67
2018 Insurance Market Briefing - Bahrain October 2018

2018 Insurance Market Briefing -Bahrain
October 2018

Welcome
Dr Roger SellekChief Executive Officer –
EMEA & Asia PacificNick Charteris-BlackManaging Director,
Market Development – EMEA

Disclaimer© AM Best Company (AMB) and/or its licensors and affiliates. All rights reserved. ALL INFORMATION CONTAINED HEREIN ISPROTECTED BY COPYRIGHT LAW AND NONE OF SUCH INFORMATION MAY BE COPIED OR OTHERWISEREPRODUCED, REPACKAGED, FURTHER TRANSMITTED, TRANSFERRED, DISSEMINATED, REDISTRIBUTED ORRESOLD, OR STORED FOR SUBSEQUENT USE FOR ANY SUCH PURPOSE, IN WHOLE OR IN PART, IN ANY FORM ORMANNER OR BY ANY MEANS WHATSOEVER, BY ANY PERSON WITHOUT AMB’s PRIOR WRITTEN CONSENT. Allinformation contained herein is obtained by AMB from sources believed by it to be accurate and reliable. Because of thepossibility of human or mechanical error as well as other factors, however, all information contained herein is provided “AS IS”without warranty of any kind. Under no circumstances shall AMB have any liability to any person or entity for (a) any loss ordamage in whole or in part caused by, resulting from, or relating to, any error (negligent or otherwise) or other circumstance orcontingency within or outside the control of AMB or any of its directors, officers, employees or agents in connection with theprocurement, collection, compilation, analysis, interpretation, communication, publication or delivery of any such information, or(b) any direct, indirect, special, consequential, compensatory or incidental damages whatsoever (including without limitation, lostprofits), even if AMB is advised in advance of the possibility of such damages, resulting from the use of or inability to use, anysuch information. The credit ratings, financial reporting analysis, projections, and other observations, if any, constituting part of theinformation contained herein are, and must be construed solely as, statements of opinion and not statements of fact orrecommendations to purchase, sell or hold any securities, insurance policies, contracts or any other financial obligations, nor doesit address the suitability of any particular financial obligation for a specific purpose or purchaser. Credit risk is the risk that anentity may not meet its contractual, financial obligations as they come due. Credit ratings do not address any other risk, includingbut not limited to, liquidity risk, market value risk or price volatility of rated securities. NO WARRANTY, EXPRESS OR IMPLIED,AS TO THE ACCURACY, TIMELINESS, COMPLETENESS, MERCHANTABILITY OR FITNESS FOR ANY PARTICULARPURPOSE OF ANY SUCH RATING OR OTHER OPINION OR INFORMATION IS GIVEN OR MADE BY AMB IN ANY FORM ORMANNER WHATSOEVER. Each credit rating or other opinion must be weighed solely as one factor in any investment orpurchasing decision made by or on behalf of any user of the information contained herein, and each such user must accordinglymake its own study and evaluation of each security or other financial obligation and of each issuer and guarantor of, and eachprovider of credit support for, each security or other financial obligation that it may consider purchasing, holding or selling.
Regulated by the Dubai Financial Services Authority as a Representative Office.
3

Disclaimer US Securities Laws explicitly prohibit the issuance or maintenance of a credit rating where a person involvedin the sales or marketing of a product or service of the CRA also participates in determining or monitoring thecredit rating, or developing or approving procedures or methodologies used for determining the credit rating.
No part of this presentation amounts to sales / marketing activity and A.M. Best’s Rating Divisionemployees are prohibited from participating in commercial discussions.
Any queries of a commercial nature should be directed to A.M. Best’s Market Development function.
4

2018 Insurance Market Briefing
Global and Regional Reinsurance Update and Trends
Greg Carter,Managing Director,Analytics – EMEA
Discussion Outline
Global Reinsurance Results and Trends
Global Reinsurance Market Capacity
Global Reinsurance Market Evolution
Global Reinsurance Sector Outlook
6
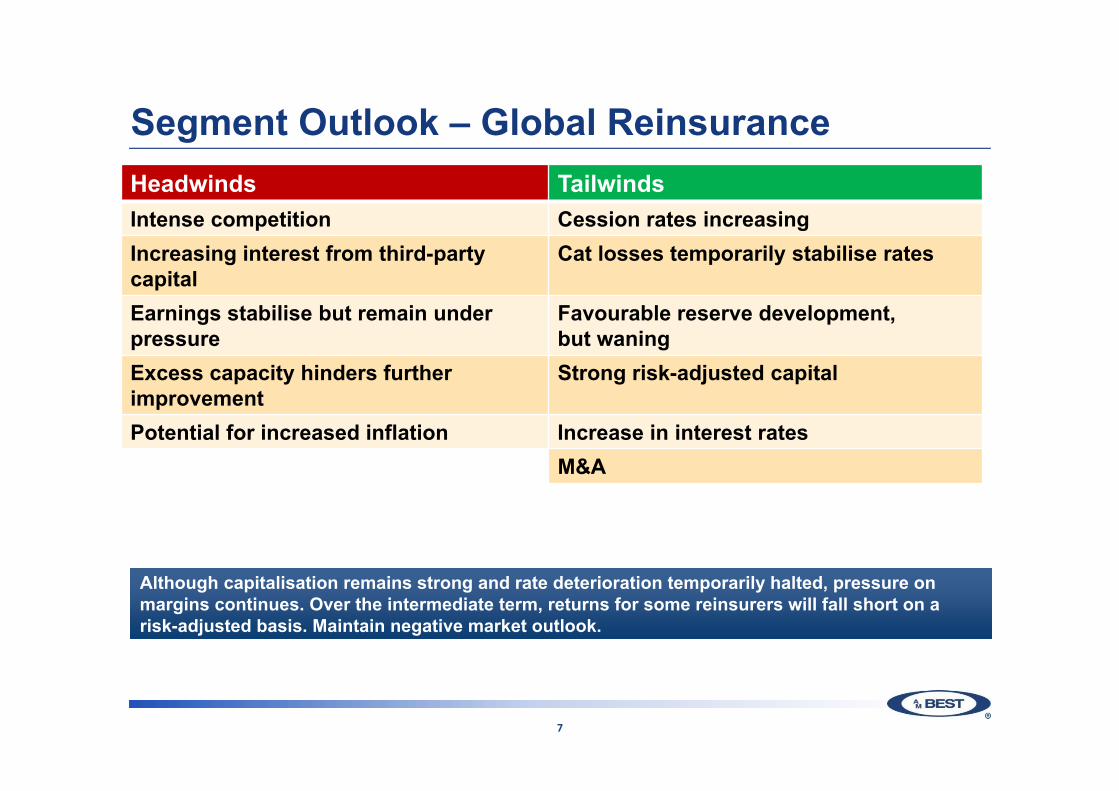
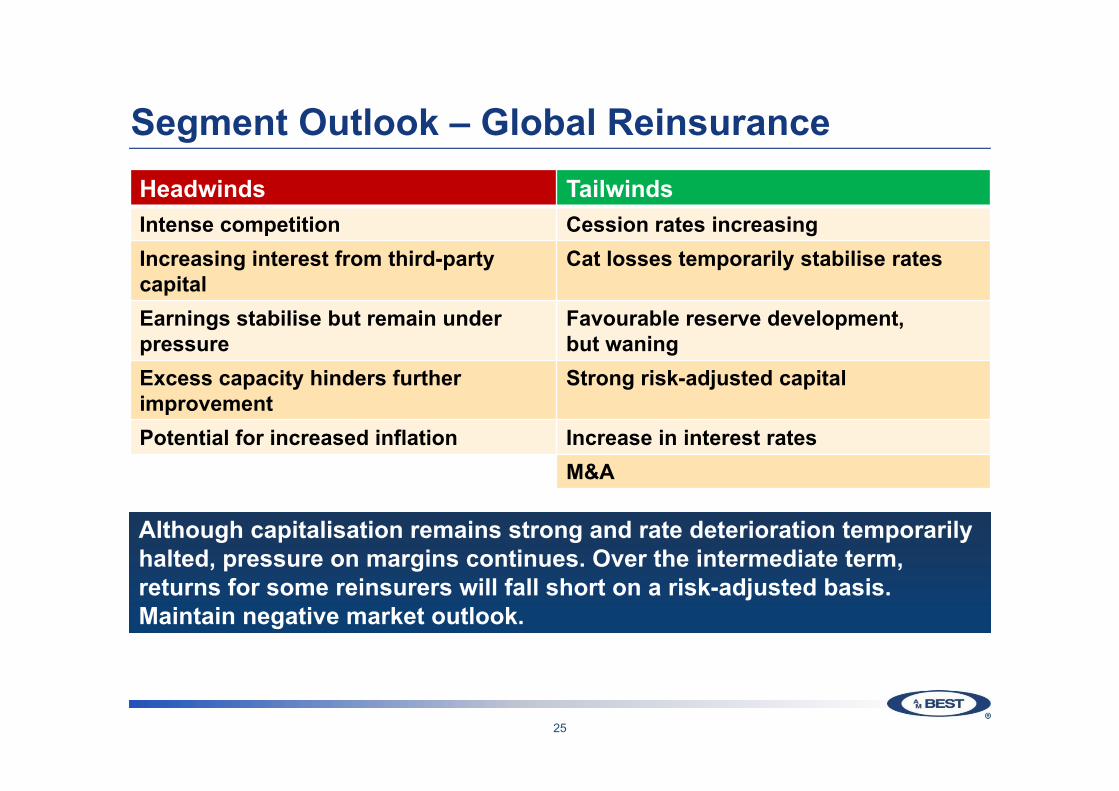
Segment Outlook – Global ReinsuranceHeadwinds TailwindsIntense competition Cession rates increasingIncreasing interest from third-party capital
Cat losses temporarily stabilise rates
Earnings stabilise but remain under pressure
Favourable reserve development,but waning
Excess capacity hinders further improvement
Strong risk-adjusted capital
Potential for increased inflation Increase in interest ratesM&A
Although capitalisation remains strong and rate deterioration temporarily halted, pressure on margins continues. Over the intermediate term, returns for some reinsurers will fall short on a risk-adjusted basis. Maintain negative market outlook.
Although capitalisation remains strong and rate deterioration temporarily halted, pressure on margins continues. Over the intermediate term, returns for some reinsurers will fall short on a risk-adjusted basis. Maintain negative market outlook.
7
Global ReinsuranceResults and Trends
8

Central Bank Base Lending Rates
‐1
0
1
2
3
4
5
6
7
8
2007 2008 2009 2010 2011 2012 2013 2014 2015 2016 2017 2018
(%)ChinaECBJapanUKUS
9
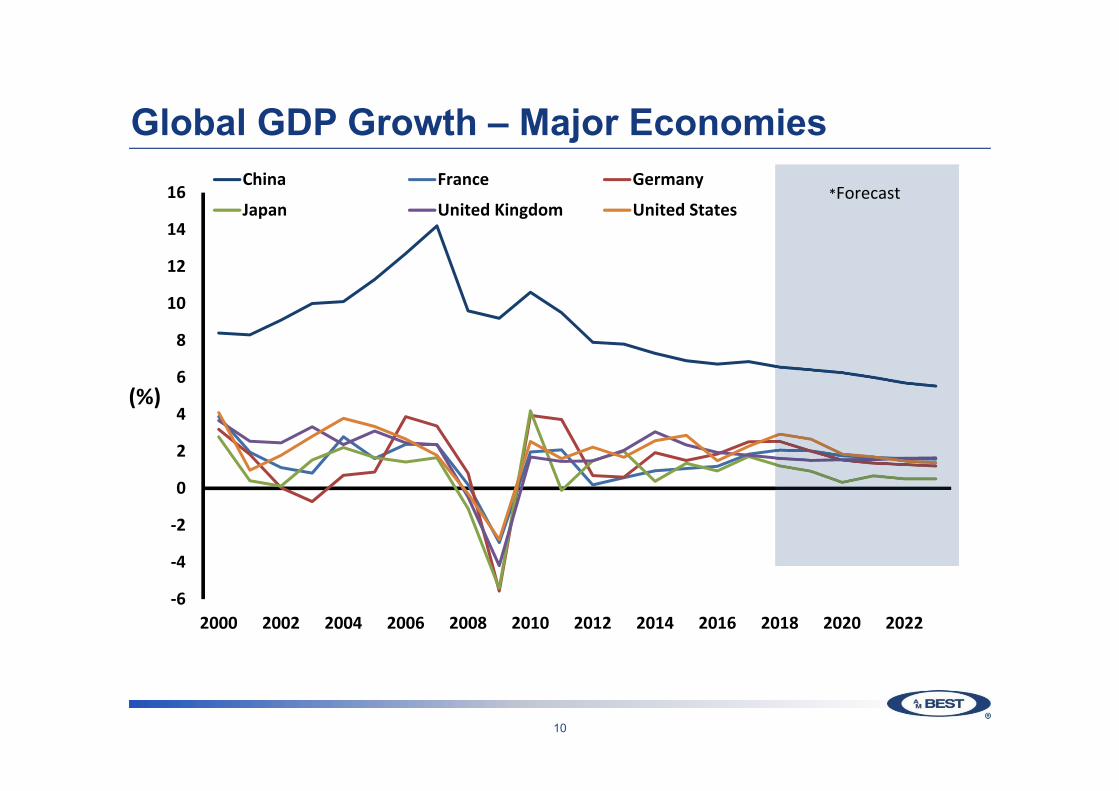
Global GDP Growth – Major Economies
‐6
‐4
‐2
0
2
4
6
8
10
12
14
16
2000 2002 2004 2006 2008 2010 2012 2014 2016 2018 2020 2022
(%)
China France Germany
Japan United Kingdom United States*Forecast
10

Global Reinsurance Market Trends
2017 represented the most significant year for catastrophe losses since 2011
Hurricanes Harvey, Irma, Maria combined with Earthquake in Mexico and Wildfire in California produced industry losses in the range of USD 80 to 100 billion
Despite timing of these events, negative reserve surprises have been limited thus far
11

Global Reinsurance Market Trends
Overall 2017 catastrophes amounted to an earnings events as rated balance sheets emerged flat for the year
Alternative capital did participate in the events in a meaningful way resulting in collateral locks prior and through the 1/1 and mid year renewal periods
Alternative capital investors were NOT hindered by the losses and brought additional capacity to the market for the renewals
12
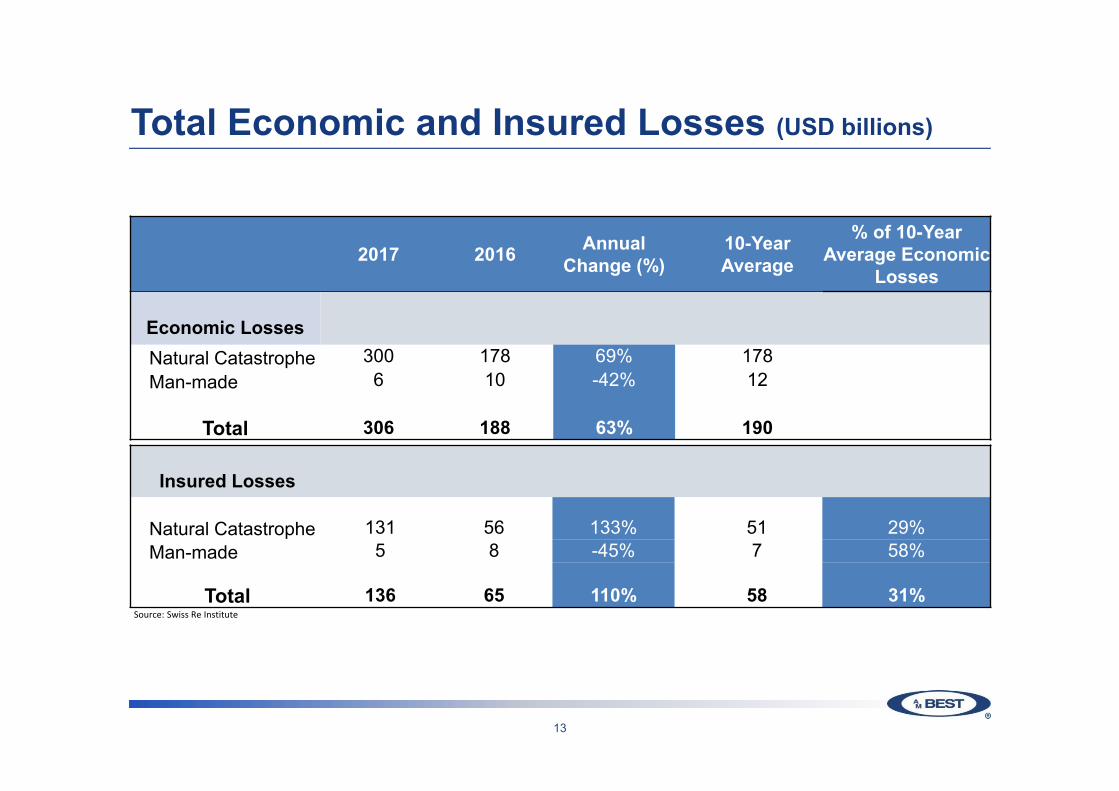
Total Economic and Insured Losses (USD billions)
Source: Swiss Re Institute
2017 2016 Annual Change (%)
10-YearAverage
% of 10-Year Average Economic
Losses
Economic LossesNatural Catastrophe 300 178 69% 178Man-made 6 10 -42% 12
Total 306 188 63% 190
Insured Losses
Natural Catastrophe 131 56 133% 51 29%Man-made 5 8 -45% 7 58%
Total 136 65 110% 58 31%
13
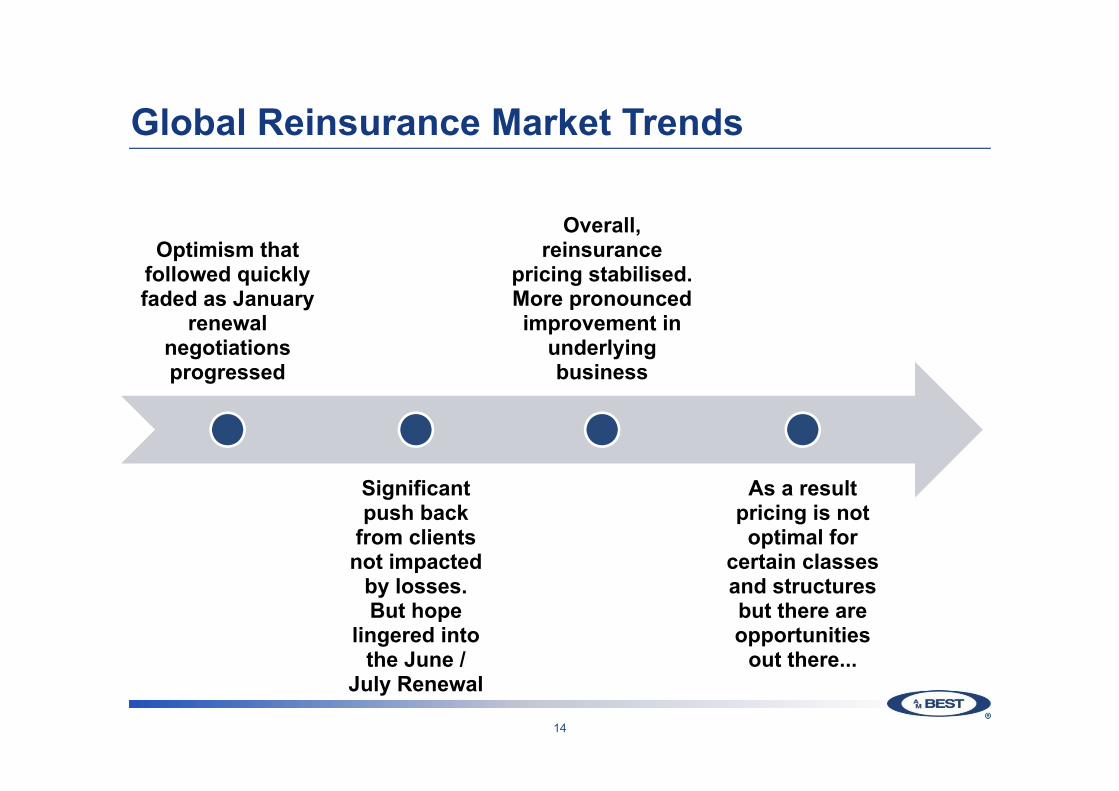
Global Reinsurance Market Trends
Optimism that followed quickly faded as January
renewal negotiations progressed
Significant push back
from clients not impacted
by losses. But hope
lingered into the June /
July Renewal
Overall, reinsurance
pricing stabilised. More pronounced improvement in
underlying business
As a result pricing is not optimal for
certain classes and structures but there are opportunities
out there...
14

Global Reinsurance Market Trends
55.9% 56.2% 56.2% 60.6%
76.5%
60.6%
61.1%
31.9% 33.5% 34.2% 34.7%
33.6%
33.9% 33.6%
0%
1%
2%
3%
4%
5%
6%
7%
8%
9%
10%
0%
20%
40%
60%
80%
100%
120%
2013 2014 2015 2016 2017 2018 H1 5yr Avg
Expense Ratio
Loss Ratio
Loss ReserveDevelopment
Source: A.M. Best data and research
Global Reinsurance Sector – Combined Ratio
15
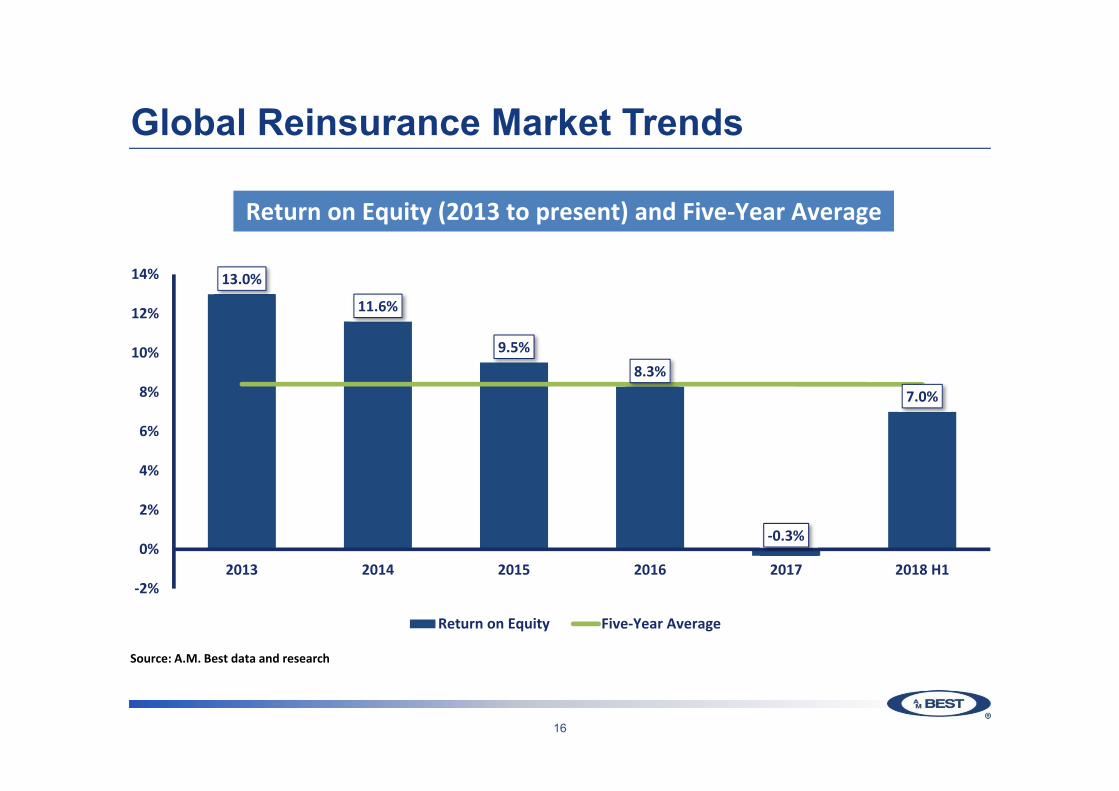
Global Reinsurance Market Trends
13.0%
11.6%
9.5%8.3%
‐0.3%
7.0%
‐2%
0%
2%
4%
6%
8%
10%
12%
14%
2013 2014 2015 2016 2017 2018 H1
Return on Equity Five‐Year Average
Source: A.M. Best data and research
Return on Equity (2013 to present) and Five‐Year Average
16
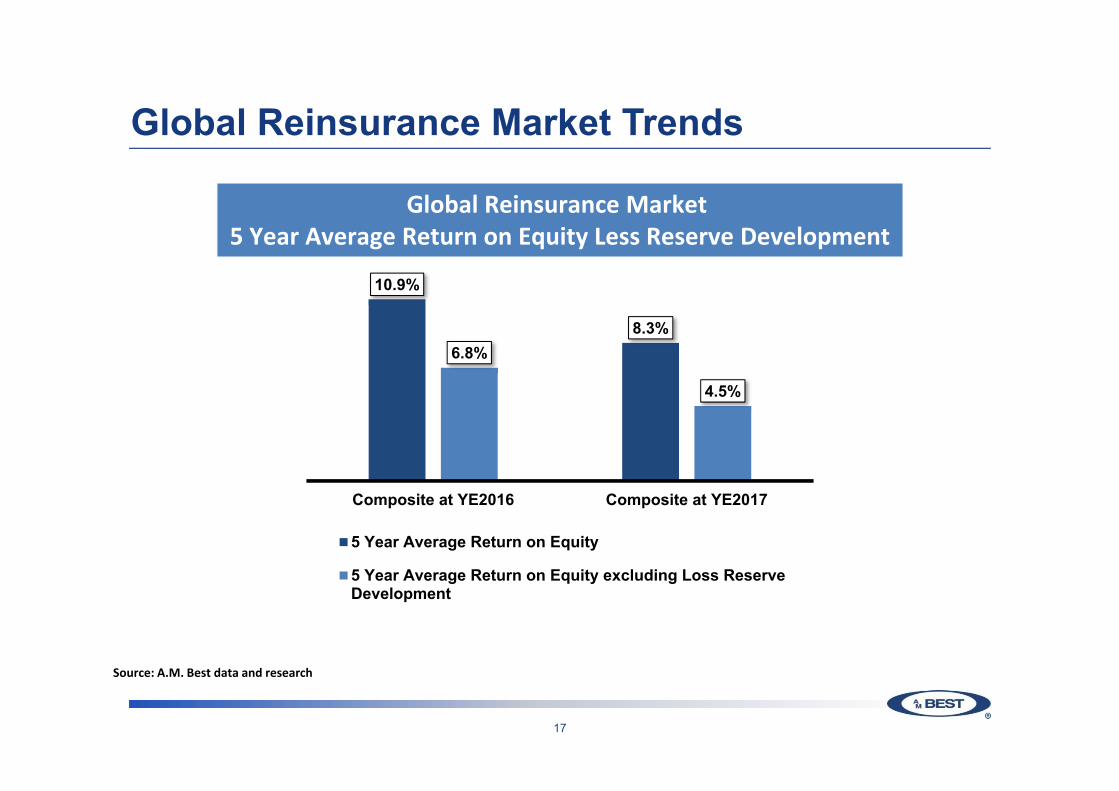
Global Reinsurance Market Trends
Global Reinsurance Market 5 Year Average Return on Equity Less Reserve Development
Source: A.M. Best data and research
10.9%
8.3%6.8%
4.5%
Composite at YE2016 Composite at YE2017
5 Year Average Return on Equity
5 Year Average Return on Equity excluding Loss ReserveDevelopment
17
Global ReinsuranceMarket Capacity
18

Global Reinsurance Market Capacity
Life and Non‐Life Reinsurance GPW Distribution by Ranking
Rank 1-1070.2%
Rank 11-2015.5%
Rank 21-307.2%
Rank 31-404.6%
Rank 41-502.5%
19

Global Reinsurance Market Capital
292 320 340 332 345 345 362
19 48
60 68 75 87 100
2012 2013 2014 2015 2016 2017 2018E
ConvergenceCapital
TraditionalCapital
Estimate for Total Dedicated Reinsurance Capital (USD billions)
Notes and Sources: Estimates by Guy Carpenter and A.M. Best
20
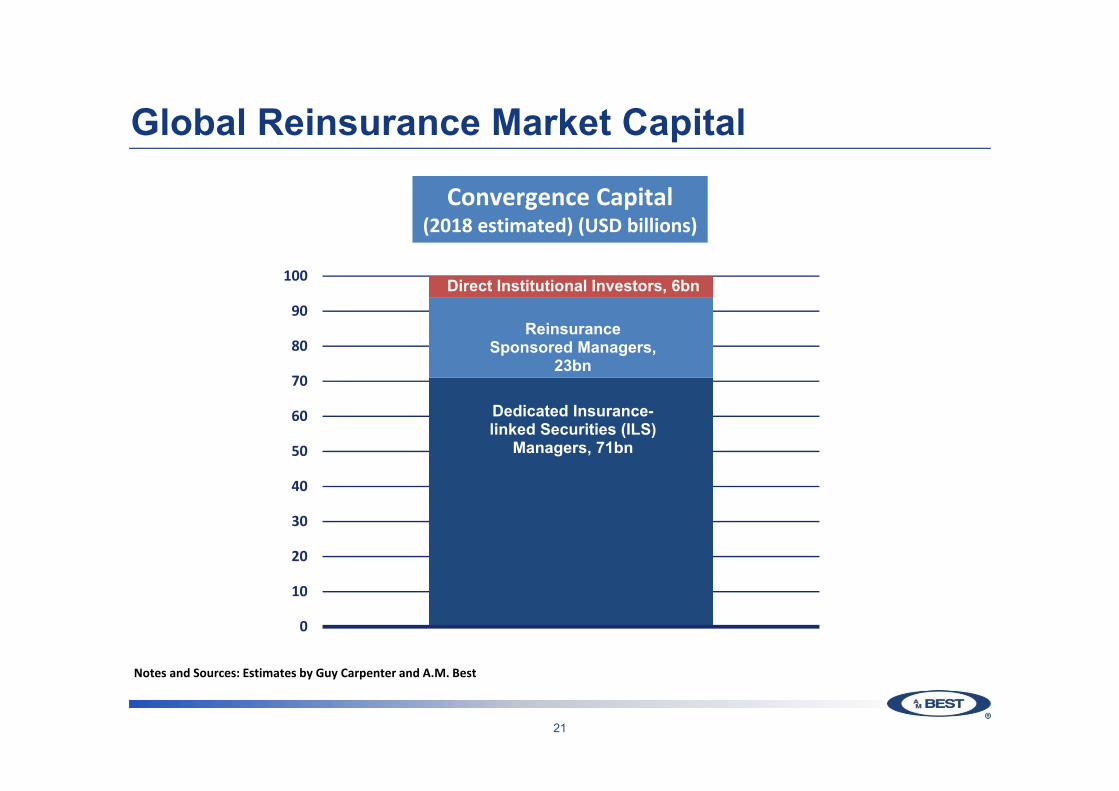
Global Reinsurance Market Capital
Dedicated Insurance-linked Securities (ILS)
Managers, 71bn
Reinsurance Sponsored Managers,
23bn
Direct Institutional Investors, 6bn
0
10
20
30
40
50
60
70
80
90
100
Convergence Capital(2018 estimated) (USD billions)
Notes and Sources: Estimates by Guy Carpenter and A.M. Best
21
Global Market Evolution
22
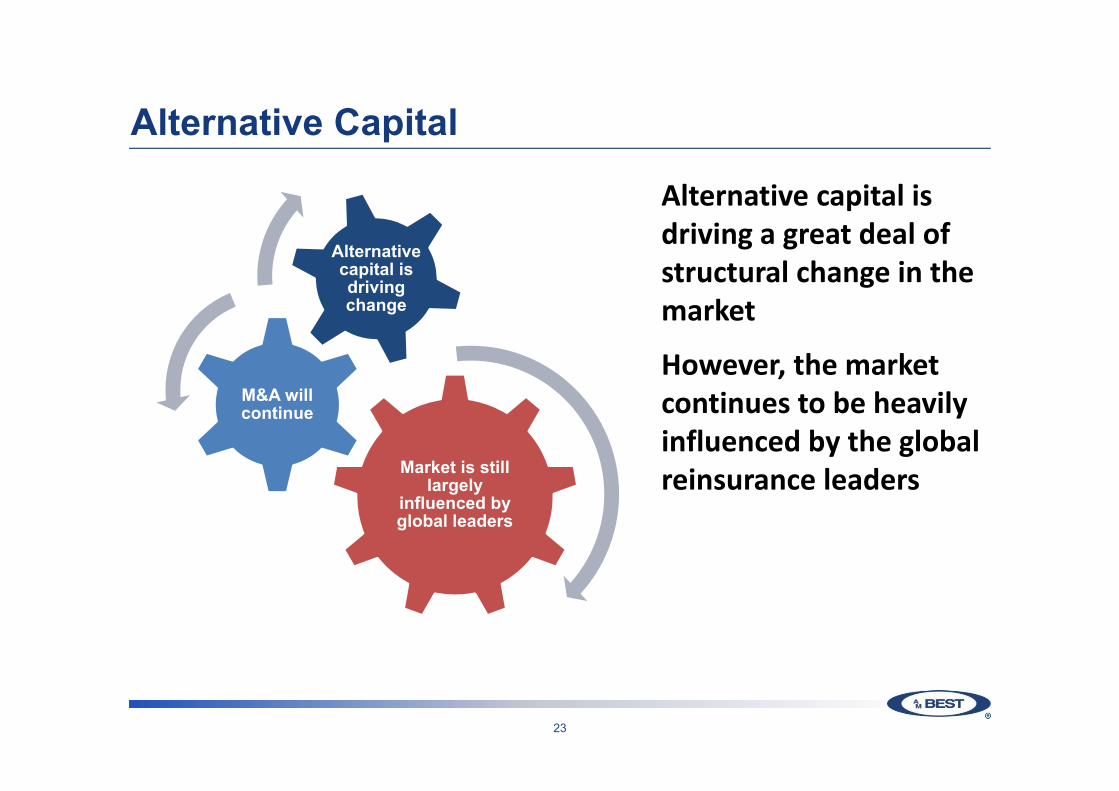
Alternative Capital
Market is still largely
influenced by global leaders
M&A will continue
Alternative capital is driving change
Alternative capital is driving a great deal of structural change in the market
However, the market continues to be heavily influenced by the global reinsurance leaders
23
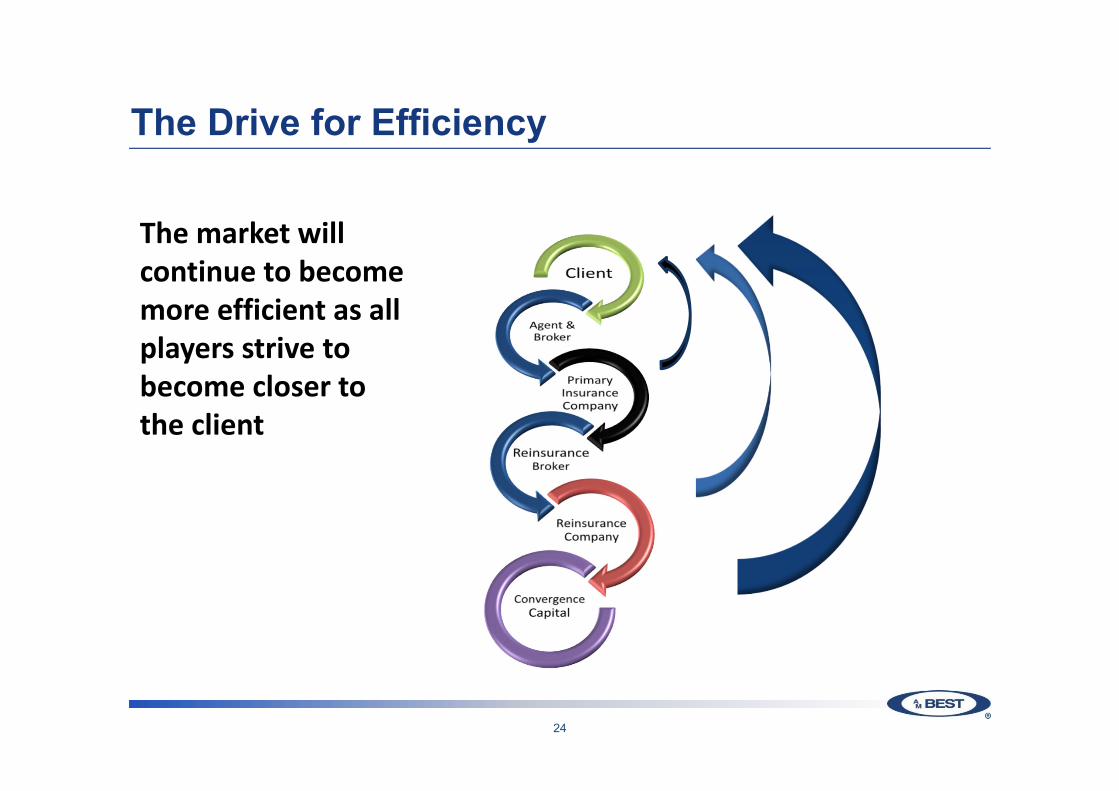
The Drive for Efficiency
The market will continue to become more efficient as all players strive to become closer to the client
24
Segment Outlook – Global ReinsuranceHeadwinds TailwindsIntense competition Cession rates increasingIncreasing interest from third-party capital
Cat losses temporarily stabilise rates
Earnings stabilise but remain under pressure
Favourable reserve development,but waning
Excess capacity hinders further improvement
Strong risk-adjusted capital
Potential for increased inflation Increase in interest ratesM&A
Although capitalisation remains strong and rate deterioration temporarily halted, pressure on margins continues. Over the intermediate term, returns for some reinsurers will fall short on a risk-adjusted basis. Maintain negative market outlook.
Although capitalisation remains strong and rate deterioration temporarily halted, pressure on margins continues. Over the intermediate term, returns for some reinsurers will fall short on a risk-adjusted basis. Maintain negative market outlook.
25
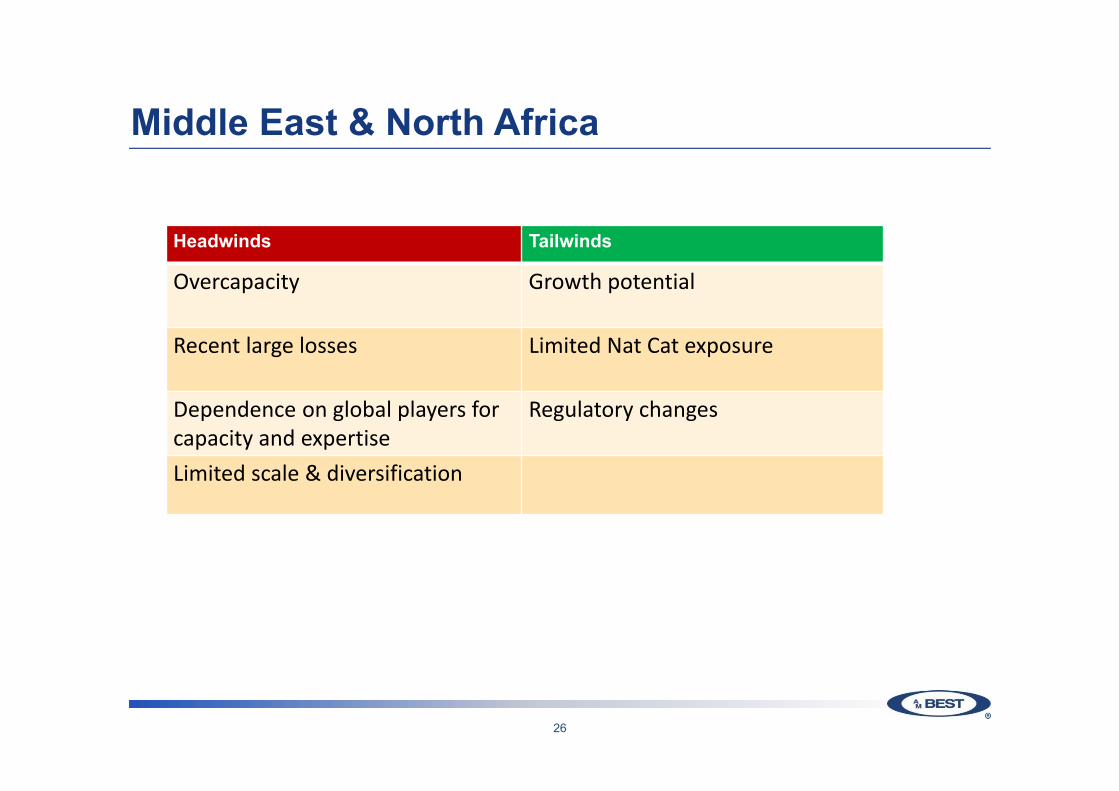
Middle East & North Africa
Headwinds Tailwinds
Overcapacity Growth potential
Recent large losses Limited Nat Cat exposure
Dependence on global players for capacity and expertise
Regulatory changes
Limited scale & diversification
26
2018 Insurance Market Briefing
Rating Trends in theMENA Region
Mahesh Mistry,Senior Director, Analytics

Distribution of Ratings ‒ MENA
6
17
6
1112
21
5
14
6
11
14
32
a a‐ bbb+ bbb bbb‐ bb+ bb
Issuer Credit Rating
Sep‐17 Sep‐18
Rating Actions
Affirmed AssignedUpgraded DowngradedWithdrawn Outlook to NegativeOutlook to Positive
Improved capitalisation and / or operating performance
Upgrades / Positive Actions
Weak technical performance, governance issues and / or reducing business profile
Downgrades / Negative Actions:
28

GCC Segment Outlook - Negative
Non‐GCC
29
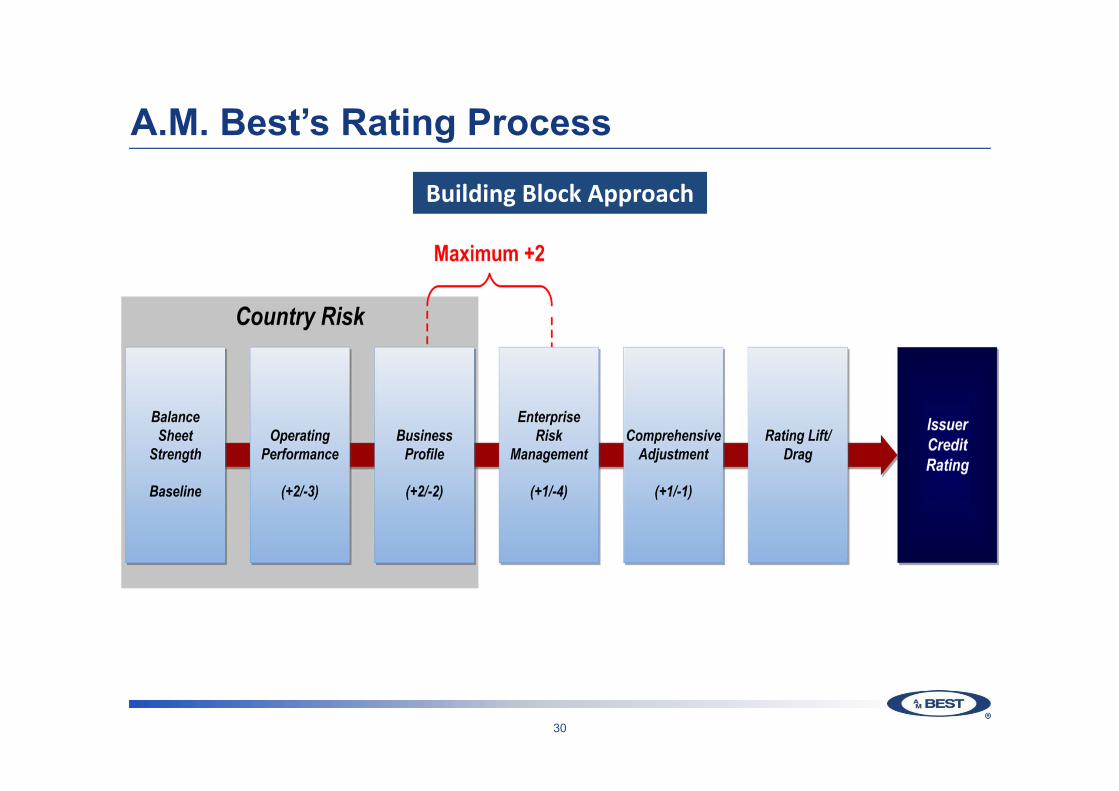
A.M. Best’s Rating Process
Building Block Approach
30

BCRM Building Blocks
Assessment
Strongest
Very Strong
Strong
Adequate
Weak
Very Weak
Assessment
Very Strong +2
Strong +1
Adequate 0
Marginal ‐1
Weak ‐2
Very Weak ‐3
Assessment
Very Favorable +2
Favorable +1
Neutral 0
Limited ‐1
Very Limited ‐2
Assessment
Very Strong +1
Appropriate 0
Marginal ‐1
Weak ‐2
Very Weak ‐3/4
31

Country Risk – Downward Pressure PersistsCountry CRT Economic
RiskPolitical Risk
Financial System Risk
Movement
UAE 3 Moderate Moderate Low
Qatar 3 Low Moderate Moderate
Saudi Arabia 3 Low Moderate Moderate
Kuwait 3 Moderate High Moderate
Oman 4 Moderate High High Down to CRT‐4 in 2018
Bahrain 4 High Moderate Moderate Down to CRT‐4 in 2015
Turkey 4 Moderate High High
Morocco 4 High High High
Jordan 4 High High Very High
Tunisia 4 High High Very High
Lebanon 5 High Very High Very High
Egypt 5 High Very High Very High Down to CRT‐5 in 2011
Algeria 5 High Very High Very High
32
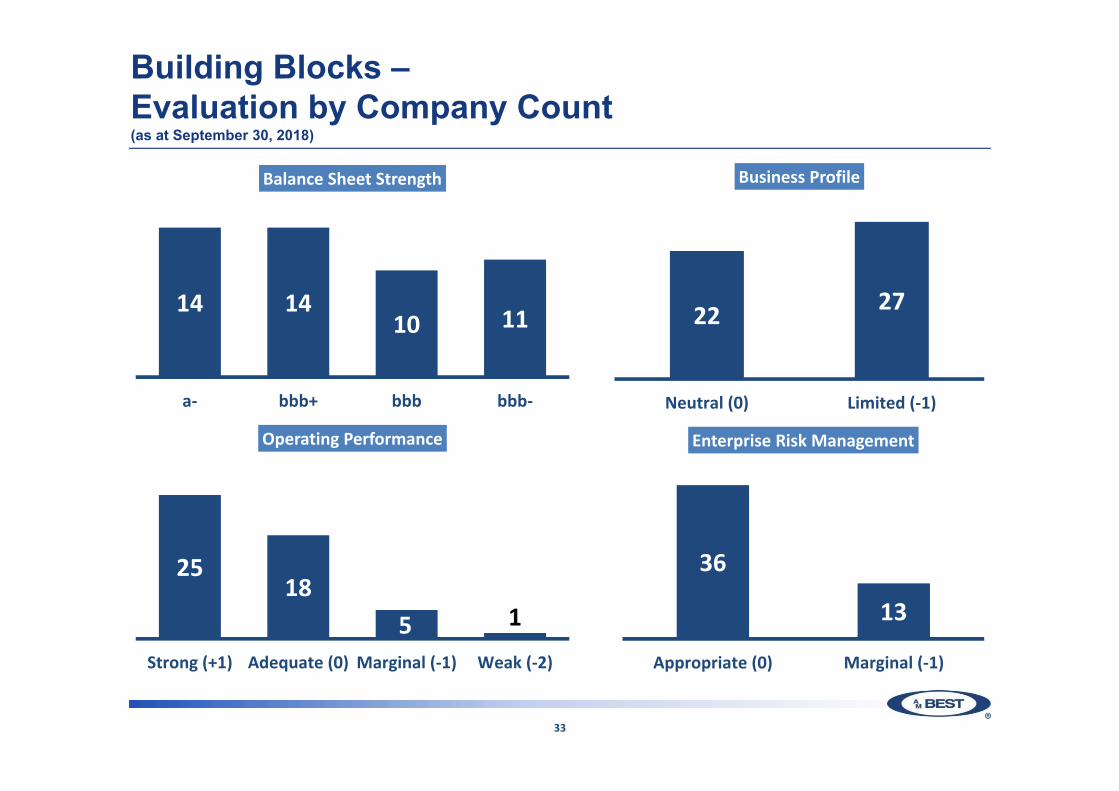
Building Blocks –Evaluation by Company Count(as at September 30, 2018)
14 1410 11
a‐ bbb+ bbb bbb‐
Balance Sheet Strength
2518
5 1
Strong (+1) Adequate (0) Marginal (‐1) Weak (‐2)
Operating Performance
22 27
Neutral (0) Limited (‐1)
Business Profile
36
13
Appropriate (0) Marginal (‐1)
Enterprise Risk Management
33
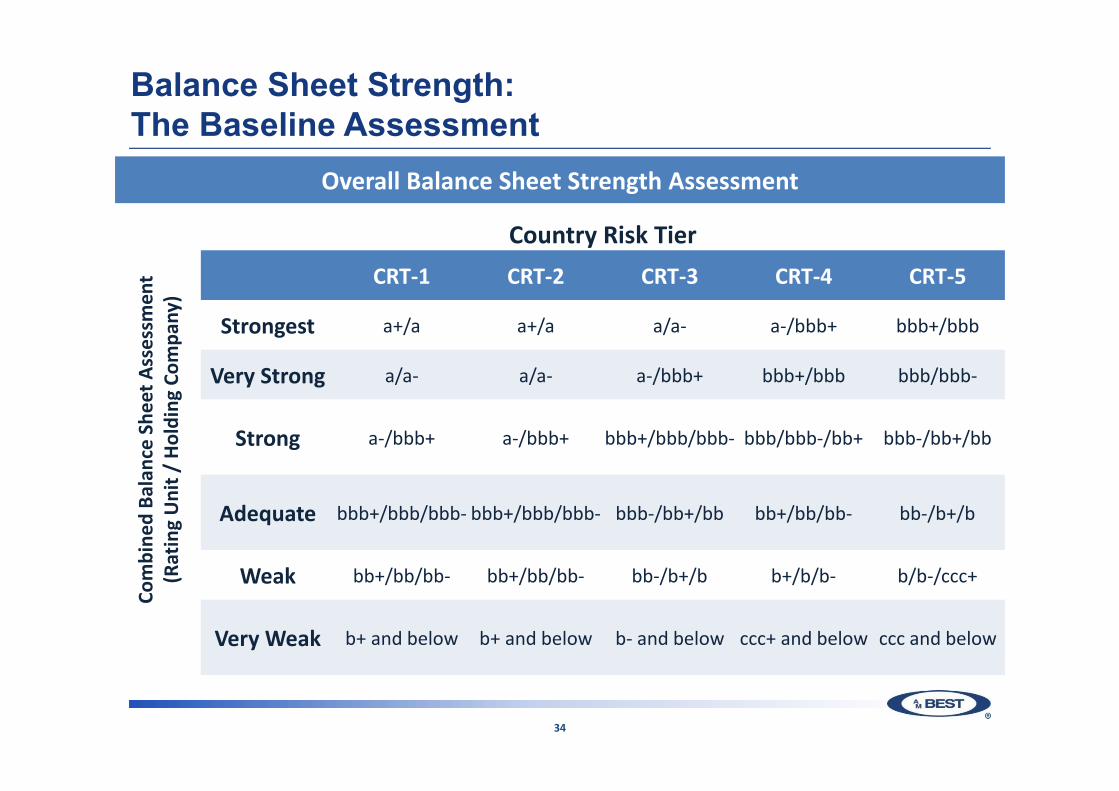
Balance Sheet Strength:The Baseline Assessment
Overall Balance Sheet Strength AssessmentCo
mbine
d Ba
lance Sh
eet A
ssessm
ent
(Rating Unit /
Holding
Com
pany
)
Country Risk TierCRT‐1 CRT‐2 CRT‐3 CRT‐4 CRT‐5
Strongest a+/a a+/a a/a‐ a‐/bbb+ bbb+/bbb
Very Strong a/a‐ a/a‐ a‐/bbb+ bbb+/bbb bbb/bbb‐
Strong a‐/bbb+ a‐/bbb+ bbb+/bbb/bbb‐ bbb/bbb‐/bb+ bbb‐/bb+/bb
Adequate bbb+/bbb/bbb‐ bbb+/bbb/bbb‐ bbb‐/bb+/bb bb+/bb/bb‐ bb‐/b+/b
Weak bb+/bb/bb‐ bb+/bb/bb‐ bb‐/b+/b b+/b/b‐ b/b‐/ccc+
Very Weak b+ and below b+ and below b‐ and below ccc+ and below ccc and below
34

Balance Sheet Strength: BCAR Scores
VaR Level (%) BCAR BCAR Assessment
99.6 > 25 at 99.6 Strongest
99.6 > 10 at 99.6 & ≤ 25 at 99.6 Very Strong
99.5 > 0 at 99.5 & ≤ 10 at 99.6 Strong
99 > 0 at 99 & ≤ 0 at 99.5 Adequate
95 > 0 at 95 & ≤ 0 at 99 Weak
95 ≤ 0 at 95 Very Weak
BCAR = ( Available Capital - Net Required Capital) x 100Available Capital
Updated BCAR Formula
Four scores corresponding to the 95%, 99%, 99.5% and 99.6% confidence level;translates to a BCAR assessment
35

Balance Sheet Strength:GCC BCAR Scores @ 99.6% (1-in-250)
36
81% 78%
69% 68% 66% 65% 64% 62%59%
55%51% 49% 47% 45% 45% 43% 43%
36% 35% 32% 32%26%
GCC Average
“Strongest” Threshold

Balance Sheet Strength:Rest of MENA BCAR Scores @ 99.6% (1-in-250)
60% 60%57%
52%49% 49%
45%
37%
24%22%
20%17%
15%12%
Misr Ins First Ins Tunis Re Bankers Arab Re ARABIA‐J AOIC AMIG ARABIA JordanIns
Milli Re JordanFrench
Al Ittihad MEICO
MENA Average
“Strongest” Threshold
37

Balance Sheet Strength:Breakdown of Capital Requirements
• Investment risk (equity and real estate) is the main driver of capital requirements
• Asset charges incorporate CIC and concentration risk factors
38
%
0
10
20
30
40
50
60
70
80
90
100
United ArabEmirates
Qatar Lebanon Kuwait Jordan Egypt Bahrain
Fixed‐Income Risk Interest Rate Risk Equity Risk Credit Risk Reserve Risk Premium Risk Business Risk CAT Risk
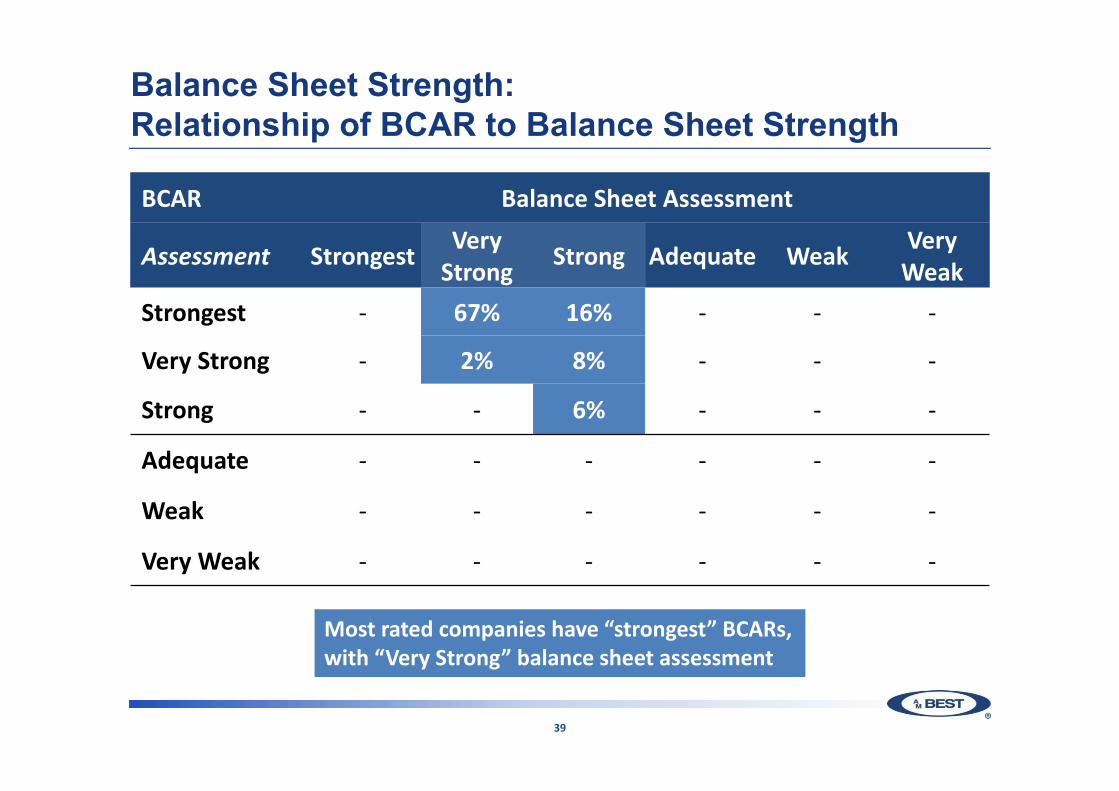
Balance Sheet Strength:Relationship of BCAR to Balance Sheet Strength
BCAR Balance Sheet Assessment
Assessment Strongest Very Strong Strong Adequate Weak Very
WeakStrongest ‐ 67% 16% ‐ ‐ ‐
Very Strong ‐ 2% 8% ‐ ‐ ‐
Strong ‐ ‐ 6% ‐ ‐ ‐
Adequate ‐ ‐ ‐ ‐ ‐ ‐
Weak ‐ ‐ ‐ ‐ ‐ ‐
Very Weak ‐ ‐ ‐ ‐ ‐ ‐
Most rated companies have “strongest” BCARs,with “Very Strong” balance sheet assessment
39

Balance Sheet Strength: Summary
0% 20% 40% 60% 80% 100%
Appropriateness of ReinsBCAR
Capital structure / leverageHolding Company Analysis
Quality of CapitalReserve Quality
Financial FlexibilityReceivables
LiquidityQuality of Assets
Stress TestsALM
Reinsurance Dependence
Balance Sheet Assessment
Positive Negative
40

Operating Performance:Technical Ratios and Volatility
41
0.0
0.1
0.2
0.3
0.4
0.5
0% 20% 40% 60% 80% 100%
Stan
dard Deviatio
n
Loss Ratio
Variability of Five Year Loss Ratios
0.0
0.1
0.2
0.3
0.4
0.5
0.6
50% 75% 100% 125% 150%
Combined Ratio
Variability of Five Year Combined Ratios
Strong
Adequate
Marginal
Weak
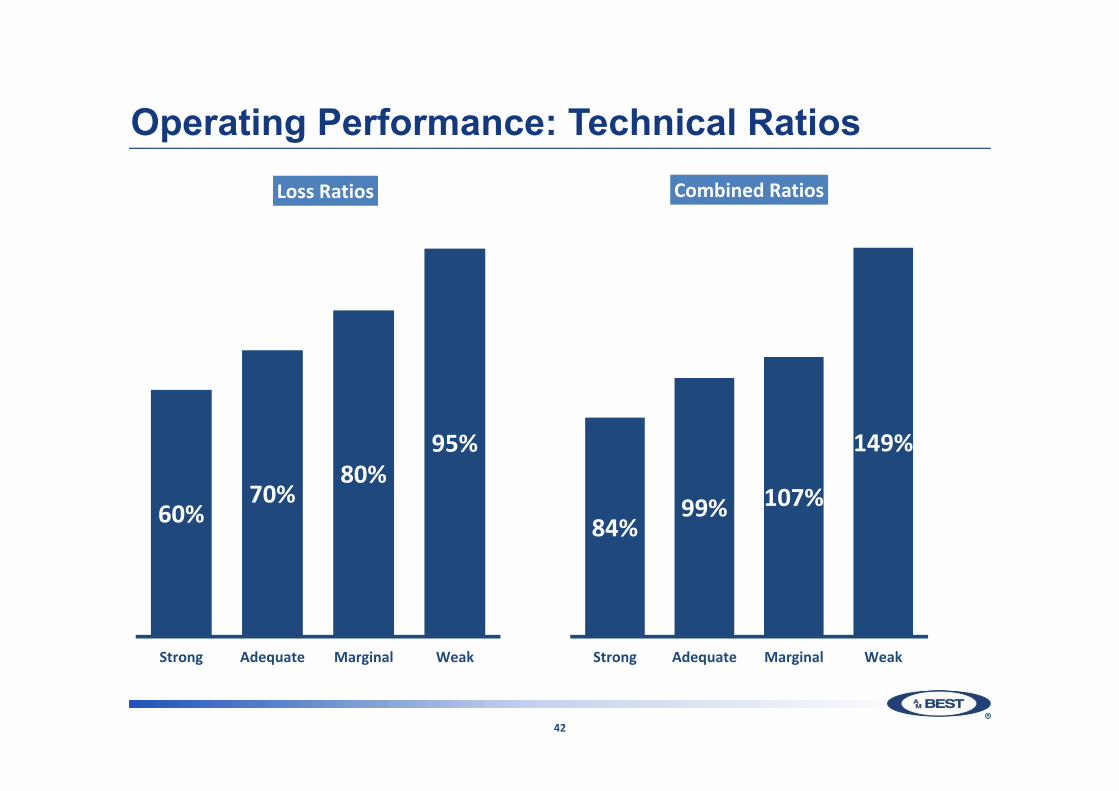
Operating Performance: Technical Ratios
60%70%
80%95%
Strong Adequate Marginal Weak
Loss Ratios
84%99% 107%
149%
Strong Adequate Marginal Weak
Combined Ratios
42
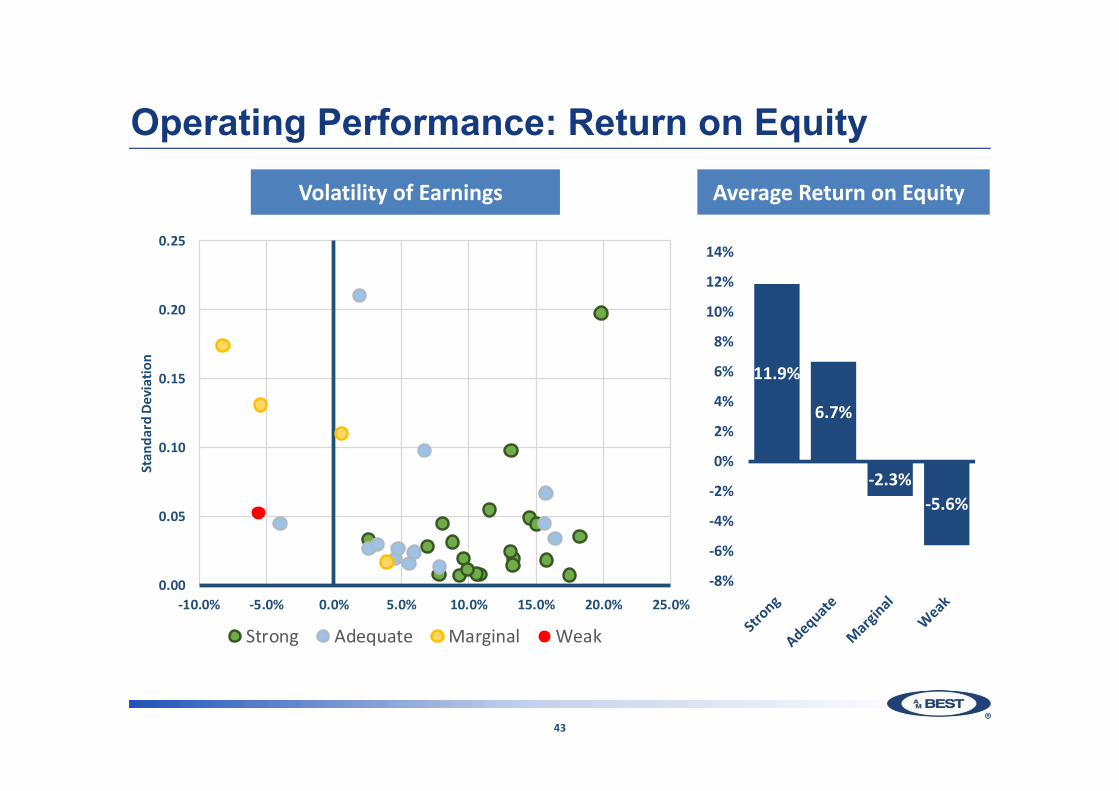
Operating Performance: Return on Equity
11.9%
6.7%
‐2.3%‐5.6%
‐8%
‐6%
‐4%
‐2%
0%
2%
4%
6%
8%
10%
12%
14%
Volatility of Earnings Average Return on Equity
43
0.00
0.05
0.10
0.15
0.20
0.25
‐10.0% ‐5.0% 0.0% 5.0% 10.0% 15.0% 20.0% 25.0%
Stan
dard Deviatio
n
Strong Adequate Marginal Weak
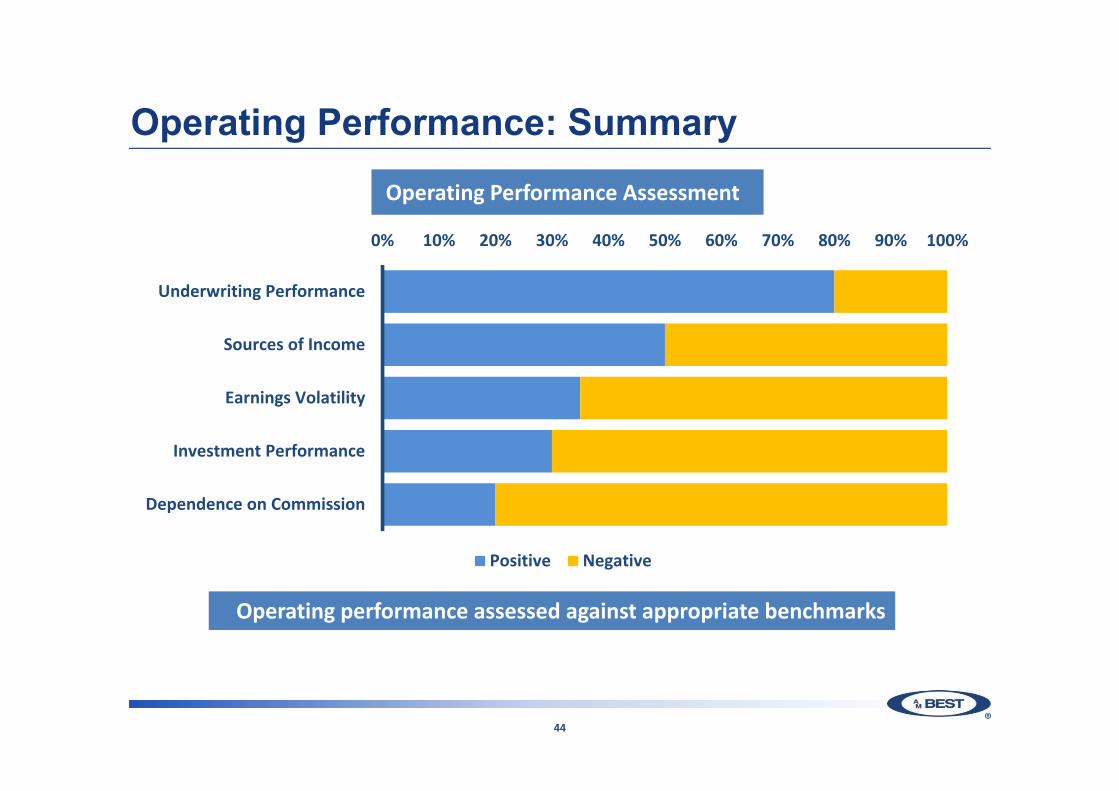
Operating Performance: Summary
Operating performance assessed against appropriate benchmarks
0% 10% 20% 30% 40% 50% 60% 70% 80% 90% 100%
Underwriting Performance
Sources of Income
Earnings Volatility
Investment Performance
Dependence on Commission
Positive Negative
Operating Performance Assessment
44

Business Profile: Summary
0% 10% 20% 30% 40% 50% 60% 70% 80% 90% 100%
Product Diversification (gross)
Market Position
Distribution
Management Quality
Regulatory Risk
Degree of Comptetion
Dependence on Third Parties
Data Quality
Pricing Sophistication
Innovation
Geographical Diversification
Product Diversification (net)
Size
Positive Negative
Business Profile

Enterprise Risk Management (ERM)Framework Assessment Components
Risk Identification and Reporting
Risk Appetite and Tolerances
Stress Testing
Risk Management and Controls
Governance and Risk Culture
Framework Assessment Descriptors
Embedded
Developed
Emerging
Nascent
Unrecognised
Assessment of Capabilities Relative to ProfileProduct and Underwriting Risk Investment Risk
Reserving riskLegislative/Regulatory/Judicial/
Economic RiskConcentration Risk Operational Risk
Reinsurance Risk Liquidity and Capital Management Risk
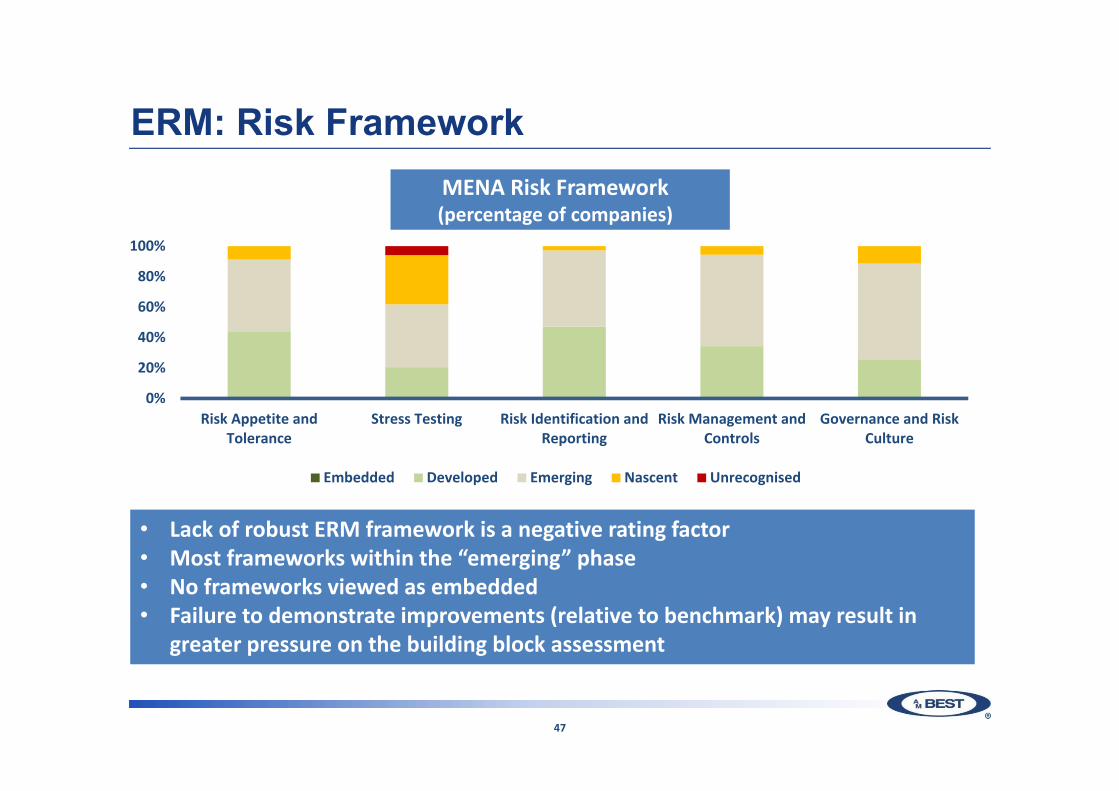
ERM: Risk Framework
0%
20%
40%
60%
80%
100%
Risk Appetite andTolerance
Stress Testing Risk Identification andReporting
Risk Management andControls
Governance and RiskCulture
Embedded Developed Emerging Nascent Unrecognised
• Lack of robust ERM framework is a negative rating factor• Most frameworks within the “emerging” phase• No frameworks viewed as embedded• Failure to demonstrate improvements (relative to benchmark) may result in
greater pressure on the building block assessment
MENA Risk Framework(percentage of companies)
47
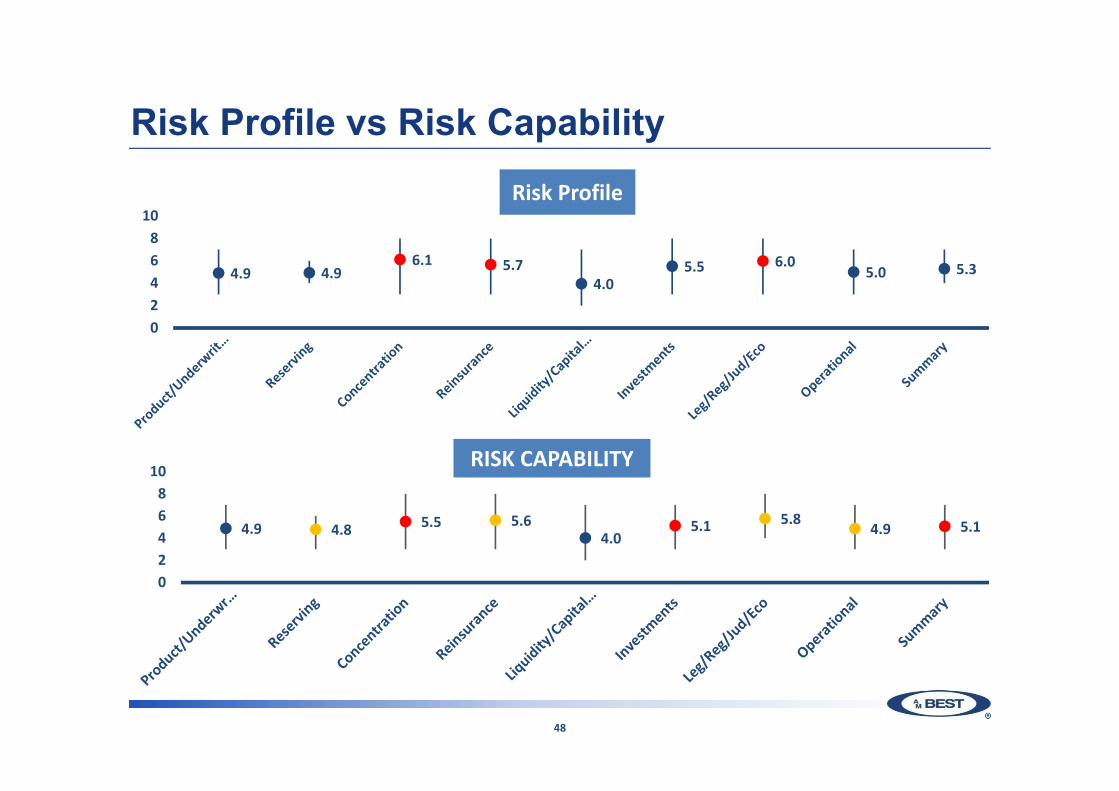
Risk Profile vs Risk Capability
4.9 4.96.1 5.7
4.05.5 6.0
5.0 5.3
02468
10
4.9 4.8 5.5 5.6 4.0
5.1 5.8 4.9 5.1
02468
10
Risk Profile
RISK CAPABILITY
48
Final Thoughts
• Governance– Restatements– Write down of assets– Reserve strengthening– Fraud
• Volatility– High asset risk– Fluctuations in
operating performance– Buffers required in RAC
• Regulation– Short-term volatility– Longer-term stability– Stronger solvency
regimes
• ERM– Improved basic structures– Lack of effective utilisation– Higher prospective
benchmarks
49
2018 Insurance Market Briefing
Catastrophe Eventsin the GCC
Vasilis Katsipis,General Manager, MarketDevelopment ‒ MENA, SCA

WorldRiskReport 2017: Exposure to natural catastrophes
Source: United Nations University
51

WorldRiskReport 2017: GCC among the countries with lowest RiskIndex
Rank Country WorldRiskIndex Exposure Vulnerability SusceptibilityLack of coping capacities
Lack of adaptive capacities
135 . United Kingdom 3.60% 11.60% 31 .08 % 16 .46 % 46 .82 % 29 .95 %136 . Slovakia 3.56% 10.21% 34 .85 % 14 .25 % 55 .25 % 35 .05 %137 . Czech Republic 3 .52 % 10.82% 32 .50 % 14 .87 % 50 .32 % 32 .31 %
138 . Kuwait 3 .46 % 9 .04 % 38.24% 12 .02 % 64.93% 37.77%139 . Latvia 3 .43 % 6.26% 37.10% 20.76% 55.43% 35.11%140 . Poland 3 .35 % 9.79% 34 .22 % 17.22% 53 .72 % 31 .71 %141 . Belgium 3 .33 % 11 .66 % 28 .54 % 15 .60 % 40 .40 % 29 .64 %142 . Spain 3 .23 % 10 .23 % 31 .53 % 15 .95 % 50 .00 % 28 .65 %143 . Belarus 3 .19 % 8 .46 % 37 .68 % 16 .77 % 60 .92 % 35 .33 %144 . Canada 3 .13 % 10 .25 % 30 .55 % 14 .85 % 45 .91 % 30 .90 %145 . Ukraine 3 .10 % 7 .50 % 41 .34 % 19 .00 % 61 .99 % 43 .03 %146 . Germany 3 .09 % 11 .41 % 27 .13 % 15 .11 % 37 .69 % 28 .57 %147 . Mongolia 3 .08 % 6 .52 % 47 .17 % 32 .32 % 65 .48 % 43 .73 %148 . Lithuania 3 .06 % 8 .88 % 34 .49 % 18 .99 % 50 .36 % 34 .13 %149 . Denmark 2 .99 % 10 .87 % 27 .54 % 14 .92 % 39 .47 % 28 .23 %150 . Cyprus 2 .76 % 7 .44 % 37 .04 % 14 .46 % 57 .74 % 38 .91 %151 . France 2 .73 % 9 .25 % 29 .47 % 16 .17 % 43 .22 % 29 .03 %
152 . Oman 2 .72 % 6 .41 % 42.37% 16 .44 % 63.53% 47.14%153 . Seychelles 2 .56 % 5 .99 % 42.77% 21 .60 % 63.23% 43.47%154 . Luxembourg 2 .55 % 9 .12 % 27 .95 % 12 .32 % 41 .17 % 30 .36 %155 . Switzerland 2 .50 % 9 .56 % 26 .19 % 14 .37 % 37 .60 % 26 .60 %156 . Estonia 2 .45 % 7 .23 % 33 .83 % 18.01% 51 .38 % 32 .10 %157 . Israel 2 .40 % 6 .41 % 37 .42 % 19.08% 58 .65 % 34 .54 %158 . Singapore 2 .36 % 7 .82 % 30 .14 % 14 .16 % 48 .83 % 27 .43 %159 . Egypt 2 .30 % 4 .72 % 48 .75 % 21 .62 % 76 .91 % 47 .72 %160 . Norway 2 .29 % 8 .58 % 26 .64 % 14 .04 % 39 .08 % 26 .78 %161 . Finland 2 .25 % 8 .19 % 27 .43 % 15 .45 % 38 .99 % 27 .86 %162 . Sweden 2 .19 % 7 .97 % 27 .47 % 15 .08 % 40 .36 % 26 .96 %
163 . United Arab Emirates 1 .98 % 5 .93 % 33 .37 % 10 .39 % 58.29% 33 .44 %164 . Bahrain 1 .77 % 4 .27 % 41 .41 % 13 .28 % 65.68% 0.4528
165 . Kiribati 1 .76 % 3 .05 % 57 .69 % 42 .18 % 83 .19 % 0.4769166 . Iceland 1 .54 % 5 .67 % 27 .19 % 14 .68 % 41 .67 % 25 .23 %167 . Grenada 1 .44 % 3 .13 % 46 .12 % 24 .86 % 69 .20 % 44 .28 %168 . Barbados 1 .21 % 3 .46 % 34 .99 % 16 .53 % 49 .96 % 38 .49 %
169 . Saudi Arabia 1.21% 2.93% 41.14% 0.1608 68.49% 38.85%170 . Malta 0.0061 0.0165 37.10% 0.1503 57.10% 39.17%
171 . Qatar 0 .09 % 0 .28 % 32 .25 % 9 .36 % 49 .03 % 38.36%
Source: United Nations University
52
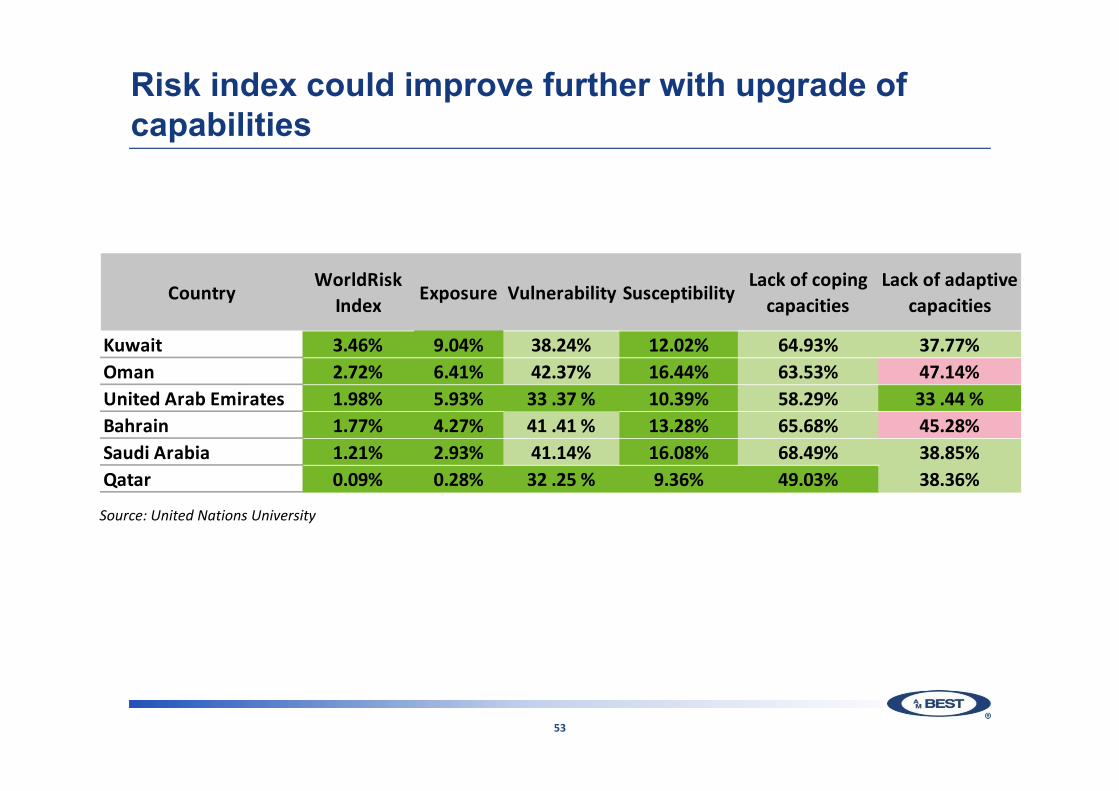
Risk index could improve further with upgrade of capabilities
Source: United Nations University
53
CountryWorldRisk
IndexExposure Vulnerability Susceptibility
Lack of coping capacities
Lack of adaptive capacities
Kuwait 3.46% 9.04% 38.24% 12.02% 64.93% 37.77%Oman 2.72% 6.41% 42.37% 16.44% 63.53% 47.14%United Arab Emirates 1.98% 5.93% 33 .37 % 10.39% 58.29% 33 .44 %Bahrain 1.77% 4.27% 41 .41 % 13.28% 65.68% 45.28%Saudi Arabia 1.21% 2.93% 41.14% 16.08% 68.49% 38.85%Qatar 0.09% 0.28% 32 .25 % 9.36% 49.03% 38.36%

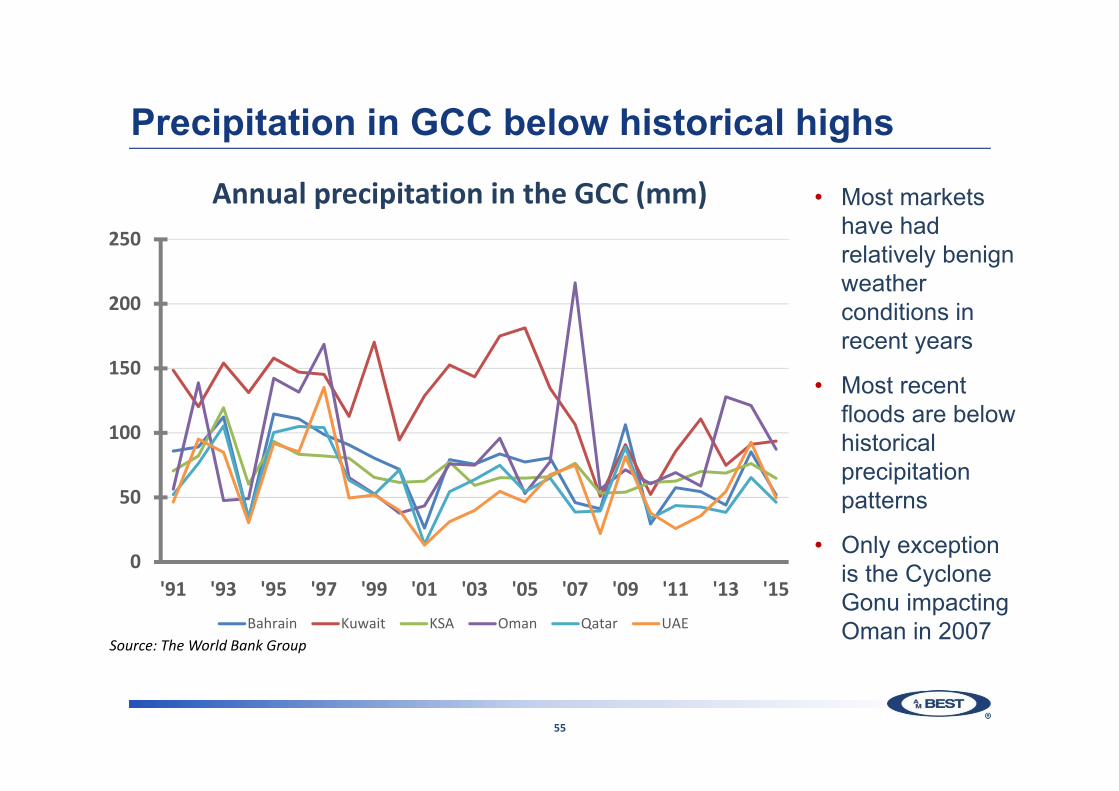
Precipitation in GCC below historical highs
Source: The World Bank Group
Annual precipitation in the GCC (mm) • Most markets have had relatively benign weather conditions in recent years
• Most recent floods are below historical precipitation patterns
• Only exception is the Cyclone Gonu impacting Oman in 2007
0
50
100
150
200
250
'91 '93 '95 '97 '99 '01 '03 '05 '07 '09 '11 '13 '15Bahrain Kuwait KSA Oman Qatar UAE
55
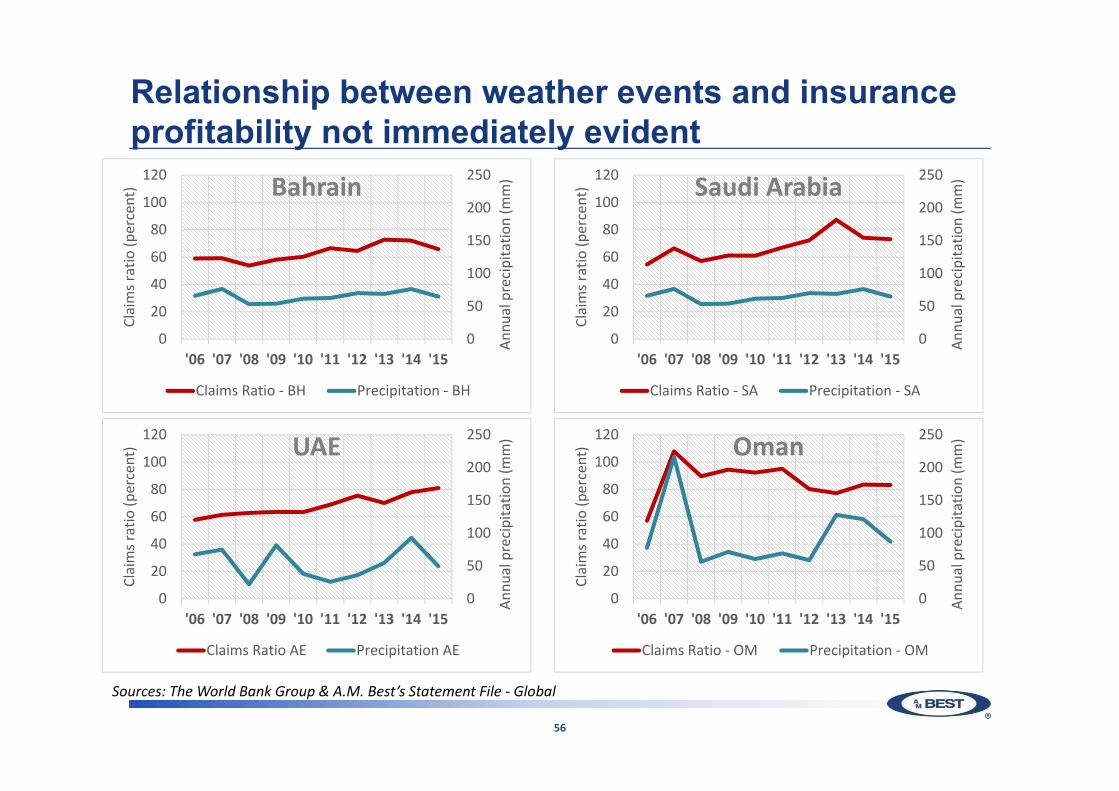
Relationship between weather events and insurance profitability not immediately evident
56
0
50
100
150
200
250
0
20
40
60
80
100
120
'06 '07 '08 '09 '10 '11 '12 '13 '14 '15
Annu
al precipitatio
n (m
m)
Claims ratio (p
ercent) Bahrain
Claims Ratio ‐ BH Precipitation ‐ BH
0
50
100
150
200
250
0
20
40
60
80
100
120
'06 '07 '08 '09 '10 '11 '12 '13 '14 '15
Annu
al precipitatio
n (m
m)
Claims ratio (p
ercent) Oman
Claims Ratio ‐ OM Precipitation ‐ OM
0
50
100
150
200
250
0
20
40
60
80
100
120
'06 '07 '08 '09 '10 '11 '12 '13 '14 '15
Annu
al precipitatio
n (m
m)
Claims ratio (p
ercent) UAE
Claims Ratio AE Precipitation AE
0
50
100
150
200
250
0
20
40
60
80
100
120
'06 '07 '08 '09 '10 '11 '12 '13 '14 '15
Annu
al precipitatio
n (m
m)
Claims ratio (p
ercent) Saudi Arabia
Claims Ratio ‐ SA Precipitation ‐ SA
Sources: The World Bank Group & A.M. Best’s Statement File ‐ Global
56
Bahrain: 0.03
KSA: 0.52
Kuwait: 0.36Qatar: ‐0.21
Oman: 0.37UAE: 0.01
50%
75%
100%
'06 '07 '08 '09 '10 '11 '12 '13 '14 '15 '16
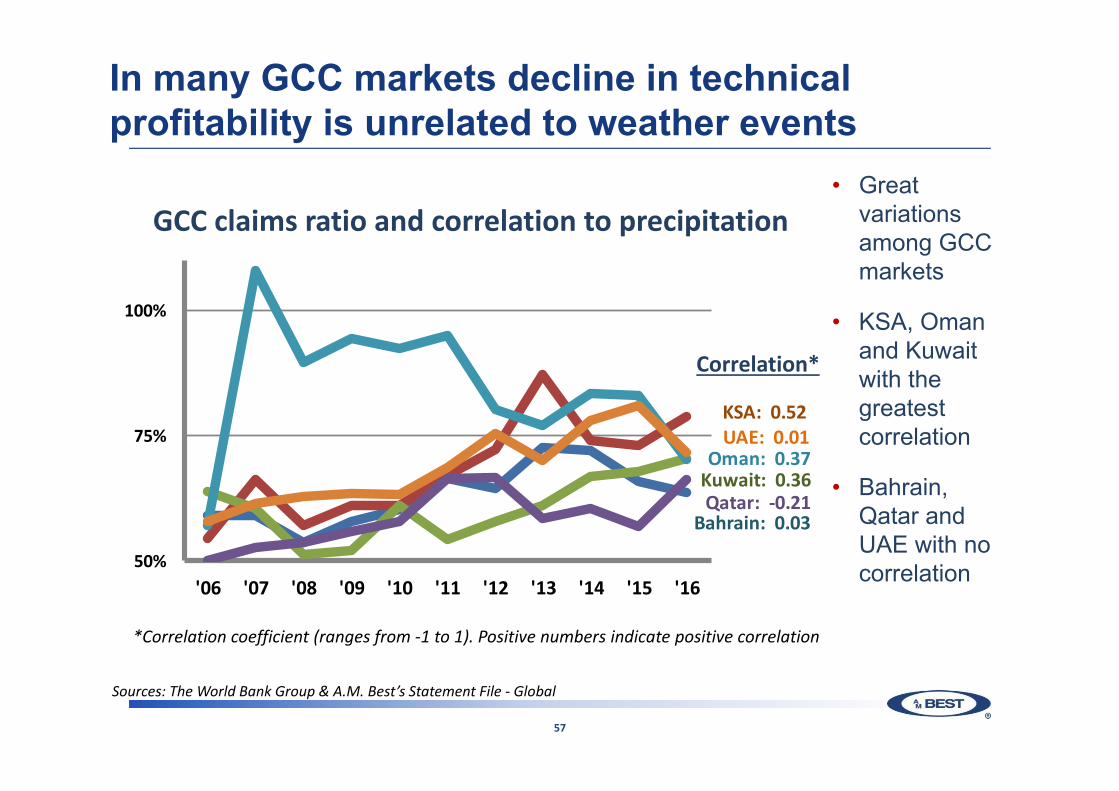
In many GCC markets decline in technical profitability is unrelated to weather events
• Great variations among GCC markets
• KSA, Oman and Kuwait with the greatest correlation
• Bahrain, Qatar and UAE with no correlation
GCC claims ratio and correlation to precipitation
Correlation*
*Correlation coefficient (ranges from ‐1 to 1). Positive numbers indicate positive correlation
Sources: The World Bank Group & A.M. Best’s Statement File ‐ Global
57
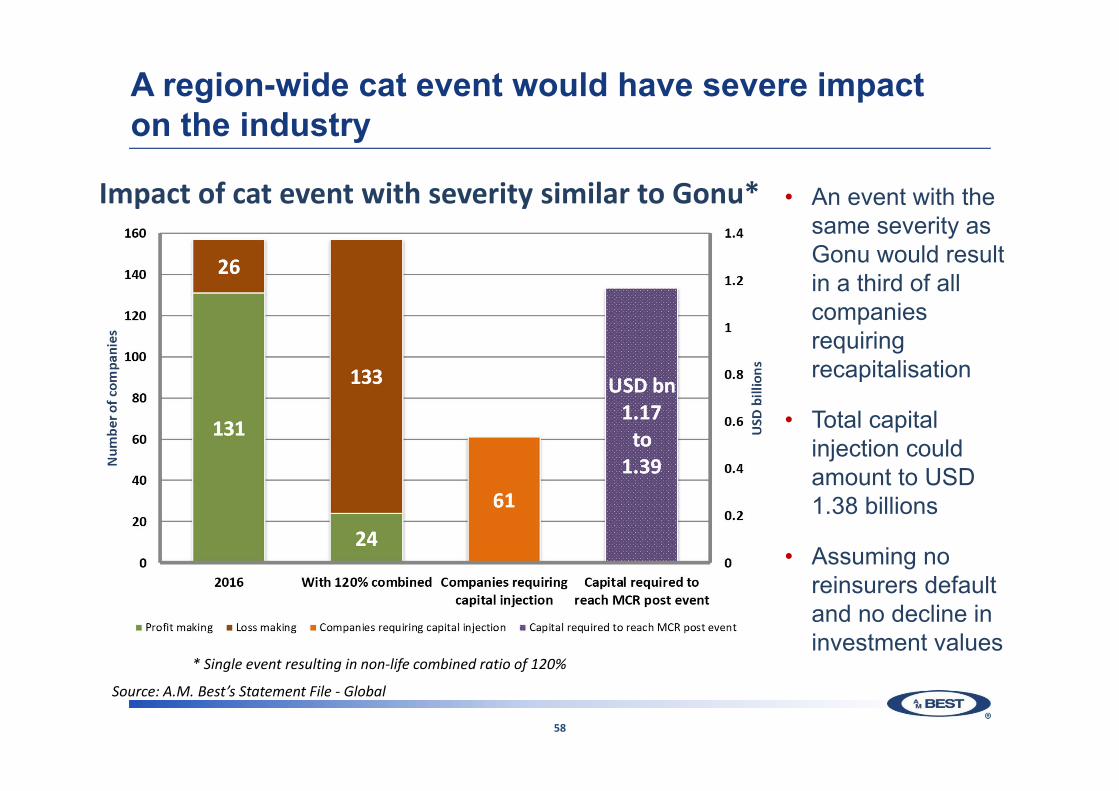
A region-wide cat event would have severe impact on the industry
• An event with the same severity as Gonu would result in a third of all companies requiring recapitalisation
• Total capital injection could amount to USD 1.38 billions
• Assuming no reinsurers default and no decline in investment values
Impact of cat event with severity similar to Gonu*
* Single event resulting in non‐life combined ratio of 120%
Source: A.M. Best’s Statement File ‐ Global
58

Thankfully global reinsurance capacity remains unchanged ...
• Cat events of 2017 were an earnings event for major reinsurers
• Providers of convergence capacity re-loaded post the cat events
• Global reinsurance capacity remains unchanged despite major cat events of 2017Source: Guy Carpenter and A.M. Best
Global reinsurance capital (USD bn)
292 320 340 332 345 345 362
19 48 60 68 75 87 100
2012 2013 2014 2015 2016 2017 2018E
Traditional Capital Convergence Capital
59

... which is good for GCC insurers given high reinsurance dependence
• Markets have benefited from what seems to be cheap reinsurance capacity
• After years of decline, cession ratio is back above 50%
• Questions:a.Has counterparty risk
remained stable throughout the period?
b.Is reinsurance buying linked to risk appetite?
Reinsurance cessions and “cost” of reinsurance* in the UAE
*Cost of reinsurance = ceded premiums / ceded claims reserves
Source: A.M. Best’s Statement File ‐ Global
60
0.40
0.80
1.20
1.60
25%
50%
75%
'06 '07 '08 '09 '10 '11 '12 '13 '14 '15 '16
Cost of reu
nsuran
ce
Cession ratio
Cession ratio Cost of reinsurance

61

Outstanding balances: a hidden source of catastrophic losses
• The UAE is the GCC market with the highest level of premiums outstanding
• Improvement in remaining GCC countries is driven mainly by KSA
• Are all these amounts recoverable?
Days premiums remain outstanding Cash flow generated
• Late payments impact cash flow
• 10 years ago the UAE accounted for almost half of the cash flow of the GCC insurance industry. In 2017 it was below 10%
• What would happen if outstanding balances were written off?
100
150
200
250
300
350
'07 '08 '09 '10 '11 '12 '13 '14 '15 '16 '17
GCC UAE
0
1
2
3
4
'07 '08 '09 '10 '11 '12 '13 '14 '15 '16 '17
GCC UAE
Source: A.M. Best’s Statement File ‐ Global
62
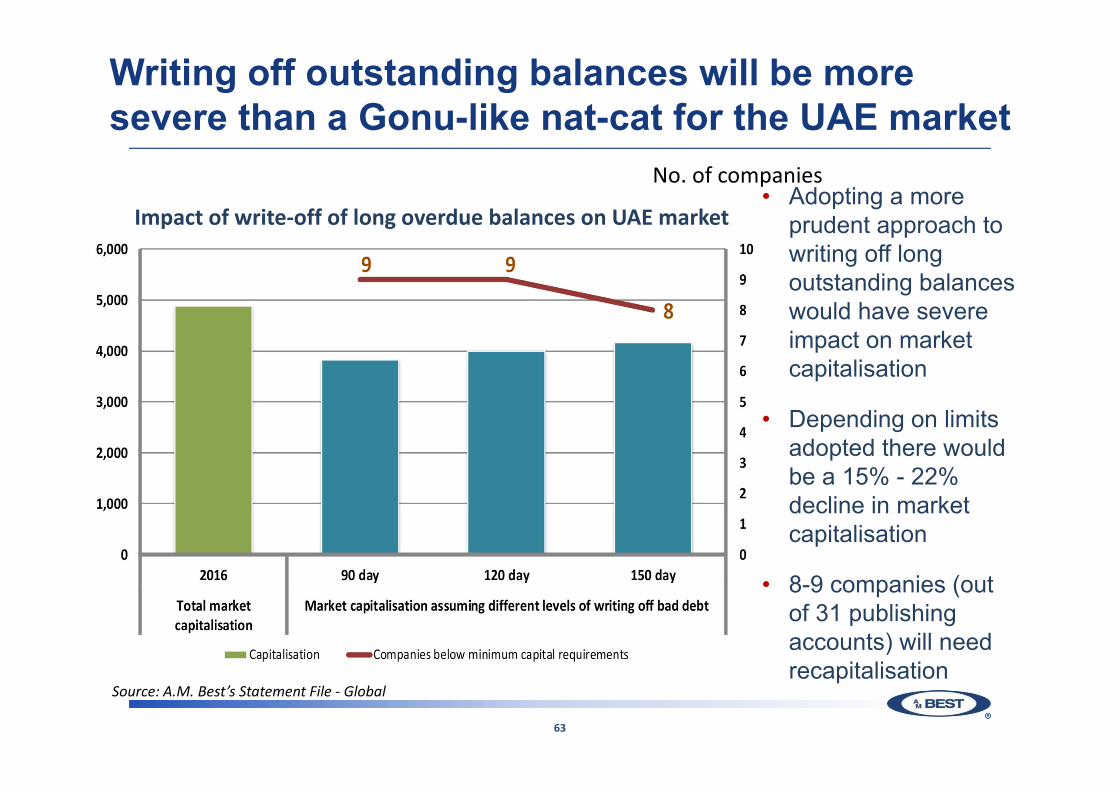
Writing off outstanding balances will be more severe than a Gonu-like nat-cat for the UAE market
• Adopting a more prudent approach to writing off long outstanding balances would have severe impact on market capitalisation
• Depending on limits adopted there would be a 15% - 22% decline in market capitalisation
• 8-9 companies (out of 31 publishing accounts) will need recapitalisation
Impact of write‐off of long overdue balances on UAE market
Source: A.M. Best’s Statement File ‐ Global
63
No. of companies
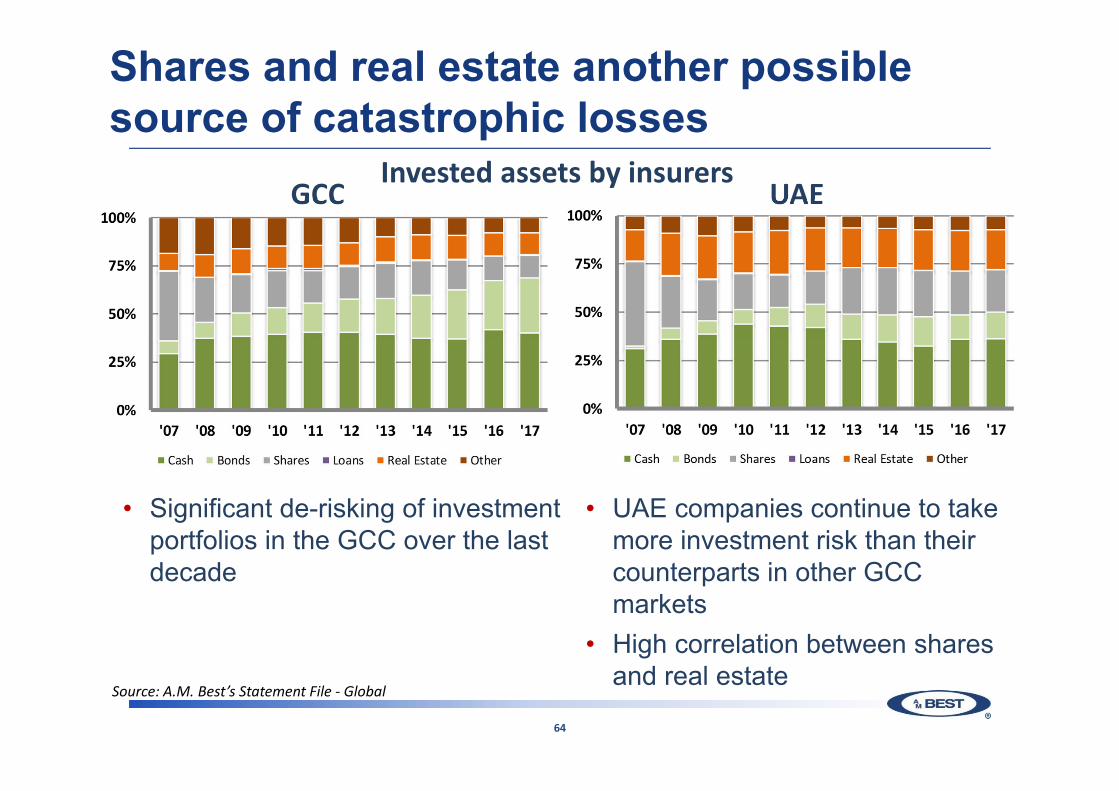
Shares and real estate another possible source of catastrophic losses
Invested assets by insurersGCC UAE
• Significant de-risking of investment portfolios in the GCC over the last decade
• UAE companies continue to take more investment risk than their counterparts in other GCC markets
• High correlation between shares and real estate
Source: A.M. Best’s Statement File ‐ Global
64

A scenario similar to the 2009 crisis results in higher losses than a Gonu-like nat-cat event
• Market remains vulnerable to investment write downs
• There is high correlation between local stocks and real estate values
• A scenario similar to the one experienced in 2008-2010 would result in a 15% - 26% loss of shareholder equity in the UAE market
• 7-8 companies needing recapitalisation
Impact of asset impairments on UAE insurers
Source: A.M. Best’s Statement File ‐ Global
65

Conclusion
• GCC has low levels of nat-cat exposure
• Recent weather-related cat events are below historical highs
• Man made events more than compensate for the lack of nat cat
• Insurers need to re-examine their risk appetite and strengthen their ERM practices
66

Future 2018 Insurance Market Briefings
2018 Insurance Market Briefing – Europe08:30 – 13:00 GMT, followed by lunchMethodology Review Seminar14:00 – 16:00 GMT
Tuesday 6 November, 2018:etc. venues St Paul's, London200 Aldersgate, London, EC1A 4HD
2018 Insurance Market Briefing – Europe08:30 – 13:00 GMT, followed by lunchMethodology Review Seminar14:00 – 16:00 GMT
Tuesday 6 November, 2018:etc. venues St Paul's, London200 Aldersgate, London, EC1A 4HD
A.M. Best’s Market Briefing 2018 at the 15th Singapore International Reinsurance Conference 14:00 – 15:00 SGT
Tuesday 30 October, 2018:A.M. Best Suite – Heliconia Jr BallroomSands Expo & Convention Centre, Marina Bay Sands, Singapore
A.M. Best’s Market Briefing 2018 at the 15th Singapore International Reinsurance Conference 14:00 – 15:00 SGT
Tuesday 30 October, 2018:A.M. Best Suite – Heliconia Jr BallroomSands Expo & Convention Centre, Marina Bay Sands, Singapore


