61
Government evidence to the STRB The 2018 pay award February 2018

Government evidence to the STRB The 2018 pay award
February 2018

2
Contents Summary 4
General Economic Outlook 6
Introduction 6
Public Finances 6
Labour Market 7
Public Sector Pay and Pensions 9
Conclusion 10
Affordability in schools 12
Maintaining a supply of high quality teachers and leaders 16
Teacher Recruitment and Retention 16
School Leaders 21
Applying the 2018 pay award 23
Annex A: Affordability in schools 24
Funding for schools in England 24
School budgets in Wales 24
Annex B: The teacher labour market 26
The teaching workforce 26
Classroom teacher salaries 28
Use of allowances 33
Vacancies 37
Demand 43
Vacancies and demand in Wales 44
Annex C: Recruitment to teacher training 45
ITT allocations 2017/18 47
The quality of new recruits 2017/18 49
Bursaries and scholarships 49
School-based ITT 52

3
Teacher recruitment and training in Wales 54
Annex D: School leaders 58
Salaries of school leaders 58
Age 59
Headship vacancies 60
Leadership supply in Wales 60

4
Summary 1. The then Secretary of State wrote to Dr Patricia Rice, the Chair of the School
Teachers’ Review Body (STRB), on the 7th December, asking for the STRB’s recommendations on the September 2018 pay award.
2. The letter emphasised that the government recognises that in some parts of the public sector, particularly in areas of skill shortage, a more flexible approach to pay may be required but there is still a need for pay discipline to ensure the affordability of public services.
3. The remit letter emphasised the importance of focusing on how the pay award can best address recruitment and retention challenges and encourage high quality entrants to join the profession and support their progression within the workforce, while remaining within the bounds of affordability. The letter asked for recommendations on:
• What adjustments should be made to the salary and allowance ranges for classroom teachers, unqualified teachers and school leaders to promote recruitment and retention.
4. This document provides the Secretary of State’s evidence to support the STRB’s consideration of the 2018 pay award for teachers and school leaders. It includes evidence on the teacher labour market, based on the latest recruitment and retention data, and on affordability.
5. On affordability, the evidence sets out the need for the STRB to consider the pay award in the context of the transition to the National Funding Formula and the cost pressures faced by schools and headroom available for increases in teachers’ pay. The evidence makes clear that affordability at a school level will vary from the national picture and that uplifts to the statutory salary and allowance ranges need to be considered in relation to an opportunity cost of reduced flexibility for schools to invest money elsewhere.
6. The evidence makes clear that while we are recruiting the teachers we need at a national level, we recognise this is a challenge, particularly in some subjects and for some schools, not least in the context of an improving economy and a strengthening graduate labour market.
7. For school leaders, the evidence shows a strong overall recruitment and retention context, with a fall in the proportion of schools reporting a headteacher vacancy or the headteacher post being temporarily filled between 2010-2016. This is supported by the pay system, which gives schools the flexibility to reward exceptional leaders and to attract strong leadership teams to work in the most challenging schools.

5
8. The STRB will want to carefully consider this evidence and how it can best target the pay award to support schools with recruitment and retention in this context.

6
General Economic Outlook
Introduction 9. The economic and fiscal context in which the Pay Review Bodies (PRBs) will
make their recommendations was set out in detail in the November 2017 Budget. However, as in previous years, this chapter summarises points that may be of particular relevance to the pay review process, notably the latest Office for Budget Responsibility (OBR) projections for the economy, and recent trends in the labour market, both in the public and the private sector. This should be considered alongside the rest of this evidence when making recommendations.
10. In 2017 the Government adopted a more flexible approach to public sector pay, to address areas of skills shortages and in return for improvements to public sector productivity. The Government will continue to ensure that the overall package for public sector workers is fair to them and ensures that we can deliver world class public services, while also being affordable within the public finances and fair to taxpayers as a whole. This makes it all the more important that Pay Review Bodies continue to consider affordability, alongside wider economic circumstances, when making their recommendations.
Public Finances 11. As usual, it is important that the PRBs take into account the wider fiscal
context when making their recommendations. As set out in the November Budget, the UK economy has demonstrated its resilience. Gross Domestic Product (GDP) has grown continuously for 19 quarters and employment has risen by 3 million since 2010 to a near record high. However, over the last year business investment has been affected by uncertainty, and productivity - the ultimate driver of wage growth - has been subdued. Productivity growth has slowed across all advanced economies since the financial crisis, but it has slowed more in the UK than elsewhere. The OBR has revised down expectations for productivity growth over the forecast period compared to Spring Budget 2017.
12. The government has made significant progress since 2010 in restoring the public finances to health. The deficit has been reduced by three quarters from a post war high of 9.9% of GDP in 2009 10 to 2.3% in 2016 17, its lowest level since before the financial crisis. Despite these improvements, borrowing and debt remain too high. The OBR forecast debt will peak at 86.5 % of GDP in 2017 18, the highest it has been in 50 years. In order to ensure the UK’s economic resilience, improve fiscal sustainability, and lessen the burden on future generations, borrowing needs to be reduced further.

7
13. The fiscal rules approved by Parliament in January 2017 commit the government to reducing the cyclically adjusted deficit to below 2% of GDP by 2020 21 and having debt as a share of GDP falling in 2020 21. These rules will guide the UK towards a balanced budget by the middle of the next decade. The OBR forecasts that the government will meet both its fiscal targets, and that borrowing will reach its lowest level since 2001 02 by the end of the forecast period. Debt as a share of GDP is forecast to fall next year and in every year of the forecast. These targets will require ongoing discipline in public spending,
14. Public Sector pay currently accounts for around £1 in every £4 spent by the government and the public sector pay bill figure for 2016/17 is £179.41bn, up from £173.19bn in 2015/16. Public sector pay policy necessarily plays an important role in controlling public spending.
15. Departments are also facing longer-term pressures. The OBR’s Fiscal Sustainability report highlighted the significant impact that demographic changes are likely to have on the public finances. Discipline in public spending remains central to achieving the government’s fiscal targets. The last Spending Review budgeted for one per cent average basic pay awards, in addition to progression pay for specific workforces, and there will still be a need for pay discipline over the coming years to ensure the affordability of the public service and the sustainability of public sector employment.
16. This makes it ever more important to ensure that our pay bill spending delivers maximum value for money. Between 2010 and 2016, public service productivity increased by 3%, an average of 0.5% per year. But although public service productivity has improved, further improvements are vital in order to deliver government objectives and meet rising demand. In its response to the PRBs Government will consider where pay awards can be agreed in return for improvements to public sector productivity, which also plays an important role in the UK’s productivity growth overall.
Labour Market 17. The UK labour market necessarily forms an important backdrop to the PRB
process. The OBR forecast that the number of people in employment will continue to increase to 32.7 million in 2022. The unemployment rate is forecast to increase slightly over the forecast horizon as it returns to the OBR’s new estimate of its equilibrium rate, remaining at 4.6% from 2020 onwards.
18. Despite the continued strength of the labour market, weak growth in labour productivity has been weighing down on wages and, ultimately, the public finances. As set out in the November 2017 Economic and Fiscal Outlook, the

8
OBR expects productivity to remain flat in 2017, before increasing 0.9% in 2018 and 1.0% in 2019. Productivity growth is then forecast to increase to 1.3% in later years. This compares to the Spring Budget 2017 forecast of 1.7% on average over the forecast period.
Figure 1: Real output per hour and real consumption per hour, year on year growth (ONS November 2017)
19. With a lower forecast for productivity growth the OBR expects average earnings growth of 2.3% in 2017, 2018 and 2019. It then increases to 2.6% in 2020, 3.0% in 2021 and 3.1% in 2022. A pickup in productivity is vital for the recovery of cross-economy wage growth rates to pre-recession levels. Public and private sector wages tend to move in similar directions, both because of pay expectations and the implications of tax receipts on public sector budgets. The £31 billion National Productivity Investment Fund and our Industrial Strategy will help to boost productivity and earning power throughout the UK.
20. We recognise that higher inflation is putting pressure on all households as well as our hardworking public servants. But historically the relationship between pay and inflation has been a weak one, in part due to the temporary nature of many inflation fluctuations. Most forecasters expect this period of above target inflation to be temporary, as inflation has been pushed above the target by the boost to import prices that had resulted from the past depreciation of sterling . The OBR and the Bank of England both expect inflation to peak at the end of this year and then fall again over 2018 and 2019. The appropriate level of public sector pay award is complex and determined by a variety of factors, notably retention and recruitment. Rates of price inflation are important, but not the only consideration.

9
Figure 2: Whole economy average earnings growth and inflation (ONS November 2017)
Public Sector Pay and Pensions 21. Specific evidence on the pay of teachers is presented elsewhere in this
document. However, wider trends in pay and remuneration are also relevant. Following the last recession, public sector wages did not undergo the sharp fall seen in the private sector, and have since grown at a slower pace than private sector wages: for the three months to October 2017 private sector total pay grew by 2.7% on the same period the previous year, compared to 1.8% in the public sector (excluding financial services). However, the overall remuneration of public sector employees when taking employer pension contributions into account remains at a significant premium, as seen in figure 3 below.

10
Figure 3: Percentage public sector pay premium, hourly pay for all employees, controlling for personal characteristics (ONS ASHE)
22. When considering changes to remuneration, PRBs should take account of the total reward package. Public service pension schemes continue to be amongst the best available and significantly above the average value of pension provision in the private sector. Around 17% of active occupational pensions scheme membership in the private sector is in defined benefit (DB) schemes, with the vast majority in defined contribution (DC) schemes. In contrast, over 95% of active members in the public sector are in DB arrangements.
23. In April 2016, the National Living Wage was introduced at £7.20 for workers aged 25 and over (increased to £7.50 an hour in April 2017, and will increase to £7.83 in April 2018). The introduction of the NLW marked an increase in pay for over a million workers across the UK labour market, including in the public sector. Estimates indicate that approximately 53,000 public sector workers were paid the NLW in 2017. In 2018-19, 1.2 million people on low incomes across the economy will have been taken out of income tax altogether (compared to 2015-16), and a typical taxpayer will pay £1,075 less income tax, compared to 2010-11. Overall, since 2015, we have cut income tax for 31 million people, while freezing fuel and alcohol duty.
Conclusion 24. This chapter summarises the economic and fiscal evidence which is likely to
be relevant to the recommendations of the PRBs. This is intended to inform their usual consideration of the affordability of specific pay awards, on top of the workforce specific evidence presented elsewhere in this document.

11
25. Much of the evidence presented here will feed into retention and recruitment across public sector workforces. Retention and recruitment will vary considerably across geographies, specialisms and grades, where public sector workers face different labour market structures. We would welcome specific comment and analysis from the PRBs on any trends and how pay systems could help address these issues.

12
Affordability in schools 26. Following the Chief Secretary to the Treasury’s letter to the chair of the STRB
on 21 September, the government has recognised the need for increased flexibility in its approach to public sector pay and it is no longer the case that the STRB is being asked to frame its recommendations within the context of a maximum 1% average pay award. However, it is clear that affordability and value for money continue to be key considerations for the STRB in making recommendations on the 2018 teachers’ pay award.
27. In July, we announced an additional £1.3 billion for schools and high needs across the next two years, over and above the schools budget set at Spending Review 2015.
28. As a result of this investment, core funding for schools and high needs will rise from almost £41.0 billion in 2017-18 to £42.4 billion in 2018-19. In 2019-20 it will rise again to £43.5 billion. The core schools and high needs budget will therefore increase by £2.6 billion between 2017-18 and 2019-20, maintaining the schools and high needs blocks of the dedicated schools grant (DSG) in real terms per pupil up to 2019-20. Spending plans beyond 2019-20 will be set out in a future Spending Review.
29. This investment has allowed us to deliver a national funding formula for schools that provides for a minimum cash increase in funding for all schools of 0.5% per pupil in 2018-19, and 1% by 2019-20 compared to their baselines. Under the national funding formula, schools will attract £2,747, £3,863, and £4,386 for each primary, key stage three and key stage four student respectively. All schools will also attract a lump sum of £110,000. Schools will attract further funding based on their specific characteristics for additional needs (deprivation, low prior attainment, English as an additional language and mobility) and school-level characteristics (sparsity and premises costs). The formula includes a minimum per-pupil funding level, in 2019-20, of £4,800 for every secondary school and £3,500 per pupil for every primary school. In 2018-19, as a step towards these minimum funding levels, secondary schools will attract at least £4,600, and primary schools £3,300. Gains will be capped at 3% per pupil in 2018-19 and a further 3% per pupil in 2019-20.
30. To provide stability for schools through the transition to the national funding formula, each local authority will continue to set a local formula which will determine individual schools’ budgets in their areas, in 2018-19 and 2019-20, in consultation with local schools. This means that the school-level allocations used within the national funding formula are notional allocations which we will use to set the total funding available for schools in each area. Schools’ final

13
actual funding allocations for 2018-19 and 2019-20 will be based on that local formula agreed in their area by the local authority.1
31. At a national level, we have estimated the pressures schools will face on their budgets from spend which is not on teachers’ pay, including non-pay inflation and the effect of increases in the National Living Wage and National Minimum Wage. These pressures come to 0.3% and 0.4% of overall expenditure in 2018-19 and 2019-20 respectively. We assume the costs associated with staffing numbers will increase in line with published figures from the Teacher Supply Model , driven by increases in pupil numbers. That means that nationally and overall, costs could rise a further 2.2% and 1.4% in 2018-19 and 2019-20 respectively before schools would face real terms pressures. This represents a theoretical absolute upper bound to the impact on schools’ budgets above which increases in teachers’ and school support staff’s pay would lead to real terms per pupil pressures for schools. Whilst these figures are calculated and expressed on the basis of financial years, the STRB will appreciate that its recommendations will affect teachers’ pay for the 18/19 academic year, and therefore overlap between the 18-19 and 19-20 financial years. It is therefore important to consider the affordability of increases in teachers’ pay in 2018 on both the 2018-19 and 2019-20 financial years. Details of the pressures schools will face in both years are available.
32. The overall rise in average pay is determined by individual teachers’ progression and changes in the composition of the workforce, both larger in magnitude than the rise the STRB makes to the pay range maxima and minima. Pay rises for teachers in service in consecutive years averaged 4.6% last year2, most of that progression concentrated on younger, early-career teachers who receive pay rises of around 8% as they move up the main pay scale. Meanwhile, a smaller composition effect - the net effect of older, higher-earning teachers leaving and younger teachers joining the profession – put a downward pressure on wages of 2.3%. These are the result of choices schools make – within the constraints of their local teacher labour market – regarding the composition of their workforces and the progression they offer their teachers. While this is an intended consequence of flexibility, it creates uncertainty regarding the overall pay rise which is determined by the interaction of the progression effect, the composition effect and the STRB’s award.
33. However, there are a wide range of other activities and priorities schools could choose to spend money on. Teachers’ pay is the single largest item in a school budget and typically represents around 50% of school expenditure. As such, schools will need to consider teachers’ pay against other important
1 Further information on the NFF is available here. 2 Teacher Analysis Compendium 2

14
priorities, such as school improvement, teacher CPD, pastoral support and teaching resources. It is therefore not the case that any money which our modelling currently shows to be theoretically ‘uncommitted’ can be considered to be fully available to fund teachers’ pay increases arising from STRB recommendations. Whilst the government provides advice and support for schools to make the most efficient use of their funding, including an improved benchmarking service for them to compare spend against other, similar schools, it is for schools themselves to take decisions about how best to allocate their resources. The current teacher pay framework provides schools with the flexibility to balance these competing demands within their budget and to prioritise teachers’ pay, if that is the best use of their resources locally. The STRB will therefore want to consider the value for money of uplifts to the statutory salary and allowance ranges against an opportunity cost of reduced flexibility for individual schools to make decisions to spend this money elsewhere, if that would be most effective in educating pupils.
34. It is also important to recognise that affordability at a school level will vary from the national picture. As outlined earlier, the introduction of the National Funding Formula will provide for up to 6% gains per pupil for underfunded schools by 2019-20, and, as a minimum, a 0.5% per pupil cash increase in 2018-19, and a 1% increase by 2019-20 compared to their baselines. If every school was to receive the notional National Funding Formula allocation for 2018-19 published in September, 32% would receive a per pupil budget increase of more than 2.5%; 22% between 1.5% and 2.5%; and 46% of up to 1.5%. However, while the total sum to be delegated to schools in each local area will, for the first time, be ring-fenced, local authorities have the flexibility to transfer up to 0.5% of the schools budget to other education spending (for example, spending on high needs) with the agreement of the local schools forum. Local authorities will also continue to set a local formula which will determine individual schools’ budgets in their areas, in 2018-19 and 2019-20, in consultation with local schools, and have the ability to diverge from the national formula if they believe that will help to smooth the transition, or to take account of specific local circumstances. This means that at a school level, the affordability of increases in teachers’ pay will be affected by their future funding trajectory – which will vary from school to school. The deadline for local authorities to set local formulae for 2018-19 is 28 February 2017, and we will provide further information on individual schools’ budgets for the coming year in due course.
35. In Wales gross schools’ expenditure is budgeted to be £2.543 billion in 2017-18.3 The funding delegated to schools in 2017-18 is budgeted to be
3 The Welsh schools budget for 2018-19 has not yet been agreed.
15
£2.142billion. Further details on school budgets in Wales can be found in Annex A.
36. Further evidence about affordability in schools is provided in Annex A.

16
Maintaining a supply of high quality teachers and leaders Teacher Recruitment and Retention
Teacher Recruitment
37. At a national level, we are recruiting the teachers we need. However, we recognise that teacher recruitment has been a challenge, particularly in some subjects and for some schools, not least in the context of an improving economy and a strengthening graduate labour market.
38. We have more teachers in our schools than ever before and the number of teachers has kept pace with changing numbers of pupils. There are more than 457,000 teachers in state-funded schools throughout England – 15,500 more than 2010. The number of full time equivalent (FTE) teachers increased by 3.5% between November 2011 and November 2016. The majority of the increase was in the primary sector, in part due to the growing number of younger pupils.
39. Teacher vacancy rates have remained low and relatively stable (at around 0.3% or below of all teaching posts) since 2010, and teaching continues to be an attractive profession for high quality graduates.
40. There were 27,895 new entrants to postgraduate ITT courses in the academic year 2017/18. Overall, this meant that we reached 90% of our target for postgraduate trainee recruitment. In the 2017/18 academic year we met 80% of our total secondary recruitment target, and in primary we recruited 106% of our recruitment target.
41. ITT performance profiles for 2015/16 (the latest available) show that 95% of the 2015/16 cohort were in a teaching post within six months of being awarded QTS, although this figure excludes the trainees for whom information is not known.
42. The latest figures also show the number of former teachers coming back to the classroom has risen significantly – from 13,090 FTEs in 2011 to 14,200 FTEs in 2016.4
43. Further information on recruitment figures can be found at Annex C.
4 School Workforce Census 2016

17
Teacher Retention
44. Official statistics5 show that after gaining QTS and starting teaching, around 70% of teachers teach in state-funded schools for at least five years; 60% for at least ten years; 50% teach for at least 20 years. These retention rates have been broadly similar for the last 20 years, as can be seen in table 8 in Annex B, which shows retention rates by year of QTS.
45. There has been an increase in teacher movements between schools. Recruitment activity generated by movements between schools now makes up more of the entrants to schools than the next largest source – NQTs. DfE published new analysis of schools workforce trends between 2010-2015 in September 2016.6
46. Recent analysis by the department7 found that the probability of leaving the profession is highest in the first five years of a teacher’s career and falls after that. This analysis also found that retention varied by teacher’s contract status, with higher retention rates for those with a permanent contract, and by region, with retention rates higher outside London. Similarly recent analysis by the NFER8 found that system-level retention is more challenging in certain subjects, particularly science and modern foreign languages, and in certain areas, particularly London and other large cities. This analysis, in common with the department’s, found that the probability of a teacher leaving the profession decreases as their number of years of experience increases. These retention rates have been broadly similar for the last 20 years.
47. We are actively addressing the issues that teachers cite as reasons for leaving the profession, for example by supporting schools to reduce unnecessary workload and improving behaviour management training for new teachers. Our plans to strengthen Qualified Teacher Status (QTS), discussed further in paragraph 65, will also support early career retention by ensuring a strong link between high-quality initial training and effective ongoing professional development.
48. We know flexible working policies can help to recruit, retain and motivate teachers. The then Secretary of State hosted a summit on flexible working on 30 October 2017 to support school leaders to provide staff with greater opportunities for flexible working. The outcomes of the summit were over 60 pledges, made on behalf of the Department, and those present, to take concrete action to increase the opportunities for flexible working in schools.
5 Schools Workforce Census 2016 – table 8 6 Local analysis of teacher workforce: 2010 to 2015 7 Teachers Analysis Compendium 1 8 NFER research report on teacher retention

18
These pledges were published on the flexible working pages on Gov.uk on 11 December 2017.
49. The fundamental changes to teachers’ pay that have been introduced over the last four years following the STRB’s recommendations have given greater autonomy to schools to decide how to reward their staff. Schools now have much greater flexibility to decide what salary to offer to new teachers on appointment, as well as greater freedom to decide how quickly their pay progresses over time. This increased flexibility helps schools to attract and retain the best teachers and to target any school-level recruitment and retention problems they may have, including addressing teacher shortages in specific subjects. Additional information on classroom teacher salaries can be found at Annex B.
Teacher Quality and Routes into Teaching
50. We are focused on attracting more top graduates into the profession, particularly in those core academic subjects that help children reach their potential. We have announced a £30million investment in tailored support for attracting more great teachers into some of the schools that struggle the most with recruitment and retention.
51. The proportion of new entrants to postgraduate initial teacher training (ITT) with degree classifications of 2:1 in 2017/18 was 74%, up from 63% in 2010/11. Nearly one in five teacher trainees had a first-class degree in 2017/18 (19%) – up from 17% in 2014/15, and 10% in 2010/11.
52. We have put a range of incentives in place – including training bursaries of up to £26,000, scholarships of £28,000 and salary grants – to encourage more top graduates and career changers to train to teach in priority English Baccalaureate (EBacc) subjects. In addition, we have given schools the opportunity to recruit and train graduates for teaching careers, giving them an even greater degree of influence over selecting and training the teachers they need. We are also piloting a new programme to reimburse student loan repayments for teachers in the early years of their careers. Around 800 MFL and 1,700 science teachers a year will be eligible for this pilot scheme.
53. For maths trainees we are offering a £20,000 bursary followed by two additional early-career payments of £5000 each (£7500 if teaching in an area of England that needs more great teachers) in their third and fifth year of teaching, if they have taught in a state-funded school in England since completing their teacher training course.
54. For the 2018-2019 recruitment cycle we are adopting a permissive approach that removes recruitment constraints on School Direct lead schools and ITT

19
providers in almost all subjects.9 In a very small number of subjects, we have set fixed allocations – in some cases by individual route – in order to safeguard against oversupply. In these subjects, places have been allocated at the start of the year, so that individual providers have certainty about the number of trainees they can recruit in those subjects.
55. We have continued multiple year allocations for the top performing ITT providers; a key recommendation from the National Audit Office’s review of teacher training published last year. A list of ITT providers that have been awarded multiple-year allocations was published on Thursday 26 October alongside the multiple-year allocations methodology for 2018-2019. The document can be found here.
56. The School Direct programme gives schools the opportunity to identify and train talented people from their local graduate labour market. It offers schools the chance to take greater control and attract, train and develop high quality teachers and potential leaders. In 2017/18, 10,070 teachers began training through School Direct.
57. The long-term viability of School Direct requires strong local partnerships to be created and maintained, and the Government encourages schools to work in broad and sustainable partnerships, particularly in areas where this is not yet fully established. The School Direct salaried programme allows trainee teachers to earn a salary as they train.
58. We have continued to accredit new school-led providers (SCITTs), of which there are 177 in the 2017/18 academic year (compared to 172 in 2016/17 and 89 in 2010/11). 53% of all recruitment to postgraduate ITT starting in 2017/18 was to school-led routes, making it the third year for which more than half of postgraduate ITT is school-led. This shows that schools have the appetite to take charge of recruitment to the profession.
59. We will also continue to support the Teach First programme. The programme is helping to recruit more teachers across England and place them in some of the most challenging schools, including in Opportunity Areas. Since its founding Teach First has trained over 10,000 teachers, with 1,300 starting in England in 2017/18.
60. The quality of teaching is the single most important factor in driving up standards in our schools. Providing the best possible training is at the heart of the Government’s drive to improve teaching standards and ensure children from all backgrounds have the opportunity to achieve academic excellence.
9 Allocation methodology for ITT places in the training year 2018-19 published 14 September 2017.

20
61. Following Sir Andrew Carter’s review of the quality of Initial Teacher Training (ITT) in 2014, the Government commissioned an independent working group chaired by Stephen Munday CBE to develop a framework of core ITT content. ‘A Framework of core content for Initial Teacher Training’ published in July 2016 sets out clearly what all providers of ITT must require of their trainees before they can be deemed to be meeting the Teachers’ Standards at the level appropriate to the end of a period of initial teacher training. Post ITT we are helping to ensure that teachers continue to access opportunities to develop and improve their practice throughout their careers, through a range of support.
62. An expert group of academics, headteachers and teachers produced the Standard for teachers’ professional development, which was published by DfE last year. This sets out the characteristics of the most effective professional development, helping schools to identify the best and most appropriate CPD for teachers.
63. The new Teaching and Leadership Innovation Fund (TLIF) will be providing around £75m to improve the quality of teachers’ and leaders’ professional development, through funding evidence-based projects which can deliver at scale, particularly in the areas of the country that need it most. The first six successful bidders were announced on 14 September including the Teacher Development Trust, Teach First and the Institute of Physics. These will share a fund worth almost £17million as part of the government’s drive to support and spread great teaching.
64. The Government has also made available up to £5m to support the establishment of the Chartered College of Teaching, which will focus on helping teachers to access high quality professional development and to use the evidence base on effective practice to inform their own teaching.
65. We believe there is more that we can do to help raise the status of the teaching profession to take its place alongside other learned professions like law and medicine. We therefore propose to strengthen Qualified Teacher Status (QTS) to ensure a strong link between high-quality initial training and effective ongoing professional development, with a view to ensuring that teachers continue to develop and improve throughout their careers. The department is currently consulting on these plans to strengthen QTS, consultation details can be found here.
66. Further information on teacher quality and routes into teaching can be found at Annex C.

21
School Leaders 67. School workforce data from 2016 also shows that there are 69,500 FTE
headteachers, deputy headteachers and assistant headteachers in state schools in England and that between 2010 and 2016 the proportion of schools reporting a headteacher vacancy or the headteacher post being temporarily filled decreased, from 1.4% to 1.1%. We recognise, however, that some schools face recruitment challenges.
68. In 2014, new leadership pay arrangements were introduced to give schools greater flexibility to attract headteachers. Schools are able to pay up to 25% above the headteacher pay range, and even more in exceptional circumstances. This gives schools greater flexibility to reward exceptional headteachers and to attract strong leadership teams to work in the most challenging schools.
69. We want to support the system to develop a strong and sustainable pipeline of talented, motivated staff in leadership positions – people who are ready to meet the challenges of today’s system. Working with top headteachers, MAT CEOs and other sector experts, we have recently developed a reformed suite of National Professional Qualifications (NPQs) to better prepare teachers for the range of leadership roles in today’s school system. This includes a new National Professional Qualification for Executive Leadership (NPQEL). 41 high-quality, accredited providers will be offering the reformed NPQs from academic year 2017/2018 with details announced on Friday 20 October, click here.
70. The Department has funded targeted programmes that aim to boost leadership capacity in challenging schools. This includes the High Potential Senior Leaders programme (currently delivered by Ambition Schools Leadership), which develops aspiring headteachers who want to work in some of the most challenging schools in the country, and the High Potential Middle Leaders programme (also currently delivered by Ambition School Leadership), which develops middle leaders in primary and secondary schools in challenging contexts. A number of these middle leaders will go on to be the headteachers of tomorrow.
71. We know that there is more to do to address the disparity in BME representation in school leadership. This is why we have provided a £1m Leadership Equality and Diversity Fund, which has supported 58 school led projects across England, many of which focus on supporting BME teachers. We are also working with the sector to revise recruitment guidance for schools and have appointed nine Women Leading in Education (WLE) regional networks to raise the profile of women in education and to support career progression.

22
72. We have also set up the WLE leadership coaching pledge in direct response to calls from the sector, and the profiles of over 800 leaders from all backgrounds are on our coaching directory where women can identify and access free leadership coaching to help increase their confidence to pursue and secure leadership roles.
73. Further information about the labour market for school leaders in England and Wales is provided in Annex D.

23
Applying the 2018 pay award 74. Following the Government’s acceptance of the recommendations of the
STRB’s 21st - 27th reports, schools now have a very large degree of flexibility to differentiate the remuneration they offer to teachers to reflect various factors, including local recruitment and retention; roles and responsibilities; and specialist qualifications.
75. The Government’s response to the STRB’s 27th report was to accept the recommendation for an uplift of 2% to the minima and maxima of the main pay range and a 1% uplift to all other classroom teacher and leadership pay ranges and allowances in the national pay framework.
76. In its report last year, the STRB reiterated its expectation that it should be for schools themselves to decide the extent to which any uplift to pay ranges and allowances within the national pay framework will apply to their teachers. It was the STRB’s view that uplifts should not be applied automatically to teachers and that any individual pay award needed to take account of performance. The STRB made very clear that it was not intended that the uplifts to the framework should translate into uniform pay increases for every teacher within every school. It is for schools to determine at the institutional level how to take account of the uplifts to pay ranges and allowances in the light of their individual school’s pay policy. The Government agrees with this approach and that schools should be using their autonomy and making decisions on how they will be rewarding individual teachers in accordance with their pay policies.
77. The Government’s view is that a similar approach should be taken in any recommendations this year, namely that it will be for schools to use their autonomy and set out in their pay policies how they intend to deal with any proposed uplifts to the national framework.
78. In making its recommendations this year, the STRB should consider how best to target uplifts to the pay ranges and allowances to best support schools with recruitment and retention.

24
Annex A: Affordability in schools
Funding for schools in England
Spending in schools
A1. In the financial year 2015-16 local authority (LA) maintained schools in England reported gross total expenditure of £27.5 billion.10 Of the total expenditure:
• £0.3billion (1.0%) was spent by LA maintained nursery schools;
• £18.0 billion (65.4%) was spent by primary schools;
• £6.9 billion (24.8%) was spent by secondary schools; and
• £2.0 billion (7.2%) was spent by special schools.
A2. Maintained schools spent £20.5 billion, or 74.5% of their total expenditure, on staffing costs. Of which:
• £12.7 billion (46.1% of total expenditure) was spent on permanent and supply teaching staff (excluding agency supply teachers and supply teacher insurance costs);
• £4.7 billion (17.1%) on education support staff; and
• £3.1 billion (11.3%) on other employee costs.
A3. The way in which academies spend their funding is broadly in line with LA maintained schools. In 2015-16 academies received income of £18.9billion. They spent £9.6bn on teaching staff (50.1%), around half of total spending, and £2.3bn (11.8%) on Education Support Staff.11
School budgets in Wales A4. In Wales, local authorities are responsible for school funding, through
devolution of education to the Welsh Government. Gross schools’ expenditure is budgeted to be £2.543 billion in 2017-18. The funding delegated to schools in 2017-18 is budgeted to be £2.142billion. Gross schools’ expenditure per pupil is budgeted to be £5,628, a year-on-year increase of 1.0% or £58. Of this £4,740 per pupil is delegated to schools and £888 per pupil retained for centrally funded school services. The amount of funding that local authorities delegate directly to schools’ ranges between 77%
10 All maintained school data available from the maintained schools spending data SFR 11 All academies school data available from the academies income and expenditure SFR

25
and 89% of overall gross schools budgeted expenditure. Overall, 84.2% of the total gross schools budgeted expenditure is delegated directly to schools, a decrease of 0.1 of a percentage point compared to the previous year.
A5. For the period 2011-12 to 2015-16 the Welsh Government committed to increasing spending on schools services at 1% better than the uplift to the overall Welsh budget. Over the Assembly term the Welsh Government provided an additional £106million for schools services. Through the Local Government Settlement in 2016-17 the Welsh Government made available an additional £35million for frontline school services. In December 2016 the Welsh Government published its Final Budget and Final Local Government Settlement for 2017-18. When compared on a like for like basis, the Welsh Government’s education budget for 2017-18 has increased by £50.9million or 3.8%.

26
Annex B: The teacher labour market
In November 2016 there were approximately 457,300 FTE teachers. Table 2 shows the FTE numbers of teachers in England split by grade and phase. The majority of teachers are classroom teachers (387,700 FTE). There are approximately 69,500 FTE leadership teachers and 24,000 FTE unqualified teachers12.
Table 2 : Full-time equivalent teachers (FTE) by grade13 and phase, publicly-funded schools (England, November 2016) (000s)14
Nursery
and primary
Secondary Special Centrally employed Total
Heads 16.8 3.6 1.4 0.1 21.9
Deputy heads 12.6 5.3 1.3 0.1 19.2
Assistant heads 11.8 13.8 1.8 1.0 28.4
Classroom teachers 181.1 185.4 18.0 3.2 387.7 TOTAL
222.4 208.2 22.3 4.3 457.3 - of which unqualified 7.6 12.8 2.8 0.8 24.0
Source: School Workforce Census, SFR November 2016
The teaching workforce15 18% of all FTE teachers in publicly-funded schools were aged 50 and over,
whilst 25% of teachers were aged under 30. Unqualified teachers have the largest percentage of teachers under 30 at 41%. Age distributions by grade are shown in Figure 5.
74% of teachers at all grades are female. For classroom teachers the percentage is slightly higher at 75%. For the leadership group, the percentage of female teachers is 69%. Figure 6 shows the percentages of females and males for each grade.
12 An unqualified teacher in the LA maintained sector is either a trainee working towards QTS; an overseas
trained teacher who has not exceeded the four years they are allowed to teacher without having QRS; or an instructor who has a particular skill who can be employed for so long as a qualified teacher is not available.
13 Includes advisory teachers therefore may not equal to the sum of the component parts. 14 Where totals appear not to sum, this is due to rounding. 15 All figures taken from the School Workforce Census (SWC) 2016 and are England only unless otherwise stated.

27
Figure 5: Full-time equivalent teachers (FTE) in publicly funded schools by grade and age (England, November 2016)
Source: School Workforce Census, November 2016 Figure 6: Full-time equivalent teachers (FTE) in publicly funded schools by grade and gender (England, November 2016)
Source: School Workforce Census, November 2016
Table 3 shows the ethnic background of teachers in England by grade. The percentage of teachers with a non-white ethnic background decreases as grade increases. The highest percentages of teachers with a non-white background are observed for unqualified teachers and the lowest percentage of teachers with a non-white background is observed for headteachers.

28
Table 3: Distribution of full-time equivalent teachers (FTE) by grade and ethnicity in publicly funded schools. (England, November 2016)16
Heads Deputy Heads
Assistant Heads
Classroom Teachers
Unqualified Teachers Total
White 96.8% 95.7% 93.6% 91.5% 85.2% 91.7%
White British 93.1% 92.0% 89.6% 86.1% 73.1% 86.3%
White Irish 1.9% 1.8% 1.6% 1.6% 3.7% 1.8%
Any Other White Background 1.8% 1.9% 2.4% 3.8% 8.4% 3.7%
Black 1.0% 1.3% 1.7% 2.2% 5.3% 2.3%
Black African 0.2% 0.3% 0.4% 0.9% 1.6% 0.8%
Black Caribbean 0.7% 0.8% 1.1% 1.0% 2.9% 1.1%
Any Other Black Background 0.1% 0.2% 0.3% 0.3% 0.8% 0.3%
Asian 1.3% 1.9% 3.1% 4.3% 5.8% 4.0%
Indian 0.7% 1.1% 1.6% 2.0% 2.5% 1.9%
Pakistani 0.3% 0.4% 0.8% 1.1% 1.6% 1.1%
Bangladeshi 0.1% 0.1% 0.3% 0.6% 0.8% 0.5%
Any Other Asian Background 0.2% 0.3% 0.4% 0.6% 1.0% 0.6%
Mixed 0.7% 0.8% 1.0% 1.3% 2.3% 1.2%
White and Black African 0.0% 0.1% 0.1% 0.1% 0.3% 0.1%
White And Black Caribbean 0.2% 0.2% 0.2% 0.3% 0.7% 0.3%
White and Asian 0.2% 0.2% 0.3% 0.3% 0.3% 0.3%
Any Other Mixed Background 0.2% 0.3% 0.4% 0.5% 0.9% 0.5%
Chinese 0.1% 0.0% 0.1% 0.2% 0.3% 0.2%
Any Other Ethnic Group 0.2% 0.3% 0.4% 0.5% 1.1% 0.5%
Source: School Workforce Census, November 2016
Classroom teacher salaries In 2017-18 the minimum salaries for classroom teachers in the Rest of
England and Wales pay band (the lowest of the four regional pay bands) are £22,917 for a qualified teacher and £16,626 for an unqualified teacher.
In November 2016 the average (median) gross pay of regular classroom teachers in publicly funded schools in England was £35,600. This was an increase of 0.6% compared to November 2015 (£35,400).
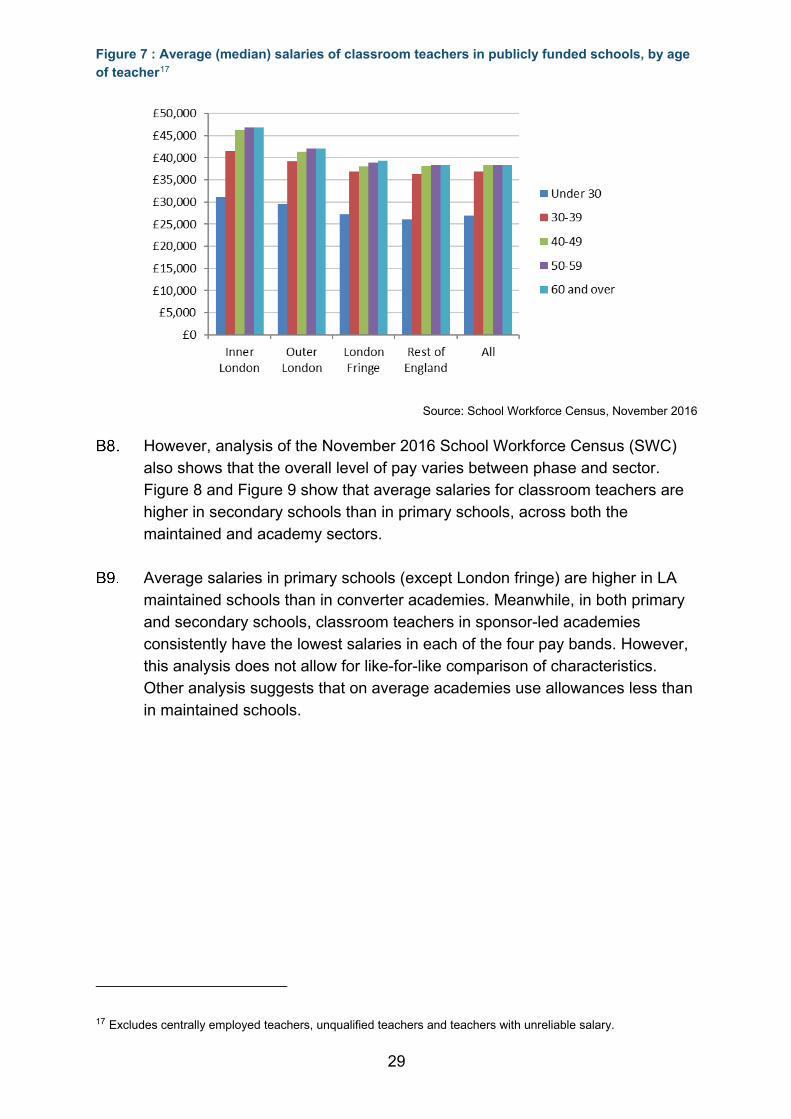
Teachers’ salaries are largely driven by the location of the school they work in and their level of experience. Figure 7 shows median salaries of classroom teachers by pay band and age. Classroom teachers typically see their salary rise much quicker in the beginning of their careers than in their later stages.
16 Percentages are out of a total of those with ethnicity information recorded in the census (over 95% of all teachers)
29
Figure 7 : Average (median) salaries of classroom teachers in publicly funded schools, by age of teacher17
Source: School Workforce Census, November 2016
However, analysis of the November 2016 School Workforce Census (SWC) also shows that the overall level of pay varies between phase and sector. Figure 8 and Figure 9 show that average salaries for classroom teachers are higher in secondary schools than in primary schools, across both the maintained and academy sectors.
Average salaries in primary schools (except London fringe) are higher in LA maintained schools than in converter academies. Meanwhile, in both primary and secondary schools, classroom teachers in sponsor-led academies consistently have the lowest salaries in each of the four pay bands. However, this analysis does not allow for like-for-like comparison of characteristics. Other analysis suggests that on average academies use allowances less than in maintained schools.
17 Excludes centrally employed teachers, unqualified teachers and teachers with unreliable salary.

30
Figure 8 : Average (median) salaries of classroom teachers in primary schools by region and school type18
Source: School Workforce Census, November 2016
Figure 9 : Average (median) salaries of classroom teachers in secondary schools by region and school type19
Source: School Workforce Census, November 2016
Figure 10 shows that the median pay of classroom teachers is higher than private sector graduate professionals in most regions in England (excluding London, Eastern, and the South East). In the other regions the median pay of classroom teachers is lower than that of private sector graduate professionals.
18 Excludes special schools, free schools, CTCs, UTCs, studio schools, and centrally employed staff and teachers with unreliable pay information. 19 Excludes special schools, free schools, CTCs, UTCs, studio schools, and centrally employed staff and teachers with unreliable pay information.

31
Figure 10 : Percentage difference in average (mean and median) salaries - classroom teachers’ salaries vs. private sector graduate professional salaries 2016/1720 21
Source: School Workforce Census November 2016 (teachers),
Labour Force Survey (graduate professionals)
Classroom teachers are less likely to be paid salaries at very high levels due to the maximum salary restrictions of the STPCD. The classroom teacher mean salary is lower than that of a graduate professional in all regions apart from the East Midlands and the North East, where classroom teacher salaries are very slightly higher. In general, this can be explained by the existence of some graduate professionals earning very high salaries, which are inflating the value of the mean, but have little effect on the median. Classroom teachers are less likely to be paid salaries at very high levels due to the maximum salary restrictions of the STPCD.
Pay is only part of the total compensation package and this analysis does not take into account additional elements offered in the different professions, such as the pension provision and the offer of healthcare benefits. Graduates would also base their career decisions on other factors, such as future career/promotion prospects, job security and work/life balance.
This analysis does not compare workers with like-for-like characteristics and the comparison would be quite different if factors such as gender and age were taken into account. Female teachers generally fare better than male teachers when compared to graduates. The earnings gap between teachers and graduates of the same age varies but is generally smaller at younger ages.
20 Graduate cohort includes employees who worked in past week, full-time in main job, with highest qualification a
degree or equivalent, professional occupation or associate professional and technical occupation. The national total for graduates includes Wales, whereas for classroom teachers it is England only.
21 The 2016/17 average salaries for graduates are estimates based on the latest three quarters of available data (Q4 2016 and Q1&Q2 2017).
NorthEast
NorthWest (incMerseysi
de)
Yorkshireand
Humberside
EastMidlands
WestMidlands Eastern London South
EastSouthWest
Median 10% 19% 14% 21% 2% -8% -4% -14% 6%Mean 2% -5% -8% 1% -10% -24% -19% -28% -11%
-30%
-20%
-10%
0%
10%
20%
30%
Diff
eren
ce b
etw
een
teac
hing
vs.
priv
ate
aver
age
sala
ry

32
Figure 11 shows real term earning values22 of classroom teachers and private
sector graduates 2002/03 to 2016/1723, not accounting for any regional variation. All three averages have decreased slightly since 2015/16, and at very similar rates. This is partly a result of relatively high inflation and partly a result of the changing composition of the teaching/private sector labour market. The figures graphed below are averages across the workforce and do not represent the career salary trajectory of any particular teacher.
From 2002/03 to 2016/1724 classroom teacher median salaries have seen a
drop of 8% and overall teacher median salaries of 11% in real terms. The median salaries of private sector graduates have decreased by 10%.
Figure 11 : Average (median) salaries in real terms25 over time26
Source: Database of Teacher Records (prior to 2010) and School Workforce Census (from 2010). Graduates: Labour Force Survey (all years)27
22 At 2016/17 prices, using CPI as the measure of inflation, consistent with ONS published analysis of changes in real wages. 23 The 2016/17 average salaries for graduates are estimates based on the latest three quarters of available data (Q4 2016 and Q1 & Q2 2017). Q3 2017 of the Labour Force Survey is not yet available. 24 Before 2013/14 the classroom teacher figures include ASTs and ETs; from 2013/14 onwards they include leading practitioners. 25 At 2016/17 prices, using CPI as the measure of inflation, consistent with ONS published analysis of changes in
real wages. 26 Unlike the previous three charts, this analysis is not limited to professional graduates due to inconsistencies in
the time series of the Standard Occupational Classification. Instead, graduates from all occupations are included in this analysis.
27 Coverage: From 2010: England and Wales, post-2010 onwards: Graduates – England and Wales, Teachers - England only. The 2014/15 average salaries for graduates are estimates based on the latest three quarters of available data (Q4 2014 and Q1&Q2 2015). Q3 2015 of the Labour Force Survey is not yet available.

33
Use of allowances Table 4 shows the percentage of schools making use of different allowances
by region. Nationally, 75.2% of schools were using allowances in November 2016. Following an increase from 75.7% in November 2010 to 78.8% in November 2013, we have observed a decrease between November 2013 and November 2016. There is considerable variation between the regions as regards the use of allowances, with additional payments being used most in inner and outer London (85.2% and 85.3% of schools using them), while only approximately two in three schools using them in Yorkshire and the Humber.

34
Table 4: Use of pay flexibilities, by region (England, November 2016)
Region Total Number of Schools
Schools using REC payments
Schools using TLR payments
Schools using SEN payments
Schools using other payments
Schools using any payments
Number % Number % Number % Number % Number %
North East 1,154 97 8.4% 827 71.7% 192 16.6% 224 19.4% 895 77.6%
North West 3,176 194 6.1% 2,295 72.3% 566 17.8% 482 15.2% 2,528 79.6% Yorkshire and the Humber 2,231 160 7.2% 1,341 60.1% 281 12.6% 353 15.8% 1,522 68.2%
East Midlands 2,035 162 8.0% 1,325 65.1% 344 16.9% 466 22.9% 1,500 73.7%
West Midlands 2,402 280 11.7% 1,393 58.0% 282 11.7% 722 30.1% 1,695 70.6%
East of England 2,543 361 14.2% 1,542 60.6% 656 25.8% 661 26.0% 1,980 77.9%
Inner London 1,011 218 21.6% 808 79.9% 209 20.7% 249 24.6% 861 85.2%
Outer London 1,548 255 16.5% 1,218 78.7% 346 22.4% 505 32.6% 1,321 85.3%
South East 3,333 415 12.5% 1,909 57.3% 775 23.3% 725 21.8% 2,304 69.1%
South West 2,314 123 5.3% 1,230 53.2% 490 21.2% 692 29.9% 1,757 75.9%
England 21,747 2,265 10.4% 13,888 63.9% 4,141 19.0% 5,079 23.4% 16,363 75.2%
Source: School Workforce Census, November 201628
28 Classroom teachers in publicly funded schools for whom data is provided. A school is counted if they are paying a pay flexibility to at least one classroom teacher. REC payments
represent Recruitment and Retention payments.

35
Teaching and learning responsibility (TLR) payments are the most widely used form of allowances, used in approximately 63.9% of schools. TLR payments are made to a teacher for undertaking a sustained additional responsibility for the purpose of ensuring the continued delivery of high-quality teaching. London schools make use of these payments most often and this pattern has been stable over time (since November 2010).
Recruitment and retention payments provide financial assistance, support or benefits to a teacher if such incentives are considered to be necessary for the recruitment of new teachers and the retention of existing teachers.
Table 4 shows that Inner London schools use these payments the most often;
this has long been the case. Given the size of the job market in London, schools may face larger competition for teachers there than elsewhere, which may in turn drive the higher use of recruitment and retention payments.
The East of England region has the most widespread use of special
educational needs (SEN) payments, but they are also widely used in London and in the South East. ‘Other payments’, on the other hand, are being used most widely in Outer London, the West Midlands and the South West. It could be that schools in some regions tend to record TLR / REC / SEN payments under ‘Other payments’. These figures should therefore be interpreted with caution.
Figure 12 shows the percentage of classroom teachers in receipt of TLR
payments each year between November 2010 and November 2016. Maintained schools were more likely to use TLR payments than academies in the same phase, and TLR payments were more widely used in secondary schools than primary schools. The overall percentage of teachers in receipt of a TLR payment has been generally increasing over time, from 26.7% in November 2010 to 27.9% in November 2016. However, between 2015 and 2016, there has been a slight reduction of the percentages in nursery, primary and secondary schools (special schools show no change). It is also worth noting that full-time teachers are twice as likely to be awarded a TLR payment compared to part-time teachers, with 32.0% of full-time teachers and 16.0% of part-time teachers having been in receipt of a TLR payment in November 2016.29
29 This also holds when controlling for school type

36
Figure 12 : Percentage of classroom teachers in receipt of a TLR payment30
Source: School Workforce Census, November 2010-2016
Figure 13 shows the median annual TLR payments by phase and sector paid to classroom teachers in November 2010-2016. It shows that TLR payments of all types were on average of higher value in secondary schools than in primary schools and that in recent years they have also generally been higher in LA-maintained schools in comparison to academies and other state-funded non-LA-maintained schools. In the most recent year the highest average TLR payments, of just under £4,000, were found in LA-maintained secondary schools. Non-LA-maintained secondary schools saw a decline between November 2010 and November 2013 and then a small increase in November 2014 with 2015 and 2016 remaining the same (at £3,600). In LA-maintained nursery, primary and special schools the average has been stable at around £2,500. Meanwhile LA-maintained primary and special schools had slightly lower TLR payments compared to non-LA-maintained schools.
30 Excludes centrally employed teachers, unqualified teachers and leading practitioners. The number of teachers in non-LA maintained special schools prior to November 2012 is not large enough to provide robust estimates and the respective figures are therefore not reported here. ‘Not LA maintained’ covers all state funded primary, secondary and special schools which are not maintained by LAs, e.g. academies, studio schools and UTCs

37
Figure 13 : Average (median) TLR payment for classroom teachers31
Source: School Workforce Census, November 2010-2016
Vacancies Table 5 shows vacancy rates by English regions between 2001 and 2016. The
dotted line indicates a change in data source prior to the final six years in the series. From November 2010 vacancy rates are based on a census date in November (prior rates were based on a census date in January, a time of the year in which schools would be expected to have more vacancies than in November). A general decline in vacancy rates and the change in census date accounts for the large drop between January 2010 and November 2010.
Vacancy rates have remained low, though have marginally increased between November 2012 and November 2016 from 0.1% to 0.3%. The teacher vacancy rate nevertheless remains low and has remained stable at around 1% or below for the past 15 years.
31 Excludes centrally employed teachers, unqualified teachers, leading practitioners and classroom teachers
without a TLR payment. The numbers of teachers receiving TLR payments in non-LA maintained special schools prior to November 2012 as well those in non-LA maintained primary schools prior to November 2011 are not large enough to provide robust estimates and the respective figures are therefore not reported here. ‘Non-LA maintained’ covers all state funded primary, secondary and special schools which are not maintained by LAs, e.g. academies, studio schools and UTCs.

38
Table 5: Vacancy rates1 in publicly funded schools by region in England, 2001 – 2016
Vacancy rate (as a percentage of teachers in post)
Region Jan
2001 Jan
2002 Jan
2003 Jan
2004 Jan
2005 Jan
2006 Jan
2007 Jan
2008 Jan
2009 Jan
2010 Nov
2010 Nov
2011 Nov
2012 Nov
2013 Nov
2014 Nov
2015 Nov
2016 North East 0.8 0.6 0.7 0.5 0.4 0.4 0.4 0.5 0.4 0.5 0.1 0.1 0.1 0.1 0.1 0.1 0.2
North West 0.5 0.6 0.5 0.5 0.5 0.3 0.3 0.3 0.3 0.3 0.1 0.1 0.1 0.2 0.1 0.2 0.2 Yorkshire and the Humber 0.5 0.9 0.6 0.5 0.6 0.5 0.5 0.7 0.5 0.4 0.1 0.1 0.1 0.2 0.2 0.2 0.4
East Midlands 0.7 0.9 0.5 0.4 0.4 0.4 0.3 0.5 0.5 0.3 0.1 0.1 0.1 0.2 0.2 0.1 0.3
West Midlands 0.9 1.1 0.8 0.7 0.7 0.6 0.6 0.9 0.9 0.6 0.1 0.1 0.1 0.2 0.2 0.2 0.3
East of England 1.7 1.7 1.2 0.9 0.8 0.8 0.7 0.8 0.9 0.5 0.1 0.1 0.1 0.1 0.2 0.2 0.3
London 3.5 2.7 2.1 1.4 1.3 1.2 1.0 1.1 0.9 0.6 0.1 0.1 0.1 0.2 0.1 0.2 0.2
South East 2.0 1.4 1.2 0.8 0.7 0.7 0.6 0.8 0.6 0.4 0.1 0.1 0.1 0.2 0.2 0.2 0.3
South West 0.6 0.5 0.4 0.3 0.4 0.3 0.3 0.4 0.3 0.2 0.0 0.1 0.0 0.1 0.1 0.1 0.2
England 1.4 1.2 0.9 0.7 0.7 0.6 0.6 0.7 0.6 0.4 0.1 0.1 0.1 0.2 0.2 0.2 0.3 England (excl. London) 1.0 1.0 0.8 0.6 0.6 0.5 0.5 0.6 0.6 0.4 0.1 0.1 0.1 0.2 0.2 0.2 0.3
Source: 618g Survey and School Workforce Census
1. Based on advertised vacancies for full-time permanent appointments (or appointments of at least one term's duration). Includes vacancies being filled on a temporary basis of less than one term. 2. From November 2010, vacancy rates are based on a census date in November which represents a break in the time series (prior rates were based on a census date in January). A general decline in vacancy
rates and change in census date accounts for the large drop between Jan 2010 and Nov 2010

39
At secondary level, Table 6 shows the number of full-time classroom teacher vacancies and temporary filled posts. This has fluctuated in recent years falling from a peak of 1,730 in 2014 to 1,430 in 2015, the rate increased to 1,670 in 2016. The rate increased from 0.3% in 2011 to 1.1% in 2014, fell to 0.9% in 2015 and then rose to 1.1% in 2016. Above-average vacancy rates have been consistently observed for mathematics, information technology, all sciences and English.
Table 7 shows the proportion of hours taught by non-specialist teachers32 in EBacc subjects. There has been a decrease in the percentage of hours taught by non-specialist teachers across most subjects since last year, with the exception of history and ICT. Although there are above average proportions of non-specialist hours for modern foreign language, this definition of ‘specialist’ does not take into account the native tongue of the teacher.33
Table 8 shows the retention rates of teachers by the year of gaining qualified
teacher status who were in service the following year and the percentage that were recorded in service in each year later.
32 Specialist teachers are those with a degree in their relevant teaching subject in the week of the collection of the School Workforce Census. 33 For example, a teacher who speaks French as a first language but who did not hold a post-A level qualification
in ‘French’ would not be counted as a specialist

40
Table 6 : Full-time classroom teacher vacancies and temporary filled number34 of posts35 and rates in publicly funded secondary schools and academies by subject36
VACANCIES AS A PERCENTAGE OF TEACHERS IN POST NUMBER OF VACANCIES
2010 2011 2012 2013 2014 2015 2016 2010 2011 2012 2013 2014 2015 2016 ALL VACANCIES 0.4 0.3 0.5 0.8 1.1 0.9 1.1 630 520 800 1,220 1,730 1,430 1,670 MAIN TEACHING
SUBJECT Mathematics 0.7 0.5 0.7 1.1 1.4 1.2 1.3 120 100 140 220 290 260 280
Information technology 0.5 0.4 0.5 1.0 1.5 1.4 1.7 40 30 30 60 90 80 70
All sciences 0.4 0.4 0.6 1.0 1.4 1.3 1.6 80 90 140 230 340 300 380 Languages 0.3 0.4 0.5 0.3 0.7 0.7 0.7 30 40 50 40 80 70 80
English 0.5 0.4 0.7 1.0 1.3 1.2 1.2 110 80 150 220 280 250 260 Drama 0.3 0.1 0.1 0.4 0.4 0.4 0.6 10 - - - - 10 20 History 0.2 0.3 0.2 0.4 0.8 0.7 0.6 10 20 20 30 60 50 50
Social sciences 0.6 0.3 0.6 0.7 1.4 0.7 0.8 20 10 30 30 60 40 50 Geography 0.2 0.2 0.4 0.6 1.2 1.2 1.3 10 10 20 40 80 80 100
Religious education 0.3 0.2 0.4 0.7 0.6 0.4 1.0 10 10 20 40 30 20 50 Design and technology 0.4 0.2 0.4 0.6 1.1 0.8 1.9 40 20 40 60 100 80 80
Commercial/business studies 0.5 0.1 0.2 0.4 0.6 0.6 0.3 20 - 10 20 40 20 10
Art/craft/design 0.2 0.1 0.2 0.5 0.5 0.3 0.4 10 10 10 30 30 20 20 Music 0.2 0.2 0.5 0.3 1.0 0.5 0.5 10 10 20 10 40 20 20
Physical education/sport/dance 0.2 0.1 0.1 0.3 0.4 0.3 0.2 30 20 20 40 50 40 30
Careers - - - - - - - - - - - - - - Other main and
combined subjects 0.5 0.4 0.5 1.0 1.1 0.9 1.5 50 50 50 90 100 70 110 Unknown subjects . . . . . . . 30 20 40 50 40 30 60
Source: School Workforce Census 2016
34 Advertised vacancies for full-time permanent appointments (or appointments of at least one term's duration). Includes vacancies being filled on a temporary basis of less than one year 35 Teachers in post include full-time qualified regular teachers in (or on secondment from) publicly funded secondary schools 36 Totals may not appear to equal the sum of the component parts because of rounding.

41
Table 7: Number of ‘specialist’ teachers and percentage of hours taught by ‘non-specialist’ teachers in publicly funded schools (England, November 2016)
EBacc subject Number of 'specialist' teachers
in subject % of hours taught by 'non-
specialist'
Number of additional 'specialist' teachers needed to
teach the 'non-specialist' hours
Mathematics 26,700 12.8%
4,400
English 30,600 9.6%
3,600
Physics 4,100 24.6%
1,600
Chemistry 5,600 16.9%
1,300
Biology 8,000 5.7%
500
Combined / General science ** 29,600 4.8%
1,600
History 12,500 13.0%
1,400
Geography 10,500 8.6%
2,000
French* 9,900 12.5%
2,000
German* 3,000 15.7%
800
Spanish* 3,900 18.9%
2,800
Other modern languages* 1,000 36.9%
1,100
ICT 6,200 49.8%
3,800
* For the languages, there is no accounting for the native tongue of the teacher (e.g. a teacher who speaks French as a first language but who did not hold a post-A level qualification in ‘French’ would not be counted as a specialist) ** Teachers qualified in biology, chemistry or physics are treated as qualified to teach both combined/general science and other science

42
Table 8: Retention rates of teachers by year of gaining QTS (Source: Schools Workforce Census 2016)
Year qualified
Number of newly qualified entrants entering service
Percentage of teachers in regular service in the state-funded schools sector in England after:
1 year 2
years 3
years 4
years 5
years 6
years 7
years 8
years 9
years 10
years 11
years 12
years 13
years 14
years 15
years 16
years 17
years 18
years 19
years 20
years
1996 18,100 91% 84% 79% 73% 71% 68% 67% 64% 62% 60% 58% 57% 56% 55% 55% 54% 53% 52% 50% 48%
1997 18,900 90% 83% 77% 74% 71% 69% 67% 65% 62% 60% 59% 58% 57% 57% 56% 55% 53% 51% 49%
1998 17,800 89% 81% 77% 74% 72% 69% 67% 64% 63% 62% 60% 59% 59% 58% 57% 55% 53% 51%
1999 18,300 88% 82% 77% 74% 71% 70% 67% 65% 64% 62% 60% 60% 59% 58% 56% 54% 52%
2000 17,600 89% 83% 78% 74% 72% 69% 67% 66% 64% 62% 62% 61% 59% 57% 56% 53%
2001 18,600 89% 82% 78% 75% 71% 68% 67% 66% 64% 64% 63% 61% 59% 57% 55%
2002 20,700 89% 83% 78% 74% 72% 70% 68% 66% 65% 64% 63% 60% 59% 56%
2003 23,000 90% 83% 77% 74% 71% 69% 68% 67% 65% 63% 61% 59% 56%
2004 25,200 89% 81% 77% 74% 71% 69% 69% 67% 65% 62% 60% 57%
2005 25,700 86% 81% 77% 74% 71% 71% 69% 66% 64% 61% 59%
2006 24,000 87% 81% 77% 74% 73% 71% 68% 66% 62% 60%
2007 24,400 88% 82% 78% 77% 74% 71% 68% 63% 62%
2008 24,400 88% 82% 80% 77% 74% 71% 66% 65%
2009 22,300 87% 83% 79% 76% 72% 68% 67%
2010 24,100 87% 82% 77% 73% 70% 66%
2011 20,600 88% 83% 77% 73% 69%
2012 23,000 88% 81% 75% 71%
2013 23,600 87% 80% 74%
2014 24,200 87% 79%
2015 25,500 87%
2016 24,400

43
Demand Every year the Department sets the National College for Teaching and
Leadership (NCTL) targets for recruitment to Initial Teacher Training (ITT) courses informed by the Teacher Supply Model (TSM)37. The main purpose of the TSM is to determine the number of ITT places in England in order to match future teacher supply with future teacher demand as closely as possible. The future demand is determined using projected Pupil Teacher Ratios (PTRs) based on data from the School Workforce Census38 and the Pupil Projections Model39. It also takes into account other flows within the existing stock of teachers, such as those leaving the profession (wastage) and retiring, as well as those expected to return to teaching in the state-funded sector. Further information on recruitment to ITT is in Annex C.
The latest Pupil Projection Model publication shows that the population in state-funded schools up to the end of Key Stage 4 in 2017 was 7,490,000 and this is projected to increase by 8.7% to 8,144,000 by 2026. Overall pupil numbers in state-funded schools began to increase in 2008/09 and are projected to continue rising until 2027/28, though the rate of increase is projected to slow from 2018: the higher levels of annual increase at the start of the projection period gradually drop until by 2027/28 the increase is minimal.
The numbers in maintained nursery and state-funded primary schools have
been rising since 2009 and reached 4.58 million in 2017. The rate of increase is forecast to slow due to falling birth rates and the population is projected to stabilise between 2020 and 2024 at around 4.66 million, with subsequent increases beginning in 2025/26.
In 2016, the overall number of pupils in secondary school increased for the
first time since 2008, reaching 2.76 million. This is because increased births from 2002 onwards mean there are now larger numbers entering secondary schools at age 11 than are leaving them at age 16. This increase continued into 2017, where there were 2.80 million children in secondary schools. The rate of increase is projected to rise rapidly from 1.4% between 2016 and 2017 (based on latest data) to 3.2% between 2019 and 2020 (a projected increase). The rate of increase is then projected to lessen, though pupil numbers will still rise. As a consequence of these larger cohorts, a continued increase in the secondary school population is forecast, with the overall population aged 11-15 reaching a peak of 3.33 million in 2025 and 2026. This is 534,000 higher
37 The model is published here 38 The latest School Workforce Census can be found here. 39 The latest Pupil Projections Model can be found here.

44
than it was in 2017 and represents a 19.1% increase between 2017 and 2026. When pupil numbers increase, it is expected that future teacher demand will increase. This is taken into account when calculating future teacher need as part of the TSM.40
Whilst the Department aims to estimate future teacher demand, decisions
taken at school level will determine the actual number of teachers required. Increasing the proportion of ITT that is school-led gives schools greater scope to plan for local demand. Wider evidence of international experience shows that, even when supply and demand for teachers are in balance, many countries face shortages of specialist teachers and shortages in schools serving disadvantaged or isolated communities41.
Vacancies and demand in Wales The latest published statistics for advertised vacancies in Wales show that
between 1 January and 31 December 2016, 782 teacher vacancies were advertised for primary schools with an average of 14 applications received (with English medium posts attracting an average of 18 applications per post and Welsh medium posts attracting an average of 7 applications). The secondary sector saw 881 advertised vacancies with an average of 8 applications per post (10 for English medium and 3 for Welsh medium).
The latest projections for pupil numbers (based on the school population of Wales at January 2016 and trends indicated by ONS 2014 national population projections) show primary pupil numbers decreasing by 4,900 between 2017 and 2027. Projections for secondary school pupils suggest pupil numbers will increase by over 16,100 during the same period. Pupil projection figures are based on full time equivalent figures.
A baseline projection from the TPSM for the period 2016/17 – 2026/27 using updated data shows that without any change to numbers there would be no oversupply of primary or secondary ITE entrants. However, there will be a sustained reliance on primary sector re-entrants and an increasing reliance on secondary sector re-entrants to fill vacant positions.
Primary ITE intake numbers have been kept at the same level since 2013/14 and for secondary ITE intake numbers have been kept the same since 2016/17. We will continue to monitor the situation in light of the latest national pupil projection data given the current projected increase in primary and secondary pupil numbers.
40 See 2016/17 TSM published here. 41 OECD, Preparing Teachers and Developing School Leaders for the 21st Century: Lessons from Around the
World, (2012), Ch. 3. p58

45
Annex C: Recruitment to teacher training Each year the Government projects the number of new trainee teachers that
will be required over the next five to 10 years to ensure there are enough teachers in the state-funded school system (in England). These estimates are reflected in indicative numbers published42 by the Department and the NCTL in relation to ITT recruitment.
Provisional recruitment data from NCTL’s ITT trainee census 2017/18, published in November 2017, show that we achieved 90% of the postgraduate target in all postgraduate secondary and primary programmes.
According to the estimate from the 2017/18 Teacher Supply Model, the
number of postgraduate trainee teachers required to have started initial teacher training in September 2017, for both the primary and secondary phases, is 30,847
Table 9 shows recruitment to primary phase against targets for the past three
years. We exceeded the primary recruitment target in 2017/18.
Table 9: Recruitment to postgraduate primary stage ITT 2015/16-2017/18
Entrants Target Recruitment rate
2015/16 12,580 11,245 112%
2016/17
11,290 11,489 98%
2017/18 (provisional)43 12,905 12,121 106%
Source: NCTL, ITT Census 30 November 2017
Table 10 shows recruitment to secondary phase broken down for English Baccalaureate subjects.
42 Teacher Supply Model 43 Provisional 2017/18 figures are based on published ITT Census data which includes those ITT trainees who started their course by the census date (11th October 2017) and ‘forecast trainees’ (those expected to start courses in the academic year after the point the statistics were collected). Final data for the 2017/18 academic year will be reported in the next ITT census publication, which is due to be published in November 2018

46
Table 10: Recruitment to postgraduate ITT courses for English Baccalaureate subjects – percentage of target
Subject
2015/16 2016/17 2017/18 (provisional)
English 105% 96% 90%
Mathematics 95% 82% 79%
Physics44 70% 79% 68%
Chemistry 94% 96% 83%
Biology 90% 113% 86%
Modern Foreign Languages45
88% 93% 93%
Geography 83% 115% 80%
History 113% 110% 102%
Computing 70% 67% 66%
Source: NCTL, ITT Census 30 November 2017
Table 11: Recruitment to postgraduate ITT courses broken down by gender 2017/18
Gender breakdown by phase Provider led
School Direct (Fees)
School Direct
(salaried) Total
Males on primary ITT programmes 20% 20% 21% 20%
Females on primary ITT programmes 80% 80% 79% 80%
Total 100% 100% 100% 100%
Males on secondary ITT programmes 40% 39% 41% 40%
Females on secondary ITT programmes 60% 61% 59% 60%
Total 100% 100% 100% 100%
Source: NCTL, ITT Census 30 November 2017
Between 2015 and 2016, 43,830 teachers started a job in English state schools. Of these, just over half (24,120) are newly qualified teachers (NQTs), just under a third (14,200) are returning to teaching, and just under one in seven (5,510) qualified earlier but are working in the state sector for the first time.
44 Recruitment for physics includes courses designated as physics with mathematics. 45 Comprises modern foreign languages and classics.

47
We do not assume that all trainees will complete their training successfully and/or teach immediately in a state school, and that is built into our estimates of the numbers required.46
We recognise that recruiting enough Science, Technology, Engineering &
Maths (STEM) and Modern Foreign Languages (MFL) teachers will continue to be challenging. We are supporting schools through the development of targeted initiatives beyond our standard recruitment channels.
We have developed a number of measures to encourage more STEM
specialists into ITT. We have provided seed grant funding for Higher Education Institutions to develop an offer for STEM degree students to opt-in to complete QTS alongside their undergraduate degree. We have also developed programmes to attract existing teachers into STEM through a school-led programme designed to refresh the skills of former teachers of these subjects and upskill teachers of other subjects who have the relevant background and skills. We are also helping returning teachers and career changers into the profession. Alongside this we continue to provide support to potential ITT applicants across priority subjects through our Premier Plus Advisors (PPAs).
We have also developed programmes to attract existing teachers into MFL.
These aim to boost the MFL skills of current teachers and provide more targeted support to help returning teachers and career changers into the profession. To support the national initiatives, and as we grow the domestic pipeline of teachers, we have instigated some international recruitment initiatives. We are working in partnership with the Spanish government to recruit visiting teachers from Spain through the Spanish Visiting Teachers Programme. We will continue to discuss any plans for recruiting teachers from Europe with the Home Office and inform the Department for Exiting the European Union as necessary.
ITT allocations 2017/18 NCTL’s allocation of ITT places aims to achieve sufficient recruitment across
all subjects; ensure that there is no significant oversupply of teachers in any subject; and make efficient use of public funds. In allocating places, we consider continuing demand, the level of popularity and recruitment patterns across different subjects and routes, and feedback from School Direct lead schools and ITT providers.
In response to feedback from the sector and knowledge gained in recent years, the approach to ITT allocations for the 2018 to 2019 academic year has
46 Proportions of new teachers based on School Workforce Census data July 2015.

48
changed. In light of requests for places, increased demand for teachers as determined by the Teacher Supply Model (TSM), and recent recruitment patterns, we have significantly increased the number of subjects where recruitment is unrestricted. To do this we have established two categories.
Unlimited allocations; this category includes subjects where recruitment is
most challenging. We have taken account of increased TSM targets, recent recruitment patterns, and provider feedback by granting unlimited allocations. This means that for subjects in this category recruitment is unrestricted. Schools and ITT providers should note that, for subjects with unlimited allocations, the DMS will show their maximum requests. In practice, the approach set out here means that School Direct leads schools and ITT providers have automatic permission to recruit above this number without first having to request additional places from NCTL.
We have learned lessons from the challenges posed to providers and
applicants by previous years’ recruitment controls. In the unlikely event that we will have to halt recruitment in an ‘unlimited’ allocation subject we will now give 5 working days’ notice to ITT providers and lead schools before we have to stop recruitment. ITT providers and lead schools will be permitted to continue receiving applications and carry out interviews during this notice period.
Fixed allocations; this category includes subjects where recent and historic
recruitment trends demonstrate consistently high demand from applicants. For 2018-19 this includes only a handful of subject route combinations, including Primary School Direct Salaried and PE (all routes). The allocations for these routes are fixed, and ITT providers and lead schools either cannot recruit above their allocated number, or must contact the NCTL if they wish to do so.
The best performing SCITTs and HEIs will again be rewarded with multiple
year allocations in 2018-19. Top performing providers have been identified on the basis of assessment of key data, including the quality of trainees recruited, the quality of the provision itself, and the outcomes that providers get for their trainees. The list of providers receiving the multiple year allocations was released on 26 October, along with a methodology setting out how they were decided.
Undergraduate ITT providers have again been individually allocated places,
determined by the same criteria as for postgraduate (excluding degree class).
For early years ITT leading to early years teacher status (EYTS), the criteria we will use for allocating early years ITT may include, but are not limited to: Degree class of trainees, quality of training and recruitment performance against allocations.

49
The quality of new recruits 2017/18 The provisional 2017/18 census data47 show that the overall proportion of
trainees with a 2:1 or higher is 74%. This is the same proportion as 2016/17 and, over the last six years, shows an overall trend towards more new entrants with a degree class of 2:1 or better. The proportion of new entrants to postgraduate initial teacher training (ITT) with degree classifications of 2:1 or higher continues to increase – 74% in 2017/18, up from 63% in 2010/11. Nearly one in five teacher trainees had a first-class degree in 2017/18 (19%) – up from 17% in 2014/15, and 10% in 2010/11.
The provisional data in Table 12 shows the proportion of trainees with a 2:1 or above since 2012/13.
Table 12: Proportion of first year postgraduate trainees with a 2:1 or higher classified degree, 2012/13-2017/18 (selected subjects only)
Subject 2012/13 2013/14 2014/15 2015/16 2016/17
2017/18 (provision
al) English 84% 84% 84% 84% 83% 84%
Mathematics 62% 67% 64% 70% 65% 68%
Biology 73% 74% 70% 75% 73% 75%
Chemistry 64% 65% 62% 68% 66% 70%
Physics 62% 65% 60% 63% 65% 66%
Modern Foreign Languages 74% 80% 73% 78% 76% 74%
Geography 75% 76% 76% 79% 76% 72%
History 87% 88% 88% 88% 87% 85%
Total Secondary 72% 75% 73% 76% 74% 75%
Primary 70% 73% 74% 74% 74% 72%
Total 71% 74% 73% 75% 74% 74%
Source: NCTL, ITT Census 30 November 2017
Bursaries and scholarships For 2018/19 we have increased bursaries to £26,000 for all trainees with a 2:2
or higher in the highest priority subjects; physics, languages, chemistry, biology, computing, geography and classics. Table 13 summarises the bursaries available to trainees in 2018/19.
47 The 2015/16, 2016/17 and 2017/18 trainee number censuses include Teach First; these trainees were excluded on previous census publications.

50
Bursaries for English trainees have been increased to £15,000 for all trainees
with a 2:2 or higher, and bursaries in all other subjects are unchanged for 2018/19.
School Direct (salaried) grant funding and bursaries for undergraduate teacher
training courses are also unchanged for 2018/19.
Table 13: Bursaries and scholarships available to trainees in 2017/18 – Postgraduate Bursaries
Subjects Scholarship 1st 2:1 2:2
Chemistry, computing, geography, languages, physics £28,000 £26,000 £26,000 £26,000
Biology, classics - £26,000 £26,000 £26,000
Maths (ITT bursary as shown and followed by two later payments of at least £5k each in teaching)
£22,000 £20,000 £20,000 £20,000
English - £15,000 £15,000 £15,000
D&T - £12,000 £9,000 -
History, music, RE - £9,000 £4,000 -
Primary maths - £6,000 £6,000 £6,000
Art, business studies, drama, other, PE, primary -
No bursary
Table 14: Bursaries and scholarships available to trainees in 2017/18 – School Direct Salaried
Subjects National Inner London
Outer London Fringe
Chemistry, classics, computing, languages, maths, physics £19,000 £23,900 £22,600 £20,200
Primary maths, biology, D&T, English, geography, history, music, RE £14,000 £17,600 £16,600 £14,900
Primary £9,000 £11,400 £10,800 £9,600
Art, business studies, drama, other, PE No grant

51
Table 15: Bursaries and scholarships available to trainees in 2017/18 – Undergraduate Bursaries
Subjects Bursary
Maths £9,000
Physics £9,000
Languages £9,000
Computing £9,000
Scholarships are designed to recognise the very best applicants who have excellent subject knowledge and outstanding potential to teach. The organisations who award the scholarships set the bar high in their assessment and selection of ITT scholars. Table 16 provides details of performance in 2016/17, for trainees starting their initial teacher training in 2017/18.
Table 16: Provisional scholarship performance in 2016/17
2016/17Scholarships
Subjects Number available Applications Awarded
Chemistry 120 261 142
Computing 100 291 81
Maths
205
(originally 150)
685 254
Physics 150 485 155
Languages 100 634 122
Geography
100
(Originally 80)
280 111
Total 775 2636 865
We are continuing to offer prestigious scholarship schemes in six subjects for 2018/19; physics, maths, languages, chemistry, computing, and geography. Successful scholars will receive £28,000 tax-free in all subjects except maths, where scholars will receive £22,000 tax-free. Maths scholars will be eligible for

52
the same additional early-career payments as those trainees who received a bursary.
School-based ITT Table 17 shows the proportion of postgraduate trainees in 2017/18 who came
through the routes recorded in the ITT Census.
Table 17: Proportion of trainees training through each ITT route 2017/18
2017/18 Census (provisional)
HEI 12,940 47%
SCITT 3,410 12%
School Direct (fee) 7,280 26%
School Direct (salaried) 2,790 10%
Teach First 1,300 5%
Total 27,72048 100%
Source: NCTL ITT Census 30 November 2017
Teaching schools and school-based ITT
As of 1 October 2017, there are 818 teaching schools across 647 alliances. Teaching schools lead the school system in training and developing outstanding teachers. Their remit includes both the development of existing teachers through professional development opportunities, such as peer-to-peer training and coaching and mentoring, as well as training new teachers.
Teaching schools co-ordinate ITT in schools across their alliance in their role as system leaders, to improve the range and quality of trainees’ experience.
School Direct
School Direct was launched as a pilot with the School Direct Training Programme (tuition fee places) in February 2012. The School Direct (salaried) route was introduced in 2013/14, offering employment-based places to career changers. Demand for School Direct places continues to increase. In 2015/16 there were 773 lead schools and 7,847 partner schools, rising to 820 lead schools and 8,554 partner schools in 2016/17.
In 2017/18, 10,070 trainee teachers commenced training through School Direct. This contributed to 36% of the postgraduates training to be teachers in
48 The total number of trainees including forecasted in-year starts is 27,895 trainees.
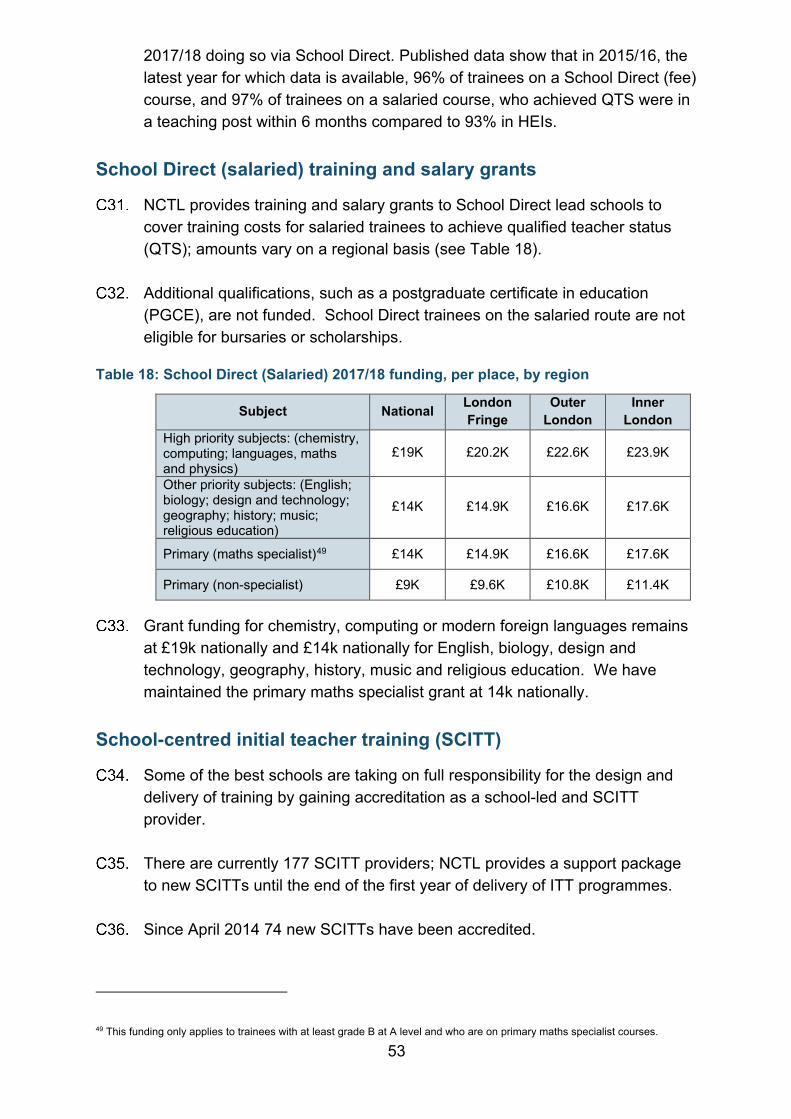
53
2017/18 doing so via School Direct. Published data show that in 2015/16, the latest year for which data is available, 96% of trainees on a School Direct (fee) course, and 97% of trainees on a salaried course, who achieved QTS were in a teaching post within 6 months compared to 93% in HEIs.
School Direct (salaried) training and salary grants
NCTL provides training and salary grants to School Direct lead schools to cover training costs for salaried trainees to achieve qualified teacher status (QTS); amounts vary on a regional basis (see Table 18).
Additional qualifications, such as a postgraduate certificate in education (PGCE), are not funded. School Direct trainees on the salaried route are not eligible for bursaries or scholarships.
Table 18: School Direct (Salaried) 2017/18 funding, per place, by region
Subject National London Fringe
Outer London
Inner London
High priority subjects: (chemistry, computing; languages, maths and physics)
£19K £20.2K £22.6K £23.9K
Other priority subjects: (English; biology; design and technology; geography; history; music; religious education)
£14K £14.9K £16.6K £17.6K
Primary (maths specialist)49 £14K £14.9K £16.6K £17.6K
Primary (non-specialist) £9K £9.6K £10.8K £11.4K
Grant funding for chemistry, computing or modern foreign languages remains at £19k nationally and £14k nationally for English, biology, design and technology, geography, history, music and religious education. We have maintained the primary maths specialist grant at 14k nationally.
School-centred initial teacher training (SCITT)
Some of the best schools are taking on full responsibility for the design and delivery of training by gaining accreditation as a school-led and SCITT provider.
There are currently 177 SCITT providers; NCTL provides a support package to new SCITTs until the end of the first year of delivery of ITT programmes.
Since April 2014 74 new SCITTs have been accredited.
49 This funding only applies to trainees with at least grade B at A level and who are on primary maths specialist courses.

54
Teach First
The recruitment target figures in 2009/10 were 560. In 2017/18, 1,300 trainees joined the programme and, with presence in every region in the country, allowing Teach First to place participants in more schools in low income communities. We continue to support the programme and have committed to funding two further cohorts of Teach First: 2017/18 and 2018/19.
Quality of ITT providers
The Ofsted guidance for inspecting ITT providers focuses on outcomes for trainees as one of the key judgements of the effectiveness of providers. Inspectors consider the attainment and completion rates of trainees; also how well trainees teach and how successful they are in finding employment upon qualification.
Teacher recruitment and training in Wales Initial Teacher Education and Training
The recruitment climate has not changed significantly in Wales during the past 3 years.
We have kept Initial Teacher Education (ITE) intake target numbers at a steady state following a period of substantial reduction to better match the needs of schools in Wales.
The Welsh Government has a key role in managing teacher supply for
maintained schools in Wales by forecasting demand for newly qualified teachers through the setting of intake targets for recruitment to accredited ITE courses in Wales.
Intake targets are set annually based on the forecast of demand for newly
qualified teachers. These are notified to the Higher Education Funding Council for Wales (HEFCW), which in turn notifies ITE Centres of their allocation by phase, subject and level of study.
The overall level of ITE Intake targets is set annually by the Welsh
Government having taken account of the statistical runs undertaken each year following annual data updates to the Teacher Planning and Supply Model (TPSM) for Wales. The allocations are notified to HEFCW early autumn for distribution across the accredited ITE Centres. The latest published allocations refer to intake for academic year 2017/18. The TPSM was introduced from 2007/08 following a Review of ITE in 2006 which recommended that more robust teacher supply model should be adopted to

55
better gauge the number of newly qualified teachers required to meet demand for teachers from maintained schools in Wales.
Overall intake targets have been reduced based on the outcome of the TPSM
and policy considerations including evidence of significant over supply of qualified teachers. Between 2004/05 and 2016/17 intake numbers have reduced by approximately one third.
The recommendation to continue to hold a steady state intake for 2017/18
academic year for primary and secondary was based on the preliminary findings of a review on the quality and consistency of ITE ‘Teaching Tomorrow’s Teachers’ (published in March 15) and the TPSM. Total intake target numbers for 2017/18 are as follows;
Table 19: Intake target numbers for 2017/18
Undergraduate Postgraduate Total Primary 300 450 750 Secondary 86 785 871 Total 386 1,235 1,621
The report included a qualitative analysis of the ITE provision overall in Wales and set out options and recommendations for reforming the sector. Work is continuing to transform the way ITE is currently delivered to help raise standards and support the introduction of a revised curriculum for Wales.
Maintaining stability in respect of ITE numbers through this period of reform will protect viability of current provision and also support the supply of Welsh medium teachers. All three ITE Centres currently provide opportunities for students to train to teach through the medium of Welsh, but provision is the most comprehensive in the North and mid Wales Centre.
At the time of preparing this advice, intake numbers for courses commencing
in academic year 2018/19 have been agreed with HEFCW and upon their recommendation, Welsh Government has agreed to reduce undergraduate secondary places by 20. No significant variance for allocations has been recommended given the work underway to transform how ITE is currently delivered in Wales. Further details of this work can be found here, which sets out the vision of ITE reforms, including, an increased role for schools; a clearer role for universities; joint ownership of the ITE programme; structured opportunities to link school and university learning; and the centrality of research.. Further details of how reform of ITE links to wider Welsh education reforms can be found here.

56
The Welsh Government makes available training incentives to students undertaking postgraduate ITE courses. Incentives are available of up to £20,000 for new eligible students starting postgraduate ITE courses in the 2018/19 academic year in the subjects of mathematics, physics, chemistry, computer sciences and Welsh. Eligible postgraduate students with a first class degree, Masters or PhD will receive the highest funding levels, with progressively lower amounts for those with a 2.1 or 2.2. Incentives of up to £15,000 will be available for new eligible students studying modern foreign languages. Again eligible postgraduate students with a first class degree, Masters or PhD will receive the highest funding levels with a lower amount for those with a 2.1. Outside of the priority subjects, the Welsh Government only offers incentive grants to students with a first class degree, Masters or PhD (£3,000). Alongside the incentive support for their first class degree, Masters, or PhD (£3,000) a further supplement is offered to primary students whose first class degree, Masters, or PhD, is in English, Welsh, mathematics, physics or chemistry (an additional £3,000).
The Cabinet Secretary recently announced a new Welsh medium incentive of £5,000 which will compliment arrangements for existing support under the Welsh Medium Improvement Scheme with up to £2,500 payable on successful completion of QTS and a further £2,500 payable on successful completion of induction in a Welsh-medium or bilingual secondary school, or on successful completion of induction teaching Welsh in any secondary setting.
In Wales, the current number of places on employment-based routes is
relatively small, around 5% of overall places leading to QTS in Wales. The Welsh Government funds a contribution toward the trainee salary costs (£14,500 for 2016/17) and training costs (£4,500 in 2016/17) for a limited number of applications in priority secondary subjects of mathematics, physics, chemistry, modern foreign languages, ICT and Welsh and a £4,500 training grant for primary places. An additional number of unfunded places are available to support existing overseas qualified and further education qualified teachers to gain QTS, and those wishing to train to teach vocational subjects to support the 14-19 local curriculum.
For academic year 2017/18, 90 GTP places are available in Wales; an
increase from 75 places academic year 2016/17 due to increased demand. Allocations for GTP places for academic year 2018/19 will be considered following the allocation of mainstream ITE places, depending on the projections from the TPSM.
From academic year 2013/14, places have been available on the Additional
Training Graduate Programme (ATGP) in Wales, which is delivered by Teach First. Teach First recruits high quality graduates to work in challenging schools in Wales. Our current cohort of Teach First participants will continue until July

57
2018. Each programme is two years in length and across the life of the pilot programme up to 150 participants will have taken part.
Minimum entry requirements for ITE courses
The current statutory minimum entry requirements for all routes to Qualified Teacher Status (QTS) in Wales are GCSE grade B (or equivalent) in both English and mathematics. The aim of this requirement is to ensure that candidates have a minimum standard of educational attainment with a key focus on high standards of literacy and numeracy. For individuals wishing to train to teach Primary, a minimum GCSE grade C in Science is also required.
If individuals do not hold these qualifications, the requirement allows the initial teacher education (ITE) provider the discretion to consider whether exceptional candidates may be given an opportunity to show that they can meet the required standard by taking an equivalency test.
Whilst the Welsh Government sets the statutory minimum entry requirements
for ITE courses, ITE providers are free to set individual standards above these minimum requirements for their courses.
Secondary teachers are expected to have at least 50% degree relevance to
the specialist teaching subject being applied for. There may be flexibility in some subjects; other degrees may contain very relevant subject knowledge. For example, engineering, economics, business studies, management science, health science.
Primary teachers teach all the subjects in the National Curriculum (English,
mathematics, science, design and technology, information and communication technology, geography, history, physical education, art, music, religious education and Welsh). Trainees’ previous education (degree, A level, and equivalent qualifications) should match at least one of these National Curriculum subjects.
The QTS Standards Wales 2009 are outcome statements which set out what
trainees must know, understand and be able to do at the end of an ITE course or employment based programme to gain QTS. The standards are accessible at here.

58
Annex D: School leaders
The leadership group in the School Teachers’ Pay and Conditions Document (STPCD) covers headteachers, deputy headteachers and assistant headteachers. There is a single leadership pay range which has eight headteacher groups (HTGs) for each of the four regional pay bands. The minimum on the Rest of England and Wales pay band is worth £39,374, and the highest on the Inner London pay band is worth £116,738.
The relevant body determines how the pay of leaders at its school relates to the leadership pay range by assigning the school to one of the eight HTGs, based on the number and age of the school’s pupils, and then adopting the three-stage process recommended in the STRB’s 23rd Report.
Salaries of school leaders In November 2016 the average (median) gross pay of regular school
leadership teachers in publicly funded schools in England was £54,500. This was an increase of 0.9% compared to November 2015 (£54,000).
Leaders in maintained secondary schools get paid significantly more than their counterparts in maintained primary schools. The average salary of leadership teachers in primary schools varied between £48,700 (average for sponsor academies in the Rest of England) and £59,800 (schools in Inner London), compared to £56,200 (average for secondary sponsor led academies) and £66,600 respectively in secondary maintained schools and convertor academies.
Figure 14: Average (median) salaries of school leadership teachers in primary schools
Source: School Workforce Census, November 2016

59
Across all regions, leadership salaries in primary academy converters are higher than in sponsor-led academies. Primary LA maintained salaries for the leadership group are higher than those in converter academies in Outer London and the rest of England; the same salaries in Inner London; and slightly lower in the London fringe. Overall, leaders in primary LA maintained schools and primary converter academies have the highest salaries.
Figure 15: Average (median) salaries of school leadership teachers in secondary schools
Source: School Workforce Census, November 2016
Similarly to primary schools, across all regions, secondary school leadership salaries are higher in academy converters than in sponsor-led academies. Secondary LA maintained salaries for the leadership group are higher than those in converter academies in Outer London and the London fringe; the same salaries in Inner London; and slightly lower in the rest of England. Overall, leaders in secondary LA maintained schools and secondary converter academies have the highest salaries.
Age D7. Average salaries of leadership teachers increase with age. Table 18 and
Figure 16 show that in all pay bands older school leaders are paid more on average than younger leaders.
Table 18: Average (median) salaries of school leadership teachers in publicly funded schools, by age
Under 30 30-39 40-49 50-59 60 and over Total Inner London £53,700 £58,500 £65,200 £69,500 £72,700 £62,400 Outer London £49,400 £55,500 £60,300 £63,800 £68,500 £59,000 London Fringe £43,100 £51,000 £57,000 £59,700 £64,200 £54,800
Rest of England £43,000 £48,700 £53,700 £57,800 £60,400 £53,200 England £44,600 £50,500 £55,000 £59,300 £63,100 £54,500
Source: School Workforce Census, November 2016

60
Figure 16: Average (median) salaries of school leadership teachers in publicly funded schools, by age
Source: School Workforce Census, November 2016
Headship vacancies D8. The School Workforce Census shows a very low and fairly stable picture of
overall headship vacancies at around 0.2%. The rate is calculated from the number of full-time permanent headship vacancies that were available on the census day each November. Vacancies recorded are those that have been advertised and remain unfilled. Vacancies must be available for a minimum of one term. They include those filled on a temporary basis for a period of less than one term.
D9. Between 2010 and 2016 the proportion of schools reporting a head teacher vacancy or the head teacher post being temporarily filled decreased, from 1.4% to 1.1%, according to School Workforce Census data. Schools counted are those that reported vacancies that had been advertised and remain unfilled. These include posts filled on a contract of less than one term. Also included are schools where the headship post was filled on the census day where the post holder had a contract of less than one year irrespective of whether the post had been advertised or not.
Leadership supply in Wales D10. The head teacher population in Wales was stable for a number of years
before declining from 1,750 in 2011 to 1,458 in 2017 due mainly to school closures. Over the same period the number of schools fell from 1,723 in 2010/11 to 1,547 in 2016/17. The age profile of head teachers in Wales continues to get younger, with the proportion of head teachers aged 50 or above falling from 65.2% to 44.8% between 2008 and 2017.

61
© Crown copyright 2018
You may re-use this document/publication (not including logos) free of charge in any format or medium, under the terms of the Open government Licence v3.0. Where we have identified any third party copyright information you will need to obtain permission from the copyright holders concerned.
To view this licence: visit www.nationalarchives.gov.uk/doc/open-government-licence/version/3 email [email protected]
About this publication: enquiries www.education.gov.uk/contactus download www.gov.uk/government/consultations
Reference: DFE-00003-2018
Follow us on Twitter: @educationgovuk
Like us on Facebook: facebook.com/educationgovuk


