42
Kentucky’s Progress toward Postsecondary & Adult Education Strategic Agenda Goals April 2018 PROGRESS REPORT STRONGER by degrees
C o u n c i l o n P o s t s e c o n d a r y E d u c a t i o n | 1
Kentucky’s Progress toward Postsecondary & Adult Education Strategic Agenda Goals
April 2018
PROGRESSREPORT
STRONGERby degrees
C o u n c i l o n P o s t s e c o n d a r y E d u c a t i o n | 2
About the Council on Postsecondary Education
The Council on Postsecondary Education is Kentucky’s adult and higher education coordinating agency committed to strengthening our workforce, economy, and quality of life. We do this by guiding the continuous improvement and efficient operation of a high-quality, diverse, and accessible system of postsecondary education.
Key responsibilities include:
• developing and implementing a strategic agenda for postsecondary and adult education that includes measures of progress.
• producing and submitting a biennial budget request for adequate public funding of postsecondary education.
• determining tuition rates and admission criteria at public postsecondary institutions.• collecting and distributing data about postsecondary education performance.• ensuring the coordination and connectivity of technology among public institutions.• administering adult education programs serving every county in Kentucky.• licensing non-public postsecondary institutions to operate in the Commonwealth.
STRONGERby degrees
C o u n c i l o n P o s t s e c o n d a r y E d u c a t i o n | 3
FROM THE PRESIDENT............................................................................................................ 4
KENTUCKY’S EDUCATIONAL ATTAINMENT GOAL.................................................................... 5
POLICY AREA 1: OPPORTUNITY
Key Initiatives.................................................................................................................................................................... 6College Readiness of College Entrants............................................................................................................................ 8In-State College-Going Rate.............................................................................................................................................. 8Kentucky Adults Enrolled in College................................................................................................................................ 9Kentucky Population without a High School Credential................................................................................................. 9High School Equivalency Diplomas Awarded.................................................................................................................. 10College-Going Rate of Adult Education Students............................................................................................................ 10Net General Fund Appropriations per Student................................................................................................................ 11Average Net Price.............................................................................................................................................................. 11Progress of Underprepared Students in English............................................................................................................. 12Progress of Underprepared Students in Mathematics................................................................................................... 13
POLICY AREA 2: SUCCESS
Key Initiatives.................................................................................................................................................................... 14Graduation Rates...............................................................................................................................................................16First-Year to Second-Year Retention................................................................................................................................ 18Average Credit Hours Earned at Graduation.................................................................................................................... 20Statewide Completion Rate.............................................................................................................................................. 21KCTCS Transfers with an Associate Degree.................................................................................................................... 22 Academic Quality and Excellence.................................................................................................................................... 23
POLICY AREA 3: IMPACT
Key Initiatives.................................................................................................................................................................... 24Degrees and Credentials Awarded................................................................................................................................... 26Non-Credit Workforce Training Hours.............................................................................................................................. 28Educational Attainment in Kentucky................................................................................................................................ 29Internships/Co-ops/Clinical Learning Experiences......................................................................................................... 30Graduates Working or Pursuing More Education............................................................................................................ 30Research and Development Expenditures....................................................................................................................... 31
APPENDICES
Appendix 1: Statewide Diversity Plan.............................................................................................................................. 33Appendix 2: Diversity Plan Metrics.................................................................................................................................. 34Appendix 3: Performance Funding.................................................................................................................................. 37Appendix 4: Statewide Scorecard................................................................................................................................... 38Appendix 5: Association of Independent Kentucky Colleges and Universities Data................................................... 40
Table of Contents
C o u n c i l o n P o s t s e c o n d a r y E d u c a t i o n | 4
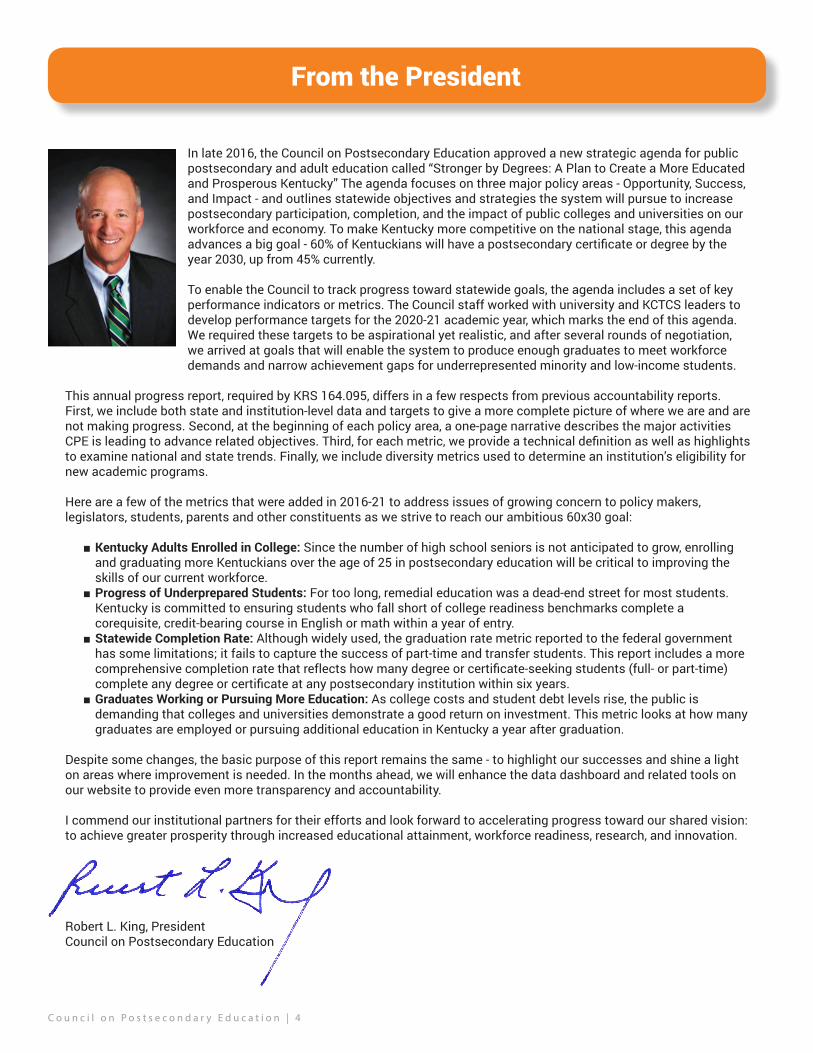
From the President
In late 2016, the Council on Postsecondary Education approved a new strategic agenda for public postsecondary and adult education called “Stronger by Degrees: A Plan to Create a More Educated and Prosperous Kentucky” The agenda focuses on three major policy areas - Opportunity, Success, and Impact - and outlines statewide objectives and strategies the system will pursue to increase postsecondary participation, completion, and the impact of public colleges and universities on our workforce and economy. To make Kentucky more competitive on the national stage, this agenda advances a big goal - 60% of Kentuckians will have a postsecondary certificate or degree by the year 2030, up from 45% currently.
To enable the Council to track progress toward statewide goals, the agenda includes a set of key performance indicators or metrics. The Council staff worked with university and KCTCS leaders to develop performance targets for the 2020-21 academic year, which marks the end of this agenda. We required these targets to be aspirational yet realistic, and after several rounds of negotiation, we arrived at goals that will enable the system to produce enough graduates to meet workforce demands and narrow achievement gaps for underrepresented minority and low-income students.
This annual progress report, required by KRS 164.095, differs in a few respects from previous accountability reports. First, we include both state and institution-level data and targets to give a more complete picture of where we are and are not making progress. Second, at the beginning of each policy area, a one-page narrative describes the major activities CPE is leading to advance related objectives. Third, for each metric, we provide a technical definition as well as highlights to examine national and state trends. Finally, we include diversity metrics used to determine an institution’s eligibility for new academic programs.
Here are a few of the metrics that were added in 2016-21 to address issues of growing concern to policy makers, legislators, students, parents and other constituents as we strive to reach our ambitious 60x30 goal:
■ Kentucky Adults Enrolled in College: Since the number of high school seniors is not anticipated to grow, enrolling and graduating more Kentuckians over the age of 25 in postsecondary education will be critical to improving the skills of our current workforce.
■ Progress of Underprepared Students: For too long, remedial education was a dead-end street for most students. Kentucky is committed to ensuring students who fall short of college readiness benchmarks complete a corequisite, credit-bearing course in English or math within a year of entry.
■ Statewide Completion Rate: Although widely used, the graduation rate metric reported to the federal government has some limitations; it fails to capture the success of part-time and transfer students. This report includes a more comprehensive completion rate that reflects how many degree or certificate-seeking students (full- or part-time) complete any degree or certificate at any postsecondary institution within six years.
■ Graduates Working or Pursuing More Education: As college costs and student debt levels rise, the public is demanding that colleges and universities demonstrate a good return on investment. This metric looks at how many graduates are employed or pursuing additional education in Kentucky a year after graduation.
Despite some changes, the basic purpose of this report remains the same - to highlight our successes and shine a light on areas where improvement is needed. In the months ahead, we will enhance the data dashboard and related tools on our website to provide even more transparency and accountability.
I commend our institutional partners for their efforts and look forward to accelerating progress toward our shared vision: to achieve greater prosperity through increased educational attainment, workforce readiness, research, and innovation.
Robert L. King, PresidentCouncil on Postsecondary Education
C o u n c i l o n P o s t s e c o n d a r y E d u c a t i o n | 5
The Big Attainment GoalKentucky’s Educational Attainment Goal
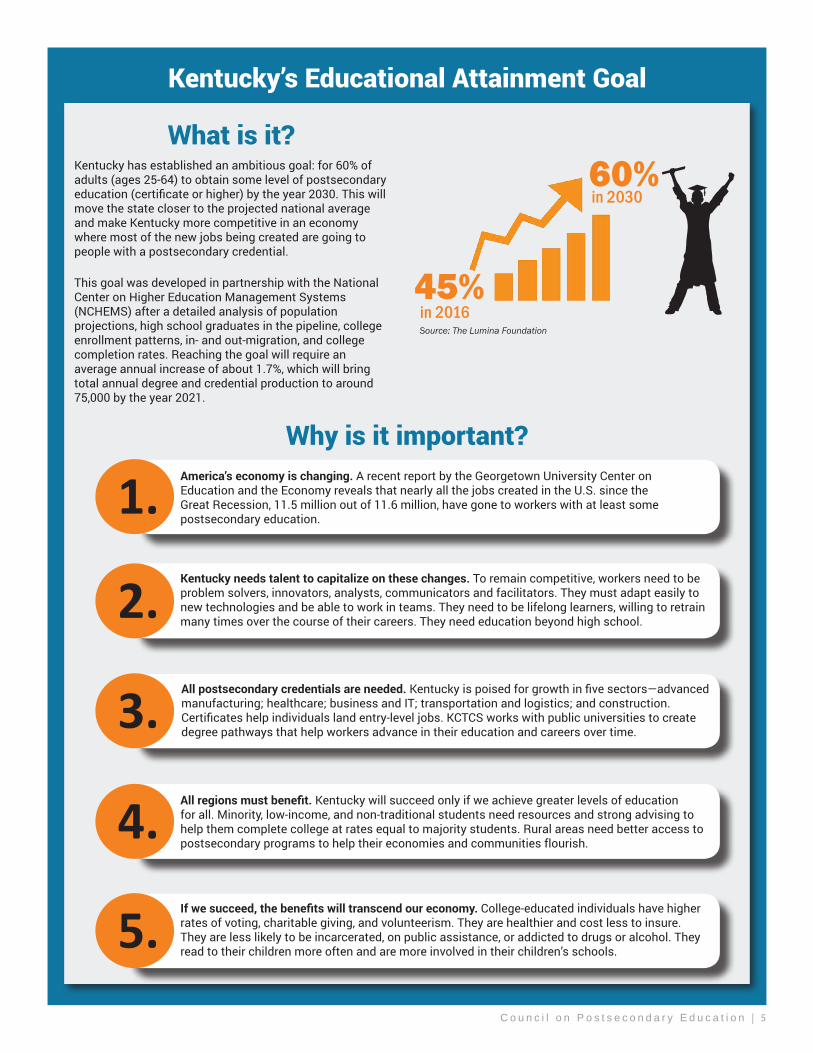
in 203060%
in 201645%
Source: The Lumina Foundation
Kentucky has established an ambitious goal: for 60% of adults (ages 25-64) to obtain some level of postsecondary education (certificate or higher) by the year 2030. This will move the state closer to the projected national average and make Kentucky more competitive in an economy where most of the new jobs being created are going to people with a postsecondary credential.
This goal was developed in partnership with the National Center on Higher Education Management Systems (NCHEMS) after a detailed analysis of population projections, high school graduates in the pipeline, college enrollment patterns, in- and out-migration, and college completion rates. Reaching the goal will require an average annual increase of about 1.7%, which will bring total annual degree and credential production to around 75,000 by the year 2021.
Why is it important?
What is it?
1.
2.
3.
4.
5.
America’s economy is changing. A recent report by the Georgetown University Center on Education and the Economy reveals that nearly all the jobs created in the U.S. since the Great Recession, 11.5 million out of 11.6 million, have gone to workers with at least some postsecondary education.
Kentucky needs talent to capitalize on these changes. To remain competitive, workers need to be problem solvers, innovators, analysts, communicators and facilitators. They must adapt easily to new technologies and be able to work in teams. They need to be lifelong learners, willing to retrain many times over the course of their careers. They need education beyond high school.
All postsecondary credentials are needed. Kentucky is poised for growth in five sectors—advanced manufacturing; healthcare; business and IT; transportation and logistics; and construction. Certificates help individuals land entry-level jobs. KCTCS works with public universities to create degree pathways that help workers advance in their education and careers over time.
All regions must benefit. Kentucky will succeed only if we achieve greater levels of education for all. Minority, low-income, and non-traditional students need resources and strong advising to help them complete college at rates equal to majority students. Rural areas need better access to postsecondary programs to help their economies and communities flourish.
If we succeed, the benefits will transcend our economy. College-educated individuals have higher rates of voting, charitable giving, and volunteerism. They are healthier and cost less to insure. They are less likely to be incarcerated, on public assistance, or addicted to drugs or alcohol. They read to their children more often and are more involved in their children’s schools.
C o u n c i l o n P o s t s e c o n d a r y E d u c a t i o n | 6
POLICY AREA 1: OPPORTUNITY
■ CPE, working with the Committee on Equal Opportunities, developed a new statewide diversity policy and directed campuses to craft plans to increase the racial, economic, and ethnic diversity of students, faculty and staff; promote cultural competence; increase enrollment, retention, and graduation; and foster a culture of equity and inclusion. These plans include performance targets on select goals, and annual progress will determine eligibility for new academic programs.
■ CPE developed the Academic Leadership Development Institute (ALDI) for early career faculty of color interested in academic leadership positions. A cohort of 19 faculty members completed the institute in fall 2017, which provided an array of professional development opportunities to participants.
To increase college readiness:
■ CPE provided funding to some postsecondary institutions to revise their teacher leader master’s programs to include 18 hours of discipline-specific content. This qualifies secondary teachers to teach dual credit courses at their high schools, provided they are approved as a part-time faculty member and meet all accreditation guidelines.
■ The Dual Credit Advisory Council, staffed by CPE, monitors the success of the Dual Credit Scholarship Program, which provides qualified high school seniors with two free dual credit courses, either in general education or career and technical education. Dual credit enrollment has increased substantially as a result of this program.
■ As a member of the Kentucky Advising Task Force for Student Success, CPE helped develop seven college and career readiness standards and competencies to help standardize advising and counseling efforts across the state. Next steps include training, curricula, and metrics for use by college and career advisors.
■ CPE provides access to NROC EdReady resources and assessments that include valuable instruction on academic intervention programming for Kentucky Adult Education and postsecondary institutions.
To enroll a greater percentage of underserved populations in college:
■ Through a multi-million dollar federal GEAR UP grant, CPE administered a statewide outreach program for over 18 years to provide at-risk and underrepresented students, families, schools, and communitites with early college exploration, preparation, and support. Kentucky will compete for another round of funding in 2018 to provide comprehensive college access services for 10,000 Kentucky students and families from 2018-2025.
■ In 2017, GEAR UP Kentucky held the Institute for a College- Going Commonwealth. This two-day conference convened over 400 diverse voices and perspectives to explore strategies to support academic, financial, cultural, social, and emotional readiness for postsecondary education.
■ Project Graduate is a campaign to recruit former college students with 80+ hours toward a bachelor’s degree to finish what they started. To date, more than 1,500 students have earned a degree through the program.
To prepare more Kentucky Adult Education students for college and careers:
■ KYAE provides professional development for adult education instructors through the Adult Education Teacher Competencies, which help instructors enhance student learning and provide opportunities for self-assessment and reflection.
■ A ten-year contract with the Worldwide Interactive Network provides adult education programs with unlimited access to online courseware to improve college and career readiness and develop soft skills.
■ KYAE participates in several federal grants (Paths to Promise, Project CASE) to retrain low-income, disabled and underemployed adults for new careers in healthcare, information technology, and manufacturing.
■ KYAE continues to increase college going among GED®
recipients through programs like Advancing Opportunity and others.
To help make college more affordable:
■ CPE establishes tuition parameters that limit the ability of public campuses to raise tuition and fees above a certain percentage. Since implementing the parameters in 2009, tuition increases have remained under five percent annually, below the SREB average.
■ CPE advocates for increased funding for postsecondary institutions with the General Assembly through print materials, presentations, testimony before commitees, and meetings with individual legislators.
Kentucky has many avenues for individuals who wish to pursue postsecondary education. Unfortunately, ample opportunity has not produced equal rates of participation. Low-income and underrepresented minority students do not enroll at the same rate as their peers. Too many working-age adults have not completed a college degree and need to upgrade their skills to meet workforce demands. CPE is working with its partners to increase college going and close participation gaps through the following activities, which align to key objectives of the 2016-21 strategic agenda.
To improve diversity and inclusiveness:

C o u n c i l o n P o s t s e c o n d a r y E d u c a t i o n | 7
STRONGEROPPORTUNITY
Kentucky will be stronger by ensuring postsecondary education is broadly accessible to all residents, students have the support and resources they need to pursue postsecondary opportunities, and all students enter postsecondary education prepared for credit-bearing work.
Key Opportunity Initiatives
C o u n c i l o n P o s t s e c o n d a r y E d u c a t i o n | 8
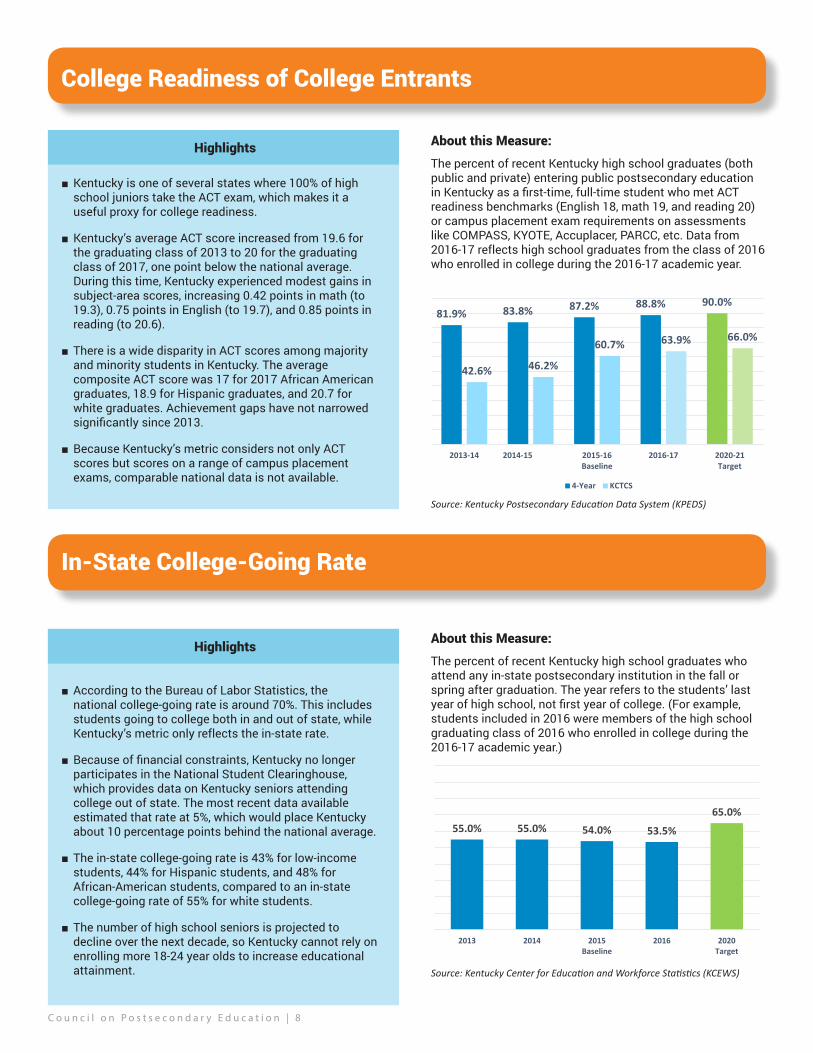
About this Measure:
The percent of recent Kentucky high school graduates (both public and private) entering public postsecondary education in Kentucky as a first-time, full-time student who met ACT readiness benchmarks (English 18, math 19, and reading 20) or campus placement exam requirements on assessments like COMPASS, KYOTE, Accuplacer, PARCC, etc. Data from 2016-17 reflects high school graduates from the class of 2016 who enrolled in college during the 2016-17 academic year.
In-State College-Going Rate
College Readiness of College Entrants
About this Measure:
The percent of recent Kentucky high school graduates who attend any in-state postsecondary institution in the fall or spring after graduation. The year refers to the students’ last year of high school, not first year of college. (For example, students included in 2016 were members of the high school graduating class of 2016 who enrolled in college during the 2016-17 academic year.)
Source: Kentucky Postsecondary Education Data System (KPEDS)
Source: Kentucky Center for Education and Workforce Statistics (KCEWS)
■ According to the Bureau of Labor Statistics, the national college-going rate is around 70%. This includes students going to college both in and out of state, while Kentucky’s metric only reflects the in-state rate.
■ Because of financial constraints, Kentucky no longer participates in the National Student Clearinghouse, which provides data on Kentucky seniors attending college out of state. The most recent data available estimated that rate at 5%, which would place Kentucky about 10 percentage points behind the national average.
■ The in-state college-going rate is 43% for low-income students, 44% for Hispanic students, and 48% for African-American students, compared to an in-state college-going rate of 55% for white students.
■ The number of high school seniors is projected to decline over the next decade, so Kentucky cannot rely on enrolling more 18-24 year olds to increase educational attainment.
Highlights
Highlights
■ Kentucky is one of several states where 100% of high school juniors take the ACT exam, which makes it a useful proxy for college readiness.
■ Kentucky’s average ACT score increased from 19.6 for the graduating class of 2013 to 20 for the graduating class of 2017, one point below the national average. During this time, Kentucky experienced modest gains in subject-area scores, increasing 0.42 points in math (to 19.3), 0.75 points in English (to 19.7), and 0.85 points in reading (to 20.6).
■ There is a wide disparity in ACT scores among majority and minority students in Kentucky. The average composite ACT score was 17 for 2017 African American graduates, 18.9 for Hispanic graduates, and 20.7 for white graduates. Achievement gaps have not narrowed significantly since 2013.
■ Because Kentucky’s metric considers not only ACT scores but scores on a range of campus placement exams, comparable national data is not available.
81.9% 83.8% 87.2% 88.8% 90.0%
42.6% 46.2%
60.7% 63.9% 66.0%
2013-14 2014-15 2015-16Baseline
2016-17 2020-21Target
4-Year KCTCS
55.0% 55.0% 54.0% 53.5%
65.0%
2013 2014 2015Baseline
2016 2020Target

C o u n c i l o n P o s t s e c o n d a r y E d u c a t i o n | 9
About this Measure:
Kentuckians ages 25-64 currently enrolled in postsecondary education in Kentucky (both public and private institutions) as a percentage of the total number of Kentuckians in that age group without a postsecondary degree. Population estimates are obtained from the American Community Survey.
Source: Kentucky Postsecondary Education Data System (KPEDS) and U.S. Census Bureau, American Community Survey
Source: U.S. Census Bureau and American Community Survey Five-Year Estimates
About this Measure:
The percent of Kentucky’s working-age population (18-64) without a high school diploma or its equivalent. Population estimates are obtained from the American Community Survey. This metric is one of Kentucky Adult Education’s key indicators of progress.
KY Adults Enrolled in College
KY Population without a High School Credential
Highlights
Highlights
■ Kentucky enrolled 73,854 adults in postsecondary education in fall 2011. By fall 2016, that number had fallen to 48,949, a 51% decrease.
■ Low unemployment and a tight labor market typically lead to a decrease in adult college enrollment, which partially accounts for Kentucky’s recent adult enrollment trend.
■ Over the last five years, adult community and technical college enrollment in the U.S. decreased 12%, while KCTCS experienced a 30% decline over the same time period.
■ To reach the 4% target, more than 70,000 adults will need to be enrolled in postsecondary education (assuming no change in Kentucky’s adult population), which is critical to achieving the state’s educational attainment goal.
■ In 2016, 12% of the U.S. adult population (ages 18-64) did not have a high school credential, compared to 12.6% of Kentucky adults.
■ From 2000 to 2015, the percentage of Kentucky adults (18-64) wihout a high school credential decreased 8.2 percentage points - from 21.1% to 12.9%. During this time frame, no other state improved as much as Kentucky on this metric.
■ In 2000, there were 39 Kentucky counties where the percentage of adults who did not finish high school exceeded 30%. By 2015, every Kentucky county was under 30%.
■ Similarly, there were only 34 Kentucky counties where the percentage of adults without a high school credential was 20% or lower in 2000. Fifteen years later, that number had risen to 95.
3.9%
3.0% 3.1% 3.0%
4.0%
Fall 2013 Fall 2014 Fall 2015Baseline
Fall 2016 Fall 2020Target
13.7% 13.4% 12.9% 12.6%
10.0%
2013 2014 2015Baseline
2016 2020Target
C o u n c i l o n P o s t s e c o n d a r y E d u c a t i o n | 1 0
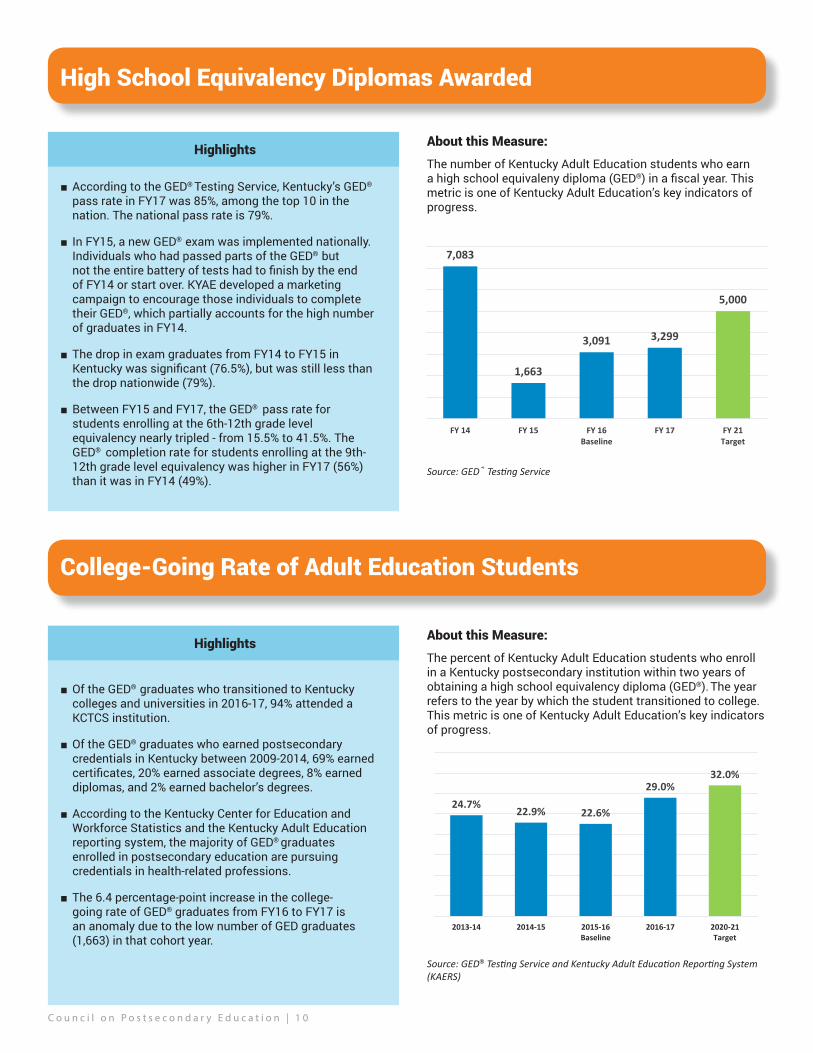
Source: GED® Testing Service
Source: GED® Testing Service and Kentucky Adult Education Reporting System (KAERS)
High School Equivalency Diplomas Awarded
About this Measure:
The number of Kentucky Adult Education students who earn a high school equivaleny diploma (GED®) in a fiscal year. This metric is one of Kentucky Adult Education’s key indicators of progress.
College-Going Rate of Adult Education Students
About this Measure:
The percent of Kentucky Adult Education students who enroll in a Kentucky postsecondary institution within two years of obtaining a high school equivalency diploma (GED®). The year refers to the year by which the student transitioned to college. This metric is one of Kentucky Adult Education’s key indicators of progress.
Highlights
Highlights
■ According to the GED® Testing Service, Kentucky’s GED® pass rate in FY17 was 85%, among the top 10 in the nation. The national pass rate is 79%.
■ In FY15, a new GED® exam was implemented nationally. Individuals who had passed parts of the GED® but not the entire battery of tests had to finish by the end of FY14 or start over. KYAE developed a marketing campaign to encourage those individuals to complete their GED®, which partially accounts for the high number of graduates in FY14.
■ The drop in exam graduates from FY14 to FY15 in Kentucky was significant (76.5%), but was still less than the drop nationwide (79%).
■ Between FY15 and FY17, the GED® pass rate for students enrolling at the 6th-12th grade level equivalency nearly tripled - from 15.5% to 41.5%. The GED® completion rate for students enrolling at the 9th-12th grade level equivalency was higher in FY17 (56%) than it was in FY14 (49%).
■ Of the GED® graduates who transitioned to Kentucky colleges and universities in 2016-17, 94% attended a KCTCS institution.
■ Of the GED® graduates who earned postsecondary credentials in Kentucky between 2009-2014, 69% earned certificates, 20% earned associate degrees, 8% earned diplomas, and 2% earned bachelor’s degrees.
■ According to the Kentucky Center for Education and Workforce Statistics and the Kentucky Adult Education reporting system, the majority of GED® graduates enrolled in postsecondary education are pursuing credentials in health-related professions.
■ The 6.4 percentage-point increase in the college-going rate of GED® graduates from FY16 to FY17 is an anomaly due to the low number of GED graduates (1,663) in that cohort year.
24.7%22.9% 22.6%
29.0%32.0%
2013-14 2014-15 2015-16Baseline
2016-17 2020-21Target
7,083
1,663
3,091 3,299
5,000
FY 14 FY 15 FY 16Baseline
FY 17 FY 21Target
C o u n c i l o n P o s t s e c o n d a r y E d u c a t i o n | 1 1
Source: Kentucky Budget of the Commonwealth and Common Fund Institute’s Higher Education Price Index
Source: Integrated Postsecondary Education Data System (IPEDS)
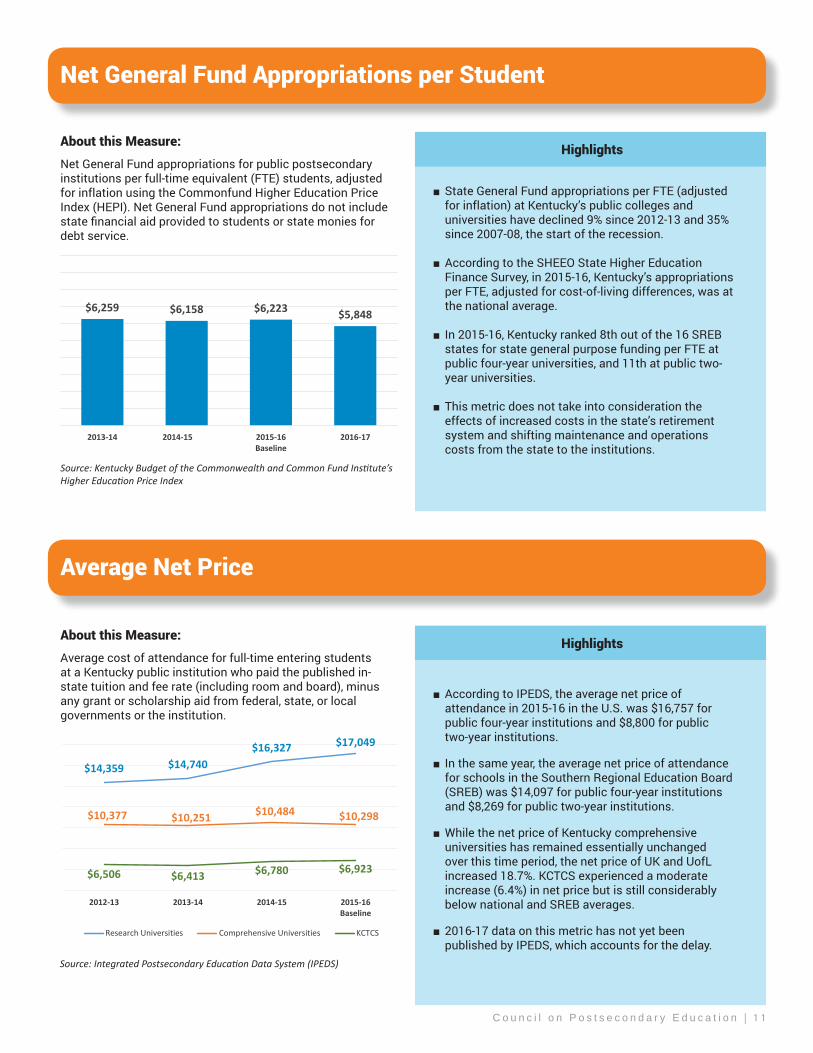
Net General Fund Appropriations per Student
Average Net Price
About this Measure:
Net General Fund appropriations for public postsecondary institutions per full-time equivalent (FTE) students, adjusted for inflation using the Commonfund Higher Education Price Index (HEPI). Net General Fund appropriations do not include state financial aid provided to students or state monies for debt service.
About this Measure:
Average cost of attendance for full-time entering students at a Kentucky public institution who paid the published in-state tuition and fee rate (including room and board), minus any grant or scholarship aid from federal, state, or local governments or the institution.
Highlights
Highlights
■ According to IPEDS, the average net price of attendance in 2015-16 in the U.S. was $16,757 for public four-year institutions and $8,800 for public two-year institutions.
■ In the same year, the average net price of attendance for schools in the Southern Regional Education Board (SREB) was $14,097 for public four-year institutions and $8,269 for public two-year institutions.
■ While the net price of Kentucky comprehensive universities has remained essentially unchanged over this time period, the net price of UK and UofL increased 18.7%. KCTCS experienced a moderate increase (6.4%) in net price but is still considerably below national and SREB averages.
■ 2016-17 data on this metric has not yet been published by IPEDS, which accounts for the delay.
$6,259 $6,158 $6,223 $5,848
2013-14 2014-15 2015-16Baseline
2016-17
■ State General Fund appropriations per FTE (adjusted for inflation) at Kentucky’s public colleges and universities have declined 9% since 2012-13 and 35% since 2007-08, the start of the recession.
■ According to the SHEEO State Higher Education Finance Survey, in 2015-16, Kentucky’s appropriations per FTE, adjusted for cost-of-living differences, was at the national average.
■ In 2015-16, Kentucky ranked 8th out of the 16 SREB states for state general purpose funding per FTE at public four-year universities, and 11th at public two-year universities.
■ This metric does not take into consideration the effects of increased costs in the state’s retirement system and shifting maintenance and operations costs from the state to the institutions.
$14,359 $14,740 $16,327 $17,049
$10,377 $10,251 $10,484 $10,298
$6,506 $6,413 $6,780 $6,923
2012-13 2013-14 2014-15 2015-16Baseline
Research Universities Comprehensive Universities KCTCS
C o u n c i l o n P o s t s e c o n d a r y E d u c a t i o n | 1 2
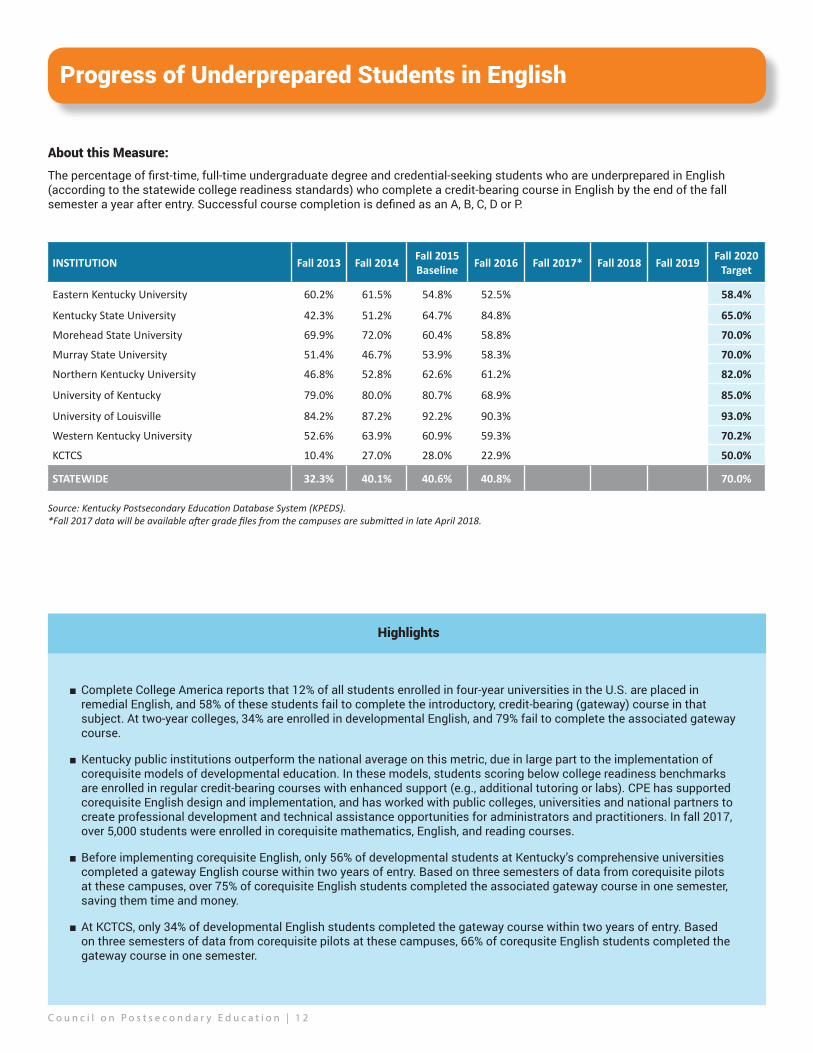
Progress of Underprepared Students in English
About this Measure:
The percentage of first-time, full-time undergraduate degree and credential-seeking students who are underprepared in English (according to the statewide college readiness standards) who complete a credit-bearing course in English by the end of the fall semester a year after entry. Successful course completion is defined as an A, B, C, D or P.
INSTITUTION Fall 2013 Fall 2014 Fall 2015Baseline Fall 2016 Fall 2017* Fall 2018 Fall 2019 Fall 2020
Target
Eastern Kentucky University 60.2% 61.5% 54.8% 52.5% 58.4%
Kentucky State University 42.3% 51.2% 64.7% 84.8% 65.0%
Morehead State University 69.9% 72.0% 60.4% 58.8% 70.0%
Murray State University 51.4% 46.7% 53.9% 58.3% 70.0%
Northern Kentucky University 46.8% 52.8% 62.6% 61.2% 82.0%
University of Kentucky 79.0% 80.0% 80.7% 68.9% 85.0%
University of Louisville 84.2% 87.2% 92.2% 90.3% 93.0%
Western Kentucky University 52.6% 63.9% 60.9% 59.3% 70.2%
KCTCS 10.4% 27.0% 28.0% 22.9% 50.0%
STATEWIDE 32.3% 40.1% 40.6% 40.8% 70.0%
Source: Kentucky Postsecondary Education Database System (KPEDS).*Fall 2017 data will be available after grade files from the campuses are submitted in late April 2018.
Highlights
■ Complete College America reports that 12% of all students enrolled in four-year universities in the U.S. are placed in remedial English, and 58% of these students fail to complete the introductory, credit-bearing (gateway) course in that subject. At two-year colleges, 34% are enrolled in developmental English, and 79% fail to complete the associated gateway course.
■ Kentucky public institutions outperform the national average on this metric, due in large part to the implementation of corequisite models of developmental education. In these models, students scoring below college readiness benchmarks are enrolled in regular credit-bearing courses with enhanced support (e.g., additional tutoring or labs). CPE has supported corequisite English design and implementation, and has worked with public colleges, universities and national partners to create professional development and technical assistance opportunities for administrators and practitioners. In fall 2017, over 5,000 students were enrolled in corequisite mathematics, English, and reading courses.
■ Before implementing corequisite English, only 56% of developmental students at Kentucky’s comprehensive universities completed a gateway English course within two years of entry. Based on three semesters of data from corequisite pilots at these campuses, over 75% of corequisite English students completed the associated gateway course in one semester, saving them time and money.
■ At KCTCS, only 34% of developmental English students completed the gateway course within two years of entry. Based on three semesters of data from corequisite pilots at these campuses, 66% of corequsite English students completed the gateway course in one semester.
C o u n c i l o n P o s t s e c o n d a r y E d u c a t i o n | 1 3
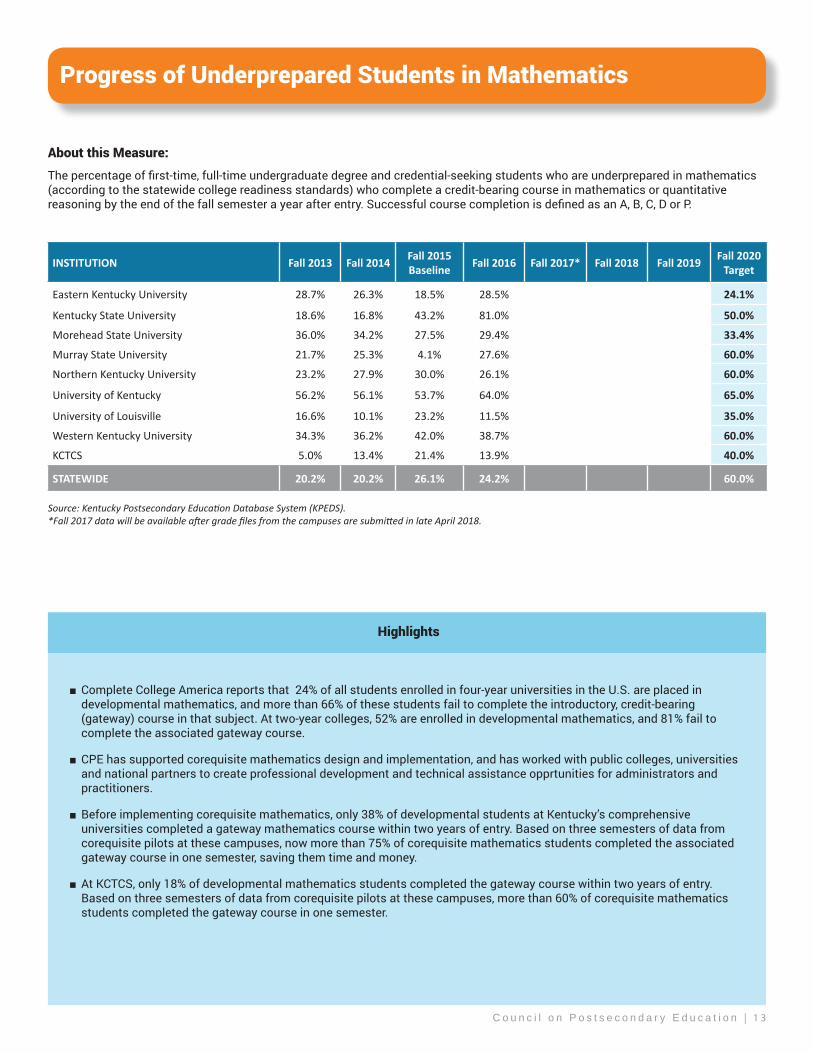
Progress of Underprepared Students in Mathematics
About this Measure:
The percentage of first-time, full-time undergraduate degree and credential-seeking students who are underprepared in mathematics (according to the statewide college readiness standards) who complete a credit-bearing course in mathematics or quantitative reasoning by the end of the fall semester a year after entry. Successful course completion is defined as an A, B, C, D or P.
INSTITUTION Fall 2013 Fall 2014 Fall 2015Baseline Fall 2016 Fall 2017* Fall 2018 Fall 2019 Fall 2020
Target
Eastern Kentucky University 28.7% 26.3% 18.5% 28.5% 24.1%
Kentucky State University 18.6% 16.8% 43.2% 81.0% 50.0%
Morehead State University 36.0% 34.2% 27.5% 29.4% 33.4%
Murray State University 21.7% 25.3% 4.1% 27.6% 60.0%
Northern Kentucky University 23.2% 27.9% 30.0% 26.1% 60.0%
University of Kentucky 56.2% 56.1% 53.7% 64.0% 65.0%
University of Louisville 16.6% 10.1% 23.2% 11.5% 35.0%
Western Kentucky University 34.3% 36.2% 42.0% 38.7% 60.0%
KCTCS 5.0% 13.4% 21.4% 13.9% 40.0%
STATEWIDE 20.2% 20.2% 26.1% 24.2% 60.0%
Source: Kentucky Postsecondary Education Database System (KPEDS).*Fall 2017 data will be available after grade files from the campuses are submitted in late April 2018.
Highlights
■ Complete College America reports that 24% of all students enrolled in four-year universities in the U.S. are placed in developmental mathematics, and more than 66% of these students fail to complete the introductory, credit-bearing (gateway) course in that subject. At two-year colleges, 52% are enrolled in developmental mathematics, and 81% fail to complete the associated gateway course.
■ CPE has supported corequisite mathematics design and implementation, and has worked with public colleges, universities and national partners to create professional development and technical assistance opprtunities for administrators and practitioners.
■ Before implementing corequisite mathematics, only 38% of developmental students at Kentucky’s comprehensive universities completed a gateway mathematics course within two years of entry. Based on three semesters of data from corequisite pilots at these campuses, now more than 75% of corequisite mathematics students completed the associated gateway course in one semester, saving them time and money.
■ At KCTCS, only 18% of developmental mathematics students completed the gateway course within two years of entry. Based on three semesters of data from corequisite pilots at these campuses, more than 60% of corequisite mathematics students completed the gateway course in one semester.
C o u n c i l o n P o s t s e c o n d a r y E d u c a t i o n | 1 4
■ CPE holds an annual Student Success Summit, which provides faculty, staff, and administrators an opportunity to learn from national experts and engage in stimulating discussions with colleagues from across the state.
■ CPE promulgated administrative regulations for the performance funding models for public universities and KCTCS, which will be implemented in 2018-19 and phased in over a three-year period. The models award funding partially based on performance - including retention, progression, graduation, and degrees - with a premium on outcomes for low-income and underrepresented minority students.
■ CPE is leading efforts to increase the use of corequisite models of developmental education, allowing students who do not meet ACT readiness benchmarks in English, mathematics, and reading to be placed in credit-bearing courses with enhanced supports. With funding from the James Graham Brown Foundation and other sources, CPE has been able to provide extensive professional development and incentives for nearly all of the public institutions to participate.
■ CPE coordinates the “15 to Finish” campaign, a series of communication and outreach materials that can be customized to encourage undergraduate students to take 15 credit hours each semester to finish their bachelor’s degree in four years.
To improve two-year to four-year transfer: ■ Over the last three years, CPE has supported KCTCS’s efforts to streamline the transfer process. At the most recent event, Transfer Summit 3.0, representatives from universities and community and technical colleges discussed campus trends, identified obstacles to seamless transfer, and identified possible solutions.
■ CPE, KCTCS, and the public universities have collaborated to create and maintain more than 90 degree pathways, which help students graduate on time with fewer unnecessary credits and less accumulated debt. Information about transfer and degree pathways is available to students via the CPE-maintained KnowHow2Transfer.org website.
■ CPE is working on efforts to maximize the transferability of military credits to public postsecondary institutions. With assistance from the Multi-state Collaborative on Military Credit, CPE developed guiding principles for awarding military credit and a crosswalk between multiple Army-enlisted occupations
POLICY AREA 2: SUCCESS
Kentucky’s future prosperity depends on more people advancing through our postsecondary education system and graduating in less time. CPE is leading efforts to increase degree production; make instruction more relevant, rigorous and engaging; improve support services for students when and where they need it; close achievement gaps; and ensure academic quality across our campuses. The following are just a few of the activities underway that align to key objectives of the 2016-21 strategic agenda.
To increase persistence and timely completion:
that depicts recommended college credits based on the American Council on Education’s research.
To promote academic excellence through improvements in teaching and learning:
■ Kentucky is participating in the VALUE Institute, a national project engaging faculty in authentic assessment methods to provide evidence of student learning. Student work is evaluated using faculty-developed VALUE rubrics for critical thinking, quantitative literacy, and written communication under the auspices of the Association of American Colleges and Universities’ LEAP (Liberal Education and America’s Promise) initiative. Since 2014, Kentucky has participated in the Multi-state Collaborative to Advance Quality Student Learning (MSC) consortium within the VALUE Institute, in which 10 states and 17 institutions participate nationally.
■ The 2017 Pedagogicon, held May 19th at Eastern Kentucky University’s Noel Studio for Academic Creativity, focused on the theme of “Innovations in Teaching and Learning.” This theme underscored the importance of forward-thinking teaching strategies that promote student engagement and learning. The event was sponsored by the statewide Faculty Development Workgroup.
■ CPE staff evaluated more than 200 existing academic programs at KCTCS and seven public universities in 2017. In addition to these program reviews, staff members are working with campus representatives to refine the program review process to increase focus on academic quality measures, data on post-graduation success, and efficiency and collaboration.
■ CPE convenes one committee and three workgroups comprised of postsecondary educators and administrators. The Committee on Undergraduate Education leads campus efforts related to academic quality, achievement gaps, and other priorities in the continuous improvement of undergraduate education. The Academic Quality Assurance workgroup focuses on academic standards, as well as assessment of student learning, academic programs, and support systems. The General Education workgroup focuses on the design, implementation, and assessment of general education to assure a high-quality experience for all students, with an emphasis on scaffolding high-impact practices and structuring a coherent curriculum. The Teaching and Learning workgroup focuses on increasing academic quality, improving student learning, and closing achievement gaps through faculty development and effective use of digital resources.
■ CPE sponsored a free faculty workshop aimed at improving student learning in the area of written communication, an essential skill needed for today’s workforce. The workshop focused on assignment design, and each campus team was encouraged to share this professional learning opportunity with others. Funds for the workshop were provided by a faculty collaborative grant from the Association of American Colleges and Universities.

C o u n c i l o n P o s t s e c o n d a r y E d u c a t i o n | 1 5
Kentucky will be stronger by ensuring that many more individuals complete a postsecondary degree or credential, and that they graduate with the skills and abilities to be productive, engaged citizens.
STRONGERSUCCESS
C o u n c i l o n P o s t s e c o n d a r y E d u c a t i o n | 1 6
Graduation Rates
INSTITUTION 2011-12 2012-13 2013-14 2014-15 2015-16Baseline 2016-17 2017-18 2018-19 2019-20 2020-21
Target
KCTCS
Overall 24.9% 23.4% 23.7% 25.5% 26.8% 27.1% 30.5%
URM 13.3% 13.4% 14.5% 14.1% 16.5% 17.2% 22.5%
Low-Income 23.6% 21.7% 20.7% 23.4% 23.4% 23.8% 28.0%
KCTCS (3-Year Rate)
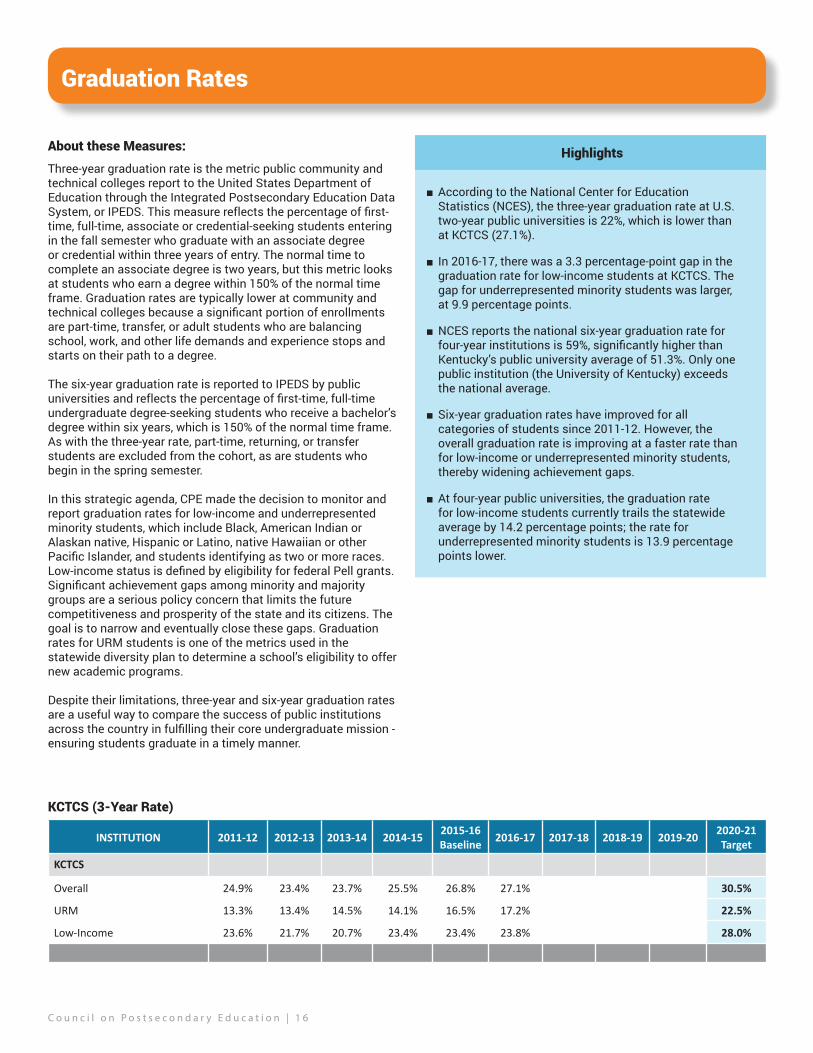
About these Measures:
Three-year graduation rate is the metric public community and technical colleges report to the United States Department of Education through the Integrated Postsecondary Education Data System, or IPEDS. This measure reflects the percentage of first-time, full-time, associate or credential-seeking students entering in the fall semester who graduate with an associate degree or credential within three years of entry. The normal time to complete an associate degree is two years, but this metric looks at students who earn a degree within 150% of the normal time frame. Graduation rates are typically lower at community and technical colleges because a significant portion of enrollments are part-time, transfer, or adult students who are balancing school, work, and other life demands and experience stops and starts on their path to a degree.
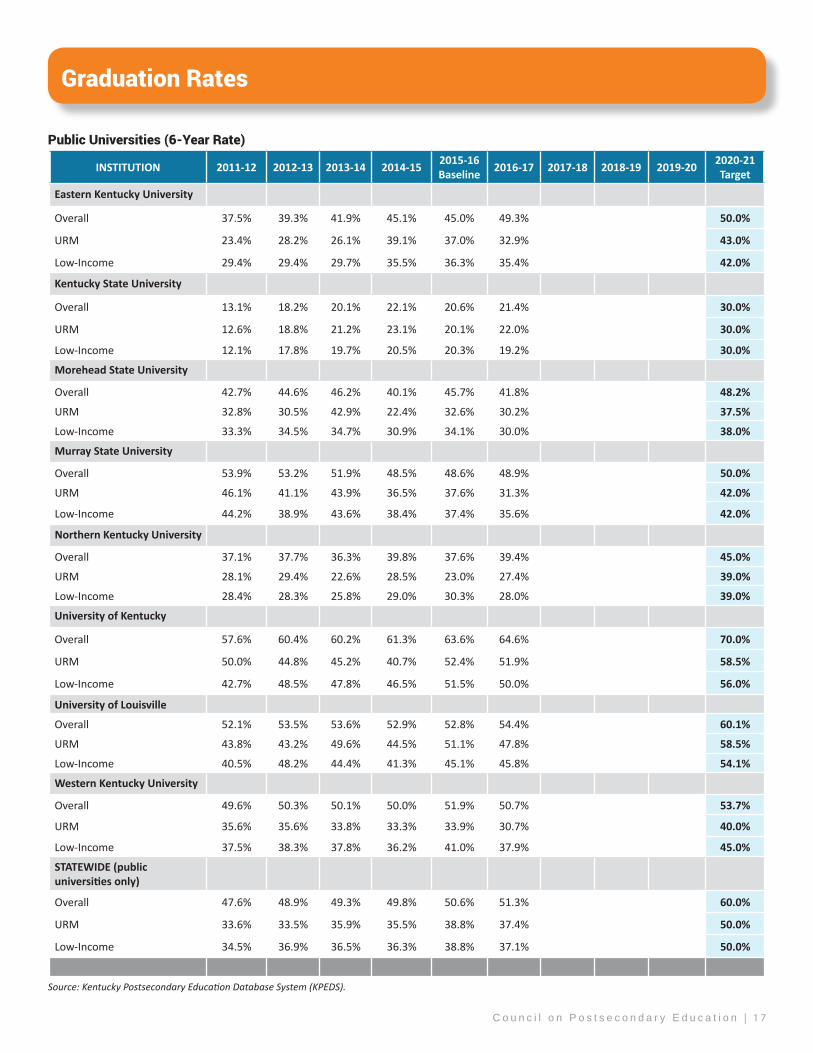
The six-year graduation rate is reported to IPEDS by public universities and reflects the percentage of first-time, full-time undergraduate degree-seeking students who receive a bachelor’s degree within six years, which is 150% of the normal time frame. As with the three-year rate, part-time, returning, or transfer students are excluded from the cohort, as are students who begin in the spring semester.
In this strategic agenda, CPE made the decision to monitor and report graduation rates for low-income and underrepresented minority students, which include Black, American Indian or Alaskan native, Hispanic or Latino, native Hawaiian or other Pacific Islander, and students identifying as two or more races. Low-income status is defined by eligibility for federal Pell grants. Significant achievement gaps among minority and majority groups are a serious policy concern that limits the future competitiveness and prosperity of the state and its citizens. The goal is to narrow and eventually close these gaps. Graduation rates for URM students is one of the metrics used in the statewide diversity plan to determine a school’s eligibility to offer new academic programs.
Despite their limitations, three-year and six-year graduation rates are a useful way to compare the success of public institutions across the country in fulfilling their core undergraduate mission - ensuring students graduate in a timely manner.
Highlights
■ According to the National Center for Education Statistics (NCES), the three-year graduation rate at U.S. two-year public universities is 22%, which is lower than at KCTCS (27.1%).
■ In 2016-17, there was a 3.3 percentage-point gap in the graduation rate for low-income students at KCTCS. The gap for underrepresented minority students was larger, at 9.9 percentage points.
■ NCES reports the national six-year graduation rate for four-year institutions is 59%, significantly higher than Kentucky’s public university average of 51.3%. Only one public institution (the University of Kentucky) exceeds the national average.
■ Six-year graduation rates have improved for all categories of students since 2011-12. However, the overall graduation rate is improving at a faster rate than for low-income or underrepresented minority students, thereby widening achievement gaps.
■ At four-year public universities, the graduation rate for low-income students currently trails the statewide average by 14.2 percentage points; the rate for underrepresented minority students is 13.9 percentage points lower.
C o u n c i l o n P o s t s e c o n d a r y E d u c a t i o n | 1 7
Graduation Rates
INSTITUTION 2011-12 2012-13 2013-14 2014-15 2015-16Baseline 2016-17 2017-18 2018-19 2019-20 2020-21
Target
Eastern Kentucky University
Overall 37.5% 39.3% 41.9% 45.1% 45.0% 49.3% 50.0%
URM 23.4% 28.2% 26.1% 39.1% 37.0% 32.9% 43.0%
Low-Income 29.4% 29.4% 29.7% 35.5% 36.3% 35.4% 42.0%
Kentucky State University
Overall 13.1% 18.2% 20.1% 22.1% 20.6% 21.4% 30.0%
URM 12.6% 18.8% 21.2% 23.1% 20.1% 22.0% 30.0%
Low-Income 12.1% 17.8% 19.7% 20.5% 20.3% 19.2% 30.0%
Morehead State University
Overall 42.7% 44.6% 46.2% 40.1% 45.7% 41.8% 48.2%
URM 32.8% 30.5% 42.9% 22.4% 32.6% 30.2% 37.5%
Low-Income 33.3% 34.5% 34.7% 30.9% 34.1% 30.0% 38.0%
Murray State University
Overall 53.9% 53.2% 51.9% 48.5% 48.6% 48.9% 50.0%
URM 46.1% 41.1% 43.9% 36.5% 37.6% 31.3% 42.0%
Low-Income 44.2% 38.9% 43.6% 38.4% 37.4% 35.6% 42.0%
Northern Kentucky University
Overall 37.1% 37.7% 36.3% 39.8% 37.6% 39.4% 45.0%
URM 28.1% 29.4% 22.6% 28.5% 23.0% 27.4% 39.0%
Low-Income 28.4% 28.3% 25.8% 29.0% 30.3% 28.0% 39.0%
University of Kentucky
Overall 57.6% 60.4% 60.2% 61.3% 63.6% 64.6% 70.0%
URM 50.0% 44.8% 45.2% 40.7% 52.4% 51.9% 58.5%
Low-Income 42.7% 48.5% 47.8% 46.5% 51.5% 50.0% 56.0%
University of Louisville
Overall 52.1% 53.5% 53.6% 52.9% 52.8% 54.4% 60.1%
URM 43.8% 43.2% 49.6% 44.5% 51.1% 47.8% 58.5%
Low-Income 40.5% 48.2% 44.4% 41.3% 45.1% 45.8% 54.1%
Western Kentucky University
Overall 49.6% 50.3% 50.1% 50.0% 51.9% 50.7% 53.7%
URM 35.6% 35.6% 33.8% 33.3% 33.9% 30.7% 40.0%
Low-Income 37.5% 38.3% 37.8% 36.2% 41.0% 37.9% 45.0%
STATEWIDE (public universities only)
Overall 47.6% 48.9% 49.3% 49.8% 50.6% 51.3% 60.0%
URM 33.6% 33.5% 35.9% 35.5% 38.8% 37.4% 50.0%
Low-Income 34.5% 36.9% 36.5% 36.3% 38.8% 37.1% 50.0%
Public Universities (6-Year Rate)
Source: Kentucky Postsecondary Education Database System (KPEDS).
C o u n c i l o n P o s t s e c o n d a r y E d u c a t i o n | 1 8
First-Year to Second-Year Retention
INSTITUTION Fall 11- Fall 12
Fall 12-Fall 13
Fall 13-Fall 14
Fall 14-Fall 15
Fall 15-Fall 16
Baseline
Fall 16-Fall 17
Fall 17-Fall 18
Fall 18-Fall 19
Fall 19-Fall 20
Fall 20-Fall 21 Target
KCTCS
Overall 50.9% 51.6% 52.0% 50.1% 52.6% 54.0% 54.4%
URM 40.0% 40.4% 42.2% 40.1% 45.1% 47.0% 46.8%
Low-Income 48.3% 49.9% 49.2% 47.6% 50.3% 52.8% 53.7%
KCTCS
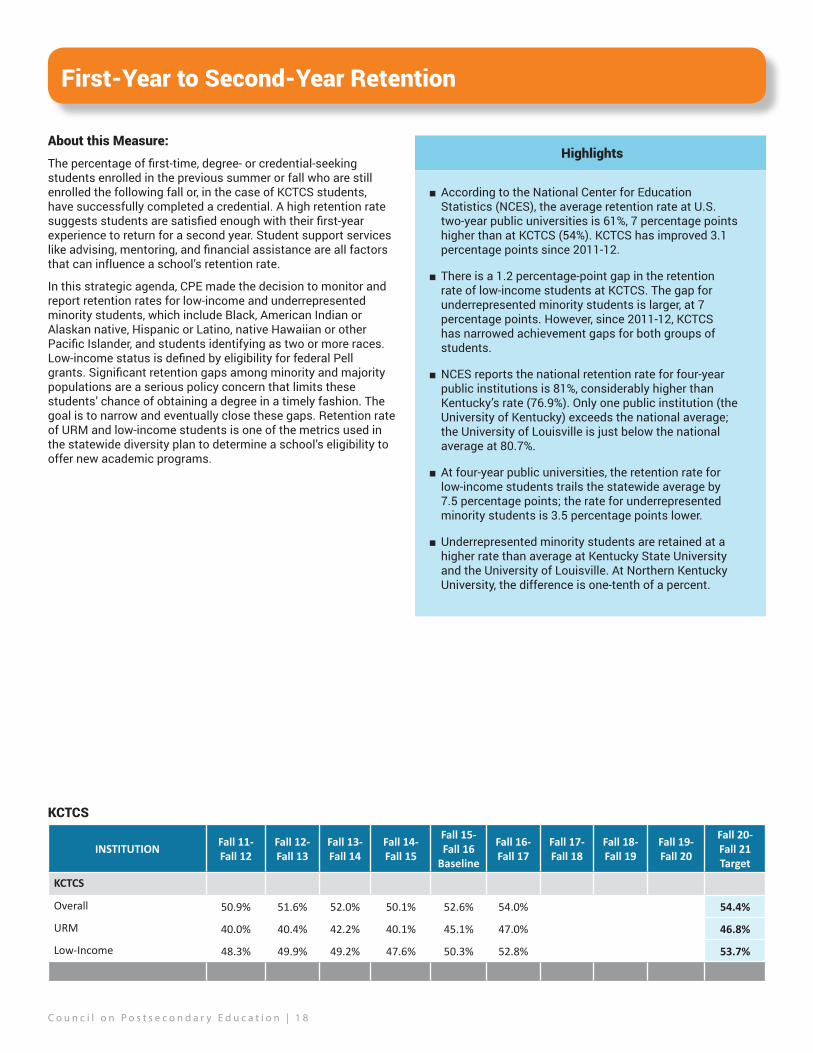
About this Measure:
The percentage of first-time, degree- or credential-seeking students enrolled in the previous summer or fall who are still enrolled the following fall or, in the case of KCTCS students, have successfully completed a credential. A high retention rate suggests students are satisfied enough with their first-year experience to return for a second year. Student support services like advising, mentoring, and financial assistance are all factors that can influence a school’s retention rate.
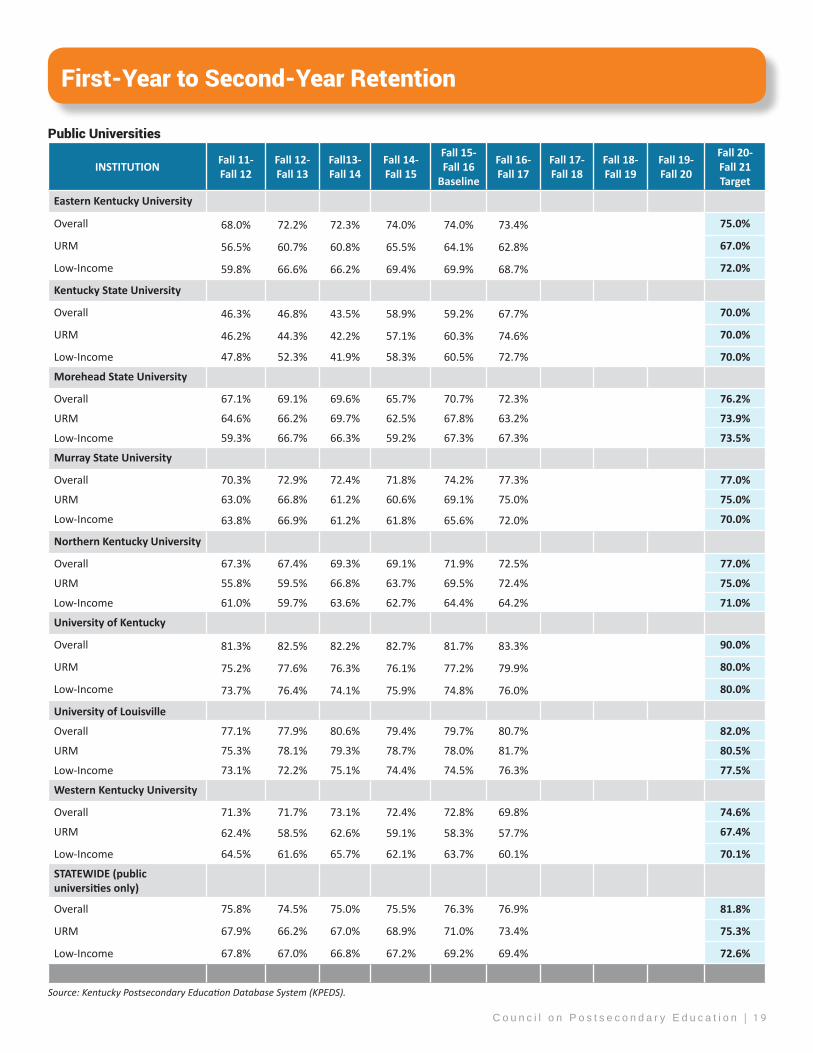
In this strategic agenda, CPE made the decision to monitor and report retention rates for low-income and underrepresented minority students, which include Black, American Indian or Alaskan native, Hispanic or Latino, native Hawaiian or other Pacific Islander, and students identifying as two or more races. Low-income status is defined by eligibility for federal Pell grants. Significant retention gaps among minority and majority populations are a serious policy concern that limits these students’ chance of obtaining a degree in a timely fashion. The goal is to narrow and eventually close these gaps. Retention rate of URM and low-income students is one of the metrics used in the statewide diversity plan to determine a school’s eligibility to offer new academic programs.
Highlights
■ According to the National Center for Education Statistics (NCES), the average retention rate at U.S. two-year public universities is 61%, 7 percentage points higher than at KCTCS (54%). KCTCS has improved 3.1 percentage points since 2011-12.
■ There is a 1.2 percentage-point gap in the retention rate of low-income students at KCTCS. The gap for underrepresented minority students is larger, at 7 percentage points. However, since 2011-12, KCTCS has narrowed achievement gaps for both groups of students.
■ NCES reports the national retention rate for four-year public institutions is 81%, considerably higher than Kentucky’s rate (76.9%). Only one public institution (the University of Kentucky) exceeds the national average; the University of Louisville is just below the national average at 80.7%.
■ At four-year public universities, the retention rate for low-income students trails the statewide average by 7.5 percentage points; the rate for underrepresented minority students is 3.5 percentage points lower.
■ Underrepresented minority students are retained at a higher rate than average at Kentucky State University and the University of Louisville. At Northern Kentucky University, the difference is one-tenth of a percent.
C o u n c i l o n P o s t s e c o n d a r y E d u c a t i o n | 1 9
First-Year to Second-Year Retention
INSTITUTION Fall 11-Fall 12
Fall 12-Fall 13
Fall13-Fall 14
Fall 14-Fall 15
Fall 15-Fall 16
Baseline
Fall 16-Fall 17
Fall 17-Fall 18
Fall 18-Fall 19
Fall 19-Fall 20
Fall 20-Fall 21 Target
Eastern Kentucky University
Overall 68.0% 72.2% 72.3% 74.0% 74.0% 73.4% 75.0%
URM 56.5% 60.7% 60.8% 65.5% 64.1% 62.8% 67.0%
Low-Income 59.8% 66.6% 66.2% 69.4% 69.9% 68.7% 72.0%
Kentucky State University
Overall 46.3% 46.8% 43.5% 58.9% 59.2% 67.7% 70.0%
URM 46.2% 44.3% 42.2% 57.1% 60.3% 74.6% 70.0%
Low-Income 47.8% 52.3% 41.9% 58.3% 60.5% 72.7% 70.0%
Morehead State University
Overall 67.1% 69.1% 69.6% 65.7% 70.7% 72.3% 76.2%
URM 64.6% 66.2% 69.7% 62.5% 67.8% 63.2% 73.9%
Low-Income 59.3% 66.7% 66.3% 59.2% 67.3% 67.3% 73.5%
Murray State University
Overall 70.3% 72.9% 72.4% 71.8% 74.2% 77.3% 77.0%
URM 63.0% 66.8% 61.2% 60.6% 69.1% 75.0% 75.0%
Low-Income 63.8% 66.9% 61.2% 61.8% 65.6% 72.0% 70.0%
Northern Kentucky University
Overall 67.3% 67.4% 69.3% 69.1% 71.9% 72.5% 77.0%
URM 55.8% 59.5% 66.8% 63.7% 69.5% 72.4% 75.0%
Low-Income 61.0% 59.7% 63.6% 62.7% 64.4% 64.2% 71.0%
University of Kentucky
Overall 81.3% 82.5% 82.2% 82.7% 81.7% 83.3% 90.0%
URM 75.2% 77.6% 76.3% 76.1% 77.2% 79.9% 80.0%
Low-Income 73.7% 76.4% 74.1% 75.9% 74.8% 76.0% 80.0%
University of Louisville
Overall 77.1% 77.9% 80.6% 79.4% 79.7% 80.7% 82.0%
URM 75.3% 78.1% 79.3% 78.7% 78.0% 81.7% 80.5%
Low-Income 73.1% 72.2% 75.1% 74.4% 74.5% 76.3% 77.5%
Western Kentucky University
Overall 71.3% 71.7% 73.1% 72.4% 72.8% 69.8% 74.6%
URM 62.4% 58.5% 62.6% 59.1% 58.3% 57.7% 67.4%
Low-Income 64.5% 61.6% 65.7% 62.1% 63.7% 60.1% 70.1%
STATEWIDE (public universities only)
Overall 75.8% 74.5% 75.0% 75.5% 76.3% 76.9% 81.8%
URM 67.9% 66.2% 67.0% 68.9% 71.0% 73.4% 75.3%
Low-Income 67.8% 67.0% 66.8% 67.2% 69.2% 69.4% 72.6%
Public Universities
Source: Kentucky Postsecondary Education Database System (KPEDS).

C o u n c i l o n P o s t s e c o n d a r y E d u c a t i o n | 2 0
Average Credit Hours Earned at Graduation
INSTITUTION 2012-13 2013-14 2014-15 2015-16Baseline 2016-17 2017-18 2018-19 2019-20 2020-21
Target
Eastern Kentucky University 140.0 141.3 141.3 140.5 142.1 137.5
Kentucky State University 146.3 140.3 141.7 142.3 140.3 120.0
Morehead State University 143.2 141.4 140.7 138.1 136.4 136.6
Murray State University 142.2 139.6 139.7 138.0 138.6 132.0
Northern Kentucky University 139.7 139.0 138.8 137.8 134.9 135.7
University of Kentucky 140.2 139.5 140.6 140.5 140.5 135.4
University of Louisville 141.6 142.4 142.2 142.2 140.9 137.0
Western Kentucky University 139.6 139.6 139.0 139.6 138.9 138.6
KCTCS 91.1 91.4 90.3 86.2 84.4 80.0
AIKCU 136.2 135.5 135.4 135.7 138.6 NA
STATEWIDE (public 4-year only) 139.7 139.3 139.4 139.0 138.6 134.0
About this Measure:
The average number of credits earned by associate and bachelor’s degree graduates at the time of graduation, including credit transferred into the degree-granting institution from other postsecondary institutions. This includes the number of hours accepted in transfer, but does not include hours earned in developmental or remedial courses or credit hours earned while obtaining a second degree at the same level in the same year. Most accreditors require bachelor’s degree programs to consist of a minimum of 120 credit hours; for associate degree programs, the minimum is 60 credit hours. Often, specific program accreditors require a higher number of credit hours for graduation.
Source: Kentucky Postsecondary Education Database System (KPEDS)
Highlights
■ Kentucky graduates who accumulate hours beyond what their program requires may incur more costs, both from increased tuition and indirectly from lost wages.
■ According to Complete College America, the average number of credit hours earned by graduates of public two-year institutions is 82.2, 2.2 hours less than the KCTCS average. The average number of credit hours earned at public four-year institutions is 135, lower than the statewide average of 139.
■ Only one institution (Northern Kentucky University) is below the national average on this metric. Morehead State University, at 136.4, is only 1.4 credit hours higher.
■ Four institutions and KCTCS have decreased average credit hours awarded since 2012-13, with the biggest declines at Morehead State University (6.8 credit hours) and Kentucky State University (6 credit hours). Eastern Kentucky University’s average increased by 2.1, while UK, UofL and WKU are basically unchanged.
■ As part of the program review process, CPE staff members monitor average credits to degree for graduates in each program over a five-year period.
C o u n c i l o n P o s t s e c o n d a r y E d u c a t i o n | 2 1
Statewide Completion Rate
About this Measure:
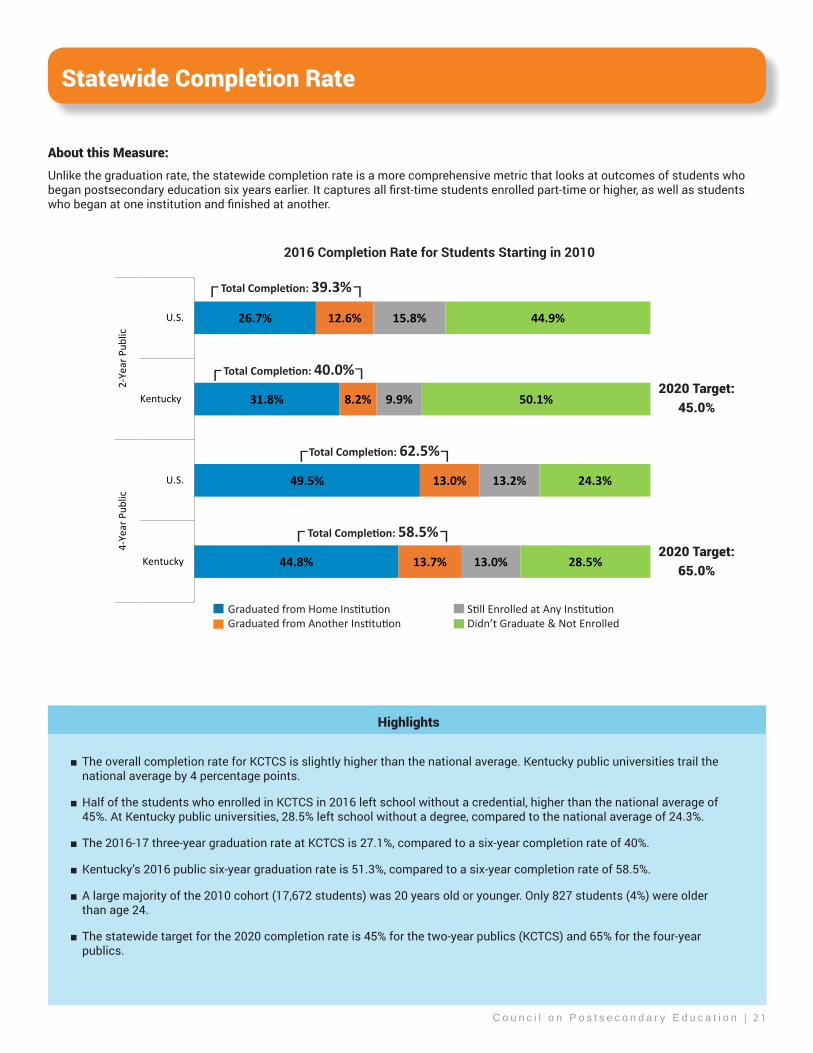
Unlike the graduation rate, the statewide completion rate is a more comprehensive metric that looks at outcomes of students who began postsecondary education six years earlier. It captures all first-time students enrolled part-time or higher, as well as students who began at one institution and finished at another.
Highlights
■ The overall completion rate for KCTCS is slightly higher than the national average. Kentucky public universities trail the national average by 4 percentage points.
■ Half of the students who enrolled in KCTCS in 2016 left school without a credential, higher than the national average of 45%. At Kentucky public universities, 28.5% left school without a degree, compared to the national average of 24.3%.
■ The 2016-17 three-year graduation rate at KCTCS is 27.1%, compared to a six-year completion rate of 40%.
■ Kentucky’s 2016 public six-year graduation rate is 51.3%, compared to a six-year completion rate of 58.5%.
■ A large majority of the 2010 cohort (17,672 students) was 20 years old or younger. Only 827 students (4%) were older than age 24.
■ The statewide target for the 2020 completion rate is 45% for the two-year publics (KCTCS) and 65% for the four-year publics.
44.8%
49.5%
31.8%
26.7%
13.7%
13.0%
8.2%
12.6%
13.0%
13.2%
9.9%
15.8%
28.5%
24.3%
50.1%
44.9%
Kentucky
U.S.
Kentucky
U.S.
4-Ye
ar P
ublic
2-Ye
ar P
ublic
Graduated from Home Institution Still Enrolled at Any InstitutionGraduated from Another Institution Didn’t Graduate & Not Enrolled
Total Completion: 39.3%
Total Completion: 40.0%
Total Completion: 62.5%
Total Completion: 58.5%
2016 Completion Rate for Students Starting in 2010
2020 Target:45.0%
2020 Target:65.0%
L
L
L
LL
L
L
L

C o u n c i l o n P o s t s e c o n d a r y E d u c a t i o n | 2 2
KCTCS Transfers with an Associate Degree
About this Measure:
The percentage of KCTCS students who earn an associate degree and transfer to a four-year institution within a year of earning the degree.
Source: KCTCS and the National Student Clearinghouse
Highlights
www.KnowHow2Transfer.orgKnowHow2TransferStarting a college degree at KCTCS and finishing it a public university can save students time and money. At KnowHow2Transfer.org, students can:
■ Explore degree pathways that enable them to complete a bachelor’s degree in four years by taking general education and some pre-requisite courses at KCTCS and transferring them to a public university.
■ Access course equivalency guides to see how a specific course taken at KCTCS will transfer to a public university.
■ Connect with an advisor, who can help navigate the transfer process and offer personalized attention.
■ A descriptive study from the National Student Clearinghouse found that students who transferred to a four-year institution with a certificate or associate degree were 16 percentage points more likely to earn a bachelor’s degree than those who transferred without one (72% versus 56%).
■ KCTCS has made steady progress on this metric, improving 1.6 percentage points since 2011-12. Preliminary data suggests the transfer rate in 2015-16 will be around 38.8%.
■ In 2014-15, 5,826 students transferred to a four-year institution in Kentucky. Of these students, 4,907 transferred to a four-year public institution (84.2%).
■ About a third of transfer students (1,960) transferred with 60 or more credit hours, but only 15% had earned an associate degree prior to transferring.
■ The average credit hours upon transfer is 40 hours. That average has remained steady since 2010-11.
■ Approximately 56% of transfer students are of traditional age (24 years or younger), while 44% are 25 or older.
36.3%37.8% 37.4% 37.9%
42.4%
2011-12 2012-13 2013-14 2014-15Baseline
2020-21Target

C o u n c i l o n P o s t s e c o n d a r y E d u c a t i o n | 2 3
www.KnowHow2Transfer.org
Academic Quality and Excellence
About these Measures:
For the first time, the strategic agenda includes measures of academic quality and excellence to reflect our collective focus on improving the quality of academic programs and other aspects of the college experience. The public universities and KCTCS were asked to select two metrics from a short list determined by CPE and campus provosts, which appears below.
Given the newness of the measures and the need to clarify calculation methodologies, targets and baseline data are not yet available. However, annual campus performance presentations to the board include information and discussion related to progress in academic quality and excellence. CPE staff will be working with campus officials over the next year to evaluate these metrics and determine if Kentucky’s participation in the Multi-state Collaborative to Advance Quality Student Learning can help inform this area of the agenda. Based on this review, the metrics may be revised.
■ Undergraduate Research and Creative Works: The percent of students graduating with a bachelor’s degree in a given year that has produced a peer-reviewed presentation or publication, completed an exhibition or performance, or delivered a mentored, out-of-class presentation exhibiting research outcomes.
■ Study Abroad/Study Away: The percent of students graduating in a given year that has participated in a postsecondary-level study abroad experience resulting in academic course credit.
■ Value-Added Certificates/Other CTE Workforce Statistics: The percent of students that complete a value-added certificate resulting in academic credit that is used to enhance skill sets and experience. These certificates may be embedded into the existing two-year, four-year, or graduate curriculum.
■ Average ACT Score: Because it is difficult to measure academic quality directly, admissions selectivity is sometimes used as a proxy measure. The average ACT composite score of incoming freshmen at selective institutions is usually 25 or higher.
■ Faculty Development and Training: The total number of hours of training faculty receives each year related to pedagogical development and other topics. This training may be offered through the institution’s faculty develpment center as well as by other internal or external means.
■ Master’s Degrees with Thesis: This metric measures the number of students earning a master’s degree in a given year who complete a thesis project certified by the graduate school.
■ Pass Rates on Licensure/Certification Exams: Pass rates for technical programs with a recognized credential validating an individual has demonstrated competencies in a core set of content or performance standards in a specific set of work-related tasks, single occupational area, or cluster of related occupational areas.
Academic Quality & Excellence Metrics
C o u n c i l o n P o s t s e c o n d a r y E d u c a t i o n | 2 4
POLICY AREA 3: IMPACT
Kentucky’s colleges and universities have an enormous impact on the state’s economy and quality of life. In addition to training current and future members of the workforce, postecondary institutions engage in research and development activities that lead to scientific breakthroughs and discoveries in health care, agriculture, manufacturing, and other fields. Colleges and universities work with businesses to provide market research, consulting, entrepreneurship training, and other services. Public service and outreach are critical to fulfilling higher education’s mission to improve local communities and the organizations and institutions that serve them.
To improve the career readiness of graduates:
■ CPE partners with the Kentucky Education and Workforce Development Cabinet (KEWDC) and the Kentucky Center for Education and Workforce Statistics (KCEWS) to produce the Postsecondary Feedback Report. The new version uses interactive Tableau technology to provide a better understanding of transfer and employment outcomes of Kentucky’s college and university graduates. Useful for educators, policymakers, board members, and the general public, the report provides employment and wage data by institution, program level, academic discipline, and industry.
■ CPE partners with KCEWS and other state agencies to produce the Kentucky Future Skills Report, which maps workforce supply (citizens holding specific degrees and credentials) with current and future workforce demand (projected job openings in various industries and occupations). The tool is particularly useful for educators in helping determine academic program needs, and for employers to identify talent within the state.
■ CPE worked with KEWDC to provide college and university academic program information to the state’s new Focus Career website. The Focus Career system provides greater transparency for Kentucky job seekers and students about career pathways; available, real-time job postings; and appropriate academic programs and institutions aligned with preferred careers. The tool allows users to explore career and internship options and research a specific program of study, career, or employer.
■ CPE is exploring the Southwestern Ohio Council for Higher Education (SOCHE) Intern Program as a possible model for Kentucky. SOCHE serves as an external resource for campuses and employers to promote and manage internship programs, including management of the application process, hiring, and payroll. The SOCHE model is different than most: the organization acts as employer, saving participating partners money and resources. It also acts as a mentor to both employers and interns, helping to improve the intern process for all involved. One of the key performance indicators for Kentucky’s strategic agenda is the percent of
undergraduates who complete an internship or other “work and learn” opportunity prior to graduation. Research has proven that these experiences help smooth pathways between college and career, as well as contribute to higher levels of student success while in college.
■ CPE President Bob King has joined other education, workforce, economic development, and business leaders as a member of the newly-formed Kentucky Business-Education Roundtable, an initiative spearheaded by the Kentucky Chamber of Commerce CEO Dave Adkisson. The group considers issues related to strengthening Kentucky’s workforce readiness, education and workforce alignment, as well as the state’s workforce participation rate.
To increase university research:
■ CPE partners with the Kentucky Science and Technology Corporation (KSTC) on a number of programs to boost Kentucky’s research, technology, commercialization, entrepreneurial, and economic development efforts, such as the Rural Innovation Fund, the Kentucky Enterprise Fund, EPSCoR, the Governor’s School for Entrepreneurs, and others.
■ CPE requested another round of funding from the General Assembly for the Bucks for Brains program in 2018-20. This program, last funded in 2010, allows universities to match private donations with state funds to create or expand endowed chairs and professorships and facilitate increased generation of federal and extramural research expenditures.
■ The Kentucky Regional Optical Network (KyRON)—a consortium of CPE, the University of Kentucky (UK) and the University of Louisville (UofL)—connects public postsecondary institutions to the national and international research and education community through Internet2. KyRoN enables UK and UofL to qualify for major federal research grants, helping them reach their HB 1 goals of becoming nationally recognized research institutions.
To expand regional partnerships, outreach and public service:
■ Public four-year universities are widely engaged in their communities through service learning, community-based research, civic engagement, and other collaborations. Six out of eight Kentucky public universities have earned the Community Engagement Classification status awarded by the Carnegie Foundation for the Advancement of Teaching: EKU, Morehead, NKU, UK, UofL, and WKU. Awarded in recognition of the strong role civic engagement plays in university life, this status is an elective classification involving data collection and documentation of important aspects of institutional mission, identity, and commitments. Achieving this status requires substantial effort on the part of participating institutions.
C o u n c i l o n P o s t s e c o n d a r y E d u c a t i o n | 2 5
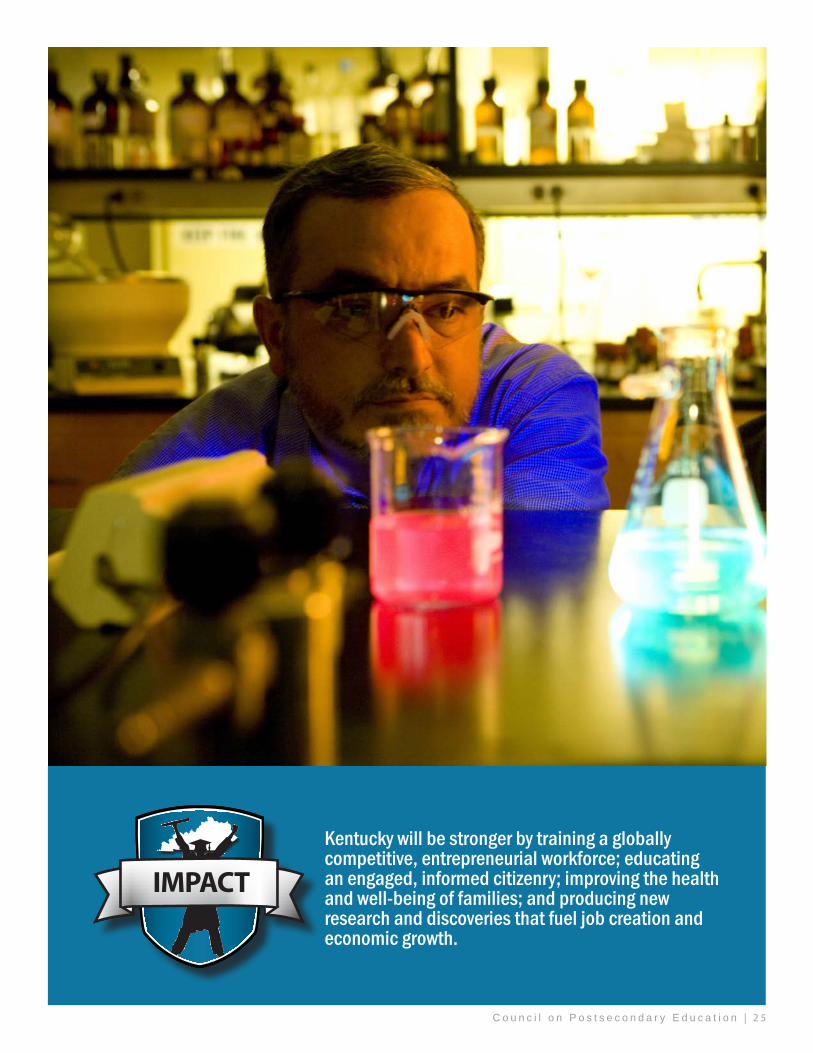
Kentucky will be stronger by training a globally competitive, entrepreneurial workforce; educating an engaged, informed citizenry; improving the health and well-being of families; and producing new research and discoveries that fuel job creation and economic growth.
STRONGERIMPACT
C o u n c i l o n P o s t s e c o n d a r y E d u c a t i o n | 2 6
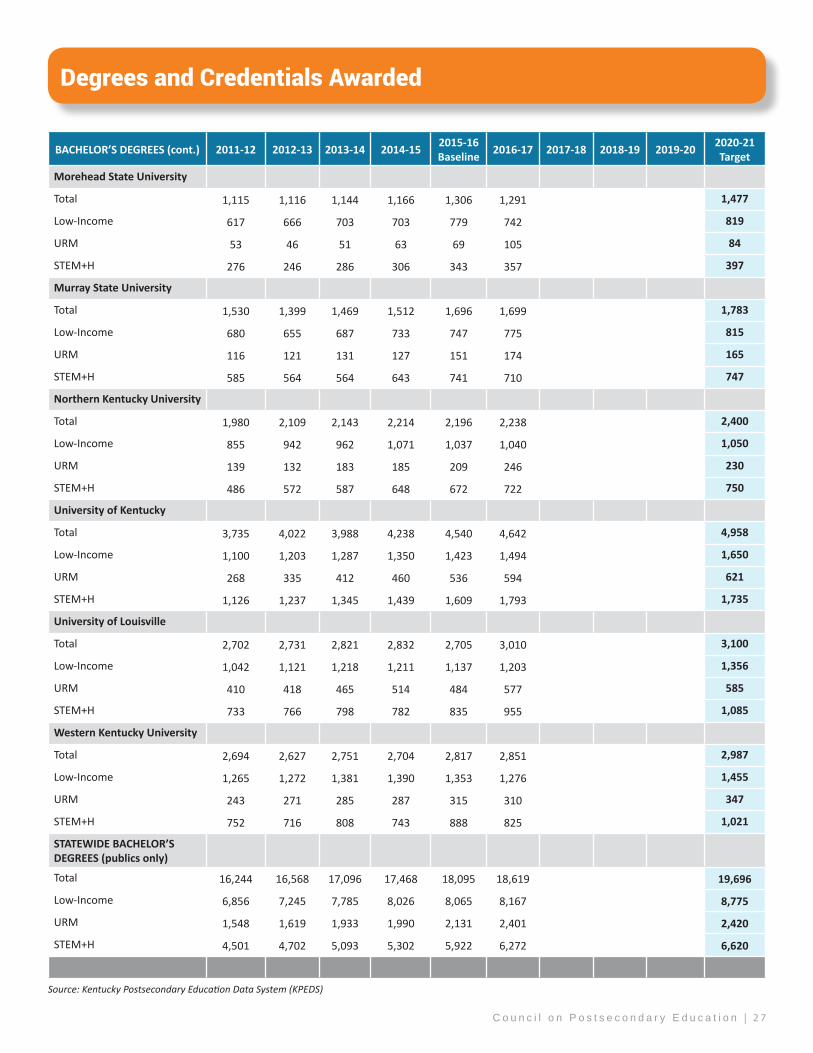
Degrees and Credentials Awarded
ASSOCIATE OR LESS 2011-12 2012-13 2013-14 2014-15 2015-16Baseline 2016-17 2017-18 2018-19 2019-20 2020-21
Target
KCTCS
Total 28,544 28,469 31,715 30,012 30,765 34,502 33,488*
Low-Income 19,873 20,138 22,403 21,090 20,339 23,218 22,139*
URM 3,084 2,940 3,378 3,228 3,340 3,705 3,757*
STEM+H 10,270 10,501 11,406 10,960 10,687 11,903 11,633*
BACHELOR’S DEGREES
Eastern Kentucky University
Total 2,259 2,358 2,508 2,532 2,559 2,573 2,690
Low-Income 1,131 1,239 1,343 1,372 1,378 1,399 1,458
URM 171 178 236 213 207 213 218
STEM+H 484 533 657 682 769 840 820
Kentucky State University
Total 229 206 272 270 276 315 320
Low-Income 166 147 204 196 211 237 220
URM 148 118 170 141 160 182 170
STEM+H 59 68 48 59 65 70 65
About this Measure:
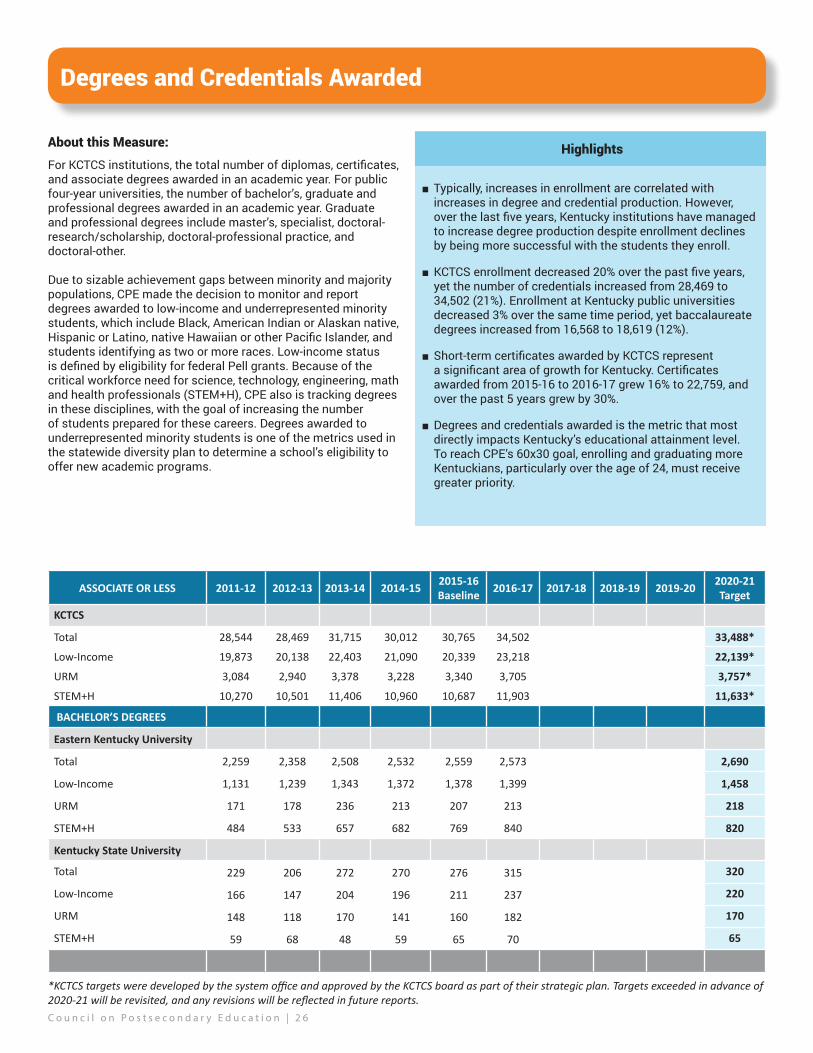
For KCTCS institutions, the total number of diplomas, certificates, and associate degrees awarded in an academic year. For public four-year universities, the number of bachelor’s, graduate and professional degrees awarded in an academic year. Graduate and professional degrees include master’s, specialist, doctoral-research/scholarship, doctoral-professional practice, and doctoral-other.
Due to sizable achievement gaps between minority and majority populations, CPE made the decision to monitor and report degrees awarded to low-income and underrepresented minority students, which include Black, American Indian or Alaskan native, Hispanic or Latino, native Hawaiian or other Pacific Islander, and students identifying as two or more races. Low-income status is defined by eligibility for federal Pell grants. Because of the critical workforce need for science, technology, engineering, math and health professionals (STEM+H), CPE also is tracking degrees in these disciplines, with the goal of increasing the number of students prepared for these careers. Degrees awarded to underrepresented minority students is one of the metrics used in the statewide diversity plan to determine a school’s eligibility to offer new academic programs.
Highlights
■ Typically, increases in enrollment are correlated with increases in degree and credential production. However, over the last five years, Kentucky institutions have managed to increase degree production despite enrollment declines by being more successful with the students they enroll.
■ KCTCS enrollment decreased 20% over the past five years, yet the number of credentials increased from 28,469 to 34,502 (21%). Enrollment at Kentucky public universities decreased 3% over the same time period, yet baccalaureate degrees increased from 16,568 to 18,619 (12%).
■ Short-term certificates awarded by KCTCS represent a significant area of growth for Kentucky. Certificates awarded from 2015-16 to 2016-17 grew 16% to 22,759, and over the past 5 years grew by 30%.
■ Degrees and credentials awarded is the metric that most directly impacts Kentucky’s educational attainment level. To reach CPE’s 60x30 goal, enrolling and graduating more Kentuckians, particularly over the age of 24, must receive greater priority.
*KCTCS targets were developed by the system office and approved by the KCTCS board as part of their strategic plan. Targets exceeded in advance of 2020-21 will be revisited, and any revisions will be reflected in future reports.
C o u n c i l o n P o s t s e c o n d a r y E d u c a t i o n | 2 7
Degrees and Credentials Awarded
BACHELOR’S DEGREES (cont.) 2011-12 2012-13 2013-14 2014-15 2015-16Baseline 2016-17 2017-18 2018-19 2019-20 2020-21
Target
Morehead State University
Total 1,115 1,116 1,144 1,166 1,306 1,291 1,477
Low-Income 617 666 703 703 779 742 819
URM 53 46 51 63 69 105 84
STEM+H 276 246 286 306 343 357 397
Murray State University
Total 1,530 1,399 1,469 1,512 1,696 1,699 1,783
Low-Income 680 655 687 733 747 775 815
URM 116 121 131 127 151 174 165
STEM+H 585 564 564 643 741 710 747
Northern Kentucky University
Total 1,980 2,109 2,143 2,214 2,196 2,238 2,400
Low-Income 855 942 962 1,071 1,037 1,040 1,050
URM 139 132 183 185 209 246 230
STEM+H 486 572 587 648 672 722 750
University of Kentucky
Total 3,735 4,022 3,988 4,238 4,540 4,642 4,958
Low-Income 1,100 1,203 1,287 1,350 1,423 1,494 1,650
URM 268 335 412 460 536 594 621
STEM+H 1,126 1,237 1,345 1,439 1,609 1,793 1,735
University of Louisville
Total 2,702 2,731 2,821 2,832 2,705 3,010 3,100
Low-Income 1,042 1,121 1,218 1,211 1,137 1,203 1,356
URM 410 418 465 514 484 577 585
STEM+H 733 766 798 782 835 955 1,085
Western Kentucky University
Total 2,694 2,627 2,751 2,704 2,817 2,851 2,987
Low-Income 1,265 1,272 1,381 1,390 1,353 1,276 1,455
URM 243 271 285 287 315 310 347
STEM+H 752 716 808 743 888 825 1,021
STATEWIDE BACHELOR’S DEGREES (publics only)
Total 16,244 16,568 17,096 17,468 18,095 18,619 19,696
Low-Income 6,856 7,245 7,785 8,026 8,065 8,167 8,775
URM 1,548 1,619 1,933 1,990 2,131 2,401 2,420
STEM+H 4,501 4,702 5,093 5,302 5,922 6,272 6,620
Source: Kentucky Postsecondary Education Data System (KPEDS)

C o u n c i l o n P o s t s e c o n d a r y E d u c a t i o n | 2 8
Degrees and Credentials Awarded
GRADUATE/PROFESSIONAL DEGREES 2011-12 2012-13 2013-14 2014-15 2015-16
Baseline 2016-17 2017-18 2018-19 2019-20 2020-21 Target
Eastern Kentucky University 751 793 744 791 903 939 950
Kentucky State University 64 50 49 52 45 40 60
Morehead State University 456 463 446 366 339 324 374
Murray State University 732 714 682 684 696 626 699
Northern Kentucky University 661 653 687 699 599 561 660
University of Kentucky 2,119 2,163 2,133 2,068 2,098 2,073 2,151
University of Louisville 1,988 1,894 1,798 1,919 1,937 1,944 2,011
Western Kentucky University 1,013 1,006 928 853 881 879 950
STATEWIDE (publics only) 7,784 7,736 7,467 7,432 7,498 7,386 7,855
Non-Credit Workforce Training Hours
Source: Kentucky Postsecondary Education Database System (KPEDS)
About this Measure:
The number of credit hours of non-credit workforce courses offered by KCTCS in an academic year. The total number of clock hours in a course is multiplied by the number of students in the course. Then, clock hours are converted to credit hours in the following manner: fifteen clock hours equals one credit hour.
Highlights
Source: Kentucky Community and Technical College System Workforce Solutions
■ The statewide strategic agenda for the first time highlights this key part of the KCTCS mission. The metric is designed to capture the breadth and impact of these non-credit, workforce-driven programs.
■ KCTCS, through their Workforce Solutions, provides customized employee training to over 5,000 Kentucky companies annually.
■ Campuses provide training in multiple formats at employer locations. Through the KCTCS-TRAINS program, companies can offset the cost of training their employees.
■ Because Workforce Solutions program delivery is tied directly to business/industry training demands and budgets, as well as to state funding, training hours fluctuate significantly from year to year.
12,346 12,319
14,794
18,61717,160
2012-13 2013-14 2014-15 2015-16Baseline
2016-17
C o u n c i l o n P o s t s e c o n d a r y E d u c a t i o n | 2 9
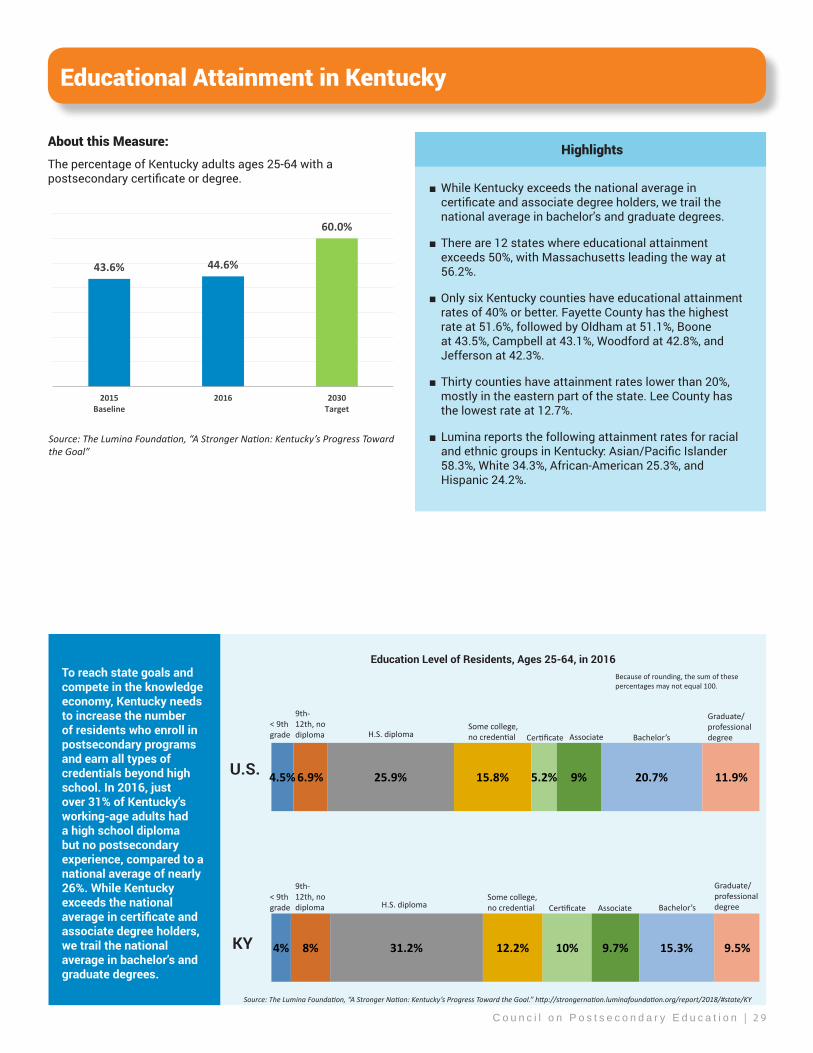
Educational Attainment in Kentucky
About this Measure:
The percentage of Kentucky adults ages 25-64 with a postsecondary certificate or degree.
Source: The Lumina Foundation, “A Stronger Nation: Kentucky’s Progress Toward the Goal”
Highlights
■ While Kentucky exceeds the national average in certificate and associate degree holders, we trail the national average in bachelor’s and graduate degrees.
■ There are 12 states where educational attainment exceeds 50%, with Massachusetts leading the way at 56.2%.
■ Only six Kentucky counties have educational attainment rates of 40% or better. Fayette County has the highest rate at 51.6%, followed by Oldham at 51.1%, Boone at 43.5%, Campbell at 43.1%, Woodford at 42.8%, and Jefferson at 42.3%.
■ Thirty counties have attainment rates lower than 20%, mostly in the eastern part of the state. Lee County has the lowest rate at 12.7%.
■ Lumina reports the following attainment rates for racial and ethnic groups in Kentucky: Asian/Pacific Islander 58.3%, White 34.3%, African-American 25.3%, and Hispanic 24.2%.
Education Level of Residents, Ages 25-64, in 2016Because of rounding, the sum of these percentages may not equal 100.
Source: The Lumina Foundation, “A Stronger Nation: Kentucky’s Progress Toward the Goal.” http://strongernation.luminafoundation.org/report/2018/#state/KY
< 9th grade
9th-12th, no diploma H.S. diploma
Some college, no credential Certificate Associate Bachelor’s
Graduate/professional degree
To reach state goals and compete in the knowledge economy, Kentucky needs to increase the number of residents who enroll in postsecondary programs and earn all types of credentials beyond high school. In 2016, just over 31% of Kentucky’s working-age adults had a high school diploma but no postsecondary experience, compared to a national average of nearly 26%. While Kentucky exceeds the national average in certificate and associate degree holders, we trail the national average in bachelor’s and graduate degrees.
4%
4.5%
8%
6.9%
31.2%
25.9%
12.2%
15.8%
10%
5.2%
9.7%
9%
15.3%
20.7%
9.5%
11.9%
< 9th grade
9th-12th, no diploma H.S. diploma
Some college, no credential Certificate Associate Bachelor’s
Graduate/professional degree
KY
U.S.
43.6% 44.6%
60.0%
2015Baseline
2016 2030Target
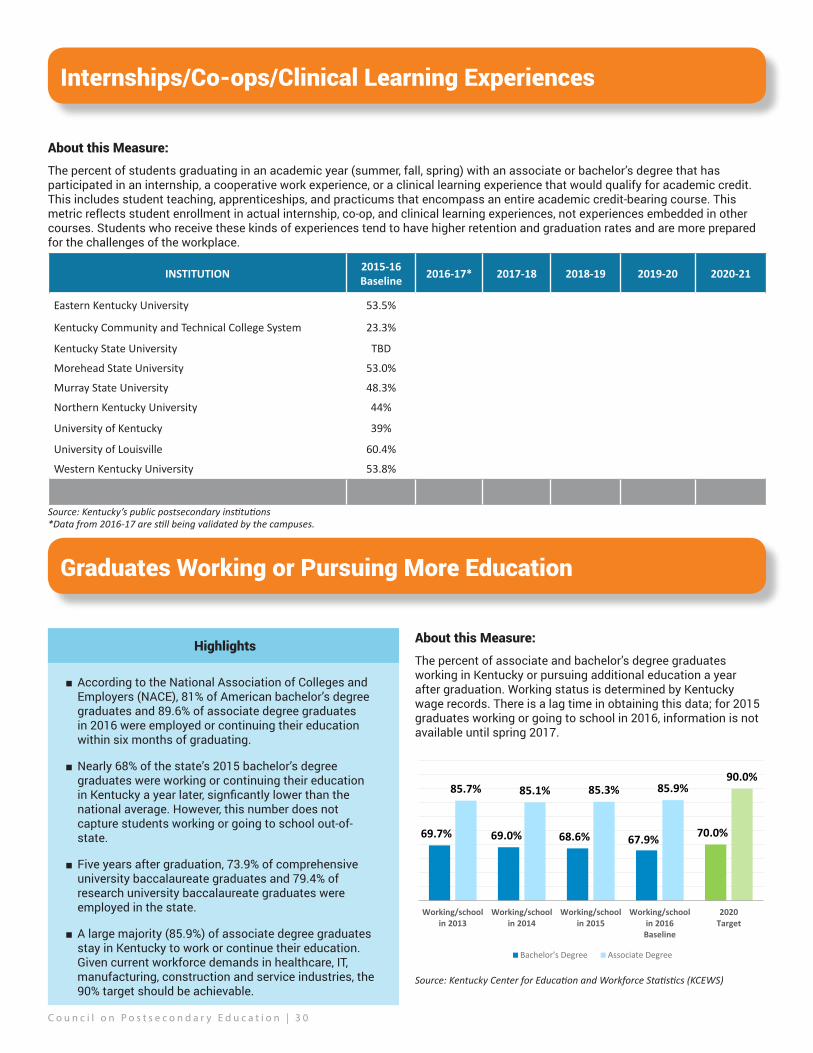
C o u n c i l o n P o s t s e c o n d a r y E d u c a t i o n | 3 0
Internships/Co-ops/Clinical Learning Experiences
Graduates Working or Pursuing More Education
INSTITUTION 2015-16Baseline 2016-17* 2017-18 2018-19 2019-20 2020-21
Eastern Kentucky University 53.5%
Kentucky Community and Technical College System 23.3%
Kentucky State University TBD
Morehead State University 53.0%
Murray State University 48.3%
Northern Kentucky University 44%
University of Kentucky 39%
University of Louisville 60.4%
Western Kentucky University 53.8%
About this Measure:
The percent of students graduating in an academic year (summer, fall, spring) with an associate or bachelor’s degree that has participated in an internship, a cooperative work experience, or a clinical learning experience that would qualify for academic credit. This includes student teaching, apprenticeships, and practicums that encompass an entire academic credit-bearing course. This metric reflects student enrollment in actual internship, co-op, and clinical learning experiences, not experiences embedded in other courses. Students who receive these kinds of experiences tend to have higher retention and graduation rates and are more prepared for the challenges of the workplace.
About this Measure:
The percent of associate and bachelor’s degree graduates working in Kentucky or pursuing additional education a year after graduation. Working status is determined by Kentucky wage records. There is a lag time in obtaining this data; for 2015 graduates working or going to school in 2016, information is not available until spring 2017.
Source: Kentucky’s public postsecondary institutions
Source: Kentucky Center for Education and Workforce Statistics (KCEWS)
Highlights
■ According to the National Association of Colleges and Employers (NACE), 81% of American bachelor’s degree graduates and 89.6% of associate degree graduates in 2016 were employed or continuing their education within six months of graduating.
■ Nearly 68% of the state’s 2015 bachelor’s degree graduates were working or continuing their education in Kentucky a year later, signficantly lower than the national average. However, this number does not capture students working or going to school out-of-state.
■ Five years after graduation, 73.9% of comprehensive university baccalaureate graduates and 79.4% of research university baccalaureate graduates were employed in the state.
■ A large majority (85.9%) of associate degree graduates stay in Kentucky to work or continue their education. Given current workforce demands in healthcare, IT, manufacturing, construction and service industries, the 90% target should be achievable.
69.7% 69.0% 68.6% 67.9% 70.0%
85.7% 85.1% 85.3% 85.9%90.0%
Working/schoolin 2013
Working/schoolin 2014
Working/schoolin 2015
Working/schoolin 2016
Baseline
2020Target
Bachelor's Degree Associate Degree
*Data from 2016-17 are still being validated by the campuses.
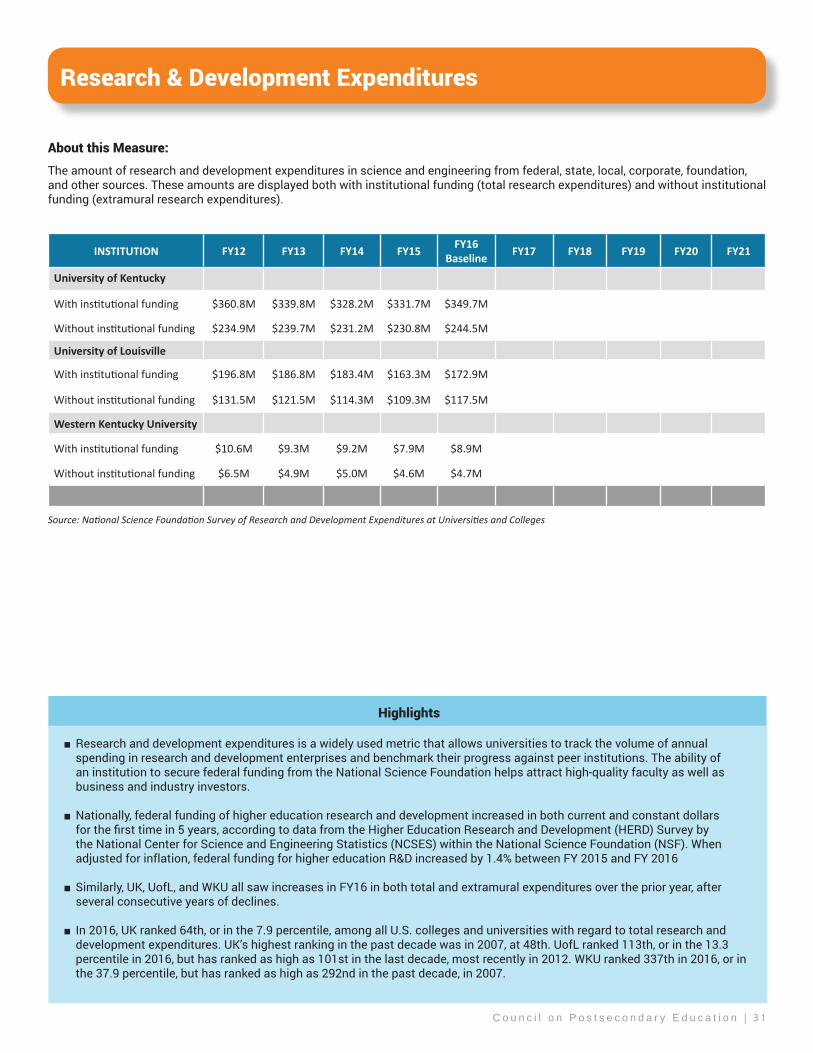
C o u n c i l o n P o s t s e c o n d a r y E d u c a t i o n | 3 1
Research & Development Expenditures
INSTITUTION FY12 FY13 FY14 FY15 FY16Baseline FY17 FY18 FY19 FY20 FY21
University of Kentucky
With institutional funding $360.8M $339.8M $328.2M $331.7M $349.7M
Without institutional funding $234.9M $239.7M $231.2M $230.8M $244.5M
University of Louisville
With institutional funding $196.8M $186.8M $183.4M $163.3M $172.9M
Without institutional funding $131.5M $121.5M $114.3M $109.3M $117.5M
Western Kentucky University
With institutional funding $10.6M $9.3M $9.2M $7.9M $8.9M
Without institutional funding $6.5M $4.9M $5.0M $4.6M $4.7M
About this Measure:
The amount of research and development expenditures in science and engineering from federal, state, local, corporate, foundation, and other sources. These amounts are displayed both with institutional funding (total research expenditures) and without institutional funding (extramural research expenditures).
Source: National Science Foundation Survey of Research and Development Expenditures at Universities and Colleges
Highlights
■ Research and development expenditures is a widely used metric that allows universities to track the volume of annual spending in research and development enterprises and benchmark their progress against peer institutions. The ability of an institution to secure federal funding from the National Science Foundation helps attract high-quality faculty as well as business and industry investors.
■ Nationally, federal funding of higher education research and development increased in both current and constant dollars for the first time in 5 years, according to data from the Higher Education Research and Development (HERD) Survey by the National Center for Science and Engineering Statistics (NCSES) within the National Science Foundation (NSF). When adjusted for inflation, federal funding for higher education R&D increased by 1.4% between FY 2015 and FY 2016
■ Similarly, UK, UofL, and WKU all saw increases in FY16 in both total and extramural expenditures over the prior year, after several consecutive years of declines.
■ In 2016, UK ranked 64th, or in the 7.9 percentile, among all U.S. colleges and universities with regard to total research and development expenditures. UK’s highest ranking in the past decade was in 2007, at 48th. UofL ranked 113th, or in the 13.3 percentile in 2016, but has ranked as high as 101st in the last decade, most recently in 2012. WKU ranked 337th in 2016, or in the 37.9 percentile, but has ranked as high as 292nd in the past decade, in 2007.

C o u n c i l o n P o s t s e c o n d a r y E d u c a t i o n | 3 2
STRONGERby degrees
APPENDICES
C o u n c i l o n P o s t s e c o n d a r y E d u c a t i o n | 3 3
Appendix 1: Statewide Diversity Plan
The Council on Postsecondary Education has a rich history of promoting diversity and inclusion at Kentucky’s public postsecondary institutions. In 1982, the Commonwealth of Kentucky Higher Education Desegregation Plan was first developed in response to a U.S. Department of Education’s Office for Civil Rights (OCR) finding that Kentucky had “failed to eliminate the vestiges of its former de jure racially dual system of public higher education.” For the next 25 plus years, CPE focused the desegregation plan and subsequent revisions on increasing the enrollment and success of African-American students, increasing the number of African-American employees on campus, and enhancing Kentucky State University, with later versions also focusing on improving campus climate. To provide oversight on plan implementation and prioritize diversity initiatives, CPE created the Committee on Equal Opportunities (CEO).
In December of 2008, the OCR released Kentucky from the remedial planning process, but CPE continued its efforts to promote equity and close achievement gaps. A new diversity policy was adopted on September 23, 2016, called the Kentucky Public Postsecondary Education Policy for Diversity, Equity and Inclusion. This statewide policy is grounded on the premise that to truly prepare students for life and work in an increasingly diverse society, the public postsecondary institutions within the Commonwealth must embrace diversity and equity within constitutional and legal parameters, commit to improving academic achievement of all students, create an inclusive campus environment, and produce culturally competent graduates for the workforce.
The policy directs campuses to develop diversity plans focused on the three priority areas of the statewide strategic agenda: Opportunity, Success, and Impact. These are the metrics for which campuses establish performance targets.
OPPORTUNITY
■ Undergraduate Enrollment. The percentage of total undergradate enrollment that is African American or Black, Hispanic or Latino, and part of an underrepresented minority propulation. URM students include American Indian or Alaskan natives, native Hawaiian or other Pacific Islanders, and students identifying as two or more races.
■ Graduate and Professional Enrollment. The percentage of total graduate enrollment that is part of an underrepresented minority population. This metric does not apply to KCTCS.
SUCCESS
■ First-year to Second-Year Retention. The percentage of first-time, underrepresented minority and low-income students seeking a credential or degree who are still enrolled at the same institution the following fall. Low-income students are defined as federal Pell grant recipients.
■ Graduation Rates. The percentage of first-time, full-time underrepresented minority and low-income students seeking a credential or degree who obtain a degree from the same institution within 150% of the normal time frame (three years for associate degree programs and six years for bachelor’s degree programs).
■ Degrees and Credentials. The number of degrees and credentials awarded to underrepresented minority and low-income students.
IMPACT
■ Faculty/Tenure Track Employees. The percentage of full-time faculty/tenure track employees who are from an underrepresented minority group, including those who identify as two or more races. For KCTCS, this metric includes instructional staff.
■ Management Occupations. The percentage of employees holding managerial or administrative positions who are from an underrepresented minority group, including those who identify as two or more races.
For an institution to remain eligible to offer new academic programs per KRS 164.020(20), it must demonstrate progress toward meeting goals and provide evidence that identified strategies are being implemented with fidelity. If institutions are not making satisfactory progress, they must submit a peformance improvement plan. Once approved, an institution may request a waiver to offer a new academic program if the institution can provide sufficient assurance that offering the new program will not divert resources from improvement efforts. The request for a waiver is submitted to the CEO for review, and then to CPE for final approval. Approval must be granted before the institution can initiate the program approval process.
The following tables display progress toward the goals campuses established through the statewide diversity planning process to improve Opportunity and Impact. The diversity metrics for Success are included on pages 18-21.
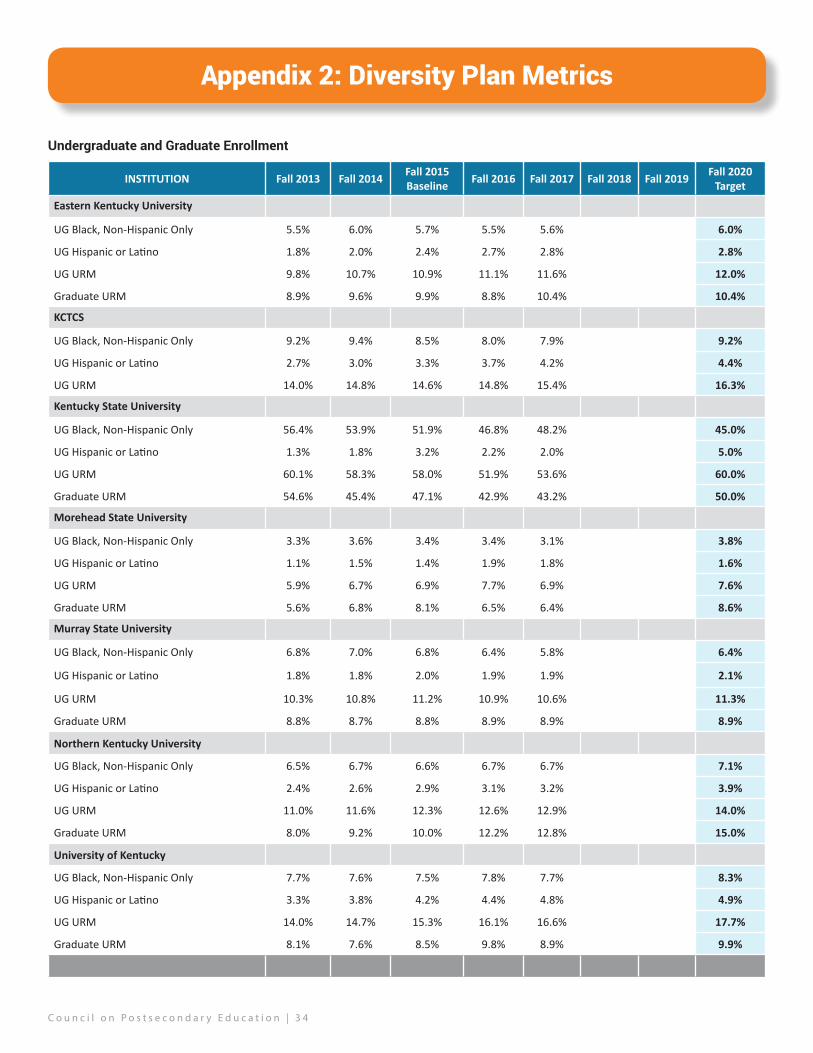
C o u n c i l o n P o s t s e c o n d a r y E d u c a t i o n | 3 4
Appendix 2: Diversity Plan Metrics
INSTITUTION Fall 2013 Fall 2014 Fall 2015Baseline Fall 2016 Fall 2017 Fall 2018 Fall 2019 Fall 2020
Target
Eastern Kentucky University
UG Black, Non-Hispanic Only 5.5% 6.0% 5.7% 5.5% 5.6% 6.0%
UG Hispanic or Latino 1.8% 2.0% 2.4% 2.7% 2.8% 2.8%
UG URM 9.8% 10.7% 10.9% 11.1% 11.6% 12.0%
Graduate URM 8.9% 9.6% 9.9% 8.8% 10.4% 10.4%
KCTCS
UG Black, Non-Hispanic Only 9.2% 9.4% 8.5% 8.0% 7.9% 9.2%
UG Hispanic or Latino 2.7% 3.0% 3.3% 3.7% 4.2% 4.4%
UG URM 14.0% 14.8% 14.6% 14.8% 15.4% 16.3%
Kentucky State University
UG Black, Non-Hispanic Only 56.4% 53.9% 51.9% 46.8% 48.2% 45.0%
UG Hispanic or Latino 1.3% 1.8% 3.2% 2.2% 2.0% 5.0%
UG URM 60.1% 58.3% 58.0% 51.9% 53.6% 60.0%
Graduate URM 54.6% 45.4% 47.1% 42.9% 43.2% 50.0%
Morehead State University
UG Black, Non-Hispanic Only 3.3% 3.6% 3.4% 3.4% 3.1% 3.8%
UG Hispanic or Latino 1.1% 1.5% 1.4% 1.9% 1.8% 1.6%
UG URM 5.9% 6.7% 6.9% 7.7% 6.9% 7.6%
Graduate URM 5.6% 6.8% 8.1% 6.5% 6.4% 8.6%
Murray State University
UG Black, Non-Hispanic Only 6.8% 7.0% 6.8% 6.4% 5.8% 6.4%
UG Hispanic or Latino 1.8% 1.8% 2.0% 1.9% 1.9% 2.1%
UG URM 10.3% 10.8% 11.2% 10.9% 10.6% 11.3%
Graduate URM 8.8% 8.7% 8.8% 8.9% 8.9% 8.9%
Northern Kentucky University
UG Black, Non-Hispanic Only 6.5% 6.7% 6.6% 6.7% 6.7% 7.1%
UG Hispanic or Latino 2.4% 2.6% 2.9% 3.1% 3.2% 3.9%
UG URM 11.0% 11.6% 12.3% 12.6% 12.9% 14.0%
Graduate URM 8.0% 9.2% 10.0% 12.2% 12.8% 15.0%
University of Kentucky
UG Black, Non-Hispanic Only 7.7% 7.6% 7.5% 7.8% 7.7% 8.3%
UG Hispanic or Latino 3.3% 3.8% 4.2% 4.4% 4.8% 4.9%
UG URM 14.0% 14.7% 15.3% 16.1% 16.6% 17.7%
Graduate URM 8.1% 7.6% 8.5% 9.8% 8.9% 9.9%
Undergraduate and Graduate Enrollment
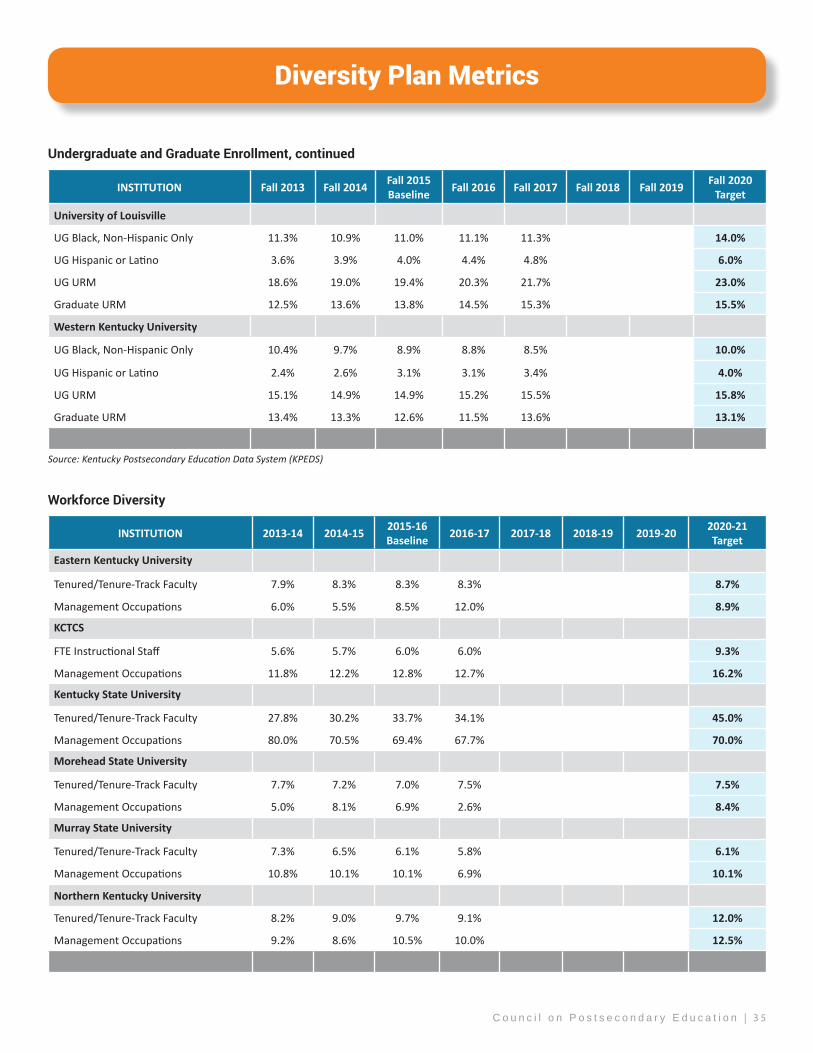
C o u n c i l o n P o s t s e c o n d a r y E d u c a t i o n | 3 5
Diversity Plan Metrics
INSTITUTION Fall 2013 Fall 2014 Fall 2015Baseline Fall 2016 Fall 2017 Fall 2018 Fall 2019 Fall 2020
Target
University of Louisville
UG Black, Non-Hispanic Only 11.3% 10.9% 11.0% 11.1% 11.3% 14.0%
UG Hispanic or Latino 3.6% 3.9% 4.0% 4.4% 4.8% 6.0%
UG URM 18.6% 19.0% 19.4% 20.3% 21.7% 23.0%
Graduate URM 12.5% 13.6% 13.8% 14.5% 15.3% 15.5%
Western Kentucky University
UG Black, Non-Hispanic Only 10.4% 9.7% 8.9% 8.8% 8.5% 10.0%
UG Hispanic or Latino 2.4% 2.6% 3.1% 3.1% 3.4% 4.0%
UG URM 15.1% 14.9% 14.9% 15.2% 15.5% 15.8%
Graduate URM 13.4% 13.3% 12.6% 11.5% 13.6% 13.1%
INSTITUTION 2013-14 2014-15 2015-16Baseline 2016-17 2017-18 2018-19 2019-20 2020-21
Target
Eastern Kentucky University
Tenured/Tenure-Track Faculty 7.9% 8.3% 8.3% 8.3% 8.7%
Management Occupations 6.0% 5.5% 8.5% 12.0% 8.9%
KCTCS
FTE Instructional Staff 5.6% 5.7% 6.0% 6.0% 9.3%
Management Occupations 11.8% 12.2% 12.8% 12.7% 16.2%
Kentucky State University
Tenured/Tenure-Track Faculty 27.8% 30.2% 33.7% 34.1% 45.0%
Management Occupations 80.0% 70.5% 69.4% 67.7% 70.0%
Morehead State University
Tenured/Tenure-Track Faculty 7.7% 7.2% 7.0% 7.5% 7.5%
Management Occupations 5.0% 8.1% 6.9% 2.6% 8.4%
Murray State University
Tenured/Tenure-Track Faculty 7.3% 6.5% 6.1% 5.8% 6.1%
Management Occupations 10.8% 10.1% 10.1% 6.9% 10.1%
Northern Kentucky University
Tenured/Tenure-Track Faculty 8.2% 9.0% 9.7% 9.1% 12.0%
Management Occupations 9.2% 8.6% 10.5% 10.0% 12.5%
Undergraduate and Graduate Enrollment, continued
Workforce Diversity
Source: Kentucky Postsecondary Education Data System (KPEDS)
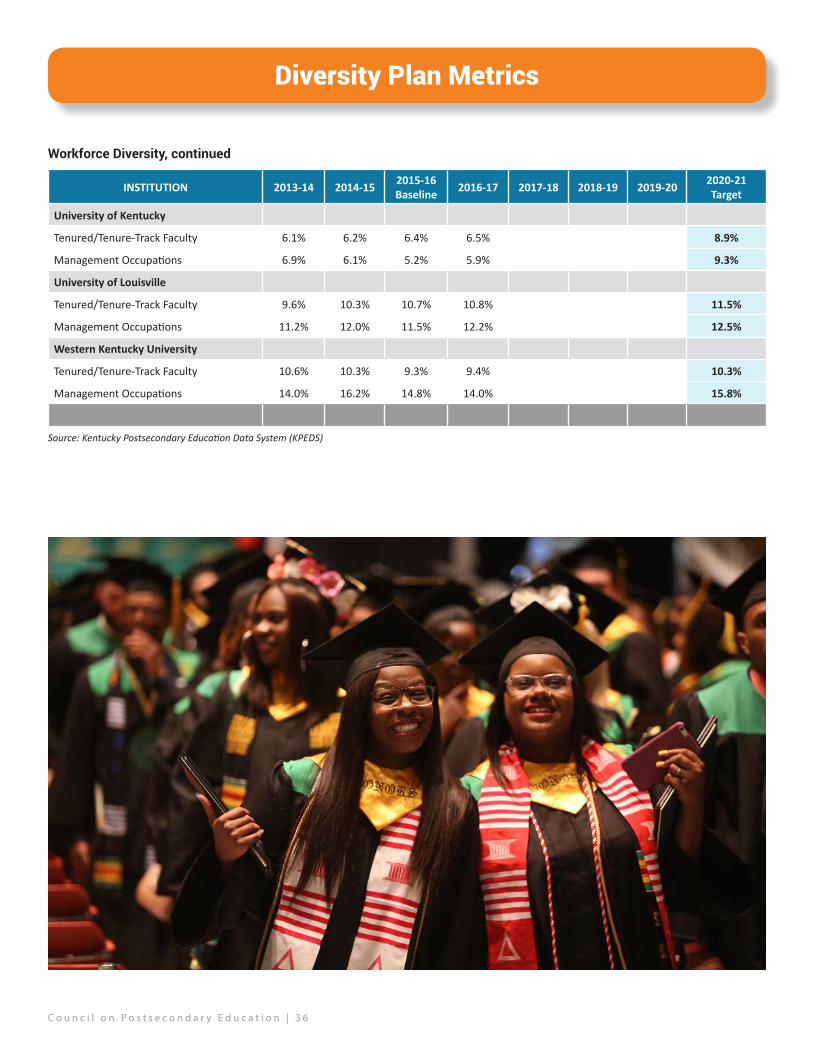
C o u n c i l o n P o s t s e c o n d a r y E d u c a t i o n | 3 6
Diversity Plan Metrics
INSTITUTION 2013-14 2014-15 2015-16Baseline 2016-17 2017-18 2018-19 2019-20 2020-21
Target
University of Kentucky
Tenured/Tenure-Track Faculty 6.1% 6.2% 6.4% 6.5% 8.9%
Management Occupations 6.9% 6.1% 5.2% 5.9% 9.3%
University of Louisville
Tenured/Tenure-Track Faculty 9.6% 10.3% 10.7% 10.8% 11.5%
Management Occupations 11.2% 12.0% 11.5% 12.2% 12.5%
Western Kentucky University
Tenured/Tenure-Track Faculty 10.6% 10.3% 9.3% 9.4% 10.3%
Management Occupations 14.0% 16.2% 14.8% 14.0% 15.8%
Workforce Diversity, continued
Source: Kentucky Postsecondary Education Data System (KPEDS)

C o u n c i l o n P o s t s e c o n d a r y E d u c a t i o n | 3 7
Appendix 3: Performance Funding
In 2017, Governor Bevin signed into law Senate Bill 153, which established a new funding model based on institutional performance (70%), campus enrollment (10%), instructional and student services spending (10%), and facilities costs (10%). Overall, there is some alignment between the student success metrics in the model and the strategic agenda metrics in this report. The model will be used to distribute state General Fund appropropriations to institutions, net of mandated programs and a small-school adjustment, and will be phased in gradually, beginning in FY 2018.
10% Institutional Support Based on each institution’s share of sector total instructional and student services spending.
10% Enrollment SupportBased on each institution’s share of sector total full-time enrollment.
10% Maintenance and OperationsBased on each institution’s share of square footage dedicated to student learning.
35% Student SuccessKCTCS UNIVERSITIES-Credentials awarded -BA/BS degrees -Credentials in STEM+H, awarded high-demand & -Degrees per 100 targeted fields FTE students-Credentials by URM, -BA/BS degrees in low-income & STEM+H fields underprepared -BA/BS by URM students & low-income -Progression students (@ 15, 30, 45 hrs.) -Progression -Transfers (@ 30, 60, 90 hrs.)
35% Course CompletionBased on each institution’s share of sector total student credit hours earned, weighted to account for cost differences by degree level and academic discipline.
First Year (2017-18): Distributes $42.9M in the postsecondary education performance fund. These funds will be distributed according to the model (Kentucky State University was exempted from the model in the first year).
Second Year (2018-19): The funding model will be applied to the full amount of allocable resources, but a hold- harmless provision will prevent the transfer of any funds among institutions.
Third Year (2019-20): The third year includes a 1% stop-loss provision, meaning that campuses compete for funding but can lose no more than 1% of base funding.
Fourth Year (2020-21): The fourth year includes a 2% stop-loss provision, meaning that campuses compete for funding but can lose no more than 2% of base funding.
1.
2.
3.
4.5. Moving forward: The hold-harmless and stop-loss provisions will sunset, allowing 100% of allocable resources to
be distributed according to the model. The Performance Funding Working Group will assess the model at the end of year three and report findings to the Governor and legislature, which could make adjustments.
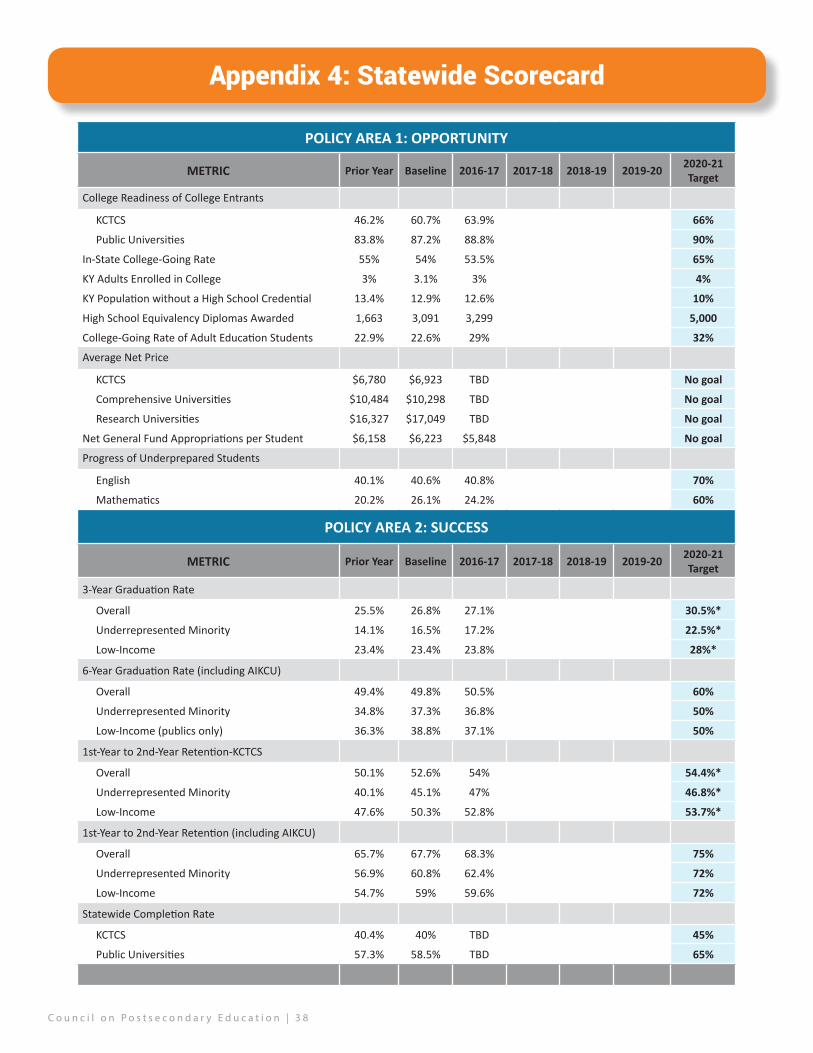
C o u n c i l o n P o s t s e c o n d a r y E d u c a t i o n | 3 8
POLICY AREA 1: OPPORTUNITY
METRIC Prior Year Baseline 2016-17 2017-18 2018-19 2019-20 2020-21 Target
College Readiness of College Entrants
KCTCS 46.2% 60.7% 63.9% 66%
Public Universities 83.8% 87.2% 88.8% 90%
In-State College-Going Rate 55% 54% 53.5% 65%
KY Adults Enrolled in College 3% 3.1% 3% 4%
KY Population without a High School Credential 13.4% 12.9% 12.6% 10%
High School Equivalency Diplomas Awarded 1,663 3,091 3,299 5,000
College-Going Rate of Adult Education Students 22.9% 22.6% 29% 32%
Average Net Price
KCTCS $6,780 $6,923 TBD No goal
Comprehensive Universities $10,484 $10,298 TBD No goal
Research Universities $16,327 $17,049 TBD No goal
Net General Fund Appropriations per Student $6,158 $6,223 $5,848 No goal
Progress of Underprepared Students
English 40.1% 40.6% 40.8% 70%
Mathematics 20.2% 26.1% 24.2% 60%
POLICY AREA 2: SUCCESS
METRIC Prior Year Baseline 2016-17 2017-18 2018-19 2019-20 2020-21 Target
3-Year Graduation Rate
Overall 25.5% 26.8% 27.1% 30.5%*
Underrepresented Minority 14.1% 16.5% 17.2% 22.5%*
Low-Income 23.4% 23.4% 23.8% 28%*
6-Year Graduation Rate (including AIKCU)
Overall 49.4% 49.8% 50.5% 60%
Underrepresented Minority 34.8% 37.3% 36.8% 50%
Low-Income (publics only) 36.3% 38.8% 37.1% 50%
1st-Year to 2nd-Year Retention-KCTCS
Overall 50.1% 52.6% 54% 54.4%*
Underrepresented Minority 40.1% 45.1% 47% 46.8%*
Low-Income 47.6% 50.3% 52.8% 53.7%*
1st-Year to 2nd-Year Retention (including AIKCU)
Overall 65.7% 67.7% 68.3% 75%
Underrepresented Minority 56.9% 60.8% 62.4% 72%
Low-Income 54.7% 59% 59.6% 72%
Statewide Completion Rate
KCTCS 40.4% 40% TBD 45%
Public Universities 57.3% 58.5% TBD 65%
Appendix 4: Statewide Scorecard
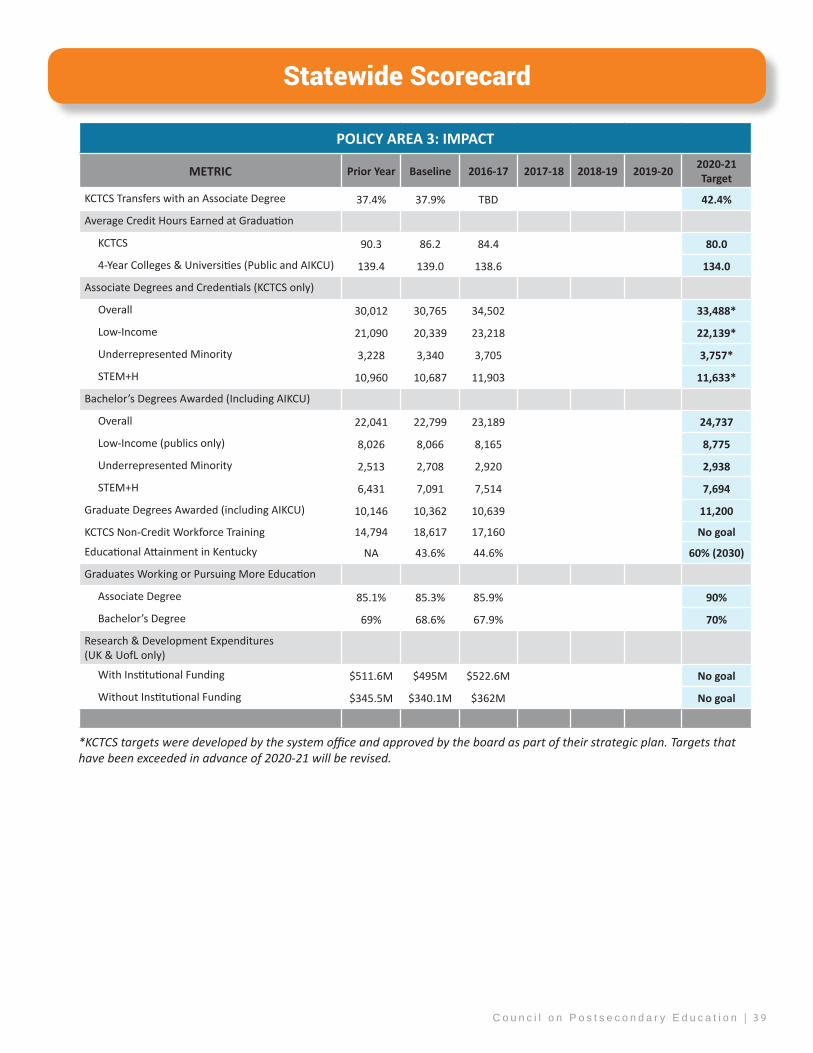
C o u n c i l o n P o s t s e c o n d a r y E d u c a t i o n | 3 9
POLICY AREA 3: IMPACT
METRIC Prior Year Baseline 2016-17 2017-18 2018-19 2019-20 2020-21 Target
KCTCS Transfers with an Associate Degree 37.4% 37.9% TBD 42.4%
Average Credit Hours Earned at Graduation
KCTCS 90.3 86.2 84.4 80.0
4-Year Colleges & Universities (Public and AIKCU) 139.4 139.0 138.6 134.0
Associate Degrees and Credentials (KCTCS only)
Overall 30,012 30,765 34,502 33,488*
Low-Income 21,090 20,339 23,218 22,139*
Underrepresented Minority 3,228 3,340 3,705 3,757*
STEM+H 10,960 10,687 11,903 11,633*
Bachelor’s Degrees Awarded (Including AIKCU)
Overall 22,041 22,799 23,189 24,737
Low-Income (publics only) 8,026 8,066 8,165 8,775
Underrepresented Minority 2,513 2,708 2,920 2,938
STEM+H 6,431 7,091 7,514 7,694
Graduate Degrees Awarded (including AIKCU) 10,146 10,362 10,639 11,200
KCTCS Non-Credit Workforce Training 14,794 18,617 17,160 No goal
Educational Attainment in Kentucky NA 43.6% 44.6% 60% (2030)
Graduates Working or Pursuing More Education
Associate Degree 85.1% 85.3% 85.9% 90%
Bachelor’s Degree 69% 68.6% 67.9% 70%
Research & Development Expenditures (UK & UofL only)
With Institutional Funding $511.6M $495M $522.6M No goal
Without Institutional Funding $345.5M $340.1M $362M No goal
Statewide Scorecard
*KCTCS targets were developed by the system office and approved by the board as part of their strategic plan. Targets that have been exceeded in advance of 2020-21 will be revised.
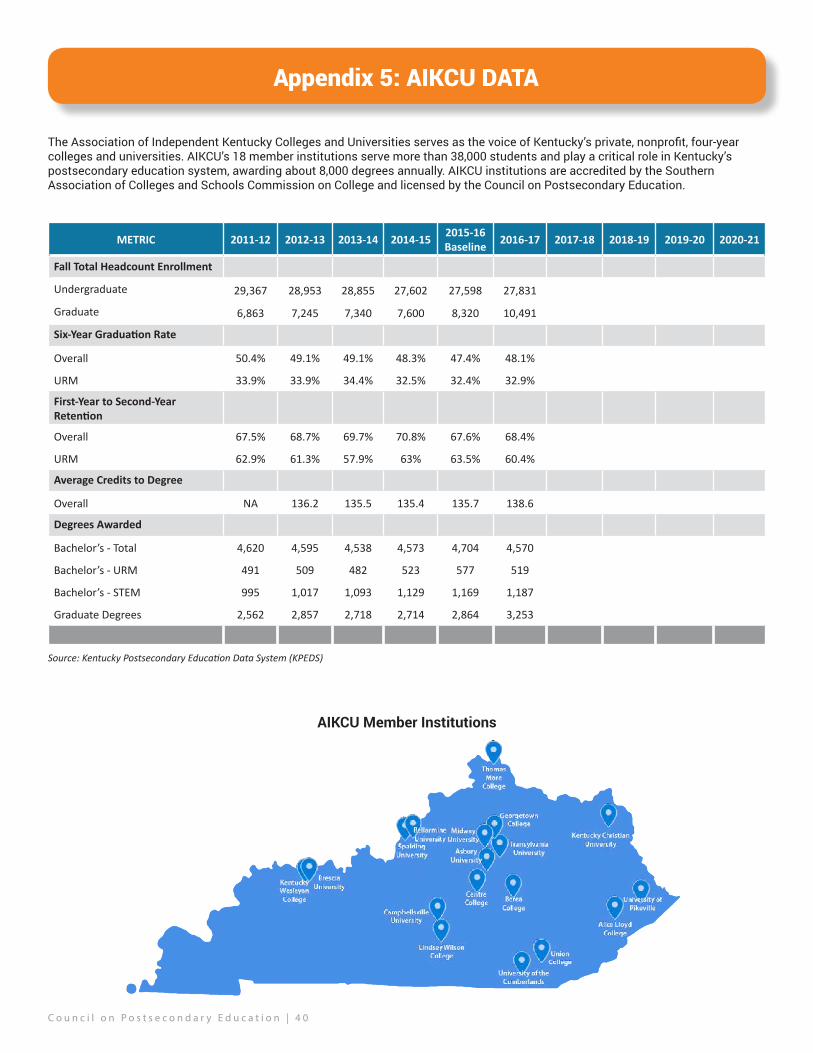
C o u n c i l o n P o s t s e c o n d a r y E d u c a t i o n | 4 0
Appendix 5: AIKCU DATA
METRIC 2011-12 2012-13 2013-14 2014-15 2015-16Baseline 2016-17 2017-18 2018-19 2019-20 2020-21
Fall Total Headcount Enrollment
Undergraduate 29,367 28,953 28,855 27,602 27,598 27,831
Graduate 6,863 7,245 7,340 7,600 8,320 10,491
Six-Year Graduation Rate
Overall 50.4% 49.1% 49.1% 48.3% 47.4% 48.1%
URM 33.9% 33.9% 34.4% 32.5% 32.4% 32.9%
First-Year to Second-Year Retention
Overall 67.5% 68.7% 69.7% 70.8% 67.6% 68.4%
URM 62.9% 61.3% 57.9% 63% 63.5% 60.4%
Average Credits to Degree
Overall NA 136.2 135.5 135.4 135.7 138.6
Degrees Awarded
Bachelor’s - Total 4,620 4,595 4,538 4,573 4,704 4,570
Bachelor’s - URM 491 509 482 523 577 519
Bachelor’s - STEM 995 1,017 1,093 1,129 1,169 1,187
Graduate Degrees 2,562 2,857 2,718 2,714 2,864 3,253
Source: Kentucky Postsecondary Education Data System (KPEDS)
The Association of Independent Kentucky Colleges and Universities serves as the voice of Kentucky’s private, nonprofit, four-year colleges and universities. AIKCU’s 18 member institutions serve more than 38,000 students and play a critical role in Kentucky’s postsecondary education system, awarding about 8,000 degrees annually. AIKCU institutions are accredited by the Southern Association of Colleges and Schools Commission on College and licensed by the Council on Postsecondary Education.
AIKCU Member Institutions
C o u n c i l o n P o s t s e c o n d a r y E d u c a t i o n | 4 1
STRONGERby degrees
Members of the Council on Postsecondary Education(as of April 2018)
Sherrill B. Zimmerman, ChairBen Brandstetter, Vice Chair
Ronald C. BealJoe E. Ellis
Kimberly A. HalbauerLaura R. Harper
Lucas V. MentzerDonna MooreKristi Nelson
Joseph P. PapaliaVidya RavichandranShawn L. Reynolds
Robert H. Staat (faculty representative)Sebastian Torres (student representative)
Carol WrightWayne D. Lewis (ex officio member)
C o u n c i l o n P o s t s e c o n d a r y E d u c a t i o n | 4 2
1024 Capital Center Drive, Suite 320Frankfort, KY 40601Ph: (502) 573-1555
cpe.ky.gov
Printed with state funds. Some photography provided by Kentucky colleges and universities.
The Council does not discriminate on the basis of race, color, national origin, sex, religion, age, or disability in employment or the provision of services, and provides, upon request, reasonable accommodation, including auxiliary aids and services necessary
to afford individuals with disabilities an equal opportunity to participate in all programs and activities.


