The Value of Professional Services 2018 FALL 2018 PEG | 39 SALARY SURVEY INDUSTRY CATEGORIES This report covers nine industry categories: • Engineering and/or Geoscience Consulting Services • Engineering, Procurement, and Construction • Resource Exploitation (except oil and gas) • Resource Exploitation (oil and gas only) • Manufacturing (durables) • Manufacturing (non-durables) • Not-For-Profit Service, Control, and Utilities • For-Profit Service, Control, and Utilities • Information and Other Advanced Technologies For good reason, the Value of Professional Services is among APEGA’s most sought-after publications. A compilation and analysis of data collected during our annual salary survey, it offers APEGA members and permit holders unbiased salary and benefits comparisons across a wide range of industries in Alberta. Welcome to our summary version of this invaluable resource. APEGA encourages you to use it, along with any other available information, to ensure fair compensation. Early in April we contacted permit holders to encourage participation. We engaged the services of Aon to administer and conduct the salary and benefits survey, and also to compile the resulting data for publication. The more employers participate and the more em- ployment positions are represented, the better the data. We are therefore pleased with the level of per- mit holder participation this year, which is up five per cent from 2017. Individual data points have increased, too. We know from experience how popular and useful the Value of Professional Services is, and we appreciate the effort permit holders make each spring to complete the survey. Without your help, this service would not be possible. Please feel free to contact APEGA with your com- ments: Mohamed El Daly Director of Outreach & Product Services 1-800-661-7020 [email protected].
Transcript
The Value of Professional Services 2018
FALL 2018 PEG | 39
SALARY SURVEY
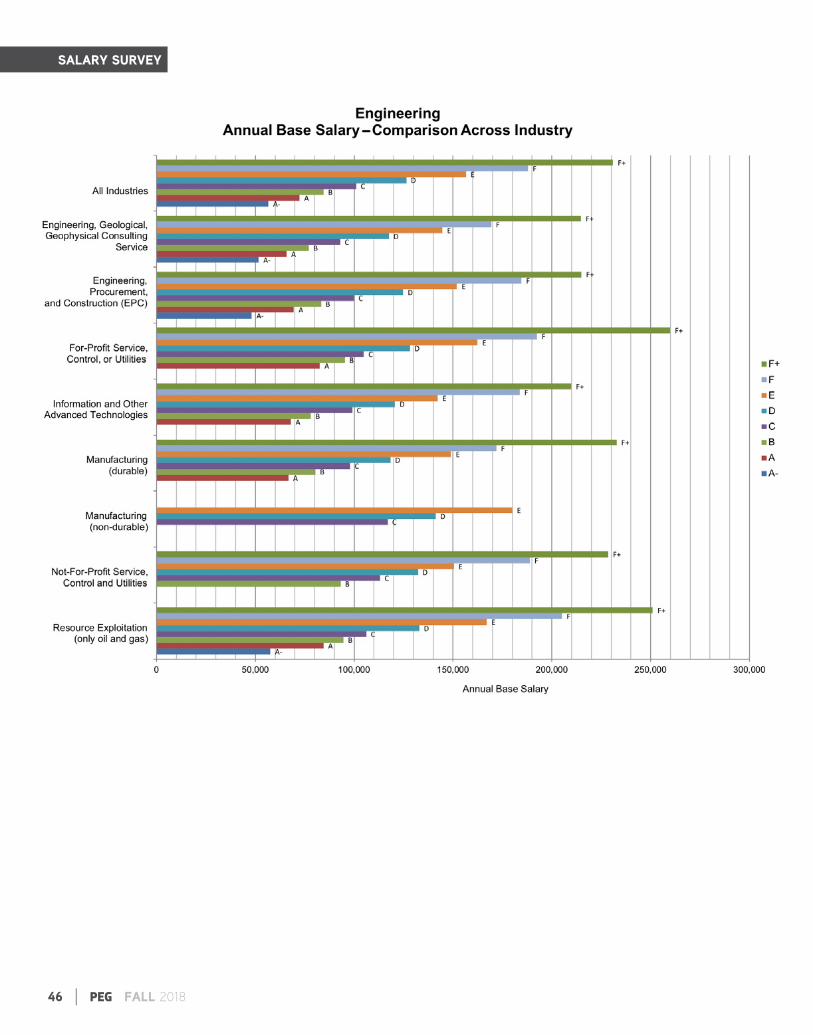
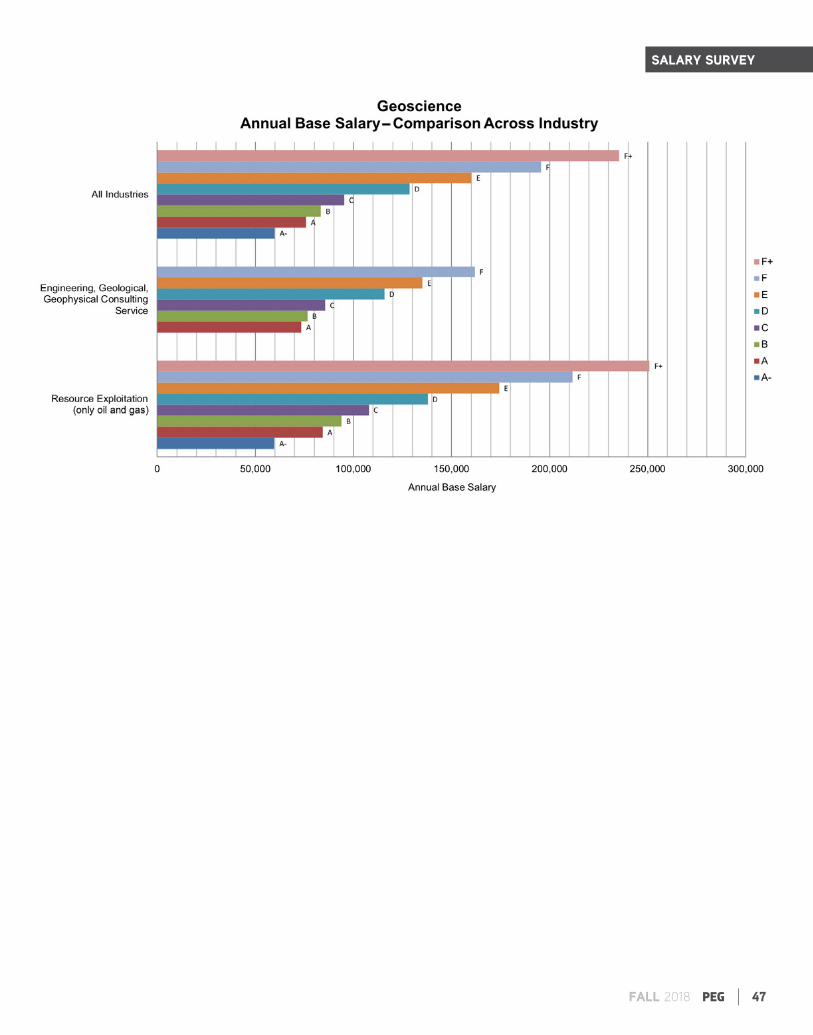
INDUSTRY CATEGORIESThis report covers nine industry categories:
For good reason, the Value of Professional Services is among APEGA’s most sought-after publications. A compilation and analysis of data collected during our annual salary survey, it offers APEGA members and permit holders unbiased salary and benefits comparisons across a wide range of industries in Alberta.
Welcome to our summary version of this invaluable resource. APEGA encourages you to use it, along with any other available information, to ensure fair compensation.
Early in April we contacted permit holders to encourage participation. We engaged the services of Aon to administer and conduct the salary and benefits survey, and also to compile the resulting data for publication.
The more employers participate and the more em-ployment positions are represented, the better the data.
We are therefore pleased with the level of per-mit holder participation this year, which is up five per cent from 2017. Individual data points have increased, too.
We know from experience how popular and useful the Value of Professional Services is, and we appreciate the effort permit holders make each spring to complete the survey. Without your help, this service would not be possible.
Please feel free to contact APEGA with your com-ments:
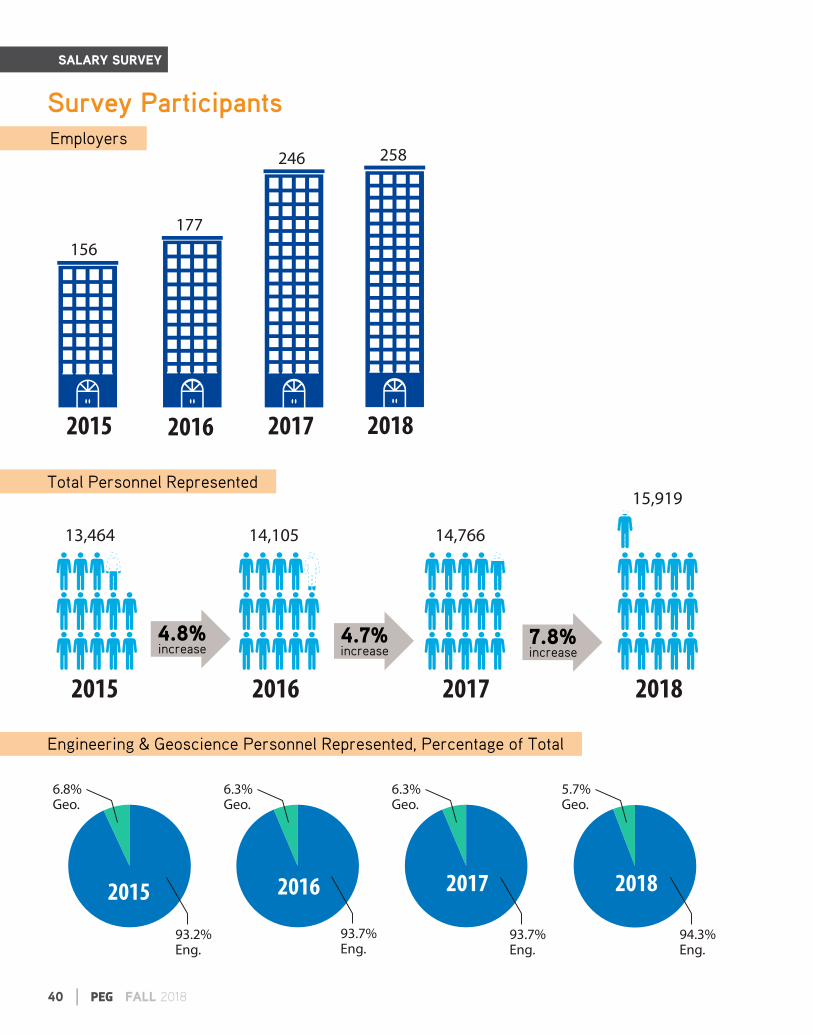
Engineering & Geoscience Personnel Represented, Percentage of Total
40 | PEG FALL 2018
Employers
4.8% increase
4.7% increase
SALARY SURVEY
7.8% increase
FALL 2018 PEG | 41
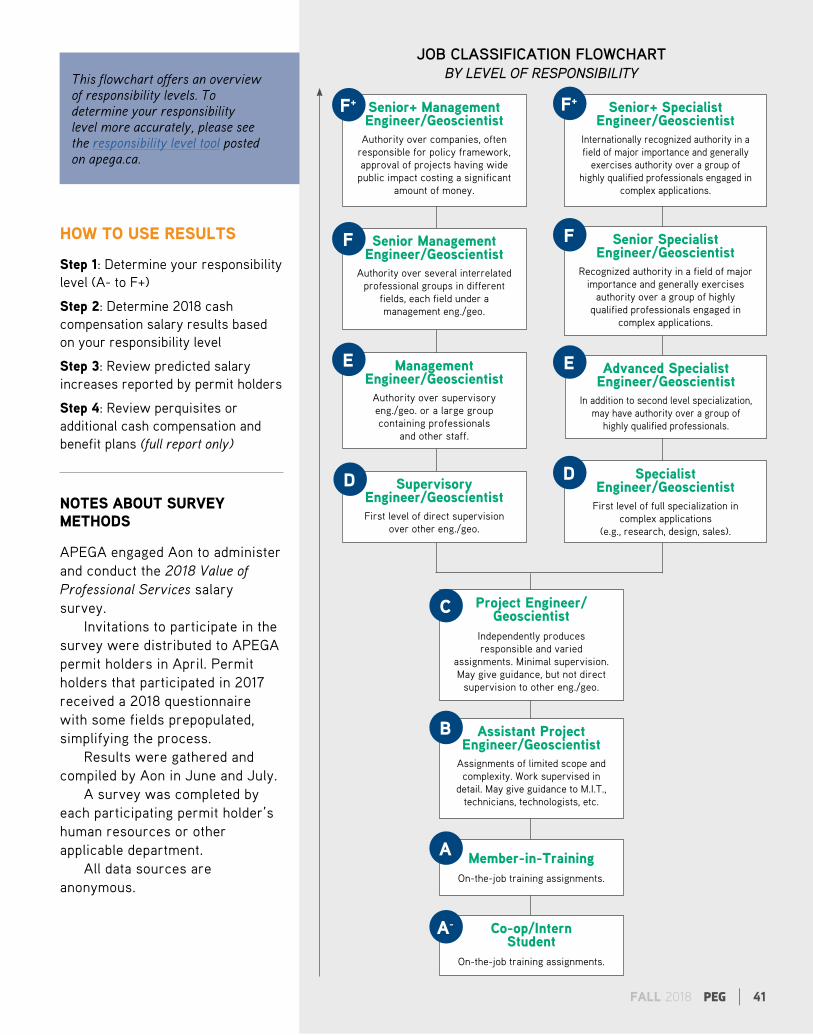
Senior+ Management Engineer/Geoscientist
Authority over companies, often responsible for policy framework, approval of projects having wide
public impact costing a significant amount of money.
Senior Management Engineer/Geoscientist
Authority over several interrelated professional groups in different
fields, each field under a management eng./geo.
Management Engineer/Geoscientist
Authority over supervisory eng./geo. or a large group containing professionals
and other staff.
Supervisory Engineer/GeoscientistFirst level of direct supervision
over other eng./geo.
Project Engineer/ Geoscientist
Independently produces responsible and varied
assignments. Minimal supervision. May give guidance, but not direct
supervision to other eng./geo.
Assistant Project Engineer/Geoscientist
Assignments of limited scope and complexity. Work supervised in
detail. May give guidance to M.I.T., technicians, technologists, etc.
Member-in-TrainingOn-the-job training assignments.
Co-op/Intern Student
On-the-job training assignments.
Senior+ Specialist Engineer/Geoscientist
Internationally recognized authority in a field of major importance and generally
exercises authority over a group of highly qualified professionals engaged in
complex applications.
Senior Specialist Engineer/Geoscientist
Recognized authority in a field of major importance and generally exercises
authority over a group of highly qualified professionals engaged in
complex applications.
Advanced Specialist Engineer/Geoscientist
In addition to second level specialization, may have authority over a group of
highly qualified professionals.
Specialist Engineer/Geoscientist
First level of full specialization in complex applications
(e.g., research, design, sales).
JOB CLASSIFICATION FLOWCHARTBY LEVEL OF RESPONSIBILITY
F+
F
E
D
C
B
A
A-
F
E
D
F+
HOW TO USE RESULTS
Step 1: Determine your responsibility level (A- to F+)
Step 2: Determine 2018 cash compensation salary results based on your responsibility level
Step 3: Review predicted salary increases reported by permit holders
Step 4: Review perquisites or additional cash compensation and benefit plans (full report only)
NOTES ABOUT SURVEY METHODS
APEGA engaged Aon to administer and conduct the 2018 Value of Professional Services salary survey.
Invitations to participate in the survey were distributed to APEGA permit holders in April. Permit holders that participated in 2017 received a 2018 questionnaire with some fields prepopulated, simplifying the process.
Results were gathered and compiled by Aon in June and July.
A survey was completed by each participating permit holder’s human resources or other applicable department.
All data sources are anonymous.
This flowchart offers an overview of responsibility levels. To determine your responsibility level more accurately, please see the responsibility level tool posted on apega.ca.
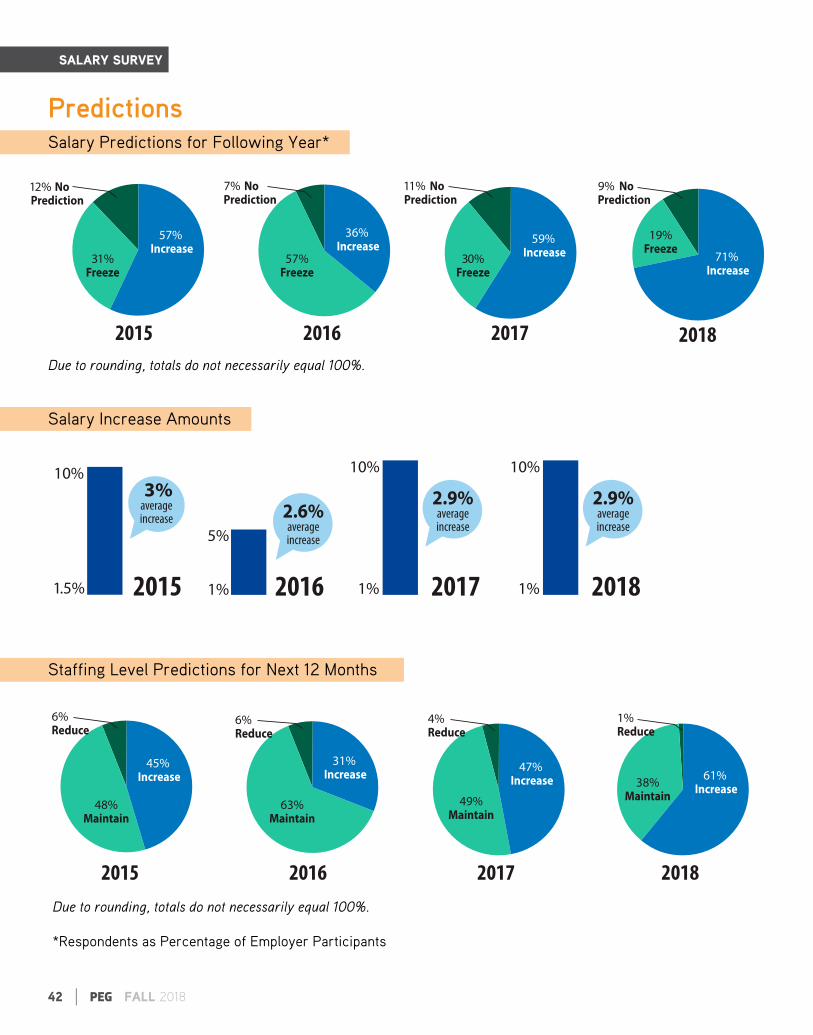
*Respondents as Percentage of Employer Participants
PredictionsSalary Predictions for Following Year*
Salary Increase Amounts
Staffing Level Predictions for Next 12 Months
Due to rounding, totals do not necessarily equal 100%.
SALARY SURVEY
Due to rounding, totals do not necessarily equal 100%.
FALL 2018 PEG | 43
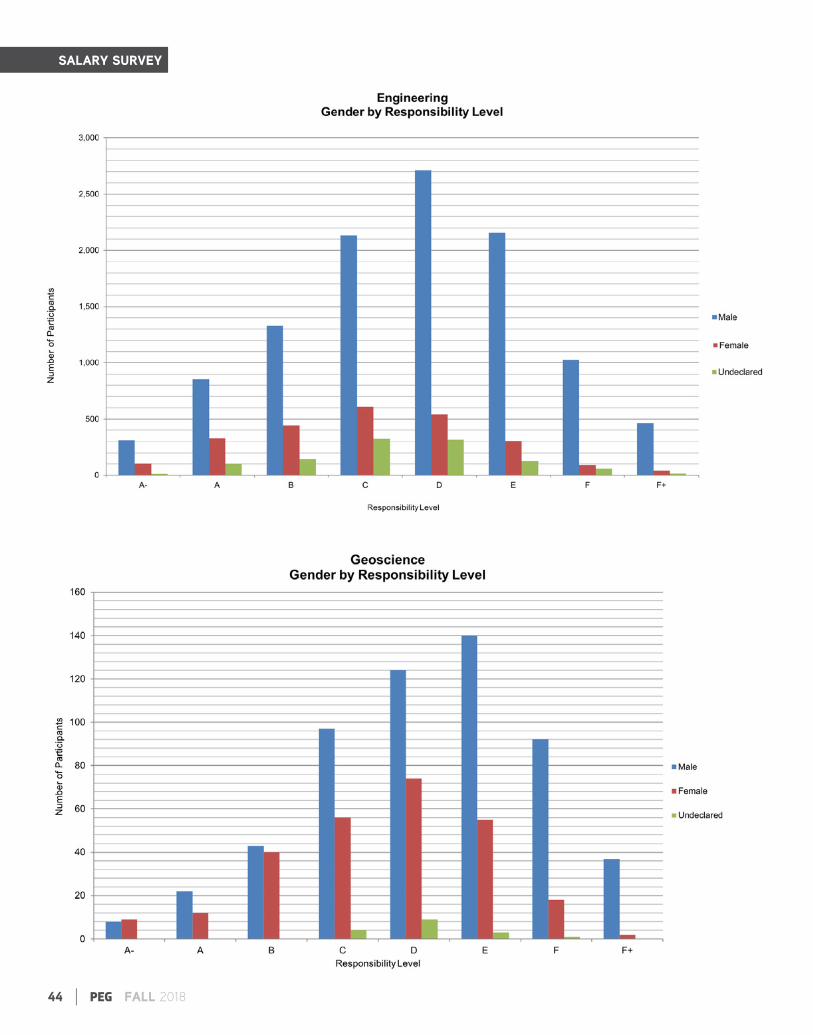
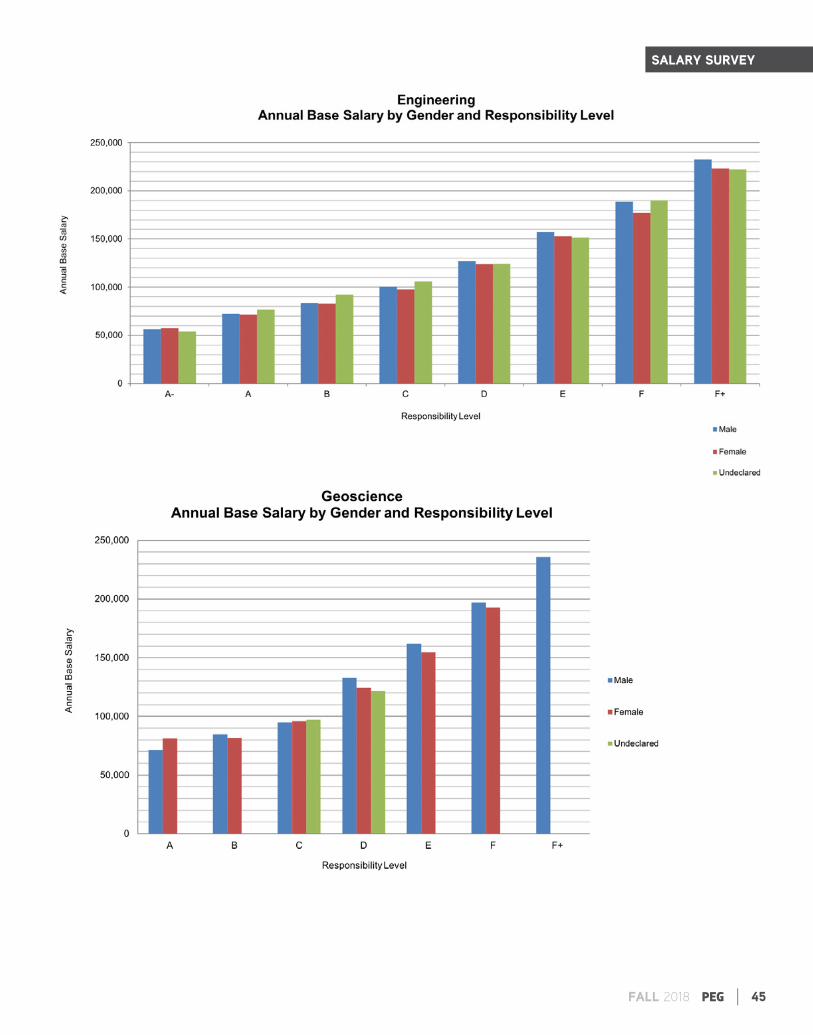
GENDER PROGRESS
Females in geoscience represent more than 33 per cent of the total geoscience sample. Results show that salaries for female geoscientists are nearly equal to those of their male counterparts (99 per cent).
Engineering base salary results show a difference of 2.4 per cent between male and female average base salaries in 2018.
ALBERTA RECOVERY BEGINS
After the recent provincial recession, the economy has improved and stabilized in Alberta. Jobs are up, the deficit is down, and Alberta’s economy is growing faster than anywhere in Canada, says the Province of Alberta’s 2018 Fiscal Plan. Recovery is expected to remain moderate. The outlook presents several factors that continue to support economic growth in the province, such as continued capital spending on infrastructure by the public sector.
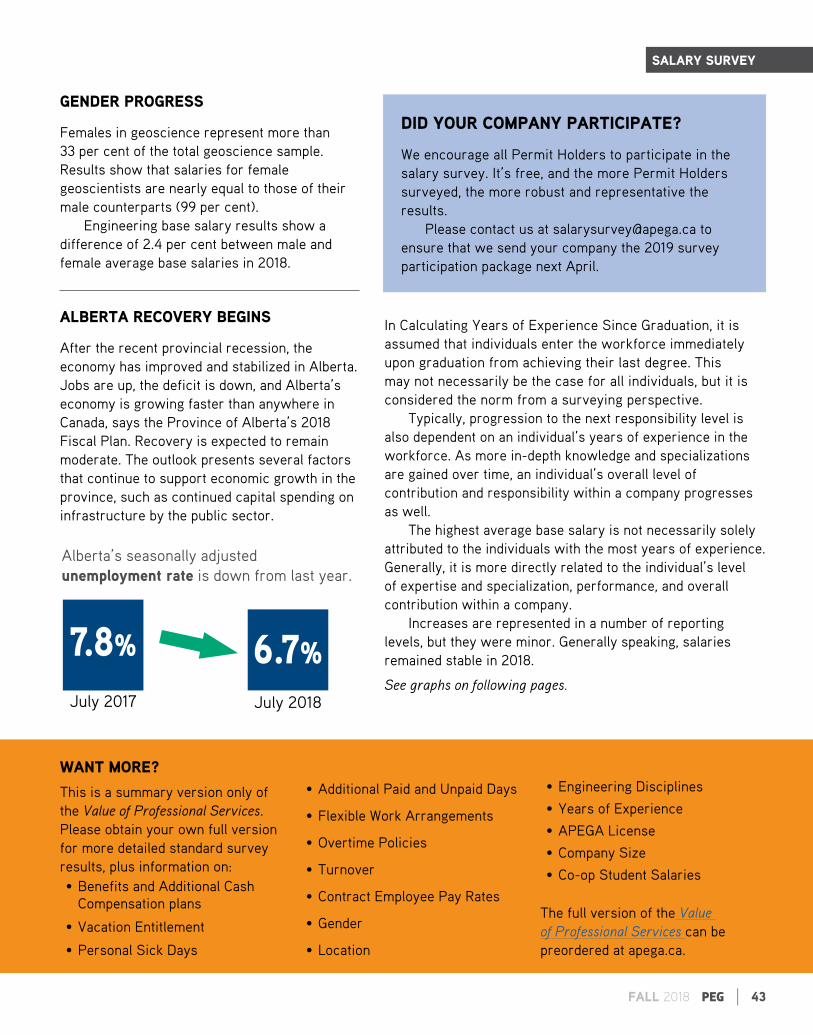
7.8%
July 2017
6.7%July 2018
DID YOUR COMPANY PARTICIPATE?
We encourage all Permit Holders to participate in the salary survey. It’s free, and the more Permit Holders surveyed, the more robust and representative the results.
Please contact us at [email protected] to ensure that we send your company the 2019 survey participation package next April.
Alberta’s seasonally adjusted unemployment rate is down from last year.
SALARY SURVEY
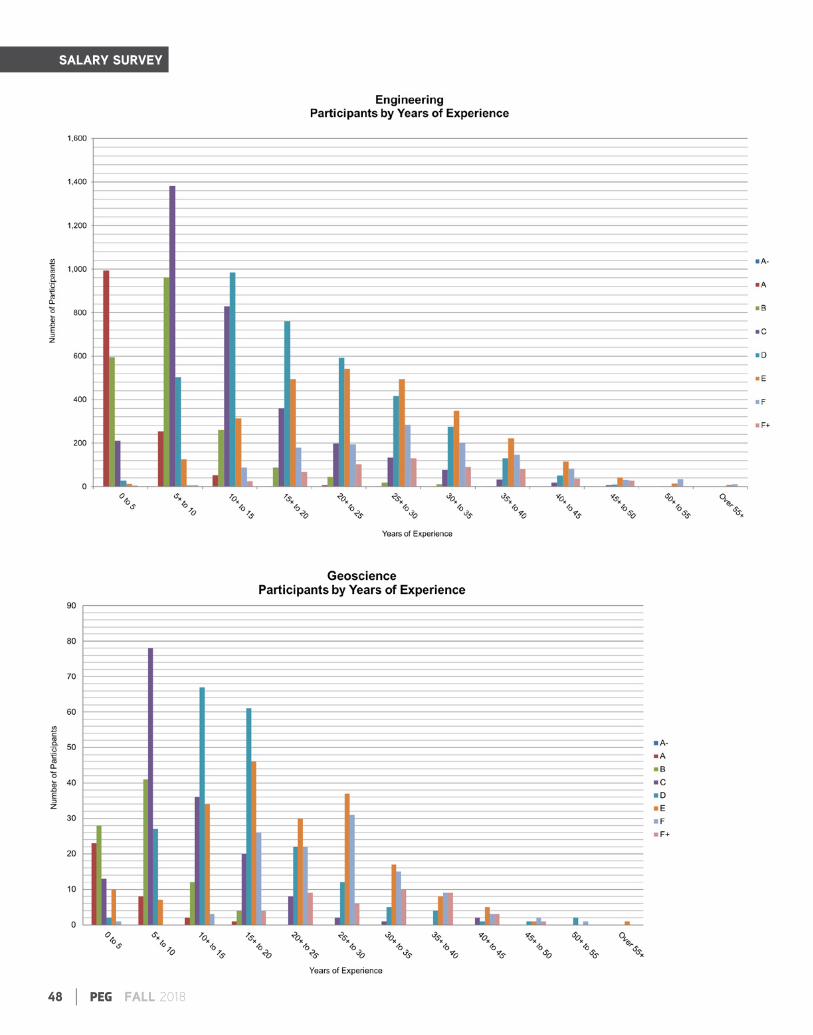
In Calculating Years of Experience Since Graduation, it is assumed that individuals enter the workforce immediately upon graduation from achieving their last degree. This may not necessarily be the case for all individuals, but it is considered the norm from a surveying perspective.
Typically, progression to the next responsibility level is also dependent on an individual’s years of experience in the workforce. As more in-depth knowledge and specializations are gained over time, an individual’s overall level of contribution and responsibility within a company progresses as well.
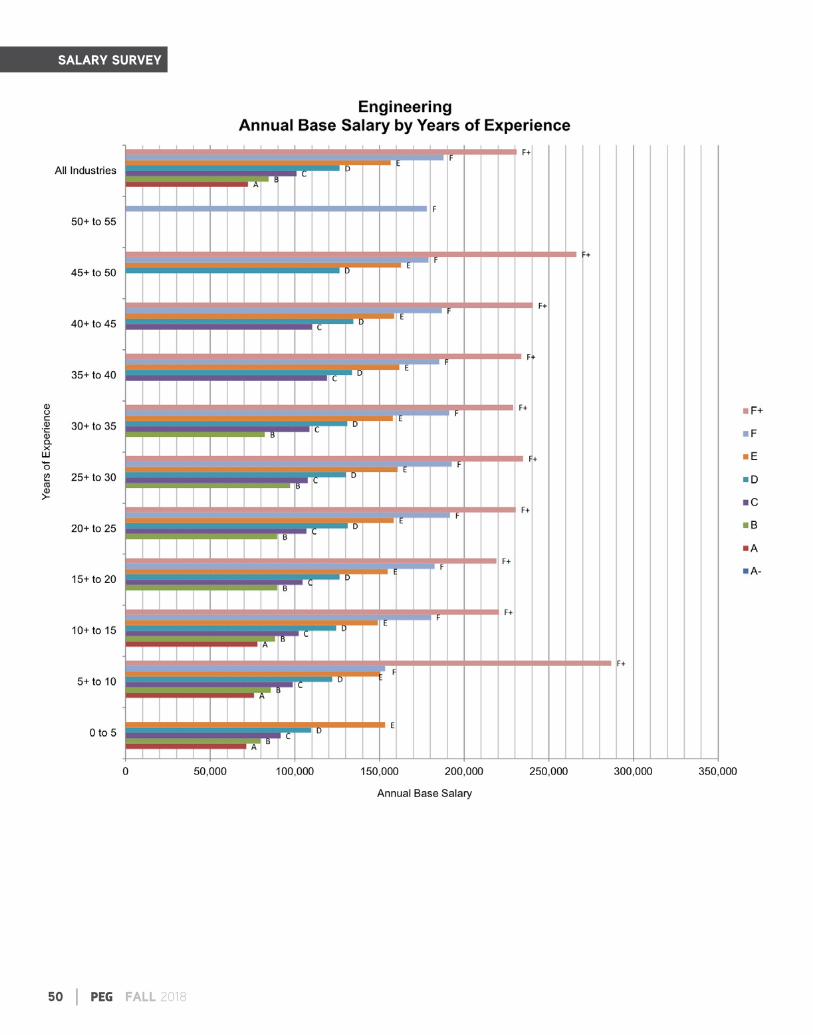
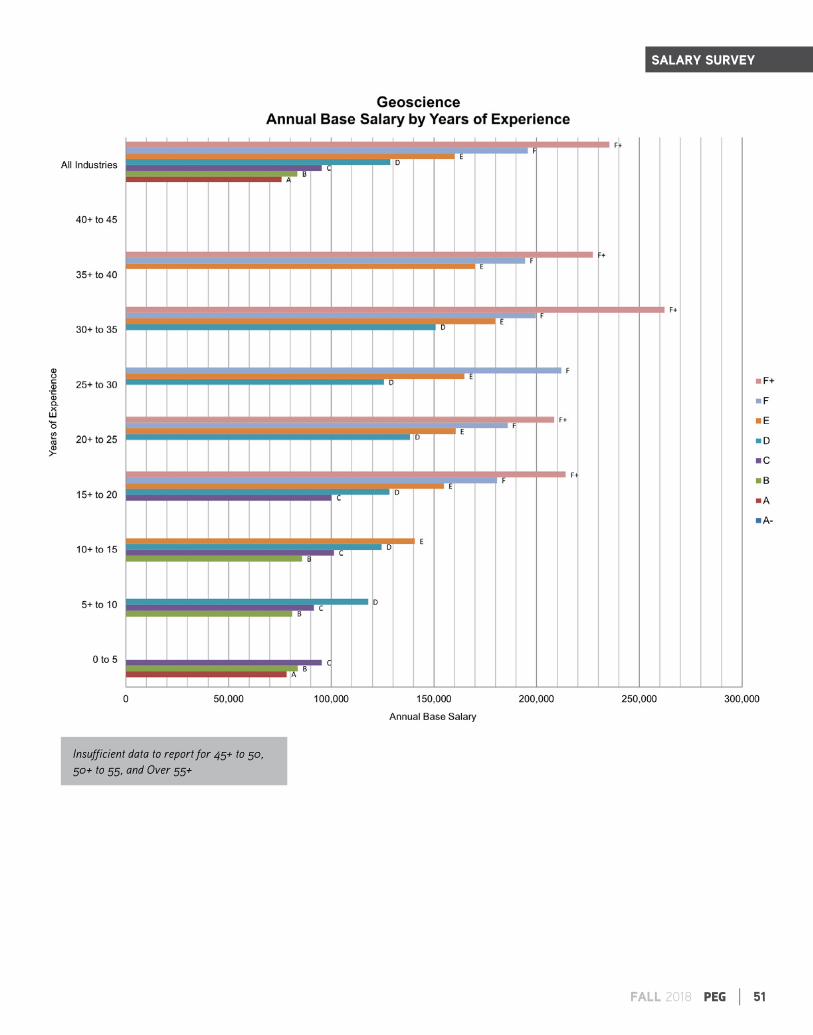
The highest average base salary is not necessarily solely attributed to the individuals with the most years of experience. Generally, it is more directly related to the individual’s level of expertise and specialization, performance, and overall contribution within a company.
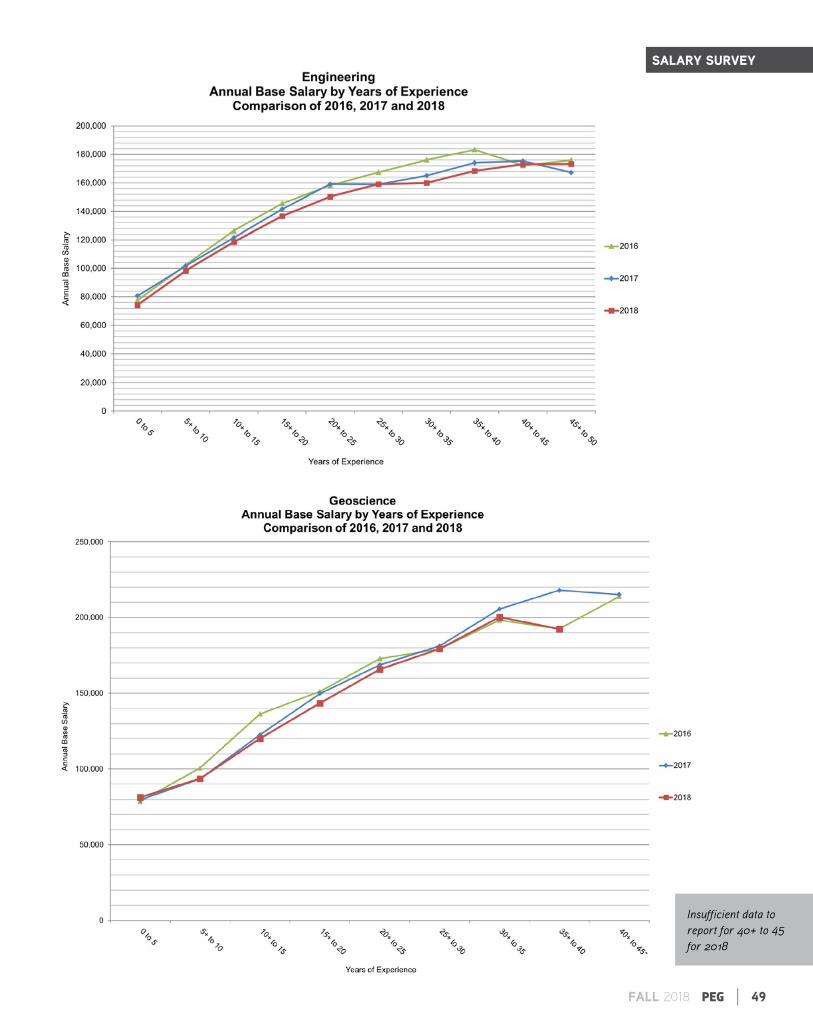
Increases are represented in a number of reporting levels, but they were minor. Generally speaking, salaries remained stable in 2018.
See graphs on following pages.
WANT MORE?
This is a summary version only of the Value of Professional Services. Please obtain your own full version for more detailed standard survey results, plus information on: • Benefits and Additional Cash
Compensation plans
• Vacation Entitlement
• Personal Sick Days
• Additional Paid and Unpaid Days
• Flexible Work Arrangements
• Overtime Policies
• Turnover
• Contract Employee Pay Rates
• Gender
• Location
• Engineering Disciplines
• Years of Experience
• APEGA License
• Company Size
• Co-op Student Salaries
The full version of the Value of Professional Services can be preordered at apega.ca.
Insufficient data to report for 40+ to 45 for 2018
50 | PEG FALL 2018
SALARY SURVEY
FALL 2018 PEG | 51
SALARY SURVEY
Insufficient data to report for 45+ to 50, 50+ to 55, and Over 55+
52 | PEG FALL 2018
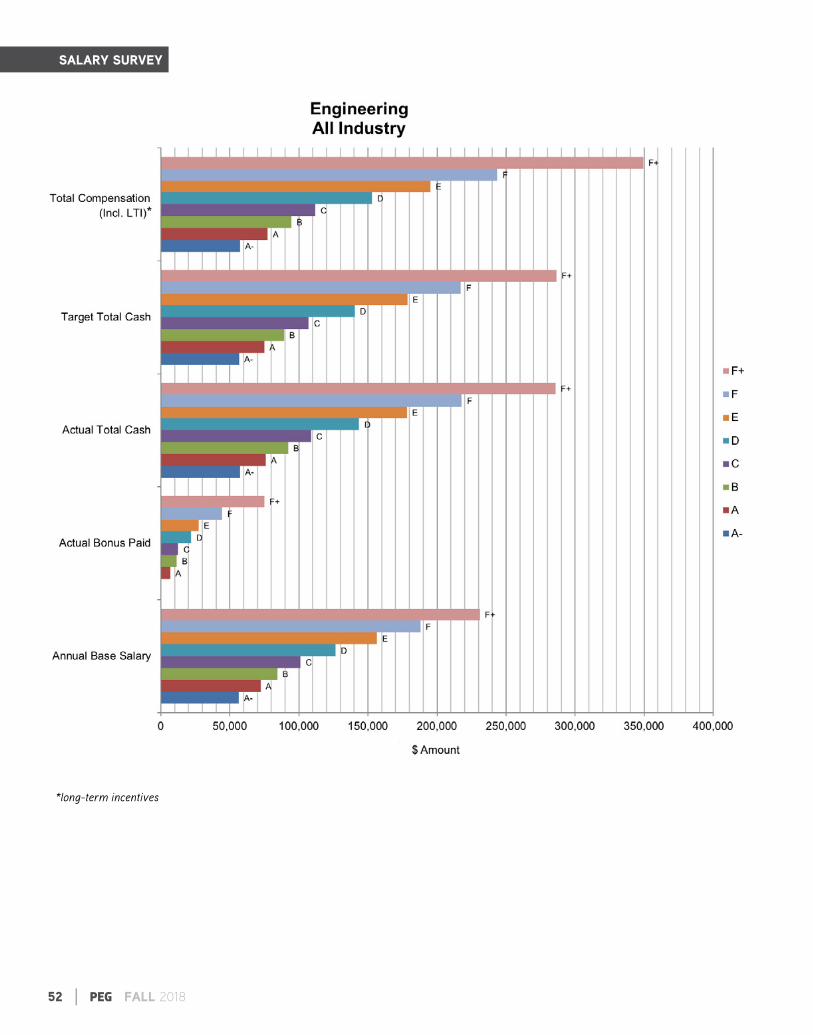
SALARY SURVEY
*long-term incentives
FALL 2018 PEG | 53
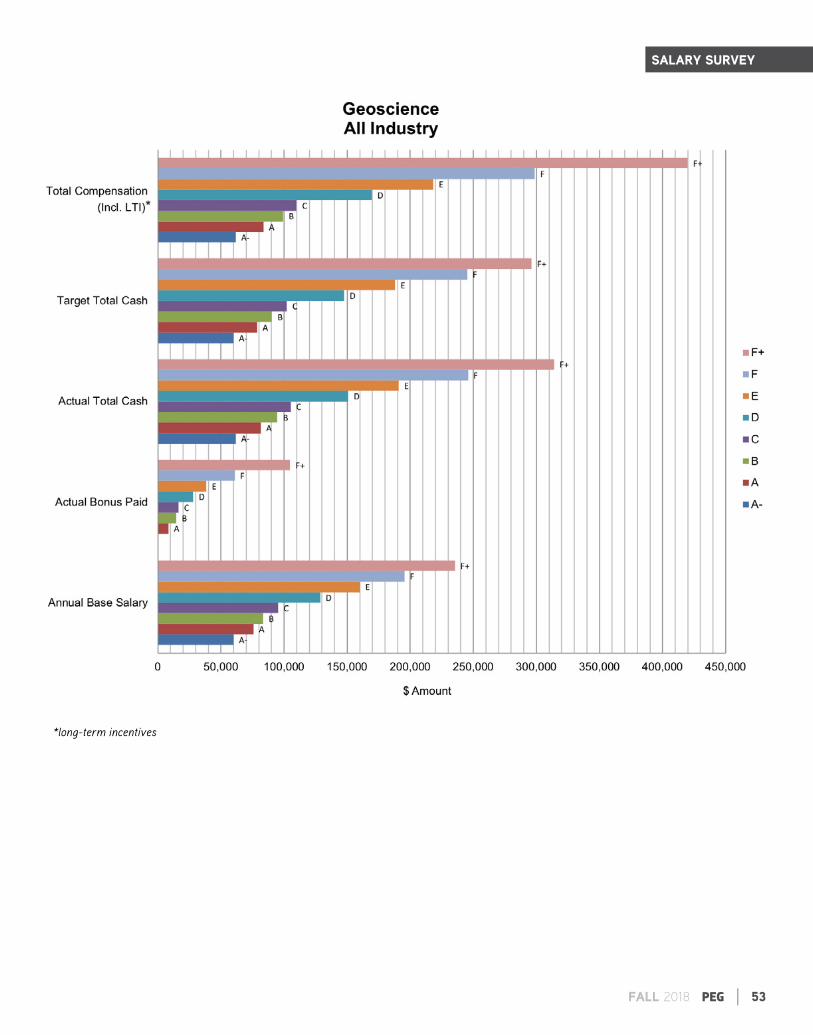
SALARY SURVEY
*long-term incentives
54 | PEG FALL 2018
SALARY SURVEY
FALL 2018 PEG | 55
SALARY SURVEY
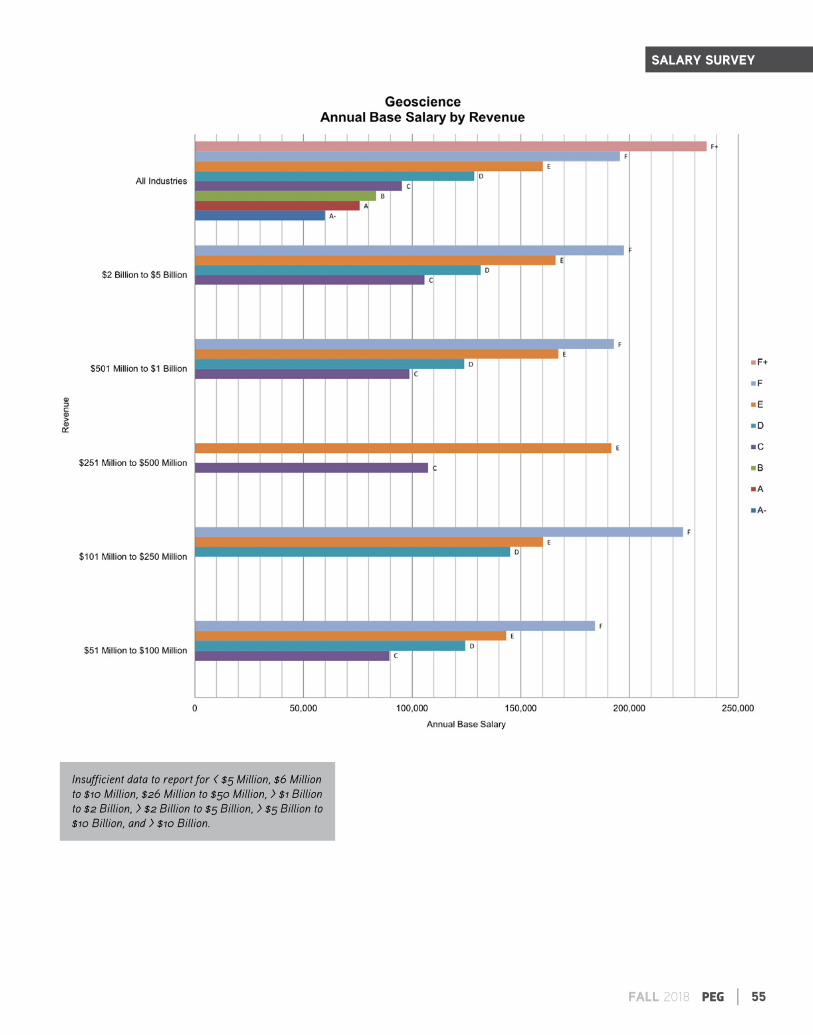
Insufficient data to report for < $5 Million, $6 Million to $10 Million, $26 Million to $50 Million, > $1 Billion to $2 Billion, > $2 Billion to $5 Billion, > $5 Billion to $10 Billion, and > $10 Billion.