2017-18 School Accountability Report Card for Burbank High School Page 1 of 18 Burbank High School School Accountability Report Card Reported Using Data from the 2017-18 School Year Published During 2018-19 By February 1 of each year, every school in California is required by state law to publish a School Accountability Report Card (SARC). The SARC contains information about the condition and performance of each California public school. Under the Local Control Funding Formula (LCFF) all local educational agencies (LEAs) are required to prepare a Local Control and Accountability Plan (LCAP), which describes how they intend to meet annual school-specific goals for all pupils, with specific activities to address state and local priorities. Additionally, data reported in an LCAP is to be consistent with data reported in the SARC. • For more information about SARC requirements, see the California Department of Education (CDE) SARC Web page at http://www.cde.ca.gov/ta/ac/sa/. • For more information about the LCFF or LCAP, see the CDE LCFF Web page at http://www.cde.ca.gov/fg/aa/lc/. • For additional information about the school, parents/guardians and community members should contact the school principal or the district office. DataQuest DataQuest is an online data tool located on the CDE DataQuest Web page at http://dq.cde.ca.gov/dataquest/ that contains additional information about this school and comparisons of the school to the district and the county. Specifically, DataQuest is a dynamic system that provides reports for accountability (e.g., test data, enrollment, high school graduates, dropouts, course enrollments, staffing, and data regarding English learners). Internet Access Internet access is available at public libraries and other locations that are publicly accessible (e.g., the California State Library). Access to the Internet at libraries and public locations is generally provided on a first-come, first-served basis. Other use restrictions may include the hours of operation, the length of time that a workstation may be used (depending on availability), the types of software programs available on a workstation, and the ability to print documents. About This School Contact Information (School Year 2018-19) School Contact Information School Name------- Burbank High School Street------- 902 North Third Street City, State, Zip------- Burbank, CA 91502-1018 Phone Number------- 818-558-4700 Principal------- Michael Bertram E-mail Address------- [email protected]Web Site------- www.burbankusd.org CDS Code 19-64337-1931187
Transcript
2017-18 School Accountability Report Card for Burbank High School Page 1 of 18
Burbank High School
School Accountability Report Card
Reported Using Data from the 2017-18 School Year
Published During 2018-19
By February 1 of each year, every school in California is required by state law to publish a School Accountability Report Card (SARC). The SARC contains information about the condition and performance of each California public school. Under the Local Control Funding Formula (LCFF) all local educational agencies (LEAs) are required to prepare a Local Control and Accountability Plan (LCAP), which describes how they intend to meet annual school-specific goals for all pupils, with specific activities to address state and local priorities. Additionally, data reported in an LCAP is to be consistent with data reported in the SARC. • For more information about SARC requirements, see the California Department of Education (CDE) SARC Web page at
http://www.cde.ca.gov/ta/ac/sa/. • For more information about the LCFF or LCAP, see the CDE LCFF Web page at http://www.cde.ca.gov/fg/aa/lc/. • For additional information about the school, parents/guardians and community members should contact the school principal or
the district office. DataQuest DataQuest is an online data tool located on the CDE DataQuest Web page at http://dq.cde.ca.gov/dataquest/ that contains additional information about this school and comparisons of the school to the district and the county. Specifically, DataQuest is a dynamic system that provides reports for accountability (e.g., test data, enrollment, high school graduates, dropouts, course enrollments, staffing, and data regarding English learners). Internet Access Internet access is available at public libraries and other locations that are publicly accessible (e.g., the California State Library). Access to the Internet at libraries and public locations is generally provided on a first-come, first-served basis. Other use restrictions may include the hours of operation, the length of time that a workstation may be used (depending on availability), the types of software programs available on a workstation, and the ability to print documents.
About This School Contact Information (School Year 2018-19)
School Description and Mission Statement (School Year 2018-19)
Burbank High is one of two comprehensive high schools in the Burbank Unified School District. The growing cultural and linguistic diversity of the school mirrors the demographic changes occurring in our community. The seven goals include:
1. Improve teaching and learning strategies and techniques. (Example: SADAIE, teaming, collaboration, critical thinking, problem solving, alternative assessment, senior project.)
2. Restructure the delivery of curriculum (school day, teaching techniques, academies, school to work, career paths, vocational
education, senior internships, clusters, 9th/10th teams, common release or prep time, integrated and interdisciplinary classes).
3. Utilize technology in teaching the CORE curriculum.
4. Effectively prepare 9th grade students for success in high school.
5. Focus on citizenship and respect for others (common standards-school wide and between departments, raise
attendance/grade rates).
6. Develop and sustain effective communication with staff, students, parents, and community.
7. Provide for more parent involvement. Burbank High School Mission Statement: The Burbank High School community supports and promotes an environment where students experience a challenging, rigorous, and meaningful curriculum; value academies and learning to respect themselves and others; and develop lifelong learning skills in order to become responsible, productive citizens in a diverse, changing society. Student Enrollment by Grade Level (School Year 2017-18)
Grade Number of
Level Students
Grade 9 664
Grade 10 683
Grade 11 619
Grade 12 588
Total Enrollment 2,554
2017-18 School Accountability Report Card for Burbank High School Page 3 of 18
Student Enrollment by Group (School Year 2017-18)
Student Percent of
Group Total Enrollment
Black or African American 3.0
American Indian or Alaska Native 0.1
Asian 5.4
Filipino 4.0
Hispanic or Latino 26.8
Native Hawaiian or Pacific Islander 0.1
White 56.5
Socioeconomically Disadvantaged 41.9
English Learners 7.3
Students with Disabilities 9.9
Foster Youth 0.4
A. Conditions of Learning
State Priority: Basic The SARC provides the following information relevant to the State priority: Basic (Priority 1): • Degree to which teachers are appropriately assigned and fully credentialed in the subject area and for the pupils they are teaching; • Pupils have access to standards-aligned instructional materials; and • School facilities are maintained in good repair. Teacher Credentials
Teachers School District
2016-17 2017-18 2018-19 2018-19
With Full Credential 101 109 109 705
Without Full Credential 1 0 0 0
Teaching Outside Subject Area of Competence (with full credential) 1 0 0 0
Teacher Misassignments and Vacant Teacher Positions
Indicator 2016-17 2017-18 2018-19
Misassignments of Teachers of English Learners 0 0 0
Total Teacher Misassignments * 0 0 0
Vacant Teacher Positions 0 0 0 Note: “Misassignments” refers to the number of positions filled by teachers who lack legal authorization to teach that grade level, subject area, student group, etc. * Total Teacher Misassignments includes the number of Misassignments of Teachers of English Learners. Quality, Currency, Availability of Textbooks and Instructional Materials (School Year 2018-19) Year and month in which data were collected: January 2019 This table displays information about the quality, currency, and availability of the standards-aligned textbooks and other instructional materials used at the school; whether the textbooks and instructional materials are from the most recent adoption (yes/no); and information about the school’s use of any supplemental curriculum or non-adopted textbooks or instructional materials please visit https://www.burbankusd.org/District/1187-curriculum.html
2017-18 School Accountability Report Card for Burbank High School Page 4 of 18
Subject Textbooks and Instructional Materials/
Year of Adoption
From Most Recent
Adoption?
Percent of Students Lacking Own
Assigned Copy
Reading/Language Arts English/Language Arts/High School:
Grade 9
California Collections
Houghton Mifflin Harcourt
9780544607101
2017 Edition
Adopted 3/2/2017
Grade 10
California Collections
Houghton Mifflin Harcourt
9780544607118
2017 Edition
Adopted 3/2/2017
Grade 11
California Collections
Houghton Mifflin Harcourt
9780544607125
2017 Edition
Adopted 3/2/2017
Grade 12
California Collections
Houghton Mifflin Harcourt
9780544607132
2017 Edition
Adopted 3/2/2017
Yes 0
Mathematics Mathematics/9-12
College Prep Math Math Ideals Pearson 978-0-321-361462 2008
AP Calculus Calculus, 7th Edition Houghton Mifflin Co. 978-0-618-14918-X 2002
2017-18 School Accountability Report Card for Burbank High School Page 5 of 18
Subject Textbooks and Instructional Materials/
Year of Adoption
From Most Recent
Adoption?
Percent of Students Lacking Own
Assigned Copy
978-0-13-136123-2 2010 7/1/2010
Trigonometry (Semester) Trigonometry, 1st Ed (customized) Pearson
978-0-55-877808-8 2010 7/1/
Algebra I Core Connections Algebra College Prep Math 9781603281508
2013 4/21/2016
Geometry Core Connections Geometry College Prep Math
9781603282352 2013 4/21/2016
Algebra II Core Connections Algebra 2
College Prep Math 9781603281317 2013 4/21/2016
Pre-Calculus Pre-Calculus with Trigonometry
College Prep Math 9781603282963 2013 4/21/2016
Science Science/9-12: Anatomy and Physiology Textbook Adopted for Use Beginning 2007-2008:
Hole’s Human Anatomy & Physiology, Eleventh Edition, by David N. Shier, Jackie L. Butler, and Ricki Lewis, published by The McGraw-Hill Companies, c. 2007, ISBN 0-07-325699-4.
Date of Adoption: July 5, 2007
Chemistry Textbook Adopted for Use Beginning 2007-2008:
World of Chemistry, by Zumdahl and Zumdahl, published by McDougal Littell, c. 2007. ISBN-10: 0-618-56276-1. ISBN-13: 978-0-618-56276-3
Date of Adoption: July 5, 2007
Sports Medicine Textbook Adopted for Use Beginning 2007-2008:
Fundamentals of Anatomy and Physiology, Seventh Edition, by Frederic H. Martini, published by Pearson Education, Inc., c. 2006, Student Edition ISBN 0-13-195644-2.
Date of Adoption: July 5, 2007
Chemistry: Modern Chemistry, Holt, Rinehart and Winston, c. 1999, ISBN # 0-03-051122-4
Yes 0
2017-18 School Accountability Report Card for Burbank High School Page 6 of 18
Subject Textbooks and Instructional Materials/
Year of Adoption
From Most Recent
Adoption?
Percent of Students Lacking Own
Assigned Copy
Biology: Biology, The Dynamics of Life, Glencoe McGraw Hill, c. 2000, ISBN #0-02-828242-6
AP Biology: Biology, Solomon, Berg, Martin, 5th Edition, Harcourt Brace College Publishers c. 1999, ISBN #0-03-022299-0
Physics: Holt Physics, R. A. Serway and J.S. Faughn, Holt, Rinehart and Winston, Austin Texas (c. 1999) ISBN #0-03-050597-6
AP Physics: Physics, 5th Edition, D.C. Giancoli, Prentice Hall, Upper Saddle River, New Jersey (c. 1998), ISBN #0-13-611971-9
Date of Adoption: April 19, 2001
Geo-Science:
Earth Science by Nancy E. Spaulding and Samuel N. Namowitz, McDougal Littell, c. 2003, Student Edition ISBN 0-618-11550-1.
Earth Science, by Leonard Bernstein, Martin Schachter, Alan Winkler, Stanley Wolfe, Pearson Education, Inc., publishing as Globe Fearon, c. 2003, Student Edition ISBN 0-130-23815-5. (This textbook is used for Special Education and SDAIE.)
Date of Adoption: May 6, 2004
Marine Biology/Grades 11-12
Marine Biology, fourth edition by Peter Castro and Michael E. Huber published by McGraw-Hill Higher Education, copyright 2003, Student Edition ISBN 0-07-285290-9.
A recent revision of the Marine Biology textbook was made to ISBN 0-07-285290-9 by Glencoe Publishing to include online information which requires an ISBN change. In the future, the revised ISBN is 07-07-293725-4. Date of Adoption: November 18, 2004
2017-18 School Accountability Report Card for Burbank High School Page 7 of 18
Subject Textbooks and Instructional Materials/
Year of Adoption
From Most Recent
Adoption?
Percent of Students Lacking Own
Assigned Copy
Date of Adoption: 12/19/2013
History-Social Science Social Science/Grades 10-12:
Economics Textbook Adopted for Use Beginning 2007-2008:
Principles of Economics, Fourth Edition, by N. Gregory Mankiw, published by Thomson, c. 2007, ISBN: 9780324224726.
Date of Adoption: July 19, 2007
AP Government Textbook Adopted for Use Beginning 2007-2008:
American Government, Tenth Edition, by James Q. Wilson and John J. Dilulio, Jr. , published by McDougal Littell, c. 2006, ISBN 978-0-618-56244-2.
Date of Adoption: July 5, 2007
Psychology Textbook Adopted for Use Beginning 2007-2008:
Psychology and You, Third Edition, by McMahon and Romano, published by Glencoe/McGraw Hill, ISBN 0314140905.
Date of Adoption: July 19, 2007
Sociology Textbook Adopted for Use Beginning 2007-2008:
Sociology: The Study of Human Relationships, c. 2008, published by Holt, Rinehart and Winston, ISBN 0030939542.
Date of Adoption: July 19, 2007
Tenth grade textbook: Modern World History, by Beck, Black, Kreiger, Maylor and Shabaka, c. 1999, published by McDougal Littell. ISBN: 0-395-93829-5; Eleventh grade textbook: The Americans: Reconstruction through the 20th Century, by Danzer, Alva, Krieger, Wilson and Woloch, c. 1999, published by McDougal Littell. ISBN: 0-395-89080-2 Twelfth grade government textbook: Magruder’s American Government, published by Prentice Hall. ISBN for American Government: 0-13-050016-X. Twelfth grade economics textbook: Economics Principles in Action, published by Prentice Hall/Budget Text. ISBN for Economics Principles in Action: 0-13-437329-4. Date of Adoption: June 29, 2000
Yes 0
2017-18 School Accountability Report Card for Burbank High School Page 8 of 18
Subject Textbooks and Instructional Materials/
Year of Adoption
From Most Recent
Adoption?
Percent of Students Lacking Own
Assigned Copy
AP US History American Pageant Cengage Learning 978-1-305-07591-7 2016
2016AP European History:
A History of the Modern World, Ninth Edition, by R.R. Palmer, Joel Colton, and Lloyd Kramer, published by McGraw-Hill, c. 2002, Student Edition, ISBN 0-07-231655-1. (Due to miscommunication from McGraw-Hill after Board approval, we had to purchase another ISBN as the approved ISBN textbooks were not sufficiently in stock for our needs. What we ordered was 0-07-250280-0 – identical in every way except it comes with a power package. A correcting memo is going to be sent to the Board.)
Date of Adoption: July 21, 2005
Foreign Language Foreign Language/ Grades 9-12:
Realidades, by Peggy Palo Boyles, Myriam Met, Richard S. Sayers, Carol Eubanks Wargin, Prentice Hall, c. 2004, Student Edition Level 1, ISBN 0-13-101687-3. Student Edition Level 2, ISBN 0-13-035951-3. Student Edition Level 3, ISBN 0-13-035968-8
AP Spanish Language: Triangulo, by Barbara Botski and John McMullen, Wayside Publishing, c. 2000, Student Edition ISBN 1-877653-74-8
Preparing for the Language Examination, Second Edition, by Jose M. Diaz, Margarita Leicher-Prieto, Glen J. Nadelbach, Addison-Wesley Publishing Company, Prentice Hall c. 1996, 1989, Student Text, ISBN # 0-8013-1531-X. Conexiones, Prentice Hall, c. 2002, Student Edition, ISBN 0-13-097880-9
Spanish 3rd Year, by Nassi Levy, published by AMSCO, c. 1989, Student Edition, ISBN 0-87720-537-X
Spanish for Native Speakers: Nuevas Vistas, by Jose Antonio Cerna-Bazan, Alejandro Cortazar, Maria Soledad Diaz, Jabier Elorrieta, Karin Fajardo, Salvador Fajardo, Rolando Hinojosa-Smith, Richard Lindley, Beatriz, Malo Pojman, Marcia Tugendhat, Holt, Rinehart and Winston, c. 2003, Student Edition 1, ISBN 0-03-055213-3, Student Edition 2, ISBN 0-03-052712-0
AP Spanish Literature:
Yes 0
2017-18 School Accountability Report Card for Burbank High School Page 9 of 18
Subject Textbooks and Instructional Materials/
Year of Adoption
From Most Recent
Adoption?
Percent of Students Lacking Own
Assigned Copy
Abriendo Puertas, McDougal Littell, c. 2003, Student Edition, ISBN 0618272607
Date of Adoption : 7/17/2003
AP Spanish
Preparing for the Language and Culture Examination 4th Ed.Pearson Publishing 978-01-33-23901-0 2013
Temas Vista Higher Learning 978-1-61-857244-8 2013
Date of Adoption: 2/6/2014
French: Bon voyage! by Conrad J. Schmitt and Katia Brillie Lutz, Glencoe McGraw-Hill, c. 2002, Student Edition, Level 1, ISBN 0-07-821256-1, Student Edition, Level 2, ISBN 0-07-821257-X, Student Edition, Level 3, ISBN 0-07-821258-8
AP French (level four):
1) Une Fois pour Toutes Deuxieme Edition by Hale Sturges II, Linda Cregg Nielsen, Henry L. Herbst, Longman, c. 1992, ISBN 0-8013-0825-9-78893
2) Advanced Placement French by Richard Ladd, Pearson Education, c. 2000, ISBN 0673218473
Date of Adoption: July 17, 2003
German 1
Kontakte, 6th Ed
McGraw-Hill 978-0-07-353533-3 2008
Date of Adoption: 10/4/2012
German 2
Na Klar! McGraw-Hill 978-0-07-338633-1 2012
Date of Adoption: 7/18/2013
Health Glencoe Health, by Mary H. Bronson, Ph.D., and Don Merki, Ph.D., published by Glencoe-McGraw Hill, c. 2005, Student Edition, ISBN 0-07-861211X.
Date of Adoption: June 2, 2005
Yes 0
Visual and Performing Arts Tonal Harmony for AP Music Theory
Enjoyment of Music
Foundations for Superior Performance
Essentials for Strings
Art In Focus (Mittler) and Abacus to Zeus (Pierce)
Digital Media
No 0
2017-18 School Accountability Report Card for Burbank High School Page 10 of 18
Subject Textbooks and Instructional Materials/
Year of Adoption
From Most Recent
Adoption?
Percent of Students Lacking Own
Assigned Copy
Video: Digital Communication & Production Goodheart-Wilcox ISBN 1-60525-817-1
Science Laboratory Equipment (grades 9-12)
All students have access to laboratory equipment in their lab classes including earth science, physical science, and life science laboratories.
No 0
School Facility Conditions and Planned Improvements (Most Recent Year)
The facility is in Good repair. Normal maintenance and upkeep is being performed. The site wireless network infrastructure was replaced. A project to replace the grass on the practice field with synthetic turf is in the planning stage. No other improvement projects are scheduled at this time. The District takes great efforts to ensure that all of its schools are clean, safe, and functional. To assist in this effort, the District uses the “Facility Inspection Tool” (FIT) developed by the State of California Office of Public School Construction. Deficiencies noted are referred to Facilities Services and/or the site for immediate correction. To review the complete results of this survey please visit Administrative Services at the District Administration Building. School Facility Good Repair Status (Most Recent Year) Using the most recently collected FIT data (or equivalent), provide the following:
• Determination of repair status for systems listed • Description of any needed maintenance to ensure good repair • The year and month in which the data were collected • The overall rating
School Facility Good Repair Status (Most Recent Year) Year and month of the most recent FIT report: 2018 September
2017-18 School Accountability Report Card for Burbank High School Page 11 of 18
Overall Facility Rating (Most Recent Year)
Year and month of the most recent FIT report: 2018 September
Overall Rating X Good
B. Pupil Outcomes
State Priority: Pupil Achievement The SARC provides the following information relevant to the State priority: Pupil Achievement (Priority 4): • Statewide assessments (i.e., California Assessment of Student Performance and Progress [CAASPP] System, which includes the
Smarter Balanced Summative Assessments for students in the general education population and the California Alternate Assessments [CAAs] for English language arts/literacy [ELA] and mathematics given in grades three through eight and grade eleven. Only eligible students may participate in the administration of the CAAs. CAAs items are aligned with alternate achievement standards, which are linked with the Common Core State Standards [CCSS] for students with the most significant cognitive disabilities); and
• The percentage of students who have successfully completed courses that satisfy the requirements for entrance to the University of California and the California State University, or career technical education sequences or programs of study.
CAASPP Test Results in English Language Arts/Literacy (ELA) and Mathematics for All Students Grades Three through Eight and Grade Eleven
Subject
Percent of Students Meeting or Exceeding the State Standards (grades 3-8 and 11)
School District State
2016-17 2017-18 2016-17 2017-18 2016-17 2017-18
English Language Arts/Literacy (grades 3-8 and 11)
69.0 69.0 61.0 63.0 48.0 50.0
Mathematics (grades 3-8 and 11)
43.0 40.0 46.0 50.0 37.0 38.0
Note: Percentages are not calculated when the number of students tested is ten or less, either because the number of students in this category is too small for statistical accuracy or to protect student privacy. Note: ELA and mathematics test results include the Smarter Balanced Summative Assessment and the CAA. The “Percent Met or Exceeded” is calculated by taking the total number of students who met or exceeded the standard on the Smarter Balanced Summative Assessment plus the total number of students who met the standard (i.e., achieved Level 3–Alternate) on the CAAs divided by the total number of students who participated in both assessments.
CAASPP Test Results in ELA by Student Group Grades Three through Eight and Grade Eleven (School Year 2017-18)
2017-18 School Accountability Report Card for Burbank High School Page 12 of 18
Student Group Total
Enrollment Number Tested
Percent Tested
Percent Met or Exceeded
Students with Disabilities 54 51 94.44 13.73
Foster Youth -- -- -- -- Note: ELA test results include the Smarter Balanced Summative Assessment and the CAA. The “Percent Met or Exceeded” is calculated by taking the total number of students who met or exceeded the standard on the Smarter Balanced Summative Assessment plus the total number of students who met the standard (i.e., achieved Level 3–Alternate) on the CAAs divided by the total number of students who participated in both assessments. Note: Double dashes (--) appear in the table when the number of students is ten or less, either because the number of students in this category is too small for statistical accuracy or to protect student privacy. Note: The number of students tested includes all students who participated in the test whether they received a score or not; however, the number of students tested is not the number that was used to calculate the achievement level percentages. The achievement level percentages are calculated using only students who received scores.
CAASPP Test Results in Mathematics by Student Group Grades Three through Eight and Grade Eleven (School Year 2017-18)
Foster Youth -- -- -- -- Note: Mathematics test results include the Smarter Balanced Summative Assessment and the CAA. The “Percent Met or Exceeded” is calculated by taking the total number of students who met or exceeded the standard on the Smarter Balanced Summative Assessment plus the total number of students who met the standard (i.e., achieved Level 3–Alternate) on the CAAs divided by the total number of students who participated in both assessments.
Note: Double dashes (--) appear in the table when the number of students is ten or less, either because the number of students in this category is too small for statistical accuracy or to protect student privacy.
Note: The number of students tested includes all students who participated in the test whether they received a score or not; however, the number of students tested is not the number that was used to calculate the achievement level percentages. The achievement level percentages are calculated using only students who received scores.
2017-18 School Accountability Report Card for Burbank High School Page 13 of 18
CAASPP Test Results in Science for All Students Grades Five, Eight, and Ten
Subject
Percentage of Students Meeting or Exceeding the State Standard
School District State
2016-17 2017-18 2016-17 2017-18 2016-17 2017-18
Science (grades 5, 8, and 10) N/A N/A N/A N/A N/A N/A Note: Cells with N/A values do not require data. Note: The 2016–17 and 2017–18 data are not available. The CDE is developing a new science assessment based on the Next Generation Science Standards for California Public Schools (CA NGSS). The CAST was pilot-tested in spring 2017 and field-tested in spring 2018. The CAST will be administered operationally during the 2018–19 school year. The CAA for Science was pilot-tested for two years (i.e., 2016–17 and 2017–18) and the CAA for Science will be field-tested in 2018–19. Note: Science test results include the CAST and the CAA for Science. The “Percent Met or Exceeded” is calculated by taking the total number of students who met or exceeded the standard on the CAST plus the total number of students who met the standard (i.e., achieved Level 3–Alternate) on the CAA for Science divided by the total number of students who participated on both assessments.
Career Technical Education Programs (School Year 2017-18)
Each BUSD High School strives to graduate students who are fully capable of making the transition from school to the working world. The school’s workforce preparation programs include school-to-work activities through business partnerships in the community, as well as employability and skill-building opportunities through middle and high school classes offered by the District or local Community Colleges. All Career Technical Education (CTE) courses incorporate the California Career Technical Education Model Curriculum Standards; satisfy the District’s graduation requirements, and/or the A-G entrance requirements for the UC/CSU system. CTE classes offered include such courses as animal care, animation, engines, business, computer application, construction, digital applications, Fire and Law Enforcement, photography, marketing, and other technology classes. A list of specific CTE courses offered is contained in the District Career Technical Education Guide https://www.burbankusd.org/CTE The school addresses the needs of all students, as well as those in career preparation, through professional development, guidance and counseling from school personnel regarding career paths and courses of study. The District also sponsors and annual College and Career Fair where more than 100 colleges and university have exhibits along with 30 or more career representatives who share aspects of their chosen field. In addition, the District has created career pathways for students that lead to post secondary programs at a variety of community colleges through the College and Career Pathways Partnership program with the Los Angeles Commmunity College District (LACCD) Career Technical Education Participation (School Year 2017-18)
Measure CTE Program Participation
Number of pupils participating in CTE 638
% of pupils completing a CTE program and earning a high school diploma 47%
% of CTE courses sequenced or articulated between the school and institutions of postsecondary education 50%
Courses for University of California (UC) and/or California State University (CSU) Admission
UC/CSU Course Measure Percent
2017–18 Pupils Enrolled in Courses Required for UC/CSU Admission 99.2
2016–17 Graduates Who Completed All Courses Required for UC/CSU Admission 51.0
2017-18 School Accountability Report Card for Burbank High School Page 14 of 18
State Priority: Other Pupil Outcomes The SARC provides the following information relevant to the State priority: Other Pupil Outcomes (Priority 8): • Pupil outcomes in the subject areas of physical education. California Physical Fitness Test Results (School Year 2017-18)
Grade Level
Percent of Students Meeting Fitness Standards
Four of Six Standards Five of Six Standards Six of Six Standards
---9--- 14.1 25.8 46.7 Note: Percentages are not calculated when the number of students tested is ten or less, either because the number of students in this category is too small for statistical accuracy or to protect student privacy.
C. Engagement
State Priority: Parental Involvement The SARC provides the following information relevant to the State priority: Parental Involvement (Priority 3): • Efforts the school district makes to seek parent input in making decisions for the school district and each school site. Opportunities for Parental Involvement (School Year 2018-19)
The Burbank High School PTA coordinates and encourages a wide variety of opportunities for parental involvement in the school community. Monthly PTA meetings are held on campus. All parents are welcomed and encouraged to participate in the group to support school and student activities throughout the school year. There are Booster Clubs for a variety of sports teams and other activities, such as Instrumental and Vocal Music Associations, that are always in need of parental support with many opportunities for involvement.
State Priority: Pupil Engagement The SARC provides the following information relevant to the State priority: Pupil Engagement (Priority 5): • High school dropout rates; and • High school graduation rates. Dropout Rate and Graduation Rate (Four-Year Cohort Rate)
Graduation Rate 96.4 97.8 96.5 93.0 94.9 82.1 82.3 83.8 82.7 For the formula to calculate the 2016–17 adjusted cohort graduation rate, see the 2017–18 Data Element Definitions document located on the SARC web page at https://www.cde.ca.gov/ta/ac/sa/.
2017-18 School Accountability Report Card for Burbank High School Page 15 of 18
Completion of High School Graduation Requirements - Graduating Class of 2017 (One-Year Rate)
Group Graduating Class of 2017
School District State
All Students 98.2 93.9 88.7
Black or African American 88.9 100.0 82.2
American Indian or Alaska Native 0.0 55.6 82.8
Asian 100.0 100.0 94.9
Filipino 100.0 92.6 93.5
Hispanic or Latino 97.3 90.6 86.5
Native Hawaiian/Pacific Islander 0.0 0.0 88.6
White 98.9 97.3 92.1
Two or More Races 93.3 90.0 91.2
Socioeconomically Disadvantaged 100.0 99.8 88.6
English Learners 73.0 59.5 56.7
Students with Disabilities 81.6 79.3 67.1
Foster Youth 100.0 100.0 74.1
State Priority: School Climate The SARC provides the following information relevant to the State priority: School Climate (Priority 6): • Pupil suspension rates; • Pupil expulsion rates; and • Other local measures on the sense of safety. Suspensions and Expulsions
Each school in the district has developed a comprehensive school safety plan with four components. At Burbank High these components are as follows: Component 1 :Personal Characteristics of Students and Staff was addressed through the following activities: By educating our students and staff in becoming more tolerant and aware of the various ethnic and cultural backgrounds that both students and staff bring to our school. Component 2:School’s Physical Environment was addressed through the following: Rebuilding the school and paying close attention to safety issues. Component 3:School’s Social Environment was addressed through the following programs or activities: Clubs and organizations that include all students; activities that promote interaction among all students; working with staff to insure all are stakeholders. Component 4:School’s Culture was addressed through the following: By fostering an environment, in which students, parents and staff can feel safe, happy, supported, and have a sense of belonging Please visit the website to view the full safety plan https://www.burbankusd.org/files/user/8/file/BHS%20Safety%20Plan.pdf
2017-18 School Accountability Report Card for Burbank High School Page 16 of 18
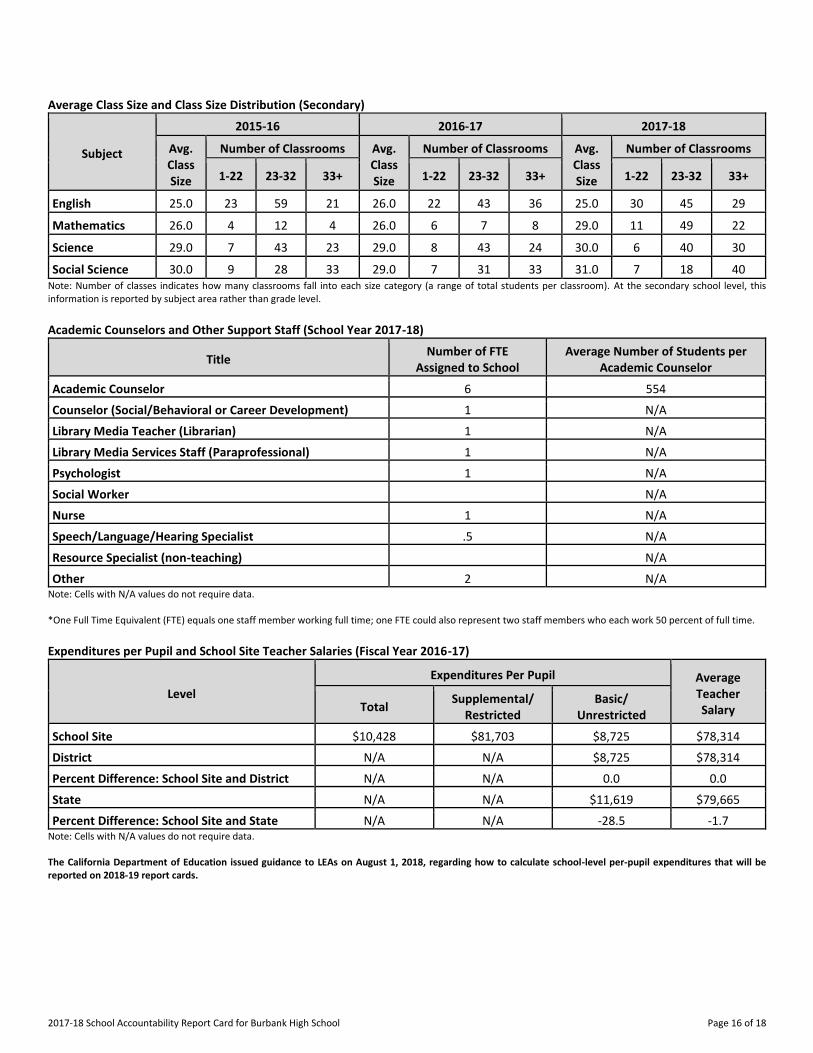
Average Class Size and Class Size Distribution (Secondary)
Subject
2015-16 2016-17 2017-18
Avg. Class Size
Number of Classrooms Avg. Class Size
Number of Classrooms Avg. Class Size
Number of Classrooms
1-22 23-32 33+ 1-22 23-32 33+ 1-22 23-32 33+
English------- ----------
25.0 23 59 21 26.0 22 43 36 25.0 30 45 29
Mathematics ----------
26.0 4 12 4 26.0 6 7 8 29.0 11 49 22
Science------- ----------
29.0 7 43 23 29.0 8 43 24 30.0 6 40 30
Social Science ----------
30.0 9 28 33 29.0 7 31 33 31.0 7 18 40 Note: Number of classes indicates how many classrooms fall into each size category (a range of total students per classroom). At the secondary school level, this information is reported by subject area rather than grade level.
Academic Counselors and Other Support Staff (School Year 2017-18)
Title Number of FTE
Assigned to School Average Number of Students per
Academic Counselor
Academic Counselor------- 6 554
Counselor (Social/Behavioral or Career Development) 1 N/A
Library Media Teacher (Librarian) 1 N/A
Library Media Services Staff (Paraprofessional) 1 N/A
Psychologist------- 1 N/A
Social Worker------- N/A
Nurse------- 1 N/A
Speech/Language/Hearing Specialist .5 N/A
Resource Specialist (non-teaching)------- N/A
Other------- 2 N/A Note: Cells with N/A values do not require data. *One Full Time Equivalent (FTE) equals one staff member working full time; one FTE could also represent two staff members who each work 50 percent of full time.
Expenditures per Pupil and School Site Teacher Salaries (Fiscal Year 2016-17)
Level
Expenditures Per Pupil Average Teacher Salary Total
Supplemental/ Restricted
Basic/ Unrestricted
School Site------- $10,428 $81,703 $8,725 $78,314
District------- N/A N/A $8,725 $78,314
Percent Difference: School Site and District N/A N/A 0.0 0.0
State------- N/A N/A $11,619 $79,665
Percent Difference: School Site and State N/A N/A -28.5 -1.7 Note: Cells with N/A values do not require data. The California Department of Education issued guidance to LEAs on August 1, 2018, regarding how to calculate school-level per-pupil expenditures that will be reported on 2018-19 report cards.
2017-18 School Accountability Report Card for Burbank High School Page 17 of 18
Types of Services Funded (Fiscal Year 2017-18)
Funding for programs is developed throught Local Control Funding Formula (LCFF) and meeting are held throughout the year for public input. For the 2017-2018 school year, the District received Federal and State aid for the following categorical, special education. Listed below are some of these and other support programs. For more information regarding all services funded please contact the BUSD Fiscal Services department. ASES Educational Technology Assistance Drug/Alcohol/Tobacco Resistance Programs Lottery Tenth Grade Counseling Special Education Vocational & Career Tech Education Career Tech Education (Perkins Funding) Teacher and Administrative Salaries (Fiscal Year 2016-17)
Category District Amount State Average for Districts In Same Category
Beginning Teacher Salary $45,457 $49,512
Mid-Range Teacher Salary $74,344 $77,880
Highest Teacher Salary $94,972 $96,387
Average Principal Salary (Elementary) $126,357 $123,139
Average Principal Salary (Middle) $138,464 $129,919
Average Principal Salary (High) $153,399 $140,111
Superintendent Salary $248,230 $238,324
Percent of Budget for Teacher Salaries 38.0 36.0
Percent of Budget for Administrative Salaries 5.0 5.0 For detailed information on salaries, see the CDE Certificated Salaries & Benefits Web page at http://www.cde.ca.gov/ds/fd/cs/. Advanced Placement (AP) Courses (School Year 2017-18)
Subject Number of AP Courses Offered* Percent of Students In AP Courses
Computer Science 2 N/A
English------- 12 N/A
Fine and Performing Arts 1 N/A
Foreign Language 3 N/A
Mathematics 9 N/A
Science------- 13 N/A
Social Science 21 N/A
All courses 61 30.5 Cells with N/A values do not require data. *Where there are student course enrollments of at least one student.
2017-18 School Accountability Report Card for Burbank High School Page 18 of 18
Professional Development (Most Recent Three Years)
High School Instructional Leadership Teams (quarterly meetings at site with administrators and monthly whole staff meetings facilitated by ILT members on WASC accreditation topics) Interventions Writing Across the Curriculum Teacher Collaboration and Planning Time Technology Integration Positive Behavior Intervention Support Secondary Content Area Pullout Time for Planning & Data Analysis (Math, English, Social Studies and Science meet monthly by grade to plan and collaborate together) Induction Training and Workshops (for mentors and new teachers, 8 meetings per year and twice monthly optional workshops) focused on the following topics: The California Standards for the Teaching Profession Formative Assessment in Professional Learning Engagement Strategies/Kagan Cooperative Social Emotional Learning Tactical Supports for Special Populations Questioning Strategies Parent Communication Classroom Design Project and Lesson Design Cognitive Rigor Classroom Management Assessments and Grading Differentiation Professional Mentoring (for teachers on plans of improvement, weekly meetings with program coordinator and mentor) on topics as needed. District Wide Professional Development Offered in the 2016-2017 school years: UNconference and EdCamp (multi-topic and disciplinary workshops) Step Up to Writing Stemscopes (Science) Kagan Cooperative Learning College Placement Math (CPM) NGSS Standards Adoption and Implementation Get Focused/Stay Focused/Teen Talk Integrating Arts in the the Common Core era Harcourt Houghton Mifflin California Collections Adoption Training Content Area ELD workshops for Math, Science, & Social Studies These trainings are offered in a variety of formats: Whole day and half day workshops at the district office and at sites Short, after school workshops at sites Saturday and pre-school workday workshops Summer Institutes Pull Out collaborations (2-4 hours per session) at sites Weekly meetings (hour long) Digital meetups via Google Hangout/Skype Individually one on one trainings