Tokyo, August 1, 2018 2018 Second Quarter Results Highlights First half adjusted operating profit at constant FX increased 3.1% year on year. Strong performance in the international tobacco business more than offset headwinds in the Japanese domestic tobacco business. Forecast for adjusted operating profit at constant FX remains unchanged. As stated in the “Business Plan 2018”, the Company announced an interim dividend of JPY 75 per share. Key business segment information: International tobacco business • Adjusted operating profit at constant FX grew 13.2% driven by pricing gains across clusters. • Acquisitions in Ethiopia, Indonesia and the Philippines bolstered shipment volume, supporting geographic expansion. • Key markets update: ⁃ Russia: Solid pricing and market share gains. Completed the Donskoy Tabak acquisition • On track to achieve 2018 profit target through top-line growth Japanese domestic tobacco business • Adjusted operating profit was negatively impacted by cigarette industry volume decline. • RRP sales volume and its related revenue increased sequentially due to Ploom TECH’s nationwide roll-out in June. • 2018 outlook for cigarette and RRP market sizes is revised to reflect current dynamics. Masamichi Terabatake, President and Chief Executive Officer of the JT Group, commented: “Our first half results demonstrate a solid performance and we remain on track to achieve our consolidated full year profit target. “The international tobacco business delivered strong profit growth, led by pricing in key markets. We are confident about reaching our full year profit target as we expect our positive performance to continue into the second half. The acquisition of Donskoy Tabak companies will reinforce our No.1 position in Russia, a long-term key market for the Group’s earnings growth. “In the Japanese domestic tobacco business, cigarette market share gains continued led by the robust performance of MEVIUS. Our RRP sales volume and revenue grew following an encouraging start of Ploom TECH’s nationwide roll-out while our capsule manufacturing capacity has continued to improve as planned. Although the current growth of the RRP market is slowing down, we believe that its market share could expand to 30% by 2020 driven by industry-wide innovations, an area in which we have also been making progress. To this effect, we are accelerating our investments in RRP initiatives, especially behind Ploom TECH, our unique offering, to establish the low-temperature heating category.” Conference Call A conference call with members of the investor community will be held at 4:00 pm, Tokyo Time, on August 2, 2018. For detailed information on the consolidated financial results, please visit the Company’s website. (https://www.jt.com/investors/). 1
Transcript
Tokyo, August 1, 2018
2018 Second Quarter Results Highlights First half adjusted operating profit at constant FX increased 3.1% year on year. Strong performance in the international tobacco business more than offset headwinds in the
Japanese domestic tobacco business. Forecast for adjusted operating profit at constant FX remains unchanged. As stated in the “Business Plan 2018”, the Company announced an interim dividend of JPY 75 per
share. Key business segment information: International tobacco business
• Adjusted operating profit at constant FX grew 13.2% driven by pricing gains across clusters. • Acquisitions in Ethiopia, Indonesia and the Philippines bolstered shipment volume, supporting
geographic expansion. • Key markets update:
⁃ Russia: Solid pricing and market share gains. Completed the Donskoy Tabak acquisition • On track to achieve 2018 profit target through top-line growth
Japanese domestic tobacco business • Adjusted operating profit was negatively impacted by cigarette industry volume decline. • RRP sales volume and its related revenue increased sequentially due to Ploom TECH’s
nationwide roll-out in June. • 2018 outlook for cigarette and RRP market sizes is revised to reflect current dynamics.
Masamichi Terabatake, President and Chief Executive Officer of the JT Group, commented: “Our first half results demonstrate a solid performance and we remain on track to achieve our consolidated full year profit target. “The international tobacco business delivered strong profit growth, led by pricing in key markets. We are confident about reaching our full year profit target as we expect our positive performance to continue into the second half. The acquisition of Donskoy Tabak companies will reinforce our No.1 position in Russia, a long-term key market for the Group’s earnings growth. “In the Japanese domestic tobacco business, cigarette market share gains continued led by the robust performance of MEVIUS. Our RRP sales volume and revenue grew following an encouraging start of Ploom TECH’s nationwide roll-out while our capsule manufacturing capacity has continued to improve as planned. Although the current growth of the RRP market is slowing down, we believe that its market share could expand to 30% by 2020 driven by industry-wide innovations, an area in which we have also been making progress. To this effect, we are accelerating our investments in RRP initiatives, especially behind Ploom TECH, our unique offering, to establish the low-temperature heating category.” Conference Call A conference call with members of the investor community will be held at 4:00 pm, Tokyo Time, on August 2, 2018. For detailed information on the consolidated financial results, please visit the Company’s website. (https://www.jt.com/investors/).
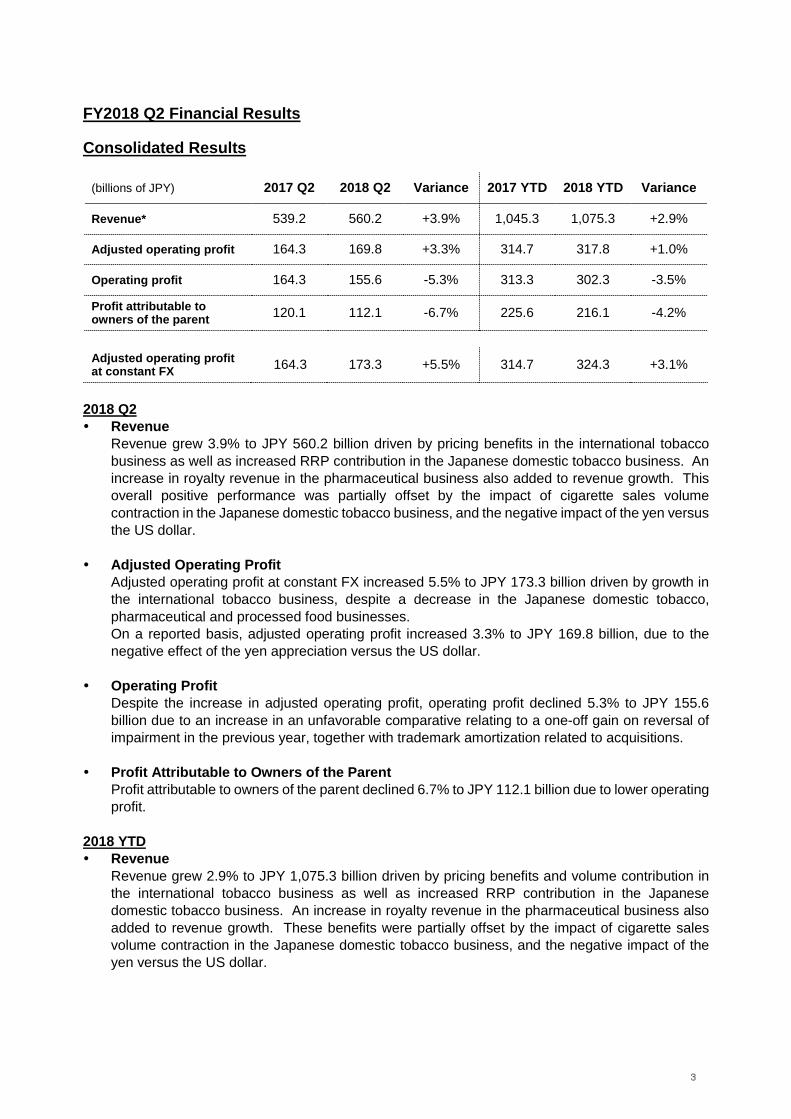
Profit attributable to owners of the parent 120.1 112.1 -6.7% 225.6 216.1 -4.2%
Adjusted operating profit at constant FX 164.3 173.3 +5.5% 314.7 324.3 +3.1%
2018 Q2 Revenue
Revenue grew 3.9% to JPY 560.2 billion driven by pricing benefits in the international tobacco business as well as increased RRP contribution in the Japanese domestic tobacco business. An increase in royalty revenue in the pharmaceutical business also added to revenue growth. This overall positive performance was partially offset by the impact of cigarette sales volume contraction in the Japanese domestic tobacco business, and the negative impact of the yen versus the US dollar.
Adjusted Operating Profit Adjusted operating profit at constant FX increased 5.5% to JPY 173.3 billion driven by growth in the international tobacco business, despite a decrease in the Japanese domestic tobacco, pharmaceutical and processed food businesses. On a reported basis, adjusted operating profit increased 3.3% to JPY 169.8 billion, due to the negative effect of the yen appreciation versus the US dollar.
Operating Profit Despite the increase in adjusted operating profit, operating profit declined 5.3% to JPY 155.6 billion due to an increase in an unfavorable comparative relating to a one-off gain on reversal of impairment in the previous year, together with trademark amortization related to acquisitions.
Profit Attributable to Owners of the Parent Profit attributable to owners of the parent declined 6.7% to JPY 112.1 billion due to lower operating profit.
2018 YTD Revenue
Revenue grew 2.9% to JPY 1,075.3 billion driven by pricing benefits and volume contribution in the international tobacco business as well as increased RRP contribution in the Japanese domestic tobacco business. An increase in royalty revenue in the pharmaceutical business also added to revenue growth. These benefits were partially offset by the impact of cigarette sales volume contraction in the Japanese domestic tobacco business, and the negative impact of the yen versus the US dollar.
3
Adjusted Operating Profit Adjusted operating profit at constant FX increased 3.1% to JPY 324.3 billion driven by growth in the international tobacco and pharmaceutical businesses, despite a decrease in the Japanese domestic tobacco and processed food businesses. On a reported basis, adjusted operating profit increased 1.0% to JPY 317.8 billion, due to the negative effect of the yen appreciation versus the US dollar.
Operating Profit Despite the increase in adjusted operating profit, operating profit declined 3.5% to JPY 302.3 billion due to an increase in an unfavorable comparative relating to a one-off gain on reversal of impairment in the previous year, together with trademark amortization expenses related to acquisitions.
Profit Attributable to Owners of the Parent Profit attributable to owners of the parent declined 4.2% to JPY 216.1 billion primarily due to lower operating profit. *As a result, compared to the application of the former accounting standard, “Revenue” and “Selling, general and administrative expenses” decreased by JPY 4,192 million and JPY 34,105 million respectively, and “Cost of sales” increased by JPY 29,913 million on the condensed interim consolidated statement of income for the six months ended June 30, 2018. These changes have no effect on Adjusted operating profit.
4
Results by Business Segment
International Tobacco Business
(billions of units, billions of JPY) 2017 Q2 2018 Q2 Variance 2017 YTD 2018 YTD Variance
Total shipment volume 101.5 107.3 +5.6% 193.2 205.6 +6.4%
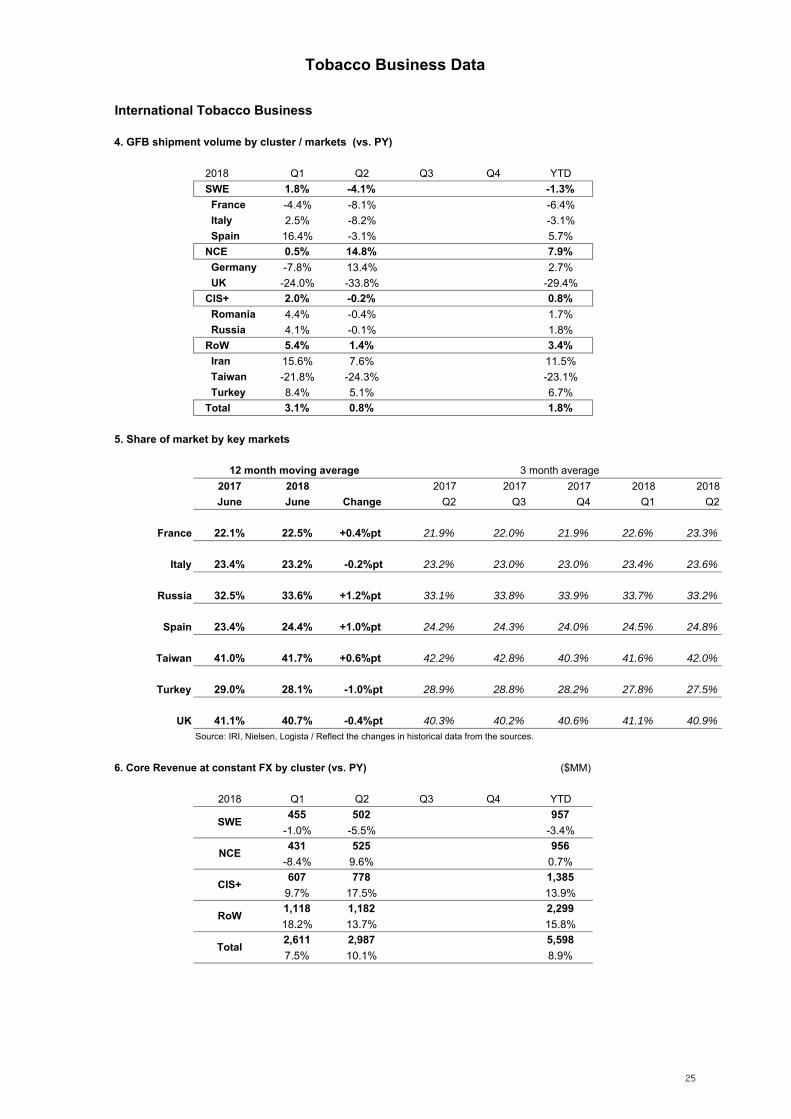
Total shipment volume grew 5.6% driven by acquisitions in Ethiopia, Indonesia and the Philippines. Excluding acquisitions and unfavorable inventory adjustments, total shipment volume declined 0.5%. Quarterly volume increases and market share gains in Austria, Czech Republic, Germany, Hungary, Iran, the Netherlands, Poland, Switzerland and several emerging markets did not offset the impact of industry volume contraction, notably in France, Russia and Taiwan. GFB shipment volume increased 0.8%, growing in North & Central Europe and Rest-of-the-World, driven by Winston.
Core revenue and Adjusted operating profit Core revenue increased 8.0% driven by volume contribution from acquisitions and a solid price/mix. Adjusted operating profit grew 14.4% including investments to strengthen the business foundation in the markets where we made acquitisions. Both core revenue and adjusted operating profit were impacted by a stronger JPY versus USD. On a USD basis, core revenue grew 9.9% driven by a price/mix variance of USD 295 million, notably in Canada, Iran, the Philippines, Russia, Taiwan and the UK. This offset a negative volume contribution of USD 20 million and unfavorable currency movements of USD 6 million. Adjusted operating profit increased 16.5%, or 17.8% when excluding currency movements, mainly driven by a favorable price/mix variance of USD 286 million.
2018 YTD Volume and Market share1
Total shipment volume grew 6.4% driven by acquisitions in Ethiopia, Indonesia and the Philippines. Excluding acquisitions and unfavorable inventory movements, total shipment volume declined 1.3%. Volume increases and market share gains in the Czech Republic, Hungary, Iran, the Netherlands, the Philippines, Spain, Sweden, Switzerland and several emerging markets did not offset the impact of industry volume contraction, notably in France, Russia and Taiwan. GFB shipment volume increased 1.8%, growing in North & Central Europe, CIS+ and Rest-of-the-World, driven by Winston, Camel and LD. Total and GFB market share grew in the key markets of France, Russia, Spain and Taiwan.
5
Core revenue and Adjusted operating profit Core revenue increased 7.4% driven by a volume contribution from acquisitions and a solid price/mix.. Adjusted operating profit grew 9.8% including investments to strengthen the business foundation markets where we made acquitisions. Both core revenue and adjusted operating profit were impacted by a stronger JPY versus USD. On a USD basis, core revenue grew 11.0% driven by a price/mix variance of USD 404 million, notably in Canada, Iran, the Philippines, Russia and Taiwan. This was enhanced by USD 52 million in volume contribution and favorable currency movements of USD 107 million. Adjusted operating profit increased 13.4%, or 13.2% when excluding currency movements, mainly driven by a favorable price/mix variance of USD 387 million.
International Tobacco Business (Quarterly) Performance review by Cluster
South and West Europe
(billions of Units, millions of USD) 2017 Q2 2018 Q2 Variance
Total shipment volume 17.7 16.8 -5.1%
GFB shipment volume 14.2 13.7 -4.1%
Core revenue 531 542 +2.0% (-5.5%)* *at constant FX
Volume and market share1
Total and GFB shipment volumes decreased 5.1% and 4.1%, respectively, due to industry volume contraction in France, Italy and Spain, and unfavorable inventory movements. Excluding inventory adjustments, total shipment volume declined 1.4%. Market share increased in France, Greece, Luxembourg, the Netherlands, Spain and Switzerland.
Core revenue Core revenue increased 2.0% as favorable currency movements of USD 40 million offset a negative volume contribution of USD 24 million and an unfavorable price/mix variance of USD 5 million, mainly from France. Excluding currency movements, core revenue decreased 5.5%.
By market In France, total shipment volume declined 10.9%, due to industry volume contraction and unfavorable inventory movements. Excluding inventory adjustments, total shipment volume declined 4.8%. GFB and fine cut shipment volumes declined 8.1% and 17.2%, respectively. Market share increased 0.4ppt to 22.5%, driven by Winston and Camel. In Italy, total and GFB shipment volumes decreased 8.0% and 8.2%, respectively, due to industry volume contraction and unfavorable inventory adjustments. Excluding inventory movements, total shipment volume declined 1.0%. Fine cut shipment volume grew 0.3% mainly driven by Winston and Camel. On a quarterly basis, market share grew for three consecutive quarters driven by B&H and supported by a stable Winston and Camel. Year-on-year market share declined 0.2ppt to 23.2%, due to Winston and Camel.
6
In Spain, total, GFB and fine cut shipment volumes decreased 2.5%, 3.1% and 15.7%, respectively, due to industry volume contraction and unfavorable inventory adjustments. Excluding inventory movements, total shipment volume was stable. Market share increased 1.0ppt to 24.4%, led by Winston and Camel.
North and Central Europe
(billions of Units, millions of USD) 2017 Q2 2018 Q2 Variance
Total shipment volume 13.1 13.8 +4.8%
GFB shipment volume 5.5 6.4 +14.8%
Core revenue 479 563 +17.6% (+9.6%)*
*at constant FX
Volume and market share1 Total and GFB shipment volumes increased 4.8% and 14.8%, respectively, mainly driven by Austria, Czech Republic, Germany, Hungary and Poland. Market share grew in Austria, Czech Republic, Hungary and Sweden.
Core revenue Core revenue grew 17.6% driven by favorable price/mix variance of USD 34 million, notably in Ireland and the UK, positive USD 12 million volume contribution and favorable currency movements of USD 38 million. Excluding currency movements, core revenue increased 9.6%.
By market In Germany, total, GFB and fine cut shipment volumes increased 8.1%, 13.4% and 14.4%, respectively, driven by market share gains in the quarter. On a quarterly basis, market share increased for three consecutive quarters driven by Winston. Year-on-year market share declined 0.5ppt to 7.6%. In the UK, total shipment volume declined 2.5% while fine cut shipment volume grew 1.4% driven by market share gains in the quarter. Quarterly market share increased 0.6ppt versus the second quarter in the previous year, although year-on-year market share was down 0.4ppt to 40.7%.
7
CIS+
(billions of Units, millions of USD) 2017 Q2 2018 Q2 Variance
Total shipment volume 35.0 33.3 -4.7%
GFB shipment volume 25.3 25.2 -0.2%
Core revenue 662 744 +12.4% (+17.5%)*
*at constant FX
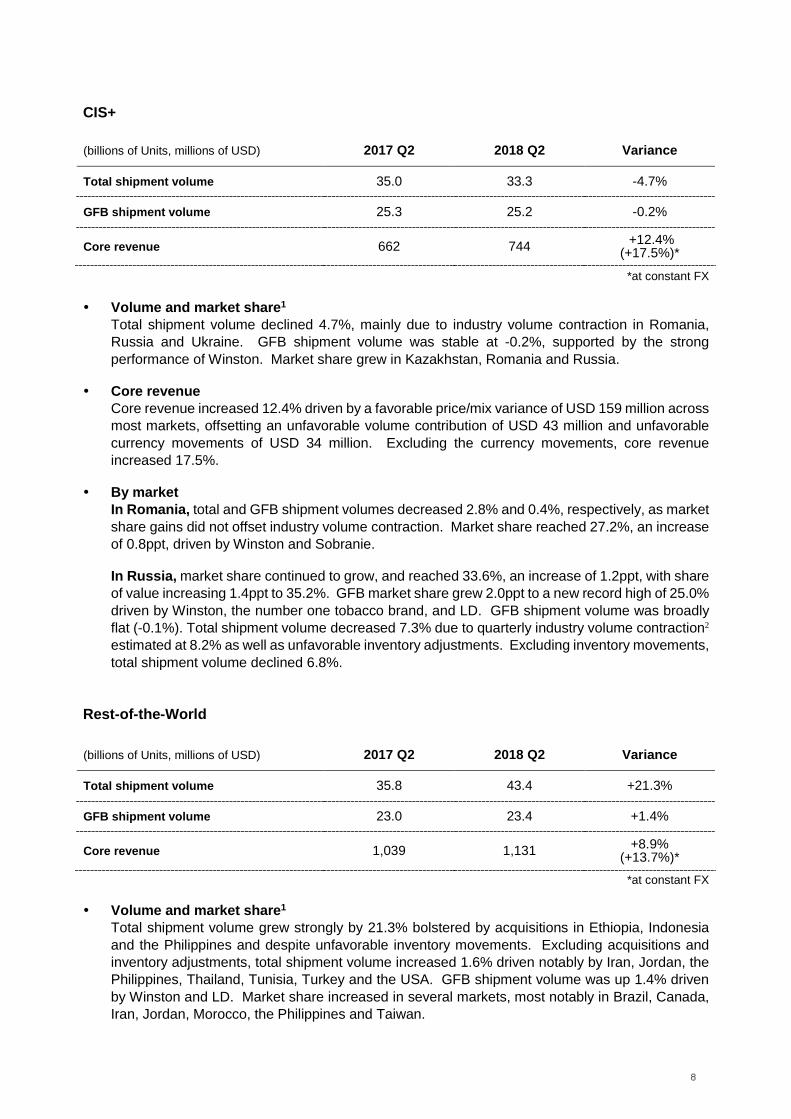
Volume and market share1 Total shipment volume declined 4.7%, mainly due to industry volume contraction in Romania, Russia and Ukraine. GFB shipment volume was stable at -0.2%, supported by the strong performance of Winston. Market share grew in Kazakhstan, Romania and Russia.
Core revenue Core revenue increased 12.4% driven by a favorable price/mix variance of USD 159 million across most markets, offsetting an unfavorable volume contribution of USD 43 million and unfavorable currency movements of USD 34 million. Excluding the currency movements, core revenue increased 17.5%.
By market In Romania, total and GFB shipment volumes decreased 2.8% and 0.4%, respectively, as market share gains did not offset industry volume contraction. Market share reached 27.2%, an increase of 0.8ppt, driven by Winston and Sobranie. In Russia, market share continued to grow, and reached 33.6%, an increase of 1.2ppt, with share of value increasing 1.4ppt to 35.2%. GFB market share grew 2.0ppt to a new record high of 25.0% driven by Winston, the number one tobacco brand, and LD. GFB shipment volume was broadly flat (-0.1%). Total shipment volume decreased 7.3% due to quarterly industry volume contraction2 estimated at 8.2% as well as unfavorable inventory adjustments. Excluding inventory movements, total shipment volume declined 6.8%.
Rest-of-the-World (billions of Units, millions of USD) 2017 Q2 2018 Q2 Variance
Total shipment volume 35.8 43.4 +21.3%
GFB shipment volume 23.0 23.4 +1.4%
Core revenue 1,039 1,131 +8.9% (+13.7%)*
*at constant FX
Volume and market share1 Total shipment volume grew strongly by 21.3% bolstered by acquisitions in Ethiopia, Indonesia and the Philippines and despite unfavorable inventory movements. Excluding acquisitions and inventory adjustments, total shipment volume increased 1.6% driven notably by Iran, Jordan, the Philippines, Thailand, Tunisia, Turkey and the USA. GFB shipment volume was up 1.4% driven by Winston and LD. Market share increased in several markets, most notably in Brazil, Canada, Iran, Jordan, Morocco, the Philippines and Taiwan.
8
Core revenue Core revenue increased 8.9%, driven by favorable price/mix variance of USD 107 million and positive volume contribution of USD 36 million, offsetting unfavorable currency movements of USD 50 million. Excluding the currency movements, core revenue increased 13.7%.
By market
In Iran, despite unfavorable inventory movements, total and GFB shipment volumes increased 2.4% and 7.6%, respectively, driven by continued growth of Winston. Excluding inventory adjustments, total shipment volume grew 13.0%. Market share continued to increase and reached 54.9%, up 7.3ppt. In Taiwan, total and GFB shipment volumes declined 22.3% and 24.3%, respectively, due to a double-digit industry volume contraction following the June 2017 tax increase. Market share grew 0.6ppt to 41.7%, strengthening our number one position, driven by Winston and LD. In Turkey, total shipment volume grew 3.9% including inventory movements. On a inventory neutral basis, total shipment volume increased 8.1% driven by a higher industry size. GFB shipment volume was up 5.1% driven by Winston. Market share declined 1.0ppt to 28.1% due to Camel and LD.
1 Source: IRI, Logista, Nielsen and JTI estimates on a 12-month rolling average, unless otherwise specified, for cigarettes and fine cut (excluding snus) at the end of June 2018. Germany, Sweden and Switzerland are on a 12-month rolling average at the end of May 2018. 12-month share of market growth for 2018 markets is calculated against a 12-month share of market at the end of June 2017. 2 Source: JTI estimates based on April-June 2018 data versus the same period last year.
9
Japanese Domestic Tobacco Business (billions of units, billions of JPY) 2017 Q2 2018 Q2 Variance 2017 YTD 2018 YTD Variance
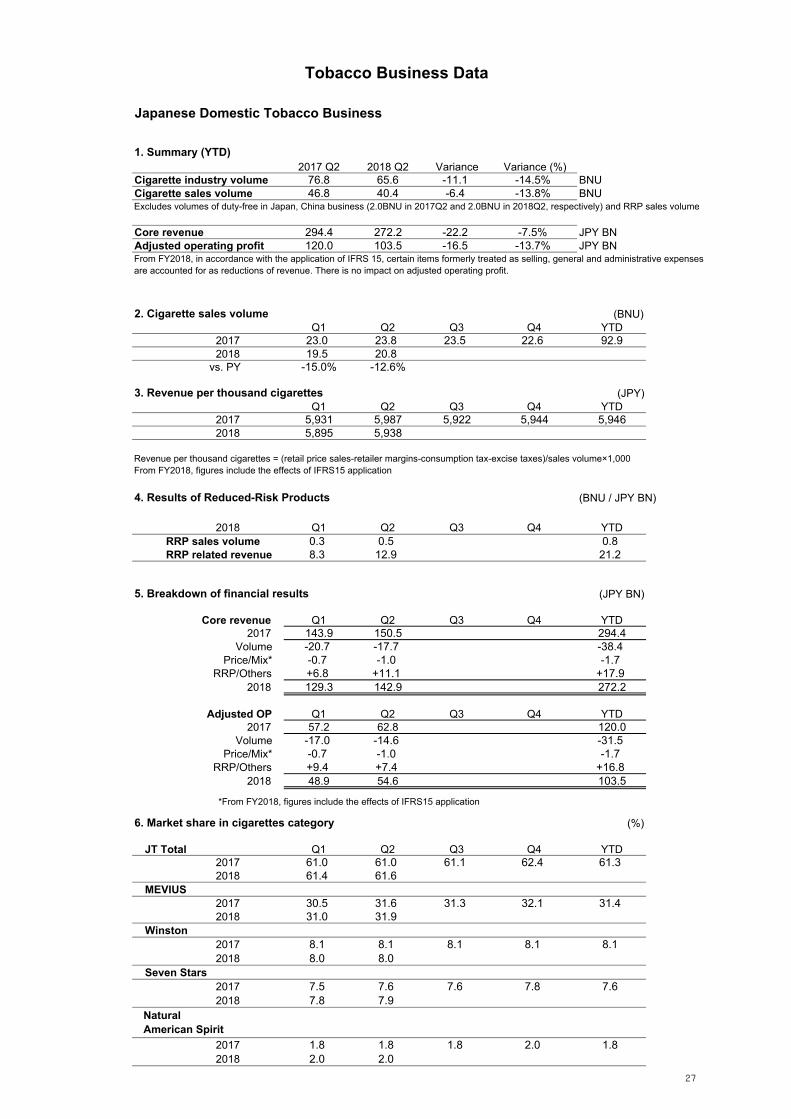
Cigarette industry volume 39.1 33.8 -13.4% 76.8 65.6 -14.5%
Cigarette industry volume decreased 13.4% impacted by the expansion of the RRP category and the underlying natural decline trend. JT’s cigarette sales volume decreased 12.6% mainly due to cigarette industry volume contraction. JT’s cigarette market share increased 0.6ppt to 61.6% versus the second quarter in the previous year and increased 0.2 ppt versus the first quarter this year, led by the solid performance of MEVIUS.
Reduced-Risk Products (RRP) performance JT estimates the overall RRP market size in Japan in the quarter was approximately 20%* of total tobacco industry volume, increasing slightly from the first quarter. In the quarter, JT RRP sales volume was 0.5 billion cigarette equivalent units. Based on sales volume, our share within the RRP category in the quarter was estimated at approximately 10% in convenience stores where our product was available. Ploom TECH’s nationwide roll-out started in June and expanded to convenience stores in July. *shipment basis
Core revenue and Adjusted operating profit Core revenue declined 5.1% mainly due to an unfavorable cigarette volume contribution of JPY 17.7 billion, partially offset by an increase in RRP related revenue. RRP related revenue was JPY 12.9 billion. Adjusted operating profit declined 13.1% due to negative cigarette volume contribution of JPY 14.6 billion, partially offset by an increase in RRP related profit and other factors of JPY 6.4 billion.
2018 YTD Cigarette sales volume
Cigarette industry volume decreased 14.5% impacted by the expansion of the RRP category and the underlying natural decline trend. Cigarette sales volume decreased 13.8% mainly due to cigarette industry volume contraction. JT’s cigarette market share increased 0.5ppt to 61.5% led by the solid performance of MEVIUS.
Reduced-Risk Products (RRP) performance JT estimates the overall RRP market size in Japan was approximately 20%* of total tobacco industry volume. JT RRP sales volume was 0.8 billion cigarette equivalent units. The accumulated total sales volume of Ploom TECH devices since its launch exceeded four million units in July. *shipment basis
10
Core revenue and Adjusted operating profit Core revenue declined 7.5% mainly due to an unfavorable cigarette volume contribution of JPY 38.4 billion, partially offset by an increase in RRP related revenue. RRP related revenue was JPY 21.2 billion. Adjusted operating profit declined 13.7% due to negative cigarette volume contribution of JPY 31.5 billion, partially offset by an increase in RRP related profit and other factors of JPY 15 billion.
Pharmaceutical Business (billions of JPY) 2017 Q2 2018 Q2 Variance 2017 YTD 2018 YTD Variance
Revenue increased 10.6% driven by higher royalty revenues from increased sales of original JT compounds and sales growth of Torii Pharmaceutical despite the impact of NHI* price revision. Adjusted operating profit decreased 6.1% due to increased R&D investments and increased cost of sales at Torii Pharmaceutical. *National Health Insurance
2018 YTD Revenue and Adjusted operating profit
Revenue increased 12.7% driven by higher royalty revenues from increased sales of original JT compounds and sales growth of Torii Pharmaceutical and despite the impact of NHI* price revision. Despite increased R&D investments and increased cost of sales at Torii Pharmaceutical, adjusted operating profit grew 26.7% driven by revenue growth. *National Health Insurance
Processed Food Business (billions of JPY) 2017 Q2 2018 Q2 Variance 2017 YTD 2018 YTD Variance
Revenue increased 0.4% due to the solid performance of staple food products and seasonings products offsetting the lower sales of other products. Adjusted operating profit declined 27.4% mainly as a result of higher raw material costs.
2018 YTD Revenue and Adjusted operating profit
Revenue decreased 0.5% due to the solid performance of staple food and seasonings products being offset by the lower sales of other products. Adjusted operating profit declined 34.1% mainly as a result of higher raw material costs.
11
FY2018 Forecasts (billions of JPY) 2018 Initial
forecast 2018 Revised
forecast Variance vs.
Initial forecast Variance vs. 2017 Result
Revenue 2,220.0 2,240.0 +20.0 +4.7%
Adjusted operating profit 600.0 586.0 -14.0 +0.1%
Operating profit 561.0 541.0 -20.0 -3.6%
Profit attributable to owners of the parent 394.0 377.0 -17.0 -3.9%
Adjusted operating profit at constant FX 607.0 607.0 - +3.7%
Revenue
The revenue forecast is revised upwards by JPY 20 billion driven by the acquisition of Donskoy Tabak and solid pricing in the international business as well as higher cigarette sales volume in the Japanese domestic tobacco business. These upsides more than offset the negative impact of revised FX assumptions and resulting in 4.7% growth versus the previous year.
Adjusted Operating Profit
While the revenue forecast is revised upwards, the forecast for adjusted operating profit at constant FX is unchanged, resulting in 3.7% growth versus previous year. This is due to the increase in RRP investments in the domestic tobacco business, investments to strengthen the Donskoy Tabak business and reflecting the potential downside arising from uncertain business environment in Iran in international tobacco business. On a reported basis, adjusted operating profit is revised downwards by JPY 14.0 billion from the initial forecast due to the revision of the FX assumptions and forecast to grow 0.1% versus the previous year.
• Operating Profit and Profit Attributable to Owners of the Parent
Operating profit and profit attributable to owners of the parent are revised downward by JPY 20 billion and JPY 17 billion respectively, as a result of downward revision of adjusted operating profit and the trademark amortization expense due to acquisitions. As a result, they are forecast to decline 3.6% and 3.9% respectively versus the previous fiscal year.
12
Forecasts by Business Segment International Tobacco Business
(billions of JPY) 2018 Initial forecast
2018 Revised forecast
Variance vs. Initial forecast
Variance vs. 2017 Result
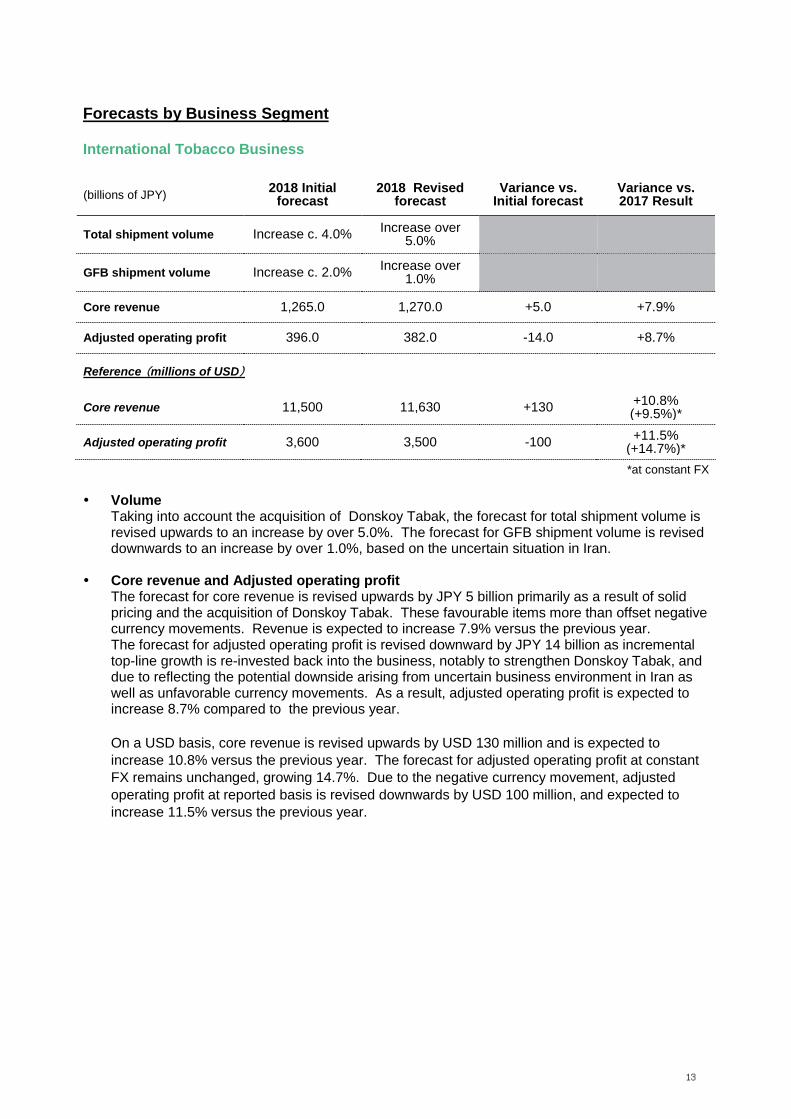
Total shipment volume Increase c. 4.0% Increase over 5.0%
GFB shipment volume Increase c. 2.0% Increase over 1.0%
Taking into account the acquisition of Donskoy Tabak, the forecast for total shipment volume is revised upwards to an increase by over 5.0%. The forecast for GFB shipment volume is revised downwards to an increase by over 1.0%, based on the uncertain situation in Iran.
Core revenue and Adjusted operating profit
The forecast for core revenue is revised upwards by JPY 5 billion primarily as a result of solid pricing and the acquisition of Donskoy Tabak. These favourable items more than offset negative currency movements. Revenue is expected to increase 7.9% versus the previous year. The forecast for adjusted operating profit is revised downward by JPY 14 billion as incremental top-line growth is re-invested back into the business, notably to strengthen Donskoy Tabak, and due to reflecting the potential downside arising from uncertain business environment in Iran as well as unfavorable currency movements. As a result, adjusted operating profit is expected to increase 8.7% compared to the previous year.
On a USD basis, core revenue is revised upwards by USD 130 million and is expected to increase 10.8% versus the previous year. The forecast for adjusted operating profit at constant FX remains unchanged, growing 14.7%. Due to the negative currency movement, adjusted operating profit at reported basis is revised downwards by USD 100 million, and expected to increase 11.5% versus the previous year.
13
Japanese Domestic Tobacco Business
(billions of JPY) 2018 Initial forecast
2018 Revised forecast
Variance vs. Initial forecast
Variance vs. 2017 Result
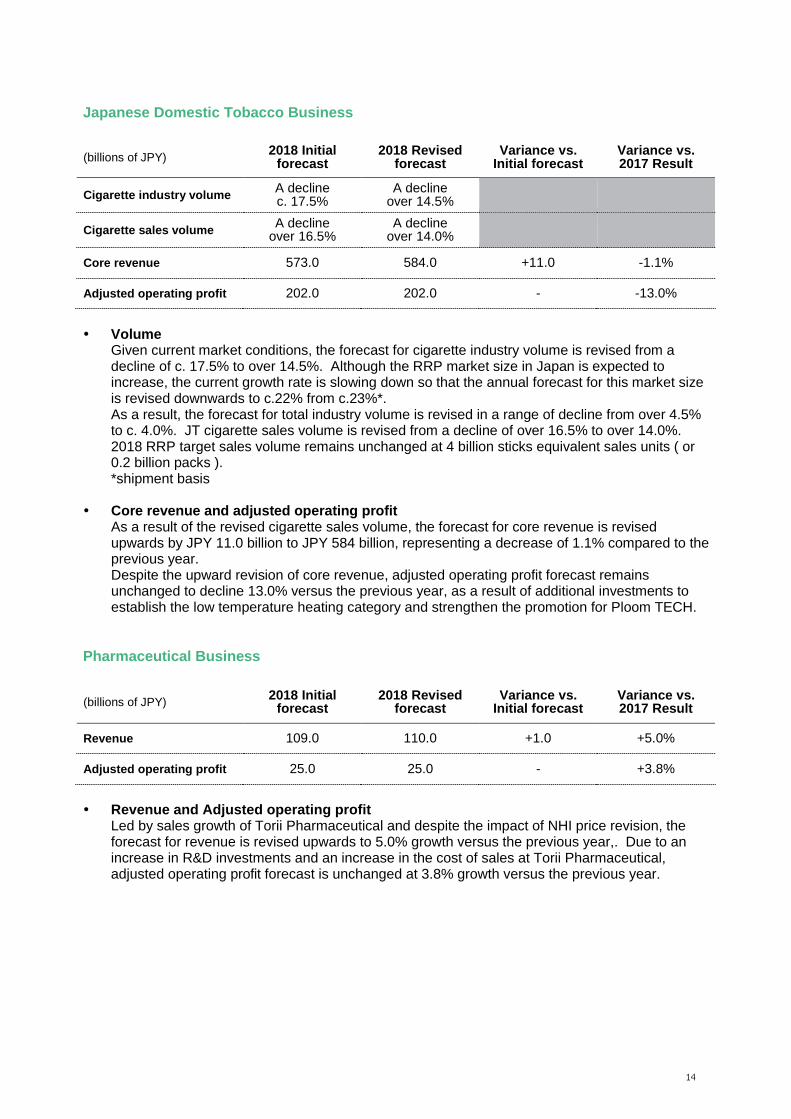
Cigarette industry volume A decline c. 17.5%
A decline over 14.5%
Cigarette sales volume A decline over 16.5%
A decline over 14.0%
Core revenue 573.0 584.0 +11.0 -1.1%
Adjusted operating profit 202.0 202.0 - -13.0%
VolumeGiven current market conditions, the forecast for cigarette industry volume is revised from adecline of c. 17.5% to over 14.5%. Although the RRP market size in Japan is expected toincrease, the current growth rate is slowing down so that the annual forecast for this market sizeis revised downwards to c.22% from c.23%*.As a result, the forecast for total industry volume is revised in a range of decline from over 4.5%to c. 4.0%. JT cigarette sales volume is revised from a decline of over 16.5% to over 14.0%.2018 RRP target sales volume remains unchanged at 4 billion sticks equivalent sales units ( or0.2 billion packs ).*shipment basis
Core revenue and adjusted operating profitAs a result of the revised cigarette sales volume, the forecast for core revenue is revisedupwards by JPY 11.0 billion to JPY 584 billion, representing a decrease of 1.1% compared to theprevious year.Despite the upward revision of core revenue, adjusted operating profit forecast remainsunchanged to decline 13.0% versus the previous year, as a result of additional investments toestablish the low temperature heating category and strengthen the promotion for Ploom TECH.
Pharmaceutical Business
(billions of JPY) 2018 Initial forecast
2018 Revised forecast
Variance vs. Initial forecast
Variance vs. 2017 Result
Revenue 109.0 110.0 +1.0 +5.0%
Adjusted operating profit 25.0 25.0 - +3.8%
Revenue and Adjusted operating profitLed by sales growth of Torii Pharmaceutical and despite the impact of NHI price revision, the forecast for revenue is revised upwards to 5.0% growth versus the previous year,. Due to an increase in R&D investments and an increase in the cost of sales at Torii Pharmaceutical, adjusted operating profit forecast is unchanged at 3.8% growth versus the previous year.
14
Processed Food Business
(billions of JPY) 2018 Initial forecast
2018 Revised forecast
Variance vs. Initial forecast
Variance vs. 2017 Result
Revenue 165.0 165.0 - +1.1%
Adjusted operating profit 5.5 5.5 - +1.9%
Revenue and Adjusted operating profitThe forecast for revenue and adjusted operating profit are remain unchanged and are expected to grow 1.1% and 1.9% versus the previous year respectively.
15
[This page is intentionally left blank]
16
Data Sheets
17
Results for 2018 Second Quarter (YTD)
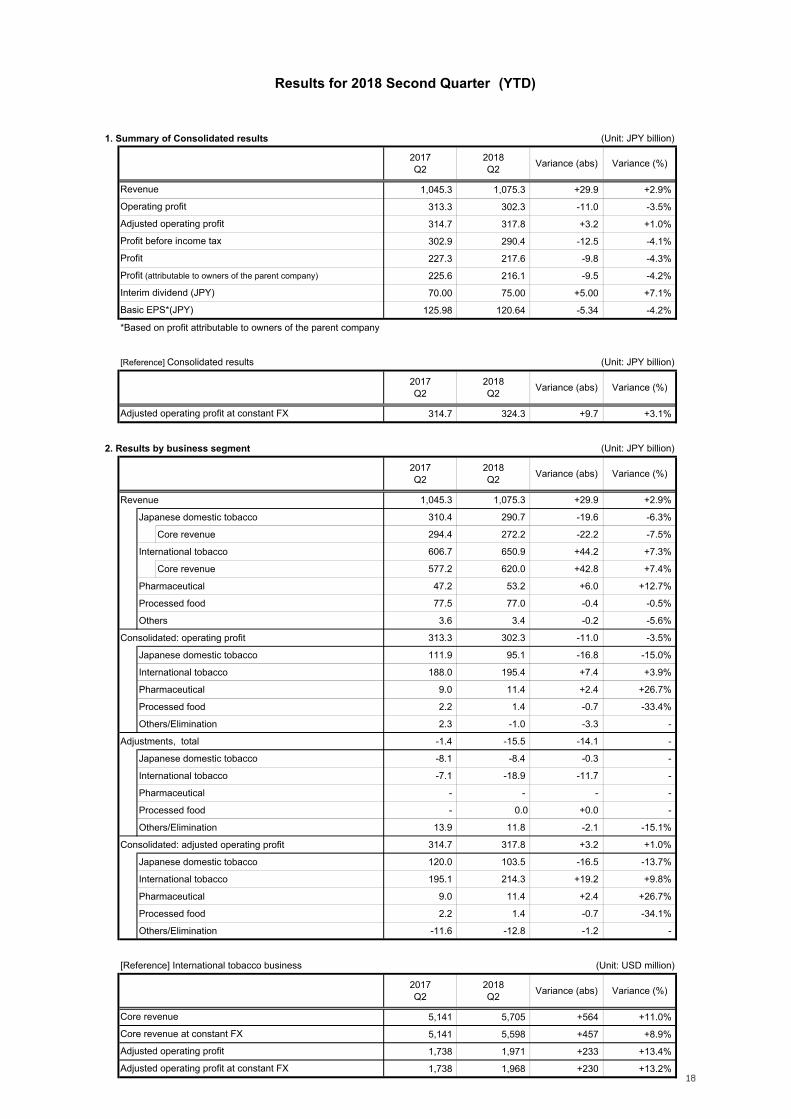
1. Summary of Consolidated results (Unit: JPY billion)
1,045.3 1,075.3 +29.9 +2.9%
313.3 302.3 -11.0 -3.5%
314.7 317.8 +3.2 +1.0%
302.9 290.4 -12.5 -4.1%
227.3 217.6 -9.8 -4.3%
225.6 216.1 -9.5 -4.2%
70.00 75.00 +5.00 +7.1%
125.98 120.64 -5.34 -4.2%
*Based on profit attributable to owners of the parent company
[Reference] International tobacco business (Unit: USD million)
FY2018Initial
Forecasts
FY2018Revised
ForecastsVariance (abs) Variance (%)
11,500 11,630 +130 +1.1%
11,350 11,500 +150 +1.3%
3,600 3,500 -100 -2.8%
3,600 3,600 - -
Adjusted operating profit at constant FX
Core revenue
Core revenue at constant FX
Adjusted operating profit
Adjusted operating profit at constant FX
22
FY2018 Revised Forecastsvs Initial Forecasts
(as of August 1, 2018)
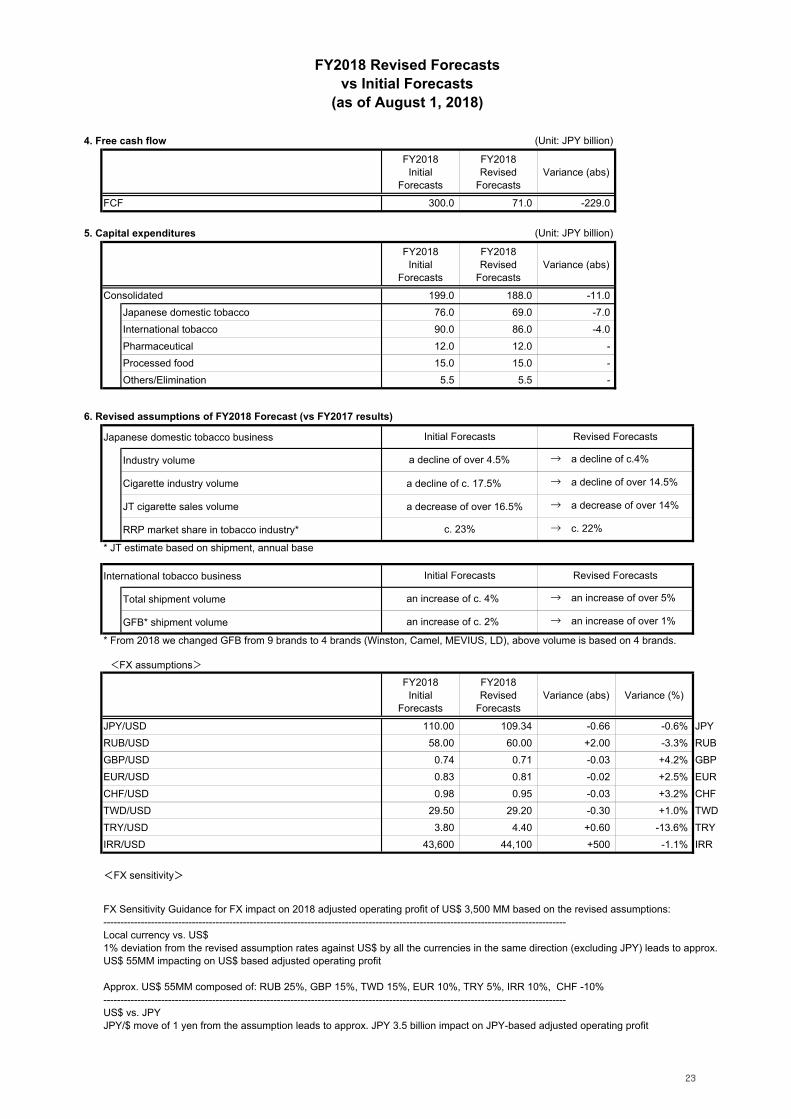
4. Free cash flow (Unit: JPY billion)
FY2018Initial
Forecasts
FY2018Revised
ForecastsVariance (abs)
FCF 300.0 71.0 -229.0
5. Capital expenditures (Unit: JPY billion)
FY2018Initial
Forecasts
FY2018Revised
ForecastsVariance (abs)
Consolidated 199.0 188.0 -11.0
Japanese domestic tobacco 76.0 69.0 -7.0
International tobacco 90.0 86.0 -4.0
Pharmaceutical 12.0 12.0 -
Processed food 15.0 15.0 -
Others/Elimination 5.5 5.5 -
6. Revised assumptions of FY2018 Forecast (vs FY2017 results)
Japanese domestic tobacco business
Industry volume
Cigarette industry volume a decline of c. 17.5%
JT cigarette sales volume a decrease of over 16.5%
RRP market share in tobacco industry*
* JT estimate based on shipment, annual base
International tobacco business
Total shipment volume
GFB* shipment volume
* From 2018 we changed GFB from 9 brands to 4 brands (Winston, Camel, MEVIUS, LD), above volume is based on 4 brands.
<FX assumptions>FY2018
InitialForecasts
FY2018Revised
ForecastsVariance (abs) Variance (%)
JPY/USD 110.00 109.34 -0.66 -0.6% JPY
RUB/USD 58.00 60.00 +2.00 -3.3% RUB
GBP/USD 0.74 0.71 -0.03 +4.2% GBP
EUR/USD 0.83 0.81 -0.02 +2.5% EUR
CHF/USD 0.98 0.95 -0.03 +3.2% CHF
TWD/USD 29.50 29.20 -0.30 +1.0% TWD
TRY/USD 3.80 4.40 +0.60 -13.6% TRY
IRR/USD 43,600 44,100 +500 -1.1% IRR
<FX sensitivity>
a decline of over 4.5% → a decline of c.4%
Initial Forecasts Revised Forecasts
FX Sensitivity Guidance for FX impact on 2018 adjusted operating profit of US$ 3,500 MM based on the revised assumptions:----------------------------------------------------------------------------------------------------------------------------------------Local currency vs. US$1% deviation from the revised assumption rates against US$ by all the currencies in the same direction (excluding JPY) leads to approx.US$ 55MM impacting on US$ based adjusted operating profit
Approx. US$ 55MM composed of: RUB 25%, GBP 15%, TWD 15%, EUR 10%, TRY 5%, IRR 10%, CHF -10%----------------------------------------------------------------------------------------------------------------------------------------US$ vs. JPYJPY/$ move of 1 yen from the assumption leads to approx. JPY 3.5 billion impact on JPY-based adjusted operating profit
UK 41.1% 40.7% -0.4%pt 40.3% 40.2% 40.6% 41.1% 40.9%Source: IRI, Nielsen, Logista / Reflect the changes in historical data from the sources.
6. Core Revenue at constant FX by cluster (vs. PY) ($MM)
2018 Q1 Q2 Q3 Q4 YTD
455 502 957
-1.0% -5.5% -3.4%
431 525 956
-8.4% 9.6% 0.7%
607 778 1,385
9.7% 17.5% 13.9%
1,118 1,182 2,299
18.2% 13.7% 15.8%
2,611 2,987 5,598
7.5% 10.1% 8.9%
International Tobacco Business
Total
CIS+
RoW
3 month average12 month moving average
SWE
NCE
25
Tobacco Business Data
7. Breakdown of Core Revenue
・USD basis ($MM)
Q1 Q2 Q3 Q4 YTD
2017 2,429 2,712 5,141
Volume +72 -20 +52
Price/Mix +109 +295 +404
2018 at constant 2,611 2,987 5,598
FX +113 -6 +107
2018 2,724 2,981 5,705
・Yen basis (JPY BN)
Q1 Q2 Q3 Q4 YTD
2017 276.0 301.3 577.2
Operations +20.6 +30.5 +51.2
USD vs. JPY -14.7 -5.9 -20.6
2018 294.8 325.2 620.0
8. Breakdown of Adjusted Operating Profit
・USD basis ($MM)
Q1 Q2 Q3 Q4 YTD
2017 810 929 1,738
Volume -7 -86 -93
Price/Mix +102 +286 +387
Others -31 -34 -65
2018 at constant 874 1,094 1,968
FX +16 -13 +3
2018 890 1,082 1,971
・Yen basis (JPY BN)
Q1 Q2 Q3 Q4 YTD
2017 92.0 103.2 195.1
Operations +7.3 +18.4 +25.7
USD vs. JPY -4.8 -2.2 -6.9
2018 96.3 118.0 214.3
9. FX actual vs. PY
2018Q1 2018Q2 2018Q3 2018Q4 2018 YTD
56.88 61.80 59.34
+3.4% -7.5% -2.3%
0.72 0.73 0.73
+12.3% +6.5% +9.3%
0.81 0.84 0.83
+15.4% +8.6% +11.9%
0.95 0.98 0.97
+5.9% +0.1% +2.9%
29.30 29.76 29.53
+6.2% +1.7% +3.9%
3.81 4.36 4.08
-3.1% -17.9% -11.0%
46,583 43,365 44,974
-17.8% -13.4% -15.7%
108.22 109.10 108.67
-4.7% -1.8% -3.3%
International Tobacco Business
+12.2
Local currenciesvs. USD
+1.8 +0.4
Local currenciesvs. USD
+12.9
*JPY vs USD change rates: (Local currency exchange rates of current period / Local currency exchange rates of same period in previous year ) -1
Local currency vs USD change rates: (Local currency exchange rates of same period in previous year / Local currency exchange rates of current period ) -1
Cigarette industry volume 76.8 65.6 -11.1 -14.5% BNUCigarette sales volume 46.8 40.4 -6.4 -13.8% BNUExcludes volumes of duty-free in Japan, China business (2.0BNU in 2017Q2 and 2.0BNU in 2018Q2, respectively) and RRP sales volume
*From FY2018, figures include the effects of IFRS15 application
6. Market share in cigarettes category (%)
JT Total Q1 Q2 Q3 Q4 YTD2017 61.0 61.0 61.1 62.4 61.32018 61.4 61.6
MEVIUS2017 30.5 31.6 31.3 32.1 31.42018 31.0 31.9
Winston2017 8.1 8.1 8.1 8.1 8.12018 8.0 8.0
Seven Stars2017 7.5 7.6 7.6 7.8 7.62018 7.8 7.9
2017 1.8 1.8 1.8 2.0 1.82018 2.0 2.0
Revenue per thousand cigarettes = (retail price sales-retailer margins-consumption tax-excise taxes)/sales volume×1,000From FY2018, figures include the effects of IFRS15 application
Natural American Spirit
Japanese Domestic Tobacco Business
From FY2018, in accordance with the application of IFRS 15, certain items formerly treated as selling, general and administrative expensesare accounted for as reductions of revenue. There is no impact on adjusted operating profit.
27
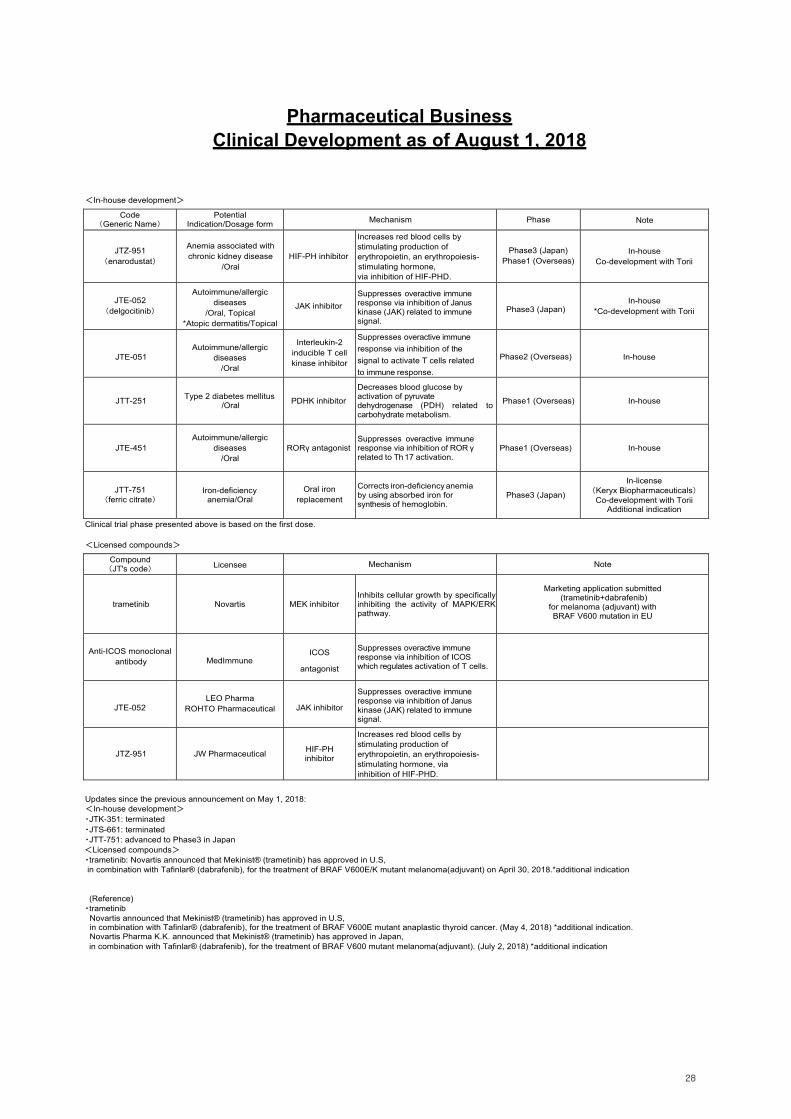
Pharmaceutical Business Clinical Development as of August 1, 2018
<In-house development>
Code (Generic Name)
Potential Indication/Dosage form
Mechanism Phase Note
JTZ-951 (enarodustat)
Anemia associated with chronic kidney disease
/Oral HIF-PH inhibitor
Increases red blood cells by stimulating production of erythropoietin, an erythropoiesis- stimulating hormone, via inhibition of HIF-PHD.
Phase3 (Japan) Phase1 (Overseas)
In-house Co-development with Torii
JTE-052 (delgocitinib)
Autoimmune/allergic diseases
/Oral, Topical *Atopic dermatitis/Topical
JAK inhibitor
Suppresses overactive immune response via inhibition of Janus kinase (JAK) related to immune signal.
Phase3 (Japan) In-house
*Co-development with Torii
JTE-051
Autoimmune/allergic diseases
/Oral
Interleukin-2 inducible T cell kinase inhibitor
Suppresses overactive immune
response via inhibition of the
signal to activate T cells related
to immune response.
Phase2 (Overseas) In-house
JTT-251 Type 2 diabetes mellitus
/Oral PDHK inhibitor
Decreases blood glucose by activation of pyruvate dehydrogenase (PDH) related to carbohydrate metabolism.
Phase1 (Overseas) In-house
JTE-451 Autoimmune/allergic
diseases /Oral
RORγ antagonist Suppresses overactive immune response via inhibition of ROR γ related to Th 17 activation.
Phase1 (Overseas) In-house
JTT-751 (ferric citrate)
Iron-deficiency anemia/Oral
Oral iron replacement
Corrects iron-deficiency anemia by using absorbed iron for synthesis of hemoglobin.
Phase3 (Japan)
In-license (Keryx Biopharmaceuticals) Co-development with Torii
Additional indication
Clinical trial phase presented above is based on the first dose.
<Licensed compounds>
Compound (JT's code) Licensee Mechanism Note
trametinib Novartis MEK inhibitor Inhibits cellular growth by specifically inhibiting the activity of MAPK/ERK pathway.
for melanoma (adjuvant) with BRAF V600 mutation in EU
Anti-ICOS monoclonal antibody MedImmune
ICOS
antagonist
Suppresses overactive immune response via inhibition of ICOS which regulates activation of T cells.
JTE-052 LEO Pharma
ROHTO Pharmaceutical JAK inhibitor
Suppresses overactive immune response via inhibition of Janus kinase (JAK) related to immune signal.
JTZ-951 JW Pharmaceutical HIF-PH inhibitor
Increases red blood cells by stimulating production of erythropoietin, an erythropoiesis- stimulating hormone, via inhibition of HIF-PHD.
Updates since the previous announcement on May 1, 2018: <In-house development> ・JTK-351: terminated ・JTS-661: terminated ・JTT-751: advanced to Phase3 in Japan <Licensed compounds> ・trametinib: Novartis announced that Mekinist® (trametinib) has approved in U.S, in combination with Tafinlar® (dabrafenib), for the treatment of BRAF V600E/K mutant melanoma(adjuvant) on April 30, 2018.*additional indication (Reference)
・trametinib Novartis announced that Mekinist® (trametinib) has approved in U.S, in combination with Tafinlar® (dabrafenib), for the treatment of BRAF V600E mutant anaplastic thyroid cancer. (May 4, 2018) *additional indication. Novartis Pharma K.K. announced that Mekinist® (trametinib) has approved in Japan, in combination with Tafinlar® (dabrafenib), for the treatment of BRAF V600 mutant melanoma(adjuvant). (July 2, 2018) *additional indication
28
Definitions
Terms Definitions
Adjusted Operating Profit (AOP)
Operating profit + amortization cost of acquired intangibles arising from business acquisitions + adjusted items (income and costs) * *Adjusted items (income and costs) = impairment losses on goodwill ± restructuring income and costs ± others
Consolidated Adjusted Operating Profit at Constant FX
For International Tobacco Business, the same foreign exchange rates between local currencies vs USD and JPY vs USD as same period in previous fiscal year are applied
Reduced-Risk Products (RRP) Products with potential to reduce the risks associated with smoking
1 pack corresponds to 20 cigarettes Exclusion: Domestic duty free, RRP devices, RRP related accessories, etc.
Core Revenue (Japanese Domestic Tobacco Business)
Excluding revenue from distribution of imported tobacco in the Japanese Domestic Tobacco Business, among others, but including revenue from domestic duty free and the China business, as well as RRP Related Revenue.
RRP Related Revenue (Japanese Domestic Tobacco Business)
RRP related revenue, as a part of core revenue, represents the sale of RRP Inclusion: Domestic duty free, principally the device and the related accessories.
Liquidity Cash and deposits + marketable securities + securities purchased under repurchase agreements
FCF is sum of cash flows from operating activities and investing activities, but excludes the following items; - From operating CF: interest received, dividends received, interest paid and income taxes related to these items - From investing CF: purchase of investment securities (for both short-term and long-term), payments into time deposits, proceeds from sale or redemption of investment securities (for both short-term and long-term), proceeds from withdrawal of time deposits and other investing activities not for business operation purposes
Additional definitions are provided at https://www.jt.com/media/glossary/index.html
29
### Japan Tobacco Inc. is a leading international tobacco company with operations in more than 130 countries. With close to 60,000 employees, it manufactures and sells some of the world’s best-known brands including Winston, Camel, MEVIUS and LD. The JT Group is committed to investing in Reduced-Risk Products (RRP) and currently markets Ploom TECH, its tobacco vapor product, and various e-cigarette products under the Logic brand. The Group is also present in the pharmaceutical and processed food businesses. For more information, visit https://www.jt.com/.
FORWARD-LOOKING STATEMENTS This document contains forward-looking statements. These statements appear in a number of places in this document and include statements regarding the intent, belief, or current and future expectations of our management with respect to our business, financial condition and results of operations. In some cases, you can identify forward-looking statements by terms such as “may”, “will”, “should”, “would”, “expect”, “intend”, “project”, “plan”, “aim”, “seek”, “target”, “anticipate”, “believe”, “estimate”, “predict”, “potential” or the negative of these terms or other similar terminology. These statements are not guarantees of future performance and are subject to various risks and uncertainties. Actual results, performance or achievements, or those of the industries in which we operate, may differ materially from any future results, performance or achievements expressed or implied by these forward-looking statements. In addition, these forward-looking statements are necessarily dependent upon assumptions, estimates and data that may be incorrect or imprecise and involve known and unknown risks and uncertainties. Forward-looking statements regarding operating results are particularly subject to a variety of assumptions, some or all of which may not be realized. Risks, uncertainties or other factors that could cause actual results to differ materially from those expressed in any forward-looking statement include, without limitation: (1) increase in awareness of health concerns related to smoking; (2) regulatory developments; including, without limitation, tax increases and restrictions on sales,
marketing, packaging, labeling and use of tobacco products, privately imposed restrictions and governmental investigations;
(3) litigation around the world alleging adverse health and financial effects resulting from, or relating to, tobacco products;
(4) our ability to further diversify our business beyond the traditional tobacco industry; (5) our ability to successfully expand internationally and make investments outside Japan; (6) competition and changing consumer preferences; (7) our ability to manage impacts derived from business diversification or business expansion; (8) economic, regulatory and political changes, such as nationalization, terrorism, wars and civil unrest,
in countries in which we operate; (9) fluctuations in foreign exchange rates and the costs of raw materials; and (10) catastrophes, including natural disasters. Contacts: Media and Investor Relations Division Japan Tobacco Inc. Investors: Media: Koji Tanaka, General Manager Masahito Shirasu, General Manager Tokyo: +81-3-5572-4316 Tokyo: +81-3-5572-4292 E-mail: [email protected] E-mail: [email protected] Tatsuya Tsukuura, General Manager Geneva: +41-22-367-5664 E-mail: [email protected]