175
2018 ANNUAL REPORT

2 0 1 8
A N N U A L R E P O R T

Contents
01 Introduction
08 Operational highlights
09 Chairman’s statement
11 Chief Executive Officer’s statement
14 Management report
78 Responsibility statement
79 Consolidated financial statements
85 Notes to the consolidated financial statements
140 Auditor’s report
Shurgard is the largest owner and operator of self-storage facilities in Europe by both number of stores and rentable space. We operate 232 stores in seven countries where over 150,000 customers lease our storage units every year.
147 Annual accounts of Shurgard Self Storage S.A.

KEY FINANCIALS
SHURGARD ANNUAL REPORT 2018
We have reported a solid financial year in 2018, supported by the growth of our store network.
+3.9%2018 244.7
235.52017
Property operating revenue1
€ million
+5.5%2018 153.7
145.72017
Income from property (NOI)3
€ million
+2.0%2018 136.1
133.42017
EBITDA4
€ million
-0.1%2018 99.3
99.32017
Adjusted EPRA earnings5
€ million
+0.9pp2018 62.8
61.92017
NOI margin3
%
+29.0%2018 2,153.8
1,670.02017
EPRA Net Asset Value2
€ million
1 Property operating revenue represents our revenue from operating our stores, and comprises our rental revenue, insurance revenue and ancillary revenue. The 2017/2018 comparison is shown at Constant Exchange Rates (CER), where 2017 financials are recalculated using 2018 exchange rates.
2 EPRA Net Asset Value (NAV) reflects the fair value of net assets on an ongoing, long-term basis. EPRA NAV is calculated based on NAV adjusted for the cumulative effects of deferred taxes, but does not adjust for the fair value of our investment properties.
3 Income from property (NOI), here shown at CER, is calculated as property operating revenue less real estate operating expense for the relevant period. The NOI margin is calculated as income from property (NOI) divided by property operating revenue for the relevant period.
4 EBITDA, here shown at CER, is calculated as earnings before interest, tax, depreciation and amortization, excluding valuation gains from investment property and investment property under construction, and losses or gains on disposal of investment property plant and equipment and assets held for sale.
5 Adjusted EPRA earnings, here shown at CER, exclude deferred tax expenses on items other than the revaluation of investment property, and significant one-off items that arise from events and transactions distinct for the Company’s regular operating activities.
01
Notes

AT A GLANCE
SHURGARD ANNUAL REPORT 2018
Shurgard has a venerable history in the self-storage business. The Company was started in 1995 and has been a pioneer of the concept for the past 24 years. In that time, we have built up a portfolio of urban storage facilities, selecting well-located sites that meet the needs of an increasing number of consumers and businesses looking for flexible storage solutions.
Our centralized IT and branding platform provides a consistent experience for customers and staff, while local expertise ensures that each store is optimized for the market in which it operates.
Our income from property has been growing steadily in recent years as demand grows and we are able to increase both rents and occupancy across our expanding portfolio.
Shurgard has become a trusted name in self-storage across Europe and we will continue to lead the way in meeting the growing demand for our storage solutions.
We are also fortunate to have a supportive shareholder in Public Storage, the largest US self-storage provider. We have access to all Public Storage’s experience and expertise of the far more developed market in the US, which is an invaluable resource as we build on our success.
Our store network comprises approximately 1,171,000 net rentable square meters as of December 31, 2018.
Geographically diversified portfolio
BELGIUM
10%UK
14%FRANCE
23%NETHERLANDS
25%GERMANY
8%SWEDEN
16%DENMARK
5%
02
NUMBER ONEself-storage operator in Europe with unrivaled presence and brand
232stores in 7 countries
150,000customers
over
1.2 MILLIONsquare metre of
rentable area
almost

Capital cities
152
62Major cities
STOCKHOLM
gothenburg
malmo
COPENHAGEN
hamburg
BERLIN
dusseldorf
cologne
BRUSSELS
LONDON
AMSTERDAM RANDSTAD
PARIS
lille
bordeaux
lyon
marseille
nice
As of December 31, 2018 18 stores are located in other cities not highlighted in the map “Major cities” defined as non-capital cities with certain level of population.
SHURGARD ANNUAL REPORT 2018
Our store locations
03

OUR BUSINESS MODEL
SHURGARD ANNUAL REPORT 2018
Our business model is focused on increasing the number and size of our stores using three key levers of growth, namely optimization of existing stores through redevelopment, building and opening new stores, and targeted bolt-on acquisitions.
Our redevelopments add at least 10% to the existing store footprint, and sometimes much more. These stores arealready in established locations and the extra space can be quickly integrated and optimized to generate more revenue with very little increase in running costs and interesting returns.
Our development pipeline is robust and growing. We have local teams sourcing and securing the best sites in urban areas with easy access for our customers and strong growth potential. We have increased the size of our development team to ensure we secure and build on sites in attractive and cycle-resilient locations in our existing markets.
We have a disciplined approach to acquisitions, evaluating potential opportunities according to projected demand. Once a store or portfolio is acquired, we can quickly and easily integrate it into Shurgard’s branded platform, ensuring a seamless transition and immediate earnings enhancement.
1. Efficient marketing andcustomer acquisition
2. Dynamic, automatedpricing and occupancymanagement
3. Continuously optimizedprocesses and platform
4. Expanding thefootprint of ownedbuildings throughredevelopment
OPTIMIZATION
Same-store
1
1. Focus on attractive andcycle resilient locationsin existing markets
2. Selective projectscomplying with strictoperational andfinancial criteria
NEW OPENINGS
Development
2
1. Focus on attractive locationsin existing markets
2. Benefit from Shurgard brandstrengths and marketingexpertise
3. Leverage Shurgard scalableplatform to optimize costs
TARGETED BOLT-ON ACQUISITIONS
M&A
3+ +
04
Our strategy 21 opportunities for growth: 3 levers of growth x 7 countries

05
SHURGARD ANNUAL REPORT 2018
number of stores
1995 - 2008 2008 - 2014 2015 - present
0
30
60
90
150
120
180
210
240
Growing with an efficient platform
Build portfolioPHASE 1
In the early days of Shurgard’s journey, we focused on building a strong portfolio of European stores.
Create platformPHASE 2
Between 2008 and 2014 we laid the foundations for our transformation from portfolio to platform. We did this by centralizing, standardizing and computerizing our systems, processes and expertise, enabling us to roll out strategic initiatives more efficiently and to implement a scalable and dynamic model while keeping costs down.
Leverage with M&A and development
PHASE 3
Since 2015 we have used that platform to leverage the acquisitions and developments that have added stores and square meters to our growing portfolio.
178
187
232

OUR MARKET OPPORTUNITY
SHURGARD ANNUAL REPORT 2018
Even at this early stage of the market’s development in Europe, rental rate growth is strengthening as occupancy levels stabilize between 80% and 90%. At theselevels, we can strengthen our margins by containing operating expenses and taking advantage of economies of scale.
Self-storage is still a relatively nascent industry in the European market. Penetration and consumer awareness are very low compared to the mature self-storage market in the US, but there are noticeable similarities in consumer behaviour on both sides of the Atlantic that suggests there is still substantial room for growth in our markets.
The average amount of self-storage floor area per capita across Europe is 0.02 square meters.This compares to 0.87 square meters per capita in the much more mature U.S. market.
Population (in m)
Self-storage area (sqm per capita)
SOURCES: FEDESSA 2018
USAEU
0.870.02
327
492
Self-storage market overview
06

Self-storage is a niche real estate sector that rents storage units, typically on a monthly basis, to individuals (approximately 75%) and business users (approximately 25%). Individuals primarily use self-storage to store household goods, while businesses usually store excess inventory or archived records. Storage units often differ in size and can range from 1 square meter to more than 50 square meters. For individuals, the industry accommodates storage needs generated by a broad set of “life changes” - e.g. marriage, relocation, divorce, death, moving and university - as well as longer-term discretionary uses. On the commercial side, self-storage is used by small businesses, e-businesses and other home-based operations as well as large companies looking for overflow storage or the ability to place materials in various locations for sales people or retail distribution.
SHURGARD ANNUAL REPORT 2018
Geographic spread Growth levers Market opportunity
Multiple growth opportunity
07
Strong fundamental demand drivers
1. Density / Urbanization
2. Purchase power
3. Life events (marriage, relocation, divorce, death)
4. Mobility
5. Rising consumer awareness
RESIDENTIAL CUSTOMERS
75% of the market
1. Flexibility (size, price, duration)
2. Convenience (location, access)
COMMERCIAL CUSTOMERS
25% of the market
Demand drivers

SHURGARD ANNUAL REPORT 2018
08
OPERATIONAL HIGHLIGHTS 2018 In March 2018, we opened a newly built facility in Stockholm (Huddinge), adding 4,655 net rentable square meters to our existing portfolio.
On June 29, 2018, we paid €38.4 million in cash for five self-storage facilities (a total of 23,957 net rentable square meters) located in Sweden that we acquired from Pelican Self Storage. This transaction increased our Swedish portfolio from 31 to 36 stores, reinforcing our position as the market leader in the country. Following the acquisition, the stores were rebranded under the Shurgard name. The acquisition did not have any impact or cause any disruption for the former Pelican customers.
On July 13, 2018, we distributed €255.0 million out of distributable reserves to our existing shareholders Shurgard European Holdings LLC and Shurgard Guernsey Investment LLC.
In October 2018, we opened our third facility in Berlin (Neukoelln). This newly built store added a total of 7,178 net rentable square meters spread over four floors. It caters to the growing number of families, students and businesses who need storage in Berlin.
On October 15, 2018, we acquired a store in London (Kensington) adding 5,225 net rentable square meters for €36.2 million.
On October 15, 2018, we successfully completed our initial public offering, and our shares were traded for the first time on Euronext Brussels. The issuance of 25,000,000 new shares at €23.00 per share generated gross cash proceeds for the Company of €575.0 million. We utilized some of the funds for the repayment of debt and the financing of the acquisitions of the Kensington store and ABC Selfstore. The remaining cash will support our future growth strategy, consisting of development and redevelopment activities, as well as acquisition opportunities as they arise.
On November 22, 2018, we acquired three self-storage facilities in Central London (Camden, Wandsworth and Southwark) for €56.0 million from ABC Selfstore. The acquisition increased the number of our London properties to 31 and added a further 11,876 net rentable square meters to our London portfolio.
We completed major redevelopment projects at three stores in the Netherlands, two in France and one in Germany which added in total 4,427 net rentable square meters of storage space.
On the night of December 31, 2018, a fire at Shurgard’s Croydon Purley Way store in London completely destroyed the building and it was subsequently demolished for safety reasons. Shurgard was insured for the reconstruction costs of the property, as well as for any loss of revenue for the following 12 months.
SHURGARD ANNUAL REPORT 2018
09
CHAIRMAN’S STATEMENT I am very pleased to be writing the Chairman’s statement of our first annual report as a publicly listed company on the Euronext Brussels Stock Exchange. The initial public offering in October marked a milestone in the Company’s development, and its success reflects the hard work and determination of all the team at Shurgard. The board’s decision to list has been a considered and careful one. It is based on management’s stellar performance in acquiring and developing storage properties across our European markets and executing an ambitious growth strategy. We believe that becoming a public company will strengthen the position of Shurgard as the leading self-storage company in Europe, open up an alternative supply of capital and give the company another source of growth. The decision to IPO in October was prescient. Shortly after our listing, the window of opportunity in the market quickly closed and some companies were unlucky enough to have to delay their offering. But Shurgard successfully came to market with an institutional share offering that raised €575.0 million and we now have a broader, but equally solid, foundation of shareholders.
GOVERNANCE STRATEGY
Shurgard has always maintained a governance strategy underpinned by strong leadership, accountability, responsibility and integrity. This will not change now that we are a public company, but we will also benefit from the addition of new directors to help guide and support the management team. The IPO has given us the opportunity to add people with a variety of skills and perspectives to our board. We now have a majority of independent directors, and have added new directors with financial, marketing, branding and technology skills that will further strengthen our organization. In addition, we have tried to adopt best practices from both Europe and the US in setting the governance structure of our board. We have independent directors on all key committees and we have established a lead independent director to provide leadership and advise the board if any matters of conflict arise.
MAJOR SHAREHOLDERS
Public Storage has been the owner or managing shareholder of Shurgard for over 12 years. Throughout this time, the Company has had access to Public Storage’s management, marketing and development expertise, IT systems, software, and all other strategic and operational knowledge. This has provided Shurgard with an important competitive advantage in the European self-storage market. Shurgard is a key investment for Public Storage, which did not sell any of its shares at the IPO, and expects to retain its holding in Shurgard. Shurgard’s other major investor is New York State Common Retirement Fund (NYSCRF).

SHURGARD ANNUAL REPORT 2018
10
The relationship between Shurgard and Public Storage is beneficial for all parties. Public Storage has been in the business of self-storage for almost 50 years. In this time, the US self-storage market has grown from 80 million square meters in the mid-1990s to 285 million square meters today. This growth has been supported by strong consumer awareness and changing demographics like population growth, mobility and increased personal wealth. Today North Americans are used to using external storage units, and penetration is substantially higher than in Europe. In the US, there is 0.87 square meters of storage per person. In western Europe it is a fraction of that at just 0.02 square meters of storage per person. In the 12 years since Public Storage has owned Shurgard, there have been noticeable similarities in customer behavior between Europe and the US. As consumers become increasingly aware of self-storage in Europe we see substantial opportunity for growth in the market, and for Shurgard as the leader in that market.
GROWTH STRATEGY
A key part of our growth strategy is both the redevelopment of existing facilities and the development of new purpose-built properties. There is a shortage of self-storage in Europe and we need to add to that capacity to grow the market and the business. To this end we have a medium-term strategy to build five properties per year. We recognize that the development process is long and complex, and the most critical aspect of it is the skillset of the people carrying out the development. To achieve this medium-term objective, we hired experienced people to source suitable sites, manage the planning process, optimize the building structure and oversee the construction. With the right people in place and the IPO completed, we also have sufficient capital to undertake this longer-term strategy. While new build storage fulfils the need for more storage space in the market, acquisitions also make up an important part of Shurgard’s development strategy. With a fully developed brand and IT platform, acquisitions can be quickly integrated into our portfolio and immediately optimized to generate the best value and growth. During 2018 we acquired nine stores, five in Sweden and four in London. Our medium-term guidance is to acquire three stores per year. The fragmented nature of the self-storage market in Europe means that sensible opportunities may arise more frequently. With our higher profile as a Euronext listed company, we hope to be a first port of call in a consolidating market.
FINANCIAL STRATEGY
The IPO has enabled the company to draw on a new source of funding, however it has not changed our corporate financial strategy, which has always been to maintain a long-term loan to value ratio below 35%, which will give us access to the debt market. This past year has been a transformative one for the business. We have a clear and ambitious but achievable strategy to take Shurgard into the future as a listed company. With strong management in place, new development plans and a market-leading brand, we look forward to another year of growth in 2019. Ronald L. Havner, Jr. Chairman of the Board of Directors

SHURGARD ANNUAL REPORT 2018
11
CHIEF EXECUTIVE OFFICER’S STATEMENT Over the last ten years, Shurgard has built an integrated, optimized and scalable branded platform, and leveraged it with acquisitions and developments. Having achieved a strong and stable basis on which to grow, 2018 was a transformative year for the Company. We delivered robust financial results and came to market with our initial public offering on the Brussels Euronext stock exchange in October. These achievements were possible with the support of our shareholders and the dedication and commitment of all our employees, who are the backbone of our business and the customer face of Shurgard across Europe.
FINANCIAL STRENGTH
We have reported a solid financial year in 2018. Property operating revenue rose 2.7% in the year to €244.7 million (+3.9% at constant exchange rates), supported by the growth of our network and the opening of newly developed and newly acquired stores. Property operating revenue at stores opened more than three years ago, or acquired over one year ago rose 1.2% at constant exchange rates. This was achieved through an increase in average rent, which is possible when mature stores have reached a stable level of occupancy. Property operating revenue from stores open less than three years or acquired within the year more than doubled to €10.8 million. This demonstrates both the ramp up in occupancy and rents enabled by Shurgard’s branded platform, as well as the addition of 11 non-same stores in 2018. Operating profit before revaluation gains rose slightly, reflecting our strong revenue and well-managed expenses, which offset the drag of IPO and acquisition costs. Other key profit measures reflect the impact of a lower valuation gain in 2018 compared to 2017. Profit before tax was €208.0 million in 2018, compared to €251.7 million in 2017. Adjusted EPRA earnings reduced by 1.3% (-0.1% at constant exchange rates) to €99.3 million. We have proposed a dividend of 25% of the target pay-out ratio of 80% of 2018 adjusted EPRA earnings.
IPO
In October, we came to the market with a successful initial public offering. The IPO was the culmination of many months of work by a dedicated team of people who balanced the requirements of the offering with the smooth operation of the business. Through the lengthy process of the IPO we managed three successful self-storage acquisitions, in Sweden and the UK, which is testament to the reliable management of the business. Now that the IPO is complete, we will use the proceeds to fund further developments to expand our portfolio of properties, and look forward to engaging with our new shareholders and Board members as a public company.

SHURGARD ANNUAL REPORT 2018
12
PROPERTY DEVELOPMENT
In 2018, we opened two new developed stores in Stockholm and Berlin, and completed redevelopment projects at three stores in the Netherlands, two in France and one in Germany. In July 2018, we completed the acquisition of five Pelican self-storage facilities in Sweden. We also acquired one third-party managed London store in October 2018, and three freehold London stores from ABC Selfstore in November 2018. Rebranding and IT integration was done for all 9 properties just a few days after acquisition. We are now at the stage where new acquisitions and new developments can be quickly integrated onto our platform. The standardization of branding and services allows us to bring new properties online efficiently, build up occupancy, and then use our proprietary pricing and portfolio system to optimize value from our stores. This optimization has helped us improve our income from property (NOI) margin through operational efficiency at the store level. In 2018 NOI margin strengthened to 62.8% from 62.0% in 2017. Unfortunately, on New Year’s Eve 2018 a fire at our Croydon, Purley Way store in London destroyed the building. The store is planned to re-open in 2020.
PEOPLE
Shurgard’s growth strategy means a constant need for more talented and experienced people to work in our stores, support and management functions, and property development and construction projects. To attract and retain the top talent that has helped us achieve our goals, we launched the Shurgard Academy in 2018. The Academy provides a transparent process of continuous development and empowers our store employees to develop throughout their career. Despite only launching in September, 122 staff members have already started the Academy program. The success of Shurgard rests on the service we provide and the talent that drives the levers of our business. I would like to thank all our employees for making 2018 a transformative year of growth.
CUSTOMERS
Our customers are at the heart of the business. They live and work within the community around our stores, which means when we engage with our community, they also feel the benefits. Our aim is to provide a safe, secure, welcoming and helpful environment when our customers turn to us for their self-storage needs. Their feedback is an important indicator of our operational success and we work hard to maintain positive interactions. As a result of our efforts, we enjoy an average Feefo1 rating of 4.6 stars, with national rankings from 4.5 stars to 4.7 stars. Throughout the year, we conducted focus group research and online surveys to understand our customers’ requirements and better serve their needs. The engaging content on our local websites is updated regularly with ideas and suggestions designed to improve their storage experience.
1 Feefo star-rating is based on the direct reviews of genuine Shurgard customers who rate the service along a five-point scale (1 for very bad to 5 for excellent).

SHURGARD ANNUAL REPORT 2018
13
OUTLOOK
We have three new developments planned for 2019 in the Netherlands, the UK and Germany, and four redevelopment projects, one of which will almost double the rentable space of the store. Our pipeline is growing as we add more property development expertise to our team, and in the medium term we plan to build five new developments a year. Our acquisition target is three properties per year. We are targeting 1.5%-2.5% annual Same Store revenue growth in the medium term, and 4% to 6% growth for All Store revenue. Shurgard expects at least two percentage points NOI margin improvement. We look forward to 2019 and the exciting opportunities it holds for Shurgard. Marc Oursin Chief Executive Officer

SHURGARD ANNUAL REPORT 2018
CHAPTER IPSUM 14
MANAGEMENT REPORT
SHURGARD ANNUAL REPORT 2018
15
TABLE OF CONTENTS
Key financials ...................................................................................................................................................................................... 16 Preliminary remarks .......................................................................................................................................................................... 17 Group overview ................................................................................................................................................................................... 17
Business model ......................................................................................................................................................................................................... 17 Our operating platform ........................................................................................................................................................................................... 17 Group structure ........................................................................................................................................................................................................ 18 Management .............................................................................................................................................................................................................. 19
Market overview ................................................................................................................................................................................ 20 Self-storage basics .................................................................................................................................................................................................. 20 European self-storage market ............................................................................................................................................................................ 20
Growth Strategy ................................................................................................................................................................................. 21 New development ..................................................................................................................................................................................................... 21 Redevelopment .......................................................................................................................................................................................................... 21 Acquisitions ................................................................................................................................................................................................................ 21 Yield management ................................................................................................................................................................................................... 21
Property portfolio ............................................................................................................................................................................... 22 Our stores ................................................................................................................................................................................................................... 22 Store layout ............................................................................................................................................................................................................... 24
Operational and Financial Review ................................................................................................................................................. 24 Group Results ............................................................................................................................................................................................................ 24 EPRA KPIs ................................................................................................................................................................................................................... 32 Liquidity ...................................................................................................................................................................................................................... 35 Financial position..................................................................................................................................................................................................... 36 Dividend ...................................................................................................................................................................................................................... 37 Outlook ........................................................................................................................................................................................................................ 37
Non-financial Information .............................................................................................................................................................. 38 Environment .............................................................................................................................................................................................................. 38 Social and people ...................................................................................................................................................................................................... 41 Anti-corruption and anti-bribery ........................................................................................................................................................................ 45 Respect for human rights ..................................................................................................................................................................................... 46
Principal risks and uncertainties ................................................................................................................................................... 47 Overall statement on the risk position ............................................................................................................................................................. 47 Risk management system ..................................................................................................................................................................................... 47 Accounting-related internal controls ................................................................................................................................................................ 48 Key risks specific to the Group and its industry ............................................................................................................................................ 48
Share Capital ...................................................................................................................................................................................... 56 Initial Public Offering .............................................................................................................................................................................................. 56 Basic share data ....................................................................................................................................................................................................... 57 Shareholders ............................................................................................................................................................................................................. 58
Luxembourg Takeover Law disclosure ........................................................................................................................................ 59 Related Party Transactions ............................................................................................................................................................. 61 Corporate Governance ..................................................................................................................................................................... 62
Corporate Governance Regime ............................................................................................................................................................................ 62 Board of Directors.................................................................................................................................................................................................... 62 Senior Management ................................................................................................................................................................................................ 68 Directors’ and management conflicts of interest.......................................................................................................................................... 68 Annual General Meeting ........................................................................................................................................................................................ 69 Statutory auditor ...................................................................................................................................................................................................... 69
Compensation Report ...................................................................................................................................................................... 70 Executive compensation policy ........................................................................................................................................................................... 70 Executive compensation in 2018 ........................................................................................................................................................................ 72 Non-Executive Director compensation policy ................................................................................................................................................ 76 Compensation of Members of the Board of Directors in 2018 ................................................................................................................. 77 Directors’ and Officers’ insurance ...................................................................................................................................................................... 77
Responsibility Statement ................................................................................................................................................................ 78

SHURGARD ANNUAL REPORT 2018
16
KEY FINANCIALS
(in € millions, except where indicated) 2018 2017 +/- +/- (CER)1
Property KPIs at period end
Number of stores 232 221 5.0%
Net rentable sqm2 1,171 1,116 4.9%
Net rented sqm3 1,003 956 4.9%
Occupancy rate4 85.6% 85.7% -0.1pp
Property KPIs for the period
Average occupancy rate5 86.9% 87.5% -0.6pp
Average in-place rent (in € per sqm)6 211.4 212.8 -0.7% 0.6%
RevPAM (in € per sqm)7 215.3 217.4 -1.0% 0.2%
Financial KPIs for the period
Property operating revenue8 244.7 238.3 2.7% 3.9%
Income from property (NOI)9 153.7 147.7 4.1% 5.5%
NOI margin10 62.8% 62.0% 0.8pp 0.9pp
EBITDA11 136.1 135.3 0.6% 2.0%
Adjusted EPRA earnings12 99.3 100.6 -1.3% -0.1%
Adjusted EPRA earnings per share (basic) (in €) 1.44
Average number of shares (in millions) 69.1
Dividend per share (in €)13 0.22
Financial KPIs at period end
Fair value of investment property 2,559.3 2,300.7 11.2%
Loan to Value (LTV)14 13.9% 25.3% -11.4pp
1 In the Constant Exchange Rate (CER) comparison, 2017 financials are recalculated using 2018 exchange rates.
2 Net Rentable Square Meters is presented in thousands of square meters and calculated as the sum of unit space available for customer storage use at our stores, measured in square meters, based on our unit size categories, as of the relevant date.
3 Net Rented Square Meters is presented in thousands of square meters and calculated as the sum of unit space rented by customers at our stores, measured in square meters, based on our unit size categories, as of the relevant date.
4 Occupancy Rate is presented in percent and calculated as the Net Rented Square Meters divided by Net Rentable Square Meters as of the relevant date.
5 Average Occupancy Rate is presented in percent and is calculated as the average of the Net Rented Square Meters divided by the average of the Net Rentable Square Meters, each for the relevant periods.
6 Average In-place Rent is presented in € per square meter and calculated as rental revenue, on a constant exchange rate basis, divided by the average Net Rented Square Meters for the relevant period.
7 RevPAM, which stands for revenue per available square meter, is presented in € per square meter for the relevant period and calculated as property operating revenue, on a constant exchange rate basis, divided by the average Net Rentable Square Meters for the relevant period.
8 Property operating revenue represents our revenue from operating our stores, and comprises our rental revenue, insurance revenue and ancillary revenue.
9 Income from property (NOI) is calculated as property operating revenue less real estate operating expense for the relevant period.
10 NOI Margin is calculated as income from property (NOI) divided by property operating revenue for the relevant period.
11 EBITDA is calculated as earnings before interest, tax, depreciation and amortization, excluding (i) valuation gains from investment property and investment property under construction and (ii) losses or gains on disposal of investment property plant and equipment and assets held for sale.
12 Adjusted EPRA earnings is calculated as EPRA earnings adjusted for (i) deferred tax expenses on items other than the revaluation of investment property and (ii) special items (“one-offs”) that are significant and arise from events or transactions distinct from the regular operating activities.
13 Dividend per share is calculated as 25% of 80% of the adjusted EPRA earnings for the year 2018, divided by the number of shares outstanding as at year end 2018 (88,815,910 shares). Subject to approval by the shareholders at the Company’s Annual General Meeting of April 30, 2019.
14 Net debt expressed as a percentage of the fair value of the Group’s investment property.

SHURGARD ANNUAL REPORT 2018
17
PRELIMINARY REMARKS
Shurgard Self Storage SA (the “Company”, and references to “Shurgard”, “we”, “us”, “our” or the “Group” are to the Company together with its consolidated subsidiaries) has the form of a public limited liability company (Société Anonyme) and is governed by the laws of the Grand Duchy of Luxembourg. Certain statements contained herein may be statements of future expectations and/or other forward-looking statements that are based on our current views and assumptions. These involve known and unknown risks and uncertainties that may cause actual results, performance or events to differ materially from those expressed or implied in such statements. Shurgard does not intend and does not undertake any obligation to revise these forward-looking statements.
GROUP OVERVIEW
BUSINESS MODEL
We are the largest owner and operator of self-storage facilities, which we refer to as stores, in Europe in terms of number of stores and net rentable square meters.2 We began operating in 1995 and are one of the pioneers of the self-storage concept in Europe. As of December 2018, our network of 232 stores comprised approximately 1,171,000 net rentable square meters serving more than 150,000 customers in the Netherlands, France, Sweden, the United Kingdom, Belgium, Germany and Denmark. Across this network, we have developed an integrated self-storage group with local expertise in the seven countries. We have centralized in-house capabilities to design, develop, acquire and operate stores to provide a consistent experience to residential and commercial customers. We generate revenue through the lease of storage units and related activities, including insurance referrals and the sale of storage products and packaging. Our property operating revenue and income from property (NOI), have increased steadily in recent years. Over this time, we increased rental rates across our network while growing occupancy, and grew our portfolio through new developments, redevelopments and acquisitions. The table below shows our property operating revenue and NOI for the financial year 2018 compared to 2017. (in € millions) 2018 2017 +/-
Property operating revenue 244.7 238.3 2.7%
NOI 153.7 147.7 4.1%
NOI margin 62.8% 62.0% 0.8pp
The fair value of our investment properties, including investment properties under constructions, was €2,559.3 million as of December 31, 2018, as compared to €2,300.7 million as of December 31, 2017.
OUR OPERATING PLATFORM
Our integrated and centralized operating platform allows us to manage many operational functions for our portfolio of stores from a central location/head office. This centralization of skills and management enables us
2 FEDESSA 'European Self Storage Annual Survey' 2018

SHURGARD ANNUAL REPORT 2018
18
to run a lean organization and provides significant operational leverage. The resulting economies of scale have a direct positive impact on our NOI margin, which came to 62.8% in 2018 compared to 62.0% in 2017. Our platform approach relies on consistency in our performance measures and key support functions across the portfolio. This means managing the yield achieved from our stores through a balance of occupancy and pricing levels. It also means we have consistency in operational and management initiatives, such as aligning sales processes, branding, shop design and supplier relations. On a granular level though, we can gather information on local conditions and monitor online traffic, conversion rates and other key metrics through our automated centralized information management systems. We continue to target growth through further development and bolt-on acquisitions. As an increasing proportion of our sales and marketing activities migrate to online customer interactions, we believe this platform approach will play a significant role in maintaining efficient operations across our network. This belief is supported by the scalability of our information management systems and centralized platform, and the consistency of operations in each of our stores.
GROUP STRUCTURE
Shurgard Self Storage SA is the parent company and principal holding company of the Group. The Company’s significant subsidiaries are in the Netherlands, France, Sweden, the United Kingdom, Belgium, Germany and Denmark.
Name Jurisdiction Percentage Ownership (directly or indirectly)
Shurgard Luxembourg S.à r.l. Luxembourg 100.0%
Shurgard Holding Luxembourg S.à r.l. Luxembourg 100.0%
Shurgard France SAS France 100.0%
Shurgard Belgium Comm. CVA/SCA Belgium 100.0%
Shurgard Europe VOF/SNC Belgium 100.0%
Shurgard Germany GmbH Germany 100.0%
First Shurgard Deutschland GmbH Germany 94.8%
Second Shurgard Deutschland GmbH Germany 94.8%
Shurgard Nederland B.V. The Netherlands 100.0%
Shurgard UK Ltd. United Kingdom 100.0%
Shurgard Denmark ApS Denmark 100.0%
Shurgard Sweden AB Sweden 100.0%
Shurgard Storage Centers Sweden KB Sweden 100.0%
All the Company’s subsidiaries are, directly and indirectly, wholly owned, except for First Shurgard Deutschland GmbH and Second Shurgard Deutschland GmbH. We own 94.8% of these two companies and the remaining 5.2% therein is held by our two Principal Shareholders through Shurgard German Holdings LLC.
SHURGARD ANNUAL REPORT 2018
19
MANAGEMENT
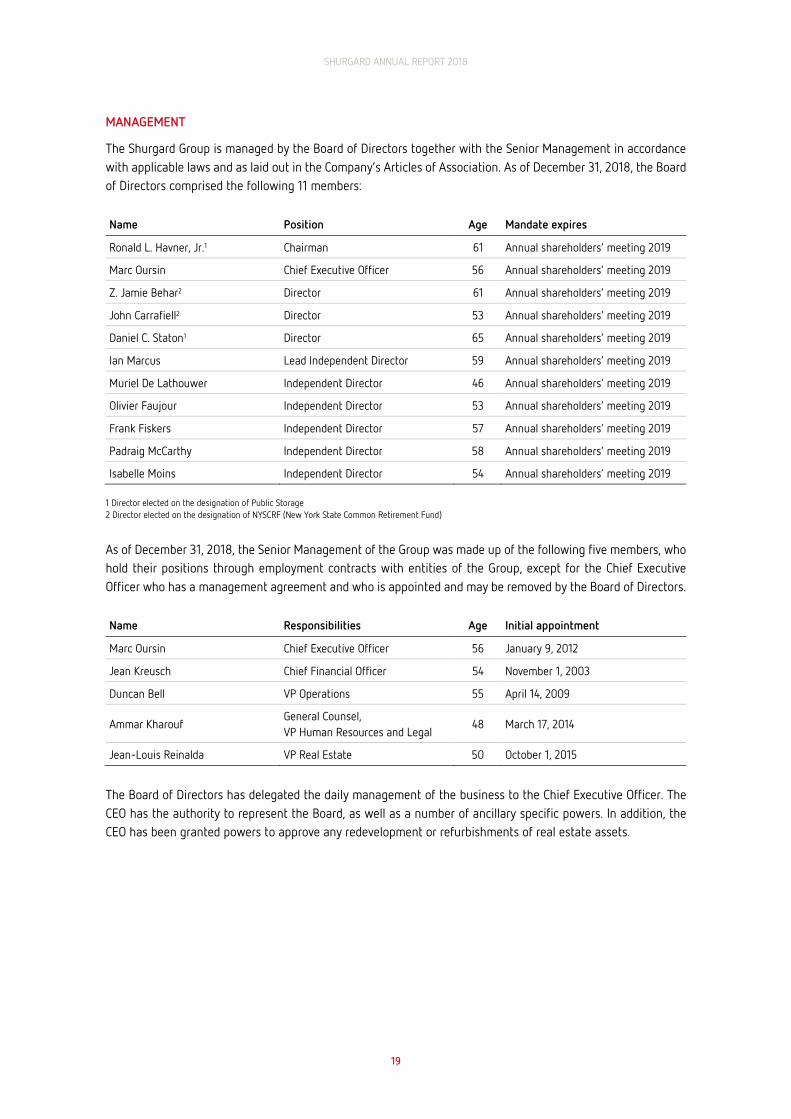
The Shurgard Group is managed by the Board of Directors together with the Senior Management in accordance with applicable laws and as laid out in the Company’s Articles of Association. As of December 31, 2018, the Board of Directors comprised the following 11 members:
Name Position Age Mandate expires
Ronald L. Havner, Jr.1 Chairman 61 Annual shareholders’ meeting 2019
Marc Oursin Chief Executive Officer 56 Annual shareholders’ meeting 2019
Z. Jamie Behar2 Director 61 Annual shareholders’ meeting 2019
John Carrafiell2 Director 53 Annual shareholders’ meeting 2019
Daniel C. Staton1 Director 65 Annual shareholders’ meeting 2019
Ian Marcus Lead Independent Director 59 Annual shareholders’ meeting 2019
Muriel De Lathouwer Independent Director 46 Annual shareholders’ meeting 2019
Olivier Faujour Independent Director 53 Annual shareholders’ meeting 2019
Frank Fiskers Independent Director 57 Annual shareholders’ meeting 2019
Padraig McCarthy Independent Director 58 Annual shareholders’ meeting 2019
Isabelle Moins Independent Director 54 Annual shareholders’ meeting 2019 1 Director elected on the designation of Public Storage 2 Director elected on the designation of NYSCRF (New York State Common Retirement Fund)
As of December 31, 2018, the Senior Management of the Group was made up of the following five members, who hold their positions through employment contracts with entities of the Group, except for the Chief Executive Officer who has a management agreement and who is appointed and may be removed by the Board of Directors. Name Responsibilities Age Initial appointment
Marc Oursin Chief Executive Officer 56 January 9, 2012
Jean Kreusch Chief Financial Officer 54 November 1, 2003
Duncan Bell VP Operations 55 April 14, 2009
Ammar Kharouf General Counsel, VP Human Resources and Legal
48 March 17, 2014
Jean-Louis Reinalda VP Real Estate 50 October 1, 2015
The Board of Directors has delegated the daily management of the business to the Chief Executive Officer. The CEO has the authority to represent the Board, as well as a number of ancillary specific powers. In addition, the CEO has been granted powers to approve any redevelopment or refurbishments of real estate assets.

SHURGARD ANNUAL REPORT 2018
20
MARKET OVERVIEW
SELF-STORAGE BASICS
Self-storage is a niche real estate sector that rents storage units, typically on a monthly basis, to individuals (approximately 75%) and business users (approximately 25%). Individuals primarily use self-storage to store household goods, while businesses usually store excess inventory or archived records. Storage units often differ in size and can range from 1 square meter to more than 50 square meters.
For individuals, the industry accommodates storage needs generated by a broad set of “life changes” - e.g. death, divorce, marriage, relocation, moving and university - as well as longer-term discretionary uses. On the commercial side, self-storage is used by small businesses, e-businesses and other home-based operations as well as large companies looking for overflow storage or the ability to place materials in various locations for sales people or retail distribution.
EUROPEAN SELF-STORAGE MARKET
The European self-storage market has been characterized by a period of sustained growth in recent years. It currently comprises nearly 3,800 facilities across Europe, providing over 9.7 million square meters of space.3 In the seven countries where we operate, there are approximately 8.0 million square meters of rentable area across approximately 2,860 self-storage facilities (including UK containers).3
The largest self-storage market in Europe is the UK, accounting for 40% of total facilities. Over 82% of the facilities are located in the six most mature countries within Europe (UK, France, Spain, Netherlands, Germany and Sweden).3 The average amount of self-storage floor area per capita across Europe is 0.02 square meters. This compares to 0.87 square meters in the much more mature U.S. market, indicating significant further growth potential.3 In terms of competition, the European self-storage market is still highly fragmented. The ten largest European self-storage operators account for 23% of all self-storage facilities and 39% of the total self-storage space.3 Shurgard, as the largest operator, represents approximately 7% of the facilities and 13% of the total space.3
The industry growth has been driven by increases in customer demand, supported by demographic and macroeconomic trends and increasing customer awareness of self-storage. Continued development in the supply of self-storage facilities and consolidation among self-storage providers has also driven growth.
Several factors have supported demand for self-storage from residential customers in recent years. These include favorable demographic and macroeconomic trends, such as population growth, urbanization, higher levels of mobility, micro-living, increasing personal wealth and ownership of more storable goods, as well as increased consumer awareness. These trends have been particularly strong in urban areas, where high density levels, elevated housing costs and the scarcity of housing and storage space are expected to support longer-term pricing rates and occupancy levels. Demand from business customers has been supported by growth of new online retailers and small businesses, which require flexible and cost-effective storage options. We expect these trends to continue to support demand for self-storage in the coming years.
Supply of self-storage facilities has grown significantly in recent years, alongside increases in customer demand. This growth is also influenced by the high level of fragmentation in the European self-storage industry. As a result, the market has been characterized by periods of consolidation in recent years, which we expect to continue in the future.
3 FEDESSA 'European Self Storage Annual Survey' 2018

SHURGARD ANNUAL REPORT 2018
21
GROWTH STRATEGY
Our goal is to enhance shareholder value by further strengthening our position as the leading self-storage operator in Europe, operating strategically-located stores and providing a level of customer service designed to satisfy the requirements and priorities of both residential and business customers. We are aiming at expanding our position in the seven countries we already operate in, with a particular focus on attractive urban areas such as London, Paris and Berlin. Our growth strategy relies on our established track record of redeveloping, developing and acquiring stores. With our centralized operating platform, we will benefit from immediate operating leverage and additional economies of scale.
REDEVELOPMENT
We continuously monitor a variety of demand metrics across our existing store network. These are based on factors like occupancy rates for various unit sizes, customer visits to our website, online pricing searches, and in-store interactions with our customers. We will continue to analyze our operations for opportunities to undertake remix projects. We reorganize the units at a store to reflect customer demand in that particular market to improve occupancy levels or increase rental rates. We also expand our existing stores when there is an increase in local demand and the returns justify the expansion of rentable area. Redevelopments may increase the rentable area of a store by at least 10%, but in many cases the rentable areas are increased by substantially more than 10%.
NEW DEVELOPMENT
The opening of new stores has proven to be an important lever of our growth. We are seeking at least five development projects per year in the medium term, with our reinforced development team of 16 dedicated development specialists. To do so, we focus on a set of clear selection criteria, both operational and financial, including attractive and cycle-resilient locations in our existing markets.
ACQUISITIONS
Finally, we intend to continue to take advantage of the strong fragmentation of the self-storage market in Europe to acquire stores across the seven countries where we operate, as well as strategic acquisitions where we deem appropriate. We believe that our experience and knowledge of the markets in which we currently operate should enable us to identify opportunities with attractive potential returns. We are targeting three store acquisitions per year on average in the medium term, benefiting from immediate operating leverage and additional economies of scale. We continue to focus on urban areas that we anticipate will enjoy strong demand during all economic cycles and provide attractive growth potential.
YIELD MANAGEMENT
Our goal is to maximize revenue through increased occupancy levels and rental rates. When a store’s occupancy rate reaches approximately 92%, we generally consider it to be “stabilized” and seek to increase rental rates to drive revenue growth through best-in-class yield management. We regularly evaluate our stores’ rental rates based on unit demand and unit availability. We adjust our marketing and promotional activities and change rental rates as necessary to seek to enhance revenue.

SHURGARD ANNUAL REPORT 2018
22
BRAND AND MARKETING We believe that the Shurgard brand is a critical marketing tool and we use a variety of channels to increase customer awareness of our name. These include highly visible store locations, site signage and architectural features. In addition, our marketing and sales processes are supported by a number of activities on social media and other websites to improve our brand awareness and direct potential customers to our website and stores.
RESEARCH AND DEVELOPMENT As part of our marketing activities, we regularly conduct focus group research and online surveys to identify the primary considerations in customers’ self-storage choices and satisfaction. This allows us to better attract and service customers.
PROPERTY PORTFOLIO
OUR STORES
The number of stores we own and operate has grown to a network of 232 stores comprising approximately 1,171,000 net rentable square meters as of December 31, 2018 (as of December 31, 2017: 221 stores and approximately 1,116,000 net rentable square meters). We primarily operate in urban areas across Europe, with approximately 92% of our stores located in capital and major cities. As of December 31, 2018, approximately 95% of our net square rentable area was in stores that we wholly own (“freehold stores”) or operate under long-term lease agreements of at least 80 years remaining life (“long leasehold stores”). The occupancy rate across all our stores was at 86.9% on average over 2018. The average in-place rent per square meter per year was at €211.4 in 2018. The following table shows our portfolio by country, as of December 31, 2018:
Total number of
stores
Net rentable square meters (in thousands)
Freehold and long leasehold1
Average occupancy rate2
Average in-place rent (in € per
square meter)3
The Netherlands 61 290 87% 87.2% 179.2
France 56 273 96% 88.0% 225.4
Sweden 36 183 96% 90.3% 232.9
United Kingdom 31 164 100% 78.1% 248.4
Belgium 21 118 100% 87.0% 174.0
Germany 17 90 100% 88.7% 208.8
Denmark 10 53 100% 91.0% 236.9
Total 232 1,171 95% 86.9% 211.4 1 Average calculated as a weighted average by net rentable square meters 2 Average occupancy rate is calculated as the average of the net rented square meters divided by the average of the net rentable square meters 3 Average in-place rent is calculated as rental revenue divided by the average net rented square meters
In 2018, we developed two new stores, completed redevelopment projects at six stores, and acquired nine stores. We opened a new store in Stockholm in March and a second new-build store in Berlin in October 2018. In the Netherlands, we completed three redevelopments during 2018 as well as two redevelopments in France and one in Germany.

SHURGARD ANNUAL REPORT 2018
23
In July 2018, we completed the acquisition of five Pelican self-storage facilities in Sweden including rebranding and IT integration. We also acquired one third-party managed London store in October 2018, and three London stores from ABC Selfstore in November 2018. PROJECTS COMPLETED IN 2018
Store Region Country Net sqm
Major redevelopments
Rotterdam SP Giesenweg Randstad Netherlands 961
Alkmaar Oudorp Randstad Netherlands 895
Hoorn Other Netherlands 518
Gare de l’Est Paris France 210
Lyon Vaise Lyon France 465
Essen Ruhr Germany 1,378
New developments
Huddinge Stockholm Sweden 4,655
Neukoelln Berlin Germany 7,178
Acquisitions
Pelican Stockholm & other Sweden 23,957
Kensington London UK 5,225
ABC London UK 11,876
Total 2018 57,318
PROJECT PIPELINE
Store Region Country Net sqm Opening date
Major redevelopments
City Airport London UK 3,663 2019
Forest Hill London UK 803 2019
Sucy en Brie Paris France 628 2019
Nanterre La Défense Paris France 955 2019
New developments
Utrecht Leidsche Rijn Randstad Netherlands 5,923 2019
Oberschoeneweide Berlin Germany 5,661 2019
Herne Hill London UK 5,868 2019
Total 2019 23,501
Signed contract conditional on planning consent
Region Country Net sqm Opening date
2 properties Paris France c. 13,000 N/A
1 property London UK c. 6,000 N/A
1 property Berlin Germany c. 5,000 N/A

SHURGARD ANNUAL REPORT 2018
24
STORE LAYOUT
Although the size of our stores varies, most consist of multi-story buildings. The rental units typically range from one to 20 square meters in size. The average unit size is approximately seven square meters, although unit sizes are typically smaller in major metropolitan areas at approximately five to six square meters. As of December 31, 2018, we had approximately 770 units at each store, and our stores had an average rentable area of over 5,000 square meters.
OPERATIONAL AND FINANCIAL REVIEW
GROUP RESULTS
(in € thousands except where indicated) 2018 2017 +/- +/- CER
Real estate operating revenue 244,844 238,561 2.6% 3.9%
Real estate operating expense (91,022) (90,609) 0.5% 1.4%
Net income from real estate operations 153,822 147,952 4.0% 5.4%
General, administrative and other expenses (9,273) (10,834) -14.4% -14.3%
of which depreciation and amortization expense (1,679) (1,527) 10.0% 10.0%
Cost incurred in connection with public offering (4,744) - N/A N/A
Acquisition costs of business combinations (3,010) (1,007) 198.9% 198.9%
Royalty fee expense (2,416) (2,343) 3.1% 4.4%
Operating profit before revaluation loss and gain on disposal of investment property, plant and equipment and assets held for sale
134,379 133,768 0.5% 1.8%
Valuation gain from investment property and investment property under construction
94,588 136,621 -30.8% -29.9%
(Loss) gain on disposal of investment property plant and equipment and assets held for sale
1 (43) N/A N/A
Operating profit 228,968 270,346 -15.3% -14.2%
Finance cost (20,968) (18,616) 12.6% 14.7%
Profit before tax 208,000 251,730 -17.4% -16.3%
Income tax expense (36,309) (40,211) -9.7% -8.0%
Attributable profit for the year 171,691 211,519 -18.8% -17.9%
Attributable to non-controlling interests 475 384 23.7% 24.3%
Attributable to ordinary equity holders of the parent
171,216 211,135 -18.9% -18.0%
Earnings per share attributable to ordinary equity holders of the parent:
Basic, profit for the period (in €) 2.48
Diluted, profit for the period (in €) 2.47
Adjusted EPRA earnings per share (basic) (in €) 1.44
Average number of shares (in millions) 69.1

SHURGARD ANNUAL REPORT 2018
25
The following discussion of Group revenue and expenses down to EBITDA is based on a constant exchange rate (CER) comparison, where 2017 (actual exchange rate – AER) numbers are recalculated using 2018 exchange rates.
REAL ESTATE OPERATING REVENUE Our real estate operating revenue is comprised of property operating revenue, which includes rental revenue, insurance and ancillary revenue, and other revenue (management fee revenue and partnership income from self-storage operations).
(in € thousands) 2018 2017 +/-
Rental revenue 208,985 201,724 3.6%
Insurance revenue 25,083 23,169 8.3%
Ancillary revenue1 10,627 10,595 0.3%
Property operating revenue (CER) 244,695 235,488 3.9%
Other revenue2 149 258 -42.2%
Real estate operating revenue (CER) 244,844 235,746 3.9%
Foreign exchange 0 2,815 N/A
Real estate operating revenue (AER) 244,844 238,561 2.6% 1 Ancillary and other operating revenue consists of merchandise sales and other revenue from real estate operations. 2 Other revenue consists of management fee revenue and partnership income from self-storage operations.
Real estate operating revenue rose 3.9%, from €235.7 million in 2017 to €244.8 million in 2018. The bulk of this revenue growth comes from an increase in storage rentals supported by the growth of our network through several redevelopments, new developments and acquisitions. Due to the difference in performance levels of our recently developed and acquired stores on the one hand, which typically have lower occupancy levels, and for which we typically charge lower rental rates, and our stabilized stores on the other hand, which are generally characterized by higher occupancy levels and higher rental rates, we evaluate the performance of our stores in two segments: “Same Stores” and “Non-Same Stores”. Rental Revenue Rental revenue is derived from our core business of renting storage units. The key levers of rental revenue growth are more storage space (from acquisitions, new developments and redevelopments), as well as higher occupancy and higher rental rates. In 2018, rental revenue increased by 3.6%, from €201.7 million for 2017 to €209.0 million in 2018. This increase was primarily due to slightly higher rental rates, and the continued operational ‘ramp-up’ of our Non-Same Stores. While acquisitions and developments add extra rentable space to our portfolio, we are also able to increase the occupancy and rental rates as these new stores mature which we refer to as ‘ramp-up’. Across our expanded network, our net rented square meters increased by 4.9% from 956 thousand square meters at the end of 2017 to 1,003 thousand square meters as of December 31, 2018. Insurance Revenue When customers rent storage from Shurgard, they are required to have insurance for their stored goods. They can use their own insurance provider or buy insurance from us via an independent insurance company. Insurance revenue increased by 8.3%, from €23.2 million in 2017 to €25.1 in 2018. This increase was primarily due to the

SHURGARD ANNUAL REPORT 2018
26
continued ‘ramp-up’ in operating performance at our Non-Same Stores, as well as an increase in the proportion of new customers subscribing to insurance within our Same Store segment. Ancillary Revenue Ancillary revenue is derived from the sale of storage products in our stores including cardboard boxes and packing materials. It also includes other revenue from real estate operations. Ancillary revenue remained stable at €10.6 million for the years 2017 and 2018.
REAL ESTATE OPERATING EXPENSE
(in € thousands) 2018 2017 +/-
Payroll expense 35,452 34,607 2.4%
Real estate and other taxes 11,756 11,856 -0.8%
Repairs and maintenance 7,040 6,975 0.9%
Marketing expense 6,229 5,761 8.1%
Utility expense 3,491 3,836 -9.0%
Other operating expenses1 15,093 14,372 5.0%
Doubtful debt expense 4,081 4,441 -8.1%
Cost of insurance and merchandise sales 4,188 4,268 -1.9%
Real estate operating expense excluding property lease expense (CER)
87,330 86,116 1.4%
Property lease expense 3,692 3,626 1.8%
Real estate operating expense (CER) 91,022 89,742 1.4%
Foreign exchange 0 867 N/A
Real estate operating expense (AER) 91,022 90,609 0.5% 1 Other operating expenses mainly include: travel expenses, legal and consultancy fees, insurance expenses, non-deductible VAT and information system
expenses.
As our network of stores grows, so do the operating expenses required to run them. It is part of our strategy to contain these expenses. Real estate operating expense increased by just 1.4%, from €89.7 million in 2017 to €91.0 million in 2018. This increase, which is lower than the Group revenue growth, demonstrates the scalability of our platform. Payroll expenses went up with more staffing from €34.6 million to €35.5 million (2.4%), but this was lower than the growth in the number of properties (5.0%). Marketing expenses rose 8.1%, from €5.8 million in 2017 to €6.2 million in 2018, representing 2.5% of our revenue. The increase was attributable to the additional stores we acquired or developed in the period as well as a rise in online marketing costs.
NET INCOME FROM REAL ESTATE OPERATIONS Net income from real estate operations reflects the revenue received minus the expenses incurred in running our real estate operations. Net income growth reflects the strong strategic position of Shurgard’s platform. We are able to leverage economies of scale as we acquire or develop stores, using the standardized IT and branding platform to contain costs and ensure our revenues grow faster than our expenses. During the year we also put several energy management initiatives in place, which helped lower our utility costs and reduce expenses. Net income from real estate operations rose 5.4% from €146.0 million in 2017 to €153.8 million in 2018 at constant exchange rates.

SHURGARD ANNUAL REPORT 2018
27
The economies of scale had a direct positive impact on our income from property (NOI) margin, which rose to 62.8% in 2018 in comparison with 62.0% in 2017.
SEGMENT INFORMATION The following table shows the development of our store network (Same Stores and Non-Same Stores) and our property operating revenue split by the two segments on a year-on-year basis.
(at CER) 2018 2017 +/-
Same Stores (as of December 31) 214 214 0
Non-Same Stores (as of December 31) 18 7 11
All Stores 232 221 11
Same Store property operating revenue (in € thousands) 233,887 231,210 1.2%
Non-Same Store property operating revenue (in € thousands) 10,808 4,278 152.6%
All Store property operating revenue (in € thousands) 244,695 235,488 3.9%
Same Stores “Same Stores” are all developed stores that have been in operation for at least three full years, and all acquired stores that we have owned for at least one full year from the start of the year. The following table shows certain performance measures across our Same Stores portfolio.
(at CER) 2018 2017 +/-
Property KPIs at period end
Number of stores 214 214 0
Net rentable sqm1 1,067 1,065 0.2%
Net rented sqm2 929 933 -0.4%
Occupancy rate3 87.1% 87.6% -0.5pp
Property KPIs for the period
Average occupancy rate4 88.5% 88.8% -0.3pp
Average in-place rent (in € per sqm)5 212.1 210.3 0.9%
RevPAM (in € per sqm)6 219.3 217.7 0.7%
Financial KPIs for the period
Property operating revenue7 (in € thousands) 233,887 231,210 1.2%
Income from property (NOI)8 (in € thousands) 148,871 144,351 3.1%
NOI margin9 63.7% 62.4% 1.3pp 1 Net Rentable Square Meters for our Same Stores is presented in thousands of square meters and calculated as the sum of unit space available for customer
storage use at our Same Stores, measured in square meters, based on our unit size categories, each as of the relevant date.
2 Net Rented Square Meters is presented in thousands of square meters and calculated as the sum of unit space rented by customers at our Same Stores, measured in square meters, based on our unit size categories, each as of the relevant date.
3 Occupancy Rate for our Same Stores is presented as a percentage and calculated as the Net Rented Square Meters in our Same Stores divided by Net Rentable Square Meters in our Same Stores, each as of the relevant date.
4 Average Occupancy Rate for our Same Stores is presented as a percentage and is calculated as the average of the Net Rented Square Meters in our Same Stores divided by the average of the Net Rentable Square Meters in our Same Stores, each for the relevant period.
5 Average In-place Rent for our Same Stores is presented in Euros per square meter and calculated as rental revenue in our Same Stores, on a constant exchange rate basis, divided by the average Net Rented Square Meters in our Same Stores, each for the relevant period.

SHURGARD ANNUAL REPORT 2018
28
6 RevPAM, which stands for revenue per available square meter, for our Same Stores is presented in Euros per square meter for the relevant period and calculated as property operating revenue in our Same Stores, on a constant exchange rate basis, divided by the average Net Rentable Square Meters, each for the relevant period.
7 Property operating revenue for our Same Stores represents our revenue from operating our Same Stores, and comprises our rental revenue, insurance revenue and ancillary revenue.
8 Income from property operations (NOI) for our Same Stores is calculated as property operating revenue less real estate operating expense for our Sames Stores, each for the relevant period.
9 NOI Margin for our Same Stores is calculated as income from property (NOI) divided by property operating revenue for our Same Stores, each for the relevant period.
The average occupancy rates for our Same Store network remained strong at 88.5% and 88.8% during 2018 and 2017, respectively. This marginal decline can be explained by slightly higher move-out volumes in 2018 which were not quite offset by move-in volumes. To maintain occupancy rates at sufficiently high levels, we regularly evaluate changes in traffic patterns of new tenants renting space and the volume of existing tenants vacating. In response to these trends, we increase or decrease rental rates, promotional discounts offered and the frequency of advertising. The average in-place rent for our Same Store facilities increased 0.9% at constant exchange rates from €210.3 per square meter in 2017 to €212.1 per square meter in 2018. The growth trend decelerated during the first half of 2018 and picked up again towards year end as we reduced the number of special offers that stores benefit from to boost their activity. This meant higher rental rates on average across the year, and we also benefited from the annual rate increases we apply to existing tenants. Property operating revenue generated by our Same Stores facilities increased by 1.2% from €231.2 million in 2017 to €233.9 million in 2018, primarily due to the increase in average in-place rental rates. The income from property (NOI) for our Same Stores increased by 3.1% from €144.4 million in 2017 to €148.9 million in 2018. This reflects our well-managed property operating expenses which rose more slowly than revenues. Consequently, the NOI margin increased from 62.4% to 63.7%. Non-Same Stores Non-Same Stores are any stores that are not classified as Same Store for a given year. Occupancy and in-place rent can vary greatly between these stores depending on their maturity. Non-Same Store property operating revenue increased by 152.6% from €4.3 million for 2017 to €10.8 million in 2018. This increase was due to the continued ‘ramp-up' at our new stores and the addition of 11 Non-Same Stores in 2018.

SHURGARD ANNUAL REPORT 2018
29
OPERATIONS BY COUNTRY
(as of and for the year ended December 31, 2018)
Number of Stores
Average Occupancy
Rate1
Average In-place Rent2
Property operating revenue
(in thousands)
NOI Margin3
The Netherlands 61 87.2% €179.2 €53,414 64.4%
France 56 88.0% €225.4 €64,406 60.1%
Sweden 36 90.3% €232.9 €40,793 68.5%
The United Kingdom 31 78.1% €248.4 €34,238 57.9%
Belgium 21 87.0% €174.0 €20,825 62.8%
Germany 17 88.7% €208.8 €17,778 61.1%
Denmark 10 91.0% €236.9 €13,241 67.1%
Total 232 86.9% €211.4 €244,695 62.8%
(as of and for the year ended December 31, 2017)
Number of Stores
Average Occupancy
Rate1
Average In-place Rent2
(CER)
Property operating revenue
(in thousands) (CER)
NOI Margin3
(CER)
The Netherlands 61 86.7% €177.0 €51,881 62.5%
France 56 89.2% €224.3 €64,329 59.2%
Sweden 30 92.1% €238.0 €38,681 69.1%
The United Kingdom 27 78.7% €252.5 €30,000 56.1%
Belgium 21 87.2% €172.4 €20,679 65.0%
Germany 16 89.0% €199.9 €16,727 60.7%
Denmark 10 90.4% €237.2 €13,185 61.4%
Total 221 87.5% €210.2 €235,488 61.9% 1 Average Occupancy Rate is presented as a percentage and is calculated as the average of the Net Rented Square Meters divided by the average of the Net
Rentable Square Meters, each for the relevant period.
2 Average In-place Rent is presented in Euros per square meter and calculated as rental revenue divided by the average Net Rented Square Meters, each for the relevant period.
3 NOI Margin is calculated as income from property (NOI) divided by property operating revenue, each for the relevant period.
The countries where we added new stores and carried out major redevelopment projects, such as the United Kingdom, Germany, Sweden and the Netherlands, led the way with solid contributions of 14.1%, 6.3%, 5.5% and 2.9% property operating revenue growth year-over-year, respectively. However, we experienced softness in demand in some markets, primarily in Sweden, which resulted in lower move-in volumes. The real estate market in Sweden is one of the few in western Europe where prices have recently been falling. Occupancy in the United Kingdom and in Sweden was impacted by the addition of new stores, which take time to reach a stable level of rented units. This weighed on the average occupancy levels.

SHURGARD ANNUAL REPORT 2018
30
GENERAL, ADMINISTRATIVE AND OTHER EXPENSES
(in € thousands, at CER) 2018 2017 +/-
Payroll expense 6,334 5,284 19.9%
Share-based compensation (income) expense (772) 1,883 -141.0%
Capitalization of internal time spent on development (1,507) (1,115) 35.2%
Depreciation and amortization expense 1,679 1,527 10.0%
Other general, administrative and other expenses (balance)1 3,539 3,236 9.4%
Total 9,273 10,815 -14.3% 1 Other general and administration expenses mainly include legal, consultancy and audit fees and non-deductible VAT.
General, administrative and other expenses decreased by 14.3%, from €10.8 million in 2017 to €9.3 million in 2018. A one-off credit for the conversion of share option plans to equity plans more than offset an increase in payroll expenses and the additional costs of being public. The increase in payroll was primarily due to an increased headcount in our real estate development team, while the costs of being public includes directors’ fees, investor relations costs and Euronext fees. We also reported a higher capitalization of internal time spent on development of investment property which, like the payroll expenses, relates to an increased headcount in the real estate development team.
ACQUISITION COSTS OF BUSINESS COMBINATIONS Acquisition costs of business combinations increased from €1.0 million in 2017 to €3.0 million in 2018. This increase was largely due to greater acquisition activity (three transactions in 2018 as compared to one in 2017).
ROYALTY FEE EXPENSE We pay our shareholder Public Storage a royalty fee equal to 1.0% of revenues in exchange for the rights to use the “Shurgard” trade name. In 2018, we incurred royalty fees of €2.4 million.
OPERATING PROFIT BEFORE REVALUATION GAINS/LOSSES Based on the increased net income from real estate operations, the operating income before revaluation gains/losses increased by 0.5%, from €133.8 million in 2017 to €134.4 million in 2018. This was affected by the one-off costs of the IPO (€4.7 million) and higher acquisition costs. Excluding the IPO and acquisition costs, the operating profit before revaluation gains/losses was up 5.5%. This is a reflection of the operational strength of the business before non-cash and exceptional items.
EBITDA We consider EBITDA to be a useful indicator of our operating performance. It is calculated as earnings before interest, tax, depreciation and amortization, excluding valuation gains from investment property and investment property under construction, and losses or gains on disposal of investment property plant and equipment and assets held for sale. At constant exchange rates, EBITDA rose 2.0% from €133.4 million in 2017 to €136.1 million in 2018 mainly due to an increase in revenue of 3.9%.

SHURGARD ANNUAL REPORT 2018
31
EBITDA
(in € thousands) 2018 2017 +/-
Operating profit before revaluation loss and gain on disposal of investment property, plant and equipment and assets held for sale
134,379 133,768 0.5%
Depreciation and amortization 1,679 1,527 10.0%
EBITDA (AER) 136,058 135,295 0.6%
Foreign exchange 0 (1,902) N/A
EBITDA (CER) 136,058 133,393 2.0%
VALUATION GAINS FROM INVESTMENT PROPERTY AND INVESTMENT PROPERTY UNDER CONSTRUCTION (IPUC) The Company opted to fair value its investment properties in accordance with IAS40 and IFRS 13 on a bi-annual basis. Changes in the value of our real estate from period to period, whether caused by macroeconomic conditions or otherwise, are recorded in our consolidated statement of profit and loss as “valuation gain from investment property and investment property under construction”. Although this is a non-cash item, it has an impact on our operating profit in each period. The valuation gain from investment property and investment property under construction was €94.6 million for 2018. This is substantially lower than the valuation gain from 2017 of €136.6 million. The valuation assumptions made by external valuers Cushman & Wakefield include predicted occupancy levels, rental rates, expenses and other factors that, depending on each assumption can cause substantial fluctuations in valuation gains each year. In the period, we recognized an impairment loss of €15.5 million for the fire at our Croydon Purley Way store. Despite being a non-cash item, the lower valuation gain in 2018 compared with the year before is the primary reason operating profit, pretax profit and earnings per share are lower in 2018. The €94.6 million valuation gain in 2018 contributed to the €258.6 million increase in the valuation of our investment property and investment property under construction to €2,559.3 million as of December 31, 2018 (December 31, 2017: €2,300.7 million). This valuation gain was primarily due to the appreciation in the fair market value of our property portfolio that resulted from an increase in anticipated future cash flows of our properties, as well as improvements in market metrics, including capitalization rates and discount rates.
OPERATING PROFIT Operating profit decreased by 15.3%, from €270.3 million in 2017 to €229.0 million in 2018, mostly due to the lower valuation gains from investment property and investment property under construction in 2018 compared with 2017.
FINANCE COSTS
(in € thousands) 2018 2017 +/-
Total interest expense 19,146 18,291 4.7%
Foreign exchange loss 1,822 325 N/A
Finance cost 20,968 18,616 12.6%

SHURGARD ANNUAL REPORT 2018
32
Finance costs increased by 12.6%, from €18.6 million in 2017 to €21.0 million in 2018. The factors affecting the increase in finance costs include a €1.5 million increase in foreign exchange losses, a €0.3 million interest cost for the Société Générale bridge loan, €0.4 million of tax assessment interest cost provisions and a €0.2 million decrease in capitalization of interest for our development and re-development projects.
INCOME TAX EXPENSE
(in € thousands) 2018 2017 +/-
Current tax expense 19,420 15,226 27.5%
Deferred tax expense 16,889 24,986 -32.4%
Income tax Expense 36,309 40,211 -9.7%
Effective tax rate1 16.4% 13.1% 3.3pp 1 Effective tax rate is current tax expenses divided by Adjusted EPRA Earnings before tax.
Current tax expenses increased by 27.5%, from €15.2 million in 2017 to €19.4 million in 2018. Deferred tax expenses in 2018 amounted to €16.9 million, 32.4% lower than the €25.0 million in 2017. Deferred tax expenses were impacted by a decrease in deferred tax liabilities, as a result of Swedish and Dutch tax reforms enacting a decrease in our future tax rates, and lower valuation gain from investment property. Our effective tax rate in 2018 was 16.4%, compared with 13.1% in 2017, based on the current tax expense divided by the adjusted EPRA earnings before tax for the relevant period. The variation is due to the utilization of net operating losses (NOLs) in 2017, while there was limited use of NOLs in 2018. Based on current tax laws, we anticipate this effective tax rate to stabilize between 18% and 20% in the medium term.
ATTRIBUTABLE PROFIT AND ATTRIBUTABLE PROFIT PER SHARE
Despite achieving strong operating profit before non-cash and exceptional items, and despite lower income taxes, the diminished valuation gain dragged total attributable profit for the year down 18.8%, from €211.5 million in 2017 to € 171.7 million in 2018. For the year 2018, €171.2 million (2017: €211.1 million) was attributable to the shareholders of Shurgard Self Storage SA, and €0.5 million (2017: €0.4 million) was attributable to non-controlling interests. Based on the average number of shares (2018: 69.1 million) this translates into earnings per share of €2.48.
EPRA KPIs
We have identified certain non-GAAP and non-IFRS measures that we believe give a good reflection of the performance of our underlying business. They are based on definitions by the European Public Real Estate Association (“EPRA”), a not-for-profit association registered in Belgium, in their Best Practices Guidelines dated November 2016. They include EPRA earnings, adjusted EPRA earnings, adjusted EPRA EBITDA and EPRA net asset value per share.
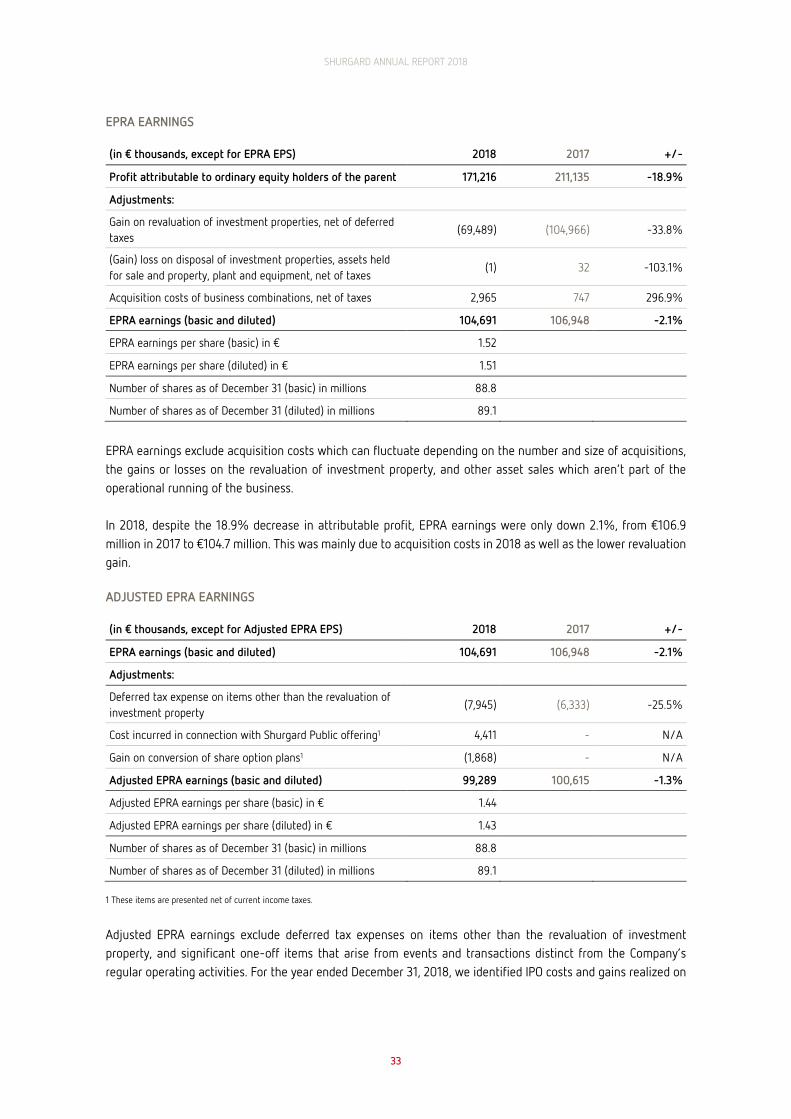
SHURGARD ANNUAL REPORT 2018
33
EPRA EARNINGS
(in € thousands, except for EPRA EPS) 2018 2017 +/-
Profit attributable to ordinary equity holders of the parent 171,216 211,135 -18.9%
Adjustments:
Gain on revaluation of investment properties, net of deferred taxes
(69,489) (104,966) -33.8%
(Gain) loss on disposal of investment properties, assets held for sale and property, plant and equipment, net of taxes
(1) 32 -103.1%
Acquisition costs of business combinations, net of taxes 2,965 747 296.9%
EPRA earnings (basic and diluted) 104,691 106,948 -2.1%
EPRA earnings per share (basic) in € 1.52
EPRA earnings per share (diluted) in € 1.51
Number of shares as of December 31 (basic) in millions 88.8
Number of shares as of December 31 (diluted) in millions 89.1
EPRA earnings exclude acquisition costs which can fluctuate depending on the number and size of acquisitions, the gains or losses on the revaluation of investment property, and other asset sales which aren’t part of the operational running of the business. In 2018, despite the 18.9% decrease in attributable profit, EPRA earnings were only down 2.1%, from €106.9 million in 2017 to €104.7 million. This was mainly due to acquisition costs in 2018 as well as the lower revaluation gain.
ADJUSTED EPRA EARNINGS
(in € thousands, except for Adjusted EPRA EPS) 2018 2017 +/-
EPRA earnings (basic and diluted) 104,691 106,948 -2.1%
Adjustments:
Deferred tax expense on items other than the revaluation of investment property
(7,945) (6,333) -25.5%
Cost incurred in connection with Shurgard Public offering1 4,411 - N/A
Gain on conversion of share option plans1 (1,868) - N/A
Adjusted EPRA earnings (basic and diluted) 99,289 100,615 -1.3%
Adjusted EPRA earnings per share (basic) in € 1.44
Adjusted EPRA earnings per share (diluted) in € 1.43
Number of shares as of December 31 (basic) in millions 88.8
Number of shares as of December 31 (diluted) in millions 89.1 1 These items are presented net of current income taxes.
Adjusted EPRA earnings exclude deferred tax expenses on items other than the revaluation of investment property, and significant one-off items that arise from events and transactions distinct from the Company’s regular operating activities. For the year ended December 31, 2018, we identified IPO costs and gains realized on

SHURGARD ANNUAL REPORT 2018
34
the conversion of share option plans prior to the IPO as significant items totaling an adjustment amount of €2.5 million. In 2018, adjusted EPRA earnings were €99.3 million, 1.3% lower than the €100.6 million in 2017.
RECONCILIATION OF EBITDA TO ADJUSTED EPRA EARNINGS
(in € thousands, at CER) 2018 2017 +/-
EBITDA 136,058 133,393 2.0%
Net attributable profit adjustments:
Depreciation & amortization (1,679) (1,527) 10.0%
Finance costs (20,968) (18,141) 15.6%
Current tax (19,421) (14,941) 30.0%
Minority interest, net of EPRA adjustments (210) (187) 12.3%
EPRA adjustments:
Acquisition expense, net of CIT 2,965 747 N/A
Cost incurred in connection with equity issuance and listing, net of CIT
4,411 0 N/A
Gain on conversion of cash into equity-settled option plans, net of CIT
(1,868) 0 N/A
Adjusted EPRA earnings 99,289 99,345 -0.1%
EPRA NET ASSET VALUE PER SHARE
(in € thousands, except for NAV per share, as of December 31)
2018 2017 +/-
NAV attributable to ordinary equity holders of the parent 1,798,661 1,339,516 34.3%
Additions to NAV:
Deferred taxes on fair value adjustments of investment property
355,139 330,474 7.5%
EPRA NAV 2,153,800 1,669,990 29.0%
EPRA NAV per share (basic) in € 24.224.3
EPRA NAV per share (diluted) in € 24.224.2
Number of shares as of December 31 (basic) in millions 88.8
Number of shares as of December 31 (diluted) in millions 89.1
This metric reflects the fair value of net assets on an ongoing, long-term basis. EPRA Net Asset Value is calculated based on Net Asset Value adjusted for the cumulative effects of deferred taxes, but does not adjust for the fair value of our investment properties. As of December 31, 2018, the EPRA Net Asset Value was at €2.2 billion, 29.0% higher than the year before, which was €1.7 billion as of December 31, 2017. The Net Asset Value per share was €24.2 as of December 31, 2018.

SHURGARD ANNUAL REPORT 2018
35
LIQUIDITY
Our primary cash requirements are for operating expenses, debt servicing, improvement to existing stores, developments and acquisitions of new stores, and for the payment of dividends. These requirements have been funded by operating cash flows, the issuance of equity and borrowings, including the U.S. Private Placement Notes, the 2015 revolving credit facility (“RCF”), the 2016 RCF and the 2018 syndicated RCF. We expect to continue to fund these requirements with operating cash flow, our existing cash position and future borrowings under our current bank credit facility or other investments. Our loan to value ratio at December 31, 2018 was 13.9%, compared with 25.3% at December 31, 2017. This reduction was a result of the cash proceeds of the IPO. In the medium term we are targeting a loan to value ratio within the range of 25% and 35%. We maintain cash and cash equivalent balances at banking institutions in certain of the countries where we operate. In Sweden, the United Kingdom and Denmark, these balances are held in local currencies. It is our policy that investments of surplus funds are made only with approved counterparties with a minimum credit rating of A. CASH FLOW OVERVIEW
(in € thousands) 2018 2017 +/-
Cash flows from operating activities 120,593 119,216 1.2%
Cash flows from investing activities (175,364) (61,476) 185.3%
Cash flows from financing activities 280,879 (45,801) N/A
Net increase in cash and cash equivalents 226,108 11,939 N/A
Effect of exchange rate fluctuation 1,169 27 N/A
Cash and cash equivalents at January 1 23,645 11,679 102.5%
Cash and cash equivalents at period end 250,922 23,645 N/A
Cash flows from operating activities Operating cash inflow increased 1.2%, from €119.2 million in 2017 to €120.6 million in 2018, which was largely attributable to a €5.7 million increase in cash from movements in working capital and €1.0 million of increased cash flows from operations, which was partially offset by €5.3 million of increased income tax payments. The working capital movements consisted primarily of a €3.7 million increase in accrued expense, VAT payable and accounts payable, and accrued expense, as well as a decrease of €2.0 million in trade receivables, other current and non-current assets. Cash flows from investing activities Our cash outflow from investing activities increased by €113.9 million, from €61.5 million in 2017 to €175.4 million in 2018. The increase was a result of our €130.6 million acquisitions of the Pelican (Sweden), Kensington (U.K.) and ABC Selfstore (U.K.) self-storage businesses in 2018. This was substantially higher than the previous year when cash expenditure was €13.5 million for our acquisition of the Box Stockage store in Paris in 2017. Cash outflows in relation to capital expenditure on investment property under construction and completed investment property decreased from €47.0 million in 2017 to €44.9 million in 2018. This reflects periodic fluctuations in construction expenditure depending on the current stage of development projects. During 2018, insurance

SHURGARD ANNUAL REPORT 2018
36
recovery proceeds and payments for intangible assets increased by €1.7 million and €0.6 million, respectively, as compared to 2017, and capital expenditure on property, plant and equipment remained stable at €0.5 million. In 2018 and 2017, we opened two new stores. Since construction of new stores can take from 9 to 12 months, with purchase of the site occurring before that period, cash expenditure during a particular period does not always correspond directly to the number of new stores opened during that period. Cash flows from financing activities Our cash inflow from financing activities increased by €326.7 million, from a cash outflow of €45.8 million in 2017 to a cash inflow of €280.9 million in 2018. The increase resulted mainly from the issuance of equity through our IPO, net of IPO costs, of €555.3 million, and an increase in net borrowings of €27.0 million. But this was partially offset by cash outflows in relation to the interim distribution (€255.0 million), the debt issuance cost we paid for the syndicated RCF and bridge loan (€0.5 million) and an increase in interest paid (€0.1 million).
FINANCIAL POSITION
NET ASSETS In the financial year 2018, the Company’s total assets increased by 20.6% from €2,352 million on December 31, 2017 to €2,836 million on December 31, 2018. This is mainly due to a further increase in the value of our investment property and the cash from equity issuance that was not used to repay debt or for acquisitions. Approximately 91% of the Company’s balance sheet consists of non-current assets, of which 99% is investment property. Investment Property Investment property increased by 11.2% in 2018 from €2,301 million (including IPUC) on December 31, 2017 to €2,559 million (including IPUC) on December 31, 2018, mainly due to our 2018 acquisitions and store developments. The stores we own and operate have grown to a network of 232 stores. Cash and cash equivalents In connection with our IPO, we raised additional capital of €575.0 million. These funds were partially used for the repayment of debt (bridge-financing) and the acquisition of properties. The remaining part which was not utilized explains the significant increase in cash and cash equivalents from €23.6 million on December 31, 2017 to €250.9 million on December 31, 2018.
CAPITAL RESOURCES AND FINANCING STRUCTURE Shurgard’s financial resources comprise the Company’s total equity as well as certain debt financing instruments. The total equity increased significantly from €1,340 million on December 31, 2017 to €1,799 million on December 31, 2018. This reflects the €555.3 million of IPO proceeds net of €19.7 million of costs, €171.2 million net profit for the year and €4.5 million related to our equity-settled share-based compensation plans. These equity gains were partially offset by the €255 million interim distribution prior to the IPO and €17.4 million related to the revaluation of Swedish, Danish and UK operations because of unfavorable currency movements. As of December 31, 2018, the equity ratio was 63.4% (December 31, 2017: 57.0%). Shurgard has issued six series of senior guaranteed notes in the years 2014 and 2015 with a total nominal volume of €600 million and maturities varying between 2021 and 2030. Effective interest rates vary from 2.67% to 3.38%.

SHURGARD ANNUAL REPORT 2018
37
On September 26, 2018 and effective October 16, 2018, the Company entered into a €250 million syndicated revolving loan facility with BNP Paribas Fortis bank, Société Générale bank and HSBC bank (with BNP Paribas Fortis bank as agent). The facility matures on October 16, 2023, bearing interest of Euribor plus a margin varying between 0.45% and 0.95% per annum (currently 0.45%) dependent on the most recent loan-to-value ratio. There are no mandatory repayments of principal debt due for this facility before its maturity, and a commitment fee equal to 35% of the applicable margin per annum applies to undrawn amounts and is currently at 0.16%. The facility is subject to certain customary covenants. The Company paid €0.4 million arrangement and legal fees. As of December 31, 2018, the Company had no outstanding borrowings under this facility. The Company also leases various investment properties with an aggregate fair value of €33.6 million as of December 31, 2018 (€ 34.4 million as of December 31, 2017) under finance leases. On December 31, 2018, future minimum lease payments (including interest charges) under the Company’s finance leases totaled €24.5 million.
DIVIDEND
Going forward, we expect to pay dividends in May and October of each year based on our results for the previous financial year or the previous six-month period. Subject to the availability of distributable reserves, we currently intend to declare and distribute a semi-annual dividend based on a target pay-out ratio of 80% of adjusted EPRA earnings (see above for details of EPRA KPIs). The amount of any interim or final dividends and the determination of whether to pay dividends in any year may be affected by a number of factors, including our earnings, business prospects and financial performance, the condition of the market, the general economic climate and other factors considered important by the Board of Directors. In respect of 2018, we plan to pay a dividend of 25% of the target pay-out ratio of 80% of adjusted EPRA earnings. Thus, our Board of Directors recommends a dividend of €19.9 million or €0.22 per share, which shareholders will be asked to approve at the Company’s Annual General Meeting on April 30, 2019. If approved by shareholders, the final dividend will be payable on May 15, 2019 to shareholders on the register at close of business on May 14, 2019.
OUTLOOK
We are targeting 1.5%-2.5% annual Same Store revenue growth in the medium term, and 4% to 6% growth for All Store revenue. Shurgard expects at least two percentage points NOI margin improvement. We have three new developments planned for 2019 in the Netherlands, the UK and Germany, and four redevelopment projects, one of which will almost double the rentable space of the store. Our pipeline is growing as we add more property development expertise to our team, and in the medium term we plan to build five new developments a year. Our acquisition target is three properties per year. While the fire in Croydon Purley Way in London was a destructive end to the year, Shurgard was insured for the replacement value of the property, as well as for loss of revenue for the following 12 months. We expect to receive the building permit to rebuild the property in 2019 and open in 2020. This will minimize the impact of the damages on Shurgard’s business operations and financial circumstances.
SHURGARD ANNUAL REPORT 2018
38
NON-FINANCIAL INFORMATION
Shurgard is committed to high standards of sustainability, to the benefit of our people, our customers, the community, the environment and our shareholders. This commitment makes business sense. Motivated well trained employees provide a better service to our customers, who are part of the communities around our stores. And the wellbeing of all our stakeholders is dependent on a global commitment to improving the environment. At its very core, self-storage is in the business of sustainability. We help people store items that might otherwise be thrown away, lessening the disposable mountain of consumer goods. They come to us often in the midst of major changes in their lives, or with business aspirations that we can support. When our corporate social responsibilities are linked with our long-term strategic objectives, all our stakeholders benefit. Shurgard’s business model means there is always ongoing development, including new builds, optimization of existing buildings and the integration of new acquisitions. At each of these stages we choose the option that is both financially prudent and environmentally sound. This means some new build properties benefit from solar panels, redevelopments include low-electricity LED lighting and on-demand lighting controls, and we are making rolling changes to our heating, ventilation and air-conditioning systems to more energy-efficient models. Our employees are the main intermediary between our customers and the Company. Their development and progression are a key pillar of our success. We pride ourselves in a structured and accessible training regime that encourages skills development and promotion, and ensure our employees and customers are safe at work. Sustainability and social responsibility strengthen our corporate position and creates value for all our stakeholders. Shurgard has not followed a specific national, European or international framework when disclosing non-financial information, however our environmentally and socially responsible undertakings embody many of the principles found in these frameworks.
ENVIRONMENT
Corporate responsibility began as an environmental commitment to reduce CO2. While the scope has broadened over time, emissions remain a key pillar of action for responsible companies. Every organization has a duty to its stakeholders to play its part in the improvement of the environment, no matter how large or small their own emissions are. The burning of coal, natural gas, and oil for electricity and heat is the largest single source of global greenhouse gas emissions. Self-storage is not a coal fired polluter by any measure, but even our modest emissions by comparison can be improved. Shurgard is committed to reducing its carbon footprint and improving energy consumption across its operations.
ELECTRICITY, GAS AND WATER Electricity, gas, district heating and water consumption are tracked monthly via digital meters or monthly dashboard billing. This allows us to quickly identify sudden variances in consumption and take remedial action as soon as possible. We also focus on the top three stores by consumption in each market and develop specific action plans to improve resource usage at these stores. Finally, we undertake continuous improvement across our store portfolio, details of which are provided under the individual energy sub headings below.

SHURGARD ANNUAL REPORT 2018
39
Electricity has the largest share within the total of our utilities’ consumption (79.9 %) followed by gas (15.8%) and finally water (4.3%). This ranking has prompted us to act primarily on the reduction of electricity consumption over the past five years. However, reducing gas and water consumption has also been on top of our cost control agenda. Electricity Consumption Despite an increase by 24% in the number of stores since 2014, we have reduced our energy consumption by 11% in kilowatt hours in that time (2.5% per year).
Year 2014
(kWh/m2) 2015
(kWh/m2) 2016
(kWh/m2) 2017
(kWh/m2) 2018
(kWh/m2)
Average Consumption 22.0 21.2 20.3 19.6 19.7
Across the entire portfolio, we used 19.7 kilowatt hours per net rentable square meter in 2018. On average this equates to 99.525 kWh per store. Below are some of the investments we have made in implementing long-term energy efficiency and sustainability initiatives.
∙ We have made a €1.33 million investment in the conversion of 138 of our properties to low-electricity LED lighting since 2015. Shurgard has earmarked a further €0.9 million to convert the remaining 94 properties.
∙ We have introduced ‘on demand’ controls for ‘just in time’ lighting in over 200 properties since 2015. This means energy is being saved during dormant periods when parts of the building are not being accessed. So far, Shurgard has spent €200,000 on this efficiency and we will continue to roll out these controls to the remaining 23 properties.
∙ We installed electrical traction elevators rather than hydraulic elevators in the last 9 new build stores. The benefit of Electrical Traction Elevators is that they consume 20% less energy, and as they don’t need oil there is no longer a hydraulic lift maintenance room where oil leakages could occur.
∙ All new developments since 2015 in the UK have received a BREEAM (British Research Establishment Environmental Assessment Method) certificate. Five stores are rated ‘Excellent’, and one is rated ‘Very Good’. BREEAM is a sustainability assessment method for buildings and looks at several aspects of a project to measure its sustainability. The aspects that are measured are procurement, health and wellbeing, transport, water, materials, waste, land use and ecology, and pollution.
∙ Since 2015 our newly constructed buildings have been certified zero carbon stores by their respective local authority.
We have achieved our key performance measure for 2018, to go below the threshold of 20 kWh/m2. We will continue to focus on reducing our electricity consumption in kWh/m² in the coming years through smart sustainability initiatives. Gas and District Heating Most of our stores only use gas for heating purposes. Across the portfolio of stores that uses gas for heating, we consumed 20.9 kilowatt hours per net rentable square meter in 2018. On average this equates to 104.906 kWh per store. In order to lower our gas consumption, Shurgard has introduced heating thresholds which heat the stores when the temperature falls below 5 degrees Celsius and turn off automatically when the temperature reaches 10 degrees Celsius.

SHURGARD ANNUAL REPORT 2018
40
Since 2015, we have installed or replaced the heating, ventilation, and air conditioning (HVAC) systems in approximately 50 properties with more energy efficient units. We spend approximately €200,000 per year on these new HVAC systems. There is no specific target date for further installation as the HVAC systems are replaced when they come to the end of their useful life, but we expect to spend €20,000 per year on average. Water Consumption Shurgard storage facilities only use water for on-site toilet facilities and fire safety. Despite this very low consumption we are committed to improving our water efficiency, and we have reduced water consumption by 43% in the nine new buildings through high-efficiency plumbing. Where water consumption costs have increased in the countries where we operate, we have identified the top three stores by consumption for each market and built specific action plans to reduce water use at those stores.
Year 2014
(€/m²) 2015
(€/m²) 2016
(€/m²) 2017
(€/m²) 2018
(€/m²)
Average Consumption 0.14 0.14 0.14 0.17 0.14
New stores excluded from comparison data.
We will continue to focus on reducing the consumption of water at our properties in the short to medium term.
ALTERNATIVE ENERGY Over 300 square meters of solar panels have been installed on four buildings since 2015 which has offset 28 tons of CO2 emissions. Shurgard’s investment hurdle for alternative energy sources reflects a prudent balance of feasibility and returns. We examine all energy-saving options during building, extensions and acquisitions to ensure we maintain this balance of stakeholders’ interests.
WASTE Our stores produce relatively small quantities of waste, as there is low staff allocation, modest customer traffic and minimal consumables used. Customers are obliged to remove unwanted goods and leave their units empty and clean at the end of their contract. Store staff apply our waste recycling policies to reduce the waste sent to landfill.
ECOLOGICAL INITIATIVES Shurgard’s portfolio consists mainly of stores in or near large urbanizations. Often these areas are densely populated with limited outlet for wildlife development. Where we are able, Shurgard will endeavor to improve the ecological environment around our stores.
∙ We installed a bio diverse living roof on the recently opened store in Deptford, south-east London. On the roof of the store we created a habitat that imitates the environment of the Redstart bird in order to attract more of this type of bird to the area. The Robin-sized Redstart bird has lost its natural habitat due to the extensive development of inner cities, so this is intended to offset that impact.
∙ At other sites in the UK, bat and bird boxes have been installed on or within the boundary of the store to encourage wildlife in the area.
∙ Where central city sites lack flora and wildlife, Shurgard endeavors to incorporate planting of native species at the development and building phase to encourage local flora.
∙ At our newly opened store in Berlin, we have incorporated an open drainage system within the grounds of the site. This creates a pond-like environment for rainwater run-off which attracts local wildlife.
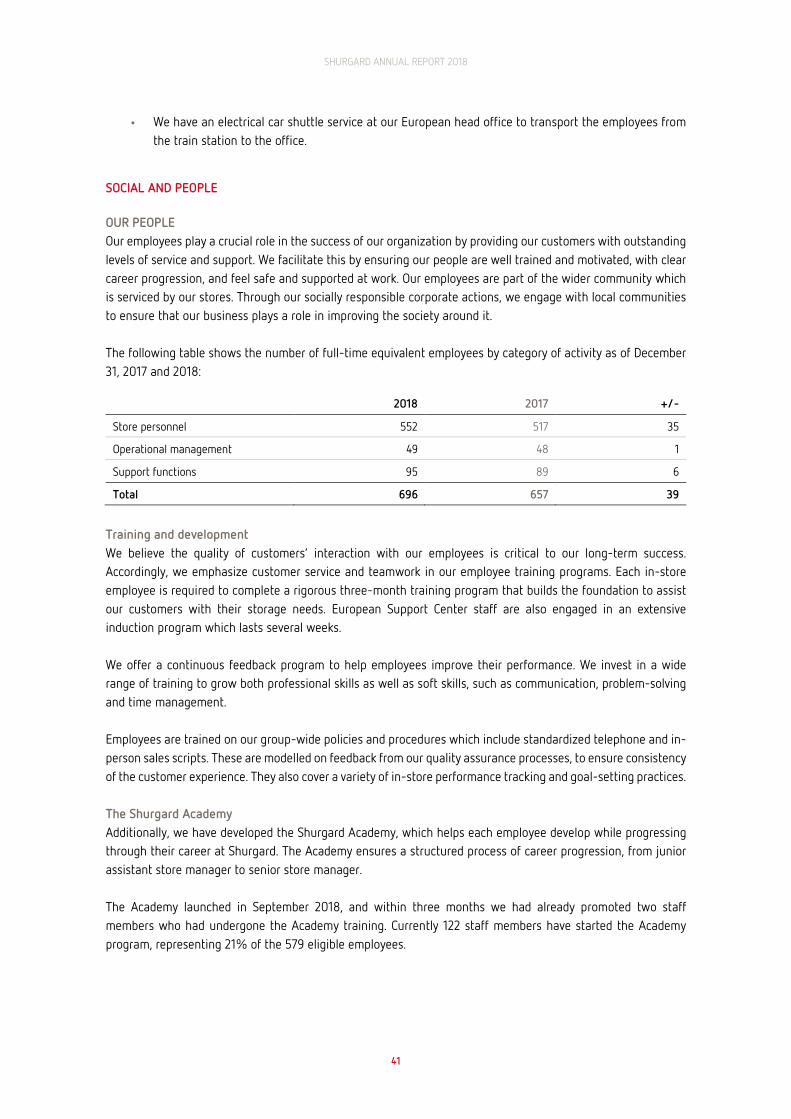
SHURGARD ANNUAL REPORT 2018
41
∙ We have an electrical car shuttle service at our European head office to transport the employees from the train station to the office.
SOCIAL AND PEOPLE
OUR PEOPLE Our employees play a crucial role in the success of our organization by providing our customers with outstanding levels of service and support. We facilitate this by ensuring our people are well trained and motivated, with clear career progression, and feel safe and supported at work. Our employees are part of the wider community which is serviced by our stores. Through our socially responsible corporate actions, we engage with local communities to ensure that our business plays a role in improving the society around it. The following table shows the number of full-time equivalent employees by category of activity as of December 31, 2017 and 2018:
2018 2017 +/-
Store personnel 552 517 35
Operational management 49 48 1
Support functions 95 89 6
Total 696 657 39
Training and development We believe the quality of customers’ interaction with our employees is critical to our long-term success. Accordingly, we emphasize customer service and teamwork in our employee training programs. Each in-store employee is required to complete a rigorous three-month training program that builds the foundation to assist our customers with their storage needs. European Support Center staff are also engaged in an extensive induction program which lasts several weeks. We offer a continuous feedback program to help employees improve their performance. We invest in a wide range of training to grow both professional skills as well as soft skills, such as communication, problem-solving and time management. Employees are trained on our group-wide policies and procedures which include standardized telephone and in-person sales scripts. These are modelled on feedback from our quality assurance processes, to ensure consistency of the customer experience. They also cover a variety of in-store performance tracking and goal-setting practices. The Shurgard Academy Additionally, we have developed the Shurgard Academy, which helps each employee develop while progressing through their career at Shurgard. The Academy ensures a structured process of career progression, from junior assistant store manager to senior store manager. The Academy launched in September 2018, and within three months we had already promoted two staff members who had undergone the Academy training. Currently 122 staff members have started the Academy program, representing 21% of the 579 eligible employees.
SHURGARD ANNUAL REPORT 2018
42
The Academy marks a complete overhaul of our training and ethos. We have moved from a traditional job application, assessment and promotion model to an ongoing development and transparent career progression model. Objectives are clear, the required competencies for promotion are unambiguous, and feedback is at a minimum once a quarter but more often monthly. Academy employees are expected to complete sales training and mastery of the systems and processes, accessing online training at any time. District managers are on hand to provide training in soft skills like communication, leadership, delegation and employee recognition. Promotion is discussed at quarterly succession planning meetings, and our employees can view their own progress at any time to ensure transparency across the process. The response to the new training regime has been very positive so far. Not only is it an effective retention tool, the Shurgard Academy encourages engagement within the Company, providing employees with a clear path to progression and direct access to the tools to achieve promotion. Benefits Our employees enjoy a range of benefits depending on their location. These include medical care plans, health insurance and health allowances. They are entitled to meal vouchers and uniform allowance in some jurisdictions, as well as transport contributions and support for the ride-to-work cycle schemes where applicable. All country operations offer a performance bonus to the relevant staff members. Equality and diversity Shurgard’s equality and diversity policy promotes equality of opportunity for all employees and job applicants. We aim to create a working environment in which all individuals feel included and can make best use of their skills, free from discrimination or harassment, and in which all decisions are based on merit. We do not discriminate against employees on the basis of their gender, sexual orientation, marital or civil partner status, gender reassignment, race, color, nationality, ethnic or national origin, religion or belief, disability or age (the protected characteristics). Managers are given appropriate training on equal opportunities awareness and equal opportunities recruitment and selection best practice. Gender diversity Shurgard supports the principles of gender diversity at both the board and Group level. 30% of our Non-Executive Directors are women, and when vacancies arise we consider board applications that will maintain a strong and effective gender balance.

SHURGARD ANNUAL REPORT 2018
43
Within our stores, we foster an inclusive culture which engages with all potential candidates. The outcome of this culture is a good gender balance in our stores, which employ 80% of the total Shurgard personnel. Within stores across our seven operating countries, the gender split is 62% male and 38% female.
The gender split for our European support center employees is 55% male and 45% female. The gender pay difference for store personnel is marginal across our different operating countries. The total difference is 0.3% (in favor of female personnel) across all geographies which reflects a range between -4.7% and 1.5%.
38%
62%
48%
35%31% 28% 27%
23%
62%
38%
52%
65%69% 72% 73%
77%
Total Europe Sweden Germany Netherlands France Belgium UK Denmark
STORE PERSONNEL SPLIT BY GENDER
Female Male
%
Total Europe Netherlands UK Germany Sweden France Denmark Belgium
STORE PERSONNEL AVERAGE SALARY
Female Male
+0.3%
-1.6%
-1.4% +1.5% -4.7% -0.3%
-4.3%
€
+0.3%

SHURGARD ANNUAL REPORT 2018
44
Health & Safety Shurgard is committed to managing health and safety effectively to protect our employees and other people with whom we interact. We recognize that we have not only a moral and legal duty, but also that our employees are our greatest asset. We have robust health and safety policies in place already but recognize that improvements in health and safety will not happen by chance. Thus, we use a systematic approach to risk assessment on an ongoing basis. For example, we carry out and regularly review risk assessments to identify proportionate and pragmatic solutions to reduce risk. We communicate and consult with our employees on matters affecting their health and safety. We encourage staff to identify and report hazards so that we can all contribute towards improving safety. And we ensure that emergency procedures are in place at all locations for dealing with health and safety issues. We have established performance standards against which we can monitor our progress to identify future actions to go into our improvement program. These standards include accident monitoring, internal monitoring and external audits. WORK ACCIDENTS 2018
2018 2017 +/-
On the work floor 16 28 -12
On the way to work/home 15 4 11
CUSTOMERS Our customers are at the heart of our business and their feedback is an important indicator of our operational success. We enjoy an average Feefo rating of 4.6 stars, with national rankings from 4.5 stars to 4.7 stars. The Feefo star-rating is based on the direct reviews of genuine Shurgard customers who rate the service along a five-point scale (1 for very bad to 5 for excellent). Customer rating sites also offer a significant platform to grow our brand, interact with our customers and ensure the brand is presented consistently. Our digital strategy is to optimize the user journey from initial advertising, to social media interactions and booking. These efforts also enable us to learn more about potential customers, allowing us to better target future customers and build stronger relationships with existing users of our facilities. We regularly conduct focus group research and online surveys so that we can better attract and service customers.
COMMUNICATION AND ENGAGEMENT We want our employees in all seven countries in which we operate to feel part of the Shurgard community. We use an internal communications platform, “Our Place”, to update our employees on Company news, and they can also find information, policies, procedures and forms on the platform. A weekly email of news and updates focusing on processes, procedures and systems is translated into all the local languages spoken across our regions, and we provide ad hoc news and announcements via email when the need arises. The local management team send a monthly update covering key KPI’s and focus points for the month to come, as well as new staff members, weddings, babies and events like team building exercises.

SHURGARD ANNUAL REPORT 2018
45
Shurgard employees have access to the online “Shurguide” handbook, which acts as a repository for all the processes and operational guides for employees across our store and support network. The “Shurguide” searchable database ensures consistent processes throughout the Company, and helps employees carry out their duties with clear and consistent instructions. “Shurguide” is updated regularly, and any changes or improvements to these processes are approved by a change committee before being added to the handbook.
OUR COMMUNITY Most of our customers live or work close to our stores. Many of them need our storage solutions because of life changes like moving house, births, deaths and marriages – times when a sense of community is particularly valuable. When Shurgard opens a store, it serves the community by providing temporary or more long-term storage solutions and creating employment opportunities within the area. While our stores generate direct employment, the far greater impact on the local economy is the growth opportunities created for our business customers which stimulate employment in the local area. Around 10% to 20% of our customers are small businesses therefore each of our stores supports between 100 and 200 businesses in the local economy. As our storage options are flexible and low cost, they can provide the stimulus for small businesses to control their costs when they need more space for equipment, archives, stock or seasonal goods. Community engagement Shurgard engages in community action on a store to store basis, working with education providers, local groups and charities to give back to the community in a socially responsible way.
∙ As part of the considerate constructors’ scheme, we work with schools, universities and local groups at every UK site. In November, 18 students visited our City Airport site under construction for a program of management-led sessions covering procurement, tendering, contracts and legal issues. Students engaged in a site walk discussing the risks and challenges faced during the build.
∙ In November, the marketing team in Brussels chose to give back to their local community by giving their time to a non-profit organization, Le Souffle de Vie, which helps pregnant women who need support. Working to their strengths within self-storage, the team helped ‘create space’ at the charity’s headquarters by sorting, packing and moving hundreds of toys ahead of Belgium’s ‘Sinterklaas’ day, the traditional day in early December when St Nicholas brings children gifts.
∙ Employees from our Development team delivered much needed winter items to local Newham homelessness charity group Caritas Anchor House. Socks, hats, gloves sleeping bags and mats were gratefully received just before Christmas to support homeless people within the local community.
ANTI-CORRUPTION AND ANTI-BRIBERY
Shurgard complies with the anti-corruption and anti-bribery laws of the countries in which it does business. Employees undergo training to ensure they are compliant. We do not directly or indirectly offer or give anything of value to any government official, including employees of state-owned enterprises, to influence any act or decision that may help us get or retain business or to direct business to anyone. Shurgard also requires that any agents we engage to conduct business on our behalf are reputable and that they comply with these guidelines.

SHURGARD ANNUAL REPORT 2018
46
RESPECT FOR HUMAN RIGHTS
Shurgard is committed to protecting all employees who report human rights violations, including maintaining our established reporting procedures to ensure this protection, and to inform employees about these procedures. The Company is committed to ensuring that the vendors it engages with are free from slavery or human trafficking. The vendors are required to confirm they comply with anti-slavery and human trafficking requirements.

SHURGARD ANNUAL REPORT 2018
47
PRINCIPAL RISKS AND UNCERTAINTIES
OVERALL STATEMENT ON THE RISK POSITION
As set out in the Market Overview and Growth Strategy sections of this report, our business activities are supported by favorable market conditions. We see a variety of opportunities to continue our growth through optimization of our existing operations, including leveraging our platform across planned redevelopment and development activities and bolt-on acquisitions. Besides these opportunities, Shurgard regularly faces risks that can have negative effects on the operating results, financial position and net assets of the Group. The risks set out below represent the principal risks and uncertainties that may adversely impact the Group’s performance and the execution of our strategy. A more comprehensive list of risks is included in our IPO-prospectus, dated October 12, 2018, which can be found on https://corporate.shurgard.eu. To identify risks at an early stage and manage them adequately, Shurgard deploys effective management and control systems which are also described below. Accordingly, we assess the risks at the time of preparation of the management report as limited, and in our opinion the overall risk is manageable. No identifiable risks currently exist that either individually or together would lead to a significant or sustainable impairment of Shurgard Group's operating results, financial position and net assets.
RISK MANAGEMENT SYSTEM
The Group’s risk management is carried out by the Senior Management, under policies approved by the Board of Directors. The Board provides principles for the overall risk management, as well as policies covering specific areas, such as foreign exchange risk, real estate risk and credit risk, the use of derivative and non-derivative financial instruments and investment of excess liquidity. The Group’s risk exposure is regularly reported to the Company’s Executive Committee, which comprises the CEO, CFO, VP Operations, VP Real Estate and VP Human Resources and Legal. The Company’s Audit Committee is responsible for monitoring the effectiveness of our risk management system. It receives a report about the Group’s risk situation every quarter. We classify our risks into the following risk areas:
∙ Operational risks ∙ Strategic risks ∙ Legal risks ∙ Financial risks ∙ IT risks ∙ HR risks ∙ PR risks ∙ Real estate risks
The Group’s risk management process is designed to systematically record and assess risks. We aim to identify unfavorable developments at an early stage and promptly take counteractive measures and monitor them. All risks are recorded in a risk register and are assigned to specific risk owners. Risk owners are responsible for providing periodically updated risk fact sheets. The assessment of the risks is carried out, as much as possible, according to quantitative parameters, likelihood of occurrence and the potential financial impact. According to the results of this assessment, risks are qualified in a risk map as low, medium, high or very high. Risks that are categorized as high or very high on the risk map receive special attention and are monitored very closely. The

SHURGARD ANNUAL REPORT 2018
48
risk register and the resulting risk map are updated every year based on risk owners’ input (new risks, closed risks, change of positioning).
ACCOUNTING-RELATED INTERNAL CONTROLS
While the Board of Directors is responsible for the preparation and fair presentation of the Group’s consolidated financial statements, the goal of our internal control system is to ensure the reliability of external and internal accounting and the timely provision of information. Besides the risk management system, the Company’s Audit Committee is also responsible for monitoring the effectiveness of our internal control system. The monitoring is supported by our integrated operating platform and information system, which is designed to centralize real-time information on stores and customers, as well as financial information for all our stores.
KEY RISKS SPECIFIC TO THE GROUP AND ITS INDUSTRY
The risks set out below represent the principal risks and uncertainties that may adversely impact the Group’s performance and the execution of our strategy. Other factors could also adversely affect the Group’s performance. Accordingly, the risks described below should not be considered a comprehensive list of all potential risks and uncertainties. The principal risks are not listed in order of significance. In addition to the principle risks described below, we are exposed to certain specific market risks such as foreign exchange risk, credit risk and liquidity risk. A detailed discussion of these risks is included in note 37 to the consolidated financial statements.
OPERATIONAL RISKS Self-storage misuse Our customers are required to confirm that their items stored are not perishable and do not include any hazardous or toxic substances or living creatures. Each customer agrees to inform us of any special storage requirements and agrees not to store any items which are illegal to possess or store, or would require us to comply with any additional rules. It is possible that our customers will violate their lease agreements. We do not generally have access to our customers’ storage units and cannot prevent our customers from storing hazardous materials, stolen goods, counterfeit goods, drugs or other illegal substances in our stores. Although the terms of our standard lease contracts for customers prohibit the storage of illegal and certain other goods on our premises, it is not possible to monitor goods stored by customers at our stores. We cannot exclude the possibility that we may be held ultimately liable with respect to the goods stored by our customers. This also includes a potential close-down by local authorities. If a customer stores an item that is contrary to our customer terms and conditions, any subsequent damage to a third party caused by the item may not be covered by our insurance. In addition, unfavorable publicity from illegal contents stored at one of our stores, or items that have been used or are planned to be used in crimes or for other illegal purposes, including terrorist attacks, could have a material adverse effect on our business, financial condition and results of operations.
STRATEGIC RISKS Housing market development Our business is dependent on residential and commercial demand for self-storage facilities, and our operating results are driven by our ability to maximize occupancy levels and rental rates at our stores. As a result, we are exposed to local, national and international economic conditions and other events and factors that affect customer demand for self-storage in the European markets in which we operate stores. In our markets, we have high concentrations of self-storage properties in urban areas. In recent years, our operating results have been supported by structural trends, including increased migration and mobility, growth in urban areas and increased

SHURGARD ANNUAL REPORT 2018
49
population density. However, demand for self-storage could decrease if these or other growth trends declined or reversed in the future. Moreover, we own substantially all the properties on which our stores are located. Property investments are subject to varying degrees of risks. The value of these properties can fluctuate significantly when economic conditions are unfavorable or could be adversely affected by a downturn in the property market in terms of capital and/or rental values. In particular, rents and values are affected (among other things) by changing demand for self-storage, changes in general economic conditions, changing supply within a particular area of competing space and attractiveness of real estate relative to other investment choices. Price war Our competitors are local, national and international operators present in our markets. While no individual operator competes with us in all the markets in which we operate, certain competitors have attained significant size within specific markets. Our competitors also include smaller self-storage providers and providers of other storage alternatives such as removal companies, peer-to-peer alternatives and offsite storage. Certain of these competitors may offer lower prices, better locations, better services or other attractive features in any given store’s catchment area, which may heighten competition for customers. Local market conditions have a significant impact on our business. In particular this impacts the prices we are able to set, and from time to time additional competition has lowered occupancy levels and rental revenue of our stores in specific markets. Aggressive price discounting measures by our competitors (i.e. a price war) can have a significantly negative impact on our property operating revenue from activities at affected stores. Also, increased pricing transparency, including as a result of the increasing prevalence of online pricing, may increase pricing pressure in our markets. In addition, there are limited barriers to entry into the self-storage business due to relatively limited amounts of capital needed to acquire existing stores or build new facilities. Therefore, any of our existing stores could face additional competition from new market entrants on relatively short notice. Such a new entrant could create pricing pressure in a specific market or otherwise seek to win customers from us. Competition for suitable stores Store location is important for our business because of the signage and promotional opportunities such locations provide and the importance of convenient access in attracting and retaining customers. A well-located store allows us to reduce our operating costs as the visibility of the location by potential customers may substitute for other forms of store promotion, such as online or print advertising. We primarily operate in capital and major cities, where undeveloped or available sites are generally in short supply and where real estate prices have historically been at a premium. As a result, there is generally a limited number of prime sites available for new self-storage centers, and competition for these sites can be intense and may constrain our growth. At times of economic growth, this competition can lead to a significant inflation in property prices. This can contribute to higher purchase prices or rents for prime properties, or result in the selection of less suitable properties, either of which could result in a material adverse effect on our business, financial condition and results of operations.

SHURGARD ANNUAL REPORT 2018
50
Legislation changes We operate our business and our properties in compliance with laws, regulations or government policies which may be adopted or changed from time to time. These include laws and regulations relating to health, safety and environmental compliance, numerous building codes and regulations, other land-use regulations, labor codes and other regulatory requirements. Changes in such laws and regulations may increase the costs of compliance with these provisions, increase construction, operating and maintenance costs, increase liabilities or lower the value of our properties. Moreover, new regulations might develop in the United Kingdom as a result of a change in its relationship with the European Union. The regulatory regimes might also evolve, including in relation to data privacy and our ability to share customer data within our organization. This could result in a material adverse effect on our future business, financial condition and results of operations. Tax increases Historically, increases in costs due to changes in real estate tax rates or increases in income, service and other taxes, including VAT, generally have not been passed through to customers directly. As a result, our results have historically been adversely impacted during periods immediately following such increases, in particular as compared to those of our competitors that passed a portion of such increased costs on to their customers. We carefully examine such tax increases against projected demand in the relevant market, however there can be no assurance that we will be successful in aligning any decision, whether to increase prices or not, with customer demand. Acquisitions One aspect of our growth strategy includes possible future acquisitions of stores, either as individual sites or existing businesses. If we acquire any stores, we will be required to integrate them into our existing portfolio and management platform. The process of integration may divert management’s attention away from our other operations, especially if the acquired stores are outside of our existing markets. This may present different competitive or regulatory dynamics than those we are familiar with. Additionally, demand for storage services at an acquired site may not be as strong as we had projected prior to the acquisition. We may fail to realize the occupancy levels or rental rates that were expected, either at the levels or within the timeframe anticipated. We may also experience stabilization of rental and occupancy rates of acquired stores that differs from our expectations. The costs of achieving and maintaining high occupancy levels and rental rates at acquired sites may be higher than expected. The integration of newly acquired stores could also result in unanticipated operating costs and exposure to undisclosed or previously unknown potential liabilities, such as liabilities for clean-up of undisclosed environmental contamination, claims by persons dealing with the former owners of the properties and claims for indemnification by general partners, directors, officers and others indemnified by the former owners of the properties. If we fail to successfully integrate any acquired sites, or if doing so requires investments beyond budgeted amounts or other liabilities, it could have a material adverse effect on our business, financial condition and results of operations. Shurgard trademarks and logos We believe that the Shurgard brand is a critical marketing tool and we use a variety of channels to increase customer awareness of our name, including highly visible store locations, site signage and architectural features. However, we do not own the trademarks for the Shurgard name and the Shurgard logos, which are held by Public

SHURGARD ANNUAL REPORT 2018
51
Storage. We have a license agreement with Public Storage, which was extended by a relationship agreement made between Public Storage and Shurgard on October 9, 2018 and effective upon listing (the “Relationship Agreement”). This states that Public Storage owns the rights to the Shurgard name and licenses these rights to us in a number of European countries for a fixed term of 25 years from the date of Shurgard’s admission to trading on a regulated market. This term can be extended for two consecutive 25-year periods. Certain standards of quality must be met and there are certain restrictions on the use of any other trademarks. We pay Public Storage monthly fees of 1% of the Group’s gross revenues for the right to use the trademarks. The Relationship Agreement will terminate after 75 years or earlier, if we do not extend the license after each 25 year- term. We would then be required to purchase the ownership rights to the trademarks in the jurisdictions covered by the license. Public Storage may terminate the Relationship Agreement if we fail to make payments or if we are in material breach of the agreement. If this happens we will no longer be able to use the Shurgard trademarks, which would materially adversely affect our ability to run our business. We are also responsible for all costs and expenses in relation to the filing, registration, and defense of the trademarks within the territories covered by the license. If we fail to protect the trademarks against infringements or misappropriation, our competitive position could suffer, and we could suffer a decrease in demand for storage units, which could materially adversely affect our results of operations.
LEGAL RISKS Compliance and regulatory risks We must operate our properties in compliance with numerous building codes and regulations and other land-use regulations. These include fire and health and safety regulations, labor codes and other regulatory requirements which may be adopted or changed from time to time. Failure to comply with the applicable regulations could result in the imposition of substantial fines or require us to incur significant additional costs, or to limit or cease part of our operations. This could have a material adverse effect on our business, financial condition and results of operations. We are subject to a number of laws relating to privacy and data protection, including General Data Protection Regulation (Regulation (EU) 2016/679) (the “GDPR”) and certain other data protection and privacy laws. Such laws govern our ability to collect, use and transfer personal data relating to customers, as well as any such data relating to our employees and others. We strive to comply with all applicable laws and regulations relating to privacy and data protection. However, it is possible that such requirements may be interpreted and applied in a manner that is inconsistent from one jurisdiction to another or may conflict with other rules or our practices. Additionally, we rely on third parties and our employees for the collection and processing of personal data, and as a result are exposed to the risk that such data could be wrongfully appropriated, lost or disclosed, damaged or processed in breach of privacy or data protection laws. We are subject from time to time to disputes with tax or other governmental or regulatory bodies. Whether or not any dispute actually proceeds to litigation, we may be required to devote significant management time and attention to its successful resolution (through litigation, settlement or otherwise). This would detract from our management’s ability to focus on our business. Any such resolution could involve the payment of damages or expenses by us, which may be significant. In addition, any such resolution could involve our agreement to terms that restrict the operation of our business. Since October 15, 2018, we are a publicly listed company on the Euronext Brussels. Thus, we also have to comply with a large amount of ongoing reporting and disclosure requirements. Any failure in meeting these requirements could result in significant penalty fees.

SHURGARD ANNUAL REPORT 2018
52
Regulation compliance We must operate our properties in compliance with numerous building codes and regulations and other land-use regulations, including fire and health and safety regulations, labor codes and other regulatory requirements. Compliance with these regulations, including the work involved in assessing our compliance, may entail significant expense. Some jurisdictions have regulations or permit requirements that apply to storage companies or operators of storage activities, but it is not always clear to what extent these apply to us. We cannot exclude the possibility that regulations that we currently view as inapplicable might be applied to us in the future. The burdens of regulatory compliance are exacerbated since we operate in seven different countries and numerous different jurisdictions and municipalities. We must continually assess our compliance with numerous local fire and safety regulations, building codes and other land-use regulations in order to operate. Failure to comply could result in the imposition of substantial fines or require us to incur significant additional costs, or to limit or stop part of our operations, which could have a material adverse effect on our business, financial condition and results of operations.
FINANCIAL RISKS Access to capital market We may face risks in relation to financing future development, redevelopment or acquisition activities. Although we have financed most growth activity in recent years through our existing financial resources, including operating cash flows and retained earnings, there can be no assurance that we will be able to do so in the future. Our ability to undertake future development, redevelopment or acquisition activities may depend on our ability to arrange necessary (or desired) financing, and we may not have access to capital markets or sufficient availability under existing or future credit facilities when such opportunities arise. As a result, we may be unable to finance future acquisition activity, on favorable terms or at all. If financing is available, but only on unfavorable terms (i.e. only expensive lending options available), this could have a significant impact on our interest expense, impose additional or more restrictive covenants or reduce cash available for distribution or for other investments in the business. We could also be restrained from raising significant debt for future acquisition activity due to covenants in our existing debt agreements. Also, significant systemic political, economic or financial crises or sustained periods of slow growth may restrict our ability to access the capital markets and generate sufficient financing due to cautious investor attitudes. We also face risks related to the outstanding U.S. Private Placement Notes and our entry into the new €250 million revolving facility. Under the terms of these financings, we may not incur financial indebtedness unless it is incurred in certain permitted circumstances. Additionally, we are subject to certain customary affirmative, financial and negative covenants, which could affect, limit or prohibit our ability to undertake certain activities, including limitations on mergers, changes of business, disposal of assets and certain specific acquisitions and joint ventures. The financial covenants imposed on us under the U.S. Private Placement Notes are tested quarterly, and those under the new revolving facility are tested semi-annually. Although we do not currently believe there is a risk of our breaching any of the covenants contained in those financings, if we were to fail to comply with any of the financial or non-financial covenants in the longer term (due, for example, to deterioration in financial performance), it could result in an event of default and the acceleration of our obligations to repay those borrowings, increased borrowing costs or cancellation of certain credit facilities. Unfavorable foreign currency exchange movements We publish our financial statements in Euros as we conduct a significant portion of our business in Euros. However, we record revenue, expenses, assets and liabilities in a number of different currencies other than the Euro, specifically, the U.K. Pound Sterling, the Swedish Krona and the Danish Krone. As of December 31, 2018, 68.3% of our assets were denominated in Euros, while 15.5%, 12.8% and 3.4% were denominated in U.K. Pound
SHURGARD ANNUAL REPORT 2018
53
Sterling, Swedish Krona and Danish Krone, respectively. Assets and liabilities denominated in local currencies are translated into Euros at exchange rates prevailing at the balance sheet date, and revenues and expenses are translated at average exchange rates over the relevant period. Fluctuations in the exchange rate of the Euro versus these other currencies will affect the amount of these items in our consolidated financial statements, even if their value remains unchanged in their original currency. We implement policies to protect against exchange rate risk only when required to do so by covenants contained in our debt agreements. These translation effects have resulted in the past and could result in the future in changes to our results of operations and balance sheet from period to period.
IT RISKS Cyber security An increasing proportion of our business operations are conducted over the internet, increasing the risk of viruses that could cause system failures and disruptions of operations. Experienced computer programmers may be able to penetrate our network security and misappropriate our confidential information, create system disruptions or cause shutdowns. Cyber incidents could also cause disruption and impact our operations, which could require substantial restoration costs or investment in new systems to protect against future cyber incidents. As a larger proportion of our customer interactions and bookings move online, the secure processing, maintenance and transmission of this information is an inherent part of our operations and business strategy. In the ordinary course of our business, we collect and may store sensitive data, including intellectual property, our proprietary business information and that of our customers, suppliers and business partners, and personally identifiable information of our customers and employees. Despite our security measures, including policies on the handling of customer information and training programs for our employees, our information technology and infrastructure may be vulnerable to attacks by hackers or breached due to employee error, malfeasance or other disruptions. Any such breach could compromise our networks and the information stored there could be accessed, publicly disclosed, lost or stolen. While we have established business continuity plans and strategies, there are inherent limitations in such plans, strategies, systems, policies and procedures. These include the possibility that certain risks have not been identified or that new cyber security threats emerge. Business interruptions Any network interruptions or problems with our websites that could prevent customers from accessing our website, have a negative impact on potential new rentals, or damage our brand and reputation.
HR RISKS Recruitment and personnel leakage We depend in significant part on the contribution of our Senior Management and Directors. Our Senior Management and Directors make significant contributions to our strategy and operations. In addition, our ability to continue to identify and develop properties depends on Senior Management’s knowledge and expertise in the property market. There is no guarantee that any members of the Senior Management team will remain employed with us. The failure to retain these individuals in key management positions could have a material adverse effect on our business. We do not have key man insurance on any of our Directors or Senior Managers.

SHURGARD ANNUAL REPORT 2018
54
We also depend on our store personnel responsible for the management and operation of our stores. Our store managers’ customer service, marketing skills and knowledge of local market demand and competitive dynamics are significant contributing factors to our ability to maximize customer satisfaction as well as our rental, insurance and ancillary revenue. Difficulties in hiring, training and retaining skilled store personnel may adversely affect our occupancy and rental revenues. We may face risks related to relations with our employees. Across our network, turnover of in-store personnel in recent years has been approximately 35% per year, which has historically been moderately higher in certain markets from year to year. Additionally, in certain markets, our employees have formed works or other advisory councils, or are party to collective bargaining agreements, including in Belgium, Sweden and France. There can be no assurance that we will not face work stoppages or other labor disputes with our employees in the future or face significant changes in turnover in a given year at a particular store.
REAL ESTATE RISKS Property damage We face risks relating to potential catastrophic property damage due to fires or other disasters. Any catastrophic events that cause significant property damage or affect the areas where a store operates could limit our ability to continue operations at a store, or in a portion of a store, after such an event while restoration or rebuilding works are undertaken. Property damage could be caused by a variety of factors, including external events such as natural disasters, earthquakes, hurricanes or other severe weather events. Property damage could also be caused by catastrophic events inside a store, such as power outages, fires, flooding, plumbing problems, or other issues, such as infestation. Moreover, our stores can be damaged or destroyed by acts of violence, civil unrest or terrorist attacks or accidents, including accidents linked to the goods stored. We are also subject to potential liability relating to damage to customer goods. Such damage can arise from a variety of factors, such as fire, flooding, pest infestations and moisture infiltration, which can result in mold or other damage to our customers’ property, as well as potential health concerns. Although we maintain reasonable liability cover where possible, certain types of losses may be either uninsurable or not economically insurable in some countries, such as losses due to hurricanes, tornadoes, riots, acts of war or terrorism. In such circumstances, we would remain liable for any debt or other financial obligation related to that property. Our business, financial condition and results of operations could be materially and adversely affected in such circumstances. Constructions and developments We consider strategic acquisitions of existing stores and sites for development, as well as redevelopment and remix activities at specific stores in our network, to be a significant part of our growth strategy. Our redevelopment activities often entail significant building works at an existing site, requiring material levels of investment and, at times, severe disruption to ongoing operations. Historically, occupancy levels and rental rates at newly acquired or developed stores have not been as high as at stores we have operated for a longer period of time. New and recently developed stores require start-up capital and generally take a significant amount of time to reach stabilized occupancy. As a result, during the early stage of this rent-up period, new stores or newly developed stores may not be as profitable as established stores, or at all.

SHURGARD ANNUAL REPORT 2018
55
We undertake many of our development activities through management contracts where specific builders and other personnel tender for particular roles in the construction process, rather than comprehensive design-and-build agreements. Construction delays due to adverse weather conditions, unforeseen site conditions, personnel problems, or cost overruns could prevent us from commencing operations at these locations on the timing or scale anticipated at the time we commenced development activities. If we experience significant cost increases after acquiring or commencing construction at a particular site, we could be required to alter, or in severe circumstances, curtail development plans. In future periods, construction costs may also increase due to increases in the cost of local contractors, in particular in high demand markets, as well as changes in the cost of raw materials, whether due to market forces or other events, such as changes in tariff regimes or trade policy. Other risks arising from developing new stores may arise from any unfamiliarity with local development regulations or delays in obtaining construction permits or risks in relation to the quality of available contractors. Before we acquired, developed or operated them, some of our properties may have been used for commercial and industrial activities including activities regulated under environmental laws. We obtain environmental assessment reports on the properties we acquire, develop and operate to evaluate their environmental condition and potential environmental liability associated with them. However, the environmental assessments that we have undertaken might not have revealed all potential environmental liabilities. It is possible that the remedial measures subsequently prove to have been inadequate, or that former owners are found not to be liable or, even in situations where they are found to be liable, they are otherwise unable to compensate us fully for such liabilities.

SHURGARD ANNUAL REPORT 2018
56
SHARE CAPITAL
INITIAL PUBLIC OFFERING
Since October 15, 2018, the shares of Shurgard Self Storage SA have been listed on the regulated market of Euronext Brussels. The initial public offering involved 25 million newly issued ordinary shares of the Company at a total volume of €575 million, including an over-allotment option of €75 million. Our principal shareholders, Public Storage and the New York State Common Retirement Fund (NYSCRF), did not sell any shares. During the offer period from October 1, 2018 to October 11, 2018, investors were asked to subscribe for the new shares at an offering price varying between €23.00 and €28.00 per share. On October 12, 2018, we announced the final offering price of €23.00, resulting in a total market capitalization of €2.0 billion for our 88.9 million shares. Following the listing of the shares, the stabilization manager J.P. Morgan Securities plc was authorized to acquire, for stabilization purposes, offer shares representing the over-allotment volume of up to €75 million during a period of 30 calendar days and sell them back to the Company (put option). On October 31, 2018, the Company announced the end of the stabilization period. J.P. Morgan Securities plc had not exercised the put option, leaving all above-mentioned parameters of the public offering, including the free float of 28.1%, unchanged. As of October 24, 2018, our shares were included into the FTSE EPRA/NAREIT Global Real Estate Index Series. This Index Series is designed to represent general trends in eligible real estate equities worldwide. As of December 24, 2018, our shares were included in the Bel Mid index of Euronext Brussels, the index of the biggest companies below the Belgian benchmark index Bel 20. IPO DATA
Issue volume (including over-allotment) €575 million, representing 25,000,000 newly issued shares
Offering period 01/10/2018 to 11/10/2018
Offering price range €23.00 to €28.00
Final offering price €23.00
Share capital after IPO €63,470,669.79
Number of shares after IPO 88,935,681
First trading day October 15, 2018
First trading price €24.00
Market capitalization at offering price €2,046 million
Free float 28.1%
Joint Global Coordinators and Joint Bookrunners BNP PARIBAS, J.P. Morgan Securities plc, Société Générale
Joint Bookrunners HSBC Bank plc, Kempen & Co N.V.
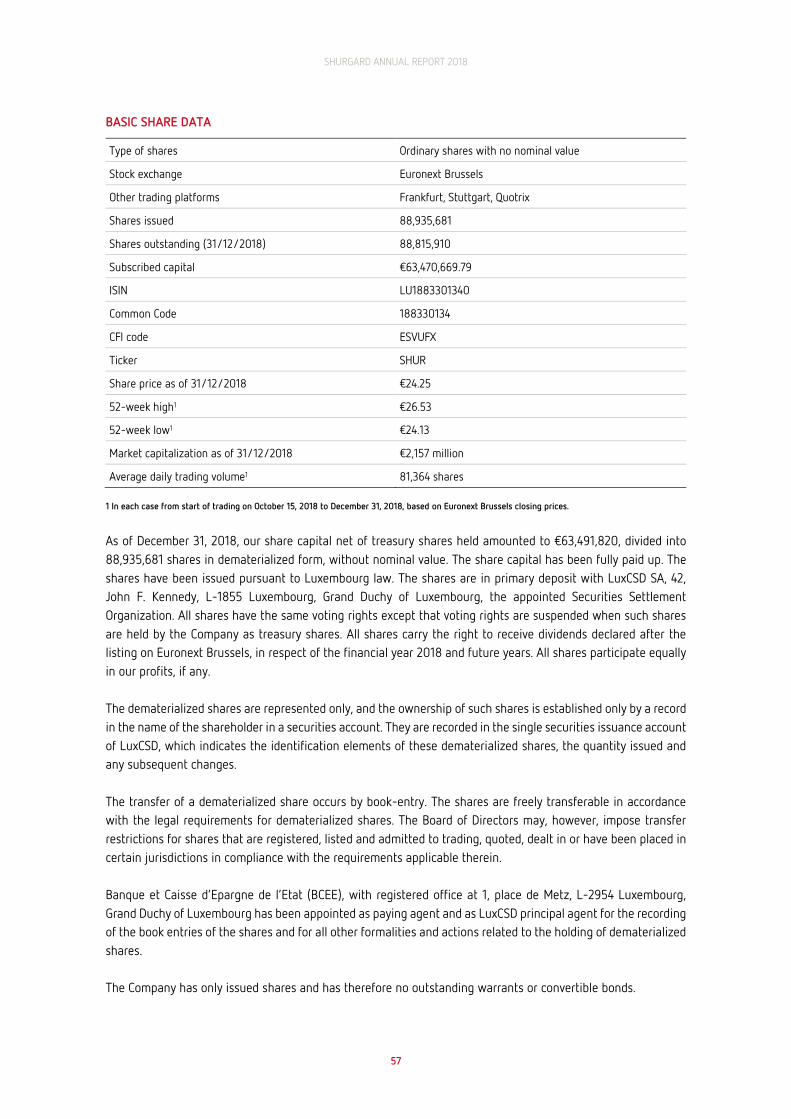
SHURGARD ANNUAL REPORT 2018
57
BASIC SHARE DATA
Type of shares Ordinary shares with no nominal value
Stock exchange Euronext Brussels
Other trading platforms Frankfurt, Stuttgart, Quotrix
Shares issued 88,935,681
Shares outstanding (31/12/2018) 88,815,910
Subscribed capital €63,470,669.79
ISIN LU1883301340
Common Code 188330134
CFI code ESVUFX
Ticker SHUR
Share price as of 31/12/2018 €24.25
52-week high1 €26.53
52-week low1 €24.13
Market capitalization as of 31/12/2018 €2,157 million
Average daily trading volume1 81,364 shares 1 In each case from start of trading on October 15, 2018 to December 31, 2018, based on Euronext Brussels closing prices.
As of December 31, 2018, our share capital net of treasury shares held amounted to €63,491,820, divided into 88,935,681 shares in dematerialized form, without nominal value. The share capital has been fully paid up. The shares have been issued pursuant to Luxembourg law. The shares are in primary deposit with LuxCSD SA, 42, John F. Kennedy, L-1855 Luxembourg, Grand Duchy of Luxembourg, the appointed Securities Settlement Organization. All shares have the same voting rights except that voting rights are suspended when such shares are held by the Company as treasury shares. All shares carry the right to receive dividends declared after the listing on Euronext Brussels, in respect of the financial year 2018 and future years. All shares participate equally in our profits, if any. The dematerialized shares are represented only, and the ownership of such shares is established only by a record in the name of the shareholder in a securities account. They are recorded in the single securities issuance account of LuxCSD, which indicates the identification elements of these dematerialized shares, the quantity issued and any subsequent changes. The transfer of a dematerialized share occurs by book-entry. The shares are freely transferable in accordance with the legal requirements for dematerialized shares. The Board of Directors may, however, impose transfer restrictions for shares that are registered, listed and admitted to trading, quoted, dealt in or have been placed in certain jurisdictions in compliance with the requirements applicable therein. Banque et Caisse d’Epargne de l’Etat (BCEE), with registered office at 1, place de Metz, L-2954 Luxembourg, Grand Duchy of Luxembourg has been appointed as paying agent and as LuxCSD principal agent for the recording of the book entries of the shares and for all other formalities and actions related to the holding of dematerialized shares. The Company has only issued shares and has therefore no outstanding warrants or convertible bonds.
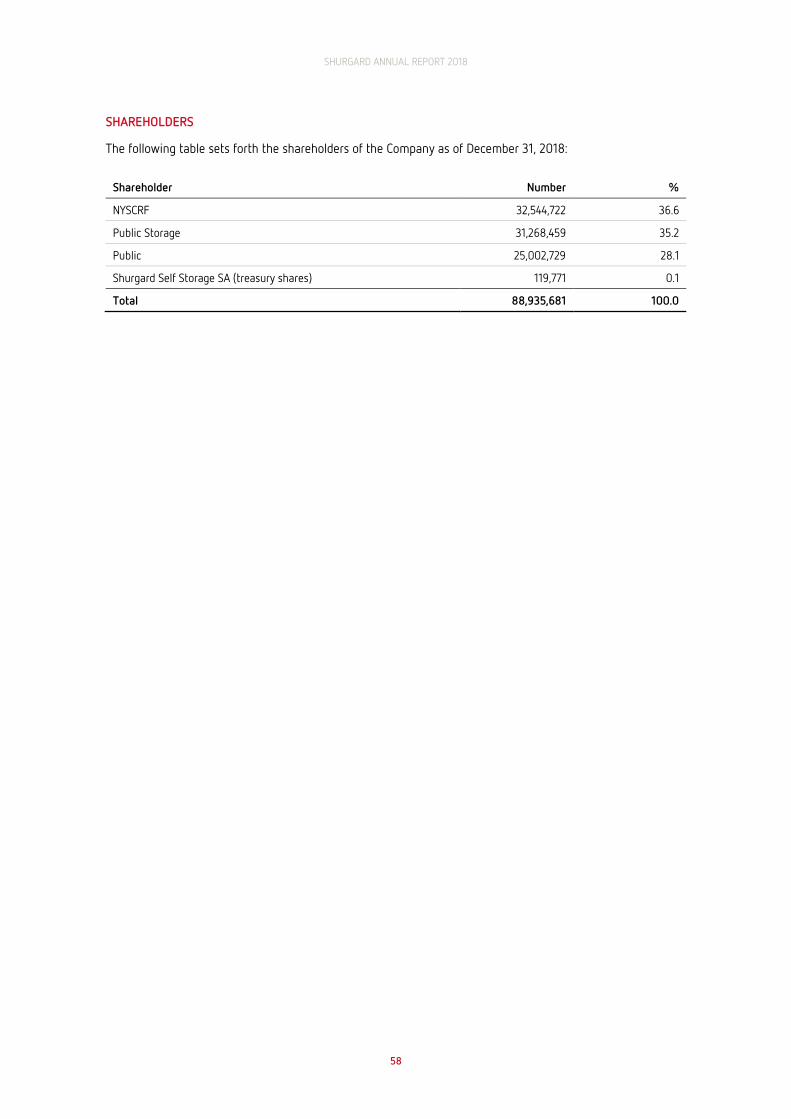
SHURGARD ANNUAL REPORT 2018
58
SHAREHOLDERS
The following table sets forth the shareholders of the Company as of December 31, 2018:
Shareholder Number %
NYSCRF 32,544,722 36.6
Public Storage 31,268,459 35.2
Public 25,002,729 28.1
Shurgard Self Storage SA (treasury shares) 119,771 0.1
Total 88,935,681 100.0
SHURGARD ANNUAL REPORT 2018
59
LUXEMBOURG TAKEOVER LAW DISCLOSURE
Shurgard Self Storage SA is required to make the following disclosures in compliance with article 11 of the Luxembourg Law of May 19, 2006, transposing Directive 2004/25/EC of the European Parliament and of the Council of April 21, 2004, on takeover bids (the “Transparency Law”): a) Capital Structure The Company has issued a single category of shares (ordinary shares). As of December 31, 2018, the share capital was set at €63,470,669.79 divided into 88,935,681 shares, with no nominal value. The share capital has been fully paid up. The shares exist in dematerialized form (titres dématérialisés) and have been issued pursuant to Luxembourg law. According to Article 7.1. of the Company’s Articles of Association each share entitles to one vote. With the Company’s IPO, on October 15, 2018, all shares were admitted to trading on the regulated market of Euronext Brussels. The shareholder structure as of December 31, 2018 is set out in the Share Capital section of this management report. b) Restrictions on the transfer of securities The Shurgard shares are freely transferable in accordance with the legal requirements for dematerialized shares. The Board of Directors may, however, impose transfer restrictions for shares that are registered, listed and admitted to trading, quoted, dealt in or have been placed in certain jurisdictions in compliance with the requirements applicable therein. The transfer of a dematerialized share occurs by book-entry. c) Direct and indirect shareholdings The ownership in the Company by each shareholder who is known to be the (direct or indirect) holder of shares of the Company representing 5% or more of the Company's voting rights is set out in the Share Capital section of this management report. d) Special control rights All the issued and outstanding ordinary shares in the Company have equal voting rights and there are no special control rights attached to the ordinary shares. As per article 7.1 of the Articles of Association of the Company each share is entitled to one vote. e) Control system of employee share schemes The Board of Directors is not aware of any system of control of any employee share scheme where the control rights are not exercised directly by the employees. f) Restrictions on voting rights In general, there are no restrictions on the voting rights of the Shurgard shares. However, the sanction of suspension of voting rights automatically applies to any shareholder (or group of shareholders) who has (or have) crossed the thresholds set out in articles 8 to 15 of the Transparency Law but have not notified the Company accordingly. The sanction of suspension of voting rights will apply until the notification has been properly made by the relevant shareholder(s). g) Restrictions on the transfer of securities Certain shareholders have signed lock-up agreements with the underwriters of our IPO transaction, in which they committed themselves not to transfer or dispose of any shares during a certain period (180 or 360 days from October 11, 2018). However, these restrictions shall not prohibit the undersigned from (i) accepting a general take-over bid on all of the ordinary share capital of the Company, giving an irrevocable commitment to accept

SHURGARD ANNUAL REPORT 2018
60
such an offer, or disposing of shares to an offeror or potential offeror during the period of such an offer; (ii) proceeding with any disposal required by law, regulation or a court of competent jurisdiction; and (iii) transferring shares intra-group for legal entities or intra-family for natural persons, provided that each such transferee shall continue to be bound by the foregoing restrictions for the remainder of the lock-up period. h) Appointment / replacement of board members and Amendments of the Articles of Association According to Articles 9.1 to 9.3 of our Articles of Association, the Company shall be managed by a Board of Directors. Each Director will be appointed by the General Meeting. The General Meeting shall determine the number of Directors, and the duration of their mandate is set at one year. Each Director is eligible for re-appointment and may be removed at any time, with or without cause by a resolution of the General Meeting. In the event of a vacancy on the Board of Directors, the remaining Directors may elect by co-optation a new Director to fill such vacancy until the next General Meeting, which shall ratify such co-optation or elect a new Director instead. An amendment of our Articles of Association must be adopted by an extraordinary resolution at a General Meeting in front of a Luxembourg public notary. A two-thirds majority of the votes cast by the shareholders present or represented is required. Our Articles of Association do not provide for any specific conditions that are stricter than required by Luxembourg law. i) Powers of Board Members According to Article 10 of our Articles of Association, the Board of Directors is vested with the broadest powers to perform all acts necessary or useful to accomplish the Company's object. All powers not expressly reserved by the Articles of Association or by the Laws to the General Meeting or to the Auditor(s) shall be within the competence of the Board of Directors. As of December 31, 2018, according to Article 6.1 of our Articles of Association, the authorized capital of the Company (including the issued share capital) was set at €95,800,729.98 divided into 134,236,856 shares without nominal value. According to Article 6.2 of our Articles of Association, the Board of Directors is authorized, up to the maximum amount of the authorized capital, to:
∙ increase the issued share capital in one or several tranches with or without share premium, against
payment in cash or in kind, by conversion of claims on the Company or in any other manner;
∙ issue subscription and/or conversion rights in relation to new shares or instruments under the terms and conditions of warrants (which may be separate or linked to shares, bonds, notes or similar instruments issued by the Company), convertible bonds, notes or similar instruments; and
∙ determine the place and date of the issue or successive issues, the issue price, the terms and conditions of the subscription of and paying up on the new shares and instruments; and
∙ remove or limit the statutory preferential subscription right of the shareholders.
The above authorizations are valid until September 26, 2023, which corresponds to a period ending five years after the date of the General Meeting creating the authorized capital. The above authorizations may be renewed, increased or reduced by a resolution of the General Meeting with a two-thirds majority of the votes cast by the shareholders present or represented. The Board of Directors is furthermore authorized until October 16, 2019 to effect on one or several occasions, repurchases and/or cancellation of Company shares on the regulation market on which the Company’s shares

SHURGARD ANNUAL REPORT 2018
61
are admitted for trading or by any other means, for a maximum number of shares representing EUR 50 million in aggregate, at a price not lower than 15% below and not higher than 15% above the shares’ official price reported in the trading session on the day before carrying out each individual transaction. j) Change of control agreements If a change of control occurs, each individual lender under the €250 million revolving facility we entered into in 2018, may cancel its commitment by not less than a 30 days’ notice and require repayment of its share in all outstanding loans. The outstanding U.S. Private Placement Notes requires us to make an offer to prepay all outstanding U.S. Private Placement Notes if, within a period of 90 days following the occurrence of a change of control, the rating assigned to the U.S. Private Placement Notes (or any other of our unsecured and unsubordinated indebtedness having an initial maturity of five years or more) immediately prior to the change of control is lowered below investment grade and/or withdrawn (or, in absence of any rated U.S. Private Placement Notes, we fail to obtain an investment grade rating of such rated debt instruments). k) End of employment compensation There are no agreements between the Company and its Board members or employees providing for compensation if they resign or are made redundant without valid reason or if their employment ceases because of a takeover bid.
RELATED PARTY TRANSACTIONS
We are engaged in certain commercial and financial transactions with related parties. Please refer to note 36 to the consolidated financial statements for further details

SHURGARD ANNUAL REPORT 2018
62
CORPORATE GOVERNANCE
CORPORATE GOVERNANCE REGIME
As a Luxembourg Société Anonyme whose shares are exclusively listed on Euronext Brussels, Shurgard is not required to adhere to the Luxembourg corporate governance regime applicable to companies that are traded in Luxembourg, or to the Belgian corporate governance regime applicable to stock corporations organized in Belgium. However, as we recognize the importance of high standards of corporate governance, we have set up our own Corporate Governance Charter that meets the specific needs and interests of our Company. The charter came into effect when the Company listed on Euronext Brussels. Our governance structure is designed to foster principled actions, informed and effective decision-making, and appropriate monitoring of both compliance and performance. For additional information please refer to the Corporate Governance Charter in the “Governance” section of the Shurgard website https://corporate.shurgard.eu. The governing bodies of our Company are the Board of Directors and the General Shareholders’ Meeting. The powers of these governing bodies are defined in the 1915 Companies Act and our Articles of Association. The Board together with the Senior Management manages the Company in accordance with applicable laws.
BOARD OF DIRECTORS
According to our Articles of Association, the Directors are appointed by the General Meeting of Shareholders for a term of one year. The General Shareholders’ Meeting also determines the number of members of the Board of Directors, their remuneration and the terms of their office (which may not exceed one year). The Directors are eligible for reelection and they can be removed at any time by the General Meeting of Shareholders, with or without cause. If the Board has a vacancy, the remaining Directors have the right to appoint a replacement until the next General Shareholders’ Meeting. The Board of Directors is currently composed of eleven members, one Executive Director and ten Non-Executive Directors. We consider six of the members of our Board of Directors to be independent, of which one has been appointed Lead Independent Director. At the Shareholders’ Meeting of September 26, 2018, the Board of Directors was appointed for a term of one year. For more detailed information on the composition of the Board of Directors, see section “Management” on page 19 of this report.
RESPONSIBILITY OF THE BOARD OF DIRECTORS The Board of Directors retains sole responsibility for the following matters:
a) convene the general meeting of shareholders of the Company;
b) establish the internal regulations of governance of the Company;
c) elect the members of the Audit Committee, the Nomination and Remuneration Committee and the Real Estate Investment Committee;
d) appoint and remove the CEO of the Company;
SHURGARD ANNUAL REPORT 2018
63
e) delegate the day-to-day management of the Company to the CEO;
f) appoint and remove the other executive board members when their appointment or removal is proposed by the CEO;
g) approve the overall Company strategy;
h) approve the annual overall Company budget;
i) approve the annual balance sheet and profit and loss accounts and propose an allocation of the annual profits;
j) approve any acquisition or disposal of assets, properties or subsidiaries worth more than €50 million; and
k) decide on a Company basis on the introduction or major amendments of pension schemes, share option schemes, participation of employees in profits, or similarly important labor relations schemes.
BOARD MEETINGS The Board of Directors meets as often as the interests of the Company require and at least four times a year. The meetings are called by the Chairperson of the Board. Except in urgent cases or with the prior consent of all the Directors, at least forty-eight hours’ written notice must be given for Board meetings. The Chairperson prepares the agenda of the Board meetings after consultation with the CEO and/or the Lead Independent Director. The Chairperson presides at meetings of the Board. If they are absent the Board can vote by majority to appoint another Director as Chairperson for the relevant meeting. At least half of the Directors must be present at the meeting for any deliberation and voting to be valid. No Directors can be represented by another Director at any meeting of the Board. The convening notice provides details of the day, time and place of the Board meetings. The Board and its committee meetings are conducted in English and can be held remotely (e.g. by video or telephone conference). In these circumstances, the connection must be uninterrupted, all members taking part in the meeting must be identified, and they must be able to communicate with each other on a continuous basis. Since the Company’s listing, the Board of Directors held one meeting on October 29, 2018. All members of the Board were present at this meeting. During that meeting, the Board members approved the acquisition of ABC Selfstore and reviewed and discussed the financial results of the third quarter as well as the committee reports presented by the committee chairs.

SHURGARD ANNUAL REPORT 2018
64
DIRECTORSHIPS HELD BY BOARD MEMBERS As of December 2018, our Board members held directorship mandates in the following companies:
Name Mandates
Ronald L. Havner, Jr. Public Storage, PS Business Parks, Inc., AvalonBay Communities, Inc., Huntington Hospital
Marc Oursin Triangle Investissement, Ugly Invest
Z. Jamie Behar Sunstone Hotel Investors, Inc., Broadstone Real Estate Access Fund, Puppies Behind Bars
John Carrafiell GreenOak Real Estate, Klépierre, Yale School of Architecture Dean’s Council, London’s Chelsea and Westminster Hospital’s Development Board, Development Board of the Anna Freud National Centre for Families and Children
Daniel C. Staton Public Storage, Staton Capital LLC, ARMOUR Residential REIT Inc, ACM, Here Today, Terran Orbital
Ian Marcus Secure Income REIT PLC, Town Centre Securities plc, Prince’s Foundation, Redevco NV, the Wharton Business School Real Estate Faculty, Cambridge University Land Society, Ian Marcus Consultants, Limited, The Crown Estate, Eastdil Secured LLP
Muriel De Lathouwer CFE, Coderdojo Belgium asbl, Amoobi
Olivier Faujour /
Frank Fiskers Whitbread PLC
Padraig McCarthy NewSpace Capital Partners GP S.A, NewSpace Capital GP S.A., NewSpace Capital Partners SCSp
Isabelle Moins April International Care France, Smile Corp (SAS), Innovaas
SHARE OWNERSHIP OF DIRECTORS As of December 31, 2018, the members of the Board of Directors owned 54,149 shares or 0.06% of the total share capital of the Company. The breakdown of share ownership is:
Name Number of shares
Ronald L. Havner, Jr. 10,000
Marc Oursin 18,092
Z. Jamie Behar 1,901
John Carrafiell N/A
Muriel De Lathouwer 1,739
Olivier Faujour 4,347
Frank Fiskers 4,347
Ian Marcus 2,515
Padraig McCarthy N/A
Isabelle Moins 1,700
Daniel C. Staton 9,508
Total 54,149

SHURGARD ANNUAL REPORT 2018
65
INDEPENDENCE OF BOARD MEMBERS Six of the Non-Executive directors – Muriel De Lathouwer, Olivier Faujour, Frank Fiskers, Ian Marcus, Padraig McCarthy and Isabelle Moins– are independent of management and other outside interests that might interfere with the exercise of their independent judgement. We define an “independent Board member” as a member who:
a) is not an executive or managing director of the Company or an associated company;
b) is not an employee of the Company or an associated company;
c) does not receive significant additional remuneration from the Company or an associated company apart from a fee received as Non-Executive Director;
d) does not have an employee, contractual or managerial relationship with, is not an agent of, nor has a financial interest in or receive compensation from, the controlling shareholder(s) (i.e. a strategic shareholder with a 10% or larger holding);
e) has no significant business relationship with the Company. Business relationships include significant suppliers of goods or services (including financial, legal, advisory or consulting services), a significant customer and organizations that receive significant contributions from the Company or Group;
f) is not a partner or employee of the external auditor of the Company or an associated company;
g) is not an executive or managing director in another company in which an executive or managing director of the Company is a non-executive or supervisory director, and does not have other significant links with executive directors of the Company through involvement in other companies or bodies; and
h) is not a close family member of an executive or managing director, or of persons in the situations referred to in points (a) to (h).
DIVERSITY OF BOARD MEMBERS Shurgard is committed to achieve a high level of diversity at all levels in diversity enhancing qualities such as age, gender, race, ethnicity, geography, sexual orientation, gender identity and diverse background. The commitment to diversity also extends to the Company’s Board. Our Board reflects diverse perspectives, including a complementary mix of skills, experience and backgrounds, which we believe is paramount to the Company’s ability to represent the interest of all shareholders.
COMMITTEES OF THE BOARD The Board of Directors has set up the following committees, each of which is governed by internal rules and regulations approved by the Board:
∙ the Audit Committee ∙ the Nomination and Remuneration Committee ∙ the Real Estate Investment Committee
The Board of Directors can amend or rescind the powers delegated to each of the committees and amend the internal rules and regulations to which the committee is subject. According to their internal rules and regulations, each of the committees convenes at appropriate times and whenever required by our affairs. The meetings are called by the chairperson or by two members acting jointly. The meetings of the committee are held in the Grand Duchy of Luxembourg at the Company’s registered office, or at other places indicated on the convening notice. Except in urgent cases or for regularly scheduled meetings, the meetings of the committee are announced in writing at least 48 hours in advance. This notice can be waived if each member of the committee provides documented consent. Meetings previously scheduled by the
SHURGARD ANNUAL REPORT 2018
66
committee do not require a separate notice. Members of the committee can participate in a meeting remotely by conference call or video-conference. Remote participation is equivalent to a physical presence at the meeting. At least half of the committee members present or represented at a committee meeting constitutes a quorum, and resolutions are adopted by a simple majority vote of the committee members present or represented. In case of a tie, the resolution will not be approved. The committee provides periodic reports to the Board of Directors and assesses its own effectiveness annually. Audit Committee The Audit Committee is responsible for all matters set forth in the Luxembourg law of July 23, 2016 on the audit profession, as amended (the “Audit Act”), the Audit Committee should, in particular, perform the following activities:
a) inform the Board of Directors of the outcome of the statutory audit and explain how the statutory audit contributed to the integrity of financial reporting and what the role of the audit committee was in that process;
b) monitor the financial reporting drawing-up process and submit recommendations or proposals to ensure its integrity;
c) monitor the effectiveness of our internal quality control and risk management systems and, where applicable, its internal audit, regarding our financial reporting, without breaching its independence;
d) monitor the statutory audit of the annual and consolidated financial statements, in particular its performance, taking into account any findings and conclusions by the CSSF pursuant to Article 26(6) of Regulation (EU) No 537/2014;
e) review and monitor the independence of the approved statutory auditor(s) (réviseur(s) d’entreprises agréé(s)), in particular the appropriateness of the provision of non-audit services to the audited entity in accordance with Article 5 of Regulation (EU) No 537/2014;
f) be responsible for the selection of the approved statutory auditor(s) (réviseur(s) d’entreprises agréé(s)) and recommend the approved statutory auditor(s) (réviseur(s) d’entreprises agréé(s)) for approval by the Company’s shareholders except when Article 16(8) of Regulation (EU) No 537/2014 is applied.
At least one member of the Audit Committee should be competent in accounting and/or auditing. The Audit Committee members as a whole should be competent in the relevant sector in which we are operating. A majority of the members of the Audit Committee should be independent of the Company. The chairperson of the Audit Committee should be appointed by its members and should also be independent of the Company. As of December 31, 2018, the Audit Committee consisted of three members: Padraig McCarthy (chairperson), Jamie Behar and Isabelle Moins. Padraig McCarthy and Isabelle Moins are considered independent Board members. Padraig McCarthy has a special competence in accounting and/or auditing. Since the Company’s listing, the Audit Committee held one meeting on October 29, 2018, where all committee members were present. Nomination and Remuneration Committee The Nomination and Remuneration Committee is responsible for the following matters:
a) the review and approval of corporate goals and objectives relevant to the Senior Management’s compensation, and the evaluation of their performance related to these goals;

SHURGARD ANNUAL REPORT 2018
67
b) making recommendations to the Board on incentive compensation plans and equity-based plans;
c) submitting proposals to the Board on the remuneration of members of the Senior Management;
d) making recommendations to the Board on the company’s framework of remuneration for Senior Management and other members of the executive management, and assisting the Board in drawing up the remuneration policy of the Company;
e) identifying candidates qualified to serve as members of the Board and executive officers;
f) recommending candidates to the Board for appointment by the General Meeting or for appointment by the Board to fill interim vacancies on the Board;
g) facilitating the evaluation of the Board and reporting to the Board on all matters relating to remuneration (including, for example, on internal pay disparity);
h) preparing a remuneration report (which should contain, among others, disclosure on the remuneration of each executive officer) and which should be submitted to the annual Shareholders’ Meeting for an advisory vote;
i) submitting a list of candidates to the Board on the appointment of new directors and Senior Management;
j) assessing the existing and required skills, knowledge and experience for any post to be filled and preparing a description of the role, together with the skills, knowledge and experience required;
k) making an assessment about the independence of candidate directors; and
l) assessing, together with the CEO, the way in which the Senior Management operates and the performance of its members at least once a year.
The Nomination and Remuneration Committee members should be competent in the relevant sector in which we are operating. The committee will be composed of independent Directors and Non-Executive Directors of the Board of Directors. As of December 31, 2018, the Nomination and Remuneration Committee consisted of four members: Frank Fiskers (chairperson), Muriel De Lathouwer, Ian Marcus and Padraig McCarthy, all of whom are considered independent Board members. Since the Company’s listing, the Nomination and Remuneration Committee held one meeting on October 29, 2018, where all committee members were present. Real Estate Investment Committee The Real Estate Investment Committee is authorized by the Board to review and approve all acquisitions or disposal of assets, properties or subsidiaries under €50 million. As of December 31, 2018, the Real Estate Investment Committee consisted of four members: Jamie Behar (chairperson), Olivier Faujour, Frank Fiskers and Daniel C. Staton. Olivier Faujour and Frank Fiskers are considered independent Board members. Since the Company’s listing, the Real Estate Investment Committee held one meeting on October 29, 2018, where all committee members were present.

SHURGARD ANNUAL REPORT 2018
68
SENIOR MANAGEMENT
The Senior Management of the Group is made up of five members, who hold their positions through employment contracts with entities of the Group, except for the CEO who has a management agreement and who is appointed and may be removed by the Board of Directors. For more detailed information on the composition of the Board of Directors, see section “Management” on page 19 of this report. The Board of Directors has delegated the daily management of the business to the CEO. The CEO has the authority to represent the Board, as well as a number of ancillary specific powers. In addition, the CEO has been granted powers to approve any development or refurbishments of real estate assets.
DIRECTORSHIPS HELD BY SENIOR MANAGEMENT As of December 2018, the members of the Senior Management held directorship mandates in the following companies:
Name Mandates
Marc Oursin Triangle Investissement, Ugly Invest
Jean Kreusch Transforming Talent SPRL
Duncan Bell Self-Storage Association UK (SSAUK)
Ammar Kharouf /
Jean-Louis Reinalda Tekto BV (NL)
SHARE OWNERSHIP OF THE MEMBERS OF SENIOR MANAGEMENT As of December 31, 2018, the members of the Senior Management owned the following numbers of shares, adding up to 36,036 shares or 0.04% of the total share capital:
Name Number of shares
Marc Oursin 18,092
Jean Kreusch 6,521
Duncan Bell 2,174
Ammar Kharouf 4,347
Jean-Louis Reinalda 4,902
Total 36,036
DIRECTORS’ AND MANAGEMENT CONFLICTS OF INTEREST
Members of the Senior Management have employment agreements with an entity of the Group, other than the CEO who has a management contract. Certain members of the Senior Management also serve on the boards of various Group companies. In addition, the CEO is a member of the Board of Directors of the Company. Therefore, conflicts of interest could arise for members of the Board of Directors and of Senior Management between their duties towards the Group, the relevant individual Group company and their duties as members of the Board of Directors of the Company or as a member of Senior Management, respectively.

SHURGARD ANNUAL REPORT 2018
69
As of December 31, 2018, the following members of the Board of Directors are partners, directors, representatives and/or employees of Public Storage or an affiliate thereof: Ronald L. Havner, Jr. and Daniel C. Staton. Jamie Behar and John Carrafiell are members of the Board of Directors elected on the designation of our shareholder New York State Common Retirement Fund. Apart from these potential conflicts of interest and the transactions and legal relations described in the section “Related Party Transactions”, there are no other actual or potential conflicts of interest between the obligations of the members of the Board of Directors or Senior Management toward the Company and their respective private interests or other obligations. None of the Board members or members of the Senior Management are related to one another by blood or marriage. We have not granted any Board members or members of the Senior Management any loans, nor have we assumed any guarantees or sureties on their behalf. Pursuant to the 1915 Companies Act, in the event that a member of the Board of Directors has a financial conflict of interest in any Company transaction submitted to the approval of the Board of Directors, they must inform the Board of Directors at that meeting and include a record of their statement in the minutes of the meeting. The member of the Board of Directors may not take part in the deliberations relating to that transaction and may not vote on the resolutions relating to that transaction. At the following General Shareholders’ Meeting, before any other resolution is put to vote, a special report should be made on any transactions in which any of the directors may have had a conflict of interest with that of the Company.
ANNUAL GENERAL MEETING
The Annual General Meeting of Shareholders must be held within six months following the end of the financial year at the place and on the day set by the Board of Directors. The Board of Directors can convene Extraordinary General Meetings as often as the Company’s interests require. In accordance with the Luxembourg Company Law, a General Meeting of Shareholders must be convened on the request of one or more shareholders who together represent at least one tenth of the Company’s capital. The right of a shareholder to participate in a General Meeting and to exercise the voting rights attached to his shares are determined with respect to the shares held by such shareholder the 14th day before the General Meeting of Shareholders at 24 hours (Luxembourg time), which is known as the “Record Date”. Each shareholder has the right to ask questions about the items on the agenda of a General Meeting of Shareholders. Each share entitles the holder to one vote. Each shareholder can exercise their voting rights in person, through a proxy holder, or by correspondence in advance of the General Meeting of Shareholders, by means of the form made available by the Company.
STATUTORY AUDITOR
As from September 26, 2018 when the Company was converted to a public limited liability company (société anonyme) under Luxembourg law, the Company’s statutory auditor (réviseur d’entreprise agréé) is Ernst & Young S.A. Ernst & Young S.A. is registered with the CSSF as a cabinet de révision agréé and with the Luxembourg Trade and Companies Register (Registre de Commerce et des Sociétés, Luxembourg) under number B47771. The registered office of Ernst & Young Luxembourg S.A. is 35E, Avenue John F. Kennedy, L-1855 Luxembourg, Grand Duchy of Luxembourg. Ernst & Young S.A. is a member of the Luxembourg body of registered auditors (Institut des Réviseurs d’Entreprises). Audit fees in 2018 were €559,109 for the audits of consolidated and statutory financial statements of the Company and its subsidiaries.

SHURGARD ANNUAL REPORT 2018
70
COMPENSATION REPORT
EXECUTIVE COMPENSATION POLICY
COMPENSATION PHILOSOPHY Shurgard’s compensation philosophy is designed to promote a well-governed approach to compensation. It includes pay practices that attract and retain exceptional executives and align the interests of management with the interests of the shareholders to create long-term shareholder value. The following key features of the compensation program reflect Shurgard’s philosophy: What we do:
∙ Align pay with performance by putting a substantial portion of our executive officers’ compensation “at risk”.
∙ Promote retention and increase long-term shareholder value. New equity award grants to executive officers only vest on the third anniversary of the grant.
∙ Mitigate undue risk in our executive compensation program. Financial targets for bonuses are based on selected metrics determined by the Committee to avoid inordinate focus on any particular metric. Bonus payments are capped at a maximum pay out level.
∙ Equity ownership guidelines for executive officers. We have robust stock ownership guidelines that must be met by our executive officers within five years of the IPO. Our minimum equity ownership guidelines are 2.5X annual base salary for our CEO and 1.5X-2X annual base salary for all our other executive officers.
∙ Pay a high percentage of executive compensation in equity. Our executive officers receive a high percentage of their total compensation in equity, thus aligning their interests closely with our shareholders.
∙ Clawback of unvested equity awards. Awards granted through our Equity Plan are subject to mandatory cancellation if the Company’s financial statements are restated or if a grantee engaged in conduct that resulted in substantial losses.
What we do not do:
∙ No “golden parachute”.
∙ No guaranteed bonus arrangements with our executive officers except in connection with new hires as an inducement to attract the best candidates.
∙ No excessive prerequisites. The Company does not offer prerequisites to our executive officers except for prerequisites that are available to employees generally such as contributions to pension plans and company car or allowance.
∙ No repricing of stock options.
∙ No tax gross ups. The Company does not provide “gross-ups” or an increase in income payments to account for deductions like tax. Nor do we provide change in control benefits to our executive officers that are not available to other employees generally.
∙ No supplemental retirement plans. Other than pension plans, the Company does not provide supplemental retirement benefits to our executive officers.
∙ No hedging against price fluctuations in the company’s securities is permitted.

SHURGARD ANNUAL REPORT 2018
71
COMPONENTS OF EXECUTIVE COMPENSATION The executive compensation design is simple, effective and links pay to performance. We create shareholder value by driving financial performance and aligning the interests of our executive team with the interests of our shareholders. To achieve our compensation objectives, we believe that total executive compensation should be balanced among the following components:
∙ a competitive annual base salary;
∙ short term performance-based incentive opportunities in the form of bonuses that are generally paid in cash; and,
∙ long term performance-based equity awards that correlate with shareholders’ long-term financial objectives.
Shurgard links these components of its executive compensation program to its business and talent strategies as follows:
Elements of pay Form Links to business and talent strategies
Annual base salary (fixed)
Cash
∙ Customary, fixed element of compensation intended to attract and retain exceptional executives.
∙ The Nomination and Remuneration Committee considers market data of comparable companies and/or competitive conditions in the market, the individual’s performance and responsibilities, and its business judgment.
Annual short-term performance-based bonus awards (variable)
Cash
∙ Aligns pay with the achievement of short-term objectives.
∙ Pay-outs based on achievement of corporate and individual performance goals, or a combination of the two.
∙ Achievement of other operational and financial goals may also be included from time to time.
∙ Actual bonus amounts are subject to the discretion of the Committee based on the collective business judgment of its members.
Long-term performance-based equity awards (variable)
Stock options
∙ Emphasize long-term shareholder value creation with equity awards, giving executive officers an ongoing stake in the success of the business through stock options.
∙ Options help us retain executive officers because new options only vest three years after their grant (cliff vesting).
∙ Stock options are granted with an exercise price of not less than 100% of the fair market value of our stock on the date of grant, which ensures that the executive does not profit from the option unless the price of our stock increases after the grant date.

SHURGARD ANNUAL REPORT 2018
72
COMPENSATION PROCESS The factors considered by the Remuneration Committee in making compensation decisions for our Senior Management include: Shareholder Advisory Votes to Approve Executive Compensation Our shareholders will vote annually on our advisory pay proposal. The Remuneration Committee believes this process demonstrates a method of aligning our shareholders and our performance with our executive compensation program. Compensation Surveys Each component of compensation we pay to our executives – salary, cash bonuses and equity – is based on the Remuneration Committee’s subjective assessment of each individual’s role and responsibilities and consideration of market compensation. The Remuneration Committee considers market rates by reviewing public disclosures of compensation paid to Senior Management by other companies of comparable size and market capitalization. An independent compensation consultant was retained, Willis Towers Watson, to prepare a market compensation survey in 2018. This was one factor the Remuneration Committee takes into consideration in targeting levels of compensation for Senior Management. Role of Board and Management The Remuneration Committee solicits the views of the Board on compensation of all the executives, particularly Mr. Oursin. Mr. Oursin attends all meetings of the Remuneration Committee at which (i) compensation of the other executives are discussed or (ii) company-wide compensation matters, such as consideration of a new equity plans, are discussed. Mr. Oursin does not vote on items before the Remuneration Committee and is not present during the Committee’s discussion and determination of his compensation. For executives other than Mr. Oursin, the Remuneration Committee sets their base salaries, bonus and equity compensation after consideration of the recommendations from Mr. Oursin.
EXECUTIVE COMPENSATION IN 2018
2018 PERFORMANCE HIGHLIGHTS Shurgard had a transformative year in 2018. In October, we came to the market with a successful initial public offering. The IPO was the culmination of many months of work by a dedicated team of people, particularly certain executives, who balanced the requirements of the offering with the smooth operation of the business. Through the lengthy process of the IPO we managed three successful self-storage acquisitions, in Sweden and the UK, which is testament to the reliable management of the business. Successful Execution of Strategy The Company achieved solid results in 2018 with the focus on (i) growing revenues and (ii) increasing our share of the market and improving the quality of our product by acquiring and developing new and existing properties.
∙ Property operating revenue rose 3.9% at constant exchange rates supported by the growth of our network and the opening of newly developed and newly acquired stores.
∙ Property operating revenue at Same Stores rose 1.2% at constant exchange rates.
∙ Property operating revenue from Non-Same Stores more than doubled.

SHURGARD ANNUAL REPORT 2018
73
∙ We strengthened our market position by acquiring or developing properties that added a total of almost 53,000 net rentable square meters
∙ We completed major redevelopment projects at six properties which added in total more than 4,000 net rentable square meters.
∙ We have proposed a dividend of 25% of the target pay-out ratio of 80% of 2018 adjusted EPRA earnings.
2018 COMPENSATION TARGETS The compensation of the members of the Senior Management consists of a fixed and a variable compensation components and additional benefits, such as company cars or allowances, insurance and pension benefits. Framework of CEO Compensation. The annual base salary for Mr. Oursin is €500,000 which has remained unchanged since 2012. Additionally, an annual cash bonus incentive award of €450,000 was set assuming the achievement of performance criteria set by the Remuneration Committee. Framework of Short-Term Performance-Based Bonus Awards for all Executives The annual performance-based cash bonus program provides an opportunity to reward Senior Management for performance during the fiscal year. Although Shurgard may set annual incentive award targets, this does not preclude the Remuneration Committee from approving higher or lower annual incentive awards in the future. The actual awards will be determined by the Committee after determining whether the targeted corporate performance metrics have been achieved. The Committee will consider the recommendations of the CEO with respect to the performance of the other members of Senior Management and their achievement of individual and other goals. In addition, the Committee will solicit the views of the Chairman and the Board, particularly with respect to the performance of the CEO. In addition, the 2018 incentive bonus is based on the following corporate operational and financial goals:
∙ All Store revenue growth 2018 positioned to achieve a medium-term growth from 4% to 6%,
∙ Same Store revenue growth from 1% to 1.5%,
∙ NOI margin increase,
∙ Occupancy sqm of 87% at end of 2018,
∙ New developments opening in Stockholm (Huddinge) and Berlin (Neukoelln),
∙ Roll out of the 2018 property redevelopment plan,
∙ Creation and buildup of the pipeline for 2019 and ongoing,
∙ The seizure of acquisition opportunities delivering a yield at maturity within 8%-10%,
∙ At least €95 million of adjusted EPRA earnings.
SHURGARD ANNUAL REPORT 2018
74
Share Ownership Requirements A large percentage of the Senior Management compensation is tied to the achievement of performance goals that are key drivers of the Company’s success. In addition, following the Shurgard IPO, the members of the Senior Management must meet share ownership requirements. They are requested to build up shareholdings in the Company proportional to their fixed compensation. This is 2.5 times the fixed compensation for the CEO, 2.0 times for the CFO and 1.5 times for the other Senior Management members. These shareholdings must be accumulated over five years following the IPO.
2018 COMPENSATION DECISIONS
Performance Targets In early 2019, the Remuneration Committee reviewed the 2018 performance. 2018 CEO Compensation In recognition of Mr. Oursin’s success in 2018, the Remuneration Committee approved the payment of a cash bonus of €405,000. Mr. Oursin’s annual base salary remained at €500,000. 2018 Compensation for Executives other than our CEO
Base salaries for 2018 for Mr. Kreusch, Mr. Bell, Mr. Kharouf, and Mr. Reinalda are €355,584, £210,000, €215,000, and €174,250 respectively. Annual Cash Incentives for 2018. After consideration of individual performances of the direct reports of Mr. Oursin, the Remuneration Committee awarded the following annual incentive bonuses, to be paid in 2019, to the following executives: Mr. Kreusch, €270,000; Mr. Bell, £160,000; Mr. Kharouf €117,000; Mr. Reinalda €68,000. IPO-Bonus 2018. For the exceptional case of the Company’s IPO in 2018, Mr. Oursin, Mr. Kreusch, and Mr. Kharouf were entitled to receive a one-off cash bonus, which was paid in 2018. The total amount of this one-off bonus was €880,000.
LONG-TERM PERFORMANCE-BASED EQUITY AWARDS 2018 In addition to the above one-off IPO bonus, a one-off stock option grant was made to the members of the Senior Management after the successful IPO in 2018, under a new equity compensation plan (see “Equity Compensation Plan 2018”). This grant was made to support retention and further strengthen the link between compensation and our stock price development. The exercise price was equal to the offering price of €23 per share. A total of 680,000 stock options were granted under this one-off grant to the members of the Senior Management. Mr. Oursin received a grant of 230,000 stock options and Mr. Kreusch, Mr. Bell, Mr. Kharouf, and Mr. Reinalda received grants of 150,000, 110,000, 100,000 and 90,000, respectively.

SHURGARD ANNUAL REPORT 2018
75
TOTAL COMPENSATION 2018 The total aggregate compensation paid to the five members of the Senior Management in the year ended December 31, 2018 amounted to €5,939,368. This included the following (the 2017 figures are shown for comparison):
Name and position Year Salary1 Bonus2 Option awards3
Non-equity incentive plan
compen-sation4
All other compen-sation5
Total
Marc Oursin CEO
2018 500,000 450,000 793,500 450,000 52,000 2,245,500
2017 500,000 0 141,000 450,000 52,000 1,143,000
Jean Kreusch CFO
2018 355,584 300,000 517,500 300,000 32,089 1,505,173
2017 355,584 0 94,000 300,000 32,185 781,769
Duncan Bell VP Operations
2018 238,668 0 379,500 136,382 33,726 788,276
2017 182,648 0 82,250 136,986 33,830 435,714
Ammar Kharouf VP HR and Legal
2018 215,000 130,000 345,000 130,000 12,097 832,097
2017 215,000 0 70,500 130,000 16,664 432,164
Jean-Louis Reinalda VP Real Estate
2018 174,250 0 310,500 68,000 15,572 568,322
2017 174,250 0 70,500 85,000 15,572 345,322 1 For Mr. Kreusch the amount includes the legal holiday pay and 13th month granted during the year. The amounts for Mr. Bell are converted from pound
Sterling. The original Sterling value was £160,000 for 2017 and £210,000 for 2018.
2 The amounts shown in this column reflect the bonuses awarded in connection with the successful initial public offering (IPO) in October 2018.
3 The amounts shown in this column reflect the grant date fair value of stock option awards granted during the corresponding year. The fair value has been determined using the Black-Scholes-model. As of the IPO-date, the fair value of the 2017-awards has been recalculated. On the IPO-date, all options from prior plans have been converted from cash-settled into equity-settled share-based compensation plans. The value reflected on the 2017-awards is the recalculated value after IPO-date.
4 The amounts shown in this column reflect annual cash incentive awards paid to the executive management based on performance targets for the prior year. The amounts for Mr. Bell are converted from pound Sterling. The original Sterling value was £120,000 paid in 2017 and 2018. The maximum annual cash incentive award for 2018 performance are for Mr. Oursin €450,000, Mr. Kreusch €300,000, Mr. Bell £160,000, Mr. Kharouf €130,000 and Mr. Reinalda €85,000.
5 The amounts shown in this column for all named executives reflect contributions to their individual group insurance and includes also the amounts for their car, being either a car allowance or the benefit in kind for using a company car. For Mr. Kreusch this amount also includes his representation allowance. For Mr. Bell this amount also includes housing allowance for the time he spends in Belgium while being a UK resident. The amount of 2017 for Mr. Kharouf includes the housing allowance he received during the first two months of 2017.
EMPLOYEE STOCK OPTION PLAN (2015-2016-2017) The Company granted stock options under three incentive plans which are still outstanding: the 2015 equity incentive plan, the 2016 equity incentive plan and the 2017 long-term incentive plan. No stock options were granted in 2018 under those plans, and no new grants may be made under those plans. Therefore, the total number of stock options granted under those three plans is 739,000.
The key features of the stock options outstanding under the 2015, 2016 and 2017 plans are as follows:
∙ upon exercise, each stock option gives the right to one ordinary share,
∙ the stock options were granted for free,
∙ the stock options may be exercised in tranches of 25% per year from the first anniversary of the date of the grant, so that each grant is fully vested after 4 years,
∙ the stock options have a term of 10 years, and
∙ the stock options vest subject to customary service rules.

SHURGARD ANNUAL REPORT 2018
76
The exercise price of each stock option is as follows:
∙ 2015 Plan: EUR 8.77
∙ 2016 Plan: EUR 18.32
∙ 2017 Plan: EUR 21.51
EQUITY COMPENSATION PLAN (2018) On September 26, 2018, the Company approved a new equity compensation plan to incentivize certain executives and employees of the Group. This new plan enables the Company to grant stock options and, possibly, restricted stock units in 2018 and following years. The first grant of stock options under this new plan took place at the closing of the IPO. The maximum number of stock options and restricted stock units intended to be granted under the new plan is 1,915,000. The key features of the stock options granted under the new equity compensation plan are as follows:
∙ upon exercise, each stock option gives the right to one ordinary share,
∙ the stock options are granted for free,
∙ the exercise price of each stock option is equal to the stock exchange price of the underlying share at the time of the grant,
∙ the stock options only vest three years after their grant,
∙ the stock options have a term of 10 years, and
∙ the stock options vest subject to customary service rules.
For additional information regarding the Company’s stock option plans please refer to notes 26 and 35 “Share-based payment reserve” and “Share-based compensation expense” in the notes to the consolidated financial statements. The table below shows the grant of stock options held by each member of the Senior Management since 2015, as of December 31, 2018.
Name 2015 Plan 2016 Plan 2017 Plan 2018 Plan Total
Marc Oursin 120,000 0 60,000 230,000 410,000
Jean Kreusch 80,000 0 40,000 150,000 270,000
Duncan Bell 60,000 0 35,000 110,000 205,000
Ammar Kharouf 40,000 0 30,000 100,000 170,000
Jean-Louis Reinalda 0 30,000 30,000 90,000 150,000
NON-EXECUTIVE DIRECTOR COMPENSATION POLICY
Non-Executive Directors receive cash retainers for serving on the Board, chairing a committee and/or serving on a committee. The retainers are paid quarterly and pro-rated when a Non-Executive Director (1) joins the Board or a committee or (2) changes his or her position on a committee or no longer serves on the Board. The

SHURGARD ANNUAL REPORT 2018
77
Nomination and Remuneration Committee periodically evaluates Director compensation and recommends any changes. After considering the recommendations of the Nomination and Remuneration Committee, the Board will present any such changes at the Annual General Meeting of Shareholders for approval.
COMPENSATION OF MEMBERS OF THE BOARD OF DIRECTORS IN 2018
From the time of their appointment, each Non-Executive Director of the Company receives €50,000 per year. Each member who serves on a committee receives an additional €10,000 in compensation. The Lead Independent Director also receives an additional €10,000 per year. Each member who serves as the chairperson of the committee receives €65,000 per year. The Chairman of the Board of Directors receives €75,000 per year. An Executive Director of the Company will not receive any additional compensation for their mandate as Director. As the Board of Directors was only constituted following the successful listing on October 15, 2018, the Directors received their compensation on a pro-rata basis. The total compensation of the Board of Directors in the fiscal year 2018 amounted to € 165,000. Since this was the first appointment of a Board of Directors to the Company, there is no comparable previous year amount.
Name Position Committee membership Compensation in €
Ronald L. Havner, Jr. Chairman 18,750
Marc Oursin Chief Executive Officer /
Z. Jamie Behar Director Real Estate (Chair), Audit 18,750
John Carrafiell Director 12,500
Daniel C. Staton Director Real Estate 15,000
Ian Marcus Lead Independent Director Nomination 17,500
Muriel De Lathouwer Independent Director Nomination 15,000
Olivier Faujour Independent Director Real Estate 15,000
Frank Fiskers Independent Director Nomination (Chair), Real Estate 18,750
Padraig McCarthy Independent Director Audit (Chair), Nomination 18,750
Isabelle Moins Independent Director Audit 15,000
Total 165,000 The compensation amounts listed above are gross amounts and do not include any applicable VAT or the deduction of any applicable withholding tax.
DIRECTORS’ AND OFFICERS’ INSURANCE
We maintain a Directors and Officers insurance policy covering claims that might be made against members of the Board of Directors and Senior Management of the Company in relation to their functions. The Company entered into indemnification agreements with its Directors and Senior Management supplementing this policy. The Company also has a public offer of securities insurance policy in relation to the IPO. This covers claims that might be made against the Company, its Directors and officers and the principal shareholders in relation to the offering circular and the prospectus.
SHURGARD ANNUAL REPORT 2018
78
RESPONSIBILITY STATEMENT We confirm to the best of our knowledge that:
∙ the consolidated financial statements of Shurgard presented in this annual report and established inconformity with International Financial Reporting Standards as adopted by the European Union give atrue and fair view of the assets, liabilities, financial position and results of Shurgard and its subsidiariesincluded within the consolidation taken as a whole; and
∙ the management report presented in this annual report includes a fair review of the position andperformance, business model and strategy of Shurgard and the subsidiaries included within theconsolidation taken as a whole, together with a description of the principal risks and uncertainties theyface.
Luxembourg, February 25, 2019
Marc Oursin Chief Executive Officer
Jean Kreusch Chief Financial Officer

SHURGARD ANNUAL REPORT 2018
79
CONSOLIDATED FINANCIAL STATEMENTS AS OF AND FOR THE YEARS ENDED DECEMBER 31, 2018 AND 2017

SHURGARD ANNUAL REPORT 2018
80
CONSOLIDATED STATEMENT OF PROFIT AND LOSS FOR THE YEAR ENDED DECEMBER 31
(in € thousands) Notes 2018 2017
Real estate operating revenue 6 244,844 238,561
Real estate operating expense 7 (91,022) (90,609)
Net income from real estate operations 153,822 147,952
General, administrative and other expenses 9 (9,273) (10,834)
Of which depreciation and amortization expense 18 (1,679) (1,527)
Cost incurred in connection with Shurgard Public offering 25 (4,744) -
Acquisition costs of business combinations 13 (3,010) (1,007)
Royalty fee expense 36 (2,416) (2,343)
Operating profit before revaluation gain and loss on disposal of investment property, plant and equipment and assets held for sale
134,379 133,768
Valuation gain from investment property and investment property under construction
16,17 94,588 136,621
Gain (loss) on disposal of investment property plant and equipment and assets held for sale
1 (43)
Operating profit 228,968 270,346
Finance cost 10 (20,968) (18,616)
Profit before tax 208,000 251,730
Income tax expense 11 (36,309) (40,211)
Attributable profit for the period 171,691 211,519
Profit attributable to non-controlling interests 28 475 384
Profit attributable to ordinary equity holders of the parent 171,216 211,135
Earnings per share in €, attributable to ordinary equity holders of the parent:
Basic, profit for the period 14 2.48 3.31
Diluted, profit for the period 14 2.47 3.30 The accompanying notes are an integral part of these consolidated financial statements.

SHURGARD ANNUAL REPORT 2018
81
CONSOLIDATED STATEMENT OF COMPREHENSIVE INCOME FOR THE YEAR ENDED DECEMBER 31
(in € thousands) Notes 2018 2017
Profit for the year 171,691 211,519
Other comprehensive income
Items to be reclassified to profit or loss in subsequent periods:
Foreign currency translation reserve (17,220) (21,393)
Net other comprehensive (loss) income, net of tax, to be reclassified to profit or loss in subsequent periods
(17,220) (21,393)
Net other comprehensive (loss) income, net of tax, not to be reclassified to profit or loss in subsequent periods
(135) 166
Total comprehensive income for the year, net of tax 154,336 190,292
Attributable to non-controlling interests 28 (475) (384)
Attributable to ordinary equity holders of the parent 153,861 189,908 The accompanying notes are an integral part of these consolidated financial statements.

SHURGARD ANNUAL REPORT 2018
82
CONSOLIDATED STATEMENT OF FINANCIAL POSITION AS OF DECEMBER 31
(in € thousands) Notes 2018 2017
Assets
Non-current assets:
Investment property 16,17 2,548,168 2,289,770
Investment property under construction 17 11,151 10,922
Property, plant and equipment 18 1,221 1,145
Intangible assets 18 3,458 3,115
Deferred tax assets 11 1,567 1,468
Other non-current assets 19 1,842 1,611
Total non-current assets 2,567,407 2,308,031
Current assets:
Trade and other receivables 20 12,489 12,952
Other current assets 21 5,272 7,379
Cash and cash equivalents 22 250,922 23,645
Assets held for sale - 3
Total current assets 268,683 43,979
Total assets 2,836,090 2,352,010
Equity and liabilities
Equity
Issued share capital 23,24 62,542 800,629
Share premium 25 537,421 -
Share-based payment reserve 26 4,525 -
Distributable reserves 27 500,000 -
Other comprehensive loss (90,493) (73,138)
Retained earnings 781,001 608,835
Total equity attributable to equity holders of the parent 1,794,996 1,336,326
Non-controlling interests 28 3,665 3,190
Total equity 1,798,661 1,339,516
Non-current liabilities:
Interest-bearing loans and borrowings 29,31 597,709 597,347
Deferred tax liabilities 11 358,292 335,028
Finance lease obligations 30,31 5,583 6,046
Other non-current liabilities 32 381 600
Total non-current liabilities 961,965 939,021
Current liabilities:
Finance lease obligations 30,31 542 504
Trade and other payables and deferred revenue 33 65,112 64,718
Income tax payable 9,810 8,251
Total current liabilities 75,464 73,473
Total liabilities 1,037,429 1,012,494
Total equity and liabilities 2,836,090 2,352,010 The accompanying notes are an integral part of these consolidated financial statements.

SHURGARD ANNUAL REPORT 2018
83
CONSOLIDATED STATEMENT OF CHANGES IN EQUITY
(in € thousands) Issued share capital
Treasury shares1
Share premium
Share-based
payment reserve
Distri-butable reserves
Other Compre-hensive
loss2
Retained Earnings
Total Non-con-
trolling interests
Total equity
At January 1, 2017 801,578 (949) - - (51,911) 397,700 1,146,418 2,806 1,149,224
Net profit - - - - 211,135 211,135 384 211,519
Other comprehensive income - - - (21,227) - (21,227) - (21,227)
At December 31, 2017 801,578 (949) - - (73,138) 608,835 1,336,326 3,190 1,339,516
Alignment of Shurgard Self Storage S.A. issued share capital (note 23)
(950) 950
Creation of distributable reserves (Notes 23,27) (755,000) - - - 755,000 - - - - -
Interim distribution (Note 27) - - - - (255,000) - - (255,000) - (255,000)
Proceeds from issuance of equity (Notes 23,25) 17,842 - 557,158 - - - - 575,000 - 575,000
Transaction costs incurred in connection with issuance of equity (Note 25)
- - (19,737) - - - - (19,737) (19,737)
Conversion of cash-settled share option plans into equity-settled share option plans (Notes 26,35)
- - 4,280 - - - 4,280 4,280
Share-based compensation expense (Notes 26,35) - - - 216 - - - 216 216
Sale of treasury shares to option holders (Notes 24,35)
- 21 - 29 - - - 50 50
Net profit - - - - - - 171,216 171,216 475 171,691
Other comprehensive income - - - - (17,355) - (17,355) - (17,355)
At December 31, 2018 63,470 (928) 537,421 4,525 500,000 (90,493) 781,001 1,794,996 3,665 1,798,661 The accompanying notes are an integral part of these consolidated financial statements 1 In our Statement of Financial Position, the value of our treasury shares is deducted from issued share capital (notes 23 and 24) 2 Other comprehensive income for all periods as of January 1, 2017, December 31, 2018 and December 31, 2017 includes €4.9 million comprehensive income the Company earned in connection with net investment hedges the Company entered into.

SHURGARD ANNUAL REPORT 2018
84
CONSOLIDATED STATEMENT OF CASH FLOWS FOR THE YEAR ENDED DECEMBER 31
(in € thousands) Notes 2018 2017
Operating activities
Profit for the period before tax 208,000 251,730
Adjustments to reconcile profit before tax to net cash flows:
Valuation gain on investment property and investment property under construction
17 (94,588) (136,621)
(Gain) loss on disposal of investment property and assets held for sale (1) 43
Depreciation and amortization expense 18 1,679 1,527
Share based compensation expense 26,35 216 -
Finance cost 10 20,968 18,616
Working capital movements:
Decrease (increase) in trade receivables, other current and non-current assets
1,531 (494)
Increase (decrease) in other current and non-current liabilities and deferred revenue
475 (3,243)
Income tax paid 11 (17,687) (12,342)
Cash flows from operating activities 120,593 119,216
Investing activities
Capital expenditures on investment property under construction and completed investment property
16,17 (44,859) (46,963)
Capital expenditures on property, plant and equipment (470) (484)
Acquisition of businesses, net of cash acquired 13 (130,600) (13,500)
Proceeds from disposal of property, plant and equipment and insurance recovery proceeds
2,197 503
Acquisition of intangible assets 18 (1,632) (1,032)
Cash flows from investing activities (175,364) (61,476)
Financing activities
Proceeds from the issuance of equity 23,25 575,000 -
Proceeds from borrowings 29,31 250,000 20,000
Proceeds from the sale of treasury shares 24,35 50 -
Interim distribution to equity holders of the parent 27 (255,000) -
Repayment of borrowings 29,31 (250,000) (47,000)
Repayment of finance lease obligations 30,31 (505) (464)
Payment for equity issuance costs 25 (19,737) -
Payment for financing and related costs 19,21, 29,31
(515) -
Interest paid 29,31 (18,414) (18,337)
Cash flows from financing activities 280,879 (45,801)
Net increase in cash and cash equivalents 226,108 11,939
Effect of exchange rate fluctuation 1,169 27
Cash and cash equivalents at January 1 23,645 11,679
Cash and cash equivalents at December 31 250,922 23,645 The accompanying notes are an integral part of these consolidated financial statements.

SHURGARD ANNUAL REPORT 2018
85
NOTES TO THE CONSOLIDATED FINANCIAL STATEMENTS

SHURGARD ANNUAL REPORT 2018
86
TABLE OF CONTENTS
1. Corporate information .............................................................................................................................................................. 87 2. Changes in accounting policies and disclosures ............................................................................................................... 88 3. Summary of significant accounting policies ...................................................................................................................... 89 4. Significant accounting judgements, estimates and assumptions ............................................................................. 100 5. Standards issued but not yet effective ............................................................................................................................... 101 6. Real estate operating revenue ............................................................................................................................................. 102 7. Real estate operating expense ............................................................................................................................................. 102 8. Operating leases – Company as lessee ............................................................................................................................ 102 9. General, administrative and other expenses .................................................................................................................... 103 10. Finance cost ............................................................................................................................................................................... 103 11. Income tax .................................................................................................................................................................................. 104 12. Segment information ...............................................................................................................................................................107 13. Business combinations ............................................................................................................................................................. 111 14. Earnings per share (EPS) ........................................................................................................................................................ 112 15. Net asset value (NAV) per share ........................................................................................................................................... 114 16. Investment property and investment property under construction ........................................................................... 115 17. Fair value measurement – investment property ............................................................................................................. 116 18. Property, plant and equipment and intangible assets .................................................................................................. 120 19. Other non-current assets ...................................................................................................................................................... 120 20. Trade and other receivables................................................................................................................................................... 121 21. Other current assets ................................................................................................................................................................. 121 22. Cash and cash equivalents ..................................................................................................................................................... 121 23. Issued share capital .................................................................................................................................................................. 121 24. Treasury shares ......................................................................................................................................................................... 122 25. Share premium .......................................................................................................................................................................... 122 26. Share-based payment reserve .............................................................................................................................................. 122 27. Distributable reserves .............................................................................................................................................................. 123 28. Non-controlling interests........................................................................................................................................................ 123 29. Interest-bearing loans and borrowings .............................................................................................................................. 123 30. Finance lease obligations ....................................................................................................................................................... 125 31. Analysis of movements in interest-bearing loans and borrowings ............................................................................ 126 32. Other non-current liabilities .................................................................................................................................................. 126 33. Trade and other payables and deferred revenue ............................................................................................................. 126 34. Pensions ...................................................................................................................................................................................... 127 35. Share-based compensation expense .................................................................................................................................. 127 36. Related party disclosures ........................................................................................................................................................ 131 37. Financial risk management objectives and policies ........................................................................................................ 132 38. Capital management ................................................................................................................................................................ 137 39. Contingencies and commitments ........................................................................................................................................ 138 40. List of consolidated entities................................................................................................................................................... 139 41. Events after the reporting period ......................................................................................................................................... 139

SHURGARD ANNUAL REPORT 2018
87
1. CORPORATE INFORMATION
Shurgard Self Storage S.A. (referred to collectively with its consolidated subsidiaries, as the “Company”, “we”, “our”, or “us”) is organized under the laws of the Grand Duchy of Luxembourg. Our registered office and principal place of business is 6 C Rue Gabriel Lippmann, L-5365 Münsbach (Grand Duchy of Luxembourg). On September 26, 2018, the Company changed its denomination from Shurgard Self Storage Europe Sàrl to Shurgard Self Storage and transformed its legal form into a Luxembourg public limited company (société anonyme). In 2018 the Company completed its initial public offering (“IPO”) and is listed on Euronext Brussels since October 15, 2018. Our shareholders are Shurgard European Holdings LLC (“SEH LLC”), a limited liability company incorporated in 2008 in Delaware, United States (“U.S.”), which owns 40.66% of the interest in the Company, Public Storage (“PS”), which owns 31.09% interest in the Company and the Public (28.11% of the interest in the Company). The New York State Common Retirement Fund (“NYSCRF”) and PS own 90% and 10%, respectively, of the interest in SEH LLC. Our principal business activities are the acquisition, development and operation of self-storage facilities providing month-to-month leases for business and personal use. We also provide ancillary services at our self-storage facilities consisting primarily of sales of storage products and provide protection (insurance) via an independent insurance company for customers’ stored goods. Any claims in regard to customer insurance are directly handled by our insurance broker. As of December 31, 2018, we operate 232 self-storage facilities under the Shurgard brand name that we own or lease in the Netherlands, France, Sweden, the United Kingdom (the “U.K.”), Belgium, Germany and Denmark.
BASIS OF PREPARATION
The consolidated financial statements of the Company have been prepared in accordance with International Financial Reporting Standards as adopted by the European Union (IFRS). The Company’s financial statements have been prepared on a historical cost basis, except for the following:
∙ Investment property and investment property under construction, which are measured at fair value;
∙ Non-current assets held for sale, which are measured at the lower of its carrying amount and fair value less cost of disposal;
∙ Cash-settled and equity-settled share-based compensation plans, for which the liability is measured at fair value; and
∙ Defined benefit pension plans, for which the assets are measured at fair value. Pension plan liabilities are measured according to the projected unit credit method.
The consolidated financial statements are presented in euros and all values are rounded to the nearest million (€’000,000), except where otherwise indicated. The financial statements were authorized for issue by the Board of Directors on February 25, 2019. The Board of Directors has the power to amend and reissue the financial statements.

SHURGARD ANNUAL REPORT 2018
88
SIGNIFICANT EVENTS AND TRANSACTIONS
Events and/or transactions significant to an understanding of the changes since December 31, 2017 have been included in the notes these consolidated financial statements and mainly relate to:
∙ On July 10, 2018, the Company distributed € 255 million to its shareholders;
∙ The IPO of the Company on October 15, 2018;
∙ The acquisition of the Pelican business on June 29, 2018, the Kensington business on October 15, 2018 and the ABC Self Store business on November 22, 2018;
∙ The modification of the cash-settled share-based payment plans to equity-settled share-based payment plans and the issuance of the 2018 equity-settled share-based compensation plan; and
∙ The destruction of our Croydon Purley Way self-storage facility as a result of a fire incident on December 31, 2018.
2. CHANGES IN ACCOUNTING POLICIES AND DISCLOSURES
The Company applied IFRS 15 and IFRS 9 for the first time. The nature and effect of the changes as a result of adoption of these new accounting standards are described below. Several other amendments and interpretations apply for the first time in 2018, but do not have an impact on the consolidated financial statements of the Group. The Group has not early adopted any standards, interpretations or amendments that have been issued but are not yet effective.
IFRS 15 REVENUE FROM CONTRACTS WITH CUSTOMERS
IFRS 15 was issued in May 2014 and amended in April 2016 and establishes a five-step model to account for revenue arising from contracts with customers. Under IFRS 15, revenue is recognized at an amount that reflects the consideration to which an entity expects to be entitled in exchange for transferring goods or services to a customer. The new revenue standard supersedes all current revenue recognition requirements under IFRS. The Company adopted the new standard on January 1, 2018, using the modified retrospective transition approach, meaning that cumulative impacts are recognized in retained earnings as of January 1, 2018 and that comparatives are not restated. The standard has only been applied to contracts that were not completed as of the date of initial application. The only revenue streams of the Company that are in scope of IFRS 15 are insurance revenue and merchandise sales. These are presented in the statement of profit or loss on the line item ‘Real estate operating revenue’ and are disaggregated separately in note 6. In addition, the Company applied the requirements of IFRS 15 also for the disposal transaction of properties previously held for rental. IFRS 15 will not affect the recognition of lease income as this is still dealt with under IAS 17 Leases.

SHURGARD ANNUAL REPORT 2018
89
Following the assessment performed, the Company concluded that, with the exception of the requirement to include additional IFRS 15 disclosures and accounting policies in the consolidated financial statements, the impact of the IFRS 15 adoption is not significant.
IFRS 9 FINANCIAL INSTRUMENTS
In July 2014, the IASB issued the final version of IFRS 9 Financial Instruments that replaces IAS 39 and all previous versions of IFRS 9. IFRS 9 brings together all three aspects of the accounting for financial instruments project: classification and measurement, impairment and hedge accounting. During 2017, the Company performed a detailed impact assessment of all three aspects of IFRS 9. Overall, the Company did not identify any significant impact on its statement of financial position and equity. The Company adopted the new standard on the required effective date and will not restate comparative information.
CLASSIFICATION AND MEASUREMENT The Company noted no significant impact on its balance sheet or equity on applying the classification and measurement requirements of IFRS 9. Trade receivables are held to collect contractual cash flows and are expected to give rise to cash flows representing solely payments of principal and interest. Thus, the Company assessed that these will continue to be measured at amortized cost under IFRS 9.
IMPAIRMENT The new impairment model requires the recognition of impairment provisions based on expected credit losses (“ECL”) rather than only incurred credit losses as is the case under IAS 39. The expected credit losses include forward-looking elements on all possible default events as well as historical loss data. It applies to financial assets classified at amortized cost, debt instruments measured at Fair Value Other Comprehensive Income (“FVOCI”), contract assets under IFRS 15 Revenue from Contracts with Customers, lease receivables, loan commitments and certain financial guarantee contracts. The Company will apply the simplified approach and record lifetime-expected losses on all trade receivables. Based on the analysis performed upon transition to IFRS 9, there was no material increase in the loss allowance for financial assets held at amortized cost.
HEDGE ACCOUNTING As the Company does not apply hedge accounting, IFRS 9 will not have any impact on the Company with respect to hedge accounting.
3. SUMMARY OF SIGNIFICANT ACCOUNTING POLICIES
BASIS OF CONSOLIDATION
The consolidated financial statements comprise the financial statements of the Company and its subsidiaries as at and for the years ended December 31, 2018 and 2017. Specifically, the Company controls an investee if, and only if, it has:
∙ Power over the investee (i.e., existing rights that give it the current ability to direct the relevant activities of the investee);
∙ Exposure, or rights, to variable returns from its involvement with the investee; and
∙ The ability to use its power over the investee to affect its returns.

SHURGARD ANNUAL REPORT 2018
90
The Company re-assesses whether or not it controls an investee if facts and circumstances indicate that there are changes to one or more of the three elements of control. Consolidation of a subsidiary begins when the Company obtains control over the subsidiary and ceases when the Company loses control of the subsidiary. Assets, liabilities, income and expenses of a subsidiary acquired or disposed of during the year are included in the consolidated financial statements from the date the Company gains control until the date the Company ceases to control the subsidiary. Profit or loss and each component of other comprehensive income (“OCI”) are attributed to the equity holders of the parent of the Company and to the non-controlling interests. When necessary, adjustments are made to the financial statements of subsidiaries to bring their accounting policies into line with the Company’s accounting policies. All intra-company assets and liabilities, equity, income, expenses and cash flows relating to transactions between members of the Company are eliminated in consolidation. A change in the ownership interest of a subsidiary, without a loss of control, is accounted for as an equity transaction. If the Company loses control over a subsidiary, it derecognizes the related assets (including goodwill), liabilities, non-controlling interest and other components of equity, while any resultant gain or loss is recognized in profit or loss. Any investment retained is recognized at fair value.
PROPERTY ACQUISITIONS
Where property is acquired, via corporate acquisitions or otherwise, management considers the substance of the assets and activities of the acquired entity in determining whether the acquisition represents the acquisition of a business. Where such acquisitions are not judged to be an acquisition of a business, they are not treated as business combinations. Rather, the cost to acquire the corporate entity or assets and liabilities is allocated between the identifiable assets and liabilities (of the entity) based on their relative values at the acquisition date.
BUSINESS COMBINATIONS AND GOODWILL
Business combinations are accounted for using the acquisition method. The cost of an acquisition is measured as the aggregate of the consideration transferred measured at acquisition date fair value and the amount of any non-controlling interests in the acquiree. For each business combination, the Company elects whether to measure the non-controlling interests in the acquiree at fair value or at the proportionate share of the acquiree’s identifiable net assets. Acquisition-related costs are expensed as incurred. Any contingent consideration to be transferred by the acquirer is recognized at fair value at the acquisition date. Contingent consideration classified as an asset or liability is measured at fair value with the changes in fair value recognized in the statement of profit or loss. Goodwill is initially measured at cost (being the excess of the aggregate of the consideration transferred and the amount recognized for non-controlling interests) and any previous interest held over the net identifiable assets acquired and liabilities assumed. If the fair value of the net assets acquired is in excess of the aggregate consideration transferred, the Company re-assesses whether it has correctly identified all of the assets acquired and all of the liabilities assumed and reviews the procedures used to measure the amounts to be recognized at

SHURGARD ANNUAL REPORT 2018
91
the acquisition date. If the reassessment still results in an excess of the fair value of net assets acquired over the aggregate consideration transferred, then the gain is recognized in profit or loss.
FOREIGN CURRENCIES
The Company’s consolidated financial statements are presented in euros, which is also the parent company’s functional currency. For each entity, the Company determines the functional currency and items included in the financial statements of each entity are measured using that functional currency. The Company uses the direct method of consolidation and on disposal of a foreign operation the gain or loss that is reclassified to profit or loss reflects the amount that arises from using this method.
TRANSACTIONS AND BALANCES Transactions in foreign currencies are initially recorded by the Company’s entities at their respective functional currency spot rates at the date the transaction first qualifies for recognition. Monetary assets and liabilities denominated in foreign currencies are translated at the functional currency spot rates of exchange at the reporting date. Differences arising on settlement or translation of monetary items are recognized in profit or loss, with the exception of monetary items that are designated as part of the hedge of the Company’s net investment of a foreign operation. These are recognized in OCI until the net investment is disposed of, at which time, the cumulative amount is reclassified to profit or loss. Tax charges and credits attributable to exchange differences on those monetary items are also recorded in OCI. Non-monetary items that are measured in terms of historical cost in a foreign currency by the Company’s entities are translated using the exchange rates at the dates of the initial transactions. Non-monetary items measured, by the Company’s entities, at fair value in a foreign currency are translated using the exchange rates at the date when the fair value is determined. The gain or loss arising on translation of such non-monetary items measured at fair value is treated in line with the recognition of gain or loss on change in fair value of the item (i.e., translation differences on items whose fair value gain or loss is recognized in OCI or profit or loss are also recognized in OCI or profit or loss, respectively).
SUBSIDIARIES On consolidation, the assets and liabilities of foreign operations are translated into euros at the rate of exchange prevailing at the reporting date and their statements of profit or loss are translated at average exchange rates prevailing at the dates of the transactions. The exchange differences arising on translation for consolidation are recognized in OCI. On disposal of a foreign operation, the component of OCI relating to that particular foreign operation is recognized in profit or loss.
SEGMENT REPORTING
Operating segments are reported in a manner consistent with the internal reporting provided to the chief operating decision maker (“CODM”). The CODM is the executive committee and consist of CEO, CFO, VP Operations, VP Real Estate and VP Human Resources and Legal (“the Executive Committee”).
INVESTMENT PROPERTY AND INVESTMENT PROPERTY UNDER CONSTRUCTION Investment property comprises completed property and property under construction or re-development that is held to earn rentals. Property held under a lease is classified as investment property when it is held to earn rentals, rather for use in production or administrative functions.

SHURGARD ANNUAL REPORT 2018
92
Investment property is measured initially at cost, including transaction costs. Transaction costs include transfer taxes, professional fees for legal services and initial leasing commissions to bring the property to the condition necessary for it to be capable of operating. The carrying amount also includes the cost of replacing part of an existing investment property at the time that cost is incurred if the recognition criteria are met. Subsequent to initial recognition, investment property is stated at fair value, which reflects market conditions at the reporting date. Gains or losses arising from changes in the fair values of investment properties are included in profit or loss in the period in which they arise, including the corresponding tax effect. Transfers are made to (or from) investment property only when there is a change in use which can be evidenced, for example with the commencement or end of owner-occupation. However, a change in management’s intentions on the property would not meet these criteria. For a transfer from investment property to owner-occupied property, the deemed cost for subsequent accounting is the fair value at the date of change in use. Investment property is derecognized either when it has been disposed of or when it is permanently withdrawn from use and no future economic benefit is expected from its disposal. The difference between the net disposal proceeds and the carrying amount of the asset is recognized in profit or loss in the period of derecognition.
LEASES
The determination of whether an arrangement is (or contains) a lease is based on the substance of the arrangement at the inception of the lease. The arrangement is, or contains, a lease if fulfilment of the arrangement is dependent on the use of a specific asset or assets or the arrangement conveys a right to use the asset or assets, even if that right is not explicitly specified in the arrangement.
COMPANY AS A LESSEE A lease is classified at the inception date as a finance lease or an operating lease. A lease that transfers substantially all the risks and rewards incidental to ownership to the Company is classified as a finance lease. Finance leases are capitalized at the commencement of the lease at the inception date fair value of the leased property or, if lower, at the present value of the minimum lease payments. Lease payments are apportioned between the finance charges and the reduction of the lease liability so as to achieve a constant rate of interest on the remaining balance of the liability. Finance charges are charged to the statement of profit or loss. Operating lease is a lease other than a finance lease. Operating lease payments, including upfront payments and lease incentives, are expensed in the statement of profit or loss within real estate operating expense on a straight-line basis over the lower of the lease term or a maximum of thirty years, except for contingent rental payments which are expensed when they arise.
COMPANY AS A LESSOR Leases in which the Company does not transfer substantially all the risks and rewards of ownership of an asset are classified as operating leases. Initial direct costs incurred in negotiating and arranging an operating lease are added to the carrying amount of the leased asset and recognized over the lease term on the same basis as rental income. Contingent rents are recognized as revenue in the period in which they are earned.
PROPERTY, PLANT AND EQUIPMENT
Our property, plant and equipment mainly consist of building improvements and office equipment in use at the local head offices in the countries in which we operate. Historical cost includes expenditure that is directly attributable to the acquisition of the items.

SHURGARD ANNUAL REPORT 2018
93
Subsequent costs are included in the asset’s carrying amount or recognized as a separate asset, as appropriate, only when it is probable that future economic benefits associated with the item will flow to the Company and the cost of the item can be measured reliably. The carrying amount of any asset is derecognized when replaced. All other repairs and maintenance are charged to profit or loss during the reporting period in which they are incurred. Property, plant and equipment is depreciated on a straight-line basis over its estimated economic useful life. The assets’ residual values and useful lives are reviewed, and adjusted if appropriate, at the end of each reporting period. When there is an impairment indicator, an asset’s carrying amount is written down immediately to its recoverable amount if the asset’s carrying amount is greater than its estimated recoverable amount. Gains and losses on disposals are determined by comparing proceeds with carrying amount. These are included in profit or loss.
INTANGIBLE ASSETS
The Company’s intangible assets mainly consists of internally developed computer software. Software development costs that are directly attributable to the design and testing of identifiable and unique software products controlled by the Company are recognized as intangible assets when the criteria, as defined in IAS 38, are met. Capitalized software development costs are recorded as intangible assets and amortized on a straight-line basis over their economic useful lives (of three to five years) from the moment at which the asset is ready for use. Costs associated with maintaining software programs are recognized as an expense as incurred. Research expenditure and development expenditure that do not meet the criteria for capitalization above are recognized as an expense as incurred. Development costs previously recognized as an expense are not recognized as an asset in a subsequent period.
BORROWINGS
All borrowings are initially recognized at fair value less directly attributable transaction costs. After initial recognition, borrowings are subsequently measured at amortized cost using the effective interest method. Borrowings are derecognized when the obligation specified in the contract is discharged, cancelled or expired. The difference between the carrying amount of a financial liability that has been extinguished or transferred to another party and the consideration paid, including any non-cash assets transferred or liabilities assumed, is recognized in profit or loss as other income or finance costs. Borrowings are classified as current liabilities unless the Company has an unconditional right to defer settlement of the liability for at least 12 months after the reporting period.
BORROWING COSTS
Borrowing costs directly attributable to the acquisition or construction of an asset that necessarily takes a substantial period of time to get ready for its intended use or sale are capitalized as part of the cost of the asset.
SHURGARD ANNUAL REPORT 2018
94
All other borrowing costs are expensed in the period in which they occur. Borrowing costs consist of interest and other costs that an entity incurs in connection with the borrowing of funds. The interest capitalized is calculated using the Company’s weighted average cost of borrowings. Interest is capitalized as from the commencement of the development work until the date of practical completion, i.e., when substantially all of the development work is completed. The capitalization of finance costs is suspended if there are prolonged periods when development activity is interrupted. Interest is also capitalized on the purchase cost of a site of property acquired specifically for redevelopment, but only where activities necessary to prepare the asset for redevelopment are in progress.
CASH AND CASH EQUIVALENTS
Cash and cash equivalents in the statement of financial position comprise cash at bank and cash equivalents with an original maturity of three months or less, which are subject to an insignificant risk of changes in value. For the purpose of the consolidated statement of cash flows, cash and cash equivalents consist of cash and cash equivalents, as defined above, net of outstanding bank overdrafts as they are considered an integral part of the Company’s cash management.
RENT AND OTHER RECEIVABLES
Rent and other receivables are recognized at their original invoiced value except where the time value of money is material, in which case receivables are recognized at fair value and subsequently measured at amortized cost and are subject to impairment. For rent and other receivables, the Company applies a simplified approach in calculating expected credit losses. Therefore, the Company does not track changes in credit risk, but instead recognizes a loss allowance based on lifetime expected credit losses at each reporting date. The Company has established a provision matrix that is based on its historical credit loss experience, adjusted for forward-looking factors specific to the debtors and the economic environment.
TRADE AND OTHER PAYABLES
These amounts represent liabilities for goods and services provided to the Company prior to the end of the financial year which are unpaid. The amounts are unsecured and are usually paid within thirty days of recognition. Trade and other payables are presented as current liabilities unless payment is not due within twelve months after the reporting period.
REVENUE RECOGNITION
The Company is in the business of operating self-storage facilities providing month-to-month leases for business and personal use. We also provide ancillary services at our self-storage facilities consisting primarily of sales of storage products and provide protection (insurance) via an independent insurance company for customers’ stored goods. Any claims in regard to customer insurance are directly handled by our insurance broker. Revenue from contracts with customers is recognized when control of the goods or services are transferred to the customer at an amount that reflects the consideration to which the Company expects to be entitled in exchange for those goods or services. The Company has concluded that it is the principal in all of its revenue arrangements, because it controls the goods or services before transferring them to the customer.

SHURGARD ANNUAL REPORT 2018
95
RENTAL INCOME The Company is the lessor in operating leases. Rental income arising from operating leases on investment property is accounted for on a straight-line basis over the lease terms and is included in revenue in the statement of profit or loss due to its operating nature, except for contingent rental income which is recognized when it arises. Initial direct costs incurred in negotiating and arranging an operating lease are recognized as an expense over the lease term on the same basis as the lease income. Tenant lease incentives are recognized as a reduction of rental revenue on a straight-line basis over the term of the lease. The lease term is the non-cancellable period of the lease together with any further term for which the tenant has the option to continue the lease, where, at the inception of the lease, management is reasonably certain that the tenant will exercise that option. Amounts received from tenants to terminate leases or to compensate for dilapidations are recognized in the statement of profit or loss when the right to receive them arises.
INSURANCE REVENUE Revenue from insurance is recognized on a straight-line basis over the period that a customer occupies its storage unit.
SERVICE CHARGES, MANAGEMENT CHARGES AND OTHER EXPENSES RECOVERABLE FROM TENANTS Income arising from expenses recharged to tenants is recognized in the period in which the compensation becomes receivable. Service and management charges and other such receipts are included in real estate operating revenue gross of the related costs, as management considers that the Company acts as principal in this respect.
EMPLOYEE BENEFITS
SHORT TERM EMPLOYEE BENEFITS Liabilities for wages and salaries that are expected to be settled wholly within twelve months after the end of the period in which the employees render the related service are recognized in respect of employees’ services up to the end of the reporting period and are measured at the amounts expected to be paid when the liabilities are settled. The liabilities are presented as current employee benefit obligations in the balance sheet. Bonuses received by company employees and management are based on pre-defined Company and individual target achievements. The estimated amount of the bonus is recognized as an expense over the period the bonus is earned.
PENSION BENEFITS The Company has defined contribution plans in certain countries in which it operates whereby contributions by the Company are charged to real estate operating expense and general, administrative and other expense in our consolidated statements of profit and loss in the period in which services are rendered by the covered employees. Because of the Belgian legislation applicable to the second pillar pension plans (the so-called “Law Vandenbroucke”), all Belgian pension plans that are structured as defined contribution plans are considered defined benefit plans under IFRS and are therefore accounted for as such. Because of a minimum guaranteed return, the employer is exposed to a financial risk since further contributions could be required if the return on the assets is not sufficient to reach the minimum benefits to be paid. The

SHURGARD ANNUAL REPORT 2018
96
Company has plans that are financed through insurance contracts. The projected unit credit method has been used as the actuarial technique to measure the defined benefit obligation. The related assumptions, the defined benefit obligation and related plan assets are further disclosed in note 34.
OTHER POST-EMPLOYMENT OBLIGATIONS The Company does not have other post-employment obligations.
TERMINATION BENEFITS Termination benefits are payable when employment is terminated by the Company before the normal retirement date, or when an employee accepts voluntary redundancy in exchange for these benefits. The Company recognizes termination benefits at the earlier of the following dates: (a) when the Company can no longer withdraw the offer of those benefits; and (b) when the entity recognizes costs for a restructuring that is within the scope of IAS 37 and involves the payment of terminations benefits. In the case of an offer made to encourage voluntary redundancy, the termination benefits are measured based on the number of employees expected to accept the offer. Benefits falling due more than 12 months after the end of the reporting period are discounted to present value.
SHARE-BASED COMPENSATION
Until October 15, 2018, employees (including senior executives) of the Company received remuneration in the form of share-based options that were cash-settled. A liability was recognized for the fair value of these share-based payment plans. The fair value was measured initially and at each reporting date up to and including the settlement date. The changes in the fair value were recognized in general, administrative and other expenses. This fair value was expensed over the four-year period until the vesting date with recognition of a corresponding liability. The fair value was determined using a Black-Scholes model. On October 15, 2018, the terms of the share-based compensation plan were modified, so that the classification of the share-based compensation plan changed from cash-settled to equity-settled. On the modification date, the Company reclassified the amount recognized as a liability, up to the modification date to equity. The share-based compensation expense for the remainder of the vesting period is based on the fair value of the share-based payment awards, measured at the modification date. The cost of equity-settled compensation plans is determined by the fair value at the grant date of the awards using the Black-Scholes model. The cost is recognized, together with a corresponding increase in retained earnings in equity, over the period in which the service conditions are fulfilled (the vesting period). The cumulative expense recognized for equity-settled transactions at each reporting date until the vesting date reflects the extent to which the vesting period has expired and the Group’s best estimate of the number of equity instruments that will ultimately vest. The expense or credit in the statement of profit or loss for a period represents the movement in cumulative expense recognized as at the beginning and end of that period and is recognized in general administrative and other expenses. No expense is recognized for awards that do not ultimately vest because non-market performance and/or service conditions have not been met. We refer to note 35 for further details on the share-based compensation plans of the Company and the modification of their terms during 2018.

SHURGARD ANNUAL REPORT 2018
97
INCOME TAX
Income tax expense comprises current and deferred tax. It is recognized in profit or loss except to the extent that it relates to a business combination, or items recognized directly in equity or in OCI. Interest and penalties related to income taxes, including uncertain tax treatments, can be accounted for under IAS 12 Income taxes or under IAS 37 Provisions, Contingent Liabilities and Contingent Assets depending on the specific nature of the particular interest and penalties and whether the relevant law considered these interest and penalties as income taxes.
CURRENT INCOME TAX The tax currently payable is based on taxable profit for the year. Taxable profit differs from profit as reported in the consolidated statement of profit or loss and other comprehensive income because it excludes items of income or expense that are taxable or deductible in other years and it further excludes items that are not taxable or tax deductible. The Group’s liability for current tax is calculated using tax rates (and tax laws) that have been enacted or substantively enacted by the end of the reporting period.
DEFERRED TAX Deferred tax is recognized for temporary differences between the carrying amounts of assets and liabilities in the consolidated financial statements and their corresponding tax bases used in the computation of taxable profit. Deferred tax liabilities are generally recognized for all taxable temporary differences and deferred tax assets are recognized to the extent that it is probable that taxable profit will be available against which deductible temporary differences and tax losses carried forward can be utilized. Deferred tax assets and liabilities are not recognized if the temporary difference arises from the initial recognition of goodwill or of an asset or liability in a transaction that is not a business combination and, at the time of the transaction, affects neither accounting profit nor taxable profit or loss. In respect of taxable temporary differences associated with investments in subsidiaries and interests in joint arrangements:
∙ Deferred tax liabilities are not recognized when the timing of the reversal of the temporary differences can be controlled and it is probable that the temporary differences will not reverse in the foreseeable future; and
∙ Deferred tax assets are recognized only to the extent that it is probable that the temporary differences will reverse in the foreseeable future and taxable profit will be available against which the temporary differences can be utilized.
The measurement of deferred tax reflects the tax consequences that would follow from the manner, in which the Group expects, at the reporting date, to recover or settle the carrying amount of assets and liabilities. For the purposes of measuring deferred tax liabilities or deferred tax assets arising from investment properties that are measured using the fair value model, the management has concluded that they are held under a business model whose objective is to consume substantially all of the economic benefits embodied in the investment properties over time, rather than through sale. Therefore, in determining the Group’s deferred taxation on investment properties, the management has determined that the presumption that investment properties measured using the fair value model are recovered through sale is rebutted.

SHURGARD ANNUAL REPORT 2018
98
Deferred income tax assets and liabilities are measured at the tax rates that are expected to apply in the year when the asset is realized or the liability is settled, based on tax rates (and tax laws) that have been enacted or substantively enacted at the reporting date.
EARNINGS PER SHARE
BASIC EARNINGS PER SHARE Basic earnings per share is calculated by dividing:
∙ the profit attributable to equity holders of the company by
∙ the weighted average number of ordinary shares outstanding during the financial year, excluding treasury shares.
DILUTED EARNINGS PER SHARE Diluted earnings per share adjusts the figures used in the determination of basic earnings per share to take into account:
∙ the after income tax effect of interest and other financing costs associated with dilutive potential ordinary shares, and
∙ the weighted average number of additional ordinary shares that would have been outstanding assuming the conversion of all dilutive potential ordinary shares (including outstanding share options).
NON-GAAP FINANCIAL INFORMATION
The Board of Directors have identified certain measures that they believe will assist the understanding of the performance of our business. The measures are not defined under IFRS and they may not be directly comparable with other companies’ non-GAAP measures. These non-GAAP measures are not intended to be a substitute for, or superior to, any IFRS measures of performance but they have been included as the Board of Directors consider them to be important key measures used within the business for assessing performance. The following are the key non-GAAP measures identified by the Company and are based on guidance as defined by the European Public Real Estate Association (“EPRA”), a not-for-profit association registered in Belgium, in their Best Practices Guidelines dated November 2016:
∙ (Adjusted) EPRA earnings – EPRA earnings is a measure of underlying operational performance to reflect the income return on investment. EPRA earnings is defined as profit or loss for the period after income tax but excluding acquisition costs relating to business combinations (net of taxes and non-controlling interest), gains or losses on the revaluation of investment property (net of taxes and non-controlling interest), gains or losses on the sale of investment property, assets held for sale and property, plant and equipment (net of taxes and non-controlling interest). Adjusted EPRA earnings is defined as EPRA earnings excluding (i) deferred tax expenses on items other than the revaluation of investment property, and (ii) significant one-off items that arise from events and transactions distinct for the Company’s regular operating activities.
∙ EPRA Net Asset Value (per share) – The objective of this metric is to provide information on the fair value of net assets on an ongoing, long-term basis. EPRA Net Asset Value is calculated based on Net Asset Value, but excludes the value of assets and liabilities measured at fair value that are not expected to crystallize in normal circumstance, and deferred taxes on such fair value adjustments.
SHURGARD ANNUAL REPORT 2018
99
∙ Adjusted EPRA Net Asset Value (per share) – The objective of this metric is to report net asset value including fair value adjustments in respect of material balance sheet items which are not reported at their fair value as part of the EPRA NAV.
FAIR VALUE MEASUREMENTS
The Company measures investment property and investment property under construction at fair value at each reporting date. Fair value related disclosures for items measured at fair value or where fair values are disclosed, are summarized in the following notes:
∙ notes 16 and 17: Investment property and investment property under construction.
Fair value is the price that would be received to sell an asset or paid to transfer a liability in an orderly transaction between market participants at the measurement date. The fair value measurement is based on the presumption that the transaction to sell the asset or transfer the liability takes place either:
∙ in the principal market for the asset or liability, or
∙ in the absence of a principal market, in the most advantageous market for the asset or liability.
The Company must be able to access the principal or the most advantageous market at the measurement date. The fair value of an asset or a liability is measured using the assumptions that market participants would use when pricing the asset or liability, assuming that market participants act in their economic best interest. A fair value measurement of a non-financial asset takes into account a market participant's ability to generate economic benefits by using the asset in its highest and best use or by selling it to another market participant that would use the asset in its highest and best use. The Company uses valuation techniques that are appropriate in the circumstances and for which sufficient data are available to measure fair value, maximizing the use of relevant observable inputs and minimizing the use of unobservable inputs. All assets and liabilities, for which fair value is measured or disclosed in the financial statements are categorized within the fair value hierarchy (described as follows), based on the lowest level input that is significant to the fair value measurement as a whole:
∙ Level 1 - Quoted (unadjusted) market prices in active markets for identical assets or liabilities
∙ Level 2 - Valuation techniques for which the lowest level input that is significant to the fair value measurement is directly or indirectly observable
∙ Level 3 - Valuation techniques for which the lowest level input that is significant to the fair value measurement is unobservable

SHURGARD ANNUAL REPORT 2018
100
4. SIGNIFICANT ACCOUNTING JUDGEMENTS, ESTIMATES AND ASSUMPTIONS
The preparation of the Company's consolidated financial statements requires management to make judgements, estimates and assumptions that affect the reported amounts of revenues, expenses, assets and liabilities, and the accompanying disclosures. Uncertainty about these assumptions and estimates could result in outcomes that require a material adjustment to the carrying amount of the assets or liabilities affected in future periods. Other disclosures relating to the Company’s exposure to risks and uncertainties includes:
∙ note 37: Financial risk management objectives and policies
∙ note 38: Capital management
The areas involving significant estimates or judgements are:
∙ Income Tax (note 11): The Company operates in multiple jurisdictions with often complex legal and tax regulatory environments. The income tax positions are considered by the Company to be supportable and are intended to withstand challenge from tax authorities. However, it is accepted that some of the positions are uncertain and include interpretations of complex tax laws which could be disputed by tax authorities. The Company judges these positions individually on their technical merits with no offset or aggregation between positions and this on a regular basis using all the information available (legislation, case law, regulations, established practice and authoritative doctrine). A liability is recorded for each item that is not probable of being sustained on examination by the tax authorities based on all relevant information. The liability is calculated by the Company as the best estimate of the current tax it expects to pay using the Company’s best judgement of the likely outcomes of such examinations. These estimates are based on facts and circumstances existing at the end of the reporting period.
∙ Business combinations (note 13): The Company acquires entities that own real estate. At the time of acquisition, the Company considers whether each acquisition represents the acquisition of a business or the acquisition of an asset (a group of asset). The Company accounts for an acquisition as a business combination when the integrated set which includes the property contains also processes that have the ability to create output (mainly in the form of rental income). The company exercises judgement to which extent the property and the acquired processes have the ability of creating output.
When the acquisition does not represent a business, it is accounted for as an acquisition of assets and liabilities. The cost of the acquisition is allocated to the assets and liabilities acquired based upon their relative fair values, and no goodwill or deferred tax is recognized.
∙ Fair value of investment property and investment property under construction (note 16): The fair value of investment property and investment property under construction is determined by external real estate valuation experts using recognized valuation techniques and the principles of IFRS 13 Fair Value Measurement. The significant methods and assumptions used by valuers in estimating the fair value of investment property are set out in note 17.
∙ Share-based compensation expense (note 35): Estimates and judgements are continuously evaluated. They are based on historical experience and other factors, including expectations of future events that may have a financial impact on the entity and that are believed to be reasonable under the circumstances.

SHURGARD ANNUAL REPORT 2018
101
5. STANDARDS ISSUED BUT NOT YET EFFECTIVE
The standards relevant to the Company that are issued but not yet effective up to the date of issuance of the Company’s financial statements are disclosed below. This list of standards and interpretations issued are those that the Company reasonably expects to have an impact on the Company’s financial statements when applied at a future date. The Company intends to adopt these standards when they become effective.
IFRS 3 BUSINESS COMBINATIONS
Amendments to the guidance of IFRS 3 Business Combinations revised the definition of a business (effective January 1, 2020). The new guidance provides a framework to evaluate when an input and a substantive process are present (including for early stage companies that have not generated outputs). To be a business without outputs, there will now need to be an organized workforce. The changes to the definition of a business will likely result in more acquisitions being accounted for as asset acquisitions across all industries, particularly real estate, pharmaceutical, and oil and gas. Application of the changes would also affect the accounting for disposal transactions. The Company decided to early adopt the revised standard on January 1, 2019.
IFRS 16 LEASES
IFRS 16 was issued in January 2016 and is endorsed by the EU. It will supersede IAS 17 Leases and a number of lease-related interpretations and will result in almost all leases being recognized on the balance sheet, as the distinction between operating and finance leases is removed. Under the new standard, an asset (the right to use the leased item) and a financial liability to pay rentals are recognized. The only exceptions are short term and low-value leases. The accounting for lessors will not change significantly. The standard is mandatory for financial years commencing on or after January 1, 2019. The Company decided not to adopt the standard before its effective date. The Company has finalized the implementation of IFRS 16 which will affect primarily the accounting for the Company’s operating leases. In 2019, the Company will adopt IFRS 16 using the modified retrospective method and the cumulative catch up approach. The Company will elect to use the exemptions proposed by the standard on lease contracts for which the lease terms ends within 12 months as of the date of initial application, and lease contracts for which the underlying asset is of low value. The Group has leases of certain office equipment (i.e., personal computers, printing and photocopying machines) that are considered of low value. In summary, the impact of the IFRS 16 adoption is expected to be, as follows: Impact on the statement of financial position (increase) as at January 1, 2019:
∙ Assets Investment property: €59.0 million Property, plant and equipment (right-of-use assets): €1.2 million
∙ Liabilities Lease liabilities: €60.2 million
∙ Net impact on equity: € nil

SHURGARD ANNUAL REPORT 2018
102
6. REAL ESTATE OPERATING REVENUE
(in € thousands) 2018 2017
Rental revenue 208,985 204,177
Insurance revenue1 25,083 23,422
Ancillary revenue1,2 10,627 10,702
Property operating revenue 244,695 238,301
Other revenue3 149 260
Real estate operating revenue 244,844 238,561 1 Revenue streams falling under scope of IFRS 15 Revenue from Contracts with Customers. 2 Ancillary and other operating revenue consists of merchandise sales and other revenue from real estate operations. 3 Other revenue consists of management fee revenue and partnership income from self-storage operations.
7. REAL ESTATE OPERATING EXPENSE
Real estate operating expense of investment property which generates property operating revenue consists of the following:
(in € thousands) 2018 2017
Payroll expense 35,452 34,968
Real estate and other taxes 11,756 11,911
Repairs and maintenance 7,040 7,028
Marketing expense 6,229 5,802
Utility expense 3,491 3,872
Other operating expenses1 15,093 14,547
Doubtful debt expense 4,081 4,480
Cost of insurance and merchandise sales 4,188 4,315
Real estate operating expense excluding property lease expense 87,330 86,923
Property lease expense 3,692 3,686
Real estate operating expense 91,022 90,609 1 Other operating expenses mainly include: travel expenses, legal and consultancy fees, insurance expenses, non-deductible VAT and information system
expenses.
8. OPERATING LEASES – COMPANY AS LESSEE
The Company has entered into leases on its property portfolio, including ground leases with terms of up to 125 years and perpetual leases, under which we incurred property lease expenses of €3.7 million for each of the years ended December 31, 2018 and 2017. These lease expenses are included in real estate operating expense on our consolidated statement of profit and loss.
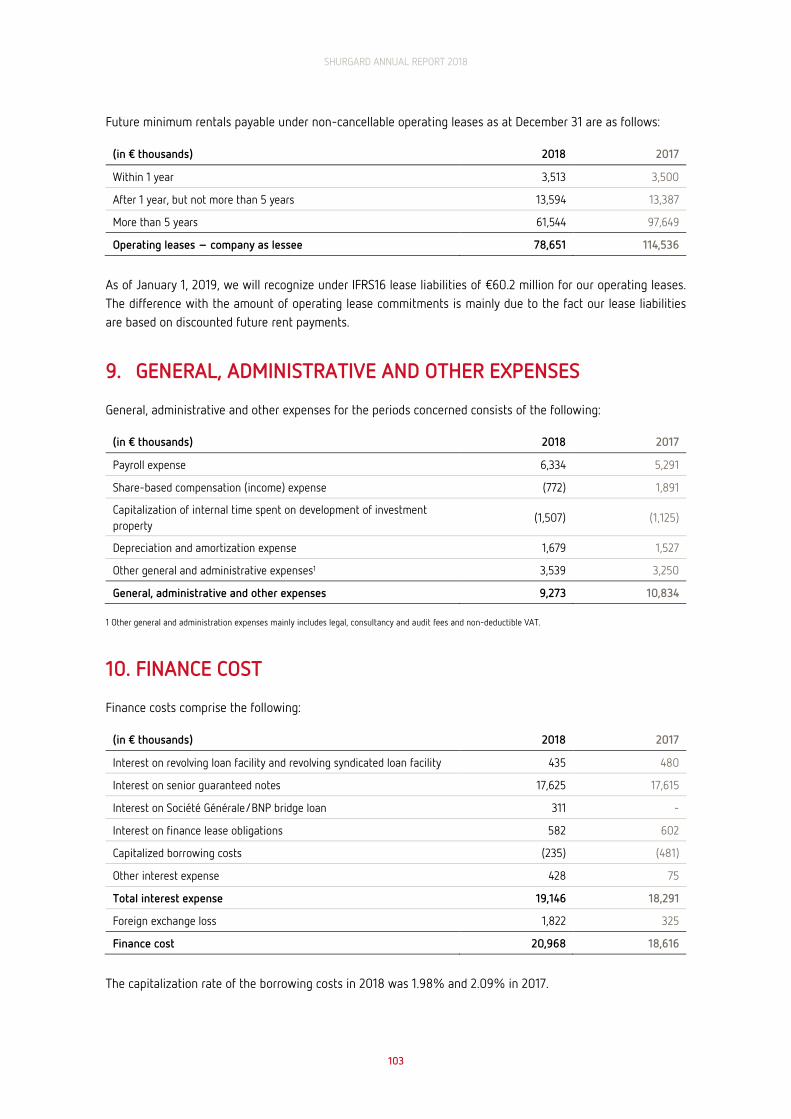
SHURGARD ANNUAL REPORT 2018
103
Future minimum rentals payable under non-cancellable operating leases as at December 31 are as follows:
(in € thousands) 2018 2017
Within 1 year 3,513 3,500
After 1 year, but not more than 5 years 13,594 13,387
More than 5 years 61,544 97,649
Operating leases – company as lessee 78,651 114,536
As of January 1, 2019, we will recognize under IFRS16 lease liabilities of €60.2 million for our operating leases. The difference with the amount of operating lease commitments is mainly due to the fact our lease liabilities are based on discounted future rent payments.
9. GENERAL, ADMINISTRATIVE AND OTHER EXPENSES
General, administrative and other expenses for the periods concerned consists of the following:
(in € thousands) 2018 2017
Payroll expense 6,334 5,291
Share-based compensation (income) expense (772) 1,891
Capitalization of internal time spent on development of investment property
(1,507) (1,125)
Depreciation and amortization expense 1,679 1,527
Other general and administrative expenses1 3,539 3,250
General, administrative and other expenses 9,273 10,834 1 Other general and administration expenses mainly includes legal, consultancy and audit fees and non-deductible VAT.
10. FINANCE COST
Finance costs comprise the following:
(in € thousands) 2018 2017
Interest on revolving loan facility and revolving syndicated loan facility 435 480
Interest on senior guaranteed notes 17,625 17,615
Interest on Société Générale/BNP bridge loan 311 -
Interest on finance lease obligations 582 602
Capitalized borrowing costs (235) (481)
Other interest expense 428 75
Total interest expense 19,146 18,291
Foreign exchange loss 1,822 325
Finance cost 20,968 18,616
The capitalization rate of the borrowing costs in 2018 was 1.98% and 2.09% in 2017.

SHURGARD ANNUAL REPORT 2018
104
11. INCOME TAX
INCOME TAX EXPENSE
(in € thousands) 2018 2017
Current tax expense 19,420 15,225
Deferred tax expense 16,889 24,986
Income tax Expense 36,309 40,211
Effective tax rate 17.46% 16.06%
The average effective current income tax rates based on adjusted EPRA earnings before tax are disclosed in note 14. The tax expenses as shown above have been calculated in conformity with local and international tax laws. The tax expense on the Company’s profit (loss) before tax differs from the theoretical amount that would arise using the domestic rate in each individual jurisdiction (on the pretax profits/losses) of the consolidated companies as follows:
(in € thousands) Dec. 31, 2018 % Dec. 31, 2017 %
Profit before tax 208,000 251,730
Expected tax based on local tax rates 60,980 29.3 64,591 25.7
Disallowed expenses 3,405 1.6 4,818 1.9
Nontaxable income (incl. notional interest deduction) (124) -0.1 (5,032) -2.0
Change in unrecognized deferred taxes 570 0.3 (10,217) -4.0
Prior year adjustments and other changes to the deferred tax balances
(2,404) -1.2 475 0.2
Impact of changes to substantively enacted tax rates (23,694) -11.4 (14,053) -5.6
Other (incl. UTP) (2,424) -1.2 (370) -0.2
Tax expense for the year 36,309 17.5 40,211 16.0
Primary drivers that impacted the effective tax rates for 2018 include the impact of changes to substantively enacted tax rates in Netherlands, Sweden and in France (in FY2017: Belgium, France, Luxembourg and the United Kingdom). Tax expense for the year ended December 31, 2018 is mainly impacted by the changes to substantively enacted tax rates. Due to a reduction in substantively enacted tax rates in the Netherlands and in Sweden, deferred tax liabilities that arose from our Dutch and Swedish investment properties have been reduced by €13 million and €4.7 million, respectively. Current year variation in net deferred tax liabilities in France (€22 million) is impacted by €5.8 million due to the progressive reduction in substantively enacted tax rates in France. Prior year adjustments and other changes to the deferred tax balances consist mainly of an adjustment in the UK deferred tax liabilities that arose from our UK investment properties (tax credit of €2.2 million). Other elements influencing the 2018 tax expense are the disallowed expenses in the UK (tax expense of €1.9 million non-deductible depreciations). The line “Other (including UTP)” consists primarily of a release of uncertain tax positions in the Netherlands (tax credit of €1.7 million).

SHURGARD ANNUAL REPORT 2018
105
Tax expense for the year ended December 31, 2017 was mainly impacted by the reduction of the French tax rates, i.e. resulting in €13.6 million decrease in deferred tax liabilities relating to French investment property, the decrease of the tax rate in Belgium, i.e. resulting in €8.5 million decreased deferred tax liabilities arisen from our Belgian investment property, partially offset by the effect of the decrease in tax rate in Luxembourg, which reduces the deferred tax assets of our Luxembourg subsidiaries by €7 million. Further, change in unrecognized deferred tax assets were also impacted by the decrease of the tax rate in Luxembourg (decrease of €7 million in unrecognized losses) and the impact on deferred tax assets of corporate restructuring (€2.1 million decrease in unrecognized losses). Other facts influencing the 2017 tax expense relate to the financial result (including foreign exchange loss) at the level of our Luxembourg subsidiary linked to the Group financing activity (an increase of €2.3 million in non-taxable income).
DEFERRED TAXES
The movement in deferred tax assets and liabilities during the year ended December 31, 2018 is as follows:
(in € thousands) Jan. 1, 2018 Acquired (Charged)/credited to the statement of
profit or loss
(Charged)/credited to other com-
prehensive income Dec. 31, 2018
Deferred tax assets:
Tax loss carry-forwards 12,692 - 762 (6) 13,448
Deductible temporary differences
1,156 - 3,816 (1) 4,971
Total Deferred tax assets 13,848 - 4,578 (7) 18,419
Deferred tax liabilities:
Investment property (346,629) (9,945) (21,000) 3,676 (373,898)
Other taxable temporary differences
(779) - (467) - (1,246)
Total Deferred tax liabilities (347,408) (9,945) (21,467) 3,676 (375,144)
Total Deferred Tax Asset/(Liabilities)
(333,560) (9,945) (16,889) 3,669 (356,725)
Reflected in our statement of financial position as follows:
Deferred tax assets 1,468 - - - 1,567
Deferred tax liabilities (335,028) - - - (358,292)
Net deferred tax liabilities as of December 31, 2018 amount to €356.7 million, of which €13.4 million relates to recognized tax losses carried forward and €373.9 million relates to deferred tax liabilities arisen from investment property. Deferred tax liabilities upon acquisitions accounted for a business combination in accordance with IFRS 3 amounted respectively €5.2 million in UK and €4.7 million in Sweden. Other main changes impacting the deferred tax liabilities on investment property are the decrease in tax rates in the Netherlands and in Sweden that are offset by a substantial increase of deferred tax liabilities related to our investment property. Deferred tax assets and liabilities expressed in euros are also influenced by the exchange rate variations for the EUR/GBP and the EUR/SEK conversion rates.

SHURGARD ANNUAL REPORT 2018
106
The movement in deferred tax assets and liabilities during the year ended December 31, 2017 is as follows:
(in € thousands) Jan. 1, 2017 (Charged)/credited to the statement of
profit or loss
(Charged)/credited to other comprehensive
income Dec. 31, 2017
Deferred tax assets:
Tax loss carry-forwards 22,786 (10,038) (56) 12,692
Deductible temporary differences 1,137 19 - 1,156
Total Deferred tax assets 23,923 (10,019) (56) 13,848
Deferred tax liabilities:
Investment property (335,687) (14,227) 3,285 (346,629)
Other taxable temporary differences (123) (740) 84 (779)
Total Deferred tax liabilities (335,810) (14,967) 3,369 (347,408)
Total Deferred Tax Asset/(Liabilities) (311,887) (24,986) 3,313 (333,560)
Reflected in our statement of financial position as follows:
Deferred tax assets 2,479 - - 1,468
Deferred tax liabilities (314,366) - - (335,028)
Net deferred tax liabilities as of December 31, 2017 amount to €333.6 million, of which €12.7 million relates to recognized tax losses carried forward and €346.6 million relates to deferred tax liabilities arisen from investment property. Main changes impacting the deferred tax liabilities on investment property are the decrease in tax rates in France and in Belgium that are offset by a substantial increase of deferred tax liabilities in the Netherlands (related to our Dutch investment property) and increased deferred tax liabilities in Germany, the U.K. and Sweden. Deferred tax assets and liabilities expressed in euros are also influenced by the exchange rate variations for the EUR/GBP and the EUR/SEK conversion rates. Main changes impacting the tax losses carried forward are the decrease in tax rates applied on the deferred tax liabilities in Belgium due to the Belgian tax reform and the utilization of tax losses carried forward by our French and Belgian subsidiaries. The tax loss carry-forwards and temporary differences for which no deferred tax asset is recognized amounted to the following:
(in € thousands) 2018 2017
Tax Loss Carryforwards:
Non-forfeitable tax loss carryforwards 241,064 242,878
Deductible temporary differences 18,915 7,708
Total unused tax losses and other deductible temporary differences not recognized
259,979 250,586
Deferred tax assets have not been recognized in respect of the items above because it is not probable that future taxable profits will be available against which the Group can utilize the loss carryforwards or deductible temporary differences. Main variation in deductible temporary differences relates to the fees and other expenses in connection with the equity issuance and admission for trading on Euronext allocated to equity for IFRS purposes.

SHURGARD ANNUAL REPORT 2018
107
No deferred tax liability is recognized on the unremitted earnings of overseas subsidiaries. As management has no intention to pay dividends or repatriate from its foreign branches where a tax leakage could materialize, no tax is expected to be payable on them in the foreseeable future. If all earnings were remitted, tax of €0.4 million for the year ended December 31, 2018 would be payable. On June 14, 2018 the Swedish government enacted significant changes to the country’s tax system, including a reduction in the corporate income tax rate, from 22% to 21.4% in 2019 and then to 20.6% from 2021. On December 18, 2018, the Dutch Senate adopted the 2019 Tax Plan. The corporate income tax rate will be reduced in steps to 20.5% in 2021 (2019: 25%). The lower basic rate (in 2018 for taxable profit up to and including EUR 200,000) will eventually decrease to 15% in 2021. Moreover, progressive reductions in corporate income tax rates were already implemented in FY2017: The main rate of corporation tax in the UK reduced from 23% to 21% from April 1, 2014, to 20% from April 1, 2015 and to 19% from April 1, 2017. A further reduction to 17%, effective April 1, 2020, was included in the Finance Act 2016 which was enacted on September 15, 2016. Further to the Finance Bill 2017, it was announced that the corporate income tax rate in France will be progressively reduced from corporate income tax rate of 33.33% to 28% over the period 2017 to 2020. Further to the Finance Bill 2018, the French corporate income tax rate would be gradually reduced to 25% by 2022. The Belgian tax reform included a reduction of the corporate tax rate from 33.99% to 29.58% as from the year ending December 31, 2018 with further reduction to 25% as from the year ending December 31, 2020. Accordingly, these rates have been applied in the measurement of the Group’s deferred tax assets and liabilities at reporting date.
12. SEGMENT INFORMATION
For earnings from investment property, discrete financial information is provided on an operating segment basis to the CODM. The individual properties are aggregated into operating segments which are defined as the individual countries where the Company operates stores and split between Same Store Facilities and Non-Same Store Facilities. The Same Stores Facilities segment for a given year comprises facilities in operations since more than three full years as of January 1 of that year in case of self-developed properties or facilities in operations for one full year as of January 1 of that year in case the properties have been acquired. The Non-Same Store Facilities segment comprises any other self-storage facilities that we operate. The operating segments (individual countries where the Company operates stores, split between Same Store Facilities and Non-Same Store Facilities) have been aggregated into two reportable segments which reflect the significant components of our operations. Therefore, we present our self-storage operations in two reportable segments: “the Same Store Facilities” and “the Non-Same Store Facilities” because we believe that the individual countries exhibit similar economic characteristics and the operations are similar with respect to their main elements (e.g.: nature of products and services offered, the class of customers, the distribution method).
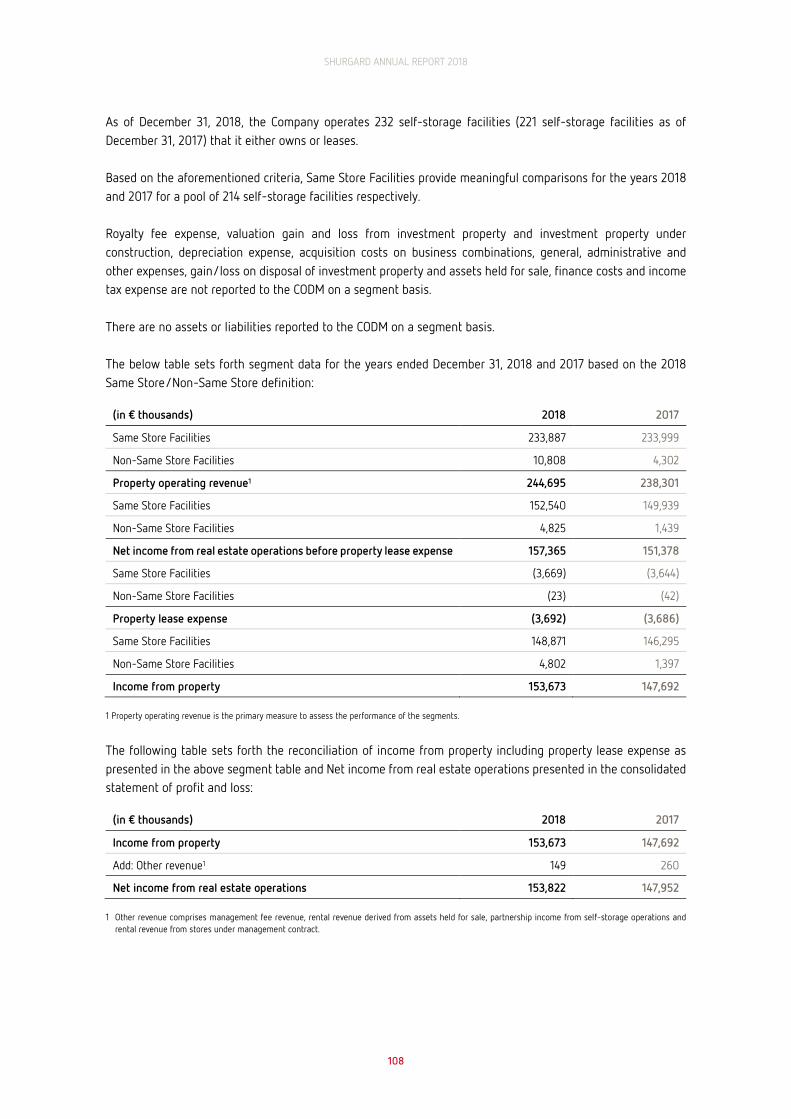
SHURGARD ANNUAL REPORT 2018
108
As of December 31, 2018, the Company operates 232 self-storage facilities (221 self-storage facilities as of December 31, 2017) that it either owns or leases. Based on the aforementioned criteria, Same Store Facilities provide meaningful comparisons for the years 2018 and 2017 for a pool of 214 self-storage facilities respectively. Royalty fee expense, valuation gain and loss from investment property and investment property under construction, depreciation expense, acquisition costs on business combinations, general, administrative and other expenses, gain/loss on disposal of investment property and assets held for sale, finance costs and income tax expense are not reported to the CODM on a segment basis. There are no assets or liabilities reported to the CODM on a segment basis. The below table sets forth segment data for the years ended December 31, 2018 and 2017 based on the 2018 Same Store/Non-Same Store definition:
(in € thousands) 2018 2017
Same Store Facilities 233,887 233,999
Non-Same Store Facilities 10,808 4,302
Property operating revenue1 244,695 238,301
Same Store Facilities 152,540 149,939
Non-Same Store Facilities 4,825 1,439
Net income from real estate operations before property lease expense 157,365 151,378
Same Store Facilities (3,669) (3,644)
Non-Same Store Facilities (23) (42)
Property lease expense (3,692) (3,686)
Same Store Facilities 148,871 146,295
Non-Same Store Facilities 4,802 1,397
Income from property 153,673 147,692 1 Property operating revenue is the primary measure to assess the performance of the segments.
The following table sets forth the reconciliation of income from property including property lease expense as presented in the above segment table and Net income from real estate operations presented in the consolidated statement of profit and loss:
(in € thousands) 2018 2017
Income from property 153,673 147,692
Add: Other revenue1 149 260
Net income from real estate operations 153,822 147,952 1 Other revenue comprises management fee revenue, rental revenue derived from assets held for sale, partnership income from self-storage operations and
rental revenue from stores under management contract.

SHURGARD ANNUAL REPORT 2018
109
SEGMENT INFORMATION BY COUNTRY FOR THE YEAR ENDED DECEMBER 31, 2018
(in € thousands) The
Netherlands France Sweden U.K. Belgium Germany Denmark Total
Same Store Facilities 53,414 63,053 38,462 27,157 20,825 17,735 13,241 233,887
Non-Same Store Facilities - 1,353 2,331 7,081 - 43 - 10,808
Property operating revenue 53,414 64,406 40,793 34,238 20,825 17,778 13,241 244,695
Same Store Facilities 35,732 39,045 27,800 16,938 13,080 11,035 8,910 152,540
Non-Same Store Facilities - 885 1,047 3,060 - (167) - 4,825
Net income from real estate operations before property lease expense
35,732 39,930 28,847 19,998 13,080 10,868 8,910 157,365
Same Store Facilities (1,336) (1,196) (921) (177) (12) (4) (23) (3,669)
Non-Same Store Facilities - (17) - (6) - - - (23)
Property lease expense (1,336) (1,213) (921) (183) (12) (4) (23) (3,692)
Same Store Facilities 34,396 37,849 26,879 16,761 13,068 11,031 8,887 148,871
Non-Same Store Facilities - 868 1,047 3,054 - (167) - 4,802
Income from property 34,396 38,717 27,926 19,815 13,068 10,864 8,887 153,673
Investment property 486,120 624,380 464,165 468,779 186,490 179,560 138,674 2,548,168
Investment property under construction
5,190 107 - 844 - 5,010 - 11,151
Property, plant and equipment and intangible assets
167 49 106 17 4,220 117 3 4,679
Deferred tax assets - - - 763 804 - - 1,567
Other non-current assets 843 300 10 190 319 - 180 1,842
Non-current assets 492,320 624,836 464,281 470,593 191,833 184,687 138,857 2,567,407

SHURGARD ANNUAL REPORT 2018
110
SEGMENT INFORMATION BY COUNTRY FOR THE YEAR ENDED DECEMBER 31, 2017
(in € thousands) The
Netherlands France Sweden U.K. Belgium Germany Denmark Total
Same Store Facilities 51,886 63,175 41,181 27,140 20,679 16,727 13,211 233,999
Non-Same Store Facilities - 1,154 - 3,148 - - - 4,302
Property operating revenue 51,886 64,329 41,181 30,288 20,679 16,727 13,211 238,301
Same Store Facilities 33,718 38,584 29,497 16,413 13,448 10,158 8,121 149,939
Non-Same Store Facilities - 697 - 742 - - - 1,439
Net income from real estate operations before property lease expense
33,718 39,281 29,497 17,155 13,448 10,158 8,121 151,378
Same Store Facilities (1,334) (1,150) (958) (174) (8) (7) (13) (3,644)
Non-Same Store Facilities - (42) - - - - - (42)
Property lease expense (1,334) (1,192) (958) (174) (8) (7) (13) (3,686)
Same Store Facilities 32,384 37,434 28,539 16,239 13,440 10,151 8,108 146,295
Non-Same Store Facilities - 655 - 742 - - - 1,397
Income from property 32,384 38,089 28,539 16,981 13,440 10,151 8,108 147,692
Investment property 470,310 555,890 432,763 370,801 175,150 154,790 130,066 2,289,770
Investment property under construction
- - 8,192 210 - 2,520 - 10,922
Property, plant and equipment and intangible assets
164 42 102 4 3,835 110 3 4,260
Deferred tax assets - - - 308 1,160 - - 1,468
Other non-current assets 886 297 10 232 5 - 181 1,611
Non-current assets 471,360 556,229 441,067 371,555 180,150 157,420 130,250 2,308,031
SHURGARD ANNUAL REPORT 2018
111
13. BUSINESS COMBINATIONS
2018 ACQUISITIONS
On June 29, 2018, we paid in cash €38.4 million for five self-storage facilities and businesses located in Sweden that we acquired from Pelican Self Storage. The acquisition has been accounted for as a business combination in accordance with IFRS 3 and of the € 38.4 million consideration paid, €43.2 million was accounted for as investment property, €0.7 million in other current assets and €0.8 million in other current liabilities and €4.7 million in deferred tax liabilities. In addition, we incurred €0.2 million in costs of acquiring facilities in respect of this acquisition. The Pelican acquisition contributed property operating revenue of €2.0 million and income from property of €1.1 million to the Company for the period June 29, 2018 to December 31, 2018. If the acquisition of the Pelican facilities had occurred on January 1, 2018, un-audited pro forma operating revenue and un-audited pro forma income from property of these facilities for the year ended December 31, 2018 would have been €3.8 million and €2.3 million, respectively. On October 15, 2018, we paid in cash €36.2 million for the Kensington (London - U.K.) self-storage facility and business that we acquired with retroactive effect to October 1, 2018 from Public Storage. The acquisition has been accounted for as a business combination in accordance with IFRS 3 and of the €36.2 million consideration paid, €41.8 million was accounted for as investment property, €0.6 million in other current assets, €1.0 million in other current liabilities and €5.2 million in deferred tax liabilities. In addition, we incurred €0.2 million in costs of acquiring facilities in respect of this acquisition. The Kensington acquisition contributed property operating revenue of €0.7 million and income from property of €0.5 million to the Company for the period October 1, 2018 to December 31, 2018. If the acquisition of the Kensington facility had occurred on January 1, 2018, un-audited pro forma operating revenue and un-audited pro forma income from property of this facility for the year ended December 31, 2018 would have been €2.6 million and €2.0 million, respectively. On November 22, 2018, we paid in cash €56.0 million for three self-storage facilities and businesses located in London (U.K.) that we acquired from ABC Self Store. The acquisition has been accounted for as a business combination in accordance with IFRS 3 and of the €56.0 million consideration paid, €56.3 million was accounted for as investment property and €0.3 million in other current liabilities. In addition, we incurred €2.6 million in costs of acquiring facilities in respect of this acquisition. The ABC acquisition contributed property operating revenue of €0.4 million and income from property of €0.1 million to the Company for the period November 22, 2018 to December 31, 2018. If the acquisition of the ABC facilities had occurred on January 1, 2018, un-audited pro forma operating revenue and un-audited pro forma income from property of these facilities for the year ended December 31, 2018 would have been €5.3 million and €0.9 million, respectively.
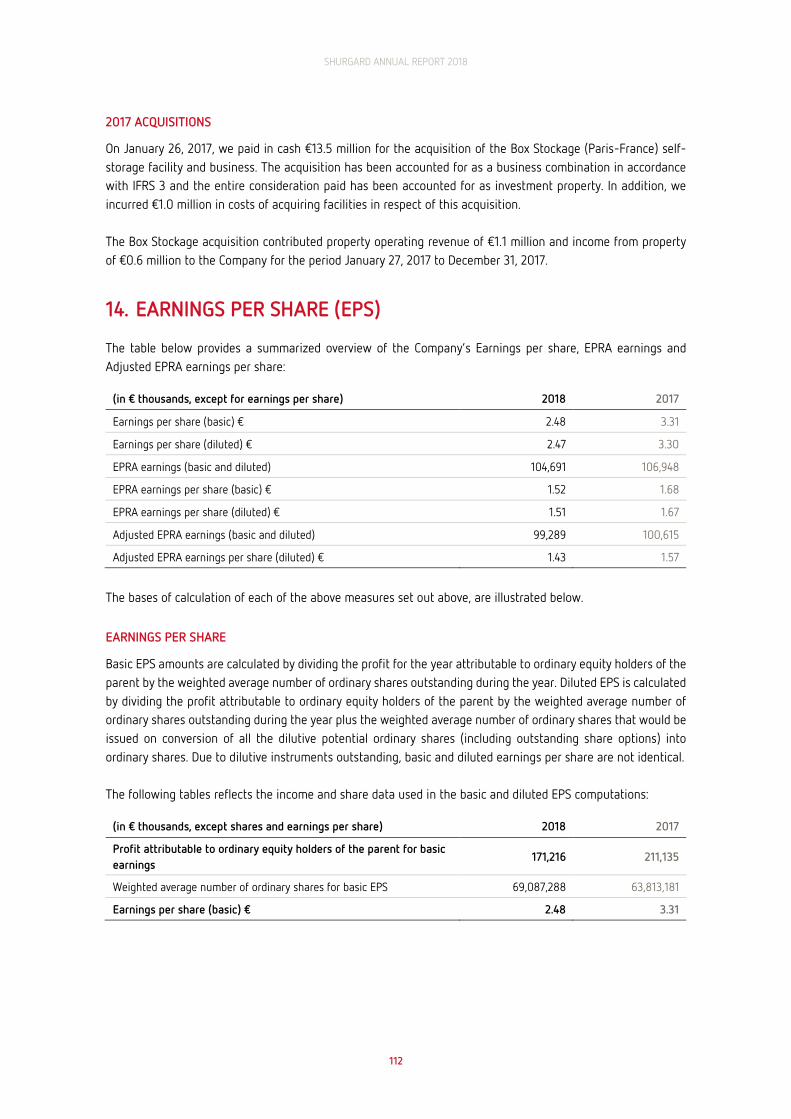
SHURGARD ANNUAL REPORT 2018
112
2017 ACQUISITIONS
On January 26, 2017, we paid in cash €13.5 million for the acquisition of the Box Stockage (Paris-France) self-storage facility and business. The acquisition has been accounted for as a business combination in accordance with IFRS 3 and the entire consideration paid has been accounted for as investment property. In addition, we incurred €1.0 million in costs of acquiring facilities in respect of this acquisition. The Box Stockage acquisition contributed property operating revenue of €1.1 million and income from property of €0.6 million to the Company for the period January 27, 2017 to December 31, 2017.
14. EARNINGS PER SHARE (EPS)
The table below provides a summarized overview of the Company’s Earnings per share, EPRA earnings and Adjusted EPRA earnings per share:
(in € thousands, except for earnings per share) 2018 2017
Earnings per share (basic) € 2.48 3.31
Earnings per share (diluted) € 2.47 3.30
EPRA earnings (basic and diluted) 104,691 106,948
EPRA earnings per share (basic) € 1.52 1.68
EPRA earnings per share (diluted) € 1.51 1.67
Adjusted EPRA earnings (basic and diluted) 99,289 100,615
Adjusted EPRA earnings per share (diluted) € 1.43 1.57
The bases of calculation of each of the above measures set out above, are illustrated below.
EARNINGS PER SHARE
Basic EPS amounts are calculated by dividing the profit for the year attributable to ordinary equity holders of the parent by the weighted average number of ordinary shares outstanding during the year. Diluted EPS is calculated by dividing the profit attributable to ordinary equity holders of the parent by the weighted average number of ordinary shares outstanding during the year plus the weighted average number of ordinary shares that would be issued on conversion of all the dilutive potential ordinary shares (including outstanding share options) into ordinary shares. Due to dilutive instruments outstanding, basic and diluted earnings per share are not identical. The following tables reflects the income and share data used in the basic and diluted EPS computations:
(in € thousands, except shares and earnings per share) 2018 2017
Profit attributable to ordinary equity holders of the parent for basic earnings
171,216 211,135
Weighted average number of ordinary shares for basic EPS 69,087,288 63,813,181
Earnings per share (basic) € 2.48 3.31

SHURGARD ANNUAL REPORT 2018
113
EFFECT OF DILUTION
(in € thousands, except shares and earnings per share) 2018 2017
Profit attributable to ordinary equity holders of the parent for dilutive earnings
171,216 211,135
Weighted average number of ordinary shares for basic EPS 69,087,288 63,813,181
Dilutive effect from share options 259,983 254,619
Weighted average number of ordinary shares adjusted for the effect of dilution
69,347,271 64,067,800
Earnings per share (diluted) € 2.47 3.30
There have been no other transactions involving ordinary shares or potential ordinary shares between the reporting date and the date of authorization of these financial statements.
EPRA EARNINGS AND EPRA EARNINGS PER SHARE
(in € thousands, except for shares and earnings per share) 2018 2017
Profit attributable to ordinary equity holders of the parent for basic earnings
171,216 211,135
Adjustments:
Gain on revaluation of investment properties, net of deferred taxes (69,489) (104,966)
(Gain) loss on disposal of investment properties, assets held for sale and property, plant and equipment, net of taxes
(1) 32
Acquisition costs of business combinations, net of taxes 2,965 747
EPRA earnings (basic and diluted) 104,691 106,948
EPRA earnings per share (basic) € 1.52 1.68
EPRA earnings per share (diluted) € 1.51 1.67
ADJUSTED EPRA EARNINGS AND ADJUSTED EPRA EARNINGS PER SHARE
(in € thousands, except for shares and earnings per share) 2018 2017
EPRA earnings (basic and diluted) 104,691 106,948
Adjustments:
Deferred tax expense on items other than the revaluation of investment property
(7,945) (6,333)
Cost incurred in connection with Shurgard Public offering1 4,411 -
Gain on conversion of share option plans1 (1,868) -
Adjusted EPRA earnings (basic and diluted) 99,289 100,615
Adjusted EPRA earnings per share (diluted) € 1.43 1.57 1 These items are presented net of current income taxes.
The average effective current income tax rates based on adjusted EPRA earnings before tax is 16.4% for the year ended December 31, 2018 and 13.1% for year ended December 31, 2017.

SHURGARD ANNUAL REPORT 2018
114
15. NET ASSET VALUE (NAV) PER SHARE
The table below provides a summarized overview of the Company’s NAV, EPRA NAV and Adjusted EPRA NAV per share:
(in € thousands, except for (Adjusted) NAV per share) 2018 2017
NAV 1,798,661 1,339,516
NAV per share (basic) € 20.25 20.99
NAV per share (diluted) € 20.18 20.92
EPRA NAV 2,153,800 1,669,990
EPRA NAV per share (diluted) € 24.17 26.08
Adjusted EPRA NAV (diluted) 2,122,884 1,622,735
Adjusted EPRA NAV per share (diluted) € 23.82 25.35
The bases of calculation of each of the above measures set out above, are illustrated below.
NAV (BASIC AND DILUTED)
Basic NAV per share amounts are calculated by dividing net assets in the statement of financial position attributable to ordinary equity holders of the parent by the number of ordinary shares outstanding at the reporting date. The following reflects the net asset and share data used in the basic and diluted NAV per share computations:
(in € thousands, except for number of shares and NAV per share) 2018 2017
NAV attributable to ordinary equity holders of the parent 1,798,661 1,339,516
Number of ordinary shares at the reporting date 88,815,910 63,813,181
Number of diluted shares at the reporting date 312,684 210,201
NAV per share (basic) 20.25 20.99
Diluted NAV per share (diluted) € 20.18 20.92
EPRA NAV (DILUTED)
The objective of the EPRA NAV measure is to highlight the fair value of net assets on an ongoing, long-term basis. Assets and liabilities that are not expected to crystallize in normal circumstances such as deferred taxes on property valuation surpluses are therefore excluded.
(in € thousands, except for NAV per share) 2018 2017
NAV attributable to ordinary equity holders of the parent (diluted) 1,798,661 1,339,516
Additions to NAV:
Deferred taxes on fair value adjustments of investment property 355,139 330,474
EPRA NAV 2,153,800 1,669,990
EPRA NAV per share (diluted) € 24.17 26.08

SHURGARD ANNUAL REPORT 2018
115
ADJUSTED EPRA NAV (DILUTED)
The objective of the adjusted EPRA NAV measure is to report net asset value including fair value adjustments in respect of all material balance sheet items which are not reported at their fair value as part of the EPRA NAV.
(in € thousands, except for NAV per share) 2018 2017
EPRA NAV 2,153,800 1,669,990
Additions to EPRA NAV:
Carrying value lower than fair value (note 37) (30,916) (47,255)
Adjusted EPRA NAV 2,122,884 1,622,735
Adjusted EPRA NAV per share (diluted) € 23.82 25.35
16. INVESTMENT PROPERTY AND INVESTMENT PROPERTY UNDER CONSTRUCTION
The table below sets forth the movement in completed investment property and investment property under construction.
Completed investment
property Level 3
Investment property under
construction Level 3
Total investment
property Level 3
December 31, 2017
At January 1 2,117,979 10,271 2,128,250
Exchange rate differences (24,297) (793) (25,090)
Transfer from investment property under construction 26,678 (26,678) -
Capital expenditure 22,877 24,572 47,449
Acquisition of businesses 13,500 - 13,500
Transfer to asset held for sale (3) - (3)
Disposals (35) - (35)
Net gain of fair value adjustment 133,071 3,550 136,621
At December 31 2,289,770 10,922 2,300,692
December 31, 2018
At January 1 2,289,770 10,922 2,300,692
Exchange rate differences (21,898) (434) (22,332)
Transfer from investment property under construction 17,952 (17,952) -
Capital expenditure 28,613 16,481 45,094
Acquisition of businesses 141,277 - 141,277
Net gain of fair value adjustment1 92,454 2,134 94,588
At December 31 2,548,168 11,151 2,559,319 1 Net gain of fair value adjustment on completed investment property for the year ended December 31, 2018 has been adversely impacted by a fire incident in regard to one of our U.K. facilities for which we recognized an impairment loss of €15.5 million.

SHURGARD ANNUAL REPORT 2018
116
The fair value of completed investment property is determined using a discounted cash flow (“DCF”) method. Under the DCF method, fair value is estimated using assumptions regarding the benefits and liabilities of ownership over the asset’s life including an exit or terminal value. This method involves the projection of a series of cash flows on a real estate property interest. To this projected cash flow series, an appropriate, market derived discount rate is applied to establish the present value of the income stream associated with the asset. The exit yield is normally separately determined and differs from the discount rate. The duration of the cash flow and the specific timing of inflows and outflows are determined by events such as rent reviews, lease renewal and related re-letting, redevelopment, or refurbishment. The appropriate duration is typically driven by market behavior that is a characteristic of the class of real estate property. Periodic cash flow is typically estimated as gross income less vacancy, non-recoverable expenses, collection losses, lease incentives, maintenance cost, agent and commission costs and other operating and management expenses. The series of periodic net operating income, along with an estimate of the terminal value anticipated at the end of the projection period, is then discounted. The valuations were performed by Cushman and Wakefield (”C&W’’), an accredited independent valuer with a recognized and relevant professional qualification and with recent experience in the locations and categories of the investment property being valued. The valuation models in accordance with those recommended by the International Valuation Standards Committee have been applied and are consistent with the principles in IFRS 13. More information about the fair value measurement is set out in note 17.
17. FAIR VALUE MEASUREMENT – INVESTMENT PROPERTY
C&W’s external valuation has been carried out in accordance with the RICS Valuation – Global Standards, published by The Royal Institution of Chartered Surveyors (“the Red Book”). The valuation of each of the investment properties and the investment properties under construction has been prepared on the basis of either Fair Value or Fair Value as a fully equipped operational entity, having regard to trading potential (as appropriate) subject to the Special Assumption referenced below in this note.
SPECIAL ASSUMPTION – MANAGEMENT COSTS
C&W were instructed to adopt the actual allocated management costs of the Company for each individual property, rather than a market assumption in this regard. The actual allocated management costs are lower than C&W’s market assumption and this has resulted in a higher level of value being reported.
VALUER DISCLOSURE REQUIREMENTS
C&W’s valuation has been provided for accounts purposes and as such, is a Regulated Purpose Valuation as defined in the Red Book. In compliance with the disclosure requirements of the Red Book, C&W have confirmed that:
∙ C&W has carried out bi-annual valuations for this purpose since the financial year ending December 31, 2015;
∙ C&W do not provide other significant professional or agency services to the Company;

SHURGARD ANNUAL REPORT 2018
117
∙ C&W have previously provided valuation advice in relation to some of the properties for both loan security and internal management purposes. The previous valuation advice has been limited since May 2014 when C&W provided desktop valuation advice on 187 properties for loan security purposes;
∙ In relation to the preceding financial year of C&W, the proportion of the total fees payable by the Company to the total fee income of the firm is less than 5%; and
∙ The fee payable to C&W is a fixed amount per store and is not contingent on the appraised value.
MARKET UNCERTAINTY
C&W’s valuation report comments on valuation uncertainty resulting from low liquidity in the market for self-storage property. C&W note that in Europe, since the first quarter of 2015, there have only been twenty-four transactions involving multiple assets and thirteen single asset transactions, with the majority of these transactions taking place in the UK. C&W state that due to the lack of comparable market information in the self-storage sector, there is greater uncertainty attached to their opinion of value than would be anticipated during more active market conditions.
CURRENCY AND AGGREGATE VALUES REPORTED
C&W’s valuation report confirms that each property has been valued individually in local currency. C&W’s valuation report then converts each property valuation to a Euro amount at the spot exchange rates provided by the Company. The total value reported in Euro is the aggregate amount for each individual value reported in Euro, but it does not reflect any potential portfolio premium, as referenced below in this note.
PORTFOLIO PREMIUM
C&W’s valuation report confirms that the properties have been valued individually but that if the portfolio was to be sold as a single lot or in selected groups of properties, the total value could differ significantly. C&W state that in current market conditions they are of the view that there could be a material portfolio premium. In particular, C&W’s individual property valuations reflect full Stamp Duty (or its equivalent in each country considered) on the sale of each property whereas a sale of the whole portfolio or selected groups of assets would most likely be effected by way of a shares transaction, which would typically attract a lower level of stamp duty.
VALUATION METHODOLOGY AND ASSUMPTIONS
The valuation of the operational self-storage facilities has been prepared having regard to trading potential. Cash flow projections have been prepared for all of the properties reflecting estimated absorption, revenue growth and expense inflation. A discounted cash flow method of valuation based on these cash flow projections has been used by C&W to arrive at its opinion of fair value for each property. C&W has adopted different approaches for the valuation of the leasehold and freehold assets as follows:
FREEHOLD AND LONG LEASEHOLD The valuation is based on a discounted cash flow of the net operating income over a ten-year period and a notional sale of the asset at the end of the tenth year.

SHURGARD ANNUAL REPORT 2018
118
Assumptions:
∙ A. Net operating income is based on projected revenue received less projected operating costs together with an allowance for a central administration charge (or management cost). As detailed above in this note, the valuation is made on the Special Assumption of actual allocated management costs of the Company for each individual property, rather than a market assumption. The initial net operating income is calculated by estimating the net operating income in the first twelve months following the valuation date.
∙ B. The net operating income in future years is calculated assuming either straight-line absorption from day one actual occupancy or variable absorption over years one to four of the cash flow period, to an estimated stabilized/mature occupancy level. In the valuation the assumed stabilized occupancy level for the trading stores (both freeholds and all leaseholds) open at December 31, 2018 averages 90.19% (90.28% at December 31, 2017). The projected revenues and costs have been adjusted for estimated cost inflation and revenue growth. The average time assumed for stores to trade at their maturity levels is 8.35 months (13.23 months in 2017).
∙ C. The capitalization rates applied to existing and future net cash flows have been estimated by reference to the available evidence of transactions in the self-storage market plus underlying yields for industrial and retail warehouse property, yields for other trading property types such as purpose-built student housing and hotels, bank base rates, ten-year money rates and inflation. The valuation included in the accounts assumes rental growth in future periods. If an assumption of no rental growth is applied to the external valuation, the net initial yield post-administration expenses for all of the open stores (both freeholds and all leaseholds) is 6.02% (6.16% in 2017), rising to a stabilized net yield post-administration expenses of 6.48% (6.84% in 2017).
∙ D. The future net cash flow projections (including revenue growth and cost inflation) have been discounted at a rate that reflects the risk associated with each asset. The weighted average annual discount rate adopted (for both freeholds and all leaseholds) is 9.19% (9.53% for 2017).
∙ E. Purchaser’s costs in the range of approximately 2.0% to 13.0% have been assumed initially, reflecting the stamp duty levels anticipated in each local market, and sales plus purchaser’s costs totaling approximately 4.0% to 15.0% are assumed on the notional sales in the tenth year in relation to freehold and long leasehold stores.
SHORT LEASEHOLDS The same methodology has been used as for freeholds, except that no sale of the assets in the tenth year is assumed but the discounted cash flow is run through to the expiry of the lease. It should be noted that the Company hold a number of short leases which have been valued on the same basis as the freehold and long leasehold assets due to their security of tenure arrangements and the potential compensation provisions in the event of the landlord wishing to take possession at expiry. The capitalization rates on these stores reflect the risk of the landlord terminating the lease at expiry.
INVESTMENT PROPERTIES UNDER CONSTRUCTION
C&W has valued the stores in development adopting the same methodology as set out above but based on the cash flow projection expected for the store at opening and allowing for the outstanding costs to take each store from its current state to completion and full fit out. C&W has allowed for carry costs and construction contingency, as appropriate.

SHURGARD ANNUAL REPORT 2018
119
CHANGES IN VALUATION TECHNIQUES
There were no other changes in valuation techniques during the periods concerned.
HIGHEST AND BEST USE
For all investment property that is measured at fair value, the current use of the property is considered the highest and best use.
FAIR VALUE HIERARCHY
Based on the significant unobservable inputs to the DCF model used for determining the fair value of all our investment property and investment property under construction that we recognized in our statement of financial position as of December 31, 2018 and 2017, our investment property is a Level 3 fair market value measurement. The geographical split of our investment property and investment property under construction is set forth in note 12. Unrealized gains and (losses) for recurring fair value measurements relating to investment property held at the end of the reporting period categorized within Level 3 of the fair value hierarchy amount to €94.6 million in 2018 and €136.6 million in 2017 and are presented in the consolidated statement of profit or loss in line item valuation (loss) gain from investment property.
SENSITIVITY OF THE VALUATION TO ASSUMPTIONS
All other factors being equal, higher net operating income would lead to an increase in the valuation of a store and an increase in the capitalization rate or discount rate would result in a lower valuation, and vice versa. Higher assumptions for stabilized occupancy, absorption rate, rental rate and other revenue, and a lower assumption for operating costs, would result in an increase in projected net operating income, and thus an increase in valuation. For the year ended December 31, 2018:
∙ All other factors being equal, a one percent increase in occupancy rates (real) would lead to an increase in the valuation of our store portfolio of €37.1 million (1.5%).
∙ All other factors being equal, one percent decrease in occupancy rates would lead to a decrease in the valuation of our store portfolio of €38.4 million (1.6%).
∙ All other factors being equal, a 0.25% percent increase (real) in both discount and capitalization rate would lead to a decrease in the valuation of our store portfolio of €16.3 million (3.9%).
∙ All other factors being equal, a 0.25% percent decrease (real) in both discount and capitalization rate would lead to an increase in the valuation of our store portfolio of €17.8 million (4.3%).

SHURGARD ANNUAL REPORT 2018
120
18. PROPERTY, PLANT AND EQUIPMENT AND INTANGIBLE ASSETS
Property, plant and equipment mainly consists of building improvements and office machinery and equipment in use in the local head offices located in the countries in which we operate.
(in € thousands) Building Equipment Total property,
plant and equipment
Intangible assets1
Historical cost
At January 1, 2017 1,049 4,677 5,726 11,926
Additions 12 472 484 1,032
Disposals - (25) (25) (2,095)
Exchange differences (10) (18) (28) -
At December 31, 2017 1,051 5,106 6,157 10,863
Additions 307 163 470 1,632
Exchange differences (7) (11) (18) -
At December 31, 2018 1,351 5,258 6,609 12,495
Depreciation and impairment
At January 1, 2017 (615) (4,088) (4,703) (8,663)
Depreciation charge of the year (29) (318) (347) (1,180)
Disposals - 14 14 2,095
Exchange differences 8 16 24 -
At December 31, 2017 (636) (4,376) (5,012) (7,748)
Depreciation and amortization charge of the year
(29) (361) (390) (1,289)
Exchange differences 2 12 14 -
At December 31, 2018 (663) (4,725) (5,388) (9,037)
Net book value
At December 31, 2018 688 533 1,221 3,458
At December 31, 2017 415 730 1,145 3,115
At January 1, 2017 434 589 1,023 3,263 1 Intangible assets consists mainly of capitalized computer software.
19. OTHER NON-CURRENT ASSETS
Other non-current assets mainly consist of indemnification assets, deposits paid to vendors and VAT recoverable after more than one year and the unamortized non-current portion of capitalized debt financing cost in incurred in connection with the revolving syndicated loan facility (see note 29).

SHURGARD ANNUAL REPORT 2018
121
20. TRADE AND OTHER RECEIVABLES
(in € thousands) December 31, 2018 December 31, 2017
Gross amount 16,795 16,958
Provision for doubtful debt (4,306) (4,006)
Trade and other receivables 12,489 12,952
Rent and service charge receivables are non-interest-bearing and are typically due within thirty days (note 37). The receivables are due from retail and business tenants.
21. OTHER CURRENT ASSETS
(in € thousands) December 31, 2018 December 31, 2017
Prepayments 3,743 3,366
Receivables from tax authorities other than VAT 512 1,496
Other current assets1 1,017 2,517
Other current assets 5,272 7,379 1 Other current assets mainly consist of VAT recoverable in less than one year, Inventory and insurance compensation proceeds and the unamortized current portion of capitalized debt financing cost in incurred in connection with the revolving syndicated loan facility (see note 29).
22. CASH AND CASH EQUIVALENTS
(in € thousands) December 31, 2018 December 31, 2017
Cash 250,922 23,645
Cash equivalents - -
Cash and cash equivalents 250,922 23,645
There are no cash and cash equivalents which are restricted from withdrawal or general corporate use as of December 31, 2018 and 2017.
23. ISSUED SHARE CAPITAL
As of December 31, 2017, the Company’s issued share capital of €800,628,936 was represented by 63,935,681 ordinary shares. On July 6, 2018, the Company reduced its issued share capital by €755,000,000 in connection with the creation of an equal amount of distributable reserves. On October 15, 2018, the Company’s shares were admitted for trading on Euronext Brussels and the Company issued twenty-five million new shares at a unit price of €23.00 per share (or €575,000,000 in total). Of the

SHURGARD ANNUAL REPORT 2018
122
€575,000,000 equity issuance proceeds, €17,841,734 was allocated to the Company’s issued share capital and €557,158,266 to the share premium account. On December 13, 2018, the Company sold treasury shares with carrying value of €21,150 (note 24). During the year ended December 31, 2018, the Company aligned its issued share capital with the share capital of Shurgard Self Storage S.A. by decreasing it for €949,375 in offset of retained earnings. As of December 31, 2018, the share capital of the Company of €62,542,445, net of treasury shares held of €928,225, is represented by 88,935,681 ordinary shares that all have been fully paid up. Ordinary shares have no par value. They entitle the holder to participate in dividends, and to share in the proceeds of winding up the company in proportion to the number of and amounts paid on the shares held. The authorized capital of the Company (including the issued share capital) is set at ninety-five million eight hundred thousand seven hundred twenty-nine euro and ninety-eight cent (€ 95,800,729.98) divided into one hundred thirty-four million two hundred thirty-six thousand eight hundred fifty-six (134,236,856) shares without nominal value.
24. TREASURY SHARES
In 2012, 122,500 ordinary shares were issued, and then repurchased by the Company in connection with the exercise of employee stock options. The shares have not been retired and are currently still in possession of the Company. In our statement of financial position, the treasury shares have been deducted from issued share capital for an amount of €949,375. In 2018, the Company sold 2,729 treasury shares for €49,995 to an employee in connection with the exercise of 2,729 share options granted under the 2016 plan. As of December 31, 2018, the Company owns 119,771 treasury shares that are deducted from share capital for an amount of €928,225.
25. SHARE PREMIUM
Of the October 15, 2018 €575,000,000 equity issuance proceeds, €557,158,266 was allocated to the share premium account. In connection with the equity issuance and admission for trading on Euronext, the Company incurred €24,481,000 in bankers, consultancy fees and other expenses, of which €19,737,000 has been allocated to equity, and the remainder, or €4,744,000 has been expensed.
26. SHARE-BASED PAYMENT RESERVE
On October 15, 2018, the Company converted its cash-settled share-based compensation plans into equity-settled plans and reclassified to share-based payment reserve €4,280,763 of share-based compensation accrual. During the period October 16 till December 31, 2018, we recognized in offset of share-based compensation expense an amount of €215,538 for our equity-settled share-based compensation expense in share premium, and we realized a gain of €28,491 on the sale of treasury shares.

SHURGARD ANNUAL REPORT 2018
123
27. DISTRIBUTABLE RESERVES
On July 6, 2018, the Company created €755,000,000 of distributable reserves through the reduction of its issued share capital. On July 10, 2018, the Company distributed €255,000,000 to its shareholders.
28. NON-CONTROLLING INTERESTS
Non-controlling interests represent 5.2% ownership interests in our German subsidiaries First Shurgard Deutschland GmbH and Second Shurgard Deutschland GmbH, owning an aggregate of 11 properties. This 5.2% ownership is with our two principal shareholders PS and NYSCRF through the entity Shurgard German Holding LLC. We allocated €0.5 million and €0.4 million of net income to non-controlling interests during the years ended December 31, 2018 and 2017, respectively, based upon their respective interest in the net income of the subsidiaries. During the period starting January 1, 2017 and ending December 31, 2018, there were no transactions with non-controlling interests.
29. INTEREST-BEARING LOANS AND BORROWINGS
(in € thousands) Effective
interest rate Maturity 2018 2017
Non-current
Senior guaranteed notes – issued July 2014 2.83% July 24, 2021 100,000 100,000
Senior guaranteed notes – issued July 2014 3.24% July 24, 2024 100,000 100,000
Senior guaranteed notes – issued July 2014 3.38% July 24, 2026 100,000 100,000
Senior guaranteed notes – issued June 2015 2.67% June 25, 2025 130,000 130,000
Senior guaranteed notes – issued June 2015 2.86% June 25, 2027 110,000 110,000
Senior guaranteed notes – issued June 2015 3.03% June 25, 2030 60,000 60,000
Nominal values 600,000 600,000
Less:
Unamortized balance of debt issuance cost on notes issued
(2,291) (2,653)
Borrowings as reported on statement of financial position
597,709 597,347
Weighted average cost of debt as of December 31
2.98% 2.98%

SHURGARD ANNUAL REPORT 2018
124
SENIOR GUARANTEED NOTES
On July 24, 2014, the Company issued to certain European and U.S. investors three tranches of senior guaranteed notes each. The proceeds from the issuance were mainly utilized to repay, in full, a note payable to our shareholders in July 2014. The Company paid €2.3 million of placement and legal fees and other expenses that are being amortized as interest expense using the effective interest method. As of December 31, 2018 and 2017, the unamortized balances of the debt financing costs on the 2014 Issuance were €1.3 million and €1.5 million, respectively. On June 25, 2015, the Company issued to certain European and U.S. investors three tranches of senior guaranteed notes. The proceeds from the issuance were mainly utilized to repay the 2014 Wells Fargo Loan, the Revolving Loan Facility and to fund the City Box Transaction. The Company paid €1.4 million of placement and legal fees and other expenses that are being amortized as interest expense using the effective interest method. As of December 31, 2018 and 2017, the unamortized balances of the debt financing costs on the 2015 Issuance were €1.0 million and €1.2 million, respectively. The senior guaranteed notes (both principal amount and interest payments) are denominated in Euro. The full and prompt performance and observance by Shurgard Luxembourg Sàrl of all its obligations under the 2014 and 2015 note purchase agreements is unconditionally guaranteed by Shurgard Self Storage S.A. as Parent Guarantor pursuant to the terms and conditions provided for under the respective note purchase agreements. The 2014 and 2015 Issuances are subject to certain customary covenants (including senior leverage, fixed charge cover and unencumbered asset value to total unsecured liabilities) that we test for compliance on a quarterly basis. As of December 31, 2018 and 2017, we are in compliance with all such covenants.
REVOLVING LOAN FACILITY BNP PARIBAS FORTIS BANK
On September 28, 2015, the Company entered into a €50.0 million revolving loan facility with BNP Paribas Fortis bank (“the BNP Revolving Loan Facility”). There are no mandatory repayments of principal debt due for the BNP Revolving Loan Facility before its maturity and a commitment fee of 0.28% applies to undrawn amounts. As of December 31, 2017, the Company had no outstanding borrowings on the BNP Revolving Loan Facility. On May 23, 2016, the BNP Revolving Loan Facility was expanded with a second tranche of €75.0 million. As of December 31, 2017 the Company had no outstanding borrowings on this second tranche of the BNP Revolving Loan Facility. The BNP Revolving Loan Facility is guaranteed by the Company pursuant to a guarantee that Shurgard Self Storage S.A. (the Parent Guarantor) has undertaken, irrevocably and unconditionally, to pay, on BNP Paribas Fortis bank’s first demand, an amount of €137.5 million maximum. We early terminated the BNP Revolving Loan Facility and repaid the remaining outstanding amount on October 16, 2018.

SHURGARD ANNUAL REPORT 2018
125
BRIDGE LOAN SOCIÉTÉ GÉNÉRALE / BNP PARIBAS FORTIS BANK
On July 10, 2018, the Company entered into a €200,000,000 bridge loan agreement with Société Générale bank and BNP Paribas Fortis, with maturity of January 10, 2019 and bearing interest of EURIBOR + 40 basis points, and has drawn €50,000,000 on the second tranche of the BNP Paribas Fortis revolving loan facility to finance the €255,000,000 interim distribution to its shareholders which was executed on July 13, 2018. We repaid the bridge loan on October 16, 2018.
REVOLVING SYNDICATED LOAN FACILITY
On September 26, 2018 and effective October 16, 2018, the Company, through its subsidiary Shurgard Luxembourg Sàrl entered into a €250 million syndicated revolving loan facility with BNP Paribas Fortis bank, Société Générale bank and HSBC bank (with BNP Paribas Fortis bank as agent) with maturity of October 16, 2023, bearing interest of Euribor plus a margin varying between 0.45% and 0.95% per annum dependent on the most recent loan-to-value ratio (“the new RCF”). There are no mandatory repayments of principal debt due for this facility before its maturity and a commitment fee of 35% of the applicable margin applies to undrawn amounts. The facility is subject to certain customary covenants. In connection with the new RCF, the Company paid €0.4 million arrangement and legal fees. As of December 31, 2018, we had no outstanding borrowings under this facility, and the commitment fee was equal to 80% of the applicable margin.
30. FINANCE LEASE OBLIGATIONS
The Company leases various investment properties with aggregate fair value of €33.6 million as of December 31, 2018 (€34.4 million as of December 31, 2017) under finance leases. Finance lease obligations are related to six investment properties in Belgium and The Netherlands, with purchase option on one Belgian property exercisable in the year 2022. The terms of the Dutch finance leases do not provide for any purchase options. The liability under finance leases at December 31, 2018 represents the future minimum lease payments, net of future interest expense totaling €18.5 million (€19.8 million as of December 31, 2017). At December 31, 2018, future minimum lease payments (including interest charges) under our finance leases totaling €24.6 million, are as follows:
(in € thousands) 2018 2017
Due within one year 1,067 1,053
Due within two to five years 4,890 3,725
Thereafter 18,628 21,548
Total future lease payments 24,585 26,326
Amount representing interest (18,460) (19,776)
Present value of minimum lease payments 6,125 6,550

SHURGARD ANNUAL REPORT 2018
126
31. ANALYSIS OF MOVEMENTS IN INTEREST-BEARING LOANS AND BORROWINGS
The below tables provide an analysis of financial debt and movements in financial debt for each of the periods presented.
(in € thousands) Jan. 1, 2018
Borrowing proceeds
Repay-ments of
debt
Payments for debt
financing cost1
Interest payments
Non-cash move-ments
Dec. 31, 2018
Interest-bearing loans and borrowings
597,347 250,000 (250,000) (100) (17,831) 18,293 597,709
Finance lease obligations 6,550 - (505) - (582) 662 6,125
Total financial debt 603,897 250,000 (250,505) (100) (18,413) 18,955 603,834
(in € thousands) Jan. 1,
2017 Borrowing
proceeds
Repay-ments of
debt
Payments for debt
financing cost
Interest payments
Non-cash move-ments
Dec. 31, 2017
Interest-bearing loans and borrowings
623,995 20,000 (47,000) - (17,735) 18,087 597,347
Finance lease obligations 6,939 - (464) - (602) 677 6,550
Total financial debt 630,934 20,000 (47,464) - (18,337) 18,764 603,897 1 In connection with the revolving syndicated loan facility the Company entered into on September 26, 2018 (see Note 29), the Company paid €415,000
arrangement and legal consultancy fees. Because we do not have any outstanding borrowings on this facility as of December 31, 2018, we recorded the debt financing cost as prepaid current and prepaid non-current assets and amortize it over the five-year term of the facility.
32. OTHER NON-CURRENT LIABILITIES
Other non-current liabilities consist, almost exclusively, of VAT due after more than one year.
33. TRADE AND OTHER PAYABLES AND DEFERRED REVENUE
(in € thousands) Dec. 31, 2018 Dec. 31, 2017
Accrued compensation and employee benefits 8,037 7,256
Accrued share-based compensation expense 179 5,449
Accounts payable (including accrued expenses) 26,404 23,883
Payables to affiliated companies 624 662
Deferred revenue 24,619 23,455
Other payables1 5,249 4,013
Trade and other payables and deferred revenue 65,112 64,718 1 Other payables consists of VAT payable in less than one year and customer deposits.

SHURGARD ANNUAL REPORT 2018
127
34. PENSIONS
The Company has defined contribution plans in certain countries in which it operates, whereby contributions by the Company are historically charged to expense in the period in which services are rendered by the covered employees. As of each of December 31, 2018 and 2017, the Company incurred €1.0 million expense. These amounts are included in property operating expenses or general, administrative and other expenses in our consolidated statements of profit and loss. The Company operates a Belgian pension plan that is structured as a defined contribution plan but that needs to be accounted for as a defined benefit plan in accordance with IFRS. During each of the years ended December 31, 2018 and 2017, we contributed €0.4 million to Vivium, a reputable Belgian third-party insurance company. We expect to contribute the same amount to Vivium in 2019. The insurance company invests the majority of its funds in sovereign and corporate bonds. Investment decisions are based on strategic asset allocation studies and risk management best practices. As of December 31, 2018, the defined benefit obligation amounted to €2.7 million (€2.3 million as of December 31, 2017), offset by plan assets of €2.8 million as of December 31, 2018 (€2.5 million as of December 31, 2017). The assumptions used in determining net benefit costs and benefit liabilities for our pension plans were as follows:
(in € thousands) December 31, 2018 December 31, 2017
Discount rate 1.80% 1.75%
Inflation 1.75% 1.75%
Rate of salary increases 2.75% 2.75%
Mortality tables MR-5/FR-5 MR-5/FR-5
35. SHARE-BASED COMPENSATION EXPENSE
Under various share option plans, the Company granted to its employees options to purchase the Company’s shares, with the exercise price equal to the fair value of the share at the respective grant dates. The terms of these grants were established by our Board of Directors. Except for the 2018 share option grants that have three-year cliff vesting, our options vest ratably over a four year period, and expire ten years after the grant date. Because employees exercising their share options could force the Company to settle the share options in cash, these share option plans were classified as cash-settled share-based payment plans. Accordingly, the fair value of the liability for the share options was remeasured at each reporting date and at the date of settlement. Any changes in the fair value were recognized in Administrative expenses. Since the Company’s shares were not traded publicly until October 15, 2018, our Board of Directors derived up to that date the fair value of our shares based on the estimated fair value of the Company under a going-concern approach. The fair value of the share options for all plans was determined using the Black-Scholes option pricing model. Expected volatility of the Company’s shares was determined based upon a combination of historical volatility and

SHURGARD ANNUAL REPORT 2018
128
peer Company review, as determined from time to time by the Board of Directors. The risk-free interest rate was based upon the yield of European treasury securities with a remaining term equal to the expected remaining life of the related share option. We used historical data and trends to estimate future forfeitures as well as the expected life of the awards. All our options outstanding as of December 31, 2018 and 2017 under the 2015, 2016 and 2017 share option plans have a ten-year contractual term and four years (25% per annum) graded vesting with no performance conditions. Participants could only exercise the share options having vested subject to the respective provisions of the relevant share option plans and at the price set previously by the Board of Directors. The Board of Directors of Shurgard Self Storage granted in the first quarter of 2015 420,000 share options under the 2015 share option plan and also determined the exercise price of the grants to be €12.77. The fair market value of the options was based on the valuation received from a third-party valuation firm and as approved by the Board. The Board of Directors of Shurgard Self Storage granted in the third quarter of 2016 54,000 share options under the 2016 share option plan and also determined the exercise price of the share options granted to be €23.10. The fair market value of the options was based on the valuation received from a third-party valuation firm and as approved by the Board. The Board of Directors of Shurgard Self Storage granted in the third quarter of 2017 255,000 share options under the 2017 share option plan and also determined the exercise price of the share options granted to be €27.02. The fair market value of the options was based on the valuation received from a third-party valuation firm and as approved by the Board. As of December 31, 2017, we used the following weighted average assumptions in the Black-Scholes option-pricing model to calculate the fair value of the liability for the options granted in 2015, 2016 and 2017:
2015 grants 2016 grants 2017 grants
Per-share fair value of Shurgard Europe shares € 28.03 € 28.03 € 28.03
Expected volatility 20.00% 20.00% 20.00%
Risk free interest rate -0.34% -0.16% -0.13%
Expected remaining term (in years) 4.3 5.8 6.8
Dividend yield - - -
Expected forfeiture rate per annum 3.00% 3.00% 5.00%
Fair value per option € 15.17 € 7.57 € 6.27
On July 13, 2018, the Company proceeded to a distribution of available reserves in the amount of €255 million. Pursuant to the meeting of the Board of Directors of the Company held in Luxembourg on September 26, 2018, the exercise prices of the share options granted in 2015 (€12.77), 2016 (€23.10), and 2017 (€27.02) were reduced accordingly to €8.77, €18.32 and €21.51, respectively. Prior to the issuance of equity and admission for trading its shares on Euronext Brussels, the Company converted it cash-settled awards granted under the 2015, 2016 and 2017 share option plans into equity settled awards.
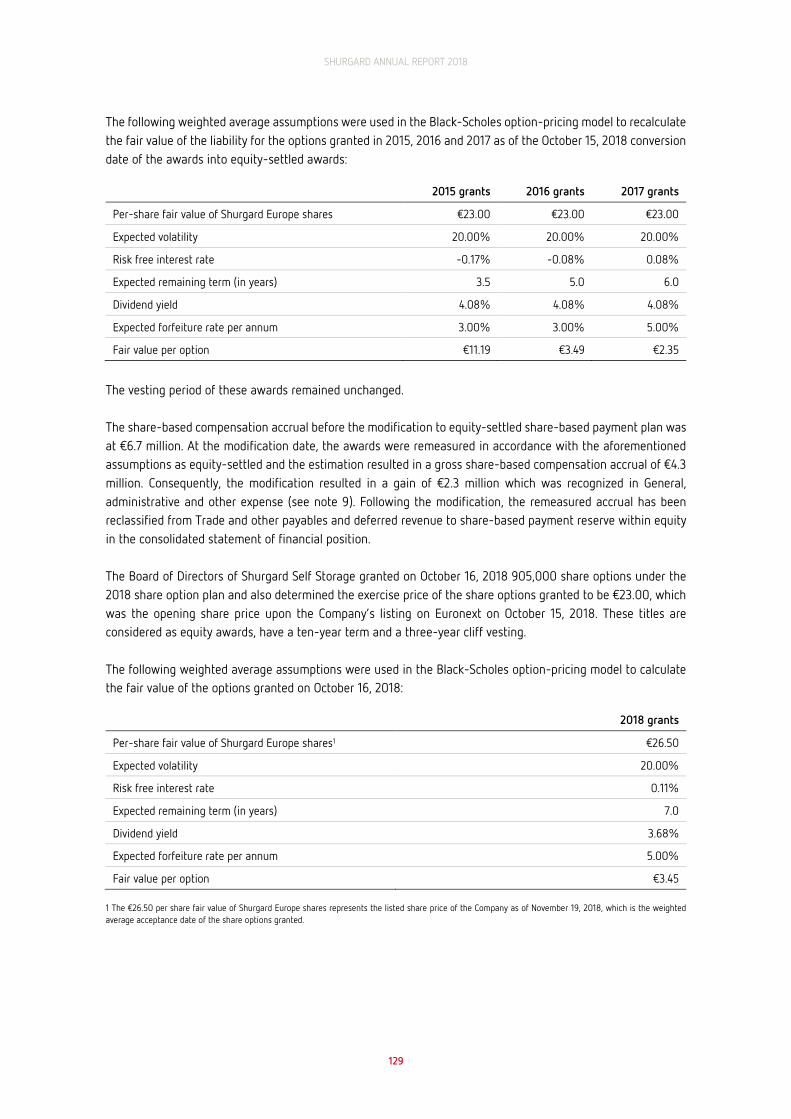
SHURGARD ANNUAL REPORT 2018
129
The following weighted average assumptions were used in the Black-Scholes option-pricing model to recalculate the fair value of the liability for the options granted in 2015, 2016 and 2017 as of the October 15, 2018 conversion date of the awards into equity-settled awards:
2015 grants 2016 grants 2017 grants
Per-share fair value of Shurgard Europe shares €23.00 €23.00 €23.00
Expected volatility 20.00% 20.00% 20.00%
Risk free interest rate -0.17% -0.08% 0.08%
Expected remaining term (in years) 3.5 5.0 6.0
Dividend yield 4.08% 4.08% 4.08%
Expected forfeiture rate per annum 3.00% 3.00% 5.00%
Fair value per option €11.19 €3.49 €2.35
The vesting period of these awards remained unchanged. The share-based compensation accrual before the modification to equity-settled share-based payment plan was at €6.7 million. At the modification date, the awards were remeasured in accordance with the aforementioned assumptions as equity-settled and the estimation resulted in a gross share-based compensation accrual of €4.3 million. Consequently, the modification resulted in a gain of €2.3 million which was recognized in General, administrative and other expense (see note 9). Following the modification, the remeasured accrual has been reclassified from Trade and other payables and deferred revenue to share-based payment reserve within equity in the consolidated statement of financial position. The Board of Directors of Shurgard Self Storage granted on October 16, 2018 905,000 share options under the 2018 share option plan and also determined the exercise price of the share options granted to be €23.00, which was the opening share price upon the Company’s listing on Euronext on October 15, 2018. These titles are considered as equity awards, have a ten-year term and a three-year cliff vesting. The following weighted average assumptions were used in the Black-Scholes option-pricing model to calculate the fair value of the options granted on October 16, 2018:
2018 grants
Per-share fair value of Shurgard Europe shares1 €26.50
Expected volatility 20.00%
Risk free interest rate 0.11%
Expected remaining term (in years) 7.0
Dividend yield 3.68%
Expected forfeiture rate per annum 5.00%
Fair value per option €3.45 1 The €26.50 per share fair value of Shurgard Europe shares represents the listed share price of the Company as of November 19, 2018, which is the weighted average acceptance date of the share options granted.

SHURGARD ANNUAL REPORT 2018
130
We realized €0.8 million in share-based compensation income (gain of €2.4 million due to the modification and €1.6 million expense recognized as services were provided by the beneficiaries) and incurred €1.9 million in share-based compensation expense in the years ended December 31, 2018 and 2017, respectively. We had a liability for share-based compensation plans, included under Trade and other payables and deferred revenue in our statements of financial position, totaling €5.4 million as at December 31, 2017. The €0.2 million liability for share-based compensation as of December 31, 2018 consists of an accrual for employers’ social security share that is calculated based on the accounting principles of cash-settled awards. As of December 31, 2018 and 2017, we had €3.4 million, and €1.9 million of unrecognized share-based compensation expense, net of estimated pre-vesting forfeitures, related to unvested option awards. For each of the years ended December 31, 2018 and 2017, the weighted average remaining vesting period of our share options was 2.2 years. As of December 31, 2018 and 2017 we estimate that the fair value of the non-exercised awards is, respectively, €7.9 million and €7.3 million. The following table sets forth the number of share options granted, forfeited, exercised and outstanding at December 31, 2018 and 2017:
2018 2017
Number of
options
Weighted average exercise
price
Number of options
Weighted average exercise
price (a)
Outstanding, January 1 654,000 € 14.38 727,125 € 12.45
Granted (a) 915,000 € 22.98 255,000 € 27.02
Forfeited - - (10,000) € 23.10
Exercised (b) (2,729) € 18.32 (318,125) € 10.28
Outstanding, December 31 1,566,271 € 19.40 654,000 € 19.02
Exercisable, December 31 340,521 € 11.79 166,000 € 13.45
The weighted average price of options outstanding as of January 1, 2018 has been adapted according to the reduced exercise prices of the options as determined on September 26, 2018 by the Board of Directors.
a) The Company granted in the first quarter of 2018 10,000 share options under the 2017 plan.
b) Share options exercised in the years ended December 31, 2018 and 2017 had an aggregate intrinsic value at the date of exercise of €8.18 and €16.74 per option, respectively.
During the year ended December 31, 2018, upon exercise of 2,729 awards under the 2016 plan, the Company realized a gain on sale of treasury shares of €28,491 that was allocated to share-based payment reserve.

SHURGARD ANNUAL REPORT 2018
131
The following table summarizes information about our share options outstanding at December 31, 2018 under the 2015, 2016, 2017 and 2018 plans:
As of December 31, 2018
Options outstanding Options exercisable
Year of grant
Fair value per option at December 31,
2018
Number of Options
Weighted average exercise
price
Weighted average
remaining contractual
Number of Options
Weighted average exercise
price
Weighted average
remaining contractual
2015 €11.19 355,000 €8.77 6.3 years 255,000 €8.77 6.3 years
2016 €3.49 41,271 €18.32 7.5 years 19,271 €18.32 7.5 years
2017 €2.35 265,000 €21.51 8.5 years 66,250 €21.51 8.5 years
2018 €3.45 905,000 €23.00 9.9 years - - -
1,566,271 €19.40 8.8 years 340,521 €11.79 6.8 years
We expect to repurchase shares upon the exercise of share options. Based on the number of vested and outstanding options, the Company’s share price and the number of treasury shares held by the Company as of December 31, 2018 and the number of options to vest in 2019, the maximum of shares to be repurchased in 2019 to satisfy such exercise will be 398,000 shares (€9.7 million in total repurchase cost).
36. RELATED PARTY DISCLOSURES
For information on the shareholders of the Company, we refer to note 1.
SUBSIDIARIES
Interests in subsidiaries are set out in note 40.
KEY MANAGEMENT PERSONNEL COMPENSATION
(in € thousands) 2018 2017
Short term employee benefits 3,604 2,672
Post-employment benefits 96 95
Share-based payments - 4,839
Total 3,700 7,606
Key management personnel consists of the members of the executive committee.
TRANSACTIONS WITH OTHER RELATED PARTIES
Pursuant to a management agreement, we managed a self-storage facility owned by Public Storage in exchange for a fee of 7.0% of revenues until we acquired the facility effective October 1, 2018. This acquisition was supported by third party valuation reports. For the years ended December 31, 2018 and 2017, we earned management fees of €0.1 million and €0.2 million, respectively, under this management agreement. These management fees are included in other operating revenue on our consolidated statements of profit and loss.

SHURGARD ANNUAL REPORT 2018
132
Additionally, we pay Public Storage a royalty fee equal to 1.0% of our pro rata equity share of revenues in exchange for the rights to use the “Shurgard” trade name. During the years ended December 31, 2018 and 2017, we incurred royalty fees of €2.4 million and €2.3 million, respectively. During the years ended December 31, 2018 and 2017 there were no transactions with New York State Common Retirement Fund.
OUTSTANDING BALANCES ARISING FROM TRANSACTIONS WITH RELATED PARTIES
At December 31, 2017, trade and other payables and deferred revenue include short-term cash advances payable to a European affiliate entity wholly-owned by Public Storage totaling €67,000. At December 31, 2018 and 2017, trade and other payables and deferred revenue include short-term cash advances payable to Public Storage totaling €624,000 and €595,000, respectively, comprised primarily of royalty fees and expenses incurred during each of the three months ended December 31, 2018 and 2017. We also refer to Note 28 in respect of the non-controlling interest held by two main shareholders in certain subsidiaries in Germany.
37. FINANCIAL RISK MANAGEMENT OBJECTIVES AND POLICIES
This note explains the Company’s exposure to financial risks and how these risks could affect the Company’s future financial performance. Current year profit or loss financial information has been included where relevant to add further context. The Company has tenant and other receivables, trade and other payables, deferred revenue and cash and cash equivalents that arise directly from its operations. The Company’s principal financial liabilities consist of loans and borrowings. The main purpose of the Company’s loans and borrowings is to finance the acquisition and development of the Company’s property portfolio. The Company is exposed to market risk (foreign exchange risk), credit risk and liquidity risk. The Company’s risk management is carried out by senior management, under policies approved by the Board of Directors. The Board of Directors provides written principles for overall risk management, as well as policies covering specific areas, such as foreign exchange risk, real estate risk and credit risk, the use of derivative and non-derivative financial instruments and investment of excess liquidity. The Board of Directors reviews and agrees policies for managing each of these risks which are summarized below. The Company is currently not exposed to significant interest rate risk, as it does not have any long-term debt with variable interest rates.
FOREIGN EXCHANGE RISK
We publish our financial statements in euros, however, we record revenue, expenses, assets and liabilities in a number of different currencies other than the euro, more specifically, the UK Pound Sterling (GBP), the Swedish Krona (SEK) and the Danish Krone (DKK). Assets and liabilities denominated in local currencies are translated into euros at exchange rates prevailing at the balance sheet date and revenues and expenses are translated at average exchange rates over the relevant period. Consequently, variations in the exchange rate of the euro versus

SHURGARD ANNUAL REPORT 2018
133
these other currencies will affect the amount of these items in our consolidated financial statements, even if their value remains unchanged in their original currency. We implement policies to protect against exchange rate risk only when required to do so by covenants contained in our debt agreements. These translations have resulted in the past and could result in the future in changes to our results of operations, balance sheet and cash flows from period to period. Because our customer base in the U.K. is mainly local, we believe the consequence of the contemplated Brexit would be limited to the effect of a possible significant depreciation of the GBP versus the euro which would result in a decrease in net profit realized by our U.K. operations. A breakdown of the foreign-exchange related amounts recognized in profit or loss and comprehensive income can be found in note 10 and in the consolidated statements of equity, respectively. The main statement of financial position items exposed to foreign exchange risk are cash and cash equivalents, trade and other receivables, assets held for sale, other current and non-current assets, trade and other payables and deferred revenue, finance lease obligations and other non-current liabilities. As of December 31, 2018 and 2017, the net assets (liabilities) exposure on our consolidated statement of financial position is as follows:
(in € thousands) EUR GBP SEK DKK Total
As of December 31, 2018 202,992 (7,882) (4,922) (1,092) 189,096
As of December 31, 2017 (22,319) (5,923) (5,311) (976) (34,529)
The following table presents the sensitivity analysis of the year end statement of financial position balances in EUR in case the euro would weaken by 10% versus the GBP, SEK and DKK, respectively.
(in € thousands) Dec. 31, 2018 Dec. 31, 2017
GBP denominated
Changes in carrying amount of monetary assets and liabilities1 788 592
SEK denominated
Changes in carrying amount of monetary assets and liabilities1 492 531
DKK denominated
Changes in carrying amount of monetary assets and liabilities1 109 98 1 These are increases in net liabilities.
The table below shows the sensitivity of profit or loss after tax to changes in the GBP/EUR, SEK/EUR and DKK/EUR exchange rates:
IMPACT ON PROFIT AFTER TAX
(in € thousands) 2018 2017
GBP/EUR exchange rate – increase 10% 814 2,591
SEK/EUR exchange rate – increase 10% 1,801 3,989
DKK/EUR exchange rate – increase 10% 1,310 917
Positive amounts represent an increase in profit after tax.

SHURGARD ANNUAL REPORT 2018
134
The table below show the sensitivity of adjusted EPRA earnings to changes in the GBP/EUR, SEK/EUR and DKK/EUR exchange rates: IMPACT ON ADJUSTED EPRA EARNINGS
(in € thousands) 2018 2017
GBP/EUR exchange rate – increase 10% 1,340 193
SEK/EUR exchange rate – increase 10% 2,060 1,789
DKK/EUR exchange rate – increase 10% 715 483
Positive amounts represent an increase in adjusted EPRA earnings. IMPACT ON EQUITY
(in € thousands) Dec. 31, 2018 Dec. 31, 2017
GBP/EUR exchange rate – increase 10% 42,528 32,903
SEK/EUR exchange rate – increase 10% 39,852 35,466
DKK/EUR exchange rate – increase 10% 12,419 11,142
Positive amounts represent an increase in equity.
CREDIT RISK
Credit risk is the risk that a counterparty will not meet its obligations under a financial instrument or customer contract, leading to a financial loss. The Company is exposed to credit risks from both its leasing activities (i.e. tenant receivables) and financing activities, which include cash equivalents with banks and financial institutions. Credit risk from balances with banks and financial institutions is managed by the Company’s senior management in accordance with the Company’s policy. Investments of surplus funds are made only with approved counterparties with a minimum credit rating of A. The Company’s maximum exposure to credit risk for the balances with banks and financial institutions at December 31, 2018 is the carrying value of the Cash and cash equivalents. Credit risk is managed by requiring tenants to pay rentals in advance. The maximum exposure to credit risk at the reporting date is the carrying value of each class of financial asset. There are no significant concentrations of credit risk, whether through exposure to individual customers or regions. Outstanding tenants’ receivables are regularly monitored. An impairment analysis is performed at each reporting date on an individual basis for all tenants. Individual receivables which are known to be uncollectible are written off by reducing the carrying amount directly. The other receivables are assessed collectively to determine whether there is objective evidence that an impairment has been incurred but not yet identified. For these receivables the estimated impairment losses are recognized in a separate provision for impairment.
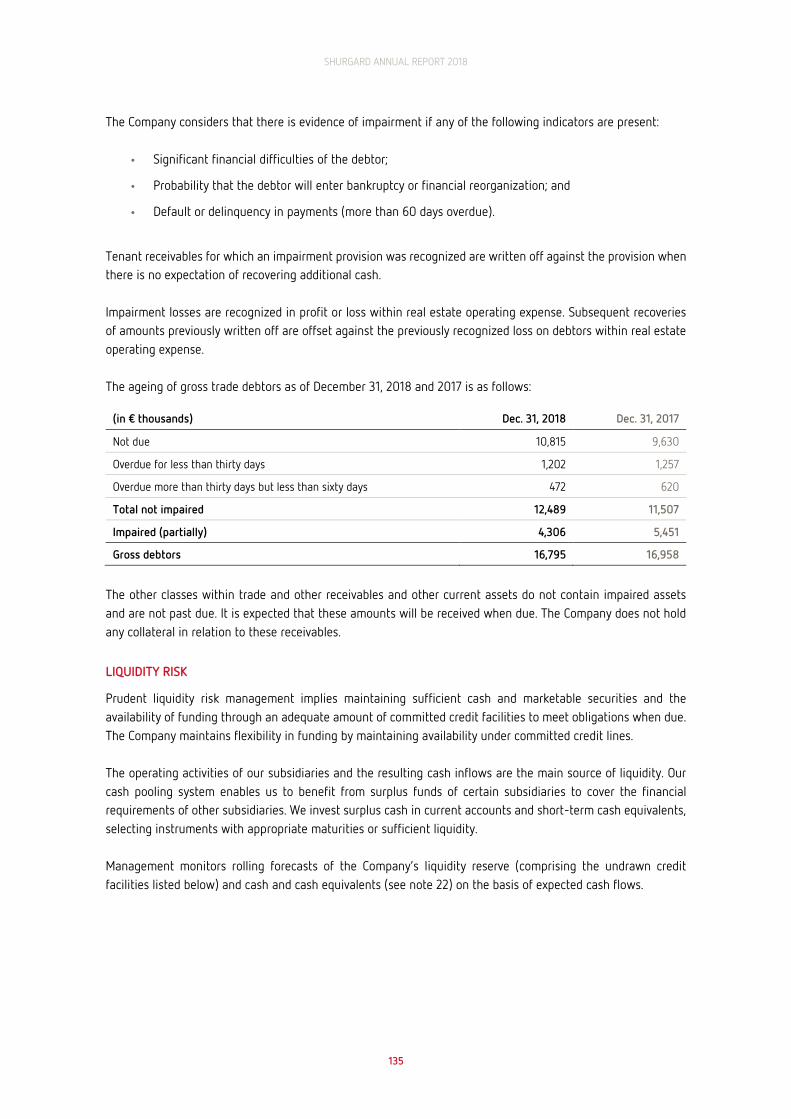
SHURGARD ANNUAL REPORT 2018
135
The Company considers that there is evidence of impairment if any of the following indicators are present:
∙ Significant financial difficulties of the debtor;
∙ Probability that the debtor will enter bankruptcy or financial reorganization; and
∙ Default or delinquency in payments (more than 60 days overdue).
Tenant receivables for which an impairment provision was recognized are written off against the provision when there is no expectation of recovering additional cash. Impairment losses are recognized in profit or loss within real estate operating expense. Subsequent recoveries of amounts previously written off are offset against the previously recognized loss on debtors within real estate operating expense. The ageing of gross trade debtors as of December 31, 2018 and 2017 is as follows:
(in € thousands) Dec. 31, 2018 Dec. 31, 2017
Not due 10,815 9,630
Overdue for less than thirty days 1,202 1,257
Overdue more than thirty days but less than sixty days 472 620
Total not impaired 12,489 11,507
Impaired (partially) 4,306 5,451
Gross debtors 16,795 16,958
The other classes within trade and other receivables and other current assets do not contain impaired assets and are not past due. It is expected that these amounts will be received when due. The Company does not hold any collateral in relation to these receivables.
LIQUIDITY RISK
Prudent liquidity risk management implies maintaining sufficient cash and marketable securities and the availability of funding through an adequate amount of committed credit facilities to meet obligations when due. The Company maintains flexibility in funding by maintaining availability under committed credit lines. The operating activities of our subsidiaries and the resulting cash inflows are the main source of liquidity. Our cash pooling system enables us to benefit from surplus funds of certain subsidiaries to cover the financial requirements of other subsidiaries. We invest surplus cash in current accounts and short-term cash equivalents, selecting instruments with appropriate maturities or sufficient liquidity. Management monitors rolling forecasts of the Company’s liquidity reserve (comprising the undrawn credit facilities listed below) and cash and cash equivalents (see note 22) on the basis of expected cash flows.

SHURGARD ANNUAL REPORT 2018
136
The Company has access to the following undrawn borrowing facilities at the end of the reporting period:
(in € thousands) Dec. 31, 2018 Dec. 31, 2017
Expiring within one year (floating rate) - -
Expiring beyond one year (floating rate) 250,000 125,000
Total 250,000 125,000
The tables below analyze the Company’s financial liabilities based on their contractual maturities. The amounts disclosed in the table are the contractual undiscounted cash flows (including interest payments). Balances due within twelve months equal their carrying balances as the impact of discounting is not material. CONTRACTUAL MATURITIES OF FINANCIAL LIABILITIES AT DECEMBER 31, 2018
(in € thousands) Less than one
year Between 1 and
5 years Over 5 years
Total contractual cash flows
Interest-bearing loans and borrowings 17,657 164,051 538,179 719,887
Finance lease obligations 1,067 4,890 18,628 24,585
Other non-current liabilities 118 162 - 280
Trade and other payables 40,493 - - 40,493
Total 59,335 169,103 556,807 785,245
CONTRACTUAL MATURITIES OF FINANCIAL LIABILITIES AT DECEMBER 31, 2017
(in € thousands) Less than one
year Between 1 and
5 years Over 5 years
Total contractual cash flows
Interest-bearing loans and borrowings 17,613 165,486 551,887 734,986
Finance lease obligations 717 3,699 25,581 29,997
Other non-current liabilities 275 325 - 600
Trade and other payables 41,263 - - 41,263
Total 59,868 169,510 577,468 806,846
FAIR VALUES
Management has assessed that the fair values of cash and cash equivalents, trade and other receivables, trade and other payables approximate their carrying amounts largely due to the short-term maturities of these instruments. The effect of fair value measurement of the finance lease obligations is not material.

SHURGARD ANNUAL REPORT 2018
137
Set out below is a comparison of the carrying amounts and fair value of the Company’s guaranteed notes, which have a fixed interest rate:
(in € thousands) Dec. 31, 2018 Dec. 31, 2017
Carrying value 597,709 597,347
Fair values 628,625 644,602
The following methods and assumptions were used to estimate the fair values:
∙ The fair values of our senior guaranteed notes (level 3) consists of the discounted value of principal amounts and any future interest payments.
∙ The discount rates used take into account the various maturities of the notes issued and are based on risk free interest rates plus spreads that are in line with market spreads for private placements as of the respective reporting dates.
38. CAPITAL MANAGEMENT
The Company’s executive committee reviews the capital structure on an ongoing basis. The primary objective of the Company’s capital management is to ensure that it complies with its covenants and to maintain a strong loan-to-value ratio. The Company reviews each reporting period the appropriateness of the loan-to-value ratio. The Company is currently satisfied with its current loan-to-value ratio and the applicable covenants. For all periods disclosed, we are in compliance with the covenants. The table below provides an overview of the evolution of the loan-to-value ratio as of December 31, 2018 and 2017.
(in € thousands) Dec. 31, 2018 Dec. 31, 2017
Net financial debt 355,202 582,905
Investment property and investment property under construction 2,559,319 2,300,692
Loan-to-value ratio 13.9% 25,34%
Net financial debt is defined as long-term and short-term interest-bearing loans and borrowings, including finance lease obligations and excluding debt issuance costs less cash and cash equivalents.

SHURGARD ANNUAL REPORT 2018
138
39. CONTINGENCIES AND COMMITMENTS
INSURANCE AND LOSS EXPOSURE
We have historically carried comprehensive insurance, including property/business interruption, general liability and workers compensation, through recognized insurance carriers, subject to customary levels of deductibles. Our insurance programs also insure affiliates of the Company. Our estimated maximum annual exposure for losses that are below the deductibles set forth in the third-party insurance contracts, assuming multiple significant events occur, is approximately €0.6 million. In addition, if losses exhaust the third-party insurers’ limit of coverage of €25.0 million for property / business interruption coverage and €5.0 million for general liability (with excess coverage up to USD 102.0 million, or approximately €89.1 million at the December 31, 2018 exchange rate, under the PS general liability program), our exposure could be greater. Our tenant insurance program provides insurance to certificate holders against claims for property losses due to specific named perils to goods stored by tenants at our self-storage facilities for individual limits up to a maximum of €20,000 per unit. We have third-party insurance coverage for our tenant insurance program. As of December 31, 2018, there were approximately 125,500 certificate holders participating in this program in Europe representing aggregate coverage of approximately €471.7 million. We rely on a third-party insurance company to provide the insurance. For the year ended December 31, 2018, revenues earned under our tenant insurance program accounted for approximately 10.2% of our total revenues (10.0% for the year ended December 31, 2017). We have historically carried property, earthquake, general liability, employee medical insurance and workers compensation coverage through internationally recognized insurance carriers, subject to deductibles. Our deductible for general liability is €2,500 per occurrence. Our deductible for property losses is €2,500 per occurrence. Insurance carriers’ aggregate limits on these policies of €20.0 million for property losses per occurrence (annual aggregate) USD 102.0 million for general liability losses (annual aggregate) are higher than estimates of maximum probable losses that could occur from individual catastrophic events determined in recent engineering and actuarial studies; however, in case of multiple catastrophic events, these limits could be exceeded.
CAPITAL EXPENDITURE COMMITMENTS
As of December 31, 2018, we had €9.3 million of outstanding capital expenditure commitments under contract in regard to certain self-storage facilities under construction.
CONTINGENT LOSSES
We are a party to various legal proceedings and subject to various claims and complaints; however, we believe that the likelihood of these contingencies resulting in a material loss to the Company, either individually or in the aggregate, is remote.
PARENTAL GUARANTEE
The full and prompt performance and observance by Shurgard Luxembourg Sàrl of all its obligations under the 2014 and 2015 note purchase agreements and the revolving syndicated loan facility agreement with BNP Paribas Fortis bank as agent is unconditionally guaranteed by Shurgard Self Storage as Guarantor pursuant to the terms and conditions provided for under each of these agreements.

SHURGARD ANNUAL REPORT 2018
139
40. LIST OF CONSOLIDATED ENTITIES
1 Holding and/or financing company with no operating activities. 2 On September 26, 2018, this entity changed its denomination from Shurgard Self Storage Europe Sàrl to Shurgard Self Storage and transformed its legal form
into a Luxembourg public limited company (société anonyme). 3 This entity has been merged with Shurgard Nederland B.V. in 2018. 4 These entities have been acquired in 2018.
41. EVENTS AFTER THE REPORTING PERIOD
We have evaluated subsequent events through February 25, 2019, which is the date the financial statements were available for issuance. There were no events requiring recognition or disclosure in the financial statements.
As of December 31, 2018 As of December 31, 2017
Country of incorporation
Consoli-dated
% Ownership
Consoli-dated
% Ownership
Shurgard Self Storage S.A.1,2 Luxembourg/
Guernsey Yes 100 Yes 100
Shurgard Luxembourg Sàrl Luxembourg Yes 100 Yes 100
Shurgard Holding Luxembourg Sàrl1 Luxembourg Yes 100 Yes 100
Shurgard Belgium Cva Belgium Yes 100 Yes 100
Shurgard Europe Vof Belgium Yes 100 Yes 100
Second Shurgard Belgium BVBA Belgium Yes 100 Yes 100
Shurgard France Sasu France Yes 100 Yes 100
Shurgard Nederland B.V. The Netherlands Yes 100 Yes 100
Shurgard Nederland CB B.V.3 The Netherlands No - Yes 100
Shurgard Germany GmbH Germany Yes 100 Yes 100
First Shurgard Deutschland GmbH Germany Yes 94.8 Yes 94.8
Second Shurgard Deutschland GmbH Germany Yes 94.8 Yes 94.8
Shurgard Denmark ApS Denmark Yes 100 Yes 100
Shurgard Real Estate ApS Denmark Yes 100 Yes 100
Shurgard U.K. Ltd UK Yes 100 Yes 100
First Shurgard U.K. Ltd UK Yes 100 Yes 100
Second Shurgard U.K. Ltd UK Yes 100 Yes 100
Second Shurgard U.K. Camberley Ltd UK Yes 100 Yes 100
Shurgard U.K. West-London Ltd4 UK Yes 100 No -
Shurgard Sweden AB Sweden Yes 100 Yes 100
Shurgard Storage Centers Sweden KB Sweden Yes 100 Yes 100
Shurgard Sweden Årstaberg KB Sweden Yes 100 Yes 100
First Shurgard Sweden Invest KB Sweden Yes 100 Yes 100
Second Shurgard Sweden Invest KB Sweden Yes 100 Yes 100
Shurgard Sweden Stockholm Invest AB4 Sweden Yes 100 No -
Shurgard Sweden Örebro AB4 Sweden Yes 100 No -
Shurgard Sweden Västerås AB4 Sweden Yes 100 No -
Shurgard Sweden Linköping AB4 Sweden Yes 100 No -
Shurgard Sweden Norrköping AB4 Sweden Yes 100 No -

SHURGARD ANNUAL REPORT 2018
140
AUDITOR’S REPORT


ANNUAL ACCOUNTS OF SHURGARD SELF STORAGE S.A. AND AUDITOR’S REPORT

1
Annual accounts as at 31 December 2018
Shurgard Self Storage Société anonyme
6C rue Gabriel Lippmann L – 5365 Munsbach R.C.S. Luxembourg B218 238 Share capital of EUR 63,470,670

2
Table of contents Page(s) Balance sheet 3 Profit and loss account 4 Notes to the annual accounts 5 - 14

Shurgard Self Storage S.A.
3
ASSETS Reference(s) As of
31 December 2018 As of
31 December 2017
B. Formation expenses 1107 Note 3 107 18,914,859 108 -
C. Fixed assets 1109 109 1,101,517,462 110 805,566,608
I. Intangible assets 1111 Note 4 111 5,968,920 112 7,496,561
III. Financial assets 1135 Note 5 135 1,095,548,542 136 798,070,047
D. Current assets 1151 151 886,173 152 1,081,604
II. Debtors 1163 163 63,122 164 556,330
a) becoming due and payable within one year 1203 Note 6 203 63,122 204 556,330
IV. Cash at bank and in hand 1197 197 823,051 198 525,274
TOTAL (ASSETS) 201 1,121,318,494 202 806,648,212
CAPITAL, RESERVES AND LIABILITIES Reference(s) As of
31 December 2018 As of
31 December 2017
A. Capital and reserves 1301 301 1,112,882,399 302 800,430,284
I. Subscribed capital 1303 Note 7 303 63,470,670 304 800,628,936
II. Share premium account 1305 Note 7 305 557,158,266 306 -
IV. Reserves 1309 Note 8 309 500,000,000 310 -
2) Reserve for own shares 1313 943,795 -
4) Other reserves, including the fair value reserve 1429 499,056,205 -
a) Other available reserves 1431 499,056,205 -
V. Profit or loss brought forward 1319 Note 9 319 (198,650) 320 -
VI. Profit or loss for the financial year 1321 Note 9 321 (7,547,887) 322 (198,650)
B. Provisions 1331 Note 10 331 5,743,432 332 5,448,566
C. Creditors 1435 435 2,692,663 436 769,362
a) becoming due and payable within one year 1453 Note 11 453 2,692,663 454 769,362
TOTAL (CAPITAL, RESERVES AND LIABILITIES) 405 1,121,318,494 406 806,648,212 The notes in the annex form an integral part of the accounts

Shurgard Self Storage S.A.
4
PROFIT AND LOSS ACCOUNT
Reference(s) 1 January through 31 December 2018
Four months ended 31 December 2017
1. to 5. Gross profit or loss 1701 Note 12 701 266,375 702 789,319
6. Staff costs 1605 605 5,254,442 606 (789,319)
a) Wages and salaries 1607 Note 13 607 (191,242) 608 -
b) Social security costs 1609 609 (2,882) 610 -
ii) other social security costs 1655 Note 13 655 (2,882) 656 -
c) Other staff costs 1613 Note 14 613 5,448,566 614 (789,319)
7. Value adjustments 1657 657 (2,350,026) 658 (141,641)
a) in respect of formation expenses and of tangible and intangible fixed assets 1659 Note 3,4 659 (2,350,026) 660 (141,641)
8. Other operating expenses 1621 Note 15 621 (4,591,359) 622 (88,945)
10. Income from other investments and loans forming part of the fixed assets 1721 721 28,491 722 53,646
a) derived from affiliated undertakings 1723 Note16 723 - 724 53,646
b) other income not included under a) 1725 Note16 725 28,491 726 -
13. Value adjustments in respect of financial assets and of investments held as current assets 1665 Note17 665 - 666 (19,768)
14. Interest payable and similar expenses 1627 627 (6,149,856) 628 (2,187)
a) concerning affiliated undertakings 1629 Note 18 629 (396,745) 630 -
b) other interest and similar expenses 1631 Note 18 631 (5,753,111) 632 (2,187)
15. Tax on profit or loss 1635 Note 19 635 (5,954) 636 245
16. Profit or loss after taxation 1667 667 (7,547,887) 668 (198,650)
18. Profit or loss for the financial year 1669 669 (7,547,887) 670 (198,650)
The notes in the annex form an integral part of the accounts

Shurgard Self Storage S.A. Notes to the annual accounts as at 31 December 2018 (Continued)
5
Note 1 – General information Shurgard Self Storage (hereafter the “Company” or “SSS”) was incorporated in March 2008 and organized under the laws of Guernsey. The registered office of the company was located at 1st & 2nd Floors, Elizabeth House, Les Ruettes Brayes, St Peter Port, Guernsey, GY1 1EW Guernsey. Its shareholders are Shurgard European Holdings LLC (“SEH LLC”), a limited liability company incorporated in 2008 in Delaware, United States, which owns 99.99% (63,813,180 shares) of the interest in the Company and Shurgard Guernsey Investment LLC, which owns the remaining 0.01% interest (one share) in the Company. The New York Common State Retirement Fund (“NYCRF”) and Public Storage (“PS”) own 51% and 49%, respectively, of the interest in SEH LLC. SEH LLC owns 100% of Shurgard Guernsey Investment LLC. The Company’s main activities include funding, guarantees and/or securities delivery, as well as any other form of financing to the affiliated undertakings forming part of the group of the Company and the acquisition and management of participations. It can borrow and lend under any forms, even on a subordinated basis, and proceed to bond issue or subscriptions. The Company delivers financial or investment services of any kind to the affiliated undertakings of the group. As a rule, it can take all control or supervision measures and proceed to any financial, estate or real estate, commercial or industrial transaction that will be useful for the achievement and the development of its corporate objectives. Further to the transfer without dissolution on 28 September 2017 from Guernsey to the Grand Duchy of Luxembourg of the domicile, registered address and administrative seat of the Company, the latter became a «Société à responsabilité limitée» (Sàrl) for an unlimited period organized and governed by the laws of the Grand Duchy of Luxembourg (the “Migration”). After the Migration, the registered office of the company was established in L-5365 Munsbach, 6C rue Gabriel Lippmann, Grand Duchy of Luxembourg. The Company’s result for the year ended 31 December 2017 is for the four month period commencing 1 September and ending 31 December 2017. On 26 September 2018, the Company changed its denomination from Shurgard Self Storage Europe Sàrl to Shurgard Self Storage and transformed its legal form into a Luxembourg public limited company (société anonyme). In 2018 the Company completed its initial public offering (IPO) and is listed on Euronext Brussels since 15 October 2018.
After the IPO, our shareholders are Shurgard European Holdings LLC (“SEH LLC”), a limited liability company incorporated in 2008 in Delaware, United States (“U.S.”), which owns 40.66% of the interest in the Company, Public Storage (“PS”) , which owns 31.09% interest in the Company and the Public (28.11% of the interest in the Company). The New York Common Retirement Fund (“NYCRF”) and Public Storage (“PS”) through its subsidiary SSC LLC own 90% and 10%, respectively, of the interest in SEH LLC.
The Company prepares audited consolidated financial statements in accordance with International Financial Reporting Standards (“IFRS”). These consolidated financial statements are filed at the Luxemburg Chambre de Commerce (RCS).
Note 2 - Summary of significant accounting policies 2.1 Basis of preparation and going concern The annual accounts have been prepared in accordance with the Law of 19 December 2002, as subsequently amended. These annual accounts have been prepared on a going concern basis. 2.2 Significant accounting policies The main valuation rules applied by the Company are the following: 2.2.1. Formation expenses Formation expense are carried at purchase or acquisition price including the expenses incidental thereto, less accumulated amortization. The Company amortizes its formation expenses on a straight-line basis over the five years estimated useful life of the assets. 2.2.2. Goodwill Goodwill is carried at purchase or acquisition price including the expenses incidental thereto, less accumulated amortization. The Company amortizes its goodwill on a straight-line basis over the five years estimated useful life of the assets.

Shurgard Self Storage S.A. Notes to the annual accounts as at 31 December 2018 (Continued)
6
Note 2 - Summary of significant accounting policies (continued) 2.2.3. Financial assets Shares in affiliated undertakings are valued at acquisition cost including the expenses incidental thereto. In case of a durable diminution in value according to the opinion of the Board of Managers, value adjustments are made, so that they are valued at the lower figure to be attributed to them at the balance sheet date. These value adjustments are not continued if the reasons for which they were made have ceased to apply. Loans to affiliated undertakings are valued at nominal value. At the end of each financial year, a value adjustment is made for any durable decrease in value, which is considered to be an impairment in value, on the basis of an evaluation of each individual loan. These value adjustments are not continued if the reasons for which they were made have ceased to apply. 2.2.4. Debtors Debtors are valued at their nominal value. They are subject to value adjustments where their recovery is partially or fully compromised. These value adjustments are not continued if the reasons for which they were made have ceased to apply. 2.2.5. Foreign currency translation The Company maintains its accounting records in Euro (“EUR”) and its annual accounts are expressed in that currency. Balances denominated in foreign currencies are translated into EUR as follows:
Assets and liabilities in other currencies are translated into EUR at the rate prevailing at the balance sheet date except for intangible and financial assets which are recorded at the historical exchange rate. Income and expense transactions are recorded at the rate prevailing on the dates of the transactions.
Realized gains and losses and unrealized losses are reflected in the profit and loss account. Unrealized gains are not recognized in the profit and loss account, except for the reversal of previously recognized unrealized losses.
2.2.6. Creditors Creditors are valued at their nominal value. 2.2.7. Provisions Provisions for liabilities and charges are intended to cover losses or debts the nature of which is clearly defined and which, at the date of the balance sheet, are either likely or certain to be incurred but uncertain as to their amount or as to the date on which they will arise.
Provisions may also be created in order to cover charges which have their origin in the financial year under review or in a previous financial year, the nature of which is clearly defined and which, at the date of the balance sheet, are either likely to be incurred or certain to be incurred but uncertain as to their amount or as to the date on which they will arise.
Provisions are assessed at year end. Provisions recorded in the previous years are reassessed each year and reversed if the reasons for which they were made have ceased to apply.
2.2.8. Prepayments This caption includes expenditures incurred during the financial year but relating to a subsequent financial year and capitalized debt financing costs which are amortized according to the straight-line method until the maturity of the debt. 2.2.9. Deferred income This caption includes income received during the financial year but relating to a subsequent financial year. 2.2.10. Value adjustments Value adjustments are deducted directly from the related asset.
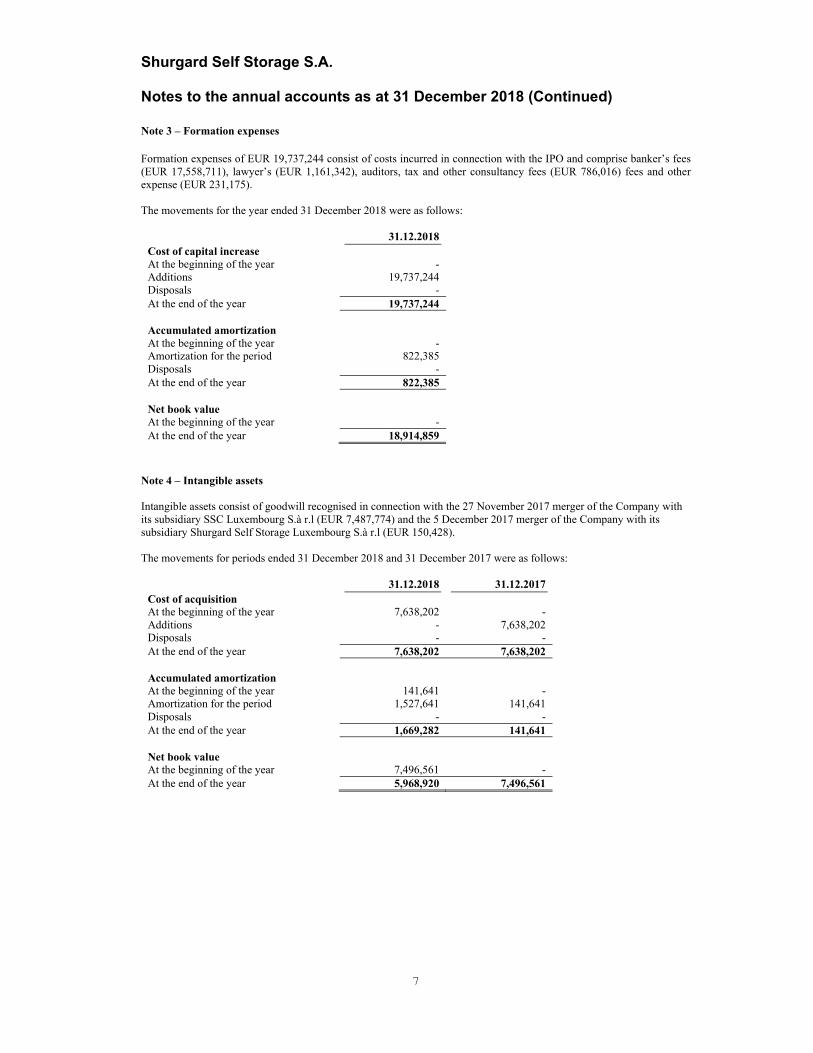
Shurgard Self Storage S.A. Notes to the annual accounts as at 31 December 2018 (Continued)
7
Note 3 – Formation expenses Formation expenses of EUR 19,737,244 consist of costs incurred in connection with the IPO and comprise banker’s fees (EUR 17,558,711), lawyer’s (EUR 1,161,342), auditors, tax and other consultancy fees (EUR 786,016) fees and other expense (EUR 231,175). The movements for the year ended 31 December 2018 were as follows:
31.12.2018 Cost of capital increase At the beginning of the year - Additions 19,737,244 Disposals - At the end of the year 19,737,244 Accumulated amortization At the beginning of the year -Amortization for the period 822,385 Disposals - At the end of the year 822,385 Net book value At the beginning of the year - At the end of the year 18,914,859
Note 4 – Intangible assets Intangible assets consist of goodwill recognised in connection with the 27 November 2017 merger of the Company with its subsidiary SSC Luxembourg S.à r.l (EUR 7,487,774) and the 5 December 2017 merger of the Company with its subsidiary Shurgard Self Storage Luxembourg S.à r.l (EUR 150,428). The movements for periods ended 31 December 2018 and 31 December 2017 were as follows:
31.12.2018 31.12.2017 Cost of acquisition At the beginning of the year 7,638,202 - Additions - 7,638,202Disposals - - At the end of the year 7,638,202 7,638,202 Accumulated amortization At the beginning of the year 141,641 -Amortization for the period 1,527,641 141,641 Disposals - - At the end of the year 1,669,282 141,641 Net book value At the beginning of the year 7,496,561 - At the end of the year 5,968,920 7,496,561

Shurgard Self Storage S.A. Notes to the annual accounts as at 31 December 2018 (Continued)
8
Note 5 - Financial assets
Shares in affiliated undertakings
Details of the shares in affiliated undertakings held and movements in 2018 are as follows:
Shares Country
Portion of capital held
as at 31.12.2018
Net book value at 31.12.2017
Increase (decrease) during the period
year Net book value at 31.12.2018
Share-holders’ equity as at 31.12.2018
Loss for the year 2018
Shurgard Self Storage S.A. treasury shares (*) Luxembourg n/a 965,300 (21,505) 943,795 n/a n/a Shurgard Luxembourg S.à r.l. Luxembourg 100% 797,104,747 297,500,000 1,094,604,747 1,060,256,823 (2,157,679) 798,070,047 297,478,495 1,095,548,542
(*) In connection with the exercise of 2,729 share options that were granted in 2016, the company sold to a participant to the 2016 share based compensation plan an equal amount of treasury shares for EUR 49,995 at a gain of EUR 28,491. As of 31 December 2018 and 31 December 2017 SSS holds 119,771 and 122,500 treasury shares, respectively. (**) Through various transactions, the Company lent to Shurgard Luxembourg S.à r.l. EUR 297,500,000 IPO proceeds. On 18 December 2018, the Company contributed in kind the EUR 297,500,000 receivable to Shurgard Luxembourg S.à r.l.’s equity reserve account in exchange for an increase of the participation in the latter. The Management assessed the financial position and performance of the affiliated undertakings owned and as a result thereof is of the opinion that no permanent impairment has been triggered as of 31 December 2018. The Board of Managers is of the opinion that no value adjustment for permanent impairment in value is required as of 31 December 2018.

Shurgard Self Storage S.A. Notes to the annual accounts as at 31 December 2018 (Continued)
9
Note 6 – Debtors
a) Debtors becoming due and payable within one year consist of the following receivables from affiliated undertakings:
31 December 2018 31 December 2017
Shurgard Belgium CVA - 55,175
Shurgard Sweden AB - 20,953
Shurgard U.K. Ltd - 91,756
Shurgard France SAS 26,926 7,803
Shurgard Nederland BV - 27,815
Shurgard Europe VOF - 352,828
Shurgard Luxembourg Sàrl 29,946 -
First Shurgard Deutschland GmbH 6,250 -
63,122 556,330
Through various transactions, the Company transferred to Shurgard Luxembourg S.à r.l. EUR 297,500,000 excess cash, representing for the Company a receivable from the latter. On 18 December 2018, the Company contributed in kind its EUR 297,500,000 receivable from Shurgard Luxembourg S.à r.l. to the equity reserve account of Shurgard Luxembourg S.à r.l. (account 115, “apport en capitaux propres non rémunéré par des titres”) in exchange for an increased interest in Shurgard Luxembourg S.à r.l. of the same amount. Note 7 – Subscribed Capital and Share Premium As of 31 December 2017, the share capital of the Company is set at eight hundred million six hundred twenty eight thousand nine hundred thirty-six euro (EUR 800,628,936) divided into sixty-three million nine hundred thirty-five thousand six hundred eighty-one (63,935,681) ordinary shares without nominal value, all of which are fully paid up, including one hundred twenty-two thousand five hundred (122,500) own shares (see note 5).
On 6 July 2018 the share capital of the Company was decreased by an amount of seven hundred fifty-five million euro (EUR 755,000,000) so as to reduce the share capital of the Company from its present amount of eight hundred million six hundred twenty-eight thousand nine hundred thirty-six euro (EUR 800,628,936) to forty-five million six hundred twenty-eight thousand nine hundred thirty-six euro (EUR 45,628,936), without cancellation of shares, and to allocate the capital reduction to a distributable reserve account of the Company.
On 15 October 2018, in connection with the IPO, 25,000,000 ordinary shares have been issued with a price per share of EUR 23.00, or EUR 575,000,000 in total. Per the 16 October 2018 notary deed before notary C. Wersandt, of the EUR 575,000,000 IPO proceeds, EUR 17,841,734 has been attributed to issued share capital and EUR 557,158,266 to share premium.
Note 8 - Reserves As of 31 December 2018, the Company’s reserves of EUR 500,000,000 consist of (i) EUR 943,795 reserves for own shares and (ii) EUR 499,056,205 distributable (other) reserves. On 10 July 2018, the Company decided to decrease its seven hundred fifty-five million euro (EUR 755,000,000) distributable reserves (note 7) to five hundred million euro (EUR 500,000,000) through the interim distribution of two hundred and fifty-five million euro (EUR 255,000,000) to its shareholders, which has been executed on 13 July 2018. During the year ended 31 December 2018, the distributable reserves have been further reduced by EUR 943,795 to establish an unavailable reserve for owns shares of the same amount. Note 9 – Profit or loss for the financial year and brought forward The company realised a loss of EUR 7,547,887 during the period 1 January through 31 December 2018 (a loss of EUR 198,650 during the four months ended 31 December 2017).

Shurgard Self Storage S.A. Notes to the annual accounts as at 31 December 2018 (Continued)
10
Note 10 - Provisions Under various share based compensation plans, the Company has issued shares options in 2015, 2016 and 2017, of which 355,000, 44,000 and 265,000 options, respectively, were outstanding as of 30 September 2018. At the IPO date, these awards, previously accounted for as liability (cash-settled) awards have become equity-settled awards, because of the change in settlement terms that as from 15 October 2018 are as follows:
(i) the Company repurchases its own shares (held as treasury shares) on a regulated market, (ii) the option holder exercises his/her vested share options which means he/she purchases from SSS shares
for the exercise/strike price and (iii) the option holder resells the shares he/she purchased from SSS on the market, and the difference between
(iii) and (ii) represents the option holder‘s remuneration. (iv) as an alternative to (iii), the option holder also has the possibility to keep the newly acquired shares in
portfolio on a securities account. The Company offers the possibility of a “cash-free settlement” under which the option holder who exercises his options can concomitantly mandate a broker to immediately sell the shares on his behalf and to remit the sales proceeds (i) to the Company up to the amount of the exercise price due by the option holder to the Company and (ii) to the option holder for the rest. This mechanism allows the option holder to avoid a pre-financing of the exercise price but is not legally and economically different than the base case described above. The Board of Managers of the Company granted on 16 October 2018 905,000 share options under the 2018 share option plan and also determined the exercise price of the share options granted to be €23.00, which was the opening share price upon the Company’s listing on Euronext on 15 October 2018. These titles are considered as equity awards, have no performance conditions, and have a ten-year term and a three year cliff vesting. As of 31 December 2017, we had a provision for share based compensation expense of EUR 5,448,566 (see note 14). On 13 December 2018, a participant to the 2016 share option plan exercised 2,729 awards (notes 5 and 16). As of 31 December 2018, the following equity awards are outstanding under the various share option plans:
Total options Vested optionsExercise price per
optionTotal future exercise
price
Share options granted in 2015 .............. 355,000 255,000 € 8.77 € 3,113,350 Share options granted in 2016 .............. 41,271 22,000 € 18.32 € 756,085 Share options granted in 2017 .............. 265,000 66,250 € 21.51 € 5,700,150 Share options granted in 2018 .............. 905,000 - € 23.00 € 20,815,000 1,566,271 343,250 € 30,384,585
Based on the total number of equity awards outstanding (1,566,271), the number of treasury shares held by the Company (119,771) and the listed closing share price of the Company on Euronext Brussels (EUR 24.25) as of 31 December 2018, the Company recognised a provision for future loss on exercise of share options of EUR 5,743,432 that has been determined as follows: Options
outstanding Per share book value
treasury shares Share priceExercise price
per optionFuture loss on exercise
share options
Share options granted in 2015 (*) ............ 119,771 € 7.88 € 24.25 € 8.77 € - Share options granted in 2015 .................. 235,229 € - € 24.25 € 8.77 € 3,641,345 Share options granted in 2016 .................. 41,271 € - € 24.25 € 18.32 € 244,737 Share options granted in 2017 .................. 265,000 € - € 24.25 € 21.51 € 726,100 Share options granted in 2018 .................. 905,000 € - € 24.25 € 23.00 € 1,131,250 1,566,271 € 5,743,432
(*) For an amount of share options equal to the number of 119,771 treasury shares held by SSS as of 31 December 2018, the Company will realise a profit upon exercise of the vested options.
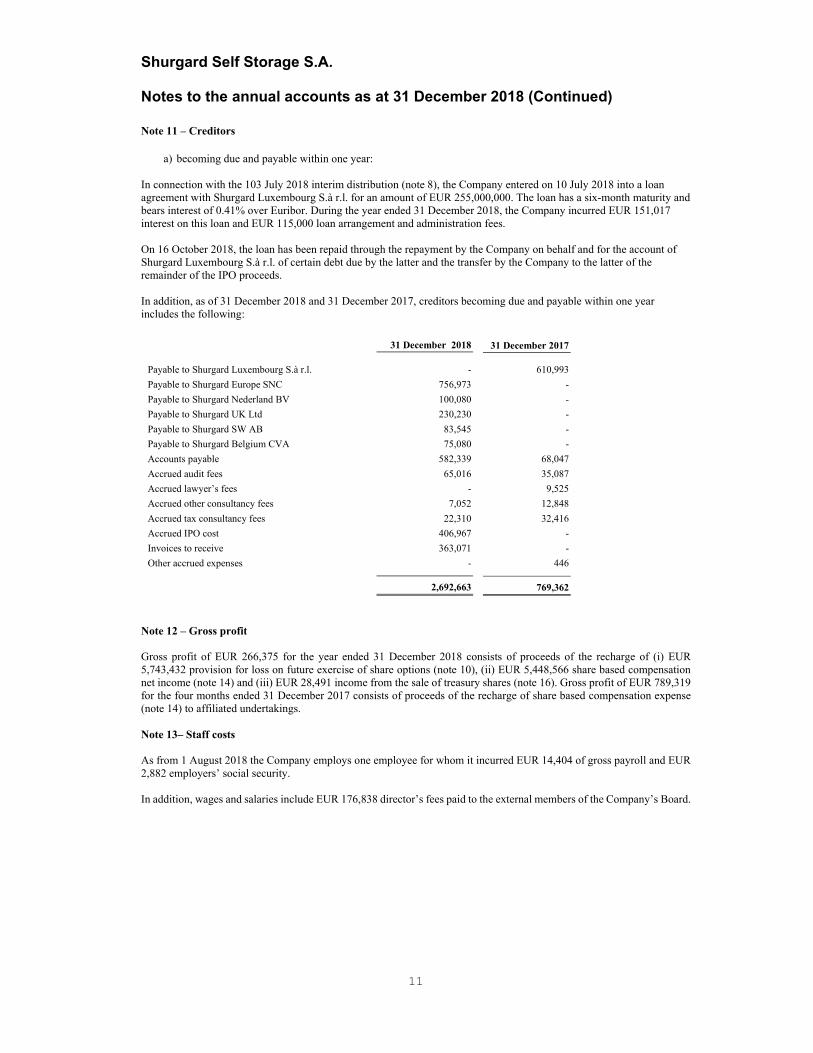
Shurgard Self Storage S.A. Notes to the annual accounts as at 31 December 2018 (Continued)
11
Note 11 – Creditors
a) becoming due and payable within one year: In connection with the 103 July 2018 interim distribution (note 8), the Company entered on 10 July 2018 into a loan agreement with Shurgard Luxembourg S.à r.l. for an amount of EUR 255,000,000. The loan has a six-month maturity and bears interest of 0.41% over Euribor. During the year ended 31 December 2018, the Company incurred EUR 151,017 interest on this loan and EUR 115,000 loan arrangement and administration fees. On 16 October 2018, the loan has been repaid through the repayment by the Company on behalf and for the account of Shurgard Luxembourg S.à r.l. of certain debt due by the latter and the transfer by the Company to the latter of the remainder of the IPO proceeds. In addition, as of 31 December 2018 and 31 December 2017, creditors becoming due and payable within one year includes the following:
31 December 2018 31 December 2017
Payable to Shurgard Luxembourg S.à r.l. - 610,993
Payable to Shurgard Europe SNC 756,973 -
Payable to Shurgard Nederland BV 100,080 -
Payable to Shurgard UK Ltd 230,230 -
Payable to Shurgard SW AB 83,545 -
Payable to Shurgard Belgium CVA 75,080 -
Accounts payable 582,339 68,047
Accrued audit fees 65,016 35,087
Accrued lawyer’s fees - 9,525
Accrued other consultancy fees 7,052 12,848
Accrued tax consultancy fees 22,310 32,416
Accrued IPO cost 406,967 -
Invoices to receive 363,071 -
Other accrued expenses - 446
2,692,663 769,362
Note 12 – Gross profit Gross profit of EUR 266,375 for the year ended 31 December 2018 consists of proceeds of the recharge of (i) EUR 5,743,432 provision for loss on future exercise of share options (note 10), (ii) EUR 5,448,566 share based compensation net income (note 14) and (iii) EUR 28,491 income from the sale of treasury shares (note 16). Gross profit of EUR 789,319 for the four months ended 31 December 2017 consists of proceeds of the recharge of share based compensation expense (note 14) to affiliated undertakings. Note 13– Staff costs As from 1 August 2018 the Company employs one employee for whom it incurred EUR 14,404 of gross payroll and EUR 2,882 employers’ social security. In addition, wages and salaries include EUR 176,838 director’s fees paid to the external members of the Company’s Board.

Shurgard Self Storage S.A. Notes to the annual accounts as at 31 December 2018 (Continued)
12
Note 14– Other staff costs Other staff costs for the period 1 January through 31 December 2017 mainly consist of EUR 785,138 gross share based compensation expense and EUR 4,181 employers’ social security thereon. Under various share-based compensation plans, the Company has granted options in 2015, 2016 and 2017 to purchase the Company’s common shares to employees of the Company’s affiliated undertakings, with the exercise price equal to the fair value of the common shares at the respective grant dates. Options vest ratably over a four year period, and expire ten years after grant date and have no performance conditions. The fair value of the option awards is expensed on a straight-line basis over the option vesting period. The terms of these grants are established by our Board of Managers. Because the Company’s common shares are not traded publicly, the Board of Managers derives the fair value of our common stock based on the estimated fair value of the Company under a going-concern approach. The fair value of the stock options is determined using the Black-Scholes option pricing model. Expected volatility of the Company’s common stock is determined based upon combination of historical volatility and peer group review, as determined from time to time by Management. The risk-free interest rate is based upon the yield of European treasury securities with a remaining term equal to the expected remaining life of the related stock option. We used historical data and trends to estimate future forfeitures as well as the expected life of the awards.
Awards where the employee can, by agreement, force the Company to settle stock option exercises in cash, or where the Company has an established practice to do so, are treated as liabilities. All other options are treated as equity. Equity or liability treatment is established initially upon grant; equity awards can be revised to liabilities if the cash-settlement practices or other circumstances subsequent to the initial determination indicate that the recipient has a constructive cash-settlement option.
Compensation expense for option awards treated as equity is based upon amortization of the grant-date fair value of stock options that are expected to vest. Stock option expense for option awards treated as liabilities is based upon the current estimated fair value, with adjustments to stock option expense for cancellations and changes in fair value.
All our stock options at 31 December 2017 were accounted for as liability awards.
We had a provision for share-based compensation expense totaling EUR 5,448,566 at 31 December 2017 (note 10). During the four months ended 31 December 2017, the Company did not pay any gross compensation cost in connection with the share option plans. The following table summarizes information about stock options outstanding and exercisable at 31 December 2017 under the 2015, 2016 and 2017 plans:
As of 31 December 2017 Options outstanding Options exercisable
Year of grant
Fair value per option at 31
December 2017 Number of
Options Weighted average exercise price (*)
Weighted average
remaining contractual life
Number of Options
Weighted average exercise price (*)
Weighted average
remaining contractual life
2015 € 15.17 355,000 € 12.77 7.3 years 155,000 € 12.77 7.3 years 2016 € 7.57 44,000 € 23.10 8.5 years 11,000 € 23.10 8.5 years 2017 € 6.27 255,000 € 27.02 9.5 years - € 27.02 9.5 years
654,000 € 19.02 8.2 years 166,000 € 13.45 7.3 years
During the four months ended 31 December 2017, no options were exercised or forfeited. During the first quarter of 2018, 10,000 additional options were granted under the 2017 plan.

Shurgard Self Storage S.A. Notes to the annual accounts as at 31 December 2018 (Continued)
13
Note 14– Other staff costs (continued) The following table summarizes information about our share options outstanding at 30 September 2018 (prior to IPO) under the 2015, 2016 and 2017 plans: As of 30 September 2018 Options outstanding Options exercisable
Year of grant
Fair value per option at 31
December 2017 Number of
Options Weighted average exercise price (*)
Weighted average
remaining contractual life
Number of Options
Weighted average exercise price (*)
Weighted average
remaining contractual life
2015 € 16.13 355,000 € 8.77 6.5 years 255,000 € 8.77 6.5 years 2016 € 7.96 44,000 € 18.32 7.8 years 22,000 € 18.32 7.8 years 2017 € 6.47 265,000 € 21.51 8.8 years 66,250 € 21.51 8.8 years
664,000 € 14.49 7.5 years 343,250 € 11.84 7.0 years
(*) On 26 September 2018, the Board of Managers of the Company has approved the reduction of the exercise price of the 2015, 2016 and 2017 options. This decision was implemented in order to compensate the beneficiaries of these plans against the erosion of the Company’s share price due to the 10 July 2018 interim distribution to the Company’s shareholders (€255 million). The reduced exercise prices have been used for the calculation of the 30 September 2018 provision for share-based compensation expense. For the year ended 31 December 2018, other staff income of EUR 5,448,566 consists of the following:
1) The Company incurred EUR 1,401,112 in gross stock option expense and EUR 46,407 in employers’ social security expense during the period 1 January through 30 September 2018. During the nine months ended 30 September 2018, no options were granted, exercised or forfeited, and the Company did not pay any gross compensation cost in connection with the share option plans.
We had a provision for share-based compensation expense totaling EUR 6,896,085 at 30 September 2018.
2) As a result of the IPO, all share option plans have been converted on 15 October 2018 from cash-settled (liability) plans into cash-settled share option plans (note 10). Because the Company was no longer liable for the settlement in cash of the outstanding awards under the 2015, 2016 and 2017 share option plans, the 30 September 2018 provision for share based payment expense of EUR 6,896,085 has been reversed.
Note 15 – Other operating expenses Other operating expenses consist of the following:
1 January through 31 December 2018
1 September through 31 December 2017
Expenses incurred in connection with the IPO (*) 3,362,622 - Centralized support. service charges recharged by affiliated undertakings
581,565 -
Director’s liability insurance 9,686 - Auditor’s fees 80,850 10,454 Other consultancy fees 172,659 22,808 Lawyers’ fees 26,173 36,183 Tax consultancy fees -1,088 19,000 Recruitment fees 7,888 - IS cost 23,316 - Other professional fees - 500 Other expenses 351 - Non-recoverable VAT 126,458 - Travel expenses 40,753 - Public Relations 110,000 - Membership fees 50,126 -
4,591,359 88,945
(*) Expenses incurred in connection with the IPO mainly consist of consultancy fees, and travel and other expenses.

Shurgard Self Storage S.A. Notes to the annual accounts as at 31 December 2018 (Continued)
14
Note 16 – Income from other investments and loans forming part of the fixed assets
a) derived from affiliated undertakings Income from other investments and loans forming part of the fixed assets for the four months ended 31 December 2017 consists of EUR 34,535 and EUR 19,111 interest earned, respectively, on a loan and credit facility agreement the Company entered into with Shurgard C.V.. The loan and the credit facility were terminated on 29 September 2017 through their contribution in kind to Shurgard Self Storage Luxembourg S.à r.l.'s equity reserve account (account 115, “apport en capitaux propres non rémunéré par des titres”) in exchange for additional equity in the latter.
b) Other income not included under a) In connection with the exercise of 2,729 share options that were granted in 2016, the company sold to the option holder an equal amount of treasury shares for EUR 49,995 at a gain of EUR 28,491. Note 17 – Value adjustments in respect of financial assets and investments held as current assets On 27 November 2017 and 5 December 2017, the Company merged through absorption with its subsidiaries SSC Luxembourg S.à r.l. and Shurgard Self Storage Luxembourg S.à r.l., respectively. SSC Luxembourg S.à r.l. and Shurgard Self Storage Luxembourg S.à r.l were both partners of Shurgard CV, a Dutch partnership that holds 100% of the interest in Shurgard Luxembourg S.à r.l. As a consequence of the aforementioned mergers, Shurgard CV has been terminated on 5 December 2017, resulting in a loss on dissolution of EUR 19,768 recognised by the Company in the year ended 31 December 2017. Note 18 – Interest payable and similar expenses
a) concerning affiliated undertakings In connection with the 10 July 2018 interim distribution (note 8), the Company entered on 10 July 2018 into a loan agreement with Shurgard Luxembourg S.à r.l. for an amount of EUR 255,000,000. The loan has a six-month maturity and bears interest of 0.41% over Euribor. Up to the 16 October 2018 repayment date of the loan, the Company incurred EUR 281,745 interest on this loan and EUR 115,000 loan arrangement and administration fees.
b) other interest and similar expenses
1 January through 31 December 2018
1 September through 31 December 2017
Provision for future loss on exercise of share options (note 10) 5,743,432 - Bank charges 5,063 576Bank interest - 1,049 Realized exchange loss GBP 3,987 562 Realized exchange loss USD 629 -
5,753,111 2,187 Note 19 – Tax on profit or loss The Company is subject to the general tax regulations applicable to all commercial companies in Luxembourg.

1
SHURGARD SELF STORAGE SOCIÉTÉ ANONYME
6C RUE GABRIEL LIPPMANN
L – 5365 MUNSBACH
R.C.S. LUXEMBOURG B 218 238 (the « Company »)
ANNUAL REPORT BY THE BOARD OF DIRECTORS
TO THE ANNUAL SHAREHOLDERS’ MEETING OF 30 APRIL 2019 We are pleased to report on the operations of the Company for the year 2018 and to submit for your approval the annual accounts for the financial year ended on 31 December 2018.
1. OVERVIEW
The Company is organised under the laws of the Grand Duchy of Luxembourg since 28 September 2017 as an S.à.r.l. with a subscribed capital of EUR 800,628,936, divided into sixty-three million nine hundred thirty-five thousand six hundred eighty-one (63,935,681) shares without nominal value, all of which are fully paid up, including one hundred twenty-two thousand five hundred (122,500) own shares held as treasury shares.
On 6 July 2018, the share capital of the Company was decreased by an amount of seven hundred fifty-five million euro (EUR 755,000,000) so as to reduce the share capital of the Company from its present amount of eight hundred million six hundred twenty-eight thousand nine hundred thirty-six euro (EUR 800,628,936) to forty-five million six hundred twenty-eight thousand nine hundred thirty-six euro (EUR 45,628,936), without cancellation of shares, and to allocate the capital reduction to a distributable reserve account of the Company.
On 10 July 2018, the Company decided to decrease its seven hundred fifty-five million euro (EUR 755,000,000) distributable reserves to five hundred million euro (EUR 500,000,000) through an interim distribution of two hundred and fifty-five million euro (EUR 255,000,000) to its shareholders Shurgard European Holdings LLC and Shurgard Guernsey Investment LLC (the “Interim Distribution”), which was executed on 13 July 2018.
On 26 September 2018, the Company changed its denomination from Shurgard Self Storage Europe to Shurgard Self Storage and transformed its legal form from a S.à.r.l. (‘société à responsabilité limitée’) into a Luxembourg public limited company (‘société anonyme).
The Company completed its initial public offering (‘’IPO’’) and is listed on Euronext Brussels since 15 October 2018. In connection with the IPO, 25,000,000 shares have been issued with a price per share of EUR 23.00, or EUR 575,000,000 in total (the ‘’IPO proceeds). Per the notary deed of 16 October 2018 before notary C. Wersandt, of the IPO proceeds, EUR 17,841,733.79 has been attributed to issued share capital and EUR 557,158,266.21 to share premium. The Company incurred EUR 23,099,866 costs for the IPO, of which EUR 19,737,244 have been capitalized as formation expenses and EUR 3,362,622 have been recognised as operating expense.
2. THE RESULT OF THE YEAR
During the year ended 31 December 2018, the Company realised a loss of EUR 7,547,887.
Taking into account the loss brought forward from the previous year amounting to EUR 198,650, the loss to be allocated amounts to EUR 7,746,537, which we suggest to carry forward:

2
Loss of the year EUR 7,547,887
Losses brought forward EUR 198,650
Loss carried forward EUR 7,746,537
Taking into account that the other available reserves amount to EUR 499,056,205 as of 31 December 2018, the amount available for distribution is EUR 491,309,668. We suggest to submit to the annual general meeting of shareholders a proposal to approve the distribution of a total dividend amounting to EUR 19,539,500 (or EUR 0.22 per share), corresponding to 25% of 80% of Adjusted Epra Earnings of the group from the other available reserves.
As of 31 December 2018, the Company’s total assets amount to EUR 1,121,318,494.
The assets of the Company comprise EUR 18,914,859 formation expenses, EUR 1,095,548,542 of financial assets, consisting of EUR 1,094,604,747 in shares in its affiliated undertaking Shurgard Luxembourg S.à.r.l. and EUR 943,795 in own shares held as treasury shares and EUR 886,173 of current assets (amounts owed by affiliated undertakings as well as cash at bank and in hand).
3. RESEARCH AND DEVELOPMENT
There were no research and development activities during the financial year.
4. OWN SHARES
There was no acquisition of own shares during the financial year.
At 31 December 2018, the Company directly held 119,771 own shares.
5. ALLOCATION OF FREE SHARES
In connection with the IPO, the Company granted on 16 October 2018 905,000 share options to employees and executives of the Company and its subsidiaries. The options have an exercise price of EUR 23.00, three-year cliff vesting and a ten-year contractual term.
On 13 December 2018, the Company sold 2,779 treasury shares to an employee who exercised the same amount of share options he was granted under the 2016 share option plan. This transaction reduced the amount of share options held by the Company to 119,771 and their carrying value to EUR 943,795. The Company created an unavailable reserve for own shares of EUR 943,795, equal to the carrying value of the treasury shares in offset of a reduction for the same amount of the distributable reserves.
6. AUDITOR’S FEES
During the year ended 31 December 2018, Ernst & Young S.A. as “Réviseur d’Entreprises agréé” charged to the Company EUR 644,015 for exceptional services and the performance of special assignments in regard to the Company’s IPO and listing.
7. PRINCIPAL RISKS, UNCERTAINTIES, OUTLOOK AND NON-FINANCIAL STATEMENT
Principal risks and uncertainties, outlook and non-financial key performance indicators are disclosed in the consolidated financial statements and the related management report.
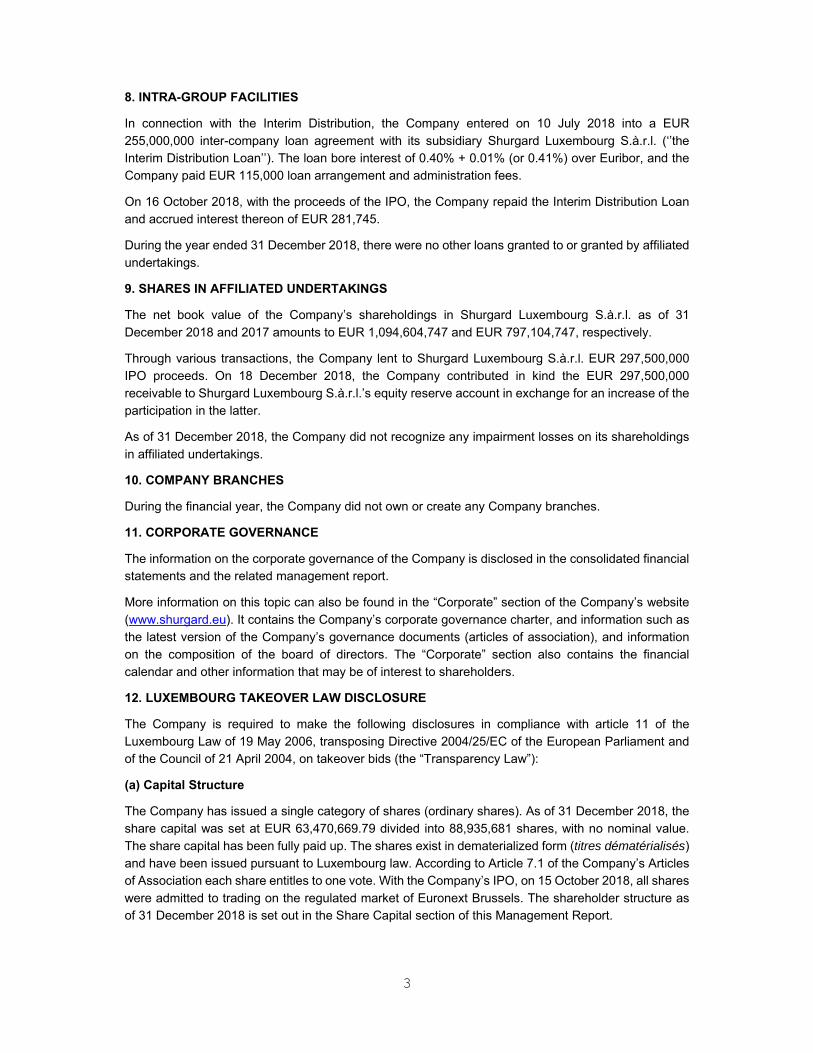
3
8. INTRA-GROUP FACILITIES
In connection with the Interim Distribution, the Company entered on 10 July 2018 into a EUR 255,000,000 inter-company loan agreement with its subsidiary Shurgard Luxembourg S.à.r.l. (‘’the Interim Distribution Loan’’). The loan bore interest of 0.40% + 0.01% (or 0.41%) over Euribor, and the Company paid EUR 115,000 loan arrangement and administration fees.
On 16 October 2018, with the proceeds of the IPO, the Company repaid the Interim Distribution Loan and accrued interest thereon of EUR 281,745.
During the year ended 31 December 2018, there were no other loans granted to or granted by affiliated undertakings.
9. SHARES IN AFFILIATED UNDERTAKINGS
The net book value of the Company’s shareholdings in Shurgard Luxembourg S.à.r.l. as of 31 December 2018 and 2017 amounts to EUR 1,094,604,747 and EUR 797,104,747, respectively.
Through various transactions, the Company lent to Shurgard Luxembourg S.à.r.l. EUR 297,500,000 IPO proceeds. On 18 December 2018, the Company contributed in kind the EUR 297,500,000 receivable to Shurgard Luxembourg S.à.r.l.’s equity reserve account in exchange for an increase of the participation in the latter.
As of 31 December 2018, the Company did not recognize any impairment losses on its shareholdings in affiliated undertakings.
10. COMPANY BRANCHES
During the financial year, the Company did not own or create any Company branches.
11. CORPORATE GOVERNANCE
The information on the corporate governance of the Company is disclosed in the consolidated financial statements and the related management report.
More information on this topic can also be found in the “Corporate” section of the Company’s website (www.shurgard.eu). It contains the Company’s corporate governance charter, and information such as the latest version of the Company’s governance documents (articles of association), and information on the composition of the board of directors. The “Corporate” section also contains the financial calendar and other information that may be of interest to shareholders.
12. LUXEMBOURG TAKEOVER LAW DISCLOSURE
The Company is required to make the following disclosures in compliance with article 11 of the Luxembourg Law of 19 May 2006, transposing Directive 2004/25/EC of the European Parliament and of the Council of 21 April 2004, on takeover bids (the “Transparency Law”):
(a) Capital Structure
The Company has issued a single category of shares (ordinary shares). As of 31 December 2018, the share capital was set at EUR 63,470,669.79 divided into 88,935,681 shares, with no nominal value. The share capital has been fully paid up. The shares exist in dematerialized form (titres dématérialisés) and have been issued pursuant to Luxembourg law. According to Article 7.1 of the Company’s Articles of Association each share entitles to one vote. With the Company’s IPO, on 15 October 2018, all shares were admitted to trading on the regulated market of Euronext Brussels. The shareholder structure as of 31 December 2018 is set out in the Share Capital section of this Management Report.

4
(b) Restrictions on the transfer of securities
The Company shares are freely transferable in accordance with the legal requirements for dematerialized shares. The Board of Directors may, however, impose transfer restrictions for shares that are registered, listed and admitted to trading, quoted, dealt in or have been placed in certain jurisdictions in compliance with the requirements applicable therein. The transfer of a dematerialized share occurs by book-entry.
(c) Direct and indirect shareholdings
The ownership in the Company by each shareholder who is known to be the (direct or indirect) holder of shares of the Company representing 5% or more of the Company's voting rights is as follows:
Shareholder Number %
NYSCRF 32,544,722 36.6
Public Storage 31,268,459 35.2
Public 25,002,729 28.1
Shurgard Self Storage SA (treasury shares) 119,771 0.1
Total 88,935,681 100.0
(d) Special control rights
All the issued and outstanding shares in the Company have equal voting rights and there are no special control rights attached to the shares. As per article 7.1 of the Articles of Association of the Company each share is entitled to one vote.
(e) Control system of employee share schemes
The Board of Directors is not aware of any system of control of any employee share scheme where the control rights are not exercised directly by the employees.
(f) Restrictions on voting rights
In general, there are no restrictions on the voting rights of the Company shares. However, the sanction of suspension of voting rights automatically applies to any shareholder (or group of shareholders) who has (or have) crossed the thresholds set out in articles 8 to 15 of the Transparency Law but have not notified the Company accordingly. The sanction of suspension of voting rights will apply until the notification has been properly made by the relevant shareholder(s).
(g) Restrictions on the transfer of securities
Certain shareholders have signed lock-up agreements with the underwriters of our IPO transaction, in which they committed themselves not to transfer or dispose of any shares during a certain period (180 or 360 days from 11 October 2018). However, these restrictions shall not prohibit the undersigned from (i) accepting a general take-over bid on all of the ordinary share capital of the Company, giving an irrevocable commitment to accept such an offer, or disposing of shares to an offeror or potential offeror during the period of such an offer; (ii) proceeding with any disposal required by law, regulation or a court of competent jurisdiction; and (iii) transferring shares intra-group for legal entities or intra-family for natural persons, provided that each such transferee shall continue to be bound by the foregoing restrictions for the remainder of the lock-up period.

5
(h) Appointment / replacement of board members and Amendments of the Articles of Association
According to Articles 9.1 to 9.3 of our Articles of Association, the Company shall be managed by a Board of Directors. Each Director will be appointed by the General Meeting. The General Meeting shall determine the number of Directors, and the duration of their mandate is set at one year. Each Director is eligible for re-appointment and may be removed at any time, with or without cause by a resolution of the General Meeting. In the event of a vacancy on the Board of Directors, the remaining Directors may elect by co-optation a new Director to fill such vacancy until the next General Meeting, which shall ratify such co-optation or elect a new Director instead.
An amendment of our Articles of Association must be adopted by an extraordinary resolution at a General Meeting in front of a Luxembourg public notary. A two-thirds majority of the votes cast by the shareholders present or represented is required. Our Articles of Association do not provide for any specific conditions that are stricter than required by Luxembourg law.
(i) Powers of Board Members
According to Article 10 of our Articles of Association, the Board of Directors is vested with the broadest powers to perform all acts necessary or useful to accomplish the Company's object. All powers not expressly reserved by the Articles of Association or by the Laws to the General Meeting or to the Auditor(s) shall be within the competence of the Board of Directors.
As of 31 December 2018, according to Article 6.1 of our Articles of Association, the authorized capital of the Company (including the issued share capital) was set at EUR 95,800,729.98 divided into 134,236,856 shares without nominal value. According to Article 6.2 of our Articles of Association, the Board of Directors is authorized, up to the maximum amount of the authorized capital, to:
- increase the issued share capital in one or several tranches with or without share premium, against payment in cash or in kind, by conversion of claims on the Company or in any other manner;
- issue subscription and/or conversion rights in relation to new shares or instruments under the terms and conditions of warrants (which may be separate or linked to shares, bonds, notes or similar instruments issued by the Company), convertible bonds, notes or similar instruments; and
- determine the place and date of the issue or successive issues, the issue price, the terms and conditions of the subscription of and paying up on the new shares and instruments; and
- remove or limit the statutory preferential subscription right of the shareholders.
The above authorizations are valid until 26 September 2023, which corresponds to a period ending five years after the date of the General Meeting creating the authorized capital. The above authorizations may be renewed, increased or reduced by a resolution of the General Meeting with a two-thirds majority of the votes cast by the shareholders present or represented.
The Board of Directors is furthermore authorized until 16 October 2019 to effect on one or several occasions, repurchases and/or cancellation of Company shares on the regulation market on which the Company’s shares are admitted for trading or by any other means, for a maximum number of shares representing EUR 50 million in aggregate, at a price not lower than 15% below and not higher than 15% above the shares’ official price reported in the trading session on the day before carrying out each individual transaction.
(j) Change of control agreements
If a change of control occurs, each individual lender under the EUR 250 million revolving facility we entered into in 2018, may cancel its commitment by not less than a 30 days’ notice and require

6
repayment of its share in all outstanding loans. The outstanding U.S. Private Placement Notes requires us to make an offer to prepay all outstanding U.S. Private Placement Notes if, within a period of 90 days following the occurrence of a change of control, the rating assigned to the U.S. Private Placement Notes (or any other of our unsecured and unsubordinated indebtedness having an initial maturity of five years or more) immediately prior to the change of control is lowered below investment grade and/or withdrawn(or, in absence of any rated U.S. Private Placement Notes, we fail to obtain an investment grade rating of such rated debt instruments).
(k) End of employment compensation
There are no agreements between the Company and its Board members or employees providing for compensation if they resign or are made redundant without valid reason or if their employment ceases because of a takeover bid.
13. EVENTS AFTER THE CLOSING
After the accounts closing date, no other specific circumstances or facts occurred that would be likely to influence the results substantially or the future development of the Company.
14. DISCHARGE OF LIABILITY TO THE DIRECTORS AND THE STATUTORY AUDITOR
We therefore propose you to approve the annual accounts as they have been presented in the pages to follow and ask you to grant discharge to the directors and to Ernst & Young S.A. as ‘’Réviseur d’Entreprises agréé’’ from any liability resulting from the performance of their duties during the financial year ended on 31 December 2018.
Responsibility statement
We confirm to the best of our knowledge that the annual accounts of the Company presented in this annual report and established in conformity with the Luxembourg legal and regulatory requirements relating to the preparation of annual accounts give a true and fair view of the assets, liabilities, financial position and results of the Company.
25 February 2019
Marc Oursin
Chief Executive Officer


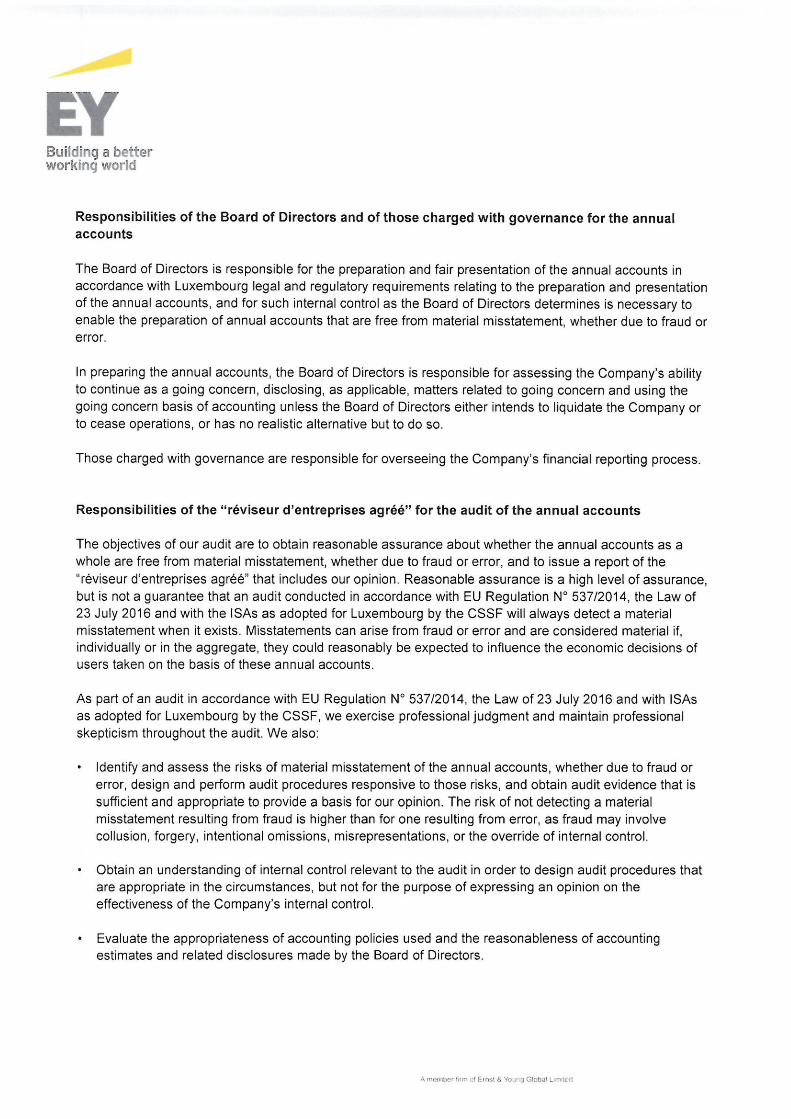


PUBLISHER
Shurgard Self Storage S.A. 6 C Rue Gabriel Lippmann L-5365 Münsbach Grand Duchy of Luxembourg www.shurgard.eu
COPYWRITING AND DESIGN
Instinctif Partners Berlin, Frankfurt, Köln, München, London www.instinctif.de www.creative.instinctif.com
PHOTO
Shurgard Self Storage S.A.


