23
2018 Third Quarter Business Review (Unaudited) October 23, 2018

2018 Third Quarter Business Review
(Unaudited)
October 23, 2018

2. All Rights Reserved.22 October 2018© 3M
3M Investor Day
Welcome reception:
November 14, 2018
Formal program:
November 15, 2018
Earnings Conference Calls
Q4: January 29, 2019

3. All Rights Reserved.22 October 2018© 3M
Forward looking statementThis presentation contains forward-looking information about 3M's financial results and estimates and business prospects that involve substantial risks anduncertainties. You can identify these statements by the use of words such as "anticipate," "estimate," "expect," "aim," "project," "intend," "plan," "believe," "will,""should," "could," "target," "forecast" and other words and terms of similar meaning in connection with any discussion of future operating or financial performanceor business plans or prospects. Among the factors that could cause actual results to differ materially are the following: (1) worldwide economic, political, and capitalmarkets conditions and other factors beyond the Company's control, including natural and other disasters or climate change affecting the operations of theCompany or its customers and suppliers; (2) the Company's credit ratings and its cost of capital; (3) competitive conditions and customer preferences; (4) foreigncurrency exchange rates and fluctuations in those rates; (5) the timing and market acceptance of new product offerings; (6) the availability and cost of purchasedcomponents, compounds, raw materials and energy (including oil and natural gas and their derivatives) due to shortages, increased demand or supply interruptions(including those caused by natural and other disasters and other events); (7) the impact of acquisitions, strategic alliances, divestitures, and other unusual eventsresulting from portfolio management actions and other evolving business strategies, and possible organizational restructuring; (8) generating fewer productivityimprovements than estimated; (9) unanticipated problems or delays with the phased implementation of a global enterprise resource planning (ERP) system, orsecurity breaches and other disruptions to the Company's information technology infrastructure; (10) financial market risks that may affect the Company’s fundingobligations under defined benefit pension and postretirement plans; and (11) legal proceedings, including significant developments that could occur in the legal andregulatory proceedings described in the Company's Annual Report on Form 10-K for the year ended Dec. 31, 2017, and any subsequent quarterly reports on Form10-Q (the “Reports”). Changes in such assumptions or factors could produce significantly different results. A further description of these factors is located in theReports under "Cautionary Note Concerning Factors That May Affect Future Results" and "Risk Factors" in Part I, Items 1 and 1A (Annual Report) and in Part I, Item 2and Part II, Item 1A (Quarterly Reports). The information contained in this presentation is as of the date indicated. The Company assumes no obligation to updateany forward-looking statements contained in this presentation as a result of new information or future events or developments.
This presentation refers to certain non-GAAP financial measures including free cash flow, free cash flow conversion, return on invested capital (ROIC), and various measures excluding the impact of the Communications Markets divestiture gain and related restructuring actions, the legal settlement and the measurement period adjustment relative to the accounting for the 2017 enactment of the Tax Cuts and Jobs Act (TCJA). These non-GAAP measures are not in accordance with, nor are they a substitute for, GAAP measures. Reconciliations of these non-GAAP financial measures to the most directly comparable GAAP financial measures can be found in the appendix to this presentation.
Note on non-GAAP financial measures

4. All Rights Reserved.22 October 2018© 3M
Q3 2018 summary
Sales of $8.2B, down -0.2% year-on-year
• Foreign currency translation -1.7%
• Acquisition/divestiture, net +0.2%
GAAP EPS of $2.58, up 11% year-on-year
Operating income of $2.0B, up 0.4% year-on-year
• Operating margin of 24.7%, up 10 basis points
Free cash flow of $1.8B, up 24% year-on-year
Returned $1.9B to shareholders via dividends and gross share repurchases
Organic local-currency growth
Operatingmargin
Earnings per share
$2.58 +10.7% year-on-year
24.7%+10 bps year-on-year
+1.3%year-on-year
5. All Rights Reserved.22 October 2018© 3M
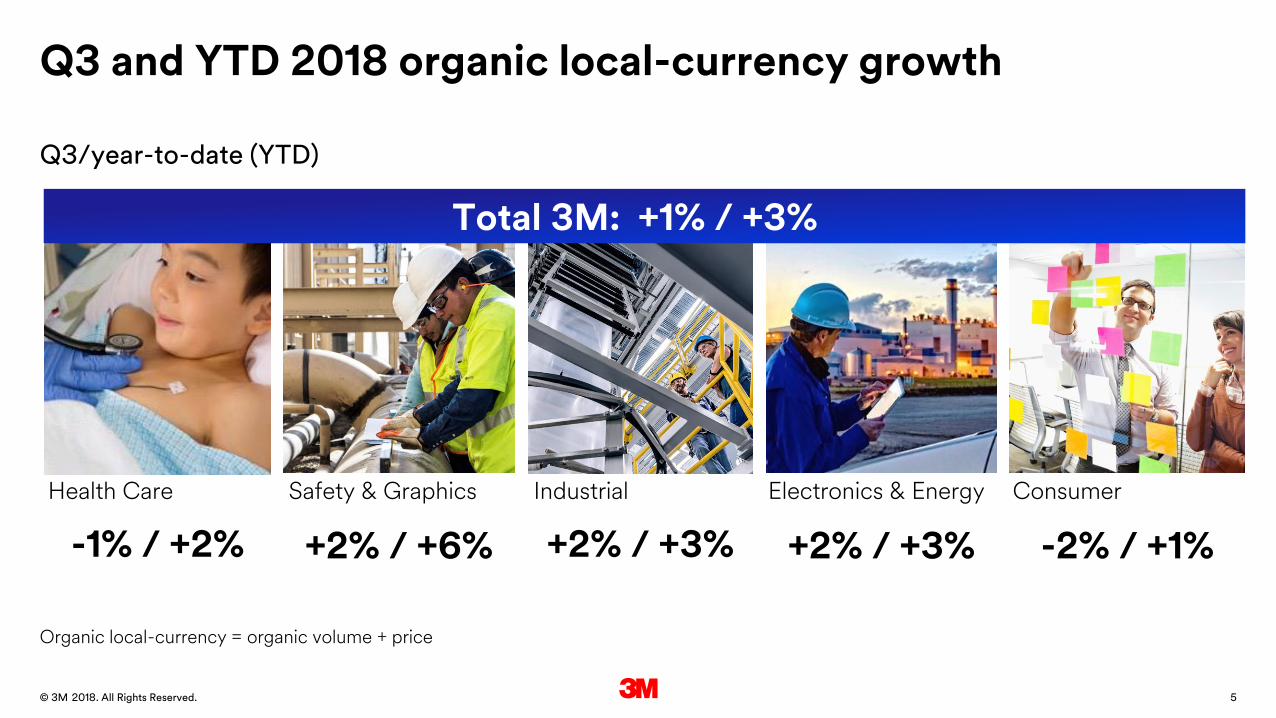
Q3 and YTD 2018 organic local-currency growth
Q3/year-to-date (YTD)
IndustrialHealth Care ConsumerSafety & Graphics Electronics & Energy
+2% / +3%-1% / +2% -2% / +1%+2% / +6% +2% / +3%
Organic local-currency = organic volume + price
Total 3M: +1% / +3%

6. All Rights Reserved.22 October 2018© 3M
Q3 2018 sales recap
Brazil +5%
Mexico +3%
Canada flat
Foreign-currency translation:
• Euro -2%, RMB -2%, Yen -1%, Real -20%
Organic local-currency growth by key countries/regions:
China/Hong Kong +10%
West Europe -2%
Japan -7%
Organic local-currency growth by area:
• U.S. +0.5%
• Latin America/Canada +2.1%
• Europe/Middle East/Africa -0.9%
• Asia Pacific +3.2%
(year-on-year)
Net sales
Organic-local currency growth
Acquisitions/Divestitures
+0.2%year-on-year
+1.3%year-on-yearvolume +0.1%, price +1.2%
Foreign currencytranslation
-1.7%year-on-year
$8.2B-0.2% year-on-year

7. All Rights Reserved.22 October 2018© 3M
Q3 2018 P&L
Q3 2017 24.6%
Organic volume/ productivity/other
+0.7%+0.1% organic volume growth; lower portfolio & footprint actions $23M
Acquisitions -0.3% Primarily Scott Safety
Communication Markets divestiture (Q2 2018)
-0.1% Stranded costs
Price/raw material +0.3%Selling price benefits net of higher raw materials
FX -0.5% Net of hedge impact
Q3 2018 24.7%
Operating income margin reconciliation:Net sales
Gross margin
Operating Income
$2.0B+0.4% year-on-year
49.0%-130 bps year-on-year
Net income$1.5B+8.0% year-on-year
$8.2B-0.2% year-on-year

8. All Rights Reserved.22 October 2018© 3M
Q3 2018 EPS
+9.0%
Q3 2017 GAAP EPS $2.33
Organic growth/productivity/other +$0.12
Benefits from organic growth, Business Transformation and productivity; lower portfolio and footprint (Q3 2018 -$0.01 vs. Q3 2017 -$0.04)
Acquisitions +$0.01 Primarily Scott Safety
Communication Markets divestiture (Q2 2018)
-$0.03 Divested income; stranded costs
FX -$0.08Pre-tax earnings impact -$66M; FY 2018 estimate: -$0.05 vs. +$0.10, previously
Other expense -$0.05 Higher retirement expense and net interest
Tax rate +$0.22 Q3 2018 21.3%, in-line with expectations
Shares outstanding +$0.06 Average diluted shares down 2.3%
Q3 2018 GAAP EPS $2.58
Earnings per share:
$2.58+10.7% year-on-year

9. All Rights Reserved.22 October 2018© 3M
Q3 2018 cash flow
Free cash flow
Dividends
Gross sharerepurchases
$1.8BFree cash flow of $1.8B, up 24% year-on-year
Free cash flow conversion of 114%
Capital expenditures:
• Q3 2018: $377M, up $52M year-on-year
• FY 2018: ~$1.6B
Returned $1.9B to shareholders via dividends and gross share repurchases in Q3
• FY 2018 gross share repurchases:
• $4B to $5B
$794M
$1.1B

10. All Rights Reserved.22 October 2018© 3M
$3.0Bflat year-on-year
+2.2%year-on-year
$667M-0.7% year-on-year
22.1%-10 bps year-on-year
Organic local-currency growth
Net sales
Operating income
Operating margin
Industrial
Organic local-currency growth by business, year-on-year:
• Sales growth led by advanced materials, automotive and aerospace solutions, and industrial adhesives and tapes; automotive aftermarket declined
Organic local-currency growth by area, year-on-year:
• Sales grew +3% in APAC, +2% in the U.S., +1% in Latin America/Canada and EMEA
Foreign currency translation decreased sales by -2.1% and divestitures decreased sales by –0.1%
Q3 2017 operating margin included -30 bps from portfolio and footprint actions

11. All Rights Reserved.22 October 2018© 3M
$1.7B+7.0% year-on-year
+2.2%year-on-year
$412M+0.4% year-on-year
24.8%-160 bps year-on-year
Safety & Graphics
Organic local-currency growth by business, year-on-year:
• Sales grew in personal safety, transportation safety, and commercial solutions; roofing granules declined
Organic local-currency growth by area, year-on-year:
• Sales grew +5% in APAC, +1% in the U.S, Latin America/Canada, and EMEA
Foreign currency translation decreased sales by -2.2% andacquisitions, net of divestitures, increased sales by +7.0%
Strong growth across all personal safety segments; Scott Safety performance and integration on-track
Operating margins impacted by:
• Q3 2017: -40 ppts from portfolio and footprint actions
• Q3 2018: -150 bps from Scott Safety acquisition
Organic local-currency growth
Net sales
Operating income
Operating margin

12. All Rights Reserved.22 October 2018© 3M
$1.4B-2.8% year-on-year
-1.1%year-on-year
$446M-4.4% year-on-year
30.9%-50 bps year-on-year
Health Care
Organic local-currency growth by business, year-on-year:
• Sales grew in food safety, health information systems, oral care; drug delivery declined
Organic local-currency growth by area, year-on-year:
• Sales grew +10% in Asia Pacific, +4% in Latin America/ Canada; sales declined -1% in EMEA and -6% in the U.S.
Foreign currency translation decreased sales by -1.7%
Developing market organic growth of +9% led by double-digit increases in China/Hong Kong
Organic local-currency growth
Net sales
Operating income
Operating margin

13. All Rights Reserved.22 October 2018© 3M
$1.4B-4.8% year-on-year
+2.3%year-on-year
$457M+6.2% year-on-year
31.7%+330 bps year-on-year
Electronics & Energy
Organic local-currency growth by business, year-on-year:
• Energy-related sales grew +6%; electronics-related sales grew +1% led by electronics materials solutions
Organic local-currency growth by area, year-on-year:
• Sales grew +5% in the U.S., +3% in APAC , and +1% in Latin America/Canada; sales declined -5% in EMEA
Foreign currency translation decreased sales by -1.0% and divestitures reduced sales by -6.1%
Operating margins impacted by:
• Q3 2018: +80 bps mix benefit from Q2 2018 divestiture of communication markets business
Organic local-currency growth
Net sales
Operating income
Operating margin

14. All Rights Reserved.22 October 2018© 3M
$1.2B-3.4% year-on-year
-2.0%year-on-year
$291M-6.7% year-on-year
23.5%-80 bps year-on-year
Consumer
Organic local-currency growth by business, year-on-year:
• Sales grew in home improvement; declined in stationery and office supplies, home care, and consumer health care
Organic local-currency growth by area, year-on-year:
• Sales grew +5% in Latin America/Canada; sales declined -1% in the U.S., -5% in EMEA, and -7% in APAC
Foreign currency translation decreased sales by -1.4%
Continued strong 3M point-of-sale growth amongst major retail customers
Q3 2017 operating margins included -70 bps from portfolio and footprint actions
Organic local-currency growth
Net sales
Operating income
Operating margin
15. All Rights Reserved.22 October 2018© 3M
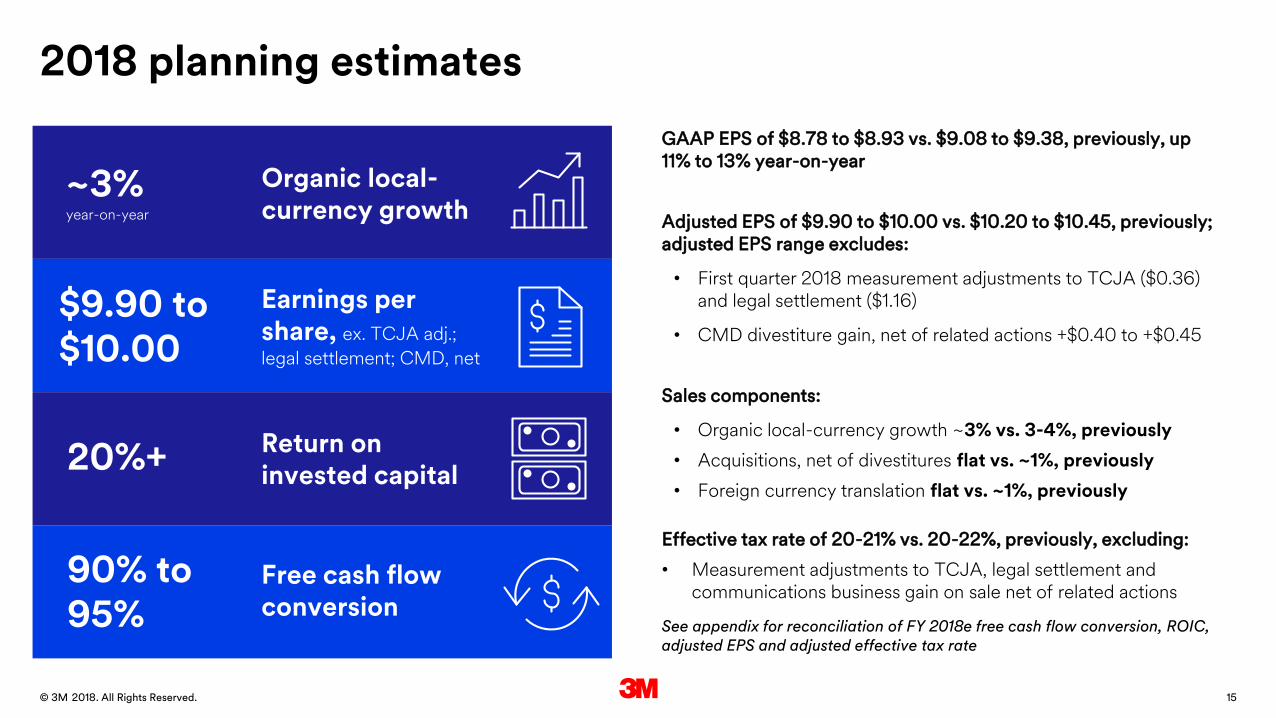
2018 planning estimates
Organic local-currency growth
Return on invested capital
$9.90 to $10.00
20%+
Free cash flowconversion
90% to95%
~3%year-on-year
GAAP EPS of $8.78 to $8.93 vs. $9.08 to $9.38, previously, up 11% to 13% year-on-year
Adjusted EPS of $9.90 to $10.00 vs. $10.20 to $10.45, previously; adjusted EPS range excludes:
• First quarter 2018 measurement adjustments to TCJA ($0.36) and legal settlement ($1.16)
• CMD divestiture gain, net of related actions +$0.40 to +$0.45
Sales components:
• Organic local-currency growth ~3% vs. 3-4%, previously
• Acquisitions, net of divestitures flat vs. ~1%, previously
• Foreign currency translation flat vs. ~1%, previously
Effective tax rate of 20-21% vs. 20-22%, previously, excluding:
• Measurement adjustments to TCJA, legal settlement and communications business gain on sale net of related actions
See appendix for reconciliation of FY 2018e free cash flow conversion, ROIC, adjusted EPS and adjusted effective tax rate
Earnings per share, ex. TCJA adj.;
legal settlement; CMD, net
16. All Rights Reserved.22 October 2018© 3M
Q&A Participants
Nick GangestadSenior Vice President and
Chief Financial Officer
Bruce JermelandDirector, Investor Relations
Mike RomanChief Executive Officer

17. All Rights Reserved.22 October 2018© 3M
Appendix

18. All Rights Reserved.22 October 2018© 3M
Q3 2018 sales recap
U.S. APAC EMEA LAC
Organic volume -0.9% +3.0% -2.5% -0.1%
Price +1.4% +0.2% +1.6% +2.2%
Organic local-currency +0.5% +3.2% -0.9% +2.1%
Acquisitions/Divestitures +0.8% -0.1% ---- -0.7%
FX ---- -1.5% -3.0% -6.9%
Total growth +1.3% +1.6% -3.9% -5.5%

19. All Rights Reserved.22 October 2018© 3M
Q3 2018 P&L
($M)Q3
2017Q3
2018 Change
Sales $8,172 $8,152 -0.2%
Gross profit $4,113 $3,993 -2.9%
% to sales 50.3% 49.0% -1.3 pts
SG&A $1,637 $1,547 -5.5%
% to sales 19.9% 19.0% -0.9 pts
R&D & related $468 $430 -7.9%
% to sales 5.7% 5.3% -0.4 pts
Operating income $2,008 $2,016 +0.4%
% to sales 24.6% 24.7% +0.1 pts
Net income $1,429 $1,543 +8.0%
GAAP earnings per share $2.33 $2.58 +10.7%
20. All Rights Reserved.22 October 2018© 3M
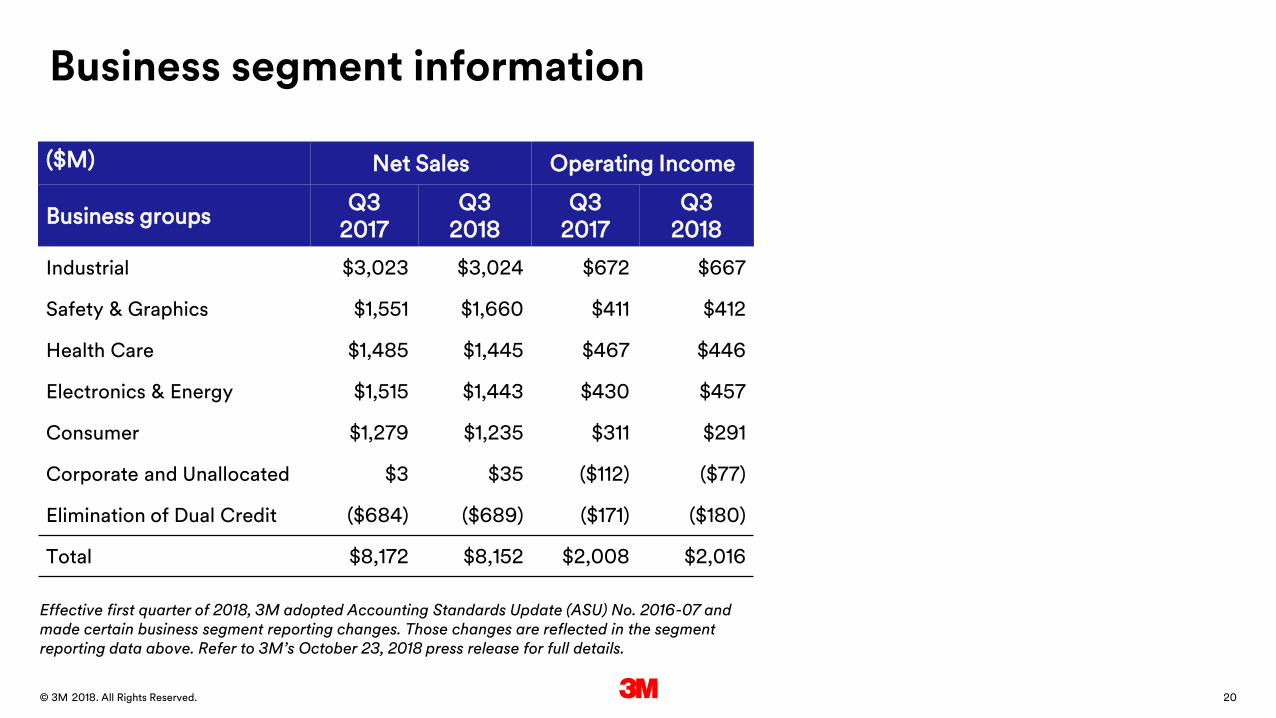
Business segment information
($M) Net Sales Operating Income
Business groups Q3
2017Q3
2018Q3
2017Q3
2018
Industrial $3,023 $3,024 $672 $667
Safety & Graphics $1,551 $1,660 $411 $412
Health Care $1,485 $1,445 $467 $446
Electronics & Energy $1,515 $1,443 $430 $457
Consumer $1,279 $1,235 $311 $291
Corporate and Unallocated $3 $35 ($112) ($77)
Elimination of Dual Credit ($684) ($689) ($171) ($180)
Total $8,172 $8,152 $2,008 $2,016
Effective first quarter of 2018, 3M adopted Accounting Standards Update (ASU) No. 2016-07 and made certain business segment reporting changes. Those changes are reflected in the segment reporting data above. Refer to 3M’s October 23, 2018 press release for full details.

21. All Rights Reserved.22 October 2018© 3M
Estimated Full Year 2018
($B, except EPS) GAAP measure
TCJA measurement
adjustment Legal settlementCMD divestiture,
net of actionsAdjusted Non-GAAP measure
Income before taxes $7.0 to $7.1 $0.9 ($0.4) $7.5 to $7.6
Provision for income taxes $1.6 to $1.7 ($0.2) $0.2 ($0.1) $1.5 to $1.6
Effective tax rate 23% to 25% 20% to 21%
Net income attributable to 3M $5.3 to $5.5 $0.2 $0.7 ($0.3) $5.9 to $6.1
Earnings per diluted share $8.78 to $8.93 $0.36 $1.16 ($0.40-$0.45) $9.90 to $10.00
Estimated Full Year 2018 TCJA measurement adjustment, legal settlement, CMD divestiture impact
In February 2018, 3M reached an agreement with the State of Minnesota that resolved the previously disclosed Natural Resource Damages (NRD) lawsuit filed by the State against the Company related to certain PFCs present in the environment. Under the terms of the settlement, 3M agreed to provide an $850 million grant to the State for a special “3M Water Quality and Sustainability Fund.” This Fund will enable projects that support water sustainability in the Twin Cities East Metro region, such as continued delivery of water to residents and enhancing groundwater recharge to support sustainable growth. The projects will also result in habitat and recreation improvements, such as fishing piers, trails, and open space preservation. 3M recorded a pre-tax charge of $897 million, inclusive of legal fees and other related obligations, in the first quarter of 2018 associated with the resolution of this matter. Also during the first quarter of 2018, 3M recorded a tax expense of $217 million related to a measurement period adjustment to the provisional amounts recorded in December 2017, from the enactment of the Tax Cuts and Jobs Act (TCJA). 3M’s provisional accounting continues to be subject to adjustment during the measurement period of up to one year following the December 2017 enactment of TCJA. In the second quarter of 2018, 3M completed the sale of substantially all of its Communication Markets Division and reflected a pre-tax gain of $494 million as a result of this divestiture. During the second quarter of 2018, management approved and committed to undertake certain restructuring actions related to addressing corporate functional costs following the Communication Markets Division divestiture. These actions resulted in a second quarter 2018 pre-tax charge of $105 million.
In addition to providing full-year estimated 2018 financial results in accordance with U.S. GAAP, the Company also provides non-GAAP measures that adjust for the impacts of the NRD resolution, measurement period adjustment to the impact of enactment of the TCJA, and the impact of the Communication Markets Division divestiture gain, net of restructuring actions. These items represent significant charges/benefits that impacted the Company’s financial results. Income before taxes, provision for income taxes, net income, earnings per share, and the effective tax rate are all measures for which 3M provides the estimated GAAP measure and an adjusted measure. The adjusted measures are not in accordance with, nor are they a substitute for, GAAP measures. The Company considers these non-GAAP measures in evaluating and managing the Company’s operations. The Company believes that discussion of results adjusted for this item is meaningful to investors as it provides a useful analysis of ongoing underlying operating trends. The determination of these items may not be comparable to similarly titled measures used by other companies.

22. All Rights Reserved.22 October 2018© 3M
Reconciliation of GAAP amounts to free cash flow conversion
Third-quarter 2018 results:
($M)Q3
2017Q3
2018 Change
Major GAAP cash flow categories:
Operating cash flow $1,750 $2,139 $389
Investing cash flow $781 ($269) ($1,050)
Financing cash flow ($843) ($1,453) ($610)
Free cash flow (non-GAAP measure):
Operating cash flow $1,750 $2,139 $389
Purchases of property, plant and equipment ($325) ($377) ($52)
Free cash flow $1,425 $1,762 $337
Net income attributable to 3M $1,429 $1,543 $114
Free cash flow conversion 100% 114% 14 pts
Free cash flow and free cash flow conversion are not defined under U.S. generally accepted accounting principles (GAAP). Therefore, they should not be considered asubstitute for income or cash flow data prepared in accordance with U.S. GAAP and may not be comparable to similarly titled measures used by other companies. TheCompany defines free cash flow as net cash provided by operating activities less purchases of property, plant and equipment. It should not be inferred that the entire freecash flow is available for discretionary expenditures. The Company defines free cash flow conversion as free cash flow divided by net income attributable to 3M. TheCompany believes free cash flow and free cash flow conversion are meaningful to investors as they function as useful measures of performance and the Company uses thesemeasures as an indication of the strength of the Company and its ability to generate cash.
Full-year 2018 forecast:
($B)
Year 2018 Planning Estimate
Free cash flow (non-GAAP measure):
Operating cash flow $6.4 to $6.8
Purchases of property, plant and equipment ($1.6)
Free cash flow $4.8 to $5.2
Net income attributable to 3M $5.3 to $5.5
Free cash flow conversion 90% to 95%

23. All Rights Reserved.22 October 2018© 3M
Reconciliation of GAAP amounts to return on invested capital
Return on Invested Capital (ROIC) is not defined under U.S. generally accepted accounting principles. Therefore, ROIC should not be considered a substitute for other measures prepared in accordance with U.S. GAAP and may not be comparable to similarly titled measures used by other companies. The Company defines ROIC as adjusted net income (net income including non-controlling interest plus after-tax interest expense) divided by average invested capital (equity plus debt). The Company believes ROIC is meaningful to investors as it focuses on shareholder value creation.
Full-year 2017 results:
($B)Year 2017
Results
Return on invested capital (non-GAAP measure):
Net income including non-controlling interest $4.9
Interest expense (after-tax)* $0.2
Adjusted net income (return) $5.1
Ave. shareholder’s equity (including non-controlling interest) $11.6
Ave. short-term and long-term debt $12.2
Ave. invested capital $23.8
Return on invested capital 21%
*Effective income tax rate used for interest expense 35.5%
Full-year 2018 forecast:
($B)
Year 2018 Planning Estimate
Return on invested capital (non-GAAP measure):
Net income including non-controlling interest $5.3 to $5.5
Interest expense (after-tax)** $0.3
Adjusted net income (return) $5.6 to $5.8
Ave. shareholder’s equity (including non-controlling interest) $10.5 to $11.5
Ave. short-term and long-term debt $14.5 to $15.5
Ave. invested capital $25.0 to $27.0
Return on invested capital 20% +
**Effective income tax rate used for interest expense 23% to 25%


