Responsible statistician: Christopher Waite Email: [email protected]Media enquiries: 020 7215 1000 Public enquiries: 020 7215 8285 Next publication: February 2021 2018 UK Greenhouse Gas Emissions, Final figures 4 February 2020 National Statistics In 2018, UK emissions of the basket of seven greenhouse gases covered by the Kyoto Protocol were estimated to be 451.5 million tonnes carbon dioxide equivalent (MtCO2e), a decrease of 2.1% compared to the 2017 figure of 461.0 million tonnes. Greenhouse gas emissions in 2018 are estimated to be 43.1% lower than they were in 1990. • The decrease in greenhouse gas emissions from 2017 was mainly caused by reductions in emissions in the energy supply sector, down 6.6% (7.4 MtCO2e). This was driven by the continued decrease in power station emissions due to the change in the fuel mix for electricity generation, in particular a reduction in the use of coal and gas. Emissions from energy supply are now 62.3% lower than they were in 1990. • Emissions from transport fell by 1.4% (1.8 MtCO2e) in 2018, their first fall since 2013. Despite this transport remains the largest emitting sector, responsible for 28% of all greenhouse gas emissions in the UK. Transport emissions are only 3.0% lower than in 1990, as increased road traffic has largely offset improvements in vehicle fuel efficiency. • Between 2017 and 2018 emissions from the business sector decreased by 2.5% (2.1 MtCO2e) caused by falls from industrial combustion and from refrigeration and air conditioning. Emissions from industrial processes decreased by 7.3% (0.8 MtCO2e), caused by reduced emissions from the production of ammonia, halocarbons, iron and steel. • There was an increase of 3.8% (2.5 MtCO2e) in residential sector emissions, driven by an increase in the use of natural gas for heating due to colder weather in the first half of 2018. Similarly, there was a 3.7% increase in public sector emissions. Emissions from both of these sectors tend to vary from year to year depending on the temperature. Carbon dioxide (CO2) is the most dominant greenhouse gas from the Kyoto “basket” of greenhouse gases, accounting for 81% of total UK greenhouse gas emissions in 2018. The latest figures show: • UK net CO2 emissions were estimated to be 365.7 million tonnes (Mt) in 2018, which was 2.2% lower than the 2017 figure of 373.8 Mt. This decrease in CO2 emissions was mainly due to the decrease in the use of coal and gas for electricity generation (as described above). Between 1990 and 2018 UK net CO2 emissions have decreased by 38.6%. What you need to know about these statistics: This publication provides the latest estimates of 1990-2018 UK territorial greenhouse gas emissions, which are presented in carbon dioxide equivalent units (CO2e) throughout this statistical release. They show greenhouse gas emissions occurring within the UK’s borders and cover the Kyoto “basket” of seven greenhouse gases: carbon dioxide (CO2), methane (CH4), nitrous oxide (N2O), hydrofluorocarbons (HFC), perfluorocarbons (PFC), sulphur hexafluoride (SF6) and nitrogen trifluoride (NF3).
Transcript
Responsible statistician: Christopher Waite Email: [email protected] Media enquiries: 020 7215 1000 Public enquiries: 020 7215 8285 Next publication: February 2021
2018 UK Greenhouse Gas Emissions, Final figures 4 February 2020 National Statistics
In 2018, UK emissions of the basket of seven greenhouse gases covered by the Kyoto Protocol were estimated to be 451.5 million tonnes carbon dioxide equivalent (MtCO2e), a decrease of 2.1% compared to the 2017 figure of 461.0 million tonnes. Greenhouse gas emissions in 2018 are estimated to be 43.1% lower than they were in 1990.
• The decrease in greenhouse gas emissions from 2017 was mainly caused by reductions in emissions in the energy supply sector, down 6.6% (7.4 MtCO2e). This was driven by the continued decrease in power station emissions due to the change in the fuel mix for electricity generation, in particular a reduction in the use of coal and gas. Emissions from energy supply are now 62.3% lower than they were in 1990.
• Emissions from transport fell by 1.4% (1.8 MtCO2e) in 2018, their first fall since 2013. Despite this transport remains the largest emitting sector, responsible for 28% of all greenhouse gas emissions in the UK. Transport emissions are only 3.0% lower than in 1990, as increased road traffic has largely offset improvements in vehicle fuel efficiency.
• Between 2017 and 2018 emissions from the business sector decreased by 2.5% (2.1 MtCO2e) caused by falls from industrial combustion and from refrigeration and air conditioning. Emissions from industrial processes decreased by 7.3% (0.8 MtCO2e), caused by reduced emissions from the production of ammonia, halocarbons, iron and steel.
• There was an increase of 3.8% (2.5 MtCO2e) in residential sector emissions, driven by an increase in the use of natural gas for heating due to colder weather in the first half of 2018. Similarly, there was a 3.7% increase in public sector emissions. Emissions from both of these sectors tend to vary from year to year depending on the temperature.
Carbon dioxide (CO2) is the most dominant greenhouse gas from the Kyoto “basket” of greenhouse gases, accounting for 81% of total UK greenhouse gas emissions in 2018. The latest figures show:
• UK net CO2 emissions were estimated to be 365.7 million tonnes (Mt) in 2018, which was 2.2% lower than the 2017 figure of 373.8 Mt. This decrease in CO2 emissions was mainly due to the decrease in the use of coal and gas for electricity generation (as described above). Between 1990 and 2018 UK net CO2 emissions have decreased by 38.6%.
What you need to know about these statistics: This publication provides the latest estimates of 1990-2018 UK territorial greenhouse gas emissions, which are presented in carbon dioxide equivalent units (CO2e) throughout this statistical release. They show greenhouse gas emissions occurring within the UK’s borders and cover the Kyoto “basket” of seven greenhouse gases: carbon dioxide (CO2), methane (CH4), nitrous oxide (N2O), hydrofluorocarbons (HFC), perfluorocarbons (PFC), sulphur hexafluoride (SF6) and nitrogen trifluoride (NF3).
Introduction This publication provides the latest annual estimates of UK territorial greenhouse gas emissions from 1990-2018. The geographic coverage of this report is UK only unless stated otherwise. The figures in this statistical release are used as the basis for reporting against UK greenhouse gas emissions reduction targets and provide information for users on the drivers of emissions trends since 1990. Emissions are estimated following the guidance set out by the Intergovernmental Panel on Climate Change (IPCC1), as required for the UK’s submissions to the United Nations Framework Convention on Climate Change (UNFCCC) each year.
The estimates present emissions on a “territorial” basis, so only include emissions which occur within the UK’s borders. They therefore exclude emissions from UK businesses and residents that occur abroad, including from international aviation and shipping, and any emissions embedded within the supply chain of manufactured goods and services imported into the UK (while including emissions that occur in the UK resulting from exported goods and services).
Two additional approaches to estimating UK emissions are also published and the Office for National Statistics (ONS) has published an article that compares these different measures of the UK’s greenhouse gas emissions in more detail. The alternative measures are:
• ONS publishes emissions on a “residential” basis in the UK Environmental Accounts. The figures represent emissions caused by UK residents and businesses whether in the UK or abroad, but exclude emissions within the UK which can be attributed to overseas residents and businesses.
• The Department for Environment, Food and Rural Affairs (Defra) publishes the UK’s carbon footprint. This estimates emissions on a “consumption” basis, meaning it covers emissions associated with the consumption of goods and services by households in the UK. It includes estimates of emissions associated with each stage of the supply chain for those goods and services, regardless of where they occur, while excluding emissions occurring in the UK that are associated with the consumption of goods and services by households outside the UK.
The estimates in this publication are based on the source of the emissions rather than where the end-user activity occurred, so for example emissions related to electricity generation are attributed to power stations, where the emissions occur, rather than homes and businesses where the electricity is used. A breakdown of 1990-2018 UK territorial emissions by end-user sector will be published as an annex to this publication on Thursday 26 March 20202.
These estimates cover the Kyoto “basket” of seven gases: carbon dioxide (CO2), methane (CH4), nitrous oxide (N2O), hydrofluorocarbons (HFC), perfluorocarbons (PFC), sulphur hexafluoride (SF6) and nitrogen trifluoride (NF3). The last four gases are collectively referred to as fluorinated gases or F gases. In accordance with international reporting and carbon trading protocols, emissions from each of the gases is weighted by its global warming potential (GWP)3, so that total greenhouse gas emissions can be reported on a consistent basis. The GWP for each gas is defined as its warming influence relation to that of carbon dioxide over a
1 2006 IPCC Guidelines for National Greenhouse Gas Inventories: https://www.ipcc-nggip.iges.or.jp/public/2006gl/index.html 2 The Annex for 1990-2017 UK greenhouse gas emissions final figures by end-user and fuel type published in March 2019 can be found here: https://www.gov.uk/government/statistics/final-uk-greenhouse-gas-emissions-national-statistics-1990-2017 3 The global warming potentials (GWPs) used are from Working Group 1 of the IPCC Fourth Assessment Report: Climate Change 2007 and summarised in a table published on the following page: https://www.gov.uk/government/publications/uk-greenhouse-gas-emissions-explanatory-notes
100 year period. Greenhouse gas emissions are then presented in carbon dioxide equivalent units (CO2e).
Carbon dioxide is reported in terms of net emissions, which means total emissions minus total removals of carbon dioxide from the atmosphere by carbon sinks. Carbon sinks are defined by the UNFCCC as “any process, activity or mechanism which removes a greenhouse gas, an aerosol or a precursor of a greenhouse gas from the atmosphere”.
For the purposes of reporting, greenhouse gas emissions are allocated into sectors as follows:
Energy Supply Emissions from electricity generation and other energy production activities such as mining, refining and manufacturing fuels. In the end-user estimates these emissions are instead assigned between the other sectors based on where the electricity/fuel is used, or to the Exports sector where they are used abroad.
Business Emissions from fuel combustion and product use in industrial and commercial sectors, and F gas emissions from refrigeration and air conditioning in all sectors. Includes industrial off-road machinery but not business-related transport emissions, which are included in the Transport sector.
Transport Emissions from road transport, domestic aviation, railways and domestic shipping. Only includes emissions from vehicles and not from transport related infrastructure or from air conditioning. International aviation and shipping emissions are not included in national totals.
Public Emissions from the combustion of fuel in public sector buildings, e.g. hospitals and schools. Emissions from public transport are included in the Transport sector.
Residential Emissions from residential properties, including from consumer product use. Primarily consists of fuel combustion for heating/cooking, garden machinery, and fluorinated gases released from aerosols and metered dose inhalers.
Agriculture Emissions of greenhouse gases from livestock, agricultural soils (excluding carbon stock changes which are included in the LULUCF sector) and agricultural machinery.
Industrial processes Emissions resulting from industrial processes, except for those associated with fuel combustion which are included in the Business sector.
Land use, land use change and forestry (LULUCF)
Emissions/removals of CO2 from changes in the carbon stock in forestland, cropland, grassland, wetlands, settlements and harvested wood products, and of other greenhouse gases from drainage (excl. croplands and intensive grasslands) and rewetting of soils, nitrogen mineralisation associated with loss and gain of soil organic matter, and fires. Because the impact of biomass harvest on carbon stocks in ecosystems is included in this sector, any emissions of CO2 from burning biomass (regardless of the country of origin) are excluded from other sectors to avoid double counting them.
Waste management Emissions resulting from the treatment and disposal of solid and liquid waste, for example from landfill, incineration and composting. Emissions from incineration with energy recovery are instead reported in the Energy Supply sector and emissions from residential composting are included in the Residential sector.
2018 UK Greenhouse Gas Emissions, Final figures
5
References to the ‘UK Greenhouse Gas Inventory’ refer to the consistent time series of emissions from 1990 to the most recent year which is updated annually and reported to the UN and the EU. The figures in these statistics are consistent with the UK’s Greenhouse Gas Inventory for 1990-2018, although the inventory reported to the UN includes emissions from the UK’s Crown Dependencies and certain Overseas Territories which are excluded from these statistics except where specifically stated.
Note that as part of this release the 1990-2017 emissions figures have been revised since the previous publication in February 2019, to incorporate methodological improvements and new data, and the 2018 figures have been revised from the provisional estimates published in March 2019. Details of these revisions can be found later in this statistical release. When emissions are measured on this basis, UK emissions account for around 1% of the global total, based on a range of estimates produced by the UN, the International Energy Agency and the World Resources Institute amongst others.
2018 total greenhouse gas emissions
In the data tables accompanying this publication, table 1 shows UK greenhouse gas emissions since 1990 by gas.
In 2018, UK emissions of the basket of seven greenhouse gases covered by the Kyoto Protocol were estimated to be 451.5 million tonnes carbon dioxide equivalent (MtCO2e), a decrease of 2.1% compared to the 2017 figure of 461.0 million tonnes. Greenhouse gas emissions in 2018 are estimated to be 43.1% lower than they were in 1990.
Figure 1: Total UK greenhouse gas emissions, 1990-2018 (MtCO2e)
Source: Table 1, Final UK greenhouse gas emissions national statistics 1990-2018 Excel data tables
When broken down by gas, UK emissions are dominated by carbon dioxide, which is estimated to have accounted for about 81% of the UK’s greenhouse gas emissions in 2018. Weighted by global warming potential, methane accounted for about 11% of UK emissions and nitrous oxide for about 5% of emissions in 2018. Fluorinated gases accounted for the remainder, around 3%.
Carbon dioxide has always been the dominant greenhouse gas emitted in the UK. Emissions of CO2 have reduced by 38.6% (around 230 MtCO2) since 1990 to 365.7 MtCO2 in 2018, mainly due to decreases in emissions from power stations. There have been much larger proportional falls in emissions from methane (61.1% since 1990) and nitrous oxide (57.6%). Fluorinated gas (F gas) emissions are estimated to be 20.3% lower now than they were in 1990, with hydrofluorocarbons (HFCs) being the dominant F gas.
Figure 2: Greenhouse gas emissions by gas, UK, 2018 (%)
Source: Table 1, Final UK greenhouse gas emissions national statistics 1990-2018 Excel data tables
2018 UK Greenhouse Gas Emissions, Final figures
7
UK performance against emissions reduction targets
In the data tables accompanying this publication, table 9 shows the UK’s progress against its domestic and international targets.
Note: The carbon accounting regulations for 2018 have not yet been laid in Parliament, and so the UK’s progress against the first year of the third carbon budget is not yet available. Progress will be updated in an annex to this publication on 26 March 2020.
The Climate Change Act 2008
The UK has domestic targets for reducing greenhouse gas emissions under the Climate Change Act 2008 (CCA)4. The CCA established a long-term legally binding framework to reduce emissions, initially committing the UK to reducing emissions by at least 80% below 1990/95 baselines by 2050. In June 2019, following the IPCC’s Special Report on Global Warming of 1.5°C and advice from the independent Committee on Climate Change, the CCA was amended to commit the UK to achieving a 100% reduction in emissions (to net zero) by 2050.
The CCA also introduced carbon budgets, which set legally binding limits on the total amount of greenhouse gas emissions the UK can emit for a given five-year period5. The first carbon budget ran from 2008-12. In 2014, the UK confirmed that it had met the budget, with emissions 36 MtCO2e below the cap of 3,018 MtCO2e6. The second carbon budget ran from 2013-17. In 2019, the UK confirmed that it had met the budget, with emissions 384 MtCO2e below the cap of 2,782 MtCO2e7. A final statement for the third carbon budget, covering the period 2018-22, will be published in May 2024.
Compliance with carbon budgets is not assessed by directly comparing the budget level against UK greenhouse gas emissions. Instead, the budget level is compared to the UK’s ‘net carbon account’. The net carbon account is currently defined as the sum of three components:
• Emissions allowances allocated to the UK under the EU Emissions Trading System (EU ETS)8
• Emissions not covered by the EU ETS (‘non-traded’) • Credits/debits from other international trading systems
Projected performance against future carbon budgets can be found in the latest UK energy and emissions projections publication9.
4 Climate Change Act 2008: http://www.legislation.gov.uk/ukpga/2008/27/contents 5 Carbon budgets: https://www.gov.uk/guidance/carbon-budgets 6 Final statement for the first carbon budget period: https://www.gov.uk/government/statistics/final-statement-for-the-first-carbon-budget-period 7 Final statement for the second carbon budget period: https://www.gov.uk/government/statistics/final-statement-for-the-second-carbon-budget-period 8 The EU Emissions Trading System (EU ETS): https://ec.europa.eu/clima/policies/ets_en 9 Energy and emissions projections: https://www.gov.uk/government/collections/energy-and-emissions-projections
Figure 3: UK’s progress towards meeting carbon budget targets (MtCO2e)
Source: Table 9, Final UK greenhouse gas emissions national statistics 1990-2018 Excel data tables
Kyoto Protocol target
The Kyoto Protocol to the United Nations Framework Convention on Climate Change (UNFCCC) is an international agreement.
First Commitment Period (2008-2012) The UK met its emissions reductions target for the first commitment period of the Kyoto Protocol. Under the first commitment period of the Kyoto Protocol (2008-12), the EU and its Member States, Iceland and Norway collectively made a commitment to reduce greenhouse gas emissions across the EU by 8% on 1990 levels by 2012. As part of this, the UK undertook to reduce total greenhouse gas emissions by 12.5% below base year levels over the five-year period 2008-1210.
UK emissions of the basket of greenhouse gases covered by the Kyoto Protocol were an average 600.6 MtCO2e per year (exclusive of emissions trading) over the first commitment period (2008-12), 23% lower than base year emissions11.
Second Commitment Period (2013-2020) Under the second commitment period of the Kyoto Protocol (2013-2020) the EU and the Member States have a target to reduce emissions by 20% relative to the reference year (1990) over the period. The commitments of the EU and the Member States, and those of Iceland, are being fulfilled jointly in accordance with Article 4 of the Kyoto Protocol. In line with this target, EU emissions are split into (i) ‘traded sector’ emissions, covered by the EU Emissions Trading System which gives an overall EU-wide ‘cap’ on emissions from participating sectors; and (ii) ‘non traded sector’ emissions, which are covered by Member State-level targets under the
10 Council Decision (2002/358/EC) of 25 April 2002: http://www.eea.europa.eu/policy-documents/council-decision-2002-358-ec 11 Record of UK base year emissions: https://www.gov.uk/government/uploads/system/uploads/attachment_data/file/345163/base_year_tables.xlsx
Effort Sharing Decision (ESD). The Kyoto Protocol second commitment period also covers emissions from the land use, land use change and forestry (LULUCF) sector which are not covered by the ESD.
The UK has now ratified the Doha Amendment, but it has not yet come into force. These statistics therefore do not include information on the UK’s progress against its second commitment period target.
Beyond 2020 Following the 21st Conference of the Parties (COP21) of the UNFCCC in Paris in December 2015, 195 countries committed to adopt a global climate change Agreement. The Paris Agreement entered into force on 4 November 2016 and was ratified by the UK on 18 November 2016. Parties to the Paris Agreement are required to prepare, communicate and maintain successive Nationally Determined Contributions (NDCs). In 2015, the EU and its Member States (including the UK) submitted their NDC for the period 2021 to 2030. This established a target of at least a 40% reduction in domestic greenhouse gas emissions by 2030 compared to 1990 levels.
Now that the UK has left the EU, the UK will come forward with its own NDC. This will be without prejudice to future relationship negotiations with the EU on climate.
EU Effort Sharing Decision
The UK has annual greenhouse gas emissions limits under the EU Effort Sharing Decision (ESD) for the period 2013-2020. The ESD was agreed as part of the 2008 EU Climate and Energy package and came into force from January 2013. It sets out targets for EU Member States to either reduce or limit emissions by a certain percentage in the non-traded sector (i.e. covering most sectors not included in the EU Emissions Trading System), by 2020 from a 2005 baseline. The UK's 2020 target, based on relative GDP per capita, is to reduce emissions by 16% from 2005 levels, to be achieved through a declining limit for emissions for each year from 2013-202012.
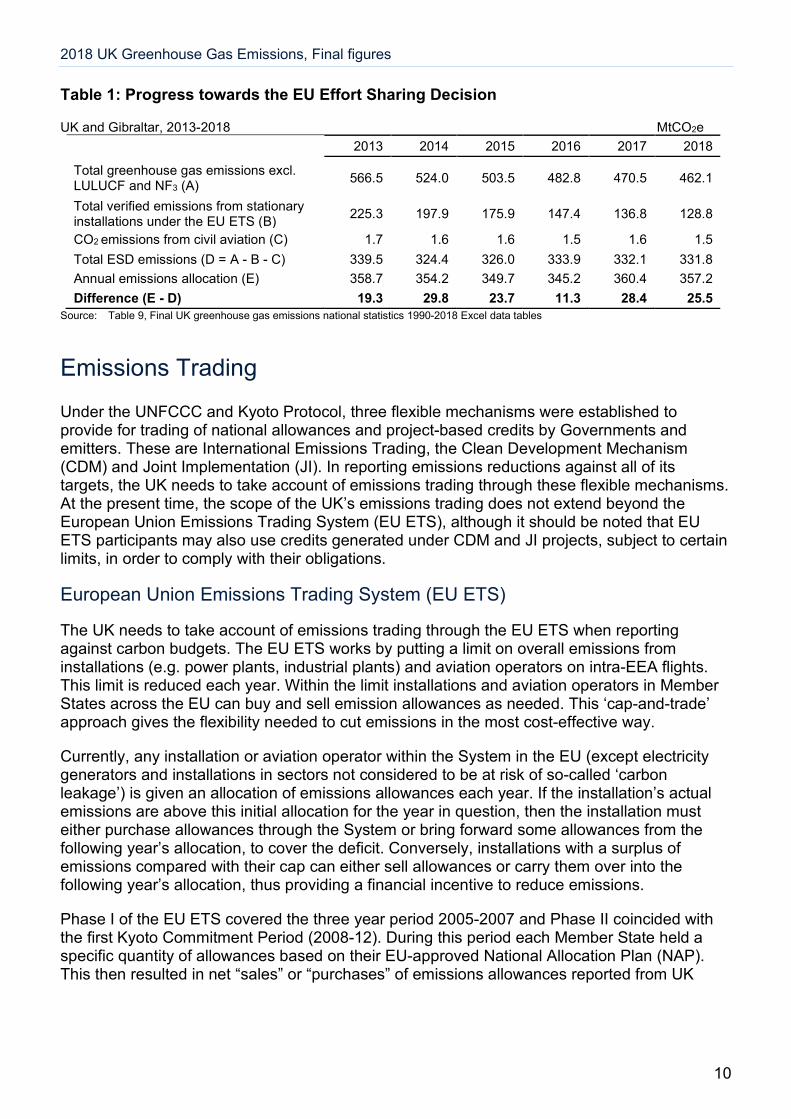
In November 2019 the European Commission confirmed for each Member State their performance against ESD for 201713. UK greenhouse gas emissions for 2017 under the ESD were confirmed to be 332.1 MtCO2e14, 28.4 MtCO2e below the UK’s annual limit for 2017 of 360.4 MtCO2e, meaning that the UK met its fifth annual target in the period. Provisional estimates indicate that greenhouse gas emissions for 2018 under the Effort Sharing Decision will also be below the annual emissions limit, by around 25.5 MtCO2e.
Table 1: Progress towards the EU Effort Sharing Decision
UK and Gibraltar, 2013-2018 MtCO2e
2013 2014 2015 2016 2017 2018
Total greenhouse gas emissions excl. LULUCF and NF3 (A) 566.5 524.0 503.5 482.8 470.5 462.1
Total verified emissions from stationary installations under the EU ETS (B) 225.3 197.9 175.9 147.4 136.8 128.8
CO2 emissions from civil aviation (C) 1.7 1.6 1.6 1.5 1.6 1.5 Total ESD emissions (D = A - B - C) 339.5 324.4 326.0 333.9 332.1 331.8 Annual emissions allocation (E) 358.7 354.2 349.7 345.2 360.4 357.2 Difference (E - D) 19.3 29.8 23.7 11.3 28.4 25.5
Source: Table 9, Final UK greenhouse gas emissions national statistics 1990-2018 Excel data tables
Emissions Trading
Under the UNFCCC and Kyoto Protocol, three flexible mechanisms were established to provide for trading of national allowances and project-based credits by Governments and emitters. These are International Emissions Trading, the Clean Development Mechanism (CDM) and Joint Implementation (JI). In reporting emissions reductions against all of its targets, the UK needs to take account of emissions trading through these flexible mechanisms. At the present time, the scope of the UK’s emissions trading does not extend beyond the European Union Emissions Trading System (EU ETS), although it should be noted that EU ETS participants may also use credits generated under CDM and JI projects, subject to certain limits, in order to comply with their obligations.
European Union Emissions Trading System (EU ETS)
The UK needs to take account of emissions trading through the EU ETS when reporting against carbon budgets. The EU ETS works by putting a limit on overall emissions from installations (e.g. power plants, industrial plants) and aviation operators on intra-EEA flights. This limit is reduced each year. Within the limit installations and aviation operators in Member States across the EU can buy and sell emission allowances as needed. This ‘cap-and-trade’ approach gives the flexibility needed to cut emissions in the most cost-effective way.
Currently, any installation or aviation operator within the System in the EU (except electricity generators and installations in sectors not considered to be at risk of so-called ‘carbon leakage’) is given an allocation of emissions allowances each year. If the installation’s actual emissions are above this initial allocation for the year in question, then the installation must either purchase allowances through the System or bring forward some allowances from the following year’s allocation, to cover the deficit. Conversely, installations with a surplus of emissions compared with their cap can either sell allowances or carry them over into the following year’s allocation, thus providing a financial incentive to reduce emissions.
Phase I of the EU ETS covered the three year period 2005-2007 and Phase II coincided with the first Kyoto Commitment Period (2008-12). During this period each Member State held a specific quantity of allowances based on their EU-approved National Allocation Plan (NAP). This then resulted in net “sales” or “purchases” of emissions allowances reported from UK
2018 UK Greenhouse Gas Emissions, Final figures
11
installations depending on whether total emissions were below or above the UK’s Phase II allocation15.
Phase III of the EU ETS (2013-20) builds upon the previous two phases and has been significantly revised to make a greater contribution to tackling climate change. The system shifted away from NAPs in favour of an EU-wide cap on the number of available allowances across Member States. In addition, a greater share of the allowances are sold at auction by Member States. In the absence of a UK-specific allocation plan, a notional cap has been estimated for the purpose of calculating carbon budget performance. Further details of this methodology are laid out in the Annual Statement of Emissions16.
In 2012, aviation was included in the EU ETS for the first time, and aircraft operators were required to report their annual emissions and surrender an equivalent number of allowances for all flights within the European Economic Area (EEA). However, UK carbon budgets only cover domestic aviation (that is, aviation within the UK). Taking into account these changes in EU ETS, from 2013 onwards domestic aviation emissions are included in the traded sector for UK carbon budget reporting purposes. To do so requires the calculation of a separate notional cap for UK domestic aviation, covering flights within the UK only.
Table 2: EU ETS net trading position as reported for carbon budgets performance
Net cancelled unallocated allowances/(sales) by UK Government1
0.9 0.9 0.9 0.9 0.9 - - - - -
Net UK domestic aviation emissions against aviation cap
- - - - - (0.1) (0.3) (0.2) (0.3) (0.3)
Net UK purchases/(sales) 20.2 (12.6) (6.7) (24.0) (13.6) 44.1 58.8 28.9 1.0 (27.9)
Source: Table 9, Final UK greenhouse gas emissions national statistics 1990-2018 Excel data tables Note:
1. At the end of Phase II of the EU ETS, the UK was required to cancel all allowances which have not been either issued or auctioned by that point. As a consequence, allowances totalling 4.5 MtCO2e were cancelled in 2012. These cancelled allowances have the effect of reducing the overall cap for the whole of Phase II. For presentational purposes, this amount has been distributed evenly over the five years 2008-2012, effectively reducing the cap by 0.9 MtCO2e each year.
2. Domestic aviation emissions are included in carbon budgets accounting from 2013.
3. From 2013, the EU ETS entered its third phase, which will end in 2020. Changes to the operating rules in this period mean that Member States no longer receive a national cap as the ETS operates at installation level. Therefore a ‘notional’ cap is estimated for the purpose of carbon budgets accounting.
4. Values in brackets indicate negative numbers or sales.
15 Note that a negative net value indicates that the reported emissions from UK installations in the EU ETS were below the cap, i.e. there was a net selling or withholding of units by UK installations. This means that emissions are either emitted elsewhere or emitted at a later stage, so they may not be used to offset UK emissions. The opposite occurs when reported emissions from EU ETS installations exceed the cap. 16 Annual Statement of Emissions: https://www.gov.uk/government/collections/annual-statements-of-emissions
In the data tables accompanying this publication, table 3 shows overall UK greenhouse gas emissions since 1990 by sector and source, while tables 4-7 show this breakdown for each individual gas.
All the sectoral breakdowns below are defined as by source, meaning emissions are attributed to the sector that emits them directly, as opposed to where the end-user activity occurred. A breakdown of 1990-2018 UK territorial emissions by end-user sector will be published as an annex to this publication on Thursday 26 March 2020.
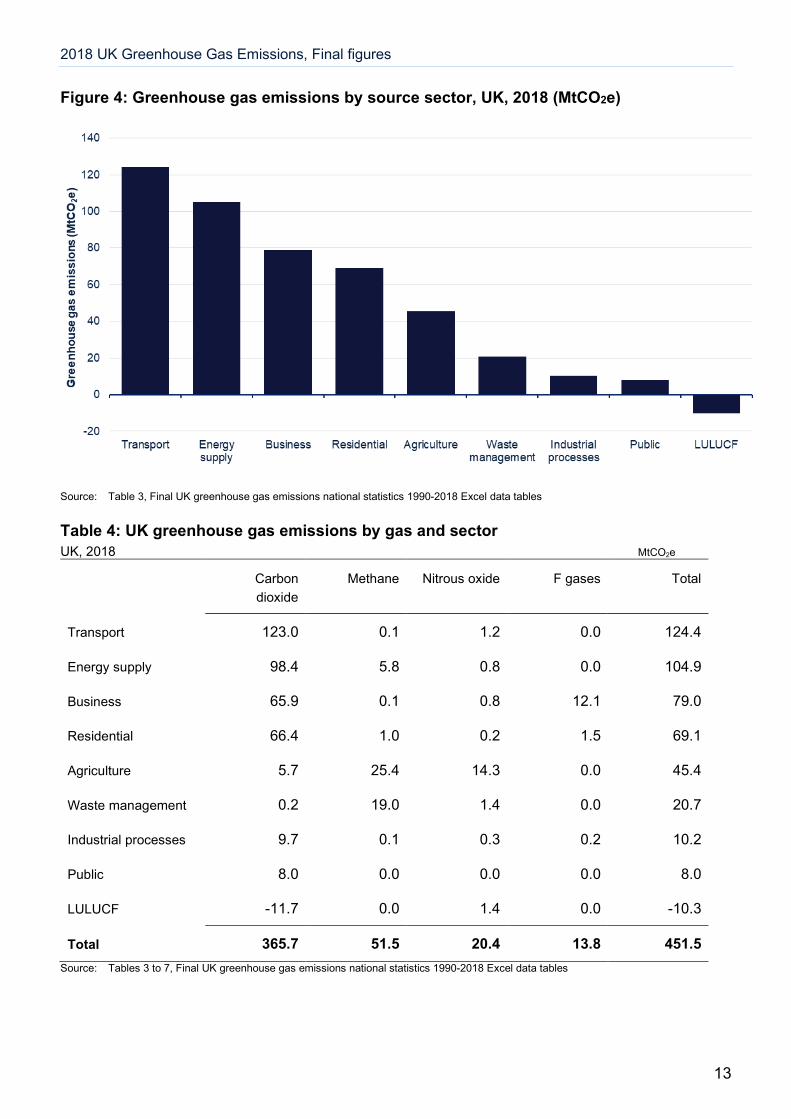
In 2018, 28% of net greenhouse gas emissions in the UK were estimated to be from the transport sector, 23% from energy supply, 18% from business, 15% from the residential sector and 10% from agriculture. The rest was attributable to the remaining sectors: waste management, industrial processes, and the public sector. The land use, land use change and forestry (LULUCF) sector acted as a net sink in 2018 so emissions were effectively negative.
Table 3: Sources of greenhouse gas emissions UK, 1990-2018 MtCO2e
1990 1995 2000 2005 2010 2015 2017 2018
Transport 128.1 129.7 133.3 136.0 124.5 123.5 126.1 124.4
Energy supply 278.0 238.0 221.6 231.5 207.4 145.3 112.3 104.9
Business 113.8 111.9 115.7 109.2 94.3 85.2 81.1 79.0
Total 793.8 745.4 707.9 683.9 600.9 497.9 461.0 451.5 Source: Table 3, Final UK greenhouse gas emissions national statistics 1990-2018 Excel data tables
Figure 4: Greenhouse gas emissions by source sector, UK, 2018 (MtCO2e)
Source: Table 3, Final UK greenhouse gas emissions national statistics 1990-2018 Excel data tables
Table 4: UK greenhouse gas emissions by gas and sector UK, 2018 MtCO2e
Carbon dioxide
Methane Nitrous oxide F gases Total
Transport 123.0 0.1 1.2 0.0 124.4
Energy supply 98.4 5.8 0.8 0.0 104.9
Business 65.9 0.1 0.8 12.1 79.0
Residential 66.4 1.0 0.2 1.5 69.1
Agriculture 5.7 25.4 14.3 0.0 45.4
Waste management 0.2 19.0 1.4 0.0 20.7
Industrial processes 9.7 0.1 0.3 0.2 10.2
Public 8.0 0.0 0.0 0.0 8.0
LULUCF -11.7 0.0 1.4 0.0 -10.3
Total 365.7 51.5 20.4 13.8 451.5 Source: Tables 3 to 7, Final UK greenhouse gas emissions national statistics 1990-2018 Excel data tables
2018 UK Greenhouse Gas Emissions, Final figures
14
Transport
The transport sector consists of emissions from road transport, railways, domestic aviation, shipping, fishing and aircraft support vehicles. It is estimated to have been responsible for around 28% of UK greenhouse gas emissions in 2018, almost entirely through carbon dioxide emissions. The main source of emissions from this sector is the use of petrol and diesel in road transport. Transport emissions fell by 1% between 2017 and 2018, despite a small increase in road traffic. The transport sector has historically been the second most emitting sector; however reductions over time in what was the largest sector (energy supply) mean that since 2016 transport has been the most emitting sector.
Between 1990 and 2018, there has been relatively little overall change in the level of greenhouse gas emissions from the transport sector. Between 1990 and 2007 (when emissions peaked) there was a general increasing trend, with some fluctuations year to year. After this peak, emissions declined each year until 2013, at which point this trend reversed to show small increases most years. The overall effect of these fluctuations over time means emissions are estimated to have been around 3% lower in 2018 than in 1990.
Road transport is the most significant source of emissions in this sector, in particular passenger cars; and the changes which have been seen over the period were heavily influenced by this category. Figure 5 shows how the volume of traffic on the roads has changed over time in Great Britain, which reflects the trend seen for the UK. Motor vehicle traffic volumes have generally increased throughout this period, other than a fall seen between 2007 and 2012 following the recession.
However, with lower petrol consumption outweighing an increase in diesel consumption17 and improvements in fuel efficiency of both petrol and diesel cars18, the volume of emissions from passenger cars has generally decreased since the mid-2000s. Although this has been partially offset by an increase in emissions from light commercial vehicles. Emissions of carbon dioxide are closely related to the amount of fuel used, whilst nitrous oxide and methane emissions are influenced more by the vehicle type and age.
17 Transport Statistics Great Britain, Energy and environment (TSGB03), Table TSGB0301 (ENV0101) Petroleum consumption by transport mode and fuel type: United Kingdom from 2000: https://www.gov.uk/government/statistical-data-sets/tsgb03 18 Transport Statistics Great Britain, Energy and environment (TSGB03), Table TSGB0303 (ENV0103) Average new car fuel consumption: Great Britain from 1997: https://www.gov.uk/government/statistical-data-sets/tsgb03
The energy supply sector consists of emissions from fuel combustion for electricity generation and other energy production sources. It is estimated to have been responsible for 23% of UK greenhouse gas emissions in 2018, with carbon dioxide being by far the most prominent gas for this sector (94%). The main source of emissions from this sector is the use of natural gas and coal in electricity generation from power stations.
There was a 7% fall in emissions from the energy supply sector between 2017 and 2018, meaning that between 1990 and 2018 they have reduced by 62%. This decrease has resulted mainly from changes in the mix of fuels being used for electricity generation, including the growth of renewables; together with greater efficiency resulting from improvements in technology. The energy supply sector has historically been the largest emissions sector; however these reductions mean that since 2016 it has been the second largest sector (the largest sector being transport).
Since 1990 there has been a decline in the use of coal at power stations and an increase in the use of gas, which has a lower carbon content so results in fewer emissions. Coal use in generation reduced by 91% between 1990 and 201819. Electricity generation was 6% higher in 2018 than in 1990, although it peaked in 2005 and has decreased since then20.
There was a 24% decrease in coal use for electricity generation between 2017 and 2018. This follows large falls in 2016 and 2017 driven by the increase in the carbon price floor in April 2015, from £9 per tonne of CO2 to £18 per tonne of CO2, which led to a shift away from coal towards gas21. In 2018 there was also a fall in the use of gas for electricity generation of 4%, whereas renewables saw a 19% increase. In 2018, total greenhouse gas emissions from power stations, at 66.8 MtCO2e, accounted for 15% of all UK greenhouse gas emissions.
The other main factor which has noticeably contributed to the long-term decline in emissions in the energy sector has been in relation to coal mining. The production of deep-mined coal in particular has declined steadily over the period, with the last three large deep mines all closing in 2015. Emissions from coal mining and handling have fallen from 21.8 MtCO2e in 1990 to only 0.5 MtCO2e in 2018.
19 Digest of United Kingdom Energy Statistics, Table 5.1.1 Fuel input for electricity generation, 1970 to 2018 https://www.gov.uk/government/uploads/system/uploads/attachment_data/file/632667/DUKES_5.1.1.xls 20 Digest of United Kingdom Energy Statistics, Table 5.1.3 Electricity generated and supplied, 1970 to 2018 https://www.gov.uk/government/uploads/system/uploads/attachment_data/file/632669/DUKES_5.1.3.xls 21 Digest of United Kingdom Energy Statistics, Chapter 5 Electricity https://www.gov.uk/government/statistics/electricity-chapter-5-digest-of-united-kingdom-energy-statistics-dukes
The business sector consists of emissions from combustion in industrial/commercial sectors, industrial off-road machinery, and refrigeration and air conditioning. Between 2017 and 2018 there was a 3% decrease in emissions from the business sector and it is estimated to have been responsible for 18% of UK greenhouse gas emissions in 2018, with carbon dioxide being the most prominent gas. Emissions from this sector primarily relate to fossil fuel combustion in industry and commerce, although emissions of F gases from the use of fluorinated compounds in certain applications, particularly refrigeration and air-conditioning, are also significant. The business sector is responsible for the majority of emissions from F gases.
In 2018, emissions from the business sector were 31% lower than 1990 emissions. Most of this decrease came between 2001 and 2009, with a significant drop in 2009 likely driven by economic factors. There has been a gradual decline in emissions in recent years. The main driver of the decrease in emissions since 1990 is a reduction in emissions from industrial combustion (including iron and steel) which has led to a 41% reduction in carbon dioxide emissions since 1990. However, emissions from F gases have increased significantly, mainly due to an increase in emissions from refrigeration and air-conditioning as HFCs replaced ozone depleting substances which were previously used as refrigerants. This increasing trend slowed in recent years and since 2015 has reversed, following the introduction of the HFC phase down as part of the EU’s 2014 F-Gas Regulation.
Figure 9: Greenhouse gas emissions from business, UK 1990-2018 (MtCO2e)
Source: Tables 3 to 7, Final UK greenhouse gas emissions national statistics 1990-2018 Excel data tables
2018 UK Greenhouse Gas Emissions, Final figures
19
Residential
The residential sector consists of emissions from fuel combustion for heating and cooking, garden machinery, and fluorinated gases released from aerosols and metered dose inhalers. It is estimated to have been responsible for around 15% of UK greenhouse gas emissions in 2018, with carbon dioxide being the most prominent gas for this sector (96%). The main source of emissions from this sector is the use of natural gas for heating and cooking.
It should be noted that since these figures are estimates of emissions by source, emissions related to residential electricity use, including electricity use for heating, are attributed to power stations and are therefore included in the energy supply sector rather than the residential sector.
Between 1990 and 2018, there has been considerable variation in greenhouse gas emissions from year to year in the residential sector. In general, carbon dioxide emissions from this sector are particularly heavily influenced by external temperatures, with colder temperatures driving higher emissions due to increased use of heating.
Temperature was the main driver of the 4% increase in residential emissions between 2017 and 2018. The average temperature across the year was on average the same in 2018 as in 2017, but 2018 had a particularly cold February and March, with average temperatures over 3 degrees Celsius lower than in 2017 in both months22, increasing the use of natural gas for heating. Further information on the impact of external temperatures on emissions can be found later in this statistical release.
Figure 10: Greenhouse gas emissions from the residential sector, UK 1990-2018 (MtCO2e)
Source: Tables 3 to 7, Final UK greenhouse gas emissions national statistics 1990-2018 Excel data tables
22 Energy Trends: Weather Table ET 7.1 Average temperatures, heating degree days and deviations from the long term mean https://www.gov.uk/government/statistics/energy-trends-section-7-weather
The agriculture sector consists of emissions from livestock, agricultural soils, stationary combustion sources and off-road machinery. It is estimated to have been responsible for 10% of UK greenhouse gas emissions in 2018. Emissions of methane (56%) and nitrous oxide (31%) dominate this sector. The most significant sources here are emissions of methane due to enteric fermentation from livestock, particularly cattle; and nitrous oxide emissions related to the use of fertilisers on agricultural soils.
Between 1990 and 2018, greenhouse gas emissions from agriculture decreased by around 16%, with a general downward trend in emissions since the late 1990s. This was driven by a fall in animal numbers over the period, together with a decrease in synthetic fertiliser use.
Between 2017 and 2018 there was a 1% decrease in emissions from the agriculture sector.
Figure 11: Greenhouse gas emissions from agriculture, UK 1990-2018 (MtCO2e)
Source: Tables 3 to 7, Final UK greenhouse gas emissions national statistics 1990-2018 Excel data tables
Waste management
The waste management sector consists of emissions from waste disposed of to landfill sites, waste incineration, and the treatment of waste-water. It is estimated to have been responsible for around 5% of UK greenhouse gas emissions in 2018, with methane being by far the most prominent gas (accounting for 92% of emissions). The vast majority of these emissions are from landfill sites.
Between 1990 and 2018, greenhouse gas emissions from the waste management sector decreased by 69%. This was due to a combination of factors, including improvements in the standards of landfilling, changes to the types of waste going to landfill (such as reducing the
2018 UK Greenhouse Gas Emissions, Final figures
21
amount of biodegradable waste), and an increase in the amount of landfill gas being used for energy.
Emissions in the waste management sector rose by 1% between 2017 and 2018 due mainly to increased emissions from landfill.
Figure 12: Greenhouse gas emissions from waste management, UK 1990-2018 (MtCO2e)
Source: Tables 3 to 7, Final UK greenhouse gas emissions national statistics 1990-2018 Excel data tables
Industrial processes
The industrial processes sector consists of emissions from industry except for those associated with fuel combustion. It is estimated to have been responsible for 2% of UK greenhouse gas emissions in 2018, with carbon dioxide being the most prominent gas. The largest source of emissions was cement production, with other processes such as sinter, lime, and iron and steel production also contributing significantly.
Between 1990 and 2018, there was a large reduction in greenhouse gas emissions from the industrial processes sector, with an overall decrease of 83%. This was most notably due to a large reduction in emissions from adipic acid production and halocarbon production between 1998 and 1999 (combined emissions from which are now almost zero).
Emissions in the industrial processes sector decreased by 7% in 2018 compared to 2017. This was mainly caused by reduced emissions from the production of ammonia, halocarbons, and iron and steel.
2018 UK Greenhouse Gas Emissions, Final figures
22
Figure 13: Greenhouse gas emissions from industrial processes, UK 1990-2018 (MtCO2e)
Source: Tables 3 to 7, Final UK greenhouse gas emissions national statistics 1990-2018 Excel data tables
Public
The public sector consists of emissions from combustion of fuel in public sector buildings, such as schools, hospitals and offices. It is estimated to have been responsible for less than 2% of UK greenhouse gas emissions in 2018, with carbon dioxide making up almost all of these emissions. The main source of emissions from this sector is the use of natural gas for heating public buildings.
Between 1990 and 2018 there has been a general downward trend in greenhouse gas emissions from the public sector, which have fallen by 41% over this period. This has been driven by a change in the fuel mix, with less use of coal and oil, and more use of natural gas.
Between 2017 and 2018 emissions increased by 4% in the public sector. As with the residential sector this is likely to be due to cooler temperatures increasing the use of gas for heating.
2018 UK Greenhouse Gas Emissions, Final figures
23
Figure 14: Greenhouse gas emissions from the public sector, UK 1990-2018 (MtCO2e)
Source: Tables 3 to 7, Final UK greenhouse gas emissions national statistics 1990-2018 Excel data tables
Land use, land use change and forestry (LULUCF)
The LULUCF sector consists of emissions and removals from forest land, cropland, grassland, settlements and harvested wood products. It acted as a net sink23 of UK greenhouse gas emissions in 2018, dominated by carbon dioxide removals. In general, settlements and cropland are the largest sources of carbon dioxide emissions, while forest land and grasslands are the dominant sinks.
In the UK the LULUCF sector is estimated to have been a net sink in every year from 1990-2018, with the estimated size of the sink increasing from 0.1 MtCO2e in 1990 to 10.3 MtCO2e in 2018. This has been driven by a reduction in emissions from land being converted to cropland and an increase in the sink provided by forest land, with an increasing uptake of carbon dioxide by trees as they reach maturity, in line with the historical planting pattern. There has also been some reduction in emissions since 1990 due to less intensive agricultural practices.
Between 2017 and 2018 there was a 2% increase in the size of the net sink provided by the LULUCF sector.
23 Carbon sinks are defined by the UNFCCC as “any process, activity or mechanism which removes a greenhouse gas, an aerosol or a precursor of a greenhouse gas from the atmosphere”.
2018 UK Greenhouse Gas Emissions, Final figures
24
Figure 15: Greenhouse gas emissions from the LULUCF sector, UK 1990-2018 (MtCO2e)
Source: Tables 3 to 7, Final UK greenhouse gas emissions national statistics 1990-2018 Excel data tables
2018 UK Greenhouse Gas Emissions, Final figures
25
Emissions from UK-based international aviation and shipping bunkers
In the data tables accompanying this publication, table 8 shows greenhouse gas emissions arising from use of fuels from UK international aviation and shipping bunkers since 1990.
Emissions from international aviation and shipping can be estimated from refuelling from bunkers24 at UK airports and ports, whether by UK or non-UK operators. Under the reporting guidelines agreed by the UNFCCC, these emissions are not included in the UK’s emissions total, but are reported as memo items in national greenhouse gas inventories. Parties to the UNFCCC are required to act to limit or reduce emissions from international services working through the International Civil Aviation Organisation (ICAO) and International Maritime Organisation (IMO).
It is important to note that whether emissions from refuelling at UK-based international aviation and shipping bunkers can be used as an accurate estimate of UK international aviation and shipping emissions will depend on what assumptions are being made about how to allocate international aviation and shipping emissions to different countries. In the International Civil Aviation Organisation, 193 states have agreed to implement a sectoral approach to tackling international aviation emissions, in the form of a “global market-based measure” known as the Carbon Offsetting and Reduction Scheme for International Aviation (CORSIA), which does not allocate emissions to states. Under the scheme, airlines will offset their international aviation emissions with reductions from other sectors, with the aim of delivering carbon-neutral growth of the sector from 202025.
At the International Maritime Organization, the 2018 Initial Strategy on Reduction of GHG Emissions from Ships26 commits Member States to peak greenhouse gas emissions from international shipping as soon as possible and to reduce the total annual greenhouse gas emissions by at least 50% by 2050 compared to 2008 while pursuing efforts towards phasing them out as soon as possible this century.
In 2018, emissions from international aviation fuel use from UK bunkers were estimated to be 36.7 MtCO2e. This was 1.1% larger than the 2017 figure. Between 1990 and 2006, when emissions reached a peak, emissions more than doubled from 15.5 MtCO2e to 35.6 MtCO2e. After 2006 emissions flattened out, but have risen again in the last two years to above the 2006 total. High altitude aviation has a greenhouse effect over and above that of carbon dioxide emissions from fuel alone, but this is not reflected in these estimates.
Emissions from UK international shipping bunkers were estimated to be 7.9 MtCO2e in 2018, a small decrease of 0.2% from the 2017 level. Since 1990, emissions from UK shipping bunkers have fluctuated, as can be seen in the chart below, but in recent years have been at around the same level that they were in 1990.
24 A large container or compartment that stores fuel for ships or aircraft. 25 https://www.icao.int/environmental-protection/CORSIA/Pages/default.aspx 26 https://unfccc.int/sites/default/files/resource/250_IMO submission_Talanoa Dialogue_April 2018.pdf
Figure 16: Greenhouse gas emissions from UK-based international aviation and shipping bunkers, 1990-2018 (MtCO2e)
Source: Table 8, Final UK greenhouse gas emissions national statistics 1990-2018 Excel data tables
Revisions from provisional estimates of greenhouse gas emissions Provisional estimates of 2018 UK greenhouse gas and carbon dioxide emissions were published in March 2019, based on early estimates of energy consumption for the year. Differences between the provisional and final estimates arise primarily due to revisions to other statistics on which these estimates were based, use of actual data to estimate non-CO2 emissions which are only estimated in a simplistic way in the provisional estimates, and methodological changes to the way emissions are calculated.
Typically the provisional estimates provide a better indication of emissions trends than of absolute emissions, as they do not take account of any methodological improvements that may be made to the way emissions are calculated and which can lead to revisions to the whole emissions time series from 1990 onwards. More information on revisions to the time series can be found in the next section.
It was provisionally estimated that total greenhouse gas emissions in 2018 for the UK would be 448.5 MtCO2e, representing a 2.5% decrease on 2017 emissions. The final estimates show that 2018 emissions were 451.5 MtCO2e, representing a 2.1% decrease on 2017 emissions. The provisional greenhouse gas emissions estimates therefore slightly underestimated total greenhouse gas emissions (by 0.6%) and slightly overestimated the percentage decrease in emissions from 2017 to 2018 (by 0.5 percentage points).
2018 UK Greenhouse Gas Emissions, Final figures
27
The provisional estimates are focused on carbon dioxide emissions from the energy sector, and only provided a simplistic estimate of non-CO2 gases which assumed that the 2018 emissions for non-CO2 gases changed from the 2017 total in line with the percentage difference between the estimates for the 2017 and 2018 of total non-CO2 emissions in the 2017 Energy and Emissions Projections27 published by BEIS. Looking just at carbon dioxide emissions, it was provisionally estimated that net UK carbon dioxide emissions in 2018 would be 364.1 million tonnes. The final 2018 figure of 365.7 million tonnes therefore shows that the provisional estimate underestimated CO2 emissions by 0.4%.
The provisional estimate of non-CO2 gases was 84.4 MtCO2e and the final estimate is 85.8 MtCO2e so these emissions are 1.7% higher than reported in the provisional estimates. This was largely due to waste management emissions increasing where the projections had anticipated a fall.
Table 5: Comparison of 2018 provisional and final estimates UK, 2017-2018
MtCO2e
2018
Provisional estimates
2018 Final estimates
Difference between final
and provisional
Provisional 2017 to 2018
% change
Final 2017 to 2018 % change
Total CO2 364.1 365.7 1.5 -2.4% -2.2%
Non-CO2 gases 84.4 85.8 1.4 -3.0% -1.6%
All greenhouse gases 448.5 451.5 2.9 -2.5% -2.1% Source: Table 1, Final UK greenhouse gas emissions national statistics 1990-2018 Excel data tables
Table 1, Provisional UK greenhouse gas emissions national statistics 2018 Excel data tables
Revisions to the UK’s Greenhouse Gas Inventory The UK Greenhouse Gas Inventory (the time series of emissions from 1990 onwards which is the basis for these statistics), is reviewed every year internally and externally (including a review by the UNFCCC), and the whole historical data series is revised where necessary to incorporate methodological improvements, changes to international reporting guidelines or new data. This takes into account revisions to the datasets which have been used in its compilation, most notably the UK energy statistics published in the Digest of UK Energy Statistics (DUKES). The methodological changes to the UK Greenhouse Gas Inventory can also impact future emissions projections. Full details of the methods used to produce the latest greenhouse gas emissions estimates will be published in the UK’s National Inventory Report28 (NIR).
These changes are applied back through the time series to 1990 in order to ensure that the trend in emissions from 1990 to the latest year is based on a consistent method. Therefore, it is not appropriate to compare the emissions time series from one year with that from another.
27 Energy and emissions projections: https://www.gov.uk/government/collections/energy-and-emissions-projections 28 Previous UK NlRs can be found here: http://naei.beis.gov.uk/reports/ and the latest NIR covering 1990-2018 emissions will be submitted to the UNFCCC on 15th April 2020.
However, the latest inventory represents a single consistent data series going back to 1990, and this therefore allows year-on-year comparisons to be made.
The most notable methodological changes to the historical series since the 2019 Greenhouse Gas Inventory was published are revisions to the LULUCF sector, while revisions to the datasets used in producing these estimates have led to changes across most sectors for more recent years. Details of the changes made to estimates of 1990 and 2017 emissions are given below. Revisions to other years of the time series are of a similar scale.
Table 6: Revisions in the 2020 Greenhouse Gas Inventory, by sector UK, 1990 and 2017
MtCO2e 1990 emissions 2017 emissions
2019 inventory
2020 inventory
Change
2019 inventory
2020 inventory
Change
Energy supply 277.9 278.0 ~0.0 112.6 112.3 -0.3
Transport 128.1 128.1 ~0.0 125.9 126.1 0.2
Business 114.0 113.8 -0.2 80.1 81.1 1.0
Residential 80.1 80.1 ~0.0 66.9 66.6 -0.3
Agriculture 54.0 54.0 ~0.0 45.6 45.8 0.2
Waste management 66.6 66.6 ~0.0 20.3 20.4 0.1
Industrial processes 59.9 59.9 ~0.0 10.8 11.0 0.2
Public 13.5 13.5 ~0.0 7.8 7.7 -0.1
LULUCF 0.3 -0.1 -0.4 -9.9 -10.1 -0.2
Total 794.4 793.8 -0.5 460.2 461.0 0.8 ~0.0 indicates where a value is non-zero but is less than either 0.05 MtCO2e in magnitude. Source: Table 3, Final UK greenhouse gas emissions national statistics 1990-2018 Data tables
Table 3, Final UK greenhouse gas emissions national statistics 1990-2017 Data tables
Within the sectors there have also been some changes made to the names of source categories this year, either to clarify them or to denote a change in coverage compared to the previous publication. These are summarised below.
2018 UK Greenhouse Gas Emissions, Final figures
29
Source category Sector Reason for change
Closed foams Business This is a renaming of the Foams category from previous publications, to make it clearer and distinguish it from the One component foams category. The coverage is unchanged.
Industrial combustion and electricity (excl. iron and steel)
Business This is a renaming of the Other industrial combustion and electricity category from previous publications to make it clearer. The coverage is unchanged.
Commercial and miscellaneous combustion and electricity
Business This is a renaming of the Miscellaneous industrial and commercial combustion and electricity category from previous publications to make it clearer. The coverage is unchanged.
Railways - mobile combustion
Transport This is a renaming of the Railways from previous publications, to make it clearer and distinguish it from the Railways - stationary combustion category. The coverage is unchanged.
Recreational use of N2O
Residential This is a new category this year. These emissions were previously included in the Use of N2O category in the Industrial processes sector, but inclusion in the Residential sector was judged to be more appropriate.
Soda ash production & use
Industrial processes
This is a renaming of the Soda ash production category from previous publications to reflect that it now includes some emissions from soda ash use, which have been included in these statistics for the first time this year.
Details of the methodological changes made to the emissions estimates this year are given below.
Additional sources from soda ash use
Based on a recommendation from the UNFCCC, estimates have been made of CO2 emissions for the use of soda ash (sodium carbonate) for applications other than glass production. While glass production is already included in the inventory, non-glass uses of soda ash were previously reported as “not estimated” due to their falling below the threshold of significance (0.01% of the inventory total or 500 ktCO2e, whichever is lower). The UNFCCC requested that we find stronger evidence that emissions were low enough to remain unreported, and in doing so the evidence we found was good enough to report. Therefore, despite emissions from non-glass uses of soda-ash being small enough to remain un-estimated – 26 ktCO2e in 1990 and 19 ktCO2e in 2017, representing approximately 0.004% of total emissions – we now estimate them as we now have the data to do so. The estimates include soda ash converted to sodium bicarbonate.
Transition to energy units for fuels
The handling of fuels activity data and emission factors are now being done in units of terajoule (TJ (net)) at the earliest practicable stage in the process. TJ (net) are the international standard
2018 UK Greenhouse Gas Emissions, Final figures
30
units for inventory reporting and guidance, so moving to use these units reduces the number of conversions required when utilising international data and reporting using common metrics.
The impact of this work has not been calculated as the impact will be felt across a great number of sectors, so it is not practicable to distinguish the impact of this from the routine recalculations across the dozens of models that this work would impact. Also note that we would expect the recalculations cause by this transition to be very limited as the unit conversion on emission factors and activity data should cancel out when calculating emissions, so the only impact would be rounding errors due to the use of subtly different calculations.
Oil and gas fugitive emissions
Three short studies into fugitive emissions from the energy sector were conducted in 2019. None of these studies have led to any notable recalculation of emission estimates in any year except 2012. Key outcomes from the studies are as follows:
• Downstream gas fugitives: there are no data recalculations this year; however, two studies are ongoing to address potential small gaps in the inventory;
• Upstream oil and gas fugitives: access to new data sources but further analysis is required before any changes are implemented in the inventory so no data recalculations have occurred as a result this year;
• Emission estimate from the Elgin field gas leak in the North Sea in 201229: a new emission estimate for methane (64 ktCO2e) has been estimated based on a research publication and added to the 2012 dataset.
Rail emissions and emission factors improvement
Improvements have been made to the 2018 rail emission estimates. Key emission factors used for rail in the GHGI were revised based on a recent Rail Standards and Safety Board project to develop new emission factors by engine power output which covered around 50% of the UK diesel fleet. The size of the recalculation in 2017 is a slight reduction in methane emissions of 0.001kt (one tonne) CO2e.
Minor LULUCF carbon stock changes
Minor changes were made to the carbon stock changes of forest land remaining forest land, land converted to forest land, and cropland remaining cropland. The most significant of these was in forest land remaining forest land though the overall impact of the changes is a 28 ktCO2e increase to emissions in the base year, and a 10 ktCO2e increase in emissions in 2017.
• Forest land remaining forest land: Wood production statistics are used as an input into the model that produces these estimates. In order to address some problems in the resulting estimates prior to the start of the wood production statistics (i.e. pre-1976), Food and Agriculture Organisation (FAO) data was used to extend the data back to 1961. The overlap method was used to make the FAO data consistent with the wood production statistics and the UK level data was divided between the Devolved
Administrations and private/public forest estates on the pro-rata basis, using the 1976 estimates.
The estimated level of conifer thinning was increased for Scotland and Wales to smooth the modelled wood production in order to reduce discontinuities in the time series.
A number of changes were made to the CARBINE model for estimating carbon stocks that addressed some issues identified during a verification exercise such as an underestimate of dead organic matter on deforested land.
• Land converted to forest land: Changes were made to the planting data and the CARBINE model as described for forest Land remaining forest Land.
• • Cropland remaining cropland: There was a change in the equilibrium soil carbon
density from values for 0-100cm of the soil profile to values for the top 0-30cm of soil30. As a result, there is an upward shift in emissions throughout the time series. An adjustment was also made to the cropland areas for potatoes and sugar beet in England in 2017, and for the areas of oats in England from 1971-1973.
Harvested wood products changes
Harvested wood products are reported under LULUCF. As described for forest land remaining forest land, the overlap method as used to make FAO data consistent with the wood production statistics and the estimated level of conifer thinning was also increased. The overall change from this is a reduction in emissions (increased draw-down) in 1990 of 458 ktCO2e and a reduction of 2017 emissions (increased draw-down) of 359 ktCO2e.
Overseas Territories and Crown Dependencies LULUCF estimation changes
Previously some categories within the LULUCF sector have not been included in the UK inventory for Overseas Territories and Crown Dependencies as the estimates were found to be below the threshold at which countries are not required to include sources in their greenhouse gas inventories. However, it was recommended in the September 2019 inventory review by the UNFCCC that the insignificance threshold cannot be applied to geographical sub-regions within a category for which emissions are already reported for the UK, so forest and grassland wildfires in Overseas Territories and Crown Dependencies are required to be reported.
Calculations have now been introduced for Guernsey, Jersey and the Isle of Man based on the rate of burning in UK forests. The calculations for the Cayman Islands are based on the rate of burning in Cuba. There is no forest land in the Falkland Islands or Gibraltar and the fire statistics for Bermuda state zero forest area burnt. For wildfires from grassland the calculations for Guernsey, Jersey, Isle of Man, the Falkland Islands and the Cayman Islands are based on the rate of burning of UK grassland. This method follows the geographical proxy guidelines (with no closer proxy available for the Falkland Islands and the Cayman Islands). Fire statistics
30 Bradley, R. I., R. Milne, et al. (2005). A soil carbon and land use database for the United Kingdom. Soil Use and Management 21(004): 363
369.
2018 UK Greenhouse Gas Emissions, Final figures
32
for Bermuda state zero area burnt. The emissions are highest from the Falkland Islands which has a large grassland area.
Small changes to cropland and settlement emissions have also occurred as a result of moving to a coded model, when small methodological improvements have been made. Emissions and removals for changes in settlement were calculated for Bermuda and the Cayman Islands for the first time.
The overall change for LULUCF from Overseas Territories and Crown Dependencies is an increase of 280 ktCO2e for 1990 and 304 ktCO2e for 2017. This does not affect the UK totals presented in table 6 and throughout most of this publication.
Regulatory Inventory Database
A new database system for processing emissions data from various regulatory inventories into emissions estimates for the UK inventory has been introduced. The new system automates the processing, leading to greater consistency in the application of assumptions used to deal with gaps and outliers in the regulator inventory datasets. This has led to some changes as part of the overhaul of systems involved reviewing and updating some of the assumptions used in gap-filling procedures.
Improvement to carbon factors for coal used in the cement industry
The UK inventory agency has received an updated set of carbon emission factors from the cement sector trade association, which indicate that the coal carbon emission factors dating back to 2000 (and also with a 1990 data point) were lower than those used in previous submissions. The lower carbon emission factors for the early part of the time series have been determined as more consistent with the large industry dataset of carbon emission factors now available, leading to recalculations back to 1990.
Minor LULUCF Recalculations
A series of minor changes were made to the LULUCF calculations.
• Forest land remaining forest land wildfire emissions: there has been an addition of wildfire data in Scotland which has increased wildfire emissions for 2014.
• Land converted to forest land soil mineralisation for the UK: changes to planting data and the CARBINE model as described previously have an impact on soil carbon stock exchange from which nitrous oxide (N2O) emissions due to mineralisation are calculated.
• Forest land drainage for the UK: changes to the forest planting time series directly impacts calculations for forest drainage which are based on the areas of forest planted on different soil types.
2018 UK Greenhouse Gas Emissions, Final figures
33
• Forest land converted to grassland controlled burning emissions/forest land converted to settlements controlled burning: calculation for controlled burning following deforestation are now made directly from biomass lost as estimated by the CARBINE model instead of from deforested area multiplied by average biomass densities. Estimates of deforestation were altered due to reprocessing of Countryside Survey data and using Forestry England Corporate Indicators report to estimate deforestation in England for 2017-2018.
• Forest land converted to grassland carbon stock change/forest land converted to settlements carbon stock change: as for controlled burning emissions recalculations, there were alterations to deforestation estimates. Additionally, carbon stock change in living biomass and dead organic matter is now estimated by the CARBINE model instead of from deforested area by average biomass densities.
2018 UK Greenhouse Gas Emissions, Final figures
34
Accompanying tables The following tables are available in Excel and ODS format on the department’s statistics website:
Table 1 Estimated territorial greenhouse gas emissions by gas, UK 1990-2018 Table 2 Estimated territorial greenhouse gas emissions by geographical coverage and gas,
UK, Crown Dependencies & Overseas Territories 1990-2018 Table 3 Estimated territorial greenhouse gas emissions by source category, 1990-2018 Table 4 Estimated territorial emissions of Carbon Dioxide (CO2) by source category, 1970-
2018 Table 5 Estimated territorial emissions of Methane (CH4) by source category, 1990-2018 Table 6 Estimated territorial emissions of Nitrous Oxide (N2O) by source category, 1990-2018 Table 7 Estimated territorial emissions of fluorinated gases (F gases) by source category,
1990-2018 Table 8 Estimated greenhouse gas emissions arising from use of fuels from UK international
aviation and shipping bunkers 1990-2018 Table 9 UK territorial greenhouse gas emissions 2008-2018, progress towards the Kyoto
Protocol, Carbon Budgets and EU Effort Sharing Decision Targets Table 10 Uncertainty in estimates of UK territorial greenhouse gas emissions: 1990/2017 Table 11 Uncertainty in estimates of UK territorial greenhouse gas emissions by sector:
1990/2017 Table 12 Sectoral definitions and inclusions Table 13 Sectoral details, methodologies and data sources Table 14 Estimated territorial greenhouse gas emissions by National Communication source
category, type of fuel and end-user category for the UK only (excluding NF3) 1990-2018
Table 15 Estimated territorial greenhouse gas emissions for the UK and Crown Dependencies by source category and type of fuel, 1990-2018
Table 16 Estimated territorial greenhouse gas emissions for the UK, Crown Dependencies and Overseas Territories by source category and type of fuel, 1990-2018
We intend to remove tables 14 and 15 listed above from the next publication because we believe they have few users and the data in them will still be available from the pivot tables published on the NAEI website. If you would prefer to see these tables retained in this release please contact us at [email protected].
Methodology for producing greenhouse gas emissions estimates
Because it is impractical to directly measure emissions from every exhaust, chimney and acre of land in the UK, greenhouse gas emission estimates are based on a series of models that estimate emissions from different sources. The source data and methods used to derive UK greenhouse gas emission estimates have been developed to be consistent with methods defined within international guidance31. All countries that report to the UNFCCC are required to use these estimation methods to ensure that the emissions for each country are complete and comparable.
The basic equation for estimating most sources of emissions is:
For example, to estimate CO2 emissions from vehicles the activity data might be the total number of kilometres travelled by that type of vehicle and the emission factor the amount of CO2 emitted per kilometre.
The emission factor is the emission per unit of activity. Emission factors for energy sources are either dependent on the fuel characteristics (for emissions of CO2) or how the fuel is burned, for example the size and efficiency of equipment used. For other sources, the emission factor can be dependent on a range of parameters, such as feed characteristics for livestock or the chemical reactions taking place for industrial process emissions. Emission factors are typically derived from measurements on a number of representative sources and the resulting factor applied to all similar sources in the UK.
The UK Greenhouse Gas Inventory uses the best available data from UK and international research for each emission source. The approach used is largely defined by the availability of data and the significance of the emission source in the overall UK inventory: more detailed methods are used for the high-emitting sources, whilst simpler methods can be used for minor sources, consistent with international guidance.
For some sources, the calculation of emissions is more complicated, and therefore a model is used to estimate emissions. For example, emissions of methane from waste disposed to landfills are estimated using a model that reflects the fact that the emissions occur over a long timeframe from the initial disposal of the waste, and that emissions are affected by the level of capture and utilisation of the landfill methane produced. The CO2 emissions and removals from land use, land use change and forestry are also modelled.
Table 13 in the data tables accompanying this publication summarises the methods and data sources used to estimate emissions from each source, and there are factsheets published on the NAEI website32 that summarise the main data sources and methods used for each sector. More detailed methodology information for each source can be found in the National Inventory Report submitted to the UNFCCC each year. The report for the 1990-2018 inventory will be
31 2006 IPCC Guidelines for National Greenhouse Gas Inventories: https://www.ipcc-nggip.iges.or.jp/public/2006gl/index.html 32 Sector, Gas and Uncertainty Summary Factsheets: https://naei.beis.gov.uk/overview/ghg-overview
published on 15 April 2020, so the report for the 1990-2017 inventory33 is the most recently available at the time of this publication.
BEIS also runs a programme to monitor atmospheric concentrations of greenhouse gases, which is used to verify the emission estimates made in the Greenhouse Gas Inventory34.
Estimating emissions on a temperature adjusted basis
BEIS publishes provisional estimates of temperature adjusted emissions35, which give an idea of overall trends in emissions without fluctuations due to changes in external temperatures. The provisional emissions series is estimated based on UK provisional energy consumption data published by BEIS and is not as accurate as the estimates in this statistical release, which are derived from our annual Greenhouse Gas Inventory. We can compare the latest provisional unadjusted and temperature adjusted emissions with the final estimates now available.
On a temperature adjusted basis, net carbon dioxide emissions in 2017 and 2018 were estimated to be 388.9 Mt and 374.1 Mt respectively. The decrease in carbon dioxide emissions between 2017 and 2018 in the temperature adjusted figures is therefore 14.8 Mt, which is slightly more than the decrease seen in the non-temperature adjusted figures, as can be seen in the table below. This suggests that the underlying change between 2017 and 2018 when adjusted for temperature would be more than the 2.2% shown.
Table 7: Comparison of provisional emissions estimates with final emissions estimates UK, 2017-2018
MtCO2e
2017 CO2 emissions (Mt)
2018 CO2 emissions (Mt)
Absolute change (Mt)
Percentage change
Final estimates unadjusted emissions
373.8 365.7 -8.1 -2.2%
Provisional estimates unadjusted emissions
373.2 364.1 -9.1 -2.4%
Provisional estimates Temperature adjusted emissions
388.9 374.1 -14.8 -3.8%
Source: Table 1, Final UK greenhouse gas emissions national statistics 1990-2018 Data tables
Table 3 & 4, Provisional UK greenhouse gas emissions national statistics 2018 Excel data tables Note: The provisional emissions estimates differ from the emissions estimates in these statistics because they were published before the 2018 figures presented were finalised.
33 UK National Inventory Report 1990-2017: https://naei.beis.gov.uk/reports/reports?report_id=981 34 Monitoring and verification of long term UK atmospheric measurement of greenhouse gas emissions: https://www.gov.uk/government/publications/uk-greenhouse-gas-emissions-monitoring-and-verification 35 Provisional UK greenhouse gas emissions: https://www.gov.uk/government/collections/provisional-uk-greenhouse-gas-emissions-national-statistics
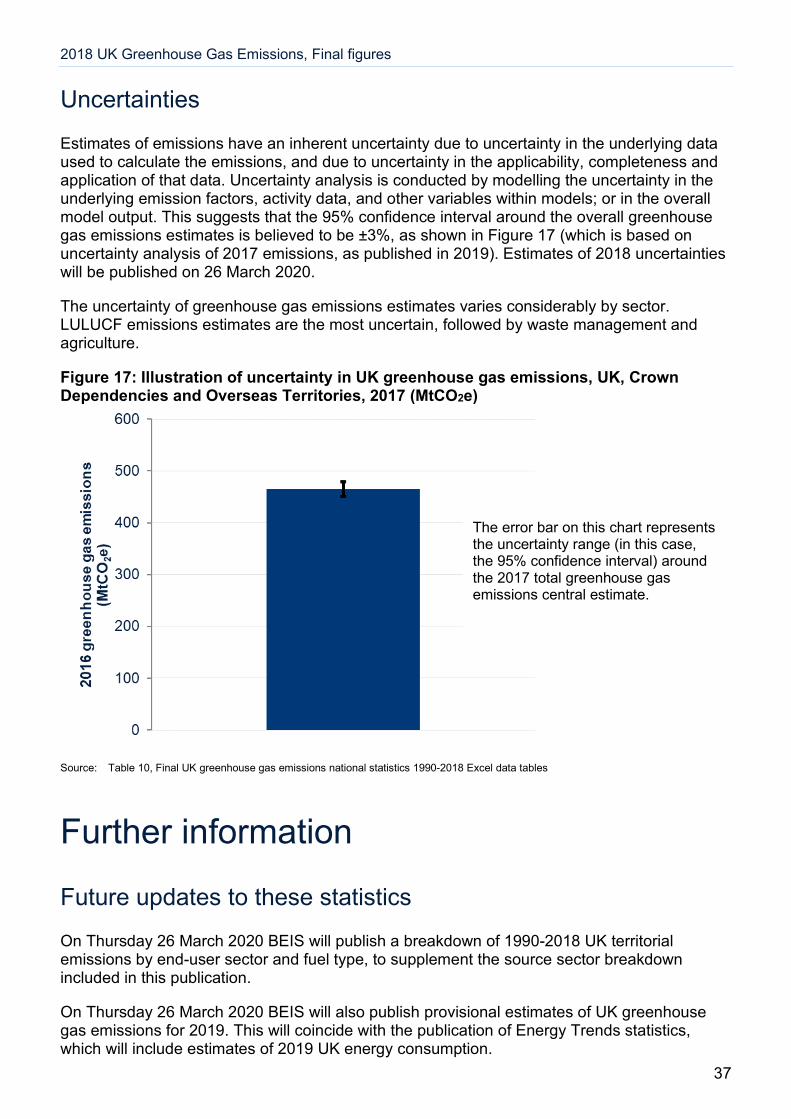
Estimates of emissions have an inherent uncertainty due to uncertainty in the underlying data used to calculate the emissions, and due to uncertainty in the applicability, completeness and application of that data. Uncertainty analysis is conducted by modelling the uncertainty in the underlying emission factors, activity data, and other variables within models; or in the overall model output. This suggests that the 95% confidence interval around the overall greenhouse gas emissions estimates is believed to be ±3%, as shown in Figure 17 (which is based on uncertainty analysis of 2017 emissions, as published in 2019). Estimates of 2018 uncertainties will be published on 26 March 2020.
The uncertainty of greenhouse gas emissions estimates varies considerably by sector. LULUCF emissions estimates are the most uncertain, followed by waste management and agriculture.
Figure 17: Illustration of uncertainty in UK greenhouse gas emissions, UK, Crown Dependencies and Overseas Territories, 2017 (MtCO2e)
Source: Table 10, Final UK greenhouse gas emissions national statistics 1990-2018 Excel data tables
Further information
Future updates to these statistics On Thursday 26 March 2020 BEIS will publish a breakdown of 1990-2018 UK territorial emissions by end-user sector and fuel type, to supplement the source sector breakdown included in this publication.
On Thursday 26 March 2020 BEIS will also publish provisional estimates of UK greenhouse gas emissions for 2019. This will coincide with the publication of Energy Trends statistics, which will include estimates of 2019 UK energy consumption.
The error bar on this chart represents the uncertainty range (in this case, the 95% confidence interval) around the 2017 total greenhouse gas emissions central estimate.
2018 UK Greenhouse Gas Emissions, Final figures
38
On Thursday 25 June 2020 BEIS will publish estimates of carbon dioxide emissions by local authority for 2018.
Final estimates of UK greenhouse gas emissions for 2019 will be published in February 2021.
Related publications • This statistical release and the related data tables are the first release of data from the
National Atmospheric Emissions Inventory (NAEI) for 1970-2018, produced for BEIS and the Devolved Administrations by Ricardo Energy & Environment. Additional results will be released as they become available. For further information on the UK Greenhouse Gas Inventory, see the NAEI website.
• The UK’s National Inventory Report (NIR) for 1990-2018 will be submitted to the United Nations Framework Convention on Climate Change (UNFCCC) on 15th April 2020. The report will contain national greenhouse gas emissions estimates for 1990-2018 and descriptions of the methods used to produce the estimates. Previous reports can be found on the NAEI website.
• The background quality report provides a summary of quality issues relating to statistics on UK territorial greenhouse gas emissions.
• There are uncertainties associated with all estimates of greenhouse gas emissions. Although for any given year considerable uncertainties may surround the emissions estimates for a pollutant, it is important to note that trends over time are likely to be much more reliable. For more information on these uncertainties see the uncertainties factsheet on the NAEI website.
• The record of base year emissions table shows how the UK base year for UK Carbon Budgets and the Kyoto Protocol has changed from 2008 to the latest inventory year.
• BEIS also publishes emissions projections based on assumptions of future emission reduction policies, economic growth, fossil fuel prices, electricity generation costs, UK population and other key variables.
• Further information about the Kyoto Protocol can be found on the UNFCCC’s website.
• Further details of the European Union Emissions Trading System can be found at the EU ETS section of the Gov.uk website.
• Under the Climate Change Act, the Annual Statement of Emissions for 2018 must be laid before Parliament and published no later than 31st March 2020. This will give details of the net UK carbon account for 2018, which is used to determine compliance with the targets and budgets under the Act.
• ONS publishes emissions on a “residential” basis in the UK Environmental Accounts. The figures represent emissions caused by UK residents and businesses whether in the UK or abroad, but exclude emissions within the UK which can be attributed to overseas residents and businesses.
• Defra publishes the UK’s carbon footprint. This estimates emissions on a “consumption” basis, meaning it covers emissions associated with the consumption of goods and services
by households in the UK. It includes estimates of emissions associated with each stage of the supply chain for those goods and services, regardless of where they occur, while excluding emissions occurring in the UK that are associated with the consumption of goods and services by households outside the UK.
• The latest UK energy statistics, including revisions to earlier years’ data, can be found in the Digest of UK Energy Statistics.
• Detailed UK temperature data can be found on both the Met Office website and the Weather Statistics section of the gov.uk website.
• Similar results for non-greenhouse gas atmospheric pollutants are published by Defra in its statistics on Emissions of air pollutants in the UK.
Revisions policy The BEIS statistical revisions policy sets out the revisions policy for these statistics, which has been developed in accordance with the UK Statistics Authority Code of Practice for Statistics.
Uses of these statistics The UK’s greenhouse gas emission estimates are used by central government departments, devolved governments and local authorities to understand emissions in the areas they are responsible for, develop policies to reduce emissions and to set targets. They are the basis for the UK’s domestic and international emissions targets and are required to be reported to the UNFCCC and EU each year.
Outside government the statistics are used by the media and the public to understand the level of the UK’s greenhouse gas emissions and trends over time. They provide detailed emissions data on gases, sectors and sub-sectors that may of interest to users (particularly academics) with a focus on a particular area of emissions. The data are also the basis of emission conversion factors that are used by companies and other organisations to report their greenhouse gas emissions.
A statement of user needs for greenhouse gas emission statistics is published at: https://www.gov.uk/government/publications/uk-greenhouse-gas-emissions-statistics-statement-on-user-needs
User engagement Users are encouraged to provide comments and feedback on how these statistics are used and how well they meet user needs. In particular, this year we are consulting on our intention to remove tables 14 and 15 from the data tables that accompany this publication. Comments on this and any issues relating to this statistical release are welcomed and should be sent to: [email protected]
The BEIS statement on statistical public engagement and data standards sets out the department’s commitments on public engagement and data standards as outlined by the Code of Practice for Statistics.
National Statistics designation National Statistics status means that our statistics meet the highest standards of trustworthiness, quality and public value, and it is our responsibility to maintain compliance with these standards.
The continued designation of these statistics as National Statistics was confirmed in September 2018 following a compliance check by the Office for Statistics Regulation. The statistics last underwent a full assessment against the Code of Practice for Statistics in 2014.
Since the latest review by the Office for Statistics Regulation, we have continued to comply with the Code of Practice for Statistics, and have made the following improvements:
• Improved the accuracy of the historic emissions estimates by continuing to make methodological changes to the UK’s Greenhouse Gas Inventory.
• Providing more methodological and background information about the statistics in the statistical release.
• Publishing a new table showing emissions by source category for the UK, Crown Dependencies and Overseas Territories combined (the geographical coverage of UK submissions to the UNFCCC).
Pre-release access to statistics Some ministers and officials receive pre-release access to these statistics up to 24 hours before release. Details of the arrangements for doing this and a list of the ministers and officials that receive pre-release access to these statistics can be found in the BEIS statement of compliance with the Pre-Release Access to Official Statistics Order 2008.
This publication is licensed under the terms of the Open Government Licence v3.0 except where otherwise stated. To view this licence, visit nationalarchives.gov.uk/doc/open-government-licence/version/3 or write to the Information Policy Team, The National Archives, Kew, London TW9 4DU, or email: [email protected].
Where we have identified any third-party copyright information you will need to obtain permission from the copyright holders concerned.
This publication is available from: https://www.gov.uk/government/collections/final-uk-greenhouse-gas-emissions-national-statistics
If you need a version of this document in a more accessible format, please email [email protected]. Please tell us what format you need. It will help us if you say what assistive technology you use.