25
ROTH Conference March 12, 2018 David Burke, Chief Executive Officer Phyllis Knight, Chief Financial Officer

ROTH ConferenceMarch 12, 2018
David Burke, Chief Executive Officer Phyllis Knight, Chief Financial Officer

Safe Harbor
2
The information made available in this presentation contains forward‐looking statements which reflect the Company’s current view of future events, results of operations, cash flows, performance, business prospects and opportunities. Wherever used, the words "anticipate," "believe," "expect," "intend," "plan," "project," "will continue," "will likely result," "may," and similar expressions identify forward‐looking statements as such term is defined in the Securities Exchange Act of 1934. Any such forward‐looking statements are subject to risks and uncertainties and the Company's actual growth, results of operations, financial condition, cash flows, performance, business prospects and opportunities could differ materially from historical results or current expectations. Some of these risks include, without limitation, the impact of economic and industry conditions, competition, food and drug safety issues, store expansion and remodeling, labor relations issues, costs of providing employee benefits, regulatory matters, legal and administrative proceedings, information technology, security, severe weather, natural disasters, accounting matters, other risk factors relating to our business or industry and other risks detailed from time to time in the Securities and Exchange Commission filings of DRH. Forward‐looking statements contained herein speak only as of the date made and, thus, DRH undertakes no obligation to update or publicly announce the revision of any of the forward‐looking statements contained herein to reflect new information, future events, developments or changed circumstances or for any other reason.
This presentation will discuss some non‐GAAP financial measures, which the Company believes are useful in evaluating our performance. You should not consider the presentation of this additional information in isolation or as a substitute for results compared in accordance with GAAP. The Company has provided reconciliations of comparable GAAP to non‐GAAP measures in tables found in the Supplemental Information portion of this presentation.

Who We Are
NASDAQ: SAUCIPO: 2008
Market capitalization $40M
Largest Buffalo Wild Wings Franchisee› Leading operator› Strong cash generator› 65 BWW locations
› Recent share price $1.49› 52 week range $1.30 ‐ $4.12› Insider ownership 50%› Institutional ownership 17%› Shares outstanding 26.7M
3
Pure play franchisee with scale and track record of accretive acquisitions
Market data as of March 6, 2018 (Source: S&P Capital IQ); Ownership as of most recent filing

4
Wings. Beer. Sports.®
• Total of 1,255 restaurants system wide1
• DRH owns 65 locations (~10% of franchised locations)
• Distinctive branding
• Exceptional guest experience
• Wings, signature sauces and seasonings
• Domestic, imported and craft beers
1 as of December 31, 2017

$106.4
$144.8
$166.5 $165.5
2014 2015 2016 2017
42
62 64 65
2014 2015 2016 2017
5
Sales and Unit Growth
Net Sales Store Count
$ Millions
Added 43 locations over the last six years, making us one of the largest BWW franchisees in the system

Sales Initiatives: Delivery
6
Delivery and Carry‐Out Sales as % of Total
The delivery channel continues to show growth, while carry‐out as a percentage of total sales declined, largely due to the impact of promotional changes in late‐Q3 and Q4 2017
Delivery Drives Incremental Sales
38 locations now offer delivery service through third parties (up from 26 last year)
2017 delivery sales increased $1.3M to $2.0M over 2016 and are expected to reach approx. $2.4M in 2018
Average delivery check is 13% higher than dine‐in and 17% higher than carry‐out
20.6%19.3% 19.5%
20.4%21.9% 21.4%
20.2%19.1%
1.9% 2.7% 2.8% 3.1% 2.7% 3.0%
Q12016
Q22016
Q32016
Q42016
Q12017
Q22017
Q32017
Q42017
% of Carry‐Out Sales % of Delivery Sales

Sales Initiatives: Blazin’ Rewards® Loyalty Program
7
Blazin’ Rewards Members
Roll‐out began in St. Louis market in mid‐2016 and ramped up with remaining locations in Q1 2017; the average loyalty check is currently 17% higher than non‐loyalty;
attachment rate of 20% was achieved in January 2018
*Loyalty Attachment Rates
* Loyalty attachment rate = loyalty checks as a percentage of total checks
0.0%
2.0%
4.0%
6.0%
8.0%
10.0%
12.0%
14.0%
16.0%
18.0%
20.0%
Jul
Aug
Sep
Oct
Nov Dec
Jan
Feb
Mar Apr
May Jun Jul
Aug
Sep
Oct
Nov Dec
Jan
2016 2017
‐
20,000
40,000
60,000
80,000
100,000
120,000
140,000
160,000
180,000
200,000
Jul
Aug
Sep
Oct
Nov Dec
Jan
Feb
Mar Apr
May Jun Jul
Aug
Sep
Oct
Nov Dec
Jan
2016 2017

Average Check and Traffic Trends
8NOTE: Average check is predominantly driven by price but is also influenced by product mix and, to a lesser extent, average guests per check.* Ramping up of Tuesday Promotion and the Bogo Blitz offering in 2016 drove 170 bp of the 12.3% traffic decline in Q4 2017.
2.6% 2.9%
5.5% 5.9%
7.7%
4.1%
1.3% 0.8%
‐2.2% ‐2.7% ‐1.8%‐5.4%
‐0.3%
‐3.7% ‐4.4%
‐6.8%
4.3%
3.0%
‐3.1%‐3.7%
0.9% 1.1%2.2%
0.2%0.6%
‐2.5%‐1.8% ‐2.0% ‐2.0%
‐3.0%‐3.3%
‐4.3%
2.0%
‐1.9%
‐6.3%
‐12.3%
1.1%
‐3.0% ‐3.2%‐4.8%
1.7% 1.7% 3.3%
5.7%7.1%
6.6%
3.1% 2.8%
‐0.2%0.2%
1.4%
‐1.1%
‐2.3% ‐…
1.9%
5.5%
3.2%
6.1%
0.1%1.1%
Q12014
Q22014
Q32014
Q42014
Q12015
Q22015
Q32015
Q42015
Q12016
Q22016
Q32016
Q42016
Q12017
Q22017
Q32017
Q42017
FY2014
FY2015
FY2016
FY2017
SSS%
Traffic %
Avg Check %
*
Traffic was a major issue in both Q3 and Q4, partially due to promotional shifts away from Half Price Tuesdays; Stronger average check reflects pricing and improved penetration of the
Blazin’ Rewards loyalty program

$22.6
$29.7$32.3
$28.3
2014 2015 2016 2017
9
EBITDA
Restaurant‐Level EBITDA* Adjusted EBITDA*
* Adjusted for pre‐opening expenses and other non‐recurring expenses. See EBITDA reconciliation slide.
$ Millions $ Millions
$17.4
$21.6$23.3
$19.9
2014 2015 2016 2017
Cost of sales, driven by record high chicken wing prices, accounted for over 65% of the year‐over‐year decline in EBITDA, followed by the impact of slower traffic and Hurricane Irma closures; operating
expenses were held in check despite the sales headwinds

Adjusted EBITDA Bridge
10
Cost of sales, driven by record high chicken wing prices, accounted for over 65% of the year‐over‐year decline in EBITDA, followed by the impact of slower traffic and Hurricane Irma closures; operating
expenses were held in check despite the sales headwinds
* Other includes: Occupancy ($0.4M) driven by NROs, Other Opex ($0.3M) driven by delivery expense, Compensation ($0.6M) driven by minimum wage increases and management labor
$18.5 $18.5 $19.4
$19.9
$2.0
$2.9
$1.4
$23.3
$1.5
$0.9 $0.5
FY 2016Adj. EBITDA
53rd WeekImpact
SalesImpact
COS (TraditionalWings)
*Other RestaurantLevel Initiatives
G&A Reductions FY 2017Adj. EBITDA

EBITDA Headwinds – Outlook
Headwinds: 2017 Current Outlook
Sales
Promotion driven, value seeking consumer without cohesive brand strategy
Major shift in brand media strategy results in significant negative trend departure from CD industry in H2 2017
NFL viewership down
New approach under changed ownership – proven track record
• Media, promotion, food and beverage strategy
Seasoning of loyalty program
Cost of sales Record high wing prices weigh down margins Wing market has corrected
11
Corrective Action: 2017 Current Outlook
Labor Offset labor inflation and sales deleveraging with labor productivity improvements Savings and productivity
initiatives will carry over into the future
We should benefit from leverage of sales lift going forward
Operating Expenses Tight management of operating expenses to offset sales deleveraging
General & Administrative
Labor reduction Expense reduction
Sales and COS pressure offset by productivity and savings initiatives, coupled with a tight capex management
Net EBITDA impact applied tension to bank covenants – negotiated significant covenant relief for 8 quarters allowing DRH to maintain existing debt amortization schedule and low interest rates

Quarterly Restaurant EBITDA Trends
12
* FF = Franchise‐related fees which includes 5.0% royalty and 3.0 – 3.15% NAF (national advertising fund)** On June 29, 2015, we acquired 18 locations in the St. Louis market to add to our existing 44 units, which had a dilutive AUV of $2.3 million
Record high chicken wing prices coupled with sales deleveraging placed added pressure on recent margins
AUV ($M) $3.1 $2.8 $2.7 $2.7 $2.7 $2.6 $2.6 $2.6 $2.8 $2.5 $2.4 $2.4 $2.8 $2.8 $2.6 $2.5
21.8% 20.6% 19.4% 20.3% 21.5% 20.0% 19.6% 16.5% 19.0% 16.6% 15.9% 17.1% 21.2% 20.4% 19.4% 17.1%
5.5% 5.9% 6.4% 6.6% 6.5% 6.8% 7.0%7.2%
6.5%7.1% 7.6% 7.2%
5.2% 6.2% 6.8%7.1%
8.0% 8.0% 8.0% 8.0% 8.2% 8.1% 8.1%8.1% 8.0% 8.1% 8.2% 8.1%
8.0% 8.0% 8.1%8.1%
12.6% 13.4% 13.0% 12.7% 11.5% 12.1% 13.3%14.0% 12.3% 12.9% 13.8% 13.1%
13.2% 12.9% 12.7%12.9%
23.3% 23.9% 25.1% 24.8% 24.4% 25.2% 24.7%25.0% 24.7% 25.5% 25.4% 25.3% 23.8% 24.4% 24.8% 25.2%
28.8% 28.1% 28.1% 27.6% 28.0% 27.9% 27.4% 29.2% 29.4% 29.9% 29.2% 29.3% 28.5% 28.1% 28.1% 29.4%
0
0.5
1
1.5
2
2.5
3
3.5
KEY Q12015
Q22015
Q32015
Q42015
Q12016
Q22016
Q32016
Q42016
Q12017
Q22017
Q32017
Q42017
FY2014 FY2015
FY2016
FY2017
AUV ($M)
COS
LABO
ROPE
X
FF*
OCC
REST.
EBITDA
****

COS Trends and Wing Impact
13
NOTE: Wing prices shown are the average price paid per pound of fresh, jumbo chicken wings – including distribution costs of approximately $0.29 per pound* Q3 actual reported COS was 29.2% which included $323K in cover charges for a UFC fight that had no cost associated with it** Q1 2018 = Jan Actual + Feb – Mar Forecast
Traditional wing costs were escalated throughout 2017 and hit record highs in Q4, but have recently declined from these highs; wings as % of total COS spiked to 24.7% in 2017
28.8%28.1% 28.1%
27.6%28.0% 27.9%
27.4%
29.2% 29.4%29.9% 29.5% 29.3%
28.0%28.5%
28.1% 28.1%
29.4%
21.7%
20.1% 20.4%
19.5%20.3%
20.9%
19.5%
23.5%24.0%
24.9% 25.3%24.7%
21.0%
18.4%
20.4%21.1%
24.7%
$1.89
$1.77 $1.80 $1.79
$1.92 $1.92
$1.70
$1.95
$2.02 $2.03
$2.14 $2.13
$1.88
$1.53
$1.81
$1.87
$2.07
Q12015
Q22015
Q32015
Q42015
Q12016
Q22016
Q32016
Q42016
Q12017
Q22017
Q32017
Q42017
Q12018
FY2014
FY2015
FY2016
FY2017
Total COS % Wing Cost % of Total COS Wing Cost/Lb
***

Historical Wing Prices
14
$ / lb. Fresh Jumbo Northeast Chicken Wing Spot Prices
Source: Urner Barry Comtell™ UB Chicken – Northeast Jumbo WingsNOTE: Logistics cost to restaurants is $0.29 / lb. over the spot price
Volatile fresh wing spot prices had ranged between $1.41 and $2.16/lb. since 2015; prices have been on the decline since October 2017, with the spot price currently at $1.35

Cost Saving Initiatives
15
To combat the impact of inflationary traditional wing costs in 2017, we implemented a number of high value initiatives to drive down cost of sales.
Targeted savings in the $3 – 4 million range (annualized), including the following:
Implemented a wing portioning adjustment in early June
Testing a revised Tuesday promotion in captive markets since mid‐June (BOGO offer on snack/small menu items only) – with favorable early results
Driving down the impact of comps and promos through –• Implemented new guidelines and policies
• Introduced aggressive targets to management incentive plans beginning in Q3 2017

Total Labor Trends
16NOTE: OH = Overhead labor costs including payroll taxes, FUTA, SUTA, health benefits and retirement plan. Bonus is typically between 1.0‐1.2% of sales.
Hourly and total labor costs continue to be held in check as we push productivity initiatives as a means of offsetting wage inflation
($M) $3.1 $2.8 $2.7 $2.7 $2.7 $2.6 $2.6 $2.6 $2.8 $2.5 $2.4 $2.4 $2.8 $2.6 $2.5
12.5% 13.2% 13.8% 13.3% 13.1% 13.6% 13.3% 13.6% 13.1% 13.8% 13.7% 13.6% 13.2% 13.4% 13.5% 13.9%
5.6%6.0%
6.4% 6.4% 6.2% 6.4% 6.6% 6.6% 6.6%6.8% 7.1% 7.2%
6.1% 6.5% 6.9% 7.1%
5.2%4.7%
4.9% 5.2% 5.1%5.1% 4.8% 4.8% 5.1%
4.8% 4.7% 4.5%5.0% 4.9% 4.8%
5.0%
Q12015
Q22015
Q32015
Q42015
Q12016
Q22016
Q32016
Q42016
Q12017
Q22017
Q32017
Q42017
FY 2015FY 2016FY 2017 2018Fcst
Hourly Labor % of Sales Mgmt Labor % of Sales Bonus & OH % of Sales AUV ($M)
23.9%25.1% 24.8% 24.4% 25.2% 24.7% 25.0% 24.7%
25.5% 25.4% 25.3%24.4% 24.8% 25.2%
26.1%
23.3%

G&A Run Rate Trending Down
17
$7.9 $7.6 $7.2
$1.0 $0.8
$0.7
4.7%
4.8%
4.9%
5.0%
5.1%
5.2%
5.3%
5.4%
$‐
$1.0
$2.0
$3.0
$4.0
$5.0
$6.0
$7.0
$8.0
$9.0
$10.0
FY2016 FY 2017 2018 Fcst
G&A $Marketing $Total G&A % of Sales
Targeted second half 2017 run rate of 5% • $1 million run rate savings target
Post – Bagger Dave’s spin‐off overhead restructuring coupled with tight spending controls
• Reductions in salaries and support office expenses
Reduced (more targeted) local marketing spend
• Better leveraging of National Ad Fund spend
• More targeted local spend
5.4%
5.1%

Adjusted EBITDA Trends
18
21.8% 20.6% 19.4% 20.3% 21.5%20.0% 19.6%
16.5%19.0%
16.6% 15.9% 17.1%
21.2% 20.4% 19.4%17.1%
4.3%8.0%
5.8% 5.1%4.9%
5.3% 5.7%
5.6%
5.1%
5.0% 4.9% 5.3%
5.1%
5.7% 5.4%5.1%
1
1.5
2
2.5
3
Key Q12015
Q22015
Q32015
Q42015
Q12016
Q22016
Q32016
Q42016
Q12017
Q22017
Q32017
Q42017
FY2014 FY2015
FY2016
FY2017
AUV ($M)
G&A
REST. EB
ITDA
AUV ($M) $3.1 $2.8 $2.7 $2.7 $2.7 $2.6 $2.6 $2.6 $2.8 $2.5 $2.4 $2.4 $2.8 $2.8 $2.6 $2.5
G&A expenses have been reduced, partially offsetting the impact of lower store‐level margins driven by higher cost of sales and lower overall sales
Free Cash Flow and Net Debt
19
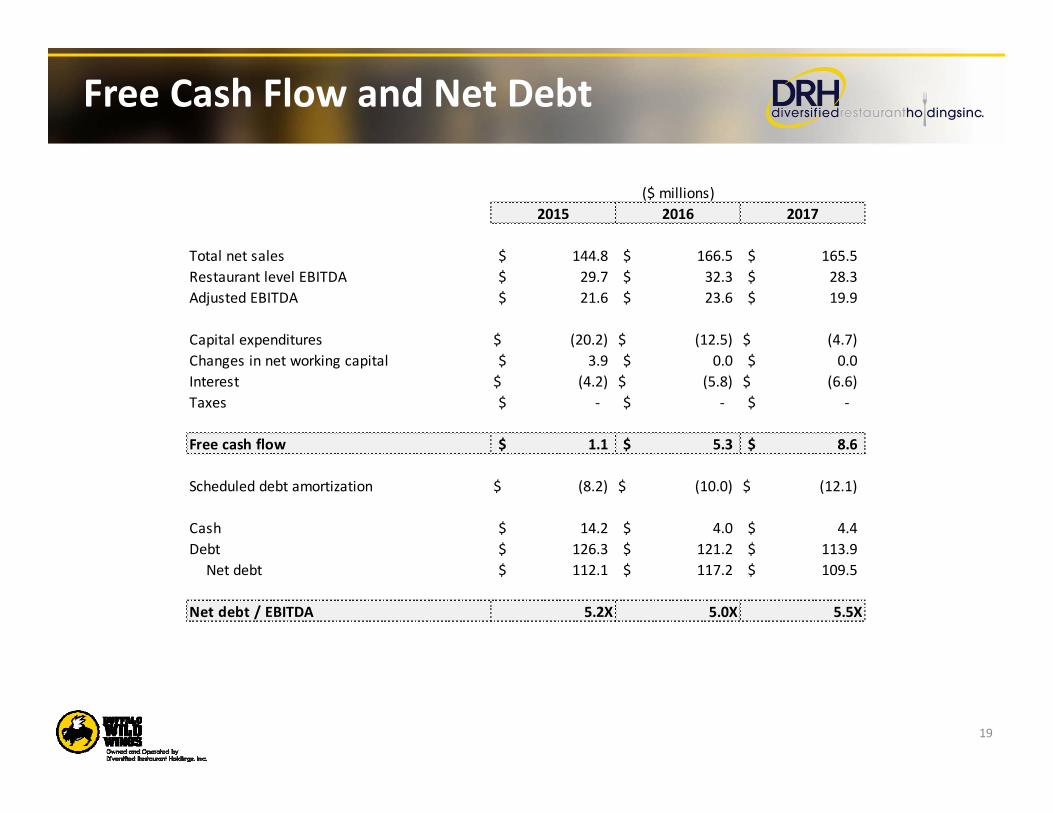
2015 2016 2017
Total net sales 144.8$ 166.5$ 165.5$ Restaurant level EBITDA 29.7$ 32.3$ 28.3$ Adjusted EBITDA 21.6$ 23.6$ 19.9$
Capital expenditures (20.2)$ (12.5)$ (4.7)$ Changes in net working capital 3.9$ 0.0$ 0.0$ Interest (4.2)$ (5.8)$ (6.6)$ Taxes ‐$ ‐$ ‐$
Free cash flow 1.1$ 5.3$ 8.6$
Scheduled debt amortization (8.2)$ (10.0)$ (12.1)$
Cash 14.2$ 4.0$ 4.4$ Debt 126.3$ 121.2$ 113.9$
Net debt 112.1$ 117.2$ 109.5$
Net debt / EBITDA 5.2X 5.0X 5.5X
($ millions)

Value Creation – Going Forward
20
‐ Best in class operations ‐ Proven integration skills ‐ Strong positive cash flow ‐ Tax benefits to offset over $70 million in pre‐tax income
‐ Franchisor under new ownership – demonstrated track record ‐ Renewed focus on the customer and marketing ‐ Leaner and more efficient organization well positioned to leverage improved commodity cost environment and future sales growth
‐ Disciplined, value‐accretive growth through acquisition ‐ Roll‐up of other BWW franchisees ready for exit as cycle turns‐ Opportunistic new unit development ‐ Opportunities with new franchised concepts
Value Proposition
Current Environment
Growth Strategy

ROTH ConferenceMarch 12, 2018

Supplemental Slides

23
Management Team
David BurkeChief Executive Officer,
President
Phyllis KnightChief Financial Officer,
Treasurer
Jason CurtisChief Operating Officer
Appointed Chief Financial Officer and Treasurer in October 2016 More than 30 years of finance, accounting and leadership experience Prior to DRH, served as EVP and CFO of Polar Corporation and
Champion Enterprises
Appointed President and Chief Executive Officer in October 2016 Served Chief Financial Officer and Treasurer since 2010; has served as a
member of the Board of Directors since inception of the Company Prior to DRH, employed by Federal‐Mogul with roles in finance, corporate
development and marketing
Held the Chief Operating Officer position since 2002 Named to the BWLD Leadership Council to serve as a liaison between
franchisees and the BWLD corporate office Certified by the National Restaurant Association as a Foodservice
Management Professional

EBITDA Reconciliation
24

EBITDA Reconciliation cont.
25
Restaurant-Level EBITDA represents net income (loss) plus the sum of non-restaurant specific general and administrative expenses, restaurant pre-opening costs, loss on property and equipment disposals, depreciation and amortization, other income and expenses, interest, taxes, and non-recurring expenses related to acquisitions, equity offerings or other non-recurring expenses. Adjusted EBITDA represents net income (loss) plus the sum of restaurant pre-opening costs, loss on property and equipment disposals, depreciation and amortization, other income and expenses, interest, taxes, and non-recurring expenses. We are presenting Restaurant-Level EBITDA and Adjusted EBITDA, which are not presented in accordance with GAAP, because we believe they provide an additional metric by which to evaluate our operations. When considered together with our GAAP results and the reconciliation to our net income, we believe they provide a more complete understanding of our business than could be obtained absent this disclosure. We use Restaurant-Level EBITDA and Adjusted EBITDA together with financial measures prepared in accordance with GAAP, such as revenue, income from operations, net income, and cash flows from operations, to assess our historical and prospective operating performance and to enhance the understanding of our core operating performance. Restaurant-Level EBITDA and Adjusted EBITDA are presented because: (i) we believe they are useful measures for investors to assess the operating performance of our business without the effect of non-cash depreciation and amortization expenses; (ii) we believe investors will find these measures useful in assessing our ability to service or incur indebtedness; and (iii) they are used internally as benchmarks to evaluate our operating performance or compare our performance to that of our competitors.
Additionally, we present Restaurant-Level EBITDA because it excludes the impact of general and administrative expenses and restaurant pre-opening costs, which is non-recurring. The use of Restaurant-Level EBITDA thereby enables us and our investors to compare our operating performance between periods and to compare our operating performance to the performance of our competitors. The measure is also widely used within the restaurant industry to evaluate restaurant level productivity, efficiency, and performance. The use of Restaurant-Level EBITDA and Adjusted EBITDA as performance measures permits a comparative assessment of our operating performance relative to our performance based on GAAP results, while isolating the effects of some items that vary from period to period without any correlation to core operating performance or that vary widely among similar companies. Companies within our industry exhibit significant variations with respect to capital structure and cost of capital (which affect interest expense and tax rates) and differences in book depreciation of property and equipment (which affect relative depreciation expense), including significant differences in the depreciable lives of similar assets among various companies. Our management team believes that Restaurant-Level EBITDA and Adjusted EBITDA facilitate company-to-company comparisons within our industry by eliminating some of the foregoing variations.
Restaurant-Level EBITDA and Adjusted EBITDA are not determined in accordance with GAAP and should not be considered in isolation or as an alternative to net income, income from operations, net cash provided by operating, investing, or financing activities, or other financial statement data presented as indicators of financial performance or liquidity, each as presented in accordance with GAAP. Neither Restaurant-Level EBITDA nor Adjusted EBITDA should be considered as a measure of discretionary cash available to us to invest in the growth of our business. Restaurant-Level EBITDA and Adjusted EBITDA as presented may not be comparable to other similarly titled measures of other companies and our presentation of Restaurant-Level EBITDA and Adjusted EBITDA should not be construed as an inference that our future results will be unaffected by unusual items. Our management recognizes that Restaurant-Level EBITDA and Adjusted EBITDA have limitations as analytical financial measures.


