2019-2020 RAINBOW CREEK HF183 MONITORING FINAL REPORT Prepared For: County of San Diego DPW/Watershed Protection 5500 Overland Ave., Suite 410 San Diego, California 92123 Contract Number: 558891 TO 5 Prepared By: Weston Solutions, Inc. 5817 Dryden Place, Suite 101 Carlsbad, California 92008 WESTON Project Number: 13245.558.005.5001 January 2021
Transcript
2019-2020 RAINBOW CREEK HF183 MONITORING
FINAL REPORT Prepared For: County of San Diego DPW/Watershed Protection 5500 Overland Ave., Suite 410 San Diego, California 92123 Contract Number: 558891 TO 5 Prepared By: Weston Solutions, Inc. 5817 Dryden Place, Suite 101 Carlsbad, California 92008 WESTON Project Number: 13245.558.005.5001 January 2021
A – Field Data Sheets, Photo Logs and Chains of Custody B – Laboratory Reports and Electronic Data Deliverables C – Molecular Quality Assurance/Quality Control D – Monitoring Results Tables
Rainbow Creek HF183 Monitoring ii January 2021
List of Figures
Figure 2-1. Receiving Water Monitoring Sampling Locations .................................................................... 2 Figure 2-2. MS4 Outfall Sampling Locations ................................................................................................ 3 Figure 3-1. Receiving Water HF183 Summary .............................................................................................. 7 Figure 3-2. HF183 Detections at Rainbow Creek Receiving Water sites, June 2019 through
June 2020 ............................................................................................................................................... 8 Figure 3-3. MS4 HF183 Summary ................................................................................................................. 11 Figure 4-1. Detections of HF183 and Total Samples by Month .............................................................. 15 Figure 4-2. Monthly Precipitation and Number of HF183 Detections ................................................... 17 Figure 4-3. Rainbow Creek Landuse within County of San Diego .......................................................... 18
digital PCR ............................................................................................................................................. 5 Table 3-1. Receiving Water Event Summary Table ...................................................................................... 6 Table 3-2. Summary of HF183 Results for Receiving Monitoring Locations .......................................... 7 Table 3-3. Summary of Fecal Indicator Bacteria Results for Receiving Water Locations ...................... 9 Table 3-4. MS4 Event Summary Table ......................................................................................................... 10 Table 3-5. Summary of HF183 Detections for MS4 Locations ................................................................ 11 Table 3-6. Summary of Fecal Indicator Bacteria Results for MS4 Locations ......................................... 12 Table 3-7. Field Blank Results........................................................................................................................ 13 Table 3-8. Field Duplicate Results ................................................................................................................. 13 Table 3-9. Monitoring Sample Collection Completeness .......................................................................... 14 Table 4-1. Percent HF183 Detections by Month ........................................................................................ 16 Table 4-2. MS4 Outfall Drainage Area Septic Systems .............................................................................. 19
Rainbow Creek HF183 Monitoring iii January 2021
Acronyms and Abbreviations Basin Plan Water Quality Control Plan for the San Diego Basin BDL below detection limit CEDEN California Environmental Data Exchange Network COLD cold freshwater habitat COC chain-of-custody County County of San Diego Department of Public Works Watershed
Protection Program ddPCR droplet digital polymerase chain reaction DNA deoxyribonucleic acid DQO data quality objective EDD electronic data deliverable EMA EnviroMatrix Analytical, Inc. FIB fecal indicator bacteria HF183 human-associated fecal marker LOD limit of detection MS4 municipal separate storm sewer system MUN municipal water supply NA not applicable ND not detected NPDES National Pollutant Discharge Elimination System NS not sampled Nutrient TMDL Total Maximum Daily Loads (TMDL) for Total Nitrogen and Total
Phosphorus in the Rainbow Creek Watershed OWTS onsite wastewater treatment systems Permit San Diego Water Board Order No. R9-2013-0001 as amended by
Order No. R9-2015-0001 and Order No. R9-2015-0100 QAPP quality assurance project plan QA quality assurance QC quality control qPCR quantitative polymerase chain reaction REC-1 contact water recreation REC-2 non-contact water recreation RPD relative percent difference San Diego Water Board San Diego Regional Water Quality Control Board SM standard method SOP standard operating procedure SPC Sample Processing Control SWAMP Surface Water Ambient Monitoring Program TMDL total maximum daily load WARM warm freshwater habitat WESTON Weston Solutions, Inc. WILD wildlife habitat WQIP Water Quality Improvement Plan
Units of Measure
cpr copies per reaction mL milliliter µL microliter µM micromole MPN most probable number
Rainbow Creek HF183 Monitoring 1 January 2021
1 OVERVIEW
1.1 Background Rainbow Creek was included on the Clean Water Act Section 303(d) list of water quality limited waterbodies in 1996 due to beneficial use impairments associated with elevated levels of nitrogen and phosphorus. Beneficial uses in Rainbow Creek include municipal supply (MUN), warm freshwater habitat (WARM), cold freshwater habitat (COLD), wildlife habitat (WILD), contact water recreation (REC-1), and non-contact water recreation (REC-2). These beneficial uses are threatened or impaired due to excessive levels of nutrients (San Diego Regional Water Quality Control Board [San Diego Water Board], 2005). In 2005 the San Diego Water Board adopted Resolution No. R9-2005-0036 to amend the Water Quality Control Plan for the San Diego Basin (Basin Plan) (San Diego Water Board, 2016) and incorporate the Total Maximum Daily Loads (TMDL) for Total Nitrogen and Total Phosphorus in Rainbow Creek Watershed (Nutrient TMDL). The Nutrient TMDL was incorporated into the National Pollutant Discharge Elimination System (NPDES) Permit and Waste Discharge Requirements for Discharges from the Municipal Separate Storm Sewer Systems (MS4s) Draining the Watersheds within the San Diego Region (San Diego Water Board Order No. R9-2013-0001 as amended by Order No. R9-2015-0001 and Order No. R9-2015-0100) (Permit) as Attachment E.3. Final TMDL compliance is required on December 31, 2021. 1.2 Study Overview The County of San Diego Department of Public Works Watershed Protection Program (County) requested the assistance of Weston Solutions, Inc. (WESTON®) to conduct a study in support of the Nutrient TMDL. The study includes collection of dry weather samples from stormwater conveyance system outfalls and receiving waters in the Rainbow Creek Watershed for analysis of fecal indicator bacteria (FIB) and human-associated fecal marker HF183 (HF183). Monthly dry weather water samples were collected from MS4 outfalls and receiving water locations per the Rainbow Creek HF183 Monitoring Plan (WESTON, 2019). Samples were collected in conjunction with the Rainbow Creek Nutrient TMDL monitoring program as well as the Rainbow Creek MS4 Outfall monitoring program (a voluntary program implemented by the County). Monitoring for this study began in June 2019 and extended through June 2020. Results from June 2019 through September 2019 were presented in the 2018-2019 Rainbow Creek HF183 Monitoring Report (WESTON, 2020a) and are also included in this overall study report. The study was designed to provide information toward answering the following study questions:
1. Is the human-associated fecal marker HF183 present in MS4 outfall and/or receiving water dry weather flows in the Rainbow Creek Watershed?
2. If HF183 is present in the watershed, the following sub-questions will be addressed: a) What is the spatial pattern of HF183? b) What is the magnitude and the rate of occurrence of HF183? c) Under what flow conditions is HF183 observed? d) Is there a correlation between the HF183 marker and land use? e) Is there a correlation between HF183 spatial patterns and known septic tank locations?
Rainbow Creek HF183 Monitoring 2 January 2021
2 METHODS
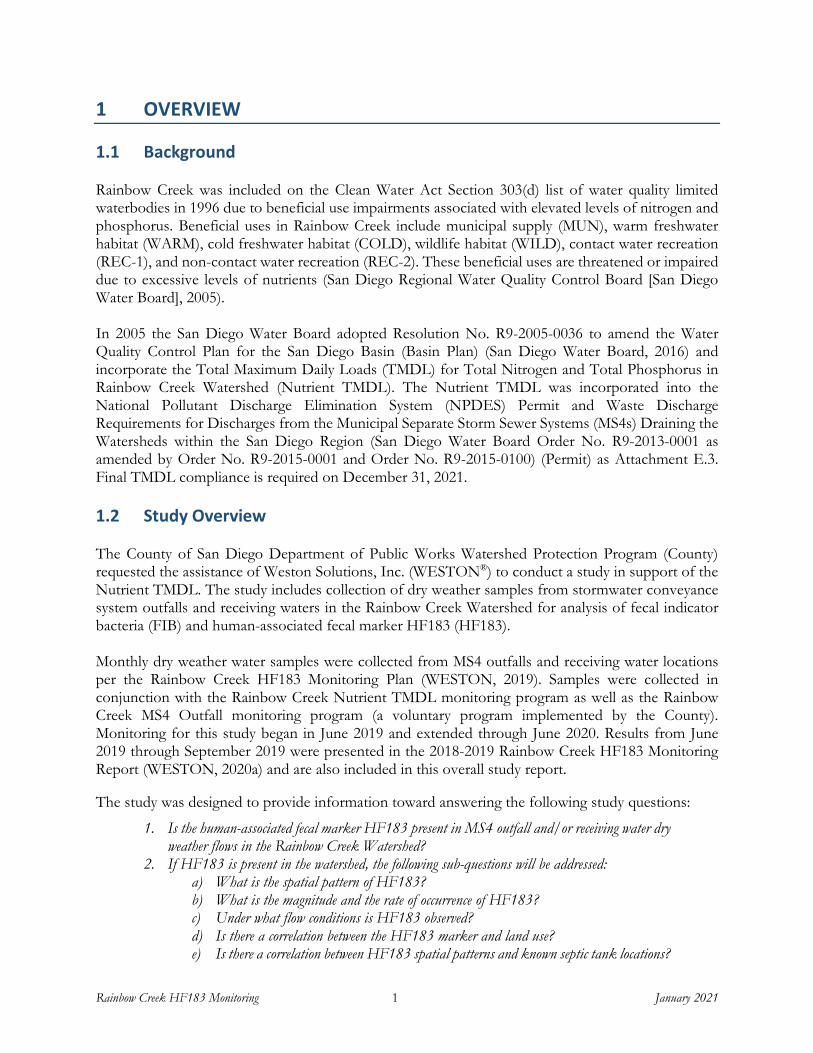
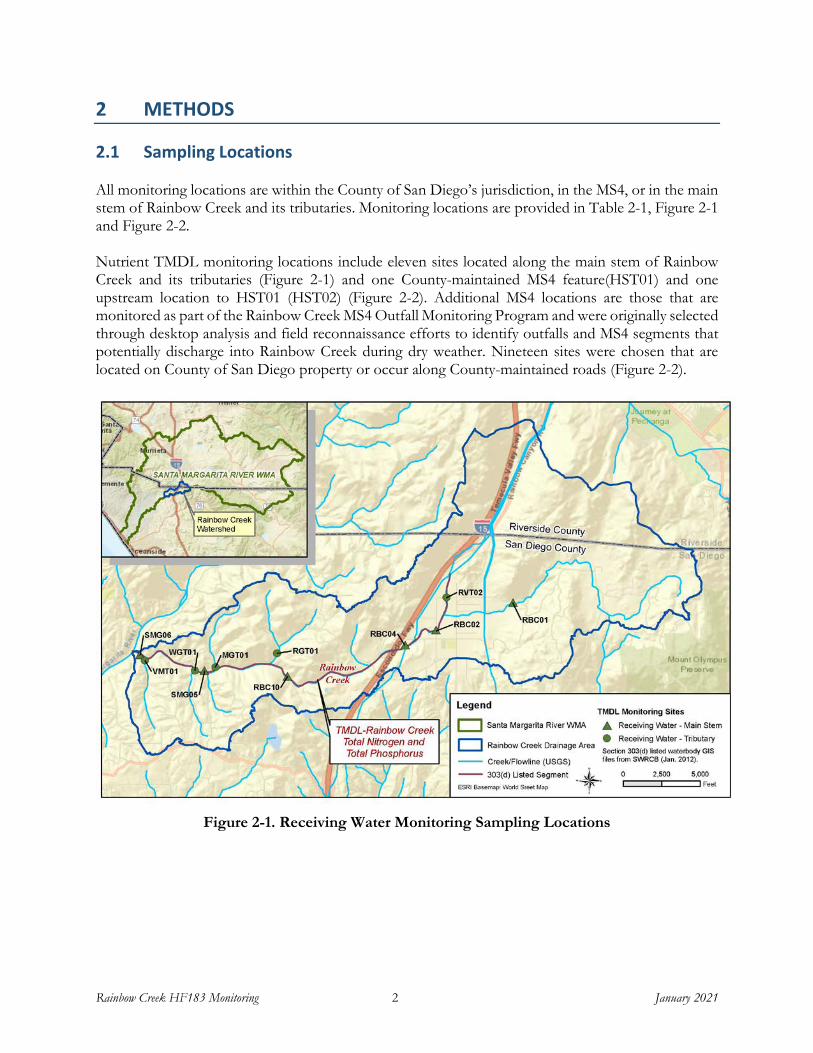
2.1 Sampling Locations All monitoring locations are within the County of San Diego’s jurisdiction, in the MS4, or in the main stem of Rainbow Creek and its tributaries. Monitoring locations are provided in Table 2-1, Figure 2-1 and Figure 2-2. Nutrient TMDL monitoring locations include eleven sites located along the main stem of Rainbow Creek and its tributaries (Figure 2-1) and one County-maintained MS4 feature(HST01) and one upstream location to HST01 (HST02) (Figure 2-2). Additional MS4 locations are those that are monitored as part of the Rainbow Creek MS4 Outfall Monitoring Program and were originally selected through desktop analysis and field reconnaissance efforts to identify outfalls and MS4 segments that potentially discharge into Rainbow Creek during dry weather. Nineteen sites were chosen that are located on County of San Diego property or occur along County-maintained roads (Figure 2-2).
Figure 2-1. Receiving Water Monitoring Sampling Locations
Rainbow Creek HF183 Monitoring 3 January 2021
Figure 2-2. MS4 Outfall Sampling Locations
Rainbow Creek HF183 Monitoring 4 January 2021
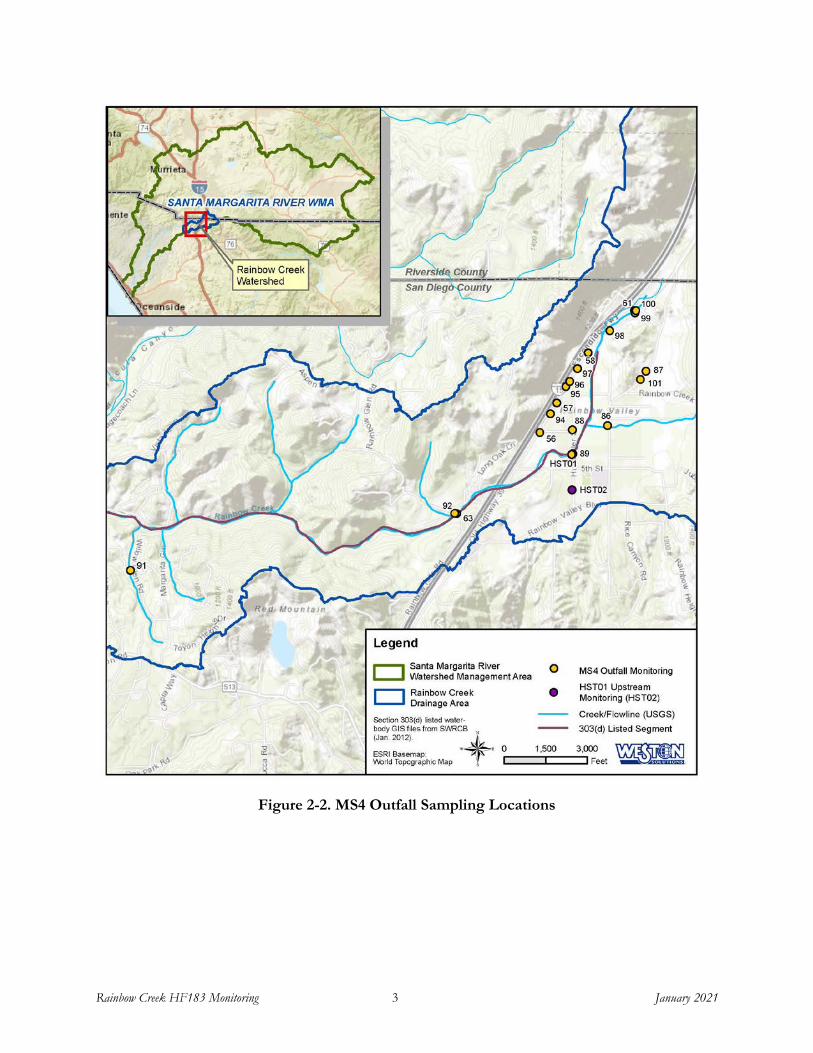
Table 2-1. Monitoring Locations
Location Name Description Latitude Longitude Main Stem Receiving Water Sample Locations
RBC01 Rainbow Creek @ Jubilee Way 33.4204 -117.1357 RBC02 Rainbow Creek @ Huffstatler Road 33.4154 -117.152 RBC04 Rainbow Creek @ Old Highway 395 33.4127 -117.1585 RBC10 Rainbow Creek @ MWD Crossing 33.407 -117.1834 SMG05 Rainbow Creek @ Willow Glen Road 33.4079 -117.201 SMG06 Rainbow Creek @ Stage Coach Lane 33.4106 -117.2148
Tributary Receiving Water Sample Locations RVT02 Chica Tributary @ 1st Street 33.4213 -117.1498 RGT01 Rainbow Glen Tributary to Rainbow Creek 33.4111 -117.1857 MGT01 Margarita Glen Tributary to Rainbow Creek 33.4085 -117.1988 WGT01 Willow Glen Tributary @ Willow Glen Road 33.4078 -117.2031 VMT01 Via Milpas Tributary to Rainbow Creek 33.4096 -117.2137
MS4 Sample Locations HST01 Brow Ditch to Rainbow Creek @ Huffstatler Road 33.4153 -117.152
HST02 Brow Ditch to Rainbow Creek @ Huffstatler Road (Upstream of HST01, not County maintained) 33.4117 -117.152
MS4-SMG-056 Outfall at Old Hwy. 395; 20’ south of 2nd Street 33.4174 -117.1558 MS4-SMG-057 Outfall at Old Hwy. 395; 1,160’ north of 2nd Street 33.4203 -117.1539 MS4-SMG-058 Outfall at Old Hwy. 395; 3,290’ north of 2nd Street 33.4253 -117.1502 MS4-SMG-061 Outfall at Rainbow Valley Blvd.; 1,025’ west of Old Hwy.
33.4296 -117.1448
MS4-SMG-063 Outfall at Rainbow Glen Rd.; 535’ west of Rainbow Hills Rd. (Under Bridge) 33.4093 -117.1656
MS4-SMG-086 Channel at 2526 Rainbow Valley Blvd. 33.4181 -117.1478 MS4-SMG-087 Channel at 2826 Rainbow Valley Blvd. (Old SMG19 Site) 33.4236 -117.1434 MS4-SMG-088 Channel at Huffstatler Street and 2nd Street 33.4177 -117.152 MS4-SMG-089 Channel across from HST01 at Huffstatler Street 33.4153 -117.1519
MS4-SMG-091 Outfall at Willow Glen Rd.; 125' north of Red Mountain Heights Dr. 33.4034 -117.2041
MS4-SMG-092 Outfall in ceiling of west box culvert at Rainbow Glen Rd.; 200' east of Oak Crest Rd. 33.4093 -117.1658
MS4-SMG-094 Outfall @ Old Hwy. 395, 700' north of 2nd Street 33.4193 -117.1546 MS4-SMG-095 Outfall @ Old Hwy. 395, 1,800' north of 2nd Street 33.422 -117.1528 MS4-SMG-096 Outfall at Old Hwy. 395, 2,000' north of 2nd Street 33.4225 -117.1524 MS4-SMG-097 Outfall at Old Hwy. 395; 2,600' north of 2nd Street 33.4238 -117.1515
MS4-SMG-098 Outfall at Old Hwy. 395; 1,350' south of West Rainbow Valley Blvd. 33.4276 -117.1476
MS4-SMG-099 Outfall on hillside of Old Highway 395; 50' south of West Rainbow Valley Blvd. 33.4293 -117.1447
MS4-SMG-100 Outfall on hillside at intersection of Old Highway 395 and West Rainbow Valley Blvd. 33.4296 -117.1446
MS4-SMG-101 Outfall at 2855 Rainbow Valley Blvd. (Rainbow Valley Nursery entrance) 33.4228 -117.144
Rainbow Creek HF183 Monitoring 5 January 2021
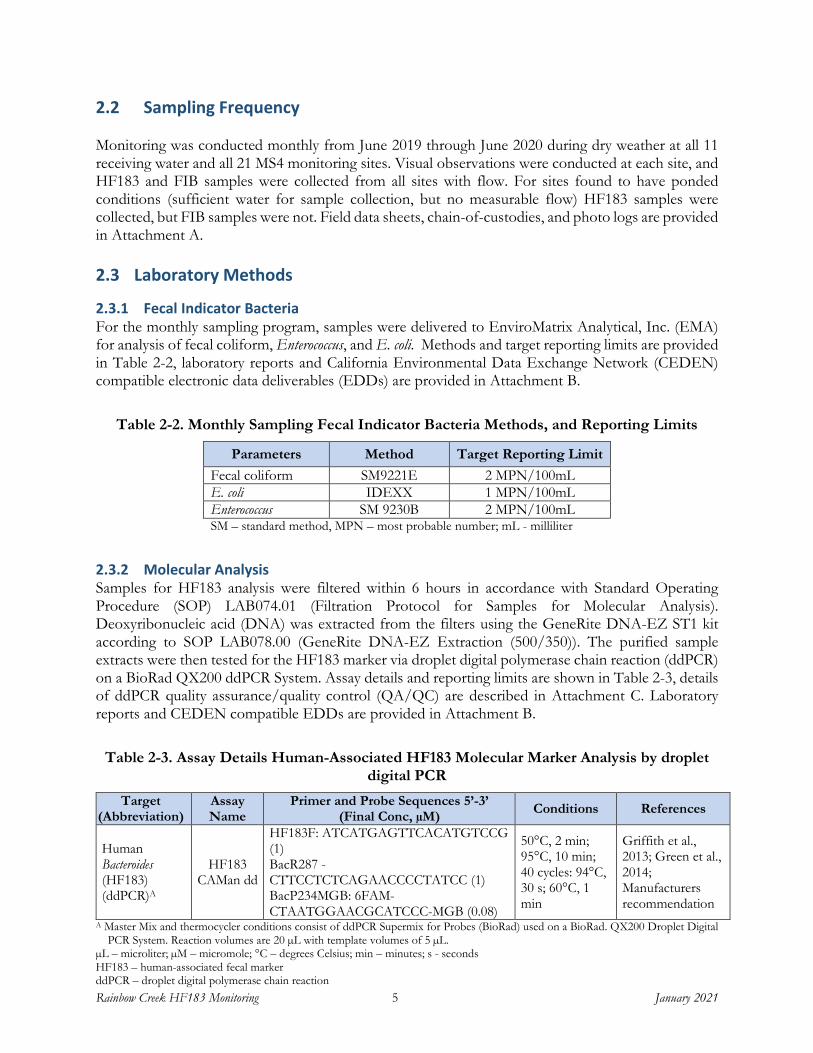
2.2 Sampling Frequency Monitoring was conducted monthly from June 2019 through June 2020 during dry weather at all 11 receiving water and all 21 MS4 monitoring sites. Visual observations were conducted at each site, and HF183 and FIB samples were collected from all sites with flow. For sites found to have ponded conditions (sufficient water for sample collection, but no measurable flow) HF183 samples were collected, but FIB samples were not. Field data sheets, chain-of-custodies, and photo logs are provided in Attachment A.
2.3 Laboratory Methods
2.3.1 Fecal Indicator Bacteria For the monthly sampling program, samples were delivered to EnviroMatrix Analytical, Inc. (EMA) for analysis of fecal coliform, Enterococcus, and E. coli. Methods and target reporting limits are provided in Table 2-2, laboratory reports and California Environmental Data Exchange Network (CEDEN) compatible electronic data deliverables (EDDs) are provided in Attachment B.
Parameters Method Target Reporting Limit Fecal coliform SM9221E 2 MPN/100mL E. coli IDEXX 1 MPN/100mL Enterococcus SM 9230B 2 MPN/100mL SM – standard method, MPN – most probable number; mL - milliliter
2.3.2 Molecular Analysis Samples for HF183 analysis were filtered within 6 hours in accordance with Standard Operating Procedure (SOP) LAB074.01 (Filtration Protocol for Samples for Molecular Analysis). Deoxyribonucleic acid (DNA) was extracted from the filters using the GeneRite DNA-EZ ST1 kit according to SOP LAB078.00 (GeneRite DNA-EZ Extraction (500/350)). The purified sample extracts were then tested for the HF183 marker via droplet digital polymerase chain reaction (ddPCR) on a BioRad QX200 ddPCR System. Assay details and reporting limits are shown in Table 2-3, details of ddPCR quality assurance/quality control (QA/QC) are described in Attachment C. Laboratory reports and CEDEN compatible EDDs are provided in Attachment B.
Table 2-3. Assay Details Human-Associated HF183 Molecular Marker Analysis by droplet digital PCR
Target (Abbreviation)
Assay Name
Primer and Probe Sequences 5’-3’ (Final Conc, µM) Conditions References
Griffith et al., 2013; Green et al., 2014; Manufacturers recommendation
A Master Mix and thermocycler conditions consist of ddPCR Supermix for Probes (BioRad) used on a BioRad. QX200 Droplet Digital PCR System. Reaction volumes are 20 µL with template volumes of 5 µL.
µL – microliter; µM – micromole; °C – degrees Celsius; min – minutes; s - seconds HF183 – human-associated fecal marker ddPCR – droplet digital polymerase chain reaction
Rainbow Creek HF183 Monitoring 6 January 2021
3 RESULTS
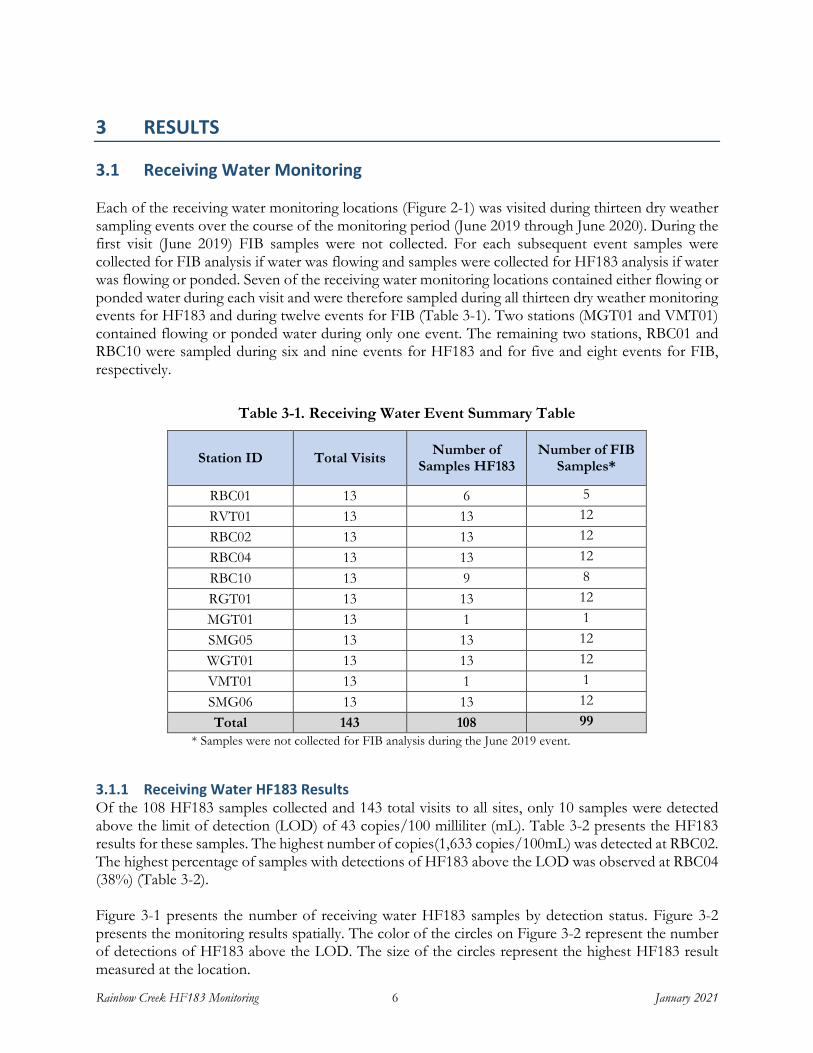
3.1 Receiving Water Monitoring Each of the receiving water monitoring locations (Figure 2-1) was visited during thirteen dry weather sampling events over the course of the monitoring period (June 2019 through June 2020). During the first visit (June 2019) FIB samples were not collected. For each subsequent event samples were collected for FIB analysis if water was flowing and samples were collected for HF183 analysis if water was flowing or ponded. Seven of the receiving water monitoring locations contained either flowing or ponded water during each visit and were therefore sampled during all thirteen dry weather monitoring events for HF183 and during twelve events for FIB (Table 3-1). Two stations (MGT01 and VMT01) contained flowing or ponded water during only one event. The remaining two stations, RBC01 and RBC10 were sampled during six and nine events for HF183 and for five and eight events for FIB, respectively.
* Samples were not collected for FIB analysis during the June 2019 event.
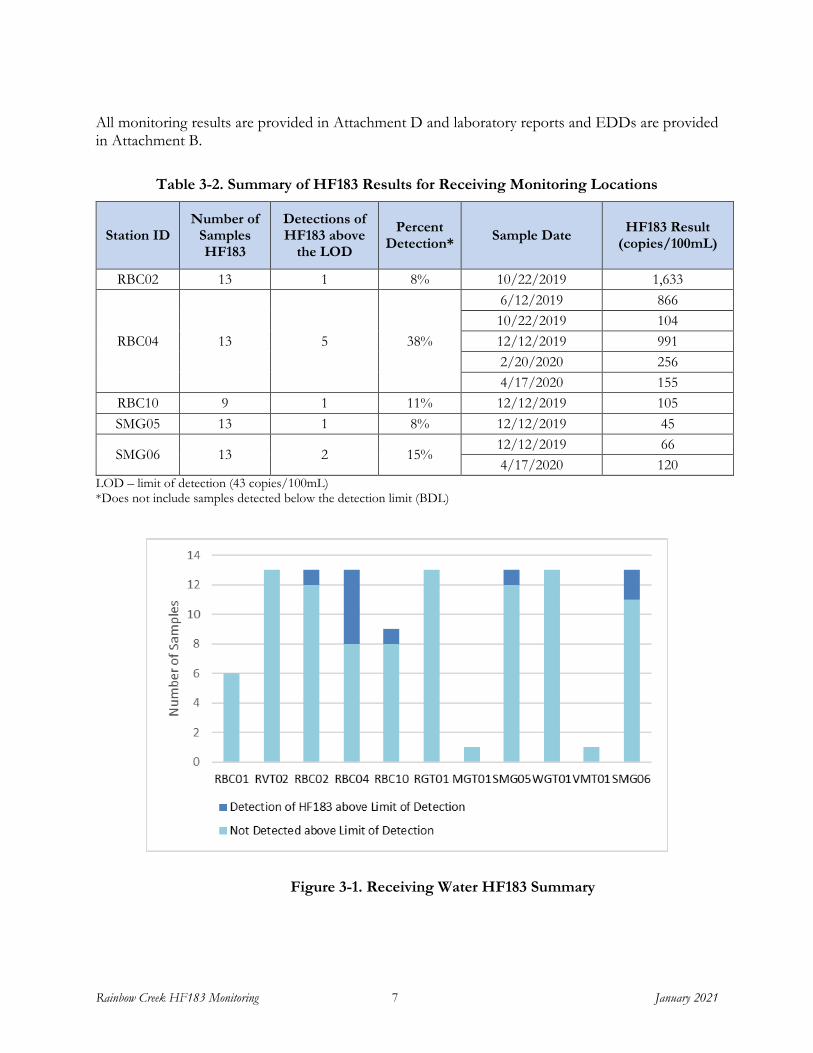
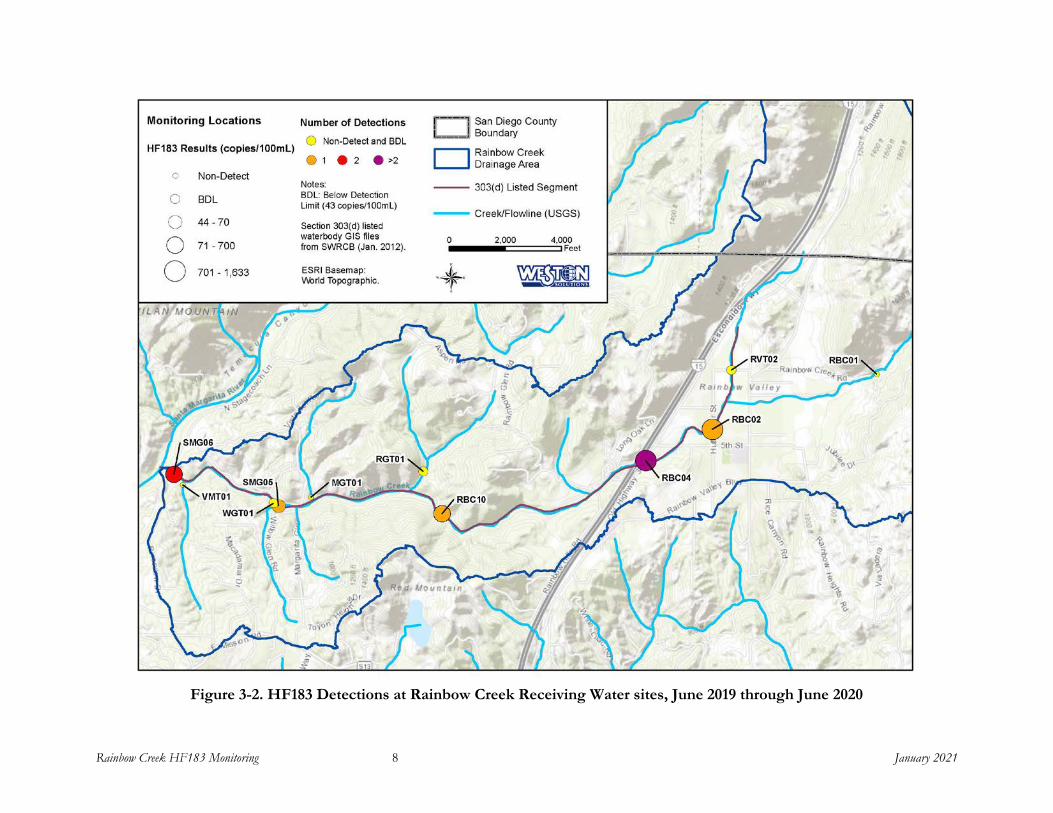
3.1.1 Receiving Water HF183 Results Of the 108 HF183 samples collected and 143 total visits to all sites, only 10 samples were detected above the limit of detection (LOD) of 43 copies/100 milliliter (mL). Table 3-2 presents the HF183 results for these samples. The highest number of copies(1,633 copies/100mL) was detected at RBC02. The highest percentage of samples with detections of HF183 above the LOD was observed at RBC04 (38%) (Table 3-2). Figure 3-1 presents the number of receiving water HF183 samples by detection status. Figure 3-2 presents the monitoring results spatially. The color of the circles on Figure 3-2 represent the number of detections of HF183 above the LOD. The size of the circles represent the highest HF183 result measured at the location.
Rainbow Creek HF183 Monitoring 7 January 2021
All monitoring results are provided in Attachment D and laboratory reports and EDDs are provided in Attachment B.
Table 3-2. Summary of HF183 Results for Receiving Monitoring Locations
LOD – limit of detection (43 copies/100mL) *Does not include samples detected below the detection limit (BDL)
Figure 3-1. Receiving Water HF183 Summary
Rainbow Creek HF183 Monitoring 8 January 2021
Figure 3-2. HF183 Detections at Rainbow Creek Receiving Water sites, June 2019 through June 2020
Rainbow Creek HF183 Monitoring 9 January 2021
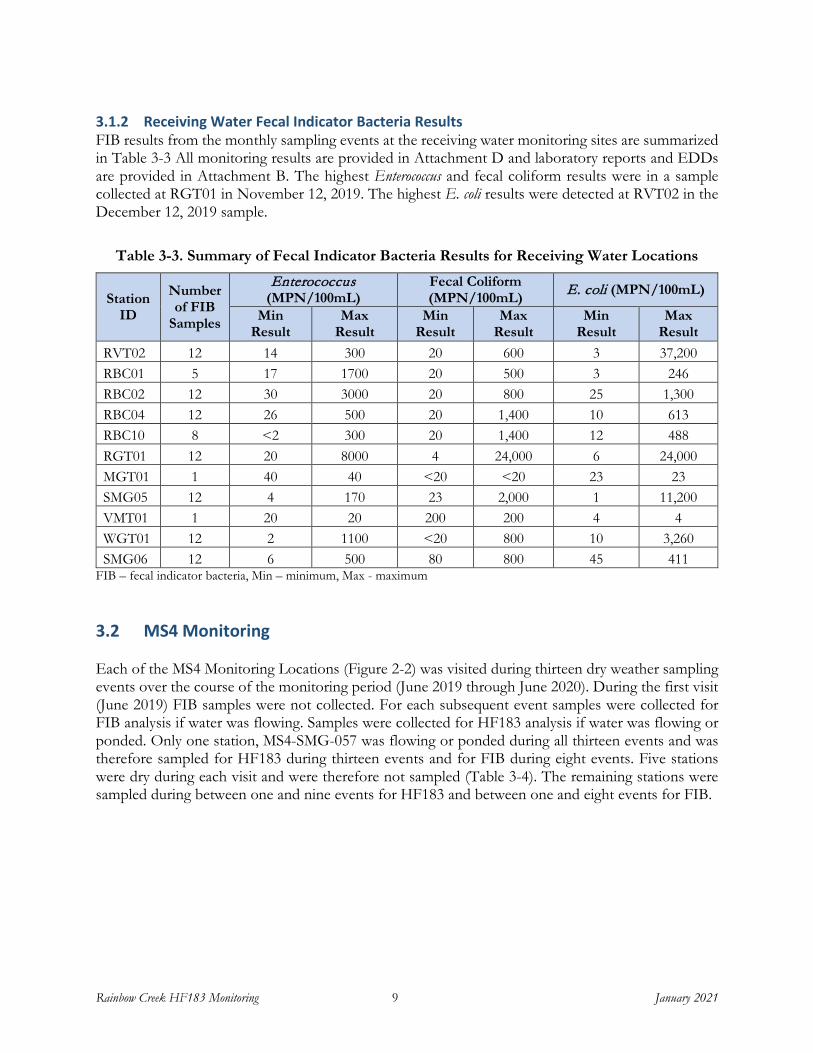
3.1.2 Receiving Water Fecal Indicator Bacteria Results FIB results from the monthly sampling events at the receiving water monitoring sites are summarized in Table 3-3 All monitoring results are provided in Attachment D and laboratory reports and EDDs are provided in Attachment B. The highest Enterococcus and fecal coliform results were in a sample collected at RGT01 in November 12, 2019. The highest E. coli results were detected at RVT02 in the December 12, 2019 sample.
Table 3-3. Summary of Fecal Indicator Bacteria Results for Receiving Water Locations
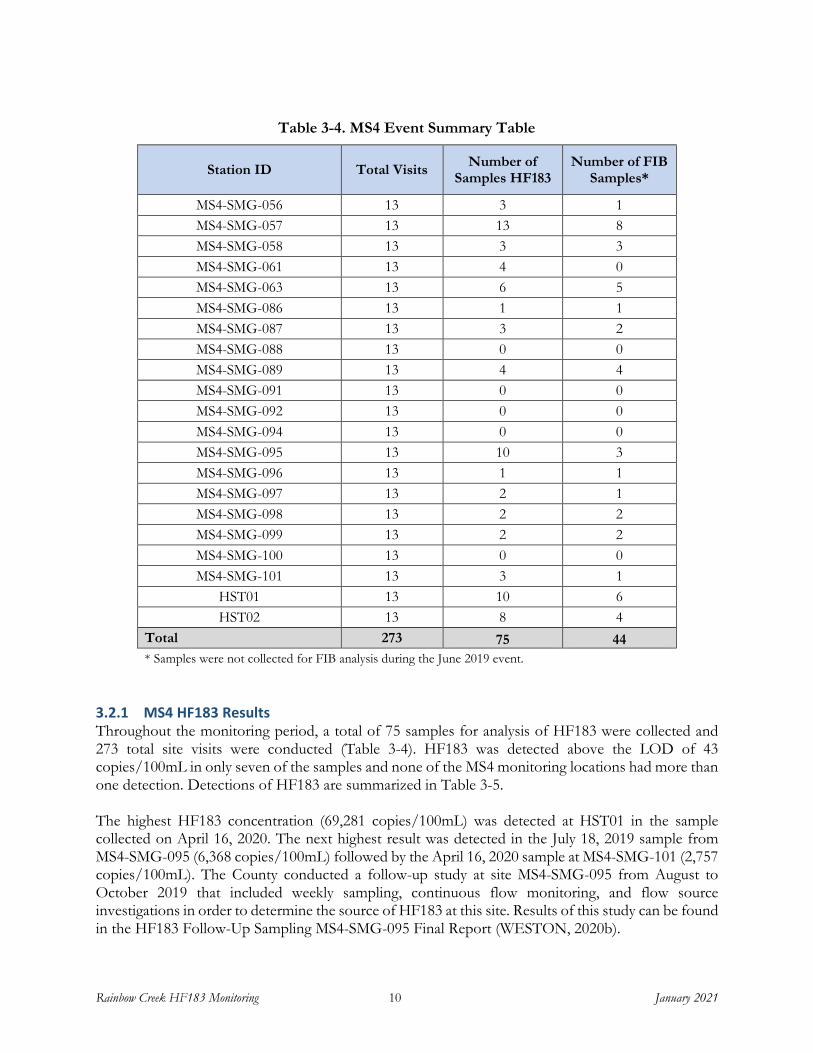
FIB – fecal indicator bacteria, Min – minimum, Max - maximum 3.2 MS4 Monitoring Each of the MS4 Monitoring Locations (Figure 2-2) was visited during thirteen dry weather sampling events over the course of the monitoring period (June 2019 through June 2020). During the first visit (June 2019) FIB samples were not collected. For each subsequent event samples were collected for FIB analysis if water was flowing. Samples were collected for HF183 analysis if water was flowing or ponded. Only one station, MS4-SMG-057 was flowing or ponded during all thirteen events and was therefore sampled for HF183 during thirteen events and for FIB during eight events. Five stations were dry during each visit and were therefore not sampled (Table 3-4). The remaining stations were sampled during between one and nine events for HF183 and between one and eight events for FIB.
Total 273 75 44 * Samples were not collected for FIB analysis during the June 2019 event.
3.2.1 MS4 HF183 Results Throughout the monitoring period, a total of 75 samples for analysis of HF183 were collected and 273 total site visits were conducted (Table 3-4). HF183 was detected above the LOD of 43 copies/100mL in only seven of the samples and none of the MS4 monitoring locations had more than one detection. Detections of HF183 are summarized in Table 3-5. The highest HF183 concentration (69,281 copies/100mL) was detected at HST01 in the sample collected on April 16, 2020. The next highest result was detected in the July 18, 2019 sample from MS4-SMG-095 (6,368 copies/100mL) followed by the April 16, 2020 sample at MS4-SMG-101 (2,757 copies/100mL). The County conducted a follow-up study at site MS4-SMG-095 from August to October 2019 that included weekly sampling, continuous flow monitoring, and flow source investigations in order to determine the source of HF183 at this site. Results of this study can be found in the HF183 Follow-Up Sampling MS4-SMG-095 Final Report (WESTON, 2020b).
Rainbow Creek HF183 Monitoring 11 January 2021
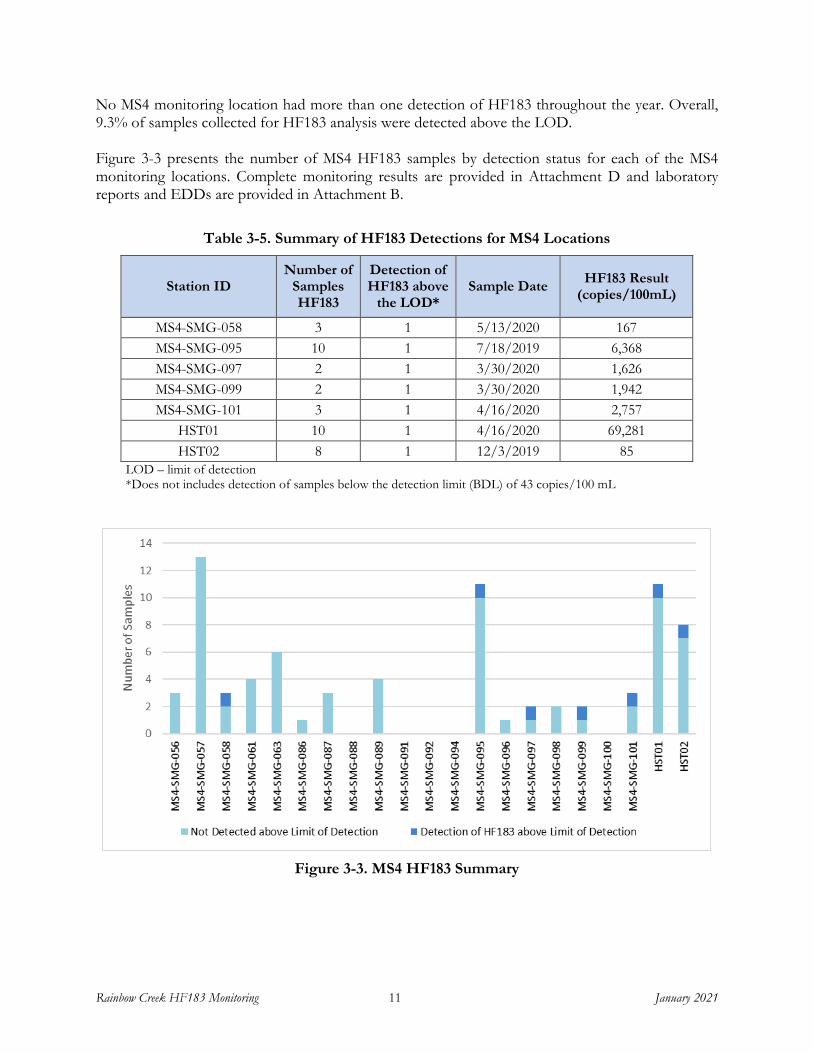
No MS4 monitoring location had more than one detection of HF183 throughout the year. Overall, 9.3% of samples collected for HF183 analysis were detected above the LOD. Figure 3-3 presents the number of MS4 HF183 samples by detection status for each of the MS4 monitoring locations. Complete monitoring results are provided in Attachment D and laboratory reports and EDDs are provided in Attachment B.
Table 3-5. Summary of HF183 Detections for MS4 Locations
LOD – limit of detection *Does not includes detection of samples below the detection limit (BDL) of 43 copies/100 mL
Figure 3-3. MS4 HF183 Summary
Rainbow Creek HF183 Monitoring 12 January 2021
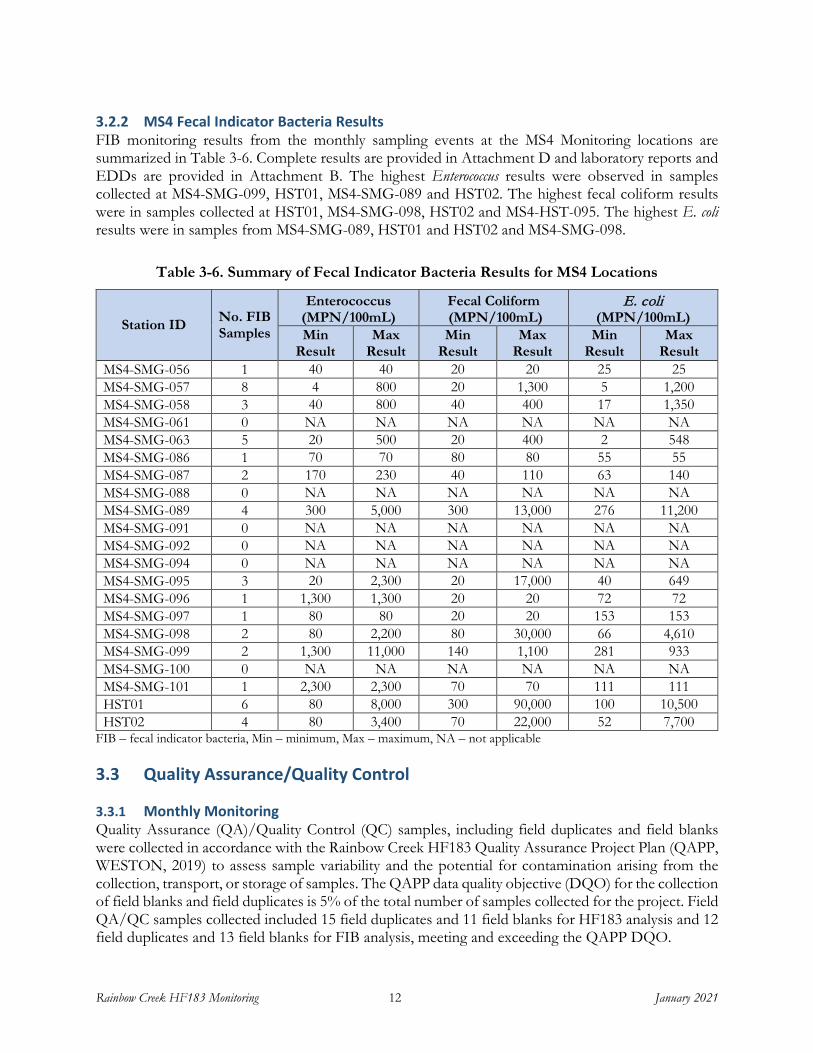
3.2.2 MS4 Fecal Indicator Bacteria Results FIB monitoring results from the monthly sampling events at the MS4 Monitoring locations are summarized in Table 3-6. Complete results are provided in Attachment D and laboratory reports and EDDs are provided in Attachment B. The highest Enterococcus results were observed in samples collected at MS4-SMG-099, HST01, MS4-SMG-089 and HST02. The highest fecal coliform results were in samples collected at HST01, MS4-SMG-098, HST02 and MS4-HST-095. The highest E. coli results were in samples from MS4-SMG-089, HST01 and HST02 and MS4-SMG-098.
Table 3-6. Summary of Fecal Indicator Bacteria Results for MS4 Locations
Station ID No. FIB Samples
Enterococcus (MPN/100mL)
Fecal Coliform (MPN/100mL)
E. coli (MPN/100mL)
Min Result
Max Result
Min Result
Max Result
Min Result
Max Result
MS4-SMG-056 1 40 40 20 20 25 25 MS4-SMG-057 8 4 800 20 1,300 5 1,200 MS4-SMG-058 3 40 800 40 400 17 1,350 MS4-SMG-061 0 NA NA NA NA NA NA MS4-SMG-063 5 20 500 20 400 2 548 MS4-SMG-086 1 70 70 80 80 55 55 MS4-SMG-087 2 170 230 40 110 63 140 MS4-SMG-088 0 NA NA NA NA NA NA MS4-SMG-089 4 300 5,000 300 13,000 276 11,200 MS4-SMG-091 0 NA NA NA NA NA NA MS4-SMG-092 0 NA NA NA NA NA NA MS4-SMG-094 0 NA NA NA NA NA NA MS4-SMG-095 3 20 2,300 20 17,000 40 649 MS4-SMG-096 1 1,300 1,300 20 20 72 72 MS4-SMG-097 1 80 80 20 20 153 153 MS4-SMG-098 2 80 2,200 80 30,000 66 4,610 MS4-SMG-099 2 1,300 11,000 140 1,100 281 933 MS4-SMG-100 0 NA NA NA NA NA NA MS4-SMG-101 1 2,300 2,300 70 70 111 111 HST01 6 80 8,000 300 90,000 100 10,500 HST02 4 80 3,400 70 22,000 52 7,700
FIB – fecal indicator bacteria, Min – minimum, Max – maximum, NA – not applicable 3.3 Quality Assurance/Quality Control
3.3.1 Monthly Monitoring Quality Assurance (QA)/Quality Control (QC) samples, including field duplicates and field blanks were collected in accordance with the Rainbow Creek HF183 Quality Assurance Project Plan (QAPP, WESTON, 2019) to assess sample variability and the potential for contamination arising from the collection, transport, or storage of samples. The QAPP data quality objective (DQO) for the collection of field blanks and field duplicates is 5% of the total number of samples collected for the project. Field QA/QC samples collected included 15 field duplicates and 11 field blanks for HF183 analysis and 12 field duplicates and 13 field blanks for FIB analysis, meeting and exceeding the QAPP DQO.
Rainbow Creek HF183 Monitoring 13 January 2021
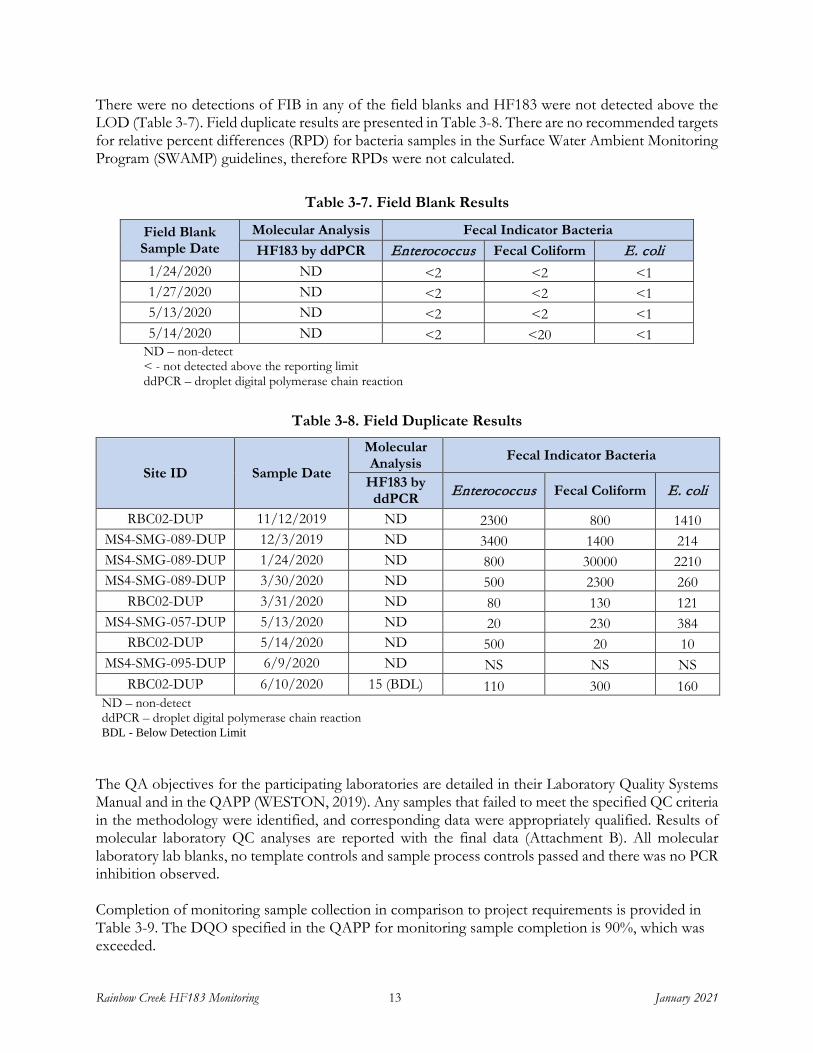
There were no detections of FIB in any of the field blanks and HF183 were not detected above the LOD (Table 3-7). Field duplicate results are presented in Table 3-8. There are no recommended targets for relative percent differences (RPD) for bacteria samples in the Surface Water Ambient Monitoring Program (SWAMP) guidelines, therefore RPDs were not calculated.
Table 3-7. Field Blank Results
Field Blank Sample Date
Molecular Analysis Fecal Indicator Bacteria HF183 by ddPCR Enterococcus Fecal Coliform E. coli
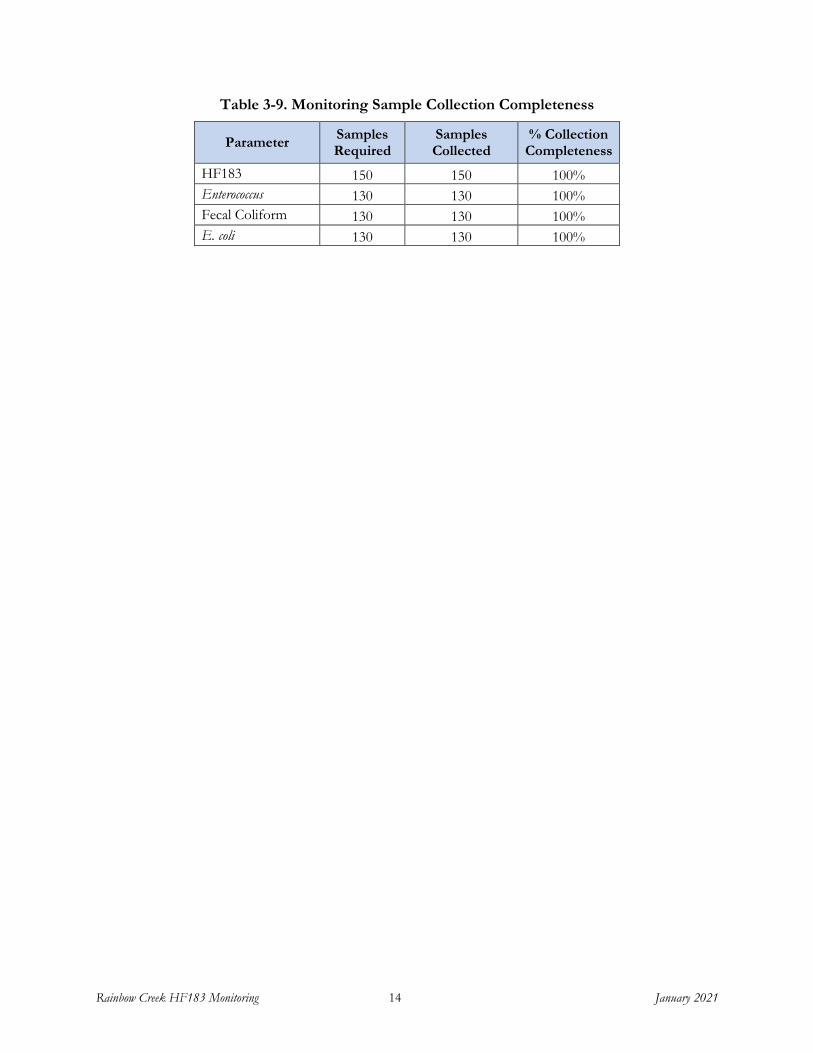
The QA objectives for the participating laboratories are detailed in their Laboratory Quality Systems Manual and in the QAPP (WESTON, 2019). Any samples that failed to meet the specified QC criteria in the methodology were identified, and corresponding data were appropriately qualified. Results of molecular laboratory QC analyses are reported with the final data (Attachment B). All molecular laboratory lab blanks, no template controls and sample process controls passed and there was no PCR inhibition observed. Completion of monitoring sample collection in comparison to project requirements is provided in Table 3-9. The DQO specified in the QAPP for monitoring sample completion is 90%, which was exceeded.
The Rainbow Creek HF183 Study was designed to collect data to inform the following study questions:
1. Is the human-associated fecal marker HF183 present in MS4 outfall and/or receiving water dry weather flows in the Rainbow Creek Watershed?
2. If HF183 is present in the watershed, the following sub-questions will be addressed:
a) What is the spatial pattern of HF183? b) What is the magnitude and the rate of occurrence of HF183? c) Under what flow conditions is HF183 observed? d) Is there a correlation between the HF183 marker and land use? e) Is there a correlation between HF183 spatial patterns and known septic tank locations?
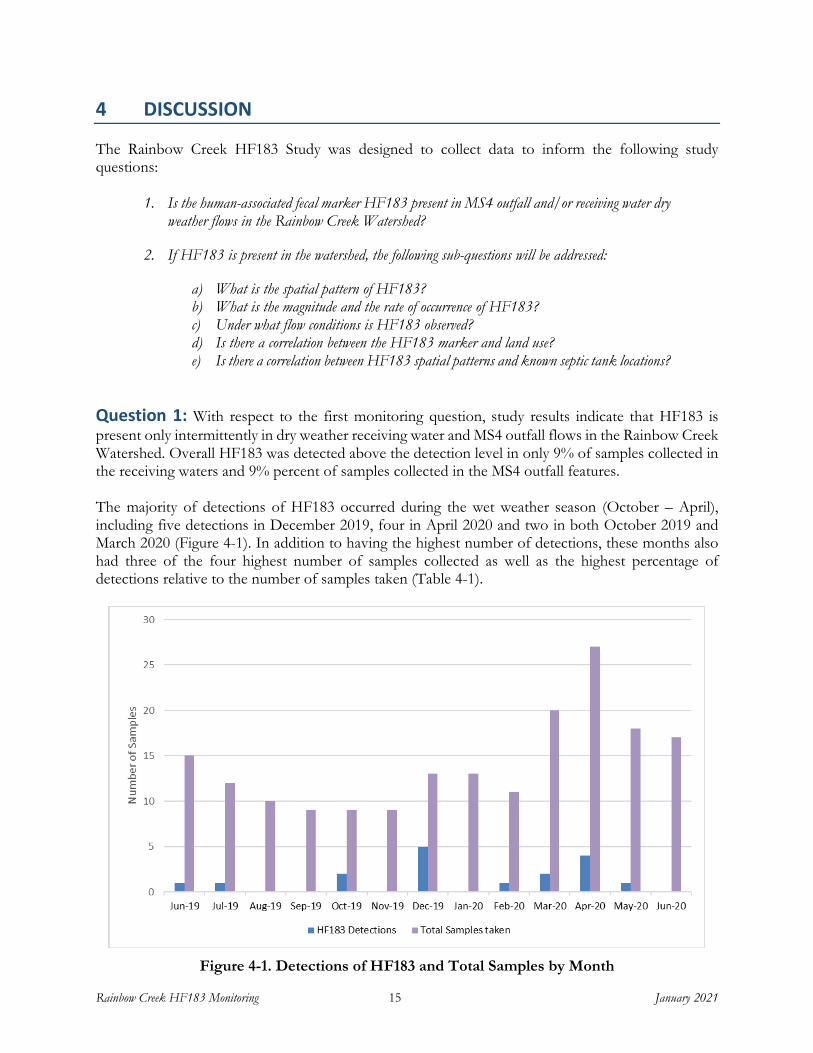
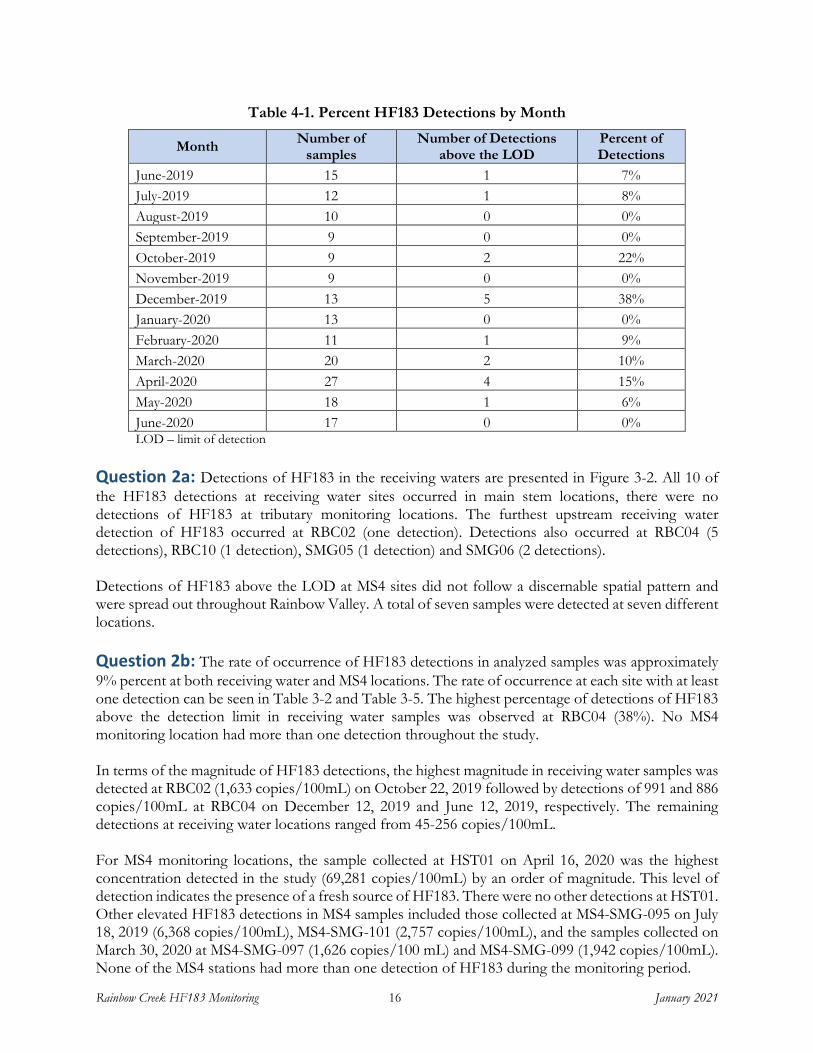
Question 1: With respect to the first monitoring question, study results indicate that HF183 is present only intermittently in dry weather receiving water and MS4 outfall flows in the Rainbow Creek Watershed. Overall HF183 was detected above the detection level in only 9% of samples collected in the receiving waters and 9% percent of samples collected in the MS4 outfall features. The majority of detections of HF183 occurred during the wet weather season (October – April), including five detections in December 2019, four in April 2020 and two in both October 2019 and March 2020 (Figure 4-1). In addition to having the highest number of detections, these months also had three of the four highest number of samples collected as well as the highest percentage of detections relative to the number of samples taken (Table 4-1).
Figure 4-1. Detections of HF183 and Total Samples by Month
Question 2a: Detections of HF183 in the receiving waters are presented in Figure 3-2. All 10 of the HF183 detections at receiving water sites occurred in main stem locations, there were no detections of HF183 at tributary monitoring locations. The furthest upstream receiving water detection of HF183 occurred at RBC02 (one detection). Detections also occurred at RBC04 (5 detections), RBC10 (1 detection), SMG05 (1 detection) and SMG06 (2 detections). Detections of HF183 above the LOD at MS4 sites did not follow a discernable spatial pattern and were spread out throughout Rainbow Valley. A total of seven samples were detected at seven different locations. Question 2b: The rate of occurrence of HF183 detections in analyzed samples was approximately 9% percent at both receiving water and MS4 locations. The rate of occurrence at each site with at least one detection can be seen in Table 3-2 and Table 3-5. The highest percentage of detections of HF183 above the detection limit in receiving water samples was observed at RBC04 (38%). No MS4 monitoring location had more than one detection throughout the study. In terms of the magnitude of HF183 detections, the highest magnitude in receiving water samples was detected at RBC02 (1,633 copies/100mL) on October 22, 2019 followed by detections of 991 and 886 copies/100mL at RBC04 on December 12, 2019 and June 12, 2019, respectively. The remaining detections at receiving water locations ranged from 45-256 copies/100mL. For MS4 monitoring locations, the sample collected at HST01 on April 16, 2020 was the highest concentration detected in the study (69,281 copies/100mL) by an order of magnitude. This level of detection indicates the presence of a fresh source of HF183. There were no other detections at HST01. Other elevated HF183 detections in MS4 samples included those collected at MS4-SMG-095 on July 18, 2019 (6,368 copies/100mL), MS4-SMG-101 (2,757 copies/100mL), and the samples collected on March 30, 2020 at MS4-SMG-097 (1,626 copies/100 mL) and MS4-SMG-099 (1,942 copies/100mL). None of the MS4 stations had more than one detection of HF183 during the monitoring period.
Rainbow Creek HF183 Monitoring 17 January 2021
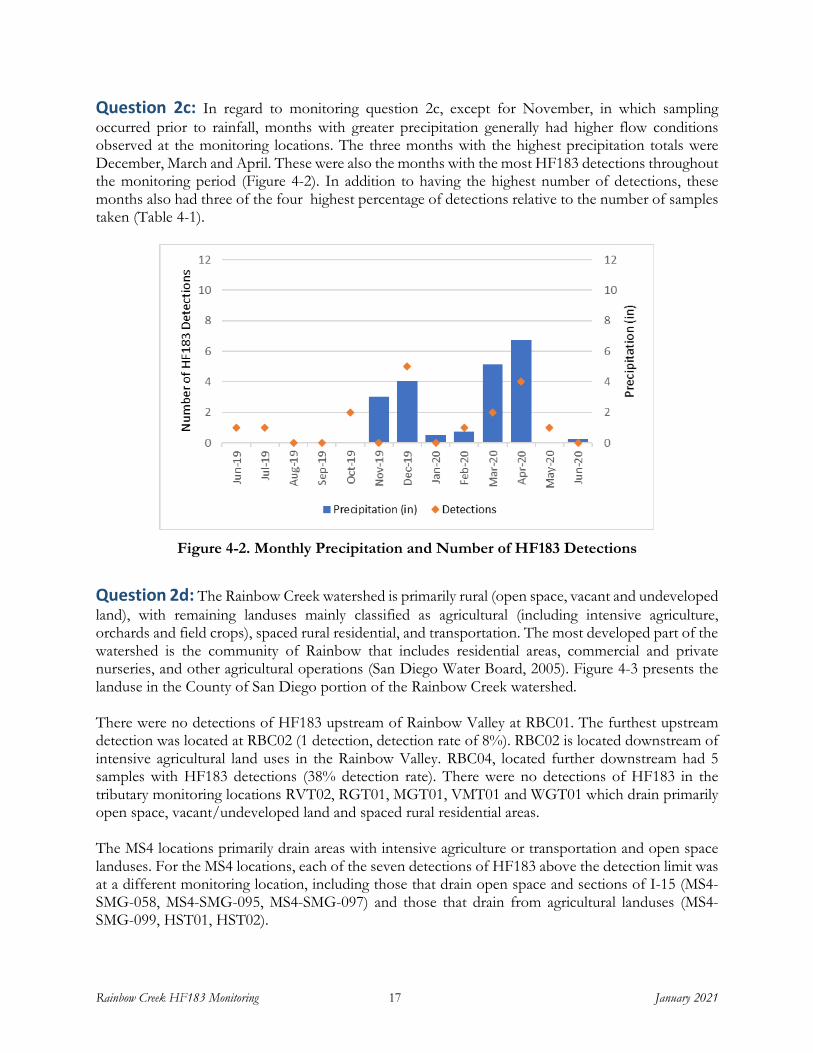
Question 2c: In regard to monitoring question 2c, except for November, in which sampling occurred prior to rainfall, months with greater precipitation generally had higher flow conditions observed at the monitoring locations. The three months with the highest precipitation totals were December, March and April. These were also the months with the most HF183 detections throughout the monitoring period (Figure 4-2). In addition to having the highest number of detections, these months also had three of the four highest percentage of detections relative to the number of samples taken (Table 4-1).
Figure 4-2. Monthly Precipitation and Number of HF183 Detections
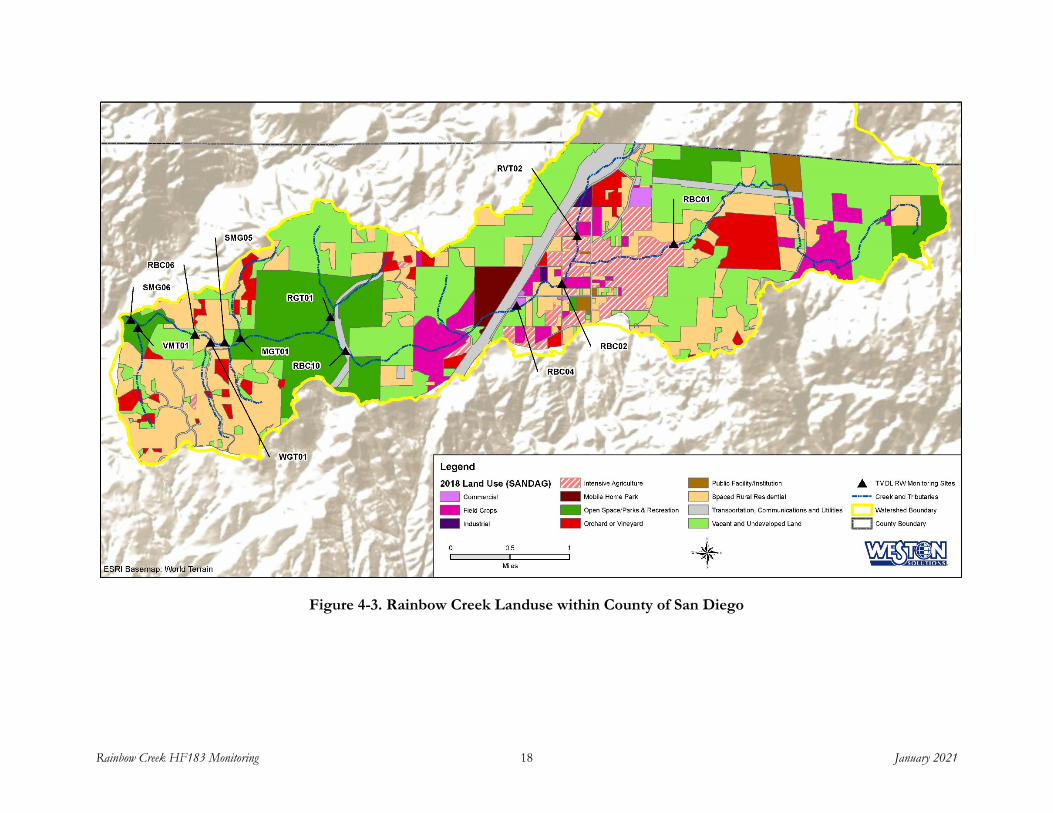
Question 2d: The Rainbow Creek watershed is primarily rural (open space, vacant and undeveloped land), with remaining landuses mainly classified as agricultural (including intensive agriculture, orchards and field crops), spaced rural residential, and transportation. The most developed part of the watershed is the community of Rainbow that includes residential areas, commercial and private nurseries, and other agricultural operations (San Diego Water Board, 2005). Figure 4-3 presents the landuse in the County of San Diego portion of the Rainbow Creek watershed. There were no detections of HF183 upstream of Rainbow Valley at RBC01. The furthest upstream detection was located at RBC02 (1 detection, detection rate of 8%). RBC02 is located downstream of intensive agricultural land uses in the Rainbow Valley. RBC04, located further downstream had 5 samples with HF183 detections (38% detection rate). There were no detections of HF183 in the tributary monitoring locations RVT02, RGT01, MGT01, VMT01 and WGT01 which drain primarily open space, vacant/undeveloped land and spaced rural residential areas. The MS4 locations primarily drain areas with intensive agriculture or transportation and open space landuses. For the MS4 locations, each of the seven detections of HF183 above the detection limit was at a different monitoring location, including those that drain open space and sections of I-15 (MS4-SMG-058, MS4-SMG-095, MS4-SMG-097) and those that drain from agricultural landuses (MS4-SMG-099, HST01, HST02).
Rainbow Creek HF183 Monitoring 18 January 2021
Figure 4-3. Rainbow Creek Landuse within County of San Diego
Rainbow Creek HF183 Monitoring 19 January 2021
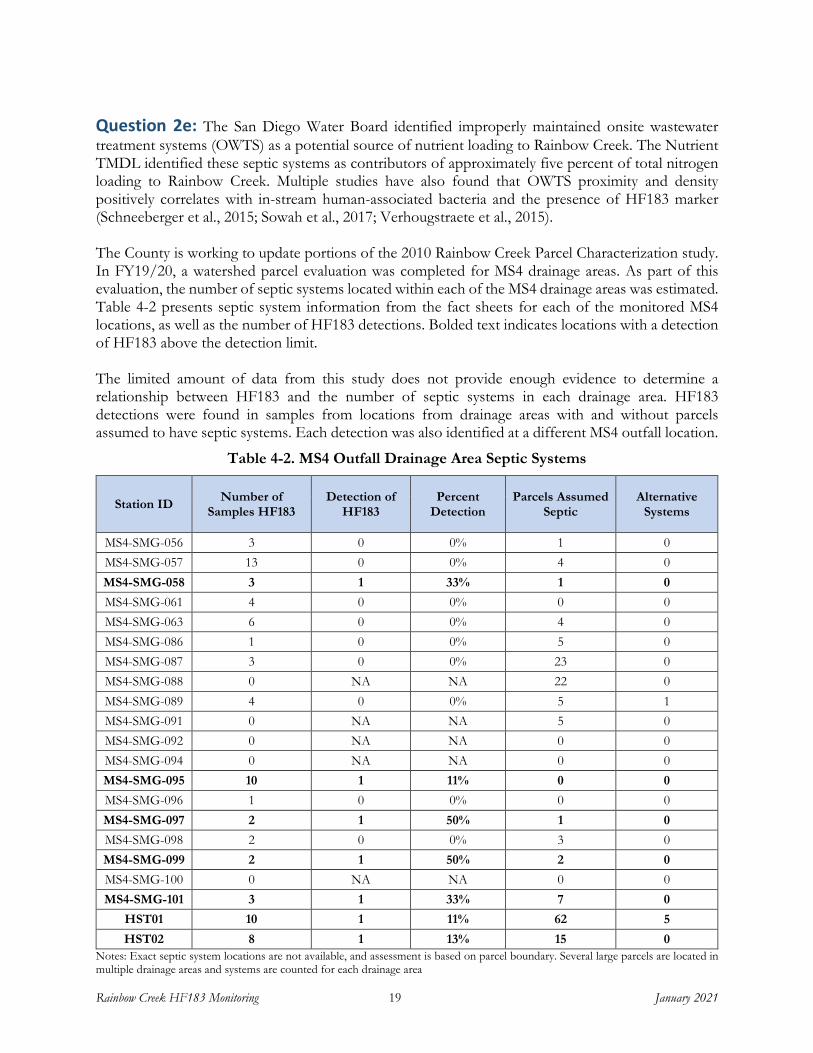
Question 2e: The San Diego Water Board identified improperly maintained onsite wastewater treatment systems (OWTS) as a potential source of nutrient loading to Rainbow Creek. The Nutrient TMDL identified these septic systems as contributors of approximately five percent of total nitrogen loading to Rainbow Creek. Multiple studies have also found that OWTS proximity and density positively correlates with in-stream human-associated bacteria and the presence of HF183 marker (Schneeberger et al., 2015; Sowah et al., 2017; Verhougstraete et al., 2015). The County is working to update portions of the 2010 Rainbow Creek Parcel Characterization study. In FY19/20, a watershed parcel evaluation was completed for MS4 drainage areas. As part of this evaluation, the number of septic systems located within each of the MS4 drainage areas was estimated. Table 4-2 presents septic system information from the fact sheets for each of the monitored MS4 locations, as well as the number of HF183 detections. Bolded text indicates locations with a detection of HF183 above the detection limit. The limited amount of data from this study does not provide enough evidence to determine a relationship between HF183 and the number of septic systems in each drainage area. HF183 detections were found in samples from locations from drainage areas with and without parcels assumed to have septic systems. Each detection was also identified at a different MS4 outfall location.
Table 4-2. MS4 Outfall Drainage Area Septic Systems
Notes: Exact septic system locations are not available, and assessment is based on parcel boundary. Several large parcels are located in multiple drainage areas and systems are counted for each drainage area
Rainbow Creek HF183 Monitoring 20 January 2021
5 REFERENCES
Green, H.C., Haugland, R.A., Varma, M., Millen, H.T., Borchardt, M.A., Field, K.G., Walters, W.A., Knight, R., Sivaganesan, M., Kelty, C.A. and Shanks, O.C. 2014. Improved HF183 Quantitative Real-Time PCR Assay for Characterization of Human Fecal Pollution in Ambient Surface Water Samples. Applied and Environmental Microbiology, 80(10), 3086-3094.
Griffith, J.F., Layton, B.A., Boehm, A.B., Holden, P.A., Jay, J.A., Hagedorn, C., McGee, C.D., and Weisberg, S.B. 2013. The California Microbial Source Identification Manual: A Tiered Approach to Identifying Fecal Pollution Sources to Beaches; Technical Report 804. Southern California Coastal Water Research Project (SCCWRP): Costa Mesa, CA.
San Diego Water Board (San Diego Water Quality Control Board). 2005. Basin Plan Amendment and
Final Technical Report for Total Nitrogen and Total Phosphorus Total Maximum Daily Loads for Rainbow Creek. Resolution No. R9-2005-0036. Effective 2006. http://www.swrcb.ca.gov/rwqcb9/water_issues/programs/tmdls/rainbowcreek.shtml
San Diego Water Board (San Diego Regional Water Quality Control Board). 2016. Water Quality
Control Plan for the San Diego Basin (9) (Basin Plan). 1994. With amendments effective on or before May 17, 2016.
Schneeberger C., O’Driscoll, M. Humphrey, C. Henry, K., Deal, N. Seiber, K., Zarate-Bermudez M. 2015. Fate and Transport of Enteric Microbes from Septic Systems in a Coastal Watershed. Journal of Environmental Health, 77(9), 22-31.
Sowah R.A., Habteselassie M.Y., Radcliffe D.E., Bauske E., & Risse M. 2017. Isolating the impact of septic system on fecal pollution in streams of suburban watersheds in Georgia, United States. Water Research, 108(1), 330-338. doi: 10.1016/j.watres.2016.11.007.
WESTON (Weston Solutions, Inc.). 2019. Quality Assurance Project Plan Rainbow Creek HF183 Monitoring. Prepared for the County of San Diego Watershed Protection Program. November 2019.
WESTON (Weston Solutions, Inc.). 2020a. 2018-2019 Rainbow Creek HF183 Monitoring Report. Prepared for the County of San Diego Watershed Protection Program. January 2020.
WESTON (Weston Solutions, Inc.). 2020b. HF183 Follow-Up Sampling MS4-SMG-095 Final Report. Prepared for the County of San Diego Watershed Protection program. May 2020.
Verhougstraete M.P., Martin S.L., Kendall A D., Hyndman D.W., & Rose J.B. 2015. Linking fecal bacteria in rivers to landscape, geochemical, and hydrologic factors and sources at the basin scale. Proceedings of the National Academy of Sciences of the United States of America, 112(33), 10419–10424. doi:10.1073/pnas.1415836112.