Surrogate safety measures and traffic conflict observations. Varhelyi, Andras; Laureshyn, Aliaksei; Johnsson, Carl; Saunier, Nicolas; van der Horst, Richard; Goede, Maartje de; Kidholm Osmann Madsen, Tanja Published in: How to analyse accident causation? 2018 Document Version: Publisher's PDF, also known as Version of record Link to publication Citation for published version (APA): Varhelyi, A., Laureshyn, A., Johnsson, C., Saunier, N., van der Horst, R., Goede, M. D., & Kidholm Osmann Madsen, T. (2018). Surrogate safety measures and traffic conflict observations. In E. Polders, & T. Brijs (Eds.), How to analyse accident causation?: A handbook with focus on vulnerable road users (first ed., pp. 95-128). InDeV, Horizon 2020 project. Total number of authors: 7 General rights Unless other specific re-use rights are stated the following general rights apply: Copyright and moral rights for the publications made accessible in the public portal are retained by the authors and/or other copyright owners and it is a condition of accessing publications that users recognise and abide by the legal requirements associated with these rights. • Users may download and print one copy of any publication from the public portal for the purpose of private study or research. • You may not further distribute the material or use it for any profit-making activity or commercial gain • You may freely distribute the URL identifying the publication in the public portal Read more about Creative commons licenses: https://creativecommons.org/licenses/ Take down policy If you believe that this document breaches copyright please contact us providing details, and we will remove access to the work immediately and investigate your claim.
Transcript
LUND UNIVERSITY
PO Box 117221 00 Lund+46 46-222 00 00
Surrogate safety measures and traffic conflict observations.
Varhelyi, Andras; Laureshyn, Aliaksei; Johnsson, Carl; Saunier, Nicolas; van der Horst,Richard; Goede, Maartje de; Kidholm Osmann Madsen, TanjaPublished in:How to analyse accident causation?
2018
Document Version:Publisher's PDF, also known as Version of record
Link to publication
Citation for published version (APA):Varhelyi, A., Laureshyn, A., Johnsson, C., Saunier, N., van der Horst, R., Goede, M. D., & Kidholm OsmannMadsen, T. (2018). Surrogate safety measures and traffic conflict observations. In E. Polders, & T. Brijs (Eds.),How to analyse accident causation?: A handbook with focus on vulnerable road users (first ed., pp. 95-128).InDeV, Horizon 2020 project.
Total number of authors:7
General rightsUnless other specific re-use rights are stated the following general rights apply:Copyright and moral rights for the publications made accessible in the public portal are retained by the authorsand/or other copyright owners and it is a condition of accessing publications that users recognise and abide by thelegal requirements associated with these rights. • Users may download and print one copy of any publication from the public portal for the purpose of private studyor research. • You may not further distribute the material or use it for any profit-making activity or commercial gain • You may freely distribute the URL identifying the publication in the public portal
Read more about Creative commons licenses: https://creativecommons.org/licenses/Take down policyIf you believe that this document breaches copyright please contact us providing details, and we will removeaccess to the work immediately and investigate your claim.
Part 2 | Chapter 2: Road accident statistics and available analysis techniques 43
𝑷(𝑨 = 𝒏) =𝒏𝒆
𝒏!
where:
= average number of accidents per year, n = non-negative integer number (0, 1, 2 …), A = actual accident count in a year.
A characteristic property of the Poisson
distribution is that its variance, Var(A), is
equal to the mean, . Therefore, stand-
ard deviation (s) is equal to the square
root of the mean, s = 0.5. This property
makes it possible to quickly assess the
confidence in estimates based on acci-
dent statistics. The expected value of ac-
cident frequency based on a series of Y
years of observations is calculated as an
arithmetic mean:
𝑬(𝑨) =∑ 𝑨
𝒀= 𝝀
where: Y = number of years of observation.
Standard error of this mean, given by the
general statistics formula as: s/√𝑌, in
case of the Poisson distribution reduces
to:
𝒔𝑬 =𝒔
√𝒀= √𝝀 𝒀⁄
For example, let us assume that during
a 3-year period 270 accidents were rec-
orded at site 1 and 18 at site 2. This
gives the mean counts per year 1 = 90
and 2 = 6. The standard errors of the
mean are: sE1 = (90/3)0.5 = 5.48 and sE2
= (6/3)0.5 = 1.41. We can then say that
the expected numbers of accidents in
one year will be: E(A1) = 90 ± 5.48 at site
1 and E(A2) = 6 ± 1.41 at site 2. In the
first case, this margin of error represents
6.1% of the mean and in the second
case 23.5%.
The fact that the relative margin of error
increases as the average accident fre-
quency declines has important implica-
tions. First, as the general road safety
44 Part 2 | Chapter 2: Road accident statistics and available analysis techniques
situation improves, there are fewer acci-
dents but also less precision in terms of
the expected number of accidents. This
problem is especially evident in coun-
tries that are leaders in road safety. Sec-
ond, the precision of accident estimates
decreases when the number of acci-
dents is divided by type or severity, i.e. if
we consider only fatal accidents or pe-
destrian accidents, rather than all acci-
dents.
When analysing accident count statistics
from several sites, the count variability is
often greater than required by the Pois-
son distribution, that is, the variance of
accident counts is greater than the
mean. This phenomenon is known as
“overdispersion”. In such cases, it is bet-
ter to model accident numbers with a
negative binomial distribution. This dis-
tribution is more general than Poisson
and has two parameters. The variance is
related to the mean in the following way:
𝑽𝒂𝒓(𝑨) = 𝑴𝒆𝒂𝒏(𝑨) + 𝝋 𝑴𝒆𝒂𝒏(𝑨)𝟐
where: Mean(A) = average number of accidents per site,
= overdispersion parameter2.
The value of parameter relates to data
dispersion in the following way. When
is small, variance is close to the mean,
so the distribution is close to Poisson. As
gets increasingly larger, the data be-
come more and more dispersed. The
value of can be estimated from the
above equation using accident data from
a reporting period of at least three years.
2.1.4 IDENTIFICATION OF HAZARDOUS LOCATIONS
The process of identifying hazardous lo-
cations involves identification and analy-
sis of black spots, as well as safety anal-
ysis of road networks. The difference be-
tween these two tasks can be explained
as follows:
2The definition used here follows that of Elvik (2011). In some textbooks a related
but different parameter: k = 1/ is used and is also called “overdispersion parame-ter”.
Black spot analysis is defined as a
method of identifying high-risk acci-
dent locations (intersections or very
short road sections, such as danger-
ous curves), i.e. locations with a
high concentration of accidents.
Black spot analysis is usually part of
Part 2 | Chapter 2: Road accident statistics and available analysis techniques 45
a black spot management pro-
gramme.
Road network safety analysis is de-
fined as a method of ranking road
sections with high accident concen-
tration. It is a means of identifying,
analysing and ranking sections of
the road network where a large
number of accidents have occurred
in proportion to the traffic flow and
road length. Road network safety
analysis is usually the first step in a
Road Network Safety Management
process.
As already mentioned, road accidents
are relatively rare, random events and
as such their frequency is subject to ran-
dom fluctuations in time. If hazardous lo-
cations are identified based on short-
term (typically three-year) accident
counts, their selection can be biased by
the so called “regression-to-the-mean”
effect. As shown in Figure 2-1, accident
frequency at a particular site is high dur-
ing period 2, owing to random variation.
If this site is identified as a black spot,
the accident frequency will go down dur-
ing period 3 even if no safety treatment
is implemented, owing to the natural re-
gression to the long-term mean. Thus, if
black spots are selected for safety im-
provement based on high accident
counts alone, the effects of the treatment
will be overestimated, as a natural ran-
dom decrease in the number of acci-
dents will be wrongly attributed to the
treatment.
Figure 2-1: Variation in short term average accident frequency at a particular site (AASHTO, 2010)
46 Part 2 | Chapter 2: Road accident statistics and available analysis techniques
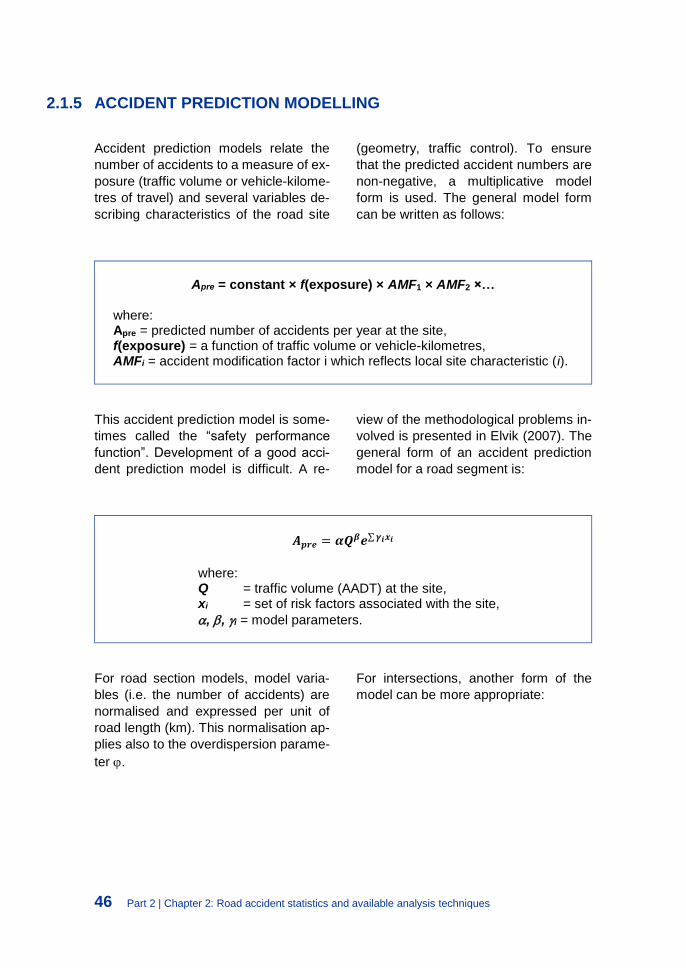
2.1.5 ACCIDENT PREDICTION MODELLING
Accident prediction models relate the
number of accidents to a measure of ex-
posure (traffic volume or vehicle-kilome-
tres of travel) and several variables de-
scribing characteristics of the road site
(geometry, traffic control). To ensure
that the predicted accident numbers are
non-negative, a multiplicative model
form is used. The general model form
can be written as follows:
Apre = constant × f(exposure) × AMF1 × AMF2 ×…
where: Apre = predicted number of accidents per year at the site, f(exposure) = a function of traffic volume or vehicle-kilometres, AMFi = accident modification factor i which reflects local site characteristic (i).
This accident prediction model is some-
times called the “safety performance
function”. Development of a good acci-
dent prediction model is difficult. A re-
view of the methodological problems in-
volved is presented in Elvik (2007). The
general form of an accident prediction
model for a road segment is:
𝑨𝒑𝒓𝒆 = 𝜶𝑸𝜷𝒆∑ 𝜸𝒊𝒙𝒊
where: Q = traffic volume (AADT) at the site, xi = set of risk factors associated with the site,
, , i = model parameters.
For road section models, model varia-
bles (i.e. the number of accidents) are
normalised and expressed per unit of
road length (km). This normalisation ap-
plies also to the overdispersion parame-
ter .
For intersections, another form of the
model can be more appropriate:
Part 2 | Chapter 2: Road accident statistics and available analysis techniques 47
𝑨𝒑𝒓𝒆 = 𝜶𝑸𝟏𝜷𝟏𝑸𝟐
𝜷𝟐𝒆∑ 𝜸𝒊𝒙𝒊
where: Q1 = first traffic volume (e.g. major road) entering the intersection, Q2 = second traffic volume (e.g. minor road or pedestrian) at the intersection, xi = set of risk factors associated with the site,
, 1, 2, i = model parameters.
Both models can be calibrated using
multiple linear regression after taking
logarithms from both sides of the equa-
tion. Figure 2-2 presents an example of
such an intersection model, taken from
the US Highway Safety Manual (HSM;
AASHTO, 2010). The model represents
accident frequency (accidents plus prop-
erty-damage-only collisions) for a typical
urban four-leg signalised intersection in
the United States as a function of major
and minor road traffic volume at the site
(AADT). To account for local conditions,
accident modification factors (called
crash modification factors in the HSM)
are used.
Figure 2-2: Accident prediction model (per year) for a four-leg signalised intersection (AASHTO, 2010)
48 Part 2 | Chapter 2: Road accident statistics and available analysis techniques
2.2 Sources of accident data
2.2.1 NATIONAL ACCIDENT DATABASES
In most countries, road accident data are
collected and maintained by the police,
and in some countries also by hospitals
(Denmark, the Netherlands, Greece,
Sweden, Spain, Slovenia) or by govern-
mental organisations (the Netherlands,
Belgium, Portugal, Hungary) (ETSC,
2006). The Swedish STRADA (Swedish
Traffic Accident Data Acquisition) sys-
tem, based on Geographic Information
Systems (GIS), contains information
about accidents from both the police and
hospitals. A useful link for finding the
sources of information in this respect is:
https://ec.eu-
ropa.eu/transport/road_safety/special-
ist/erso/important-links_en
A data linkage project using data from
various sources, such as emergency
hospital and ambulance services, fire
services, forensic services, mortality
records and information from insurance
companies has been developed in the
Netherlands (IRTAD, 2011). Another
good example of a national database is
FARS (Fatality Analysis Reporting Sys-
tem), created for the USA. It is a dis-
aggregated database providing detailed
information on traffic accidents with
open access to raw data files.
Swedish Traffic Accident Data Acquisition (STRADA)
The Swedish national information system STRADA contains data on road accidents and in-juries, based on information from reports provided by the police and medical reports provided by the hospitals. STRADA was implemented in cooperation with the Swedish Police, the Fed-eration of Swedish County Councils, the National Board of Health and Welfare, the Swedish Association of Local Authorities, the Swedish Institute for Transport and Communications Analysis (SIKA) and Statistics Sweden (SCB). The Swedish Transport Agency is the authority responsible for STRADA.
Registration in STRADA is mandatory for the police and for hospitals. Nationwide reporting to STRADA by the police has been carried out continuously since 2003. In 2012, 19 of 21 counties had all hospitals registered in the system (in total, 68 hospitals were registered in STRADA in 2012). The data entered by the police and hospitals into STRADA are then matched, which results in more detailed information on traffic accidents. In 2013, about 30% of all injured persons registered by the hospitals were also registered in police databases. In hospital databases, injuries are coded using the Abbreviated Injury Scale (AIS), Maximum Abbreviated Injury Scale (MAIS), Injury Severity Score (ISS), International Classification of Diseases (ICD 10) and Reaction Level Scale (RLS). Information from STRADA is used by national, regional and local authorities and by road safety researchers.
Part 2 | Chapter 2: Road accident statistics and available analysis techniques 49
Number of injured persons in the County of Värmland reported from the police and from hospitals, and type of road user (2011) (Swedish Transport Agency, 2012)
2.2.2 INTERNATIONAL ACCIDENT DATABASES
There are several international accident
databases:
CARE (Community Road Accident
Database for Europe);
IRTAD (International Road Traffic
and Accident Database) – see be-
low;
Eurostat database – contains sta-
tistical data on persons killed in road
accidents aggregated by countries;
the data is provided by EU member
states;
UNECE (Economic Commission for
Europe) Statistical Database - con-
tains information on persons killed
or injured in road traffic accidents
aggregated by country, category of
user, accident type, age group and
time of accident;
The WHO (World Health Organiza-
tion) Mortality Database – is a
source of information on traffic fatal-
ities aggregated by country, year,
sex and age. The data are provided
by member states from their civil
registration systems since 1979 and
safety reports are published. How-
ever, the reports present only an
overall view of road fatalities. Ac-
cess to the database is open and
possible via the WHO website. A
special application can be used to
perform the analysis or the raw data
files can be downloaded directly
from the website.
A comparison of databases and their ac-
cessibility is presented in Table 2-3.
50 Part 2 | Chapter 2: Road accident statistics and available analysis techniques
Table 2-3: Comparison of international databases
Database CARE IRTAD Eurostat database
UNECE statistical database
The WHO mortality database
Coverage EU countries 32 OECD countries
EU countries 56 UNECE countries
182 countries
Access limited open open open open
Type of data disaggregated aggregated aggregated aggregated aggregated
Information on VRU accidents
yes yes no yes no
Exposure data none vehicle
kilometres none
population vehicle fleet
population
CARE is a disaggregated database,
which contains information on individual
accidents provided by countries in Com-
mon Accident Dataset (CADaS) format.
Permission from the EC is required to
access the database: https://ec.eu-
ropa.eu/transport/road_safety/special-
ist/statistics_en
The following classes of information are
collected in the CARE database
(IDABC, 2004):
Person class (road user type: pe-destrian, driver, passenger);
Part 2 | Chapter 2: Road accident statistics and available analysis techniques 51
The Common Accident Dataset (CADaS)
CADaS was developed to provide a common framework for road accident data collection in Europe. The minimum data elements selected for CADaS were based on extensive research on data sources and systems available in 25 European countries, as well as stakeholders’ needs and priorities for accident data analysis at the national level (Yannis et al., 2008). The data elements of CADaS were finalised after more than four years of consultations with road safety data experts and are currently being applied in the European CARE database. The resulting common dataset was reviewed by experts and practitioners in several countries and
revised for relevance and feasibility. The purpose of implementing this common dataset was to help countries to improve and standardise their own road accident databases. CADaS glossary contains detailed information on variables which should be provided to the CARE database. http://ec.eu-
52 Part 2 | Chapter 2: Road accident statistics and available analysis techniques
European Commission Road Safety Statistics
In order to support road safety research in Europe, the web-based Road Safety Knowledge System has been developed within the DaCoTA research project (Yannis et al., 2016). The system contains not only accident data but also exposure, safety performance and socioec-onomic indicators, as well as information on road user attitudes and traffic laws and regula-tions. These data are used in road safety analysis to produce Basic Fact Sheets and annual statistical reports. Since 2012, the data are available on the EC Mobility and Transport webpage (European Commission, 2017) and are currently being further developed by the DaCoTA research group.
2.2.3 PROBLEM OF DATA HARMONISATION
International databases such as CARE
are created with the goal of harmonising
accident information between countries
to make international comparisons more
meaningful. However, in most EU coun-
tries there is a lack of detailed infor-
mation about the collision type (manoeu-
vres), and there are also different sub-
categories of junction type. National ac-
cident data collection systems across
the EU use the CADaS format on a vol-
untary basis. There are a lot of differ-
ences between the national databases,
and some values and variables may not
be compatible with the CADaS format.
Data transformations are very often diffi-
cult, which explains why many entries in
the CARE database are currently classi-
fied as “not available” or “other”.
The definition criteria used to classify
injury severity vary from country to
country and only fatalities can be
included in benchmarking studies.
The CARE definitions of injury severity
Injury road accident – incident on a public road involving at least one moving vehicle and at least one casualty (person injured or killed)
Fatally injured – death within 30 days of the road accident, confirmed suicide and natural death are not included
Injured – road user seriously or slightly injured (but not killed within 30 days) in the road accident
Seriously injured – injured (although not killed) in the road accident and hospitalized at least 24 hours
Slightly injured – injured (although not killed) in the road accident and hospitalized less than 24 hours or not hospitalized
Not injured – person participating in the accident although not injured
Part 2 | Chapter 2: Road accident statistics and available analysis techniques 53
At present, there is an attempt to harmo-
nize the definitions of traffic accident in-
jury severity by using one of the medical
injury scales:
Abbreviated Injury Scale (AIS);
Maximum Abbreviated Injury Scale
(MAIS);
Injury Severity Score (ISS);
New Injury Severity Score (NISS).
As a result of the work of experts and
public consultations (IRTAD 2011), the
European Commission recommended
using the MAIS3+ scale to determine the
number of serious injuries (European
Commision, 2013). As from 2015,
Member States started to report data on
serious injuries based on this scale. This
was a milestone in the work addressing
the problem of serious road traffic
accidents as injuries classified as MAIS
3+ cause most long term damage and
consequences.
Definitions of injury severity according to medical injury scales
Abbreviated Injury Scale (AIS) is a medical scale describing the severity of injury for each of nine regions of the body as: 1 Minor, 2 Moderate, 3 Serious, 4 Severe, 5 Critical, 6 Unsur-vivable. The body regions are: 1 Head, 2 Face, 3 Neck, 4 Thorax, 5 Abdomen, 6 Spine, 7 Upper Extremity, 8 Lower Extremity, 9 External and other.
Maximum Abbreviated Injury Scale (MAIS) is the maximum of the AIS scores for all regions of the body.
“MAIS 3+” - MAIS with the score 3 or more is now used for the definition of serious injuries. The European Commission adopted MAIS 3+ as a common scale score among EU countries for serious road traffic injuries instead of non-medical definitions based on the length of hospital stay or need for hospital treatment.
Some researchers advocate using the
disability-adjusted life years (DALYs)
to rate injury severity. DALY expresses
the number of life years lost due to ill-
health, disability or early death. It con-
veys additional information about the in-
fluence of an accident on the future life
of the person involved in the accident.
2.2.4 PROBLEM OF UNDERREPORTING
Misreporting and underreporting largely
occur because, in most EU countries,
the national road traffic injury databases
are based on police reports only (Euro-
pean Commission, 2013). However, the
police are not called to every traffic acci-
dent and cannot be expected to perform
a medical diagnosis; their assessment of
injuries is only a rough on-the-spot esti-
mation. This initial assessment by the
police is not always checked against
subsequent medical reports about injury
severity. Many studies (e.g. Alsop &
Langley, 2001; Amoros et al., 2006) con-
firmed that underreporting varied with in-
jury severity and road user type. Cyclist
victims have the lowest probability of be-
ing police-reported (especially when in-
volved in single-user accidents), fol-
lowed by pedestrians and motorcyclists.
54 Part 2 | Chapter 2: Road accident statistics and available analysis techniques
Thus, it can be concluded that police
records are generally biased against
VRU victims. Because of the incom-
pleteness of police databases, the rec-
ords collected by the police are being
combined with hospital records in some
countries (e.g. the STRADA system in
Sweden). This approach is the most ap-
propriate way to capture the underre-
porting of serious and slight injuries.
2.3 When to conduct
accident data analysis?
The needs for accident data analysis
vary depending on the geographical
scale (country, region, city, local area,
specific site) and time period considered
(long-term, short-term). In general, the
following possible objectives of safety
assessment are:
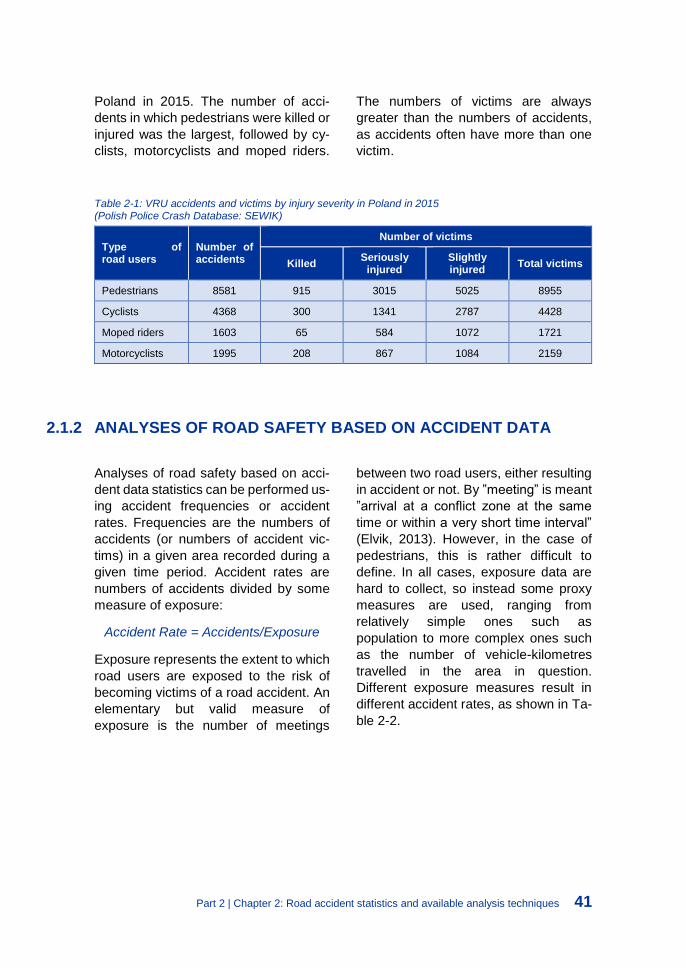
overview of the road safety situation in the area, diagnosis and identifica-tion of the most serious problems;
benchmarking or comparing the safety situation among countries or cities;
monitoring how the road safety situ-ation changes in time;
identification of hazardous locations as part of black spot management or network safety management;
before-and-after evaluation when implementing some safety treat-ment;
detailed site analysis of hazardous
locations earmarked for treatment.
Table 2-4 presents the analytical tools
suitable for different types of studies and
different assessment objectives. De-
tailed descriptions of the tools and ex-
amples will be provided in the next sec-
tion.
Table 2-4: Tools suitable for different safety assessment objectives
Objective of assessment
Tools
General traffic safety
reports
Black spot
analysis
Network safety
analysis
Accident prediction modelling
Collision diagram analysis
Overview of safety situation V
Monitoring of trends V V
Identification of critical locations V V V
Before-and-after evaluation V V V
Detailed site analysis V V V
Part 2 | Chapter 2: Road accident statistics and available analysis techniques 55
2.4 How to conduct
accident data analysis?
2.4.1 GENERAL TRAFFIC SAFETY REPORTS
General traffic safety reports are rou-
tinely prepared by road authorities or the
police in most countries and regions at
regular time intervals, typically every
year. They provide an overview of the
road safety situation in the area under
consideration, using descriptive statis-
tics. The reports also identify time trends
and specific problems, such as the situ-
ation of VRUs. These studies are based
on police accident records and therefore
the results are biased, owing to the well-
known problems with police data as de-
scribed above. However, general traffic
safety reports provide an overview of the
road safety situation and should form the
basis of any safety assessment.
Steps in preparing a general traffic safety report
1. Define the area of interest, time period (years) and types of accidents to be examined.
2. List the variables needed for analysis (e.g. injury severity, road user type, accident lo-
cation, road type, vehicle type, victim’s age and gender, etc.).
3. Obtain disaggregate accident data as specified above (if available) or request tabula-
tions below from database administrator.
4. Perform cross-tabulations (e.g. injury severity by location) and frequency distributions
(e.g. victims by age and gender).
5. Produce diagrams and charts.
6. Draw conclusions (assess time trends, identify problem areas).
The European Road Safety Observatory
publishes yearly reports (European
Commission, 2015) that present general
traffic safety facts in EU countries con-
cerning various road transport modes
and user groups. Three of these reports
focus on VRU user groups: pedestrians,
cyclists and motorcycle/moped (PTW)
riders. The reports are based on analy-
sis of the CARE database and are very
good examples of general traffic safety
reports.
Accident frequencies and accident rates
can be presented in various forms as ta-
bles, graphs and maps. These can show
time trends, distributions of accidents by
type, severity, circumstances and victim
characteristics. Such tabulations and
graphs can point to the problems and
safety-critical issues. While the exact
56 Part 2 | Chapter 2: Road accident statistics and available analysis techniques
causes of accidents cannot be deter-
mined, the contributing factors can often
be deduced.
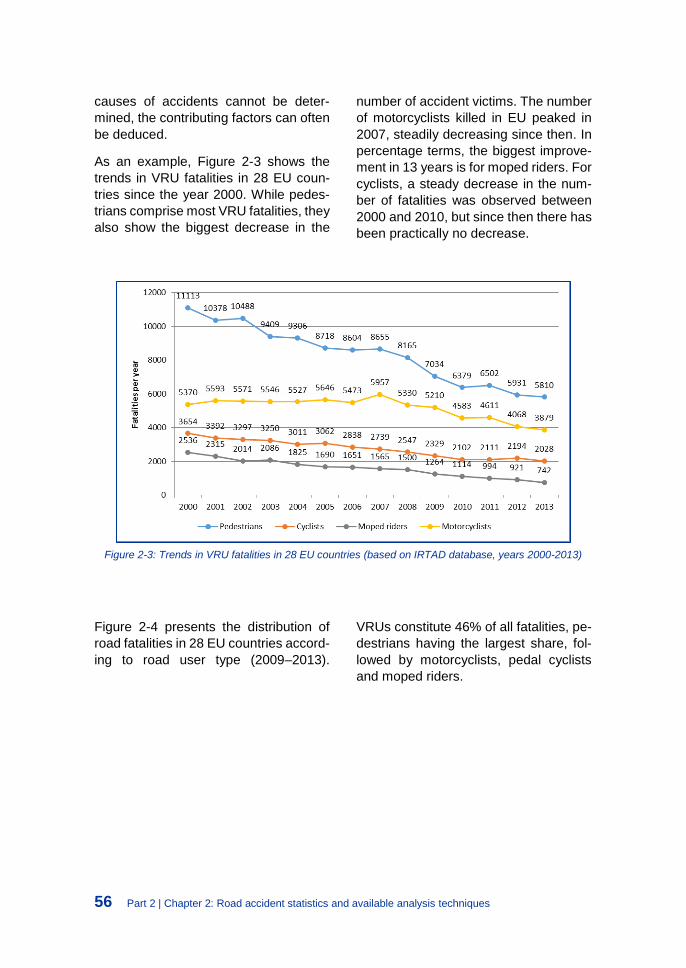
As an example, Figure 2-3 shows the
trends in VRU fatalities in 28 EU coun-
tries since the year 2000. While pedes-
trians comprise most VRU fatalities, they
also show the biggest decrease in the
number of accident victims. The number
of motorcyclists killed in EU peaked in
2007, steadily decreasing since then. In
percentage terms, the biggest improve-
ment in 13 years is for moped riders. For
cyclists, a steady decrease in the num-
ber of fatalities was observed between
2000 and 2010, but since then there has
been practically no decrease.
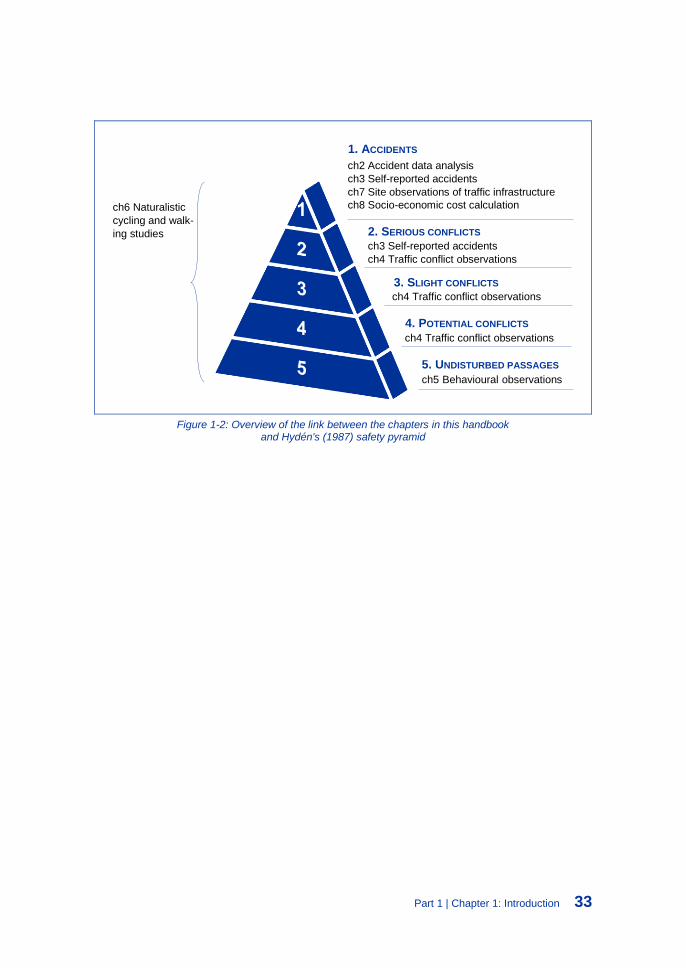
Figure 2-3: Trends in VRU fatalities in 28 EU countries (based on IRTAD database, years 2000-2013)
Figure 2-4 presents the distribution of
road fatalities in 28 EU countries accord-
ing to road user type (2009–2013).
VRUs constitute 46% of all fatalities, pe-
destrians having the largest share, fol-
lowed by motorcyclists, pedal cyclists
and moped riders.
Part 2 | Chapter 2: Road accident statistics and available analysis techniques 57
Figure 2-4: Distribution of road fatalities in EU according to road user type
(based on CARE database, years 2009-2013)
Figure 2-5 shows the comparison of
VRU fatality rates in selected EU coun-
tries according to road user type (2009–
2013). The rates range from one to 10
persons killed per million population per
year. Among the countries compared,
the lowest fatality rates are in Sweden,
the Netherlands (except for cyclists) and
Denmark (except for pedestrians).
Spain, Germany and Belgium have the
highest fatality rates for pedestrians,
motorcyclists and cyclists. Moped riders
have the lowest fatality rates.
Figure 2-5: VRU fatality rates (fatalities/1 million population/year) in selected EU countries
62 Part 2 | Chapter 2: Road accident statistics and available analysis techniques
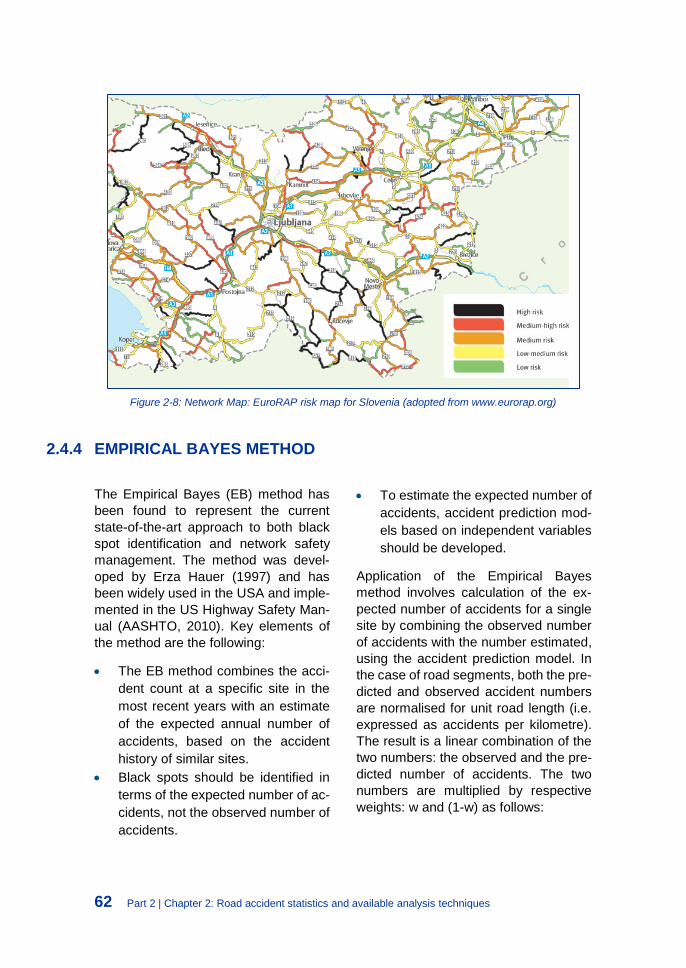
Figure 2-8: Network Map: EuroRAP risk map for Slovenia (adopted from www.eurorap.org)
2.4.4 EMPIRICAL BAYES METHOD
The Empirical Bayes (EB) method has
been found to represent the current
state-of-the-art approach to both black
spot identification and network safety
management. The method was devel-
oped by Erza Hauer (1997) and has
been widely used in the USA and imple-
mented in the US Highway Safety Man-
ual (AASHTO, 2010). Key elements of
the method are the following:
The EB method combines the acci-
dent count at a specific site in the
most recent years with an estimate
of the expected annual number of
accidents, based on the accident
history of similar sites.
Black spots should be identified in
terms of the expected number of ac-
cidents, not the observed number of
accidents.
To estimate the expected number of
accidents, accident prediction mod-
els based on independent variables
should be developed.
Application of the Empirical Bayes
method involves calculation of the ex-
pected number of accidents for a single
site by combining the observed number
of accidents with the number estimated,
using the accident prediction model. In
the case of road segments, both the pre-
dicted and observed accident numbers
are normalised for unit road length (i.e.
expressed as accidents per kilometre).
The result is a linear combination of the
two numbers: the observed and the pre-
dicted number of accidents. The two
numbers are multiplied by respective
weights: w and (1-w) as follows:
Part 2 | Chapter 2: Road accident statistics and available analysis techniques 63
𝑬(𝑨) = 𝒘𝑨𝒑𝒓𝒆 + (𝟏 − 𝒘)𝑨𝒐𝒃𝒔
where: E(A) = estimated expected number of accidents per year, Apre = number of accidents per year predicted by the accident model for similar sites, Aobs = number of accidents per year observed at the site, w = statistical weight.
The statistical weight w is calculated as follows:
𝒘 =𝟏
𝟏 + 𝒀𝝋𝑨𝒑𝒓𝒆
where: Y = number of years for which accident observations are made,
= overdispersion parameter associated with the accident prediction model (see section 2.1.3).
The value of w varies between 0 and 1.0.
The weight controls the relative im-
portance of model predictions versus the
recorded number of accidents. If many
years of observations are used (high Y
number), w will be smaller and thus
more emphasis will be given to Aobs. If
data used to calibrate the accident pre-
diction model show little dispersion (low
value), w will be larger, as in this situ-
ation we have more confidence in the
model.
The EB method approach makes it pos-
sible to provide unbiased estimates of
the number of accidents expected in the
long term at a particular site, such as an
intersection or a road segment. It elimi-
nates the bias in the observed number of
accidents due to random fluctuations,
which is known as the regression-to-the
mean effect.
64 Part 2 | Chapter 2: Road accident statistics and available analysis techniques
Example of EB method application
Consider a three-leg rural intersection where 10 accidents were recorded in the last three years. The following model was calibrated for a group of similar intersections to predict the number of accidents per year:
Apre = 6.54×10⁻⁵×Q10.82×Q2
0.51×AMF For our intersection, Q1 (major road AADT) is 4000 veh/day, Q2 (minor road AADT) is 500 veh/day and AMF to account for local differences from nominal conditions is 1.27. The value
of overdispersion parameter for this type of intersection is given as 0.313.
1) Predicted number of accidents per year: Apre = 6.54×10-5×40000.82×5000.51×1.27 = 1.78
In the three years for which accidents are recorded we would expect: 3×1.78 = 5.34 accidents.
2) The statistical weight w is calculated as:
𝑤 =1
1 + 3 × 0.313 × 1.78 = 0.375
3) Estimated expected number of accidents:
𝐸(𝐴) = 0.375𝐴𝑝𝑟𝑒 + (1 − 0.375)𝐴𝑜𝑏𝑠
𝐸(𝐴) = 0.375 × 5.34 + 0.625 × 10 = 8.25 accidents in 3 years or 2.75 accidents per year. The standard deviation of the estimate is: se = (0.625×2.75)0.5 = 1.31. Thus, the expected accident frequency at this intersection is: 2.75 ± 1.31 per year. We note that the estimate is between the observed number for this site (3.33) and the average for similar sites (1.78). The EB estimator pulls the accident frequency towards the predicted mean and therefore corrects the regression-to-the-mean bias.
2.4.5 COLLISION DIAGRAM ANALYSIS
Collision diagrams provide a visual rep-
resentation of accident data at a given
location (intersection, road segment) to
illustrate how each accident happened.
They use symbols to denote different ac-
cident types, their locations and ma-
noeuvres of vehicles involved. These al-
low traffic safety engineers to determine
the main accident causes, identify spe-
cific accident factors and pick locations
to install new safety measures. It is pos-
sible then to go from the network level
analysis to viewing the actual accident
reports for individual accidents.
Collision diagram analysis is often used
for further detailed investigation of haz-
ardous locations identified as part of the
black spot management process. It usu-
ally involves the following stages:
1. Preparation of a collision diagram
which should show the road geome-
try, the location of all accidents, their
types and severity, as well as move-
ments of vehicles involved (see Fig-
ure 2-9 for an example).
Part 2 | Chapter 2: Road accident statistics and available analysis techniques 65
2. Preparation of a “condition dia-
gram”, showing the traffic layout
plan, including location of traffic
signs and markings, pedestrian
crossings, traffic signals, bus stops
and parking spaces.
3. Site visit to check local conditions
such as visibility, location of obstruc-
tions and fixed objects, pavement
condition (e.g. skid resistance).
4. Preparation of a traffic safety im-
provement plan including the pro-
posed remedial actions.
Figure 2-9: Example of a collision diagram – Germany (PIARC, 2015)
2.4.6 IN-DEPTH ACCIDENT CAUSATION STUDIES
In-depth accident causation studies
are aimed at collecting data and iden-
tifying, usually by means of on-scene
visits, the contributing factors that
have played a role in the process lead-
ing towards a specific accident and to
store the collected data in an accident
causation database for post-hoc acci-
dent causation analysis. The approach
originally stems from air crash investi-
gations where the systematic in-depth
investigation and analysis of plane
crashes was already widely adopted.
In an on-road in-depth accident causa-
tion investigation, typically a multi-dis-
ciplinary team of investigators carries
out an ‘on-scene’ or ‘nearly on-scene’
visit immediately (or shortly) after the
66 Part 2 | Chapter 2: Road accident statistics and available analysis techniques
accident to collect data, i.e. to conduct
vehicle and road inspections as well as
interviews with crash participants. Ad-
ditionally, the use of advanced acci-
dent simulation models can help to un-
derstand the dynamics, process and
stages of the accident leading to a cer-
tain accident outcome.
Already in the 1990s, the vehicle man-
ufacturing sector set up in-depth acci-
dent investigations under the umbrella
of European funded projects, including
for example the European Accident
Causation Study (EACS), the Motorcy-
cle Accident In-depth Study (MAIDS),
and the European Truck Accident
Causation (ETAC) Study. However,
given the variety of methods and differ-
ence in approaches between different
countries and different transport
modes, the EU FP6 SafetyNet project
came up with a set of best-practice
recommendations for in-depth acci-
dent causation studies and a sug-
gested methodology (SNACS), as well
as the development of a structure for
an accident causation database (See
Thomas et al., 2009).
Although in-depth accident causation
studies can be a very effective way to
gain a deeper understanding in the po-
tentially contributing factors of road ac-
cidents, they have sometimes been
criticized for their cost efficiency, which
in several European Member States
has led to difficulties in their systematic
adoption.
More information about in-depth accident causation studies
For further reading on this subject, we refer to some interesting references such as:
the UK RAIDS on the spot pedestrian study (https://www.gov.uk/government/publica-tions/road-accident-investigation-road-accident-in-depth-studies/road-accident-in-depth-studies-raids);
the German In-Depth Accident Study (GIDAS) (https://www.bast.de/BASt_2017/EN/Automo-tive_Engineering/Subjetcs/gidas.html);
the DaCoTA on-line manual for in-depth road accident investigators (http://www.dacota-pro-ject.eu/deliverables.html).
padimitriou, E. (2016). Development of the European Road Safety Knowledge Sys-
tem. In G. Yannis & S. Cohen (Ed.), Traffic Safety (pp.35-50). Hoboken, New Jersey,
USA: John Wiley & Sons, Incorporated.
72 Part 2 | Chapter 2: Road accident statistics and available analysis techniques
Part 2 | Chapter 3: Self-reporting of accidents and near-accidents 73
CHAPTER 3
Self-reporting of
accidents and
near-accidents
The focus of this chapter is the use of
self-reporting for increasing knowledge
about traffic safety and creating a coher-
ent view of the actual traffic safety chal-
lenges facing the country/region/city in
question. Self-reporting can be used to
collect information about a larger share
of all accidents than those included in
the official statistics. Furthermore, self-
reporting can be used for collecting de-
tailed information directly from the road
users on their involvement in less severe
events, such as traffic conflicts. The
method can also be used for reporting
on normal behaviour.
The self-reporting of accidents is partic-
ularly useful for gaining knowledge
about traffic conflicts, which are usually
not registered, and about less severe ac-
cidents, such as those resulting in only
minor injuries or property damage only;
in both circumstances, there is a large
degree of underreporting in the official
statistics. However, combining police-re-
ported accident data with hospital data
remains the recommended approach for
coping with the underreporting of acci-
dents resulting in serious and fatal inju-
ries.
Furthermore, injury severity can be in-
cluded in the accident data collection
process via self-reporting, although a
certain amount of underreporting of se-
vere injuries and fatalities does, of
course, remain. Likewise, the infor-
mation gained from self-reporting about
injury severity can form a basis for soci-
oeconomic calculations, but the same
limitation exists in terms of underreport-
ing. For both perspectives, a careful use
of comparison groups can compensate
for this weakness in the data type.
In this chapter, the use of self-reporting
for collecting information on traffic acci-
dents and conflicts will be described.
Guidance is provided about when self-
reporting is beneficial, how to collect
data and how to interpret the results.
74 Part 2 | Chapter 3: Self-reporting of accidents and near-accidents
What will this chapter tell me?
What is self-reporting?
How can self-reporting be used to assess traffic safety?
Why conduct studies using self-reporting?
How can a study involving self-reporting be carried out?
Which data are collected, and how can they be analysed?
3.1 Introduction to self-reporting
Self-reporting is a method for the collec-
tion of detailed, first-hand information
about accidents and traffic conflicts from
the road users involved. The aim of self-
reporting is to let the road users report
their accidents or near-accidents them-
selves. This data source can be used as
a supplement to the official accident sta-
tistics, from the police or hospital rec-
ords, and can potentially be used to fo-
cus on specific road user groups (e.g.,
cyclists or the elderly), specific topics or
specific areas.
In this method of data collection, infor-
mation about accidents and/or near- ac-
cidents is collected using questionnaires
or by interviewing road users in order to
get detailed information. For instance,
information similar to that which is usu-
ally registered by the police can be col-
lected, such as the location and time of
the accident, the road and weather con-
ditions, the people involved, a descrip-
tion of the accident, and the potential in-
fluencing factors at the time of the acci-
dent (e.g., fatigue, alcohol intake or
phone use).
Self-reporting can either be conducted
using one survey in which the respond-
ent is asked to recall all their accidents
and near-accidents for a certain period
of time (e.g., within the past year) or by
following the respondents for a certain
period of time (e.g., the year ahead) and
asking them to report accidents via mul-
tiple questionnaires that are distributed
regularly (e.g., monthly or bi-monthly).
What is self-reporting?
Self-reporting is a method for the collection of detailed information about traffic accidents and conflicts directly from the road user, including when and where the incident happened, a de-scription of the incident, who was involved and the circumstances of the incident.
Part 2 | Chapter 3: Self-reporting of accidents and near-accidents 75
The self-reporting of accidents and near-
accidents also makes it possible to in-
clude information that is not part of offi-
cial police reports but could be of rele-
vance to the occurrence of the event.
The collection of self-reported accidents
and near-accidents is particularly inter-
esting because it makes it possible to
collect a larger share of accidents and,
thus, overcome issues with underreport-
ing and biased data.
For instance, less severe accidents are
often underreported compared to more
severe or fatal accidents. In this way,
self-reported accidents and near- acci-
dents can contribute to better and more
complete insights into the current state
of traffic safety. This will enhance the
ability to target all road users and acci-
dent types in all aspects of traffic safety
work.
3.1.1 ADVANTAGES AND DISADVANTAGES
The self-reporting of accidents and near-
accidents is a means by which to collect
more data regarding traffic safety than is
possible with official accident reporting
alone. This makes it more likely that
there will be enough data for analyses at
specific locations. As opposed to the of-
ficial statistics, it is also possible to col-
lect information about near-accidents,
and less severe accidents will have a
higher chance of being registered. This
means that this method can be used to
compensate for underreporting in the of-
ficial statistics and, thus, to obtain infor-
mation on accidents that would other-
wise remain unknown. However, acci-
dents in which the most severe injuries
and fatalities occur will often be missing
in the self-reported events, as the road
user is often not capable of reporting the
accident for a long time, if ever. There-
fore, it is beneficial to use self-reporting
as a supplement to official accident data.
Self-reporting has the advantage that
the information is obtained directly, with-
out any intermediary procedures, and
that the self-reports provide an oppor-
tunity to obtain information on aspects
that are normally not covered in official
statistics, such as the road users’ well-
being before the accident occurred or
what the road user considered plausible
accident factors. However, gaining infor-
mation from the direct source can also
be seen as a disadvantage of using self-
reporting, as self-reports contain only
the information the road user remem-
bers, knows and decides to report. In ad-
dition, considerations for privacy and
ethical issues might be an obstacle for
the collection of some important param-
eters to link self-reports with data from
other sources and to get a full overview
of the accident or near-accident. Last,
self-reports only contain one side of the
story, which might not fully represent
what actually happened.
Furthermore, self-reporting makes it
possible to tailor the data collection for a
specific research question or road user
group and to use it as a background for
the implementation of traffic safety
measures. Because a larger share of all
accidents are included—and there is the
potential to include near-accidents for a
76 Part 2 | Chapter 3: Self-reporting of accidents and near-accidents
larger data source—trends in the acci-
dent statistics will be revealed more
quickly and an evaluation of specific traf-
fic safety measures can be conducted
earlier.
Why should I collect self-reported data?
ADVANTAGES DISADVANTAGES
First-hand information from the involved road user;
Accident information only obtained from one party in the accident
Lower degree of underreporting than in the official statistics;
Potential lack of ability or willingness to an-swer truthfully in reports
Possible to get information regarding near-ac-cidents;
Lack of expert information – such as exact speed, road geometry
Possible to tailor the data collection for a spe-cific research question or road user group
Privacy and ethical issues might hinder col-lection of some parameters
Possible to include aspects that are normally not covered in official statistics (police and/or hospital)
Fatal accidents and accidents with severe injuries will not be registered
Trends in accident statistics will be revealed at an earlier stage
Evaluation of traffic safety measures can be conducted earlier
3.2 When to collect self-reported
accident data
Self-reported traffic accidents can, in
general, provide extra knowledge and
an increased amount of data in all situa-
tions where official accident statistics
are used. This means that, often, anal-
yses can be made even though the num-
ber of accidents in the official statistics is
low. Hence, the method can be used for
the following:
Monitoring trends in accidents and
injuries;
Following up on traffic safety goals;
Estimating the underreporting rate in
official statistics;
Evaluating traffic safety measures;
Analysing accident causal factors
and injury factors;
Identifying hazardous road loca-
tions;
Analysing accidents occurring at
specific locations.
Trends in accidents and injuries over a
period of time can often be difficult to find
due to a low number of accidents, which
Part 2 | Chapter 3: Self-reporting of accidents and near-accidents 77
makes it difficult to know whether
changes in the numbers are random or
founded on developments that can af-
fect traffic safety (e.g., safer vehicles be-
ing produced). By referring to a larger
data source via self-reported accidents
and incidents, trends can be identified
faster and with greater certainty. This
also makes it possible to follow up on
specific traffic safety goals for a faster
assessment of whether they have been
met. Similarly, self-reported accidents or
near-accidents can be used to evaluate
specific traffic safety measures, such as
the effect that the establishment of a bi-
cycle path on a road has on the number
of car–bicycle collisions or the effect that
the use of visible cycling clothing has on
the number of multi-party accidents in-
volving cyclists.
The self-reporting of accidents can be
used to estimate the degree of underre-
porting in the official statistics from po-
lice or hospital records in order to pro-
vide better knowledge about the actual
number of accidents occurring. Based
on this information, it is also possible to
adjust for any differences in the degree
of reporting between various accident
types and road user groups and, accord-
ingly, to better prioritise how to use the
available resources for traffic safety im-
provements.
Questionnaires for the self-reporting of
accidents and near-accidents can con-
tain questions related to factors that are
normally not fully covered in the official
statistics. For instance, questions re-
garding the behaviour and personal cir-
cumstances (e.g., the presence of
stress, fatigue or inattentiveness caused
by doing other activities) leading up to
the accident may give insight into acci-
dent causal factors.
With the increased amount of data that
is obtained via self-reporting, and partic-
ularly in cases where there is a large
group of respondents in the same area,
it is likely that more accidents will be reg-
istered at specific locations. This means
that the identification of hazardous road
locations becomes easier and that acci-
dent analyses of specific locations can
be conducted.
Estimating the degree of underreporting in police records: an example
An Australian study (Boufous et al., 2010) among a cohort of young drivers (aged 17–24) used the self-reporting of on-road accidents to assess the accuracy of self-reports made by young drivers and to estimate the amount of underreporting in this age group.
Participants were recruited from a pool of newly licensed drivers in New South Wales, Aus-tralia, who were originally recruited for the Drive Project. Two years after their participation, a sample of 5,000 participants was asked to fill in an online questionnaire in which they were asked to recall and describe any traffic accidents they were involved in during the past year. In total, 2,991 out of the 20,822 DRIVE participants responded to the self-reporting question-naire.
The results showed that the participants reported five times as many accidents via self-re-porting compared to what was recorded in the police database. Furthermore, self-reporting had a high accuracy when compared to police-recorded accidents. Of the police-reported accidents, 85.1% were also self-reported by the respondents.
78 Part 2 | Chapter 3: Self-reporting of accidents and near-accidents
Evaluation of the effect of permanently running lights on bicycles: an example
A Danish study (Madsen et al., 2013) used the self-reporting of accidents to assess the safety effects of mounting permanently running lights on bicycles. In the study, a randomised con-trolled trial (RCT) was conducted using 3,845 bicyclists; permanently running lights were mounted at 1,845 bicycles, and the remaining participants constituted the control group. The participants were volunteers who learned about the study through the media.
Online questionnaires were distributed every second month over a period of one year, yield-ing a total of six questionnaires per participant. In each questionnaire, respondents were asked to recall any traffic accidents they had been involved in as cyclist during the past two months. For each accident reported in the questionnaire, detailed information was collected, such as where it happened, what happened and who was involved.
The results showed an accident rate that was 19% lower for cyclists with permanently running lights mounted on their bicycles compared to cyclists without permanently running lights.
Evaluation of the effect of cycling with a yellow bicycle jacket: an example
In a Danish study (Lahrmann et al., 2018) of the safety effect of cyclists wearing a highly visible yellow jacket when cycling, an RCT was conducted.
Volunteers (who were over the age of 18 and used their bicycle more than three times a week) were found using press releases in national media, by contacting interest groups related to traffic safety and with help from practitioners working with local authorities. The volunteers were also prompted to tell their friends about the project. Almost 12,000 signed up for the study, of whom 6,793 were included in the study. The participants were randomly divided into a treatment group, who received the bicycle jacket and had to wear it throughout the study, and a control group, who had to use their normal garments when cycling.
An online questionnaire was distributed once a month for one year, yielding twelve question-naires per respondent in total. In the questionnaire, the respondents were asked to register information (e.g., location, who was involved and what happened) regarding their cycling ac-cidents from the past month.
The results showed that the use of the highly visible jacket while cycling reduced the involve-ment in multi-party accidents by 38% compared to the control group.
Analysis of accident causal factors and injury factors: an example
In a study of elderly Dutch cyclists (de Hair et al., 2015), 879 elderly cyclists (aged 65+) com-pleted a questionnaire with the purpose of gaining better insight into single-cyclist accidents involving elderly cyclists. Furthermore, in-depth interviews and focus group sessions were carried out.
In the questionnaire, which the respondents received either on paper or via a link to a web-based version of the questionnaire, based on their preference, the respondents were asked about their demographic information (age, gender, province and living environment), bicycle use, physical and cognitive impairments and critical cycling situations, among other things.
The results showed that slippery roads, getting on/off the bike and colliding with the curb and with limited visibility poles and other obstacles were among the most frequently reported causes for single-cyclist accidents among the elderly cyclists.
Part 2 | Chapter 3: Self-reporting of accidents and near-accidents 79
3.3 Methods for collecting self-
reported traffic accidents and
incidents
Self-reported accidents and incidents
can be collected using various methods
depending on the study objectives.
Overall, there are four different methods
to use for the collection of data: paper
questionnaires, online questionnaires,
telephone interviews and face-to-face
interviews. The most commonly used
method for collecting self-reports on traf-
fic accidents is questionnaires, whether
paper based, online or via a combination
of the two, because the cost is low and
the method is suitable for studies con-
taining a large number of respondents.
Interviews are less common and often
have a higher cost per respondent,
which makes them most suitable for
studies involving fewer respondents. Ta-
ble 3-1 provides an overview of the cost,
time consumption, suitable target group
and suitable sample size for each of the
four methods.
Table 3-1: Overview of methods to collect self-reports of accidents
Method Cost /
respondent
Time consumption /
respondent
Suitable target groups
Suitable sample size
Paper questionnaire Medium
(postage) Medium All except children Large
Online questionnaire Low Low
All except children, but less suitable
than paper for the elderly
Large
Telephone interview High Medium All except children Medium
Face-to-face interview High High All Small
3.3.1 PAPER QUESTIONNAIRE
A paper questionnaire is a basic data
collection method that has been used for
many years and in many fields. A ques-
tionnaire is constructed, printed and dis-
tributed to the target group. Paper ques-
tionnaires have the advantage of only
needing a pen for answering the ques-
tionnaire.
A paper questionnaire can be conducted
once or numerous times. Some costs
will, occur every time, regardless of the
number of respondents, such as printing
80 Part 2 | Chapter 3: Self-reporting of accidents and near-accidents
costs and postage. Furthermore, data
must be digitalised prior to data analysis.
After data digitalisation, the analysis
costs are identical to the costs of other
data collection approaches.
Paper questionnaires are particularly
useful for collecting data from road users
who do not have access to a computer.
Some users, however, might be reluc-
tant to answer paper questionnaires be-
cause it requires handwriting and post-
ing the questionnaire afterwards.
Paper questionnaires for self-reporting of accidents and near-accidents: an example
A Finnish study (Korpinen & Paakkonen, 2012) studied the impact of mobile phone use on traffic accidents and close-call situations, with a focus on mobile phone use as a potential accident causal factor.
A paper questionnaire was sent to a random sample of 15,000 Finns aged 18–65. In the questionnaire, participants were asked to recall any accidents in which they had been in-volved during the past year. A total of 6,121 respondents filled out the questionnaire.
The results showed that 2.8% of the respondents had been involved in an accident where mobile phone use had played a role in the escalation of a situation to an accident.
3.3.2 ONLINE QUESTIONNAIRE
Online questionnaires are similar to pa-
per questionnaires but provide the op-
portunity to tailor the questionnaire
based on the answers provided by the
respondent. For instance, it is possible
only to ask about the use of bicycle hel-
mets if respondents have answered that
they have used a bicycle. Similarly, one
can include interactive maps to increase
the ease with which respondents can log
the location of an incident. Online ques-
tionnaires can be fitted to a variety of
platforms and made as either web-
based questionnaires or app-based
questionnaires for tablet/smartphones.
Online questionnaires are particularly
useful for large studies, as this type of
survey can be answered by a large num-
ber of respondents with a marginal addi-
tional cost per respondent. Furthermore,
it is easy to repeat the distribution of the
questionnaire multiple times to follow the
respondents for a longer period of time.
However, some groups might be reluc-
tant to answer an online questionnaire
due to lack of access to computer/tab-
let/smartphone or to the internet.
Part 2 | Chapter 3: Self-reporting of accidents and near-accidents 81
App and web based questionnaires for self-reporting of accidents and near-accidents: an example
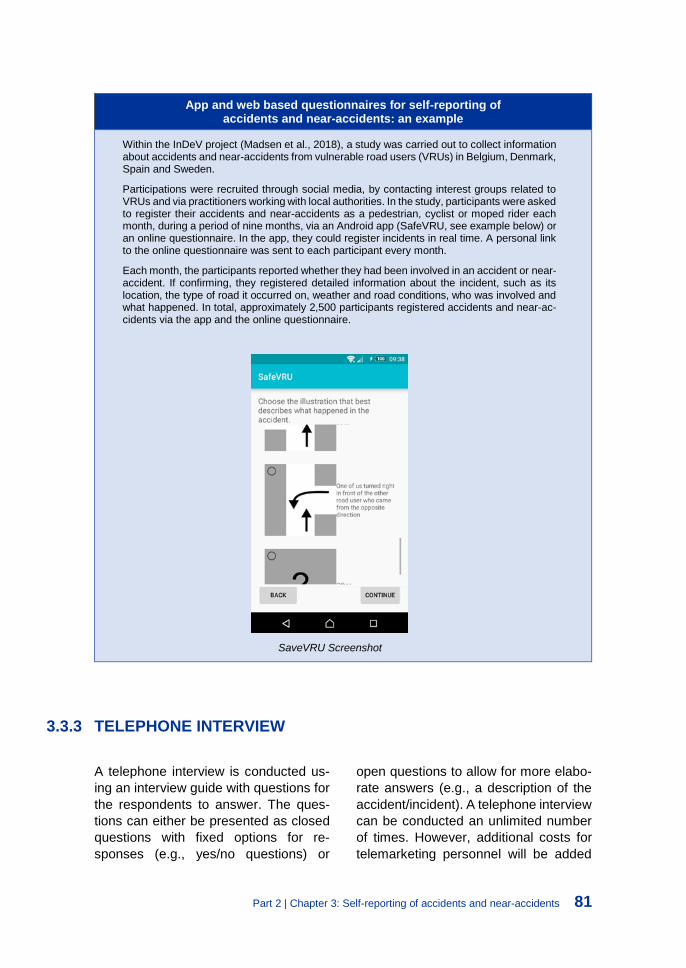
Within the InDeV project (Madsen et al., 2018), a study was carried out to collect information about accidents and near-accidents from vulnerable road users (VRUs) in Belgium, Denmark, Spain and Sweden.
Participations were recruited through social media, by contacting interest groups related to VRUs and via practitioners working with local authorities. In the study, participants were asked to register their accidents and near-accidents as a pedestrian, cyclist or moped rider each month, during a period of nine months, via an Android app (SafeVRU, see example below) or an online questionnaire. In the app, they could register incidents in real time. A personal link to the online questionnaire was sent to each participant every month.
Each month, the participants reported whether they had been involved in an accident or near-accident. If confirming, they registered detailed information about the incident, such as its location, the type of road it occurred on, weather and road conditions, who was involved and what happened. In total, approximately 2,500 participants registered accidents and near-ac-cidents via the app and the online questionnaire.
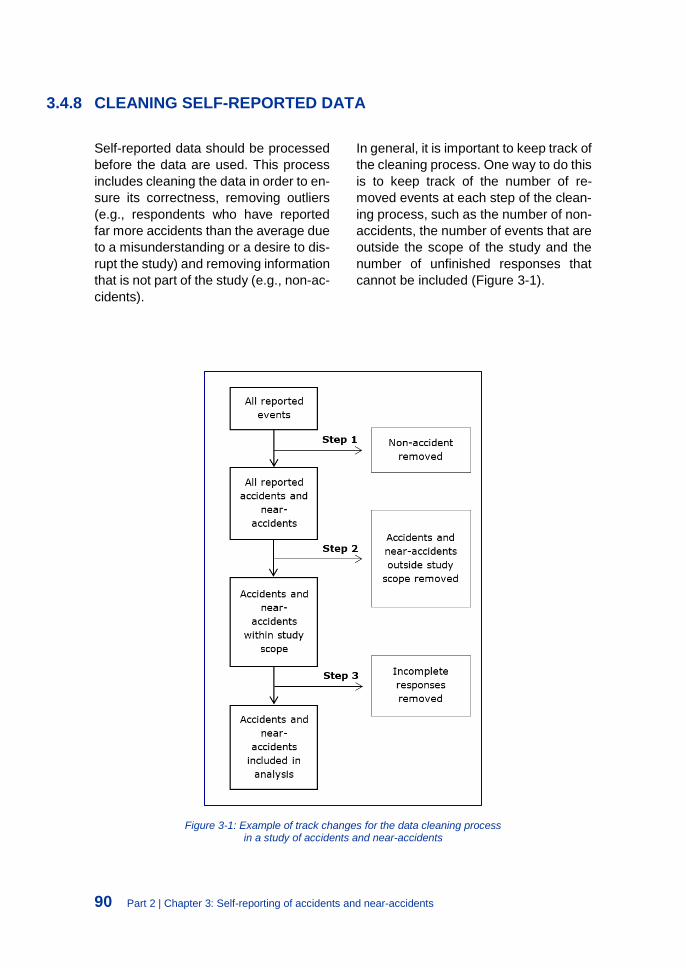
SaveVRU Screenshot
3.3.3 TELEPHONE INTERVIEW
A telephone interview is conducted us-
ing an interview guide with questions for
the respondents to answer. The ques-
tions can either be presented as closed
questions with fixed options for re-
sponses (e.g., yes/no questions) or
open questions to allow for more elabo-
rate answers (e.g., a description of the
accident/incident). A telephone interview
can be conducted an unlimited number
of times. However, additional costs for
telemarketing personnel will be added
82 Part 2 | Chapter 3: Self-reporting of accidents and near-accidents
every time the survey is conducted. Typ-
ically, a respondent will only be con-
tacted once or twice in a study.
An advantage of conducting telephone
interviews is the option to clarify misun-
derstandings with the respondent. How-
ever, telephone interviews may imply a
risk of lacking anonymity, as the inter-
viewer knows the identity of the respond-
ent. This can influence the responses,
as there may be some things that the re-
spondent does not want to admit to the
interviewer because they may have con-
sequences for the individual if revealed,
such as conducting specific behaviour
that is not permitted (e.g., drink driving).
Telephone interviews for self-reported accidents: an example
A Canadian study (Fuller et al., 2013) of the safety impact of implementing a public bicycle share programme in Montréal used the self-reporting of collisions and near- accidents.
Respondents were recruited from households with a landline telephone connection in areas that had introduced the public bicycle share program. Telephone interviews were made in three rounds, with approximately 1,000 respondents in each round. During the interview, they were asked about their cycling accidents and near-accidents in which they had collided with a motorised vehicle.
The results showed that users of the public bicycle share programme did not have a higher risk of a collision than did cyclists using their own bicycle.
3.3.4 FACE-TO-FACE INTERVIEW
Face-to-face interviews can be con-
ducted either in groups or among individ-
uals. Similar to telephone interviews,
they are based on an interview guide, of-
ten with very open questions that leave
room for discussion and elaborate an-
swers. Face-to-face interviews are often
used when children are the main target
group and are useful for questions in
which interactive features are useful
(e.g., discussions based on map data or
a demonstration of equipment used) or
where it is beneficial to visit the particular
site where the accident or incident hap-
pened.
Another type of face-to-face interview
consists of few closed questions. This in-
terview can be advantageous if you
need information about a very limited ge-
ographical area. Road users in the area
of interest can be stopped and asked a
few questions before continuing their
journeys.
Face-to-face interviews can be con-
ducted once or a very limited number of
times to the same target group. While
the interview guide can be used an un-
limited number of times, there are addi-
tional costs to personnel and travel ex-
penses every time interviews are con-
ducted. As with telephone interviews,
the lack of anonymity and the circum-
stance of sitting in front of an interviewer
may result in situations where respond-
ents are likely to modify their answers to
some questions, which they would not
have done had they responded to an
Part 2 | Chapter 3: Self-reporting of accidents and near-accidents 83
online questionnaire with no contact be-
tween the respondent and the inter-
viewer.
Face-to-face interviews for self-reported accidents – example
In a study among Australian cyclists (De Rome et al., 2014), participants were recruited using hospital records and contacted by mail in order to arrange interviews with those who agreed to participate.
Interviews were conducted either by telephone or face to face at the hospital. During the interviews, participants were asked to provide information about their accident and injuries in order to study injury outcomes in different cycling environments.
The results showed that most participants crashed in traffic (39.1%) and on shared paths (36.1%), while fewer crashed on footpaths (16.8%) and in cycle lanes (7.9%). More than 50% of the injuries were minor, approximately 33% were moderate and just over 5% were severe.
3.4 How to collect
self-reported accidents
Certain practical considerations should
be kept in mind when planning a study
involving the collection of self-reported
accidents or incidents. These are related
to the planning phase (before data are
collected), the collection phase (during
the data collection) and the processing
of responses (after data are collected):
What is the purpose of the study?
Which road users are relevant for
the study?
What type of information should be
registered?
Which method should be used for
self-reporting?
How to deal with ethical and/or pri-
vacy issues?
How to recruit participants?
How to establish a hotline during
data collection?
How to clean the self-reported data?
84 Part 2 | Chapter 3: Self-reporting of accidents and near-accidents
3.4.1 WHAT IS THE PURPOSE OF THE STUDY?
First, the purpose of the study should be
defined; what is the purpose of collecting
self-reported accidents and/or near-ac-
cidents? Self-reported information can,
for instance, be used to provide a larger
sample than that which is possible when
using official accident statistics (police
and/or hospital data), to collect infor-
mation about single accidents among
cyclists and pedestrians and to collect
information about less severe multi-
party accidents and near-accidents.
They can also be used to estimate the
degree of underreporting in the official
accident statistics. Depending on the
purpose of the study, specific criteria
should be set for the study design, in-
cluding who are relevant as participants
in the study.
3.4.2 WHICH ROAD USERS ARE RELEVANT FOR THE STUDY?
The target group must to be valid for the
purpose of your study. If, for instance,
you want to evaluate the implementation
of a traffic safety measure targeting pe-
destrians, your target group will be made
up of pedestrians. In contrast, if you
want to collect general accident data
over a long period for an entire munici-
pality or city, the target group must rep-
resent all road users. Generally, there
are two types of sampling techniques for
selecting respondents for self-reporting
studies: random and volunteer. For both
types, specific criteria can be included
(e.g., specific age groups, only road us-
ers who cycle at least three times per
week or only people admitted to the hos-
pital after road accidents within a certain
period of time).
Sampling of respondents
Random: The sample of potential respondents is chosen randomly, typically using infor-mation from an administrative register. The potential respondents are then contacted directly.
Volunteers: Respondents are recruited via traditional and social media and/or specific or-ganisations (e.g., companies or interest organisations). In this way, a lot of road users can hear about the study and have the opportunity to participate. The ones who choose voluntarily to participate in the study will be contacted. When using volunteers, it is of great importance how information about the study is spread. Contacting interest organisations, such as auto-motive organisations, has the potential to result in a biased group of respondents, whose behaviour may differ considerably from the behaviour of the general population.
Part 2 | Chapter 3: Self-reporting of accidents and near-accidents 85
Which type of sample should I use?
TYPE ADVANTAGES DISADVANTAGES
Random Results are easily compared with official statistics and can be ex-trapolated to the population in general.
Typically involves costs to the bureau administrating the register.
Response rate can be quite low.
Volunteers Higher response rate than with random samples.
Biased sample, since some groups never volunteer for studies, particu-larly not if they violate the traffic rules.
3.4.3 WHAT TYPE OF INFORMATION SHOULD BE REGISTERED?
The objective of the data collection is im-
portant in order to decide what kind of
information should be collected via self-
reporting. In Table 3-2, an overview of
mandatory and optional information is
given in relation to the purpose of the
study. However, no comprehensive list
can be given because the content of the
self-report should be customised to the
purpose of each individual study.
Table 3-2: Mandatory and optional information in self-reports based on the objective of the study
Purpose of the self-reporting study
Basic accident information
Demographic information on road user
Detailed accident information
Location Detailed information on road user
Monitoring x (x) (x) (x) (x)
Follow-up on safety goals
x (x) (x) (x) (x)
Estimating the un-derreporting rate
x (x) (x) (x) (x)
Evaluating measures
x (x)
Analysing factors x x (x) (x)
Identifying hazard-ous road locations
x x
Analysing specific locations
x (x) x
x = mandatory, (x) = optional, blank = not necessary
86 Part 2 | Chapter 3: Self-reporting of accidents and near-accidents
Basic accident information
The basic information that is always
needed, regardless of a study’s pur-
pose, is the time of the accident or near-
accident. This information can vary de-
pending on the desired level of detail but
usually consists of the year, month, day,
hour and sometimes even minute of the
events (sometimes divided into intervals
of 5, 10 and 15 minutes). Furthermore,
information on the type of accident (sin-
gle- or multi-party), road user type, the
counterpart’s means of transport, inju-
ries, type of infrastructure and other sim-
ilar features can be included.
Demographic information on road users
The basic information collected about
road users can include gender, age and
area of residence. If data are to be com-
pared to official accident statistics, a per-
sonal identifier is also needed. A per-
sonal identifier could come from the Civil
Registration System (CRS). However,
using a personal identifier from the CRS
often calls for approval, according to the
National Data Protection Act.
Detailed accident information
This category covers a wide list of ques-
tions. The main idea is to get as detailed
information as necessary without both-
ering the road user with unnecessary
questions.
For example, for obtaining more
knowledge about accidents, information
that contributes to a detailed description
of what happened in the accident may
be of relevance, including the manoeu-
vres of the involved road users, speed
estimations (e.g., lower than speed limit,
according to speed limit or higher than
speed limit), the weather conditions,
whether light poles were turned on/off
and the state of the road.
However, if the objective is to gain
knowledge of the cost of accidents, the
questions should focus on the conse-
quences caused by the accident. This
could be information about absence
from work, hospitalisation, estimates of
material damage and the length of time
traffic was blocked.
Location
Location, in this context, refers to fairly
precise data about where the accident
occurred. Preferably, this data is given in
the form of GNSS (GPS) coordinates
(obtained, for example, by mapping the
accident or near-accident on an interac-
tive map in the questionnaire). Alterna-
tively, the location can be provided as an
address that can then be used to map
the event on the road network.
Detailed information on road users and vehicles
If the study’s purpose is to conduct an
analysis of potential accident causal fac-
tors or injury factors, information is
needed regarding explanatory factors,
such as whether the road users were
distracted, whether smartphones were
in use at the time of the incident, the
number of hours road users slept the
night before or the number of years road
users had held a driving license. Moreo-
ver, the state of the vehicle could be of
interest, such as its age, its model, the
presence of passive and active safety
equipment and the use of personal
safety equipment (e.g., a seatbelt or hel-
met).
Part 2 | Chapter 3: Self-reporting of accidents and near-accidents 87
Control and classification questions
Because the information being collected
relates to accidents and near-accidents,
control questions should be included to
ensure the validity of the information
gathered. For instance, discrepancies
can occur within answers to multiple
about the same issue, indicating impre-
cise or falsified information that should
be corrected, if possible, or removed be-
fore processing the data.
Furthermore, the self-reporting system
should include questions to facilitate the
classification of the events into groups
(e.g., non-accidents, near-accidents or
accidents). For instance, accidents can
be defined as events resulting in injury
or property damage. Questions can then
be included regarding whether there
was any physical contact between road
users or between a road user and infra-
structure. This could be supplemented
by questions about whether anyone was
injured during the accident. If not, it may
have been a near-accident instead of an
accident. Based on the classification,
events of no interest to the study can be
discarded.
3.4.4 WHICH METHOD SHOULD BE USED FOR SELF-REPORTING?
Depending on the information being col-
lected and the number of respondents
desired, some methods may be more
appropriate than others. For instance,
face-to-face and telephone interviews
are suitable for small studies with few
participants from which detailed infor-
mation regarding the incident is col-
lected. For large studies and studies that
require knowing the location of the acci-
dent or near-accident, online question-
naires may be used. For some groups of
respondents, paper questionnaires may
be sent instead.
How to assess the degree of underreporting?
To assess the degree of underreporting, a survey of self-reporting on a representative sample of the population can be carried out.
In the survey, the respondents are asked to report all their accidents for a certain period of time (e.g., one year), preferably by the use of multiple questionnaires throughout the survey to reduce the recall time between the time of the distribution of the questionnaire and the time of the accident. For instance, a questionnaire can be sent out each month, or the option of immediate registration can be provided, followed by monthly reminders to register all acci-dents.
Furthermore, demographic information (e.g., gender, age, car ownership, residence and transport habits) should be collected to ensure that the results from the sample can be scaled up to account for the general population.
Finally, to be able to assess the degree of underreporting, the results from the sample should be scaled up so that each cluster from the sample (e.g., divided into groups based on age and gender) is weighted according to the distribution of the population. The results should then be compared to the official statistics.
88 Part 2 | Chapter 3: Self-reporting of accidents and near-accidents
If available, a link between the respondents’ self-reported accidents and their accidents as recorded by the police or hospitals can be used to compare the number of self-reported and officially registered accidents directly for the respondents of the study. For instance, one can use information from the CRS or a similar identifier available in the official records.
3.4.5 HOW TO DEAL WITH ETHICAL AND/OR PRIVACY ISSUES?
Personal information may be collected
via the questions in self-reporting stud-
ies. Therefore, it must be considered
whether ethical approval (i.e., from the
ethical board) and approvals according
to the General Data Protection Regula-
tion (GDPR) (consult the legal depart-
ment to clarify) should be granted before
the study can start.
In some countries, it is time-consuming
to get ethical approval, so it might be
worthwhile to consider skipping ques-
tions or road user groups that necessi-
tate ethical approval (e.g., including chil-
dren in the study). Similarly, if approval
regarding the National Data Protection
Act is needed, you must choose be-
tween seeking this approval and adjust-
ing your survey so that approval is not
necessary. Whether or not it is advisable
to seek the approval depends on how
time-consuming and costly it is to get the
approval weighted against how essential
the private data are for the study.
Participants should be notified about
what personal information is collected
and how this information is stored and
treated.
3.4.6 HOW TO RECRUIT PARTICIPANTS?
Based on the target group and the type
of sample needed for the study, partici-
pants can be recruited directly via per-
sonal contact (e.g., telephone, letters
sent to their address or emails) or indi-
rectly via the distribution of information
regarding the need for participants for
the study on traditional and social media
or through newsletters and messages to
network contacts, specific companies or
organisations, and interest organisa-
tions.
Part 2 | Chapter 3: Self-reporting of accidents and near-accidents 89
How to recruit participants?
TYPE HOW TO REACH
Random Sample from a national statistical bureau or local citizen regis-ter. Each person in the sample is contacted directly, either via telephone or letters (paper or electronic).
Volunteers Recruit through traditional and social media or via large organi-sations or public institutions.
The following strategies can be used to
prompt respondents to participate:
Rely on people’s desire to help the
greater good. When contacting peo-
ple, it is important to inform potential
respondents why their participation
is important and how their infor-
mation might help others.
Offer a prize to be drawn from
among those who participate in the
survey. The prize should be appeal-
ing but not so big that it will affect re-
spondents’ answers.
Offer a gift to all who participate.
This could be somehow related to
the study subject. For instance, if the
study only concerns bicyclists, every
respondent might receive bicycle
gloves, other types of bicycle equip-
ment or a gift certificate for a bicycle
shop. However, the gift should not
influence the outcome of the study
(e.g., if the purpose is to study the
trend in the number of cycling acci-
dents, bicycle lights given to the par-
ticipants may influence the safety
level).
3.4.7 ESTABLISHMENT OF HOTLINE DURING DATA COLLECTION
Depending on the data collection
method used, it is recommended to es-
tablish a hotline for support with answer-
ing the questionnaires. For instance, re-
spondents may experience problems
with answering the online questionnaire,
have troubles using the smartphone app
for self-reporting, have questions about
the study or want to quit the study. The
majority of these problems can be
solved by a hotline function.
90 Part 2 | Chapter 3: Self-reporting of accidents and near-accidents
3.4.8 CLEANING SELF-REPORTED DATA
Self-reported data should be processed
before the data are used. This process
includes cleaning the data in order to en-
sure its correctness, removing outliers
(e.g., respondents who have reported
far more accidents than the average due
to a misunderstanding or a desire to dis-
rupt the study) and removing information
that is not part of the study (e.g., non-ac-
cidents).
In general, it is important to keep track of
the cleaning process. One way to do this
is to keep track of the number of re-
moved events at each step of the clean-
ing process, such as the number of non-
accidents, the number of events that are
outside the scope of the study and the
number of unfinished responses that
cannot be included (Figure 3-1).
Figure 3-1: Example of track changes for the data cleaning process in a study of accidents and near-accidents
Part 2 | Chapter 3: Self-reporting of accidents and near-accidents 91
3.5 Interpretation of results based
on self-reported accidents
Interpreting self-reported accidents and
near-accidents does not differ substan-
tially from interpreting other types of ac-
cident data, and as such, they can be
used for descriptive statistics and/or be
analysed using statistical tools. Similar
to data about accidents from official rec-
ords, survey data should be interpreted
with caution. Particularly, because the
road users register the information
themselves, one should keep in mind
that some responses may not be correct,
either on purpose or due to ignorance.
Most road users want to ‘fit in’, which can
make respondents reluctant to answer
social unacceptable answers—such as
reporting that they were drunk driving.
However, if the respondent is sure of
her/his anonymity, this reluctance usu-
ally decreases, improving the reliability
of the responses.
When interpreting the data, it is im-
portant to keep in mind how the respond-
ents are selected and contacted. Specif-
ically, if the results are to be generalised
to include the entire population, it is im-
portant to have a large sample of road
users who have been randomly se-
lected. In short, remember that the larger
the sample, the more generalisable the
results and that the more random the
sample is, the more generalisable the re-
sults. If the sample is not representative
of the population, is may hinder general-
isation. However, via the stratification of
data, corrections can be made to adjust
for a skewed distribution of the study
population compared to the general pop-
ulation.
3.6 Conclusions and key points
Collecting self-reported traffic accidents
and near-accidents can provide
knowledge that is valuable when consid-
ering road safety work. This self-re-
ported data can be used to supplement
official accident data in many situations,
such as for monitoring trends, evaluating
traffic safety measures, analysing acci-
dent causal factors and estimating the
underreporting rate in the official acci-
dent records, depending on the infor-
mation registered by the road user. The
advantage of using self-reporting is that
it offers a broader picture of safety levels
in traffic. However, this broader picture
is usually collected from only one road
user’s perspective.
Different methods can be used for col-
lecting self-reports, including paper or
92 Part 2 | Chapter 3: Self-reporting of accidents and near-accidents
online questionnaires, telephone inter-
views and face-to-face interviews. Some
issues should, however, be considered
before collecting self-reported infor-
mation regarding accidents and/or near-
accidents via these methods:
What is the purpose of the study?
Which road users are relevant for
the study?
What type of information should be
registered?
Which method should be used for
self-reporting?
How to deal with ethical and/or pri-
vacy issues.
How to recruit participants.
How to establish a hotline during
data collection.
How to clean self-reported data.
When interpreting results, it is important
to be aware that data are collected via
the road users themselves. In this re-
gard, it is important to know how the
sample of respondents is recruited and
who they are (e.g., in terms of gender,
age, location and transport patterns) in
order to be able to generalise results to
the population as a whole. Furthermore,
one should be aware of the risk that re-
spondents might be reluctant to admit if
they have conducted socially unac-
ceptable actions that resulted in an acci-
dent, such as reporting oneself as a
drink driver.
3.7 Recommended reading
Overview of conducted studies of self-reported traffic accidents:
Andersen, C., Kamaluddin, N., Varhelyi, A., Madsen, T., & Meltofte, K. (2017). Re-
view of current study methods for VRU safety. Appendix 7 – Systematic literature review: Self-reported accidents (Deliverable 2.1 – part 5 of 5). Horizon 2020 EC Project, InDeV. Lund, Sweden: Lund University.
General information on survey design:
Dillman, D. A., Christian, L. M., & Smyth, J. D. (2014). Internet, phone, mail, and
mixed-mode surveys - the tailored design method (4th ed.). Hoboken, New Jersey, USA: John Wiley & Sons, Incorporated
Part 2 | Chapter 3: Self-reporting of accidents and near-accidents 93
References Chapter 3
Boufous, S., Ivers, R., Senserrick, T., Stevenson, M., Norton, R., & Williamson, A.
(2010). Accuracy of self-report of on-road crashes and traffic offences in a cohort of
young drivers: The DRIVE study. Injury Prevention 16(4), 275–277. doi:
10.1136/ip.2009.024877
De Rome, L., Boufous, S., Georgeson, T., Senserrick, T., Richardson, D. & Ivers, R.
(2014). Bicycle crashes in different riding environments in the Australian Capital Ter-
Part 2 | Chapter 4: Surrogate measures of safety and traffic conflict observations 95
CHAPTER 4
Surrogate
measures of safety
and traffic
conflict observations
This chapter focuses on surrogate
measures of safety as a tool for site
safety analysis. The term ‘surrogate
measures’ is limited here to the following
definition:
Indicators derived from observation
and safety gradation of non-accident
events in traffic with the ultimate goal
to estimate the expected crash/injury
frequency as well as to get a better
understanding of the crash mecha-
nisms and contributing factors.
The definition excludes some types of
data that might be of relevance for
safety, but has a weaker predictive
power of expected accidents/injuries. As
a result, this chapter will NOT cover:
Safety Performance Indicators
such as seat belt use, share of driv-
ers speeding or being under alcohol
influence, usage of helmets by bicy-
clists and motorcyclists. While
these indicators are relevant for
safety, the relation of the phenom-
ena they describe to crash risk is
not always straightforward and
most often the indicators are not di-
rectly transferable into crash num-
bers.
96
Other behavioural observations
that do not explicitly involve grading
the severity of traffic situations. Ex-
amples of such data are looking or
yielding behaviour, lateral position-
ing, speed choice, etc. These indi-
cators are described in CHAPTER
5.
The chapter briefly describes the theory
underpinning surrogate safety
measures. Practical guidance focuses
primarily on conducting traffic conflict
observations, although there are other
ways to collect and analyse surrogate
safety data.
The main reason for selecting this ap-
proach is that applying more advanced
methods inevitably requires fully auto-
mated tools that can collect accurate
data on road user speeds and trajecto-
ries. While such tools exist, they are still
in development and are not always avail-
able to the practitioner. In contrast, traffic
conflict observations can be completed
using less sophisticated tools—in the
simplest case, using only trained human
observers. Examples of the method’s
use in road safety studies are provided,
along with recommendations for further
reading.
4.1 What is meant by safety
analysis based on surrogate
measures?
4.1.1 BASIC CONCEPT
The method is based on the assumption
that there are sufficient similarities be-
tween actual accidents and almost acci-
dents (traffic conflicts, near-misses, etc.)
of the same type—events where a colli-
sion was highly probable but was fortu-
nately avoided. If this is so, much can be
learned about the underlying factors that
contribute to accidents by studying ‘al-
most accidents’.
4.1.2 HISTORICAL NOTE
Traffic conflict technique was first ap-
plied in practice in the late 1960s by a
team of researchers at General Motors
Corporation (Perkins & Harris, 1967),
but the idea was known at least a dec-
ade earlier (Forbes, 1957). Following the
Part 2 | Chapter 4: Surrogate measures of safety and traffic conflict observations 97
success of early attempts, the method
rapidly gained in popularity. The associ-
ation for International Co-operation in
Traffic Conflict Techniques (ICTCT) (IC-
TCT, 2016) was founded in 1977 and
became an important forum for re-
searchers working in this area of traffic
safety.
At the first ICTCT workshop in Oslo,
Amundsen and Hyden (1977) proposed
the following definition of a traffic con-
flict:
A traffic conflict is an observable situa-
tion in which two or more road users
approach each other in space and time
to such an extent that there is a risk of
collision if their movements remain un-
changed.
As this convenient and intuitive definition
allows for many interpretations when ap-
plied in practice, it is unsurprising that
many different traffic conflict techniques
emerged in different countries, including
Austria, Belgium, Canada, the Czech
Republic, Finland, France, Germany,
the Netherlands, the United Kingdom,
the United States and Sweden. A cali-
bration study of several techniques used
at the same time (Asmussen, 1984) re-
vealed substantial differences in how
various teams selected conflicts, but
there was quite good agreement in spec-
ifying severity scores once conflicts
were identified.
From the early 1990s onward, the use of
traffic conflict techniques became less
frequent, mainly because of the signifi-
cant costs in time and effort, as most of
the data had to be collected by human
observers. However, new technologies
such as advanced automated video
analysis have revived interest in the
method. In Western countries, the use of
traffic conflicts (or other relevant surro-
gate indicators of safety) has been
driven by road safety improvements that
make it increasingly difficult to depend
exclusively on registered accident data.
In developing countries, accident data
are still seldom available and its quality
is poor.
4.1.3 THE CONCEPT OF SEVERITY
To construct a safety pyramid (as in Fig-
ure 1-1), an operational measure is
needed to capture the seriousness or
severity of the traffic event. Most traffic
conflict indicators express severity in
terms of proximity to a collision in time or
space. The most common indicators of
this type are time-to-collision (TTC),
post-encroachment time (PET) and mul-
tiple variants of deceleration-based indi-
cators (see textbox).
However, proximity to a collision is only
one dimension of its severity; the poten-
tial consequences of a collision should
also be taken into account. For example,
minor collisions between cars in parking
lots are of little concern for road safety,
as these almost never result in injuries
for vehicle occupants. On the other
hand, a near-miss between a cyclist and
a large truck moving at high speed would
be perceived as very dangerous.
98 Part 2 | Chapter 4: Surrogate measures of safety and traffic conflict observations
Ideally, a theoretical definition of severity
should incorporate ‘nearness to a seri-
ous personal injury’, in line with the Vi-
sion Zero philosophy that ‘no one will be
killed or seriously injured within the road
transport system’ (Johansson, 2009).
However, it is not clear how risk of injury
can be estimated in situations where the
collision was actually avoided. For that
reason, the most common practices are
to either ignore the potential conse-
quences or to apply subjective rules
about how those consequences can be
integrated into the final severity score.
Time-to-Collision (TTC)
TTC is the time until a collision would occur between road users if each continued on their present course at their present rate (Hayward, 1971).
Calculation of TTC requires the presence of a collision course (i.e. the road users will collide if nothing changes). TTC is a continuous indicator, returning a value for any time instance during the collision course. Two such values are commonly used:
TTCmin (the lowest TTC value during the interaction)
Time-to-Accident (TA) (TTC value at the moment when evasive action is first taken by one of the road users.
Post-Encroachment Time (PET)
PET is calculated as the time between the moment that the first road user leaves the path of the second and the moment that the second reaches the path of the first; in other words, PET indicates the extent to which they have missed each other.
Time Advantage (TAdv) or predicted PET (pPET) are variations of the PET indicator based on the predicted motion of road users according to their current position, direction and speed (Mohamed & Saunier, 2013; Laureshyn et al., 2010).
1
2
1
2
t 1 t 2
PET = t 2 - t 1
conflict zone
Part 2 | Chapter 4: Surrogate measures of safety and traffic conflict observations 99
Conflict indicators based on acceleration
Deceleration-to-safety (DST) is the minimum deceleration required to avoid a collision (Hup-fer, 1997). Note that it is not necessary to come to a complete stop but only to convert a collision course situation into a PET-situation.
Jerk is a derivative of deceleration that describes the suddenness of braking (Bagdadi & Várhelyi, 2011). While accelerations and decelerations are significantly affected by individual driving style—that is, one driver’s ‘normal’ is ‘critical’ for another)—jerk seems more stable across different drivers, with high values indicating dangerous situations.
While many other acceleration-based indicators have been proposed (e.g. proportion of stop-ping distance, potential collision speed, deceleration rate to avoid crash), there is very little available validation to support (or reject) their use.
4.1.4 RELIABILITY AND VALIDITY
Reliability is a measuring tool’s ability to
maintain the same level of accuracy re-
gardless of the conditions in which it is
used. As applied to traffic conflict stud-
ies, reliability means that the method
used for conflict detection and severity
scoring should guarantee that observed
differences in conflict counts can be at-
tributed to differences in safety rather
than to issues such as loss of attention,
observation perspective, weather or
lighting conditions.
Traditional traffic conflict techniques
have been criticised for their use of hu-
man observers as the main ‘measuring
tool’. Specifically, an observer’s ability to
maintain attention over longer time peri-
ods or to objectively estimate indicators
like TTC has been called into question.
A number of calibration studies (Hydén,
1987; Lightburn & Howarth, 1979) have
shown that it is possible to train observ-
ers to detect conflicts and judge speeds
and distances consistently. It is im-
portant, however, that the observers un-
dergo standardised training, which
should be refreshed periodically, as
these skills tend to deteriorate over time.
In general, it takes about a week to train
observers for traffic conflict studies.
In recent years, tools like video analysis
have become commonplace in traffic
conflict studies. Although characterised
as ‘objective’, their accuracy remains
dependent on the quality and calibration
of the camera, as well as on traffic con-
ditions and weather. However, the rapid
progress in this field offers hope that the
reliability of these tools will not be of ma-
jor concern in the near future.
Validity is a more fundamental property,
referring to the measuring tool’s ability to
capture the quality of interest—in the
present case, road safety. Given the
many different operational definitions of
traffic conflicts, it is reasonable to ask
whether some are more valid than oth-
ers. For many of the proposed conflict
techniques, few if any validation studies
relate observed conflicts to actual acci-
dents at the same sites; probably the
only exceptions are the Swedish Traffic
Conflict Technique and the Dutch tech-
nique DOCTOR (see the separate text-
boxes in section 4.4).
100 Part 2 | Chapter 4: Surrogate measures of safety and traffic conflict observations
It is a hard task to convert the conflict
counts into the number of accidents ex-
pected at the site. However, in many
cases, this is not always necessary. For
example, if at least the direction of
change (less conflicts = less accidents)
can be proven, the conflicts can be used
to indicate whether a certain safety inter-
vention has succeeded or failed (without
knowing the exact number of accidents
avoided). Similarly, if the process of con-
flicts (typical situations, behaviour, mis-
takes) resembles the process of acci-
dents, this information can be used to
better understand the factors contrib-
uting to the accidents and how they can
be mitigated.
4.2 Advantages and disadvantages
of traffic conflict studies
Traffic conflict studies have the following
advantages.
Because traffic conflicts are much
more frequent than accidents, data
can be collected over a much
shorter time rather than waiting for
annual accident records.
As traffic conflicts are actually ob-
served, there is much more availa-
ble information than in accident re-
ports.
Traffic conflicts studies are proac-
tive, which means that the safety
problem can be detected and ad-
dressed BEFORE accidents occur.
The disadvantages/limitations of traffic
conflict studies are as follows.
The method requires trained per-
sonnel, video recording equipment
and tools for video processing.
Collecting conflict data requires field
work and subsequent video pro-
cessing to identify conflicts; accident
records are ‘already there’ as seen
from a practitioner perspective.
The relation between accidents and
conflicts is not always clear for all
types of conflict, and conversion of
observed conflicts into an expected
number of accidents is not very ac-
curate.
Traffic conflict studies are more of-
ten conducted during daylight hours
and in good weather conditions.
However, with the introduction of
video recording and automated tools
for conflict detection, this restriction
has become less important.
For best results, it is advisable to com-
bine traffic conflict observations with
other methods such as accident anal-
yses, behavioural observations or inter-
views with road users.
Part 2 | Chapter 4: Surrogate measures of safety and traffic conflict observations 101
4.3 When to conduct traffic conflict
observation
Traffic conflict observation is the right
method for the following purposes:
to make a safety diagnosis of a
given site when accident data are in-
sufficient or absent;
to investigate the factors that con-
tribute to accident risk at a given
site;
to compare the safety performance
of different road infrastructure fea-
tures, regulations and rules;
to quickly evaluate the effects of
road safety measures in before-after
investigations;
to monitor the development of a
site’s traffic safety situation.
As in the case of accident analysis, map-
ping of traffic conflicts can indicate
where accidents might be expected.
Analysis of conflict manoeuvres and the
road users involved serves to indicate
what types of accidents can be ex-
pected. Watching recordings of traffic
conflicts enhances understanding of the
process of accident development and
contributing factors and helps to gen-
erate ideas for possible countermeas-
ures.
Traffic conflict observations have been
used mainly in urban areas; for rural
roads, the available practical knowledge
is more limited. This does not mean that
the method cannot be used in rural ar-
eas, but greater caution is advisable in
planning the study and interpreting re-
sults.
Many of the traditional traffic conflict
techniques were originally designed for
car-car situations. Very often, these can
still be successfully applied to situations
involving vulnerable road users (VRUs).
Techniques that consider both collision
risk and consequences are more suita-
ble for this purpose.
Evaluation of large-scale introduction of small roundabouts (Hydén & Várhelyi, 2000)
To test the effects of small roundabouts, the Swedish city of Växjö provisionally reconfigured 21 conventional intersections as roundabouts. Safety was among the aspects to be evalu-ated. As the roundabouts were only provisional and were to be removed after six months, there was insufficient time to collect accident data. Additionally, the intersections were se-lected on the basis of high accident numbers in previous years; this selection bias meant that conclusions based on the accident counts would be inaccurate. In this case, the Swedish Traffic Conflict Technique was chosen as the method of safety evaluation, and conflict obser-vations were complemented by road user counts, speed measurements, behavioural obser-vations and interviews with road users.
Conflict observations were carried out at 12 intersections for 5 days (30 hours) per site, both before reconfiguration and four months after (to allow road users to get used to the new de-sign). Observations at the 12 studied sites identified 223 serious conflicts before reconfigura-tion and 231 after. The number of car-car conflicts increased by 43%, but the number of
102 Part 2 | Chapter 4: Surrogate measures of safety and traffic conflict observations
conflicts involving pedestrians and bicyclists decreased by 49%. While the total number of serious conflicts did not decrease, these became less severe. Specifically, the character of the conflicts changed, as front-to-front situations involving left turns and situations involving perpendicular courses were replaced by situations involving a small angle between the con-flicting vehicles, which made the conflicts less severe in the after situation. Additionally, the average speed in conflicts decreased from 30.5 km/h in the before situation to 27.2 km/h in the after situation. The average TA value in the before situation was 0.80 seconds; in the after situation, it was 0.81, representing a slight but statistically non-significant improvement.
For VRUs, risk was significantly reduced, but there was no risk reduction for car occupants. An association was found between reduced approach speed and reduction of injury accident risk. Behavioural observations indicated that design details are of decisive importance for road user safety, and that the situation of cyclists warrants special attention. Based on the behavioural observations, important recommendations were made for improving cyclists’ sit-uation, including the following. a) The transition between cycle path/lane and junction must be designed with care to integrate cyclists with motorised traffic before they enter the round-about. b) There should be only one car lane on the approach, in the circulating area and at the exit. c) The roundabout should be as small as possible.
Evaluation of speed management measures in Bangladesh (van der Horst et al., 2017)
Three locations in Bangladesh were selected for testing of the integrated speed management program. A before-after design was applied, combining three research methods to monitor and evaluate the road safety interventions. To overcome the lack of reliable accident statistics in Bangladesh, an individualised system was developed for recording traffic accidents, using trained local record keepers. Secondly, laser-guns were used to measure the speed of mo-torised traffic (at both intervention and control locations). Finally, the Dutch Objective Conflict Technique for Operation and Research (DOCTOR) was applied for video observation of se-rious traffic conflicts at the intervention locations.
Prior to the intervention program (according to the alternative accident recording system), the three locations combined accounted on average for about 100 serious accidents, with 10 fatalities and 200 injuries each year (based on the 19-month before period). The after period commenced 4 months after implementation of the infrastructural measures and ran for 9 months. During this after period, the average number of serious accidents per month de-creased by 66%; the number of people injured decreased by 73%, and the number of fatalities decreased by 67% (significant at the 1%, 1%, and 10% levels, respectively).
The laser-gun speed measurements of motorised traffic revealed an overall net reduction of 13.3 km/h (or 20% in relative terms) at the intervention locations on correcting for speed measurement outcomes at the two control locations (Vet et al., 2016).Applying Nilsson’s power model (Nilsson, 2004), an average speed reduction of this magnitude would result in an expected reduction in fatalities of 59%.
The DOCTOR observations of serious conflicts were based on video recordings at each of the intervention locations for about a week (24 h/day, before and after). The after period com-menced about six months after the infrastructural interventions ended to ensure a sufficient habituation period. The DOCTOR method usually requires a total conflict observation period of 18 h. On analysing the first tapes, it became clear that slight conflicts (DOCTOR severity categories 1 and 2) were considered more or less normal behaviour in Bangladesh, and we therefore focused on the more severe conflicts (DOCTOR severity scores 3–5). As the num-ber of serious conflicts was relatively high, it was considered adequate and more efficient in terms of time to reduce the number of hours analysed to 4.5 h per location and per period (before and after). The total number of serious conflicts was significantly reduced from 64 per location before to 29 serious conflicts after, representing a 55% reduction in relative terms. When corrected for changes in traffic volumes, the overall reduction in conflict risk was still 54%.
All three evaluation methods suggest a similar impact of the intervention program, with an improvement in road safety of between 54% and 60%. The speed-reducing measures had a
Part 2 | Chapter 4: Surrogate measures of safety and traffic conflict observations 103
significant impact on the speed of motorised traffic (mean speed and 85th percentile values), reducing both the number and severity of serious conflicts and the actual number of reported accidents. Taking the actual number of accidents at the three intervention locations as the ground truth, both speed measurements and traffic conflict observations were shown to be valid methods of estimating the effects of road safety interventions when no reliable accident data are available.
4.4 Different traffic conflict
techniques
Of the many techniques developed by
research teams in different countries,
some have not evolved since the 1980s
and are rarely used today. However, the
Swedish and Dutch (DOCTOR) tech-
niques are still widely used, and Ameri-
can and British techniques seem to have
found a new lease of life, particularly in
developing countries. For the sake of
completeness, the following publications
describe these techniques.
Austria: Risser & Schutzenhofer
(1984);
Belgium: Mortelmans et al. (1986);
UK: Baguley (1984);
Canada: Sayed & Zein (1999) ;
Czech Republic: Kocárková (2012);
Netherlands (DOCTOR): Kraay et
al. (2013);
Finland: Kulmala (1984);
France: Muhlrad & Dupre (1984);
Germany: Erke & Gstalter (1985);
Sweden: Hydén (1987);
US: Parker & Zegeer (1989).
The Swedish Traffic Conflict Technique (TCT)
The Swedish TCT was developed at Lund University during the 1970s and 1980s (Hydén, 1987); the strength of this technique lies in the uniquely solid validation work that underpins it. Several large-scale studies (Svensson, 1992; Hydén, 1987; Gårder, 1982; Linderholm, 1981; Hydén, 1977) have confirmed a strong association between serious conflicts (as de-fined by the technique) and police-reported accidents.
According to the Swedish TCT, collision course is a necessary condition for conflict. Severity ranking is based on two indicators:
Time-to-Accident (TA): the time remaining before a collision when a road user takes evasive action;
Conflicting Speed (CS): road user speed when taking evasive action.
The following graph distinguishes between serious and non-serious conflicts.
104 Part 2 | Chapter 4: Surrogate measures of safety and traffic conflict observations
Severity increases as TA decreases (reflecting nearness to collision) and CS increases (re-flecting to some extent the seriousness of possible consequences in case of collision). If the road users take evasive actions simultaneously, TA and CS are estimated for both. The rele-vant road user is the one with the lowest severity ranking, which is also the final severity of the conflict.
Conflicts with a severity level higher than 26 (red line on the graph) are categorised as seri-ous. However, there is evidence to suggest that the threshold should be moved down one or two levels if evasive action is taken by a VRU (Svens-son, 1998) because VRUs generally travel at lower speeds, resulting in underscoring of conflict severity.
The detailed manual for the Swedish TCT can be downloaded at https://www.bast.de/InDeV/EN/Documents/pdf/TCT-OM.pdf?__blob=pub-licationFile&v=2
DOCTOR – Dutch Objective Conflict Technique for Operation and Research
The DOCTOR method was developed in the Netherlands by the Institute of Road Safety Re-search (SWOV) and TNO Human Factors. The method defines a critical situation as one in which the available space for manoeuvre is less than that needed for normal reaction. If at least one of the parties involved needs to take action to avoid a collision, the situation is categorised as a conflict. In some cases, road users narrowly avoid each other without taking any noticeable evasive action. These situations can also be critical, as any small disturbance in the approach process can result in a collision. Conflict severity is scored on a five-point scale, ranging from 1 (least severe) to 5 (collision), taking account of (i) the probability of a collision and (ii) the extent of the consequences if a collision occurred. The probability of a collision is determined by the following parameters:
minimal Time-To-Collision (TTCmin): the lowest time-to-collision value during the inter-action (note that this differs from the Swedish TCT, which uses the TTC value at the commencement of evasive action); TTCmin below 1.5 s is considered critical;
Post-Encroachment Time (PET): the time between the moment the first road user leaves the path of the second and the moment the second reaches the path of the first (see illustration in PET textbox); in urban conditions, a PET value lower than 1 s is considered critical.
Part 2 | Chapter 4: Surrogate measures of safety and traffic conflict observations 105
The extent of the consequences is defined by the types of road user involved in the conflict, their speeds and the types of manoeuvre performed. For example, a conflict between a car and a cyclist may have much more serious consequences than a conflict between two cy-clists, given their relative vulnerability and speed. The DOCTOR technique includes a sub-jective component, as the observer must always take account of the road users’ behaviour—for example, whether they undertake a controlled or uncontrolled evasive action—and the
extent of the consequences if a collision had taken place. Conflicts with an overall severity score of 1 or 2 are considered minor (i.e. more like a disturbance in the traffic process that is still manageable by at least one of the road users involved). Conflicts with a severity score of 3–5 are categorised as serious conflicts with more direct implications for traffic safety.
The detailed manual for the DOCTOR technique can be downloaded at https://www.bast.de/InDeV/EN/Documents/pdf/DOCTOR-Manual.pdf.
108 Part 2 | Chapter 4: Surrogate measures of safety and traffic conflict observations
Swedish TCT
Doctor
Figure 4-1: Examples of the conflict register forms
Prior to observation
Before conducting the actual observa-
tion, the following preparatory steps are
recommended.
Collect relevant information about
the actual site, including map and
drawings of the site, accident history
if available, type of regulation, signal
settings, traffic volumes.
Investigate possibilities for camera
installation (e.g. balconies, lamp
posts or other pieces of road infra-
structure).
Print out a sufficient number of con-
flict registering sheets. A practical
solution is to use a folder with pasted
reference tables on the left-hand
side and conflict sheets on the right.
Check the weather forecast and
take appropriate clothes.
Carry a phone number for the super-
visor of the study in case of any in-
quiries.
Performing the observations
On arriving at the observation site, the
observer should select a vantage point
that offers a clear view of the area to be
observed. The location of this point
should be marked on the conflict register
form, along with an arrow to indicate due
north. Alternatively, obvious landmarks
should be noted on the sketch of the in-
tersection. This is extremely important in
correctly specifying road users’ direction
of travel and the conflict location.
In before/after studies, the same van-
tage point should be used before and af-
ter. The observer should be unobtrusive
Part 2 | Chapter 4: Surrogate measures of safety and traffic conflict observations 109
so as not to influence road users passing
the site—for example, wearing a high-
visibility vest is not recommended. At the
same time, the observer should not be
inside a vehicle or building, as not
‘breathing the same air’ as the observed
road users might cause important infor-
mation to be lost.
To facilitate estimation of distance and
speed, the observer should take some
initial measurements on first arriving at
the scene so that distances between sa-
lient objects or marks can be measured.
Estimating speeds by means of a radar
gun can help to get a sense of prevailing
speeds at the site.
If more than one observer is working at
the same site, they should clearly dis-
cuss and agree on their respective ar-
eas. If a conflict occurs in a place where
both observers might record it, this
should be noted on a register form so
that it can be checked afterwards to
avoid double-counting.
Every detected conflict situation should
be recorded on an individual register
form, as completely and immediately as
possible. To save time, some of the
fields can be pre-filled (e.g. location, ob-
server’s name and position, observation
period).
All conflicts should be recorded, even if
only the serious ones are used in the
subsequent analysis. When a conflict is
first detected, it may not be obvious how
serious it is until the necessary indica-
tors (TA, PET etc.) have been calcu-
lated.
4.6 Presentation and interpretation
of results
In a conflict study, the presentation of re-
sults usually includes the following:
a sketch indicating conflict locations
(see Figure 4-2);
a summary table itemising conflicts
by type of manoeuvre and road us-
ers involved (see Table 4-1);
depending on the technique, addi-
tional diagrams of conflict severity
distribution (see Figure 4-3);
Short video clips containing the rec-
orded conflicts.
110 Part 2 | Chapter 4: Surrogate measures of safety and traffic conflict observations
Figure 4-2: Sketch indicating locations and types of conflict
Table 4-1: Summary of conflict observations (based on Swedish TCT approach)
Conflict ID
Date & time
Conflict type Road user 1
Road user 2
Time-to-accident
(sec.)
Conflict-ing speed
km/h Severity
28 2013-09-03, 07:09
Cyclist on red cyclist car 1,7 15 24
40 2013-09-03, 07:21
Cyclist on red cyclist moped 1,3 9 24
216 2013-09-04, 09:47
Cyclist on red cyclist car 1,1 32 26
254 2013-09-05, 07:28
Cyclist on red cyclist mc 1,9 14 24
22 2013-09-03, 07:01
Cyclist straight, Motor vehicle right
cyclist car 1 12 25
32 2013-09-03, 07:12
Cyclist straing, Motor vehicle right
cyclist car 1,1 10 25
207 2013-09-04, 09:11
Cyclist straight, Motor vehicle right
cyclist car 1,2 8 25
292 2013-09-05, 08:57
Cyclist straight, Motor vehicle right
cyclist car 1,6 12 24
396 2013-09-06, 09:50
Cyclist straight, Motor vehicle right
cyclist car 0,8 11 25
cyclist
motor vehicle
on red
Part 2 | Chapter 4: Surrogate measures of safety and traffic conflict observations 111
934 2013-09-13, 07:40
Cyclist straight, Motor vehicle right
cyclist car 1,4 17 25
62 2013-09-03, 07:59
Cyclist straight, Motor vehicle left
cyclist car 1,5 10 24
496 2013-09-09, 09:28
Cyclist straight, Motor vehicle left
cyclist car 0,9 12 25
594 2013-09-10, 08:33
Cyclist straight, Motor vehicle left
cyclist car 1,4 13 24
710 2013-09-11, 08:10
Cyclist straight, Motor vehicle left
cyclist car 1,7 19 24
Figure 4-3: Conflict severity diagram (based on Swedish TCT approach)
Interpretation of conflict study results in-
cludes the following:
identification of the common conflict
types;
identification of the locations where
conflicts occur;
identification of the particular cir-
cumstances of conflict occurrence
(e.g. in the dark, peak or off-peak
traffic, parked/stopped vehicles ob-
scuring the view, start or end of
green signal);
calculation of mean speeds and
time-related indicators for the road
users involved.
When comparing two sites or before/af-
ter studies, the following questions
should be asked.
Have accumulations of certain con-
flict types been eliminated?
Has there been a general decrease
in the severity of conflicts? For spe-
cific conflict types?
Have any new types of conflict
emerged?
2425262728
0
10
20
30
40
50
60
70
80
0,0 0,5 1,0 1,5 2,0 2,5 3,0 3,5 4,0
Co
nfl
icti
ng
sp
eed
, k
m/h
Time-to-Accident, sec.
Cyclist on red
Cyclist straight,
Motor vehicle right
Cyclist straight,
Motor vehicle left
112 Part 2 | Chapter 4: Surrogate measures of safety and traffic conflict observations
4.7 Complementary studies
For better understanding of the safety situation, the traffic conflict observations should
be complemented with additional types of data collection.
4.7.1 EXPOSURE
The number of traffic conflicts in itself
tells us little unless related to the level of
traffic activity at the studied site—that is,
its exposure. The most theoretically cor-
rect measure of exposure is the number
of encounters or simultaneous arrivals of
two road users, counted separately for
each type of interaction or conflict (Elvik,
2015). If the number of encounters is
known, it is possible to calculate the con-
flict rate (i.e. number of conflicts per
number of encounters during the same
period), indicating the risk that an en-
counter will become a conflict.
However, it is hard work to count simul-
taneous arrivals manually. If no auto-
mated tool is available to obtain these
data, traffic flows can be used as a sub-
stitute. The conflict rate can then be ex-
pressed, for example, as the number of
conflicts involving cyclists per number of
cyclists passing during the observation
period. An obvious drawback, of course,
is that the amount of conflicting traffic is
not taken into account in any way.
Traffic counting method is described in
detail in the PIARC Road Safety Manual
(PIARC, 2003).
4.7.2 SPEED MEASUREMENTS
Vehicle speed plays a decisive role in
both risk of accident occurrence and out-
come severity. For that reason, safety
analyses involving VRUs should always
be complemented by vehicle speed
measurements at the observed site.
Speed measurement method is de-
scribed in detail in the PIARC Road
Safety Manual (PIARC, 2003).
4.7.3 BEHAVIOURAL OBSERVATIONS
Insights into the different kinds of road
user behaviour that occur at the studied
site serve as a useful basis for describ-
ing what is going on at the site and what
makes it ‘unsafe’. Issues such as red-
walking, yielding behaviour and informal
communication can help to account for
safety problems, and conflict observa-
tions should be complemented when
Part 2 | Chapter 4: Surrogate measures of safety and traffic conflict observations 113
possible with behavioural observations
of ‘normal’ traffic behaviour.
Behavioural observations are described
in detail in CHAPTER 5 of this hand-
book.
4.7.4 INTERVIEWS WITH ROAD USERS
Road users who pass the studied site
regularly are likely to have some sense
of unsafe situations they have been in-
volved in or observed, and an external
observer might need lengthy observa-
tion to acquire a similar level of
knowledge. Short interviews with pass-
ing road users may therefore help to
identify relevant issues, which in turn
provide a basis for subsequent observa-
tion of behaviours and conflicts.
4.8 Video recording and analysis
4.8.1 WHY RECORDING?
It can be difficult to perform conflict ob-
servations in the field. Detection re-
quires full attention at all times, and
when a conflict occurs, the observer gets
only one chance to see it and to make
the necessary judgements. For that rea-
son, it is recommended that field obser-
vations should be complemented by
simultaneous video recording. This al-
lows the observer to revisit the identified
situations or ask a colleague for a sec-
ond opinion. When reporting results, the
observation sheets can be comple-
mented by short video clips showing
each conflict to ensure a well-docu-
mented and transparent study. Videos
offer a useful way of illustrating safety
problems for decision makers or the
general public and can also serve as a
source of inspiration when envisaging
possible safety counter-measures. It
would be good practice to always ask
“Would the suggested counter-measure
prevent or mitigate unsafe situations of
this kind?”
TIP
Always remember to synchronise your watch with the internal camera clock to make it eas-ier to find recorded conflicts subsequently.
114 Part 2 | Chapter 4: Surrogate measures of safety and traffic conflict observations
Increasingly, conflict studies are com-
pleted directly from video. This is more
convenient, as the observer can work at
the office and fast-forward when traffic is
low and nothing much is happening, tak-
ing breaks when necessary. Special
video processing tools can also be used
to detect potential conflicts or to more
accurately measure speeds, distances
and other indicators from the video.
At the same time, it is important to real-
ise that a video does not fully represent
the traffic environment for a number of
reasons, including limited area of view, a
perspective that may be unusual for the
observer or distortions such as fisheye
effects. It is very important, then that the
observer actually visits the site and
spends some time there in order to un-
derstand how the traffic functions and
what lies beyond the camera’s view.
4.8.2 RECORDING EQUIPMENT
For shorter recordings (for example,
those done at the same time as field
conflict observations), equipment re-
quirements are minimal, as a simple
camcorder will suffice. However, if a
longer recording is planned, the follow-
ing issues must be considered.
There must be sufficient storage
space for the recorded video, and a
separate computer or hard drive
may be needed for data storage.
If there is no on-site access to the
power network, solutions such as
large capacity batteries (e.g. car bat-
teries), solar cells or field generators
should be considered.
To save disc space the recording
should be scheduled to exclude the
hours of darkness or weekends.
Equipment may need to be pro-
tected from the weather (rain, fog,
low temperatures) and from theft or
vandalism.
If several cameras are used to rec-
ord at the same location, units
should be time-synchronised.
It should be possible to check the
status of the equipment without vis-
iting the site.
Figure 4-4 depicts a general scheme for
an advanced system for long-term,
multi-camera recording. Depending on
specific needs, some of these elements
can be simplified or removed, and there
are commercial products and services
that support long-term filming and asso-
ciated requirements.
Part 2 | Chapter 4: Surrogate measures of safety and traffic conflict observations 115
Figure 4-4: General scheme for an advanced video recording system
Another important consideration is the
most appropriate camera (sensor). The
most common sensor types (i.e. ‘normal’
video) are RGB, but thermal sensors are
becoming increasingly common and af-
fordable.
RGB camera
Thermal camera
Figure 4-5: Simultaneous views of the same traffic scene using RGB (left) and thermal (right) cameras
The respective advantages and limitations of these camera types can be summarised
as follows.
BoxMast
IP camera
PoE + switchGSM internet (NTP)GPS reciever (GPS time)
BatteriesNAS (storage)
TP-cable(PoE)
Power (12V)
Data (TP)
Stabiliser 12VCharger
220V AC(night time only)
116 Part 2 | Chapter 4: Surrogate measures of safety and traffic conflict observations
RGB Thermal
+ “Normal” view -/+ “Unusual” view but easy to interpret
+ Relatively low price - Relatively expensive
+ High resolution - Lower resolution than RGB
- Poor performance in dark conditions + Good performance in both light and dark con-ditions
- Moving shadows create difficulties for auto-mated video processing tools
+ Shadows are not visible and so create no problems
- Sensitive to direct sun light or sun reflection on asphalt, windows, etc.
- Hot weather becomes problematic when as-phalt heats up
- Privacy protection issues + Personal data (e.g. faces, number plates) are not recognisable
NOTE
As video recordings are regarded as personal data in many countries, there may be special rules governing whether a camera can be left recording autonomously, what resolution can be used, how the recording is to be handled afterwards, etc. Because these rules differ widely from country to country, it is always a good idea to check them and to seek the required permissions before recording.
4.8.3 POSITIONING THE CAMERA
If the video is to be used only as a
backup for the observer in the field, the
requirements for positioning the camera
are not very strict; it can be placed on a
tripod near the observer or on street fur-
niture at a height of 2–3 meters. How-
ever, if computer tools for video pro-
cessing are to be used at some later
stage, the requirements become much
more specific.
The camera should be positioned as
high and directly downward as pos-
sible to obtain a bird’s eye view. This
helps to mitigate the problem of oc-
clusion, when one road user is not
visible behind another. In practice,
however, one must compromise, us-
ing available lamp posts or balco-
nies. As a rule of a thumb, a height
of at least 7-8 meters is recom-
mended.
No sky should be visible. If the re-
cording involves a longer period, the
sun will move; if light then enters the
camera objective directly, nothing
will be seen because the image will
be overexposed. More sky in the
view also means that less of the im-
age is devoted to the relevant con-
tent.
It is recommended that the area of
interest should be aligned with the
image diagonal, so ensuring that
the available resolution is used in
the most efficient way (see example
in Figure 4-6).
Part 2 | Chapter 4: Surrogate measures of safety and traffic conflict observations 117
High positioning (in this case, on top of a nearby building, h≈40m) gives the camera a perfect view of the studied location. In reality, however, one would be very lucky to access such a view. Note also how the trees obstruct the view of the right leg of the intersection, limiting observation of interac-tions at the pedestrian crossing there.
This view from a camera mounted on a lamp post (h≈8m) is the most common perspective. As the intersection and approaches to it are not fully visi-ble, it was necessary to decide which parts of the intersection are of most interest and to orient the camera accordingly. A two-camera setup would also be an option. Note that the area of interest is oriented diagonally.
In this example of a less successful camera per-spective, the sky creates a risk of blinding when the sun gets low (which may not have been obvi-ous when the camera was installed). Although a very long section of the road is visible, the image is unusable because of the very small scale of far-away objects and the difficulty of estimating dis-tance or speed. A preferable camera orientation is shown by the red rectangle.
Here, the camera is installed directly above the pe-destrian crossing, creating a very unusual view for the observer. The fisheye lens means that a rela-tively long section of the approach to the crossing is visible, but the distortion makes it difficult for the observer to judge distance and speed. However, such measurements are possible with a special tools that take distortion parameters into account.
Figure 4-6: Examples of camera views with comments
118 Part 2 | Chapter 4: Surrogate measures of safety and traffic conflict observations
4.8.4 SEMI-AUTOMATED TOOLS FOR TRAFFIC
CONFLICT OBSERVATION
Using semi-automated video pro-
cessing, some technical tool is used to
aid detection and analysis of traffic con-
flicts, but part of the work is still com-
pleted manually. Easily automated func-
tions include the following:
Managing large collections of video
recordings and bookmarks referring
to instances of conflict in the original
video.
Database tools for managing con-
flicts and their descriptions and pro-
ducing summary reports.
Manual extraction of road user tra-
jectories, usually by clicking frame
by frame on a road user or an ad-
justable box in the image. Calibra-
tion of the camera view is an im-
portant pre-task, establishing a
model that allows video frame pixels
to be transferred to a real-world po-
sition in meters.
Calculation of safety-relevant indica-
tors based on extracted trajectories.
Watchdog is a relatively simple
video processing tool that flags situ-
ations in which a conflict might be
found. This usually involves a com-
bination of several simple detector
units that are triggered when an ac-
tivity is detected in a certain part of
the image, along with a set of rules
that define a situation as potentially
relevant—for example, the simulta-
neous arrival of a car and a pedes-
trian at a pedestrian crossing. It is
usually impossible to make a mean-
ingful judgement about the severity
of the event, which must subse-
quently be reviewed by an expert.
Automation of these functions can en-
hance a conflict study by making the
work more efficient, standardising output
and ensuring more accurate measure-
ments. However, all the important deci-
sions must still be made by a human ob-
server.
Part 2 | Chapter 4: Surrogate measures of safety and traffic conflict observations 119
T-Analyst: A tool for processing traffic conflicts
Developed at Lund University in Sweden, this database solution links tables describing iden-tified conflicts to the recorded video, making it simple, for example, to select conflicts of a certain type and to play short video sequences containing only those conflicts.
The tool also allows the user to assign a certain time frequency to pre-defined shapes in the image (car, truck, cyclist, pedestrian) and to extract their trajectories and speed profiles.
Based on these data, it is possible to calculate the most common safety indicators (e.g. TTC, PET).
The software supports multi-camera recordings and includes a set of tools for video conversion and camera calibration.
For more information, see https://bitbucket.org/TrafficAndRoads/tana-lyst/wiki/Home
120 Part 2 | Chapter 4: Surrogate measures of safety and traffic conflict observations
RUBA: A watchdog software tool
RUBA (Road User Behaviour Analysis) was developed at Aalborg University in Denmark. The tool’s basic functional unit is a detector—an area of the image that is monitored constantly for activity. Several detector types are activated by presence, idling (long-term presence) or mo-tion in a certain direction, and one detector recognises traffic light colour.
Several detectors connected by a set of logical rules can be used at the same time. For example, it is possible to detect encounters (a car and a bicycle arriving simultaneously) or pedestrians walking on red.
The tool is most efficient when the frequency of expected events is low. Under favourable conditions, it allows removal of up to 90 % of original footage that does not include relevant situations.
For more information, see https://bitbucket.org/aauvap/ruba/wiki/Home
122 Part 2 | Chapter 4: Surrogate measures of safety and traffic conflict observations
Traffic Intelligence project
This project at Polytechnique Montréal in Canada includes several tools for detecting, track-ing and classifying road users, using a feature-based tracking algorithm for analysis of main outputs, trajectory data and road user interactions, as well as diagnosis of behaviour and safety. It has been applied to many case studies related, for example, to pedestrian behav-iour and the safety of cycling facilities, highway entry and exit ramps and roundabouts. The technology has been used by several research teams and companies around the world.
While it includes tools for the most common tasks, it is best thought of as a software library for the user’s own scripts. As all the code is open source, researchers can contribute new functionalities and replicate re-search results, and wider adoption is encouraged.
For more information and the open source code, see https://bit-bucket.org/Nicolas/trafficintelligence/
Part 2 | Chapter 4: Surrogate measures of safety and traffic conflict observations 123
STRUDL: Surveillance Tracking Using Deep Learning
STRUDL is an open-source and free framework for tracking road users in videos filmed by static surveillance cameras. It uses a deep learning object detector, camera calibration and tracking to create trajectories of e.g. road users, in world coordinates. It was designed to facilitate traffic safety analysis, using modern computer vision and deep learning, rather than the traditional methods commonly used despite their many flaws. By creating trajecto-ries in world coordinates, truly meaningful metrics and safety measures can be computed. STRUDL provides a Web user interface that attempts to make it easy to use, even without too much knowledge in computer vision and deep learning.
Using the program involves the following six steps: 1. Import videos 2. Annotate images 3. Train an object detector 4. Provide camera calibration 5. Perform tracking in world coordinates 6. Download the tracks as csv files, and analyse them with whatever
tools you like
For more information and the open source code, see https://github.com/ahrnbom/strudl
124 Part 2 | Chapter 4: Surrogate measures of safety and traffic conflict observations
4.9 Conclusions and key points
Surrogate measures of safety can be of
great value in safety analysis, especially
when accident data are limited or is of
doubtful quality. The advantages of such
analyses include their proactive nature,
the relatively short time needed for data
collection and the ability to observe con-
ditions that are not usually recorded in
accident reports. Over the years, many
methods and techniques have been
suggested, but only a few have been
properly tested and validated.
The weakest feature of traditional traffic
conflict techniques is their complete reli-
ance on a human observer for detection
and severity rating. Significant progress
has recently been made in computer
aids for the observer, including auto-
mated and semi-automated video analy-
sis tools. However, while fully automated
conflict studies are likely to be feasible in
the near future, the properly trained traf-
fic conflict observer will continue to play
a key role.
4.10 Recommended reading
State-of-the-art review:
Laureshyn, A., Johnsson, C., De Ceunynck, T., Svensson, Å., de Goede, M.,
Saunier, N., Włodarek, P., van der Horst, A. R. A., & Daniels, S. (2016). Review of current study methods for VRU safety. Appendix 6 – Systematic literature review: surrogate measures of safety in site-based road traffic observations (Deliverable 2.1 – part 4.). Horizon 2020 EC Project, InDeV. Lund, Sweden: Lund University
TCT manuals:
Kraay, J. H., van der Horst, A. R. A., & Oppe, S. (2013). Manual conflict observation
technique DOCTOR: Dutch Objective Conflict Technique for Operation and Re-search (No. 2013-1). Voorburg, The Netherlands: Foundation Road safety for all.
Laureshyn, A., & Varhelyi, A. (2018). The Swedish Traffic Conflict technique: ob-
server's manual. Lund, Sweden: Transport & Roads, Department of Technology & Society, Faculty of Engineering, LTH, Lund University.
Part 2 | Chapter 4: Surrogate measures of safety and traffic conflict observations 125
References Chapter 4
Manan, M. M. A., & Várhelyi, A. (2015). Motorcyclists’ road safety related behavior at
access points on primary roads in Malaysia: A case study. Safety Science, 77, 80-94.
doi.org/10.1016/j.ssci.2015.03.012
Amundsen, F. H., & Hyden, C. (Eds.) (1977). Proceedings from the first workshop on
traffic conflicts. 26-27 September, Oslo, Norway.
Asmussen, E. (Ed.) (1984). Proceedings of the NATO advanced research workshop
on international calibration study of traffic conflict techniques. 25-27 May, Copenha-
gen, Denmark. NATO ASI Series F: Computer and System Science vol. 5.
Bagdadi, O., & Várhelyi, A. (2011). Jerky driving – an indicator for accident prone-
Vet, J. M., Thierry, M. C., van der Horst, A. R. A., & Rahman, A. K. M. F. (2016). The
first integrated speed management program benefitting vulnerable road users in
Bangladesh: results and implications for LMICs. Paper presented at the 17th Road
Safety on Five Continents Conference, 17-19 May, Rio de Janeiro, Brazil.
Part 2 | Chapter 5: Behavioural observation studies 129
CHAPTER 5
Behavioural
observation
studies
Road user behaviour is a key aspect of
road safety. Road safety literature
widely acknowledges that road user be-
haviour is an important factor in the com-
plex interactions between road users,
the road environment and the vehicle.
According to several studies (Reason,
2000; Sabey & Taylor, 1980; Treat et al.,
1979), road user behaviour is the most
important contributing factor in nearly all
accidents (94%), while the road environ-
ment and the vehicle only partially con-
tribute in 18% and 8% of all accidents,
respectively. Therefore, interventions
targeted at controlling or altering road
user behaviour should increase road
safety. To understand road user behav-
iour, predict it in different situations and,
if possible, control and modify it, it is nec-
essary to have a technique or method for
observing and identifying behavioural
processes. This chapter presents such
behavioural observation techniques as
valuable tools for diagnosing road
safety.
What will this chapter tell me?
What are behavioural observation studies?
How can behavioural observation studies be used to assess road safety?
Why conducting a behavioural observation study?
How to carry out a behavioural observation study?
Which data are collected and how these data can be analysed.
130 Part 2 | Chapter 5: Behavioural observation studies
Behavioural observation studies can be
used to identify and study the frequency
of particular characteristics of road user
behaviour in different situations (OECD,
1998; van Haperen, 2016). This includes
observing road user behaviour in all
types of traffic events, from undisturbed
passages to serious conflicts. Such
study makes it possible to gain
knowledge about the behavioural and
situational factors at play both in low-risk
encounters and preceding serious traffic
events. Behavioural observation studies
thus provide an opportunity to better un-
derstand the contributory factors influ-
encing accident occurrence. Certain fac-
tors—such as speeding, red-light run-
ning and failure to wear seatbelts or hel-
mets—not only contribute to accident
occurrence but also to injury severity. As
behavioural observation studies observe
these contributing factors and the spe-
cific characteristics of related road user
behaviour, the results of such studies
can be used to identify which target
groups or risk-increasing behaviours re-
quire attention to reduce road fatalities
and serious injury.
Behavioural observation techniques are
particularly useful when studying road
user behaviour to diagnose road safety
problems at specific locations or among
specific target groups. Unlike accident
data analyses, observing interactive be-
haviour provides an insight into the road
safety process, not only road safety out-
comes. For example, observing road
user behaviour can reveal the underly-
ing factors as to whether a given meas-
ure improves road safety or not. This
chapter serves as a guide for applying
behavioural observation studies to as-
sess the road safety of vulnerable and
other road users.
5.1 Introduction to behavioural
observation studies
Identification of the drawbacks of acci-
dent data analysis has led to the devel-
opment of several other road safety
evaluation methodologies. These meth-
ods largely use safe traffic interactions
as a benchmark and are based on the
direct observation of traffic events that
result from processes similar to those of
accidents, or on observations and anal-
yses of the particular characteristics and
determinants of traffic behaviour
(OECD, 1998). Behavioural studies are
an example of such road safety evalua-
tion methods. Typical behaviours in a
behavioural observation study include
informal communication, yielding behav-
iours, crossing behaviours, looking be-
haviours, red-light running, speeding
and seatbelt use.
Behavioural studies are among the first
road safety evaluation methods to use
non-accident-based data. Nearly a cen-
tury ago, Dodge (1923) argued that ob-
serving road user behaviour is crucial to
improving road safety. One of the oldest
behavioural studies was performed by
Greenshields, Thompson, Dickinson
Part 2 | Chapter 5: Behavioural observation studies 131
and Swinton in 1934. They introduced
the technique of taking consecutive pic-
tures as a new data collection method to
analyse road user behaviour. Since
then, behavioural studies have become
common practice and have been applied
for various research purposes.
Behavioural studies are a type of natu-
ralistic on-site observation technique, as
road user behaviour is observed in the
real setting in which the behaviour of in-
terest occurs (Eby, 2011). In road safety
research, this setting consists of the
road environment, the vehicle and the
road users interacting with each other in
this environment.
What is a behavioural study?
A type of traffic observation study used to examine road user behaviour. These studies emphasise analysing the actions of road users in their natural settings by means of observ-able, qualitative variables (e.g. gender, age, interaction type, approaching behaviour, look-ing behaviour, priority behaviour, distraction, communication behaviour, red-light running, seatbelt use) while they interact with other road users, the road environment and/or their mode of transportation.
The basic principle behind the use of be-
havioural studies is the paradigm that
the behaviour of road users is a prereq-
uisite for road safety. According to
Svensson (1998), safety levels are
closely linked to the quality of the inter-
active behaviour and communication
that takes place between road users.
Consequently, road user behaviour—
the most important contributing factor in
road accidents—forms the core of be-
havioural studies. These studies aim to
define and observe the principles of safe
interaction among road users and the
road environment by looking not only at
unsafe interactions but also safe ones.
The rationale behind this approach is
that safe and unsafe interactions relate
to each other; a subtle change in the in-
teraction process between road users,
the vehicle and the road environment
can transform a safe situation into an un-
safe one.
In capturing the interactions between
these elements and the behavioural and
situational aspects that precede acci-
dents, behavioural observation studies
offer valuable insights into how safe in-
teractions can evolve into potential acci-
dents and how road user behaviour in-
fluences the occurrence of accidents
and accident-preceding events. Such
study allows us to better understand why
road users behave the way they do in
different situations and events and to
predict how road users will behave in
certain situations, allowing safety
measures to be implemented proactively
(i.e. before accidents occur).
132 Part 2 | Chapter 5: Behavioural observation studies
5.1.1 ADVANTAGES AND DISADVANTAGES
Behavioural studies are essential to
many empirical data collection efforts
but, like any technique, have both ad-
vantages and disadvantages.
The six main strengths of this method
are described below.
Why should I use behavioural and interactional studies?
ADVANTAGES DISADVANTAGES
Direct observation of road user behaviour in a natural setting
Only observes revealed behaviours
Practice-ready (convenient to learn & apply) Difficult generalisability of results
Data can be collected quickly for fast evaluation of road safety situations
Labour-intensive data collection
Inexpensive Observer bias
Insights into behavioural and situational aspects that precede accidents (supplement to accident data)
Susceptible to adverse weather conditions, diffi-cult at night
Can be combined with other techniques (i.e. supplement to accident data)
First, these behavioural studies allow
the direct observation of road user be-
haviour in a natural setting, making for
strong face and construct validity (Eby,
2011). Their interpretation does not rely
on road user behaviour proxies as self-
reporting techniques do (Eby, 2011),
and the results of these studies are more
likely to reflect reality than those of other
research methods (such as driving sim-
ulators). Further, observing road user
behaviour in a natural setting reduces
the effects of behavioural adaptation
that can lead to risky or aggressive be-
haviour while driving (Shinar, 1998).
Second, these studies are practice-
ready and convenient to learn and apply.
Human observers can be trained in as
little as two days because of the
method’s ease of use. These studies are
so easy to use because no complex re-
search resources are required; collect-
ing road user behavioural data requires
only trained human observers. These
human observers can be complemented
or even replaced by video cameras, but
the locations of such cameras and the
privacy legislations that can restrict their
use should be considered properly.
Third, behavioural studies allow road
safety situations to be diagnosed very
quickly, as the data necessary for such
diagnoses can be collected in a short pe-
riod of time. These studies thus offer the
advantage of responsibility, as road
safety can be diagnosed and evaluated
at locations perceived as unsafe before
serious accidents occur.
Fourth, behavioural studies are inexpen-
sive compared to other safety diagnostic
Part 2 | Chapter 5: Behavioural observation studies 133
methods, as they do not require costly
training programmes or tools. This
opens opportunities for road safety re-
search in developing countries.
Fifth, these studies provide insights into
the causes of accidents by describing
the behavioural and situational aspects
that precede them, as well as the spe-
cific characteristics of a location that
may influence observed road user be-
haviour. This allows for the selection of
location-specific road safety solutions.
Finally, behavioural studies can be used
in combination with other techniques. To
maximise the benefits gained from be-
havioural studies, it is recommended to
combine results of these studies with
traffic violation data, accident data anal-
yses, self-reports and traffic intensity
measurements (Lötter, 2001). When
combined with these techniques, behav-
ioural studies—which can be easily
adapted to the requirements of a specific
situation—are an effective tool for diag-
nosing road safety problems at specific
locations or for specific target groups.
As a road safety diagnostic method, be-
havioural studies also have some disad-
vantages. The main shortcoming of
these studies is that only variables de-
scribing the revealed behaviours of road
users can be observed and collected,
meaning the underlying causes of these
behaviours remain undetected (Eby,
2011).
Another disadvantage is the lack of re-
sults generalisability (Eby, 2011). Be-
cause the observations of road user be-
haviour are location-specific, it is difficult
to verify that the observed behaviours
will also occur at locations where no be-
havioural study has been performed. As
such, results interpretation requires cau-
tion.
Another drawback is the labour-inten-
sive quality of the method’s data collec-
tion. It is very time-consuming to conduct
a behavioural observation study, as the
observers must study the road user be-
haviour on-site for several hours. This
requires significant endurance from the
observers, who must remain focused
during the entire observation period. Alt-
hough the use of video cameras can re-
duce this intensity of labour (events can
be replayed multiple times and the con-
tinuous observation period split into
smaller blocks), it cannot eliminate it.
Another disadvantage is that the human
observers on whom the studies rely may
have biases that affect what they see
and record (Eby, 2011). This observer
bias can be mitigated through training or
the use of video cameras to register road
user interactions.
Finally, the execution of these studies is
susceptible to adverse weather condi-
tions and relies on daytime hours as
these aspects limit the visibility of human
observers to accurately record road user
behaviour. Additionally, not all video
cameras are able to sustain adverse
weather conditions.
134 Part 2 | Chapter 5: Behavioural observation studies
5.2 When to conduct behavioural
observation studies
Behavioural observation studies provide
information about the frequency of spe-
cific characteristics of road user behav-
iour in different situations. Unlike traffic
conflict observation studies, these stud-
ies are not used to quantify road safety
levels in terms of the expected number
of injury-inducing accidents (OECD,
1998; van Haperen, 2016). On-site be-
havioural observation studies can be
used for a wide variety of purposes and
are especially useful when assessing
road safety situations where there is no
accident data available, or when the
available accident data lacks detail
(OECD, 1998). In the context of diagnos-
ing and evaluating road safety, behav-
ioural observation studies are used pri-
marily for the following (OECD, 1998;
van Haperen, 2016):
Monitoring the frequency of road
user behaviour;
Checking the findings of accident
and traffic conflict studies regarding
possible accident factors;
Evaluating the effects of road safety
countermeasures or strategies;
Developing behavioural models for
simulation purposes; and
Developing and testing automated
video analysis software.
When behavioural studies are used for
monitoring purposes, their focus lies in
observing the frequency and character-
istics of road user behaviour at one or
multiple (i.e. identical) locations to deter-
mine the most prevalent behaviours. An
example of such a study is that by
Langbroek et al. (2012), who used be-
havioural indicators to investigate inter-
actions between pedestrians and motor
vehicles at signalised intersections.
Results based on accident and/or con-
flict data alone can be insufficient for de-
termining possible accident factors or
providing detailed insights into the
causes and behavioural elements be-
hind road safety problems. This is espe-
cially the case in situations where there
is little accident or conflict data available,
or when the available data lacks detail.
Behavioural observation studies can
help assess the road safety situation by
checking the findings of accident and
traffic conflict studies regarding possible
accident factors. An example is the
study by De Ceunynck, Daniels, Polders
and Vernyns (2015), who aimed to gain
a better understanding of the interac-
tions between drivers of motor vehicles
and cyclists at roundabouts with sepa-
rated cycle paths to identify the road
safety issues facing cyclists at these lo-
cations. Earlier studies based on acci-
dent data had been unable to determine
whether it was safer to implement prior-
ity for cyclists crossing the exit and entry
lanes of roundabouts with separate bicy-
cle paths.
Behavioural studies are also effective
when evaluating whether a measure has
had its intended effect and to identify un-
wanted side effects at an early stage.
The observation of ‘normal’ interactive
behaviour is particularly relevant when
determining why a given measure is an
Part 2 | Chapter 5: Behavioural observation studies 135
improvement to road safety or not. Un-
like accident data analyses, interactive
behaviour observation provides insights
into the road safety process in addition
to road safety outcomes, as demon-
strated by Polders et al. (2015).
Finally, behavioural observation studies
can be used for software and model de-
velopment. With model development,
behavioural observation data can be
used as input to develop, calibrate
and/or validate behavioural models such
as microsimulation models (van
Haperen et al., 2018). For example,
Kadali et al. (2015) used behavioural ob-
servation data based on a video graphic
survey as input to develop a pedestrian
gap acceptance model. Behavioural
video data of road user interactions can
be used to develop and test automated
video analysis tools (van Haperen et al.,
2018). An example of such work is that
by Zaki and Sayed (2014), who studied
non-conforming pedestrian behaviour at
an intersection in Vancouver, Canada.
In this study, the authors developed and
tested an automated system for identify-
ing pedestrian crossing non-conform-
ance to traffic regulations based on pat-
tern matching. Their results revealed a
high rate of noncompliance among dif-
ferent pedestrian populations and pro-
vided general information on the behav-
iour of crossing pedestrians (e.g. illegal
crossing rate at the facility).
To summarise, behavioural observation
studies are applied predominantly for
monitoring and evaluation purposes, but
are also used (to a lesser extent) to de-
velop behavioural models and software
(van Haperen et al., 2018).
Interactions between pedestrians and motor vehicles at signalized intersections (Langbroek et al., 2012)
A joint Belgian–Swedish study analysed interactions between pedestrians and motor vehi-cles at two-phase signalised intersections by means of video-based behavioural observa-tions at three intersections in Sweden and Belgium. The study collected the following be-havioural indicators: number of pedestrians, age and gender of involved road users and behavioural aspects like yielding, crossing and looking behaviours.
The analysis of the behavioural aspects revealed that men and young road users violated red traffic signals more often than women and older road users. Red light violation was also more prevalent at Swedish intersections than at Belgian ones. No differences were noted between pedestrians walking alone and pedestrians walking in groups. One interesting re-sult was the fact that red traffic violations appeared to be independent of the presence of an approaching vehicle. Further, pedestrians often did not yield when violating a red traffic signal. Regarding looking behaviours, around 30% of pedestrians in general did not look both ways before crossing. Pedestrians who did not look both ways before crossing were involved in more traffic conflict situations than those who did.
Motorcyclists’ road safety-related behaviour at access points on primary roads in Malaysia: A case study (Abdul Manan & Várhelyi, 2015)
An observational study focusing on motorcyclists was conducted at access points on straight sections of primary roads in Malaysia to gain more insight into actual road traffic situations at these sites. Motorcyclist behaviour was observed by means of video record-ings and trained human observers at selected locations. The video camera was installed unobtrusively inside a parked car. Two observers were seated in the car; one operated the video camera while the other noted all the interactions and associated characteristics (e.g. identification of serious conflicts, course of events preceding the conflict, road user behav-iours influencing the course of events).
136 Part 2 | Chapter 5: Behavioural observation studies
The results revealed that the majority of motorcyclists kept to the speed limit and reduced speed when approaching an access point, especially in the presence of other road users. Motorcyclists tended to participate in a risky right turn movement (i.e. Opposite Indirect Right Turn [OIRT]) from the access point onto the primary road. Most of the motorcyclists who engaged in the OIRT manoeuvre did not comply with the stop line rule. The motorcy-clists exhibited high compliance with helmet and headlight usage but were poor at utilising the turning indicator.
Yielding behaviour at roundabouts with separated cycle paths (De Ceunynck, Daniels, Polders, & Vernyns, 2015)
This Belgian study observed interactions between drivers of motor vehicles and cyclists at six roundabouts with separated cycle paths—three with priority for cyclists and three with no priority for cyclists.
By means of a standardised observation form, detailed information about 165 interactions was collected in a structured way. The observations showed that there were substantial differences between the two types of roundabouts concerning interaction behaviours be-tween cyclists and motor vehicle drivers. At the roundabouts with priority for cyclists, the cyclists usually were given priority from the motor vehicle drivers. At roundabouts with no priority for cyclists, situations in which the motor vehicle drivers took priority occurred most frequently.
Looking behaviour also played a role in the interaction process. When a motor vehicle driver looked in the direction of a cyclist, the probability of the cyclist continuing to ride increased significantly. This probability was also higher among male cyclists. At roundabouts without priority for cyclists, motor vehicle drivers often were denied priority by male cyclists. Simi-larly, motor vehicle drivers took their priority less frequently when interacting with male cy-clists than with female cyclists. Notably, the share of motor vehicle drivers who did not use direction indicators was quite high at 29%.
In sum, there was a high degree of heterogeneity among the interactions between cyclists and motor vehicle drivers, especially at roundabouts without priority for cyclists. This could indicate a potential safety risk for cyclists.
Drivers’ behavioural responses to speed and red light cameras (Polders et al., 2015)
Many signalised intersections worldwide have been equipped with enforcement cameras to
tackle red-light running or to enforce speed limits. However, various impact evaluation stud-
ies of red-light cameras (RLCs) show that the presence of these cameras leads to increases
in rear-end collisions (up to 44%). The principal objective of this study was to provide pos-
sible explanations for the increase in rear-end collisions at combined speed and red-light
camera (SRLC) installation sites.
Real-world behavioural observations and driving simulator-based observations were used.
Video recordings at two signalised intersections where SRLCs were about to be installed
were used to analyse rear-end conflicts, interactions and driver behaviours under two con-
ditions (with and without the SRLC). One of these intersections was also built into a driving
simulator equipped with an eye tracking system. At this location, two test conditions (SRLC
and SRLC with a warning sign) and one control condition (no SRLC) were set for examina-
tion. Data from 63 participants were used to estimate the risk of rear-end collisions via a
Monte Carlo Simulation.
The results of the on-site behavioural observation study revealed decreases in red and yellow light violations, a shift in the dilemma zone (closer to the stop line) and a time head-way reduction after SRLC installation. Based on the driving simulator data, the odds of rear-end collisions (compared to the control condition) for the conditions with SRLC and SRLC + warning sign were 6.42 and 4.01, respectively. To conclude, the real-world and driving simulator observations indicated that the risk of rear-end collisions increased when SRLCs were installed. However, this risk might decrease with installation of an early warning sign.
Part 2 | Chapter 5: Behavioural observation studies 137
5.3 Methods for observing road
user behaviour
Behavioural observation studies for di-
agnostic purposes are usually designed
according to the behaviour of interest or
situation under observation. From a
methodological point of view, behav-
ioural observation studies can be di-
vided into two categories: unstructured
and structured.
In unstructured behavioural observation
studies, researchers look with an ‘open
mind’ at road user behaviours and rec-
ord any observable action or behaviour
that seems interesting or conspicuous.
In this sense, these studies help re-
searchers to ‘get acquainted’ with the re-
search site. Unstructured behavioural
observations typically complement traf-
fic conflict observation studies; interest-
ing situations are identified and collected
when analysing the conflict observation
data. Behavioural observations are not
the goal of the research, but rather pro-
vide the bonus of rich qualitative infor-
mation about road safety at a specified
location. An example of an unstructured
behavioural observation study is that by
Manan and Várhelyi (2015).
In contrast, structured behavioural ob-
servations are well-prepared and can
expand on results from unstructured ob-
servation studies. These studies con-
duct explicit and detailed observations of
specific safety-related behaviours such
as crossing and looking behaviours or
traffic rule compliance at a certain loca-
tion. In most cases, standardised forms
of observation are used to study the be-
haviour of interest. These studies, espe-
cially when combined with other re-
search methods, are essential for under-
standing complex road safety problems.
An example of a structured behavioural
observation study is that by Langbroek
et al. (2012).
Regardless of the type of behavioural
observation study, the two most com-
mon methods for collecting behavioural
observation data are on-site human ob-
servers and video cameras (or a combi-
nation of the two, as mentioned by van
Haperen et al., 2018). Both methods are
easy to apply, can be used to observe all
types of road users and allow the collec-
tion of a wide variety of behavioural indi-
cators. The applied data collection
method depends on the purpose of the
study and the type of behavioural indica-
tors under observation. Table 5-1 pro-
vides an overview of the two data collec-
tion methods and their characteristics.
138 Part 2 | Chapter 5: Behavioural observation studies
Table 5-1: Overview of data collection methods
Method Costs Time consumption
Suitable target group
Suitable sample size
Type of behavioural indicators
Human observers
Medium High All types of road users
Small to medium
Yes/No
Video cameras
Medium Medium to high
All types of road users
Large Yes/No and more detailed measurements
Types of behavioural indicators (adopted from van Haperen et al., 2018)
Yes / No More detailed
Red-light running Gap acceptance Evasive action Protective clothing Carrying items Use of pedestrian push button Mobile phone use Wrong-way driving Turn indicator Lane change Stop-sign compliance Lights Stop/go decision Yellow-light running Overtaking Smoking Seatbelt use Child restraint use Speed (related) Looking Yielding Merging
Crossing path Waiting time Waiting position Lateral position Crossing time Gap size Headway Yielding distance Other distractions Other violations Lane choice Distance to stop line Merging distance Overtaking attempts Intersection entry time Speed (related) Looking Yielding Merging
Behavioural observation studies also register variables describing the personal characteristics of indi-vidual road users (e.g. age and sex) and informal communication actions like head, eye and hand move-ments and eye contact.
5.3.1 HUMAN OBSERVERS
On-site trained human observers are a
flexible and basic means to collect be-
havioural observation data. Research-
ers or observers stand next to roadways
and intersections, look into vehicles and
at vulnerable road users (VRUs) and
record what they see (Eby, 2011). Be-
havioural observation studies by means
of trained human observers have the ad-
vantage of only needing a watch, pen
and behavioural observation form to reg-
ister the revealed road user behaviour.
The variables that are registered on the
Part 2 | Chapter 5: Behavioural observation studies 139
behavioural observation form are mostly
‘yes/no’ and ‘single value’ indicators.
Further, the data of interest can be col-
lected very quickly and efficiently (van
Haperen et al., 2018). This method is
useful when collecting behavioural data
at different types of locations (e.g.
roundabouts, intersections, part of an in-
tersection) and for all types of road us-
ers.
The costs of using human observers for
data collection primarily involve labour
costs and depend on the number of ob-
servers for each project. The number of
observers depends on the purpose of
the research and the size and complex-
ity of the study location. For instance, for
a moderately sized intersection or a not-
too-complex location, one observer is
generally sufficient; more than one ob-
server is recommended for more com-
plex intersections or locations. When us-
ing multiple observers, some observa-
tion data will overlap, but this is compen-
sated by the gain of additional infor-
mation that can be observed and regis-
tered. The use of several observers is
most useful in situations where multiple
events occur simultaneously. It should
be noted that in all projects involving hu-
man observers, the collected data must
be digitised before data analysis may
commence.
A disadvantage of behavioural observa-
tion studies using trained human observ-
ers is that the data collection process is
influenced by inter- and intra-coder reli-
ability (Williams, 1981), subjectivity
(Grayson, 1984) and possible registra-
tion errors when the human observers
are involved in operations for extended
time periods. According to van Haperen
et al. (2018), these drawbacks become
more significant when the data collection
process is complex and when the meas-
urements are based on estimations that
cannot be verified after the fact. Due to
these limitations, it is recommended to
only apply this data collection method for
small-to-medium sample sizes (e.g. ob-
serve for two hours, then take a break
before resuming observations). Further,
the observers must be trained prior to
collecting the data to ensure that the ob-
servations are performed as systemati-
cally and objectively as possible to yield
valid results. Currently, many behav-
ioural observations that use human ob-
servers also use video recordings. This
allows the observer to review the ob-
served interactions and behaviours
when analysing the results. An example
of a behavioural observation study by
means of trained human observers is
that by Langbroek et al. (2012).
TIP: Training of observers
Observers should be trained properly in conducting behavioural observation studies. During a short, multi-day training course, the observers participate in:
Theoretical lectures
- How to compose a behavioural observation form; - How to perform a behavioural observation study; - Points of attention.
Practical instructions:
- Exercises are done to learn how to observe road user behaviour accu-rately and efficiently on location;
140 Part 2 | Chapter 5: Behavioural observation studies
- Real-life field observation sessions take place at a study location to ensure everyone gets acquainted with the behavioural observation form, knows which behaviours/interactions to observe and to check consistency in the recorded observations;
- Camera placement (if used); - Processing, analysing and interpreting the data and results; - Taking a good position with respect to the point of observation
Three main issues that need to be addressed during training (Eby, 2011):
Training for consistency and accuracy: each observer should collect the behav-ioural data by following the same procedures (protocols and identical data cod-ing). This should be practiced before starting the actual study.
Inter-observer reliability: when using multiple observers, all observers should be trained together and tested for inter-observer reliability to ensure the collected data are comparable. This can be achieved by checking and comparing the rec-orded results of each observer after the practice session. If the inter-observer reliability is low (i.e. less than 85%), the observers should discuss how they are coding data and continue practicing until the comparability between the results is greater than 85%.
Intra-observer reliability: the variability in the recordings of a single observer over time (Archer, 2005). The discrepancies of an individual observer can be attributed to different factors, including lack of training, inadequate definitions of the ob-served situations, fatigue, excessive conflicts and the occurrence of complex conflict types (Chin & Quek, 1997). These inconsistencies can be overcome through training programmes and video analysis techniques.
At the study location, observer(s) should have unobstructed visibility (i.e., a good overall view) and should wear unobtrusive clothing so as not to influence road user behaviour (Löt-ter, 2001).
5.3.2 VIDEO CAMERAS
Video cameras are a more objective and
accurate means of collecting behav-
ioural observation data. Per this method,
one or multiple cameras are installed in-
conspicuously at the location(s) of inter-
est and record road user interactions
and behaviours (Eby, 2011). This
method can be used to collect behav-
ioural data at different types of locations
(e.g. roundabouts, intersections, part of
an intersection) and for all types of road
users. Video cameras allow the continu-
ous observation of road user behaviour,
and the recorded interactions can be re-
played and reviewed to verify the results.
Registerable variables include both
‘yes/no’ and more detailed indicators.
Data collection by means of video cam-
eras is less labour-intensive due to the
approach not requiring the presence of a
trained observer during data collection.
The subsequent data analysis is still
time-consuming, however, as auto-
mated video analysis tools are currently
still under development (see chapter 4).
An example of a behavioural observa-
tion study by means of video cameras is
that by van Haperen et al. (2018). For
more information on using video record-
ings for observation purposes, please
consult section 4.8 of CHAPTER 4 of
this handbook.
Part 2 | Chapter 5: Behavioural observation studies 141
TIP: Using video cameras
The following points should be considered when using cameras:
Authorisation from the road authority is required to place a camera.
A good location (e.g. lamp post, building) is required to place the equipment. This place should be inconspicuous.
The availability of electricity is an important factor.
The camera’s point of view must include the entire research area.
Weather and lighting conditions must be accounted for (e.g. provision of a pro-tective rain cover).
The equipment must have some protection against theft.
Privacy issues must be taken seriously. Video footage is a type of personal data, so all privacy regulations must be respected. These rules specify how the rec-orded video footage must be handled (e.g. blur license plates or faces, type of resolution to be used while recording). These rules vary from country to country, with some requiring permission from the privacy commission or authority before recording may commence.
Available data storage space (e.g. hard drives, SD cards) must be monitored to avoid the overwriting of data and keep data loss to a minimum.
Conventional video cameras suffice for recording video footage at certain locations, but for longer observation periods (e.g. one week or more), the use of professional video cameras is recommended. These cameras can be rented from companies specialised in equipment for traffic studies.
Yielding behaviour and traffic conflicts at cyclist crossing facilities on channelized right-turn lanes (van Haperen et al., 2018)
A Belgian study investigated the safety performance of crossing facilities for cyclists using channelized right-turn lanes (CRTLs). Site-based observations of yielding behaviours were used to evaluate the effect of the priority rule on cyclists’ safety in two CRTL designs. Four locations in Belgium were selected for video observations: two where the priority rule favoured cyclists and two where motorists had priority.
With regard to yielding, four types of crossing behaviours were identified and defined. Inde-pendent of the priority rule, cyclists crossed the conflict zone first in most interactions without taking the initiative to cross first. Underlying reasons for motorists willingly yielding their right-of-way could not be determined, but courtesy or fear of inflicting injuries on VRUs may have been of influence. The results lightly suggested that locations with motorist priority and right-to-left cyclist crossings (from the driver’s point of view) produce the highest proportion of safety-critical events.
142 Part 2 | Chapter 5: Behavioural observation studies
5.4 How to collect behavioural
observation data
Behavioural observation studies typi-
cally follow a well-defined study plan.
This section provides a step-by-step
guide for setting up a behavioural obser-
vation study. The basic stages of a be-
havioural observation study are as fol-
lows:
1. Deciding to apply a behavioural ob-
servation study;
2. Selecting locations for observations;
3. Determining what road user behav-
iours to observe;
4. Formulating observation protocols;
5. Defining the research design;
6. Defining a data collection methodol-
ogy;
7. Conducting the behavioural obser-
vation study.
These stages are described in greater
detail in the subsections below.
5.4.1 DECIDING TO APPLY A BEHAVIOURAL OBSERVATION STUDY
Behavioural observation studies are a
useful method for diagnosing many road
safety issues. However, not all road
safety issues can be assessed by
means of this naturalistic observation
method. Therefore, the following four
qualities should be considered before
deciding to use behavioural observation
studies as a method (Eby, 2011):
1. Purpose of the study (research ob-
jective);
2. Reliability;
3. Population of interest;
4. Resources.
First, the purpose of the study needs to
be determined. Behavioural observation
studies are suitable when examining the
frequency or occurrence of road user be-
Part 2 | Chapter 5: Behavioural observation studies 143
haviours but are not appropriate for gain-
ing an in-depth understanding of the un-
derlying causes (e.g. motivations, be-
liefs, attitudes) of the revealed behav-
iours (Eby, 2011). Determining the pur-
pose of the study or research objective
is a crucial step in applying behavioural
studies, as doing so dictates the entire
study design (e.g. location, target group,
behaviours for observation, observation
time and duration). Second, you must
determine whether it is possible to judge
the behaviour of interest accurately and
reliably through visual inspection (Eby,
2011). Third, it is important to identify the
population of interest (Eby, 2011). In
some cases, it can be difficult to design
a behavioural observation study that
both represents a large population and
is cost-effective. Further, the population
must occur in natural settings. Finally,
you must have access to sufficient re-
sources to conduct such studies, which
can be very costly due to reliance on la-
bour-intensive work and depending on
the study’s scope and design.
5.4.2 SELECTING LOCATIONS FOR OBSERVATIONS
Once you have decided to conduct a be-
havioural observation study, it is im-
portant to determine where the observa-
tions will take place. This decision re-
lates closely to the study’s purpose and
the research objective. For example,
your focus could be to evaluate road in-
frastructure re-designs at a certain loca-
tion or to monitor the frequency and
characteristics of road user behaviours
at one or multiple locations to identify
prevalent behaviours; such studies
would require entirely different locations.
When selecting observation sites, it is
crucial that they represent the behaviour
of interest accurately—simply put, the
behaviour for study must occur naturally
at the chosen location. Generally, be-
havioural observation studies are ap-
plied at intersections in urban settings
because VRUs appear more frequently
in urban areas, as do road user interac-
tions.
Selection of study location(s) (van Haperen et al. 2018)
Based on accident data: Locations with reasonably high numbers of reported accidents are selected for the behavioural observation study.
Based on infrastructural characteristics: Locations are selected based on their infrastruc-tural characteristics. These characteristics should be as similar as possible to limit the influ-ence of confounding factors.
To guarantee the transferability of results, behavioural studies should focus on locations free of location-specific factors that may influence road safety conditions.
144 Part 2 | Chapter 5: Behavioural observation studies
5.4.3 DETERMINING WHAT ROAD USER BEHAVIOURS TO OBSERVE
Once you have set your study location,
it is important to select the variables for
observation. These variables can relate
to:
The road user type to be observed:
all road users or a specific group
(e.g. only VRUs, only drivers).
Personal characteristics of the road
user: age, gender, helmet use, etc.
Road user behaviour: looking, yield-
ing, crossing, communication (e.g.
use of directional indicators, hand
gestures) and other behaviours.
Infrastructural elements: priority
rules at the location, colour of the
traffic light while crossing, etc.
Laureshyn (2010) provides a detailed
overview of the different variables that
can be used to observe individual road
user behaviours and interactions. These
variables are clustered according to the
main road user group for study (i.e. driv-
ers of motor vehicles, cyclists or pedes-
trians). This overview indicates the data
type and preferred data collection
method for each variable. For more in-
formation regarding this topic, consult
Laureshyn (2010). Interesting variables
can also be selected based on the avail-
able road safety data at the study loca-
tion; variables can be tailored to reflect
the types of accidents for which addi-
tional information about road user be-
haviour is needed. Another option is to
observe an intersection without any
preparation; this method brings the ad-
vantage of obtaining an overall picture of
the location’s road safety and traffic situ-
ation (see section 5.3).
In observations using trained observers,
the selected variables are noted on a
standardised behavioural observation
form specifically developed for the
study. On this form, the various behav-
ioural and situational aspects of the in-
teraction are represented in the form of
binary (yes/no) or categorical variables.
By structuring and standardising interac-
tions in such a way, it is possible to carry
out quantitative analyses on the col-
lected data. An example of such a stand-
ardised behavioural observation form is
provided in Annex 1 of CHAPTER 5.
5.4.4 FORMULATING OBSERVATION PROTOCOLS
An observation protocol defines when
and for how long the behavioural obser-
vation study will take place. The obser-
vation period should be determined ac-
cording to the purpose of the behav-
ioural observation study. If, for example,
the road safety problem or behaviour of
interest relates to specific weather con-
ditions, traffic conditions or time of day
(e.g. peak hours, night), the behavioural
observations will need to be conducted
at an appropriate time to meet these
conditions (Lötter, 2001). Before starting
formal observations, you should collect
background information to acquaint
yourself with the road safety problems at
the study location. Accident data and in-
quiries with the local police department
Part 2 | Chapter 5: Behavioural observation studies 145
or residents near the study location can
provide valuable insights (Lötter, 2001).
It is crucial to consider the entire obser-
vation period thoroughly. When defining
this period, you must ensure that it is re-
liable and representative of the road
user behaviour under study. You can as-
sure this representativeness by spacing
the observations evenly throughout the
hours of the day and days of the week
(including weekends if necessary) to
avoid possible biases.
The duration of the behavioural observa-
tions will depend on the situation under
study, the desired reliability level, traffic
density and the number of interactions at
the location. In most cases, 30 hours of
behavioural observations at a site are
sufficient to provide an overview of the
prevalent road user behaviours and al-
low for a road safety analysis. Generally,
observations carried out by human ob-
servers (see section 5.3.1) are divided
into blocks of no longer than two to three
hours, each followed by a break of 10 to
15 minutes. To ensure each observation
period begins on time, the observers
should arrive at the study location at
least 10 minutes before the start of the
behavioural observations.
Observation protocol example
There are no standardised observation protocols currently available. Instead, researchers develop individual protocols tailored to their specific studies. Researchers do not uniformly describe study characteristics at the same level of detail, significantly limiting the transparency and transferability of research results (van Haperen et al., 2018).
The following observation protocol example has been taken from De Ceunynck et al. (2013, p. 41), who used it to observe vehicle–vehicle interactions at two non-signalised intersections:
Each intersection was observed for 30 h during the November 24 through December 5, 2011, period. All observations took place in dry weather conditions during the daytime because of the need to look inside the vehicles to collect information about the drivers’ gender, age and looking behaviour. Twilight, night, and rainy conditions did not allow this. The observations were done in blocks of 2 to 3 h, spread evenly throughout the hours of the day and days of the week (including weekends) for both intersections to avoid possible biases. All observa-tions were executed by one observer using a standardised observation form. All variables were objectified and standardised as binary or categorical variables to allow quantitative anal-yses of the interactions.
5.4.5 DEFINING THE RESEARCH DESIGN
The research design of a behavioural
observation study is linked to the pur-
pose of the study. For instance, if the
purpose of the study is to evaluate road
infrastructure re-designs, a before-and-
after design is recommended. In such a
study, road user behaviours are ob-
served before and after the implementa-
tion of the infrastructural measure of in-
terest to see whether the measure has
its intended effect and results in positive
road safety changes.
Behavioural observation studies can
also use a single observation design,
which focuses on observing the fre-
146 Part 2 | Chapter 5: Behavioural observation studies
quency of road user behaviours at a lo-
cation. For example, the crossing be-
haviours of VRUs at signalised intersec-
tions could be observed. Variables could
include the number of times pedestrians
violate red traffic signals, whether they
look both ways before crossing or
whether they yield.
TIP: before and after study design
The same observation periods must be applied before and after the studied measure’s im-plementation, and the characteristics of these observation periods (e.g. weather conditions, traffic conditions) must be as identical as possible. The ‘after’ observations should begin at least six weeks after the implementation of the measure to reduce the influence of the nov-elty effect and ensure road user behaviours have adapted to the changed traffic conditions (Polders et al., 2015).
Another option for research design is the
cross-sectional approach. With this de-
sign, two or more locations (e.g. inter-
sections) are selected. These locations
must be as comparable as possible in
terms of infrastructural design character-
istics, vehicle speeds and traffic flows,
but differ in one aspect (e.g. right-of-way
rules). The behavioural observations at
all the locations then examine how this
one difference influences road user be-
haviour.
5.4.6 DEFINING A DATA COLLECTION METHODOLOGY
The data collection method you choose
to apply will depend on the purpose of
the study and the type of behavioural in-
dicators that need to be observed.
The two most common data collection
methods are on-site human observers
and video cameras (or a combination of
the two, as mentioned by van Haperen
et al., 2018). For more information, con-
sult section 5.3.
Video camera vs trained observers (van Haperen et al.,2018)
Variables such as gender, age and communication between road users (e.g. informal sig-nals, eye contact) cannot be obtained easily from video data and should be collected by on-site observers.
Video cameras offer the advantage of continuous data collection for longer time periods, whereas trained observers may take only a sample of a situation. Video data allow the registration of continuous variables (e.g. speeds), which can then be analysed accurately using video analysis. Video data also create the possibility of verifying the quality of meas-urements and replaying the videos as many times necessary to extract all relevant infor-mation (van Haperen et al., 2018). Finally, videos are very efficient in communicating re-search findings to other researchers and the public. However, only events happening in view of the camera can be analysed.
Part 2 | Chapter 5: Behavioural observation studies 147
5.4.7 CONDUCTING THE BEHAVIOURAL OBSERVATION STUDY
Once you have completed all prepara-
tions, it is time for the actual behavioural
observation study. Trained human ob-
servers must be present at the study lo-
cation during the entire observation pe-
riod. If using multiple observers, they will
need to synchronise their watches be-
fore the start of the study so as to record
road user behaviour occurrences on the
behavioural observation form accu-
rately. Time synchronisation also simpli-
fies the data analysis process to follow.
If using a camera at the study location,
all human observers should synchronise
their watches with the internal clock of
the video camera to make it easier to re-
trieve interesting behaviours during the
data analysis stage. You should also
verify that the camera is working
properly at the start of the study.
5.5 Presentation and interpretation
of results
Descriptive statistics are commonly
used to present the results of behav-
ioural observation studies (see Table
5-2 and Figure 5-1). These statistics in-
dicate the frequency of certain behav-
iours and are completed using the fol-
lowing information:
Identification of common road user
behaviours;
Identification of the situations and
circumstances in which the ob-
served behaviour takes place;
Characteristics of the road user ex-
hibiting the behaviour.
148 Part 2 | Chapter 5: Behavioural observation studies
Table 5-2: Descriptive analysis example of possible yielding events between cyclists and motor vehicles and the distribution of crossing directions (adopted from van Haperen, Daniels, & De Ceunynck, 2016).
Location “No crossing” events Interactions
Crossing direction Total
Total (#) Unnecessary yield (#) L R (#) L R (#)
C (Z) 4 3 58 59 117
C 103 54 [52%] 330 225 555
M (Z) 385 109 [28%] 397 145 542
M 2 2 116 36 152
Total (n) 494 168 901 465 1366
Note:
C (Z) = cyclist right-of-way (with zebra crossing); C = cyclist right-of-way (no zebra crossing); M (Z) = motor vehicle right-of-way (with zebra crossing); M = motor vehicle right-of-way (no zebra crossing);
L = left; R = right
Figure 5-1: Illustration of analysis of yielding behaviour between cyclists and motor vehicles (adopted
from van Haperen et al., 2018)
If using a before-and-after study design,
the following questions should be ad-
dressed:
Did the implemented measure result
in a reduction of the targeted behav-
iour?
Did the implemented measure lead
to the occurrence of other behav-
iours?
As mentioned earlier, the generalisabil-
ity of behavioural observation study re-
sults is an issue. Because road user be-
haviours are observed at specific loca-
tions, it is difficult to guarantee that the
observed behaviours also occur at other
locations where no behavioural studies
have been performed. Therefore, some
caution is required when interpreting re-
sults.
Part 2 | Chapter 5: Behavioural observation studies 149
5.6 Complementary studies
Behavioural observation studies are
usually complemented by other road
safety data collection methods to create
a comprehensive picture of the road
safety situation at a given location. The
study of Polders et al. (2015) is an ex-
ample of an integrated study in which
behavioural observations, traffic conflict
observations and driving simulator re-
search are combined to diagnose road
safety holistically. These complemen-
tary studies are described in greater de-
tail in the subsections below.
5.6.1 TRAFFIC COUNTS
The amount of cyclist, pedestrian and
other traffic correlates positively to the
number of encounters among the vari-
ous road users. Exposure is a useful ad-
dition of traffic safety analysis and is im-
portant when proposing safety counter-
measures. For more information regard-
ing the collection of traffic counts or ex-
posure data, consult the PIARC Road
Safety Manual (PIARC, 2003).
5.6.2 SPEED MEASUREMENTS
Vehicle speed plays a critical role in ac-
cident occurrence and injury outcomes.
As such, speed measurements can be
used as a background reference and di-
agnostic tool to conduct behavioural ob-
servation studies (e.g. identify locations
where VRUs might be at a higher acci-
dent risk due to fast-moving vehicles).
As speed is a major determinant of
VRUs’ risk of injury, studies seeking to
diagnose the safety of VRUs should al-
ways include speed measurements. Be-
havioural observation can then be ap-
plied to gain a better understanding of
the relevant road user behaviours and
their determining features at the speci-
fied location. For more information re-
garding the use of speed measure-
ments, consult the PIARC Road Safety
Manual (PIARC, 2003).
5.6.3 ACCIDENT DATA
Sometimes there is little accident data
available, or the available data lacks the
detail necessary to obtain a satisfactory
evaluation or diagnosis. In such cases,
behavioural observations can comple-
ment accident analyses to support the
action design and, where appropriate,
can even compensate for shortages of
information on accident-generating pro-
cesses (Muhlrad, 1993). The behav-
ioural items to observe and locations of
interest are determined primarily by the
150 Part 2 | Chapter 5: Behavioural observation studies
accident analysis findings. Often, behav-
ioural observations are used to verify the
findings of accident studies regarding
possible accident factors. For more in-
formation on the use of accident data,
consult CHAPTER 2 of this handbook.
5.6.4 TRAFFIC CONFLICT OBSERVATION STUDIES
Behavioural observation studies are of-
ten combined with traffic conflict studies
to cover diverse aspects of the road
safety situation of interest. Unstructured
behavioural observations are typically
additions to traffic conflict observation
studies. Interesting situations are identi-
fied and compiled when analysing con-
flict observation data. In this way, behav-
ioural observations add value to traffic
conflict studies by providing more insight
into the behavioural aspects and ele-
ments that affect traffic conflict occur-
rence. For more information on traffic
conflict observation studies, consult
CHAPTER 4 of this handbook.
5.6.5 DRIVING SIMULATOR STUDIES
A driving simulator consists of a mock-
up vehicle surrounded by screens dis-
playing a virtual road environment. Par-
ticipants in driving simulator studies nav-
igate the simulated road environment by
controlling the vehicle actuators (steer-
ing wheel, brake pedal, throttle, gears).
The simulators log detailed information
about the user’s driving behaviours and
performance parameters.
Driving simulators allow for the proactive
and detailed modelling of driving perfor-
mance. These studies provide insights
into how driver, vehicle and roadway
characteristics influence driving safety
and monitor how road safety improve-
ments or measures influence driver per-
formance (Boyle & Lee, 2010). Driver
awareness of and response to risky situ-
ations, near-accidents and even acci-
dents can be monitored in a simulator
(McGehee & Carsten, 2010). Simulator
studies also provide insights into the un-
derlying mechanisms of safety-critical
events (Boyle & Lee, 2010). Driving sim-
ulators have the potential to identify road
design problems, explore effective infra-
structural countermeasures, test ad-
vanced vehicle technologies and inves-
tigate a variety of driver impairments.
Consequently, they provide very rich in-
formation about road safety.
Driving simulators do not only focus on
the road safety of car and truck drivers.
Driving simulators for motorcyclists and
cyclists are also applied to assess the
road safety of VRUs. For more infor-
mation regarding driving simulator stud-
ies, consult Carsten and Jamson (2011)
and Fisher, Rizzo, Caird and Lee (2011).
Part 2 | Chapter 5: Behavioural observation studies 151
5.6.6 STATED PREFERENCE STUDIES
Interviews can aid the collection of infor-
mation from road users of a location of
interest and can provide data about
safety-related phenomena. Even brief
interviews with passing road users can
yield critical information about the site
that the observer might not have noticed
in a short period of time. As such, these
opinions form a solid basis for consecu-
tive behavioural observations. The main
reason for combining behavioural stud-
ies with stated preference studies is to
determine the extent to which self-re-
ported behaviours, attitudes, beliefs and
opinions resemble the observed behav-
iour (see Geller, Casali & Johnson,
1980; Hakkert, Zaidel & Sarelle, 1981).
5.7 Conclusions and key points
Behavioural observation studies have a
long history in the examination of road
user behaviour and road safety and are
still in common use today. These studies
are particularly useful when seeking to
diagnose road safety problems at spe-
cific locations or for specific target
groups in order to identify which target
groups and risk-increasing behaviours
require attention. Typical behaviours in a
behavioural observation study include
informal communication, yielding behav-
iours, crossing behaviours, looking be-
haviours, red-light running, speeding
and seatbelt use.
In the context of road safety evaluation
and diagnosis, behavioural observation
studies are used mainly to monitor the
frequency of road user behaviours, to
support findings from accident and traffic
conflict studies regarding possible acci-
dent factors and to evaluate the effects
of road safety countermeasures and
strategies. Observing road user behav-
iours in their natural settings is a valua-
ble method because it yields critical
knowledge about effective road user be-
haviour and provides a means to identify
and describe the determining features of
such behaviour.
Behavioural observation studies are de-
signed according to the specific behav-
iour and/or situation of interest, and as
such require a well-prepared study de-
sign, established protocols, extensive
observer training and adequate re-
sources to yield valid results. The two
most common methods to collect behav-
ioural observation data are on-site
trained human observers and video
cameras (or a combination). The main
remaining issue with these studies is the
generalisability (or lack thereof) of re-
sults. Because road user behaviour is
observed at a specific location, conclu-
sions that the behaviour will also occur
at locations not under study are difficult
to secure. To combat this limitation, be-
havioural observation studies are often
supported by other road safety data col-
lection methods (accident data, traffic
conflict observation studies, driving sim-
ulator research, speed and exposure
measurements) to compile a compre-
hensive picture of the road safety situa-
tion at a certain location.
152 Part 2 | Chapter 5: Behavioural observation studies
5.8 Recommended reading
Carsten, O., & Jamson, H. A. (2011). Driving simulators as research tools in traffic
psychology. In B. E. Porter (Ed.), Handbook of Traffic Psychology (2nd ed., pp. 87-
96). London, UK: Academic Press.
Eby, D. W. (2011). Naturalistic observational field techniques for traffic psychology
research. In B. E. Porter (Ed.), Handbook of Traffic Psychology (2nd ed., pp. 61-72).
London, UK: Academic Press.
Fisher, D. L., Rizzo, M., Caird, J. K., & Lee, J. D. (2011). Handbook of driving simu-
lation for engineering, medicine, and psychology. Boca Raton, USA: CRC Press -
Taylor & Francis Group.
Laureshyn, A. (2010). Application of automated video analysis to road user behaviour
(Doctoral dissertation, Bulletin 253). Lund Institute of Technology, Department of
Technology and Society Traffic Engineering, Lund, Sweden.
158 Part 2 | Chapter 6: Naturalistic cycling and walking studies
What will this chapter tell me?
What are naturalistic studies?
How can naturalistic studies be used to assess traffic safety?
Why should a naturalistic study be conducted?
How to carry out a naturalistic study?
What data are collected and how to analyse them.
6.1 Introduction to
naturalistic studies
Naturalistic studies are a method to con-
duct behavioural studies in transporta-
tion. The behaviour is observed dis-
cretely by the use of equipment to collect
behavioural information such as posi-
tion, speed, acceleration/deceleration
patterns, swerving and performed ma-
noeuvres. Furthermore, situational infor-
mation such as the road condition, the
presence of other road users and the
look of the surroundings can be col-
lected to describe all aspects of the trip.
In most naturalistic studies, the road
user is observed over a long time while
they travel in their own means of
transport during their daily trips, as they
would normally do. Although road users
are observed through a multitude of
equipment and are aware of it at first,
studies have shown that they tend to for-
get that any equipment is present after a
few days (Jørgensen, 2010, Lahrmann
et al. 2012). In practice, the equipment
will thus not influence the behaviour of
the road user.
What is a naturalistic study?
A method for the collection of continuous data (position, speed, acceleration, swerving, ma-noeuvres and video of surroundings) unobtrusively from the road users’ own means of transport during his/her daily travel to study road user behaviour.
Naturalistic studies make it possible to
collect a wide range of data to describe
all aspects of road users’ behaviour as it
is reflected in interaction with other road
users and the road environment. From a
traffic safety perspective, the collection
of continuous data in a naturalistic study
is particularly interesting, because it
makes it possible to collect data from
near-accidents and accidents and other
driving activities in its widest under-
standing while they occur. Because
events related to traffic safety are rela-
tively rare (Agerholm, Lahrmann 2012),
naturalistic studies often involve a large
number of road users and a long data
collection period, e.g. months or years,
Part 2 | Chapter 6: Naturalistic cycling and walking studies 159
which increases the probability of cap-
turing these events. In most studies so
far, it has been found that it is mainly an
identification of typical incidents rather
than sufficient incidents to enumerate
actual accident patterns that has been
documented. However, some of the
larger naturalistic studies such as the
American SHRP2 Naturalistic Driving
Study, but also some of the largest Field
Operational Tests (FOT) in Europe have
sufficient data collected for reliable acci-
dent statistical inputs (FOT-Net Data
2017, Virginia Tech Transportation Insti-
tute 2017). From large-scale naturalistic
studies with a high number of registered
accidents, the severity of registered in-
jured road user accidents can be com-
pared with other sorts of accident data
collection methods in order to verify if
there are any dark figures in the data.
This approach, however, requires addi-
tional data collection parallel to the natu-
ralistic studies. It could e.g. be self-re-
porting, although it faces the same limi-
tations as mentioned in CHAPTER 3
Data collected before, during and after
near-accidents and accidents contain
relevant information about the interplay
between the road user, the vehicle, the
road design and the environment, as
well as the interaction between road us-
ers involved in the situation. By observ-
ing and analysing data collected around
these events, an increased knowledge
about factor(s), which alone or together
result an accident or near-accident. Fur-
thermore, it is worth noting that most
tests of autonomous vehicles/driving
from levels 1–4 require substantial vol-
umes of data from a large range of
sources and fusion of these, and that in
many cases these data collections also
are/have been in connection with natu-
ralistic studies.
6.1.1 ADVANTAGES AND DISADVANTAGES
Naturalistic studies are a useful tool to
collect data about road user behaviour.
As opposed to behavioural studies,
which observe road users at a specific
location, behavioural information is col-
lected continuously in the naturalistic
study. It means that knowledge in natu-
ralistic studies is based on the behav-
iours of a sample of road users, but cov-
ering a wider part of the road infrastruc-
ture gives a coherent view on various in-
cidents under different conditions, com-
pared to covering all road users’ behav-
iour in one particular area or point. This
feature makes it possible to follow the
road user during entire trips, thus allow-
ing for an extensive insight into their be-
haviour under various conditions as well
as how it changes over time. Further-
more, it is possible to assess the behav-
iour of the individual road user across lo-
cations. An important feature of natural-
istic studies is that they reflect the actual
behaviour of the road users in the way
they act in traffic, with no instructions
and no intervention as regards to how,
where and when to travel. After installa-
tion, data are collected automatically
with no or limited need for human re-
sources. Thus there are virtually no limi-
tations on the duration of the data collec-
tion and it is possible to collect data over
several months or years. For example,
160 Part 2 | Chapter 6: Naturalistic cycling and walking studies
in SHRP2, video data have been col-
lected for more than one year per vehi-
cle. As data are collected continuously,
conflicts, near-accidents and accidents
will eventually be captured. Hence, such
data contains important information
about the behaviour and the surround-
ings in the moment before and during
any incident, and can contribute to a bet-
ter understanding of the causes of acci-
dents. In this respect, naturalistic studies
can also be a means to compensate for
the under-reporting of accidents in the
official statistics (Agerholm, Andersen
2015, Schepers et al. 2015), as all acci-
dents and near-accidents during the du-
ration of the study will be registered. A
more in-depth perspective on under-re-
porting is presented in CHAPTER 3
(Self-reporting of accidents and near-ac-
cidents). Naturalistic studies can be
used in combination with other tech-
niques. For instance, it can be combined
with self-reports to get insights into psy-
chological factors and behavioural as-
pects that are not measured by the sen-
sors used for data collection (e.g. fa-
tigue, stress and alcohol intake). Over-
all, the availability of coherent
knowledge of the recorded incidents is
an advantage and such reporting covers
virtually all types of road designs.
There are also some challenges from
using naturalistic studies. The data vol-
ume grows rapidly and the volume of
data will often be in terabyte (TB). In
case of especially naturalistic studies,
including those using different data
sources, e.g. video, radar and/or on-
board diagnostics (OBD-II)-based data
(from the car’s internal system) the vol-
ume of data can be extremely high. It
means either the vehicle in question
must have a large server capacity or a
high-speed 4G/Wi-Fi connection to other
server facilities. The requested sensors
depends on the data needed. Despite
the fact that a significant part of the data
types today can be collected by
smartphones, is it far from easy to make
different sensor types to provide data in
a readable format. This means that a
planned collection of a certain data type
in some cases can be much more diffi-
cult than expected due to lack of data
readability. Probably the most common
challenge of naturalistic studies is the
planned analyses of data. In the majority
of cases, the needed resources for anal-
yses has been either underestimated
manifold or used to compensate for
higher than expected operation cost. A
majority of the large naturalistic studies
based on Global Navigation Satellite
System (GNSS) data, video data or Li-
DAR/Radar data has faced the reality
that even several years after the finalisa-
tion of the project, hardly any of the
planned analyses have been conducted.
Privacy issues regarding the collected
data might make it difficult to use the da-
tasets, as with the new General Data
Protection Regulation (GDPR) of 2018
all persons’ behaviour recorded in one
way or the other has 1) to be sufficiently
anonymised and 2) be withdrawn from
the data sample on request of the single
user. The latter might sound trivial, but
with large data volumes, it is often a
challenging task to solve.
Part 2 | Chapter 6: Naturalistic cycling and walking studies 161
Why should I conduct naturalistic studies?
ADVANTAGES DISADVANTAGES
Continuous data collection Data volume is big
Reflects actual behaviour Time-consuming data analysis
Data collected virtually automatically Special equipment needed
Contains information about the time before and during near-accidents and accidents
Privacy issues
Compensates for under-reporting of accidents in official statistics
Can be used in combination with other data col-lection methods
6.2 When to conduct naturalistic
studies?
Naturalistic studies can be used to iden-
tify and assess factors related to driving
behaviour and traffic safety issues, and
used to identify hazardous road loca-
tions in situations where accident data
are insufficient, either because there are
too few accidents registered or because
there is a desire to assess other behav-
ioural aspects. In general, the method
can be used for:
Identification and assessment of
factors leading to near-accidents
and accidents;
Identification of hazardous road lo-
cations;
Evaluation of the effect of traffic
safety measures on road user be-
haviour;
Monitoring of general road user be-
haviour.
Naturalistic studies are well-suited to
identify and assess combination of driv-
ing behaviour and surroundings and
their combined effects on traffic safety.
As they collect data continuously, they
can also be used to assess accident
causation, i.e. which factors lead to the
occurrence of an accident. The same
applies for studies of near-accidents. Mi-
nor naturalistic studies can point out any
behaviour, which seems to increase ac-
cident or near-accident risk. Major natu-
ralistic studies can provide knowledge of
statistical correlations between driving
behaviour and surroundings in order to
identify specific activities and/or loca-
tions that increase accident risk to a rate
that is higher than expected.
In case of low registration rate of acci-
dents, identification of hazardous road
locations becomes uncertain. This is
due to the fact that the number of acci-
dents is small and might be random.
162 Part 2 | Chapter 6: Naturalistic cycling and walking studies
Large-scale naturalistic studies can con-
tribute to increasing the amount of data
so the most dangerous locations can be
identified. Specifically, motion data, e.g.
GNSS and video data, from a naturalistic
study can be analysed in order to identify
near-accidents and use as a supplement
to accident data. Similarly, other indica-
tors, e.g. speed patterns or data ob-
tained from the vehicle itself, can be
used to identify locations of interest.
The effect of traffic safety measures on
road user behaviour can be evaluated
via naturalistic studies. For instance, the
effect of campaigns, infrastructural mod-
ifications or regulation changes (e.g. to
reduce speed, seat belt use, red light
right turn) can be evaluated based mo-
tion patterns (e.g. speed), manoeuvres
(e.g. head turning, braking) or video to
assess if there has been a general effect
of the measure.
Finally, general road user behaviour can
be monitored based on the data col-
lected in a naturalistic study. With this in-
formation, the frequency of a particular
behaviour can be estimated, and trends
over time can be found.
Identification of hazardous road locations: an example
An Australian naturalistic cycling study (Johnson et al., 2014) collected data from 36 cyclists who were equipped with a video camera and a GPS data logger on their helmet to capture data. Over a period of four weeks, 8,986 km of cycling data were collected, corresponding to 466 hours.
The video footage was manually reviewed in order to identify interactions between cyclists and drivers, which were either accidents, near-accidents or incidents (i.e. events with a less sudden evasive manoeuvre). A total of 91 safety-critical interactions were identified; no colli-sions, 1 near-accident and 90 incidents. Many of those involved road users travelling in the same direction with the driver making a left turn in front of the cyclist, vehicles from an adja-cent road, and open vehicle doors.
GPS data was used to map trip routes and locations of identified safety-critical interactions. Although not performed in the study, the latter can for instance be used for the identification of hazardous road locations.
Assessment of factors leading to near-accidents: an example
In the German Naturalistic Cycling Study (Schleinitz et al., 2015b), 31 cyclists had their bicy-cles equipped with two video cameras on the handlebars—one filming the cyclist’s face, one filming forward—and a speed sensor on the front wheel. Data were collected for a period of four weeks. In total, data from 1,667 trips were collected, corresponding to 5,280 km or 372 hours. The video footage was reviewed manually in order to identify near-accidents.
A total of 77 near-accidents were found in the study. An assessment of the near-accidents showed that those between the cyclist and a motorised vehicle were often caused by the driver’s failure to yield the right of way to the cyclist. For instance, this occurred when right-turning vehicles crossed the bike path and apparently neglected to check for cyclists. In near-accidents between two cyclists, the near-accident was often a result of sudden and unex-pected manoeuvres by the other cyclist. In 45% of the near-accidents, one or both road users made traffic violations just before the near-accident occurred. The cyclists often used the wrong infrastructure (e.g. cycling on the pavement), failed to yield or cycled in the wrong direction. The opposing road user mainly failed to yield or left the parking space without sig-nalling.
Part 2 | Chapter 6: Naturalistic cycling and walking studies 163
Evaluation of traffic safety measures on behaviour: an example
In a study of motorcyclists (Smith et al., 2013), naturalistic riding data are collected from nov-ice and experienced motorcyclists to assess the effect of motorcycle rider training on the visual scanning patterns and the frequency of situations with stopping distances greater than the sight distance. Thirty-one motorcyclists completed the study by collecting data via eye trackers and a portable data acquisition system to measure the position, speed and orienta-tion of the motorcycle. In total, more than 30 hours of naturalistic riding data were collected during the study.
The results show that untrained novice riders more frequently than trained riders (novice and experienced) rode with stopping distances higher than the sight distance and that they do a visual scanning of a wider area than experienced riders.
Monitoring road user behaviour: an example
Based on the German Naturalistic Cycling Study (Schleinitz et al., 2015a) the speed behav-iour of cyclists using conventional bicycles and electrical bicycles (pedelecs: up to 25 km/h, S-pedelecs: up to 45 km/h) was compared. Ninety participants had their bicycles equipped with a speed sensor on the front wheel and two video cameras on the handlebar. The study lasted four weeks. A total of 4,327 trips were captured with a total mileage of 16,873 km.
Analysis of the speed data revealed that cyclists on S-pedelecs rode significantly longer trips than cyclists on pedelecs and conventional bicycles. The average speeds for conventional bicycles, pedelecs and S-pedelecs were 15.3, 17.4, and 24.5 km/h, respectively. Cyclists on S-pedelecs rode a considerable larger share of the total distance with speeds above 20, 25 and 30 km/h compared to the other cyclists. Furthermore, they accelerated faster than cyclists on conventional bicycles and pedelecs.
Video footage was manually reviewed to identify the type of infrastructure (e.g. carriageway, bicycle infrastructure, pavement) and free flow situations.
The actions of drivers: Between legal norms and practice
A naturalistic study with the aim to trace how legal norms are embedded in the legal con-sciousness of Danish drivers, and how this influences their driving practices was conducted by (Jørgensen 2010). By exploring how legal consciousness unfolds in dynamic processes, through the interpretation of everyday life activities, the research was based on a pragmatic hermeneutic approach. Thirty drivers were selected and interviewed. Ten of them participated in a naturalistic study with three cameras installed in their car. The aim was to differentiate analytically between three types of legal consciousness: pragmatic, ethical and rational.
Analysis of the video recordings indicates that the different types of legal consciousness ap-pear in practice as entwined in various ways. E.g. stopping at red lights is perceived by all those interviewed as the most natural thing to do. At the same time, it is perceived to be associated with the risk of harming others if this legal norm is disobeyed. When the practical legal consciousness is rule ethical and pragmatic, legal norms play a significant role in prac-tice. This manifests itself by drivers experiencing their own violations of this legal norm as frightening or shameful.
164 Part 2 | Chapter 6: Naturalistic cycling and walking studies
6.3 Methods for collecting
naturalistic traffic data
Data in a naturalistic study can be col-
lected in various ways depending on the
type of road user, the selected sensors
and the scope of the study.
For the data collection in naturalistic
studies, there are overall three types of
equipment: factory-installed, fixed and
portable. All these types can collect data
about the road user’s actions, the vehi-
cle and the surrounding environment but
differ in how the equipment is installed.
Factory-installed equipment means
equipment that is installed in the vehicle
before start using it. Traditional it has
been a range of sensors built-in to the
car and accessed via the OBD-II plug.
This plug gives access to a range of data
such as speed, acceleration, revolution,
and fuel consumption. Also, a range of
other data to diagnose the car is availa-
ble, but for car mechanics only. Increas-
ingly, cars are equipped with other sen-
sors, which can deliver data if accessi-
bility is given. It includes built-in naviga-
tion, and various advanced driver assis-
tance equipment as lane-keeping assis-
tance, following distance warnings and
adaptive cruise control. Data from these
are, however, hard to access for non-car
companies or car mechanics.
Fixed equipment is installed in/on the ve-
hicle as an aftermarket installation, e.g.,
it can be installed on the handlebar or in
the wheels of the bicycle, moped or mo-
torcycle. The equipment is powered by
the vehicle’s battery, via external batter-
ies that are installed together with the
equipment, by internal batteries in the
equipment or, potentially, via a dynamo.
Once installed, the position of the equip-
ment will remain the same. The ad-
vantages of this equipment are that the
data are collected in the same manner
and that information is only collected
when the particular vehicle is in use.
However, this method is not applicable
for pedestrian studies.
Portable equipment is carried by the
road user and can easily be removed. It
can be placed in different positions each
time, (prior it was often an independent
device, as e.g. GNSS unit, cameras or
Bluetooth readers. However, with the
rapidly increased volume of functions
and computer capacities of
smartphones, most portable equipment
is or will be substituted with smart
phone-based counterparts. The portable
device can be placed in pockets or a
backpack) but may also be worn in the
same position each time (e.g. smart-
watch on the wrist or video camera on
the helmet). The implication of this is that
the position is unknown and may change
from trip to trip, which complicates the
data analysis if the device is dependent
on acceleration pattern or slope. On the
other hand, this type of equipment is
usually lightweight, flexible and can be
used independent of the means of
transport, e.g. to collect data from the
participant both when cycling and walk-
ing.
In naturalistic studies of VRUs, the
weight and size of the equipment is im-
portant. Independent of the choice of in-
stallation, low weight and small size
Part 2 | Chapter 6: Naturalistic cycling and walking studies 165
should be ensured. In this respect, e.g.
smartphones are relevant since many
road users already carry a smartphone
while travelling and most new
smartphones have built-in sensors
which can be used for data collection
and cover a range of data types of rele-
vance.
Depending on the objectives of the
study, different sensor types can be
used for collecting data. The most com-
mon sensor types are:
Accelerometer;
Gyroscope;
GNSS logger;
Video camera;
Switches;
OBD-II with a range of data
types available;
Radar/LiDAR (laser scanner).
Accelerometers are used to collect infor-
mation about acceleration and decelera-
tion patterns of the road user. Usually,
the information is collected with a high
frequency i.e. several times each sec-
ond and in three directions (X, Y, and Z
axes). This information can be used in
traffic safety studies, e.g. to indicate if a
road user decelerates or swerves. Also,
it can be used to identify sudden
changes in the acceleration—so-called
jerks—which may indicate that the road
user has stopped quickly, e.g. due to an
accident. Furthermore it is useful as a
supplementing source of data, which
can improve the precision of GNSS po-
sitions in case of low or no access from
the GNSS devise to the sky.
Gyroscopes collect information about ro-
tation of the sensor based on how the
sensor is positioned. Similar to acceler-
ation, rotation is typically collected with
high frequency and in three directions
(X, Y, and Z axes). With this information,
one can register changes in the orienta-
tion of the vehicle or road user. For in-
stance, rotation can occur if the road
user falls or the vehicle tips over. As for
the accelerometer, it can be a supple-
menting source of data to improve the
precision of GNSS (GPS) positions, i.e.
dead reckoning.
GNSS loggers register the position of
the road user continuously. Hence, the
selected route of the road the user can
be recorded. The position can be used
to map where accidents and near-acci-
dents happen. GNSS data can also be
used to estimate the speed of the road
user. Furthermore, if the GNSS device is
programmed with Kalman filtering, it can
under some conditions work as a crude
accelerometer.
Video cameras are usually installed to
supplement motion data from other sen-
sors with video recordings of the sur-
roundings as well as of the road user.
For instance, one camera can point for-
ward to capture the surroundings while
another points on the road user to record
facial expressions and reactions or any
body language. In addition to the video
recordings, eye tracking devices can be
used to track where the road user has
directed their attention to and for how
long. It can be done in real time or in af-
ter analyses of video recordings. Addi-
tionally, cameras can be based on tradi-
tional video data and thermal video data.
Switches can be mounted on the vehicle
to register specific manoeuvres; turning
of the handlebar, pedal use, use of the
brake handles, etc. Switches can also be
mounted in the wheel to register the
speed of the vehicle.
Radar/LiDAR are most used for perma-
nent or long-term placement but can be
166 Part 2 | Chapter 6: Naturalistic cycling and walking studies
installed in cars. Both allows for 3-D reg-
istration of surroundings and absolute
and relative speed for moving elements
in the surroundings. Radar/LiDAR is an
essential part of the data collection of
autonomous vehicles on different levels
and will be wide-spread in many cars
concurrent with increasing automation.
6.4 How to conduct naturalistic
studies?
The decision on which technique should
be applied for data collection is based on
the objective of the study and the re-
sources available. If the most possible
data are required for an in-depth
knowledge about the processes leading
up to accidents or near-accidents, natu-
ralistic studies based on one or several
cameras and combined with other sen-
sors are suitable. Conversely, if the
study aims to clarify the surface quality
of a bicycle path network, an accelerom-
eter combined with a GNSS device
might result in the most valid selection of
sensor type. Additionally, some practical
considerations should be taken into ac-
count as part the planning of the study.
The costs of a naturalistic study are high
due to the need of special equipment
and the large data samples that need to
be collected. These data collection costs
have recently decreased due to the de-
velopment of smartphone-based sen-
sors. Despite this development, the data
analysis process remains labour-inten-
sive.
6.4.1 BEFORE
Which type of data to collect?
Depending on the objective of the study,
different types of data are interesting to
collect; position, acceleration, rotation,
speed, manoeuvres, video footage or
Radar/LiDAR of the road user and the
surroundings. In some cases, it is also
relevant to combine the naturalistic
study with other techniques to collect the
relevant data. For instance, self-report-
ing (e.g. questionnaires, trip diaries) can
provide information to supplement the
naturalistic data and cover the gaps left
by the selected data collection method.
Equipment
As the next step, it should be decided
whether the equipment for data collec-
tion should be factory installed, fixed on
the means of transport or portable. For
VRUs, the size and weight must be kept
low. Thus, power consumption of the
sensors should be considered to reduce
Part 2 | Chapter 6: Naturalistic cycling and walking studies 167
the need of large batteries. Also, if espe-
cially factory installed, but also to a cer-
tain degree fixed sensors are required, it
might affect the user group considera-
bly.
How many and which type of partici-pants?
Due to the need of equipment for data
collection and the costs related to this,
the number of participants in a natural-
istic study is often low. Many naturalistic
studies of VRUs have used up to 40 par-
ticipants, although some have been car-
ried out with more than 100 participants
and few with more than 1,000 partici-
pants (Madsen et al., 2016). Particularly
for safety studies aiming to register acci-
dents or near-accidents, the number of
participants should be high.
Permissions
Personal information is collected in a
naturalistic study. Thus, privacy issues
and especially GDPR and its new re-
quirements must be dealt with and the
necessary permissions granted (e.g.
from the national data protection
agency) before the study can start. Fur-
thermore, participants should be notified
about which personal information is col-
lected and how this information is stored
and treated and how they can request
their personal data deleted from the data
collection.
Recruitment
Participants for a naturalistic study are
mostly recruited from volunteers, e.g.
based on criteria regarding how often
they use a particular means of transport,
but also as a part of the available volume
of potential participants, which might be
quite low (Lahrmann et al. 2012, Lahr-
mann 2013). For instance, participants
can be recruited via network, interest or-
ganisations and media (social, news). It
should be noted that recruitment among
volunteers often implies that it is difficult
to obtain a representative sample, which
may influence the generalisability of re-
sults.
Installation of equipment
Before the study starts, all participants
should have equipment installed. Fixed
equipment should be mounted on each
vehicle and calibrated, if required. Port-
able equipment should be sent to partic-
ipants and instructions of how to use it
(e.g. how often batteries must be
charged) should be given. It is highly
recommended that the equipment is
tested by each participant before the
study start. In many cases the equip-
ment is non-existent, because it is
smartphone-based. In such cases, it
might be recommendable to have a sort
of hotline, as many apps can malfunction
depending on the operating system and
version.
168 Part 2 | Chapter 6: Naturalistic cycling and walking studies
Part 2 | Chapter 6: Naturalistic cycling and walking studies 169
6.6 Conclusions and key points
Naturalistic studies are used when the
aim is to observe road user behaviour
continuously and unobtrusively from the
road users’ point of view. Therefore,
data collected before and during near-
accidents and in some cases even acci-
dents can provide an in-depth know-
ledge of the factors contributing to these
incidents. Naturalistic studies can also
be used to evaluate the effect of traffic
safety measures on road user behaviour
and monitoring of road user behaviour.
Generally, data are collected via special
equipment such as:
Accelerometers;
Gyroscopes;
GPS loggers;
Video cameras;
Switches mounted on the vehicle;
OBD-II with a range of data types
available;
Radar/LiDAR (Laser scanner).
Based on the data collected from this
equipment, a large volume of infor-
mation can be extracted from the data
and used for the assessment of behav-
ioural and safety-related aspects. It is, in
this regard, important to remember, that
data analysis is often very time-consum-
ing. In studies of VRUs, the weight of the
equipment is an important factor and
should preferably be kept low.
A number of issues should be consid-
ered before deciding and conducting a
naturalistic study:
Resources (human and financial).
Which type of data to collect?
Which type of equipment is appro-
priate to collect data?
How many participants?
Permissions and GDPR
How to recruit participants?
Installation, operation and mainte-
nance of equipment.
Establishment of a hotline during
data collection.
6.7 Recommended reading
Winkelbauer, M., Eichhorn, A., Sagberg, F., & Backer-Grøndahl, A. (2010). Natu-
ralistic Driving. In J. Düh, H. Hufnagl, E. Juritsch, R. Pfliegl, H. Schimany & H. Schönegger (Eds.), Data and mobility: Transforming information into intelligent traf-fic and transportation services proceedings of the lakeside conference 2010 (pp. 163-176). Berlin, Heidelberg: Springer Berlin Heidelberg. doi.org/10.1007/978-3-642-15503-1_15
170 Part 2 | Chapter 6: Naturalistic cycling and walking studies
References Chapter 6
Agerholm, N., Lahrmann, H. (2015).Identification of Hazardous Road Locations on
the basis of floating car data: Method and first results. Road safety in a globalised and
more sustainable world - current issues and future challenges. Paper presented at the
Part 2 | Chapter 7: Site observations of traffic infrastructure 173
CHAPTER 7
Site
observations of
traffic infrastructure
The Star Rating protocol of the iRAP/Eu-
roRAP programme is complementary to
Road Safety Audits/Inspections in the
sense that it provides a quick assess-
ment of the general risk standard of a
road whereas Road Safety Audits/In-
spections focus on identifying detailed
safety deficiencies EuroRAP, 2018;
iRAP, 2018). The focus of this chapter
lies on the latter. Therefore, this chapter
focuses on Road Safety Inspections
(RSI). An overview of tools of the Euro-
RAP/iRAP programme can be consulted
in section 2.4.3 of CHAPTER 2. Some
references to Road Safety Audits (RSA)
will be made in order to expound the dif-
ferences and similarities between RSI
and RSA. It will be based on a literature
review (general description and defini-
tions) and some examples of the
RSI/RSA.
Both RSI and RSA aim to reduce road
accidents by analysing road infrastruc-
ture elements that could influence acci-
dent risk. These techniques allow the
mapping of the risks of accidents across
the entire European road network, which
allows a comparison of the safety levels
of roads across Europe. Within these
techniques accident patterns on new
174 Part 2 | Chapter 7: Site observations of traffic infrastructure
and existing roads are studied. Addition-
ally, the self-explaining and forgiving
character of the roads are evaluated by
assessing the crash-friendliness of the
road infrastructure elements. In this re-
spect, both techniques assist in reducing
fatal and serious injuries among road us-
ers as it is highly recognised that the
self-explaining and forgiving roads con-
cepts assist in reducing injury severity.
The difference between inspection and
audit is related to the phase in which the
infrastructure is found. RSI are per-
formed if the road is already build and
opened to traffic for a time period suffi-
cient for accidents to have been regis-
tered. On the contrary, RSA are per-
formed for roads in the preliminary
stages before opening to traffic. This in-
cludes the phases from planning to con-
struction (and also the first months with
traffic). Therefore, one determinant that
must be taken into account is that for
RSI we have accidents to analyse, and
for RSA we analyse only the infrastruc-
ture without accidents. The European
Directive 2008/96/EC (European Parlia-
ment & European Council, 2008) defines
an RSI as ‘an ordinary periodic assess-
ment of a road’s features and deficien-
cies which from a road safety perspec-
tive make maintenance necessary’ (see
section 7.1).
Road safety audits and inspections were
introduced in road safety management
by the European Traffic Safety Council
on behalf of the European Commission.
The council produced the report ‘Road
Safety Audit and Safety Impact Assess-
ment’ in 1997. The report focused on the
benefits of RSA and recommended all
Member States to introduce the tool. Be-
fore that, there had been a progressive
shift in road safety management thinking
and practices in high-income countries.
Four main development phases for road
safety management can be considered,
progressively increasing the ambitions
in terms of results (OECD, 2008):
From the 1950s to the 1960s the fo-
cus was on driver interventions – for
example, focusing on rules, penal-
ties, education and training.
From the 1970s to the 1980s the fo-
cus was on system-wide interven-
tions – for example, focusing on in-
frastructure, vehicles and users in
the pre-crash, in-crash and post-
crash phases.
In the early 90s, the focus was on
system-wide interventions, targeted
results and institutional leadership.
From the late 90s onward, the focus
has been on system-wide interven-
tions, long-term elimination of
deaths and serious injuries and
shared responsibility.
The objective of this chapter is to identify
the key elements that help to assess and
treat the risk, focused on vulnerable road
users (VRUs).According to the World
Road Association, RSA and RSI are pro-
active approaches that can be applied to
avoid future accidents by (PIARC,
2015):
Ensuring that the safest road design
scheme is selected for construction;
Checking that the proposed road in-
frastructure or feature is designed
and built to minimise the occurrence
of road safety problems; and
Treating safety issues on existing
road networks before accidents oc-
cur at these locations.
It is generally accepted that RSI are per-
formed on existing roads, and RSA are
performed during the design process.
Part 2 | Chapter 7: Site observations of traffic infrastructure 175
However, some countries refer to both
for similar processes.
Figure 7-1: Sequence of road safety checks during the design stages (PIARC, 2011 and PIARC, 2015)
7.1 European Directive on road in-
frastructure safety management
In recent years, the palliative road safety
policies that have traditionally been ap-
plied by all road administrations have
been accompanied by preventive road
safety measures. These preventive
measures aim to address potential road
safety problems before accidents occur.
Within this framework, RSAs are estab-
lished in Europe as one of the most use-
ful tools to improve road safety.
The European Union already addressed
the need to implement RSAs and other
preventive tools for new and existing
roads in a systematic way, in their third
Road Safety Action Plan covering the
period between 2002 and 2010. How-
ever, the true step forward took place
with Directive 2008/96/EC of the Euro-
pean Parliament and of the Council on
Road Infrastructure Safety Management
that was issued on 19 November 2008.
The rationale behind this Directive im-
plies that road safety infrastructure man-
agement offers a wide margin of im-
provement. Directive 2008/96/EC has
recently been amended by a proposal of
the European Commission and Euro-
pean Council (European Commission
and European Council, 2018). This pro-
posal sets out that VRUs and their road
safety needs should be mandatory and
176 Part 2 | Chapter 7: Site observations of traffic infrastructure
systematically taken into account in all
road safety management procedures.
Establishing adequate management
procedures is an essential tool to im-
prove the safety of road infrastructure.
Thus, the Directive "requires the estab-
lishment and application of procedures
related to road safety impact assess-
ments, RSAs, road network safety man-
agement and safety inspections by
Members States" (European Parliament
& European Council, 2008):
Road safety impact assessments
have to show what the implications
of different planning alternatives for
an infrastructure project are at a
strategic level. It constitutes the
comparative strategic analysis of the
impact of a new road or the substan-
tial modification of an existing road.
RSAs should determine in detail the
risk elements of an infrastructure
project, that is, the verification of the
safety of a road infrastructure pro-
ject from the planning phase to the
initial exploitation phase.
Safety management of the road net-
work in operation aims to increase
the safety level of the existing roads
by investing specifically those sec-
tions where there is a greater con-
centration of accidents or a greater
potential for reducing them.
To determine road sections with a
high concentration of accidents; the
number of fatal accidents per unit of
road length in relation to the traffic
volume must be taken into account.
This also applies to intersections.
Next, the road sections will be clas-
sified into categories. For each road
category, the classification of net-
work safety will be translated into
priority lists of road sections in which
an improvement of the infrastructure
is expected to be highly effective.
It must be ensured that teams of ex-
perts evaluate the sections with the
highest priority through site visits.
Furthermore, corrective actions
should be directed at the road sec-
tions with the highest rate of return.
The classification of network safety
presents great potential in the period
immediately after application. Once
the road sections with a high con-
centration of accidents have been
treated and the appropriate correc-
tive measures have been adopted,
safety inspections should acquire an
important role as preventive actions.
Periodic inspections are an essen-
tial tool for preventing potential dan-
gers that threaten all road users, in-
cluding VRUs.
The Directive includes the need to carry
out safety inspections on roads in oper-
ation as a means to identify road safety
characteristics and prevent accidents
(European Parliament & European
Council, 2008). RSIs include periodic in-
spections of the road network and safety
checks of the traffic flow. Such inspec-
tions are carried out frequently enough
to ensure an adequate level of safety.
Furthermore it is important to clarify that,
when referring to the different proce-
dures of road safety management, the
Directive reserves the concept of audit,
in a strict sense, to the "verification of a
road infrastructure project, applied to the
different phases from the planning to the
exploitation in its initial phase" (Euro-
pean Parliament & European Council,
2008). It refers to other terminology such
as the impact assessment when it fo-
cuses on new construction projects
Part 2 | Chapter 7: Site observations of traffic infrastructure 177
(planning) or when it refers to the verifi-
cation of existing roads (safety ranking
and management of the road network in
operation and safety inspections).
In this light, it can be assumed that there
are different management levels to
which the different strategies corre-
spond according to the different causes
of the problem and the possible solu-
tions.
Finally, the Directive "will apply to all
roads in the Trans-European Road Net-
work (TERN), regardless of whether
they are in the design, construction or
operation phase" (European Parliament
& European Council, 2008). Additionally,
it is included that "Member States may
apply the provisions of the Directive, as
a set of good practices, also for the na-
tional road transport infrastructure, not
included in the TERN, which has been
built through the resource total or partial
community funds" (European Parliament
& European Council, 2008). Therefore,
although in its literal meaning, the Di-
rective is limited to the integral roads of
the Trans-European Road Network, the
regulation enables, and in some way
recommends, its application to the rest
of the road network.
7.2 Basic concepts in RSA/RSI
RSA and RSI are procedures to test the
safety level of the road infrastructure.
RSA test the design of new roads or the
reconstruction of existing roads,
whereas the RSI are implemented for
testing existing roads (SWOV, 2012). An
RSA, therefore, aims to improve road
safety before the road is built or recon-
structed (SWOV, 2012).
RSI also contribute to road safety, alt-
hough in Directive 2008/96/EC they may
give them a more limited purpose than
they may have. An RSI can be carried
out periodically on an entire network but
also on road sections that have an
above-average number of accidents
(SWOV, 2012). Currently, no standard-
ized procedure exists for RSIs whereas
standardisation is desirable for a more
systematic use of this assessment
method (SWOV, 2012).
Most practices agree on certain similar
characteristics of RSIs:
An RSI is systematic: it will be car-
ried out in a methodical way follow-
ing a formal procedure.
An RSI is proactive: safety deficien-
cies are to be identified for remedial
actions in order to prevent acci-
dents.
An RSI is performed on existing in-
frastructures.
An RSI identifies potential safety
hazards for each road user perspec-
tive.
An RSI should be performed by a
qualified and independent profes-
sional team.
As a critical thought, RSAs are based on
predictions, because new roads are de-
signed according to a regulation from
178 Part 2 | Chapter 7: Site observations of traffic infrastructure
which it is expected to result in adequate
safety levels. For existing roads, it is not
always the adaptation to the regulations
that provides safety but the improve-
ment of the issues detected. Therefore,
many people believe that certainties
should always have priority over fore-
casts, no matter how sophisticated the
measurement methods or prediction
models are.
7.3 Actors in the RSA/RSI
A qualified team carries out the inspection or audit. This team must fulfil the following
requirements (European Parliament & European Council, 2008 and Austroads, 2009):
7.3.1 SKILLS
It is essential that RSAs or RSIs are con-
ducted by an experienced team in road
safety engineering. This means that the
team should be familiar with traffic engi-
neering and management, road design
and construction techniques and road
user behaviour. The team should be
transversal in an organisational sense,
this means that the team is able to cut
across multiple functions or elements of
the RSA or RSI.
It is convenient that the team members
have different skills and experience so
they analyse the road project from sev-
eral points of view. It is crucial that RSAs
and RSIs are performed from all road
user perspectives.
7.3.2 EXPERIENCE
The auditor team should consist of mem-
bers with adequate road safety engi-
neering experience. There should be
one team leader with road safety experi-
ence and training, named the Senior
Road Safety Auditor.
A Senior Road Safety Auditor has:
Successfully completed a recog-
nised audit training course. Each
country should organise audit
courses to train road safety profes-
sionals to become road safety audi-
tors;
At least five years of experience in a
relevant road design, road construc-
tion or traffic engineering field (this is
a minimum that the Directive re-
quires, it is generally considered that
team leaders for audits of more
Part 2 | Chapter 7: Site observations of traffic infrastructure 179
complicated projects should have
significantly more experience);
Undertaken at least five formal
RSAs, including at least three at de-
sign stages; and
Kept his/her professional experi-
ence updated by undertaking at
least one audit per year.
The expert criteria of the auditors should
be based on an in-depth knowledge of
the principles of road design, of the risk
factors according to the context and of
the safety elements of the road infra-
structure.
7.3.3 INDEPENDENCE AND SUBJECTIVITY
The inspection team must be different
and independent from the conservation
and exploitation team.
If the road safety auditor is independent,
the project is critically assessed. Even
though, RSI is a process included in the
field of exploitation of the road in which
the people responsible for conservation
and exploitation of the inspected section
contribute and offer added value. There-
fore, communication between the par-
ties must be established and maintained
if the audit is to be done effectively and
without wasted time and effort.
Auditors need to be objective in their as-
sessments and consider all road users
(pedestrians, bicyclists, public transport
users, powered two-wheeler drivers,
truck and bus drivers, etc.). They have to
avoid just analysing the roads from the
car-driver perspective. Designers and
clients need to consider audit recom-
mendations objectively and gain from
the experience.
7.3.4 NUMBER OF AUDITORS
The road safety audit team should at
least consist of two experienced and
qualified professionals. The benefits of
having a multi-member audit team, ra-
ther than a single person, include (Aus-
troads, 2009):
The diverse backgrounds and differ-
ent approaches of different people;
The cross-fertilisation of ideas which
can result from discussions; and
Having more pairs of eyes in order
to successfully assess all the defi-
ciencies.
The road management institution desig-
nates the auditors that are part of the au-
dit team. If needed, the team will also in-
clude technical specialists.
180 Part 2 | Chapter 7: Site observations of traffic infrastructure
7.4 A step-by-step guide
for inspections and audits
A RSA or RSI is a relatively straightfor-
ward process. The steps in the process
are illustrated in the flow chart in Figure
7-2. In some organisational structures,
and for some minor projects, some of the
steps may be brief, but the sequence of
steps will still apply. The steps apply
equally to design-stage audits and other
audits.
Figure 7-2: Audit process (based on European Parliament & European Council, 2008 and Austroads,
2009)
Each step of the process should be con-
sidered in every RSA or RSI regardless
of the nature or scale of a particular in-
frastructure project. This means that
even when a small-scale audit needs to
be performed, is important to select the
expert team carefully, collect all the
available information, organise meetings
and write the audit/inspection report.
However, the number of meetings or the
length of the report increases with the
complexity of the project.
Part 2 | Chapter 7: Site observations of traffic infrastructure 181
7.4.1 PREPARATION WORK IN THE OFFICE
Basic material
The audit team must have all the infor-
mation necessary to carry out the audit
or inspection. This includes documenta-
tion related to the project, legal docu-
mentation, internal information regard-
ing traffic volumes, accidents, any road
safety study or investigation carried out
in the area of influence or that may be of
interest for the case. The audit team
must also know if a previous RSA was
conducted and should have access to
these results.
The documentation related to the project
must include a set of drawings with
enough detail to be able to analyse the
vertical and horizontal alignment and
other items relevant at the particular
phase of the audit. When the audit is
conducted in the planning stage, the lay-
out of the road plans are essential. At
detailed design and pre-opening stages,
signage, line-marking and street lighting
plans are more important. It is also nec-
essary that the audit team has infor-
mation not only from the project area but
also from the surrounding area that the
project may affect. The delivered infor-
mation must be digital, compatible and
editable. The plans must allow measure-
ments.
Site data also needs to be considered,
such as any environmental effects rele-
vant to the location or the design – for
example, weather conditions (ice, fog,
snow, etc.), animals, services, historic
buildings, special road users, factories
and topography. Data related to traffic
volumes should also be delivered to the
audit team, including data from VRUs if
known.
The analyses of available information
must be done rigorously and, when use-
ful, on the ground, before and after each
inspection.
Simple accident study
Once the inspection team has the basic
material, it is important to study the reg-
istered accidents.
When considering the accident situation
on a road section, it is important to think
proactively, that is, not just focusing on
what has happened but also on antici-
pating what can happen in the future.
One should be focused on previous ac-
cidents on the road section in order to
identify the hazard points in the road. In-
spectors should also gain a rough over-
view of the accident situation along the
section. Past occurrences give as infor-
mation about the actual road situation,
but inspectors should not overlook other
hazardous conditions that may affect
general road safety.
It is the general accident picture of the
section that should be focused on but al-
ways based on the locations where the
individual accidents have occurred. This
is achieved through a simple accident
study. Which accident types dominated
on the section and which have resulted
in serious injury should be revealed.
Moreover, it would be appropriate to
check if there are other factors that typify
the accident picture, such as the time of
the year, time of the day, etc.
The accident study must reveal the type
of road users that were injured in the
section. In this respect, inspectors must
know if there is any safety problem re-
garding VRUs.
182 Part 2 | Chapter 7: Site observations of traffic infrastructure
Inspectors should also look at the previ-
ous black-spot reports and check if there
is any black-spot or zone in the analysed
road section.
It is recommended to carry out the acci-
dent study before the inspection is com-
pleted and to check whether the acci-
dent picture confirms the hazard loca-
tions in the road section.
In accident studies, it is very interesting
that the audit team is consists of experts
in road safety, traffic management and
road design. The number of accidents,
the typology of the most frequent acci-
dents, the traffic conditions, the traffic
volumes, the capacity of the road and
congestion are already known in RSIs.
Therefore, it is important that the audi-
tors have extensive knowledge of acci-
dent characteristics of different road
types, specific knowledge of accident re-
construction, the ability to relate the
identified problems with possible solu-
tions and knowledge about the needs of
all road users that use the road section
– including pedestrians, cyclists, motor-
ists, light-vehicles users and heavy-vehi-
cles users.
7.4.2 ON-SITE FIELD STUDY
It is essential for the RSI team to visit the
site in daylight to identify any problems
relating to the present configuration and,
if appropriate, to visualise the future pro-
posals and their effects. In addition, it is
a good practice to visit the road at night-
time. Aspects related to luminosity and
reflectivity can be better analysed with-
out daylight. The audit team should care-
fully select the most effective periods to
inspect the site as traffic conditions can
vary throughout the day or week.
A night-time inspection is also essential
except where, in the experience of the
client, there will be nothing additional to
observe. However, these circumstances
should be rare. The visual information
available to road users can be markedly
different at night-time, and it can be sur-
prising what additional issues can be
identified on a night-time inspection,
even where work has not yet com-
menced.
When the audit team is on site, they
must look beyond the limits of the design
plans (or the limits of works at the pre-
opening stage): the inspection should in-
clude the adjacent road sections.
Transition or terminal zones, where the
new (and usually higher standard) road
transitions into the existing road system
can often be locations of greater hazard
as
Road layouts and devices which
previously operated safely can fail to
do so once traffic volumes, speeds
or movements alter; and
Motorcyclists may be unaware of the
need to adjust their behaviour.
In addition, new roads or new traffic ar-
rangements can often disrupt existing
traffic and pedestrian movement pat-
terns.
The inspection should be undertaken
from the point of view of all the likely
Part 2 | Chapter 7: Site observations of traffic infrastructure 183
road user groups and not just motorists.
Young and elderly pedestrians, truck
drivers, cyclists, elderly and disabled
drivers have quite different safety needs.
Child pedestrians have a lower eye-
height to observe vehicles. Being
small, they can be easily out of the
field of vision of a car driver. Moreo-
ver, they can act impulsively.
Elderly pedestrians may be less ag-
ile, have poorer sight or hearing or
may have a poorer ability in judging
gaps and the speed of traffic.
Truck drivers have a higher eye-
height, but this can lead to delinea-
tion issues, and their visibility can be
more easily affected by overhanging
foliage. Their vehicles take longer to
stop and start moving, they are
wider and blind spots can be a prob-
lem.
Cyclists are more seriously affected
by surface conditions (for example,
grates, potholes and gravel) and
gradients.
Elderly drivers may be less able to
recognise certain traffic control fea-
tures or judge gaps due to cognitive
difficulties.
People with disabilities can be af-
fected by poor eyesight, poor hear-
ing or difficulties moving around ob-
jects, moving near edges, moving
between levels or moving at typical
pedestrian speeds.
Motorcyclists have rapid accelera-
tion but are susceptible to poor
pavement conditions and ‘squeeze
points’, such as when the road turns
from two lanes to one lane.
Consider how well the design caters for
the different types of movements, such
as crossing the road and entering the
traffic stream or leaving it as well as for
travelling along the road. Consider these
for the different user groups and the ef-
fects of different weather conditions.
Taking photographs or videotapes al-
lows for later reference and possible in-
clusion in the report, but such materials
must not be used as a substitute for a
site inspection: all audit team members
should inspect the site.
7.4.3 RSI REPORT WRITING
The main focus of the RSI report is to
describe the aspects of the project that
involve safety risk and make recommen-
dations about corrective actions. The
recommendations will usually indicate
the nature or direction of a solution ra-
ther than precise details. The report pro-
vides the formal documentation on
which decisions about corrective actions
will be based.
A positive element of the design that im-
proves safety can be mentioned in a
RSA or RSI report, but it is not neces-
sary to mention them. The purpose of
the report is not to rate the design but
rather to address any road safety con-
cerns.
184 Part 2 | Chapter 7: Site observations of traffic infrastructure
In some cases, safety problems may be
identified but a recommendation may
not come to mind. In this case, the safety
issue should not be ignored: simply rec-
ord the finding (i.e. the safety concern),
and write ‘Investigate treatment and im-
plement it’ under the item ‘Recommen-
dation’’.
There is no unique procedure of ordering
findings and recommendations in a RSI
report, but the most important consider-
ation is that the order needs to be logical
and helpful for the report’s recipients
when they study the road to implement
road safety measures. For example, in
the situation of different intersections
and ramps, where the identified prob-
lems are related to four elements – align-
ment, cross section, delineation and vis-
ibility – it may be better to define each
site separately rather than write about
each design element from the different
sites. On the contrary, for long road sec-
tion projects, it may be more appropriate
to divide the project into sections. In any
case, recommendations for similar
safety problems related to different road
sections of the project should be cross-
referenced in the report. The usual way
to order safety problems if they are not
related is by significance and risk, start-
ing with the critical ones and finalising
with the slight ones.
7.4.4 REMEDIAL MEASURES AND FOLLOW-UP
Recommendations included in RSA and
RSI should be based where possible on
proven collision reduction techniques,
and the road safety inspectors should
have experience in this area. The expe-
rience gained in proposing appropriate
remedial measures provides the Road
Safety Auditor with the skills needed to
identify solutions most likely to be effec-
tive in addressing the specific risks iden-
tified. These include monitoring the site
to identify the success of the remedial
measures and building up control data
from similar sites. Road Safety Auditors
should also be aware of the issues that
are known to affect the road safety of all
road users.
Any safety issue that is considered to be
of sufficient hazard to warrant immediate
attention for removal, protection or warn-
ing should be identified in the recom-
mendations with the words ‘URGENT’.
Similarly, any safety problem which the
auditor considers as great potential dan-
ger can be identified as ‘IMPORTANT’.
These two categories are not mutually
exclusive. Their use does not imply that
other identified problems are not im-
portant.
To maintain good communication with
the designer, the auditor should endeav-
our to resolve any uncertainties or mis-
understandings by talking with the de-
signer before drawing conclusions.
However, the auditor is independent and
should not, for example, be required to
provide a draft of the RSA report to the
client or designer. Depending on the pro-
ject type, the findings and recommenda-
tions of the audit may be written in ‘prose
style’ or in a tabular format. A tabular for-
mat has the advantage that it can be
used directly by the client to create a ta-
ble of corrective action responses.
Part 2 | Chapter 7: Site observations of traffic infrastructure 185
7.5 Road safety incidences
templates
For a better performance of the on-site
field study works, the use of templates is
recommended. The templates can be
useful for the audit team and used as a
checklist guide in order to follow a formal
process in each inspection. The road
safety incidences templates must con-
sider six sections, as follows:
7.5.1 GENERAL DATA
Table 7-1: General data from road safety audit/inspection template (Catalan Government (2017) and NPRA (2014))
Form code 1 Number of forms in a same section 2
Incidence title 3
Incidence family 4 Incidence group 5
Involves vulnerable users? 6
Pedestrians Cyclists Motorcyclists Other
Location of incidence 7
Date created 8
Date updated 9
Audit type 10 Code Author 11
Notes
186 Part 2 | Chapter 7: Site observations of traffic infrastructure
1 Form code: code of the form 2 Number form: correlated number of forms of incidences in a same stretch 3 Incidence title: brief description of the incidence detected 4 Family incidence: general elements / functional elements / pending 5 Group of incidence: according to the table of families of incidences 6 Involves vulnerable users? whether the incidence detected involves potentially vulnera-
ble users: pedestrians, cyclists, motorcyclists, other 7 Type of incidence: general / punctual / stretch / pending 8 Creation date: date of initial creation of the first card 9 Update date: date of the last update of the card 10 Audit type:
- RSA: Road Safety Audit (design and construction)
- RSI: Road Safety Inspection (operation) 11 Author: name of the component of the inspection team that has filled in the form
7.5.2 LOCATION
Table 7-2: Location data from road safety audit/inspection template (Catalan Government (2017) and NPRA (2014))
Road / street 1 Direction 2
Initial km 3 Final km 4
UTM initial x 5 UTM final x 6
UTM initial y 5 UTM final y 6
Notes
1 Road/street: code of the road or name of the street 2 Direction: ascending / descending / not applicable 3 Initial km: indicates the kilometre and hectometre separate (example: 12+550) 4 Final km: indicates the kilometre and hectometre separate (example: 12+550) 5 UTM Initial: indicates the coordinates X and Y in UTM of the initial point of the incidence 6 UTM Final: indicates the coordinates X and Y in UTM of the final point of the incidence
Part 2 | Chapter 7: Site observations of traffic infrastructure 187
7.5.3 ANALYSIS
Table 7-3: Incident analysis from road safety audit/inspection template (Catalan Government (2017) and NPRA (2014))
Incidence description 1
Level of risk 2
Risk justification 3
Consequences of the ac-cident 4
1 Incidence description: analysis of the incidence detected 2 Level of risk: normal / low / medium / high
The level of risk will be defined by the inspectors analysing the data on traffic, speed of
route, outline, quality of equipment, etc. This value is related to the probability that an
accident will happen. There are four categories of risk:
Normal low risk
Low half risk or no significant risk
Medium high or significant risk
High top risk 3 Risk justification: brief description of the risk that supposes the incidence detected and
justification of its level of risk. 4 Consequences of the accident: slight / severe / very severe
This identifies the type of accident that could occur and the consequences of this accident.
Evaluation of the incidence: determination of the level of incidence, I/II/III/IV/V. The level
of incidence will be determined in a standard way following Table 7-4, combining the two
previous concepts of establishing the four levels of risk – normal/low/medium/high – and
the five levels of incidence – I/II/III/IV/V. The highest incidence corresponds to grade I and
the lowest incidence corresponds to grade V.
Table 7-4: Determination of the level of incidence when completing the template (Catalan Government (2017) and NPRA (2014))
Level of incidence Consequences of the accident
Slight Severe Very severe
Level of risk
Normal V IV IV
Low V III III
Medium IV III II
High III II I
188 Part 2 | Chapter 7: Site observations of traffic infrastructure
7.5.4 PHOTO AND MAP/AERIAL PHOTO
Photos, maps and/or aerial photos are necessary to better define the incidences de-
tected.
7.5.5 ADDITIONAL DOCUMENTS
Additional photos, documents, schemes, etc. can be included.
7.5.6 IDENTIFICATION CODE
The incidences are identified according to a specific functional coding based on the following classification of family and group:
General elements of road security include ergonomics, coherence, readability, visibility, user expecta-tions, perception of the risk, speed, exploitation, typology of users and other general elements of road se-curity. In this group we find inci-dences such as traffic signals ob-structed by urban vegetation, con-tradictory traffic signals, a pedes-trian crossing too far from the inter-section, a pedestrian crossing ob-structed by other urban elements, a lack of secure zones for pedestrians
in an intersection, excessive road space for motor vehicles with re-spect to VRUs, etc.
Functional elements of road se-curity include layout, cross section, pavement and drainage capacity, signage, markings, containment systems, intersections, roundabouts and links, access points, special sections, security elements for other users, rest areas, obsolete sections and other functional elements of road security. In this group we find incidences such as cracks in pave-ment, floods due to drain system failure, erased marks, lack of space for handicapped users, etc.
Part 2 | Chapter 7: Site observations of traffic infrastructure 189
7.6 Checklists
Checklists are developed to facilitate the
realisation of RSA and RSI in all stages.
The aim of these checklists is to provide
inspectors a support to be consulted so
that no road safety aspect is overlooked.
Checklists establish a relation between
aspects that must be checked at each
stage.
Although the checklists can facilitate the
preparation of the audit, this cannot be
limited to a routine check of the points
reflected in the lists; it is essential that for
each specific case the team in charge
applies their criteria and their experience
to detect the problems. The checklists
are just another tool for the audit team.
In this sense, the audit reports should in-
clude in the body of the document the re-
view of the general aspects that are in-
cluded in them.
7.6.1 WHEN DO WE USE CHECKLISTS?
The checklists as a tool should be used
in the RSA of road projects in the design,
construction and operation stages (in
the pre-opening phase) and in the RSI in
full-operation roads, as appropriate. For
this, the specialist who applies the
checklist must have experience in RSAs
and must establish, according to their
criteria, the total or partial applicability of
them since it depends to a large extent
on the characteristics of the project to
audit the aspects considered in them.
The application of the checklists must be
in homogeneous sections, for which the
division of the sections or intersections
to be applied must be defined in ad-
vance. Subsequently, each question
must be answered by noting georefer-
enced information and making all the an-
notations that are considered permanent
and that allow the full identification each
of the elements of the infrastructure that
have been evaluated.
It is recommended not to include the
checklists in the audit report. However,
the obligation to include them as an-
nexes to the report depends on the con-
tracting entity.
7.6.2 HOW DO WE USE CHECKLISTS?
In the stage of the development of an
RSA or RSI, the audit team must per-
form a review of the primary and second-
ary information available, with the pur-
pose of defining the aspects to be eval-
uated and in this way define and con-
struct the checklists.
190 Part 2 | Chapter 7: Site observations of traffic infrastructure
The checklists can be structured as gen-
eral or specific. The general lists contain
the broad aspects to be considered, for
which it is recommended that the audit
team define the topics that should be in-
corporated in the audit according to the
characteristics of the project to be eval-
uated and depending on the phase in
which the RSA/RSI will be performed. In
the same way, special aspects of the
project must be identified and not listed
in the formats presented in the manual.
The specific checklists contain in detail
each of the aspects to be evaluated, dis-
aggregating the content established in
the general checklist, in order to identify
the findings that affect the road safety of
the evaluated project. In the specific
checklists the magnitude and the risk of
the deficiency are normally assessed.
The magnitude refers to the grade of the
deficiency, and it is normally ranked in
three levels (very bad, bad and me-
dium). For example, we can find a dete-
riorated pedestrian crossing, but this de-
terioration can be ranked to give an idea
of the actual condition of the pedestrian
crossing. The risk refers to the impact
that deficiencies have on users’ safety,
and it is ranked in four levels (continu-
ous, frequent, sometimes and sporadic).
Given that the format presented in this
handbook is general, the audit team
should adjust their formats to allow them
to record as much information as possi-
ble for each of the items or aspects eval-
uated.
7.6.3 ASPECTS TO BE ANALYSED
The audit team must carry out an evalu-
ation of the key aspects that the check-
lists consider from the point of view of
road safety. These aspects differ ac-
cording to the stage in which the RSA or
RSI is being carried out.
Environment
The generalities of the project are dis-
cussed, such as the function or origin,
how the project is framed within the road
network and for whom the road infra-
structure designed will serve. This infor-
mation allows an evaluation of the con-
text of general project security. It is nec-
essary to analyse aspects such as
changes from the previous stages (if ap-
plicable), drainage, climatic conditions,
landscaping, services, access to proper-
ties and important developments in the
environment, access to emergency vehi-
cles, future extensions and/or future re-
alignments, construction by stages of
the project, planning by stages of the
works, stability of slopes and embank-
ments and compliance with technical re-
quirements for signalling, road clear-
ance, side areas and other users.
Infrastructure
Evaluate whether a previous RSA or RSI
has been performed, which allows
knowledge of aspects that require spe-
cial attention and the changes that have
been generated in the project. The audit
team must consider additional aspects
to those outlined in the handbook in ac-
cordance with the characteristics of the
project.
Part 2 | Chapter 7: Site observations of traffic infrastructure 191
In this section, the corridor is analysed.
When performing an RSI, based on a
field visit in combination with the con-
struction drawings, we can determine
the sites that may have security prob-
lems. Here we analyse aspects related
to visibility distances, design speed,
speed limits, homogeneous sectors, ge-
ometry of horizontal and vertical align-
ment, overtaking, cross section, bridges
and gauges, culverts and boxes, trans-
verse slopes and banks, friction, defects
of the pavement and slopes of inclines.
Intersections also play an important role.
The intersections must be easy to under-
stand for the user, and the design should
strive to use the same type of intersec-
tion throughout the project, or a typology
according to the types of roads that in-
tersect, with the aim of preventing the
user from deciphering each intersection
individually, which generates insecurity
and can lead to mistakes.
Special road users
Special users are pedestrians, cyclists,
motorcyclists, cargo transport vehicles,
public transport and road maintenance
vehicles. The project environment
should be evaluated with the aim of
providing complete solutions for special
users. In this section, we seek to evalu-
ate from the perspective of road safety
whether the facilities required by these
special users have been taken into ac-
count and if their use allows safe travel
throughout the project.
Transit and transportation
For RSA, it is highly important to know
which types of users are going to use the
infrastructure or which type of users are
going to cross it. How traffic is distributed
in time is basic to anticipating road
safety problems.
One of the most important aspects in
road projects is related to signage, so
this must be evaluated judiciously since
it is the communication language of the
users with the road project to achieve
safe and fluid movement. In addition to a
good design, it is necessary to provide
all the necessary and sufficient infor-
mation to the user of a road so that he
can manoeuvre safely and with sufficient
advance notice. The most important as-
pects to be evaluated are lighting, traffic
lights, vertical signage, demarcation and
road delineation, central barriers, lateral
containment barriers, poles and other
obstructions and finally bridges, culverts
and gutters.
192 Part 2 | Chapter 7: Site observations of traffic infrastructure
Table 7-5: Road aspects to be analysed when performing an RSI (MINITRANSPORTE, 2017)
Aspect General topic Particular topic
Environment General environment Weather conditions
Landscaping Landscaping and terrain
Infrastructure
Corridor
Visibility and visibility distance
Design speed
Horizontal and vertical alignment
Speed limit/speed zoning
Overtaking
Readability
Rail widths
Berms
Bridges
Culverts
Transverse slopes and banks
Slip resistance
Puddles
Functional defects of the pavement
Traverse slopes
Intersections
Location
Horizontal and vertical layout
Visibility to and from the intersection
Horizontal signage
Vertical signage
Lateral banks
Illumination
Others
Auxiliary lanes
Length and transitions
Visibility
Vertical signage and demarcation
Associate infrastruc-ture
Public and private equipment
Areas of services and rest
Access to properties and urban developments
Accesses for emergency vehicles
Vulnerable road us-ers
General topics
Pedestrians
Cyclists
Part 2 | Chapter 7: Site observations of traffic infrastructure 193
Motorcyclists
Special road users Public transport
Maintenance vehicles
Other road safety as-pects
Parking lots
Provision for heavy vehicles
Temporary road works
Activities on the edge of the road
Rest areas
Crossing of animals
Furniture
Urban landscaping
Traffic and transportation
Signage, facilities and obstructions
Illumination
General topics of vertical signalling
Centre line, edge line and lane line
Legibility of signals
Devices for traffic regulation
Lateral zones
Barriers and defences
Visibility of barriers and defences
Traffic light
194 Part 2 | Chapter 7: Site observations of traffic infrastructure
7.7 Conclusions and key points
This chapter has described the results of
the review on Road Safety Audits (RSA)
and Road Safety Inspections (RSI)
methodologies that could be included in
road safety management, focusing on
VRUs.
The chapter focused specifically on the
following topics:
Basic concepts, steps and authors
in RSA/RSI;
RSI forms;
Checklists for VRU.
The developed topics were mainly
based on the European Directive on
Road Infrastructure Safety Manage-
ment. Nevertheless, RSI for VRU are not
generally as of yet applied in road safety
management, so an adaptation from
general RSI and RSA background mate-
rials has been made.
7.8 Recommended reading
Austroads (2009). Guide to Road Safety Part 6: Road Safety Audit (No.
AGRS06/09). Sydney, Australia: Austroads.
Baltris (2012). Road Safety Inspection Guidelines and Checklists. Vilnius, Lithua-
nia: Tallinn University of Technology.
Catalan Government (2017). Manual per a la Realització d’avaluacions d’impacte
i Auditories de Seguretat Viària a la Xarxa de Carreteres de la Generalitat de Ca-talunya, (2nd ed.). Barcelona, Spain.
European Transport Safety Council (1997). Road Safety Audit and Safety Impact
Assessment. Brussels, Belgium: ETSC – European Transport Safety Council.
FHWA (2006). Federal Highway Administration Road Safety Audit Guidelines (No.
FHWA-SA-06-06). Washington D.C., USA: U.S. Department of Transportation.
Norwegian Public Roads Administration (NRPA) (2004). Cycle Path Inspections:
Road safety, accessibility, experience of travel (No. 249). Oslo, Norway: Norwegian Public Roads Administration.
Norwegian Public Roads Administration (NRPA) (2014). Road Safety Audits and
Inspections (No. V720 E). Oslo, Norway: Norwegian Public Roads Administration.
Part 2 | Chapter 7: Site observations of traffic infrastructure 195
References Chapter 7
Austroads (2009). Guide to Road Safety Part 6: Road Safety Audit (No. AGRS06/09).
Sydney, Australia: Austroads.
European Parliament and European Council (2008). Directive 2008/96/EC of the Eu-
ropean Parliament and of the Council of 19 November 2008 on road infrastructure
safety management, Pub. L. No. DIRECTIVE 2008/96/EC, Official Journal of the Eu-
ropean Union 319. Retrieved from: https://eur-lex.europa.eu/legal-con-
tent/EN/ALL/?uri=CELEX%3A32008L0096
European Parliament and European Council (2018). Proposal for a Directive of the
European Parliament and of the Council of 17 May 2018 amending Directive
2008/96/EC on road infrastructure safety management, COM/2018/274 final -
EuroRAP (2018). European Road Assessment Programme. Retrieved from
http://www.eurorap.org/
iRAP (2018). International Road Assessment Programme. Retrieved from
https://www.irap.org/
MINITRANSPORTE (2017). Manual de Auditorías de Seguridad Vial para Colombia.
Bogota, Colombia: Agencia Nacional de Seguridad Vial, Ministerio de Transporte.
OECD (2008). Towards Zero: Achieving Ambitious Road safety targets through a safe
System Approach. Paris, France: OECD.
PIARC (2011). Road safety audit guideline for safety checks of new road projects
(No. 2011R01). Paris, France: PIARC – World Road Association.
PIARC. (2015). Road safety manual: A Manual for Practitioners and Decision Makers
on Implementing Safe System Infrastructure. Paris, France: PIARC - World Road As-
sociation. Retrieved from: from http://roadsafety.piarc.org/en
SWOV (2012). The Road Safety Audit and Road Safety Inspection. SWOV-factsheet,
July 2012, The Hague, The Netherlands: SWOV – Instituut voor Wetenschappelijk
Onderzoek Verkeersveiligheid.
196 Part 2 | Chapter 7: Site observations of traffic infrastructure
Annex 1: RSI template Road safety inspection template (Catalan Government (2017) and NPRA (2014))
GENERAL DATA
Form code Number of forms
in a same section
Incidence title
Incidence family Incidence group
Involves vulnerable road users Pedestrians Cyclists Motorcyclists Other
Location of incidence Date created Date updated
Audit type Code Author
Notes
LOCATION
Road / street Direction
Initial km Final km
UTM initial x UTM final x
UTM initial y UTM final y
Notes
ANALYSIS
Incidence description
Level of risk
Risk justification
Consequences of the accident
Evaluation of the incidence
Level of incidence
Consequences of the accident
Slight Severe Very severe
Level of risk
Normal V IV IV
Low V III III
Medium IV III II
High III II I
Notes
PHOTO MAP / AERIAL PHOTO
ADDITIONAL DOCUMENTS
Part 2 | Chapter 7: Site observations of traffic infrastructure 197
Annex 2: RSI checklist Checklist for a road safety inspection (MINITRANSPORTE (2017))
ASPECTS COMMENTS
PEDESTRIAN SPACE
Presence, design and location
Are platforms provided along the street?
If there is no platform, is there an accessible berm (for example, wide enough to accommodate cyclists / pedestrians) on the road or other nearby trail?
Are berms / platforms provided on both sides of the bridges?
Is the width of the platform suitable for pedestrian volumes?
Is there an adequate separation distance between vehicular traffic and pedestrians?
Can people with visual impairment distinguish the limits of the platform / street?
Are ramps offered as an alternative to stairs?
Does the wide platform radius increase the pedestrian crossing dis-tances and increase high-speed in right turns?
Do the channelized right turn lanes minimise conflicts with pedestrians?
Does a skewed intersection prevent drivers from concentrating on pe-destrian crossing?
Are pedestrian crossings found in areas where viewing distance can be a problem?
Do high roadway dividers provide a safe waiting area (shelter) for pe-destrians?
Are the pedestrian crossing marks wide enough?
Are rail crossings safe for pedestrians?
Are pedestrian crossings located along pedestrian flow lines?
Are corners and platform ramps properly planned and designed for each approach to the crossing?
Do the platforms / paths connect the street and the adjacent uses of the land?
Are the platforms / paths properly designed?
Are building entrances located and designed to be obvious and easily accessible to pedestrians?
Are the bus stops conveniently located?
Are pedestrian crossings adequate and safe, especially for the popula-tion with reduced mobility and the school population?
Is the visibility distance to bus stops adequate?
Are the stops properly designed and placed for the safety and comfort of pedestrians?
Are the waiting areas at the locations sized according to the prevailing demand?
Quality, condition and obstructions
Is the pedestrian path clear in case of temporary or permanent obstruc-tions?
Is the walking surface too steep?
198 Part 2 | Chapter 7: Site observations of traffic infrastructure
Is the surface of the walk (platform or pedestrian path) adequate and well maintained?
Is the crossing pavement adequate and well maintained?
At intersections is the junction between the road surface and the pave-ment of the road adequate?
Are parked vehicles clogging pedestrian crossings?
Is the seating area at a safe and comfortable distance from the vehicle and bicycle lanes?
Do the seats (or people sitting on them) block the sidewalk or reduce its useful width?
Is a sufficient landing area provided to accommodate passengers wait-ing, boarding / alighting and passing through pedestrian traffic during peak hours?
In whereabouts, is the landing zone paved and free of problems such as uneven surfaces, standing water or steep slopes?
Is the platform free of temporary / permanent obstructions that restrict its width or block access to the bus stop?
Continuity and connectivity
Are the platforms and berms continuous and on both sides of the street?
Are measures needed to direct pedestrians to safe crossing points and pedestrian access roads?
Does the connectivity of the pedestrian network continue through the crossings by means of adequate waiting areas at the corners, platform ramps and marked pedestrian crossings?
Are pedestrians clearly oriented to crossing points and pedestrian ac-cesses?
Are pedestrian facilities continuous? Do they provide adequate connec-tions for pedestrian traffic?
Are the transitions of pedestrian facilities between developments / pro-jects adequate?
Is the nearest crossing opportunity free of potential hazards to pedes-trians?
Are the stops, stations and terminals part of a continuous network of pedestrian facilities?
Illumination
Is the platform adequately illuminated?
Does street lighting improve pedestrian visibility at night?
Is the crosswalk properly lit?
Are the access roads to the transit facilities well-lit to accommodate the early morning, afternoon and evening?
Visibility
Is the visibility of pedestrians walking along the platform / berm ade-quate?
Can pedestrians see vehicles approaching at all intersection / junction accesses and vice versa?
Is the distance from the stop line (or give way) to a crosswalk sufficient for drivers to see pedestrians?
Are there other conditions in which stopped vehicles can obstruct the visibility of pedestrians?
Is the visibility and distance of visibility adequate?
Are open lines of sight maintained between the approaching buses and the waiting and loading areas of the passengers?
Part 2 | Chapter 7: Site observations of traffic infrastructure 199
TRAFFIC AND TRANSPORTATION
Access management
Do the roads that cross continuous platforms have the necessary ad-justments that reduce the danger to pedestrians?
In existing pedestrian crossings, does the number of lanes make the route unsafe for pedestrians?
Are access roads for pedestrians and other vehicle modes clearly bounded on open roads?
Do drivers look for and give way to pedestrians when entering and leav-ing roads?
Transit
Are there conflicts between bicycles and pedestrians on the sidewalks?
Do vehicles that turn represent a danger to pedestrians?
Are there enough gaps in traffic to allow pedestrians to cross the road?
Do traffic operations (especially during peak periods) create a safety problem for pedestrians?
Does the behaviour of pedestrians or drivers increase the risk of being run over?
Are buses, cars, bicycles and pedestrians separated on the site and provided with their own designated areas for travel?
Are pedestrians entering and leaving buses in conflict with vehicles, bi-cycles or other pedestrians?
Road signs
Are pedestrian areas clearly delimited from other modes of transit through the use of stripes, coloured pavements and/or textures, signs and other methods?
Is the visibility of horizontal and vertical signage adequate during the day and night?
Is the condition of the paint on the stop lines and pedestrian crossings adequate, or are there any worn, missing or damaged signs?
Are crosswalks for pedestrians properly marked and/or demarcated?
Traffic lights
Are traffic lights provided for pedestrians, and are they adequate?
Are pedestrian traffic lights timed so that waiting times and crossing times are reasonable?
Is there a problem due to an inconsistency in pedestrian activation or detection systems?
Are all pedestrian signals and push buttons working correctly and safely?
Are the access buttons provided and located properly for pedestrians in a disability condition?
200 Part 2 | Chapter 7: Site observations of traffic infrastructure
Wijnen, W., Weijermars, W., Van den Berghe, W., Schoeters, A., Bauer, R., Carnis,
L., Elvik, R., Theofilatos, A., Filtness, A., Reed, S., Perez, C., Martensen, H. (2017). Crash cost estimates for European countries (Deliverable 3.2). Horizon 2020 EC Project, SafetyCube. Loughborough, UK: Loughborough University.
References Chapter 8
Kasnatscheew, A., Heinl, F., Schönebeck, S., Lerner, M., Hosta, P. (2016). Review
of European accident cost calculation methods – with regard to vulnerable road users
Wijnen, W., et al., (2018). Cost of road crashes in Europe: Official values and harmo-
nized estimates. Submitted to Accident Analysis & Prevention.
206
Part 2 | Chapter 9: Conclusion 207
CHAPTER 9
Conclusion
The purpose of this handbook is to com-
pile current knowledge on road safety di-
agnostic techniques into a detailed,
practical overview. The described road
safety methods include accident data
analysis, surrogate safety indicators,
self-reported accidents and naturalistic
behavioural data and primarily ad-
dresses the case of vulnerable road us-
ers (VRUs). The handbook is intended to
help road safety practitioners, profes-
sionals and researchers diagnose road
safety problems by gaining more in-
sights into the mistakes by road users
that lead to collisions. This handbook as-
sists in linking accident causal factors to
accident risk and so contributes to fur-
ther improving road safety and generat-
ing a better, in-depth understanding of
the causal factors contributing to un-
safety. These enhanced insights allow
us to better understand mistakes by road
users that are essential to develop and
select targeted countermeasures to re-
duce deaths and serious injuries. The
handbook thus also indirectly contrib-
utes to the European Commission’s
(2018) road safety objective to further re-
duce the number of fatalities and serious
injuries by 2030. In general, road safety
in Europe has greatly improved in recent
decades. Despite this positive develop-
ment, VRUs still experience elevated ac-
cident and injury risk. The InDeV re-
search project, therefore, specifically fo-
cused on improving the road safety of
VRUs. Consequently, this handbook
mainly addresses how different road
208 Part 2 | Chapter 9: Conclusion
safety techniques can be used to identify
the accident causal factors for VRUs.
Nevertheless, these techniques can also
be applied to assess the safety of other
road users.
Moreover, depending on the study ob-
jectives, various techniques can be used
to gain insights into the accident causal
factors for VRUs. Overall, six different
techniques can be used to collect such
data: accident data analysis, self-re-
ported data, behavioural observation
studies, traffic conflict observation stud-
ies, naturalistic cycling and walking stud-
ies and RSA and RSI. The previous
chapters provide a detailed, practical-
oriented overview of the application ar-
eas, characteristics and considerations
that should be kept in mind when decid-
ing which particular technique to use. In
this chapter, the most important aspects
of these six road safety diagnostic tech-
niques are summarised in Table 9-1.
This easily accessible summary table
helps practitioners to find the appropri-
ate technique to gain insights into a spe-
cific road safety problem for all groups of
road users and, in particular, VRUs. Ta-
ble 9-1 provides a quick, detailed over-
view of the different techniques by dis-
cussing their main characteristics:
Context: scope of a technique;
Variables: type of data that can be
collected with a technique;
Data collection techniques: possible
methods that can be used to collect
data;
Study area: geography within a road
traffic system for which a technique
can be used to collect data;
Data processing efforts: estimated
time needed to analyse collected
data;
Costs: estimated monetary re-
sources to apply a technique;
External validity: extent to which the
results collected through a tech-
nique can be generalised to other
situations or the whole population of
road users;
Experimental control: extent to
which a researcher can influence sit-
uations and behaviours occurring in
the road environment during the
data collection phase;
Time: estimated average time
needed to apply a technique in a
study;
Advantages: descriptions of the de-
sirable features of a technique;
Challenges: specific challenges re-
lated to the adoption of a technique.
Throughout this handbook, the road
safety techniques discussed are un-
questionably proven to have added
value for performing evidence-based
road safety research aimed at identifying
accident causal factors for VRUs. This is
also illustrated in Table 9-1. For in-
stance, accident data analyses are very
useful to assess and monitor road safety
situations in areas of interest, identify the
time trends of accident occurrence and
resulting injury severity and compare the
safety situation among countries, re-
gions and cities. Furthermore, the fol-
lowing three techniques can be used to
directly collect information from road us-
ers. First, self-reporting is especially
useful for gaining knowledge of near-ac-
cidents, which are usually not regis-
tered, and less severe accidents (e.g. re-
sulting in slight injuries or only property
damage), which are largely under-re-
ported in official statistics. Second, on-
site behavioural observation studies are
used to study the frequency of and to
identify particular characteristics of road
user behaviour in normal traffic events
and near-accidents. On-site traffic con-
flict observation studies only focus on
Part 2 | Chapter 9: Conclusion 209
identifying relevant road user behaviour
in near-accidents. It, therefore, is possi-
ble to gain knowledge about the behav-
ioural and situational aspects that play a
role in encounters with low safety risk, as
well as the aspects that precede serious
traffic events. These studies thus pro-
vide the opportunity to better understand
the various contributing factors that influ-
ence accident occurrence. Conse-
quently, these studies’ results can be
used as a basis to identify which target
groups and risk-increasing behaviours
require attention to reduce road fatalities
and serious injuries. Third, naturalistic
cycling and walking studies allow unob-
trusively and continuously observing
road user behaviour in the real world be-
fore and during near-accidents and in
some cases even accidents to gain in-
depth knowledge of the factors contrib-
uting to these incidents. Finally, RSA au-
dits and RSI are road infrastructure as-
sessment techniques specifically used
to assess which infrastructural elements
of new and existing roads influence ac-
cident risk.
210 Part 2 | Chapter 9: Conclusion
Table 9-1: Overview of road safety diagnostic techniques
Road safety diagnostic technique
Accident data analysis
Self-reported data
Behavioural observation
study
Traffic con-flict
observation study
Naturalistic cy-cling and walk-
ing study
Road safety audit/inspec-
tion
Euro-RAP/iRAP
methodology
Context Accidents (ranging from only material damage to fatal inju-ries)
Accidents and near-accidents
Road user be-haviour in undis-turbed passages and near-acci-dents
Traffic con-flicts (i.e. near-accidents)
Road user behav-iour in accidents, near-accidents and undisturbed pas-sages
Road infrastruc-ture assessment of new and ex-isting roads
Risk assess-ment of individ-ual roads and road networks
Variables Accidents and their related characteris-tics, exposure data, infrastructure data and collision diagram information
Accidents, near-accidents and their descriptions (e.g. location, inci-dent, involved par-ties and circum-stances)
Variables related to road user be-haviour (e.g. looking behav-iour, priority be-haviour and communication), road user char-acteristics (e.g. gender and age) and more de-tailed indicators when video cam-eras are used
Measurable (continuous in the case of video-based observation) parameters of road user be-haviour in traf-fic conflict situ-ations
Detailed and contin-uously logged data (e.g. speed, accel-eration and posi-tion), road user be-haviour data and characteristics of traffic situations in normal and safety-critical events
Elements of road infrastruc-ture that could influence acci-dent risk
Elements of road infrastruc-ture that could influence acci-dent and injury risk
Data collec-tion tech-niques
Desk research in na-tional accident data-bases and police-re-ported accident data (especially for only material damage), possibly enriched with hospital data
Interviews and questionnaires
Human observ-ers and video-based behav-ioural data
Human ob-servers and video-based trajectory data
Instrumented vehi-cles (e.g. bicycles, mopeds and motor-cycles) and portable equipment (e.g. smartphones and activity bands)
Trained road safety auditors and inspectors
Desk research in case of risk mapping, safer road investment plans and per-formance plans. Trained road in-spectors in case of star rating protocol
Part 2 | Chapter 9: Conclusion 211
Road safety diagnostic technique
Accident data analysis
Self-reported data
Behavioural observation
study
Traffic con-flict
observation study
Naturalistic cy-cling and walk-
ing study
Road safety audit/inspec-
tion
Euro-RAP/iRAP
methodology
Study area Dependent on the study objectives, ranging from country based to network and site based
Dependent on the study objectives, ranging from country to region based
On site On site Real-world traffic environment rang-ing from country based to network based and site based
On site Dependent on the study objec-tives, ranging from country based to net-work and site based
Data pro-cessing ef-forts
Low (general traffic safety reports and collision diagram analysis) to moderate (black spot analysis, network safety analy-sis and accident pre-diction modelling)
Low to moderate depending on the number of re-spondents and data collection technique (online or not)
Moderate to high depending on the number of regis-tered events and use of
(semi-)auto-mated video analysis tech-niques
Moderate to high depend-ing on the number of reg-istered events and use of
(semi-)auto-mated video analysis tech-niques
High Low Low to moderate depending on the protocol used (star rating requires more efforts)
Costs Low Medium Low to medium Low to me-dium
Medium to high Low (mostly la-bour costs)
Low to medium
External va-lidity
Low-moderate de-pending on the num-ber of analysed acci-dents and the typical characteristics of ac-cident locations
Low-moderate depending on the number of re-spondents
Low-moderate: natural setting, unobtrusive data collection and ac-tual safety-critical situations and behaviours, but valid study re-sults only for the location studied, difficult to estab-lish link with acci-dents
Low-moder-ate: natural setting, unob-trusive data collection and actual safety-critical situa-tions and be-haviours, but valid study re-sults only for the location studied
Very high: natural setting, unobtrusive data collection and actual safety-critical situations and be-haviour
Low: valid re-sults only for the location studied
Low: valid re-sults only for the location studied
212 Part 2 | Chapter 9: Conclusion
Road safety diagnostic technique
Accident data analysis
Self-reported data
Behavioural observation
study
Traffic con-flict
observation study
Naturalistic cy-cling and walk-
ing study
Road safety audit/inspec-
tion
Euro-RAP/iRAP
methodology
Experimental control
No control over road users’ interactions or the traffic environ-ment
No control over road users’ inter-actions or the traf-fic environment
No control over road users’ inter-actions or the traffic environ-ment
No control over road us-ers’ interac-tions or the traffic environ-ment
No control over road users’ interac-tions or the traffic environment
Not applicable Not applicable
Average study dura-tion
1 to several years Several weeks to months
Several days to weeks
Several days to weeks
Several months, up to one year or longer
Several days (RSI), months to years (RSA)
Several days to weeks
Specific ad-vantages
Direct assessment of the outcome indicator of road safety (e.g. number and severity of accidents)
First-hand infor-mation, correction for underreporting (data on slight ac-cidents), near-ac-cident information, tailored study de-sign and swift road safety diagnosis and evaluation
Direct observa-tion of road user behaviour, non-intrusive data collection, prac-tice ready, large sample size, swift road safety diagnosis, inex-pensive and in-sights into acci-dent develop-ment process
Direct obser-vation of road user behav-iour in safety-critical events, non-intrusive data collec-tion, practice ready, large sample size, swift road safety diagno-sis and possi-ble supple-ment or re-placement for accident data
In-depth under-standing of road us-ers’ natural behav-iour, possibility to study behaviour over extended time periods, compensa-tion for underreport-ing of accidents, au-tomatic data collec-tion, reflection of ac-tual behaviour, in-formation on the ac-cident development process and study of normal, conflict and accident situa-tions
Reduced acci-dent risk, safer facilities for vul-nerable and other road users and better road safety targets, standards and design guide-lines, detailed overview of the safety deficien-cies of a road
Easy to apply, standardized protocols for risk mapping, star rating, perfor-mance tracking and safer road investment plans; also appli-cable when no accident is avail-able; comple-mentary to RSA/RSI
Part 2 | Chapter 9: Conclusion 213
Road safety diagnostic technique
Accident data analysis
Self-reported data
Behavioural observation
study
Traffic con-flict
observation study
Naturalistic cy-cling and walk-
ing study
Road safety audit/inspec-
tion
Euro-RAP/iRAP
methodology
Challenges Underreporting, ran-dom variation, ethical concerns, no infor-mation on road user behaviour and acci-dent development process and slow road safety diagnosis and
evaluation (extensive accident data needed for 3–5 years)
Privacy issues, no expert information, response bias, data from only one of the involved road users and no data on severe and fatal accidents
Generalisability, findings on only revealed road user behaviour (i.e. not on un-derlying motives of behaviour), observer bias, la-bour-intensive data collection (observers) and susceptible to adverse weather conditions and difficult at night
Labour-inten-sive data col-lection (ob-servers), gen-eralisability, validity,
inter- and in-tra-observer variability, ad-vanced video analysis tech-niques still un-der develop-ment and sus-ceptible to ad-verse weather conditions and difficult at night
High set-up costs, time-consuming data–analysis pro-cess, selection bias, data from only one of the involved road users, privacy is-sues and limited sample size due to high costs
No standardised approach to RSI
Provides a quick assessment of the general risk standard of a road but a de-tailed overview of the safety de-ficiencies of the road or network is missing.
214 Part 2 | Chapter 9: Conclusion
Each technique, in its own way, can pro-
vide valuable insights into the road
safety situation of VRUs. However,
based on the information presented in
this handbook, it can be concluded that
there is no perfect technique to assess
road safety but only the most suitable
technique given the study’s scope, time
frame, available human and monetary
resources and expected outcomes.
However, each technique also suffers
from limitations, so it is very difficult to
gain a sound picture of the road safety
situation based on one technique alone
(see Table 9-1). Consequently, a crucial
opportunity lies in complementing the re-
sults from different road safety tech-
niques to overcome the limitations of in-
dividual techniques. Exploring the differ-
ent opportunities for such an integrated
approach was also the rationale of the
InDeV-project (and this handbook).
Based on the information presented in
this handbook, the following recommen-
dations for combining different road
safety techniques can be suggested.
1. Accident data and self-reported
data
Accident data analysis is the most com-
monly used technique to assess the
road safety situation of VRUs and other
road users. However, accident data suf-
fer from underreporting and injury mis-
classification. The degree of underre-
porting in police accident records is the
highest for accidents with VRUs and of a
less severe nature, such as accidents
with slight injuries or only property dam-
age. Combining police-reported acci-
dent data with hospital data can help to
overcome some of these problems and
is becoming a more widely adopted ap-
proach in the road safety field. The use
of self-reported accident data in combi-
nation with police-reported accident data
is a useful approach especially for gain-
ing more knowledge about less severe
accidents because it can capture more
less-severe accidents, thus overcoming
underreporting and the associated po-
tential for biased data.
Combining self- and police-reported ac-
cident data thus can contribute to better,
more complete insights into the current
state of traffic safety. However, combin-
ing police-reported accident data with
hospital data remains the recommended
approach to address the underreporting
of accidents with serious and fatal inju-
ries.
2. Accident data and behavioural
observation and traffic conflict
data
Accident data analysis directly examines
the phenomenon one wants to avoid
from a safety perspective—namely, ac-
cidents and their related consequences.
This direct assessment can be regarded
as the main advantage of accident data
analysis. However, such data contain in-
formation on the outcomes of accidents
(the severity of accident-related injuries)
but lack information on accident causal
factors (situational and behavioural as-
pects preceding accidents). The acci-
dent development process, therefore,
remains unclear.
To overcome this limitation, accident
data can be combined with behavioural
and traffic conflict observation data.
Both techniques are used to study the
frequency of and to identify particular
characteristics of road user behaviour in
normal traffic events and near-acci-
dents. These techniques, therefore, are
very useful to gain knowledge on the be-
havioural and situational aspects that
play a role in encounters with low safety
Part 2 | Chapter 9: Conclusion 215
risk, as well as the aspects that lead to
accident occurrence.
Road safety evaluation and assessment
based on accident data also require ex-
tensive accident data (typically 3–5
years) to produce reliable results. Some-
times, there are little accident data avail-
able, or the available data are insuffi-
ciently detailed to obtain a good evalua-
tion or diagnosis. In such cases, behav-
ioural and traffic conflict observations
provide a vital complement to accident
analysis as a support for action design
and, where appropriate, may even com-
pensate for a shortage of information on
accident-generating processes. Further-
more, the behavioural and conflict items
observed and the locations of interest for
both observations are mostly deter-
mined by the findings of accident analy-
sis.
3. Self-reported data and traffic
conflict data
Similarly to accident data, traffic conflict
data on slight conflicts and near-acci-
dents can be combined with self-re-
ported data to gain more knowledge on
the occurrence of less severe conflict sit-
uations.
4. Behavioural observation data
and traffic conflict data
Behavioural observation studies are of-
ten combined with traffic conflict studies
to broaden coverage of different aspects
of road safety situations. Insights into the
different road user behaviours that occur
at studied sites serve as a useful basis
for describing what is going on at sites
and makes them unsafe. Behavioural
observations, therefore, offer added
value to traffic conflict studies by provid-
ing more insight into the risk-increasing
behavioural aspects and elements that
play a role in traffic conflicts.
5. Naturalistic cycling and walking
studies and behavioural observa-
tion and traffic conflict data
Naturalistic cycling and walking studies
are a useful technique to continuously
collect data on road user behaviour. In
these studies, data are collected with in-
strumented vehicles and portable meas-
uring devices. Continuously collecting
data, these studies can evaluate not only
the last movements and constellations
leading to accidents but also the under-
lying factors that may have led to road
users ending up in safety-critical situa-
tions. However, this technique only col-
lects data from the viewpoint of one of
the involved road users (the road user
with a portable measuring device or us-
ing an instrumented vehicle). Conse-
quently, the collected information on the
other road user is sometimes limited as
the measuring devices might not have
detected evasive action or behaviour by
the other road user. This complicates
obtaining a complete understanding of
accidents’ contributing factors.
However, this issue can be solved by
combing naturalistic walking and cycling
studies with behavioural and conflict ob-
servation studies on designated sites of
the road network, such as intersections.
These site-based observation studies
create the opportunity to collect supple-
mentary information on the position and
speed of other road users in the vicinity
of participants in naturalistic cycling and
walking studies. The added value of
combining both techniques lies in the op-
portunities to obtain a more in-depth un-
derstanding of road safety and to relate
the behaviour of participants and non-
participants in naturalistic walking and
cycling studies.
To conclude, these insights make a
strong case for an integrated approach
216 Part 2 | Chapter 9: Conclusion
to assessing the road safety of VRUs
and other road users. The added value
of this integrated approach lies in the op-
portunity to enrich the results from one
technique with the complementary re-
sults from another and to check whether
the techniques’ findings align. This ap-
proach not only overcomes the limita-
tions of each individual technique but
also allows drawing highly detailed,
sound road safety inferences, ultimately
producing a more comprehensive pic-
ture of the road safety situation. Further-
more, higher road safety levels on the
road traffic system have gradually
evolved over recent decades. If this pos-
itive trend continues, accidents will be-
come even rarer and thus less suitable
for reliable road safety analyses. An in-
tegrated approach based on a combina-
tion of the road safety techniques dis-
cussed in this handbook, therefore, will
perform an important role in future road
safety evaluation policies.
Additionally, in light of the Safe System
and Vision Zero approach, a strong case
has been made in the scientific commu-
nity for adopting a system approach to
conducting road safety research.
The new European road safety vision,
moreover, recommends the Safe Sys-
tem approach as a common framework
to achieve further reductions in road fa-
talities and serious injuries during 2020–
2030 (European Commission, 2018).
Throughout this handbook, it has be-
come apparent that the most important
merit of combining different techniques
to study the road safety of VRUs lies in
the possibility to study road user behav-
iour from a system perspective. It, there-
fore, can be recommended that coun-
tries pursuing a system-based road
safety vision adopt an integrated ap-
proach based on a combination of tech-
niques to observe road user behaviour
in interactions, near-accidents and acci-
dents. Besides road user behavioural
factors, vehicle, road and emergency
medical system factors are also critical
to a Safe System Approach. Even
though, the latter factors are not the fo-
cus of this handbook, it can be sug-
gested that the proposed integrated ap-
proach to study road user behaviour is a
first and important step to further reduce
the number of road fatalities and serious
injuries and to formulate policy priorities
in order to eventually establish an inher-
ently safe road traffic system.
References Chapter 9
European Commission. (2018). Europe on the move: sustainable mobility for Europe:
safe, connected, and clean, pub. l. no. COM/2018/293 final, communication from the
Commission to the European Parliament, the Council, the European Economic and
Social Committee and the Committee of the Regions. Retrieved from https://eur-
D Dacota Road Safety Data, Collection, Transfer and Analysis
DALY Disability-Adjusted Life Years
DOCTOR Dutch Objective Conflict Technique for Operation and Re-search
DST Deceleration-To-Safety
E EACS European Accident Causation Study
EB Empirical Bayes (Method)
EC European Commission
ERSO European Road Safety Observatory
ETAC European Truck Accident Causation Study
F FARS Fatality Analysis Reporting System
G GIDAS German In-Depth Accident Study
I ICD10 International Classification of Diseases
InDeV In-Depth Understanding of Accident Causation for Vulnerable Road Users
IRF International Road Federation
IRTAD International Road Traffic and Accident Database
ISS Injury Severity Score
220 Part 3 | List of abbreviations
M MAIDS Motorcycle Accident In-depth Study
MAIS Maximum Abbreviated Injury Scale
MAIS3+ MAIS With Score 3 Or More
N NISS New Injury Severity Score
NSM Network Safety Management
O OECD Organisation For Economic Co-Operation And Development
P PET Post-Encroachment Time
Ppet Predicted PET
PTW Powered Two Wheelers (Motorcycle/Moped)
R RAIDS Road Accident In Depth Studies
RCT Randomised Controlled Trial
RLC Red Light Cameras
RLS Reaction Level Scale
RSA Road Safety Audits
RSI Road Safety Inspections
RUBA Road User Behaviour Analysis
S SNACS SafetyNet Accident Causation System
SRLC Speed and Red Light Cameras
SSM Surrogate Safety Measure
STCT Swedish Traffic Conflict Technique
STRADA Swedish Traffic Accident Data Acquisition
SWOV Institute of Road Safety Research
T TA Time-To-Accident
Tadv Time Advantage
TCT Traffic Conflict Technique
TEN Trans-European Road Network
TTC Time-To-Collision
TTCmin Minimum Time-To-Collision
U UNECE United Nations Economic Commission For Europe
V VRU Vulnerable Road User
W WHO World Health Organisation
Part 3 | Concepts and definitions 221
Concepts and definitions
A Annual average daily traffic
The number of vehicles passing a road
during one year, divided by the number
of days in that year.
Abbreviated injury scale
A medical scale used to indicate the se-
verity of injuries. The scores on the injury
scale range from AIS 1 (minor injury) to
6 (fatal injury).
Accident
Event between road users on public
roads involving at least one moving ve-
hicle resulting in injury, fatality or prop-
erty damage.
Accident black spot
Any location in the road network that has
a higher expected number of accidents
than other similar locations as a result of
a local risk factor; sometimes also re-
ferred to as a hazardous road location.
Accident cost
The value of all resources lost or used
as a result of an accident; comprehen-
sive costs also include a monetary valu-
ation of lost quality of life as a result of
accidents.
Accident counts
The number of accidents.
Accident density
The rate at which road users are being
killed or seriously injured.
Accident frequencies
Number of accidents (or number of acci-
dent victims) in a given area recorded
during a given time period.
Accident modification factor
A multiplicative factor used to compute
the safety effectiveness (in terms of the
expected number of accidents) after im-
plementing a particular countermeasure
at a specific site. Also known as crash
modification factor (CMF).
Accident prediction model
Statistical model used for estimating the
expected accident frequencies of vari-
ous roadway entities (highways, inter-
sections, interstates, etc.) in terms of the
geometric, environmental and opera-
tional factors that are associated with the
occurrence of accidents.
Accident rate
The number of accidents per unit of ex-
posure; most commonly, the number of
accidents per million vehicle kilometres
of travel.
Accident reporting
Formal systems established to report
road traffic accidents to public authori-
ties. In general, police departments are
entrusted to report accidents.
Accident risk
Probability of accident occurrence in a
given location or area and during a defi-
nite period of time. Accident risk is esti-
mated through statistical procedures,
based on data of observed accidents
and exposure.
222 Part 3 | Concepts and definitions
Accident severity
Measure describing the outcome of an
accident usually categorised as fatal, se-
vere or minor injuries and property-dam-
age-only.
Accident statistics
Records of reported accidents kept by
highway authorities, police departments
or other governmental bodies.
Active safety equipment
Any technology that automatically as-
sists in preventing an accident such as
forward collision warning systems, lane
departure warning systems, electronic
stability control, anti-lock braking sys-
tems, brake assist.
B Before and After study
A study design used to evaluate the ef-
fects of road safety measures by com-
paring the number of accidents before
and after introduction of the measure.
Behavioural observation study
A type of traffic observation study used
to examine road user behaviour. In
these studies, the emphasis lies on ana-
lysing the actions of road users in their
natural setting by means of (mostly) ob-
servable qualitative variables (i.e. gen-
der, age, interaction type, approaching
behaviour, looking behaviour, priority
behaviour, distraction, communication
behaviour, etc.) while they interact with
other road users and the road environ-
ment.
Bias
Systematic errors; a sample is biased if
observations made in the sample cannot
be generalised to the population of inter-
est.
Black spot
Road locations with a (relatively) high
accident potential or locations with a
higher expected number of accidents
than other similar locations (intersec-
tions or short road sections, less than
0.5 km long); sometimes referred to as a
hazardous road location.
Black spot analysis
A method of identifying high-risk acci-
dent locations (i.e. locations with a high
concentration of accidents) in the road
network.
Black spot management programme
A programme designed to identify, ana-
lyse, and treat black spots on the road
network (black spots are seldom longer
than 0.5 kilometres).
C Collision
Impact event between two or more road
users/vehicles, or a road-user (vehicle)
and stationary object.
Collision course
A situation in which the road users will
collide eventually if they continue to
move with unchanged speeds and direc-
tions.
Collision diagram
A visual representation of accidents at a
given location (intersection, road seg-
ment) by means of symbols to denote
different accident types, their location
Part 3 | Concepts and definitions 223
and manoeuvres of vehicles/road users
involved.
Collision point
Location of the first physical contact
(projected on a road plane) when two
road users collide.
Conflict diagram
A visual representation of conflicts at a
given location (intersection, road seg-
ment) by means of symbols to denote
different conflict types, their location and
manoeuvres of vehicles/road users in-
volved.
Conflict distance
A temporary measurement of (spatial)
distance to a common conflict point, for
a road user/vehicle in a conflict situation.
Conflict indicator
An objective and measurable parameter
that has a relation to a studied quality of
the traffic system (e.g. efficiency, safety,
comfort, etc.).
Conflict severity
Seriousness of a potential collision or
near-accident measured by temporal or
spatial proximity.
Conflicting speed
In the Swedish Traffic Conflict Tech-
nique: the speed of the road user who
undertakes the first evasive action.
Construct validity
The extent to which a study or method
observes the concept for what it is spe-
cifically designed to measure or ob-
serve.
Continuous data
A variable that can be measured to any
level of precision. Time is an example of
a continuous variable.
Cost-benefit-analysis
A formal analysis of costs and benefits
of a programme, in which all relevant im-
pacts are converted to monetary terms.
Crash
See accident. The term ‘crash’ used in
the USA includes both injury accidents
and property-damage-only crashes. For
the sake of consistency the authors use
the term ‘accident’ in this handbook to
both denote injury and property-dam-
age-only accidents as they do not differ-
entiate between the terms in relation to
the context.
Cross-sectional study
A study design used to evaluate the ef-
fects of road safety measures by com-
paring the number of accidents at two or
more locations (at least one location with
and one location without the measure).
These locations must be as comparable
as possible in terms of infrastructural de-
sign characteristics, vehicle speeds and
traffic flows, but differ in the presence of
the road safety measure.
D Deceleration-to-safety
Conflict indicator expressing the minimal
necessary deceleration to avoid a colli-
sion.
Disability-adjusted life year
A measure indicating the number of life
years lost due to ill-health, disability or
early death. It conveys additional infor-
mation about the influence of an acci-
dent on the future life of the person in-
volved in the accident.
224 Part 3 | Concepts and definitions
E Empirical Bayes
Method that corrects for regression-to-
the-mean. This method compares acci-
dent numbers after the implementation
of the measure with the before period,
increases the precision of estimation
and is widely accepted as the best
standard in the evaluation of traffic
safety measures.
Encounter
See interaction.
Entity
Spatial extent or analysis, be it a single
site, a set of sites, or a region.
Evasive action
Action taken by a road user to diverge
from a collision course and resolve a
conflict situation by changing speed or
direction. Examples of evasive actions
are braking, accelerating, and/or swerv-
ing.
Event
Any kind of incident or occurrence in traf-
fic.
Expected number of accidents
The mean number of accidents (per unit
of time) expected to occur in the long run
for a given exposure and a given level of
risk. Technically, the expected number
of accidents is the mean value of a ran-
dom variable whose sampling space
consists of the recorded number of acci-
dents.
Exposure
The amount of activity exposed to risk.
In road safety studies, exposure usually
denotes the amount of travel either by
vehicle or on foot in which accidents may
occur.
Eye-tracking
The process of measuring the point of
gaze (where one is looking) or the move-
ment of the point of gaze. An eye
tracker, a device that records eye move-
ment and positions, carries out these
measurements.
F Face validity
The extent to which a study or method is
subjectively perceived as covering the
concept it means to measure.
Face-to-face interview
A data collection method in which the in-
terviewer directly communicates with the
respondent in accordance with the pre-
pared questionnaire.
Fatal injury
According to the Vienna convention, a
fatal injury is one that results in death
within 30 days of the accident.
Fatality rate
Numbers of fatalities divided by some
measure of exposure such as fatalities
per million inhabitants or per number of
person kilometres of travelled.
Focus group interview
A qualitative data collection method in
which a group of people are selected
and questioned about their opinion or
perceptions about a particular topic. Fo-
cus group interviews take place in an in-
teractive setting as the participants dis-
cuss their opinions in small groups.
Part 3 | Concepts and definitions 225
G Generalisability
The degree to which the research find-
ings and conclusions from a study can
be transferred to other situations or the
population at large.
H Hazard
A hazard is anything that may cause
damage or injury in the event of an acci-
dent.
Hazardous behaviour
Any behaviour in traffic that could result
in injury or damage to yourself and/or
other road users.
Hazardous road section
Any section at which the site-specific ex-
pected number of accidents is higher
than for similar sections, due to local and
section-based risk factors present at the
site.
I Incomplete accident reporting
Refers to the fact that the accidents rec-
orded in the official accident statistics
suffer from misreporting and underre-
porting.
Injury
Bodily harm. In this handbook, this refers
to injury caused by a road accident.
Injury accident
An accident with at least one fatal, seri-
ously or slightly injured individual.
Injury severity score
An anatomical scoring system that indi-
cates the overall severity for people with
multiple injuries.
Interaction
Basic traffic event that is necessary for
an accident to occur. It typically refers to
a situation in which two road users are
close enough in time and space that they
may be aware of each other, influence
each other’s behaviour and have to in-
teract.
International Classification of Dis-
eases
International standard diagnostic tool
used to classify and monitor causes of
injury and death and that maintains in-
formation for health analyses (i.e. mor-
tality and morbidity studies).
J Jerk
A conflict indicator describing the sud-
denness of braking. Jerk is a derivative
of deceleration.
M Maximum Abbreviated Injury Scale
The maximum AIS score for an individ-
ual with one or multiple injuries.
226 Part 3 | Concepts and definitions
Minimal Time-to-Collision
The lowest TTC-value during the inter-
action indicating the closeness of the in-
teraction/conflict situation to an acci-
dent. TTCmin indicates the TTC at the
time the potential collision is avoided.
Misreporting
Misclassification of injury severity or in-
appropriate reporting of the injury sever-
ity of road traffic victims (for example,
classifying a severe injury as a slight in-
jury).
N Naturalistic study
Data collection method in which the topic
of interest is observed in its natural set-
ting. Applied to road safety, this setting
consists of the road environment and the
road users who interact with each other
in this environment.
Naturalistic driving
A road safety technique in which the
everyday behaviour of road users is ob-
served unobtrusively in a natural road
environment. Data are normally col-
lected for a long period of time, which al-
lows to collect data about safe road user
interactions and safety-critical events
such as near-accidents and accidents.
Naturalistic cycling and walking stud-
ies
Naturalistic driving applied to vulnerable
road users. Instead of instrumented ve-
hicles, data are collected by means of
portable measuring devices
(smartphones, activity bands).
Near-accident
A situation when two road users uninten-
tionally pass each other with very small
margins in time and space, so that the
general feeling is that a collision/acci-
dent was “near”. Synonym for traffic con-
flict.
Near-miss
See near-accident.
Network safety analysis
A method of ranking of road sections
with high accident concentration. It is a
method to identify, analyse and rank
sections of the road network where a
large number of accidents occurred in
proportion to the traffic flow and road
length.
Network safety management
Safety analysis of road networks focus-
ing on longer road sections of normally
2-10 kilometres.
New Injury Severity Score
A medical scoring system that provides
an overall score for people with multiple
injuries. Calculated as the sum of the
squares of the Abbreviated Injury Scale
scores of each of the individual’s three
most severe injury regardless of the
body region in which they occur.
O Observer bias
Systematic error caused when a re-
searcher unconsciously affects results,
data, or a participant in an experiment
due to subjective influence.
Part 3 | Concepts and definitions 227
Overdispersion
Phenomenon indicating the presence of
greater variability (statistical dispersion)
in a data set than would be expected
based on a given statistical model. In
terms of accident data, it means that the
count variability is greater than required
by the Poisson distribution, i.e. the vari-
ance of accident counts is greater than
the mean.
P Passive safety equipment
Any device that automatically provides
protection for the occupant of a vehicle
during an accident, such as seat-belts,
padded dashboard, bumpers, laminated
windshield, head restraints, collapsible
steering columns and airbags.
Poisson distribution
Statistical distribution for rare events
named after the French mathematician
Simeon Denis Poisson, who first de-
scribed it. The Poisson distribution is
generally used as a model to describe
pure random variation in the number of
accidents.
Post encroachment time
A conflict indicator representing a meas-
ure of the temporal difference between
two road users over a common spatial
point or area. It is calculated as the time
between the moment that the first road
user leaves the path of the second and
the moment that the second reaches the
path of the first; i.e. PET indicates the
extent to which they have missed each
other.
Predicted PET
See time advantage.
Probability
The long-term frequency of occurrence
of an event in repeated trials that have
the event as one of the possible out-
comes; how likely something is to hap-
pen.
Property-damage-only accident
Accident with no injuries or fatalities.
R Random variation in the number of
accidents
Variation in the recorded number of ac-
cidents around a given expected num-
ber of accidents.
Reaction level scale
Scale to evaluate the neurologic status
of individuals after a head trauma or
neurosurgery.
Regression-to-the-mean
The tendency for an abnormally high
number of accidents to return to values
closer to the long-term mean; con-
versely, abnormally low numbers of ac-
cidents tend to be succeeded by higher
numbers.
Relevant road user
In the Swedish Traffic Conflict Tech-
nique: the road user that determines the
severity of a traffic conflict.
Reliability
The ability of a measure or technique to
produce consistent results regardless of
the conditions in which it is used.
Risk factor
Any factor that affects the probability of
accident occurrence or the severity of
the consequences of an accident.
228 Part 3 | Concepts and definitions
Road network safety analysis
See network safety analysis.
Road network safety management
process
See network safety management.
Road safety
Quality of the transport system, usually
measured in terms of the number of ac-
cidents and casualties resulting from
these accidents. The ultimate goal of
road safety researchers is to decrease
or eliminate the hazardous conditions in
the road network that cause accidents
and causalities.
Road safety audit
A systematic procedure to assess the
accident potential and road safety per-
formance of the road infrastructure ele-
ments of future roads or intersections by
an independent, multidisciplinary team.
Road safety diagnosis
A formal procedure for identifying and
understanding types of safety prob-
lems/issues. The purpose is to under-
stand patterns in the accident or surro-
gate safety measure data and to identify
accident causal factors.
Road safety impact assessment
As defined by European Directive
2008/96/EC, a strategic comparative
analysis of the impact of a new road or a
substantial modification to the existing
network on the safety performance of
the road network.
Road safety inspection
A systematic, periodic, objective and
proactive safety assessment of an exist-
ing road or intersection. The objectives
of RSI are to identify and eliminate haz-
ardous conditions, faults and deficien-
cies in order to improve the safety for the
road users.
Road section
A stretch of road of 2-10 kilometres.
Road traffic accident
See accident.
Road user
Any individual who uses the road net-
work such as pedestrians, bicyclists,
motorists, powered two-wheelers, mo-
torcyclists and bus drivers.
S Safety critical event
Term used to describe an event with an
identified accident potential or for which
a surrogate safety measure or conflict in-
dicator indicates a threshold value.
Safety pyramid
Conceptions of unsafety and severity of
an event. Developed by Hydén (1984).
The fatal injury accident forms the top of
the pyramid.
Self-reported (near-) accident
The road user himself reports the (near-
) accident in which he was involved e.g.
when and where it happened, a descrip-
tion of the incident, who was involved
and the circumstances of the incident.
Several data collection techniques can
be used for this purpose: including ques-
tionnaires and inventories, interviews,
focus groups, and driving diaries.
Self-reporting
Method to collect detailed information di-
rectly from road users or individuals by
using interviews or questionnaires.
Part 3 | Concepts and definitions 229
Semi-Automated Video Processing
Processing in which some technical tool
is used as an aid in detection and analy-
sis of the traffic conflicts, but part of the
work is still done manually.
Serious conflict
An event/interaction where the evasive
action started late and whereby the in-
teraction could have resulted in an acci-
dent or collision.
Seriously injured
According to the European accident da-
tabase (CARE), injured (although not
killed) in the road accident and hospital-
ised at least 24 hours.
Severity hierarchy
Severity dimension common to all traffic
events illustrated by the safety pyramid
of Hydén (1984). This dimension is ex-
pressed by measureable parameters
based on presumptions regarding the
closeness of the traffic event to an acci-
dent and the potential accident severity.
Severity level
Level in the severity hierarchy.
Single vehicle accident
An accident involving just one vehicle or
road user.
Slight conflict
An event/interaction where two or more
road users are on a collision course and
initiate an evasive action.
Slightly injured
According to the European accident da-
tabase (CARE), injured (although not
killed) in the road accident and hospital-
ised less than 24 hours or not hospital-
ised.
Socio-economic cost calculation
Method to calculate the costs of acci-
dents or injuries. This monetary valua-
tion of accidents and injuries is based on
medical costs, loss of productive capac-
ity, human costs, property damage
costs, administrative and other costs.
Structured behavioural observation
studies
Studies which focus on the explicit and
detailed observation of a specific safety-
related behaviour, for instance, crossing
and looking behaviour or traffic rule com-
pliance at a certain location. Structured
behavioural observations are well pre-
pared and can originate from the results
of unstructured observation studies.
Surrogate safety measure
Measure of safety that does not require
observing accidents with different mean-
ings for a traffic event or an entity.
For a traffic event, it measures the prob-
ability of such an event to develop into
an accident and/or the severity of that
potential accident.
For an entity, it measures its safety, i.e.
the expected number of accidents over
the long run, by levels of severity.
T Time Advantage (TAdv)
An extension of the PET indicator based
on the predicted motion of road users
according to their current position, direc-
tion and speed. Also known as predicted
PET (pPET).
230 Part 3 | Concepts and definitions
Time-to-Accident
In the Swedish Traffic Conflict Tech-
nique: the time remaining from the first
evasive action taken by one of the road
users up to the collision that might have
taken place had they continued with un-
changed speeds and directions. More
specifically, it is the TTC value at the mo-
ment an evasive action is first taken by
one of the road users involved in the traf-
fic conflict.
Time-to-collision
A continuous parameter of time. In colli-
sion course situations, it indicates the re-
maining time for two road users to collide
if they continue with unchanged speeds
and directions.
Traffic conflict
An observable situation in which two or
more road users approach each other in
space and time to such an extent that a
collision is imminent if their movements
remain unchanged.
Traffic conflict technique
A technique to assess road safety based
on the observation of traffic conflicts
(near-accidents). The rationale behind
these techniques is that accidents and
conflicts are related as they originate
from the same type of traffic processes.
U Underreporting
Accident casualties who are not rec-
orded in police-reported accident data,
but can possibly be found in hospital
data.
Unobtrusive
Not conspicuous or attracting attention.
Unstructured behavioural observa-
tion studies
Observations in which researchers look
with an ‘open mind’ at road user behav-
iour and record any observable action or
behaviour that seems interesting or con-
spicuous. Unstructured behavioural ob-
servations require no preparation.
V Validity
Evidence that a study allows correct in-
ferences about the question it was
aimed to answer or that a road safety
technique/indicator measures what it set
out to measure conceptually.
Vulnerable road user
Non-motorised road users, such as pe-
destrians and cyclists as well as motor-
cyclists and moped riders. Children,
older people and disabled people can
also be included in this category.
W Willingness-to-pay
Cost calculation approach based on the
amount of money a victim is willing to
pay for not being hurt or killed respec-
tively for a risk reduction.
231
Layout by
Edith Donders
Yasmine Nowicki
How to analyse accident causation?
A handbook with focus on vulnerable road users
This handbook is designed to offer road safety professionals a detailed and practical overview of the various road safety diagnostic techniques available for studying road users’ behaviour during interactions, near-misses and accidents. It describes various road safety methods that can be applied for studying the safety of vulnerable (and other) road users, including: accident data analysis, con lict and behavioural observations, self-reporting and naturalistic studies and road safety audit and inspection. The handbook also focuses on delivering better calculations of the socio-economic costs of vulnerable road user accidents. The authors discuss when those techniques function best, when they are not entirely suitable, and how they can bene it each other when used in conjunction. Applying the principles described in this handbook will contribute to the further improvement of road safety and a better, in-depth understanding of the causal factors contributing to vulnerable road user unsafety.