66
2019 WORLD LNG REPORT Sponsored by

2019WORLD LNG REPORT
Sponsored by

The trademarks and registered trademarks used to designate certain products and services in this presentation are owned by their respective companies.
TABLE OF CONTENTSMessage from the President of the International Gas Union 3
2. State of the LNG Industry 4
3. LNG Trade 8
4. Liquefaction Plants 26
5. LNG Carriers 48
6. LNG Receiving Terminals 64
7. The LNG Industry in Years Ahead 82
8. Special Topic: Small Scale and LNG Bunkering 86
9. Special Topic: Floating LNG 90
10. References Used in the 2019 Edition 94
Appendices 96
1

3
President’s Message
Joe M. KangPresident of the International Gas Union
Yours sincerely,
Dear colleagues,
It is my honour to have been named President of the International Gas Union (IGU) for the 2018-2021 triennium. I look forward to building on the great work that has been done under previous Presidencies, and to intensifying collective efforts to advance the role of liquefied natural gas (LNG) in a sustainable energy future. The IGU is pleased to present the 2019 World LNG Report at LNG19 in Shanghai, highlighting physical and market developments in the LNG industry around the world.
The report demonstrates that 2018 was another strong year for LNG by a range of metrics. For the fifth consecutive year, global LNG trade set a record, reaching 316.5 million tonnes (MT). This marks an increase of 28.2 MT (+9.8% year-on-year) from 2017. Specifically, non-long-term LNG trade reached 99 MT in 2018, an increase of 14.5 MT year-on-year (YOY) and accounted for 31% of total gross LNG trade. This substantial expansion can be attributed to increasingly flexible LNG supply. Most LNG-related prices around the world followed an upward trend in 2018, influenced by rising oil prices and strong LNG demand in Asia. China and South Korea continued to lead demand growth driven by policies to improve air quality.
Global liquefaction build-out was driven largely by capacity additions in Australia, the United States, and Russia. Between January 2018 and February 2019, 36.2 MTPA of liquefaction capacity was added. In an engineering milestone, the first project utilizing a floating liquefaction conversion, Kribi FLNG in Cameroon, was brought online.
2018 marked a positive turn for project developers. Four projects took FIDs in 2018 (Corpus Christi LNG T3, LNG Canada, Greater Tortue FLNG and Tango FLNG), with a number of significant projects expected to reach FIDs in 2019.
The overall global LNG fleet grew by 11.5% in 2018, and spot charter rates soared. As 51.8 MTPA of new liquefaction capacity is expected to start up in 2019, the shipping market may become tighter with only 43 newbuild deliveries targeted in the year.
Global regasification capacity has continued to increase, rising to 824 MTPA by February 2019. Of the under-construction capacity, 36.4 MTPA of much needed capacity is anticipated online during 2019, much of it in India and China. Both markets, however, have struggled to develop related infrastructure at the same pace,
causing challenges for gas to flow to demand centres.
The future looks bright for LNG, and we expect 2019 to be a benchmark year for the industry, with growth in trade and investment. A vibrant LNG industry, and the increased use of natural gas in general, brings great benefits to society. It improves security of electricity supply and offers opportunities to meet emissions targets and facilitate vital access to energy in diverse markets around the globe. It also has a significant impact on improving quality of life by reducing air pollution, especially as population growth continues. A combination of natural gas and renewables will allow the developing world to meet the Paris commitments affordably, without sacrificing economic growth.
Our aim at the IGU is to demonstrate that natural gas has a vital environmental and economic role to play in the sustainable energy future, and that the industry is open to co-operate with the global community towards achieving this future.
MESSAGE FROM THE PRESIDENTOF THE INTERNATIONAL GAS UNION
CONTACT YOUR SHELL LNG EXPERT [email protected]/lngfuel
SHELL CARDISSA FUELLING GAGARIN PROSPECT, THE WORLD’SFIRST CRUDE OIL TANKER TO BE POWERED BY LNG
CLEANER ENERGYSOLUTIONS IN ACHANGING ENVIRONMENT
CLEANER BURNING. Shell LNG can contribute to lower local exhaust emissions and global greenhousegas emissions. It also supports shipping in meeting current and expected IMO MARPOL Annex VI Sulphurand NOx limits.
COST COMPETITIVE. Shell LNG is cost competitive with alternative compliant fuel solutions.
LNG AVAILABILITY. Shell offers a worldwide LNG marine bunker network and continues to develop keysupply locations to serve customers who have committed to LNG fuel as their bunker fuel.
LNG EXPERIENCE & EXPERTISE. Shell is an experienced LNG supplier and works closely with manyleading OEMs. Our expertise can help during ship design processes, logistics planning, emissions calculationsand other marine transport challenges.

4 5
IGU World LNG report - 2019 Edition State of the LNG Industry
1 The scope of this report is limited only to international LNG trade, excluding small-scale projects, unless explicitly stated. Small-scale projects are defined as anything less than 0.5 MTPA for liquefaction, 1.0 MTPA for regasification, and 60,000 cm for LNG vessels. Domestic trade between terminals is also not included.
Global Trade Global Prices Liquefaction plantsShort, Medium, and Long-term LNG Market (as defined in Chapter 10)
316.5 MTGlobal trade
in 2018
$9.78/MMBtu
AverageNortheast Asianspot price, 2018
393 MTPAGlobal nominal
liquefaction capacity,February 2019
99 MTNon-long-term
trade, 2018
For the fifth consecutive year, global LNG trade set a record, reaching 316.5 million tonnes (MT). This marks an increase of 28.2 MT from 2017, equating to 9.8% year-on-year (YOY) growth. The continued growth in trade was supported by increases in LNG output from liquefaction plants ramping-up and coming
Most LNG-related prices around the world followed an upward trend in 2018, influenced by rising oil prices and strong LNG demand in Asia. Several price markers experienced some volatility in the spring and summer months, but a cold winter at the start of the year and active spot buying in China kept prices generally elevated; although Northeast Asian spot prices fell from an average $9.88 per million British thermal units (MMBtu) in January 2018 to a low of $7.20/MMBtu in May
Global liquefaction capacity remains in the extended phase of build-out that began in 2016, driven largely by capacity additions in Australia, the United States, and Russia. Between January 2018 and February 2019, 36.2 million tonnes per annum (MTPA) of liquefaction capacity was added, though 5.6 MTPA was assumed to be decommissioned. In an engineering first, the first project utilizing a floating liquefaction conversion, Kribi FLNG in Cameroon, was brought online. The market where the most liquefaction capacity was added during 2018 was Russia, with 11 MTPA of capacity reaching commercial operations across Yamal LNG T1-2, while Yamal
online, more than offsetting lower production from several legacy projects. Australia led all exporters in incremental growth (+12.2 MT), supported by the new Wheatstone LNG and Ichthys LNG projects. The United States was again the second-largest driver of LNG supply growth, adding 8.2 MT as trains at Sabine Pass LNG operated for the full year and Cove Point LNG came online. Asia remained the driver of international LNG demand growth, as China broke its own record for incremental LNG by importing an additional 15.8 MT in 2018. This was again driven by the strong enforcement of environmental policies designed to promote coal-to-gas switching as well as continued economic growth. Other key markets that drove global LNG growth included South Korea, India, and Pakistan, which took in a combined 12.8 MT of incremental imports. The Pacific Basin continues to be the key driver of trade growth, with intra-Pacific trade flows reaching a record 134.2 MT, supported by Australian production and Chinese demand.
2018, this was 36% higher than their level in May 2017. While this resurgence is notable, spot prices showed some signs of weakness toward the end of 2018, as a thus far mild winter in Asia and Europe, coupled with the continued ramp-up of new supply, started to place downward pressure on spot prices, with average Northeast Asian spot prices falling by 18% between November 2018 and January 2019, landing at $9.36/MMBtu. European spot prices climbed for most of the year, though a large influx of LNG in the fourth quarter of the year began to place some downward pressure on market prices like the United Kingdom’s National Balancing Point (NBP), compounded by the fall in oil prices. After hitting a peak of $9.54/MMBtu in September 2018 – over 50% higher than its level in the previous year – NBP began to decline in October and had reached $7.44/MMBtu by January 2019. As new liquefaction capacity is added in 2019, prices could fall further, particularly during traditional seasonal lulls in demand in the spring and summer months.
LNG T3 reached commercial operations in February 2019. After Russia, the most capacity was added in Australia, where two trains at Wheatstone LNG reached commercial operations in 2018. By mid-2019, the final projects in Australia’s recent build-out, Ichthys LNG and Prelude FLNG, are expected to have reached full commercial operations (a combined 12.5 MTPA). Still, the United States is poised to surpass them both in incremental liquefaction capacity as it brings online over 29 MTPA of liquefaction capacity during 2019. As of February 2019, 101.3 MTPA of liquefaction capacity was under-construction or sanctioned. With increasing optimism for LNG import needs during the 2020s, 21.5 MTPA of liquefaction capacity reached a final investment decision (FID) in 2018. This includes 14 MTPA of capacity at LNG Canada T1-2 and 4.5 MTPA at Corpus Christ LNG T3. Most recently, FID was reached on the 15.6 MTPA Golden Pass LNG project in February 2019, the largest single FID since 16.5 MTPA of capacity at Yamal LNG T1-3 was sanctioned in December 2013.
Non-long-term LNG trade reached 99 MT in 2018, an increase of 14.5 MT YOY, and accounted for 31% of total gross LNG trade. This marks the second year in a row that the non-long-term market has substantially expanded, which can be attributed to growing LNG supply and demand elasticity. As with total global trade, short-term supply and demand growth was strongest in the Pacific Basin. New liquefaction capacity added during the year was contracted mostly to aggregators with diverse LNG trading portfolios. Particularly notable was the increase in short-term supply from Australia, which had the largest increase in non-long-term exports (+6.4 MT) despite holding long-term contracts directly with many end-markets. The largest growth in non-long-term imports was in China, which took in an additional 10 MT YOY from the short-term market as buyers relied heavily on the spot market to satisfy their strong demand growth.
2.State of theLNG Industry1
Barcelona LNG Terminal - Courtesy of Enagas

6 7
State of the LNG Industry
2 While Malta began LNG imports in 2017, its regasification terminal is small-scale at 0.4 MTPA of capacity, and thus is not included in regasification totals. 3 This 80.1 MTPA is included in the global regasification capacity total of 824 MTPA quoted above.4 Data for pipeline trade and indigenous gas production comes from the BP Statistical Review. Data for 2018 is not yet available.
New Liquefaction Proposals
843 MTPAProposed
liquefactioncapacity,
February 2019
After a challenging environment for FIDs in recent years, 2018 marked a positive turn for project developers. Many projects that remained under development during these years
Regasification Terminals
Shipping Fleet
Floating Regasification LNG in the global gas market
Global regasification capacity has continued to increase, rising to 824 MTPA by February 2019. Unlike in 2017, regasification capacity additions did not outpace increases in liquefaction capacity and global trade, with a total 6.2 MTPA of net regasification capacity added during 2018 (22.8 MTPA of new additions minus 16.6 MTPA from floating storage and regasification unit (FSRU) departures over the course of the year). Much of this capacity was added in China (10.6 MTPA), where suppliers sought to increase regasification
The global LNG shipping fleet consisted of 525 vessels at the end of 2018, including conventional vessels and ships
in preparation for the 2018-2019 winter after the market had higher than expected demand in the 2017-2018 winter. Two regasification terminals were added in new markets, Panama and Bangladesh, bringing the number of global LNG markets to 362. Along with the rapid increase in liquefaction capacity expected through the end of the decade, additional regasification capacity is expected to be constructed. Additions will be both in mature markets that are experiencing increased gas demand, as well as in new markets where governments have made developing gas demand a priority. There is an additional 129.7 MTPA of regasification capacity under construction as of February 2019. This includes capacity across several new markets, such as Bahrain, the Philippines, Russia (Kaliningrad), and Ghana. Of under-construction capacity, 36.4 MTPA of capacity is anticipated online during 2019, much of it in India and China. The single-largest under-construction project is in Kuwait, with 11.3 MTPA of regasification capacity expected online in 2021.
acting as FSRUs and floating storage units. The overall global LNG fleet grew by 11.5% in 2018, as 53 carriers were added to the fleet, including four FSRUs. Relative to the previous year, this was a more balanced addition relative to liquefaction capacity, and charter rates for modern fuel-efficient tonnage started the year strong owing to an increase in winter LNG demand in China. After dipping in the spring and summer months to an average of $56,000/day, there was a significant uptick in charter rates owing to the build-up of winter LNG inventories in Northeast Asian markets, with rates soaring to an average $150,000/day in Q4 2018. However, this was short-lived, and spot charter rates had already returned to around $74,000/day by January 2019. Even with the decline from end-2018, it is unlikely that charter rates will return to their 2017 levels as new liquefaction capacity continues to be added to the market, which will help keep rates higher.
Despite the start-up of two offshore projects during 2018, total regasification capacity at operational offshore terminals decreased to 80.1 MTPA. This was due to four FSRUs departing from existing offshore terminals in Brazil, Egypt, the United
Natural gas accounts for just under a quarter of global energy demand, of which 10.7% is supplied as LNG. LNG supply previously grew faster than any
824 MTPAGlobal nominalregasification
capacity,February 2019
525Vessels
LNG fleet,end-2018
80.1 MTPA3
FSRU capacity,February 2019
10.7% of SupplyShare of LNG
in global gas supplyin 20174
Gemmata - Courtesy of Shell
could now be posed to reach FID in 2019. As of February 2019, the total liquefaction capacity of proposed projects reached 845 MTPA, with the majority in the United States and Canada. Beyond those two markets, projects based on massive resource bases have continued to sign offtake agreements or attract new partners which will help reach FID, as is the case in Mozambique and Russia. Qatar has also proposed expanding capacity in the 2020s to ensure it is the largest liquefaction capacity holder in the world. With currently under-construction projects expected to contribute to strong global supply during the 2019-2022 period, many developers are targeting the mid-2020s as the next period in which to bring new liquefaction capacity online. Despite increased optimism in future LNG demand growth, much proposed liquefaction capacity will be challenged by fierce competition for LNG buyers, project financing, and available engineering, procurement, and construction (EPC) contractors.
Arab Emirates, and Argentina (a reduction of 16.6 MTPA). Charters of two FSRUs ended as well, in Kuwait and at Tianjin, China. However, the terminal in the former is likely to receive a replacement vessel, and the latter has already received a replacement FSRU, which boosted receiving capacity at the terminal. As of February 2019, twelve offshore projects were under construction. These terminals are spread between new markets, such as Ghana and Russia (Kaliningrad) and more mature markets, such as India and Brazil. Projects have even been proposed in Australia, a major LNG exporter, with one project signing a time charter for an FSRU in December 2018 to meet periodic surges in gas demand. As of February 2019, twelve FSRUs (including conversions) were on the order book of shipbuilding yards. Furthermore, several FSRUs were open for charter, with some being used as conventional LNG carriers, indicating no immediate shortage of vessels for offshore terminals.
other natural gas supply source – averaging 8.3% per annum from 2000 to 2010, although growth stalled in the early 2010s as indigenous production and pipeline supply competed for growing global gas markets. The large increases in global liquefaction capacity and international LNG trade have enabled a return to robust growth in LNG consumption. The 10.7% share of total gas consumption for LNG in 2017 marks the second consecutive year of share growth and a new record.
With the increasing importance of environmental regulation globally, interest in the use of natural gas and LNG in marine shipping is continuing to grow. Companies are ordering and taking delivery of smaller LNG bunkering vessels, which load LNG from regasification terminals or other small-scale facilities to directly fuel the expanding fleet of LNG-fuelled vessels. Although each individual cargo is small, in aggregate these volumes are anticipated to grow consistently, with sectoral demand potentially surpassing 25 MTPA by 2030.
IGU World LNG report - 2019 Edition

Joined the club ofLNG exporterswith the world’ssecond floatingliquefaction project
Cameroon
Two new markets beganreceiving LNG supply in 2018
Bangladeshand Panama
LNG import growth in 2018 was driven by China and South Korea,the world’s second- and third-largest LNG importers.
of the increasein net trade
Represented nearly
80%Combinedincrementalgrowth of 22.2MT
Australia led allexporters in
incrementalgrowth
Increased by
28.2MTSetting a newannual record of
316.5MT
5thconsecutive yearof incremental growth
3rdlargest annualincrease ever(behind only 2010and 2017)
LNG Trade
3.LNG TradeGlobal LNG trade increasedsharply in 2018
IGU World LNG report - 2019 Edition
8 9

10 11
LNG TradeIGU World LNG report - 2019 Edition
LNG Carrier Pyeongtaek - Courtesy of KOGAS
Global trade increased sharply again in 2018, following a strong performance in 2017, rising by 28.2 MT to reach 316.5 MT. This marks the fifth consecutive year of incremental growth, and the third-largest annual increase ever (behind only 2010 and 2017). The increase was driven by higher production at new liquefaction plants in Australia, the United States, and Russia. Legacy projects had mixed results, with production falling in Malaysia owing to pipeline issues. Beyond large exporters adding new liquefaction trains, Cameroon joined the club of LNG exporters with the world’s second floating liquefaction project coming online during the first half of 2018. As was the case in 2017, LNG import growth in 2018 was driven by China and South Korea, the world’s second- and third-largest LNG importers. Two new markets began receiving LNG supply in 2018: Bangladesh and Panama.
China and South Korea returned as the drivers of LNG import demand in 2018, following incremental growth of 12.0 and 4.2 MT in 2017, respectively, with growth of 15.8 and 6.4 MT in 2018. Their combined incremental growth of 22.2 MT in 2018 represented nearly 80% of the increase in net trade; this builds on what had already been an impressive 50% in 2017. The 15.8 MT of incremental import growth in China was the largest ever for a single market, surpassing a mark that was also set by China only in 2017. In contrast, LNG imports declined by 3.7 MT in Egypt as domestic gas production from the Zohr field and the West Nile Delta region surged. Egypt had previously been a key driver of LNG demand growth, rising to 7.3 MT of imports in 2016 despite only receiving its first cargo during 2015. Both China and Egypt are examples of the shifts that can occur in LNG import patterns where LNG is used flexibly as an alternative to other gas supply sources.
Supply is poised to rise again in 2019 as global liquefaction capacity remains in a period of expansion. Growth in international LNG trade during 2019 is likely to be driven by the same set of markets as in 2018, with Australia concluding its multi-year expansion, full-year performance of new Russian projects, and the United States adding new trains and projects throughout the year. Import demand growth is expected to be driven by markets across Asia, including China, India, Pakistan, and Bangladesh. The ability of markets to absorb new incremental supply may be tested absent demand stimuli, which could push more LNG into regions with ample natural gas infrastructure and market liquidity. This trend began to manifest during the final quarter of 2018, with record LNG imports into Europe for a fourth quarter. New markets are also likely to provide small pockets of import demand growth, particularly via the use of rapidly-deployable FSRUs or floating storage units as is expected to be the case in Russia (Kaliningrad) and Bahrain, respectively.

12 13
LNG Trade
1 Owing to improved data availability and partial-cargo tracking methodology, some historical trade numbers have been restated.2 Please refer to Chapter 10: References for an exact definition of each region.
3 All counts and totals within this section include all markets that imported LNG on conventionally-sized LNG carriers and above even if they only have small-scale (<0.5 MTPA) regasification capacity, such as Jamaica and Malta. They also exclude markets that buy cargoes exclusively from domestic liquefaction plants, such as Indonesia. Refer to Chapter 10: References for a description of the categorization of small-scale versus large-scale LNG.
Imports into Asia-Pacific and Asia markets (the distinction between these regions is illustrated in Section 10.3) increased again during 2018. However, due to the significant growth in China and support from other regional markets, Asia was the only region to increase its share of global imports, rising by 5.3 percentage points to 27.1% of total trade. The other Asian markets to experience strong incremental growth were India (+4.0 MT), Pakistan (+2.4 MT), and Bangladesh (+0.7 MT). In the Asia-Pacific region, import growth was driven primarily by South Korea (+6.4 MT), with small additions in Thailand, Singapore, and Chinese Taipei (+1.5 MT). However, with Japanese imports contracting slightly, the region’s share of LNG import trade fell under 50% for the first time since the mid-1970s.
The addition of Bangladesh and Panama brought the number of importing markets to 37, with the pair recording a combined 0.9 MT of imports.3 Looking forward, a handful of new markets are expected to start importing LNG during 2019, including Bahrain and Russia (Kaliningrad). Incremental growth is also anticipated across most markets that came online in 2015-18. In contrast, improving natural gas supply balances in markets such as Egypt and Argentina are likely to reduce the need for LNG imports in those markets. Given expectations of seasonal gas surplus in Argentina, LNG import reliance may also fall in neighbouring Chile, to which pipeline gas exports restarted late in 2018. In fact, a previously-idle floating liquefaction vessel is expected to allow LNG exports from Argentina during 2019, although they will likely amount to less than 0.5 MT of incremental supply.
European LNG imports increased YOY for the fourth consecutive year (+3.4 MT). This increase occurred despite net negative incremental growth through the first three quarters of the year, as the fourth quarter of the year was the second strongest quarter ever for net imports into the region (behind Q1 2011). In both absolute and relative terms, the strongest gains were experienced in the North-western European markets of the Netherlands and Belgium, which had incremental growth of 1.3 MT and 1.4 MT (+184% and +132% YOY), respectively. Incremental LNG import growth was repeated in other well-connected and mature European gas markets, including France, Italy, and Turkey (combined +1.5 MT YOY), while the UK arrested its
2017-2018 LNG Trade in Review
two-year slide, with imports rising to 5.0 MT (+0.3 MT YOY). Three European LNG markets contracted by a combined 2.1 MT in 2018: Spain, Greece, and Lithuania.
There was limited incremental growth in LNG imports on a regional level in North America and Latin America in 2018 (+0.3 MT YOY for each region). Of all markets in the two regions, the strongest incremental growth was in Brazil (+0.4 MT YOY), due to domestic issues that necessitated LNG to meet temporary gaps in supply that domestic production could not fill. Other gains were experienced in Puerto Rico (the United States), where demand recovered after a low year in 2017 caused by Hurricane Maria, as well as LNG for power sector consumption in Colombia and Panama. With an improving natural gas balance in Argentina, lower LNG imports were required in that market as well as in neighbouring Chile, which was able to import gas from its neighbour on the Southern Cone.
European LNG imports during 2019 are likely to be shaped by dynamics that began to emerge towards the end of 2018, including readily-available LNG supply, decreasing European domestic gas production, and increasing gas demand, including both industrial sector growth and competition between gas and coal in the power sector. If these conditions persist, high levels of LNG could be delivered to the interconnected and highly-liquid natural gas markets across Europe. However, the behaviour of pipeline suppliers will be a major factor in determining how much LNG arrives at European terminals. Even after exporting record volumes to Europe during 2018, Russia retains additional export capacity, which could result in increased competition with LNG, particularly if global LNG prices rise on higher demand.
From a supply perspective, the balance of new production is expected to continue shifting towards the Atlantic Basin during 2019. New projects in the United States and Russia are likely to have strong incremental growth throughout the year. The last two projects in Australia’s current expansion queue – Prelude FLNG and Ichthys LNG T2 – will come online during the year as well. In all three markets, trains that came online during 2018 will benefit from being run for the full year during 2019.
Global LNG Trade LNG Exporters & Importers LNG Re-Exports LNG Price Change
Growth of global LNG trade Number of new LNG importers in 2018
Re-exported volumes increased by 46% YOY in 2018
Rise in average Northeast Asian spot price from 2017 to 2018, in MMBtu
Global LNG trade reached an all-time high of 316.5 MT in 2018, setting a record for the fourth consecutive year.
China provided 15.8 MT in new import demand, while new records were reached in South Korea and India, as the pair added 6.4 MT and 4.0 MT, respectively.
Contractions were largest in Egypt, the UAE, and Spain (-3.7 MT, -1.4 MT, and -1.4 MT, respectively).
Bangladesh and Panama became LNG importers during 2018 after their first terminals came online. In Bangladesh, an offshore terminal began supplying the regional gas network, while in Panama an onshore terminal provides LNG for use at the market’s first gas-fired power plant.
While most liquefaction capacity was added in markets already exporting LNG, a floating liquefaction project came online in Cameroon, raising the number of exporters to 19.
Re-export activity rose in 2018, supported by increased activity during the first quarter of 2018 as persistently-high Asian LNG prices attracted cargoes.
The start of Yamal LNG resulted in an increase in re-exports as well, as much of the plant’s production is transferred from specialized ice-class LNG carriers to conventional carriers in Europe for onward sale.
While Northeast Asian prices still experienced seasonal variability in 2018, they generally increased throughout the year, reaching $10.38/MMBtu in December.
After hitting a peak of $9.54/MMBtu in September 2018, NBP began to decline in October owing to the influx of LNG and mild temperatures, and reached $8.29/MMBtu by November 2018.
Figure 3.1 LNG Trade Volumes, 1990-2018
Source: IHS Markit, IEA, IGU
45
40
35
30
25
20
15
10
5
0
900
800
700
600
500
400
300
200
100
0
1990
1991
1992
1993
1994
1995
1996
1997
1998
1999
2000
2001
2002
2003
2004
2005
2006
2007
2008
2009
2010
2011
2012
2013
2014
2015
2016
2017
2018
No. of CountriesMTPA
Global Regasification Capacity
Total Volumes of LNG Trade
No. of LNG Exporting Countries (right axis)
No. of LNG Importing Countries (right axis)
3.1
Qatar, 78.7, 24.9%Australia, 68.6, 21.7%Malaysia, 24.5, 7.7%U S, 21.1, 6.7%Nigeria, 20.5, 6.5%Russia, 18.9, 6%Indonesia, 15.2, 4.8%Trinidad, 12.2, 3.9%Algeria, 10.3, 3.3%Oman, 9.8, 3.1%PNG, 6.9, 2.2%Brunei, 6.4, 2%UAE, 5.5, 1.7%Norway, 4.6, 1.5%Angola, 4.1, 1.3%Peru, 3.6, 1.1%Eq. Guinea, 3.5, 1.1%Egypt, 1.4, 0.5%Cameroon, 0.6, 0.2%Yemen, 0, 0%
3.2
16
12
8
4
0
-4
Aust
ralia
, 68.
6
US,
21.
1
Russ
ia, 1
8.9
Qat
ar, 7
8.7
Trin
idad
, 12.
2
Om
an, 9
.8
Cam
eroo
n, 0
.6
Nor
way
, 4.6
Egyp
t, 1.
4
Ango
la, 4
.1
UAE
, 5.5
Yem
en, 0
Eq. G
uine
a, 3
.5
Brun
ei, 6
.4
Peru
, 3.6
Nig
eria
, 20.
5
Indo
nesi
a, 1
5.2
PNG
, 6.9
Alge
ria,
10.
3
Mal
aysi
a, 2
4.5
North America Europe FSU Latin America Africa Asia-Pacific Middle East12.2
8.2 7.8
2.0 1.5 1.5 0.6 0.6 0.6 0.5 0.30 -0.1 -0.3 -0.6 -0.6 -0.8 -1.3 -1.9 -2.0
MT
3.3
In 2018, the number of LNG-exporting markets rose to 19 as the 2.4 MTPA Kribi FLNG project came online in Cameroon. Political instability in Yemen has continued to prevent the resumption of LNG exports since they were halted in mid-2015. The single greatest increase in LNG exports occurred again in Australia (+12.2 MT), owing to new trains coming on-stream, and higher utilization at existing facilities. The other primary contributors to incremental LNG supply were the United States and Russia, which added 8.2 and 7.8 MT, respectively, across new and existing trains. After falling during 2017, global re-export activity increased by 46% YOY, with 3.9 MT re-exported by 11 markets during the year (the same set of 11 markets that re-exported LNG in 2017).
The Asia-Pacific region2 continues to be the leading LNG-exporting region, supplying 38.4% of total exports (121.6 MT). This share is consistent with its share of global exports since 2016, when it became the largest LNG-exporting region after being second to the Middle East from 2010-15. Growth in exports from the Asia-Pacific was supported both by new trains coming online and higher production from existing trains in Australia. Production from existing projects declined from most other Asia-Pacific exporters, including Malaysia, Indonesia, Brunei, and Papua New Guinea (down a combined 4.4 MT YOY in 2018). Lower production in Papua New Guinea was caused by the plant going offline for several months in the first half of the year after an earthquake caused damage to associated infrastructure. Although the Asia-Pacific has grown in importance as an LNG-exporting region in recent years, Qatar remained the largest LNG-exporting market by a sizeable, but shrinking margin. The market accounted for around 25% of total global LNG exports in 2018 (78.7 MT). Australia was second with 22% of global supply (68.6 MT of exports).
The United States continued its expected ramp-up of exports, rising by 8.2 MT as Cove Point LNG came online and production increased at trains at Sabine Pass LNG. Additionally, the first commissioning cargoes from Corpus Christ LNG were lifted during the final quarter of the year. There were mixed results across the rest of the Atlantic Basin. LNG exports declined in Nigeria and Algeria by 0.6 MT and 1.9 MT, respectively; the latter may have been impacted by higher sales of pipeline gas to Europe. New upstream projects that came online
3.1OVERVIEW
Globally-traded LNG volumes increased by 28.2 MT in 2018, setting a new annual record of 316.5 MT1 (see Figure 3.1). Combined with 2017, this marks the strongest two-year growth period for international LNG demand since 2010-11. Similarly-strong growth is anticipated in 2019 as a wave of projects sanctioned in 2013-15 come online and others reach nameplate production capacity.
316.5 MTGlobal LNG trade reached a
historic high in 2018
IGU World LNG report - 2019 Edition
in Trinidad throughout 2017 resulted in production rising to 12.2 MT in 2018, nearly recovering to 2015 levels. Stronger performances were also recorded at projects in Norway and Angola, along with new production from Cameroon’s Kribi FLNG (a combined +1.7 MT YOY). An improved gas balance allowed for more LNG exports to be loaded from Egypt during the year as well (1.4 MT was exported in 2018); this figure could rise again in 2019.

14 15
LNG Trade
Figure 3.4 Share of Global LNG Exports by Market, 1990-2018
Figure 3.5: Re-exports by Market, 2005-2018
Figure 3.6: LNG Exports by Region, 1990-2018
Sources: IHS Markit, IGU
100%
80%
0%1990 1994 1998 2002 2006 2010 2014 2018
20%
40%
60%
% Share
3.4
3.5
SpainBelgiumUSBrazilFranceMexicoPortugalNetherlandsSouth KoreaIndiaSingaporeUnited KingdomDom. Rep.Japan
7
6
5
4
3
2
1
0
MT
2005 2007 2009 2011 2013 2015 2017
3.6
1990 1994 1998 2002 2006 2010 2014 2018
MT
350
300
250
200
150
100
50
0
Qatar Australia Malaysia Nigeria IndonesiaUS Algeria Russia Trinidad OmanPNG Brunei UAE Peru NorwayAngola Eq. Guinea Egypt Cameroon YemenLibya
Middle East Asia Pacific Africa Latin AmericaFSU Europe North America
The lead in LNG production that was established by the Asia-Pacific region in 2016 was expanded upon again during 2018, with regional production rising to 121.6 MT (+7.9 MT YOY; see Figure 3.6). The Middle East remained the clear second-place exporting region owing to Qatar’s industry-leading 77 MT of nameplate liquefaction capacity. The Middle East received additional support with better output at Oman LNG, although exports from the United Arab Emirates remained flat. Exports from Yemen LNG have yet to restart owing to domestic instability in the market.
LNG supply from North America was driven entirely by the United States, which benefitted from year-long production at Sabine Pass LNG T3 and T4 plus the start-up of Cove Point LNG. Commissioning volumes from Sabine Pass LNG T5 and Corpus Christi LNG T1 were also loaded during the final quarter of the year. In Latin America, exports increased for the second consecutive year (+0.9 MT) owing to increased exports from Atlantic LNG in Trinidad given better feedstock availability. Production fell at Peru LNG, which experienced issues with feedstock and loading cargoes due to multiple weather-related disruptions.
During 2019, LNG exports from the Americas are likely to be supported again by increased production from the United States given the expected start-up of trains at Corpus Christi LNG, Elba Island LNG, Freeport LNG, and Cameron LNG. Increased production from Trinidad is a possibility as well, although support from cross-border Venezuelan feedstock may have to wait until after 2019 as a deal was reached only in the second half of 2018. Somewhat surprisingly, surging domestic production in Argentina is allowing for seasonal gas exports. After the market chartered an idle LNG FPSO vessel in late 2018, the Tango FLNG project is set to export up to 0.5 MT during 2019 from the market’s Bahia Blanca port.
Given stronger production from Yamal LNG, which supported re-export trade during 2018, re-exports may increase in the near term. However, re-exports based on price arbitrage plays, which had been the strongest driver of re-exports in the past, may be challenged in the short run with an expected tighter shipping market and the materialization of an abundance of LNG supply. Seasonal or logistical re-export plays, such as is the case in Singapore or Brazil, may help underpin re-export trade to a degree.
Re-exported trade recovered during 2018, increasing by 46% to 3.9 MT (just over 1% of global trade). The number of markets that re-exported LNG remained at 11, the same markets that re-exported cargoes during 2017. The recovery in re-exports was reflective of higher opportunity for arbitrage plays between basins during the early part of the year. More support for re-export trade came from the start of production from Yamal LNG, as much of the production is re-loaded from specialized ice-class carriers on to conventional carriers at European terminals. Re-exports increased from all five European re-exporters – France, Belgium, the Netherlands, Spain, and the UK – accounting for 2.9 MT of total re-export trade. Changes to Spanish regulations made during 2018 may encourage a return of re-export activity from the market during 2019; previously, over 1 MT of re-exports occurred from Spain annually between 2012-2015. Beyond Europe, re-exports were strong in Singapore, rising for the third straight year to 0.7 MT as the market increases its position as an LNG hub in the Pacific Basin.
3.9 MTRe-exported LNG volumes in 2018
Note: Re-exports figures exclude volumes that were reloaded and discharged within the same market.Sources: IHS Markit
Note: FSU = Former Soviet UnionSources: IHS Markit, IGU
Figure 3.3. 2018 Incremental LNG Exports by Market Relative to 2017 (in MT)
Sources: IHS Markit, IGU
45
40
35
30
25
20
15
10
5
0
900
800
700
600
500
400
300
200
100
0
1990
1991
1992
1993
1994
1995
1996
1997
1998
1999
2000
2001
2002
2003
2004
2005
2006
2007
2008
2009
2010
2011
2012
2013
2014
2015
2016
2017
2018
No. of CountriesMTPA
Global Regasification Capacity
Total Volumes of LNG Trade
No. of LNG Exporting Countries (right axis)
No. of LNG Importing Countries (right axis)
3.1
Qatar, 78.7, 24.9%Australia, 68.6, 21.7%Malaysia, 24.5, 7.7%U S, 21.1, 6.7%Nigeria, 20.5, 6.5%Russia, 18.9, 6%Indonesia, 15.2, 4.8%Trinidad, 12.2, 3.9%Algeria, 10.3, 3.3%Oman, 9.8, 3.1%PNG, 6.9, 2.2%Brunei, 6.4, 2%UAE, 5.5, 1.7%Norway, 4.6, 1.5%Angola, 4.1, 1.3%Peru, 3.6, 1.1%Eq. Guinea, 3.5, 1.1%Egypt, 1.4, 0.5%Cameroon, 0.6, 0.2%Yemen, 0, 0%
3.2
16
12
8
4
0
-4
Aust
ralia
, 68.
6
US,
21.
1
Russ
ia, 1
8.9
Qat
ar, 7
8.7
Trin
idad
, 12.
2
Om
an, 9
.8
Cam
eroo
n, 0
.6
Nor
way
, 4.6
Egyp
t, 1.
4
Ango
la, 4
.1
UAE
, 5.5
Yem
en, 0
Eq. G
uine
a, 3
.5
Brun
ei, 6
.4
Peru
, 3.6
Nig
eria
, 20.
5
Indo
nesi
a, 1
5.2
PNG
, 6.9
Alge
ria,
10.
3
Mal
aysi
a, 2
4.5
North America Europe FSU Latin America Africa Asia-Pacific Middle East12.2
8.2 7.8
2.0 1.5 1.5 0.6 0.6 0.6 0.5 0.30 -0.1 -0.3 -0.6 -0.6 -0.8 -1.3 -1.9 -2.0
MT
3.3
3.2LNG EXPORTS BY MARKET
Figure 3.2. 2018 LNG Exports and Market Share by Market (in MT)
Note: Numbers in the legend represent total 2018 exports in MT, followed by market share.Sources: IHS Markit, IGU
45
40
35
30
25
20
15
10
5
0
900
800
700
600
500
400
300
200
100
0
1990
1991
1992
1993
1994
1995
1996
1997
1998
1999
2000
2001
2002
2003
2004
2005
2006
2007
2008
2009
2010
2011
2012
2013
2014
2015
2016
2017
2018
No. of CountriesMTPA
Global Regasification Capacity
Total Volumes of LNG Trade
No. of LNG Exporting Countries (right axis)
No. of LNG Importing Countries (right axis)
3.1
Qatar, 78.7, 24.9%Australia, 68.6, 21.7%Malaysia, 24.5, 7.7%U S, 21.1, 6.7%Nigeria, 20.5, 6.5%Russia, 18.9, 6%Indonesia, 15.2, 4.8%Trinidad, 12.2, 3.9%Algeria, 10.3, 3.3%Oman, 9.8, 3.1%PNG, 6.9, 2.2%Brunei, 6.4, 2%UAE, 5.5, 1.7%Norway, 4.6, 1.5%Angola, 4.1, 1.3%Peru, 3.6, 1.1%Eq. Guinea, 3.5, 1.1%Egypt, 1.4, 0.5%Cameroon, 0.6, 0.2%Yemen, 0, 0%
3.2
16
12
8
4
0
-4
Aust
ralia
, 68.
6
US,
21.
1
Russ
ia, 1
8.9
Qat
ar, 7
8.7
Trin
idad
, 12.
2
Om
an, 9
.8
Cam
eroo
n, 0
.6
Nor
way
, 4.6
Egyp
t, 1.
4
Ango
la, 4
.1
UAE
, 5.5
Yem
en, 0
Eq. G
uine
a, 3
.5
Brun
ei, 6
.4
Peru
, 3.6
Nig
eria
, 20.
5
Indo
nesi
a, 1
5.2
PNG
, 6.9
Alge
ria,
10.
3
Mal
aysi
a, 2
4.5
North America Europe FSU Latin America Africa Asia-Pacific Middle East12.2
8.2 7.8
2.0 1.5 1.5 0.6 0.6 0.6 0.5 0.30 -0.1 -0.3 -0.6 -0.6 -0.8 -1.3 -1.9 -2.0
MT
3.3
While most of liquefaction capacity added was in markets that were already exporting LNG, the 2.4 MTPA Kribi FLNG project came online during 2018, increasing the number of LNG exporting markets to 19. Additional LNG supply was available in both the Atlantic and Pacific Basins, with Australia and the United States (+12.2 MT and +8.2 MT, respectively) providing 72% of net new supply (see Figure 3.3). The other key contributor to global supply was at Yamal LNG in Russia; the first train reached commercial operations early in 2018, followed by the second train later in the year. The third train launched commissioning cargoes late in the final quarter of 2018 and was announced to start commercial production in early 2019. With consistent exports at Sakhalin-2 LNG, Yamal LNG production contributed to Russia’s incremental supply growth of 7.8 MT. Performances were mixed at older projects across both basins, with total net gains in LNG supply amounting to 16.4 MT in the Atlantic Basin and 7.7 MT from the Pacific Basin. Beyond the aforementioned three leaders, the largest absolute changes YOY were from Malaysia (-2.0 MT), Qatar (+2.0 MT), and Algeria (-1.9 MT).
With exports of 78.7 MT, Qatar continued to be the largest LNG exporter, a position it has held for over a decade. Qatar’s global market share continued to fall however (to 25%), as its production remains mostly stable while exports from other markets have grown (see Figure 3.2).
There has been a slight shake-up in the rankings of LNG exporters, with the United States jumping to fourth (21.1 MT) in 2018. Australia and Malaysia remained second and third, respectively. Australia continued to close the gap with Qatar, cutting the latter’s lead to 10 MT in 2018; this could potentially be closed during 2019 given new production
Following strong LNG production during 2017, eight markets failed to match their totals from the previous year in 2018 (see Figure 3.3). Indonesian exports continued to decline owing to maturing feedstock sources, as well as more gas being required for the domestic market. In Algeria, feedstock for LNG was instead used to boost pipeline gas exports to Europe. Production also fell in Papua New Guinea, Malaysia, and Peru, where issues with midstream infrastructure caused either by natural disasters or technical issues reduced annual LNG output.
Of exporters with YOY growth, gains were limited outside of the three key growth markets. From legacy projects, increased production was apparent at Trinidad and Oman owing to better
upstream performances (each one +1.5 MT YOY). Additional production due to better plant performance occurred in Norway and Angola, although the latter continues to operate below nameplate capacity. An improved gas supply balance in Egypt enabled a slow return to higher LNG exports, although production remains well below nameplate value. Cameroon began exporting LNG during 2018, with 0.6 MT of production from the 2.4 MTPA Kribi FLNG – the world’s first LNG floating production storage and offloading (FPSO) unit converted from an LNG carrier. During 2019, small incremental volumes are expected to be provided by another floating liquefaction vessel that will be stationed at Bahia Blanca in Argentina, enabling seasonal LNG exports.
IGU World LNG report - 2019 Edition
from Prelude FLNG and Ichthys LNG. Nigeria clung to the fifth position with 20.5 MT, but Russia is likely to surpass Nigeria and possibly even Malaysia during 2019 as production from Yamal LNG increases.

16 17
LNG Trade
3.3LNG IMPORTS BY MARKET
New markets continue to play a minor role in LNG demand growth, with all new importers across 2016, 2017, and 2018 (five markets), amounting to just 1.3 MT in incremental growth in 2018 (total imports from those five markets reached just 1.8 MT). The class of 2015 importers have provided slightly more support, with Pakistan adding 2.4 MT and Poland 0.7 MT (the two combined for a total 9.1 MT of imports in 2018). However, the third new importer of 2015, Egypt, experienced the largest contraction of all LNG markets (-3.7 MT YOY), cancelling out the contributions to global trade from that group. Instead, the major Asia and Asia Pacific4 markets again boosted LNG imports, with China and South Korea increasing their LNG take by 15.8 MT and 6.4 MT YOY, respectively.
Asia Pacific remained the largest importing region by a wide margin in 2018, although its share of global trade fell under 50% for the first time since the mid-1970s, to 48%. This is the fifth straight year of declining market share for the region, which is reflective largely of the rise of imports into Asia, led by China, and a continued recovery in European imports. Demand in Asia-Pacific continues to be led by Japan (83.2 MT), with South Korea (44.5 MT) reaching a new annual record for imports during 2018. Despite higher production from Australia, intra-Asia-Pacific trade decreased in 2018 given lower output from other regional producers and slower imports into Japan. Still, intra-regional trade amounted to 81.8 MT during 2018.
In Japan, imports declined modestly (-0.6 MT YOY) given lower LNG requirements from the power sector. The market remains the single-largest LNG importer, representing over 26% of total global LNG trade. South Korea, which had been the second-largest market as recently as 2016, showed strong LNG import growth for its part, rising by 6.4 MT in 2018. A cold end to the 2017-2018 winter as well as limits on the availability of coal and nuclear power capacity supported LNG imports in the market. Japanese and South Korean imports continued to be increasingly sourced from Australian projects, as well as traditionally key suppliers Qatar and Malaysia.
Asia firmed up its position as the second-largest importing region during 2018, recording the highest increase by region (+22.2 MT YOY) to reach 85.9 MT. Asia’s share of global LNG trade has risen every year since China became the first importer in the region to receive LNG in 2006. The increase in Asian imports was driven by China, which surpassed its own record for incremental growth for a single market set last year by increasing LNG imports by 15.8 MT (+41% YOY). This was the third consecutive year in which China led all markets in incremental LNG import growth, and it has established itself as the clear second-largest LNG market globally. This increase in LNG imports during 2018
Figure 3.8: Incremental 2018 LNG Imports by Market & Incremental Change Relative to 2017 (in MT)
Japan, 83.2, 25.4%China, 54.8, 16.7%S. Korea, 44.5, 13.6%India, 23.3, 7.1%Chinese Taipei, 17.1, 5.2%Spain, 10.8, 3.3%Turkey, 8.5, 2.6%France, 8.4, 2.6%Pakistan, 7.1, 2.2%Italy, 6.3, 1.9%Mexico, 5.1, 1.6%UK, 5.0, 1.5%Thailand, 4.5, 1.4%Kuwait, 3.5, 1.1%Chile, 3.1, 1%Portugal, 2.9, 0.9%US, 2.8, 0.9%Singapore, 2.7, 0.8%Argentina, 2.6, 0.8%Jordan 2.6, 0.8%Belgium, 2.4, 0.7%Egypt, 2.3, 0.7%Other, 16.0, 4.4%
Chin
a, 5
4.8
S. K
orea
, 44.
5
Indi
a, 2
3.3
Paki
stan
, 7.1
Belg
ium
, 2.4
Net
herl
ands
, 2
Oth
er, 2
2.4
Fran
ce, 8
.4
Thai
land
, 4.5
Pola
nd, 2
Bang
lade
sh, 0
.7
Turk
ey, 8
.5
Sing
apor
e, 2
.7
Braz
il, 1
.9
US,
1.3
Chin
ese
Taip
ei, 1
7.1
UK,
5
Chile
, 3.1
Lith
uani
a, 0
.6
Gre
ece,
0.7
Arge
ntin
a, 2
.6
Japa
n, 8
3.2
Jord
an, 2
.6
UAE
, 0.8
Spai
n, 1
0.8
Egyp
t, 2.
3
North AmericaEurope FSULatin AmericaAsia-PacificAfrica Asia Middle East Other15.8
6.44.0
2.4 1.4 1.3 1.1 0.9 0.8 0.7 0.7 0.6 0.5 0.4 0.3 0.3 0.3
-0.2 -1.4-1.4-0.8-0.6-0.6-0.4-0.3
-3.7
3.7
3.8
3.9
4,000
3,500
3,000
2,500
2,000
1,500
1,000
500
0
Bcm CAGR (2000-2017)
2000 2003 2006 2009 2012 2015
Consumed where producedLNG Pipeline
6.4%
3.1%
1.8%
Although the large natural gas markets of the United States Lower 48 and Canada continue to take small volumes of LNG, minor growth in North American imports was supported by recovery in Puerto Rico (US) following Hurricane Maria in 2017 and delays in additional pipeline capacity in Mexico, with the region as a whole rising by 0.6 MT YOY.
In Latin America, Brazil LNG imports were supported by short-term power sector demand necessitating LNG imports during the second half of the year. However, total Latin American imports were essentially flat (+0.01 MT YOY) as annual LNG imports into Argentina declined for the fifth consecutive year to just 2.6 MT (-0.6 MT). Domestic gas production has responded positively to policy changes and more investment in the market in recent years, leading to higher output from its vast unconventional resource base. Still, midstream bottlenecks prevent domestic resources from fully meeting winter gas demand in population centres along the coast, thus LNG imports remain consistent during periods of peak demand. However, surging gas production has enabled natural gas exports during low-demand periods, reducing LNG import requirements in neighbouring Chile. In fact, natural gas is set to be exported as LNG from Argentina via Tango FLNG during 2019.
Because Egypt is the only LNG-importing market in Africa, the region had the largest decline (-3.7 MT) as the market’s improved domestic production removed the need for LNG imports. Beyond Africa, the only other region to experience declining LNG imports during 2018 was the Middle East, which fell by 2.2 MT to a total of 7.4 MT for 2018. The decline in LNG imports in the region was most apparent in the UAE and in Jordan (-1.4 MT and -0.8 MT, respectively). In the former, stronger domestic production helped replace imported LNG. In the latter, a reduced need for LNG to be imported via the Aqaba terminal for export via pipeline to Egypt was responsible for the decline. Despite the Middle East being home to the world’s largest LNG exporter, Qatar, the region received just 2.2 MT (30%) of its total imports from the Middle East during 2018.
Figure 3.7. 2018 LNG Imports and Market Share by Market (in MT)
Japan, 83.2, 25.4%China, 54.8, 16.7%S. Korea, 44.5, 13.6%India, 23.3, 7.1%Chinese Taipei, 17.1, 5.2%Spain, 10.8, 3.3%Turkey, 8.5, 2.6%France, 8.4, 2.6%Pakistan, 7.1, 2.2%Italy, 6.3, 1.9%Mexico, 5.1, 1.6%UK, 5.0, 1.5%Thailand, 4.5, 1.4%Kuwait, 3.5, 1.1%Chile, 3.1, 1%Portugal, 2.9, 0.9%US, 2.8, 0.9%Singapore, 2.7, 0.8%Argentina, 2.6, 0.8%Jordan 2.6, 0.8%Belgium, 2.4, 0.7%Egypt, 2.3, 0.7%Other, 16.0, 4.4%
Chin
a, 5
4.8
S. K
orea
, 44.
5
Indi
a, 2
3.3
Paki
stan
, 7.1
Belg
ium
, 2.4
Net
herl
ands
, 2
Oth
er, 2
2.4
Fran
ce, 8
.4
Thai
land
, 4.5
Pola
nd, 2
Bang
lade
sh, 0
.7
Turk
ey, 8
.5
Sing
apor
e, 2
.7
Braz
il, 1
.9
US,
1.3
Chin
ese
Taip
ei, 1
7.1
UK,
5
Chile
, 3.1
Lith
uani
a, 0
.6
Gre
ece,
0.7
Arge
ntin
a, 2
.6
Japa
n, 8
3.2
Jord
an, 2
.6
UAE
, 0.8
Spai
n, 1
0.8
Egyp
t, 2.
3
North AmericaEurope FSULatin AmericaAsia-PacificAfrica Asia Middle East Other15.8
6.44.0
2.4 1.4 1.3 1.1 0.9 0.8 0.7 0.7 0.6 0.5 0.4 0.3 0.3 0.3
-0.2 -1.4-1.4-0.8-0.6-0.6-0.4-0.3
-3.7
3.7
3.8
3.9
4,000
3,500
3,000
2,500
2,000
1,500
1,000
500
0
Bcm CAGR (2000-2017)
2000 2003 2006 2009 2012 2015
Consumed where producedLNG Pipeline
6.4%
3.1%
1.8%
Note: Number legend represents total imports in MT, followed by market share %. “Other” includes markets with imports less than 2.0 MT (by order of size): Poland, the Netherlands, Brazil, Malaysia, the Dominican Republic, the United Arab Emirates, Greece, Bangladesh, Lithuania, Israel, Canada, Malta, Jamaica, and Colombia.Sources: IHS Markit, IGU
Note: “Other” includes markets with incremental imports of less than ±0.2 MT: Malaysia, Italy, Mexico, Kuwait, Portugal, the Dominican Republic, Malta, Panama, Israel, Canada, Jamaica, and Colombia.Sources: IHS Markit, IGU
was reflective of the continued enforcement of environmentally-driven policies mandating coal-to-gas switching in addition to sustained economic growth in the market.
South Asia was also an important region for incremental LNG import growth. The three importers in the region added 7.1 MT of LNG imports YOY. India had the third-largest incremental growth of any market in 2018, solidifying its position as the fourth-largest LNG importer. LNG cargoes were required as demand in India’s power, fertilizer, and industrial sectors rose at a rate that could not be matched by domestic gas production. In Pakistan, strong domestic demand supported LNG imports, although infrastructure bottlenecks and financial issues restricted the ability of the market to absorb even more LNG. Bangladesh received its first LNG cargo, in part to complement declining indigenous production. All three of these markets are likely to experience continued import growth during 2019. Buyers in Asia continued to source primarily from a mix of Middle Eastern and Asia Pacific suppliers (providing 79% of regional supply).
European imports expanded for the fourth consecutive year in 2018, reaching 50.0 MT (+7.3% YOY). Higher gas imports for the continent were necessitated by declines in domestic production, mainly in the Netherlands and the United Kingdom, as well as increased natural gas consumption given steady industrial sector demand. For the first three quarters of the year, pipeline imports from Russia and Algeria were prioritised in meeting this higher gas import need. However, in the final quarter of the year, European LNG imports spiked to a new record. With high charter rates for LNG carriers and low spot LNG prices in Asia, LNG flows into Northwest European gas markets rose and re-exports decreased. This was particularly the case for flexible-destination cargoes from Atlantic Basin producers, such as Russia and the United States, but not for cargoes from Qatar. Although the region’s largest LNG market, Spain, contracted during 2018 due to in part to strong pipeline imports, gains were experienced in almost all other European LNG markets. The strongest increases in incremental LNG imports were markets in Northwest Europe, with Belgium (+1.4 MT), the Netherlands (+1.3 MT), and France (+0.9 MT) showing the largest growth in the region during 2018.
Despite continued increases in LNG imports, the region’s relative significance in terms of its share of global trade remains below historical highs at just 15.8% in 2018 (a decrease from 2017). Europe received a higher proportion of its LNG from the former Soviet Union (FSU) and North America in 2018 than during 2017, although Africa and the Middle East remained the dominant sources of supply (a combined 75% of regional supply).
Table 3.1: LNG Trade between Basins, 2018, MT
Sources: IHS Markit, EIA, IGU
4 In this chapter, the Asia region includes China, India, Pakistan, and Bangladesh while the remainder of markets on the Asian continent are included in the Asia-Pacific region. Please refer to Chapter 10: References for the exact definitions of each region.
Exporting Region
Africa Asia-Pacific EuropeFormer Soviet Union
LatinAmerica Middle East North
AmericaReexports Received
Reexports Loaded Total
Importing Region
Africa 0.3 0.4 0.2 0.1 1.0 0.1 0.1 2.3
Asia 10.5 39.4 0.4 1.6 0.9 28.1 3.6 1.4 0.1 85.9Asia-Pacific 4.6 81.8 0.2 11.4 2.6 44.7 7.5 1.4 0.9 153.3
Europe 20.5 3.1 4.9 4.5 16.9 2.7 0.4 2.9 50.0Latin
America 1.2 0.2 0.3 3.8 1.1 2.5 0.2 0.1 10.6
Middle East 2.3 0.1 0.2 0.3 0.8 2.2 1.1 0.3 7.4North
America 1.1 0.2 0.1 0.1 3.2 3.6 0.1 7.1
Total 40.6 121.6 4.6 18.9 15.8 94.0 21.1 3.9 -3.9 316.5
IGU World LNG report - 2019 Edition
Although LNG has had a higher annual rate of growth over the past 17 years than either global production for indigenous consumption or international pipeline exports, much of the impressive growth occurred in the first decade, with growth slowing during 2010-15 as global markets worked to absorb the rapid expansion of liquefaction capacity from the end of the 2000s. Growth in LNG consumption as a percentage of global trade began to rise briskly again in 2016, driven first by the liquefaction capacity buildout in Australia, and then recent capacity additions across the United States and Russia
(see Figure 3.9). In 2017, LNG’s share of global gas trade jumped by 0.8 percentage points, setting a new record of 10.7% of global consumption (surpassing the previous record of 10% in 2011). Pipeline’s share also increased, to 20.2%, showing that natural gas import reliance is growing. Pipeline trade into Europe was a key factor, with both Russian gas exports to Europe hitting a record during the year, as well as rising flows from the United States into Mexico and FSU markets into China.

18 19
LNG Trade
Figure 3.10: Inter-Basin Trade Flows 1964-2018
Figure 3.11: Inter-Basin Trade, 2000 v. 2018
3.10
3.11
3.12
Intra-Pacific
Middle East-Pacific
Intra-Atlantic
Middle East-Atlantic
Atlantic-Pacific
Intra-Middle East
Atlantic-Middle East
Pacific-Middle East
Pacific-Atlantic
56.3134.2
15.4
26.0
1.8
72.7
47.8
19.1
0.0
0.0
0.0
0.0
0.2
33.5
2.2
4.7
0.1
2.1MT
0 45 90 135
20002018
2010 2011 2012 2013 2014 2015 2016 2017 2018
350
300
250
200
150
100
50
0
35%
30%
25%
20%
15%
10%
5%
0%
Long-term
% Spot and Short-term(right)
Short-term Medium-term
MTPA
100%
80%
60%
40%
20%
0%64 68 72 76 80 84 88 92 96 00 04 08 12 16
% Share
Intra-Pacific Intra-Atlantic Intra-Middle EastMiddle East-Pacific Middle East-Atlantic Atlantic-PacificAtlantic-Middle East Pacific-Middle East Pacific-Atlantic
Sources: IHS Markit, IGU
Sources: IHS Markit, IGU
The largest global LNG trade flow route continues to be intra-Pacific trade (see Figure 3.10), a trend that is unlikely to change in the near term given high demand growth in China, Southeast Asia, and South Asia, and increasing supply from Australia. Trade between the Middle East and Pacific was the second-highest by volume owing to Qatar’s role in supplying Japan, South Korea, and China. Stronger production in the Atlantic Basin during the year resulted in higher intra-basin flows as well as increased deliveries to the Pacific Basin. Intra-Atlantic trade remained the third largest route by volume, although Atlantic-Pacific trade grew by 11.6 MT during 2018, becoming the fourth largest route.
Pacific Basin LNG has continued to remain mostly within its own basin, with Pacific-Middle East and Pacific-Atlantic flows totalling just 2.2 MT in 2018, compared to 134.2 MT of Intra-Pacific trade. Moreover, the Pacific Basin attracted more LNG from the Atlantic Basin, largely the result of higher LNG flows from the United States to Asia via the Panama Canal. Flows into the Middle East remain relatively small, with other Middle East and Atlantic Basin sources providing nearly all of those markets’ imports.
Figure 3.9: Global Gas Trade, 2000-2017
Japan, 83.2, 25.4%China, 54.8, 16.7%S. Korea, 44.5, 13.6%India, 23.3, 7.1%Chinese Taipei, 17.1, 5.2%Spain, 10.8, 3.3%Turkey, 8.5, 2.6%France, 8.4, 2.6%Pakistan, 7.1, 2.2%Italy, 6.3, 1.9%Mexico, 5.1, 1.6%UK, 5.0, 1.5%Thailand, 4.5, 1.4%Kuwait, 3.5, 1.1%Chile, 3.1, 1%Portugal, 2.9, 0.9%US, 2.8, 0.9%Singapore, 2.7, 0.8%Argentina, 2.6, 0.8%Jordan 2.6, 0.8%Belgium, 2.4, 0.7%Egypt, 2.3, 0.7%Other, 16.0, 4.4%
Chin
a, 5
4.8
S. K
orea
, 44.
5
Indi
a, 2
3.3
Paki
stan
, 7.1
Belg
ium
, 2.4
Net
herl
ands
, 2
Oth
er, 2
2.4
Fran
ce, 8
.4
Thai
land
, 4.5
Pola
nd, 2
Bang
lade
sh, 0
.7
Turk
ey, 8
.5
Sing
apor
e, 2
.7
Braz
il, 1
.9
US,
1.3
Chin
ese
Taip
ei, 1
7.1
UK,
5
Chile
, 3.1
Lith
uani
a, 0
.6
Gre
ece,
0.7
Arge
ntin
a, 2
.6
Japa
n, 8
3.2
Jord
an, 2
.6
UAE
, 0.8
Spai
n, 1
0.8
Egyp
t, 2.
3
North AmericaEurope FSULatin AmericaAsia-PacificAfrica Asia Middle East Other15.8
6.44.0
2.4 1.4 1.3 1.1 0.9 0.8 0.7 0.7 0.6 0.5 0.4 0.3 0.3 0.3
-0.2 -1.4-1.4-0.8-0.6-0.6-0.4-0.3
-3.7
3.7
3.8
3.9
4,000
3,500
3,000
2,500
2,000
1,500
1,000
500
0
Bcm CAGR (2000-2017)
2000 2003 2006 2009 2012 2015
Consumed where producedLNG Pipeline
6.4%
3.1%
1.8%
Note: CAGR = Compound Annual Growth Rate; Annual data through 2017 is the most recent available.Sources: IHS Markit, BP Statistical Review of World Energy
LNG trade has continued to develop for reasons that vary by market and region. In Japan, South Korea, and Chinese Taipei (JKT), LNG imports are driven by geographic remoteness and gas resource scarcity. Additionally, uncertainties regarding nuclear power have continued to support LNG imports. Restrictions on coal-fired generation to improve air quality in the region are likely to support
+ 6.4% p.a.Average yearly growth rateof LNG demand since 2000
3.4LNGINTERREGIONAL TRADE
DSLNG Tanker - Courtesy of KOGAS
Huelva LNG Terminal - Courtesy of Enagas
IGU World LNG report - 2019 Edition
LNG usage through the long term in these markets. Unlike some other importing regions, these markets find themselves without prospects for increased domestic gas production and/or major cross-border pipeline connections.
In other markets, LNG is used to supplement domestic production, which is either maturing or insufficient to keep pace with domestic demand. In Europe, long-term decline continues at two traditional producers, the Netherlands and the United Kingdom. Furthermore, in a multitude of markets, there has been an increase in LNG imports to complement local gas production to keep pace with demand growth; including in Bangladesh, Thailand, and China.
LNG continues to be used to increase gas supply security even in markets with ample pipeline connections. European importers such as Italy, Portugal, and Turkey use LNG to diversify their import mix and to maintain access to gas in the case of inadequate pipeline flows. Many markets such as Kuwait and Argentina use seasonal LNG imports to meet summer or winter demand peaks for cooling and heating. Markets with high renewables penetration in their power generation mixes are also considering gas, often delivered as LNG, as a source of reliable backup power generation to complement renewables. This is particularly the case in markets across Latin American, such as Brazil, Colombia, and Panama.
During the past decade, the fortunes of domestic gas production in several markets have, and will continue to affect their outlooks as importers. The most pronounced shift was the shale revolution in the United States, which allowed the market to begin exporting LNG from the Lower 48, instead of becoming a net importer as had previously been projected. US production in turn influenced the LNG import needs of neighbouring Canada and Mexico as well. For other importers, the possibility of expanding unconventional gas production has begun to change LNG import dynamics. This has been the case in Argentina, where expanding production has altered LNG import patterns not only in that market, but the region as well. The development of conventional gas resources is also playing a key factor in LNG imports, reducing LNG import requirements in Egypt.

20 21
IGU World LNG report - 2019 Edition
Note: Indonesia, Malaysia, India, France, and the UAE conducted domestic LNG trade in 2012-2018. These volumes are not included above as they do not reflect international trade between markets. Sources: IHS Markit, IGU
Alg
eria
Ang
ola
Aus
tral
ia
Bru
nei
Cam
eroo
n
Egy
pt
Equ
ator
ial
Gui
nea
Indo
nesi
a
Mal
aysi
a
Nig
eria
Nor
way
Om
an
Pap
ua N
ew
Gui
nea
Per
u
Egypt - - - - - - 0.06 - - 0.20 0.44 - - - Africa - - - - - - 0.06 - - 0.20 0.44 - - - Bangladesh - - - - - - - - - - - - - -
China 0.07 0.56 24.06 0.21 0.17 0.20 0.70 4.85 6.01 1.09 0.26 0.38 2.31 0.07
India 0.23 1.72 1.49 - 0.27 0.14 0.95 - 0.27 3.04 0.07 1.07 - - Pakistan 0.14 0.07 0.06 - - - 0.32 0.12 0.06 0.89 0.12 0.06 - - Asia 0.43 2.35 25.61 0.21 0.44 0.34 1.96 4.97 6.34 5.02 0.44 1.51 2.31 0.07 Japan - 0.20 29.00 4.20 - 0.13 0.12 5.05 11.30 1.41 0.06 3.05 3.18 0.56 Malaysia - - 0.90 0.39 - - - - - - - - - Singapore - 0.14 2.17 - - - 0.28 0.13 - - - - 0.08 - South Korea - 0.27 8.15 0.83 - 0.19 0.06 3.52 3.60 0.49 0.06 4.28 0.07 0.96 Chinese Taipei - 0.06 2.59 0.76 0.06 - - 1.22 2.71 0.18 0.06 0.31 1.15 0.06 Thailand - - 0.07 0.06 - 0.07 - 0.19 0.53 0.92 - 0.07 - - Asia-Pacific - 0.67 42.86 6.24 0.06 0.40 0.47 10.11 18.14 3.00 0.19 7.71 4.48 1.58 Belgium - 0.07 - - - - - - - - 0.07 - - - France 3.16 0.07 - - - 0.26 - - - 2.76 1.13 - - 0.20 Greece 0.60 - - - - - - - - - - - - - Italy 0.65 0.07 - - 0.06 0.10 0.14 - - 0.06 0.13 - - - Lithuania - - - - - - - - - - 0.60 - - - Malta - - - - - - 0.06 - - 0.08 - - - 0.06 Netherlands 0.11 0.15 - - - - - - - - 0.31 - - 0.24 Poland - - - - - - - - - - 0.25 - - - Portugal 0.10 - - - - - - - - 1.82 - - - - Spain 1.12 0.06 - - 0.06 - - - - 3.11 0.44 - - 1.29 Turkey 3.54 0.07 - - - 0.15 0.06 - - 1.64 0.06 - - - United Kingdom 0.17 - - - - 0.12 0.06 - - 0.06 0.08 - - 0.06 Europe 9.45 0.50 - - 0.12 0.62 0.32 - - 9.53 3.06 - - 1.85 Argentina 0.06 - - - - - 0.06 - - 0.38 - - - - Brazil - 0.07 - - - - - - - 0.20 0.18 - - - Chile - - - - - - 0.47 - - - - - - - Colombia - - - - - - - - - - - - - - Dominican Republic - - - - - - - - - - - - - - Jamaica - - - - - - - - - - 0.01 - - - Panama - - - - - - - - - - - - - - Puerto Rico - - - - - - - - - - - - - - Latin America 0.06 0.07 - - - - 0.53 - - 0.58 0.19 - - - Israel - - - - - - - - - - - - - - Jordan 0.07 - - - - - 0.07 - - 0.62 0.12 0.08 - - Kuwait - 0.49 - - - 0.06 0.13 - - 0.41 0.12 0.48 - - United Arab Emirates 0.28 0.07 0.14 - - - - - - 0.07 - - - - Middle East 0.36 0.56 0.14 - - 0.06 0.20 - - 1.10 0.25 0.56 - - Canada - - - - - - - - - - 0.06 - - - Mexico - - - - - - - 0.13 - 1.06 - - 0.07 0.06 United States - - - - - - - - - 0.06 - - - - North America - - - - - - - 0.13 - 1.12 0.06 - 0.07 0.06 2018 Exports 10.30 4.14 68.61 6.45 0.61 1.43 3.54 15.21 24.49 20.55 4.63 9.79 6.86 3.56
2017 Exports 12.17 3.67 56.37 6.74 - 0.86 3.60 16.02 26.49 21.15 4.04 8.33 4.14 8.13
2016 Exports 11.62 0.77 43.79 6.23 - 0.52 3.28 16.28 24.79 18.14 4.40 8.11 4.04 7.68 2015 Exports 12.13 - 29.25 6.45 - - 3.76 15.94 24.76 20.29 4.30 7.66 3.65 7.10 2014 Exports 12.53 0.34 23.25 6.17 - 0.33 3.70 15.88 24.90 19.31 3.70 7.86 4.33 3.49 2013 Exports 10.81 0.33 22.18 6.93 - 2.79 3.87 17.00 24.68 16.70 2.98 8.64 4.26 - 2012 Exports 10.97 - 20.78 6.85 - 5.08 3.75 18.12 23.11 19.95 3.41 8.08 3.89 -
Table 3.2: LNG Trade Volumes between Markets, 2018 (in MT)
Qat
ar
Rus
sia
Tri
nida
d
Uni
ted
Arab
Em
irat
es
Uni
ted
Stat
es
Yem
en
Re-
expo
rts
Rece
ived
Re-
expo
rts
Load
ed
201
8 Ex
port
s
201
7 N
et
Impo
rts
201
6 N
et
Impo
rts
201
5 N
et
Impo
rts
201
4 N
et
Impo
rts
201
3 N
et
Impo
rts
201
2 N
et
Impo
rts
1.02 0.20 0.07 - 0.13 - 0.15 - 2.26 5.97 7.32 2.68 - - - 1.02 0.20 0.07 - 0.13 - 0.15 - 2.26 5.97 7.32 2.68 - - - 0.70 - - - - - - - 0.70 - - - - - -
9.19 1.20 0.38 - 2.26 - 0.79 - 54.75 38.97 27.01 19.69 19.81 18.51 14.77
11.61 0.35 0.38 0.32 1.04 - 0.39 (0.07) 23.26 19.30 18.38 15.79 14.29 13.24 13.99 4.59 0.07 0.06 0.13 0.25 - 0.20 - 7.15 4.74 2.91 0.95 - - -
26.09 1.62 0.82 0.45 3.56 - 1.38 (0.07) 85.86 63.01 48.30 36.43 34.11 31.74 28.76 9.98 7.00 0.12 4.90 2.48 - 0.63 (0.17) 83.21 83.84 82.78 85.34 88.69 87.75 87.24
- - - - - - - - 1.29 1.42 1.08 1.53 1.55 1.46 - 0.43 - 0.07 - - - 0.07 (0.65) 2.71 2.24 2.08 2.02 1.88 0.92 -
14.45 2.06 0.18 - 4.74 - 0.64 (0.06) 44.50 38.05 33.87 33.22 37.81 40.69 36.78 5.03 2.32 0.24 0.06 0.25 - 0.07 - 17.14 16.84 15.19 14.58 13.59 12.84 12.78 2.02 0.07 0.39 0.06 - - - - 4.45 3.70 2.90 2.62 1.28 1.41 0.97
31.91 11.45 1.00 5.03 7.47 - 1.40 (0.88) 153.29 146.09 137.89 139.32 144.80 145.06 137.77 1.89 0.59 - - - - 0.03 (0.26) 2.40 1.03 1.00 1.90 0.81 1.18 1.91 0.86 1.10 0.06 - 0.31 - - (1.47) 8.43 7.58 5.57 4.57 4.72 5.65 7.48 0.06 - - - 0.07 - - - 0.73 1.11 0.56 0.42 0.40 0.42 1.07 4.71 - - - 0.34 - - - 6.26 6.13 4.43 4.08 3.02 3.96 5.23
- - - - - - - - 0.60 0.91 1.07 0.32 0.10 - - - - 0.18 - 0.07 - - - 0.45 0.26 - - - - -
0.28 1.25 - - 0.24 - - (0.60) 1.97 0.69 0.39 0.63 0.43 0.49 0.61 1.68 - - - 0.07 - - - 2.00 1.26 0.81 0.08 - 0.73 - - - 0.26 - 0.03 - 2.94 2.78 1.34 1.22 0.98 1.39 1.66 2.48 0.66 1.61 - 0.20 - 0.11 (0.32) 10.82 12.25 10.11 8.84 8.16 9.74 14.22 2.15 - 0.36 - 0.26 - 0.20 - 8.48 7.92 5.56 5.60 5.32 4.41 5.68 2.11 1.25 0.42 - 0.88 - - (0.25) 4.95 4.70 7.20 9.86 8.36 6.99 10.36 16.94 4.85 2.62 - 2.70 - 0.38 (2.89) 50.03 46.62 38.03 37.52 32.31 34.24 48.22 1.05 - 0.42 - 0.51 - 0.08 - 2.56 3.16 3.59 4.19 4.68 4.75 3.82 0.06 0.28 0.35 - 0.74 - 0.15 (0.08) 1.95 1.54 1.28 5.00 5.71 4.26 2.52
- - 1.84 - 0.82 - - - 3.13 3.37 3.27 3.00 2.78 2.86 3.03 - - 0.13 - 0.09 - - - 0.22 0.03 0.06 - - - - - - 0.92 - 0.16 - - (0.02) 1.06 1.04 0.84 0.95 0.92 1.09 0.96 - - 0.17 - 0.06 - - - 0.23 0.17 0.06 - - - - - 0.06 - - 0.09 - - - 0.16 - - 1.28 - - - - - 1.28 0.96 1.30 1.13 1.24 1.21 0.97
1.11 0.34 3.83 - 2.47 - 0.22 (0.10) 9.32 9.31 9.10 13.14 14.09 12.96 10.33 - - 0.47 - 0.06 - - - 0.53 0.46 0.28 0.13 0.12 0.41 -
0.19 0.28 0.23 - 0.83 - 0.06 - 2.55 3.36 3.25 1.90 - - - 1.43 0.06 0.06 - 0.16 - 0.06 - 3.48 3.55 3.62 3.07 2.73 1.64 2.11
- - - - 0.07 - 0.20 - 0.83 2.21 3.17 2.40 1.39 1.25 1.20 1.62 0.34 0.75 - 1.13 - 0.32 - 7.39 9.58 10.33 7.51 4.24 3.30 3.31
- 0.07 0.32 - - - - - 0.45 0.32 0.24 0.47 0.42 0.75 1.28 - - 0.20 - 3.59 - - - 5.10 4.94 4.14 5.07 6.87 5.94 3.55 - 0.06 2.62 - - - 0.09 - 2.84 2.53 2.98 2.86 2.42 3.04 4.24 - 0.14 3.13 - 3.59 - 0.09 - 8.39 7.79 7.36 8.40 9.71 9.74 9.06
78.69 18.93 12.23 5.48 21.05 - 3.95 (3.95) 316.54
76.71 11.11 10.76 5.20 12.90 - 2.70 (2.70) 288.37
78.68 10.75 10.59 5.77 2.89 - 4.46 (4.46) 258.33 79.17 10.81 12.27 5.61 0.32 1.53 4.57 (4.57) 245.00 75.90 10.56 14.31 5.78 0.25 6.66 6.23 (6.23) 239.26 78.01 10.75 14.52 5.41 - 7.20 4.59 (4.59) 237.05 77.32 10.92 14.40 5.53 0.17 5.13 3.45 (3.45) 237.46
LNG Trade

22 23
3.5SHORT, MEDIUM ANDLONG-TERM TRADE5
The LNG market has grown increasingly complex over the past decade, as a greater number of participants utilize a broader variety of trading strategies. While cargoes were historically mainly delivered under long-term fixed destination contracts, a growing portion of LNG is being sold under shorter contracts or on the spot market.
This “non-long-term” LNG trade6 has been made possible by the emergence of portfolio players and traders, as well as more destination flexibility in contracts. Non-long-term trade surged in 2011, owing to shocks like those that resulted from the Fukushima disaster and the growth in production of shale gas in the United States, but then stagnated through 2016 as new LNG supply came mostly from long-term contracted projects. Since then, the volume of LNG traded without a long-term contract has increased significantly, growing by 19% YOY in 2017 and by 18% YOY in 2018. This recent growth is partially caused by the ramp-up of new flexibly-contracted liquefaction projects in the Atlantic Basin, such as those in the United States and Russia. The share of the LNG market traded without a long-term contract has now reached 31% – roughly 50% higher than in 2008. Over the past decade, this segment of the market has developed as a result of several key factors:
• The growth in LNG contracts with destination flexibility, which has facilitated diversions to higher priced markets.
• The increase in the number of exporters and importers, which has amplified the complexity of the industry and introduced new permutations and linkages between buyers and sellers. In 2018, 30 markets (including re-exporters) exported spot volumes to 35 end markets. This compares to 6 spot exporters and 8 spot importers in 2000.
• The growth of companies with diverse marketing portfolios taking on an aggregator role, allowing long-term offtake contracts to satisfy a variety of short- and long-term buyer commitments.
99.0 MTNon-long-term trade in 2018;
31% of total gross trade
5 As defined in Chapter 10.6 “Non-long-term” trade refers to all volumes traded under contracts of less than 5 years duration (spot/short-term + medium-term trade). To truly capture the size of the market, volumes are categorized under the shortest duration of any part of the trade (e.g., volumes procured from the spot market and then delivered under a medium- or long-term portfolio contract would be considered spot).
LNG Trade
Figure 3.12: Short, Medium and Long-Term Trade, 2010-2018
Figure 3.13: Non Long-Term Volumes, 1995-2018
Figure 3.14: Non Long-Term Cargo Market Development,1995-2018
3.10
3.11
3.12
Intra-Pacific
Middle East-Pacific
Intra-Atlantic
Middle East-Atlantic
Atlantic-Pacific
Intra-Middle East
Atlantic-Middle East
Pacific-Middle East
Pacific-Atlantic
56.3134.2
15.4
26.0
1.8
72.7
47.8
19.1
0.0
0.0
0.0
0.0
0.2
33.5
2.2
4.7
0.1
2.1MT
0 45 90 135
20002018
2010 2011 2012 2013 2014 2015 2016 2017 2018
350
300
250
200
150
100
50
0
35%
30%
25%
20%
15%
10%
5%
0%
Long-term
% Spot and Short-term(right)
Short-term Medium-term
MTPA
100%
80%
60%
40%
20%
0%64 68 72 76 80 84 88 92 96 00 04 08 12 16
% Share
Intra-Pacific Intra-Atlantic Intra-Middle EastMiddle East-Pacific Middle East-Atlantic Atlantic-PacificAtlantic-Middle East Pacific-Middle East Pacific-Atlantic
100
90
80
70
60
50
40
30
20
10
0
50%
45%
40%
35%
30%
25%
20%
15%
10%
5%
0%1995 1999 2003 2007 2011 2015
MTPA % Share
Non Long-Term Trade % of Total LNG Trade (right axis)
3.13
1,800
1,600
1,400
1,200
1,000
800
600
400
200
0
45
40
35
30
25
20
15
10
5
0
1995 1999 2003 2007 2011 2015
No. of Non Long-Term Cargoes Traded
No. of Countries Exporting Non Long-Term LNG (right axis)
No. of Countries Importing Non Long-Term LNG (right axis)
No. of Cargoes No. of Countries
3.14
Sources: IHS Markit, IGU
Sources: IHS Markit, IGU
Sources: IHS Markit, IGU
Volumes traded under medium-term contracts (between 2 and <5 years) remain a comparatively small portion of all non-long-term trade. True medium-term deliveries – those cargoes both procured and delivered under a medium-term contract – declined for the fourth year in a row in 2018, falling from 7.1 MT at peak in 2014 to 3.0 MT in 2018. This is not necessarily a sign that medium-term contracts are falling out of favour – in fact, the volume of medium-term LNG contracted for delivery in 2018 increased by 26% YOY in 2018. The reason for the apparent decline in medium-term trade is that many traditional trader companies that were formerly active only in the spot market have begun to sign medium-term contracts as a seller, though they continue to source spot cargoes to fulfil them. Thus, medium-term contracts are being filled increasingly with short-term volumes. Medium term contracts offer markets with uncertain future LNG needs more security of supply for their minimum requirements than would be provided by short-term imports; and they have been favoured by buyers hesitant to sign long-term contracts because of the availability of uncontracted and flexible supply.
Total non-long-term LNG trade (all volumes traded under contracts of less than 5 years or on the spot market) reached 99.0 MT in 2018, an increase of 14.5 MT relative to 2017. Non-long-term trade accounted for an all-time high 31% of total gross LNG trade – a 2% increase in share from 2017. With the build-up in long-term contracted Australian capacity set to come to an end in 2019 as the final few projects come online, the share of non-long-term LNG is likely to continue to increase in the near-term, particularly as the build-out in flexibly-contracted Atlantic Basin capacity is still in full swing.
As with total gross LNG trade, the largest increase in non-long-term imports came from China. The market’s 41% YOY growth in LNG imports pulled heavily from the spot- and short-term market, as long-term contracts increased by only 9% YOY; non-long-term Chinese imports grew by 10 MT YOY. In early 2018, many Chinese buyers continued to search for additional short-term volumes to meet the growth spurred by 2017’s anti-pollution measures, and heightened buying activity continued into the summer and fall months as buyers sought to fill storage to avoid another tight winter market. As in the previous year, South Korea continued to rely on the spot market to offset continued nuclear outages, with non-long-term imports rising by 47% YOY in 2018.
As with importers, the largest growth in non-long-term supply also came from the market with the largest total growth in exports – Australia (+6.4 MT YOY). While exports from Australian markets are primarily sent to long-term customers, several plants that ramped-up supply in 2018 were contracted to large aggregator companies that sell into a diverse portfolio of end-markets, both on a contracted and spot basis. Furthermore, the strong demand increase in China led many Australian projects to divert cargoes there rather than other Pacific markets. New Atlantic Basin suppliers also had significant growth in non-long-term supply in 2018, owing to flexible-destination contracts with aggregators, especially from Yamal LNG (Russia) and Sabine Pass LNG (the US). Russian deliveries outside of long-term contracts grew by 5.7 MT in 2018, followed by an increase of 3.5 MT from the US.
Many of the markets with declines in non-long-term supply had an outage-induced decline in total exports, including Malaysia (-2.6 MT of non-long-term deliveries) and Papua New Guinea (-1.3 MT). While total exports also declined in Nigeria (-0.6 MT of total deliveries), non-long-term exports fell more quickly as the ramp-up at Australian and new Atlantic Basin projects pushed more cargoes to be directed to their original contracted markets, particularly in Europe. As a result, non-long-term Nigerian deliveries fell by -2.1 MT.
The largest decline in non-long-term imports was in Japan. In 2018, returning nuclear plants let LNG demand start to ease off the peak levels reached in the mid-2010s, causing total Japanese LNG imports to fall by 0.6 MT. Meanwhile, several new contracts between Australian LNG plants and Japanese buyers continued to ramp-up during the year, causing non-long-term imports to fall at a much faster rate (-4 MT YOY). Japan’s decline was followed closely by Egypt, where non-long-term imports fell by 3.7 MT. The market had relied exclusively on short- and medium-term contracts to fill its temporary LNG demand spike, and new domestic gas production has all but eliminated the need for LNG, thus causing Egyptian buyers to pull back from the short-term market.
IGU World LNG report - 2019 Edition
• Sudden changes in supply or demand dynamics such as the Fukushima disaster in Japan or replacing pipeline supply in Jordan.
• The decline in competitiveness of LNG in interfuel competition such as coal in the power sector (chiefly in Europe) and shale gas (North America) that has freed up volumes to be re-directed elsewhere.
• Periods of large disparity between prices in different basins such as that from 2010 to 2014, which made arbitrage an important and lucrative monetisation strategy.
• The faster development timeline and lower initial capital costs of FSRUs compared to onshore regasification, which allow new markets to enter the LNG import market.
• The large growth in the LNG fleet, especially vessels ordered without a long-term charter, which has at times allowed for low-cost inter-basin deliveries.
Short-term trade – defined here as all volumes traded either on the spot market or under agreements of less than two years – makes up the vast majority (97%) of cargoes traded without a long-term contract, with the remainder sold under medium-term deals. In 2018, short-term trade reached 96 MT, or 29.9% of total gross traded LNG (including re-exports). As in 2017, the growth in short-term trade was supported by new liquefaction project start-ups in the Atlantic Basin. Many of the projects in the Atlantic Basin that have come online in the past two years – such as Sabine Pass LNG in the US and Yamal LNG in Russia – have destination-flexible contracts with traders or aggregator companies that have large LNG portfolios. This contrasts with the marketing structure of projects that started up in the Pacific Basin between 2014 and 2016, which were largely contracted under long-term deals directly with end-users.
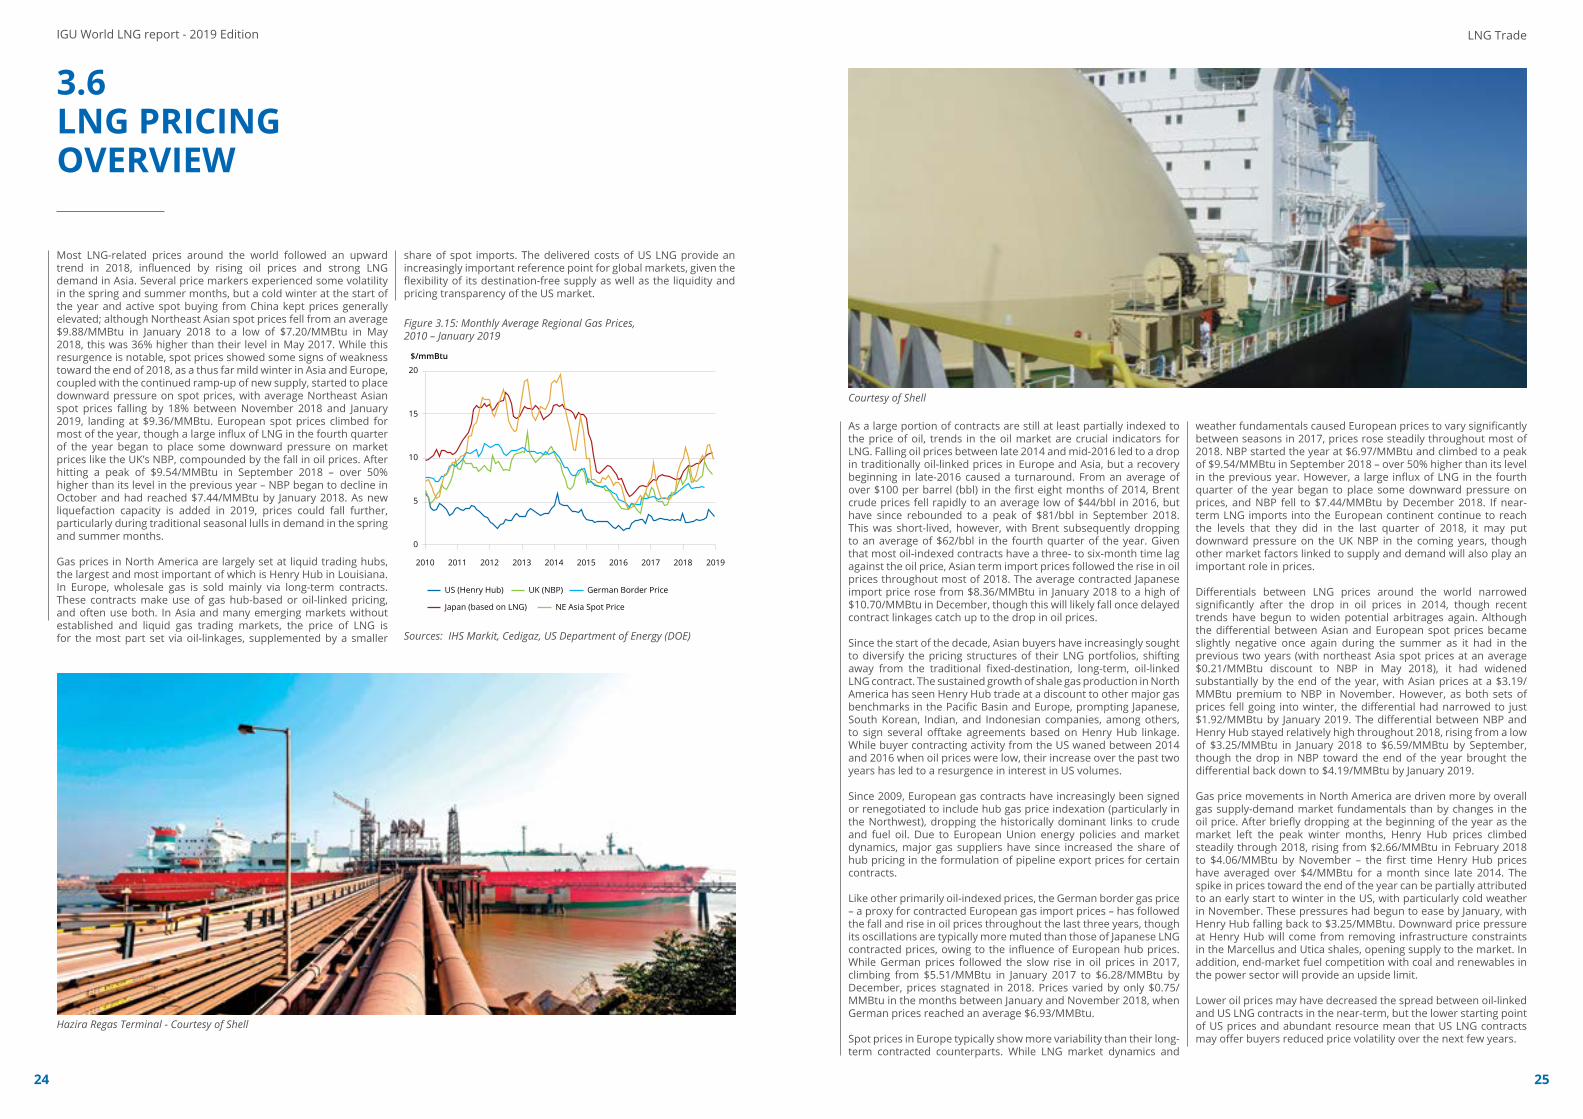
24 25
3.6LNG PRICINGOVERVIEW
Figure 3.15: Monthly Average Regional Gas Prices,2010 – January 2019
3.15
20
15
10
5
0
2010 2011 2012 2013 2014 2015 2016 2017 2018 2019
$/mmBtu
US (Henry Hub) UK (NBP)
Japan (based on LNG) NE Asia Spot Price
German Border Price
3.16
100%
80%
60%
40%
20%
0%
2005
2007
2009
2010
2012
2013
2014
2015
2016
2017
% Share of price formation mechanism
Oil Price Escalation Gas-on-Gas Competition
Sources: IHS Markit, Cedigaz, US Department of Energy (DOE)
Most LNG-related prices around the world followed an upward trend in 2018, influenced by rising oil prices and strong LNG demand in Asia. Several price markers experienced some volatility in the spring and summer months, but a cold winter at the start of the year and active spot buying from China kept prices generally elevated; although Northeast Asian spot prices fell from an average $9.88/MMBtu in January 2018 to a low of $7.20/MMBtu in May 2018, this was 36% higher than their level in May 2017. While this resurgence is notable, spot prices showed some signs of weakness toward the end of 2018, as a thus far mild winter in Asia and Europe, coupled with the continued ramp-up of new supply, started to place downward pressure on spot prices, with average Northeast Asian spot prices falling by 18% between November 2018 and January 2019, landing at $9.36/MMBtu. European spot prices climbed for most of the year, though a large influx of LNG in the fourth quarter of the year began to place some downward pressure on market prices like the UK’s NBP, compounded by the fall in oil prices. After hitting a peak of $9.54/MMBtu in September 2018 – over 50% higher than its level in the previous year – NBP began to decline in October and had reached $7.44/MMBtu by January 2018. As new liquefaction capacity is added in 2019, prices could fall further, particularly during traditional seasonal lulls in demand in the spring and summer months.
Gas prices in North America are largely set at liquid trading hubs, the largest and most important of which is Henry Hub in Louisiana. In Europe, wholesale gas is sold mainly via long-term contracts. These contracts make use of gas hub-based or oil-linked pricing, and often use both. In Asia and many emerging markets without established and liquid gas trading markets, the price of LNG is for the most part set via oil-linkages, supplemented by a smaller
Hazira Regas Terminal - Courtesy of Shell
LNG Trade
As a large portion of contracts are still at least partially indexed to the price of oil, trends in the oil market are crucial indicators for LNG. Falling oil prices between late 2014 and mid-2016 led to a drop in traditionally oil-linked prices in Europe and Asia, but a recovery beginning in late-2016 caused a turnaround. From an average of over $100 per barrel (bbl) in the first eight months of 2014, Brent crude prices fell rapidly to an average low of $44/bbl in 2016, but have since rebounded to a peak of $81/bbl in September 2018. This was short-lived, however, with Brent subsequently dropping to an average of $62/bbl in the fourth quarter of the year. Given that most oil-indexed contracts have a three- to six-month time lag against the oil price, Asian term import prices followed the rise in oil prices throughout most of 2018. The average contracted Japanese import price rose from $8.36/MMBtu in January 2018 to a high of $10.70/MMBtu in December, though this will likely fall once delayed contract linkages catch up to the drop in oil prices.
Since the start of the decade, Asian buyers have increasingly sought to diversify the pricing structures of their LNG portfolios, shifting away from the traditional fixed-destination, long-term, oil-linked LNG contract. The sustained growth of shale gas production in North America has seen Henry Hub trade at a discount to other major gas benchmarks in the Pacific Basin and Europe, prompting Japanese, South Korean, Indian, and Indonesian companies, among others, to sign several offtake agreements based on Henry Hub linkage. While buyer contracting activity from the US waned between 2014 and 2016 when oil prices were low, their increase over the past two years has led to a resurgence in interest in US volumes.
Since 2009, European gas contracts have increasingly been signed or renegotiated to include hub gas price indexation (particularly in the Northwest), dropping the historically dominant links to crude and fuel oil. Due to European Union energy policies and market dynamics, major gas suppliers have since increased the share of hub pricing in the formulation of pipeline export prices for certain contracts.
Like other primarily oil-indexed prices, the German border gas price – a proxy for contracted European gas import prices – has followed the fall and rise in oil prices throughout the last three years, though its oscillations are typically more muted than those of Japanese LNG contracted prices, owing to the influence of European hub prices. While German prices followed the slow rise in oil prices in 2017, climbing from $5.51/MMBtu in January 2017 to $6.28/MMBtu by December, prices stagnated in 2018. Prices varied by only $0.75/MMBtu in the months between January and November 2018, when German prices reached an average $6.93/MMBtu.
Spot prices in Europe typically show more variability than their long-term contracted counterparts. While LNG market dynamics and
weather fundamentals caused European prices to vary significantly between seasons in 2017, prices rose steadily throughout most of 2018. NBP started the year at $6.97/MMBtu and climbed to a peak of $9.54/MMBtu in September 2018 – over 50% higher than its level in the previous year. However, a large influx of LNG in the fourth quarter of the year began to place some downward pressure on prices, and NBP fell to $7.44/MMBtu by December 2018. If near-term LNG imports into the European continent continue to reach the levels that they did in the last quarter of 2018, it may put downward pressure on the UK NBP in the coming years, though other market factors linked to supply and demand will also play an important role in prices.
Differentials between LNG prices around the world narrowed significantly after the drop in oil prices in 2014, though recent trends have begun to widen potential arbitrages again. Although the differential between Asian and European spot prices became slightly negative once again during the summer as it had in the previous two years (with northeast Asia spot prices at an average $0.21/MMBtu discount to NBP in May 2018), it had widened substantially by the end of the year, with Asian prices at a $3.19/MMBtu premium to NBP in November. However, as both sets of prices fell going into winter, the differential had narrowed to just $1.92/MMBtu by January 2019. The differential between NBP and Henry Hub stayed relatively high throughout 2018, rising from a low of $3.25/MMBtu in January 2018 to $6.59/MMBtu by September, though the drop in NBP toward the end of the year brought the differential back down to $4.19/MMBtu by January 2019.
Gas price movements in North America are driven more by overall gas supply-demand market fundamentals than by changes in the oil price. After briefly dropping at the beginning of the year as the market left the peak winter months, Henry Hub prices climbed steadily through 2018, rising from $2.66/MMBtu in February 2018 to $4.06/MMBtu by November – the first time Henry Hub prices have averaged over $4/MMBtu for a month since late 2014. The spike in prices toward the end of the year can be partially attributed to an early start to winter in the US, with particularly cold weather in November. These pressures had begun to ease by January, with Henry Hub falling back to $3.25/MMBtu. Downward price pressure at Henry Hub will come from removing infrastructure constraints in the Marcellus and Utica shales, opening supply to the market. In addition, end-market fuel competition with coal and renewables in the power sector will provide an upside limit.
Lower oil prices may have decreased the spread between oil-linked and US LNG contracts in the near-term, but the lower starting point of US prices and abundant resource mean that US LNG contracts may offer buyers reduced price volatility over the next few years.
IGU World LNG report - 2019 Edition
share of spot imports. The delivered costs of US LNG provide an increasingly important reference point for global markets, given the flexibility of its destination-free supply as well as the liquidity and pricing transparency of the US market.
Courtesy of Shell

Total nominalliquefaction capacityincreased by
since the end of 201730.6 MTPA
Led by additions in
Russia &Australia
Capacity has reached
392.9 MTPAas of February 2019
A further
101.3 MTPAhas been sanctioned fordevelopment, the majority ofwhich is under constructionin the United States
A total of
of liquefaction projects reachedFID in 2018 — nearly as much asin the previous three years combined
21.5 MTPASignificant additional FIDsare expected in 2019
Golden Pass LNG projectin February.
startingwith the15.6 MTPA
Liquefaction project developersare poised to drive a wave ofnew capacity with approximately
in proposed capacity seekingto come online by 2025
843 MTPAis expected by 2024 inglobal nominal liquefactioncapacity from February 2019
A growth of
22%
Liquefaction Plants
4.Liquefaction PlantsThe substantial expansion of globalliquefaction capacity that began in 2016 continued through 2018
IGU World LNG report - 2019 Edition
26 27
28 29
The substantial expansion of global liquefaction capacity that began in 2016 continued through 2018. Led by significant additions in Russia and Australia, total nominal liquefaction capacity increased by 30.6 MTPA since the end of 2017 (36.2 MTPA of new additions offset by 5.6 MTPA of decommissioned capacity) to reach 392.9 MTPA as of February 2019. A further 101.3 MTPA has been sanctioned for development, the majority of which is under construction in the United States. Approximately 60% of the current liquefaction buildout is expected to be completed by the end of 2020.
Liquefaction Plants
The present state of under-construction liquefaction projects means that a rapid rise in capacity over the next two years will be followed by a period of lower capacity additions in 2021-22. This is the result of low investment in recent years, particularly 2016 and 2017 owing to factors like low energy prices, demand uncertainty, and some expectations of surplus LNG supply. A total of 21.5 MTPA of liquefaction projects reached FID in 2018—nearly as much as in the previous three years combined—followed by an FID at the 15.6 MTPA Golden Pass LNG project in February 2019. Significant additional FIDs are expected in 2019. Throughout 2018, proposed projects signed a number of long-term LNG contracts to advance their prospects for FID, while some project sponsors committed to taking on their projects’ marketing risk themselves to accelerate development and meet expected growth in LNG demand by the mid-2020s. Liquefaction project developers are poised to drive a wave of new capacity with a total of approximately 843 MTPA in proposed capacity seeking to come online by the middle of the next decade. However, many of these projects will likely need to sign long-term offtake contracts to enable FID and will be competing for the same set of buyers, making it unlikely that all projects will move forward.
Current proposals not only include many greenfield projects, but also expansion plans at brownfield projects targeted to keep costs down. For example, Qatargas plans to expand capacity by over 30 MTPA to reach 110 MTPA and secure Qatar’s status as the world’s largest LNG exporter by the mid-2020s. New upstream developments are also providing backfill opportunities for older plants, further heightening supply-side competition.
IGU World LNG report - 2019 Edition
Courtesy of Shell

30 31
4.1OVERVIEW
For the second straight year, nominal liquefaction capacity grew by 7% in 2018, ending the year at 382.9 MTPA. Additions came entirely from new projects rather than expansions of existing liquefaction plants. Commercial starts were reached at both trains of Wheatstone LNG in Australia (8.9 MTPA total), the first two trains of Yamal LNG in the Russian Arctic (11 MTPA total), Cove Point in the US (5.25 MTPA), and Kribi FLNG offshore Cameroon (2.4 MTPA). In addition, commissioning cargoes were exported by Ichthys LNG T1 (4.45 MTPA) in October 2018 and Yamal LNG T3 (5.5 MTPA) in December, with commercial start assumed to have begun at both trains in early 2019. This has brought total capacity to 392.9 MTPA as of February 2019 (see Figure 4.1). Prelude FLNG offshore Australia also reported initial gas production in December, with commercial exports targeted for early 2019.
392.9 MTPAGlobal nominal liquefaction capacity,
February 2019
The ongoing wave of liquefaction capacity expansion that began in 2016 is set to continue in 2019, with a total of 51.8 MTPA scheduled to be completed during the year. In addition to Ichthys LNG T1 and Yamal LNG T3, projects totalling 41.8 MTPA in capacity (49% of all sanctioned or under-construction liquefaction capacity) currently have announced commercial start dates before the end of 2019. US liquefaction will lead the way in the addition of new capacity. Corpus Christi LNG T1 and T2 (9 MTPA total), Elba Island LNG T1-T10 (2.5 MTPA total), Cameron LNG T1 and T2 (8 MTPA total), Freeport LNG T1 (5.1 MTPA), and Sabine Pass LNG T5 (4.5 MTPA) are all targeted for 2019 start-up, more than doubling existing US Atlantic Basin capacity. Additional capacity to be added in 2019 includes new liquefaction trains in Russia, Australia, Indonesia, and Argentina.
The commercial start of Ichthys LNG at the beginning of 2019 will make Australia the world’s largest source of liquefaction capacity (79.9 MTPA total), surpassing Qatar. After the US, the largest contribution to global capacity in 2019 will come from Australia (12.5 MTPA). Australia, which has been a primary driver of the current phase of capacity growth alongside the US, will complete its current wave of growth after Prelude FLNG and Ichthys LNG T2 come online as no other projects in the nation have reached FID.
Investment in new liquefaction capacity accelerated in 2018. Only 13.3 MTPA in capacity reached FID in 2016 and 2017 combined, including only 8.6 MTPA in greenfield projects. However, 21.5 MTPA in announced capacity reached FID in 2018 followed by another FID in February 2019 at Golden Pass LNG in the US (15.6 MTPA). FIDs were driven by factors including higher energy prices and an expectation that the relatively low aggregate capacity expected to be added in the early 2020s by under-construction projects will mean that the market will need new projects within several years to meet global demand growth. Much of the capacity sanctioned in 2018 came from the 14 MTPA LNG Canada T1-2, its nation’s first project to be sanctioned. Only one train to reach FID in 2018, Corpus Christi LNG T3 (4.5 MTPA), is a brownfield addition; its first two trains reached FID in 2015. The remaining sanctioned projects were both smaller floating proposals in frontier regions, with the 2.5 MTPA Greater Tortue FLNG on the Mauritania-Senegal border and the 0.5 MTPA Tango FLNG in Argentina.
Ahead of a potential near-term supply surplus, buyers have tended toward a preference for shorter-term contracts. This has resulted in limited long-term contracting activity of the type that has traditionally underpinned FIDs at proposed projects. While project sponsors have continued to compete for long-term contracts in order to drive FIDs, confidence that new supply will be needed in the early-to-mid-2020s is increasingly prompting liquefaction partners to take on greater marketing activities themselves. LNG Canada reached FID under an equity marketing model, in which its ownership partners are responsible for feed gas supply and LNG offtake. This shows a strong willingness to take on substantial volume and price risk and represents the largest liquefaction project to take FID under an affiliate marketing arrangement (without pre-FID recontracting) since the Qatari megatrains over a decade ago. Later in 2018, Greater Tortue FLNG (2.5 MTPA) announced FID with majority partner BP committing to marketing the full offtake from its portfolio.
Figure 4.1: Nominal Liquefaction Capacity by Status and Region, February 2019
Sources: IHS Markit, Company Announcements
4.3
4.2
Qatar, 77, 102%Australia, 75.4, 95%Malaysia, 30.5, 81%Algeria, 25.3, 41%US, 24.6, 96%Nigeria, 21.9, 94%Russia, 21.8, 110%Indonesia, 20.9, 69%Trinidad, 15.5, 79%Egypt, 12.2, 12%Oman, 10.8, 91%Yemen, 7.2, 0%Brunei, 7.2, 90%PNG, 6.9, 99%UAE, 5.8, 94%Angola, 5.2, 80%Peru, 4.5, 80%Norway, 4.2, 110%Eq. Guinea, 3.7, 96%Cameroon, 2.4, 43%
1990 1995 2000 2005 2010 2015 2020
500
450
400
350
300
250
200
150
100
50
0
100%
90%
80%
70%
60%
50%
40%
30%
20%
10%
0%
Global Liquefaction Capacity % of Capacity Utilised (right axis)
MTPA
Forecast
4.1
Afri
ca
Euro
pe FSU
Latin
Am
eric
a
Mid
dle
East
Nor
th A
mer
ica
Tota
l
Asia
Pac
ific
900
800
700
600
500
400
300
200
100
0
Pre-FIDExisting FID
MTPA
Much of the 844.8 MTPA in currently proposed capacity is aiming to reach commercial operation by the mid-2020s to meet anticipated demand. Most of these projects will require long-term contracts to be signed to obtain the required financing to reach FID. North America is the source of the majority of this proposed pre-FID
101.3 MTPAGlobal liquefaction capacity under
construction, February 2019
Liquefaction Plants
1 Please refer to Chapter 10: References for an exact definition of each region.
Courtesy of Shell
IGU World LNG report - 2019 Edition
capacity (571.6 MTPA), with 293.1 MTPA alone located on the US Gulf of Mexico (US GOM) coastline and another 210.6 MTPA in Canada. After North America,1 Mozambique, Russia, and Qatar each have large amounts of proposed capacity under consideration. Many of these proposals have proceeded slowly amid a crowded and competitive field. Globally, only 48% of pre-FID capacity is estimated to have entered at least the pre-front end engineering and design (pre-FEED) phase.
Many advanced proposals have sought to underpin an FID by securing long-term offtake commitments for the majority of their capacity. This has become more challenging as buyers have increasingly shown a preference for shorter-term contracts; if this imbalance between term preferences prevents projects from reaching FID, the market could become short by the mid-2020s. However, as in 2018, it is likely that 2019 may see further FIDs without long-term purchase agreements in place, as competition to be one of the new projects to meet expected demand needs in the early-to-mid 2020s accelerates. For example, the sponsors of Rovuma LNG (15.2 MTPA) in Mozambique announced in December 2018 that they would take on all offtake responsibilities under an affiliate marketing model rather than seek third-party contracting to drive FID, which is targeted for 2019.
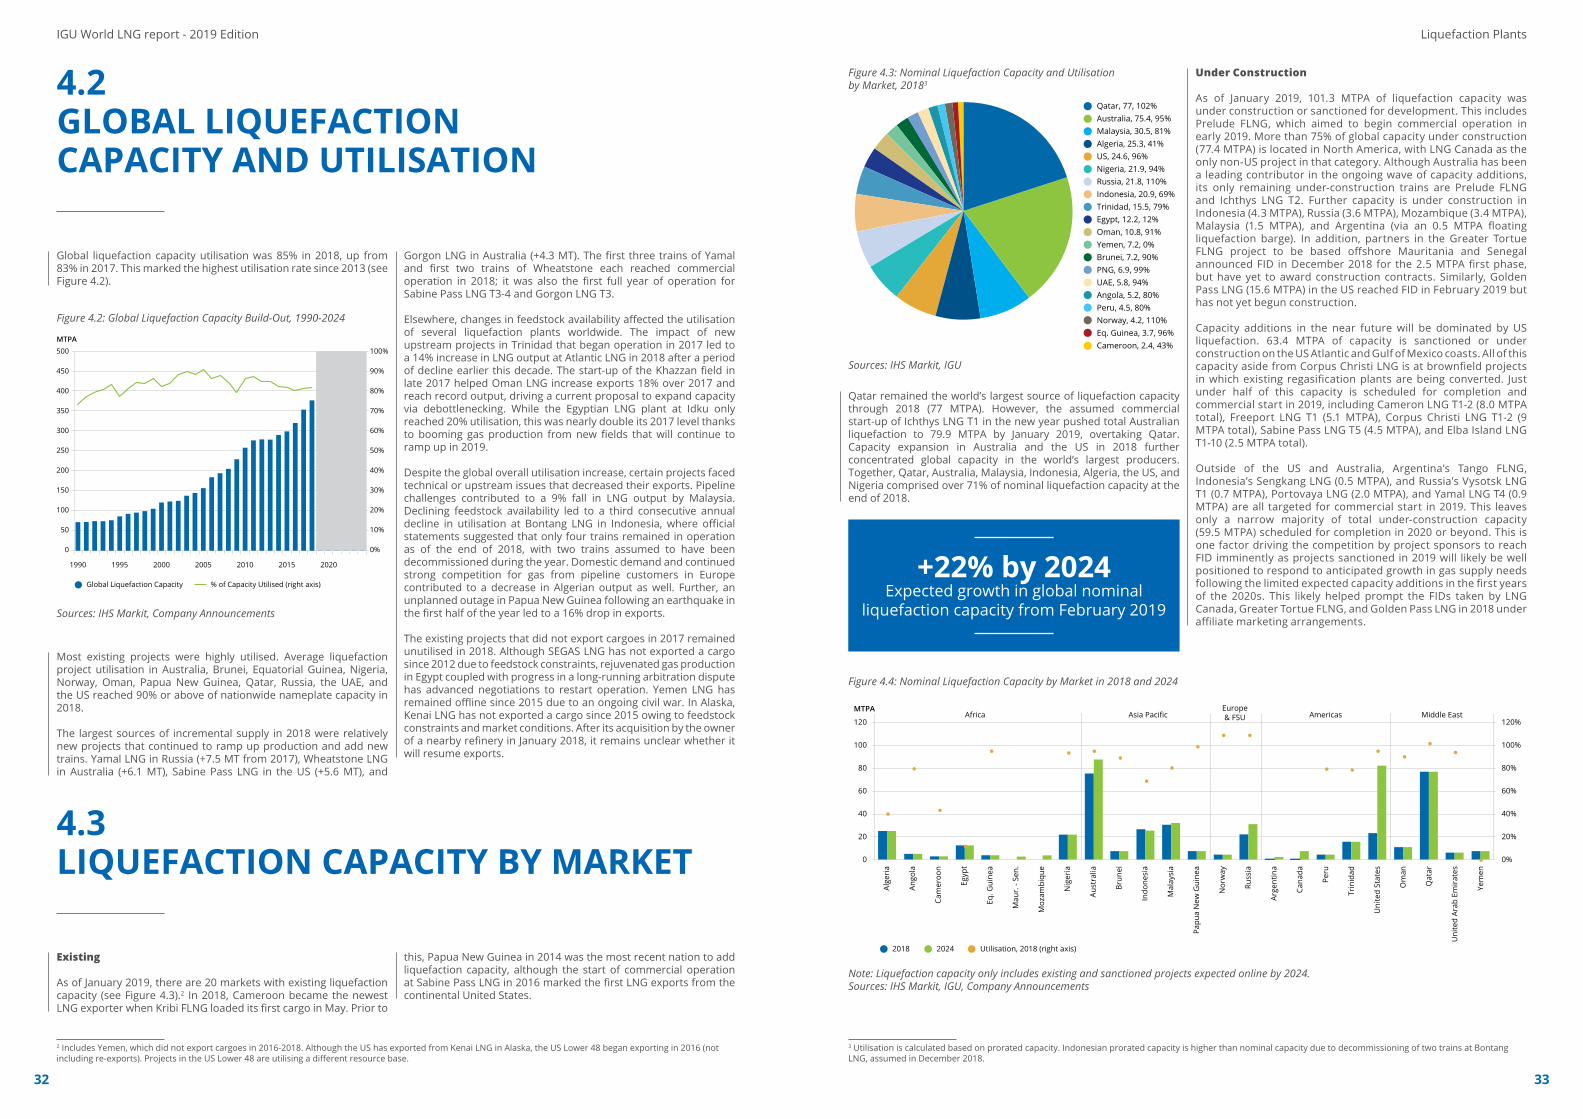
32 33
4.2GLOBAL LIQUEFACTIONCAPACITY AND UTILISATION
Global liquefaction capacity utilisation was 85% in 2018, up from 83% in 2017. This marked the highest utilisation rate since 2013 (see Figure 4.2).
Most existing projects were highly utilised. Average liquefaction project utilisation in Australia, Brunei, Equatorial Guinea, Nigeria, Norway, Oman, Papua New Guinea, Qatar, Russia, the UAE, and the US reached 90% or above of nationwide nameplate capacity in 2018.
The largest sources of incremental supply in 2018 were relatively new projects that continued to ramp up production and add new trains. Yamal LNG in Russia (+7.5 MT from 2017), Wheatstone LNG in Australia (+6.1 MT), Sabine Pass LNG in the US (+5.6 MT), and
Figure 4.2: Global Liquefaction Capacity Build-Out, 1990-2024
Sources: IHS Markit, Company Announcements4.3
4.2
Qatar, 77, 102%Australia, 75.4, 95%Malaysia, 30.5, 81%Algeria, 25.3, 41%US, 24.6, 96%Nigeria, 21.9, 94%Russia, 21.8, 110%Indonesia, 20.9, 69%Trinidad, 15.5, 79%Egypt, 12.2, 12%Oman, 10.8, 91%Yemen, 7.2, 0%Brunei, 7.2, 90%PNG, 6.9, 99%UAE, 5.8, 94%Angola, 5.2, 80%Peru, 4.5, 80%Norway, 4.2, 110%Eq. Guinea, 3.7, 96%Cameroon, 2.4, 43%
1990 1995 2000 2005 2010 2015 2020
500
450
400
350
300
250
200
150
100
50
0
100%
90%
80%
70%
60%
50%
40%
30%
20%
10%
0%
Global Liquefaction Capacity % of Capacity Utilised (right axis)
MTPA
Forecast
4.1
Afri
ca
Euro
pe FSU
Latin
Am
eric
a
Mid
dle
East
Nor
th A
mer
ica
Tota
l
Asia
Pac
ific
900
800
700
600
500
400
300
200
100
0
Pre-FIDExisting FID
MTPA
4.3LIQUEFACTION CAPACITY BY MARKET
Existing
As of January 2019, there are 20 markets with existing liquefaction capacity (see Figure 4.3).2 In 2018, Cameroon became the newest LNG exporter when Kribi FLNG loaded its first cargo in May. Prior to
Qatar remained the world’s largest source of liquefaction capacity through 2018 (77 MTPA). However, the assumed commercial start-up of Ichthys LNG T1 in the new year pushed total Australian liquefaction to 79.9 MTPA by January 2019, overtaking Qatar. Capacity expansion in Australia and the US in 2018 further concentrated global capacity in the world’s largest producers. Together, Qatar, Australia, Malaysia, Indonesia, Algeria, the US, and Nigeria comprised over 71% of nominal liquefaction capacity at the end of 2018.
Figure 4.3: Nominal Liquefaction Capacity and Utilisation by Market, 20183
3 Utilisation is calculated based on prorated capacity. Indonesian prorated capacity is higher than nominal capacity due to decommissioning of two trains at Bontang LNG, assumed in December 2018.
2 Includes Yemen, which did not export cargoes in 2016-2018. Although the US has exported from Kenai LNG in Alaska, the US Lower 48 began exporting in 2016 (not including re-exports). Projects in the US Lower 48 are utilising a different resource base.
Liquefaction Plants
+22% by 2024Expected growth in global nominal
liquefaction capacity from February 2019
4.3
4.2
Qatar, 77, 102%Australia, 75.4, 95%Malaysia, 30.5, 81%Algeria, 25.3, 41%US, 24.6, 96%Nigeria, 21.9, 94%Russia, 21.8, 110%Indonesia, 20.9, 69%Trinidad, 15.5, 79%Egypt, 12.2, 12%Oman, 10.8, 91%Yemen, 7.2, 0%Brunei, 7.2, 90%PNG, 6.9, 99%UAE, 5.8, 94%Angola, 5.2, 80%Peru, 4.5, 80%Norway, 4.2, 110%Eq. Guinea, 3.7, 96%Cameroon, 2.4, 43%
1990 1995 2000 2005 2010 2015 2020
500
450
400
350
300
250
200
150
100
50
0
100%
90%
80%
70%
60%
50%
40%
30%
20%
10%
0%
Global Liquefaction Capacity % of Capacity Utilised (right axis)
MTPA
Forecast
4.1
Afri
ca
Euro
pe FSU
Latin
Am
eric
a
Mid
dle
East
Nor
th A
mer
ica
Tota
l
Asia
Pac
ific
900
800
700
600
500
400
300
200
100
0
Pre-FIDExisting FID
MTPA
Sources: IHS Markit, IGU
IGU World LNG report - 2019 Edition
Gorgon LNG in Australia (+4.3 MT). The first three trains of Yamal and first two trains of Wheatstone each reached commercial operation in 2018; it was also the first full year of operation for Sabine Pass LNG T3-4 and Gorgon LNG T3.
Elsewhere, changes in feedstock availability affected the utilisation of several liquefaction plants worldwide. The impact of new upstream projects in Trinidad that began operation in 2017 led to a 14% increase in LNG output at Atlantic LNG in 2018 after a period of decline earlier this decade. The start-up of the Khazzan field in late 2017 helped Oman LNG increase exports 18% over 2017 and reach record output, driving a current proposal to expand capacity via debottlenecking. While the Egyptian LNG plant at Idku only reached 20% utilisation, this was nearly double its 2017 level thanks to booming gas production from new fields that will continue to ramp up in 2019.
Despite the global overall utilisation increase, certain projects faced technical or upstream issues that decreased their exports. Pipeline challenges contributed to a 9% fall in LNG output by Malaysia. Declining feedstock availability led to a third consecutive annual decline in utilisation at Bontang LNG in Indonesia, where official statements suggested that only four trains remained in operation as of the end of 2018, with two trains assumed to have been decommissioned during the year. Domestic demand and continued strong competition for gas from pipeline customers in Europe contributed to a decrease in Algerian output as well. Further, an unplanned outage in Papua New Guinea following an earthquake in the first half of the year led to a 16% drop in exports.
The existing projects that did not export cargoes in 2017 remained unutilised in 2018. Although SEGAS LNG has not exported a cargo since 2012 due to feedstock constraints, rejuvenated gas production in Egypt coupled with progress in a long-running arbitration dispute has advanced negotiations to restart operation. Yemen LNG has remained offline since 2015 due to an ongoing civil war. In Alaska, Kenai LNG has not exported a cargo since 2015 owing to feedstock constraints and market conditions. After its acquisition by the owner of a nearby refinery in January 2018, it remains unclear whether it will resume exports.
this, Papua New Guinea in 2014 was the most recent nation to add liquefaction capacity, although the start of commercial operation at Sabine Pass LNG in 2016 marked the first LNG exports from the continental United States.
Under Construction
As of January 2019, 101.3 MTPA of liquefaction capacity was under construction or sanctioned for development. This includes Prelude FLNG, which aimed to begin commercial operation in early 2019. More than 75% of global capacity under construction (77.4 MTPA) is located in North America, with LNG Canada as the only non-US project in that category. Although Australia has been a leading contributor in the ongoing wave of capacity additions, its only remaining under-construction trains are Prelude FLNG and Ichthys LNG T2. Further capacity is under construction in Indonesia (4.3 MTPA), Russia (3.6 MTPA), Mozambique (3.4 MTPA), Malaysia (1.5 MTPA), and Argentina (via an 0.5 MTPA floating liquefaction barge). In addition, partners in the Greater Tortue FLNG project to be based offshore Mauritania and Senegal announced FID in December 2018 for the 2.5 MTPA first phase, but have yet to award construction contracts. Similarly, Golden Pass LNG (15.6 MTPA) in the US reached FID in February 2019 but has not yet begun construction.
Capacity additions in the near future will be dominated by US liquefaction. 63.4 MTPA of capacity is sanctioned or under construction on the US Atlantic and Gulf of Mexico coasts. All of this capacity aside from Corpus Christi LNG is at brownfield projects in which existing regasification plants are being converted. Just under half of this capacity is scheduled for completion and commercial start in 2019, including Cameron LNG T1-2 (8.0 MTPA total), Freeport LNG T1 (5.1 MTPA), Corpus Christi LNG T1-2 (9 MTPA total), Sabine Pass LNG T5 (4.5 MTPA), and Elba Island LNG T1-10 (2.5 MTPA total).
Outside of the US and Australia, Argentina’s Tango FLNG, Indonesia’s Sengkang LNG (0.5 MTPA), and Russia’s Vysotsk LNG T1 (0.7 MTPA), Portovaya LNG (2.0 MTPA), and Yamal LNG T4 (0.9 MTPA) are all targeted for commercial start in 2019. This leaves only a narrow majority of total under-construction capacity (59.5 MTPA) scheduled for completion in 2020 or beyond. This is one factor driving the competition by project sponsors to reach FID imminently as projects sanctioned in 2019 will likely be well positioned to respond to anticipated growth in gas supply needs following the limited expected capacity additions in the first years of the 2020s. This likely helped prompt the FIDs taken by LNG Canada, Greater Tortue FLNG, and Golden Pass LNG in 2018 under affiliate marketing arrangements.
Figure 4.4: Nominal Liquefaction Capacity by Market in 2018 and 20244.4
120%
100%
80%
60%
40%
20%
0%
120
100
80
60
40
20
0
Alge
ria
Ango
la
Cam
eroo
n
Egyp
t
Eq. G
uine
a
Mau
r. -
Sen.
Moz
ambi
que
Nig
eria
Aust
ralia
Brun
ei
Indo
nesi
a
Mal
aysi
a
Papu
a N
ew G
uine
a
Nor
way
Russ
ia
Arge
ntin
a
Cana
da
Peru
Trin
idad
Uni
ted
Stat
es
Om
an
Qat
ar
Uni
ted
Arab
Em
irat
es
Yem
en
Utilisation, 2018 (right axis)2018 2024
MTPAAfrica Asia Pacific
Europe& FSU Americas Middle East
4.5
500
400
300
200
100
0
AP-C3MR/SplitMRAP-C3MR AP-X APC - Other
Shell ProprietaryCOP Opt. Cascade Linde MFC Other
2018 2019 2020 2021 2022 2023 2024
MTPA
41%
12%
18%
22%
38%
10%
20%
23%
5
4
3
2
1
0
50
40
30
20
10
0
1964
-197
0
1971
-197
5
1976
-198
0
1981
-198
5
1986
-199
0
1991
-199
5
1996
-200
0
2001
-200
5
2006
-201
0
2011
-201
5
2016
-201
8
2019
-202
4
MTPA No. of Trains
Average Individual Unit Capacity of Trains Commissioned
No. of New Trains Commissioned (right axis)
Fore
cast
4.6
Note: Liquefaction capacity only includes existing and sanctioned projects expected online by 2024.Sources: IHS Markit, IGU, Company Announcements
34 35
Proposed
There is approximately 842.5 MTPA in pre-FID liquefaction capacity worldwide. Concerns about how many projects can be supported by expected global demand growth have resulted in fierce competition for offtakers by proposed projects. The large number of pre-FID projects as well as uncertainty over future LNG demand and the near-term supply build-up have made it difficult for most proposals to secure offtake deals. This could lead to the market being short of capacity in the mid-2020s if it prevents sufficient FIDs. However, some project sponsors with experience in LNG marketing and confidence in the economics of their proposals may decide to accelerate development by taking FID under an affiliate marketing model, as LNG Canada and Greater Tortue FLNG did in 2018.
The majority of proposed capacity lies in Canada (211 MTPA) and the US (329 MTPA). 89% of proposed US capacity is located on the Gulf of Mexico. North America holds a commercially-recoverable gas resource of over 2,200 trillion cubic feet (Tcf). Feedgas for these proposals will come from a variety of supply basins, although the vast and interconnected gas pipeline network across North America allows natural gas to be procured securely from any number of supply sources. Notably, the largest US proposal in the Pacific Basin, the approximately 20 MTPA Alaska LNG project, aims to use stranded gas from the North Slope.
Most existing and under-construction US LNG projects have been structured as tolling facilities, with capacity holders procuring feed gas from the interconnected North American pipeline network, or have sold Henry Hub-indexed LNG on a free on board (FOB) basis. In a competitive LNG market, some US LNG projects have sought to differentiate themselves by offering a wider variety of commercial structures. These range from vertical integration with upstream resource ownership to alternative pricing mechanisms, such as price linkages to oil or LNG-specific markers. Golden Pass LNG is the first US LNG project to pursue affiliate marketing rather than signing long-term contracts with third parties before FID.
Most Canadian proposals are located on the nation’s Pacific coastline in British Columbia. These proposals intend to source feedstock from the Western Canadian Sedimentary Basin but will require significant investment in lengthy greenfield pipelines to connect the upstream resources to the coastal liquefaction plants. This challenge has contributed to the high capital expenditure estimates that have led to the stalling or cancellation of several Canadian proposals. LNG Canada became the first proposal in the nation to reach FID when it did so in 2018, and the success with which the pipeline associated with the project can be completed, despite ongoing challenges from First Nations leaders, could be indicative of the prospects for pre-FID capacity on the British Columbia coast. Another 47 MTPA of estimated capacity is proposed on Canada’s Atlantic coast; proposed feedstock sources for these projects include gas from Western Canada and the Eastern US.
After the successful start-up of Yamal LNG in 2018 confirmed the potential of commercialising stranded Arctic gas resources, Russia aims to continue its ambitious plans in the region. Building on experience gained in the under-construction Yamal LNG T4 (0.9 MTPA), proposals largely aim to use indigenously produced components to build their projects. This strategy is driven by the goals of reducing costs and exchange rate risk while also insulating sponsors from the risk of potential future sanctions. The largest project among Russia’s 59.3 MTPA in pre-FID capacity is the three-train Arctic LNG-2 (19.8 MTPA total), another project led by Yamal LNG operator Novatek. The project aims to take FID in 2019 and will utilise three domestically-produced gravity-based structures to be built in Murmansk before being shipped complete for installation in the waters off Gydan. A third Novatek proposal in the region, Arctic LNG-1, is targeted for later development. Other Russian project proposals include an additional 5.4 MTPA train at the existing Sakhalin-2 plant on the Pacific coast, the nearby Far East LNG proposal (6.2 MTPA), the 10 MTPA Baltic LNG project on the Baltic Sea, and a second train (0.66 MTPA) at Vysotsk LNG, all of which are targeting FID in 2019.
African proposals account for 111 MTPA in pre-FID capacity. Of this capacity, 81 MTPA is on the east coast of the continent and aim to follow Mozambique’s Coral South FLNG (3.4 MTPA), the first project to reach FID underpinned by the vast new gas discoveries offshore East Africa. 50 MTPA of this capacity is in Mozambique, where the Mozambique LNG (Area 1) (12.9 MTPA) and the Rovuma LNG (15.2 MTPA) projects are both seeking to reach FID in 2019. The two projects have followed different approaches toward sanctioning. As of February 2019, Mozambique LNG has struck seven preliminary or confirmed offtake agreements, including an innovative flexible hybrid contract to sell volumes to buyers in Japan and Europe, as it seeks enough sales to enable FID. The owners of Rovuma LNG, however, agreed in December 2018 to commit to affiliate marketing, taking on contracting risk themselves in order to drive project development forward. Just north of the volumes targeted for Mozambican projects lie offshore reserves tied to the 15 MTPA Tanzania LNG proposal, which aims to begin operation in the second half of the 2020s. Also in East Africa, a 3 MTPA liquefaction project has been proposed in Djibouti to utilise gas from neighbouring Ethiopia.
In West Africa, Nigeria LNG has scaled back its expansion plan to a single 8 MTPA train and hopes to reach FID by the end of 2019. The sponsors of the cross-border Greater Tortue FLNG in Mauritania and Senegal have plans to eventually add a second floating phase, and the resources supporting the project could lead to several more floating and/or larger-scale onshore liquefaction projects in both Mauritania and Senegal in the long term, either as additional cross-border schemes or individual single-market projects. Additional floating projects have been proposed in Republic of Congo, Equatorial Guinea, and Cameroon.
In the Asia Pacific region (40.8 MTPA proposed), Australia is home to only four active proposals for new trains despite its recently-gained position as the world leader in liquefaction capacity. Australia may instead see more development of gas fields to backfill existing plants. The Browse field could fill spare capacity at North West Shelf LNG, while the Scarborough field has been proposed to backfill North West Shelf or Pluto LNG and potentially drive construction of a new 5 MTPA train at Pluto. Both fields had previously been the subject of floating liquefaction proposals. Indonesia (15.6 MTPA) and Papua New Guinea (12 MTPA) are far greater sources of pre-FID capacity, with the majority of the Papua New Guinea proposals seeking FID in 2019.
In the rest of the world, pre-FID capacity is dominated by the proposed expansion of Qatargas. Having observed a moratorium on new gas development in the North Field for over a decade, Qatar announced an end to the policy in 2017 and signalled plans to increase its liquefaction capacity. After two announcements that it had increased the scope of its plans, Qatar currently plans to bring its total capacity to 110 MTPA and regain its position as the global leader in LNG export capacity in the face of ongoing US and Australian expansion. Its expansion plan includes four megatrains, listed at 7.8 MTPA each in the FEED scope of work announced in March 2018. Qatar aims to take FID in 2019, potentially with foreign partners. It targets first LNG by end-2023 and hopes to complete the expansion by end-2024.
As in Australia, backfill at mature projects may increase output from nations where new nominal capacity will be limited or non-existent. Discussions aimed at securing Venezuelan and cross-border resources to solidify utilisation increases at Trinidad’s Atlantic LNG continue, and gas could arrive from the Dragon field as early as 2020. In Egypt, production from new fields like Zohr and West Nile Delta is likely to allow for increased output at the underutilised Egyptian LNG plant and the long-idle SEGAS LNG. Potentially more significant in the long-term are emerging proposals to feed Egypt’s plants with gas from fields offshore Israel and Cyprus. First pipeline gas exports from Israel to Egypt are expected to begin in 2019, and while these initial volumes are not explicitly tied to liquefaction, they are likely to help a gas surplus in Egypt and facilitate greater LNG exports.
Liquefaction Plants
Decommissioned
No train has been formally announced as decommissioned since Arun LNG in Indonesia, which was then converted to a regasification terminal. However, Bontang LNG has confirmed only four trains are operational at the plant, meaning that an additional two trains of the plant are assumed to have been decommissioned at end 20184. Two trains had initially been taken offline and presumed decommissioned in the early 2010s. Elsewhere, limited decommissioning activity is expected in the near term. Kenai LNG in Alaska, which went into preservation mode in 2017, has not exported a cargo since 2015. After being sold to refiner Andeavor in January 2018 for likely integration with its nearby refinery, it is unclear when or if it will resume exports.Aside from Kenai, 33.6 MTPA of global liquefaction capacity is at
plants that have been in operation for 35 years or longer as of February 2019, including trains at Arzew LNG in Algeria, Bontang LNG in Indonesia, and Malaysia LNG Satu. Ageing trains may be decommissioned for technical reasons, but these plants have not made any such announcements. In November 2018, Abu Dhabi officials announced that the first two trains of ADNOC LNG (formerly known as ADGAS) would undergo a refurbishment process in the coming years to maintain the project’s full capacity. The trains began commercial operation in 1977. While younger in age, the three trains of Oman LNG were to be taken offline in 2025, but the arrival of new feedstock from the Khazzan tight gas field since 2017 has shifted the nation’s gas balance. This has led Oman not only to cancel its decommissioning plans but also to explore a debottlenecking of the plant, which it hopes will add 1-1.5 MTPA in capacity over 2019-20.
IGU World LNG report - 2019 Edition
Courtesy of Shell
4 The 5.6 MTPA in capacity at the two trains assumed to have been decommissioned at end-2018 is not included in totals of year-end liquefaction capacity for Indonesia referenced in charts in this chapter.

36 37
4.4LIQUEFACTION PROCESSES
Air Products liquefaction processes remained the most widely used in liquefaction in 2018, totalling 72% of global capacity (see Figure 4.5) The most widely used process was AP-C3MR™ at 42% of global capacity, while AP-C3MR/SplitMR® accounted for 18% of capacity and the AP-X® process accounted for 12% of capacity worldwide. Air Products processes are used in much of the capacity that began operation in 2018; the AP-C3MR™ design is used at Yamal LNG in Russia, and the AP-C3MR/SplitMR® process is used at Cove Point LNG in the US. These processes will be used in projects set for 2019 start-up as well. AP-C3MR™ is to be used at Cameron LNG in the US and AP-C3MR/SplitMR® is set for use at Freeport LNG in the US and Ichthys LNG in Australia, helping drive its share of total liquefaction to 20% by 2024. All global capacity to use the AP-X® process is in the existing Qatari megatrains, and its share of global liquefaction capacity will be bolstered if it is selected for the four new megatrains proposed to expand Qatargas.
Air Products also has a central role in most existing or under-construction floating liquefaction. AP-N™ process is used in PFLNG Satu and the under-construction PFLNG Dua, and the AP-DMR™ process will be used at Coral South FLNG. While Shell’s proprietary Floating LNG process is used at Prelude FLNG, the vessel does incorporate a cryogenic heat exchanger provided by Air Products. However, Kribi FLNG—which, unlike the previous LNG FPSO projects, is a converted floating liquefaction unit rather than a purpose-built one—uses the Black & Veatch PRICO® process.
Over 21 MTPA in new liquefaction is expected to come online with the ConocoPhillips Optimized Cascade® process by 2022. The process, well-suited for dry gas, is particularly prominent in US and Australian projects. It was used in the 8.9 MTPA Wheatstone LNG project that came online in 2018. It is also used in the under-construction Corpus Christi T1-3 (13.5 MTPA total) and Sabine Pass LNG, including the 4.5 MTPA T5 expected online in early 2019. By 2020, it will have been used in 62.2 MTPA in new liquefaction capacity to have come online since 2016, all of which is in the US and Australia. By 2024, it is expected to be used in 23% of global liquefaction.
Smaller or modular trains are increasingly common in liquefaction plant proposals (see Figure 4.6). This can lower costs by enabling offsite construction and reduce the volume of contracts needed before an FID is reached. Certain liquefaction processes are geared toward smaller train capacities. This approach is particularly common in current North American proposals. Calcasieu Pass LNG T1-18 (20 MTPA total) and Fourchon LNG T1-10 (5 MTPA total) both target FID in 2019 and are among the US proposals to use Chart Industries’ IPSMR® process. Magnolia LNG T1-4 (8 MTPA total) plans to use the LNG Limited OSMR® process. Annova LNG T1-6 (6 MTPA total), Jordan Cove T1-5 (7.5 MTPA total) and several US and Canadian floating proposals all plan to use Black & Veatch’s PRICO®. Elba Island T1-10 (2.5 MTPA total) is expected to come online by end-2019 with Shell’s Movable Modular Liquefaction System (MMLS). In Russia, Novatek’s proprietary Arctic Cascade process will be used for the first time in the under-construction Yamal T4 (0.9 MTPA), targeted for completion in 2019.
Figure 4.6: Number of Trains Commissioned vs. Average Train Capacity, 1964-2024
Sources: IHS Markit, Company Announcements
4.4
120%
100%
80%
60%
40%
20%
0%
120
100
80
60
40
20
0
Alge
ria
Ango
la
Cam
eroo
n
Egyp
t
Eq. G
uine
a
Mau
r. -
Sen.
Moz
ambi
que
Nig
eria
Aust
ralia
Brun
ei
Indo
nesi
a
Mal
aysi
a
Papu
a N
ew G
uine
a
Nor
way
Russ
ia
Arge
ntin
a
Cana
da
Peru
Trin
idad
Uni
ted
Stat
es
Om
an
Qat
ar
Uni
ted
Arab
Em
irat
es
Yem
en
Utilisation, 2018 (right axis)2018 2024
MTPAAfrica Asia Pacific
Europe& FSU Americas Middle East
4.5
500
400
300
200
100
0
AP-C3MR/SplitMRAP-C3MR AP-X APC - Other
Shell ProprietaryCOP Opt. Cascade Linde MFC Other
2018 2019 2020 2021 2022 2023 2024
MTPA
41%
12%
18%
22%
38%
10%
20%
23%
5
4
3
2
1
0
50
40
30
20
10
0
1964
-197
0
1971
-197
5
1976
-198
0
1981
-198
5
1986
-199
0
1991
-199
5
1996
-200
0
2001
-200
5
2006
-201
0
2011
-201
5
2016
-201
8
2019
-202
4
MTPA No. of Trains
Average Individual Unit Capacity of Trains Commissioned
No. of New Trains Commissioned (right axis)
Fore
cast
4.6
Figure 4.5: Liquefaction Capacity by Type of Process, 2018-2024
4.4
120%
100%
80%
60%
40%
20%
0%
120
100
80
60
40
20
0
Alge
ria
Ango
la
Cam
eroo
n
Egyp
t
Eq. G
uine
a
Mau
r. -
Sen.
Moz
ambi
que
Nig
eria
Aust
ralia
Brun
ei
Indo
nesi
a
Mal
aysi
a
Papu
a N
ew G
uine
a
Nor
way
Russ
ia
Arge
ntin
a
Cana
da
Peru
Trin
idad
Uni
ted
Stat
es
Om
an
Qat
ar
Uni
ted
Arab
Em
irat
es
Yem
en
Utilisation, 2018 (right axis)2018 2024
MTPAAfrica Asia Pacific
Europe& FSU Americas Middle East
4.5
500
400
300
200
100
0
AP-C3MR/SplitMRAP-C3MR AP-X APC - Other
Shell ProprietaryCOP Opt. Cascade Linde MFC Other
2018 2019 2020 2021 2022 2023 2024
MTPA
41%
12%
18%
22%
38%
10%
20%
23%
5
4
3
2
1
0
50
40
30
20
10
0
1964
-197
0
1971
-197
5
1976
-198
0
1981
-198
5
1986
-199
0
1991
-199
5
1996
-200
0
2001
-200
5
2006
-201
0
2011
-201
5
2016
-201
8
2019
-202
4
MTPA No. of Trains
Average Individual Unit Capacity of Trains Commissioned
No. of New Trains Commissioned (right axis)
Fore
cast
4.6Source: IHS Markit
Liquefaction Plants
4.5FLOATING LIQUEFACTION
Cameroon’s Kribi FLNG (2.4 MTPA) began exports in 2018, becoming the second floating liquefaction project in operation, and the first to utilise a liquefaction unit built from a converted LNG vessel. The plant followed the purpose-built PFLNG Satu in Malaysia (1.2 MTPA), which started exports in 2017 in a major milestone for the LNG industry. An additional 11.5 MTPA in floating liquefaction capacity has reached FID and is anticipated to come online by 2022, with the purpose-built Prelude FLNG in Australia (3.6 MTPA) and the barge-based Tango FLNG in Argentina (0.5 MTPA) expected to start operations in 2019.
As of January 2018, there is 161.6 MTPA of pre-FID floating liquefaction capacity proposed worldwide across 21 projects. Including existing and sanctioned projects, a combined 80% of this capacity is located in Canada (74.4 MTPA) and the US (69 MTPA). Other proposals exist in Argentina, Australia, Cameroon, Republic of the Congo, Djibouti, Equatorial Guinea, Indonesia, Malaysia, Mauritania-Senegal, Mozambique, Papua New Guinea, and Russia (see Figure 4.7).
Floating liquefaction projects, which are generally smaller in capacity (approximately 0.5 MTPA-4 MTPA) than onshore liquefaction plants, can allow for the commercialisation of stranded offshore gas resources. Their smaller capacity can enable them to underpin FID with fewer offtake contracts or with contracts to deliver to buyers with lower needs. Barge-based floating projects, which tend to be the smallest (around 0.5 MTPA), are generally based at or near the shoreline and supplied by gas from onshore resources.
Through offsite construction, LNG FPSO projects aim to gain cost advantages over onshore construction. Some initial projects have experienced delays and cost escalation as they confront challenges of the new technology. As floating liquefaction is a technology still in its relative infancy, the potential cost benefits of LNG FPSO technology will become clearer as more projects reach start-up. The lower infrastructure investment that may be required, particularly for projects based on a conversion model, and the ability of LNG FPSO vessels to serve multiple projects during their operational lifetimes, make the model especially suited for smaller, isolated gas resources that would be exhausted in a relatively short timeframe.
Offshore floating projects use either purpose-built or converted vessels for liquefaction. PFLNG Satu and three of the five floating liquefaction projects that are under construction or have reached FID are using purpose-built vessels. After arriving at its site offshore Australia in mid-2017, Prelude FLNG began gas production in late 2018 and anticipates first exports in early 2019. PFLNG Dua anticipates its newbuild vessel sailing to its site in early 2020 for commissioning. In Mozambique, Coral South FLNG aims to begin operation in early 2022. The 3.4 MTPA project reached FID in 2017 after being prioritised by project sponsors to rapidly commercialise offshore gas resources, demonstrating the viability of investments in Mozambique’s Rovuma basin and paving the way for future liquefaction developments in the market.
The Tango FLNG barge (0.5 MTPA), which is being delivered to Argentina to help commercialize seasonal gas surpluses in the nation, was originally built for use in Colombia. Then known as Caribbean FLNG, the Exmar-owned vessel had been looking for a new charterer since Colombia’s liquefaction plans were cancelled in 2016. A proposal to use the barge to liquefy Iranian gas for export fell through in early 2018. Argentina’s use of the barge is an example both of the flexibility the technology offers and the quick development timeframe possible when barges are available for charter. The ten-year charter between Exmar and Argentina’s YPF was only signed in November 2018, and first exports are anticipated in the second quarter of 2019.
Conversion schemes are also emerging as an option for floating liquefaction, and the first such project to begin operation was Kribi FLNG in 2018. After approximately 40 Tcf was discovered between Mauritania and Senegal in recent years, Greater Tortue FLNG was proposed to commercialise the 15 Tcf cross-border Ahmeyim/Guembeul offshore field. The project’s first phase (2.5 MTPA) reached FID in late 2018 based on a conversion scheme, with project partner BP committing to take the entire offtake into its portfolio. The project targets first gas in 2022, and may pave the way for further floating and onshore liquefaction capacity in Mauritania and Senegal.
161.6 MTPAProposed floating
liquefaction capacity,February 20195
5 This number is included in the 842.5 MTPA of total proposed global liquefaction capacity quoted in Section 4.1. It excludes the 15.1 MTPA of FLNG capacity in operation or having reached FID.
IGU World LNG report - 2019 Edition
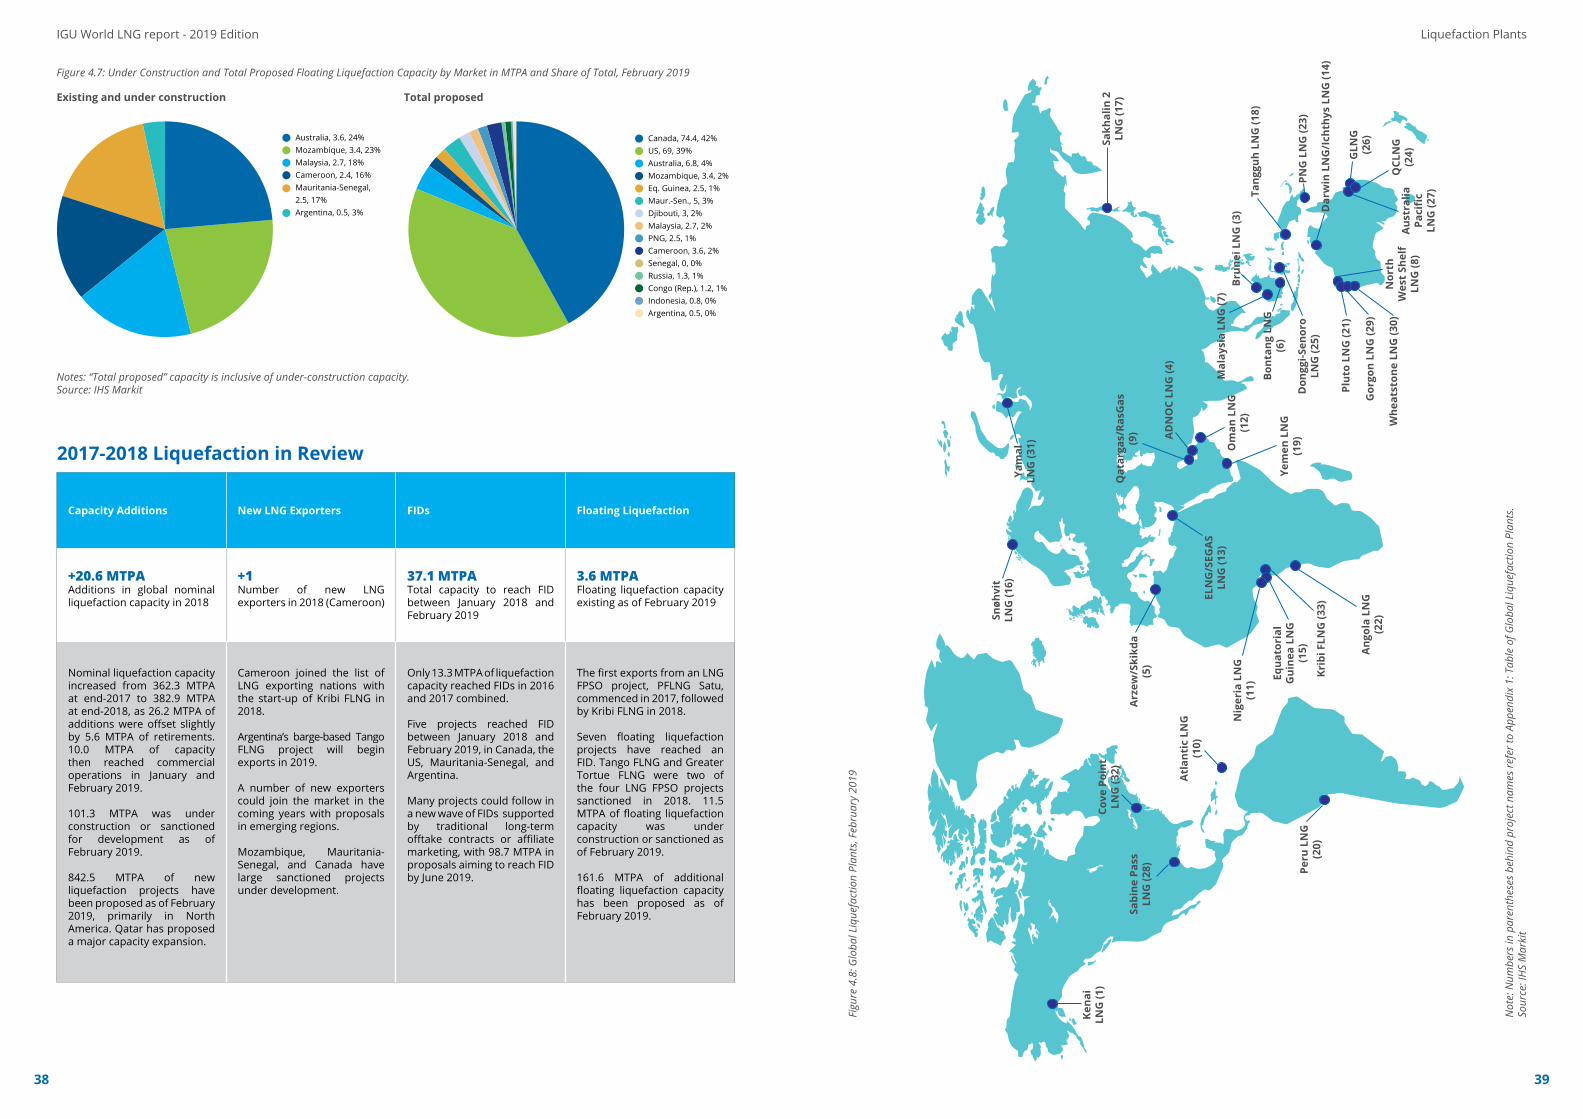
38 39
Australia, 3.6, 24%Mozambique, 3.4, 23%Malaysia, 2.7, 18%Cameroon, 2.4, 16%Mauritania-Senegal,2.5, 17%Argentina, 0.5, 3%
Canada, 74.4, 42%US, 69, 39%Australia, 6.8, 4%Mozambique, 3.4, 2%Eq. Guinea, 2.5, 1%Maur.-Sen., 5, 3%Djibouti, 3, 2%Malaysia, 2.7, 2%PNG, 2.5, 1%Cameroon, 3.6, 2%Senegal, 0, 0%Russia, 1.3, 1%Congo (Rep.), 1.2, 1%Indonesia, 0.8, 0%Argentina, 0.5, 0%
4.7Figure 4.7: Under Construction and Total Proposed Floating Liquefaction Capacity by Market in MTPA and Share of Total, February 2019
Existing and under construction Total proposed
Notes: “Total proposed” capacity is inclusive of under-construction capacity.Source: IHS Markit
2017-2018 Liquefaction in Review
Liquefaction Plants
Figu
re 4
.8: G
loba
l Liq
uefa
ctio
n Pl
ants
, Feb
ruar
y 20
19
Kena
iLN
G (1
)
Sabi
ne P
ass
LNG
(28)
Cove
Poi
ntLN
G (3
2) Atl
anti
c LN
G(1
0)
Peru
LN
G(2
0)
Nig
eria
LN
G(1
1)
Equa
tori
alG
uine
a LN
G(1
5)
Krib
i FLN
G (3
3)
Ang
ola
LNG
(22)
ELN
G/S
EGA
SLN
G (1
3)
Snøh
vit
LNG
(16)
Arz
ew/S
kikd
a(5
)
Yam
alLN
G (3
1)
Qat
arga
s/Ra
sGas
(9)
Sakh
alin
2LN
G (1
7)
Brun
ei L
NG
(3)
Mal
aysi
a LN
G (7
)
AD
NO
C LN
G (4
)
Om
an L
NG
(12)
Yem
en L
NG
(19)
Bont
ang
LNG
(6)
Don
ggi-S
enor
oLN
G (2
5)
Plut
o LN
G (2
1)
Gor
gon
LNG
(29)
Whe
atst
one
LNG
(30)
Aus
tral
iaPa
cific
LNG
(27)
Nor
thW
est
Shel
fLN
G (8
)
QCL
NG
(24)GLN
G(2
6)
Dar
win
LN
G/I
chth
ys L
NG
(14)
PNG
LN
G (2
3)
Tang
guh
LNG
(18)
IGU World LNG report - 2019 Edition
Capacity Additions New LNG Exporters FIDs Floating Liquefaction
+20.6 MTPAAdditions in global nominal liquefaction capacity in 2018
+1Number of new LNG exporters in 2018 (Cameroon)
37.1 MTPATotal capacity to reach FID between January 2018 and February 2019
3.6 MTPAFloating liquefaction capacity existing as of February 2019
Nominal liquefaction capacity increased from 362.3 MTPA at end-2017 to 382.9 MTPA at end-2018, as 26.2 MTPA of additions were offset slightly by 5.6 MTPA of retirements. 10.0 MTPA of capacity then reached commercial operations in January and February 2019.
101.3 MTPA was under construction or sanctioned for development as of February 2019.
842.5 MTPA of new liquefaction projects have been proposed as of February 2019, primarily in North America. Qatar has proposed a major capacity expansion.
Cameroon joined the list of LNG exporting nations with the start-up of Kribi FLNG in 2018.
Argentina’s barge-based Tango FLNG project will begin exports in 2019.
A number of new exporters could join the market in the coming years with proposals in emerging regions.
Mozambique, Mauritania-Senegal, and Canada have large sanctioned projects under development.
Only 13.3 MTPA of liquefaction capacity reached FIDs in 2016 and 2017 combined.
Five projects reached FID between January 2018 and February 2019, in Canada, the US, Mauritania-Senegal, and Argentina.
Many projects could follow in a new wave of FIDs supported by traditional long-term offtake contracts or affiliate marketing, with 98.7 MTPA in proposals aiming to reach FID by June 2019.
The first exports from an LNG FPSO project, PFLNG Satu, commenced in 2017, followed by Kribi FLNG in 2018.
Seven floating liquefaction projects have reached an FID. Tango FLNG and Greater Tortue FLNG were two of the four LNG FPSO projects sanctioned in 2018. 11.5 MTPA of floating liquefaction capacity was under construction or sanctioned as of February 2019.
161.6 MTPA of additional floating liquefaction capacity has been proposed as of February 2019.
Not
e: N
umbe
rs in
par
enth
eses
beh
ind
proj
ect n
ames
refe
r to
Appe
ndix
1: T
able
of G
loba
l Liq
uefa
ctio
n Pl
ants
.So
urce
: IH
S M
arki
t

40 41
4.6RISKS TOPROJECT DEVELOPMENT
While there have been real improvements in LNG flexibility, which can contribute to easing supply shortages, uncertainties remain for the future evolution of gas markets. This includes a risk of tightening from insufficient investment in production and infrastructure capacity, and questions surrounding future shipping capacity growth - a pre-condition for LNG market flexibility. These uncertainties could have an impact on price volatility and hurt consumers – especially the most price-sensitive emerging buyers – and cause additional security of supply concerns.
LNG flexibility has evolved with the development of secondary markets, emphasizing the role of portfolio players and the growing role of emerging LNG buyers, and of the development of market liquidity on trade and new contracts. To address these issues, supply flexibility remains a key prerequisite to ensure further global gas trade development and security. Yet the priorities in terms of flexibility differ for long-term traditional buyers who seek the removal of destination clauses, and new emerging buyers whose
Project EconomicsMany project sponsors are seeking to reduce costs to bolster their projects’ competitiveness. The extent to which they are successful will likely have a significant impact on which projects are sanctioned in the near term. Fiscal and regulatory uncertainty, which has been a challenge in some emerging liquefaction regions, can also impact project costs.
LNG Canada, for example, rebid EPC work on a competitive basis, and the government of British Columbia, where LNG Canada is located, also announced a series of fiscal measures intended to improve projects’ competitiveness. This combination of measures has been successful, resulting in the sanctioning of the LNG Canada project in 2018.
Other projects, such as the now state-owned Alaska LNG project, seek to benefit from tax-exempt status and lower financing costs. To expedite marketing and financing, some sponsors have incorporated options for a phased approach or reduced scope into their development plans.
It is estimated that the production deficit gap in 2025 will be about 50 MTPA, which would need to be sanctioned soon to be on-stream in that timeframe. By assessing breakeven prices for potential future LNG projects, it is possible to predict which projects will most likely be developed, being those projects with the lowest breakeven cost.
Politics, Geopolitics, and Regulatory ApprovalsThere are a variety of political, geopolitical, and regulatory uncertainties that have the potential to impede the pace of project development.
Some projects in operation have been impacted by security issues, including Yemen LNG which declared force majeure in 2015 and remains offline owing to an ongoing civil war.
US and European Union (EU) sanctions remain a challenge to LNG project development in Russia and Iran, providing greater uncertainty around future project development in those markets, though Yamal LNG was ultimately able to secure financing and has begun exports. In Iran, the sanctions lifted in 2016 were reimposed by the US at end 2018. Iran’s LNG ambitions now face numerous challenges, as Iran is unable to use US-sourced liquefaction technology, and secondary sanctions remain in place, meaning that EU sourced technologies and equipment for Iran LNG projects have also been affected by these sanctions, as are payment mechanisms.
Extensive regulatory requirements, particularly in developed supplier markets, can be time-consuming and costly, although in many cases the process, while rigorous, is nonetheless predictable. In some circumstances, the review process can be protracted due to local opposition, based on environmental or Not In My Backyard (NIMBY) grounds. Other potential LNG exporting markets, such as Tanzania, are still developing their gas and LNG regulatory frameworks, which will in part drive the pace of project development.
Partner Priorities, Ability to Execute and Business CyclesPartner alignment is critical to reaching an FID, while divergent priorities and views on market fundamentals can result in project delays or cancellations. For companies with multiple projects, investment decisions will be made within the context of their broader portfolios. The size of the investment may also impact project participants’ decisions to proceed.
Market uncertainty and macroeconomic conditions have been important factors in the reduction in foundational contracting activity and FIDs over the past few years. Several projects have referenced weaker market conditions when announcing they would no longer proceed.
For their part, buyers have been more reluctant to commit to long-term contracts owing to uncertainty around their demand requirements as well as oil and gas prices. For instance, the trajectory of nuclear power plant restarts in Japan could significantly impact that market’s LNG requirements, and some emerging markets have proposed ambitious LNG import or gas-fired power generation targets that may not be
priority is more focused on procuring short-term supply, usually for prompt execution.
Changing LNG markets are also reshaping shipping needs and the risk of a lack of timely investment in the LNG carrier fleet could pose a threat to market development and security of supply, which could materialise even earlier than the risk of insufficient liquefaction capacity.
The traditional risks facing liquefaction project development continue to include project economics, politics and geopolitics, regulatory approvals, partner priorities and ability to execute, business cycles, feedstock availability, domestic gas needs, fuel competition, and marketing and contracting.
However there has been progress and 2018 saw 4 liquefaction project FIDs (LNG Canada, Corpus Christi Train 3, Tango FLNG, and Greater Tortue FLNG).
LNG Carrier and Samcheok Terminal - Courtesy of KOGAS
fully achieved. Some buyers wish to procure more LNG on a spot or shorter-term basis as a means of dealing with this unpredictability or otherwise diversifying their portfolios; others may be seeking lower prices before committing to a long-term contract during what may be a period of oversupply. Potential customers and financiers must also be confident in the technical, operational, financial, and logistical capabilities of project sponsors and their partners, to ensure that a project reaches FID and performs as expected. This has become increasingly important as several proposed projects are being developed by companies with limited or no direct liquefaction, or major project development, experience.
Feedstock Availability, Domestic Gas Needs,and Fuel CompetitionGas supply challenges and/or growing domestic demand have impacted production at operating facilities in Algeria, Australia, Egypt, Indonesia, Oman, and Trinidad. For some projects, they also pose a challenge for future production as fields mature.
Coal seam gas-based projects in Eastern Australia faced significant pressure in 2017 to supply more gas locally in response to high domestic gas prices. Fracking restrictions in several states and capital spending reductions have hindered domestic production growth, while significant volumes have been contracted for export as LNG. The Australian government in 2017 enacted a temporary mechanism to ensure that domestic demand was fulfilled, with the possibility of export controls being imposed in the event of a shortfall. To avoid such restrictions, the East Coast LNG producers and the Australian government reached an agreement to ensure sufficient domestic gas supply in 2018 and 2019. In June 2018, the Australian Energy Market Operator (AEMO) advised that Australia is no longer in danger of a domestic gas supply shortfall. AEMO’s 2018 Gas Statement of Opportunities (GSOO) has found a change in international market dynamics, lower demand for gas-powered generation, new pipeline interconnections and the Federal Government’s Australian Domestic Gas Supply Mechanism have delivered an improved outlook for the east-coast gas markets.
Progress on new upstream developments has accelerated over the past two years, which will extend the life of some existing liquefaction plants by either supplying them directly or being used to fulfil domestic demand. For example:
• The Browse gas fields are being proposed to backfill North West Shelf LNG in Australia. Australia’s oldest LNG plant is for the first time set to process third-party gas after a landmark agreement was reached among the North West Shelf venture partners that will ensure the plant can keep running after the venture’s own gas runs out. The deal, agreed in July 2018 by the partners also paves the way for gas from Woodside Petroleum’s Browse fields to be processed at the NW Shelf venture’s LNG plant in Karratha.
• ConocoPhillips and its co-venturers are proposing to develop the Barossa hydrocarbon resources located offshore about 300 kilometres north of Darwin to provide a new source of gas to backfill the Darwin LNG facility from 2023 when the existing offshore gas supply from Bayu-Undan is expected to be exhausted. Barossa FEED phase will be completed in 1Q2019 and FID is targeted towards the end of 2019.
• Exports from Oman LNG could be extended as a result of new production from the Khazzan field that began in the last quarter of 2017. With the new stream feeding straight into the plant, all three liquefaction trains are now operating at almost full capacity.
• In Egypt the successful commercialisation of new gas fields is supporting a return to exports on a larger scale. The latest turnaround in Egypt’s gas fortunes is due to production from the Zohr field, as well as some fresh BP finds. Located off the market’s northern coast, Zohr is the largest gas deposit in the Mediterranean and its gas reserves are not only bringing an end to the need for LNG imports but also meeting local demand and supporting a resumption of LNG exports. The Damietta LNG facility has agreed
Liquefaction PlantsIGU World LNG report - 2019 Edition

42 43
to restart exports from the plant, while Idku LNG had already recommenced limited shipments in 2016. Damietta ceased export shipments in February 2013, citing insufficient quantities of feed gas for its liquefaction train, and Idku followed 12 months later, declaring force majeure to its LNG customers due to ongoing diversions of gas supplies to the local market.
• In Trinidad BP and Shell have been working to extend the operational life of Atlantic LNG in Point Fortin. In 2018 the government signed an agreement to purchase natural gas from Venezuela’s offshore Dragon field (via Shell’s Hibiscus platform), providing much needed additional feedstock for the Atlantic liquefied natural gas (ALNG) project. In recent years, ALNG project stakeholders have also identified several new fields to shore up LNG production. In 2017, BP started production from the Juniper field and also sanctioned the development of the Angelin field, expected to start production in 2019. BP has also commissioned the Trinidad onshore compression project to increase feedstock supply to the facility. Additional offshore fields that could provide natural gas feedstock for the project include BHP Billiton’s LeClerc field and BP’s blocks near Juniper and Cashima fields.
In end-markets, the competitiveness of LNG versus pipeline gas (if applicable) and alternate fuels remain an important factor in liquefaction investment decisions.
Marketing and ContractingThe long-term contracting environment remained challenging in 2018. With expectations that the significant LNG supply build-up in the near term may potentially result in lower prices, most buyers have been reluctant to sign long-term foundational contracts to underpin new liquefaction capacity. Some, such as those with uncertain demand requirements, have instead increased reliance on spot, short, or medium-term contracts. However, there is recognition that new liquefaction capacity, and therefore long-term contracts, will be needed to prevent a significant market tightening in the next decade. Indeed, several long-term contracts associated with new trains were signed in 2018.
There is significant competition for customers. New liquefaction
proposals are competing with existing projects, seeking to maintain production via potentially lower-cost backfill opportunities or additional trains. In this environment, there has been downward pressure on contract pricing terms, including slopes for oil-indexed contracts and capacity fees at some US projects, in addition to shorter term lengths and proposals for alternative commercial structures. Several buyers have been able to renegotiate existing long-term contracts at lower prices, though they have typically come with larger volume requirements or longer terms.
Some emerging LNG buyers continue to secure volumes via fixed-destination agreements, while other LNG customers, including traditional buyers in Asia, are seeking greater destination flexibility to manage their portfolios. Japanese buyers are unlikely to sign new contracts with destination clauses as recommended by a Japan Fair Trade Commission report issued in 2017. Japan’s trade ministry has also advocated the re-working of current LNG supply contracts to remove restrictive destination clauses, deemed to be ‘anti-competitive’.
Companies that have traditionally served as foundational buyers, such as aggregators or certain utilities, have portfolios that may require or benefit from full destination flexibility. Commodity traders are also increasing their presence in the LNG market and have signed long-term foundational offtake contracts for the first time. These types of companies are important intermediaries between project sponsors and higher risk markets that may not have sufficient credit ratings to support a liquefaction project FID.
While most LNG projects require long-term LNG sales contracts to move forward, certain types of projects may not, depending on project scope (e.g., new train versus existing train), project costs, financing plans, risk tolerance, and return expectations. The recently sanctioned LNG Canada project is different in that it isn’t underpinned by long-term sales contracts. These agreements are typically necessary to provide a level of certainty to the oil and gas companies and their financiers that guaranteed buyers existed for the output and revenues. Instead, each of the partners in LNG Canada is responsible for providing their share of the natural gas to be liquefied and would also oversee marketing their share of the LNG.
Table 4.1: Liquefaction Project Development Risks
Risk Factors Impact on LNG Project Development
Project EconomicsLong-term sales contracts that allow for a sufficient return typically underpin the financing of LNG projects. High project costs or changing market prices can have a large impact on when or if a project is sanctioned, and cost overruns post-FID can impact project returns.
Politics & GeopoliticsPermitting may be time consuming. National or local governments may not be supportive of exports and could levy additional taxes on LNG projects or establish stringent local content requirements. Political instability or sanctions could inhibit project development or operations.
Regulatory Approvals Regulatory approval may be costly and extends to the approval of upstream development and pipeline construction. Local environmental opposition, including from indigenous groups, may also arise.
Partner Priorities Not all partners are equally committed to a project and face different constraints depending on their respective portfolios. Ensuring alignment in advance of an FID may be difficult.
Ability to Execute Partners must have the technical, operational, financial, and logistical capabilities to fully execute a project. Certain complex projects may present additional technical hurdles that could impact project feasibility.
Business Cycle Larger economic trends (e.g. declining oil prices, economic downturns) could limit project developers’ ability or willingness to move forward on a project.
Feedstock Availability The overall availability of gas to supply an LNG project may be limited by technical characteristics of the associated fields or the requirement of long-distance pipelines.
Fuel Competition Interest in a project may wane if project developers or end-markets instead seek to develop or consume pipeline gas or competing fuels, including coal, oil, or renewables.
Domestic Gas Needs Markets with high or rising gas demand may choose to use gas domestically rather than for exports. This often results in new or existing liquefaction projects being required to dedicate a share of production to meet domestic demand. In some cases, it may also limit the life of existing projects.
Marketing/Contracting Project developers generally need to secure long-term LNG buyers for a large portion of project capacity before sanctioning a project. Evolving or uncertain market dynamics may make this task more difficult.
Liquefaction PlantsIGU World LNG report - 2019 Edition
The current wave of new global LNG export capacity development is due online by the end of 2020. In the short run, this massive capacity addition is likely to result in a surplus and increase competition – however this could be short-lived with dynamic growth in Asian emerging markets. Without new investment, the continuous growth of the LNG trade could result in a tight market by 2023. Owing to the long lead time of such projects, investment decisions need to be taken in the next few years to ensure adequate supply through the 2020s.
The pickup in the second half of 2018 and 1Q2019 in new LNG export project approvals suggests that the risk of an abrupt tightening in global LNG around the mid-2020s may be easing. A steady flow of additional projects will still be required to meet demand and there is still considerable disagreement between buyers and sellers about what kind of business models and contracting structures will underpin new investment decisions in the new global LNG order. However, the outlook for new projects is more optimistic, as an increasingly liquid, flexible and transparent trading space is creating opportunities to spread market risks more evenly among stakeholders and along the value chain.
While projects that can come to market relatively quickly and at a lower cost (such as the brownfield Qatari expansion) are the ones most amenable to the industry’s current focus on capital discipline and short-cycle investments, large-scale greenfield projects can also find a place in the new gas order supported by new emerging market solutions.
Several regions around the world have proposed large amounts of new liquefaction capacity based on significant gas resources. Progress was achieved on both the commercial and regulatory fronts in 2018 despite an investment hiatus. Projects are examining ways to improve their competitiveness, though political and geopolitical risks remain in some regions, which can extend development timelines.
Middle EastIn Qatar, the 12-year self-imposed moratorium on further North Field gas utilisation has been removed and a major Expansion Project is under development by Qatar Petroleum. Chiyoda has been contracted to carry out FEED work for a total of four new 7.8MTPA production trains. When the expansion plans were unveiled last year the production capacity was to be increased from the current 77MTPA to 100MTPA. However, based on the good results obtained through recent additional appraisal and testing, they decided to add a fourth train (to the three trains previously announced), expanding Qatar’s export capacity by around 43% to 110MTPA. Qatar Petroleum plans to make its final investment decision on the expansion and announce partners by the end of 2019, and aims to be onstream in 2024.
Iran’s first LNG export project, Iran LNG with a planned capacity of 10.8MTPA, has been stalled again due to the impact from the US sanctions. Work on the plant hit a wall in 2012 when sanctions stopped Iran from bringing in specialist liquefaction equipment.
4.7UPDATE ON NEWLIQUEFACTION PLAYS
Much of the offsites and utilities facilities for this project, including power station and LNG and LPG tanks, are in place.
United StatesThe emergence of the United States as a global exporter challenges the traditional features of LNG trade. The wave of liquefaction projects being developed in the US ensures ample supply and growth of LNG trade but also challenges the traditional features of supply contracts. The emergence of US exports with flexible destination and gas-indexed pricing presents a different model from the standard fixed-delivery, oil-indexed supply agreements. The United States appears likely to challenge Qatar in Asian and European LNG markets as a new global player.
The United States began exporting LNG from the Lower 48 states in February 2016, when the Sabine Pass liquefaction terminal in Louisiana shipped its first cargo. Since then, Sabine Pass expanded from one to four operating liquefaction trains, and the single train Cove Point LNG export facility began operation in Maryland. Two more trains, Sabine Pass Train 5 and Corpus Christi LNG Train 1, began LNG production this year, several months ahead of schedule.
The innovative Elba Island Liquefaction facility (which involves adding 10 small-scale 0.25MTPA modular units to the existing import terminal) is reported as planning a Q1 2019 start-up with trains being progressively placed in-service through 2019.
In November, Sempra announced that Cameron LNG’s first train is now slated to enter service in September 2019, with the second and third trains coming online in January 2020 and May 2020, respectively.
The Freeport LNG project was originally planning to have all LNG-producing units in service by the end of 2019, however, the terminal site faced flooding after Hurricane Harvey, and the developer and its contractors are competing for labour with other megaprojects along the U.S. Gulf Coast, forcing delays. The start date for the first train has been pushed back to September 2019, with the subsequent start-ups of trains two and three also pushed back to January 2020 and May 2020 respectively.
As of December 2018, a total of 34 MTPA of LNG nameplate capacity was operational in the US. A further 50 MTPA of liquefaction capacity is in the construction phase and is due to be on-line in 2019/2020. With all currently sanctioned US liquefaction capacity expected to be online by 2020, developers are focusing on the next wave of US LNG supply. In addition to those export projects which are either in operation or under construction, there are nearly twenty other LNG export facilities which have been proposed in the USA - in Texas, Louisiana and Oregon – with a total proposed LNG export capacity of approximately 190 MTPA. Only a few of these multibillion-dollar LNG export projects are likely to advance to final investment decisions (FID), and construction and operation, but even those that do will have profound impacts on U.S. natural gas production, pipeline flows, and the global LNG market. With global demand for LNG rising and U.S. natural gas producers needing
44 45
Liquefaction PlantsIGU World LNG report - 2019 Edition
markets for their burgeoning output, it has not been a question of whether another round of U.S. liquefaction/LNG export facilities will be built, but which developer would be first to FID. In February 2019, ExxonMobil and Qatar Petroleum announced an FID on Golden Pass LNG. Built originally to handle imports from Qatar, Golden Pass LNG will add liquefaction facilities to handle exports from the US.
Challenging LNG market conditions and competition amongst US LNG projects and global counterparts have made it more difficult to sign binding offtake agreements, and numerous projects have pushed back their anticipated start dates. Additionally, several current customers of US produced LNG are seeking to place some of their contracted volumes via recontracting as well as time or destination swaps to reduce shipping costs.
Many of the sanctioned US project developers act as infrastructure providers under a tolling model. Several sponsors of new US projects are taking on additional roles across the LNG value chain. More proposed projects plan to manage feedstock procurement for potential customers under an LNG sale and purchase agreement (SPA) contracting model. In an attempt to reduce feed gas costs, some companies have acquired or are proposing to acquire upstream assets or otherwise secure favourable basis differentials. Some projects are also willing to offer delivered ex-ship (DES) sales, which would require them to charter a shipping fleet, to tap more markets. A wide variety of contracting structures and business models is also being proposed. There is greater willingness to offer more types of indexation and various contract lengths. In addition, Driftwood LNG developer Tellurian has proposed an equity LNG business model under which customers would invest up front and receive LNG at cost.
Outside the continental US, the approximately 20 MTPA Alaska LNG project, developed by the Alaska Gasline Development Corp (AGDC) stated they are working towards sanction in 2020, with a 2024 start-up. A centrepiece to progress on this project has been the joint development agreement that the AGDC has signed with the state-owned Chinese companies Sinopec, China Investment Corp. and the Bank of China, and although nonbinding, the JDA has been touted as the early stages of a foundational deal to support the gas line as it calls for selling up to 75 percent of the project’s LNG production capacity to Sinopec in exchange for a similar percentage of the needed financing. The close proximity of the export facility site to the major North Asian markets is an offset to the high development costs.
A Memorandum of Understanding was signed on August 31, 2018 between FERC and PHMSA, describing how they will coordinate their efforts to expedite the review of applications for LNG facilities. The US regulatory process remains time-consuming and expensive, but it is unlikely to be a major obstacle for most projects.
CanadaThe proposed Western Canadian LNG export projects are advantaged by access to abundant, low-cost natural gas from British Columbia’s vast resources and the relatively short shipping distance to North Asia, which is about 50 percent shorter than from the Gulf of Mexico and avoids the Panama Canal.
However, the greenfield nature and location of the developments, which require the need for lengthy pipeline infrastructure to transport gas from the Western Canadian Sedimentary Basin to the British Columbia coast, have contributed to higher cost estimates for Canadian projects relative to proposals on the US Gulf of Mexico coast. As a result, some projects in Canada have been unable to secure customers. Reduced capital budgets, the availability of potentially more cost-effective sources of supply, and uncertain demand in some partners’ home markets have slowed project momentum.
Around twenty LNG export facilities have been proposed in Canada – in British Columbia, Quebec and Nova Scotia – with a total proposed export capacity of 257MTPA of LNG. However, over the
past few years, a number of those projects have been cancelled or re-paced. The most notable cancellation was the 12 MTPA Pacific Northwest LNG project, one of the market’s highest-profile projects at the time of cancellation.
However, the first Canadian LNG FID was taken in 2018 with the Shell-led LNG Canada project being sanctioned in October. This also marked the first greenfield LNG export project FID globally in five years. The project will initially export LNG from two trains totalling 14MTPA, with the potential to expand to four trains in the future. The LNG export facility will be constructed on a large, partially developed industrial site with an existing deep-water port, roads, rail and power supplies. The project has a 40-year export license and all major environmental permits are in place for the plant and the pipeline. Notably, the project will also achieve the lowest carbon intensity of any LNG project in operation today, aided by the use of aero derivative gas-turbine drivers and the use of hydropower for auxiliary power demand. Both Pieridae’s $10-billion Goldboro LNG project in Nova Scotia and Woodfibre’s $1.6-billion project in British Columbia are nearing sanction in a race to be the second LNG project in Canada. The Woodfibre LNG project, backed by the Indonesian RGE Group, is a relatively small endeavour with a capacity of 2.1MTPA, while the Goldboro LNG project is planning to construct a 10MTPA export facility.
Taxes and tariffs could impact the competitiveness of Canadian LNG. In March 2018, the British Columbia government introduced a new gas development framework, which included a series of fiscal measures, intended to improve the competitiveness of LNG projects in the province.
The regulatory approval process in Canada has generally taken approximately two years to complete, though in some cases the process has been significantly longer. Impacted First Nations, including those with traditional territories along associated pipeline routes, must also be accommodated and provide consent.
MexicoAn LNG export project, Sempra’s Costa Azul LNG export facility, has been proposed for Mexico. Sempra has signed three equal volume HOAs for 20-year LNG sales-and-purchase agreements for the 2.4MTPA export capacity of Phase 1 of the project located in Baja California, Mexico. Energia Costa Azul LNG Phase 1 is a single-train liquefaction facility to be integrated into the existing LNG import terminal. A final investment decision for ECA LNG is targeted in late 2019 with potential first LNG deliveries in 2023. In June, TechnipFMC and Kiewit were selected as the EPC contractor for the project.
East AfricaEast African LNG will face strong competition from other producers, especially Qatar, Australia and Papua New Guinea, in the race for the rising demand in South-East Asia and West Asia. East Africa benefits particularly from its proximity to India and Pakistan.
The first project in the region to reach an FID in 2017, the Coral South FLNG project offshore Mozambique has contracted its entire 3.4 MTPA capacity to BP and is expected online in 2022.
Several other floating and onshore projects totalling 70 MTPA have been proposed following large offshore dry discoveries in Mozambique and Tanzania. Of these, the Anadarko led Area 1 Mozambique LNG export project anticipates making FID in the first half of 2019, provided they have lined up enough customers for the LNG. LNG is being marketed jointly by the partners, and Anadarko has stated that 8.5 MTPA of contracted offtake is necessary for an FID. The Mozambique LNG project, located between both the Asia-Pacific and European markets, will consist of two liquefaction trains with the capacity to liquefy 12.88 MTPA. The site preparation and resettlement processes commenced in Q4 2017. Mozambique’s ongoing debt crisis is a potential obstacle.
Another Mozambique LNG project is the Rovuma LNG Area 4 consortium, which aims to build the world’s biggest liquefaction trains outside Qatar, in pursuit of cost savings. The first two
liquefaction trains are each to produce 7.6 MTPA, with FID expected in 2019 and an LNG production start date in 2024. Significant progress has been made on marketing and the joint venture partners are in active negotiations on binding sales and purchase deals with some affiliated buyer entities of the Area 4 co-venturers. ExxonMobil will lead construction and operation of liquefaction trains and related onshore facilities for the Rovuma LNG project, while Eni will lead upstream developments and operations. Discussions regarding potential coordination or infrastructure sharing between the Area 1 and 4 partners are ongoing.
LNG development in Tanzania is at a more preliminary stage. Shell and Equinor are still committed to a project, however, significant regulatory challenges remain. Proposals to build a $30 billion two train LNG plant, with total capacity of 10MTPA, have been under consideration since 2011, clouded by policy uncertainty in Tanzania’s extractives industry.
West AfricaThe Kribi FLNG project offshore Cameroon, commenced exports in April 2018. The project, based on a conversion of an older LNGC by Keppel in Singapore, is the world’s first converted FLNG vessel. The Episeyo was converted from the 1975-built Golar Hilli Moss containment LNG carrier with a storage capacity of 125,000 cm. It is designed for a liquefaction capacity of about 2.4 MTPA from four 0.6MTPA trains.
Several projects have been proposed to commercialise approximately 40 Tcf of gas resources in Mauritania and Senegal. The Tortue/Ahmeyim field straddles the territorial waters of Senegal and Mauritania and development of the first project, Greater Tortue FLNG, continues at an accelerated pace only 16 months after the discovery of the gas deposit. BP made a large equity investment and now has a majority stake in the upstream and liquefaction assets. Both governments have demonstrated their alignment and commitment to the project, as evidenced by the signing of a unitisation agreement in February 2018. Based on experience gained from converting the Hilli LNGC into an FLNG vessel, Golar entered into an agreement with BP to proceed with FEED on the provision of a vessel to service the project. The intention is to use the Golar Gimi LNGC for conversion, in a similar fashion to the Golar Hilli conversion, as the Greater Tortue FLNG vessel. FID on the project was made in December 2018, enabling the FLNG vessel to begin producing cargoes for export expected in 2022. The FLNG facility is designed to provide circa 2.5 MTPA of LNG for global export as well as making gas available for domestic use in both Mauritania and Senegal.
A third FLNG development, the Fortuna FLNG offshore Equatorial Guinea was planning to reach an FID in 2018, however the project has faced significant challenges. Fortuna FLNG was originally planned to be developed by Ophir Energy using Golar’s FLNG technology, converting the 126,000 cm LNG carrier Gandria and aiming to produce 2.2 MTPA, but Equatorial Guinea’s decision not to extend Ophir Energy’s licence on offshore block R, has scuppered the long-delayed LNG project, which was largely expected, given the firm’s protracted struggle to find funding.
In Nigeria, expansion at the existing Nigeria LNG complex is currently undergoing a dual FEED study, with the development concept being for two trains with capacities of 3.2 and 4 MTPA. Nigeria LNG has announced that the company is making steady progress towards achieving FID on its expansion project, originally planned for end 2018 but now delayed. This project will increase NLNG’s annual production capacity to approximately 30 MTPA.
The much delayed 10 MTPA Brass LNG project continues to undergo a planning review by partners Nigerian National Petroleum Corporation (NNPC), TOTAL, and Eni.
RussiaThe 16.5 MTPA Yamal LNG project in the Russian Arctic exported its first cargoes in 2017 and the first cargo from Train 2 was loaded in August 2018, adding 5.5MTPA, doubling the plant’s capacity and 6 months ahead of schedule. The third 5.5 MTPA train is expected to start operations early in 2019. During 2018, Yamal LNG shipped
several cargoes eastbound via the Northern Sea Route, transiting the ice-covered part of the route in 9 days with no icebreaker escort.
Novatek’s Arctic-2 LNG project, with an estimated cost of US$25.5 billion, envisages construction of three LNG trains at 6.6 million tons per annum each, with a total capacity of 19.8MTPA, located on gravity-based structures (GBS) floated in and ballasted down nearshore. Novatek will use Linde’s technology for the liquefaction process and Saipem will develop the gravity-based structures. Novatek has announced that the use of GBS systems will reduce construction costs for Arctic LNG 2 by 30% (or approximately $9 B) from what was spent on Yamal LNG. FID may be made as early as the second half of 2019 (the first train is planned to be put into operation in 2023, and the third in 2026). The company is planning to sell up to 40 percent of the Arctic LNG 2 project to foreign partners. Total has signed an agreement with Novatek outlining the terms upon which Total shall acquire a direct working interest of 10% in Arctic LNG 2. The project also attracted a lot of interest from international partners, including Chinese national oil and gas major CNPC, energy giant Saudi Aramco, South Korean public natural gas company KOGAS, as well as from Japanese investors. In May 2018, Novatek announced that it was planning to produce 70 million tonnes of liquefied natural gas annually by 2035.
Additionally, the LNG delivery method for Arctic LNG 2 will also differ from that used for Yamal LNG. Rather than use icebreaking LNG carriers to export the product all the way to markets, Novatek will develop trans-shipment facilities in Norway and Kamchatka. The ice-class tankers will deliver LNG to these terminals, from where the LNG will be loaded into traditional LNGCs for export. The terminals will significantly slash the company’s transportation expenses. In November, Novatek completed the first ship-to-ship LNG trans-shipment in the area near the port of Honningsvag in northern Norway. The ice-class LNG tanker Vladimir Rusanov reloaded an LNG cargo delivered from the Yamal LNG facility at Sabetta to the lower ice-class designated tanker Pskov, which then delivered the reloaded cargo to customers in North-West Europe. This approach decreases the travel distance of the Arc7 ice-class tankers and the experience gained from ship-to-ship LNG trans-shipments will be used at Novatek’s future large-scale LNG trans-shipment projects.
In mid-2018 Gazprom announced that they and Shell would take an FID on the third train of the Sakhalin 2 LNG plant at the end of 2018 or in early 2019. The expansion would increase the plant’s capacity by 50%, from 9.6 to 15.0MTPA. FEED work on the third train has been completed. Sanctions and delays in a third-party gas supply agreement have challenged development of the third train.
In October 2018, Gazprom and Shell signed the Framework Agreement on the joint design concept (pre-FEED) for the Baltic LNG project. The document outlines the next stage of the Baltic LNG project in the lead-up to the FEED stage. During the signing process, the parties noted that the joint feasibility study had been successfully completed. Baltic LNG is a Gazprom long-term project and the project provides for the construction of an LNG plant near Ust-Luga port in Eastern Russia. Projected plant capacity is 10MTPA of LNG, with the potential to increase production by 15m tonnes. It is expected that the plant would be commissioned in 2023.
ExxonMobil with its partner Rosneft is reportedly moving forward with the Far East LNG project, with a final investment decision planned for 2019. They continue to work on their LNG project and have stated that sanctions are not an obstacle to the collaborative work on the project Far East LNG, valued at $15bn, has a planned capacity of more than 6.2 MTPA. The facility would use gas from the Sakhalin-1 venture as a source. The plant’s capacity also could be increased from planned initial volumes.
AustraliaBy the end 2018, Australia’s liquefaction capacity, with 20 LNG trains operational, was 84MTPA nameplate capacity. During 2018, LNG start-ups included Wheatstone Train 2 and Ichthys.
The remaining project under construction in Australia, the single train Prelude floating LNG project, was scheduled to begin in late 2018. However, in late December, Shell announced that the wells
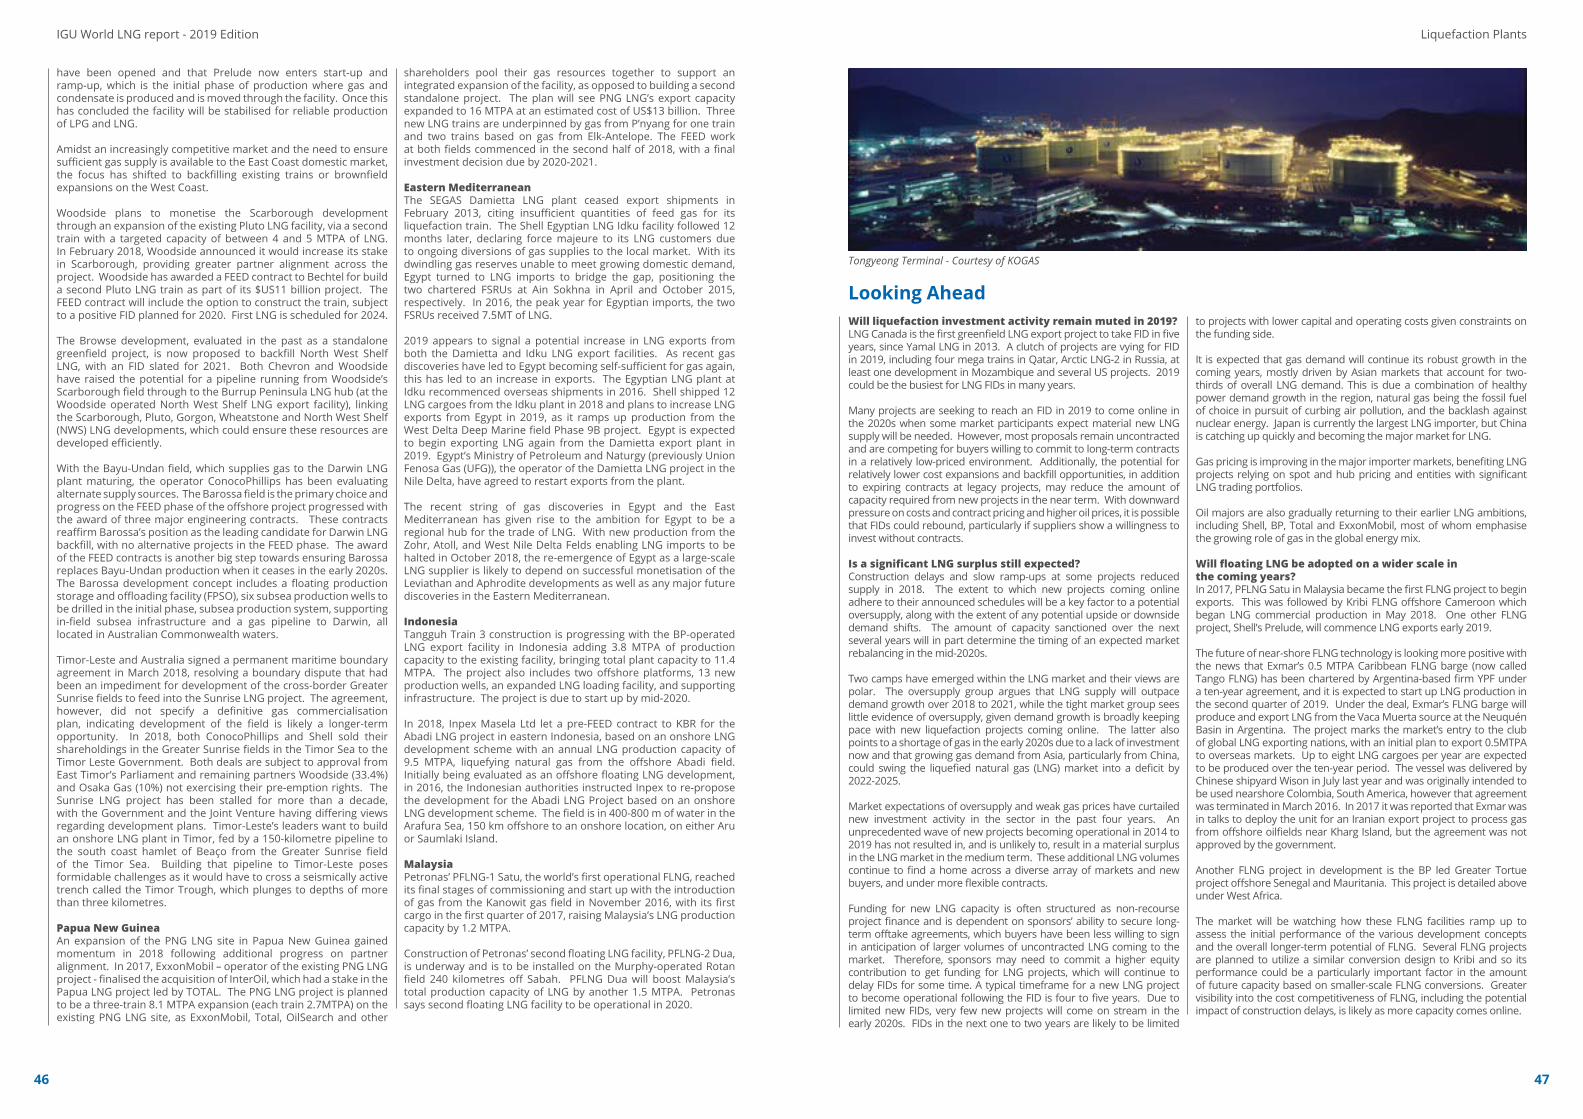
46 47
Liquefaction PlantsIGU World LNG report - 2019 Edition
have been opened and that Prelude now enters start-up and ramp-up, which is the initial phase of production where gas and condensate is produced and is moved through the facility. Once this has concluded the facility will be stabilised for reliable production of LPG and LNG.
Amidst an increasingly competitive market and the need to ensure sufficient gas supply is available to the East Coast domestic market, the focus has shifted to backfilling existing trains or brownfield expansions on the West Coast.
Woodside plans to monetise the Scarborough development through an expansion of the existing Pluto LNG facility, via a second train with a targeted capacity of between 4 and 5 MTPA of LNG. In February 2018, Woodside announced it would increase its stake in Scarborough, providing greater partner alignment across the project. Woodside has awarded a FEED contract to Bechtel for build a second Pluto LNG train as part of its $US11 billion project. The FEED contract will include the option to construct the train, subject to a positive FID planned for 2020. First LNG is scheduled for 2024.
The Browse development, evaluated in the past as a standalone greenfield project, is now proposed to backfill North West Shelf LNG, with an FID slated for 2021. Both Chevron and Woodside have raised the potential for a pipeline running from Woodside’s Scarborough field through to the Burrup Peninsula LNG hub (at the Woodside operated North West Shelf LNG export facility), linking the Scarborough, Pluto, Gorgon, Wheatstone and North West Shelf (NWS) LNG developments, which could ensure these resources are developed efficiently.
With the Bayu-Undan field, which supplies gas to the Darwin LNG plant maturing, the operator ConocoPhillips has been evaluating alternate supply sources. The Barossa field is the primary choice and progress on the FEED phase of the offshore project progressed with the award of three major engineering contracts. These contracts reaffirm Barossa’s position as the leading candidate for Darwin LNG backfill, with no alternative projects in the FEED phase. The award of the FEED contracts is another big step towards ensuring Barossa replaces Bayu-Undan production when it ceases in the early 2020s. The Barossa development concept includes a floating production storage and offloading facility (FPSO), six subsea production wells to be drilled in the initial phase, subsea production system, supporting in-field subsea infrastructure and a gas pipeline to Darwin, all located in Australian Commonwealth waters.
Timor-Leste and Australia signed a permanent maritime boundary agreement in March 2018, resolving a boundary dispute that had been an impediment for development of the cross-border Greater Sunrise fields to feed into the Sunrise LNG project. The agreement, however, did not specify a definitive gas commercialisation plan, indicating development of the field is likely a longer-term opportunity. In 2018, both ConocoPhillips and Shell sold their shareholdings in the Greater Sunrise fields in the Timor Sea to the Timor Leste Government. Both deals are subject to approval from East Timor’s Parliament and remaining partners Woodside (33.4%) and Osaka Gas (10%) not exercising their pre-emption rights. The Sunrise LNG project has been stalled for more than a decade, with the Government and the Joint Venture having differing views regarding development plans. Timor-Leste’s leaders want to build an onshore LNG plant in Timor, fed by a 150-kilometre pipeline to the south coast hamlet of Beaço from the Greater Sunrise field of the Timor Sea. Building that pipeline to Timor-Leste poses formidable challenges as it would have to cross a seismically active trench called the Timor Trough, which plunges to depths of more than three kilometres.
Papua New GuineaAn expansion of the PNG LNG site in Papua New Guinea gained momentum in 2018 following additional progress on partner alignment. In 2017, ExxonMobil – operator of the existing PNG LNG project - finalised the acquisition of InterOil, which had a stake in the Papua LNG project led by TOTAL. The PNG LNG project is planned to be a three-train 8.1 MTPA expansion (each train 2.7MTPA) on the existing PNG LNG site, as ExxonMobil, Total, OilSearch and other
shareholders pool their gas resources together to support an integrated expansion of the facility, as opposed to building a second standalone project. The plan will see PNG LNG’s export capacity expanded to 16 MTPA at an estimated cost of US$13 billion. Three new LNG trains are underpinned by gas from P’nyang for one train and two trains based on gas from Elk-Antelope. The FEED work at both fields commenced in the second half of 2018, with a final investment decision due by 2020-2021.
Eastern MediterraneanThe SEGAS Damietta LNG plant ceased export shipments in February 2013, citing insufficient quantities of feed gas for its liquefaction train. The Shell Egyptian LNG Idku facility followed 12 months later, declaring force majeure to its LNG customers due to ongoing diversions of gas supplies to the local market. With its dwindling gas reserves unable to meet growing domestic demand, Egypt turned to LNG imports to bridge the gap, positioning the two chartered FSRUs at Ain Sokhna in April and October 2015, respectively. In 2016, the peak year for Egyptian imports, the two FSRUs received 7.5MT of LNG.
2019 appears to signal a potential increase in LNG exports from both the Damietta and Idku LNG export facilities. As recent gas discoveries have led to Egypt becoming self-sufficient for gas again, this has led to an increase in exports. The Egyptian LNG plant at Idku recommenced overseas shipments in 2016. Shell shipped 12 LNG cargoes from the Idku plant in 2018 and plans to increase LNG exports from Egypt in 2019, as it ramps up production from the West Delta Deep Marine field Phase 9B project. Egypt is expected to begin exporting LNG again from the Damietta export plant in 2019. Egypt’s Ministry of Petroleum and Naturgy (previously Union Fenosa Gas (UFG)), the operator of the Damietta LNG project in the Nile Delta, have agreed to restart exports from the plant.
The recent string of gas discoveries in Egypt and the East Mediterranean has given rise to the ambition for Egypt to be a regional hub for the trade of LNG. With new production from the Zohr, Atoll, and West Nile Delta Felds enabling LNG imports to be halted in October 2018, the re-emergence of Egypt as a large-scale LNG supplier is likely to depend on successful monetisation of the Leviathan and Aphrodite developments as well as any major future discoveries in the Eastern Mediterranean.
IndonesiaTangguh Train 3 construction is progressing with the BP-operated LNG export facility in Indonesia adding 3.8 MTPA of production capacity to the existing facility, bringing total plant capacity to 11.4 MTPA. The project also includes two offshore platforms, 13 new production wells, an expanded LNG loading facility, and supporting infrastructure. The project is due to start up by mid-2020.
In 2018, Inpex Masela Ltd let a pre-FEED contract to KBR for the Abadi LNG project in eastern Indonesia, based on an onshore LNG development scheme with an annual LNG production capacity of 9.5 MTPA, liquefying natural gas from the offshore Abadi field. Initially being evaluated as an offshore floating LNG development, in 2016, the Indonesian authorities instructed Inpex to re-propose the development for the Abadi LNG Project based on an onshore LNG development scheme. The field is in 400-800 m of water in the Arafura Sea, 150 km offshore to an onshore location, on either Aru or Saumlaki Island.
MalaysiaPetronas’ PFLNG-1 Satu, the world’s first operational FLNG, reached its final stages of commissioning and start up with the introduction of gas from the Kanowit gas field in November 2016, with its first cargo in the first quarter of 2017, raising Malaysia’s LNG production capacity by 1.2 MTPA.
Construction of Petronas’ second floating LNG facility, PFLNG-2 Dua, is underway and is to be installed on the Murphy-operated Rotan field 240 kilometres off Sabah. PFLNG Dua will boost Malaysia’s total production capacity of LNG by another 1.5 MTPA. Petronas says second floating LNG facility to be operational in 2020.
Looking AheadWill liquefaction investment activity remain muted in 2019? LNG Canada is the first greenfield LNG export project to take FID in five years, since Yamal LNG in 2013. A clutch of projects are vying for FID in 2019, including four mega trains in Qatar, Arctic LNG-2 in Russia, at least one development in Mozambique and several US projects. 2019 could be the busiest for LNG FIDs in many years.
Many projects are seeking to reach an FID in 2019 to come online in the 2020s when some market participants expect material new LNG supply will be needed. However, most proposals remain uncontracted and are competing for buyers willing to commit to long-term contracts in a relatively low-priced environment. Additionally, the potential for relatively lower cost expansions and backfill opportunities, in addition to expiring contracts at legacy projects, may reduce the amount of capacity required from new projects in the near term. With downward pressure on costs and contract pricing and higher oil prices, it is possible that FIDs could rebound, particularly if suppliers show a willingness to invest without contracts.
Is a significant LNG surplus still expected? Construction delays and slow ramp-ups at some projects reduced supply in 2018. The extent to which new projects coming online adhere to their announced schedules will be a key factor to a potential oversupply, along with the extent of any potential upside or downside demand shifts. The amount of capacity sanctioned over the next several years will in part determine the timing of an expected market rebalancing in the mid-2020s.
Two camps have emerged within the LNG market and their views are polar. The oversupply group argues that LNG supply will outpace demand growth over 2018 to 2021, while the tight market group sees little evidence of oversupply, given demand growth is broadly keeping pace with new liquefaction projects coming online. The latter also points to a shortage of gas in the early 2020s due to a lack of investment now and that growing gas demand from Asia, particularly from China, could swing the liquefied natural gas (LNG) market into a deficit by 2022-2025.
Market expectations of oversupply and weak gas prices have curtailed new investment activity in the sector in the past four years. An unprecedented wave of new projects becoming operational in 2014 to 2019 has not resulted in, and is unlikely to, result in a material surplus in the LNG market in the medium term. These additional LNG volumes continue to find a home across a diverse array of markets and new buyers, and under more flexible contracts.
Funding for new LNG capacity is often structured as non-recourse project finance and is dependent on sponsors’ ability to secure long-term offtake agreements, which buyers have been less willing to sign in anticipation of larger volumes of uncontracted LNG coming to the market. Therefore, sponsors may need to commit a higher equity contribution to get funding for LNG projects, which will continue to delay FIDs for some time. A typical timeframe for a new LNG project to become operational following the FID is four to five years. Due to limited new FIDs, very few new projects will come on stream in the early 2020s. FIDs in the next one to two years are likely to be limited
to projects with lower capital and operating costs given constraints on the funding side.
It is expected that gas demand will continue its robust growth in the coming years, mostly driven by Asian markets that account for two-thirds of overall LNG demand. This is due a combination of healthy power demand growth in the region, natural gas being the fossil fuel of choice in pursuit of curbing air pollution, and the backlash against nuclear energy. Japan is currently the largest LNG importer, but China is catching up quickly and becoming the major market for LNG.
Gas pricing is improving in the major importer markets, benefiting LNG projects relying on spot and hub pricing and entities with significant LNG trading portfolios.
Oil majors are also gradually returning to their earlier LNG ambitions, including Shell, BP, Total and ExxonMobil, most of whom emphasise the growing role of gas in the global energy mix.
Will floating LNG be adopted on a wider scale inthe coming years? In 2017, PFLNG Satu in Malaysia became the first FLNG project to begin exports. This was followed by Kribi FLNG offshore Cameroon which began LNG commercial production in May 2018. One other FLNG project, Shell’s Prelude, will commence LNG exports early 2019.
The future of near-shore FLNG technology is looking more positive with the news that Exmar’s 0.5 MTPA Caribbean FLNG barge (now called Tango FLNG) has been chartered by Argentina-based firm YPF under a ten-year agreement, and it is expected to start up LNG production in the second quarter of 2019. Under the deal, Exmar’s FLNG barge will produce and export LNG from the Vaca Muerta source at the Neuquén Basin in Argentina. The project marks the market’s entry to the club of global LNG exporting nations, with an initial plan to export 0.5MTPA to overseas markets. Up to eight LNG cargoes per year are expected to be produced over the ten-year period. The vessel was delivered by Chinese shipyard Wison in July last year and was originally intended to be used nearshore Colombia, South America, however that agreement was terminated in March 2016. In 2017 it was reported that Exmar was in talks to deploy the unit for an Iranian export project to process gas from offshore oilfields near Kharg Island, but the agreement was not approved by the government.
Another FLNG project in development is the BP led Greater Tortue project offshore Senegal and Mauritania. This project is detailed above under West Africa.
The market will be watching how these FLNG facilities ramp up to assess the initial performance of the various development concepts and the overall longer-term potential of FLNG. Several FLNG projects are planned to utilize a similar conversion design to Kribi and so its performance could be a particularly important factor in the amount of future capacity based on smaller-scale FLNG conversions. Greater visibility into the cost competitiveness of FLNG, including the potential impact of construction delays, is likely as more capacity comes online.
Tongyeong Terminal - Courtesy of KOGAS

Spot charter rates for a modernfuel-efficient tanker averaged$76,000/day for the firsttwo months of the year, an
81% YOY increase
Spot charter rates in Q4 2018peaked at an all-time high of
$195,500/dayand averaged
$150,000/day
This was short-lived and spot charterrates had returned to around
$74,000/dayby January 2019
Spot charter rates tapered offduring the spring and summermonths, averaging
$56,000/day
525LNG VesselsAt end-2018
5,119Trade voyagesIn 2018
Global LNG Fleet
+53Conventional carriers added
to the global fleet in 2018
Propulsion systems
41%Active vessels with DFDE/TFDE,
ME-GI, or XDF propulsion systems
Charter Market
Steam $53,400TFDE/DFDE $85,500
Average spot charter rateper day in 2018
Orderbook Growth
+52Conventional carriers
ordered in 2017
LNG Carriers
5.LNG Carriers
IGU World LNG report - 2019 Edition
48 49

50 51
LNG Carrier Pyeongtaek - Courtesy of KOGAS
LNG Carriers
The LNG shipping sector has evolved over the past decade in response to substantial changes in the broader LNG market. The market has been cyclical in nature, with charter rates falling from historic highs in 2012 when the Fukushima disaster in Japan caused a spike in the need for spot deliveries, to historic lows in the summer of 2017 owing to the lingering effects of a large buildup in shipping tonnage experienced since 2013.
New deliveries matched additions in LNG supply in 2018 more evenly, and rates were supported by an increase in winter LNG demand in China. Spot charter rates for a modern fuel-efficient tanker averaged $76,000/day during the first two months of the year, an 81% YOY increase. While spot charter rates tapered off during the spring and summer months, averaging around $56,000/day, they were still significantly higher than the levels of 2017.
Notably, toward the end of 2018 there was a significant uptick in charter rates owing to the buildup of winter LNG inventories in Northeast Asian markets. This rate increase was further bolstered by a resulting floating storage play as inventory levels maxed out in Northeast Asia, resulting in laden tankers with postponed discharge dates. Spot charter rates in Q4 2018 peaked at an all-time high of $195,500/day and averaged $150,000/day. However, this was short-lived and spot charter rates had already returned to around $74,000/day by January 2019. Still, even with the decline from end-2018 it is unlikely that charter rates will return to their 2017 levels as 51.8 MTPA of new liquefaction capacity is expected to start up in 2019, which will help keep rates higher. This liquefaction capacity will be met by only 43 newbuild deliveries. Given the historical rubric of one tanker for 0.75 MTPA or 1.2-1.3 vessels per 1 MTPA of liquefaction capacity, there is a high probability that rates will stay high as shipping capacity struggles to match new LNG exports.
IGU World LNG report - 2019 Edition
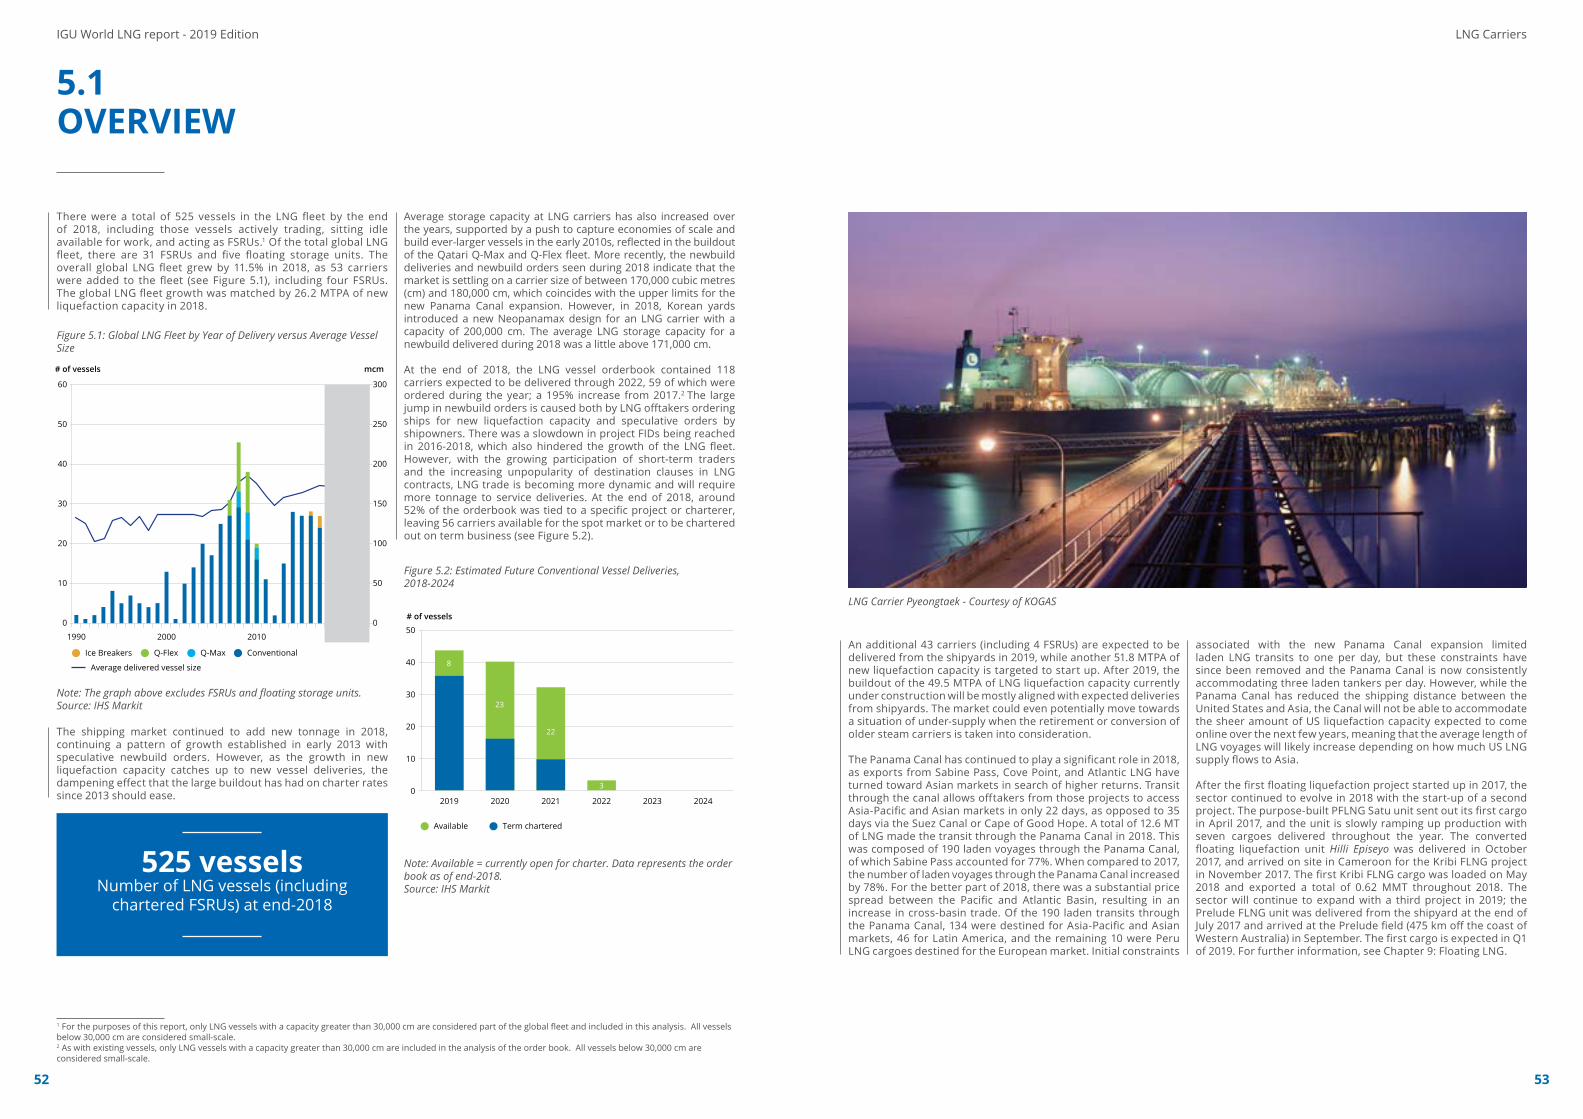
52 53
5.1OVERVIEW
There were a total of 525 vessels in the LNG fleet by the end of 2018, including those vessels actively trading, sitting idle available for work, and acting as FSRUs.1 Of the total global LNG fleet, there are 31 FSRUs and five floating storage units. The overall global LNG fleet grew by 11.5% in 2018, as 53 carriers were added to the fleet (see Figure 5.1), including four FSRUs. The global LNG fleet growth was matched by 26.2 MTPA of new liquefaction capacity in 2018.
The shipping market continued to add new tonnage in 2018, continuing a pattern of growth established in early 2013 with speculative newbuild orders. However, as the growth in new liquefaction capacity catches up to new vessel deliveries, the dampening effect that the large buildout has had on charter rates since 2013 should ease.
525 vesselsNumber of LNG vessels (including
chartered FSRUs) at end-2018
Average storage capacity at LNG carriers has also increased over the years, supported by a push to capture economies of scale and build ever-larger vessels in the early 2010s, reflected in the buildout of the Qatari Q-Max and Q-Flex fleet. More recently, the newbuild deliveries and newbuild orders seen during 2018 indicate that the market is settling on a carrier size of between 170,000 cubic metres (cm) and 180,000 cm, which coincides with the upper limits for the new Panama Canal expansion. However, in 2018, Korean yards introduced a new Neopanamax design for an LNG carrier with a capacity of 200,000 cm. The average LNG storage capacity for a newbuild delivered during 2018 was a little above 171,000 cm.
At the end of 2018, the LNG vessel orderbook contained 118 carriers expected to be delivered through 2022, 59 of which were ordered during the year; a 195% increase from 2017.2 The large jump in newbuild orders is caused both by LNG offtakers ordering ships for new liquefaction capacity and speculative orders by shipowners. There was a slowdown in project FIDs being reached in 2016-2018, which also hindered the growth of the LNG fleet. However, with the growing participation of short-term traders and the increasing unpopularity of destination clauses in LNG contracts, LNG trade is becoming more dynamic and will require more tonnage to service deliveries. At the end of 2018, around 52% of the orderbook was tied to a specific project or charterer, leaving 56 carriers available for the spot market or to be chartered out on term business (see Figure 5.2).
1 For the purposes of this report, only LNG vessels with a capacity greater than 30,000 cm are considered part of the global fleet and included in this analysis. All vessels below 30,000 cm are considered small-scale.2 As with existing vessels, only LNG vessels with a capacity greater than 30,000 cm are included in the analysis of the order book. All vessels below 30,000 cm are considered small-scale.
Figure 5.1: Global LNG Fleet by Year of Delivery versus Average Vessel Size
Note: The graph above excludes FSRUs and floating storage units. Source: IHS Markit
5.1
4.3
5.2
Membrane-typeMoss-type
60
50
40
30
20
10
0
300
250
200
150
100
50
0
# of vessels mcm
Forecast
Q-Max ConventionalIce Breakers Q-Flex
Average delivered vessel size
2000 2010 20201990
67%
33%
50
40
30
20
10
0
# of vessels
2019 2020 2021 2022 2023 2024
Available Term chartered
8
23
22
3
LNG Carriers
An additional 43 carriers (including 4 FSRUs) are expected to be delivered from the shipyards in 2019, while another 51.8 MTPA of new liquefaction capacity is targeted to start up. After 2019, the buildout of the 49.5 MTPA of LNG liquefaction capacity currently under construction will be mostly aligned with expected deliveries from shipyards. The market could even potentially move towards a situation of under-supply when the retirement or conversion of older steam carriers is taken into consideration.
The Panama Canal has continued to play a significant role in 2018, as exports from Sabine Pass, Cove Point, and Atlantic LNG have turned toward Asian markets in search of higher returns. Transit through the canal allows offtakers from those projects to access Asia-Pacific and Asian markets in only 22 days, as opposed to 35 days via the Suez Canal or Cape of Good Hope. A total of 12.6 MT of LNG made the transit through the Panama Canal in 2018. This was composed of 190 laden voyages through the Panama Canal, of which Sabine Pass accounted for 77%. When compared to 2017, the number of laden voyages through the Panama Canal increased by 78%. For the better part of 2018, there was a substantial price spread between the Pacific and Atlantic Basin, resulting in an increase in cross-basin trade. Of the 190 laden transits through the Panama Canal, 134 were destined for Asia-Pacific and Asian markets, 46 for Latin America, and the remaining 10 were Peru LNG cargoes destined for the European market. Initial constraints
Figure 5.2: Estimated Future Conventional Vessel Deliveries, 2018-2024
Note: Available = currently open for charter. Data represents the order book as of end-2018.Source: IHS Markit
5.1
4.3
5.2
Membrane-typeMoss-type
60
50
40
30
20
10
0
300
250
200
150
100
50
0
# of vessels mcm
Forecast
Q-Max ConventionalIce Breakers Q-Flex
Average delivered vessel size
2000 2010 20201990
67%
33%
50
40
30
20
10
0
# of vessels
2019 2020 2021 2022 2023 2024
Available Term chartered
8
23
22
3
LNG Carrier Pyeongtaek - Courtesy of KOGAS
IGU World LNG report - 2019 Edition
associated with the new Panama Canal expansion limited laden LNG transits to one per day, but these constraints have since been removed and the Panama Canal is now consistently accommodating three laden tankers per day. However, while the Panama Canal has reduced the shipping distance between the United States and Asia, the Canal will not be able to accommodate the sheer amount of US liquefaction capacity expected to come online over the next few years, meaning that the average length of LNG voyages will likely increase depending on how much US LNG supply flows to Asia.
After the first floating liquefaction project started up in 2017, the sector continued to evolve in 2018 with the start-up of a second project. The purpose-built PFLNG Satu unit sent out its first cargo in April 2017, and the unit is slowly ramping up production with seven cargoes delivered throughout the year. The converted floating liquefaction unit Hilli Episeyo was delivered in October 2017, and arrived on site in Cameroon for the Kribi FLNG project in November 2017. The first Kribi FLNG cargo was loaded on May 2018 and exported a total of 0.62 MMT throughout 2018. The sector will continue to expand with a third project in 2019; the Prelude FLNG unit was delivered from the shipyard at the end of July 2017 and arrived at the Prelude field (475 km off the coast of Western Australia) in September. The first cargo is expected in Q1 of 2019. For further information, see Chapter 9: Floating LNG.

54 55
5.2VESSEL CHARACTERISTICS
Containment Systems
Two different designs were initially developed for LNG containment on vessels: the Moss Rosenberg design and the membrane-tank system using thin, flexible membranes supported only by the insulated hull structure. The Moss Rosenberg design started in 1971 and is well known by its independent spherical tanks that often have the top half exposed on LNG carriers. The most common membrane-tank systems have been designed by Gaztransport and Technigaz (GTT)3. Several GTT systems have already been implemented on board of LNG carriers for many years now and other designs from different companies have recently been developed. GTT recently developed new solutions to reduce boil-off rates to around 0.07% of a cargo during transit. Among these new systems, the Mark III Flex +, Mark V, and NO96 Flex could possibly be implemented in the future on some newbuilds. A new version of the membrane containment design, KC-1, has been developed by KOGAS; it is installed on two vessels ordered by SK Shipping. At the end of 2018, 67% of the active fleet had a GTT Membrane-type containment system (see Figure 5.3), which also continues to lead the orderbook as the preferred containment option for 91% of vessels on order. The Sayaringo LNG carrier was developed by Mitsubishi and was purpose built for the long haul voyages between the US and Japan.
Both tank systems rely on expensive insulation to keep LNG cold during the voyage and minimize evaporation. Nevertheless, an amount equivalent up to roughly 0.15% of the cargo evaporates per day in older designs. The rate of the boil off gas (BOG) is ultimately determined by the insulation of the LNG carrier, which in turn varies according to the containment system. Newer vessels are designed with lower BOG rates, with the best-in-class purporting rates as low as 0.08%. The Japan Marine United shipyard has achieved this low boil-off rate as well as reduced sloshing with the IHI SPB containment system. They delivered one LNG carrier with this containment system in 2018 and have another three on order.
Propulsion Systems
To keep the tank pressure close to atmospheric conditions per design conditions for Moss and membrane systems, BOG has to be taken out from the tanks, and has generally been used for fuelling the ships’ steam-turbine propulsion systems, which are reliable but not the most efficient. Since the early 2000s, however, these systems specific to LNG carriers have undergone major innovations and enhancements, particularly to reduce fuel costs during an LNG voyage.
With a rise in bunker costs during the 2000s, the issue of fuel cost became even more critical. Attempting to reconcile the objective of low fuel consumption with the necessity of consuming the BOG, innovative systems have taken a variety of approaches, depending on the specific transport concept, such as carrying capacity, vessel speed, the duration of its potential voyages, and other voyage-specific factors. Any comparison of alternative concepts of LNG carrier propulsion and auxiliary energy generation must consider the overall complexity of LNG transport. Today, LNG carrier operators can choose between the following systems:
Steam TurbinesSteam turbines are the traditional propulsion system of LNG carriers. Usually two boilers generate sufficient steam for the main propulsion turbines and auxiliary engines. The boilers can also be partially or fully fuelled with heavy fuel oil (HFO). One important advantage of the steam turbine system is the fact that no gas combustion unit is necessary; all BOG is used in the boilers. Maintenance and other operating costs are considerably lower with steam propulsion systems when compared to other systems due to the simple design with BOG from the LNG.
On the other hand, low thermal efficiency and the resulting higher cargo transport costs are clear disadvantages. Large LNG carriers require more power than existing steam turbine designs can deliver. Moreover, manning the vessels with engineers that are qualified to operate steam-turbine systems is getting more difficult as this technology loses market share and fewer seamen pursue this qualification.
Source: IHS Markit
5.1
4.3
5.2
Membrane-typeMoss-type
60
50
40
30
20
10
0
300
250
200
150
100
50
0
# of vessels mcm
Forecast
Q-Max ConventionalIce Breakers Q-Flex
Average delivered vessel size
2000 2010 20201990
67%
33%
50
40
30
20
10
0
# of vessels
2019 2020 2021 2022 2023 2024
Available Term chartered
8
23
22
3
Figure 5.3: Existing Fleet by Containment Type, end-2018
3 GTT was formed in 1994 out of the merger between Gaztransport and Technigaz. Both companies had previous experience in designing and developing LNG carrier technologies.
LNG CarriersIGU World LNG report - 2019 Edition
Dual-Fuel Diesel Electric/Tri-Fuel Diesel Electric (DFDE/TFDE)After almost forty years of the LNG fleet consisting entirely of steam turbine propulsion systems, ENGIE (then GDF SUEZ) ordered the first LNG carriers to be powered by DFDE propulsion systems in 2001. DFDE systems are able to burn both diesel oil and BOG, improving vessel efficiency by around 25-30% over the traditional steam-turbines. DFDE propulsion systems are equipped with an electric propulsion system powered by dual-fuel, medium-speed diesel engines. In gas mode, these dual-fuel engines run on low-pressure natural gas with a small amount of diesel used as a liquid spark. The engine operators can switch to traditional marine diesel at any time.
These propulsion systems must be equipped to handle excess BOG. In contrast to steam propulsions, a Gas Combustion Unit (GCU) is necessary as it offers an appropriate means to burn the BOG when necessary. In addition, a GCU is needed to dispose of residual gas from the cargo tanks prior to inspection. The additional equipment needed for the BOG increases the amount of maintenance needed for the engines.
Shortly after the adoption of DFDE systems, TFDE vessels – those able to burn heavy fuel oil, diesel oil, and gas – offered a further improvement to operating flexibility with the ability to optimize efficiency at various speeds. While the existing fleet is still dominated by the legacy steam propulsion system, almost 32% of active vessels in 2018 were equipped with DFDE/TFDE propulsion systems. Additionally, the orderbook consists of 22% of vessels planned with DFDE/TFDE systems as of end-2018 (see Figure 5.4).
Slow-Speed Diesel (SSD) with a BOG Re-liquefaction PlantAnother propulsion system was introduced to the LNG shipping industry in the mid-2000s, primarily developed in tandem with the Qatari megatrain projects. Instead of using BOG to generate propulsion and/or electric energy, vessels are propelled by conventional low-speed diesel engines consuming HFO or marine diesel oil (MDO) generator sets.
The BOG is instead entirely re-liquefied and fed back into the cargo tanks. An additional GCU allows BOG to be burned when necessary. This system permits LNG to be transported without any loss of cargo, which can be advantageous especially if HFO or MDO is comparatively cheaper than burning BOG for propulsion fuel.
During ballast voyages, the cargo tank temperature is maintained by spraying re-liquefied LNG back into the cargo tanks. This helps reduce the initial increase of BOG on laden voyages. The entirety of the Q-Class fleet is equipped with this propulsion type.
M-type, Electronically Controlled, Gas Injection (ME-GI)As of end-2018, around 27% of vessels in the orderbook are designated to adopt the newest innovation in LNG carrier engine
Table 5.1: Propulsion Type and Associated Characteristics
5.4
5.5
5.6
100%
75%
50%
25%
0%Active Fleet Order Book
TFDESteam DFDE SSD ME-GI XDF
Steam Reheat Undecided STaGE
<10 10-19
225 226
20-29
43
30-39 >39
18 13
300
250
200
150
100
50
0
# of vessels
vessels age (years)
125,000 - 149,999 cm
>180,000cm 150,000 - 180,000 cm
30,000 - 124,999 cm
180
150
120
90
60
30
0
6
5
4
3
2
1
0
$’000/day
Jan-12 Jan-13 Jan-14 Jan-15 Jan-16 Jan-17
# of vessels
Vessels delivered (right) Steam DFDE/TFDE
Source: IHS Markit
Note: LNG fuel consumption figures in the table above are at designed service speeds. Source: Fearnleys, IHS Markit
Figure 5.4: Existing and On Order LNG Fleet by Propulsion Type, end-2018
Propulsion Type
LNG Fuel Consumption (tonnes/day)
Average Vessel Capacity Typical Age
Steam 175 <150,000 >10
DFDE/TFDE 130 150,000-180,000 <15
ME-GI 110 150,000-180,000 <5
XDF 108 150,000-180,000 <1
Steam Re-heat 140 150,000-180,000 Not Active
design from MAN B&W: the ME-GI engine, which utilises high-pressure slow-speed gas-injection engines. Unlike the Q-Class that cannot accept BOG in the engine, ME-GI engines optimise the capability of slow speed engines by running directly off BOG – or fuel oil if necessary – instead of only re-liquefying the gas. This flexibility allows for better economic optimisation at any point in time.
A 170,000 cm, ME-GI LNG carrier – operating at design speed and fully laden in gas mode – will consume around 15-20% less fuel than the same vessel with a TFDE propulsion system. The ME-GI propulsion system now accounts for almost as many vessels in the order book as TFDE/DFDE carriers. This more fuel-efficient propulsion system seems to be gaining traction amongst ship owners as the bulk of the most recent newbuild orders have been placed for vessels with the ME-GI propulsion system. As of end-2018, there are 36 carriers in the global LNG fleet utilising this propulsion system, 21 of which were delivered in 2018. The share of carriers utilising the ME-GI system is expected to continue to grow substantially in 2019, as another 17 such carriers are expected to be delivered during the year.
Winterthur Gas & Diesel (WinGD) Low-PressureTwo-Stroke Engine (XDF)Wärtsilä introduced its low-speed two-stroke dual-fuel engine in 2014, and since 2015 the system has been marketed by WinGD (originally a JV between Wärtsilä and China State Shipbuilding Corporation [CSSC], though Wärtsilä has since transferred its stake to CSSC). This alternative to DFDE propulsion systems is estimated to offer capital expenditure reductions of 15-20% via a simpler and lower cost LNG and gas handling system. Significant gains are reportedly achieved by eliminating the high pressure gas compression system. In addition, the nitrogen oxides (NOX) abatement systems may not be required. By end-2018 there were 6 active tankers utilising the XDF propulsion system, with 44 XDF tankers on the orderbook.
Steam Reheat and STaGEIn order to improve the performance of a traditional steam-turbine propulsion system, modern designs have been developed. The Steam Reheat design is based on a reheat cycle, where the steam used in the turbine is reheated to improve its efficiency. The STaGE system combines steam turbines and gas engines equipped with waste heat recovery. These improvements in steam adaptation have maintained the benefits of the simple steam-turbine while improving overall efficiency.
Vessel Size
The size of an LNG vessel can vary widely depending on age and need. While additions in the early 2010s demonstrated a bias toward vessels with ever larger capacities, recent deliveries have settled around a range of 170,000-180,000 cm, though this is still larger than historical averages. Prior to the introduction of the Q-Class in 2008-2010, the standard capacity of the fleet was between 125,000 cm and 150,000 cm; as of end-2018, 43% of active LNG carriers had a capacity within this range. However, vessels with a capacity of between 150,200 cm and 180,000 accounted for 46% of the market by end-2018, making that range the new most common vessel size in the existing fleet (see Figure 5.5). Conventional carrier newbuilds delivered during 2018 had an average size of 171,500 cm, and none of the 48 vessels had a capacity lower than 150,200 cm.
The Q-Flex (210,000-217,000 cm) and Q-Max (261,700-266,000 cm) LNG carriers that make up the Qatari Q-Class offer the largest available capacities. The Q-Class (45 vessels in total) accounted for 9% of the active fleet and 12% of total LNG transportation capacity at the end of 2018.

56 57
Source: IHS Markit
Figure 5.5: Active Global LNG Fleet by Capacity and Age, end-2018
5.4
5.5
5.6
100%
75%
50%
25%
0%Active Fleet Order Book
TFDESteam DFDE SSD ME-GI XDF
Steam Reheat Undecided STaGE
<10 10-19
225 226
20-29
43
30-39 >39
18 13
300
250
200
150
100
50
0
# of vessels
vessels age (years)
125,000 - 149,999 cm
>180,000cm 150,000 - 180,000 cm
30,000 - 124,999 cm
180
150
120
90
60
30
0
6
5
4
3
2
1
0
$’000/day
Jan-12 Jan-13 Jan-14 Jan-15 Jan-16 Jan-17
# of vessels
Vessels delivered (right) Steam DFDE/TFDE
LNG Carriers
With the Panama Canal accommodating carriers of up to 180,000 cm under the vessel class known as the New Panamax4, it will be difficult to justify a newbuild any larger than what is allowed through the Neopanamax locks. As a carrier’s marketability is contingent on its flexibility to trade in different markets, not being able to pass through the Panama Canal would most likely exclude a larger carrier from the US LNG trade. As of end-2018,
4 The New Panamax is defined by length, breadth, and draught. The maximum capacity which still fits these dimensions has thus far come to about 180,000cm, but there is no specific limitation on capacity.
IGU World LNG report - 2019 Edition
91% of the global LNG fleet meets new Panama Canal carrier size requirements, with the entirety of the orderbook also meeting the requirements.
Vessel Age At the end of 2018, 51% of the active fleet was 10 years of age or younger, a reflection of the newbuild order boom that accompanied liquefaction capacity growth in the mid-2000s, and again in the early 2010s. Generally, shipowners primarily consider safety and operating economics when deciding whether to retire a vessel after it reaches the age of 35, although some vessels have operated for approximately 40 years. Around 6% of active LNG carriers were 30 years of age or older by the end of 2018; these carriers will continue to be pushed out of the market as the younger, larger, and more efficient vessels continue to be added to the existing fleet.
Typically, as a shipowner considers options for older vessels – either conversion or scrappage – the LNG carrier is laid-up. However, those vessels can still re-enter the market. At the end of 2018, 19 vessels (primarily Moss-type steam carriers, all with a capacity of under 150,000 cm) were laid-up. Over 83% of these vessels were over 30 years old, and all were older than 10. A total of 7 tankers were either scrapped or scheduled to be scrapped during 2018, with the average age being 40 years old.
As newbuilds are delivered from the shipyards, shipowners can consider conversion opportunities to lengthen the operational ability of a vessel if it is no longer able to compete in the charter market. In 2018, one vessel was nominated for conversion to an FSRU; the 14-year-old, steam propelled, 140,000 cm Golar Viking will be delivered to the Croatia LNG project in 2020. One problem that potential conversion candidates are running into is size, as most modern LNG FPSO, FSRU, or floating storage unit projects are looking for at least 150,000 cm of storage capacity. Most conversion candidates are well below this capacity level.
Global LNG Fleet Propulsion systems Charter Market Orderbook Growth
53Conventional carriers added to the global fleet in 2018
41%Active vessels with DFDE/TFDE, ME-GI, or XDF propulsion systems
Steam $53,400TFDE/DFDE $85,500Average spot charter rate per day in 2018
59Conventional carriersordered in 2018
The active fleet expanded to525 conventional carriers in 2018.
The average ship capacity of newbuilds in 2018 was 171,500 cm, a slight decrease compared to 2017.
Four FSRUs were also completed in 2018, plus one floating storage unit.
In 2015, over 72% of the fleet was steam-based; by 2018, this had fallen to 47%.
The orderbook has a variety of vessels with new propulsion systems, including ME-GI and XDF, which together account for 64% of the vessels on order.
After three years of low charter rates, delivery of vessels more evenly matched new LNG supply, propping up rates in 2018.
Rates spiked to an all-time high in Q4 2018, peaking at $195,500/day for modernfuel-efficient tonnage due to high Asian LNG demand.
After a multi-year lull in new orders, additions to the orderbook increased by 195% in 2018.
Two FSRUs were also ordered in 2018.
Nearly three-quarters of the orders placed in 2018 were speculative.
5.3CHARTER MARKET
In 2018, spot charter rates averaged $53,000/day for conventional steam tankers, and $85,000/day for modern fuel-efficient tankers (DFDE, TFDE, ME-GI, X-DF). However, for the first three quarters of 2018, rates for a modern fuel-efficient tanker averaged only $63,000. The surge in spot charter rates during Q4 2018 skewed the annual average, with rates reaching a historic peak of $195,000/day. This rate increase was spurred by the build-up of winter inventories in Asia, and ultimately the floating storage play that ensued as inventories filled up quicker than expected, delaying discharge windows. During this Q4 increase in spot charter rates, Europe had its highest-ever single month of LNG imports as the rise in freight costs made voyages to Asian markets less desirable to traders with Atlantic Basin cargoes. For traders without their own dedicated fleet that needed to charter tankers off the spot market, the high cost of cross-basin trades led them to turn to Europe as netbacks were more favourable. However, these historically high rates were short-lived as the market worked through the floating storage volumes; in the first month of 2019, rates fell back down to around $74,000/day.
LNG traders have continued to play a critical role in balancing excess tonnage. The number of spot fixtures continues to grow with both traders and portfolio players trying to secure vessels for single voyages. Traders, still reluctant to take a long-term position on shipping, continue to use the spot carrier market to meet their shipping requirements. As the market becomes more liquid, short-term fixtures will be more prevalent. Aggregators are also tapping into the carrier market to fill the gaps in their carrier fleets as they move LNG from the Atlantic to the Pacific Basin. There were close to 325 spot fixtures during 2018, a 12% YOY decrease as there was very little tanker availability in Q4 due to the winter inventory build-up and floating storage play. The bulk of spot fixtures were for DFDE/TFDE carriers; this is further evidence of the market’s preference for the newer, larger, and more fuel efficient ME-GI, and XDF carriers as most of those vessels have already been contracted under long-term charter.
As LNG prices face downward pressure and in turn squeeze trading margins, charterers are trying to reduce costs where they can. DFDE/TFDE carriers offer superior boil-off rates and consume around 30% less fuel oil than a steam carrier consumes at 18 knots. DFDE/TFDE carriers, even with higher spot charter rates, still offer larger savings overall when boil-off and fuel consumption are taken into consideration. A few of the newer XDF and ME-GI LNG carriers are also being offered in the spot carrier market, which have even greater fuel and boil-off efficiencies, but the majority have been contracted under long-term charters. As the DFDE/TFDE, ME-GI, and XDF newer carriers capture most of the spot trade, older steam carriers are left to sit idle with longer periods of time between cargoes, causing the storage tanks and associated cryogenic equipment to become warm. This requires the vessel to take in cool-down volumes to return to service, which adds time and expense.
Looking forward to 2019, rates are expected to fall off their winter highs as the market enters the shoulder months for LNG demand. However, the continued buildout of liquefaction capacity should prevent a return to the lows reached in 2017. The 51.8 MTPA of new liquefaction capacity coming online in 2019 is currently being met by only 41 newbuild deliveries. This is slightly mismatched, as with current trading dynamics one LNG tanker is needed for every 0.75 MTPA of liquefaction capacity.
Figure 5.6: Average LNG Spot Charter Rates versus Vessel Deliveries, 2012–2018
Source: IHS Markit
5.4
5.5
5.6
100%
75%
50%
25%
0%Active Fleet Order Book
TFDESteam DFDE SSD ME-GI XDF
Steam Reheat Undecided STaGE
<10 10-19
225 226
20-29
43
30-39 >39
18 13
300
250
200
150
100
50
0
# of vessels
vessels age (years)
125,000 - 149,999 cm
>180,000cm 150,000 - 180,000 cm
30,000 - 124,999 cm
180
150
120
90
60
30
0
6
5
4
3
2
1
0
$’000/day
Jan-12 Jan-13 Jan-14 Jan-15 Jan-16 Jan-17
# of vessels
Vessels delivered (right) Steam DFDE/TFDE
Pacific Breeze - Courtesy of Inpex

58 59
LNG Carriers
Figu
re 5
.7: M
ajor
LN
G S
hipp
ing
Rout
es, 2
018
Sour
ce: I
HS
Mar
kit
Shor
test
LN
G v
oyag
e le
ngth
in 2
018:
130n
m (A
lger
ia t
o Sp
ain)
N
umbe
r of
LN
G v
oyag
es in
201
8:5,
119
Long
est
LNG
voy
ages
leng
th in
201
8:15
,520
nm
(Sab
ine
Pass
LN
G t
o Ja
pan
via
Cape
of G
ood
Hop
e)
Liqu
efac
tion
proj
ect
Rega
sific
atio
n te
rmin
alLN
G tr
ade
rout
e in
201
8
IGU World LNG report - 2019 Edition
5.8
Atlantic-Pacific Total Voyages (right)
40
35
30
25
20
15
10
5
0
5,300
5,100
4,900
4,700
4,500
4,300
4,100
3,900
MT Total # of voyages
2010 2011 2012 2013 2014 2015 2016 2017 2018
5.9
180
160
140
120
100
80
60
40
20
0
18
16
14
12
10
8
6
4
2
0
$’000/day # of vessels
Apr Jul OctJan Apr Jul OctJan
2012 2013
Apr Jul OctJan
2014
Apr Jul OctJan
2015
Apr Jul OctJan
2016
Apr Jul OctJan
2017
Conventional Newbuild Orders (right)Spot Charter Rate Long-term Charter Rate
5.10
40
30
20
10
0Q1 2012
5
94 4
10 10 10 9
16
3
31
6 74
5
2 2 3
1
11 1 4
3
2
4 55
12
9
10
4
122
37
9 2
5
Q3 2012 Q1 2013 Q3 2013 Q1 2014 Q3 2014 Q1 2015 Q3 2015 Q1 2016 Q3 2016 Q1 2017 Q3 2017 Q1 2018 Q3 2018
# of vessels
Speculative Term-chartered
2
5.4FLEET VOYAGES AND VESSELUTILISATION
Once again, the total number of voyages completed in 2018 grew, as both Asian and European markets helped to absorb new supply from the continued build-out of new liquefaction capacity. A total of 5,119 voyages were completed during the year, an 8% YOY increase (see Figure 5.8). Historically, trade was most commonly conducted on a regional basis along fixed routes serving long-term point-to-point contracts, though the rapid expansion in LNG trade over the past decade has been accompanied by an increasing diversification of trade routes. With new liquefaction capacity coming online in the US and the Panama Canal expansion accommodating more LNG tankers, inter-basin trade was on the rise in 2018, at 13% YOY.
In 2018, the average number of voyages completed per tanker was 10.5, compared to the 11 voyages per tanker in 2017. Laden voyage days were up in 2018, averaging 14 days compared to 13 days in 2017. This corresponds with the increase in cross-basin trade – the longer voyage distance results in fewer completed voyages. Even with the buildout in new liquefaction capacity in 2018, the holdover from outmatched deliveries in previous years has maintained increased carrier availability. In contrast, vessel utilisation was at its highest in 2011 following Japan’s Fukushima disaster, which required significant incremental LNG volumes sourced from the Atlantic Basin. Strong Atlantic to Pacific trade continued in the following three years as traders capitalised on the arbitrage opportunity between basins. The extended voyage distance between the Atlantic and Pacific put a strain on the global LNG fleet, which caused charter rates to skyrocket and led ship owners to put in orders on a speculative basis.
With the Panama Canal expansion now operational for over two years and daily slots for LNG tankers increasing, the voyage distance from the US Gulf Coast to Japan has been reduced to 9,500 nautical miles (nm), compared to 14,400 nm when the Suez Canal is used. The longest voyage undertaken in 2018 was from Sabine Pass LNG to Sakai, Japan around the Cape of Good Hope – a distance of 15,520 nm, with the shortest voyage being a more traditional route from Algeria to Spain, at 130 nm. The most common voyage in 2018 was from Australia to Japan, with 469 voyages completed during the year.
5,119 VoyagesNumber of voyages of
LNG trade voyages in 2018
Figure 5.8: Atlantic-Pacific Trade versus Total Number of Voyages per year, 2010-2018
Source: IHS Markit
Rita Andrea - Courtesy of Shell

60 61
5 Long-term charter rates refer to anything chartered under a contract of five years or above. Sport charter rates refer to anything chartered under a contract of six months or less.
LNG Carriers
Starting in 2013, the build-up in LNG liquefaction capacity lagged the influx of newbuilds to the market, creating high carrier availability and low charter rates, though the seasonality of the LNG trade usually results in a slight increase in day rates during the peak heating season in the winter and cooling season in the summer. A continued influx of new tonnage through 2017 kept rates low and led them to hit an all-time trough in the spring of 2017. However, starting in the 2017-2018 winter, demand for spot tonnage was heightened by China’s appetite for spot LNG volumes as they progressed coal-to-gas switching plans, causing spot charter rates to rise to levels not reached since early 2014. While there was a slight
Figure 5.10: Firm Conventional Newbuild Orders by Quarter, 2012-2018
5.8
Atlantic-Pacific Total Voyages (right)
40
35
30
25
20
15
10
5
0
5,300
5,100
4,900
4,700
4,500
4,300
4,100
3,900
MT Total # of voyages
2010 2011 2012 2013 2014 2015 2016 2017 2018
5.9
180
160
140
120
100
80
60
40
20
0
18
16
14
12
10
8
6
4
2
0
$’000/day # of vessels
Apr Jul OctJan Apr Jul OctJan
2012 2013
Apr Jul OctJan
2014
Apr Jul OctJan
2015
Apr Jul OctJan
2016
Apr Jul OctJan
2017
Conventional Newbuild Orders (right)Spot Charter Rate Long-term Charter Rate
5.10
40
30
20
10
0Q1 2012
5
94 4
10 10 10 9
16
3
31
6 74
5
2 2 3
1
11 1 4
3
2
4 55
12
9
10
4
122
37
9 2
5
Q3 2012 Q1 2013 Q3 2013 Q1 2014 Q3 2014 Q1 2015 Q3 2015 Q1 2016 Q3 2016 Q1 2017 Q3 2017 Q1 2018 Q3 2018
# of vessels
Speculative Term-chartered
2
Sources: IHS Markit, Shipyard Reports
IGU World LNG report - 2019 Edition
rate correction as the market exited the coldest winter months, rates stayed elevated throughout the first half of 2018. Toward the end of 2018, rates began to soar owing to the buildup of winter LNG inventories in Northeast Asian markets, further bolstered by a resulting floating storage play as inventory levels maxed out in Northeast Asia. This resulted in laden tankers with postponed discharge dates. Spot charter rates in Q4 2018 peaked at an all-time high $195,500/day and averaged $150,000/day. However, this was short-lived and spot charter rates had already returned to around $74,000/day by January 2019.
Figure 5.9: Estimated Long-term and Spot Charter Rates versus Newbuild Orders, 2012-20185
5.8
Atlantic-Pacific Total Voyages (right)
40
35
30
25
20
15
10
5
0
5,300
5,100
4,900
4,700
4,500
4,300
4,100
3,900
MT Total # of voyages
2010 2011 2012 2013 2014 2015 2016 2017 2018
5.9
180
160
140
120
100
80
60
40
20
0
18
16
14
12
10
8
6
4
2
0
$’000/day # of vessels
Apr Jul OctJan Apr Jul OctJan
2012 2013
Apr Jul OctJan
2014
Apr Jul OctJan
2015
Apr Jul OctJan
2016
Apr Jul OctJan
2017
Conventional Newbuild Orders (right)Spot Charter Rate Long-term Charter Rate
5.10
40
30
20
10
0Q1 2012
5
94 4
10 10 10 9
16
3
31
6 74
5
2 2 3
1
11 1 4
3
2
4 55
12
9
10
4
122
37
9 2
5
Q3 2012 Q1 2013 Q3 2013 Q1 2014 Q3 2014 Q1 2015 Q3 2015 Q1 2016 Q3 2016 Q1 2017 Q3 2017 Q1 2018 Q3 2018
# of vessels
Speculative Term-chartered
2
Source: IHS Markit
5.5FLEET ANDNEWBUILDORDERS
At the end of 2018, 118 vessels were on order. Around 52% of vessels in the orderbook were associated with charters that extend beyond a year, while 56 vessels were ordered on a speculative basis (see Figure 5.10).
In 2018, newbuild vessel orders increased by 195% YOY to 59, two of which were for FSRUs. Prior to 2017, the slowdown in liquefaction FIDs had also led to a lull in new vessel orders, as companies delayed a decision on potential associated newbuilds. Also, with an order book heavy with speculatively ordered tonnage, many potential project offtakers could easily cover their shipping requirements with these carriers. However, as the lull in new orders stretched into years, the potential for a tighter shipping market began to loom, particularly considering the propensity to favour more fuel-efficient DFDE/TFDE, ME-GI, and XDF carriers over steam turbine carriers. Newbuild orders began to increase in mid-2017 and this trend continued into 2018, especially as the first generation of LNG carriers are being considered as potential scrap or conversion candidates. The potential of a tightening shipping market post-2022 will keep the momentum in the newbuild market going into 2019, as
Figure 5.11: LNG Fleet by Respective Interests, end-20185.11
40353025201510
50
# of vessels
Nak
ilat
MIS
CTe
ekay
Mar
an G
as M
arit
ime
Gas
Log
BWG
olar
LN
GSi
noko
r M
erch
ant M
arin
eJ4
Con
sort
ium
BGT
Ltd.
Knut
sen
OAS
Dyn
agas
Gol
ar L
NG
Par
tner
sH
yund
ai L
NG
Shi
ppin
gN
atio
nal G
as S
hipp
ing
CoEx
cele
rate
Ene
rgy
NYK
, K L
ine,
MO
L, Ii
no, M
itsu
i, N
akila
tSh
ell
Hoe
ghN
orth
Wes
t She
lf Ve
ntur
eN
YKSo
vcom
flot
Kore
a Li
neG
aslo
g Pa
rtne
rsCh
evro
nSK
Shi
ppin
gBr
unei
Gas
Car
rier
sCa
rdiff
Mar
ine
Mar
an G
.M, N
akila
tTe
ekay
, Mar
uben
iCh
ina
LNG
Shi
p M
gmt.
Han
jin S
hipp
ing
Co.
OSC
, MO
LTE
PCO
, NYK
, Mit
subi
shi
MO
L, N
YK, K
Lin
e, S
CI, N
akila
t, Pe
tron
etM
OL
Nak
ilat,
Teek
ay BPCo
mm
erz
Real
, Nak
ilat,
PRO
NAV
Nak
ilat,
OSC
Mit
sui,
NYK
, Tee
kay
MO
L, C
hina
LN
GG
ener
al D
ynam
ics
MO
L, N
YK, K
Lin
eH
YPRO
CSh
ell,
Gas
log
Sten
a Bu
lkK
Line
MO
L, N
YKM
OL,
KEP
COK
Line
, PT
Mer
atus
Mit
sui,
Sona
ngol
, Soj
itz
Then
amar
isPE
TRO
NAS
Chin
a Sh
ippi
ng G
roup
On Order Delivered in 2018 Active
5.12
1,800
1,700
1,600
1,500
1,400
1,300
1,200
1,100
1,000
900
55
50
45
40
35
30
25
20
15
10
$/cm Months
2005 2007 2009 2011 2013 2015 2017
Steam SSD TFDE DFDE MEGIAvg. Delivery (right)
a series of newbuild orders and options have already been taken by LNG shipowners in the first month of the year.
Many independent shipping companies made moves to dramatically grow their fleet sizes in the aftermath of the Fukushima nuclear crisis. The more traditional LNG shipowners have typically ordered newbuilds on the back of a long-term contract, leaving the speculative orders to the more niche owners. However, as with the growth of traditional buyers and sellers in the spot LNG trading market, traditional shipowners are also increasingly branching out into speculative orders.
Out of the 118 vessels on charter in the order book, 22% are tied to companies that would traditionally be considered an LNG producer (e.g., PETRONAS, Yamal LNG, etc.; see Figure 5.11), though these lines are blurring as more producer companies are branching into LNG buying and trading. Traditional LNG buyers make up 35% of the new-build orders as the companies gear up for their Australian and US offtake. The remaining charters are from companies with multiple market strategies, including traders and aggregators.
Note: The above graph only includes shipping groups that have three or more active vessels.Source: IHS Markit

62 63
LNG Carriers
5.6VESSEL COSTSAND DELIVERY SCHEDULE
Throughout the 2000s, average LNG carrier costs per cubic metre remained within a narrow range. The rapid growth in demand for innovative vessels starting in 2014, particularly vessels with TFDE propulsion, pushed average vessel costs to rise from $1,300/cm in 2005 to $1,770/cm in 2014 (see Figure 5.12). This was mainly driven by the Yamal LNG icebreaker vessels, which are more expensive than a typical carrier. However, in 2017, the costs for XDF/ME-GI vessels dropped back to $1,057/cm. Korean shipyards, which have been suffering from the overall downturn in shipping, have been quite aggressive with their pricing, in turn forcing Japanese and Chinese shipyards to also offer competitive bids for newbuilds. Following a banner year for LNG newbuild orders in 2018, vessel costs have ticked upwards to $1,069/cm.
With few exceptions, vessels have historically been delivered between 30 and 50 months after the order is placed. However, the delivery timeline has varied depending on the type of propulsion system. For instance, when DFDE vessels were first ordered in the early 2000s, the time to delivery lengthened as shipyards had to adapt to the new ship specifications. DFDE carriers delivered between 2006 and 2010 experienced an average time of 50 months between order and delivery, but this improved to 37 months post-2010. Also, if a shipowner orders a sister ship, the delivery time can be cut down substantially to less than 24 months, since those orders involve minimal design changes. The Yamal LNG project will require 15 ice-breaker LNG carriers, all of which have already been ordered; 9 vessels have been delivered as of the end of 2018. These ships have the capacity to transport
Figure 5.12: Average Delivery and Cost per Cubic Meter in Ordered Year by LNG Carrier Type, 2005-2018
Source: IHS Markit
5.11
40353025201510
50
# of vessels
Nak
ilat
MIS
CTe
ekay
Mar
an G
as M
arit
ime
Gas
Log
BWG
olar
LN
GSi
noko
r M
erch
ant M
arin
eJ4
Con
sort
ium
BGT
Ltd.
Knut
sen
OAS
Dyn
agas
Gol
ar L
NG
Par
tner
sH
yund
ai L
NG
Shi
ppin
gN
atio
nal G
as S
hipp
ing
CoEx
cele
rate
Ene
rgy
NYK
, K L
ine,
MO
L, Ii
no, M
itsu
i, N
akila
tSh
ell
Hoe
ghN
orth
Wes
t She
lf Ve
ntur
eN
YKSo
vcom
flot
Kore
a Li
neG
aslo
g Pa
rtne
rsCh
evro
nSK
Shi
ppin
gBr
unei
Gas
Car
rier
sCa
rdiff
Mar
ine
Mar
an G
.M, N
akila
tTe
ekay
, Mar
uben
iCh
ina
LNG
Shi
p M
gmt.
Han
jin S
hipp
ing
Co.
OSC
, MO
LTE
PCO
, NYK
, Mit
subi
shi
MO
L, N
YK, K
Lin
e, S
CI, N
akila
t, Pe
tron
etM
OL
Nak
ilat,
Teek
ay BPCo
mm
erz
Real
, Nak
ilat,
PRO
NAV
Nak
ilat,
OSC
Mit
sui,
NYK
, Tee
kay
MO
L, C
hina
LN
GG
ener
al D
ynam
ics
MO
L, N
YK, K
Lin
eH
YPRO
CSh
ell,
Gas
log
Sten
a Bu
lkK
Line
MO
L, N
YKM
OL,
KEP
COK
Line
, PT
Mer
atus
Mit
sui,
Sona
ngol
, Soj
itz
Then
amar
isPE
TRO
NAS
Chin
a Sh
ippi
ng G
roup
On Order Delivered in 2018 Active
5.12
1,800
1,700
1,600
1,500
1,400
1,300
1,200
1,100
1,000
900
55
50
45
40
35
30
25
20
15
10
$/cm Months
2005 2007 2009 2011 2013 2015 2017
Steam SSD TFDE DFDE MEGIAvg. Delivery (right)
IGU World LNG report - 2019 Edition
LNG in summer via the North Sea Route (NSR) and in winter by the western route to European terminals, including Zeebrugge and Dunkirk. These ice-breaking carriers each cost approximately $320 million. In December 2017, the first of these vessels loaded at the Yamal LNG project.
Currently, 84% of global shipping uses heavy fuel oil that generates polluting sulphur dioxide. Shipping companies increasingly must consider local and global regulations for air emission pollution, among other developments. In the maritime industry, IMO has a clear route to implement regulations to reduce Sulphur Oxides (SOx) and NOx in the near-term, and further reduce CO2 emissions in the long-term. In addition, regulatory bodies from states such as California (CARB), markets such as the EU, and markets such as China, Hong Kong and others have also issued specific regulations to limit the use of fuels with high content of sulphur. The most important global regulation is the IMO sulphur cap (0.5% maximum content) which will affect the global fleet starting in 2020. In emission control areas and in EU ports, this threshold is further reduced to 0.1% maximum content.
In particular for SOx compliance, the sulphur content of LNG is 1000 times lower than the IMO’s 0.5% rule. Beside the use of low sulphur fuels, other alternative methods have been proposed such as exhaust gas treatment systems, called scrubbers. Nevertheless, some authorities have decided to ban the use of open loop scrubbers, equipment which uses sea water in an open loop as a method to clean the exhaust gas. Although the investment to install LNG fuel equipment on board may be significant compared to scrubber installation, LNG fuel might be a more convenient and economical solution in the long term. This may become an increasingly important consideration for shipping companies when developing their fleet in the future.
In addition to the above regulations in place for ships, environmental advantages of LNG as a fuel create a business case for the development of new LNG import terminals.
This has resulted in two clear trends in the LNG market. Firstly, the increased use of LNG as fuel for more ships, which had already been used traditionally for LNG carriers. Secondly, the implementation of fast regasification and trucked LNG to power solutions by means of floating storage units, floating storage and regasification units (FSRU’s) and combinations of both.
The fleet of LNG fuelled ships, other than gas carriers, has grown sustainably in the last years. More than 150 ships are now in service and many more on order. Although the bunker capacity of the ships is relatively small, a fleet of small scale carriers dedicated to
5.7NEAR-TERM SHIPPING DEVELOPMENTS
bunkering LNG has rapidly developed. As indicated in Chapter 8: Small-scale focus on LNG bunkering, 7 ships are already providing LNG as a bunker fuel in Europe and one barge has recently been delivered in the USA. Many more LNG bunkering ships are on order, so potentially by 2022 more than 20 ships could be in operation globally. Regions identified where those ships could deploy are the USA and Canada, Europe and large bunkering ports in the world such as Singapore.
The second main trend is the development of new business models; including floating installations to import LNG and feed gas to power plants. Multiple configurations of new terminals involving FSRU’s or floating storage units have been implemented. Examples in the last years are the Malta and Jamaica floating storage unit import terminals. Although the concept is different the purpose is the same - to burn cleaner energy in power plants on shore. The Maltese power plant receives LNG by cryogenic pipe and then burns the natural gas once it is regasified on shore. The Jamaica project is a bit more complex, involving trans-shipment from the floating storage unit to a small-scale LNG carrier that delivers the parcels to a regas and power plant facility. Short term new developments may include floating gas power plants moored alongside or in the proximity of FSRU’s. Different concepts for barges, both newbuild and conversions, have been proposed. Eventually, FSRPU (floating storage regasification and power units) have been designed.
More specifically for LNG carriers, the market has become very dynamic for different reasons. The main reason has been the high requirements for flexibility in LNG trade. For instance, ships are delivering more and more partial cargoes. This means that in some cases, only some cargo tanks would be offloaded at the receiving terminal, and the rest would be shipped to another destination. Many more small-scale developments are expected, thereby creating additional requirements for small LNG carriers.
LNG shipping will follow the same trend, and will look to become even more flexible. Technologies applied for ships will have to follow the charterers and owners’ requirements. Containment system boil off rates and propulsion engines consumption will be aligned as much as possible, and ships speed reduced to 15-16 knots in more cases. Re-liquefaction technologies will be installed on board and new systems developed. In the short term, new containment systems for small scale ships will be developed as well.
Sakhalin Energy Grand Aniva - Courtesy of Shell

Argentina, Brazil, Egypt,and United Arab Emirates
had their chartered FSRUs leave port in 2018removing 16.6 MTPA from the market and
resulting in only 6.2 MTPA of net regasificationcapacity growth.
New markets including
Bahrain, Croatia,El Salvador, Ghana,and the Philippinesare in the process of constructingtheir first regasification terminals
Multiple new regasification terminalsand expansion projects were set to begin
operations in early 2019, including
Thailand, India,Chinese Taipei, China, Jamaica,
Russia (Kaliningrad),Bahrain, and Bangladesh
Chinawas a particular source of growth,completing three new terminals
in 2018 and an expansionof an existing terminal.
Global LNG regasificationcapacity reached a high of
824 MTPAas of February 2019
+6.2 MTPANet growth of global LNGreceiving capacity
+5New LNG onshoreimport terminals
New terminals andexpansion projects added
22.8 MTPAof regasification capacity to theglobal LNG market in 2018
+2New LNG Offshoreterminals
+2Regasificationmarkets
6.LNG ReceivingTerminals
IGU World LNG report - 2019 Edition LNG Receiving Terminals
64 65

66 67
LNG Receiving Terminals
Global LNG regasification capacity reached a high of 824 MTPA1 as of February 2019, continuing a path of consistent expansion. While the growth in regasification capacity was primarily centred in existing LNG markets, two new LNG importers – Bangladesh and Panama – added regasification capacity in 2018 as the first new importers to the market since 2016. In addition, China, Japan, and Turkey also added new terminals during the year.
China was a particular source of growth, completing three new terminals in 2018 and an expansion of an existing terminal. A regasification capacity expansion was also completed in Greece. In sum, new terminals and expansion projects added 22.8 MTPA of regasification capacity to the global LNG market in 20182. However, four terminals – in Argentina, Brazil, Egypt, and United Arab Emirates – had their chartered FSRUs leave port in 2018 as their services were no longer required, removing 16.6 MTPA from the market and resulting in only 6.2 MTPA of net regasification capacity growth. Their departures highlight the inherent flexibility provided by offshore terminals as FSRUs can be added and removed with relative ease, particularly in markets subject to significant demand swings. Nonetheless, multiple new regasification terminals and expansion projects were set to begin operations in early 2019, including in Thailand, India, Chinese Taipei, China, Jamaica, Russia (Kaliningrad), Bahrain, and Bangladesh. Indeed, Russia (Kaliningrad) and Bahrain were expected to begin operations at their first regasification terminals in early 2019 after an FSRU arrived in Kaliningrad in December 2018 and a floating storage unit arrived in Bahrain in January 2019.
The majority of near-term regasification capacity growth is still expected to occur in established importing markets, particularly in Asia through additions in China, India, and elsewhere in the region. Although their regasification capacities are not yet on the scale of many existing importing markets, many new LNG importers continue to add or plan to develop regasification terminals, which could ultimately add a significant aggregate capacity volume in the future. Following the addition of Bangladesh and Panama in 2018 and of Russia (Kaliningrad) in early 2019, new markets including Bahrain, Croatia, El Salvador, Ghana, and the Philippines are in the process of constructing their first regasification terminals and will begin LNG imports in the next few years. Further, many other markets have proposed adding regasification capacity, including Australia, Sudan, Cyprus, Ireland, Nigeria, Côte D’Ivoire, Lebanon, Namibia, Vietnam, China (Hong Kong), South Africa, Morocco, and Germany. However, many of the markets listed have been subject to numerous delays in bringing terminals to fruition as a number of these developments face substantial headwinds to move forward, particularly in financing and infrastructure development. Despite these challenges, the trend of adding new importers to the global LNG market is expected to continue with a few new markets expected to emerge per year in the near-term.
1 All counts and totals within this section only include markets with large-scale LNG regasification capacity (0.5 MTPA and above). This includes markets that only regasify domestically-produced LNG, which may cause totals to differ from those reported in Chapter 3: LNG Trade. Refer to Chapter 10: References for a description of the categorization of small-scale versus large-scale LNG.
2 Some individual capacity numbers have been restated over the past year owing to improved data availability and a methodological change in accounting for mothballed and available floating capacity. This may cause global capacity totals to differ compared to the IGU World LNG Report – 2018 Edition.
IGU World LNG report - 2019 Edition
Incheon Terminal - Courtesy of KOGAS

68 69
6.2RECEIVING TERMINAL CAPACITY AND REGASIFICATION UTILISATION GLOBALLY
In 2018, 22.8 MTPA of new regasification capacity was constructed. This is a slower rate of growth than experienced in 2017, when 45 MTPA of new capacity was completed. The new markets of Bangladesh and Panama added to regasification growth in 2018, following 2017 when capacity was only constructed at existing markets, which had marked the first time in ten years without a new regasification market6. The number of importers with regasification infrastructure has expanded significantly in recent years, more than tripling over the past 15 years. Increasingly flexible supply has supported LNG trade growth, and FSRUs have played a larger role in allowing new markets to access LNG supply at a faster rate as observed in Egypt and Pakistan in 2015 or in Bangladesh in 2018. LNG trade growth has also benefited from previous periods of lower global LNG prices, driving demand in markets such as India, as well as measures for reduction in air pollution as observed in China. A large portion of the next group of LNG importers anticipated to join the global LNG market are from emerging, higher credit risk regions. However, new markets continue to join the ranks of LNG importers even in established importing regions like Europe.
Seven new regasification terminals achieved commercial operations in 2018 (see Figure 6.3). Five of these new terminals were completed in the Asia or Asia Pacific regions, including three in China (Shenzhen, Tianjin (Sinopec), and Zhoushan), Japan (Soma), and Bangladesh (Moheshkhali (Petrobangla)). Panama added its first terminal (Costa Norte) in 2018, the first new regasification terminal for the Latin America region since Colombia’s Cartagena terminal in 2016. In Europe, Turkey’s Dortyol terminal began commercial operations in early 2018 after completing construction in 2017. In total, 20.7 MTPA of regasification capacity was added in new terminals in 2018.
Figure 6.2: Global Receiving Terminal Capacity, 2000-2024
Note: The above forecast only includes projects sanctioned as of February 2019. Regasification utilisation figures are calculated using regasification capacity prorated based on terminal start dates. Owing to short construction timelines for regasification terminals, additional projects that have not yet been sanctioned may still come online in the forecast period. Capacity declines over the forecast period as FSRU charters conclude, although new charters may be signed during this time.Sources: IHS Markit, IGU, Company Announcements
6.1OVERVIEW
Two new markets, Bangladesh and Panama, added LNG regasification capacity in 2018. Beyond those two, new terminals were constructed in China, Japan, and Turkey, all of which were existing LNG markets. China and Greece also completed regasification capacity expansion projects at existing plants. Furthermore, one expansion project in Thailand came online in January 2019. In sum, these additions brought total LNG regasification capacity in the global market to 824 MTPA across 36 markets3 as of February 2019 (see Figure 6.1).
The global market’s largest levels of regasification capacity are located in the Asia and Asia Pacific regions.5 The two regions are anticipated to continue their high rates of capacity expansion moving forward in both growth markets as well as established LNG importers. Despite having high levels of existing regasification capacity, North America has not experienced capacity growth in recent years outside of small-scale projects in the Caribbean region due to increases in domestic production. The introduction of FSRUs have allowed several new markets to access the global LNG market over the last decade, especially in the Middle East, Asia, and Latin America. Indeed, Bangladesh’s first regasification terminal is an FSRU added in 2018. FSRUs could continue to play an important role in bringing LNG imports to new markets quickly, provided there is sufficient pipeline and offloading infrastructure in place. However, while construction timelines are typically longer at onshore regasification terminals, they offer the stability of a permanent, larger-scale solution and thus will continue to be important to accommodate the needs of growing LNG importers.
3 The total number of markets excludes those with only small-scale (<0.5 MTPA) regasification capacity, such as Finland, Jamaica, Malta, Norway, and Sweden. It includes markets with large-scale regasification capacity that only consume domestically-produced cargoes, such as Indonesia.4 Total excludes regasification capacities from Abu Dhabi (Ruwais), Ain Sokhna Höegh, Bahia Blanca, and Guanabara Bay as FSRU charters ended at those ports in 2018.5 Please refer to Chapter 10: References for an exact definition of each region.6 Although Malta began LNG imports in 2017, its terminal is small-scale (0.4 MTPA) and thus not included in this chapter.
LNG Receiving Terminals
824 MTPA4Global LNG nameplate receiving
capacity, February 2019
7 terminalsNumber of new receiving terminals
brought online in 2018
6.1
6.3
6.2
450
400
350
300
250
200
150
100
50
0Existing FID Pre-FID
MTPA
North AmericaAsia Pacific Europe Latin America
Asia Middle East Africa Former Soviet Union
1,000
900
800
700
600
500
400
300
200
100
0
100%
90%
80%
70%
60%
50%
40%
30%
20%
10%
0%
MTPA
2000
2001
2002
2003
2004
2005
2006
2007
2008
2009
2010
2011
2012
2013
2014
2015
2016
2017
2018
2019
2020
2021
2022
2023
2024
Utilization (right axis)Under Construction in 2019 Existing
Forecast
18
16
14
12
10
8
6
4
2
0
45
40
35
30
25
20
15
10
5
0
New Terminals or Expansion Phases Online No. of Countries
1980
1982
1984
1986
1988
1990
1992
1994
1996
1998
2000
2002
2004
2006
2008
2010
2012
2014
2016
2018
2020
2022
2024
No. of Countries with LNG Receiving Terminals (right axis)Floating Onshore
Forecast
Figure 6.1: LNG Receiving Capacity by Status and Region, as of February 2019 6.1
6.3
6.2
450
400
350
300
250
200
150
100
50
0Existing FID Pre-FID
MTPA
North AmericaAsia Pacific Europe Latin America
Asia Middle East Africa Former Soviet Union
1,000
900
800
700
600
500
400
300
200
100
0
100%
90%
80%
70%
60%
50%
40%
30%
20%
10%
0%
MTPA
2000
2001
2002
2003
2004
2005
2006
2007
2008
2009
2010
2011
2012
2013
2014
2015
2016
2017
2018
2019
2020
2021
2022
2023
2024
Utilization (right axis)Under Construction in 2019 Existing
Forecast
18
16
14
12
10
8
6
4
2
0
45
40
35
30
25
20
15
10
5
0
New Terminals or Expansion Phases Online No. of Countries
1980
1982
1984
1986
1988
1990
1992
1994
1996
1998
2000
2002
2004
2006
2008
2010
2012
2014
2016
2018
2020
2022
2024
No. of Countries with LNG Receiving Terminals (right axis)Floating Onshore
Forecast
Sources: IHS Markit, Company Announcements
6.1
6.3
6.2
450
400
350
300
250
200
150
100
50
0Existing FID Pre-FID
MTPA
North AmericaAsia Pacific Europe Latin America
Asia Middle East Africa Former Soviet Union
1,000
900
800
700
600
500
400
300
200
100
0
100%
90%
80%
70%
60%
50%
40%
30%
20%
10%
0%
MTPA
2000
2001
2002
2003
2004
2005
2006
2007
2008
2009
2010
2011
2012
2013
2014
2015
2016
2017
2018
2019
2020
2021
2022
2023
2024
Utilization (right axis)Under Construction in 2019 Existing
Forecast
18
16
14
12
10
8
6
4
2
0
45
40
35
30
25
20
15
10
5
0
New Terminals or Expansion Phases Online No. of Countries
1980
1982
1984
1986
1988
1990
1992
1994
1996
1998
2000
2002
2004
2006
2008
2010
2012
2014
2016
2018
2020
2022
2024
No. of Countries with LNG Receiving Terminals (right axis)Floating Onshore
Forecast
Figure 6.3: Start-Ups of LNG Receiving Terminals, 1980-2024.
Note: Forecast only includes under-construction terminals as of February 2019. Owing to short construction timelines for regasification terminals, additional projects that have not yet been sanctioned may still come online in the forecast period. The decrease in number of markets with receiving terminals is due to the expiration of FSRU charters, although new FSRU charters may be signed during this time period.Sources: IHS Markit, Company Announcements
IGU World LNG report - 2019 Edition

70 71
Furthermore, there were an additional two expansion projects completed at existing regasification terminals in 2018. China’s Qidong terminal added 0.6 MTPA of capacity, expanding the terminal’s total regasification capacity to 1.2 MTPA. Greece’s Revithoussa terminal also added 1.5 MTPA of capacity in the second capacity expansion at the terminal, increasing total capacity to 4.8 MTPA. The 2.1 MTPA of expansion projects, in combination with the 20.7 MTPA of new terminals, brought total added regasification capacity in 2018 to 22.8 MTPA.
Four terminals had FSRUs leave their ports during 2018 as the vessels were no longer needed. Lower LNG demand in the UAE led to the Excelerate being re-chartered as a carrier vessel in mid-2018. The Hoegh Gallant’s charter was ended early in October 2018 as Egypt’s domestic gas production has increased significantly. In Argentina, the Exemplar FSRU left the Bahia Blanca terminal in October 2018 after it was decided that the charter would not be renewed. Brazil’s Guanabara Bay terminal ended the charter of the Golar Spirit FSRU early in 2017, but temporarily brought in an FSRU in third quarter 2018 during a maintenance period at an offshore domestic gas processing platform. In sum, 16.6 MTPA of active regasification capacity was removed from the market as the FSRUs left without any clear announcement of future charters for the terminals.
One expansion project, adding 1.5 MTPA at Thailand’s Map Ta Phut terminal, came online in January 2019. Beyond this project, 129.7 MTPA of new regasification capacity was under construction as of February 2019, including seventeen new onshore terminals, twelve FSRUs, and thirteen expansion projects to existing receiving terminals. Although 87% of this total capacity will be in existing import markets, six under-construction projects are anticipated to add capacity for the first LNG imports in Russia (Kaliningrad), Bahrain, the Philippines, El Salvador, Ghana, and Croatia. Indeed, the Marshal Vasilevskiy FSRU arrived in Kaliningrad in late December 2018 and the Bahrain Spirit floating storage unit arrived in Bahrain in January 2019, where operations were expected to begin imminently. China has nine terminals under construction, along with eight expansion projects, while India has five new terminal projects and an expansion project under construction. Brazil has two forthcoming FSRU projects also in development. Additional terminal construction and regasification capacity expansion projects are underway in Jamaica, Bangladesh, Belgium, South Korea, Japan, Kuwait, Poland, Indonesia, United States (Puerto Rico), and Thailand. An FSRU, the Golar Freeze, arrived at Old Harbour in Jamaica in December 2018, with operations expected to begin in early 2019.
Average regasification utilisation levels across the global LNG market reached 39% in 2018. If idled or mothballed7 terminals were included, this figure would drop to 36% globally. Onshore regasification terminals operated at 39% of capacity in 2018, roughly equal to 38% of capacity at offshore terminals throughout the year. Due to the requirement to meet peak seasonal demand and ensure security of supply, regasification terminal capacity far exceeds liquefaction capacity. Although 6.2 MTPA of net regasification capacity was added in 2018 (22.8 MTPA of new additions minus 16.6 MTPA from FSRU departures over the course of the year), the average levels of global regasification utilisation increased slightly on higher demand globally. US imports utilised just 4% of the market’s 75 MTPA existing active regasification capacity8, as domestic gas production from shale has expanded.
Due to multiple small-to medium-sized terminals in smaller markets beginning operations, average send-out capacity at regasification terminals has trended downwards over the last few years. Further intensifying this trend is the proliferation of floating regasification terminals installed worldwide, whose capacity is generally below 6 MTPA. Average regasification capacity for existing onshore terminals stood at 7.2 MTPA as of February 2019 compared to 4.0 MTPA for floating terminals. Global average regasification capacity has fallen from 9.8 billion cubic meters per year (bcm/yr; equivalent to 7.1 MTPA) in 2011 to 8.7 bcm/yr (6.4 MTPA) in 2018 (see Figure 6.4).
LNG Receiving Terminals
129.7 MTPANew receiving capacity under
construction, as of February 2019
7 Includes Lake Charles, Cameron LNG, Golden Pass, Gulf LNG, and El Musel regasification terminals.8 Including Puerto Rico’s Peñuelas regasification terminal.
9 Historical Japan regasification capacity figures have been restated this year owing to greater data availability. 10 Historical South Korea regasification capacity figures have been restated this year owing to greater data availability.
Figure 6.4: Annual Regasification Capacity of LNG Terminals in 2018 and 2024. 6.4
6.5
6.6
Japan, 202, 41%South Korea, 134, 33%US, 72, 4%China, 64, 85%Spain, 44, 25%UK, 36, 15%India, 27, 87%France, 25, 40%Turkey, 25, 34%Mexico, 17, 31%Brazil, 15, 14%Chinese Taipei, 14, 122%Italy, 11, 56%Singapore, 11, 31%
Thailand, 10, 45%Pakistan, 9, 76%Egypt, 9, 25%Netherlands, 9, 29%Indonesia, 9, 36%UAE, 8, 10%Argentina, 8, 33%Canada, 8, 6%Malaysia, 7, 19%Belgium, 7, 40%Kuwait, 6, 60%Portugal, 6, 51%Chile, 5, 57%Small Mkts, 24, 32%
60
50
40
30
20
10
0
Number of Terminals
2018 2024
1-5bcm/yr
5-10bcm/yr
10-20bcm/yr
20-30bcm/yr
30+bcm/yr
200
150
100
50
0
120%
90%
60
30%
0%
Egyp
t
Gha
na
Chin
a
Indi
a
Paki
stan
Bang
lade
sh
Japa
n
Sout
h Ko
rea
Chin
ese
Taip
ei
Indo
nesi
a
Mal
aysi
a
Sing
apor
e
Thai
land
Phili
ppin
es
Belg
ium
Fran
ce
Gre
ece
Ital
y
Port
ugal
Spai
n
Turk
ey UK
Lith
uani
a
Net
herl
ands
Pola
nd
Russ
ia
Dom
. Rep
.
Jam
aica
Pana
ma
El S
alva
dor
Arge
ntin
a
Braz
il
Colo
mbi
a
Chile
Bahr
ain
Isra
el
Jord
an
Kuw
ait
UAE
Mex
ico
US
Cana
da
MTPA
Africa Asia Asia - Pacific Europe Latin America Middle East NorthAmerica
2018 2024 Regasification utilisation 2018 (right axis)
Sources: IHS Markit, Company Announcements
6.3RECEIVING TERMINAL CAPACITY AND REGASIFICATION UTILISATIONBY MARKET
The market with the largest regasification capacity is also the largest LNG importer, Japan (see Figure 6.5). Japan’s regasification capacity stood at 202 MTPA9 in 2018, which includes the new 1.3 MTPA Soma terminal completed in early 2018. Japan’s total accounts for 24% of global regasification capacity. Despite already being the global leader in regasification capacity, Japan continues to expand its importing abilities with a 3.8 MTPA expansion project at the Hitachi terminal under construction as of February 2019. At year end, Japan’s regasification utilisation reached 41%, down slightly from 2017.
At 134 MTPA10 of regasification capacity in 2018, South Korea has the second largest regasification capacity in the world, behind only Japan. The market remained the third largest LNG importer in 2018, following Japan and China. Although South Korea did not add any regasification capacity in 2018, one new terminal was under construction as of early 2019, the 1 MTPA Jeju Island project. South Korea experienced a regasification utilisation rate of 33% in 2018, up from 30% in 2017 as LNG demand increased owing to lower utilisation of nuclear and coal-fired power.
China became the second largest LNG import market in 2017, surpassing South Korea, and held this position throughout 2018; however, China is still behind South Korea in total regasification capacity, though the gap between them is quickly closing. China continues to be one of the fast-growing regasification markets, adding 10.6 MTPA of capacity in 2018. In addition, the market has 37.6 MTPA of capacity under construction as of February 2019. In terms of total regasification capacity, China is the fourth largest market in the world at 64 MTPA nameplate capacity in 2018. Notably, this is up from only 10 MTPA in 2008. China’s regasification utilisation continued to rise significantly in 2018, reaching 85%, up from 70% in 2017 and 56% in 2016. Given northern China’s colder climate in the winter, utilisation is typically high between November and March in comparison to southern China. Utilisation has consistently increased due to significantly higher imports as the market sought to reduce air pollution through coal-to-gas switching.
India has 26.5 MTPA of regasification capacity under construction as of February 2019 as the market is anticipated to be a significant source of growth for the LNG market moving forward. India’s 27 MTPA of existing capacity in 2018 is the seventh largest in the world. India is expected to complete 14 MTPA of additional capacity in early 2019 at the Ennore, Jaigarh, and Mundra terminals, which will increase total capacity to 41 MTPA. Furthermore, based on announced proposed projects, India’s total regasification capacity could reach as high as 98 MTPA by 2021. Eastern India requires additional supply since domestic upstream projects have either under-performed or been delayed. Moreover, new gas-consuming sectors such refineries, city gas consumption, and other industrial uses are actively being developed. Similar gas development and regasification activity is gaining traction in northeastern and
6.4
6.5
6.6
Japan, 202, 41%South Korea, 134, 33%US, 72, 4%China, 64, 85%Spain, 44, 25%UK, 36, 15%India, 27, 87%France, 25, 40%Turkey, 25, 34%Mexico, 17, 31%Brazil, 15, 14%Chinese Taipei, 14, 122%Italy, 11, 56%Singapore, 11, 31%
Thailand, 10, 45%Pakistan, 9, 76%Egypt, 9, 25%Netherlands, 9, 29%Indonesia, 9, 36%UAE, 8, 10%Argentina, 8, 33%Canada, 8, 6%Malaysia, 7, 19%Belgium, 7, 40%Kuwait, 6, 60%Portugal, 6, 51%Chile, 5, 57%Small Mkts, 24, 32%
60
50
40
30
20
10
0
Number of Terminals
2018 2024
1-5bcm/yr
5-10bcm/yr
10-20bcm/yr
20-30bcm/yr
30+bcm/yr
200
150
100
50
0
120%
90%
60
30%
0%
Egyp
t
Gha
na
Chin
a
Indi
a
Paki
stan
Bang
lade
sh
Japa
n
Sout
h Ko
rea
Chin
ese
Taip
ei
Indo
nesi
a
Mal
aysi
a
Sing
apor
e
Thai
land
Phili
ppin
es
Belg
ium
Fran
ce
Gre
ece
Ital
y
Port
ugal
Spai
n
Turk
ey UK
Lith
uani
a
Net
herl
ands
Pola
nd
Russ
ia
Dom
. Rep
.
Jam
aica
Pana
ma
El S
alva
dor
Arge
ntin
a
Braz
il
Colo
mbi
a
Chile
Bahr
ain
Isra
el
Jord
an
Kuw
ait
UAE
Mex
ico
US
Cana
da
MTPA
Africa Asia Asia - Pacific Europe Latin America Middle East NorthAmerica
2018 2024 Regasification utilisation 2018 (right axis)
Figure 6.5: LNG Regasification Capacity by Market (MTPA) and Annual Regasification Utilisation, 2018.
Note: “Smaller Markets” includes (in order of size): Jordan, Poland, Greece, Lithuania, Israel, Colombia, Dominican Republic, Bangladesh, and Panama. Each of these markets had 4 MTPA or less of prorated capacity as of end-2018. Regasification utilisation figures are based on 2018 trade data and prorated regasification capacity based on terminal start dates in 2018. Prorated capacity in 2018 is displayed in this graph.Sources: IHS Markit, IGU
IGU World LNG report - 2019 Edition
southwestern India as well. Despite this, new pipeline connections will be needed to maximize gas penetration throughout the market. The lack of connectivity near the Kochi terminal in particular has limited throughput thus far and current expectations by the operator are that the pipeline will be completed by 2019 at the earliest. India’s regasification utilisation rate hit 87% in 2018, a rise from 72% in 2017.

72 73
LNG Receiving Terminals
Europe accounts for roughly 20% of total global regasification capacity, but regasification utilisation rates have generally been low, owing to competition from pipeline gas coupled with weaker gas demand in the power sector. Utilisation averaged 33% in 2018 (up from 30% in 2017). This figure, however, varies widely by market, ranging from 15% in the United Kingdom to 56% in Italy (see Figure 6.6). As global LNG supply increased throughout 2018, lower LNG spot prices and standard weather conditions in Asia pushed more cargoes normally destined for the region into Europe, causing utilisation rates to rise toward the end of the year.
Turkey was the only European market to develop a new regasification terminal in 2018 (the Dortyol FSRU), after also adding a terminal in 2017. Given low regasification utilisation rates across Europe, significant increases to regasification capacity may not be required despite the anticipation of higher LNG imports into Europe moving forward. The 3.6 MTPA Swinoujscie terminal was introduced in Poland in 2016 to provide diversity of supply and an expansion project was underway at the terminal as of February 2019; the market is also planning to add an FSRU at Gdansk. Another expansion project is under construction at Zeebrugge in
Figure 6.6: Receiving Terminal Import Capacity and Regasification Utilisation Rate by Market in 2018 and 2024.
6.4
6.5
6.6
Japan, 202, 41%South Korea, 134, 33%US, 72, 4%China, 64, 85%Spain, 44, 25%UK, 36, 15%India, 27, 87%France, 25, 40%Turkey, 25, 34%Mexico, 17, 31%Brazil, 15, 14%Chinese Taipei, 14, 122%Italy, 11, 56%Singapore, 11, 31%
Thailand, 10, 45%Pakistan, 9, 76%Egypt, 9, 25%Netherlands, 9, 29%Indonesia, 9, 36%UAE, 8, 10%Argentina, 8, 33%Canada, 8, 6%Malaysia, 7, 19%Belgium, 7, 40%Kuwait, 6, 60%Portugal, 6, 51%Chile, 5, 57%Small Mkts, 24, 32%
60
50
40
30
20
10
0
Number of Terminals
2018 2024
1-5bcm/yr
5-10bcm/yr
10-20bcm/yr
20-30bcm/yr
30+bcm/yr
200
150
100
50
0
120%
90%
60
30%
0%
Egyp
t
Gha
na
Chin
a
Indi
a
Paki
stan
Bang
lade
sh
Japa
n
Sout
h Ko
rea
Chin
ese
Taip
ei
Indo
nesi
a
Mal
aysi
a
Sing
apor
e
Thai
land
Phili
ppin
es
Belg
ium
Fran
ce
Gre
ece
Ital
y
Port
ugal
Spai
n
Turk
ey UK
Lith
uani
a
Net
herl
ands
Pola
nd
Russ
ia
Dom
. Rep
.
Jam
aica
Pana
ma
El S
alva
dor
Arge
ntin
a
Braz
il
Colo
mbi
a
Chile
Bahr
ain
Isra
el
Jord
an
Kuw
ait
UAE
Mex
ico
US
Cana
da
MTPA
Africa Asia Asia - Pacific Europe Latin America Middle East NorthAmerica
2018 2024 Regasification utilisation 2018 (right axis)
Note: Forecast only includes under-construction capacity as of February 2019. Regasification utilisation figures are calculated using 2018 import data and prorated regasification capacity based on terminal start dates in 2018 and 2024. Prorated capacity in each year is displayed in this graph. Capacity declines over the forecast period are due to FSRU charter expirations, although new charters may be signed during this period. Sources: IHS Markit, IGU, Company Announcements
2017-2018 LNG Receiving Terminals in Review
Belgium, which will add 2.2 MTPA. Another FSRU project in Turkey, the Saros project, is targeted to start up in 2019. Russia’s FSRU in the Kaliningrad exclave arrived in late December 2018, poised to be the market’s first regasification terminal as operations begin in 2019. Further down the road, Croatia is set to become an LNG importer after taking FID on its Krk LNG terminal in February 2019. Elsewhere on the Mediterranean Sea, Greece and Bulgaria are pushing to install an FSRU at Alexandroupolis. Spain has proposed gasifying the Canary Islands via LNG. In northwest Europe, both Germany and Ireland have proposed adding their first regasification terminals. These plans include the Wilhelmshaven and Brünnsbüttel terminals in Germany and the Innisfree and Shannon terminals in Ireland. Although small-scale, Gibraltar (UK) is expected to complete its first LNG terminal in 2019.
Behind only Japan and South Korea, the US contains the third highest level of regasification capacity in the world. However, its terminals remain minimally utilised, if at all; the market averaged 4% regasification utilisation in 2018, largely supported by imports at the Peñuelas regasification terminal in Puerto Rico. In recent years Puerto Rico has experienced regasification utilisation figures over
100% – reaching 113% in 2018 – except for a low year (80%) in 2017 when the market was affected by Hurricane Maria. Puerto Rico is currently constructing its second terminal, an FSRU, set to come online in 2019. Six different terminals in the US received cargoes in 2018, although several of these were likely only cooling cargoes in preparation for the addition of liquefaction capacity; most US regasification terminals that intend to add liquefaction operations have been planned as bidirectional facilities. The Cameron LNG, Golden Pass, Gulf LNG, and Lake Charles regasification terminals are all considered idled and not included in active capacity totals as they haven’t imported cargoes for several years and are assumed to have warm storage tanks. However, regasification capacity at Cameron LNG is expected to start back up in early 2019 as preparations for liquefaction activities ramp up. If all currently idled terminals were included, the US would have a total 131 MTPA of regasification capacity. The prospect of ample, price-competitive domestic gas production means that LNG imports are not expected to increase, and many terminal operators have focused on adding export liquefaction capacity to take advantage of the shale gas boom. As regasification capabilities still exist at these terminals, their capacity will become viable again as storage tanks cool down once liquefaction operations begin.
Canada also had one of the lowest regasification utilisation levels
in 2018 (6%), also due to the availability of domestic production. Chinese Taipei (122%) registered the highest regasification utilisation in 2018 as the market has typically received higher volumes than its announced regasification capacity, often leading to utilisation levels over 100%.
Although Kuwait is currently a relatively small LNG import market, with only 6 MTPA of existing regasification capacity, it is notably constructing one of the largest regasification terminals in recent years. The Al Zour terminal will have an initial regasification capacity of 11.3 MTPA, with a potential expansion up to 22.3 MTPA; the first phase is announced to come online in 2021. The last regasification terminal larger than 10 MTPA to be completed was South Korea’s Samcheok terminal (11.6 MTPA) in 2014.
As LNG exports have increased significantly in eastern Australia since 2015, the market has experienced spikes in regional domestic gas prices. In response, multiple FSRU developments have been proposed in an effort to provide alternative gas sources, meaning Australia could soon join the small group of markets that both export and consume LNG cargoes. The Crib Point terminal in Victoria signed a charter agreement with an FSRU supplier in December 2018 and targets a start date of 2021-2022, though some of the projects have targeted start dates as early as 2020.
IGU World LNG report - 2019 Edition
LNG for Transport - Courtesy of Shell
Receiving Capacity New LNG onshore import terminals
New LNG Offshore terminals
Number of regasification markets
+6.2 MTPANet growth of global LNG receiving capacity
+5Number of new onshore regasification terminals
+2Number of new offshore LNG terminals
+2Markets that added regasification capacity
Net nameplate regasification capacity grew by 6.2 MTPA, from 816.4 MTPA in end-2017 to 822.6 MTPA in end-2018
New regasification additions reached 22.8 MTPA in 2018, but were offset by the departures of FSRUs in Argentina, Brazil, Egypt, and UAE amounting to 16.6 MTPA
Growth in capacity was led by the Asia and Asia Pacific regions in 2018
New onshore terminals were added in in China, Japan, and Panama
Two expansion projects at existing onshore terminals, in China and Greece, were also completed in 2018
One expansion project was completed in Thailand in January 2019
Two FSRUs began commercial operations in 2018, in Turkey (Dortyol), and Bangladesh (Moheshkhali (Petrobangla))
FSRUs also arrived at Old Harbour in Jamaica and Kaliningrad in Russia in December 2018, with operations expected to commence in early 2019
The number of markets with regasification capacity increased to 36 in 2018, following the addition of Panama and Bangladesh.
Russia (Kaliningrad), the Philippines, Ghana, and Bahrain all have their first regasification projects in advanced development stages in 2019, set to come online over the next few years

74 75
LNG Receiving Terminals
11 Terminals that can receive deliveries from more than one size of vessel are only included under the largest size that they can accept.
Regasification terminals vary significantly in terms of the capacity of carrier vessels they can accommodate. A multitude of factors, including a terminal’s size and location, can influence its berthing capacity. Following a similar trend as the divergence in global storage capacities, onshore facilities have increased their maximum ship berthing capacities to accommodate larger vessels, while new markets deploying FSRUs or small-scale regasification terminals generally have smaller ship berthing capacities. Typically, smaller terminals only have the capacity to berth conventional ships, which are under 200,000 cm in capacity. As more established and higher-demand markets have expanded their ship berthing capacities in recent years, the utilisation of Q-Class carriers (those over 217,000 cm) has increased.
Q-Max vessels are the LNG market’s biggest carrier vessel size, with capacities of around 266,000 cm. As of early 2019, 43 out of 126 existing regasification terminals, located in 17 different markets, were known to have the berthing capacity to receive a Q-Max vessel (see Figure 6.8). Of these 44 terminals, 25 were in the Asia or Asia Pacific regions, while the Middle East only has one such terminal, and Latin America and Africa have none. Q-Flex vessels have a capacity around 217,000 cm; a further 31 regasification terminals had berthing capacities to receive Q-Flex carriers, as well as conventional LNG vessels. Out of 36 total import markets, 24 were confirmed to have a minimum of one terminal with receiving capacity for Q-Class vessels. Of the 52 terminals that are estimated to be limited to receive conventional vessels, 16 are FSRUs. Many terminals are also adjusting to accommodate small-scale and bunkering vessels to comply with emissions targets and capture new commercial opportunities. Several terminals with multiple jetties such as GATE and Barcelona can receive a wide variety of vessels sizes, ranging from Q-Max vessels all the way down to small-scale ships, some as low as 500 cm.
Figure 6.7: LNG Storage Tank Capacity by Market (mmcm) and % of Total, as of February 2019
6.5RECEIVING TERMINALBERTHING CAPACITY
6.7
6.8
6.9
Japan, 18.7, 29%South Korea, 12.6, 20%China, 9.2, 14%Spain, 3.3, 5%United States, 3, 5%India, 2.1, 3%United Kingdom, 2.1, 3%France, 1.4, 2%Chinese Taipei, 1.2, 2%Indonesia, 1, 2%Turkey, 0.9, 1%Mexico, 0.9, 1%Singapore, 0.8, 1%Thailand, 0.6, 1%
Netherlands, 0.5, 1%Chile, 0.5, 1%Italy, 0.5, 1%Canada, 0.5, 1%Malaysia, 0.5, 1%Portugal, 0.4, 1%Belgium, 0.4, 1%Smaller Markets*, 2.7, 4%
25
20
15
10
5
0
Number of Terminals
Conventional Q-Flex Q-Max
Africa Asia Asia Pacific Europe LatinAmerica
MiddleEast
NorthAmerica
50
45
40
35
30
25
20
15
10
5
0
Number of Countries
2000
2001
2002
2003
2004
2005
2006
2007
2008
2009
2010
2011
2012
2013
2014
2015
2016
2017
2018
2019
2020
2021
2022
2023
2024
Onshore-only importers Both onshore & FSRU FSRU-only importers
Forecast
Note: “Smaller Markets” includes (in order of size): Poland, Brazil, Greece, Panama, Egypt, Kuwait, Lithuania, Colombia, Pakistan, Jordan, Dominican Republic, United Arab Emirates, Israel, Bangladesh, and Argentina. Each of these markets had less than 0.4 mmcm of capacity as of February 2019.Sources: IHS Markit, Company Announcements
Figure 6.8: Maximum Berthing Capacity of LNG Receiving Terminals by Region, 201811.
Sources: IHS Markit, Company Announcements
6.7
6.8
6.9
Japan, 18.7, 29%South Korea, 12.6, 20%China, 9.2, 14%Spain, 3.3, 5%United States, 3, 5%India, 2.1, 3%United Kingdom, 2.1, 3%France, 1.4, 2%Chinese Taipei, 1.2, 2%Indonesia, 1, 2%Turkey, 0.9, 1%Mexico, 0.9, 1%Singapore, 0.8, 1%Thailand, 0.6, 1%
Netherlands, 0.5, 1%Chile, 0.5, 1%Italy, 0.5, 1%Canada, 0.5, 1%Malaysia, 0.5, 1%Portugal, 0.4, 1%Belgium, 0.4, 1%Smaller Markets*, 2.7, 4%
25
20
15
10
5
0
Number of Terminals
Conventional Q-Flex Q-Max
Africa Asia Asia Pacific Europe LatinAmerica
MiddleEast
NorthAmerica
50
45
40
35
30
25
20
15
10
5
0
Number of Countries
2000
2001
2002
2003
2004
2005
2006
2007
2008
2009
2010
2011
2012
2013
2014
2015
2016
2017
2018
2019
2020
2021
2022
2023
2024
Onshore-only importers Both onshore & FSRU FSRU-only importers
Forecast
The strategic importance of natural gas storage capabilities is expanding as LNG supply ramps up worldwide, particularly in Asia and Europe. Global LNG storage capacity grew to 64 million cubic meters (mmcm) through end-2018 following the addition of seven new regasification terminals and two expansion projects over the year. The average storage capacity for existing terminals in the global market was 528 thousand cubic meters (mcm) as of early 2019 (see Figure 6.7).
Over 45% of the LNG market’s total existing storage capacity is contained in the twenty LNG terminals with the largest storage capabilities, which range from 0.7 to 3.4 mmcm in size. Out of these twenty terminals, fifteen are in the Asia and Asia Pacific regions, as terminal operators in the region have placed a premium on large storage capacity to secure supply and enhance flexibility, particularly given Asia’s seasonal demand cycles. Importers like China, Japan, India, and South Korea also often have little gas storage available outside of LNG terminals.
South Korea’s Pyeongtaek terminal has the largest storage capacity in the world at 3.36 mmcm. Capacity in South Korea has continued to grow, with the Samcheok terminal’s storage capacity increasing to 2.61 mmcm in mid-2017 following the completion of three additional storage tanks of 270,000 cm each – the world’s largest capacity for a single storage tank. China added a total of 1.8 mmcm of storage capacity in 2018 through the addition of three new regasification terminals and an expansion project, increasing the market’s total storage capacity to 9.2 mmcm, the third largest in the global market behind only Japan and South Korea. The Tianjin (Sinopec) and Shenzhen terminals each added 0.64 mmcm of
6.4RECEIVING TERMINAL LNG STORAGE CAPACITY
IGU World LNG report - 2019 Edition
capacity. Outside of Asia, small storage capacity increases were added in 2018 in Turkey (0.26 mmcm), Panama (0.18 mmcm), and Greece (0.1 mmcm) through new terminals and expansion projects.
Trends in global storage capacity developments are diverging. On the one hand, there is storage capacity growth in established LNG markets, particularly via onshore terminals in Asia, compared to a downward shift in average storage capacity in newer markets that utilise FSRUs to import LNG. In general, FSRUs contain substantially less storage capacity than onshore terminals. Onshore terminals generally contain between 260 and 700 mcm of storage capacity, whereas floating terminals typically utilise storage tanks between 125 and 170 mcm in size.
Furthermore, storage capacity can potentially provide value beyond storing LNG that is later regasified. Storage capacity can also be utilised for transhipment and truck-loading capabilities. Although these processes generally require small volumes of LNG, they are expected to comprise a growing portion of LNG demand growth moving forward.
Queensland Curtis LNG Plant - Courtesy of Shell

76 77
LNG Receiving Terminals
Some LNG importing markets have the capability re-export imported LNG cargoes to destinations elsewhere in the global LNG market, a phenomenon that has occurred more frequently in recent years. These are generally markets with access to alternative pipeline supply that take advantage of arbitrage opportunities through LNG trade between basins as well as specific logistical factors within certain markets. France re-exported the most cargoes in 2018 for the third consecutive year, at 1.4 MTPA, utilising the Montoir, Fos Cavaou, and Dunkirk terminals. After France, the Netherlands re-exported the second largest volume of cargoes in 2018. Prior to 2016, Spain and Belgium historically sent out the most re-exported volumes, although cargoes from both markets have dwindled in recent years. Even as the markets within the region vary, Europe continues to produce the highest volume of re-exports as it has since re-exports began in the 2000s. There are 15 terminals in Europe (out of 26 existing terminals) that are capable of re-exports. Lithuania began re-exports within the region in 2017, although these volumes are small-scale in nature. However, the share of non-European re-exports in the global LNG market has risen in recent
6.6RECEIVING TERMINALS WITH RELOADING AND TRANSSHIPMENT CAPABILITIES
Market Terminal Reloading Capability Storage (mcm) No. of Jetties Start ofRe-Exports
Belgium Zeebrugge 4-5 mcm/h 380 1 2008
Brazil Guanabara Bay 1.0 mcm/h 171 2 2011
Brazil Bahia 5.0 mcm/h 136 1 N/A
Brazil Pecém 1.0 mcm/h 127 2 N/A
Colombia Cartagena 0.005 mcm/h 170 1 N/A
Dom. Rep. Andrés N/A 160 1 2017
France Fos Cavaou 4.0 mcm/h 330 1 2012
France Montoir 5.0 mcm/h 360 2 2012
France Dunkirk 4.0 mcm/h 570 1 2018
France Fos Tonkin 1.0 mcm/h 150 1 N/A
India Kochi N/A 320 1 2015
Japan Sodeshi N/A 337 1 2017
Table 6.1: Regasification Terminals with Reloading Capabilities as of February 2019.
IGU World LNG report - 2019 Edition
years, reaching 27% of total re-exports in 2018. Although this was down from 40% in 2017, re-exports from the Asia and Asia Pacific regions have expanded steadily since 2016. Indeed, Singapore produced the third most reloaded cargoes and was essentially on par with the Netherlands, reaching 0.7 MTPA in 2018 – the most for a non-European market since the United States re-exported 1.1 MTPA in 2011.
Although there were no new markets that re-exported LNG cargoes in 2018, France’s Dunkirk regasification terminal generated its first re-export cargoes in early 2018. Japan and the Dominican Republic both produced their first re-exports in 2017 via the Sodeshi and Andres terminals, respectively. The Andres terminal also added the capability to re-export small-scale volumes to terminals in the Caribbean region. As of February 2019, 28 terminals in 15 different markets have reloading capabilities. Other facilities, such as Cove Point in the US, have been authorized to re-export but decided not to pursue this option as they have instead focused on adding liquefaction capacity. Terminals with multiple jetties have the ability to complete
trans-shipments and deliver bunkering services, such as the Montoir-de-Bretagne (France) terminal. Multiple terminals in Europe such as GATE, Barcelona, and Cartagena have been offering this functionality for ships as small as 500 cm.
Though volumes currently remain small, the transportation and industrial sector is expected to provide growth in the LNG market over the long term. Multiple receiving facilities have developed
Market Terminal Reloading Capability Storage (mcm) No. of Jetties Start ofRe-Exports
Mexico Costa Azul N/A 320 1 2011
Netherlands GATE 10 mcm/h 540 3 2013
Portugal Sines 3.0 mcm/h 390 1 2012
Singapore Singapore 8.0 mcm/h 564 2 2015
S. Korea Gwangyang N/A 530 1 2013
Spain Cartagena 7.2 mcm/h 587 2 2011
Spain Huelva 3.7 mcm/h 620 1 2011
Spain Mugardos 2.0 mcm/h 300 1 2011
Spain Barcelona 3.5 mcm/h 760 2 2014
Spain Bilbao 3.0 mcm/h 450 1 2015
Spain Sagunto 6.0 mcm/h 600 1 2013
Spain El Musel 6.0 mcm/h 300 1 N/A
UK Isle of Grain Ship-dependent 960 1 2015
USA Freeport 2.5 mcm/h* 320 1 2010
USA Sabine Pass 2.5 mcm/h* 800 2 2010
USA Cameron 2.5 mcm/h* 480 1 2011
*Lithuania also began re-exports in 2017, but these were small-scale and thus not included in this report. **For Huelva, re-loading capabilities began in 1997 with internal re-loadings within Spain. ***Reloading capacity permitted by the US DOE.Sources: IHS Markit, IGU
bunkering and truck loading capabilities. France’s Fos Cavaou terminal is set to add LNG bunkering services beginning in 2019. Poland has also announced plans to add a second jetty at the Swinoujscie terminal to allow for bunkering and trans-shipments. In addition, small-scale consumption has increased, reaching isolated demand pockets outside of the primary pipeline infrastructure. Spain has demonstrated the use of intermodal LNG International Organisation for Standardisation (ISO) container transport through truck, train, and ship.
Submarine Pipeline - Courtesy of KOGAS

78 79
LNG Receiving Terminals
As of February 2019, nearly 85% of existing terminals were located onshore. Although the ratio of onshore to offshore terminals has been shifting toward the latter in recent years, five of the seven terminals that began operations in 2018 were onshore developments. This was largely caused by onshore additions to established markets in Asia, including China and Japan. However, only seventeen of the twenty-nine terminals under construction as of early 2019 are listed as onshore proposals. The addition of FSRUs has provided a pathway for a number of new markets to join the global LNG market throughout the last few years, including Bangladesh in 2018 (see Figure 6.9). Out of the thirty-six existing LNG import markets in February 2019, sixteen had FSRU capacity, and five of those had onshore capacity as well. Five FSRU projects were under construction and have announced plans to come online by end-2019, totalling 15.4 MTPA. These include the new markets of Russia (Kaliningrad) and Jamaica (which currently imports LNG via small-scale regasification capacity), as well as Bangladesh, the United States (Puerto Rico), and India. Furthermore, multiple under-construction projects for FSRUs are being planned for start-up in 2020-2021, particularly in Ghana, El Salvador, and Croatia, all of which would be new import markets. Beyond those three, Australia, Côte D’Ivoire, Cyprus, China (Hong Kong), Ireland, Lebanon, Myanmar, Namibia, Nigeria, South Africa, and Sudan have all proposed FSRU projects in order to join the global LNG market. Nevertheless, there are still several new importers that have announced plans to enter the LNG market using onshore proposals to establish a more permanent solution for gas imports such as Bahrain, Morocco, the Philippines, and Vietnam. Notably, Germany has proposed both onshore and FSRU regasification concepts in its efforts to join the global LNG market.
Two new floating terminals began operations in 2018: Turkey’s 4.1 MTPA Dortyol terminal and Bangladesh’s 3.8 MTPA Moheshkali (Petrobangla) terminal, the latter market’s first regasification terminal. However, four terminals had their FSRUs leave port in 2018 as their services were no longer required, highlighting the inherent flexibility of deploying FSRUs. After their charters ended, Bahia Blanca in Argentina, Guanabara Bay in Brazil, Ain Sokhna Hoegh in Egypt, and Abu Dhabi in the United Arab Emirates all had FSRUs leave port with no clear intentions of chartering a replacement vessel in the near term. Combined, the departure of the FSRUs at the four terminals reduce active floating regasification capacity by 16.6 MTPA. Furthermore, while the Golar Igloo left Kuwait’s Mina al-Ahmadi terminal at the end of 2018 as the charter expired, it is expected that a replacement vessel will be chartered in the near term as Kuwait requested a charter extension into 2020. As of January 2019, total active floating import capacity stood at 80.1 MTPA at 20 terminals (see Figure 6.10). However, two new FSRU projects had FSRUs in place starting in December 2018 with operations expected to begin in early 2019: Kaliningrad in Russia and Old Harbour in Jamaica.
6.7COMPARISON OF FLOATING AND ONSHORE REGASIFICATION
6.7
6.8
6.9
Japan, 18.7, 29%South Korea, 12.6, 20%China, 9.2, 14%Spain, 3.3, 5%United States, 3, 5%India, 2.1, 3%United Kingdom, 2.1, 3%France, 1.4, 2%Chinese Taipei, 1.2, 2%Indonesia, 1, 2%Turkey, 0.9, 1%Mexico, 0.9, 1%Singapore, 0.8, 1%Thailand, 0.6, 1%
Netherlands, 0.5, 1%Chile, 0.5, 1%Italy, 0.5, 1%Canada, 0.5, 1%Malaysia, 0.5, 1%Portugal, 0.4, 1%Belgium, 0.4, 1%Smaller Markets*, 2.7, 4%
25
20
15
10
5
0
Number of Terminals
Conventional Q-Flex Q-Max
Africa Asia Asia Pacific Europe LatinAmerica
MiddleEast
NorthAmerica
50
45
40
35
30
25
20
15
10
5
0
Number of Countries
2000
2001
2002
2003
2004
2005
2006
2007
2008
2009
2010
2011
2012
2013
2014
2015
2016
2017
2018
2019
2020
2021
2022
2023
2024
Onshore-only importers Both onshore & FSRU FSRU-only importers
Forecast
Figure 6.9: Rise of FSRUs among Import Markets, 2000-2024
Figure 6.10: Floating Regasification Capacity by Status and Number of Terminals, 2005-2024
Note: The above graph only includes importing markets that had existing or under-construction LNG import capacity as of end-2018. Owing to short construction timelines for regasification terminals, additional projects that have not yet been sanctioned may still come online in the forecast period. The decrease in number of markets with receiving terminals is due to the expiration of FSRU charters, although new FSRU charters may be signed during this period.Sources: IHS Markit, Company Announcements
Note: The above forecast only includes floating capacity sanctioned as of end-2018. Owing to short construction timelines for FSRUs, additional projects that have not yet been sanctioned may still come online in the forecast period. The decrease in floating capacity is due to the expiration of FSRU charters, although new FSRU charters may be signed during this period. Sources: IHS Markit, Company Announcements
6.10
120
100
80
60
40
20
0
30
25
20
15
10
5
0
MTPA
2005
2006
2007
2008
2009
2010
2011
2012
2013
2014
2015
2016
2017
2018
2019
2020
2021
2022
2023
2024
Total chartered Floating Terminals (right)Existing FID
Forecast
IGU World LNG report - 2019 Edition
On the other hand, onshore terminals also deliver a number of benefits over floating regasification terminals, depending on the market’s specific requirements. Storage and send-out capacities can be of strategic importance in many markets, and onshore terminals typically provide the opportunity for larger storage tanks and expansions. Floating regasification can also face several potential location-based risks that are avoided by onshore projects, such as a longer LNG deliverability downtime, vessel performance, and heavy seas or meteorological conditions. Bangladesh’s FSRU faced a number of these challenges in reaching full operations in 2018, as start-up was delayed several months due to technical and infrastructure challenges, as well as rough seas during monsoon season. FSRUs also may experience limitations or challenges with onloading capacities that many onshore terminals can circumvent. In addition, depending on the location, onshore projects can permit future on-site regasification and storage expansion plans.
After a surge in FSRUS over the past two decades, the demand for new floating capacity may be nearing a balancing point. While multiple new markets continue to add or plan to develop FSRUs in order to join the global LNG market, other markets have allowed FSRU charters to expire as capacity was no longer required. Furthermore, several markets have even completely abandoned FSRU proposals in favour of onshore developments as their demand increases. For more information on FSRU activity and uses, please refer to Chapter 9: Floating LNG.
Twelve FSRUs (with capacities over 60,000 cubic meters) were announced to be on the order book, including conversion orders, as of February 2019. In addition, multiple FSRUs were open for charter around the same time, indicating sufficient near-term floating regasification capacity. Furthermore, as some floating terminal projects have been delayed or cancelled, the number of FSRUs being used as conventional carriers has increased. With multiple FSRUs ordered on a speculative basis, there is ample near-term FSRU capacity, leading some FSRU developers to slow down their buildout aspirations. Nonetheless, the value of bringing a new import market online quickly is set to grow over time as the global LNG market expands. The number of proposed floating projects is steadily rising and reaching historic highs, underlining the perceived importance of FSRUs in supporting new LNG markets.
Onshore terminals and FSRUs each provide distinct benefits and drawbacks for regasification terminal utilisation. These factors are very reliant on specific target market requirements and conditions, and will vary on a case-by-case basis. In recent years, several first-time importing markets have all joined the global LNG market through the addition of floating regasification, including Bangladesh, Egypt, Jordan, Pakistan, Abu Dhabi, and Colombia. FSRUs can be brought online faster than onshore terminals, allowing for faster fuel switching. This can be important for new markets that aim to satisfy potential near-term gas demand growth. With FSRUs often chartered from third parties, offshore terminals are typically less capital-intensive than onshore developments and can often be completed via faster permitting processes. In many cases, FSRUs allow for greater flexibility in choosing a desired location for a regasification terminal with fewer space constraints and limited onshore construction requirements. FSRUs also provide flexibility to terminal operators to release the vessel if regasification capacity is no longer required, as observed in Argentina, Brazil, Egypt, and the United Arab Emirates in 2018.
Onshore Terminals FSRUs
Provides a more permanent solution
Allows for quicker fuel switching
Offers longer-term supply security
Greater flexibility if there are space constraints or no useable ports
Greater gas storage capacity
Requires less capital expenditures (CAPEX)
Requires lower operating expenditures (OPEX)
Depending on location, fewer regulations
Option for future expansions
Table 6.2: Benefits of Onshore Regasification Terminals and FSRUs.
LNG Schneeweisschen - Courtesy of DSME

80 81
LNG Receiving Terminals
Regasification terminal developers must often confront multiple difficulties in completing proposed terminal plans, some of which are different than those facing prospective liquefaction plant developers. Regasification developers can mitigate some of these risks when choosing a development concept, based on the advantages and disadvantages of floating and onshore terminal approaches. Both FSRUs and onshore developments are tasked with circumventing comparable risks in order to move forward. However, unlike onshore terminals, FSRUs may be chartered on a short or medium-term basis and be later redeployed to serve a different market. The extent to which the economics of regasification projects work are often a combination of the ability to take on risk, or mitigate risks, as well as the ability to add or extract value from parts of the chain.
Risks and factors that determine economic and commercial viability of regasification projects include:
Project and equity financingHistorically, projects have faced delays as a result of financing challenges. These challenges can arise from the perceived risk profile of the partners, of the market in which the project is to be located, as well as of the capacity owners. Creditworthiness of parties involved will determine the ability to get financing, however, aggregators and traders can to some extent help take on these risks and lower the perceived liabilities to the bank.
Regulatory and fiscal regimeNew regasification terminals can face significant delays in markets with complicated government approval processes or lengthy permit authorization periods. New terminals can also be hampered by the lack of an adequate regulatory framework or by detrimental fiscal regimes. Some markets also have incumbents with strong control over infrastructure and import facilities, which despite liberalisation trajectories, gives them some control over capacity and profitability of parties looking to participate in that market.
Challenging site-related conditionsIn specific geographical areas, technical conditions and/or environmental conditions can lead to additional costs, delays or cancellations of regasification projects. An examples is weather disturbances that cause construction delays.
Reliability and liquidity of contractors and engineering firmsDuring the construction process, financial and regulatory issues with contractors or construction companies can lead to project delays or
6.8RISKS TO PROJECT DEVELOPMENT
even equity partners pulling out of the project all together. Part of this responsibility lies with the contractor – to ensure documentation and applications are prepared in time, but also with governments, to set clear and efficient processes, and communicate these clearly. Examples of delays have been caused by visa delays, and delays in approvals of permits due to in-complete submissions.
Securing long-term regasification and offtake contractsTerminal capacity holders and downstream consumers will need to be contracted for an FID to be taken, particularly as the market shifts toward shorter-term contracting. For the development of new terminals, political support could be needed if long-term commitments are not secured. Parties need to agree a sharing of some of the remaining risks when not all capacity or offtake has been contracted in time for a competitive investment decision. Uncertainty in demand outlook, or significant unexpected changes in the demand outlook will cause delays or cancellation of regasification projects. Increased scalability of regasification facilities will help to some extent.
Access to downstream market and availability of downstream infrastructurePipelines or power plant construction that are required to connect a terminal with end-users are often separate infrastructure projects that are not planned and executed by the terminal owners themselves. The misalignment of timelines between the projects, or lack of infrastructure development downstream of the terminal can cause under-utilization of facilities or delays in start-up.
5354
5814
77
76 4861
84
134
120
3935
1110
35662
65
99
71
78
59
100
66
68
52
42
22
63
8940
4375
121
2160
135
1 5123
73
4 94
118
106
36
28 4713
112
387
111,
114
, 124
113
119
64 72
128
112 41
88 98
4513
2
108
79 90 101 81
30
122 44
38 9
19
102
25, 2
910
4 2450
632
8, 1
5, 3
71816, 3
42,
7,
116
13010
933
, 11511
0
82
1783
97 4620
,27
3112
127
91107
133
9349
103
266986
80
9596 12
910
5 57 67 9213
555 12
685
117
74
125
Figu
re 6
.12:
Glo
bal L
NG
Rec
eivi
ng T
erm
inal
Loc
atio
ns
Not
e: T
erm
inal
num
bers
cor
resp
ond
to A
ppen
dix
III: T
able
of L
NG
Rec
eivi
ng T
erm
inal
s.So
urce
: IH
S M
arki
t
IGU World LNG report - 2019 Edition
UGCC - Courtesy of KOGAS

82 83
1 3 42
The LNG Industry in Years Ahead
The 4 FIDs seen in 2018 (Corpus Christi LNG Train 3, LNG Canada, Greater Tortue FLNG and Tango FLNG) demonstrate that parties take FIDs on the basis of different risk appetites – not all those projects were underpinned by long term offtake agreements at the time of FID. This trend is likely to continue in 2019, and the industry may see that parties who do not require external financing to develop facilities, will be able to proceed without long term agreements in place. This means that contracting progress is not the only indication of progress towards FID.
Another aspect that will shape appetite for new project sanctioning in 2019 is that new market entrants in LNG export from Canada and Africa are intending to take advantage of the increasing commoditization of LNG and trade to diverse markets including China, India and other developing economies. Indeed, these events may portend a restart of liquefaction investment to meet what is expected to be a redeveloping gap in supply to meet growing demand in the mid-2020s.
For example, the scale and aggressive timeline of the LNG Canada project may be the first indication of a move toward rapid development of Western Canada LNG projects to take advantage of the expected continued growth in the Chinese gas market, and world demand growth generally, and to respond to other exporters interested in capturing this growth. Current projects underway and existing capacities will be strained into the early 2020s, and while several significant global players will be on track for capacity expansion to meet this expected continuing demand growth, renewed opportunities for green field projects are expected to emerge. For Western Canada and Alaska, proximity to the Chinese market has particular attraction for accelerated development of projects there.
Another aspect that will drive appetite for FIDs is perceived competitiveness of supplies out of projects. Brownfield developments, and those with access to low cost upstream gas have been able to demonstrate progress in 2018 that could position them for an FID in 2019. Progress in late 2018 and early 2019 on contracting supplies out of Mozambique and other new entrants suggests that momentum on new liquefaction development is proceeding, at least in certain regions and particularly in Africa where new natural gas supplies and needs to monetize those supplies represent distinct opportunities for national governments. Timing of these development interests and expectations in developing market needs for additional supplies appear to be in alignment to justify new projects.
Will the 4 FIDs taken in 2018 spur a new wave of liquefaction investment to come on line post 2023?
7.The LNG Industryin Years Ahead
LNG export from Russia is poised to grow significantly and perhaps challenge Australia and Qatar for global leadership in liquefaction capacity. The opening up of the Arctic as a frontier LNG export region, and the ability to export LNG through the Northern Sea route mean LNG from Russia can now reach more markets competitively.
After a slow start to developing Russia’s frontier Arctic region, building upon its experience with its Yamal facility, Novatek is rolling out a strategy with an eye to expanding Russian Arctic production to a scale mirroring Qatar’s export business, with completion of Arctic LNG 2. The intent is to bring this additional capacity on line by 2023 or earlier, assuming an FID will be taken in 2019. This scale of LNG production in the Arctic may be the start of a new wave of LNG, after Arctic production historically struggled to demonstrate that it could overcome the numerous challenges of running liquefaction facilities and operating carriers in the Arctic.
While current contracting is mostly long-term and oil index-priced, that approach may change as new Arctic capacity is brought on line with players who have the ability to take some of the offtake risk. Novatek forecasts for capacity additions with completion of all trains planned for Yamal and Arctic LNG 2, plus existing capacity at Sakhalin among other projects, would place it as the leading exporter of LNG, surpassing its current rank as fourth in world liquefaction capacity.
Technical aspects of Arctic development will remain key drivers for capacity expansion, notably exploitation of the Northern Sea Route through use of ice-class LNG carriers and trans-shipment technologies and strategies. Russian LNG, long thought to be plays for the Northern European market, may turn out to have longer reach into higher demand markets, including China with the opening up of the Northern Sea route for LNG.
A potential constraint for further LNG export development from Russia may come from Russia’s international trade in pipeline natural gas. Russia’s pipeline projects to China, including the Altai Pipeline and Power of Siberia projects, may develop into gas-to-gas competition within the Russian export market and slow further LNG project activity.
What will be the role of Russia in future LNG supply? How will build out of the LNG
carrier fleet proceed?What factors will influence Chinese LNG demand?
Orders for new LNG carriers are the highest they have been since 2014, edged on by high spot charter rates, relatively low new build costs, and robust transportation growth. Builders, having been careful to avoid over-building until recently, have been unable to resist these incentives for new vessels, which are going to new market entrants as well as established LNG market participants. Along the way, new builders have also entered the market. Incentives to construct new LNG carriers are such that at least one-third of the vessel order book do not have any clear charter business, meaning they are speculative builds.
Older vessels continue to hold value as LNG carriers, where some may have thought their futures were as conversions to FSRUs and other vessel types. Decommissioning and scrapping of LNG carriers has not kept pace in retiring potentially obsolete vessels to make way for new vessels. Some laid up capacity has resumed operation as charter rates have become higher. Increase in new builds will incentivize scrapping older vessels, but as U. S. exports ramp up and needs to serve longer routes increase, these older vessels may play a renewed role in the trade.
While ice class vessel orders have been predicted to increase during the next few years due to the increased production of LNG in the Arctic region, the need for regular LNG carriers will also increase, This is to keep pace with the increased amount of trans-shipment operations in the Northern seas, to shorten the routes of the ice class vessels due to their lower max speed. This would also increase the demand for new modern LNG carriers with properties better adjusted for safe and sustainable trans-shipment operations.
Upward pressure on new build prices is being observed after several years of stability due to vessel supplies and moderated LNG demand. Those underlying conditions are changing, however, and have put upward pressure on prices. Ultimately, charter rates will also be influenced by Basin imbalances, use of swaps to maintain balances, vessel availability, and digitalization of trade data.
Recent moderation of growth in the Chinese economy, caused by a variety of factors, is likely to have short-term impacts on LNG demand growth. However, as the Chinese economy continues to modernize and replace coal and other energy resources with natural gas, LNG will continue to be the principal dynamic and balancing energy resource in China. Fundamentals for the Chinese economy and prospects for growth are expected to remain strong over the long run, especially as domestic Chinese consumer incomes and consumption patterns increase.
The pace of governmental efforts to switch out coal-fired power generation for natural gas-fired generation will continue to have a major impact upon LNG demand. In recent years, expansion of coal-fired generation has occurred at the expense of potential increased use of natural gas-fired generation, but this trend was principally determined by regional power needs and associated location of generation assets. As China builds out its natural gas infrastructure, switching to natural gas-fired generation may accelerate in these regional power markets.
Gas-to-gas competition in China has yet to emerge in any significant way, but as domestic production takes on a greater role, and more importantly pipeline imports of natural gas from Russia, LNG will have to compete for emerging energy demand. The impact of these sources and the rate of their deployment, too, will depend upon how fast the Chinese natural gas infrastructure is expanded.
IGU World LNG report - 2019 Edition

84 85
5 6 7 8 9
The LNG Industry in Years Ahead
Sanctioning and implementation of FSRU projects will continue to play an important role in energy delivery, especially in new markets for natural gas, used to either repower electrical generation or meet general consumer energy needs. Of course, an FSRU deployment strategy is likely to face limits in economically-efficient energy market expansions, and governments and energy industry players need to consider where a transition to full scale, land-based LNG import terminals is warranted.
It is expected that small-scale floating systems growth will be used to support power generation and, specifically, as gas-to-power integrated units. This application is likely to dominate the roll-out of small-scale floating systems since they can provide the most cost-effective means of simultaneously addressing repowering of electrical systems and integrating the fuel delivery and supply function when switching to natural gas. As discussed in this report, gas-to-power strategies represent one of the most vibrant areas of technological development since projects need to simultaneously address challenges of LNG storage, floating regasification technologies, vessel design, and regulatory classification and siting.
Small-scale floating projects are likely to emerge as a niche solution to various issues in energy demand, such as industrial customers requiring stable and high-compositional quality natural gas, isolated markets and to address various regulatory and logistical limits on pipeline supplies. New technologies, such as those discussed earlier in this report and including containerized delivery of LNG, are expected to play a greater role in these niche opportunities. Many of these niches might never grow in scale to support traditional land-based terminal operations, and in many areas continuing regulatory challenges may continue to hamper onshore terminal construction. As a result, continuing innovation to serve these markets is likely to receive great attention.
According to many climate scientists, methane from natural processes and industrial emissions may represent a powerful contributor to total greenhouse gas (GHG) atmospheric concentrations and climate change. As international accords on climate change enter the implementation stage with respect to industrial emissions of GHGs, increasing attention to the natural gas chain as a source of methane emissions is inevitable. Accurate data on actual natural gas emission rates and underlying emissions will continue to play a role in developing international, national, and local policies regarding emission controls in the near term. However, it is clear the LNG industry as a significantly-growing segment of the natural gas chain will have to assume a more direct role in assessing its contribution to methane emissions and prepare to take steps to reduce emissions wherever possible.
It is in the direct economic interest of the LNG industry to reduce methane emissions as a portion of its natural gas throughput, toward a target of zero emissions. For LNG plant operators, having sustainable and low-emitting facilities go hand-in-hand with good operating practices. Going forward, the LNG industry needs to communicate clearly to public stakeholders about these complementary interests while it continues to develop monitoring technologies to assess the extent of facility emissions and control strategies to deal with known emission sources.
It is clear that natural gas presents significant environmental advantages as a fossil fuel, and LNG supports that environmental advantage in meeting world energy needs. The LNG industry must continue to advocate its case for use in the world energy mix and distinguish its environmental performance from other energy forms and industries. Also, the LNG industry must continue to develop new approaches to address the source of its feedstock as a means of addressing methane emissions. “Bio-LNG,” discussed later in this chapter as a new technological effort offering promise, is one such approach.
Beyond more traditional LNG operations, methane emissions from internal combustion engines known as “methane slip”, as part of total hydrocarbon emissions, is gaining increased scrutiny from stakeholders looking at LNG’s contribution to atmospheric methane from human sources. This source is most important in the use of LNG as a marine vessel fuel. Also, vessel bunkering operations involving the connection and disconnection of fueling lines is seen by some parties as an issue. Both of these sources of methane from LNG might be expected to grow as LNG vessels become more common in shipping. However, technologies to minimize these sources are on the horizon and need to be deployed to help move towards expansion of the LNG vessel fleet.
The restart of some idled Japanese nuclear power stations has initially resulted in a significant decline in LNG demand as shown in data for 2018, but the pace of decline in the future is difficult to predict. A plan issued by Japan’s Ministry of Energy, Trade and Industry (METI) includes a continued role for natural gas in Japan’s energy mix. The role for natural gas role in the long-term is not as clear, as growth in renewable energy has also been significant. Nuclear plant restarts coupled with other pressures on LNG demand, including increases in end use energy efficiency and increasing requirements for reducing carbon fuel use to meet climate goals, may perpetuate declines in LNG demand.
Energy policies in Korea have had similar effects as they grapple with regulatory reforms and contingencies such as the potential to import pipeline supplies from Russia. Collectively, these pressures have led to a decline in Northeast Asian LNG demand growth. However, with the phasing out of nuclear power in South Korea and Chinese Taipei, the gap in energy supply sources suggests a continuing role for LNG and perhaps growth in LNG demand. It is unclear whether the experience of Japan involving increased energy efficiency and renewable energy growth will be experienced in these markets.
What will be the role of small-scale floating receiving terminal capacity?
What is the future for nuclear power generation in Northeast Asia and how will it impact LNG?
How will international efforts to limit methane emissions as part of greenhouse gas reduction strategies affect LNG?
What innovations and technologies will be needed to support further development of LNG?
What changes and influences might support faster roll out of LNG bunkering projects?
Innovations in commercial aspects of the traditional LNG chain are needed to accomplish more equitable risk allocation among market participants, including producers, shippers, consumers, and governments. Today, imbalances in the risks facing new projects, in particular, create impediments to project development and execution. For example, with respect to new liquefaction projects, risks associated with offtake for project developers may continue to impose crucial disincentives to projects. Going forward, a need exists to develop collaborative models for commercial agreements involving commercial interests, the banking industry and governmental authorities (including local as well as national governments). Local regulatory and incentives, in particular, present opportunities to expedite LNG project development. Positive approaches at this level should be promoted.
In terms of technologies, increased flexibility to produce and accept various compositional specifications of LNG is needed to enhance market liquidity and competitiveness of LNG generally compared to other primary energy forms. This will require greater levels of capital expenditure at export facilities and receiving terminals, but expiries of long term supply contracts may provide an important opportunity to time projects to accomplish this. Increased digitalization of the industry would also contribute to greater competitiveness by improving plant efficiencies and lowering plant operating costs.
Over the longer run, technologies and efficiencies will need to address methane emissions from the LNG value chain. Energy efficiency of existing operations and in new plants will play a key role in reducing overall carbon emissions, while carbon capture and utilization approaches further reduce the carbon footprint of LNG. It is anticipated the biogas and its utilization to produce “bio-LNG” will play a role in the future, and while up to this point having been seen as a very long-term opportunity, its development could accelerate as carbon emissions control programs are implemented.
Under current bunker fuel market conditions, the costs of alternatives to high-sulfur fuels and emission mitigation approaches give LNG an advantage for meeting IMO-driven emissions regulations. In the future, regulation of oxides of nitrogen in vessel emissions will play a role, but sulfur emissions criteria will dominate decision making regarding bunker fuels. A key factor in this emissions limit-based driver for the bunkering market will be adherence to the current IMO timetables, especially as deadlines for compliance approach in critical markets such as the Mediterranean Sea and inland waterways covered by local governmental administration of the IMO limits.
Real and potential barriers to more rapid development of LNG bunkering include a lack of a clear regulatory framework for facilities, equipment, and port operations, including vessel maneuvering. These fundamental safety-related needs have been addressed regionally, as in Europe, and on a piecemeal basis, as in North America. However, since many potentially LNG-fueled vessels cross jurisdictional boundaries, greater consistency in technology and operations practices is needed. Greater development and adoption of International Standards Organization (ISO) requirements is needed to alleviate these impediments to growth. However, many jurisdictions will need to go further with coordination of facility and port requirements to help ensure that safe operation of LNG-fueled vessels is maintained.
Beyond ISO and jurisdictional rule developments, standards development organizations (SDOs) have stepped forward to initiate other consensus-based standards for bunkering facilities and those may be adopted outside of jurisdictions that traditionally refer to ISO standards. These standards-development activities, while needing to be consistent with ISO coverage, should be encouraged to support more rapid deployment of bunkering technologies.
With respect to technology development, bunkering could be accelerated by greater design consistency of fueling equipment and practices, development of more modular and scalable approaches to meet growing fleet needs, and development of consistent fuel quality standards and storage that meet both the needs of engine manufacturers and fuel suppliers.
IGU World LNG report - 2019 Edition

86 87
8.Small scale and LNG bunkering with special emphasis on ship to ship bunkering
Increasing environmental regulation worldwide, and locally in Europe, the US, and China, makes LNG a natural fuel of choice in a variety of sectors, including power generation, industrial use, and marine transportation. However, the adoption of LNG as fuel depends on an efficient, secure and competitive LNG supply chain and related infrastructure.
A specific small-scale market focus on bunkering LNG to ships, that have the ability to use LNG as fuel, has developed in the last few years. Ship to ship (STS) and truck to ship bunkering therefore seems to be an obvious requirement for the adoption of LNG as fuel for ships globally.
Although the LNG bunkering market developed early in 2002 regionally in Norway, to deliver this new bunker fuel to small ships, such as platform supply vessels, fishing vessels and coastal ferries, the environmental regulations put in place by international and local regulatory bodies are driving shipowners to build new ships or convert the existing ones to LNG fuel, displacing other bunker fuels.
Many LNG bunkering projects have been developed based on truck to ship or tank to ship installation years before the scheduled entry into force of the International Maritime Organization (IMO) ban to burn fuels on board of ships with sulphur content higher than 0.5%, and thanks to the availability of LNG in regions that have been directly affected by local regulations to prevent air pollution such as Europe and the USA.
These days the bunker capacity of new projects, especially newbuilds, also requires larger capacity LNG bunkers, which makes delivery of fuel from a significant number of LNG trailers commercially less attractive.
There has been a clear evolution since the first LNG bunkering projects of few thousands of cubic meters to the recent ultra large container ships ordered by CMA-CGM with a total LNG fuel capacity of 18,600 cm.
LNG ship to ship (STS) bunkering has been based on a large number of STS transfers in the LNG carrier segment, and this was first developed in the port of Stockholm between the SEAGAS bunkering barge (180 cm capacity) and a large ferry ship, the Viking Grace, in 2013. This is a project with a high frequency of bunkering operations, considering that the ferry has a 24 h sailing time between Stockholm and Turku. There is limited storage on board the ferry - two tanks each of approximately 200 cm. This project is a very specific example of LNG Bunkering since the SEAGAS barge is not being loaded at a small-scale LNG terminal but by trucks in another location of Stockholm port, the trucks being loaded in the Swedish small-scale LNG terminal of Brunnsviksholmen (Nynäshamn), in operation since 2011. Another specificity of this project is that the bunkering barge is a conversion of an old coastal ferry, imposing limitations to achieve a bespoke LNG bunkering ship, such as the LNG tank capacity for instance.
Coralius - Courtesy of Sirius Shipping
Small scale focus on LNG bunkering
Small scale LNG carriers built in European, Japanese and Chinese yards have entered into service since the early nineties with capacities ranging from 1,000 to 20,000 cm, but none have been specifically designed and built for STS LNG bunkering operations. The list of such small-scale ships is included here below.
Table 8.1 Small-scale LNG vessels
IMO No. Name Builder Shipowner CAP. (m3) Delivery
9275074 PIONEER KNUTSEN Biljma Knutsen 1100 2004
9675200 KAKUYU MARU Higaki Zosen K.K. Tsurumi Sunmarine Co Ltd 1500 2013
9260603 SHINJU MARU NO. 1 Higaki Zosen K.K. Shinwa Chemical Co. 2500 2003
9317200 NORTH PIONEER Shin Kurushima Dockyard Co. Ltd. Iino Gas Transport 2500 2005
9433884 SHINJU MARU NO. 2 Higaki Zosen K.K. Shinwa Chemical Co. 2500 2008
9469235 KAKUREI MARU Higaki Zosen K.K. Tsurumi Sunmarine Co Ltd 2500 2008
9554729 AKEBONO MARU Higaki Zosen K.K. Chuo Kaiun KK 3500 2011
9625140 CORAL ANTHELIA Avic Dingheng Anthony Veder 6500 2013
9378278 NORGAS INNOVATION Taizhou Wuzhou Shipbuilding Industry Co Norgas Carriers 10000 2010
9378280 NORGAS CREATION Taizhou Wuzhou Shipbuilding Industry Co Norgas Carriers 10000 2010
9378292 NORGAS INVENTION Taizhou Wuzhou Shipbuilding Industry Co Norgas Carriers 10000 2011
9378307 NORGAS CONCEPTION Taizhou Wuzhou Shipbuilding Industry Co Norgas Carriers 10000 2011
9468437 NORGAS UNIKUM Avic Dingheng Shipbuilding Co Ltd Norgas Carriers 12000 2011
9468449 BAHRAIN VISION Avic Dingheng Shipbuilding Co Ltd Norgas Carriers 12000 2011
9738569 HUA XIANG 8 Jiangsu Qidong Fengshun HI Zhejiang Huaxiang Shipping 14000 2016
9617698 CORAL ENERGY Meyer Werft Anthony Veder 15600 2013
9783124 CORAL ENERGICE Neptun Werft Anthony Veder 18000 2018
9161510 AMAN HAKATA NKKK Tsu MISC 18800 1998
9016492 LUCIA AMBITION (Ex-AMAN BINTULU) NKKK Tsu MISC 18928 1993
9134323 AMAN SENDAI NKKK Tsu MISC 18928 1997
9349942 SUN ARROWS KHI MOL 19100 2007
9060534 SURYA AKI KHI Humpuss Consortium 19474 1996
9187356 TRIPUTRA (Ex-SURYA SATSUMA) NKKK Tsu Humpuss
Consortium 23096 2000
9685425 JS INEOS INSIGHT Nantong Sinopacific Offshore EVERGAS 27500 2015
9685437 JS INEOS INGENUITY Nantong Sinopacific Offshore EVERGAS 27500 2015
9685449 JS INEOS INTREPID Nantong Sinopacific Offshore EVERGAS 27500 2015
9685451 JS INEOS INSPIRATION Nantong Sinopacific Offshore EVERGAS 27500 2016
9744958 JS INEOS INNOVATION Nantong Sinopacific Offshore EVERGAS 27500 2016
9744960 JS INEOS INDEPENDENCE Nantong Sinopacific Offshore EVERGAS 27500 2017
9771511 JS INEOS INVENTION Jiangsu New Yangzi EVERGAS 27500 2017
9771523 JS INEOS INTUITION Jiangsu New Yangzi EVERGAS 27500 2017
9693719 XINLE 30 Ningbo Xinle Shipbuilding Zhejiang Yuanhe Shpg Co Ltd 30000 2018
9696266 HAI YANG SHI YOU 301 Jiangnan Shipyard Group Co Ltd Offshore Oil Yangjiang Ent 30720 2015
IGU World LNG report - 2019 Edition

88 89
The first real purpose design and built ship, capable of these types of LNG bunkering operations, is the Engie Zeebrugge. The 5,100 cm ship, delivered by Hanjin Heavy Industries to a joint venture of Engie, NYK, Mitsubishi Corporation and Fluxys in 2017, entered into operation early that year to deliver the bunker to car carriers in the port of Zeebrugge. Managed by NYK, the ship is also expected to deliver LNG fuel to other ports in the region, as the demand for LNG is increasing significantly.
Immediately following this development, others such as the 6,500 cm Cardissa, the 5,800 cm Coralius, and more recently the 7,500 cm Kairos have entered into service in Northern Europe, which has been pioneering commissioning of these type of projects. This makes sense considering the proximity to LNG terminals and the fact that some of these terminals have been also modified to provide LNG to small scale ships such as the Gate terminal in Rotterdam. The Cardissa will be operated in Rotterdam port, the Coralius at the entrance of the Baltic sea and the Kairos inside the
Baltic. Loading terminals and clients to receive the bunker fuel are different case by case.
Another interesting development has been the conversion and upgrading of ships to enable LNG bunkering. Examples in this category are the Coral Methane and the Oizmendi. The Coral Methane is a small-scale LNG carrier of 7,500 cm delivered by Remontowa shipyard to Anthony Veder, which was recently upgraded to give the required flexibility to deliver LNG to gas fuelled ships. Minor adaptations of the LNG transfer system and the installation of a sub-cooling system for the LNG were considered in 2018. The ship is expected to be operated in Rotterdam port.
The second example is the Oizmendi, a HFO/MDO bunkering tanker which was converted in the first half of 2018, into a multifuel bunker ship; including two LNG tanks on the main deck to provide just 660 cm by STS. The ship will cover bunkering operations in the Iberian Peninsula.
Table 8.2: Active bunkering ships, newbuilt or conversions:
IMO No. Name_of_Ship Builder Shipowner CAP. (m3) Delivery
7382691 SEAGAS Loland Verft AS AGA GAS AB 180 1974
9494981 OIZMENDI Cardama Itsas Gas Bunker Supply 660 2009
9404584 CORAL METHANE Remontowa Anthony Veder 7500 2009
9750024 ENGIE ZEEBRUGGE Hanjin H.I. LNG Link Investment AS 5000 2017
9769128 CORALIUS Royal Bodewes Sirius Veder AB 5800 2017
9765079 CARDISSA STX Offshore & Shbldg - Jinhae
Shell Western LNG BV 6500 2017
9819882 KAIROS HMD Babcock Schulte Energy 7500 2018
The above list does not contain a 2,200 cm bunkering barge (non-propelled unit) built in the US, specifically for LNG bunkering of TOTE containerships. This was built locally in the COMRAD shipyard with membrane Mark III technology, the first ever of this type.
Among the twelve newbuild projects confirmed at the end of 2018, capacities range from 3,500 to 18,600 cm.
The technology typically installed in this new generation of ships for LNG containment is the type C cylindrical. Membrane technology also appears to be of interest in some new projects, when cargo capacity under discussion is above 10,000 cm: the first and largest ever LNG bunkering ship presently under construction at Hudong-Zhongua shipyard in China for MOL, will be equipped with 2 LNG Mark III flex containment systems with a total capacity of 18,600 cm.
The above being said, considering port limitations and ship manoeuvrability, it seems reasonable to assume that the cargo capacity of new LNG bunkering ships will likely be kept below 10,000 cm in most cases. This would lead to an increased number of LNG bunkering operations when taking into account the expected demand of LNG as fuel.
In terms of engine and propulsion solutions, dual-fuel engines (for propulsion and electrical generation) and conventional propellers could well be the choice for small ships. This is largely driven by environmental regulations and previous experiences in the LNG carrier segment with different technologies. However, in some specific cases azimuthal propulsion will lead to increased manoeuvrability and reduced collision risks during operations inside ports. In addition, transversal propellers have been installed in most cases where the LNG bunkering ship is not equipped with azimuthal propulsion.
Different LNG transfer systems have been proposed for existing or on-order LNG Bunkering ships. Most of the designs have considered flexible hoses handled by cargo hose cranes and
suitable emergency release couplings (ERC) and quick connection/disconnection couplings (QCDC) which offer safe connections to prevent LNG leaks. However, a tailor-made LNG transfer system was installed on board of the Cardissa LNG bunkering ship, based on an LNG loading arm suitably designed for LNG bunkering operations.
With regards to the evolution of shore small scale LNG installations that can provide bunker fuel, these are wide spread in Europe and the USA, and progressively being constructed in other parts of the world.
Small-scale LNG production and regasification facilities in Norway, which facilitate the distribution of LNG to bunkering stations, ships or trucks, include those located at Tjeldbergodden, Kollsnes, Karmøy, Øra and Risavika, with Statoil, Skangass and Shell (Gasnor) being the main developers.
In particular, the Risavika plant south of Stavanger is the newest liquefaction facility in Norway, and possibly the most important in terms of bunkering because of its storage capacity (30,000 cm). Small- scale LNG carriers use this facility with great regularity and some LNG bunkering operations have already been carried out terminal to ship.
Storage and bunkering stations already in operation include: Naturgass Møre in Alesund, Sunndalsøra (Gasnor-Shell), Høyanger, Mosjøen, Ågotness Coast Centre Base (CCB), Halhjem terminal, and Florø (Saga Fjordbase). Many of these have already been used for truck-to-ship or shore-to-ship LNG bunker operations. In addition, Skangass secured a permit early in 2014 to build a dedicated LNG bunkering station in Risavika for the Fjord Line ferries operating between Stavanger, Bergen and Hirtshals (Denmark). This bunker facility was commissioned in June 2015.
As mentioned above, AGA commissioned the Brunnsviksholmen (Nynäshamn) regasification terminal, located South of Stockholm, in 2011. Also in Sweden, the Coralius ship is used to load at Lysekil and deliver the bunker fuel at the entrance to the Baltic Sea.
Small scale focus on LNG bunkering
Pacific Breeze - Courtesy Of Inpex
Gothenburg port has already confirmed that it is heavily involved in the development of LNG bunkering facilities and bunkering procedures.
Some new LNG import terminals were commissioned in Finland. As an example, Skangass chose the Western Finnish port of Pori as the location for its first LNG import terminal. The Northern Tornio Manga LNG-receiving terminal unloaded its first shipment of LNG back in November 2017, taking delivery of a 15,000 cm cargo delivered from the Skangas-chartered Coral Energy small scale LNG carrier.
A more recent operation linked to the LNG bunkering market took place in January 2019 from the FSRU Independence in Lithuania to the LNG bunkering ship Kairos.
Shore to ship bunkering operations have already been carried out in Hirtshals (Denmark) for Fjordline ferry ships operating between Norway and Denmark.
Various plans to build LNG bunkering stations have been reported elsewhere in recent months, mainly in Northern Europe. In particular, the Rotterdam and Zeebrugge LNG terminals currently have specific small-scale facilities to load such small ships. Grain LNG terminal East of London is studying different options for the implementation of break-bulk facilities, to be able to reload small-scale LNG carriers and supply LNG to trucks. France, Spain, Italy and Greece are developing projects as well. In Spain, adjustments have been made to the LNG terminal of Barcelona to be able to handle both large and small-scale vessels, and in Cartagena studies of transshipment operations in the port have been undertaken. In the USA, infrastructure is available in Port Fourchon for Harvey Gulf platform support vessels and Jacksonville, for truck to ship and soon ship to ship, using the COMRAD built barge. At least two more articulated tug barges are under construction, of 4,000 and 8,000 cm capacity respectively. LNG bunkering of Carnival cruise ships in Florida is also foreseen.
Outside the USA and Europe, infrastructure for LNG is available in many locations such as the Middle East, Singapore, Malaysia, Japan, China, South Korea and Australia, demonstrating that small scale infrastructure development is progressing. As an example of
the developments in these markets, Excelerate Energy at Jebel Ali in Dubai is able to deliver bunker fuel through an LNG bunkering manifold on board of the FSRU. Similarly, China is presently building its first national LNG bunkering ship project for ENN Energy, and Japan is developing a project for Central LNG Shipping.
The evolution of the gas fuel fleet has been slow, but large ships are expected to be delivered from 2020. At the end of 2018 a total number of 140 ships using LNG as fuel were in service, with over 160 ships on order, including at least 35 large tonnage ships. These include ultra large container ships, ore carriers and aframax tankers.
Although global small-scale production is estimated at around 25 MTPA with potential for growth of more than 6% per year, a figure slightly above ten percent of the global production is forecasted to be used as a bunker fuel in 2020, i.e. in the range of 3 MTPA. As an example, Total and CMA CGM have signed an agreement covering the supply of around 0.3 MTPA of LNG per year for a period of 10 years starting in 2020, when nine ultra large container ships presently under construction are scheduled to be delivered. Further predictions are that by 2030 a figure of slightly above 25 MTPA will be dedicated to LNG as marine bunker fuel.
Further regional small scale markets will be developed because of new local regulations. As an example, virtual LNG pipelines have been already developed in Portugal and USA. Both are based on ISO containerized transportation of LNG by ship. The Gaslink project in Portugal between the Sines and Lisbon ports and Madeira Island is in operation since 2014, and has transported an average 25 containers per week. In March, Hawaii Gas received approval from the Hawai‘i Public Utilities Commission (PUC) to use LNG in limited quantities as a backup fuel for its O‘ahu synthetic natural gas operations. Its first shipment of containerized LNG arrived in April. In addition, Hawaiian Electric reached a deal with Fortis B. C. to import up to 0.8 MTPA of LNG for 15 years starting in 2017. Other terrestrial virtual pipeline projects have been developed involving transportation of ISO LNG containers by ship, train and truck. In Spain, a multimodal transport pilot project was completed at the beginning of 2018, consisting of transporting an ISO container of LNG from the LNG terminal in Huelva in Spain by road, rail and ship to Melilla.
IGU World LNG report - 2019 Edition

90 91
9.Floating LNG
Shell Prelude - Courtesy of Shell
Floating LNG
There are two different applications of floating LNG (FLNG): floating, production, storage and offloading units (LNG FPSO); and floating, storage and regasification units (FSRU). FLNG facilities are a relatively new concept, with very few in operation today, but it is realising its potential, with different technology solutions for different developments. FSRU concepts have been deployed regularly and successfully around the world over the last 10 years; advantages can include speed and affordability/scalability when local demand is small or new, and development of an onshore terminal is challenging.
IGU World LNG report - 2019 Edition

92 93
LNG FPSO
LNG FPSO have traditionally been referred to as FLNG, and there are few applications in the world to date. In fact, these concepts are small scale applications in any case, with production capacities ranging from 0.5 to 3.6 MTPA. LNG FPSO have been discussed for decades, since the first concept of a barge was developed in the fifties. There are several arguments to support the development of LNG FPSO – for instance, the development of offshore gas fields with no pipeline connection to shore, limitations for LNG carriers to access a waterfront facility or difficulties in developing an onshore terminal.
Recently, different concepts involving newbuild units and conversions have been developed. Although LNG FPSO are not usually considered fast track projects, an advantage is that the units can be relocated. The relocation may however involve modifications to the gas treatment facilities, liquefaction facilities, anchoring and other systems. An LNG FPSO facility is usually built in a shipyard, which allows for cost savings when compared to the construction of a conventional onshore liquefaction terminal.
Offshore LNG FPSO facilities may be exposed to harsh met ocean
conditions. The concepts are usually equipped with weather-vaning anchoring and dynamic position systems. Such type of LNG FPSO will also require LNG offloading based on ship to ship (units moored alongside) or tandem configurations.
Units operated in more protected areas, such as near to shore or near ports, are used to produce LNG from onshore gas and eventually maybe offshore gas, supplied by a short pipeline. The locations have relatively benign water conditions since they are usually not exposed to open seas. Because they are located near shore, transfer of personnel and equipment is easier, and the accommodation and service facilities on board can therefore be limited, reducing the total CAPEX of the installation. In addition, the mooring equipment may be similar to a permanent mooring system for a floating installation or ship into a jetty which also reduces the cost of the construction and installation.
Very few LNG FPSO have been converted LNG carriers, the main advantage being the time required for the commissioning of the unit. A conversion project in most of cases will require less capital cost and will involve shorter time schedules, making it suitable for an area where a fast fuel switch is required. On the other hand, new build units can be tailor made, designed for a specific gas field and prepared to be relocated.
Market Developer Project MTPA cm Start-Up
Malaysia Petronas PFLNG Satu,Kanowit Field 1.2 354,000 2017
Australia Shell Prelude 3.6 437,500 2018
Cameroon SNH/Perenco/Golar LNG Kribi (Golar Hilli) 1.2 125,000 2018
Equatorial Guinea1 Ophir Fortuna (Golar Gandria) 2.2 125,000 2019
Malaysia Petronas PFLNG2, Rotan Field 1.5 177,000 2020
Mozambique ENI Coral South 3.4 230,000 2020
Argentina2 Exmar Tango FLNG 0.5 16,500 2019
Senegal BP Greater Tortue 2.4 125,000
Note: Sources IGU Work Report “FLNG Concepts. Facts and Differentiators” dated June 2018 and others
Nowadays only three units, the Malaysia “PFLNG Satu”, Shell “Prelude” and “Golar Hilli” are in operation. The other units are either under construction or under conversion.
Floating LNG
FSRU3
After more than 10 years of operations, FRSU solutions are considered a proven and reliable solution. FSRUs are also flexible since relocation after a period of operation in a single location is highly feasible. FSRUs have been seen as an advantageous alternative to onshore terminals, with the main benefits being the reduced cost and easier implementation. For instance, regulatory approvals may be less time consuming due to the lesser environmental impact. In addition, units just for storage - so called floating storage units - have been deployed in different locations as the storage tank construction period onshore is lengthy in comparison to a ship or floater construction at a specialized shipyard. Floating storage units, in combination with onshore regas or other small-scale applications such as ship to ship LNG offloading, are presently used as well. A conventional onshore terminal on the other hand, compared to any type of floating solution, has a greater gas storage capacity. This offers long-term supply security for the market and therefore provides a more permanent solution, while an FSRU can be classified as a more temporary solution.
Since regasification terminals are typically close to the consumers, the FSRU’s are often installed inside a port or within a protected marine area. Indeed, near shore applications have been the common approach for FSRU because there are many advantages with regards to mooring systems and short distances to the gas grid or gas power plant. In addition, the design of the unit takes into consideration the mild met ocean conditions of the area as compared to an offshore location with a harsh sea environment.
The first FSRU was a newbuilt ship of 138,000 cm constructed by DSME (South Korea) for Excelerate, designed to offload gas on open sea conditions. This unit, delivered in 2005, was followed by other similar newbuilds which were equipped with the same type of regasification and mooring system, based on an internal turret and offloading buoy for the gas, which is connected to a subsea pipeline. This concept is still used in few locations and is called the “Gateway” concept. Another feature of this concept was that the units were weather-vaning moored to the buoy only during the offloading operations, typically less than ten days, and then disconnected and returned to the export LNG terminal to take another cargo.
Soon after this FSRU concept, jetty moored solutions were
typically used in ports or protected areas, including rivers in South America, Europe and the Middle East.
Furthermore, the first FSRU vessel conversion was commissioned in 2008, followed by very few until the last one was commissioned in 2013. Old Moss type LNG carriers were converted for projects in Brazil, Indonesia and Italy for instance. Another more recent example of floating storage unit conversion is the Malta project, commissioned in 2017.
As to the comparison between conversion and newbuilds, CAPEX and OPEX considerations are leading parameters for decisions. Conversion of LNG carriers to FSRU’s used to take less time than newbuilds and had higher feasibility from a CAPEX point of view. On the other hand, new builds may be more flexible and long lasting, and are therefore a particularly interesting solution for mid to long term projects. The limited capacity and the age of the potential candidates to be converted (LNG carriers of 20 to 40 years old, most of them of Moss tanks and steam turbines) in the range of 125,000 to 137,000 cm, may limit the number of FIDs for such types of conversions in the near future. In addition, Moss type LNG carriers may face an issue arranging the regasification facility in the cargo area because of its layout. When compared to an onshore conventional terminal, it generally requires lower operating expenditure (OPEX) than any of the FSRU solutions, but comes with a higher initial investment.
Despite the advantages of FSRU’s versus onshore facilities, it is also clear that there are many challenges - such as a lack of clear local policies and regulations, a lack of infrastructure in remote or less developed markets, and commercial hurdles such as potential fluctuation of LNG demand. An example of the dynamism of the FSRU market is that markets may become exporters from a traditional import position and vice versa - examples being Egypt and Colombia. In some other locations regasification and liquefaction capacities co-exist.
The total FSRU capacity, in terms of regasification, is relevant when compared to global regasification capacity as it represents approximately 15% of the Global LNG regasification capacity. However, the utilization rate is lower, since for instance one third of the total modern fleet is actually operated as LNG carriers (approximately 10 units). Furthermore, it must be noted that to deploy these LNG carriers as import terminals, infrastructure construction would be needed onshore, such as pipeline, jetty, etc.
Under Construction or in Operation LNG FPSO projects
1 Golar Gandria LNG was proposed for conversion, but Ophir has lost the license2 The Exmar Caribbean FLNG will be relocated in Argentina to develop LNG exports
3 Please also refer to 6.7
IGU World LNG report - 2019 Edition

94 95
10.References Used in the 2019 Edition
10.4 ACRONYMS
10.5 UNITS
10.6 CONVERSION FACTORS
BOG = Boil-Off GasCAPEX = Capital ExpendituresCBM = Coalbed methaneCO2 = Carbon DioxideDES = Delivered Ex-ShipDFDE = Dual-Fuel Diesel Electric EPC = Engineering, Procurement and ConstructionEU = European UnionFEED = Front-End Engineering and DesignFERC = Federal Energy Regulatory CommissionFID = Final Investment DecisionFOB = Free On BoardFLNG = Floating LiquefactionFPSO = Floating Production, Storage, and Offloading
bbl = barrelBcfd = billion cubic feet per daybcm = billion cubic meterscm = cubic metersKTPA = thousand tonnes per annum
10.1 DATA COLLECTION
10.3 REGIONS AND BASINS
Data in the 2019 World LNG Report is sourced from a variety of public and private domains, including the BP Statistical Review of World Energy, Cedigaz, the International Energy Agency (IEA), the Oxford Institute for Energy Studies (OIES), the US Energy Information Agency (EIA), the US Department of Energy (DOE), GIIGNL, IHS Markit, company reports and announcements. This report should be read in conjunction with previous World LNG Reports, available on the IGU website at www.igu.org. No representations or warranties, express or implied, are made by the sponsors concerning the accuracy or completeness of the data and forecasts supplied under the report.
The IGU wishes to thank the following organisations and Task Force members entrusted to oversee the preparation and publication of this report:• American Gas Association (AGA), USA: Ted Williams• Australian Gas Industry Trust (AGIT), Australia: Geoff Hunter• Bureau Veritas, France: Carlos Guerrero• Enagás, Spain: Angel Rojo Blanco, Anne Rebecca Samuelsson• GIIGNL, France: Vincent Demoury• IHS Markit: Kelli Krasity, Gautam Sudhakar• KOGAS, S. Korea: Soo Ock Shin, Youngkyun Kim, Sung-pyo Wi• Osaka Gas, Japan: Tamotsu Manabe• Shell: Birthe van Vliet, Chris Hay, Wouter Meiring
The IGU regions referred to throughout the report are defined as per the colour coded areas in the map above. The report also refers to three basins: Atlantic, Pacific and Middle East. The Atlantic Basin encompasses all markets that border the Atlantic Ocean or Mediterranean Sea, while the Pacific Basin refers to all markets bordering the Pacific and Indian Oceans. However, these two categories do not include the following markets, which have been differentiated to compose the Middle East Basin: Bahrain, Iran, Iraq, Israel, Jordan, Kuwait, Oman, Qatar, UAE and Yemen. IGU has also taken into account markets with liquefaction or regasification activities in multiple basins and has adjusted the data accordingly.
LNG Carriers: For the purposes of this report, only Q-Class and conventional LNG vessels with a capacity greater than 30,000 cm are considered part of the global fleet discussed in the “LNG Carriers” chapter (Chapter 5). Vessels with a capacity of 30,000 cm or less are considered small-scale LNG carriers.
Long-term and Spot Charter Rates: Long-term charter rates refer to anything chartered under a contract of five years or above. Sport charter rates refer to anything chartered under a contract of six months or less.
Northeast Asian Spot Prices: Northeast Asian spot prices are calculated based on the observed average price for spot cargoes imported into Japan and South Korea in a given month.
Project CAPEX: Liquefaction plant CAPEX figures reflect the complete cost of building the facilities, including site preparation, gas processing, liquefaction, LNG storage and other related infrastructure costs. Regasification terminal CAPEX figures are based on company announcements and may therefore only include selected infrastructure components.
Short-term, Medium-term and Long-term Trade:• Short-term trade = volumes traded on a spot basis or under contracts of less than 2 years• Medium-term trade = volumes traded under a 2 to <5 year contract• Short- and medium-term trade together comprise non-long-term trade• Long-term trade = volumes traded under a 5+year contract
Traded LNG Volumes: Trade figures are measured according to the volume of LNG imported at the regasification level. Only international trade is taken into account. Domestic LNG trade in Indonesia is thus excluded from the global figures.10.2 DEFINITIONS
Brownfield Liquefaction Project: A land-based LNG project at a site with existing LNG infrastructure, such as: jetties, storage tanks, liquefaction facilities or regasification facilities.
Forecasted Data: Forecasted liquefaction and regasification capacity data only takes into account existing and under construction capacity (criteria being FID taken), and is based on company announced start dates.
Greenfield Liquefaction Project: A land-based LNG project at a site where no previous LNG infrastructure has been developed.
Home Market: The market in which a company is based.
Large-Scale vs. Small-Scale LNG: For the purposes of this report, IGU defines the large-scale LNG industry as every LNG business above 0.5 MTPA of LNG production and/or consumption. Conversely, small-scale LNG is any business under 0.5 MTPA.
Liquefaction and Regasification Capacity: Unless otherwise noted, liquefaction and regasification capacity throughout the document refers to nominal capacity. It must be noted that re-loading and storage activity can significantly reduce the effective capacity available for regasification.
References Used in the 2019 Edition
North AmericaLatin AmericaEuropeAfricaFormer Soviet UnionMiddle EastAsiaAsia Pacific
FSRU = Floating Storage and Regasification UnitFSU = Former Soviet UnionHFO = Heavy Fuel OilHOA = Heads of AgreementIOC = International Oil CompanyIMO = International Maritime OrganisationISO = International Organisation for StandardisationJKT = Japan, South Korea, and Chinese TaipeiME-GI = M-type, Electronically Controlled, Gas InjectionMDO = Marine Diesel OilMOU = Memorandum of UnderstandingNBP = National Balancing Point NIMBY = Not in My Backyard
Tonnes LNG cm LNG mmcm gas mmcf gas MMBtu boe
Tonnes LNG 2.222 0.0013 0.0459 53.38 9.203
cm LNG 0.450 5.85 x 10⁻⁴ 0.0207 24.02 4.141
mmcm gas 769.2 1,700 35.31 4,110 7,100
mmcf gas 21.78 48 0.0283 1,200 200.5
MMBtu 0.0187 0.0416 2.44 x 10⁻⁵ 8.601 x 10⁻⁴ 0.1724
boe 0.1087 0.2415 1.41 x 10⁻⁴ 0.00499 5.8
Multiply by
IGU World LNG report - 2019 Edition
NOC = National Oil CompanyNOX = Nitrogen OxidesNSR = North Sea RouteOPEX = Operating ExpendituresSOx = Sulphur Oxides SPA = Sales and Purchase AgreementSTS = Ship to shipSSD = Slow Speed DieselTFDE = Tri-Fuel Diesel Electric UAE = United Arab EmiratesUK = United KingdomUS = United StatesUS DOE = US Department of EnergyUS GOM = US Gulf of MexicoUS Lower 48 = US excluding Alaska, Hawaii, and Puerto RicoYOY = Year-on-Year
mcm = thousand cubic meters mmcfd = million cubic feet per day mmcm = million cubic metersMMBtu = million British thermal units
MT = million tonnesMTPA = million tonnes per annumnm = nautical milesTcf = trillion cubic feet

96 97
Appendices
Appendix 1: Table of Global Liquefaction Plants Appendix 1: Table of Global Liquefaction Plants (continued)
Reference Number Country Project
Name Start Year Nameplate Capacity (MTPA) Owners* Liquefaction Technology
1 United States Kenai LNG** 1969 1.5 Andeavor ConocoPhillips Optimized Cascade®
2 Libya Marsa El Brega LNG T1-4*** 1970 3.2 LNOC AP-C3MR™
3 Brunei Brunei LNG T1-4 1973 5.76 Government of Brunei, Shell, Mitsubishi AP-C3MR™
3 Brunei Brunei LNG T5 1974 1.44 Government of Brunei, Shell, Mitsubishi AP-C3MR™
4 United Arab Emirates ADNOC LNG T1-2 1977 2.6 ADNOC, Mitsui, BP, TOTAL AP-C3MR™
5 Algeria Arzew - GL1Z T1-6 1978 7.9 Sonatrach AP-C3MR™
5 Algeria Arzew - GL2Z T1-6 1981 8.2 Sonatrach AP-C3MR™
6 Indonesia Bontang LNG T3-4 1983 5.4 Government of Indonesia AP-C3MR™
7 Malaysia MLNG Satu T1-3 1983 8.4 PETRONAS, Mitsubishi, Sarawak State Government AP-C3MR™
8 Australia North West Shelf T1 1989 2.5BHP Billiton, BP, Chevron,
Shell, Woodside, Mitsubishi, Mitsui
AP-C3MR™
8 Australia North West Shelf T2 1989 2.5BHP Billiton, BP, Chevron,
Shell, Woodside, Mitsubishi, Mitsui
AP-C3MR™
6 Indonesia Bontang LNG T5 1990 2.9 Government of Indonesia AP-C3MR™
8 Australia North West Shelf T3 1992 2.5BHP Billiton, BP, Chevron,
Shell, Woodside, Mitsubishi, Mitsui
AP-C3MR™
4 United Arab Emirates ADNOC LNG T3 1994 3.2 ADNOC, Mitsui, BP, TOTAL AP-C3MR™
6 Indonesia Bontang LNG T6 1995 2.9 Government of Indonesia AP-C3MR™
7 Malaysia MLNG Dua T1-3 1995 9.6 PETRONAS, Mitsubishi, Sarawak State Government AP-C3MR™
9 Qatar Qatargas I T1 1997 3.2Qatar Petroleum,
ExxonMobil, TOTAL, Marubeni, Mitsui
AP-C3MR™
9 Qatar Qatargas I T2 1997 3.2Qatar Petroleum,
ExxonMobil, TOTAL, Marubeni, Mitsui
AP-C3MR™
6 Indonesia Bontang LNG T7 1998 2.7 Government of Indonesia AP-C3MR™
9 Qatar Qatargas I T3 1998 3.1Qatar Petroleum,
ExxonMobil, TOTAL, Marubeni, Mitsui
AP-C3MR™
9 Qatar RasGas I T1 1999 3.3Qatar Petroleum,
ExxonMobil, KOGAS, Itochu, LNG Japan
AP-C3MR™
10 Trinidad Atlantic LNG T1 1999 3.3 Shell, BP, CIC, NGC Trinidad ConocoPhillips Optimized Cascade®
11 Nigeria Nigeria LNG T1 2000 3.3 NNPC, Shell, TOTAL, Eni AP-C3MR™
12 Oman Oman LNG T1 2000 3.55
Government of Oman, Shell, TOTAL, Mitsubishi, Mitsui, Partex, KOGAS, Hyundai,
Posco, Samsung, Itochu, SK Group
AP-C3MR™
6 Indonesia Bontang LNG T8 2000 3 Government of Indonesia AP-C3MR™
12 Oman Oman LNG T2 2000 3.55
Government of Oman, Shell, TOTAL, Mitsubishi, Mitsui, Partex, KOGAS, Hyundai,
Posco, Samsung, Itochu, SK Group
AP-C3MR™
9 Qatar RasGas I T2 2000 3.3Qatar Petroleum,
ExxonMobil, KOGAS, Itochu, LNG Japan
AP-C3MR™
11 Nigeria Nigeria LNG T2 2000 3.3 NNPC, Shell, TOTAL, Eni AP-C3MR™
10 Trinidad Atlantic LNG T2 2002 3.5 Shell, BP ConocoPhillips Optimized Cascade®
11 Nigeria Nigeria LNG T3 2003 3 NNPC, Shell, TOTAL, Eni AP-C3MR™
10 Trinidad Atlantic LNG T3 2003 3.5 Shell, BP ConocoPhillips Optimized Cascade®
Reference Number Country Project
Name Start Year Nameplate Capacity (MTPA) Owners* Liquefaction Technology
7 Malaysia MLNG Tiga T1-2 2003 7.7
PETRONAS, Shell, JX Nippon Oil & Energy, Sarawak State
Government, Mitsubishi, JAPEX
AP-C3MR™
9 Qatar RasGas II T1 2004 4.7 Qatar Petroleum, ExxonMobil AP-C3MR/SplitMR®
8 Australia North West Shelf T4 2004 4.6BHP Billiton, BP, Chevron,
Shell, Woodside, Mitsubishi, Mitsui
AP-C3MR™
13 Egypt SEGAS LNG T1*** 2005 5 Union Fenosa Gas, EGAS, EGPC AP-C3MR/SplitMR®
13 Egypt Egyptian LNG T1 2005 3.6 PETRONAS, Shell, EGAS, EGPC, TOTAL
ConocoPhillips Optimized Cascade®
9 Qatar RasGas II T2 2005 4.7 Qatar Petroleum, ExxonMobil AP-C3MR/SplitMR®
13 Egypt Egyptian LNG T2 2005 3.6 PETRONAS, Shell, EGAS, EGPC
ConocoPhillips Optimized Cascade®
12 Oman Qalhat LNG 2006 3.7
Government of Oman, Shell, Mitsubishi, Eni, Naturgy,
Itochu, Osaka Gas, TOTAL, Mitsui, Partex, KOGAS,
Hyundai, Posco, Samsung, SK Group
AP-C3MR™
10 Trinidad Atlantic LNG T4 2006 5.2 Shell, BP, NGC Trinidad ConocoPhillips Optimized Cascade®
11 Nigeria Nigeria LNG T4 2006 4.1 NNPC, Shell, TOTAL, Eni AP-C3MR™
11 Nigeria Nigeria LNG T5 2006 4.1 NNPC, Shell, TOTAL, Eni AP-C3MR™
14 Australia Darwin LNG T1 2006 3.7 ConocoPhillips, Santos, INPEX, Eni, JERA, Tokyo Gas
ConocoPhillips Optimized Cascade®
9 Qatar RasGas II T3 2007 4.7 Qatar Petroleum, ExxonMobil AP-C3MR/SplitMR®
15 Equatorial Guinea EG LNG T1 2007 3.7 Marathon, GEPetrol, Mitsui,
MarubeniConocoPhillips Optimized
Cascade®
16 Norway Snøhvit LNG T1 2008 4.2 Equinor, Petoro, TOTAL, ENGIE, LetterOne Linde MFC®
11 Nigeria Nigeria LNG T6 2008 4.1 NNPC, Shell, TOTAL, Eni AP-C3MR™
8 Australia North West Shelf T5 2008 4.6BHP Billiton, BP, Chevron,
Shell, Woodside, Mitsubishi, Mitsui
AP-C3MR™
9 Qatar Qatargas II T1 2009 7.8 Qatar Petroleum, ExxonMobil AP-X®
17 Russia Sakhalin-2 T1 2009 5.4 Gazprom, Shell, Mitsui, Mitsubishi Shell DMR
17 Russia Sakhalin-2 T2 2009 5.4 Gazprom, Shell, Mitsui, Mitsubishi Shell DMR
9 Qatar RasGas III T1 2009 7.8 Qatar Petroleum, ExxonMobil AP-X®
9 Qatar Qatargas II T2 2009 7.8 Qatar Petroleum, ExxonMobil, TOTAL AP-X®
18 Indonesia Tangguh LNG T1 2009 3.8
BP, CNOOC, JX Nippon Oil & Energy, Mitsubishi, INPEX,
KG Berau, Sojitz, Sumitomo, Mitsui
AP-C3MR/SplitMR®
19 Yemen Yemen LNG T1*** 2009 3.6TOTAL, Hunt Oil, Yemen
Gas Co., SK Group, KOGAS, Hyundai, GASSP
AP-C3MR/SplitMR®
18 Indonesia Tangguh LNG T2 2010 3.8
BP, CNOOC, JX Nippon Oil & Energy, Mitsubishi, INPEX,
KG Berau, Sojitz, Sumitomo, Mitsui
AP-C3MR/SplitMR®
9 Qatar RasGas III T2 2010 7.8 Qatar Petroleum, ExxonMobil AP-X®
19 Yemen Yemen LNG T2*** 2010 3.6TOTAL, Hunt Oil, Yemen
Gas Co., SK Group, KOGAS, Hyundai, GASSP
AP-C3MR/SplitMR®
20 Peru Peru LNG T1 2010 4.45 Hunt Oil, Shell, SK Group, Marubeni AP-C3MR/SplitMR®
9 Qatar Qatargas III 2010 7.8 Qatar Petroleum, ConocoPhillips, Mitsui AP-X®
9 Qatar Qatargas IV 2011 7.8 Qatar Petroleum, Shell AP-X®
IGU World LNG report - 2019 Edition

98 99
Appendices
Appendix 1: Table of Global Liquefaction Plants (continued)
Sources: IHS Markit, Company Announcements* Companies are listed by size of ownership stake, starting with the largest stake.** Andeavor acquired Kenai LNG from ConocoPhillips in January 2018. The plant has not exported cargoes since 2015, and future exports are uncertain.*** SEGAS LNG in Egypt has not exported since the end of 2012. Yemen LNG has not exported since 2015 due to an ongoing civil war. The Marsa El Brega plant in Libya is included for reference although it has not been operational since 2011.
Sources: IHS Markit, Company Announcements* Companies are listed by size of ownership stake, starting with the largest stake.** Greater Tortue FLNG 1 and Golden Pass LNG T1-3 had reached FID but not yet begun construction as of February 2019.
Reference Number Country Project
Name Start Year Nameplate Capacity (MTPA) Owners* Liquefaction Technology
21 Australia Pluto LNG T1 2012 4.9 Woodside, Kansai Electric, Tokyo Gas
Shell propane pre-cooled mixed refrigerant design
5 Algeria Skikda - GL1K Rebuild 2013 4.5 Sonatrach AP-C3MR™
22 Angola Angola LNG T1 2014 5.2 Chevron, Sonangol, BP, Eni,
TOTALConocoPhillips Optimized
Cascade®
23 Papua New Guinea PNG LNG T1 2014 3.45
ExxonMobil, Oil Search, Kumul Petroleum, Santos, JX Nippon Oil & Energy, MRDC,
Marubeni, Petromin PNG
AP-C3MR™
23 Papua New Guinea PNG LNG T2 2014 3.45
ExxonMobil, Oil Search, Kumul Petroleum, Santos, JX Nippon Oil & Energy, MRDC,
Marubeni, Petromin PNG
AP-C3MR™
5 Algeria Arzew - GL3Z 2014 4.7 Sonatrach AP-C3MR/SplitMR®
24 Australia Queensland Curtis LNG T1 2015 4.25 Shell, CNOOC ConocoPhillips Optimized
Cascade®
24 Australia Queensland Curtis LNG T2 2015 4.25 Shell, Tokyo Gas ConocoPhillips Optimized
Cascade®
25 Indonesia Donggi Senoro LNG 2015 2 Mitsubishi, Pertamina,
KOGAS, Medco AP-C3MR™
26 Australia GLNG T1 2016 3.9 Santos, PETRONAS, TOTAL, KOGAS
ConocoPhillips Optimized Cascade®
27 Australia Australia Pacific LNG T1 2016 4.5 ConocoPhillips, Origin
Energy, SinopecConocoPhillips Optimized
Cascade®
28 United States Sabine Pass LNG T1 2016 4.5 Cheniere, Blackstone ConocoPhillips Optimized
Cascade®
26 Australia GLNG T2 2016 3.9 Santos, PETRONAS, TOTAL, KOGAS
ConocoPhillips Optimized Cascade®
28 United States Sabine Pass LNG T2 2016 4.5 Cheniere, Blackstone ConocoPhillips Optimized
Cascade®
29 Australia Gorgon LNG T1 2016 5.2 Chevron, ExxonMobil, Shell,
Osaka Gas, Tokyo Gas, JERA AP-C3MR/SplitMR®
29 Australia Gorgon LNG T2 2016 5.2 Chevron, ExxonMobil, Shell,
Osaka Gas, Tokyo Gas, JERA AP-C3MR/SplitMR®
7 Malaysia MLNG T9 2017 3.6PETRONAS, JX Nippon Oil & Energy, PTT, Sarawak State
GovernmentAP-C3MR/SplitMR®
27 Australia Australia Pacific LNG T2 2017 4.5 ConocoPhillips, Origin
Energy, SinopecConocoPhillips Optimized
Cascade®
28 United States Sabine Pass LNG T3 2017 4.5 Cheniere, Blackstone ConocoPhillips Optimized
Cascade®
29 Australia Gorgon LNG T3 2017 5.2 Chevron, ExxonMobil, Shell,
Osaka Gas, Tokyo Gas, JERA AP-C3MR/SplitMR®
28 United States Sabine Pass LNG T4 2017 4.5 Cheniere, Blackstone ConocoPhillips Optimized
Cascade®
30 Australia Wheatstone LNG T1 2018 4.45
Chevron, KUFPEC, Woodside, JOGMEC,
Mitsubishi, Kyushu Electric, NYK, JERA
ConocoPhillips Optimized Cascade®
31 Russia Yamal LNG T1 2018 5.5 Novatek, CNPC, TOTAL, Silk Road Fund AP-C3MR™
32 United States Cove Point LNG 2018 5.25 Dominion AP-C3MR/SplitMR®
33 Cameroon Kribi FLNG 2018 2.4 Golar LNG, Keppel, Black & Veatch Black & Veatch PRICO®
30 Australia Wheatstone LNG T2 2018 4.45
Chevron, KUFPEC, Woodside, JOGMEC,
Mitsubishi, Kyushu Electric, NYK, JERA
ConocoPhillips Optimized Cascade®
31 Russia Yamal LNG T2 2018 5.5 Novatek, CNPC, TOTAL, Silk Road Fund AP-C3MR™
14 Australia Ichthys LNG T1 2018 4.45
INPEX, TOTAL, CPC, Tokyo Gas, Kansai Electric, Osaka
Gas, JERA, Toho GasAP-C3MR/SplitMR®
31 Russia Yamal LNG T3 2019 5.5 Novatek, CNPC, TOTAL, Silk Road Fund AP-C3MR™
Appendix 2: Table of Liquefaction Plants Santioned or Under Construction
Country Project Name Start Year Nameplate Capacity (MTPA) Owners*
Indonesia Senkang LNG T1 2019 0.5 EWC
United States Elba Island LNG T1-6 2019 1.5 Kinder Morgan, EIG Global Energy Partners
Australia Prelude FLNG 2019 3.6 Shell, INPEX, KOGAS, CPC
Australia Ichthys LNG T2 2019 4.45 INPEX, TOTAL, CPC, Tokyo Gas, Kansai Electric, Osaka Gas, JERA, Toho Gas
Russia Vysotsk LNG T1-2 2019 0.66 Novatek, Cryogas
Argentina Tango FLNG 2019 0.5 YPF
United States Cameron LNG T1 2019 4 Sempra, Mitsubishi/NYK JV, Mitsui, TOTAL
United States Corpus Christi LNG T1 2019 4.5 Cheniere
United States Freeport LNG T1 2019 5.1 Freeport LNG, JERA, Osaka Gas
United States Sabine Pass LNG T5 2019 4.5 Cheniere, Blackstone
Russia Portovaya LNG 2019 2 Gazprom
United States Cameron LNG T2 2019 4 Sempra, Mitsubishi/NYK JV, Mitsui, TOTAL
United States Elba Island LNG T7-10 2019 1 Kinder Morgan, EIG Global Energy Partners
United States Corpus Christi LNG T2 2019 4.5 Cheniere
Russia Yamal LNG T4 2019 0.94 Novatek, CNPC, TOTAL, Silk Road Fund
United States Freeport LNG T2 2020 5.1 Freeport LNG, IFM Investors
United States Cameron LNG T3 2020 4 Sempra, Mitsubishi/NYK JV, Mitsui, TOTAL
Indonesia Tangguh LNG T3 2020 3.8BP, CNOOC, JX Nippon Oil & Energy, Mitsubishi, INPEX, KG Berau, Sojitz,
Sumitomo, Mitsui
Malaysia PFLNG Dua 2020 1.5 PETRONAS
United States Freeport LNG T3 2020 5.1 Freeport LNG
United States Corpus Christi LNG T3 2021 4.5 Cheniere
Mozambique Coral South FLNG 2022 3.4 Eni, ExxonMobil, CNPC, ENH, Galp Energia, KOGAS
Mauritania-Senegal Greater Tortue FLNG 1** 2022 2.5 BP, Kosmos Energy, Petrosen, SMHPM
Canada LNG Canada T1 2024 7 Shell, PETRONAS, CNPC, Mitsubishi, KOGAS
United States Golden Pass LNG T1** 2024 5.2 ExxonMobil, Qatar Petroleum
United States Golden Pass LNG T2** 2024 5.2 ExxonMobil, Qatar Petroleum
Canada LNG Canada T2 2025 7 Shell, PETRONAS, CNPC, Mitsubishi, KOGAS
United States Golden Pass LNG T3** 2025 5.2 ExxonMobil, Qatar Petroleum
IGU World LNG report - 2019 Edition

100 101
Appendix 3: Table of LNG Receiving Terminals
Existing as of February 2019
Reference Number Market Terminal Name Start Year
Nameplate Receiving Capacity (MTPA)
Owners* Concept
1 Spain Barcelona 1969 12.5 ENAGAS 100% Onshore
2 Japan Negishi 1969 12.0 TEPCO 50%; Tokyo Gas 50% Onshore
3 US Everett 1971 5.4 ENGIE 100% Onshore
4 Italy Panigaglia 1971 2.6 GNL Italia 100% Onshore
5 France Fos Tonkin 1972 2.2 ENGIE 100% Onshore
6 Japan Senboku 1972 15.3 Osaka Gas 100% Onshore
7 Japan Sodegaura 1973 29.4 TEPCO 50%; Tokyo Gas 50% Onshore
8 Japan Chita LNG Joint 1977 8.0 Chubu Electric 50%; Toho Gas 50% Onshore
9 Japan Tobata 1977 6.8 Kitakyushu LNG 100% Onshore
10 US Cove Point 1978 11.0 Dominion 100% Onshore
11 US Elba Island 1978 12.4 KM LNG Operating Partnership 100% Onshore
12 Japan Himeji 1979 13.3 Osaka Gas 100% Onshore
13 France Montoir-de-Bretagne 1980 7.3 ENGIE 100% Onshore
15 Japan Chita LNG 1983 12.0 Chubu Electric 50%; Toho Gas 50% Onshore
16 Japan Higashi-Ohgishima 1984 14.7 TEPCO 100% Onshore
17 Japan Nihonkai LNG Niigata 1984 8.9 Nihonkai LNG 58.1%; Tohoku Electric 41.9% Onshore
18 Japan Futtsu 1985 16.0 TEPCO 100% Onshore
19 South Korea Pyeongtaek 1986 41.0 KOGAS 100% Onshore
20 Japan Yokkaichi LNG Center 1987 7.1 Chubu Electric 100% Onshore
21 Belgium Zeebrugge 1987 6.6 Publigas 89.97%; Fluxys 10.03% Onshore
22 Spain Huelva 1988 8.6 ENAGAS 100% Onshore
23 Spain Cartagena (Spain) 1989 8.6 ENAGAS 100% Onshore
24 Japan Oita 1990 5.1 Kyushu Electric 100% Onshore
25 Japan Yanai 1990 2.4 Chugoku Electric 100% Onshore
26 ChineseTaipei Yongan 1990 9.5 CPC 100% Onshore
27 Japan Yokkaichi Works 1991 0.7 Toho Gas 100% Onshore
28 Turkey Marmara Ereglisi 1994 7.6 Botas 100% Onshore
29 Japan Hatsukaichi 1996 0.7 Hiroshima 100% Onshore
30 South Korea Incheon 1996 53.6 KOGAS 100% Onshore
31 Japan Sodeshi 1996 1.6 Shizuoka Gas 65%; TonenGeneral 35% Onshore
32 Japan Kawagoe 1997 7.7 Chubu Electric 100% Onshore
33 Japan Sendai-Shin Minato Works 1998 0.5 Sendai City Gas 100% Onshore
34 Japan Ohgishima 1998 6.7 Tokyo Gas 100% Onshore
35 US Peñuelas 2000 1.2 Gas Natural Fenosa 47.5%; ENGIE 35%; Mitsui 15%; GE Capital 2.5% Onshore
36 Greece Revithoussa 2000 4.8 DEPA 100% Onshore
37 Japan Chita Midorihama Works 2001 8.3 Toho Gas 100% Onshore
38 South Korea Tongyeong 2002 26.6 KOGAS 100% Onshore
39 Dominican Republic Andrés 2003 1.9 AES 92%; Estrella-Linda 8% Onshore
40 Spain Bahia de Bizkaia Gas 2003 5.1 ENAGAS 50%; EVE 50% Onshore
41 India Dahej 2004 15.0 Petronet LNG 100% Onshore
42 Portugal Sines 2004 5.7 REN 100% Onshore
43 UK Grain 2005 14.8 National Grid Transco 100% Onshore
44 South Korea Gwangyang 2005 2.3 Posco 100% Onshore
45 India Hazira 2005 5.0 Shell 74%; TOTAL 26% Onshore
46 Japan Sakai 2005 6.4 Kansai Electric 70%; Cosmo Oil 12.5%; Iwatani 12.5%; Ube Industries 5% Onshore
47 Turkey Aliaga 2006 8.0 Egegaz 100% Onshore
48 Mexico Altamira 2006 5.4 Vopak 60%; ENAGAS 40% Onshore
49 China Guangdong 2006 6.8 Local companies 37%; CNOOC 33%; BP 30% Onshore
50 Japan Mizushima 2006 1.7 Chugoku Electric 50%; JX Nippon Oil & Energy 50% Onshore
51 Spain Saggas (Sagunto) 2006 6.4 ENAGAS 72.5%; Osaka Gas 20%; Oman Oil 7.5% Onshore
52 Spain Mugardos 2007 2.6 Grupo Tojeiro 50.36%; Gobierno de Galicia 24.64%; First State Regasificadora 15%; Sonatrach 10% Onshore
53 Mexico Costa Azul 2008 7.5 Sempra 100% Onshore
54 US Freeport LNG 2008 11.3 Michael S Smith Cos 57.5%; Global Infrastructure Partners 25%; Osaka Gas 10%; Dow Chemical 7.5% Onshore
55 China Fujian 2008 5.0 CNOOC 60%; Fujian Investment and Development Co 40% Onshore
56 US Northeast Gateway 2008 3.0 Excelerate Energy 100% Floating
57 China Shanghai Wuhaogou 2008 0.5 Shanghai Gas Group 100% Onshore
58 US Sabine Pass 2008 30.2 Cheniere Energy 100% Onshore
60 Italy Adriatic 2009 5.8 ExxonMobil 46.35%; Qatar Petroleum 46.35%; Edison 7.3% Offshore
62 Canada Canaport 2009 7.5 Repsol 75%; Irving Oil 25% Onshore
63 UK Dragon 2009 5.5 Shell 50%; PETRONAS 30%; 4Gas 20% Onshore
64 Kuwait Mina Al-Ahmadi 2009 5.8 Kuwait Petroleum Corporation 100% Floating
65 Brazil Pecém 2009 6.0 Petrobras 100% Floating
66 Chile Quintero 2009 4.0 ENAGAS 60.4%; ENAP 20%; Oman Oil 19.6% Onshore
67 China Shanghai 2009 3.0 Shenergy Group 55%; CNOOC 45% Onshore
68 UK South Hook 2009 15.6 Qatar Petroleum 67.5%; ExxonMobil 24.15%; TOTAL 8.35% Onshore
69 Chinese Taipei Taichung 2009 4.5 CPC 100% Onshore
70 Japan Sakaide 2010 0.7 Shikoku Electric 70%; Cosmo Gas 20%; Shikoku Gas 10% Onshore
72 UAE Dubai 2010 6.0 Dubai Supply Authority (Dusup) 100% Floating
73 France Fos Cavaou 2010 6.0 ENGIE 71.5%; TOTAL 28.5% Onshore
Existing as of February 2019
Reference Number Market Terminal Name Start Year
Nameplate Receiving Capacity (MTPA)
Owners* Concept
Appendices
Appendix 3: Table of LNG Receiving Terminals (continued)
IGU World LNG report - 2019 Edition

102 103
74 China Dalian 2011 6.0 CNPC 75%; Dalian Port 20%; Dalian Construction Investment Corp 5% Onshore
75 Netherlands GATE 2011 8.8 Gasunie 40%; Vopak 40%; Dong 5%; EconGas OMV 5%; EON 5%; RWE 5% Onshore
78 Argentina Escobar 2011 3.8 Enarsa 50%; YPF 50% Floating
79 Thailand Map Ta Phut 2011 11.5 PTT 100% Onshore
80 China Jiangsu 2011 6.5 PetroChina 55%; Pacific Oil and Gas 35%; Jiangsu Guoxin 10% Onshore
81 Indonesia Nusantara 2012 3.8 Pertamina 60%; PGN 40% Floating
82 Japan Ishikari 2012 1.4 Hokkaido Gas 100% Onshore
83 Japan Joetsu 2012 2.3 Chubu Electric 100% Onshore
84 Mexico Manzanillo 2012 3.8 Mitsui 37.5%; Samsung 37.5%; KOGAS 25% Onshore
85 China Dongguan 2012 1.5 Jovo Group 100% Onshore
86 Japan Yoshinoura 2012 0.5 Okinawa Electric 100% Onshore
87 Israel Hadera Gateway 2013 3.0 Israel Natural Gas Lines 100% Floating
88 India Ratnagiri 2013 2.0 GAIL 31.52%; NTPC 31.52%; Indian financial institutions 20.28%; MSEB Holding Co. 16.68% Onshore
90 Singapore Singapore 2013 11.0 Singapore Energy Market Authority 100% Onshore
91 Malaysia Sungai Udang 2013 3.8 PETRONAS 100% Onshore
92 China Zhejiang Ningbo 2013 3.0 CNOOC 51%; Zhejiang Energy Group Co Ltd 29%; Ningbo Power Development Co Ltd 20% Onshore
93 China Zhuhai 2013 3.5 CNOOC 30%; Guangdong Gas 25%; Guangdong Yuedian 25%; Local companies 20% Onshore
94 Italy FSRU Toscana 2013 2.7 EON 46.79%; IREN 46.79%; OLT Energy 3.73%; Golar 2.69% Floating
95 China Tangshan 2013 6.5 CNPC 51%; Beijing Enterprises Group 29%; Hebei Natural Gas 20% Onshore
96 China Tianjin (CNOOC) (FSRU) 2013 2.2 CNOOC 100% Floating
97 Japan Naoetsu 2013 2.1 INPEX 100% Onshore
98 India Kochi 2013 5.0 Petronet LNG 100% Onshore
99 Brazil Bahia 2014 3.8 Petrobras 100% Floating
100 Chile Mejillones 2014 1.5 ENGIE 63%; Codelco 37% Onshore
101 Indonesia Lampung 2014 1.8 PGN 100% Floating
102 South Korea Samcheok 2014 11.6 KOGAS 100% Onshore
103 China Hainan 2014 3.0 CNOOC 65%; Hainan Development Holding Co 35% Onshore
104 Japan Hibiki 2014 3.5 Saibu Gas 90%; Kyushu Electric 10% Onshore
105 China Shandong 2014 4.5 Sinopec 99%; Qingdao Port Group 1% Onshore
106 Lithuania Klaipeda 2014 3.0 Klaipedos Nafta 100% Floating
107 China Hainan Shennan 2014 0.6 CNPC 90%; Beijing Gas Blue Sky Holdings Ltd. 10% Onshore
108 Indonesia Arun LNG 2015 3.0 Pertamina 70%; Aceh Regional Government 30% Onshore
109 Japan Hachinohe 2015 1.6 JX Nippon Oil & Energy 100% Onshore
110 Japan Kushiro 2015 0.5 JX Nippon Oil & Energy 100% Onshore
112 Pakistan Elengy 2015 3.8 Engro Corp. 100% Floating
113 Jordan Aqaba 2015 3.8 Jordan Ministry of Energy and Mineral Resources (MEMR) 100% Floating
115 Japan Shin-Sendai 2015 1.7 Tohoku Electric 100% Onshore
116 Japan Hitachi 2016 1.8 Tokyo Gas 100% Onshore
117 China Beihai 2016 3.0 Sinopec 100% Onshore
118 Poland Swinoujscie 2016 3.6 GAZ-SYSTEM SA 100% Onshore
120 Colombia Cartagena (Colombia) 2016 3.0 Promigas 51%; Baru LNG 49% Floating
121 France Dunkirk 2017 9.5 EDF 65%; Fluxys 25%; TOTAL 10% Onshore
122 South Korea Boryeong 2017 3.0 GS Group 50%; SK Group 50% Onshore
123 Turkey Etki 2017 5.3 Etki Liman Isletmeleri Dolgalgaz Ithalat ve Ticaret 100% Floating
124 Egypt Sumed BW 2017 5.7 EGAS 100% Floating
125 China Qidong 2017 1.2 Xinjiang Guanghui Petroleum 100% Onshore
126 China Yuedong 2017 2.0 CNOOC 100% Onshore
127 Malaysia RGT2 (Pengerang) 2017 3.5 PETRONAS 65%; Dialog Group 25%; Johor Government 10% Onshore
128 Pakistan PGPC Port Qasim 2017 5.7 Pakistan LNG Terminals Limited 100% Floating
129 China Tianjin (Sinopec) 2018 3.0 Sinopec 98%; Tianjin Nangang Industrial Zone Developemnt Co., Ltd. 2% Onshore
130 Japan Soma 2018 1.3 JAPEX 100% Onshore
131 Turkey Dortyol 2018 4.1 Botas 100% Floating
132 Bangladesh Moheshkhali (Petrobangla) 2018 3.8 Petrobangla 100% Floating
133 China Shenzhen 2018 4.0 CNOOC 70%; Shenzhen Energy Group 30% Onshore
134 Panama Costa Norte 2018 1.5 AES 50%; Inversiones Bahia 50% Onshore
135 China Zhoushan 2018 3.0 ENN Energy 100% Onshore
Existing as of February 2019
Reference Number Market Terminal Name Start Year
Nameplate Receiving Capacity (MTPA)
Owners* Concept
Existing as of February 2019
Reference Number Market Terminal Name Start Year
Nameplate Receiving Capacity (MTPA)
Owners* Concept
Appendix 3: Table of LNG Receiving Terminals (continued)Appendix 3: Table of LNG Receiving Terminals (continued)
Appendices
Source: IHS Markit, Company Announcements
IGU World LNG report - 2019 Edition

104 105
Appendix 4: Table of LNG Receiving Terminals Under Construction Appendix 5: Table of LNG Receiving Terminals with Idle Capacity
Under construction as of February 2019
Reference Number Market Terminal or Phase Name Start Year
Nameplate Receiving Capacity (MTPA)
Owners* Concept
136 India Ennore LNG 2019 5.0 Indian Oil Corporation 45%; Tamil Nadu Industrial Development Corporation 5% Onshore
137 Jamaica Old Harbour 2019 3.6 New Fortress Energy 100% Floating
138 China Shenzhen (Shenzhen Gas) 2019 0.8 Shenzhen Gas 100% Onshore
139 Russia Kaliningrad LNG 2019 3.5 Gazprom 100% Floating
140 Bahrain Bahrain LNG 2019 6.0 NOGA 30%; Teekay Corp 30%; Gulf Investment Corporation (GIC) 20%; Samsung 20% Onshore
141 China Tianjin (CNOOC) (onshore) 2019 2.2 CNOOC 46%; Tianjin Govt 40%; Tianjin Gas Group 9%; Tianjin Hengrongda Investment Company 5% Onshore
142 Bangladesh Moheshkhali (Summit Power) 2019 3.8 Summit Power 75%; Mitsubishi 25% Floating
143 India Jaigarh 2019 4.0 H-Energy 100% Floating
144 India Mundra 2019 5.0 Adani Group 50%; GSPC 50% Onshore
145 US San Juan 2019 0.5 New Fortress Energy 100% Floating
146 China Chaozhou 2019 1.0 Sinoenergy 55%; Huafeng Group 45% Onshore
147 South Korea Jeju Island 2019 1.0 KOGAS 100% Onshore
148 Brazil Sergipe 2020 3.6 Ebrasil 50%; Golar Power 50% Floating
149 India Jafrabad LNG Port 2020 5.0 Exmar 38%; Gujarat Government 26%; Swan Energy 26%; Tata Group 10% Floating
150 Philippines Pagbilao 2020 3.0 Energy World Corporation 100% Onshore
151 China Shenzhen (CNPC) 2020 3.0 CNPC 51%; CLP 24.5%; Shenzhen Gas 24.5% Onshore
152 Ghana GNPC Tema 2020 2.0 Ghana National Petroleum Company (GNPC) 50%; Helios Investment Partners 50% Floating
153 China Jiaxing 2020 1.0 Jiaxing Gas 34%; GCL 33%; Hangzhou Gas 33% Onshore
154 Kuwait Al Zour 2021 11.3 Kuwait Petroleum Corporation 100% Onshore
155 Brazil Port of Acu 2021 5.6 Prumo Logística 100% Floating
156 India Dharma Port 2021 5.0 Adani Group 51%; Indian Oil Corporation 29.4%; GAIL 19.6% Onshore
157 El Salvador Acajutla 2021 0.5 Energía del Pacífico Floating
158 Indonesia Java-1 (Cilamaya) 2021 2.4 Pertamina 26%; Other Companies 25%; Marubeni 20%; MOL 19%; Sojitz 10% Floating
159 China Binhai 2021 3.0 CNOOC 100% Onshore
160 China Wenzhou 2021 3.0 Zhejiang Energy Group Co Ltd 51%; Sinopec 41%; Wenzhou City 8% Onshore
161 Croatia Krk 2021 1.9 Plinacro 50%; HEP 50% Floating
162 Thailand Nong Fab 2022 7.5 PTT 100% Onshore
163 China Longkou (Sinopec) 2022 3.0 Sinopec 100% Onshore
164 China Zhangzhou 2022 3.0 CNOOC 60%; Fujian Investment and Development Co 40% Onshore
Note: Under construction expansion projects at existing terminals are not included in these totals.Source: IHS Markit, Company Announcements
Source: IHS Markit, Company Announcements
Offshore terminals with no chartered FSRUs as of February 2019
Reference Number Market Terminal or Phase Name Start Year
Nameplate Receiving Capacity (MTPA)
Owners* Concept
59 Argentina Bahia Blanca 2008 3.8 YPF 50%; Stream JV 50% Floating
71 Brazil Guanabara Bay 2009 4.8 Petrobras 100% Floating
111 Egypt Ain Sokhna Hoegh 2015 4.2 EGAS 100% Floating
114 Egypt Ain Sokhna BW 2015 5.7 EGAS 100% Floating
119 UAE Abu Dhabi 2016 3.8 ADNOC 100% Floating
Mothballed as of February 2019
Reference Number Market Terminal or Phase Name Start Year
Nameplate Receiving Capacity (MTPA)
Owners* Concept
14 US Lake Charles 1982 17.3 Energy Transfer Equity 100% Onshore
61 US Cameron LNG 2009 11.3 Sempra 50.2%; ENGIE 16.6%; Mitsubishi 16.6%; Mitsui 16.6% Onshore
76 US Golden Pass 2011 15.6 Qatar Petroleum 70%; ExxonMobil 17.6%; ConocoPhillips 12.4% Onshore
77 US Gulf LNG 2011 11.3 KM LNG Operating Partnership 50%; General Electric 40%; AES 10% Onshore
89 Spain El Musel 2013 5.1 ENAGAS 100% Onshore
AppendicesIGU World LNG report - 2019 Edition

106 107
Appendices
Appendix 5: Table of Active Fleet, end-2018
Ship Name Shipowner Shipbuilder Type Delivery Year
Capacity (cm)
Propulsion Type IMO #
AAMIRA Nakilat Samsung Q-Max 2010 260,912 SSD 9443401
ABADI Brunei Gas Carriers Mitsubishi Conventional 2002 135,269 Steam 9210828
ADAM LNG Oman Shipping Co (OSC) Hyundai Conventional 2014 162,000 DFDE 9501186
AL AAMRIYA NYK, K Line, MOL, Iino, Mitsui, Nakilat Daewoo Q-Flex 2008 206,958 SSD 9338266
AL AREESH Teekay Daewoo Conventional 2007 148,786 Steam 9325697
AL BAHIYA Nakilat Daewoo Q-Flex 2010 205,981 SSD 9431147
AL BIDDA J4 Consortium Kawaski Conventional 1999 135,466 Steam 9132741
AL DAAYEN Teekay Daewoo Conventional 2007 148,853 Steam 9325702
AL DAFNA Nakilat Samsung Q-Max 2009 261,988 SSD 9443683
AL DEEBEL MOL, NYK, K Line Samsung Conventional 2005 142,795 Steam 9307176
AL GATTARA Nakilat, OSC Hyundai Q-Flex 2007 216,200 SSD 9337705
AL GHARIYA Commerz Real, Nakilat, PRONAV Daewoo Q-Flex 2008 205,941 SSD 9337987
AL GHARRAFA Nakilat, OSC Hyundai Q-Flex 2008 216,200 SSD 9337717
AL GHASHAMIYA Nakilat Samsung Q-Flex 2009 211,885 SSD 9397286
AL GHUWAIRIYA Nakilat Daewoo Q-Max 2008 257,984 SSD 9372743
AL HAMLA Nakilat, OSC Samsung Q-Flex 2008 211,862 SSD 9337743
AL HAMRA National Gas Shipping Co Kvaerner Masa Conventional 1997 137,000 Steam 9074640
AL HUWAILA Teekay Samsung Q-Flex 2008 214,176 SSD 9360879
AL JASRA J4 Consortium Mitsubishi Conventional 2000 135,855 Steam 9132791
AL JASSASIYA Maran G.M, Nakilat Daewoo Conventional 2007 142,988 Steam 9324435
AL KARAANA Nakilat Daewoo Q-Flex 2009 205,988 SSD 9431123
AL KHARAITIYAT Nakilat Hyundai Q-Flex 2009 211,986 SSD 9397327
AL KHARSAAH Nakilat, Teekay Samsung Q-Flex 2008 211,885 SSD 9360881
AL KHATTIYA Nakilat Daewoo Q-Flex 2009 205,993 SSD 9431111
AL KHAZNAH National Gas Shipping Co Mitsui Conventional 1994 137,540 Steam 9038440
AL KHOR J4 Consortium Mitsubishi Conventional 1996 135,295 Steam 9085613
AL KHUWAIR Nakilat, Teekay Samsung Q-Flex 2008 211,885 SSD 9360908
AL MAFYAR Nakilat Samsung Q-Max 2009 261,043 SSD 9397315
AL MARROUNA Nakilat, Teekay Daewoo Conventional 2006 149,539 Steam 9325685
AL MAYEDA Nakilat Samsung Q-Max 2009 261,157 SSD 9397298
AL NUAMAN Nakilat Daewoo Q-Flex 2009 205,981 SSD 9431135
AL ORAIQ NYK, K Line, MOL, Iino, Mitsui, Nakilat Daewoo Q-Flex 2008 205,994 SSD 9360790
AL RAYYAN J4 Consortium Kawaski Conventional 1997 134,671 Steam 9086734
AL REKAYYAT Nakilat Hyundai Q-Flex 2009 211,986 SSD 9397339
AL RUWAIS Commerz Real, Nakilat, PRONAV Daewoo Q-Flex 2007 205,941 SSD 9337951
AL SADD Nakilat Daewoo Q-Flex 2009 205,963 SSD 9397341
AL SAFLIYA Commerz Real, Nakilat, PRONAV Daewoo Q-Flex 2007 210,100 SSD 9337963
AL SAHLA NYK, K Line, MOL, Iino, Mitsui, Nakilat Hyundai Q-Flex 2008 211,842 SSD 9360855
AL SAMRIYA Nakilat Daewoo Q-Max 2009 258,054 SSD 9388821
AL SHAMAL Nakilat, Teekay Samsung Q-Flex 2008 213,536 SSD 9360893
AL SHEEHANIYA Nakilat Daewoo Q-Flex 2009 205,963 SSD 9360831
AL THAKHIRA K Line, Qatar Shpg. Samsung Conventional 2005 143,517 Steam 9298399
AL THUMAMA NYK, K Line, MOL, Iino, Mitsui, Nakilat Hyundai Q-Flex 2008 216,235 SSD 9360843
AL UTOURIYA NYK, K Line, MOL, Iino, Mitsui, Nakilat Hyundai Q-Flex 2008 211,879 SSD 9360867
AL WAJBAH J4 Consortium Mitsubishi Conventional 1997 134,562 Steam 9085625
AL WAKRAH J4 Consortium Kawaski Conventional 1998 134,624 Steam 9086746
AL ZUBARAH J4 Consortium Mitsui Conventional 1996 135,510 Steam 9085649
ALTO ACRUX TEPCO, NYK, Mitsubishi Mitsubishi Conventional 2008 147,798 Steam 9343106
AMADI Brunei Gas Carriers Hyundai Conventional 2015 155,000 Steam Reheat 9682552
AMALI Brunei Gas Carriers Daewoo Conventional 2011 147,228 TFDE 9496317
AMANI Brunei Gas Carriers Hyundai Conventional 2014 155,000 TFDE 9661869
AMUR RIVER Dynagas Hyundai Conventional 2008 146,748 Steam 9317999
ARCTIC AURORA Dynagas Hyundai Conventional 2013 154,880 TFDE 9645970
ARCTIC DISCOVERER K Line, Statoil, Mitsui, Iino Mitsui Conventional 2006 139,759 Steam 9276389
ARCTIC LADY Hoegh Mitsubishi Conventional 2006 147,835 Steam 9284192
ARCTIC PRINCESS Hoegh, MOL, Statoil Mitsubishi Conventional 2006 147,835 Steam 9271248
ARCTIC SPIRIT Teekay I.H.I. Conventional 1993 87,305 Steam 9001784
ARCTIC VOYAGER K Line, Statoil, Mitsui, Iino Kawaski Conventional 2006 140,071 Steam 9275335
ARKAT Brunei Gas Carriers Daewoo Conventional 2011 147,228 TFDE 9496305
ARMADA LNG MEDITERRANA Bumi Armada Berhad Mitsui FSU 2016 127,209 Steam 8125868
ARWA SPIRIT Teekay, Marubeni Samsung Conventional 2008 163,285 DFDE 9339260
ASEEM MOL, NYK, K Line, SCI, Nakilat, Petronet Samsung Conventional 2009 154,948 DFDE 9377547
ASIA ENDEAVOUR Chevron Samsung Conventional 2015 154,948 DFDE 9610779
ASIA ENERGY Chevron Samsung Conventional 2014 154,948 DFDE 9606950
ASIA EXCELLENCE Chevron Samsung Conventional 2015 154,948 DFDE 9610767
ASIA INTEGRITY Chevron Samsung Conventional 2017 154,948 DFDE 9680188
ASIA VENTURE Chevron Samsung Conventional 2017 154,948 TFDE 9680190
ASIA VISION Chevron Samsung Conventional 2014 154,948 TFDE 9606948
ATLANTIC ENERGY Sinokor Merchant Marine Kockums Conventional 1984 132,588 Steam 7702401
BAHRAIN SPIRIT Teekay Daewoo FSU 2018 173,400 MEGI 9771080
BALTIC ENERGY Sinokor Merchant Marine Kawaski Conventional 1983 125,929 Steam 8013950
BARCELONA KNUTSEN Knutsen OAS Daewoo Conventional 2009 173,400 TFDE 9401295
BEIDOU STAR MOL, China LNG Hudong-Zhonghua Conventional 2015 172,000 MEGI 9613159
BERGE ARZEW BW Daewoo Conventional 2004 138,089 Steam 9256597
BERING ENERGY General Dynamics General Dynamics Conventional 1978 126,750 Steam 7390155
BILBAO KNUTSEN Knutsen OAS IZAR Conventional 2004 135,049 Steam 9236432
BISHU MARU Trans Pacific Shipping Kawasaki Sakaide Conventional 2017 164,700 Steam
Reheat 9691137
Ship Name Shipowner Shipbuilder Type Delivery Year
Capacity (cm)
Propulsion Type IMO #
Appendix 5: Table of Active Fleet, end-2018 (continued)
IGU World LNG report - 2019 Edition

108 109
Appendices
BORIS DAVYDOV Sovcomflot Daewoo Conventional 2018 172,000 TFDE 9768394
BORIS VILKITSKY Sovcomflot Daewoo Conventional 2017 172,000 TFDE 9768368
BRITISH ACHIEVER BP Daewoo Conventional 2018 174,000 MEGI 9766542
BRITISHCONTRIBUTOR BP Daewoo Conventional 2018 174,000 MEGI 9766554
BRITISH DIAMOND BP Hyundai Conventional 2008 151,883 DFDE 9333620
BRITISH EMERALD BP Hyundai Conventional 2007 154,983 DFDE 9333591
BRITISH PARTNER BP Daewoo Conventional 2018 174,000 MEGI 9766530
BRITISH RUBY BP Hyundai Conventional 2008 155,000 DFDE 9333606
BRITISH SAPPHIRE BP Hyundai Conventional 2008 155,000 DFDE 9333618
BROOG J4 Consortium Mitsui Conventional 1998 136,359 Steam 9085651
BU SAMRA Nakilat Samsung Q-Max 2008 260,928 SSD 9388833
BW BOSTON BW, TOTAL Daewoo Conventional 2003 138,059 Steam 9230062
BW EVERETT BW Daewoo Conventional 2003 138,028 Steam 9243148
BW GDF SUEZ BRUSSELS BW Daewoo Conventional 2009 162,514 DFDE 9368314
BW INTEGRITY BW Samsung FSRU 2017 170,000 TFDE 9724946
BW LILAC BW Daewoo Conventional 2018 174,300 MEGI 9758076
BW PARIS BW Daewoo Conventional 2009 162,524 TFDE 9368302
BW PAVILION LEEARA BW Hyundai Conventional 2015 161,880 TFDE 9640645
BW PAVILION VANDA BW Pavilion LNG Hyundai Conventional 2015 161,880 TFDE 9640437
BW SINGAPORE BW Samsung FSRU 2015 170,000 TFDE 9684495
BW TULIP BW Daewoo Conventional 2018 174,300 MEGI 9758064
CADIZ KNUTSEN Knutsen OAS IZAR Conventional 2004 135,240 Steam 9246578
CAPE ANN Hoegh, MOL, TLTC Samsung FSRU 2010 145,130 DFDE 9390680
CARIBBEAN ENERGY Sinokor Merchant Marine General Dynamics Conventional 1980 126,530 Steam 7619575
CASTILLO DE CALDELAS Elcano Imabari Conventional 2018 178,000 MEGI 9742819
CASTILLO DE MERIDA Elcano Imabari Conventional 2018 178,000 MEGI 9742807
CASTILLO DE SANTISTEBAN Anthony Veder STX Conventional 2010 173,673 TFDE 9433717
CASTILLO DE VILLALBA Anthony Veder IZAR Conventional 2003 135,420 Steam 9236418
CATALUNYA SPIRIT Teekay IZAR Conventional 2003 135,423 Steam 9236420
CESI BEIHAI China Shipping Group Hudong-Zhonghua Conventional 2017 174,000 TFDE 9672844
CESI GLADSTONE Chuo Kaiun/Shinwa Chem. Hudong-Zhonghua Conventional 2016 174,000 DFDE 9672820
CESI LIANYUNGANG China Shipping Group Hudong-Zhonghua Conventional 2018 174,000 DFDE 9672818
CESI QINGDAO China Shipping Group Hudong-Zhonghua Conventional 2017 174,000 DFDE 9672832
CESI TIANJIN China Shipping Group Hudong-Zhonghua Conventional 2017 174,000 DFDE 9694749
CESI WENZHOU China Shipping Group Hudong-Zhonghua Conventional 2018 174,000 TFDE 9694751
CHEIKH BOUAMAMA HYPROC, Sonatrach, Itochu, MOL Universal Conventional 2008 74,245 Steam 9324344
CHEIKH EL MOKRANI HYPROC, Sonatrach, Itochu, MOL Universal Conventional 2007 73,990 Steam 9324332
CHRISTOPHE DE MARGERIE Sovcomflot Daewoo Conventional 2016 170,000 TFDE 9737187
CLEAN ENERGY Dynagas Hyundai Conventional 2007 146,794 Steam 9323687
CLEAN HORIZON Dynagas Hyundai Conventional 2015 162,000 TFDE 9655444
CLEAN OCEAN Dynagas Hyundai Conventional 2014 162,000 TFDE 9637492
CLEAN PLANET Dynagas Hyundai Conventional 2014 162,000 TFDE 9637507
CLEAN VISION Dynagas Hyundai Conventional 2016 162,000 TFDE 9655456
COOL EXPLORER Thenamaris Samsung Conventional 2015 160,000 TFDE 9640023
COOL RUNNER Thenamaris Samsung Conventional 2014 160,000 TFDE 9636797
COOL VOYAGER Thenamaris Samsung Conventional 2013 160,000 TFDE 9636785
CORCOVADO LNG Cardiff Marine Daewoo Conventional 2014 159,800 TFDE 9636711
CREOLE SPIRIT Teekay Daewoo Conventional 2016 173,400 MEGI 9681687
CUBAL Mitsui, NYK, Teekay Samsung Conventional 2012 154,948 TFDE 9491812
CYGNUS PASSAGE TEPCO, NYK, Mitsubishi Mitsubishi Conventional 2009 145,400 Steam 9376294
DAPENG MOON China LNG Ship Mgmt. Hudong-Zhonghua Conventional 2008 147,200 Steam 9308481
DAPENG STAR China LNG Ship Mgmt. Hudong-Zhonghua Conventional 2009 147,200 Steam 9369473
DAPENG SUN China LNG Ship Mgmt. Hudong-Zhonghua Conventional 2008 147,200 Steam 9308479
DIAMOND GAS ORCHID NYK Mitsubishi Conventional 2018 165,000 TFDE 9779226
DIAMOND GAS ROSE NYK Mitsubishi Conventional 2018 165,000 TFDE 9779238
DISHA MOL, NYK, K Line, SCI, Nakilat, Petronet Daewoo Conventional 2004 136,026 Steam 9250713
DOHA J4 Consortium Mitsubishi Conventional 1999 135,203 Steam 9085637
DUHAIL Commerz Real, Nakilat, PRONAV Daewoo Q-Flex 2008 210,100 SSD 9337975
DUKHAN J4 Consortium Mitsui Conventional 2004 137,672 Steam 9265500
DWIPUTRA P.T. Humpuss Trans Mitsubishi Conventional 1994 127,386 Steam 9043677
EDUARD TOLL Teekay Daewoo Conventional 2017 172,000 TFDE 9750696
EJNAN K Line, MOL, NYK, Mitsui, Nakilat Samsung Conventional 2007 143,815 Steam 9334076
EKAPUTRA 1 P.T. Humpuss Trans Mitsubishi Conventional 1990 136,400 Steam 8706155
ENERGY ADVANCE Tokyo Gas Kawaski Conventional 2005 144,590 Steam 9269180
ENERGY ATLANTIC Alpha Tankers STX Conventional 2015 157,521 TFDE 9649328
ENERGY CONFIDENCE Tokyo Gas, NYK Kawaski Conventional 2009 152,880 Steam 9405588
ENERGY FRONTIER Tokyo Gas Kawaski Conventional 2003 144,596 Steam 9245720
ENERGY HORIZON NYK, TLTC Kawaski Conventional 2011 177,441 Steam 9483877
ENERGY LIBERTY MOL Japan Marine Conventional 2018 165,000 TFDE 9736092
ENERGY NAVIGATOR Tokyo Gas, MOL Kawaski Conventional 2008 147,558 Steam 9355264
ENERGY PROGRESS MOL Kawaski Conventional 2006 144,596 Steam 9274226
ENSHU MARU K Line Kawaski Conventional 2018 164,700 Steam Reheat 9749609
ESSHU MARU Mitsubishi, MOL, Chubu Electric Mitsubishi Conventional 2014 155,300 Steam 9666560
EXCALIBUR Excelerate, Teekay Daewoo Conventional 2002 138,000 Steam 9230050
EXCELERATE Exmar, Excelerate Daewoo FSRU 2006 135,313 Steam 9322255
Ship Name Shipowner Shipbuilder Type Delivery Year
Capacity (cm)
Propulsion Type IMO #Ship Name Shipowner Shipbuilder Type Delivery
YearCapacity
(cm) Propulsion
Type IMO #
Appendix 5: Table of Active Fleet, end-2018 (continued)Appendix 5: Table of Active Fleet, end-2018 (continued)
IGU World LNG report - 2019 Edition

110 111
Appendices
EXCELLENCE Excelerate Energy Daewoo FSRU 2005 138,124 Steam 9252539
EXCELSIOR Excelerate Energy Daewoo FSRU 2005 138,000 Steam 9239616
EXEMPLAR Excelerate Energy Daewoo FSRU 2010 151,072 Steam 9444649
EXPEDIENT Excelerate Energy Daewoo FSRU 2010 147,994 Steam 9389643
EXPERIENCE Excelerate Energy Daewoo FSRU 2014 173,660 TFDE 9638525
EXPLORER Excelerate Energy Daewoo FSRU 2008 150,900 Steam 9361079
EXPRESS Excelerate Energy Daewoo FSRU 2009 150,900 Steam 9361445
EXQUISITE Excelerate Energy Daewoo FSRU 2009 151,035 Steam 9381134
FEDOR LITKE Sovcomflot Daewoo Conventional 2017 172,000 TFDE 9768370
FLEX ENDEAVOUR Frontline Management Daewoo Conventional 2018 173,400 MEGI 9762261
FLEX ENTERPRISE Frontline Management Daewoo Conventional 2018 174,000 MEGI 9762273
FLEX RAINBOW Flex LNG Samsung Conventional 2018 174,000 MEGI 9709037
FLEX RANGER Flex LNG Samsung Conventional 2018 174,000 MEGI 9709025
FORTUNE FSU Dalian Inteh Dunkerque Normandie Conventional 1981 130,000 Steam 7428471
FRAIHA NYK, K Line, MOL, Iino, Mitsui, Nakilat Daewoo Q-Flex 2008 205,950 SSD 9360817
FSRU TOSCANA OLT Offshore LNG Toscana Hyundai Converted FSRU 2004 137,500 Steam 9253284
FUJI LNG Cardiff Marine Kawaski Conventional 2004 144,596 Steam 9275359
FUWAIRIT K Line, MOL, NYK, Nakilat Samsung Conventional 2004 138,262 Steam 9256200
GALEA Shell Mitsubishi Conventional 2002 135,269 Steam 9236614
GALICIA SPIRIT Teekay Daewoo Conventional 2004 137,814 Steam 9247364
GALLINA Shell Mitsubishi Conventional 2002 135,269 Steam 9236626
GANDRIA Golar LNG HDW Conventional 1977 123,512 Steam 7361934
GASELYS TOTAL, NYK Chantiers de l'Atlantique Conventional 2007 151,383 DFDE 9320075
GASLOG CHELSEA GasLog Hanjin H.I. Conventional 2010 153,600 TFDE 9390185
GASLOG GENEVA GasLog Samsung Conventional 2016 174,000 TFDE 9707508
GASLOG GENOA GasLog Samsung Conventional 2018 174,000 LP-2S 9744013
GASLOG GIBRALTAR GasLog Samsung Conventional 2016 174,000 TFDE 9707510
GASLOG GLASGOW GasLog Samsung Conventional 2016 174,000 TFDE 9687021
GASLOG GREECE GasLog Samsung Conventional 2016 170,520 TFDE 9687019
GASLOG HONG KONG GasLog Hyundai Conventional 2018 174,000 LP-2S 9748904
GASLOG HOUSTON GasLog Hyundai Conventional 2018 174,000 LP-2S 9748899
GASLOG SALEM GasLog Samsung Conventional 2015 155,000 TFDE 9638915
GASLOG SANTIAGO GasLog Samsung Conventional 2013 154,948 TFDE 9600530
GASLOG SARATOGA GasLog Samsung Conventional 2014 155,000 TFDE 9638903
GASLOG SAVANNAH GasLog Samsung Conventional 2010 154,948 TFDE 9352860
GASLOG SEATTLE GasLog Samsung Conventional 2013 154,948 TFDE 9634086
GASLOG SHANGHAI GasLog Samsung Conventional 2013 154,948 TFDE 9600528
GASLOG SINGAPORE GasLog Samsung Conventional 2010 154,948 TFDE 9355604
GASLOG SKAGEN GasLog Samsung Conventional 2013 154,948 TFDE 9626285
GASLOG SYDNEY GasLog Samsung Conventional 2013 154,948 TFDE 9626273
GCL Hoegh General Dynamics Conventional 1979 126,000 Steam 7413232
GDF SUEZ POINT FORTIN MOL, Sumitomo, LNG JAPAN Imabari Conventional 2010 154,982 Steam 9375721
GEMMATA Shell Mitsubishi Conventional 2004 135,269 Steam 9253222
GEORGIY BRUSILOV Dynagas Daewoo Conventional 2018 172,000 TFDE 9768382
GHASHA National Gas Shipping Co Mitsui Conventional 1995 137,100 Steam 9038452
GIGIRA LAITEBO MOL, Itochu Hyundai Conventional 2010 173,870 TFDE 9360922
GIMI Golar LNG Rosenberg Verft Conventional 1976 122,388 Steam 7382732
GLOBAL ENERGY TOTAL Chantiers de l'Atlantique Conventional 2004 74,130 Steam 9269207
GOLAR ARCTIC Golar LNG Daewoo Conventional 2003 137,814 Steam 9253105
GOLAR BEAR Golar LNG Samsung Conventional 2014 160,000 TFDE 9626039
GOLAR CELSIUS Golar LNG Samsung Conventional 2013 160,000 TFDE 9626027
GOLAR CRYSTAL Golar LNG Samsung Conventional 2014 160,000 TFDE 9624926
GOLAR ESKIMO Golar LNG Samsung FSRU 2014 160,000 TFDE 9624940
GOLAR FREEZE Golar LNG Partners HDW Converted FSRU 1977 126,000 Steam 7361922
GOLAR FROST Golar LNG Samsung Conventional 2014 160,000 TFDE 9655042
GOLAR GLACIER ICBC Hyundai Conventional 2014 162,500 TFDE 9654696
GOLAR GRAND Golar LNG Partners Daewoo Conventional 2005 145,700 Steam 9303560
GOLAR ICE Golar LNG Samsung Conventional 2015 160,000 TFDE 9637325
GOLAR IGLOO Golar LNG Partners Samsung FSRU 2014 170,000 TFDE 9633991
GOLAR KELVIN ICBC Hyundai Conventional 2015 162,000 TFDE 9654701
GOLAR MARIA Golar LNG Partners Daewoo Conventional 2006 145,700 Steam 9320374
GOLAR MAZO Golar LNG Partners Mitsubishi Conventional 2000 135,000 Steam 9165011
GOLAR NANOOK Golar Power Samsung FSRU 2018 170,000 DFDE 9785500
GOLAR PENGUIN Golar LNG Samsung Conventional 2014 160,000 TFDE 9624938
GOLAR SEAL Golar LNG Samsung Conventional 2013 160,000 TFDE 9624914
GOLAR SNOW ICBC Samsung Conventional 2015 160,000 TFDE 9635315
GOLAR SPIRIT Golar LNG Partners Kawasaki Sakaide Converted FSRU 1981 129,000 Steam 7373327
GOLAR TUNDRA Golar LNG Samsung FSRU 2015 170,000 TFDE 9655808
GOLAR WINTER Golar LNG Partners Daewoo Converted FSRU 2004 138,000 Steam 9256614
GRACE ACACIA NYK Hyundai Conventional 2007 146,791 Steam 9315707
GRACE BARLERIA NYK Hyundai Conventional 2007 146,770 Steam 9315719
GRACE COSMOS MOL, NYK Hyundai Conventional 2008 146,794 Steam 9323675
GRACE DAHLIA NYK Kawaski Conventional 2013 177,425 Steam 9540716
GRACE ENERGY Sinokor Merchant Marine Mitsubishi Conventional 1989 127,580 Steam 8702941
GRAND ANIVA NYK, Sovcomflot Mitsubishi Conventional 2008 145,000 Steam 9338955
GRAND ELENA NYK, Sovcomflot Mitsubishi Conventional 2007 147,968 Steam 9332054
GRAND MEREYA MOL, K Line, Primorsk Mitsui Conventional 2008 145,964 Steam 9338929
Ship Name Shipowner Shipbuilder Type Delivery Year
Capacity (cm)
Propulsion Type IMO #Ship Name Shipowner Shipbuilder Type Delivery
YearCapacity
(cm) Propulsion
Type IMO #
Appendix 5: Table of Active Fleet, end-2018 (continued)Appendix 5: Table of Active Fleet, end-2018 (continued)
IGU World LNG report - 2019 Edition

112 113
Appendices
GULF ENERGY General Dynamics General Dynamics Conventional 1978 126,750 Steam 7390143
HANJIN MUSCAT Hanjin Shipping Co. Hanjin H.I. Conventional 1999 138,366 Steam 9155078
HANJIN PYEONGTAEK Hanjin Shipping Co. Hanjin H.I. Conventional 1995 130,366 Steam 9061928
HISPANIA SPIRIT Teekay Daewoo Conventional 2002 137,814 Steam 9230048
HL RAS LAFFAN Hanjin Shipping Co. Hanjin H.I. Conventional 2000 138,214 Steam 9176008
HL SUR Hanjin Shipping Co. Hanjin H.I. Conventional 2000 138,333 Steam 9176010
HOEGH ESPERANZA Hoegh Hyundai FSRU 2018 170,000 DFDE 9780354
HOEGH GALLANT Hoegh Hyundai FSRU 2014 170,000 DFDE 9653678
HOEGH GANNET Hoegh Hyundai FSRU 2018 166,630 DFDE 9822451
HOEGH GIANT Hoegh Hyundai FSRU 2017 170,000 DFDE 9762962
HOEGH GRACE Hoegh Hyundai FSRU 2016 170,000 DFDE 9674907
HYUNDAI AQUAPIA Hyundai LNG Shipping Hyundai Conventional 2000 134,400 Steam 9179581
HYUNDAI COSMOPIA Hyundai LNG Shipping Hyundai Conventional 2000 134,308 Steam 9155157
HYUNDAI ECOPIA Hyundai LNG Shipping Hyundai Conventional 2008 146,790 Steam 9372999
HYUNDAI GREENPIA Hyundai LNG Shipping Hyundai Conventional 1996 125,000 Steam 9075333
HYUNDAI OCEANPIA Hyundai LNG Shipping Hyundai Conventional 2000 134,300 Steam 9183269
HYUNDAI PEACEPIA Hyundai LNG Shipping Daewoo Conventional 2017 174,000 MEGI 9761853
HYUNDAI PRINCEPIA Hyundai LNG Shipping Daewoo Conventional 2017 174,000 MEGI 9761841
HYUNDAI TECHNOPIA Hyundai LNG Shipping Hyundai Conventional 1999 134,524 Steam 9155145
HYUNDAI UTOPIA Hyundai LNG Shipping Hyundai Conventional 1994 125,182 Steam 9018555
IBERICA KNUTSEN Knutsen OAS Daewoo Conventional 2006 135,230 Steam 9326603
IBRA LNG OSC, MOL Samsung Conventional 2006 145,951 Steam 9326689
IBRI LNG OSC, MOL, Mitsubishi Mitsubishi Conventional 2006 145,173 Steam 9317315
INDEPENDENCE Hoegh Hyundai FSRU 2014 170,132 DFDE 9629536
ISH National Gas Shipping Co Mitsubishi Conventional 1995 137,512 Steam 9035864
K. ACACIA Korea Line Daewoo Conventional 2000 138,017 Steam 9157636
K. FREESIA Korea Line Daewoo Conventional 2000 138,015 Steam 9186584
K. JASMINE Korea Line Daewoo Conventional 2008 142,961 Steam 9373008
K. MUGUNGWHA Korea Line Daewoo Conventional 2008 148,776 Steam 9373010
KINISIS Chandris Group Daewoo Conventional 2018 173,400 MEGI 9785158
KITA LNG Cardiff Marine Daewoo Conventional 2014 159,800 TFDE 9636723
KUMUL MOL, China LNG Hudong-Zhonghua Conventional 2016 169,147 SSD 9613161
LA MANCHA KNUTSEN Knutsen OAS Hyundai Conventional 2016 176,300 MEGI 9721724
LALLA FATMA N'SOUMER HYPROC Kawaski Conventional 2004 144,888 Steam 9275347
LENA RIVER Dynagas Hyundai Conventional 2013 154,880 DFDE 9629598
LIJMILIYA Nakilat Daewoo Q-Max 2009 258,019 SSD 9388819
LNG ABALAMABIE BGT Ltd. Samsung Conventional 2016 170,000 DFDE 9690171
LNG ABUJA II Nigeria LNG Ltd Samsung Conventional 2016 175,180 DFDE 9690169
LNG ADAMAWA BGT Ltd. Hyundai Conventional 2005 142,656 Steam 9262211
LNG AKWA IBOM BGT Ltd. Hyundai Conventional 2004 142,656 Steam 9262209
LNG AQUARIUS Hanochem General Dynamics Conventional 1977 126,750 Steam 7390181
LNG BARKA OSC, OG, NYK, K Line Kawaski Conventional 2008 152,880 Steam 9341299
LNG BAYELSA BGT Ltd. Hyundai Conventional 2003 137,500 Steam 9241267
LNG BENUE BW Daewoo Conventional 2006 142,988 Steam 9267015
LNG BONNY II Nigeria LNG Ltd Hyundai Conventional 2015 177,000 DFDE 9692002
LNG BORNO NYK Samsung Conventional 2007 149,600 Steam 9322803
LNG CAPRICORN Nova Shipping & Logistics General Dynamics Conventional 1978 126,750 Steam 7390208
LNG CROSS RIVER BGT Ltd. Hyundai Conventional 2005 142,656 Steam 9262223
LNG DREAM NYK Kawaski Conventional 2006 147,326 Steam 9277620
LNG EBISU MOL, KEPCO Kawaski Conventional 2008 147,546 Steam 9329291
LNG ENUGU BW Daewoo Conventional 2005 142,988 Steam 9266994
LNG FINIMA II BGT Ltd. Samsung Conventional 2015 170,000 DFDE 9690145
LNG FLORA NYK, Osaka Gas Kawaski Conventional 1993 125,637 Steam 9006681
LNG FUKUROKUJU MOL, KEPCO Kawasaki Sakaide Conventional 2016 164,700 Steam
Reheat 9666986
LNG IMO BW Daewoo Conventional 2008 148,452 Steam 9311581
LNG JAMAL NYK, Osaka Gas Mitsubishi Conventional 2000 136,977 Steam 9200316
LNG JUNO MOL Mitsubishi Conventional 2018 180,000 TFDE 9774628
LNG JUPITER Osaka Gas, NYK Kawaski Conventional 2009 152,880 Steam 9341689
LNG JUROJIN MOL, KEPCO Mitsubishi Conventional 2015 155,300 Steam Reheat 9666998
LNG KANO BW Daewoo Conventional 2007 148,565 Steam 9311567
LNG KOLT STX Pan Ocean Hanjin H.I. Conventional 2008 153,595 Steam 9372963
LNG LAGOS II BGT Ltd. Hyundai Conventional 2016 177,000 DFDE 9692014
LNG LERICI ENI Sestri Conventional 1998 63,993 Steam 9064085
LNG LOKOJA BW Daewoo Conventional 2006 148,471 Steam 9269960
LNG MALEO MOL, NYK, K Line Mitsui Conventional 1989 127,544 Steam 8701791
LNG MARS Osaka Gas, MOL Mitsubishi Conventional 2016 153,000 Steam Reheat 9645748
LNG OGUN NYK Samsung Conventional 2007 149,600 Steam 9322815
LNG ONDO BW Daewoo Conventional 2007 148,478 Steam 9311579
LNG OYO BW Daewoo Conventional 2005 142,988 Steam 9267003
LNG PIONEER MOL Daewoo Conventional 2005 138,000 Steam 9256602
LNG PORT-HARCOURT II BGT Ltd. Samsung Conventional 2015 170,000 DFDE 9690157
LNG PORTOVENERE ENI Sestri Conventional 1996 65,262 Steam 9064073
LNG RIVER NIGER BGT Ltd. Hyundai Conventional 2006 142,656 Steam 9262235
LNG RIVER ORASHI BW Daewoo Conventional 2004 142,988 Steam 9266982
LNG RIVERS BGT Ltd. Hyundai Conventional 2002 137,500 Steam 9216298
LNG SAKURA NYK/Kepco Kawasaki Sakaide Conventional 2018 177,000 TFDE 9774135
LNG SATURN MOL Mitsubishi Conventional 2016 153,000 Steam Reheat 9696149
Ship Name Shipowner Shipbuilder Type Delivery Year
Capacity (cm)
Propulsion Type IMO #Ship Name Shipowner Shipbuilder Type Delivery
YearCapacity
(cm) Propulsion
Type IMO #
Appendix 5: Table of Active Fleet, end-2018 (continued)Appendix 5: Table of Active Fleet, end-2018 (continued)
IGU World LNG report - 2019 Edition

114 115
Appendices
LNG SCHNEEWEISSCHEN Mitsui & Co Daewoo Conventional 2018 180,000 TFDE 9771913
LNG SOKOTO BGT Ltd. Hyundai Conventional 2002 137,500 Steam 9216303
LNG TAURUS Nova Shipping & Logistics General Dynamics Conventional 1979 126,750 Steam 7390167
LNG VENUS Osaka Gas, MOL Mitsubishi Conventional 2014 155,300 Steam 9645736
LNG VESTA Tokyo Gas, MOL, Iino Mitsubishi Conventional 1994 127,547 Steam 9020766
LNG VIRGO General Dynamics General Dynamics Conventional 1979 126,750 Steam 7390179
LOBITO Mitsui, NYK, Teekay Samsung Conventional 2011 154,948 TFDE 9490961
LUCKY FSU Dalian Inteh Dunkerque Normandie Conventional 1981 127,400 Steam 7428469
LUSAIL K Line, MOL, NYK, Nakilat Samsung Conventional 2005 142,808 Steam 9285952
MACOMA Teekay Daewoo Conventional 2017 173,400 MEGI 9705653
MADRID SPIRIT Teekay IZAR Conventional 2004 135,423 Steam 9259276
MAGDALA Teekay Daewoo Conventional 2018 173,400 MEGI 9770921
MAGELLAN SPIRIT Teekay, Marubeni Samsung Conventional 2009 163,194 DFDE 9342487
MALANJE Mitsui, NYK, Teekay Samsung Conventional 2011 154,948 DFDE 9490959
MARAN GAS ACHILLES Maran Gas Maritime Hyundai Conventional 2015 174,000 DFDE 9682588
MARAN GAS AGAMEMNON Maran Gas Maritime Hyundai Conventional 2016 174,000 MEGI 9682590
MARAN GAS ALEXANDRIA Maran Gas Maritime Hyundai Conventional 2015 164,000 DFDE 9650054
MARAN GAS AMPHIPOLIS Maran Gas Maritime Daewoo Conventional 2016 173,400 DFDE 9701217
MARAN GAS APOLLONIA Maran Gas Maritime Hyundai Conventional 2014 164,000 DFDE 9633422
MARAN GAS ASCLEPIUS Maran G.M, Nakilat Daewoo Conventional 2005 142,906 Steam 9302499
MARAN GAS CORONIS Maran G.M, Nakilat Daewoo Conventional 2007 142,889 Steam 9331048
MARAN GAS DELPHI Maran Gas Maritime Daewoo Conventional 2014 159,800 TFDE 9633173
MARAN GAS EFESSOS Maran Gas Maritime Daewoo Conventional 2014 159,800 DFDE 9627497
MARAN GAS HECTOR Maran Gas Maritime Hyundai Conventional 2016 174,000 DFDE 9682605
MARAN GAS LINDOS Maran Gas Maritime Daewoo Conventional 2015 159,800 DFDE 9627502
MARAN GAS MYSTRAS Maran Gas Maritime Daewoo Conventional 2015 159,800 DFDE 9658238
MARAN GAS OLYMPIAS Maran Gas Maritime Daewoo Conventional 2017 173,400 TFDE 9732371
MARAN GAS PERICLES Maran Gas Maritime Hyundai Conventional 2016 174,000 DFDE 9709489
MARAN GAS POSIDONIA Maran Gas Maritime Hyundai Conventional 2014 164,000 DFDE 9633434
MARAN GAS ROXANA Maran Gas Maritime Daewoo Conventional 2017 173,400 TFDE 9701229
MARAN GAS SPARTA Maran Gas Maritime Hyundai Conventional 2015 162,000 TFDE 9650042
MARAN GAS SPETSES Maran G.M, Nakilat Daewoo Conventional 2018 173,400 MEGI 9767950
MARAN GAS TROY Maran Gas Maritime Daewoo Conventional 2015 159,800 TFDE 9658240
MARAN GAS ULYSSES Maran Gas Maritime Hyundai Conventional 2017 174,000 TFDE 9709491
MARIA ENERGY Tsakos Hyundai Conventional 2016 174,000 TFDE 9659725
MARIB SPIRIT Teekay Samsung Conventional 2008 163,280 DFDE 9336749
MARSHAL VASILEVSKIY Gazprom JSC Hyundai FSRU 2018 174,000 TFDE 9778313
MARVEL EAGLE Mitsui & Co Kawasaki Sakaide Conventional 2018 155,000 TFDE 9759240
MARVEL FALCON Mitsui & Co Samsung Conventional 2018 174,000 XDF 9760768
MARVEL HAWK Mitsui & Co Samsung Conventional 2018 174,000 MEGI 9760770
MEDITERRANEAN ENERGY Sinokor Merchant Marine Mitsubishi Conventional 1984 126,975 Steam 8125832
MEGARA Teekay Daewoo Conventional 2018 173,400 MEGI 9770945
MEKAINES Nakilat Samsung Q-Max 2009 261,137 SSD 9397303
MERCHANT Sinokor Merchant Marine Samsung Conventional 2003 138,517 Steam 9250191
MERIDIAN SPIRIT Teekay, Marubeni Samsung Conventional 2010 163,285 DFDE 9369904
MESAIMEER Nakilat Hyundai Q-Flex 2009 211,986 SSD 9337729
METHANE ALISON VICTORIA GasLog Samsung Conventional 2007 145,000 Steam 9321768
METHANE BECKI ANNE GasLog Samsung Conventional 2010 167,416 TFDE 9516129
METHANE HEATHER SALLY GasLog Samsung Conventional 2007 145,000 Steam 9321744
METHANE JANE ELIZABETH GasLog Samsung Conventional 2006 145,000 Steam 9307190
METHANE JULIA LOUISE Mitsui & Co Samsung Conventional 2010 167,416 TFDE 9412880
METHANE KARI ELIN Shell Samsung Conventional 2004 136,167 Steam 9256793
METHANE LYDON VOLNEY GasLog Samsung Conventional 2006 145,000 Steam 9307205
METHANE MICKIE HARPER Shell Samsung Conventional 2010 167,400 TFDE 9520376
METHANE NILE EAGLE Shell, Gaslog Samsung Conventional 2007 145,000 Steam 9321770
METHANE PATRICIA CAMILA Shell Samsung Conventional 2010 167,416 TFDE 9425277
METHANE PRINCESS Golar LNG Partners Daewoo Conventional 2003 136,086 Steam 9253715
METHANE RITA ANDREA Shell, Gaslog Samsung Conventional 2006 145,000 Steam 9307188
METHANE SHIRLEY ELISABETH Shell, Gaslog Samsung Conventional 2007 142,800 Steam 9321756
METHANE SPIRIT Teekay, Marubeni Samsung Conventional 2008 163,195 TFDE 9336737
MILAHA QATAR Nakilat, Qatar Shpg., SocGen Samsung Conventional 2006 145,140 Steam 9321732
MILAHA RAS LAFFAN Nakilat, Qatar Shpg., SocGen Samsung Conventional 2004 136,199 Steam 9255854
MIN LU China LNG Ship Mgmt. Hudong-Zhonghua Conventional 2009 145,000 Steam 9305128
MIN RONG China LNG Ship Mgmt. Hudong-Zhonghua Conventional 2009 145,000 Steam 9305116
MOL FSRU CHALLENGER MOL Daewoo FSRU 2017 263,000 TFDE 9713105
MOURAD DIDOUCHE Sonatrach Chantiers de l'Atlantique Conventional 1980 126,190 Steam 7400704
MOZAH Nakilat Samsung Q-Max 2008 261,988 SSD 9337755
MRAWEH National Gas Shipping Co Kvaerner Masa Conventional 1996 135,000 Steam 9074638
MUBARAZ National Gas Shipping Co Kvaerner Masa Conventional 1996 135,000 Steam 9074626
MUREX Teekay Daewoo Conventional 2017 173,400 MEGI 9705641
MURWAB NYK, K Line, MOL, Iino, Mitsui, Nakilat Daewoo Q-Flex 2008 205,971 SSD 9360805
MYRINA Teekay Daewoo Conventional 2018 173,400 MEGI 9770933
NEO ENERGY Tsakos Hyundai Conventional 2007 146,838 Steam 9324277
NEPTUNE Hoegh, MOL, TLTC Samsung FSRU 2009 145,130 DFDE 9385673
Ship Name Shipowner Shipbuilder Type Delivery Year
Capacity (cm)
Propulsion Type IMO #Ship Name Shipowner Shipbuilder Type Delivery
YearCapacity
(cm) Propulsion
Type IMO #
Appendix 5: Table of Active Fleet, end-2018 (continued)Appendix 5: Table of Active Fleet, end-2018 (continued)
IGU World LNG report - 2019 Edition

116 117
Appendices
NIZWA LNG OSC, MOL Kawaski Conventional 2005 145,469 Steam 9294264
NKOSSA II AP Moller Mitsubishi Conventional 1992 78,488 Steam 9003859
NORTH ENERGY Sinokor Merchant Marine Mitsubishi Conventional 1983 125,788 Steam 8014409
NORTHWEST SANDERLING North West Shelf Venture Mitsubishi Conventional 1989 125,452 Steam 8608872
NORTHWEST SANDPIPER North West Shelf Venture Mitsui Conventional 1993 125,042 Steam 8913150
NORTHWEST SEAEAGLE North West Shelf Venture Mitsubishi Conventional 1992 125,541 Steam 8913174
NORTHWEST SHEARWATER North West Shelf Venture Kawaski Conventional 1991 125,660 Steam 8608705
NORTHWEST SNIPE North West Shelf Venture Mitsui Conventional 1990 127,747 Steam 8608884
NORTHWEST STORMPETREL North West Shelf Venture Mitsubishi Conventional 1994 125,525 Steam 9045132
NORTHWEST SWAN North West Shelf Venture Daewoo Conventional 2004 140,500 Steam 9250725
NUSANTARA REGAS SATU Golar LNG Partners Rosenberg
Verft Converted FSRU 1977 125,003 Steam 7382744
OAK SPIRIT Teekay Daewoo Conventional 2016 173,400 MEGI 9681699
OB RIVER Dynagas Hyundai Conventional 2007 146,791 Steam 9315692
OCEAN QUEST GDF SUEZ Newport News Conventional 1979 126,540 Steam 7391214
OCEANIC BREEZE K-Line, Inpex Mitsubishi Conventional 2018 153,000 Steam Reheat 9698111
ONAIZA Nakilat Daewoo Q-Flex 2009 205,963 SSD 9397353
OUGARTA HYPROC Hyundai Conventional 2017 171,800 TFDE 9761267
PACIFIC ARCADIA NYK Mitsubishi Conventional 2014 145,400 Steam 9621077
PACIFIC BREEZE K Line Kawaski Conventional 2018 182,000 TFDE 9698123
PACIFIC ENERGY Sinokor Merchant Marine Kockums Conventional 1981 132,588 Steam 7708948
PACIFIC ENLIGHTEN Kyushu Electric, TEPCO, Mitsubishi, Mitsui, NYK, MOL Mitsubishi Conventional 2009 147,800 Steam 9351971
PACIFIC EURUS TEPCO, NYK, Mitsubishi Mitsubishi Conventional 2006 135,000 Steam 9264910
PACIFIC MIMOSA NYK Mitsubishi Conventional 2018 155,300 Steam Reheat 9743875
PACIFIC NOTUS TEPCO, NYK, Mitsubishi Mitsubishi Conventional 2003 137,006 Steam 9247962
PALU LNG Cardiff Marine Daewoo Conventional 2014 159,800 TFDE 9636735
PAN AMERICAS Teekay Hudong-Zhonghua Conventional 2018 174,000 DFDE 9750232
PAN ASIA Teekay Hudong-Zhonghua Conventional 2017 174,000 DFDE 9750220
PAN EUROPE Teekay Hudong-Zhonghua Conventional 2018 174,000 DFDE 9750244
PAPUA MOL, China LNG Hudong-Zhonghua Conventional 2015 172,000 TFDE 9613135
PATRIS Chandris Group Daewoo Conventional 2018 174,000 MEGI 9766889
PGN FSRU LAMPUNG Hoegh Hyundai FSRU 2014 170,000 DFDE 9629524
POLAR SPIRIT Teekay I.H.I. Conventional 1993 88,100 Steam 9001772
PORTOVYY Gazprom Daewoo Conventional 2003 135,344 Steam 9246621
PRACHI MOL, NYK, K Line, SCI, Nakilat, Petronet Hyundai Conventional 2016 173,000 TFDE 9723801
PROVALYS TOTAL Chantiers de l'Atlantique Conventional 2006 151,383 DFDE 9306495
PSKOV Sovcomflot STX Conventional 2014 170,200 DFDE 9630028
PUTERI DELIMA MISC Chantiers de l'Atlantique Conventional 1995 127,797 Steam 9030814
PUTERI DELIMA SATU MISC Mitsui Conventional 2002 134,849 Steam 9211872
PUTERI FIRUS MISC Chantiers de l'Atlantique Conventional 1997 127,689 Steam 9030840
PUTERI FIRUS SATU MISC Mitsubishi Conventional 2004 134,865 Steam 9248502
PUTERI INTAN MISC Chantiers de l'Atlantique Conventional 1994 127,694 Steam 9030802
PUTERI INTAN SATU MISC Mitsubishi Conventional 2002 134,770 Steam 9213416
PUTERI MUTIARA SATU MISC Mitsui Conventional 2005 134,861 Steam 9261205
PUTERI NILAM MISC Chantiers de l'Atlantique Conventional 1995 127,756 Steam 9030826
PUTERI NILAM SATU MISC Mitsubishi Conventional 2003 134,833 Steam 9229647
PUTERI ZAMRUD MISC Chantiers de l'Atlantique Conventional 1996 127,751 Steam 9030838
PUTERI ZAMRUD SATU MISC Mitsui Conventional 2004 134,870 Steam 9245031
RAAHI MOL, NYK, K Line, SCI, Nakilat, Petronet Daewoo Conventional 2004 138,077 Steam 9253703
RAMDANE ABANE Sonatrach Chantiers de l'Atlantique Conventional 1981 126,190 Steam 7411961
RASHEEDA Nakilat Samsung Q-Max 2010 260,912 MEGI 9443413
RIBERA DEL DUERO KNUTSEN Knutsen OAS Daewoo Conventional 2010 173,400 DFDE 9477593
RIOJA KNUTSEN Knutsen OAS Hyundai Conventional 2016 176,300 MEGI 9721736
RUDOLF SAMOYLOVICH Teekay Daewoo Conventional 2018 172,000 TFDE 9750713
SALALAH LNG OSC, MOL Samsung Conventional 2005 148,174 Steam 9300817
SCF MELAMPUS Sovcomflot STX Conventional 2015 170,200 TFDE 9654878
SCF MITRE Sovcomflot STX Conventional 2015 170,200 TFDE 9654880
SEAN SPIRIT Teekay Hyundai Conventional 2018 174,000 MEGI 9781918
SEISHU MARU Mitsubishi, NYK, Chubu Electric Mitsubishi Conventional 2014 155,300 Steam 9666558
SENSHU MARU MOL, NYK, K Line Mitsui Conventional 1984 125,835 Steam 8014473
SERI ALAM MISC Samsung Conventional 2005 145,572 Steam 9293832
SERI AMANAH MISC Samsung Conventional 2006 142,795 Steam 9293844
SERI ANGGUN MISC Samsung Conventional 2006 145,100 Steam 9321653
SERI ANGKASA MISC Samsung Conventional 2006 142,786 Steam 9321665
SERI AYU MISC Samsung Conventional 2007 143,474 Steam 9329679
SERI BAKTI MISC Mitsubishi Conventional 2007 149,886 Steam 9331634
SERI BALHAF MISC Mitsubishi Conventional 2009 154,567 TFDE 9331660
SERI BALQIS MISC Mitsubishi Conventional 2009 154,747 TFDE 9331672
SERI BEGAWAN MISC Mitsubishi Conventional 2007 149,964 Steam 9331646
SERI BIJAKSANA MISC Mitsubishi Conventional 2008 149,822 Steam 9331658
SERI CAMAR PETRONAS Hyundai Conventional 2018 150,200 Steam Reheat 9714305
SERI CAMELLIA PETRONAS Hyundai Conventional 2016 150,200 Steam Reheat 9714276
SERI CEMARA PETRONAS Hyundai Conventional 2018 150,200 Steam Reheat 9756389
SERI CEMPAKA PETRONAS Hyundai Conventional 2017 150,200 MEGI 9714290
SERI CENDERAWASIH PETRONAS Hyundai Conventional 2017 150,200 Steam Reheat 9714288
Ship Name Shipowner Shipbuilder Type Delivery Year
Capacity (cm)
Propulsion Type IMO #Ship Name Shipowner Shipbuilder Type Delivery
YearCapacity
(cm) Propulsion
Type IMO #
Appendix 5: Table of Active Fleet, end-2018 (continued)Appendix 5: Table of Active Fleet, end-2018 (continued)
IGU World LNG report - 2019 Edition

118 119
Appendices
SESTAO KNUTSEN Knutsen OAS IZAR Conventional 2007 135,357 Steam 9338797
SEVILLA KNUTSEN Knutsen OAS Daewoo Conventional 2010 173,400 DFDE 9414632
SHAGRA Nakilat Samsung Q-Max 2009 261,988 SSD 9418365
SHAHAMAH National Gas Shipping Co Kawaski Conventional 1994 137,756 Steam 9035852
SHEN HAI China LNG, CNOOC, Shanghai LNG Hudong-Zhonghua Conventional 2012 142,741 Steam 9583677
SIMAISMA Maran G.M, Nakilat Daewoo Conventional 2006 142,971 Steam 9320386
SINGAPORE ENERGY Sinokor Merchant Marine Samsung Conventional 2003 136,135 Steam 9238040
SK AUDACE SK Shipping, Marubeni Samsung Conventional 2017 180,000 XDF 9693161
SK RESOLUTE SK Shipping, Marubeni Samsung Conventional 2018 180,000 XDF 9693173
SK SERENITY SK Shipping Samsung Conventional 2018 174,000 DFDE 9761803
SK SPICA SK Shipping Samsung Conventional 2018 174,000 MEGI 9761815
SK SPLENDOR SK Shipping Samsung Conventional 2000 135,540 Steam 9180231
SK STELLAR SK Shipping Samsung Conventional 2000 135,540 Steam 9180243
SK SUMMIT SK Shipping Daewoo Conventional 1999 135,933 Steam 9157624
SK SUNRISE Iino Kaiun Kaisha Samsung Conventional 2003 135,505 Steam 9247194
SK SUPREME SK Shipping Samsung Conventional 2000 136,320 Steam 9157739
SM EAGLE Korea Line Daewoo Conventional 2017 174,000 MEGI 9761827
SM SEAHAWK Korea Line Daewoo Conventional 2017 174,000 MEGI 9761839
SOHAR LNG OSC, MOL Mitsubishi Conventional 2001 135,850 Steam 9210816
SOLARIS GasLog Samsung Conventional 2014 155,000 TFDE 9634098
SONANGOL BENGUELA Mitsui, Sonangol, Sojitz Daewoo Conventional 2011 160,500 Steam 9482304
SONANGOL ETOSHA Mitsui, Sonangol, Sojitz Daewoo Conventional 2011 160,500 Steam 9482299
SONANGOL SAMBIZANGA Mitsui, Sonangol, Sojitz Daewoo Conventional 2011 160,500 Steam 9475600
SOUTH ENERGY Sinokor Merchant Marine General Dynamics Conventional 1980 126,750 Steam 7619587
SOUTHERN CROSS MOL, China LNG Hudong-Zhonghua Conventional 2015 169,295 Steam
Reheat 9613147
SOYO Mitsui, NYK, Teekay Samsung Conventional 2011 154,948 DFDE 9475208
SPIRIT OF HELA MOL, Itochu Hyundai Conventional 2009 173,800 DFDE 9361639
STENA BLUE SKY Stena Bulk Daewoo Conventional 2006 142,988 Steam 9315393
STENA CLEAR SKY Stena Bulk Daewoo Conventional 2011 173,593 TFDE 9413327
STENA CRYSTAL SKY Stena Bulk Daewoo Conventional 2011 173,611 TFDE 9383900
SUNRISE Shell Dunkerque Ateliers Conventional 1977 126,813 Steam 7359670
SYMPHONIC BREEZE K Line Kawaski Conventional 2007 145,394 Steam 9330745
TAITAR NO. 1 CPC, Mitsui, NYK Mitsubishi Conventional 2009 144,627 Steam 9403669
TAITAR NO. 2 MOL, NYK Kawaski Conventional 2009 144,627 Steam 9403645
TAITAR NO. 3 MOL, NYK Mitsubishi Conventional 2010 144,627 Steam 9403671
TAITAR NO. 4 CPC, Mitsui, NYK Kawaski Conventional 2010 144,596 Steam 9403657
TANGGUH BATUR Sovcomflot, NYK Daewoo Conventional 2008 142,988 Steam 9334284
TANGGUH FOJA K Line, PT Meratus Samsung Conventional 2008 154,948 DFDE 9349007
TANGGUH HIRI Teekay Hyundai Conventional 2008 151,885 DFDE 9333632
TANGGUH JAYA K Line, PT Meratus Samsung Conventional 2008 154,948 DFDE 9349019
TANGGUH PALUNG K Line, PT Meratus Samsung Conventional 2009 154,948 DFDE 9355379
TANGGUH SAGO Teekay Hyundai Conventional 2009 151,872 DFDE 9361990
TANGGUH TOWUTI NYK, PT Samudera, Sovcomflot Daewoo Conventional 2008 142,988 Steam 9325893
TEMBEK Nakilat, OSC Samsung Q-Flex 2007 211,885 SSD 9337731
TENAGA EMPAT MISC CNIM FSU 1981 130,000 Steam 7428433
TENAGA SATU MISC Dunkerque Chantiers FSU 1982 130,000 Steam 7428457
TESSALA HYPROC Hyundai Conventional 2016 171,800 TFDE 9761243
TORBEN SPIRIT Teekay Daewoo Conventional 2017 173,400 MEGI 9721401
TRADER Sinokor Merchant Marine Samsung Conventional 2002 138,248 Steam 9238038
TRINITY ARROW K Line Imabari Conventional 2008 152,655 Steam 9319404
TRINITY GLORY K Line Imabari Conventional 2009 152,675 Steam 9350927
UMM AL AMAD NYK, K Line, MOL, Iino, Mitsui, Nakilat Daewoo Q-Flex 2008 206,958 SSD 9360829
UMM AL ASHTAN National Gas Shipping Co Kvaerner Masa Conventional 1997 137,000 Steam 9074652
UMM BAB Maran G.M, Nakilat Daewoo Conventional 2005 143,708 Steam 9308431
UMM SLAL Nakilat Samsung Q-Max 2008 260,928 SSD 9372731
VALENCIA KNUTSEN Knutsen OAS Daewoo Conventional 2010 173,400 DFDE 9434266
VELIKIY NOVGOROD Sovcomflot STX Conventional 2014 170,471 DFDE 9630004
VLADIMIR RUSANOV MOL Daewoo Conventional 2018 172,000 TFDE 9750701
VLADIMIR VIZE MOL Daewoo Conventional 2018 172,000 TFDE 9750658
WILFORCE Teekay Daewoo Conventional 2013 155,900 TFDE 9627954
WILPRIDE Teekay Daewoo Conventional 2013 156,007 TFDE 9627966
WOODSIDE CHANEY Maran Gas Maritime Hyundai Conventional 2016 174,000 DFDE 9682576
WOODSIDE DONALDSON Teekay, Marubeni Samsung Conventional 2009 162,620 DFDE 9369899
WOODSIDE GOODE Maran Gas Maritime Daewoo Conventional 2013 159,800 DFDE 9633161
WOODSIDE REES WITHERS Maran Gas Maritime Daewoo Conventional 2016 173,400 DFDE 9732369
WOODSIDE ROGERS Maran Gas Maritime Daewoo Conventional 2013 159,800 DFDE 9627485
YARI LNG Cardiff Marine Daewoo Conventional 2014 159,800 TFDE 9636747
YENISEI RIVER Dynagas Hyundai Conventional 2013 154,880 DFDE 9629586
YK SOVEREIGN SK Shipping Hyundai Conventional 1994 124,582 Steam 9038816
ZARGA Nakilat Samsung Q-Max 2010 261,104 SSD 9431214
ZEKREET J4 Consortium Mitsui Conventional 1998 134,733 Steam 9132818
Ship Name Shipowner Shipbuilder Type Delivery Year
Capacity (cm)
Propulsion Type IMO #Ship Name Shipowner Shipbuilder Type Delivery
YearCapacity
(cm) Propulsion
Type IMO #
Appendix 5: Table of Active Fleet, end-2018 (continued)Appendix 5: Table of Active Fleet, end-2018 (continued)
IGU World LNG report - 2019 Edition

120 121
Appendices
Appendix 6: Table of LNG Vessel Orderbook, end-2018
Ship Name Shipowner Shipbuilder Type Delivery Year
Capacity (cm)
Propulsion Type IMO #
ADRIANO KNUTSEN Knutsen OAS Hyundai Conventional 2019 180,000 MEGI 9831220
BRITISH LISTENER BP Daewoo Conventional 2019 174,000 MEGI 9766566
BRITISH MENTOR BP Daewoo Conventional 2019 174,000 MEGI 9766578
BRITISH SPONSOR BP Daewoo Conventional 2019 174,000 MEGI 9766580
BUSHU MARU NYK Mitsubishi Conventional 2019 180,000 TFDE 9796793
BW COURAGE BW Daewoo FSRU 2019 173,400 MEGI 9792591
BW IRIS BW Daewoo Conventional 2019 173,400 MEGI 9792606
DAEWOO 2466 Maran Gas Maritime Daewoo Conventional 2019 170,000 MEGI 9810367
DAEWOO 2467 Maran Gas Maritime Daewoo Conventional 2019 170,000 MEGI 9810379
DAEWOO 2469 Maran Gas Maritime Daewoo Conventional 2020 169,540 MEGI 9844863
DAEWOO 2477 Maran Gas Maritime Daewoo FSRU 2020 173,400 DFDE 9820843
DAEWOO 2478 Maran Gas Maritime Daewoo Conventional 2020 169,540 MEGI 9845013
DAEWOO 2481 Minerva Marine Daewoo Conventional 2021 170,000 9854363
DAEWOO 2482 Minerva Marine Daewoo Conventional 2021 170,000 9854375
DAEWOO 2483 Alpha Tankers Daewoo Conventional 2020 170,000 9854612
DAEWOO 2484 Alpha Tankers Daewoo Conventional 2020 170,000 9854624
DAEWOO 2485 Alpha Tankers Daewoo Conventional 2021 173,400 MEGI 9859739
DAEWOO 2486 Maran Gas Maritime Daewoo Conventional 2020 169,540 9859753
DAEWOO 2487 Maran Gas Maritime Daewoo FSRU 2021 173,400 9859741
DAEWOO 2490 BW Daewoo Conventional 2019 170,799 MEGI 9850666
DAEWOO 2491 BW Daewoo Conventional 2020 170,799 MEGI 9850678
DAEWOO 2495 Maran Gas Maritime Daewoo Conventional 2021 173,400 MEGI 9874820
DAEWOO 2496 BW Daewoo Conventional 2021 174,000 MEGI 9873840
DAEWOO 2497 BW Daewoo Conventional 2021 174,000 MEGI 9873852
DAEWOO 2498 MOL Daewoo Conventional 2020 176,523 XDF 9877133
DAEWOO 2499 MOL Daewoo Conventional 2021 176,523 XDF 9877145
DIAMOND GAS SAKURA NYK Mitsubishi Conventional 2019 165,000 STaGE 9810020
ENERGY GLORY NYK Japan Marine Conventional 2019 165,000 TFDE 9752565
ENERGY INNOVATOR MOL Japan Marine Conventional 2019 165,000 MEGI 9758832
FLEX AMBER Flex LNG Hyundai Conventional 2020 170,520 XDF 9857377
FLEX AUROA Flex LNG Hyundai Conventional 2020 170,520 XDF 9857365
FLEX CONSTELLATION Frontline Management Daewoo Conventional 2019 170,234 MEGI 9825427
FLEX COURAGEOUS Frontline Management Daewoo Conventional 2019 170,234 MEGI 9825439
FLEX FREEDOM Frontline Management Daewoo Conventional 2020 170,234 MEGI 9862308
FLEX RELIANCE Flex LNG Daewoo Conventional 2020 170,234 MEGI 9851634
FLEX RESOLUTE Flex LNG Daewoo Conventional 2020 170,234 MEGI 9851646
FLEX VIGILANT Flex LNG Hyundai Conventional 2021 170,520 XDF 9862475
FLEX VOLUNTEER Flex LNG Hyundai Conventional 2021 170,520 XDF 9862463
GASLOG GLADSTONE GasLog Samsung Conventional 2019 174,000 XDF 9744025
GASLOG WARSAW GasLog Samsung Conventional 2019 180,000 XDF 9816763
GASLOG WINDSOR GasLog Samsung Conventional 2019 180,000 XDF 9819650
GEORGIY USHAKOV Teekay Daewoo Conventional 2019 172,000 TFDE 9750749
HOEGH GALLEON Hoegh Samsung FSRU 2019 170,000 DFDE 9820013
HUDONG-ZHONGHUA H1786A Dynagas Hudong-
Zhonghua FSRU 2021 174,000 DFDE 9861809
HUDONG-ZHONGHUA H1787A Dynagas Hudong-
Zhonghua FSRU 2021 174,000 DFDE 9861811
HUDONG-ZHONGHUA H1810A MOL Hudong-
Zhonghua Conventional 2019 174,000 DFDE 9834296
HUDONG-ZHONGHUA H1811A MOL Hudong-
Zhonghua Conventional 2020 174,000 DFDE 9834301
HUDONG-ZHONGHUA H1812A MOL Hudong-
Zhonghua Conventional 2020 174,000 DFDE 9834313
HUDONG-ZHONGHUA H1813A MOL Hudong-
Zhonghua Conventional 2020 170,000 DFDE 9834325
HYUNDAI SAMHO 8007 Sovcomflot Hyundai Conventional 2020 174,000 XDF 9864746
HYUNDAI SAMHO 8008 Sovcomflot Hyundai Conventional 2021 174,000 XDF 9870525
HYUNDAI SAMHO 8029 NYK Hyundai Conventional 2020 174,000 XDF 9862487
HYUNDAI SAMHO 8030 NYK Hyundai Conventional 2021 174,000 XDF 9874454
HYUNDAI SAMHO 8031 NYK Hyundai Conventional 2021 174,000 XDF 9874466
HYUNDAI SAMHO 8039 Consolidated Marine Management Hyundai Conventional 2021 174,000 XDF 9872987
HYUNDAI SAMHO 8040 Consolidated Marine Management Hyundai Conventional 2021 174,000 XDF 9872999
HYUNDAI SAMHO S970 NYK Hyundai Conventional 2020 174,000 XDF 9852975
HYUNDAI ULSAN 3020 TMS Cardiff Gas Hyundai Conventional 2020 170,520 XDF 9845764
HYUNDAI ULSAN 3021 TMS Cardiff Gas Hyundai Conventional 2020 170,520 XDF 9845776
HYUNDAI ULSAN 3022 TMS Cardiff Gas Hyundai Conventional 2020 170,520 XDF 9845788
HYUNDAI ULSAN 3037 TMS Cardiff Gas Hyundai Conventional 2020 170,520 XDF 9864667
HYUNDAI ULSAN 3038 TMS Cardiff Gas Hyundai Conventional 2021 170,520 XDF 9869306
HYUNDAI ULSAN 3039 TMS Cardiff Gas Hyundai Conventional 2021 170,520 XDF 9872901
Ship Name Shipowner Shipbuilder Type Delivery Year
Capacity (cm)
Propulsion Type IMO #
Appendix 6: Table of LNG Vessel Orderbook, end-2018 (continued)
IGU World LNG report - 2019 Edition

122 123
HYUNDAI ULSAN 3095 Turkiye Petrolleri Hyundai FSRU 2020 170,000 9859820
HYUNDAI ULSAN 3096 Thenamaris Hyundai Conventional 2020 174,000 9861031
HYUNDAI ULSAN 3105 Capital Ship Management Hyundai Conventional 2020 174,000 XDF 9862891
HYUNDAI ULSAN 3106 Capital Ship Management Hyundai Conventional 2020 174,000 XDF 9862906
HYUNDAI ULSAN 3107 Capital Ship Management Hyundai Conventional 2021 174,000 XDF 9862918
HYUNDAI ULSAN 3108 Capital Ship Management Hyundai Conventional 2021 174,000 XDF 9862920
HYUNDAI ULSAN 3112 TMS Cardiff Gas Hyundai Conventional 2021 170,520 XDF 9872949
HYUNDAI ULSAN 3126 Thenamaris Hyundai Conventional 2021 174,000 9869265
IMABARI SAIJO 8215 Imabari Conventional 2022 178,000 MEGI 9789037
IMABARI SAIJO 8216 Imabari Conventional 2022 178,000 MEGI 9789049
IMABARI SAIJO 8217 Imabari Conventional 2022 178,000 MEGI 9789051
JIANGNAN JOVO 1 Jovo Group Jiangnan Conventional 2021 79,800 9864837
JIANGNAN JOVO 2 Jovo Group Jiangnan Conventional 2021 79,800 9864849
JMU TSU 5073 MOL Japan Marine Conventional 2019 165,000 TFDE 9758844
KAWASAKI SAKAIDE 1729 Mitsui & Co Kawasaki
Sakaide Conventional 2019 155,000 TFDE 9759252
KAWASAKI SAKAIDE 1735 NYK/Chubu Electric Kawasaki
Sakaide Conventional 2019 177,000 DFDE 9791212
MARAN GAS CHIOS Maran Gas Maritime Daewoo Conventional 2019 173,400 MEGI 9753014
MARAN GAS HYDRA Maran Gas Maritime Daewoo Conventional 2019 173,400 MEGI 9767962
MARAN GAS SYROS Maran Gas Maritime Daewoo Conventional 2019 174,000 DFDE 9753026
MARVEL CRANE NYK Mitsubishi Conventional 2019 177,000 TFDE 9770438
MARVEL KITE Mitsui & Co Samsung Conventional 2019 174,000 MEGI 9760782
MARVEL SWAN K Line Imabari Conventional 2020 178,000 MEGI 9778923
MITSUBISHI NAGASAKI 2322 Mitsui & Co Mitsubishi Conventional 2019 177,000 TFDE 9770440
NIKOLAY URVANTSEV MOL Daewoo Conventional 2019 172,000 TFDE 9750660
NIKOLAY YEVGENOV Teekay Daewoo Conventional 2019 172,000 TFDE 9750725
NOHSHU MARU MOL Mitsubishi Conventional 2019 180,000 STaGE 9796781
PRISM AGILITY SK Shipping Hyundai Conventional 2019 180,000 DFDE 9810549
PRISM BRILLIANCE SK Shipping Hyundai Conventional 2019 180,000 DFDE 9810551
RIAS BAIXAS KNUTSEN Knutsen OAS Hyundai Conventional 2019 180,000 MEGI 9825568
SAGA DAWN Landmark Capital LtdXiamen
Shipbuilding Industry
Conventional 2019 45,000 9769855
SAMSUNG 2255 Jawa Satu Regas PT Samsung FSRU 2020 170,000 DFDE 9854935
SAMSUNG 2262 GasLog Samsung Conventional 2020 152,880 XDF 9855812
SAMSUNG 2271 Cardiff Marine Daewoo Conventional 2020 152,880 XDF 9851787
SAMSUNG 2274 GasLog Samsung Conventional 2020 180,000 XDF 9853137
SAMSUNG 2275 TMS Cardiff Gas Samsung Conventional 2020 152,880 XDF 9862346
SAMSUNG 2276 TMS Cardiff Gas Samsung Conventional 2020 152,880 XDF 9863182
SAMSUNG 2297 Celsius Shipping Samsung Conventional 2020 180,000 XDF 9864784
SAMSUNG 2298 Celsius Shipping Samsung Conventional 2020 180,000 XDF 9864796
SAMSUNG 2300 GasLog Samsung Conventional 2020 174,000 XDF 9864916
SAMSUNG 2301 GasLog Samsung Conventional 2020 174,000 XDF 9864928
SAMSUNG 2302 NYK Samsung Conventional 2021 174,000 XDF 9870159
SAMSUNG 2304 Minerva Marine Samsung Conventional 2021 173,400 9869942
SAMSUNG 2306 NYK Samsung Conventional 2021 174,000 XDF 9874480
SAMSUNG 2307 NYK Samsung Conventional 2021 174,000 XDF 9874492
SAMSUNG 2308 TMS Cardiff Gas Samsung Conventional 2021 170,520 XDF 9875800
SAMSUNG 2311 GasLog Samsung Conventional 2021 176,400 XDF 9876660
SAMSUNG 2312 GasLog Samsung Conventional 2021 176,400 XDF 9876737
SCF LA PEROUSE Sovcomflot Hyundai Conventional 2020 174,000 XDF 9849887
SHINSHU MARU NYK Kawasaki Sakaide Conventional 2019 177,000 DFDE 9791200
TRAIANO KNUTSEN Knutsen OAS Hyundai Conventional 2020 180,000 MEGI 9854765
TURQUOISE Kolin / Kalyon Hyundai FSRU 2019 167,042 DFDE 9823883
VASANT Triumph Offshore Pvt Ltd Hyundai FSRU 2019 180,000 DFDE 9837066
VLADIMIR VORONIN Teekay Daewoo Conventional 2019 172,000 TFDE 9750737
YAKOV GAKKEL MOL Daewoo Conventional 2019 172,000 TFDE 9750672
YAMAL SPIRIT Teekay Hyundai Conventional 2019 174,000 MEGI 9781920
Ship Name Shipowner Shipbuilder Type Delivery Year
Capacity (cm)
Propulsion Type IMO #Ship Name Shipowner Shipbuilder Type Delivery
YearCapacity
(cm) Propulsion
Type IMO #
Appendix 6: Table of LNG Vessel Orderbook, end-2018 (continued)Appendix 6: Table of LNG Vessel Orderbook, end-2018 (continued)
AppendicesIGU World LNG report - 2019 Edition

124 125
Notes
NOTES NOTES
IGU World LNG report - 2019 Edition

126 127
I Global I I Sustainable I I Innovators I enagas.es
What our energy is. What we are.We are good because for almost 50 yearswe’ve been making people’s lives better by operating natural gas infrastructuresafely and e�ciently.We are new because we innovate and developour services and solutions for an increasingly competitive energy.We are energy because we work withdetermination and enthusiasm with one of the cleanest energies for a sustainable future.
World leader in its sector on the Dow Jones
Sustainability Index in 2018.
IGU World LNG report - 2019 Edition
NOTES

International Gas Union (IGU)Att: Naturgy,Plaça del Gas, 1,Building A 2nd floor,08003 Barcelona,Spain
Telephone: + 34 93 412 97 89Fax: + 34 93 402 54 26E-mail: [email protected]
Published by the International Gas Union (IGU) Copyright © 2019. The entire content of this publication is protected by copyright, full details of which are available from the publisher. All rights reserved. No part of this publication may be reproduced, stored in retrieval systems or transmitted in any form or by any means – electronic, mechanical, photocopying, recording or otherwise – without the prior permission of the copyright owner.


