112
ANNUAL REPORT 2019

ANNUAL REPORT2019

William P. Foley, IIChairman of the BoardFidelity National Financial, Inc.
Douglas K. AmmermanRetiredKPMG LLP
Thomas M. HagertyManaging PartnerThomas H. Lee Partners, L.P.
Daniel D. LaneChairman of the BoardLane/Kuhn Pacific
Richard N. MasseyChief Executive OfficerCannae Holdings, Inc.
Heather H. MurrenManaging PartnerMurren Family Office
Raymond R. QuirkChief Executive OfficerFidelity National Financial, Inc.
John D. RoodChairmanThe Vestcor Companies, Inc.
Peter O. Shea, Jr.President and Chief Executive OfficerJ.F. Shea Company
Cary H. ThompsonVice ChairmanBanc of America Merrill Lynch
Willie D. DavisDirector Emeritus
AUDIT COMMITTEEDouglas K. Ammerman, ChairHeather H. MurrenJohn D. Rood
COMPENSATION COMMITTEERichard N. Massey, ChairDaniel D. LaneCary H. Thompson
GOVERNANCE COMMITTEEPeter O. Shea, Jr., ChairRichard N. Massey
BOARD OF DIRECTORS
Raymond R. QuirkChief Executive Officer
Michael J. NolanPresident
Roger S. JewkesChief Operating Officer
Anthony J. ParkExecutive Vice PresidentChief Financial Officer
Peter T. SadowskiExecutive Vice PresidentChief Legal Officer
Michael L. GravelleExecutive Vice PresidentGeneral Counsel and Corporate Secretary
GENERAL INFORMATION
CORPORATE OFFICEFidelity National Financial, Inc.601 Riverside AvenueJacksonville, FL 32204www.fnf.com
STOCK TRANSFER AGENT AND REGISTRARContinental Stock Transfer andTrust Company1 State Street30th FloorNew York, NY 10004(212) [email protected]/contact
INDEPENDENT REGISTERED PUBLICACCOUNTING FIRMErnst & Young LLP12926 Gran Bay Parkway, Suite 500Jacksonville, FL 32258
PUBLICATIONSThe Company’s Annual Report on Form 10-K and quarterly reports on Form 10-Q are available on the Investor Relations section of the Company’s website at www.fnf.com.
A Notice of Annual Meeting of Stockholder and Proxy Statement are furnished to stockholders in advance of the Annual Meeting.
STOCK EXCHANGE LISTINGFidelity National Financial, Inc.common stock is listed on the New York Stock Exchange under symbol FNF.
CERTIFICATIONSFNF filed the Chief Executive Officer and Chief Financial Officer certifications required by Section 302 of the Sarbanes-Oxley Act of 2002 as exhibits to its Annual Report on Form 10-K for the fiscal year ended December 31, 2019.
INVESTOR RELATIONSPlease visit the Contact Investor Relations section of FNF's Investor Info website at FNF.com to submit a question or request to the Investor Relations department.You can also contact FNF's InvestorRelations department via email [email protected]
EXECUTIVE OFFICERS
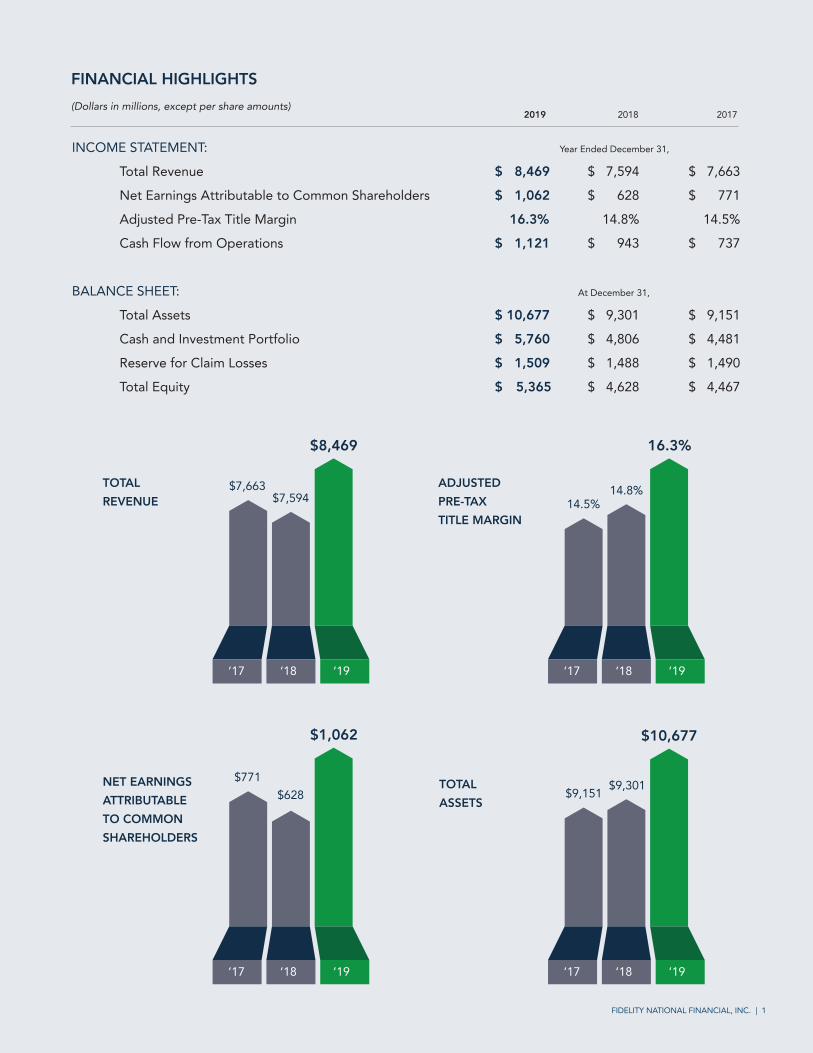
FINANCIAL HIGHLIGHTS(Dollars in millions, except per share amounts)
2019 2018 2017
At December 31,
Year Ended December 31,INCOME STATEMENT:
Total Revenue $ 8,469 $ 7,594 $ 7,663
Net Earnings Attributable to Common Shareholders $ 1,062 $ 628 $ 771
Adjusted Pre-Tax Title Margin 16.3% 14.8% 14.5%
Cash Flow from Operations $ 1,121 $ 943 $ 737
BALANCE SHEET:
Total Assets $ 10,677 $ 9,301 $ 9,151
Cash and Investment Portfolio $ 5,760 $ 4,806 $ 4,481
Reserve for Claim Losses $ 1,509 $ 1,488 $ 1,490
Total Equity $ 5,365 $ 4,628 $ 4,467
TOTALREVENUE
NET EARNINGSATTRIBUTABLETO COMMONSHAREHOLDERS
ADJUSTEDPRE-TAXTITLE MARGIN
TOTALASSETS
$7,663
‘19‘18‘17
$7,594
$8,469
$771
‘19‘18‘17
$628
$1,062
14.5%
‘19‘18‘17
14.8%
16.3%
$9,151
‘19‘18‘17
$9,301
$10,677
FIDELITY NATIONAL FINANCIAL, INC. | 1

Wearepleasedthat2019wasanotheryearoffinancialstrengthforourCompanyaswegeneratedtotalrevenueof$8.5billion,netearningsof$1.1billionandcashflowfromoperationsof$1.1billion.Dilutedearningspersharewere$3.83andadjustedearningspershare1were$3.39.Ourtitlebusinessgeneratedrecordadjustedpre-taxtitleearnings1 of $1.3billion,withanadjustedpre-taxtitlemarginof16.3%,ourbestyearsince2003.Totalcommercialrevenueforthefullyearwas$1.1billion,making2019thebestcommercialrevenueyearincompanyhistory.Wecontinuedtostrengthenourbalancesheet,endingtheyearwithover$1.1billionofholdingcompanycashandadebttocapitalratiobelow13%.Thestrengthofourbalancesheetandcontinuedprofitabilityofourtitlebusinesspositionsuswelltotakeadvantageofstrategicopportunitiesastheyariseandprotectusfromanymacro-economicheadwindsthatwemayencounter.
In2019,wemadeinvestmentsinourdigitalplatformbyexpandingourWireSafeandstartSafeprograms.Theseprogramseducateconsumersaboutwirefraudandhowtomitigateriskwhileengaginghomebuyersandsellersinanewdigitalopeningworkspace.Inaddition,wemadeprogressenhancingcoretitleproductionsystemtechnologiesandintegrationsandadvancingautomatedtitleandunderwritingcapabilities.WehavealsomadeadditionalinvestmentsinourCRM,transactioncoordinationandtransactionmanagementtechnologiesleveragedbyrealestateagentsandbrokers.Alloftheseinvestmentsalignwithourmissiontoadvance,expand,andprotectthelifechangingexperienceofhomeownership.
Strategically,wespentthemajorityof2019workingtocloseouracquisitionofStewartInformationServices,atransactionthatwasannouncedinMarchof2018andwhichhadanequityvalueofapproximately$1.2billion.Unfortunately,wefacedinsurmountableregulatoryhurdlesand,asaresult,madethedecisiontoterminatetheStewartmergerinSeptemberwhichwebelievedwasinthebestinterestofourshareholders. Followingtheterminationannouncement,theBoardandmanagementteamunderwentacomprehensivereviewofFNF’scapitalallocationstrategyanddeterminedthatexpandingintotheannuitymarketthroughtheacquisitionofFGLHoldings(“F&G”),announced
TO OUR SHAREHOLDERS
2 | FIDELITY NATIONAL FINANCIAL, INC.
William P. Foley, IIChairman of the Board
Raymond R. QuirkChief Executive Officer

FIDELITY NATIONAL FINANCIAL, INC. | 3
February2020,wouldbestmaximizevalueforourshareholders.FNFhasbeenaminorityownerinF&GforthepastthreeyearsanddecidedtoacquiretheremaininginterestinF&Gasawaytodiversifyourearningsandreducetheriskandvolatilityinherentinourstand-alonetitleoperations.F&Goffersanattractivereturnonourcapitalinvestmentinanindustrywithstrongseculargrowthtailwindsthatwillperformwellineconomicenvironmentsthatmaybemorechallengingfortitleinsurance.TheclosingofthetransactionissubjecttocertainregulatoryandclosingconditionsincludingtheapprovalbyF&Gshareholders,federalandstateregulatoryapprovalsandthesatisfactionofothercustomaryclosingconditions.Weexpecttheclosingtobeinthesecondorthirdquarterof2020andlookforwardtowelcomingtheF&GemployeesandclientstotheFNFfamily.
Lastly,fortheeighthstraightyear,ourboardelectedtoincreaseourquarterlycashdividend.Ourfourthquarterdividendincreasedto$0.33pershare,a6.5%increasefromthepreviousquarterlycashdividendof$0.31pershare.Weremainedcommittedtovaluecreationthroughthemeansofsharerepurchases,repurchasingover2.1millionsharesthroughouttheyear.Theboardwillcontinuetoevaluatecapitalallocationincludingsharerepurchases,dividends,debtpaydownandfurtherinvestmentinourbusinesssegments.
WecurrentlyfindourselvesinunprecedentedtimesasourcommunitieshavebeenrapidlyaffectedbytheinfluxofCOVID-19thathasimpactedtheworld.Wehaveplansinplacetoaddressapandemicandaretakingthenecessaryactionstosupportourcustomersandprotectouremployeesandtheirfamilies.
Whilewerecognizethechallengesanduncertaintiesthataglobalpandemicbringstothemarket,weremaincautiouslyoptimisticabouttheprospectsthatacontinuedlowinterestrateenvironmentwillprovidetoourtitlebusiness.Weareproudofwhatwewereabletoaccomplishin2019andweremaincommittedtoleadingthetitleinsuranceindustryinprofitabilityandcontinuingtocreatevalueforourshareholdersin2020andbeyond.Wethankallofouremployeesfortheireffortsin2019andthankallofourshareholdersfortheircontinuedsupport.
Our title business generated record adjusted pre-tax title earnings1 of $1.3 billion, with an adjusted pre-tax title margin of 16.3%, our best year since 2003.
WilliamP.Foley,IIChairman of the Board
RaymondR.QuirkChief Executive Offi cer
(1) See the Non-GAAP Financial Measures page for reconciliations of GAAP to non-GAAP � nancial measures.

4 | FIDELITY NATIONAL FINANCIAL, INC.
NON-GAAP FINANCIAL MEASURES
RECONCILIATION OF PRE-TAX EARNINGS TO ADJUSTED PRE-TAX EARNINGS
CONSOLIDATED TITLE
Pre-tax earnings $ 1,369 $ 1,536
Realized (gains) and losses, net (318) (326)
Purchase price amortization 105 86
Transaction costs 58 -
Severance costs and other adjustments 7 1
Adjusted Pre-tax earnings $1,221 $1,297
($ in millions)
RECONCILIATION OF DILUTED EARNINGS PER SHARE TO ADJUSTED EARNINGS PER SHARE
Net earnings attributable to common shareholders $ 1,062
Realized (gains) and losses, net (318)
Purchase price amortization 105
Transaction costs 58
Severance costs and other adjustments 7
Income taxes on non-GAAP adjustments 38
Non-controlling interest on non-GAAP adjustments (12)
Adjusted net earnings attributable to common shareholders $940
Earnings per share - diluted $3.83
Adjusted earnings per share - diluted $3.39
Weighted average shares outstanding - diluted 277
($ in millions, except per share data)
Use of Non-GAAP Financial InformationGenerally Accepted Accounting Principles (GAAP) is the term used to refer to the standard framework of guidelines for financial accounting. GAAP includes the standards, conventions, and rules accountants follow in recording and summarizing transactions and in the preparation of financial statements. In addition to reporting financial results in accordance with GAAP, FNF has provided non-GAAP financial measures, which it believes are useful to help investors better understand its financial performance, competitive position and prospects for the future. These non-GAAP measures include adjusted pre-tax earnings and adjusted earnings per share.
Any non-GAAP measures should be considered in context with the GAAP financial presentation and should not be considered in isolation or as a substitute for GAAP net earnings. Further, FNF's non-GAAP measures may be calculated differently from similarly titled measures of other companies. Reconciliations of these non-GAAP measures to related GAAP measures are provided above.
2019
2019

FIDELIT Y NATIONAL FINANCIAL, INC.
F O R M
1OK

UNITED STATES SECURITIES AND EXCHANGE COMMISSIONWashington, D.C. 20549
Form 10-K (Mark One)
ANNUAL REPORT PURSUANT TO SECTION 13 OR 15(d) OF THE SECURITIES EXCHANGEACT OF 1934
For the Fiscal Year Ended December 31, 2019 or
TRANSITION REPORT PURSUANT TO SECTION 13 OR 15(d) OF THE SECURITIESEXCHANGE ACT OF 1934
Commission File No. 1-32630
Fidelity National Financial, Inc.
(Exact name of registrant as specified in its charter)
Delaware 16-1725106(State or other jurisdiction of incorporation or
organization)(I.R.S. Employer Identification No.)
601 Riverside Avenue, Jacksonville, Florida 32204(Address of principal executive offices) (zip code)
(904) 854-8100 ___________________________________________________________________
(Registrant’s telephone number, including area code)Securities registered pursuant to Section 12(b) of the Act:
Title of Each Class Trading Symbol(s) Name of Each Exchange on Which RegisteredFNF Common Stock, $0.0001 par value FNF New York Stock Exchange
5.50% Notes due September 2022 FNF22 New York Stock ExchangeSecurities registered pursuant to Section 12(g) of the Act: None
Indicate by check mark if the registrant is a well-known seasoned issuer, as defined in Rule 405 of the Securities Act. Yes No
Indicate by check mark if the registrant is not required to file reports pursuant to Section 13 or Section 15(d) of the Act. Yes No
Indicate by check mark whether the registrant (1) has filed all reports required to be filed by Section 13 or 15(d) of the Securities Exchange Act of 1934 during the preceding 12 months (or for such shorter period that the registrant was required to file such reports), and (2) has been subject to such filing requirements for the past 90 days. Yes No
Indicate by check mark whether the registrant has submitted electronically every Interactive Data File required to be submitted pursuant to Rule 405 of Regulation S-T (§ 232.405 of this chapter) during the preceding 12 months (or for such shorter period that the registrant was required to submit such files). Yes No
Indicate by check mark if disclosure of delinquent filers pursuant to Item 405 of Regulation S-K (§ 229.405) is not contained herein, and will not be contained, to the best of registrant’s knowledge, in definitive proxy or information statements incorporated by reference in Part III of this Form 10-K, or any amendment to this Form 10-K.
Indicate by check mark whether the registrant is a large accelerated filer, an accelerated filer, a non-accelerated filer, a smaller reporting company, or emerging growth company. See the definitions of “large accelerated filer,” “accelerated filer,” “smaller reporting company,” and “emerging growth company” in Rule 12b-2 of the Exchange Act. (Check one):
Large accelerated filer Accelerated filer
Non-accelerated filer Smaller reporting company Emerging growth company
Indicate by check mark whether the registrant is a shell company (as defined in Rule 12b-2 of the Exchange Act). Yes No
The aggregate market value of the shares of FNF common stock held by non-affiliates of the registrant as of June 30, 2019 was $10,594,534,815 based on the closing price of $40.30 as reported by The New York Stock Exchange.
As of January 31, 2020 there were 275,607,954 shares of FNF common stock outstanding.
The information in Part III hereof for the fiscal year ended December 31, 2019, will be filed within 120 days after the close of the fiscal year that is the subject of this Report.

i
FIDELITY NATIONAL FINANCIAL, INC.FORM 10-K
TABLE OF CONTENTS
Page
Number
PART IItem 1. BusinessItem 1A. Risk FactorsItem 1B. Unresolved Staff CommentsItem 2. PropertiesItem 3. Legal Proceedings
PART IIItem 5. Market for Registrant’s Common Equity, Related Stockholder Matters and Issuer Purchases of
Equity SecuritiesItem 6. Selected Financial DataItem 7. Management’s Discussion and Analysis of Financial Condition and Results of OperationsItem 7A. Quantitative and Qualitative Disclosure About Market RiskItem 8. Financial Statements and Supplementary DataItem 9. Changes in and Disagreements With Accountants on Accounting and Financial DisclosureItem 9A. Controls and ProceduresItem 9B. Other Information
PART IIIItem 10. Directors and Executive Officers of the RegistrantItem 11. Executive CompensationItem 12. Security Ownership of Certain Beneficial Owners and Management and Related Stockholder
MattersItem 13. Certain Relationships and Related Transactions, and Director IndependenceItem 14. Principal Accounting Fees and Services
PART IVItem 15. Exhibits, Financial Statement SchedulesItem 16. Summary
112171717
1821244143898989
9090
909090
9195
Table of Contents
1
PART I
Item 1. Business
Introductory Note
The following describes the business of Fidelity National Financial, Inc. and its subsidiaries. Except where otherwise noted, all references to "we," "us," "our", the "Company" or "FNF" are to Fidelity National Financial, Inc. and its subsidiaries, taken together.
Overview
We are a leading provider of (i) title insurance, escrow and other title-related services, including trust activities, trustee sales guarantees, recordings and reconveyances and home warranty products and (ii) transaction services to the real estate and mortgage industries. FNF is one of the nation’s largest title insurance companies operating through its title insurance underwriters - Fidelity National Title Insurance Company ("FNTIC"), Chicago Title Insurance Company ("Chicago Title"), Commonwealth Land Title Insurance Company ("Commonwealth Land Title"), Alamo Title Insurance and National Title Insurance of New York Inc. - which collectively issue more title insurance policies than any other title company in the United States. Through our subsidiary ServiceLink Holdings, LLC ("ServiceLink"), we provide mortgage transaction services including title-related services and facilitation of production and management of mortgage loans.
As of December 31, 2019, we had the following reporting segments:
• Title. This segment consists of the operations of our title insurance underwriters and related businesses which provide title insurance and escrow and other title-related services including trust activities, trustee sales guarantees, and home warranty products. This segment also includes our transaction services business, which includes other title-related services used in the production and management of mortgage loans, including mortgage loans that experience default.
• Corporate and Other. This segment consists of the operations of the parent holding company, our real estate technology subsidiaries, other smaller, non-title businesses and certain unallocated corporate overhead expenses and eliminations of revenues and expenses between it and our Title segment.
Competitive Strengths
We believe that our competitive strengths include the following:
Corporate principles. A cornerstone of our management philosophy and operating success is the six fundamental precepts upon which we were founded, which are:
• Autonomy and entrepreneurship;• Bias for action;• Customer-oriented and motivated;• Minimize bureaucracy;• Employee ownership; and• Highest standard of conduct.
These six precepts are emphasized to our employees from the first day of employment and are integral to many of our strategies described below.
Competitive cost structure. We have been able to maintain competitive operating margins in part by monitoring our businesses in a disciplined manner through continual evaluation of title order activity and management of our cost structure. When compared to our industry competitors, we also believe that our structure is more efficiently designed, which allows us to operate with lower overhead costs.
Leading title insurance company. We are one of the largest title insurance companies in the United States and a leading provider of title insurance and escrow and other title-related services for real estate transactions. Through the third quarter of 2019, our insurance companies had a 34.1% share of the U.S. title insurance market, according to the American Land Title Association ("ALTA").
Established relationships with our customers. We have strong relationships with the customers who use our title services. Our distribution network, which includes more than 1,300 direct residential title offices and more than 5,300 agents, is among the largest in the United States. We also benefit from strong brand recognition in our multiple title brands that allows us to access a broader client base than if we operated under a single consolidated brand and provides our customers with a choice among brands.
Strong value proposition for our customers. We provide our customers with title insurance and escrow and other title-related services that support their ability to effectively close real estate transactions. We help make the real estate closing process more
Table of Contents
2
efficient for our customers by offering a single point of access to a broad platform of title-related products and resources necessary to close real estate transactions.
Proven management team. The managers of our operating businesses have successfully built our title business over an extended period of time, resulting in our business attaining the size, scope and presence in the industry that it has today. Our managers have demonstrated their leadership ability during numerous acquisitions through which we have grown and throughout a number of business cycles and significant periods of industry change.
Commercial title insurance. While residential title insurance comprises the majority of our business, we are also a significant provider of commercial real estate title insurance in the United States. Our network of agents, attorneys, underwriters and closers that service the commercial real estate markets is one of the largest in the industry. Our commercial network combined with our financial strength makes our title insurance operations attractive to large national lenders that require the underwriting and issuing of larger commercial title policies.
We believe that our competitive strengths position us well to take advantage of future changes to the real estate market.
Strategy
Our strategy in the title business is to maximize operating profits by increasing our market share and managing operating expenses throughout the real estate business cycle. To accomplish our goals, we intend to do the following:
• Continue to operate multiple title brands independently. We believe that in order to maintain and strengthen our title insurance customer base, we must operate our strongest brands in a given marketplace independently of each other. Our national and regional brands include FNTIC, Chicago Title, Commonwealth Land Title, Lawyers Title, Ticor Title, Alamo Title, and National Title of New York. In our largest markets, we operate multiple brands. This approach allows us to continue to attract customers who identify with a particular brand and allows us to utilize a broader base of local agents and local operations than we would have with a single consolidated brand.
• Consistently deliver superior customer service. We believe customer service and consistent product delivery are the most important factors in attracting and retaining customers. Our ability to provide superior customer service and consistent product delivery requires continued focus on providing high quality service and products at competitive prices. Our goal is to continue to improve the experience of our customers, in all aspects of our business.
• Manage our operations successfully through business cycles. We operate in a cyclical industry and our ability to diversify our revenue base within our title insurance business and manage the duration of our investments may allow us to better operate in this cyclical business. Maintaining a broad geographic revenue base, utilizing both direct and independent agency operations and pursuing both residential and commercial title insurance business help diversify our title insurance revenues. We continue to monitor, evaluate and execute upon the consolidation of administrative functions, legal entity structure, and office consolidation, as necessary, to respond to the continually changing marketplace. We maintain shorter durations on our investment portfolio to mitigate our interest rate risk. A more detailed discussion of our investment strategies is included in “Investment Policies and Investment Portfolio.”
• Continue to improve our products and technology. As a national provider of real estate transaction products and services, we participate in an industry that is subject to significant change, frequent new product and service introductions and evolving industry standards. We believe that our future success will depend in part on our ability to anticipate industry changes and offer products and services that meet evolving industry standards. In connection with our service offerings, we are continuing to deploy new information system technologies to our direct and agency operations. We expect to improve the process of ordering title and escrow services and improve the delivery of our products to our customers.
• Maintain values supporting our strategy. We believe that our continued focus on and support of our long-established corporate culture will reinforce and support our business strategy. Our goal is to foster and support a corporate culture where our employees and agents seek to operate independently and maintain profitability at the local level while forming close customer relationships by meeting customer needs and improving customer service. Utilizing a relatively flat managerial structure and providing our employees with a sense of individual ownership support this goal.
• Effectively manage costs based on economic factors. We believe that our focus on our operating margins is essential to our continued success in the title insurance business. Regardless of the business cycle in which we may be operating, we seek to continue to evaluate and manage our cost structure and make appropriate adjustments where economic conditions dictate. This continual focus on our cost structure helps us to better maintain our operating margins.
Acquisitions, Dispositions, Minority Owned Operating Subsidiaries and Financings
Acquisitions have been an important part of our growth strategy and dispositions have been an important aspect of our strategy of returning value to shareholders. On an ongoing basis, with assistance from our advisors, we actively evaluate possible transactions, such as acquisitions and dispositions of business units and operating assets and business combination transactions.

Table of Contents
3
In the future, we may seek to sell certain investments or other assets to increase our liquidity. In the past we have obtained majority and minority investments in entities and securities where we see the potential to achieve above market returns. Fundamentally our goal is to acquire quality companies that are run by best in class management teams and that have attractive organic and acquired growth opportunities. We leverage our operational expertise and track record of growing industry-leading companies and also our active interaction with the acquired company's management directly or through our board of directors, to ultimately provide value for our shareholders.
There can be no assurance that any suitable opportunities will arise or that any particular transaction will be completed. We have made a number of acquisitions and dispositions over the past several years to strengthen and expand our service offerings and customer base in our various businesses, to expand into other businesses or where we otherwise saw value, and to monetize investments in assets and businesses.
Refer to discussion under Selected Financial Data and Certain Factors Affecting Comparability included in Item 6 and Item 7 of Part II of this Annual Report on Form 10-K (this "Annual Report"), respectively, which are incorporated by reference into this Item 1 of Part I, for further discussion of material dispositions of businesses.
Termination of Stewart Merger Agreement and Payment of Reverse Termination Fee
On March 18, 2018, we signed a merger agreement (the "Stewart Merger Agreement") to acquire Stewart Information Services Corporation ("Stewart") (NYSE: STC) (the "Stewart Merger"). On, September 9, 2019, we entered into a mutual Termination Agreement with Stewart (the “Termination Agreement”), pursuant to which the parties agreed to terminate the Stewart Merger Agreement, due to the Federal Trade Commission's issuance of an administrative complaint seeking to block the merger. In connection with the termination of the Stewart Merger Agreement, we paid to Stewart, on September 12, 2019, the Reverse Termination Fee (as defined in the Stewart Merger Agreement) consisting of $50 million in cash, which is included within other operating expenses in the Consolidated Statements of Earnings.
Pending Acquisition of FGL
On February 7, 2020, we signed a merger agreement (the “Merger Agreement”) to acquire FGL Holdings (“FGL”) (NYSE: FG) (the “FGL Merger”). Subject to the terms and conditions of the Merger Agreement, which has been approved by the board of directors of FNF, at the First Effective Time (as defined in the Merger Agreement), the ordinary shares of FGL (the “Ordinary Shares”), including all restricted Ordinary Shares (whether vested or unvested), issued and outstanding as of immediately prior to the First Effective Time (other than (i) shares owned by FGL and any of its subsidiaries or FNF and any of its subsidiaries and (ii) shares in respect of which dissenters rights have been properly exercised and perfected under Cayman law) will be converted into the right to receive $12.50 in cash or 0.2558 shares (“the Stock Consideration”) of common stock of FNF (“FNF Common Stock”), at the election of the holder thereof and subject to the proration mechanics set forth in the Merger Agreement. Pursuant to the Merger Agreement, all Ordinary Shares held by FNF and its subsidiaries will be converted into the right to receive the Stock Consideration. Each Series B Cumulative Preferred Share, all of which are held by FNF and its subsidiaries, will be converted into the right to receive a number of shares of FNF Common Stock that is equal to (i) the Liquidation Preference (as defined in the Merger Agreement) divided by (ii) the Reference Parent Common Stock Price (as defined in the Merger Agreement).
Additionally, all options to purchase Ordinary Shares (“FGL Share Option”) and phantom unit denominated in Ordinary Shares (“FGL Phantom Unit”), in each case, outstanding immediately prior to the First Effective Time, will be canceled and converted into options to purchase FNF Common Stock and phantom units denominated in FNF Common Stock at the First Effective Time (collectively, the “Rollover Awards”), as applicable. The Rollover Awards will generally be subject to the same terms and conditions as applicable to the applicable canceled FGL Share Option or FGL Phantom Unit immediately prior to the First Effective Time, except that (i) all performance-vesting criteria will be deemed satisfied at the First Effective Time at the levels described in the Merger Agreement and such Rollover Awards will be subject only to time-based vesting conditions after the First Effective Time, and (ii) immediately prior to the First Effective Time, additional time-vesting credits will be provided to holders in respect of FGL Share Options and FGL Phantom Units granted prior to January 1, 2020, as described in the Merger Agreement.
The closing of the transaction is subject to certain closing conditions, including the approval by FGL stockholders, federal and state regulatory approvals, and the satisfaction of other customary closing conditions. Closing is expected in the second or third quarter of 2020.
Title Insurance
Market for title insurance. According to Demotech Performance of Title Insurance Companies 2019 Edition, an annual compilation of financial information from the title insurance industry that is published by Demotech Inc. ("Demotech"), an independent firm, total operating income for the entire U.S. title insurance industry has increased over the last five years from approximately $12.2 billion in 2014 to $15.9 billion in 2018, which represents a $0.3 billion increase from 2017. The size of the industry is closely tied to various macroeconomic factors, including, but not limited to, growth in the gross domestic product,

Table of Contents
4
inflation, unemployment, the availability of credit, consumer confidence, interest rates, and sales volumes and prices for new and existing homes, as well as the volume of refinancing of previously issued mortgages.
Most real estate transactions consummated in the U.S. require the use of title insurance by a lending institution before the transaction can be completed. Generally, revenues from title insurance policies are directly correlated with the value of the property underlying the title policy, and appreciation or depreciation in the overall value of the real estate market are major factors in total industry revenues. Industry revenues are also driven by factors affecting the volume of real estate closings, such as the state of the economy, the availability of mortgage funding, and changes in interest rates, which affect demand for new mortgage loans and refinancing transactions.
The U.S. title insurance industry is concentrated among a handful of industry participants. According to Demotech, the top four title insurance groups accounted for 84% of net premiums written in 2018. Approximately 38 independent title insurance companies accounted for the remaining 16% of net premiums written in 2018. Consolidation has created opportunities for increased financial and operating efficiencies for the industry’s largest participants and should continue to drive profitability and market share in the industry.
Our Title segment revenue is closely related to the level of real estate activity which includes sales, mortgage financing and mortgage refinancing. For further discussion of current trends in real estate activity in the United States, see discussion under Business Trends and Conditions included in Item 7 of Part II of this Annual Report, which is incorporated by reference into this Item 1 of Part I.
Title Insurance Policies. Generally, real estate buyers and mortgage lenders purchase title insurance to insure good and marketable title to real estate and priority of lien. A brief generalized description of the process of issuing a title insurance policy is as follows:
• The customer, typically a real estate salesperson or broker, escrow agent, attorney or lender, places an order for a title policy.
• Company personnel note the specifics of the title policy order and place a request with the title company or its agents for a preliminary report or commitment.
• After the relevant historical data on the property is compiled, the title officer prepares a preliminary report that documents the current status of title to the property, any exclusions, exceptions and/or limitations that the title company might include in the policy, and specific issues that need to be addressed and resolved by the parties to the transaction before the title policy will be issued.
• The preliminary report is circulated to all the parties for satisfaction of any specific issues.• After the specific issues identified in the preliminary report are satisfied, an escrow agent closes the transaction in
accordance with the instructions of the parties and the title company’s conditions.• Once the transaction is closed and all monies have been released, the title company issues a title insurance policy.
In real estate transactions financed with a mortgage, virtually all real property mortgage lenders require their borrowers to obtain a title insurance policy at the time a mortgage loan is made. This lender’s policy insures the lender against any defect affecting the priority of the mortgage in an amount equal to the outstanding balance of the related mortgage loan. An owner’s policy is typically also issued, insuring the buyer against defects in title in an amount equal to the purchase price. In a refinancing transaction, only a lender’s policy is generally purchased because ownership of the property has not changed. In the case of an all-cash real estate purchase, no lender’s policy is issued but typically an owner’s title policy is issued.
Title insurance premiums paid in connection with a title insurance policy are based on (and typically are a percentage of) either the amount of the mortgage loan or the purchase price of the property insured. Applicable state insurance regulations or regulatory practices may limit the maximum, or in some cases the minimum, premium that can be charged on a policy. Title insurance premiums are due in full at the closing of the real estate transaction.
The amount of the insured risk or “face amount” of insurance under a title insurance policy is generally equal to either the amount of the loan secured by the property or the purchase price of the property. The title insurer is also responsible for the cost of defending the insured title against covered claims. The insurer’s actual exposure at any given time, however, generally is less than the total face amount of policies outstanding because the coverage of a lender’s policy is reduced and eventually terminated as a result of payments on the mortgage loan. A title insurer also generally does not know when a property has been sold or refinanced except when it issues the replacement coverage. Because of these factors, the total liability of a title underwriter on outstanding policies cannot be precisely determined.
Title insurance companies typically issue title insurance policies directly through branch offices or through affiliated title agencies, or indirectly through independent third party agencies unaffiliated with the title insurance company. Where the policy is issued through a branch or wholly-owned subsidiary agency operation, the title insurance company typically performs or directs the title search, and the premiums collected are retained by the title company. Where the policy is issued through an independent agent, the agent generally performs the title search (in some areas searches are performed by approved attorneys), examines the title, collects the premium and retains a majority of the premium. The remainder of the premium is remitted to the title insurance

Table of Contents
5
company as compensation, part of which is for bearing the risk of loss in the event a claim is made under the policy. The percentage of the premium retained by an agent varies from region to region and is sometimes regulated by the states. The title insurance company is obligated to pay title claims in accordance with the terms of its policies, regardless of whether the title insurance company issues policies through its direct operations or through independent agents.
Prior to issuing policies, title insurers and their agents attempt to reduce the risk of future claim losses by accurately performing title searches and examinations. A title insurance company’s predominant expense relates to such searches and examinations, the preparation of preliminary title reports, policies or commitments, the maintenance of "title plants,” which are indexed compilations of public records, maps and other relevant historical documents, and the facilitation and closing of real estate transactions. Claim losses generally result from errors made in the title search and examination process, from hidden defects such as fraud, forgery, incapacity, or missing heirs of the property, and from closing-related errors.
Residential real estate business results from the construction, sale, resale and refinancing of residential properties, while commercial real estate business results from similar activities with respect to properties with a business or commercial use. Commercial real estate title insurance policies insure title to commercial real property, and generally involve higher coverage amounts and yield higher premiums. Residential real estate transaction volume is primarily affected by macroeconomic and seasonal factors while commercial real estate transaction volume is affected primarily by fluctuations in local supply and demand conditions for commercial space.
Direct and Agency Operations. We provide title insurance services through our direct operations and through independent title insurance agents who issue title policies on behalf of our title insurance companies. Our title insurance companies determine the terms and conditions upon which they will insure title to the real property according to our underwriting standards, policies and procedures.
Direct Operations. Our direct operations include both the operations of our underwriters and those of affiliated agencies. In our direct operations, the title insurer issues the title insurance policy and retains the entire premium paid in connection with the transaction. Our direct operations provide the following benefits:
• higher margins because we retain the entire premium from each transaction instead of paying a commission to an independent agent;
• continuity of service levels to a broad range of customers; and• additional sources of income through escrow and closing services.
We have more than 1,300 offices throughout the U.S. primarily providing residential real estate title insurance. We continuously monitor the number of direct offices to make sure that it remains in line with our strategy and the current economic environment. Our commercial real estate title insurance business is operated primarily through our direct operations. We maintain direct operations for our commercial title insurance business in all the major real estate markets including Atlanta, Boston, Chicago, Dallas, Houston, Los Angeles, New York, Philadelphia, Phoenix, Seattle and Washington D.C.
Agency Operations. In our agency operations, the search and examination function is performed by an independent agent or the agent may purchase the search product from us. In either case, the agent is responsible to ensure that the search and examination is completed. The agent thus retains the majority of the title premium collected, with the balance remitted to the title underwriter for bearing the risk of loss in the event that a claim is made under the title insurance policy. Independent agents may select among several title underwriters based upon their relationship with the underwriter, the amount of the premium “split” offered by the underwriter, the overall terms and conditions of the agency agreement and the scope of services offered to the agent. Premium splits vary by geographic region, and in some states are fixed by insurance regulatory requirements. Our relationship with each agent is governed by an agency agreement defining how the agent issues a title insurance policy on our behalf. The agency agreement also sets forth the agent’s liability to us for policy losses attributable to the agent’s errors. An agency agreement is usually terminable without cause upon 30 days notice or immediately for cause. In determining whether to engage or retain an independent agent, we consider the agent’s experience, financial condition and loss history. For each agent with whom we enter into an agency agreement, we maintain financial and loss experience records. We also conduct periodic audits of our agents and strategically manage the number of agents with which we transact business in an effort to reduce future expenses and manage risks. As of December 31, 2019, we transact business with approximately 5,300 agents.
Fees and Premiums. One method of analyzing our business is to examine the level of premiums generated by direct and agency operations.
The following table presents the percentages of our title insurance premiums generated by direct and agency operations:
Table of Contents
6
Year Ended December 31, 2019 2018 2017 Amount % Amount % Amount % (Dollars in millions)
Direct $ 2,381 44.6% $ 2,221 45.2% $ 2,170 44.3%Agency 2,961 55.4 2,690 54.8 2,723 55.7 Total title insurance premiums $ 5,342 100.0% $ 4,911 100.0% $ 4,893 100.0%
The premium for title insurance is due in full when the real estate transaction is closed. We recognize title insurance premium revenues from direct operations upon the closing of the transaction. Premium revenues from agency operations include an accrual based on estimates of the volume of transactions that have closed in a particular period for which premiums have not yet been reported to us. The accrual for agency premiums is necessary because of the lag between the closing of these transactions and the reporting of these policies to us by the agent, and is based on estimates utilizing historical information.
Escrow, Title-Related and Other Fees. In addition to fees for underwriting title insurance policies, we derive a significant amount of our revenues from escrow and other title-related services including closing and trust activities, trustee sales guarantees, recordings and reconveyances, and home warranty products. The escrow and other services provided by us include all of those typically required in connection with residential and commercial real estate purchases and refinance activities. Escrow, title-related and other fees included in our Title segment represented approximately 28.9%, 30.6%, and 30.2% of total Title segment revenues in 2019, 2018, and 2017, respectively.
Sales and Marketing. We market and distribute our title and escrow products and services to customers in the residential and commercial market sectors of the real estate industry through customer solicitation by sales personnel. Although in many instances the individual homeowner is the beneficiary of a title insurance policy, we do not focus our marketing efforts on the homeowner. We actively encourage our sales personnel to develop new business relationships with persons in the real estate community, such as real estate sales agents and brokers, financial institutions, independent escrow companies and title agents, real estate developers, mortgage brokers and attorneys who order title insurance policies for their clients. While our smaller, local clients remain important, large customers, such as national residential mortgage lenders, real estate investment trusts and developers are an important part of our business. The buying criteria of locally based clients differ from those of large, geographically diverse customers in that the former tend to emphasize personal relationships and ease of transaction execution, while the latter generally place more emphasis on consistent product delivery across diverse geographical regions and the ability of service providers to meet their information systems requirements for electronic product delivery.
Claims. An important part of our operations is the handling of title and escrow claims. We employ a large staff of attorneys in our claims department. Our claims processing centers are located in Omaha, Nebraska and Jacksonville, Florida. In-house claims counsel are also located in other parts of the country.
Claims result from a wide range of causes. These causes generally include, but are not limited to, search and exam errors, forgeries, incorrect legal descriptions, signature and notary errors, unrecorded liens, mechanics’ liens, the failure to pay off existing liens, mortgage lending fraud, mishandling or theft of settlement funds (including independent agency theft), and mistakes in the escrow process. Under our policies, we are required to defend insureds when covered claims are filed against their interest in the property. Some claimants seek damages in excess of policy limits. Those claims are based on various legal theories, including in some cases allegations of negligence or an intentional tort. We occasionally incur losses in excess of policy limits. Experience shows that most policy claims and claim payments are made in the first five years after the policy has been issued, although claims may also be reported and paid many years later.
Title losses due to independent agency defalcations typically occur when the independent agency misappropriates funds from escrow accounts under its control. Such losses are usually discovered when the independent agency fails to pay off an outstanding mortgage loan at closing (or immediately thereafter) from the proceeds of the new loan. Once the previous lender determines that its loan has not been paid off timely, it will file a claim against the title insurer.
Claims can be complex, vary greatly in dollar amounts and are affected by economic and market conditions and the legal environment existing at the time claims are processed. In our commercial title business, we may issue polices with face amounts well in excess of $100 million, and from time to time claims are submitted with respect to large policies. We believe we are appropriately reserved with respect to all claims (large and small) that we currently face. Occasionally we experience large losses from title policies that have been issued or from our escrow operations, or overall worsening loss payment experience, which require us to increase our title loss reserves. These events are unpredictable and adversely affect our earnings. Claims can result in litigation in which we may represent our insured and/or ourselves. We consider this type of litigation to be an ordinary course aspect of the conduct of our business.
Reinsurance and Coinsurance. We limit our maximum loss exposure by reinsuring risks with other insurers under excess of loss and case-by-case (“facultative”) reinsurance agreements. Reinsurance agreements generally provide that the reinsurer is liable
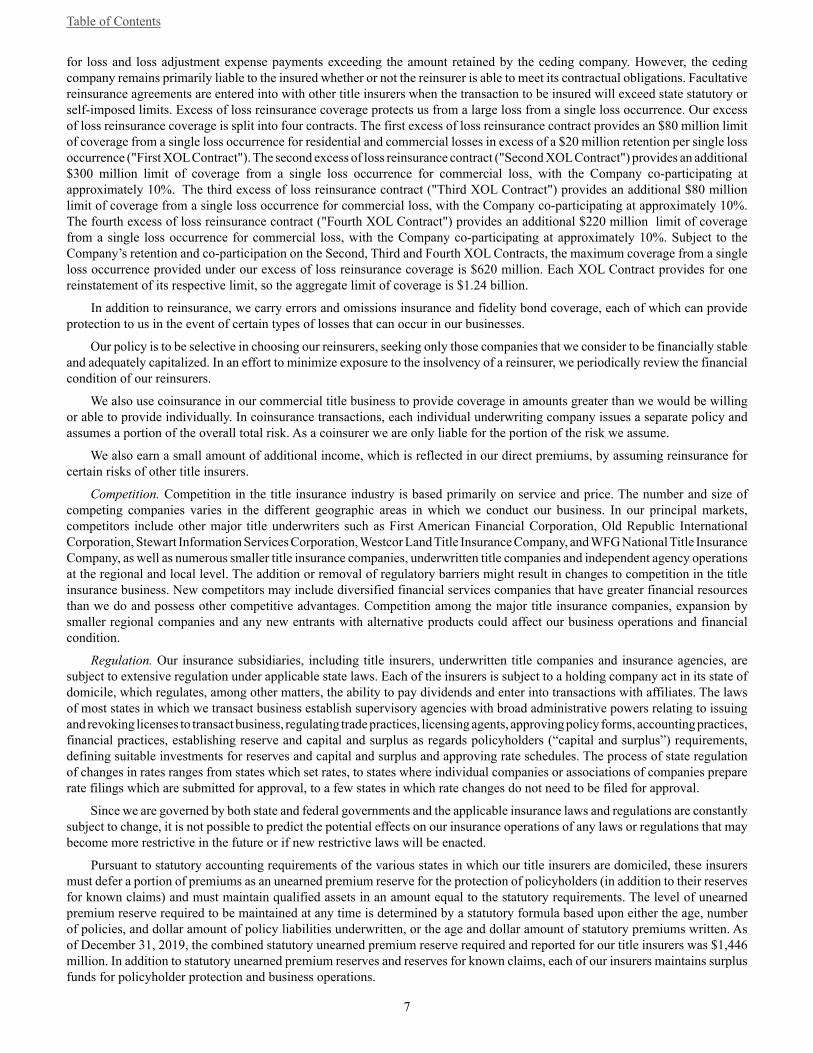
Table of Contents
7
for loss and loss adjustment expense payments exceeding the amount retained by the ceding company. However, the ceding company remains primarily liable to the insured whether or not the reinsurer is able to meet its contractual obligations. Facultative reinsurance agreements are entered into with other title insurers when the transaction to be insured will exceed state statutory or self-imposed limits. Excess of loss reinsurance coverage protects us from a large loss from a single loss occurrence. Our excess of loss reinsurance coverage is split into four contracts. The first excess of loss reinsurance contract provides an $80 million limit of coverage from a single loss occurrence for residential and commercial losses in excess of a $20 million retention per single loss occurrence ("First XOL Contract"). The second excess of loss reinsurance contract ("Second XOL Contract") provides an additional $300 million limit of coverage from a single loss occurrence for commercial loss, with the Company co-participating at approximately 10%. The third excess of loss reinsurance contract ("Third XOL Contract") provides an additional $80 million limit of coverage from a single loss occurrence for commercial loss, with the Company co-participating at approximately 10%. The fourth excess of loss reinsurance contract ("Fourth XOL Contract") provides an additional $220 million limit of coverage from a single loss occurrence for commercial loss, with the Company co-participating at approximately 10%. Subject to the Company’s retention and co-participation on the Second, Third and Fourth XOL Contracts, the maximum coverage from a single loss occurrence provided under our excess of loss reinsurance coverage is $620 million. Each XOL Contract provides for one reinstatement of its respective limit, so the aggregate limit of coverage is $1.24 billion.
In addition to reinsurance, we carry errors and omissions insurance and fidelity bond coverage, each of which can provide protection to us in the event of certain types of losses that can occur in our businesses.
Our policy is to be selective in choosing our reinsurers, seeking only those companies that we consider to be financially stable and adequately capitalized. In an effort to minimize exposure to the insolvency of a reinsurer, we periodically review the financial condition of our reinsurers.
We also use coinsurance in our commercial title business to provide coverage in amounts greater than we would be willing or able to provide individually. In coinsurance transactions, each individual underwriting company issues a separate policy and assumes a portion of the overall total risk. As a coinsurer we are only liable for the portion of the risk we assume.
We also earn a small amount of additional income, which is reflected in our direct premiums, by assuming reinsurance for certain risks of other title insurers.
Competition. Competition in the title insurance industry is based primarily on service and price. The number and size of competing companies varies in the different geographic areas in which we conduct our business. In our principal markets, competitors include other major title underwriters such as First American Financial Corporation, Old Republic International Corporation, Stewart Information Services Corporation, Westcor Land Title Insurance Company, and WFG National Title Insurance Company, as well as numerous smaller title insurance companies, underwritten title companies and independent agency operations at the regional and local level. The addition or removal of regulatory barriers might result in changes to competition in the title insurance business. New competitors may include diversified financial services companies that have greater financial resources than we do and possess other competitive advantages. Competition among the major title insurance companies, expansion by smaller regional companies and any new entrants with alternative products could affect our business operations and financial condition.
Regulation. Our insurance subsidiaries, including title insurers, underwritten title companies and insurance agencies, are subject to extensive regulation under applicable state laws. Each of the insurers is subject to a holding company act in its state of domicile, which regulates, among other matters, the ability to pay dividends and enter into transactions with affiliates. The laws of most states in which we transact business establish supervisory agencies with broad administrative powers relating to issuing and revoking licenses to transact business, regulating trade practices, licensing agents, approving policy forms, accounting practices, financial practices, establishing reserve and capital and surplus as regards policyholders (“capital and surplus”) requirements, defining suitable investments for reserves and capital and surplus and approving rate schedules. The process of state regulation of changes in rates ranges from states which set rates, to states where individual companies or associations of companies prepare rate filings which are submitted for approval, to a few states in which rate changes do not need to be filed for approval.
Since we are governed by both state and federal governments and the applicable insurance laws and regulations are constantly subject to change, it is not possible to predict the potential effects on our insurance operations of any laws or regulations that may become more restrictive in the future or if new restrictive laws will be enacted.
Pursuant to statutory accounting requirements of the various states in which our title insurers are domiciled, these insurers must defer a portion of premiums as an unearned premium reserve for the protection of policyholders (in addition to their reserves for known claims) and must maintain qualified assets in an amount equal to the statutory requirements. The level of unearned premium reserve required to be maintained at any time is determined by a statutory formula based upon either the age, number of policies, and dollar amount of policy liabilities underwritten, or the age and dollar amount of statutory premiums written. As of December 31, 2019, the combined statutory unearned premium reserve required and reported for our title insurers was $1,446 million. In addition to statutory unearned premium reserves and reserves for known claims, each of our insurers maintains surplus funds for policyholder protection and business operations.
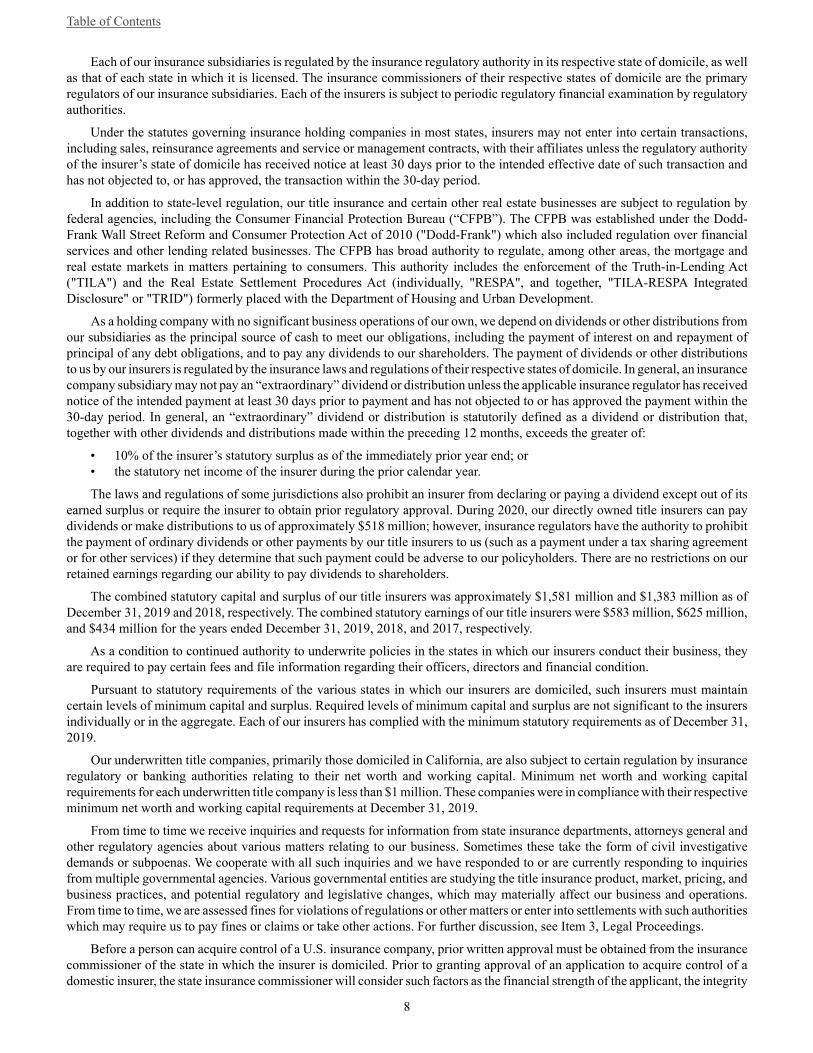
Table of Contents
8
Each of our insurance subsidiaries is regulated by the insurance regulatory authority in its respective state of domicile, as well as that of each state in which it is licensed. The insurance commissioners of their respective states of domicile are the primary regulators of our insurance subsidiaries. Each of the insurers is subject to periodic regulatory financial examination by regulatory authorities.
Under the statutes governing insurance holding companies in most states, insurers may not enter into certain transactions, including sales, reinsurance agreements and service or management contracts, with their affiliates unless the regulatory authority of the insurer’s state of domicile has received notice at least 30 days prior to the intended effective date of such transaction and has not objected to, or has approved, the transaction within the 30-day period.
In addition to state-level regulation, our title insurance and certain other real estate businesses are subject to regulation by federal agencies, including the Consumer Financial Protection Bureau (“CFPB”). The CFPB was established under the Dodd-Frank Wall Street Reform and Consumer Protection Act of 2010 ("Dodd-Frank") which also included regulation over financial services and other lending related businesses. The CFPB has broad authority to regulate, among other areas, the mortgage and real estate markets in matters pertaining to consumers. This authority includes the enforcement of the Truth-in-Lending Act ("TILA") and the Real Estate Settlement Procedures Act (individually, "RESPA", and together, "TILA-RESPA Integrated Disclosure" or "TRID") formerly placed with the Department of Housing and Urban Development.
As a holding company with no significant business operations of our own, we depend on dividends or other distributions from our subsidiaries as the principal source of cash to meet our obligations, including the payment of interest on and repayment of principal of any debt obligations, and to pay any dividends to our shareholders. The payment of dividends or other distributions to us by our insurers is regulated by the insurance laws and regulations of their respective states of domicile. In general, an insurance company subsidiary may not pay an “extraordinary” dividend or distribution unless the applicable insurance regulator has received notice of the intended payment at least 30 days prior to payment and has not objected to or has approved the payment within the 30-day period. In general, an “extraordinary” dividend or distribution is statutorily defined as a dividend or distribution that, together with other dividends and distributions made within the preceding 12 months, exceeds the greater of:
• 10% of the insurer’s statutory surplus as of the immediately prior year end; or• the statutory net income of the insurer during the prior calendar year.
The laws and regulations of some jurisdictions also prohibit an insurer from declaring or paying a dividend except out of its earned surplus or require the insurer to obtain prior regulatory approval. During 2020, our directly owned title insurers can pay dividends or make distributions to us of approximately $518 million; however, insurance regulators have the authority to prohibit the payment of ordinary dividends or other payments by our title insurers to us (such as a payment under a tax sharing agreement or for other services) if they determine that such payment could be adverse to our policyholders. There are no restrictions on our retained earnings regarding our ability to pay dividends to shareholders.
The combined statutory capital and surplus of our title insurers was approximately $1,581 million and $1,383 million as of December 31, 2019 and 2018, respectively. The combined statutory earnings of our title insurers were $583 million, $625 million, and $434 million for the years ended December 31, 2019, 2018, and 2017, respectively.
As a condition to continued authority to underwrite policies in the states in which our insurers conduct their business, they are required to pay certain fees and file information regarding their officers, directors and financial condition.
Pursuant to statutory requirements of the various states in which our insurers are domiciled, such insurers must maintain certain levels of minimum capital and surplus. Required levels of minimum capital and surplus are not significant to the insurers individually or in the aggregate. Each of our insurers has complied with the minimum statutory requirements as of December 31, 2019.
Our underwritten title companies, primarily those domiciled in California, are also subject to certain regulation by insurance regulatory or banking authorities relating to their net worth and working capital. Minimum net worth and working capital requirements for each underwritten title company is less than $1 million. These companies were in compliance with their respective minimum net worth and working capital requirements at December 31, 2019.
From time to time we receive inquiries and requests for information from state insurance departments, attorneys general and other regulatory agencies about various matters relating to our business. Sometimes these take the form of civil investigative demands or subpoenas. We cooperate with all such inquiries and we have responded to or are currently responding to inquiries from multiple governmental agencies. Various governmental entities are studying the title insurance product, market, pricing, and business practices, and potential regulatory and legislative changes, which may materially affect our business and operations. From time to time, we are assessed fines for violations of regulations or other matters or enter into settlements with such authorities which may require us to pay fines or claims or take other actions. For further discussion, see Item 3, Legal Proceedings.
Before a person can acquire control of a U.S. insurance company, prior written approval must be obtained from the insurance commissioner of the state in which the insurer is domiciled. Prior to granting approval of an application to acquire control of a domestic insurer, the state insurance commissioner will consider such factors as the financial strength of the applicant, the integrity
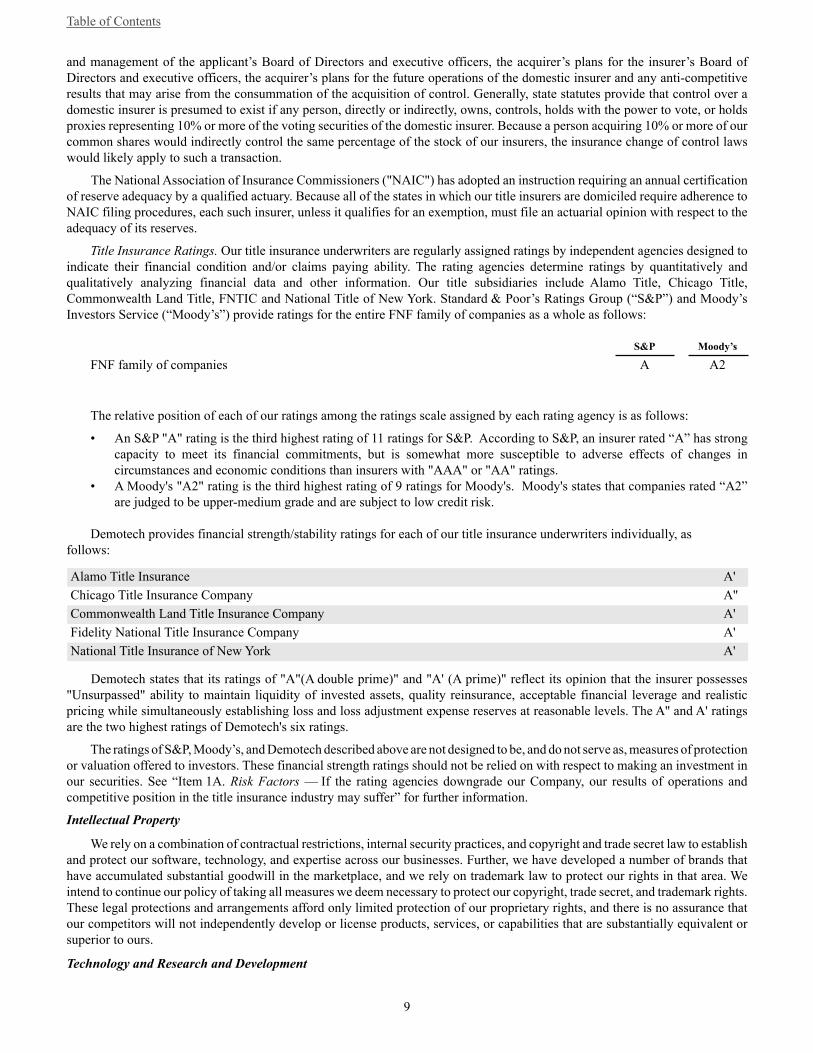
Table of Contents
9
and management of the applicant’s Board of Directors and executive officers, the acquirer’s plans for the insurer’s Board of Directors and executive officers, the acquirer’s plans for the future operations of the domestic insurer and any anti-competitive results that may arise from the consummation of the acquisition of control. Generally, state statutes provide that control over a domestic insurer is presumed to exist if any person, directly or indirectly, owns, controls, holds with the power to vote, or holds proxies representing 10% or more of the voting securities of the domestic insurer. Because a person acquiring 10% or more of our common shares would indirectly control the same percentage of the stock of our insurers, the insurance change of control laws would likely apply to such a transaction.
The National Association of Insurance Commissioners ("NAIC") has adopted an instruction requiring an annual certification of reserve adequacy by a qualified actuary. Because all of the states in which our title insurers are domiciled require adherence to NAIC filing procedures, each such insurer, unless it qualifies for an exemption, must file an actuarial opinion with respect to the adequacy of its reserves.
Title Insurance Ratings. Our title insurance underwriters are regularly assigned ratings by independent agencies designed to indicate their financial condition and/or claims paying ability. The rating agencies determine ratings by quantitatively and qualitatively analyzing financial data and other information. Our title subsidiaries include Alamo Title, Chicago Title, Commonwealth Land Title, FNTIC and National Title of New York. Standard & Poor’s Ratings Group (“S&P”) and Moody’s Investors Service (“Moody’s”) provide ratings for the entire FNF family of companies as a whole as follows:
S&P Moody’s
FNF family of companies A A2
The relative position of each of our ratings among the ratings scale assigned by each rating agency is as follows:
• An S&P "A" rating is the third highest rating of 11 ratings for S&P. According to S&P, an insurer rated “A” has strong capacity to meet its financial commitments, but is somewhat more susceptible to adverse effects of changes in circumstances and economic conditions than insurers with "AAA" or "AA" ratings.
• A Moody's "A2" rating is the third highest rating of 9 ratings for Moody's. Moody's states that companies rated “A2” are judged to be upper-medium grade and are subject to low credit risk.
Demotech provides financial strength/stability ratings for each of our title insurance underwriters individually, as follows:
Alamo Title Insurance A'Chicago Title Insurance Company A''Commonwealth Land Title Insurance Company A'Fidelity National Title Insurance Company A'National Title Insurance of New York A'
Demotech states that its ratings of "A"(A double prime)" and "A' (A prime)" reflect its opinion that the insurer possesses "Unsurpassed" ability to maintain liquidity of invested assets, quality reinsurance, acceptable financial leverage and realistic pricing while simultaneously establishing loss and loss adjustment expense reserves at reasonable levels. The A'' and A' ratings are the two highest ratings of Demotech's six ratings.
The ratings of S&P, Moody’s, and Demotech described above are not designed to be, and do not serve as, measures of protection or valuation offered to investors. These financial strength ratings should not be relied on with respect to making an investment in our securities. See “Item 1A. Risk Factors — If the rating agencies downgrade our Company, our results of operations and competitive position in the title insurance industry may suffer” for further information.
Intellectual Property
We rely on a combination of contractual restrictions, internal security practices, and copyright and trade secret law to establish and protect our software, technology, and expertise across our businesses. Further, we have developed a number of brands that have accumulated substantial goodwill in the marketplace, and we rely on trademark law to protect our rights in that area. We intend to continue our policy of taking all measures we deem necessary to protect our copyright, trade secret, and trademark rights. These legal protections and arrangements afford only limited protection of our proprietary rights, and there is no assurance that our competitors will not independently develop or license products, services, or capabilities that are substantially equivalent or superior to ours.
Technology and Research and Development
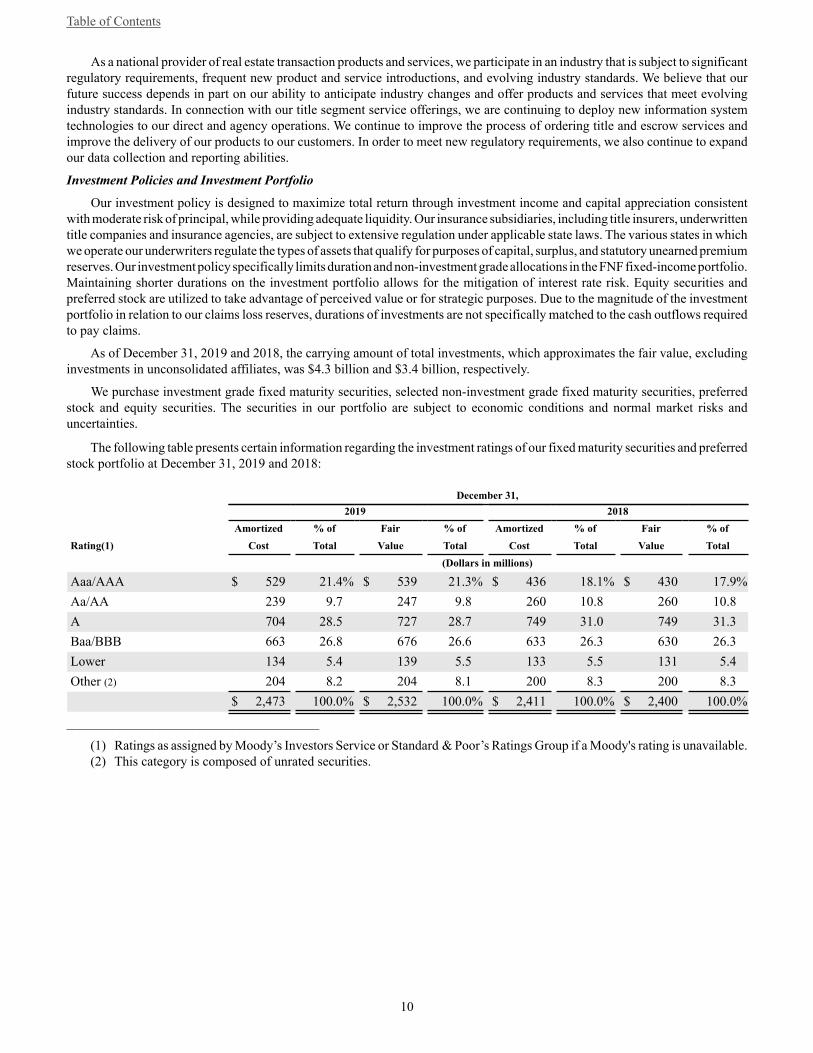
Table of Contents
10
As a national provider of real estate transaction products and services, we participate in an industry that is subject to significant regulatory requirements, frequent new product and service introductions, and evolving industry standards. We believe that our future success depends in part on our ability to anticipate industry changes and offer products and services that meet evolving industry standards. In connection with our title segment service offerings, we are continuing to deploy new information system technologies to our direct and agency operations. We continue to improve the process of ordering title and escrow services and improve the delivery of our products to our customers. In order to meet new regulatory requirements, we also continue to expand our data collection and reporting abilities.
Investment Policies and Investment Portfolio
Our investment policy is designed to maximize total return through investment income and capital appreciation consistent with moderate risk of principal, while providing adequate liquidity. Our insurance subsidiaries, including title insurers, underwritten title companies and insurance agencies, are subject to extensive regulation under applicable state laws. The various states in which we operate our underwriters regulate the types of assets that qualify for purposes of capital, surplus, and statutory unearned premium reserves. Our investment policy specifically limits duration and non-investment grade allocations in the FNF fixed-income portfolio. Maintaining shorter durations on the investment portfolio allows for the mitigation of interest rate risk. Equity securities and preferred stock are utilized to take advantage of perceived value or for strategic purposes. Due to the magnitude of the investment portfolio in relation to our claims loss reserves, durations of investments are not specifically matched to the cash outflows required to pay claims.
As of December 31, 2019 and 2018, the carrying amount of total investments, which approximates the fair value, excluding investments in unconsolidated affiliates, was $4.3 billion and $3.4 billion, respectively.
We purchase investment grade fixed maturity securities, selected non-investment grade fixed maturity securities, preferred stock and equity securities. The securities in our portfolio are subject to economic conditions and normal market risks and uncertainties.
The following table presents certain information regarding the investment ratings of our fixed maturity securities and preferred stock portfolio at December 31, 2019 and 2018:
December 31, 2019 2018
Amortized % of Fair % of Amortized % of Fair % ofRating(1) Cost Total Value Total Cost Total Value Total
(Dollars in millions)
Aaa/AAA $ 529 21.4% $ 539 21.3% $ 436 18.1% $ 430 17.9%Aa/AA 239 9.7 247 9.8 260 10.8 260 10.8A 704 28.5 727 28.7 749 31.0 749 31.3Baa/BBB 663 26.8 676 26.6 633 26.3 630 26.3Lower 134 5.4 139 5.5 133 5.5 131 5.4Other (2) 204 8.2 204 8.1 200 8.3 200 8.3 $ 2,473 100.0% $ 2,532 100.0% $ 2,411 100.0% $ 2,400 100.0%
______________________________________
(1) Ratings as assigned by Moody’s Investors Service or Standard & Poor’s Ratings Group if a Moody's rating is unavailable.(2) This category is composed of unrated securities.

Table of Contents
11
The following table presents certain information regarding contractual maturities of our fixed maturity securities at December 31, 2019:
December 31, 2019
Amortized % of Fair % ofMaturity Cost Total Value Total
(Dollars in millions)
One year or less $ 341 16.8% $ 341 16.3%After one year through five years 1,093 53.9 1,117 53.4After five years through ten years 403 19.8 424 20.3After ten years 132 6.5 146 7.0Mortgage-backed/asset-backed securities 60 3.0 62 3.0 $ 2,029 100.0% $ 2,090 100.0%
Expected maturities may differ from contractual maturities because certain borrowers have the right to call or prepay obligations with or without call or prepayment penalties. Because of the potential for prepayment on mortgage-backed and asset-backed securities, they are not categorized by contractual maturity.
At December 31, 2019 and 2018, we held $131 million and $137 million, respectively, in investments that are accounted for using the equity method of accounting.
As of December 31, 2019 and 2018, other long-term investments were $153 million and $135 million, respectively. Other long-term investments include other investments carried at fair value and company-owned life insurance policies carried at cash surrender value.
Short-term investments, which consist primarily of commercial paper and money market instruments which have an original maturity of one year or less, are carried at amortized cost, which approximates fair value. As of December 31, 2019 and 2018, short-term investments amounted to $876 million and $480 million, respectively.
Our investment results for the years ended December 31, 2019, 2018 and 2017 were as follows:
December 31, 2019 2018 2017 (Dollars in millions)
Net investment income (1) $ 206 $ 169 $ 139Average invested assets $ 3,768 $ 3,291 $ 3,296Effective return on average invested assets 5.5% 5.1% 4.2%
______________________________________(1) Net investment income as reported in our Consolidated Statements of Earnings has been adjusted in the presentation
above to provide the tax equivalent yield on tax exempt investments and to exclude interest earned on cash and cash equivalents. Net investment income includes fees earned by holding customer funds in escrow (off-balance sheet) during facilitation of tax-deferred property exchanges. See Note D Investments to our Consolidated Financial Statements included in Item 8 of Part II of this Annual Report for a detail of our interest income.
Loss Reserves
For information about our loss reserves, see Item 7. Management’s Discussion and Analysis of Financial Condition and Results of Operations — Critical Accounting Estimates.
Employees
As of January 31, 2020, we had 25,063 full-time equivalent employees, which includes 24,443 in our Title segment and 620 in our Corporate and other segment. We monitor our staffing levels based on current economic activity. None of our employees are subject to collective bargaining agreements. We believe that our relations with employees are generally good.
Financial Information by Operating Segment
For financial information by operating segment, see Note R Segment Information to our Consolidated Financial Statements included in Item 8 of Part II of this Annual Report.
Statement Regarding Forward-Looking Information

Table of Contents
12
The statements contained in this Annual Report or in our other documents or in oral presentations or other statements made by our management that are not purely historical are forward-looking statements within the meaning of Section 27A of the Securities Act of 1933, as amended, and Section 21E of the Securities Exchange Act of 1934, as amended (the "Exchange Act"), including statements regarding our expectations, hopes, intentions, or strategies regarding the future. These statements relate to, among other things, future financial and operating results of the Company. In many cases, you can identify forward-looking statements by terminology such as “may,” “will,” “should,” “expect,” “plan,” “anticipate,” “believe,” “estimate,” “predict,” “potential,” or “continue,” or the negative of these terms and other comparable terminology. Actual results could differ materially from those anticipated in these statements as a result of a number of factors, including, but not limited to the following:
• changes in general economic, business, and political conditions, including changes in the financial markets;• the severity of our title insurance claims;• downgrade of our credit rating by rating agencies;• adverse changes in the level of real estate activity, which may be caused by, among other things, high or increasing interest
rates, a limited supply of mortgage funding, increased mortgage defaults, or a weak U.S. economy;• compliance with extensive government regulation of our operating subsidiaries and adverse changes in applicable laws
or regulations or in their application by regulators;• inability to obtain without unanticipated conditions or significant delay, if at all, the necessary approvals to consummate
the FGL Merger;• inability to timely satisfy or obtain waiver of any of the closing conditions to the proposed FGL Merger;• failure to successfully integrate FGL’s business with that of FNF, that such integration may be more difficult, time-
consuming or costly than expected or that the expected benefits of the FGL Merger will not be realized;• potential impact of the announcement or consummation of the FGL Merger on relationships, including employees,
suppliers, customers and competitors;• regulatory investigations of the title insurance industry;• loss of key personnel that could negatively affect our financial results and impair our operating abilities;• our business concentration in the States of California and Texas are the source of approximately 14.3% and 13.8%,
respectively, of our title insurance premiums;• our potential inability to find suitable acquisition candidates, as well as the risks associated with acquisitions in lines of
business that will not necessarily be limited to our traditional areas of focus, or difficulties integrating acquisitions;• our dependence on distributions from our title insurance underwriters as our main source of cash flow;• competition from other title insurance companies; and• other risks detailed in "Risk Factors" below and elsewhere in this document and in our other filings with the SEC.
We are not under any obligation (and expressly disclaim any such obligation) to update or alter our forward-looking statements, whether as a result of new information, future events or otherwise. You should carefully consider the possibility that actual results may differ materially from our forward-looking statements.
Additional Information
Our website address is www.fnf.com. We make available free of charge on or through our website our Annual Report on Form 10-K, Quarterly Reports on Form 10-Q, Current Reports on Form 8-K and all amendments to those reports filed or furnished pursuant to Section 13(a) or 15(d) of the Exchange Act as soon as reasonably practicable after such material is electronically filed with or furnished to the Securities and Exchange Commission. However, the information found on our website is not part of this or any other report.
Item 1A. Risk Factors
In addition to the normal risks of business, we are subject to significant risks and uncertainties, including those listed below and others described elsewhere in this Annual Report. Any of the risks described herein could result in a significant or material adverse effect on our results of operations or financial condition.
General
We have recorded goodwill as a result of prior acquisitions, and an economic downturn could cause these balances to become impaired, requiring write-downs that would reduce our operating income.
Goodwill aggregated approximately $2,727 million, or 25.5% of our total assets, as of December 31, 2019. Current accounting rules require that goodwill be assessed for impairment at least annually or whenever changes in circumstances indicate that the carrying amount may not be recoverable from estimated future cash flows. Factors that may be considered a change in circumstance indicating the carrying value of our intangible assets, including goodwill, may not be recoverable include, but are not limited to, significant underperformance relative to historical or projected future operating results, a significant decline in our stock price and market capitalization, and negative industry or economic trends. In the year ended December 31, 2018, we recorded $3 million
Table of Contents
13
of goodwill impairment related to a real estate brokerage subsidiary in our Corporate and other segment. For the years ended December 31, 2019 and 2017, no goodwill impairment charge was recorded. However, if there is an economic downturn in the future, the carrying amount of our goodwill may no longer be recoverable, and we may be required to record an impairment charge, which would have a negative impact on our results of operations and financial condition. We will continue to monitor our market capitalization and the impact of the economy to determine if there is an impairment of goodwill in future periods.
Our management has historically sought to grow through acquisitions, both in our current lines of business as well as in lines of business outside of our traditional areas of focus or geographic areas. This expansion of our business subjects us to associated risks, such as risks and uncertainties associated with new companies, the diversion of management’s attention and lack of experience in operating unrelated businesses, and may affect our credit and ability to repay our debt.
Our management has historically sought to grow through acquisitions, both in our current lines of business, as well as lines of business that are not directly tied to or synergistic with our current operations. Accordingly, we have in the past acquired, and may in the future acquire, businesses in industries or geographic areas with which management is less familiar than we are with our current businesses. These activities involve risks that could adversely affect our operating results, due to uncertainties involved with new companies, diversion of management’s attention and lack of substantial experience in operating such businesses. There can be no guarantee that we will not enter into transactions or make acquisitions that will cause us to incur additional debt, increase our exposure to market and other risks and cause our credit or financial strength ratings to decline.
We are a holding company and depend on distributions from our subsidiaries for cash.
We are a holding company whose primary assets are the securities of our operating subsidiaries. Our ability to pay interest on our outstanding debt and our other obligations and to pay dividends is dependent on the ability of our subsidiaries to pay dividends or make other distributions or payments to us. If our operating subsidiaries are not able to pay dividends to us, we may not be able to meet our obligations or pay dividends on our common stock.
Our title insurance subsidiaries must comply with state laws which require them to maintain minimum amounts of working capital, surplus and reserves, and place restrictions on the amount of dividends that they can distribute to us. Compliance with these laws will limit the amounts our regulated subsidiaries can dividend to us. During 2020, our title insurers may pay dividends or make distributions to us of approximately $518 million; however, insurance regulators have the authority to prohibit the payment of ordinary dividends or other payments by our title insurers to us if they determine that such payment could be adverse to our policyholders.
The maximum dividend permitted by law is not necessarily indicative of an insurer’s actual ability to pay dividends, which may be constrained by business and regulatory considerations, such as the impact of dividends on surplus, which could affect an insurer’s ratings or competitive position, the amount of premiums that can be written and the ability to pay future dividends. Further, depending on business and regulatory conditions, we may in the future need to retain cash in our underwriters or even contribute cash to one or more of them in order to maintain their ratings or their statutory capital position. Such a requirement could be the result of investment losses, reserve charges, adverse operating conditions in the current economic environment or changes in interpretation of statutory accounting requirements by regulators.
The loss of key personnel could negatively affect our financial results and impair our operating abilities.
Our success substantially depends on our ability to attract and retain key members of our senior management team and officers. If we lose one or more of these key employees, our operating results and in turn the value of our common stock could be materially adversely affected. Although we have employment agreements with many of our officers, there can be no assurance that the entire term of the employment agreement will be served or that the employment agreement will be renewed upon expiration.
Failure of our information security systems or processes could result in a loss or disclosure of confidential information, damage to our reputation, monetary losses, additional costs and impairment of our ability to conduct business effectively.
Our operations are highly dependent upon the effective operation of our computer systems. We use our computer systems to receive, process, store and transmit sensitive personal consumer data (such as names and addresses, social security numbers, driver's license numbers, credit cards and bank account information) and important business information of our customers. We also electronically manage substantial cash, investment assets and escrow account balances on behalf of ourselves and our customers, as well as financial information about our businesses generally. The integrity of our computer systems and the protection of the information that resides on such systems are important to our successful operation. If we fail to maintain an adequate security infrastructure, adapt to emerging security threats or follow our internal business processes with respect to security, the information or assets we hold could be compromised. Further, even if we, or third parties to which we outsource certain information technology services, maintain a reasonable, industry-standard information security infrastructure to mitigate these risks, the inherent risk that unauthorized access to information or assets remains. This risk is increased by transmittal of information over the internet and the increased threat and sophistication of cyber criminals. While, to date, we believe that we have not experienced a material breach of our computer systems, the occurrence or scope of such events is not always apparent. If additional information regarding an event previously considered immaterial is discovered, or a new event were to occur, it could potentially have a material adverse

Table of Contents
14
effect on our operations or financial condition. In addition, some laws and certain of our contracts require notification of various parties, including regulators, consumers or customers, in the event that confidential or personal information has or may have been taken or accessed by unauthorized parties. Such notifications can potentially result, among other things, in adverse publicity, diversion of management and other resources, the attention of regulatory authorities, the imposition of fines, and disruptions in business operations, the effects of which may be material. Any inability to prevent security or privacy breaches, or the perception that such breaches may occur, could inhibit our ability to retain or attract new clients and/or result in financial losses, litigation, increased costs, negative publicity, or other adverse consequences to our business.
Further, our financial institution clients have obligations to safeguard their information technology systems and the confidentiality of customer information. In certain of our businesses, we are bound contractually and/or by regulation to comply with the same requirements. If we fail to comply with these regulations and requirements, we could be exposed to suits for breach of contract, governmental proceedings or the imposition of fines. In addition, future adoption of more restrictive privacy laws, rules or industry security requirements by federal or state regulatory bodies or by a specific industry in which we do business could have an adverse impact on us through increased costs or restrictions on business processes.
If economic and credit market conditions deteriorate, it could have a material adverse impact on our investment portfolio.
Our investment portfolio is exposed to economic and financial market risks, including changes in interest rates, credit markets and prices of marketable equity and fixed-income securities. Our investment policy is designed to maximize total return through investment income and capital appreciation consistent with moderate risk of principal, while providing adequate liquidity and complying with internal and regulatory guidelines. To achieve this objective, our marketable debt investments are primarily investment grade, liquid, fixed-income securities and money market instruments denominated in U.S. dollars. We make investments in certain equity securities and preferred stock in order to take advantage of perceived value and for strategic purposes. Economic and credit market conditions may adversely affect the ability of some issuers of investment securities to repay their obligations and affect the values of investment securities. If the carrying value of our investments exceeds the fair value, and the decline in fair value is deemed to be other-than-temporary, we will be required to write down the value of our investments, which could have a material negative impact on our results of operations and financial condition.
Failure of our enterprise-wide risk management processes could result in unexpected monetary losses, damage to our reputation, additional costs or impairment of our ability to conduct business effectively.
As a large insurance entity and a publicly traded company, we have always had risk management functions, policies and procedures throughout our operations and management. These functions include but are not limited to departments dedicated to enterprise risk management and information technology risk management, information security, business continuity, lender strategy and development, and vendor risk management. These policies and procedures have evolved over the years as we continually reassess our processes both internally and to comply with changes in the regulatory environment. Due to limitations inherent in any internal process, if our risk management processes prove unsuccessful at identifying and responding to risks, we could incur unexpected monetary losses, damage to our reputation, additional costs or impairment of our ability to conduct business effectively.
We are the subject of various legal proceedings that could have a material adverse effect on our results of operations.
We are involved from time to time in various legal proceedings, including in some cases class-action lawsuits and regulatory inquiries, investigations or other proceedings. If we are unsuccessful in our defense of litigation matters or regulatory proceedings, we may be forced to pay damages, fines or penalties and/or change our business practices, any of which could have a material adverse effect on our business and results of operations. See Note M Commitments and Contingencies to our Consolidated Financial Statements included in Item 8 of Part II of this Annual Report for further discussion of pending litigation and regulatory matters and our related accrual.
If adverse changes in the levels of real estate activity occur, our revenues may decline.
Title insurance revenue is closely related to the level of real estate activity which includes sales, mortgage financing and mortgage refinancing. The levels of real estate activity are primarily affected by the average price of real estate sales, the availability of funds to finance purchases and mortgage interest rates.
We have found that residential real estate activity generally decreases in the following situations:
• when mortgage interest rates are high or increasing;• when the mortgage funding supply is limited; • when housing inventory is limited or home prices are high or increasing; and• when the United States economy is weak, including high unemployment levels.
Declines in the level of real estate activity or the average price of real estate sales are likely to adversely affect our title insurance revenues. The Mortgage Bankers Association's ("MBA") Mortgage Finance Forecast as of January 17, 2020 calculates an approximately $2.1 trillion mortgage origination market for 2019, which would be an increase from 2018 resulting primarily from increased refinance activity. However, the MBA predicts overall mortgage originations in 2020 and 2021 will decrease slightly when compared to 2019. Our revenues in future periods will continue to be subject to these and other factors which are
Table of Contents
15
beyond our control and, as a result, are likely to fluctuate. See discussion under 'Business Trends and Conditions' within Management's Discussion and Analysis of Financial Condition and Results of Operations included in Item 7 of Part II of this Annual Report for further discussion of current market trends.
If financial institutions at which we hold escrow funds fail, it could have a material adverse impact on our company.
We hold customers' assets in escrow at various financial institutions, pending completion of real estate transactions. These assets are maintained in segregated bank accounts and have not been included in the accompanying Consolidated Balance Sheets. We have a contingent liability relating to proper disposition of these balances for our customers, which amounted to $18.7 billionat December 31, 2019. Failure of one or more of these financial institutions may lead us to become liable for the funds owed to third parties and there is no guarantee that we would recover the funds deposited, whether through Federal Deposit Insurance Corporation coverage or otherwise.
If we experience changes in the rate or severity of title insurance claims, it may be necessary for us to record additional charges to our claim loss reserve. This may result in lower net earnings and the potential for earnings volatility.
By their nature, claims are often complex, vary greatly in dollar amounts and are affected by economic and market conditions and the legal environment existing at the time of settlement of the claims. Estimating future title loss payments is difficult because of the complex nature of title claims, the long periods of time over which claims are paid, significantly varying dollar amounts of individual claims and other factors. From time to time, we experience large losses or an overall worsening of our loss payment experience in regard to the frequency or severity of claims that require us to record additional charges to our claims loss reserve. There are currently pending several large claims which we believe can be defended successfully without material loss payments. However, if unanticipated material payments are required to settle these claims, it could result in or contribute to additional charges to our claim loss reserves. These loss events are unpredictable and adversely affect our earnings.
At each quarter end, our recorded reserve for claim losses is initially the result of taking the prior recorded reserve for claim losses, adding the current provision to that balance and subtracting actual paid claims from that balance, resulting in an amount that management then compares to our actuary's central estimate provided in the actuarial calculation. Due to the uncertainty and judgment used by both management and our actuary, our ultimate liability may be greater or less than our current reserves and/or our actuary’s calculation. If the recorded amount is within a reasonable range of the actuary’s central estimate, but not at the central estimate, management assesses other factors in order to determine our best estimate. These factors, which are both qualitative and quantitative, can change from period to period and include items such as current trends in the real estate industry (which management can assess, but for which there is a time lag in the development of the data used by our actuary), any adjustments from the actuarial estimates needed for the effects of unusually large or small claims, improvements in our claims management processes, and other cost saving measures. Depending upon our assessment of these factors, we may or may not adjust the recorded reserve. If the recorded amount is not within a reasonable range of the actuary’s central estimate, we would record a charge or credit and reassess the provision rate on a go forward basis.
Our subsidiaries must comply with extensive regulations. These regulations may increase our costs or impede or impose burdensome conditions on actions that we might seek to take to increase the revenues of those subsidiaries.
Our insurance businesses are subject to extensive regulation by state insurance authorities in each state in which they operate. These agencies have broad administrative and supervisory power relating to the following, among other matters:
• licensing requirements;• trade and marketing practices;• accounting and financing practices;• disclosure requirements on key terms of mortgage loans;• capital and surplus requirements;• the amount of dividends and other payments made by insurance subsidiaries;• investment practices;• rate schedules;• deposits of securities for the benefit of policyholders;• establishing reserves; and• regulation of reinsurance.
Most states also regulate insurance holding companies like us with respect to acquisitions, changes of control and the terms of transactions with our affiliates. State regulations may impede or impose burdensome conditions on our ability to increase or maintain rate levels or on other actions that we may want to take to enhance our operating results. In addition, we may incur significant costs in the course of complying with regulatory requirements. Further, various state legislatures have in the past considered offering a public alternative to the title industry in their states, as a means to increase state government revenues. Although we think this situation is unlikely, if one or more such takeovers were to occur they could adversely affect our business. We cannot be assured that future legislative or regulatory changes will not adversely affect our business operations. See “Item 1. Business — Regulation” for further discussion of the current regulatory environment.
Table of Contents
16
Our ServiceLink subsidiary provides mortgage transaction services including title-related services and facilitation of production and management of mortgage loans. Certain of these businesses are subject to federal and state regulatory oversight. For example, ServiceLink’s LoanCare business services and subservices mortgage loans secured primarily by residential real estate throughout the United States. LoanCare is subject to extensive federal, state and local regulatory oversight, including federal and state regulatory examinations, information gathering requests, inquiries, and investigations by governmental and regulatory agencies, including the CFPB. In connection with formal and informal inquiries by those agencies, LoanCare receives numerous requests, subpoenas, and orders for documents, testimony and information in connection with various aspects of its or its clients’ regulated activities.
LoanCare is also required to maintain a variety of licenses, both federal and state. License requirements are in a frequent state of renewal and reexamination as regulations change or are reinterpreted. In addition, federal and state statutes establish specific guidelines and procedures that debt collectors must follow when collecting consumer accounts. LoanCare’s failure to comply with any of these laws, should the states take an opposing interpretation, could have an adverse effect on LoanCare in the event and to the extent that they apply to some or all of its servicing activities.
State regulation of the rates we charge for title insurance could adversely affect our results of operations.
Our title insurance subsidiaries are subject to extensive rate regulation by the applicable state agencies in the jurisdictions in which they operate. Title insurance rates are regulated differently in various states, with some states requiring the subsidiaries to file and receive approval of rates before such rates become effective and some states promulgating the rates that can be charged. In general, premium rates are determined on the basis of historical data for claim frequency and severity as well as related production costs and other expenses. In all states in which our title subsidiaries operate, our rates must not be excessive, inadequate or unfairly discriminatory. Premium rates are likely to prove insufficient when ultimate claims and expenses exceed historically projected levels. Premium rate inadequacy may not become evident quickly and may take time to correct, and could adversely affect our business operating results and financial conditions.
Regulatory investigations of the insurance industry may lead to fines, settlements, new regulation or legal uncertainty, which could negatively affect our results of operations.
From time to time we receive inquiries and requests for information from state insurance departments, attorneys general and other regulatory agencies about various matters relating to our business. Sometimes these take the form of civil investigative demands or subpoenas. We cooperate with all such inquiries and we have responded to or are currently responding to inquiries from multiple governmental agencies. Also, regulators and courts have been dealing with issues arising from foreclosures and related processes and documentation. Various governmental entities are studying the title insurance product, market, pricing, and business practices, and potential regulatory and legislative changes, which may materially affect our business and operations. From time to time, we are assessed fines for violations of regulations or other matters or enter into settlements with such authorities which may require us to pay fines or claims or take other actions.
Because we are dependent upon California and Texas for approximately 14.3% and 13.8% and of our title insurance premiums, respectively, our business may be adversely affected by regulatory conditions in California and/or Texas.
California and Texas are the two largest sources of revenue for our title segment and, in 2019, California-based premiums accounted for approximately 28.9% of premiums earned by our direct operations and 0.8% of our agency premium revenues. Texas-based premiums accounted for 17.9% of premiums earned by our direct operations and 9.8% of our agency premium revenues. In the aggregate, California and Texas accounted for approximately 14.3% and 13.8%, respectively, of our total title insurance premiums for 2019. A significant part of our revenues and profitability are therefore subject to our operations in California and Texas and to the prevailing regulatory conditions in these states. Adverse regulatory developments in California and Texas, which could include reductions in the maximum rates permitted to be charged, inadequate rate increases or more fundamental changes in the design or implementation of the California and Texas title insurance regulatory framework, could have a material adverse effect on our results of operations and financial condition.
If the rating agencies downgrade our insurance companies, our results of operations and competitive position in the title insurance industry may suffer.
Ratings have always been an important factor in establishing the competitive position of insurance companies. Our title insurance subsidiaries are rated by S&P, Moody’s, and Demotech. Ratings reflect the opinion of a rating agency with regard to an insurance company’s or insurance holding company’s financial strength, operating performance and ability to meet its obligations to policyholders and are not evaluations directed to investors. Our ratings are subject to continued periodic review by rating agencies and the continued retention of those ratings cannot be assured. If our ratings are reduced from their current levels by those entities, our results of operations could be adversely affected.
If our claim loss prevention procedures fail, we could incur significant claim losses.
In the ordinary course of our title insurance business, we assume risks related to insuring clear title to residential and commercial properties. We have established procedures to mitigate the risk of loss from title claims, including extensive underwriting and risk

Table of Contents
17
assessment procedures. We also mitigate the risk of large claim losses by reinsuring risks with other insurers under excess of loss and case-by-case (“facultative”) reinsurance agreements. Reinsurance agreements generally provide that the reinsurer is liable for loss and loss adjustment expense payments exceeding the amount retained by the ceding company. However, the ceding company remains primarily liable to the insured whether or not the reinsurer is able to meet its contractual obligations. If inherent limitations cause our claim loss risk mitigation procedures to fail, we could incur substantial losses having an adverse effect on our results of operations or financial condition.
Our use of independent agents for a significant amount of our title insurance policies could adversely impact the frequency and severity of title claims.
In our agency operations, an independent agent performs the search and examination function or the agent may purchase a search product from us. In either case, the agent is responsible for ensuring that the search and examination is completed. The agent thus retains the majority of the title premium collected, with the balance remitted to the title underwriter for bearing the risk of loss in the event that a claim is made under the title insurance policy. Our relationship with each agent is governed by an agency agreement defining how the agent issues a title insurance policy on our behalf. The agency agreement also sets forth the agent’s liability to us for policy losses attributable to the agent’s errors. For each agent with whom we enter into an agency agreement, financial and loss experience records are maintained. Periodic audits of our agents are also conducted and the number of agents with whom we transact business is strategically managed in an effort to reduce future expenses and manage risks. Despite efforts to monitor the independent agents with which we transact business, there is no guarantee that an agent will comply with their contractual obligations to us. Furthermore, we cannot be certain that, due to changes in the regulatory environment and litigation trends, we will not be held liable for errors and omissions by agents. Accordingly, our use of independent agents could adversely impact the frequency and severity of title claims.
Failure to respond to rapid changes in technology could adversely affect our results of operations or financial condition.
Rapidly evolving technologies and innovations in software and financial technology could drive changes in how real estate transactions are recorded and processed throughout the mortgage life cycle. There is no guarantee that we will be able to effectively adapt to and utilize changing technology. Existing or new competitors may be able to utilize or create technology more effectively than us, which could result in the loss of market share.
Our pending acquisition of FGL may expose us to certain risks.
On February 7, 2020, we signed a merger agreement (the “Merger Agreement”) to acquire FGL Holdings (“FGL”) (NYSE: FG) (the “FGL Merger”). Consummation of the FGL Merger is subject to the satisfaction or waiver of customary conditions. Additionally, the Merger Agreement contains certain customary termination rights in favor of either FNF or FGL. If the FGL Merger is completed, we may face challenges in integrating FGL into our existing infrastructure. These challenges include evaluating and possibly changing operations, facilities and systems, coordinating management and personnel, retaining key employees, and managing different corporate cultures. There can be no assurance that we will be able to fully integrate all aspects of the acquired business successfully, and the process of integrating this acquisition may disrupt our business and divert our resources.
Item 1B. Unresolved Staff Comments
None.
Item 2. Properties
Our corporate headquarters are in Jacksonville, Florida in owned facilities.
The majority of our branch offices are leased from third parties. See Note B Leases to our Consolidated Financial Statements included in Item 8 of Part II of this Annual Report for further information on our outstanding leases. Our subsidiaries conduct their business operations primarily in leased office space in 45 states, Washington, DC, Canada and India.
Item 3. Legal Proceedings
For a description of our legal proceedings see discussion of Legal and Regulatory Contingencies in Note M. Commitments and Contingencies to our Consolidated Financial Statements included in Item 8 of Part II of this Annual Report, which is incorporated by reference into this Item 3 of Part I.

Table of Contents
18
PART II
Item 5. Market for Registrant's Common Equity, Related Stockholder Matters and Issuer Purchases of Equity Securities
Our common stock trades on the New York Stock Exchange under the trading symbol "FNF".
On January 31, 2020, the last reported sale price of our common stock on the New York Stock Exchange was $48.75. We had approximately 6,400 shareholders of record.
Refer to Note O. Employee Benefit Plans to our Consolidated Financial Statements included in Item 7 of Part II of this Annual Report, which is incorporated by reference into this Item 5 of Part II, for further information on securities issued for employee stock compensation pursuant to our Omnibus Plan.
Information concerning securities authorized for issuance under our equity compensation plans will be included in Item 12 of Part III of this Annual Report.
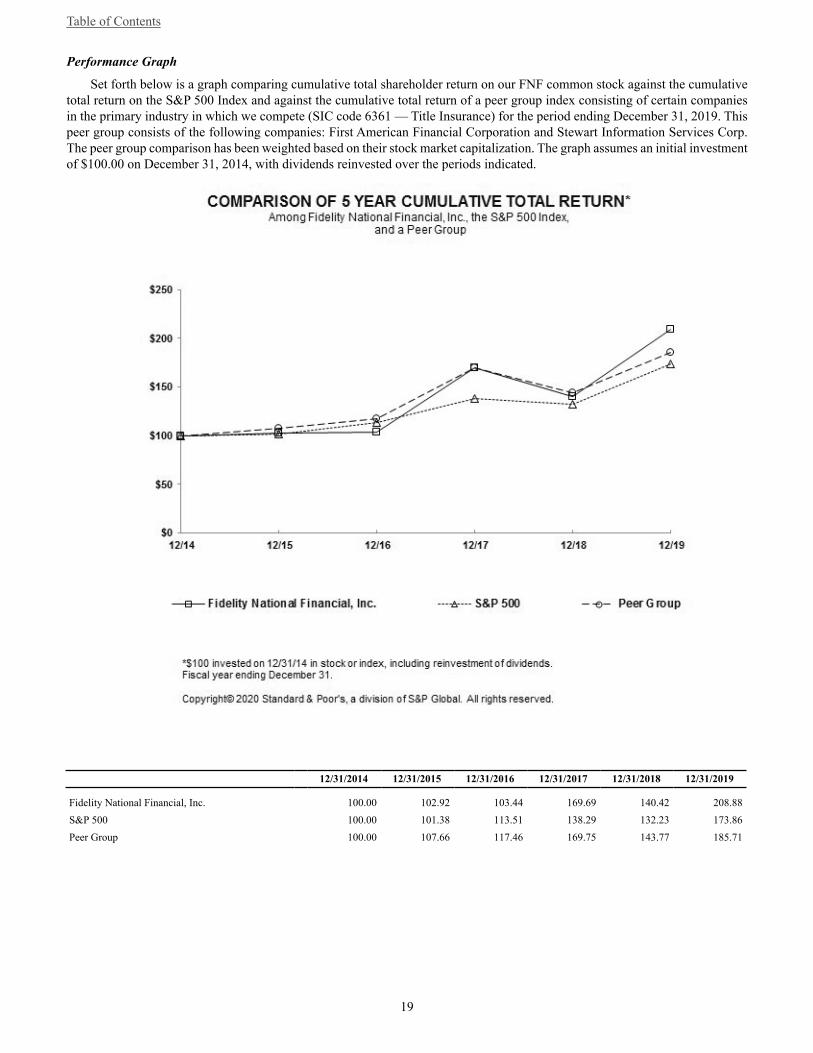
Table of Contents
19
Performance Graph
Set forth below is a graph comparing cumulative total shareholder return on our FNF common stock against the cumulative total return on the S&P 500 Index and against the cumulative total return of a peer group index consisting of certain companies in the primary industry in which we compete (SIC code 6361 — Title Insurance) for the period ending December 31, 2019. This peer group consists of the following companies: First American Financial Corporation and Stewart Information Services Corp. The peer group comparison has been weighted based on their stock market capitalization. The graph assumes an initial investment of $100.00 on December 31, 2014, with dividends reinvested over the periods indicated.
12/31/2014 12/31/2015 12/31/2016 12/31/2017 12/31/2018 12/31/2019
Fidelity National Financial, Inc. 100.00 102.92 103.44 169.69 140.42 208.88S&P 500 100.00 101.38 113.51 138.29 132.23 173.86Peer Group 100.00 107.66 117.46 169.75 143.77 185.71

Table of Contents
20
Dividends
Dividends declared on our common stock for the two most recent fiscal years are as follows:
Year Ended December 31,2019 2018Cash Dividends per Share
First quarter $ 0.31 $ 0.30Second quarter 0.31 0.30Third quarter 0.31 0.30Fourth quarter 0.33 0.30
On February 13, 2020, our Board of Directors formally declared a $0.33 per FNF share cash dividend that is payable on March 31, 2020 to FNF shareholders of record as of March 17, 2020.
Our current dividend policy anticipates the payment of quarterly dividends in the future. The declaration and payment of dividends will be at the discretion of our Board of Directors and will be dependent upon our future earnings, financial condition and capital requirements. There are no restrictions on our retained earnings regarding our ability to pay dividends to shareholders, although there are limits on the ability of certain subsidiaries to pay dividends to us, as described below. Our ability to declare dividends is subject to restrictions under our existing credit agreement. We do not believe the restrictions contained in our credit agreement will, in the foreseeable future, adversely affect our ability to pay cash dividends at the current dividend rate.
Since we are a holding company, our ability to pay dividends will depend largely on the ability of our subsidiaries to pay dividends to us, and the ability of our title insurance subsidiaries to do so is subject to, among other factors, their compliance with applicable insurance regulations. As of December 31, 2019, $1,868 million of our net assets are restricted from dividend payments without prior approval from the Departments of Insurance in the states where our title insurance subsidiaries are domiciled. During 2020, our directly owned title insurance subsidiaries can pay dividends or make distributions to us of approximately $518 millionwithout prior approval. The limits placed on such subsidiaries’ abilities to pay dividends affect our ability to pay dividends.
Purchases of Equity Securities by the Issuer
On July 17, 2018, our Board of Directors approved a new three-year stock repurchase program effective August 1, 2018 (the "2018 Repurchase Program") under which we may purchase up to 25 million shares of our FNF common stock through July 31, 2021. We may make repurchases from time to time in the open market, in block purchases or in privately negotiated transactions, depending on market conditions and other factors. During the year ended December 31, 2019, we repurchased a total of 2,120,000FNF common shares for an aggregate amount of $85 million or an average of $40.09 per share. Since the original commencement of the 2018 Repurchase Program, we repurchased a total of 2,780,000 FNF common shares for an aggregate amount of $106 million, or an average of $38.24 per share.
The following table summarizes repurchases of equity securities by FNF during the year ending December 31, 2019:
PeriodTotal Number of
Shares PurchasedAverage Price Paid
per Share
Total Number of SharesPurchased as Part ofPublicly Announced
Plans or Programs (1)
Maximum Number ofShares that May Yet BePurchased Under thePlans or Programs (2)
1/1/2019 - 1/31/2019 60,000 $ 31.83 60,000 24,280,0002/1/2019 - 2/28/2019 135,000 34.83 135,000 24,145,0003/1/2019 - 3/31/2019 315,000 35.56 315,000 23,830,0004/1/2019 - 4/30/2019 90,000 38.39 90,000 23,740,0005/1/2019 - 5/31/2019 330,000 39.03 330,000 23,410,0006/1/2019 - 6/30/2019 300,000 39.95 300,000 23,110,0007/1/2019 - 7/31/2019 180,000 42.47 180,000 22,930,0008/1/2019 - 8/31/2019 330,000 43.73 330,000 22,600,0009/1/2019 - 9/30/2019 300,000 44.13 300,000 22,300,00010/1/2019 - 10/31/2019 60,000 44.13 60,000 22,240,00011/1/2019 - 11/30/2019 20,000 46.32 20,000 22,220,00012/1/2019 - 12/31/2019 — — — 22,220,000Total 2,120,000 $ 40.09 2,120,000
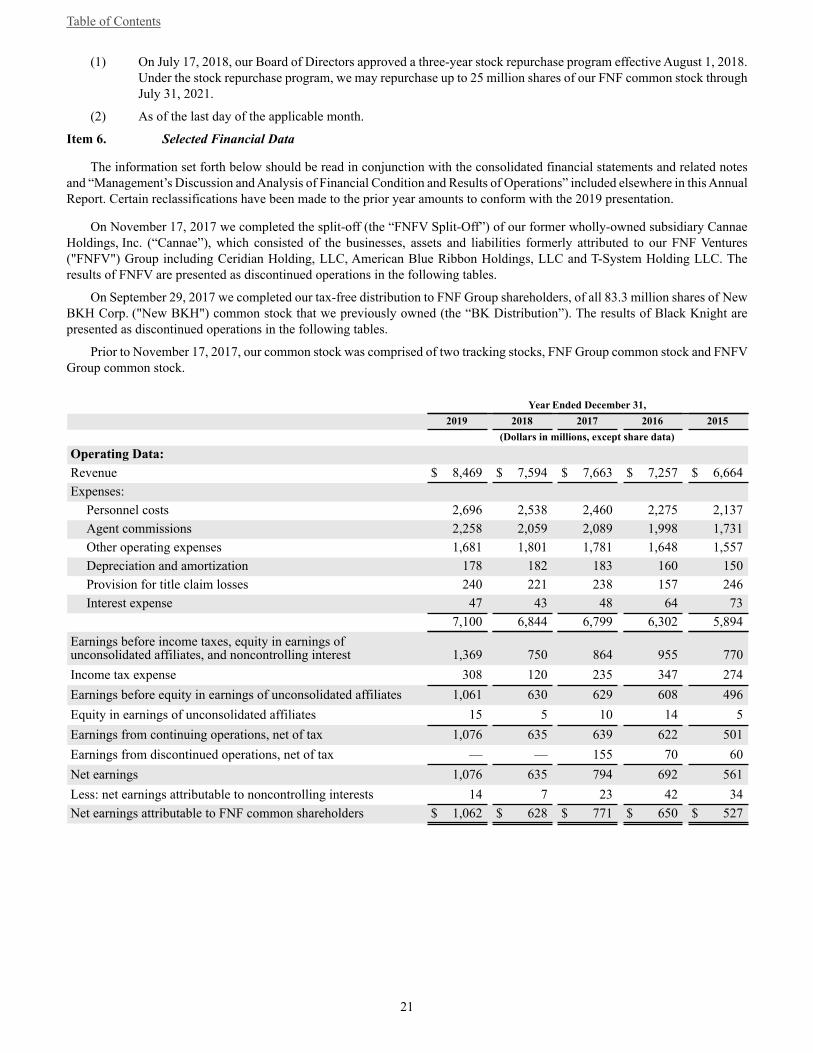
Table of Contents
21
(1) On July 17, 2018, our Board of Directors approved a three-year stock repurchase program effective August 1, 2018. Under the stock repurchase program, we may repurchase up to 25 million shares of our FNF common stock through July 31, 2021.
(2) As of the last day of the applicable month.
Item 6. Selected Financial Data
The information set forth below should be read in conjunction with the consolidated financial statements and related notes and “Management’s Discussion and Analysis of Financial Condition and Results of Operations” included elsewhere in this Annual Report. Certain reclassifications have been made to the prior year amounts to conform with the 2019 presentation.
On November 17, 2017 we completed the split-off (the “FNFV Split-Off”) of our former wholly-owned subsidiary Cannae Holdings, Inc. (“Cannae”), which consisted of the businesses, assets and liabilities formerly attributed to our FNF Ventures ("FNFV") Group including Ceridian Holding, LLC, American Blue Ribbon Holdings, LLC and T-System Holding LLC. The results of FNFV are presented as discontinued operations in the following tables.
On September 29, 2017 we completed our tax-free distribution to FNF Group shareholders, of all 83.3 million shares of New BKH Corp. ("New BKH") common stock that we previously owned (the “BK Distribution”). The results of Black Knight are presented as discontinued operations in the following tables.
Prior to November 17, 2017, our common stock was comprised of two tracking stocks, FNF Group common stock and FNFV Group common stock.
Year Ended December 31,2019 2018 2017 2016 2015
(Dollars in millions, except share data)
Operating Data: Revenue $ 8,469 $ 7,594 $ 7,663 $ 7,257 $ 6,664Expenses:
Personnel costs 2,696 2,538 2,460 2,275 2,137Agent commissions 2,258 2,059 2,089 1,998 1,731Other operating expenses 1,681 1,801 1,781 1,648 1,557Depreciation and amortization 178 182 183 160 150Provision for title claim losses 240 221 238 157 246Interest expense 47 43 48 64 73
7,100 6,844 6,799 6,302 5,894Earnings before income taxes, equity in earnings ofunconsolidated affiliates, and noncontrolling interest 1,369 750 864 955 770Income tax expense 308 120 235 347 274Earnings before equity in earnings of unconsolidated affiliates 1,061 630 629 608 496Equity in earnings of unconsolidated affiliates 15 5 10 14 5Earnings from continuing operations, net of tax 1,076 635 639 622 501Earnings from discontinued operations, net of tax — — 155 70 60Net earnings 1,076 635 794 692 561Less: net earnings attributable to noncontrolling interests 14 7 23 42 34Net earnings attributable to FNF common shareholders $ 1,062 $ 628 $ 771 $ 650 $ 527
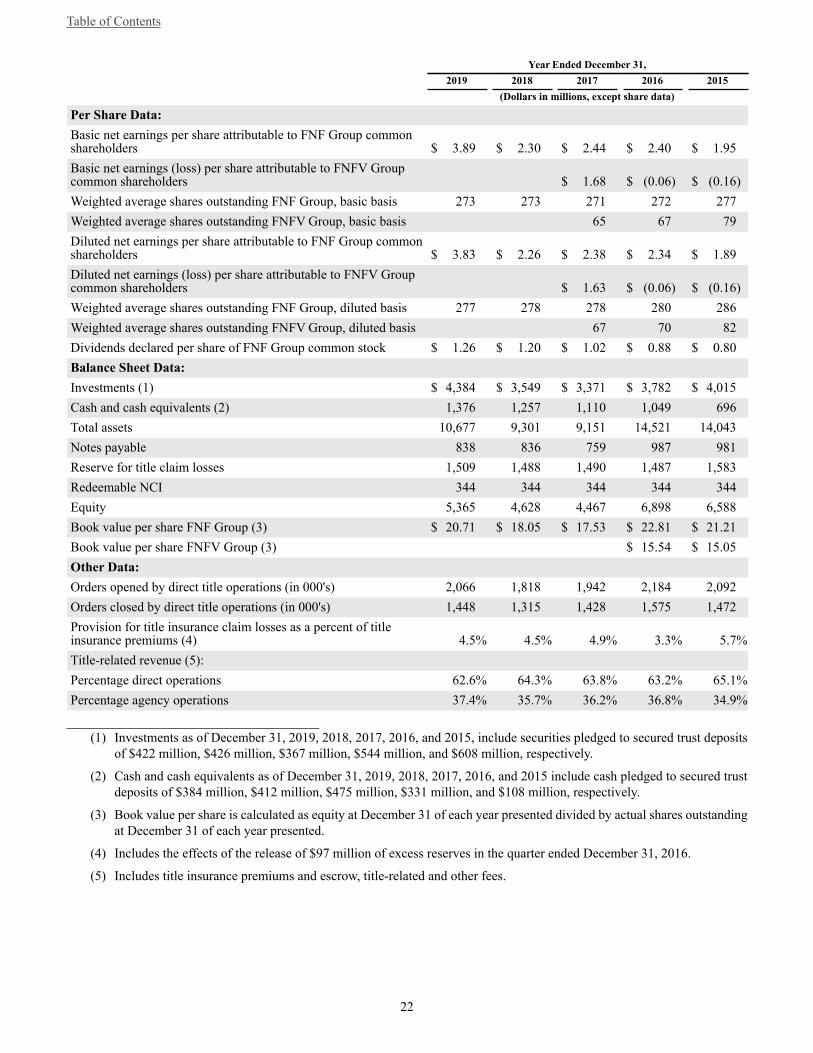
Table of Contents
22
Year Ended December 31, 2019 2018 2017 2016 2015 (Dollars in millions, except share data)
Per Share Data: Basic net earnings per share attributable to FNF Group commonshareholders $ 3.89 $ 2.30 $ 2.44 $ 2.40 $ 1.95Basic net earnings (loss) per share attributable to FNFV Groupcommon shareholders $ 1.68 $ (0.06) $ (0.16)Weighted average shares outstanding FNF Group, basic basis 273 273 271 272 277Weighted average shares outstanding FNFV Group, basic basis 65 67 79Diluted net earnings per share attributable to FNF Group commonshareholders $ 3.83 $ 2.26 $ 2.38 $ 2.34 $ 1.89Diluted net earnings (loss) per share attributable to FNFV Groupcommon shareholders $ 1.63 $ (0.06) $ (0.16)Weighted average shares outstanding FNF Group, diluted basis 277 278 278 280 286Weighted average shares outstanding FNFV Group, diluted basis 67 70 82Dividends declared per share of FNF Group common stock $ 1.26 $ 1.20 $ 1.02 $ 0.88 $ 0.80Balance Sheet Data: Investments (1) $ 4,384 $ 3,549 $ 3,371 $ 3,782 $ 4,015Cash and cash equivalents (2) 1,376 1,257 1,110 1,049 696Total assets 10,677 9,301 9,151 14,521 14,043Notes payable 838 836 759 987 981Reserve for title claim losses 1,509 1,488 1,490 1,487 1,583Redeemable NCI 344 344 344 344 344Equity 5,365 4,628 4,467 6,898 6,588Book value per share FNF Group (3) $ 20.71 $ 18.05 $ 17.53 $ 22.81 $ 21.21Book value per share FNFV Group (3) $ 15.54 $ 15.05Other Data:Orders opened by direct title operations (in 000's) 2,066 1,818 1,942 2,184 2,092Orders closed by direct title operations (in 000's) 1,448 1,315 1,428 1,575 1,472Provision for title insurance claim losses as a percent of titleinsurance premiums (4) 4.5% 4.5% 4.9% 3.3% 5.7%Title-related revenue (5):Percentage direct operations 62.6% 64.3% 63.8% 63.2% 65.1%Percentage agency operations 37.4% 35.7% 36.2% 36.8% 34.9%
______________________________________(1) Investments as of December 31, 2019, 2018, 2017, 2016, and 2015, include securities pledged to secured trust deposits
of $422 million, $426 million, $367 million, $544 million, and $608 million, respectively.
(2) Cash and cash equivalents as of December 31, 2019, 2018, 2017, 2016, and 2015 include cash pledged to secured trust deposits of $384 million, $412 million, $475 million, $331 million, and $108 million, respectively.
(3) Book value per share is calculated as equity at December 31 of each year presented divided by actual shares outstanding at December 31 of each year presented.
(4) Includes the effects of the release of $97 million of excess reserves in the quarter ended December 31, 2016.
(5) Includes title insurance premiums and escrow, title-related and other fees.

Table of Contents
23
Selected Quarterly Financial Data (Unaudited)
Selected quarterly financial data is as follows:
Quarter Ended March 31, June 30, September 30, December 31, (Dollars in millions, except per share data)
2019 Revenue $ 1,722 $ 2,144 $ 2,241 $ 2,362Earnings from continuing operations before income taxes, equity inearnings of unconsolidated affiliates, and noncontrolling interest 264 353 313 439Net earnings attributable to FNF common shareholders 206 266 250 340Basic earnings per share attributable to FNF common shareholders 0.75 0.97 0.92 1.24Diluted earnings per share attributable to FNF common shareholders 0.74 0.96 0.90 1.22Dividends paid per share FNF common stock 0.31 0.31 0.31 0.332018Revenue $ 1,693 $ 2,123 $ 2,085 $ 1,693Earnings from continuing operations before income taxes, equity inearnings of unconsolidated affiliates, and noncontrolling interest 127 275 287 61Net earnings attributable to FNF common shareholders 97 251 236 44Basic earnings per share attributable to FNF common shareholders 0.36 0.92 0.86 0.16Diluted earnings per share attributable to FNF common shareholders 0.35 0.90 0.85 0.16Dividends paid per share FNF common stock 0.30 0.30 0.30 0.30

Table of Contents
24
Item 7. Management's Discussion and Analysis of Financial Condition and Results of Operations
The following discussion should be read in conjunction with the Consolidated Financial Statements and the Notes thereto and Selected Financial Data included elsewhere in this Annual Report.
Overview
For a description of our business, including descriptions of segments, see the discussion under Business in Item 1 of Part I of this Annual Report, which is incorporated by reference into this Item 7 of Part II of this Annual Report.
Recent Developments
Termination of Stewart Merger Agreement and Payment of Reverse Termination Fee
On March 18, 2018, we signed a merger agreement (the "Stewart Merger Agreement") to acquire Stewart Information Services Corporation ("Stewart") (NYSE: STC) (the "Stewart Merger"). On September 9, 2019, we entered into a mutual Termination Agreement with Stewart (the “Termination Agreement”), pursuant to which the parties agreed to terminate the Stewart Merger Agreement, due to the Federal Trade Commission's issuance of an administrative complaint seeking to block the merger. In connection with the termination of the Stewart Merger Agreement, on September 12, 2019, we paid to Stewart the Reverse Termination Fee (as defined in the Stewart Merger Agreement) consisting of $50 million in cash, which is included within other operating expenses in the Consolidated Statements of Earnings.
Pending Acquisition of FGL
On February 7, 2020, we signed a merger agreement (the “Merger Agreement”) to acquire FGL Holdings (“FGL”) (NYSE: FG) (the “FGL Merger”). Subject to the terms and conditions of the Merger Agreement, which has been approved by the board of directors of FNF, at the First Effective Time (as defined in the Merger Agreement), the ordinary shares of FGL (the “Ordinary Shares”), including all restricted Ordinary Shares (whether vested or unvested), issued and outstanding as of immediately prior to the First Effective Time (other than (i) shares owned by FGL and any of its subsidiaries or FNF and any of its subsidiaries and (ii) shares in respect of which dissenters rights have been properly exercised and perfected under Cayman law) will be converted into the right to receive $12.50 in cash or 0.2558 shares (“the Stock Consideration”) of common stock of FNF (“FNF Common Stock”), at the election of the holder thereof and subject to the proration mechanics set forth in the Merger Agreement. Pursuant to the Merger Agreement, all Ordinary Shares held by FNF and its subsidiaries will be converted into the right to receive the Stock Consideration. Each Series B Cumulative Preferred Share, all of which are held by FNF and its subsidiaries, will be converted into the right to receive a number of shares of FNF Common Stock that is equal to (i) the Liquidation Preference (as defined in the Merger Agreement) divided by (ii) the Reference Parent Common Stock Price (as defined in the Merger Agreement).
Additionally, all options to purchase Ordinary Shares (“FGL Share Option”) and phantom unit denominated in Ordinary Shares (“FGL Phantom Unit”), in each case, outstanding immediately prior to the First Effective Time, will be canceled and converted into options to purchase FNF Common Stock and phantom units denominated in FNF Common Stock at the First Effective Time (collectively, the “Rollover Awards”), as applicable. The Rollover Awards will generally be subject to the same terms and conditions as applicable to the applicable canceled FGL Share Option or FGL Phantom Unit immediately prior to the First Effective Time, except that (i) all performance-vesting criteria will be deemed satisfied at the First Effective Time at the levels described in the Merger Agreement and such Rollover Awards will be subject only to time-based vesting conditions after the First Effective Time, and (ii) immediately prior to the First Effective Time, additional time-vesting credits will be provided to holders in respect of FGL Share Options and FGL Phantom Units granted prior to January 1, 2020, as described in the Merger Agreement.
The closing of the transaction is subject to certain closing conditions, including the approval by FGL stockholders, federal and state regulatory approvals, and the satisfaction of other customary closing conditions. Closing is expected in the second or third quarter of 2020.
Business Trends and Conditions
Our Title segment revenue is closely related to the level of real estate activity which includes sales, mortgage financing and mortgage refinancing. Declines in the level of real estate activity or the average price of real estate sales will adversely affect our title insurance revenues.
We have found that residential real estate activity is generally dependent on the following factors:• mortgage interest rates;• mortgage funding supply;• housing inventory and home prices; and• strength of the United States economy, including employment levels.
As of January 17, 2020, the Mortgage Banker's Association ("MBA") estimated the size of the United States ("U.S.") residential mortgage originations market as shown in the following table for 2019 - 2022 in its "Mortgage Finance Forecast" (in trillions, 2018 represents actual originations):
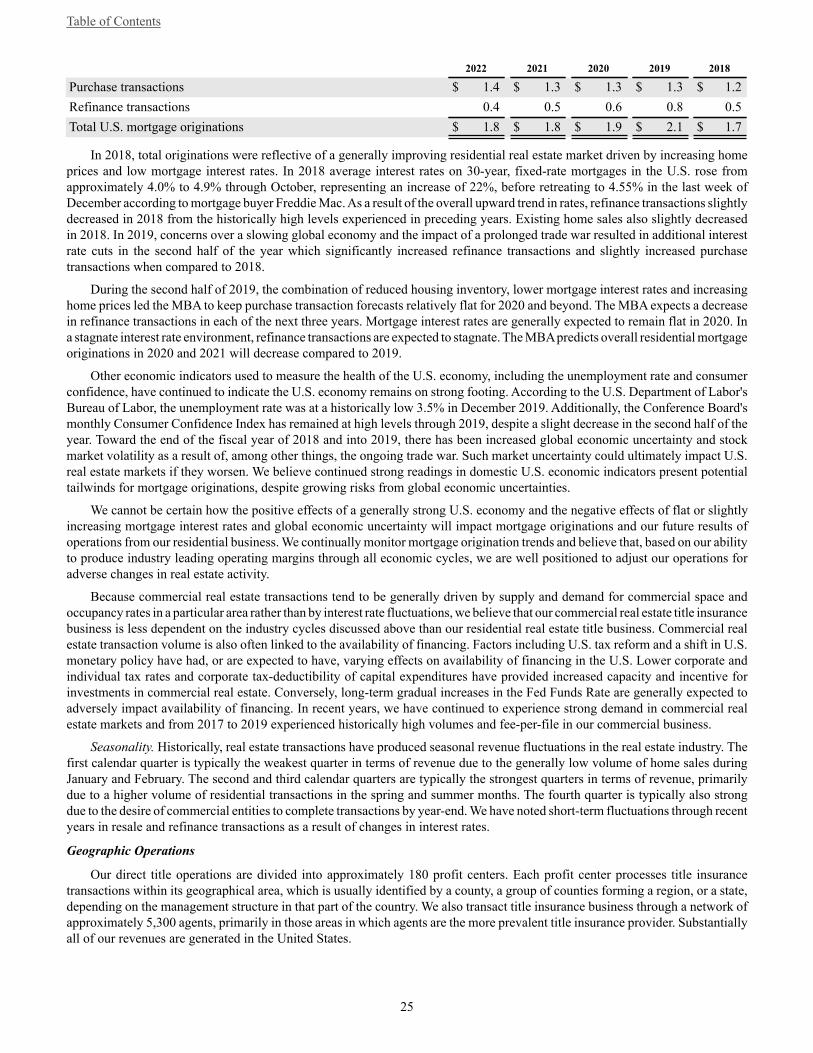
Table of Contents
25
2022 2021 2020 2019 2018
Purchase transactions $ 1.4 $ 1.3 $ 1.3 $ 1.3 $ 1.2Refinance transactions 0.4 0.5 0.6 0.8 0.5Total U.S. mortgage originations $ 1.8 $ 1.8 $ 1.9 $ 2.1 $ 1.7
In 2018, total originations were reflective of a generally improving residential real estate market driven by increasing home prices and low mortgage interest rates. In 2018 average interest rates on 30-year, fixed-rate mortgages in the U.S. rose from approximately 4.0% to 4.9% through October, representing an increase of 22%, before retreating to 4.55% in the last week of December according to mortgage buyer Freddie Mac. As a result of the overall upward trend in rates, refinance transactions slightly decreased in 2018 from the historically high levels experienced in preceding years. Existing home sales also slightly decreased in 2018. In 2019, concerns over a slowing global economy and the impact of a prolonged trade war resulted in additional interest rate cuts in the second half of the year which significantly increased refinance transactions and slightly increased purchase transactions when compared to 2018.
During the second half of 2019, the combination of reduced housing inventory, lower mortgage interest rates and increasing home prices led the MBA to keep purchase transaction forecasts relatively flat for 2020 and beyond. The MBA expects a decrease in refinance transactions in each of the next three years. Mortgage interest rates are generally expected to remain flat in 2020. In a stagnate interest rate environment, refinance transactions are expected to stagnate. The MBA predicts overall residential mortgage originations in 2020 and 2021 will decrease compared to 2019.
Other economic indicators used to measure the health of the U.S. economy, including the unemployment rate and consumer confidence, have continued to indicate the U.S. economy remains on strong footing. According to the U.S. Department of Labor's Bureau of Labor, the unemployment rate was at a historically low 3.5% in December 2019. Additionally, the Conference Board's monthly Consumer Confidence Index has remained at high levels through 2019, despite a slight decrease in the second half of the year. Toward the end of the fiscal year of 2018 and into 2019, there has been increased global economic uncertainty and stock market volatility as a result of, among other things, the ongoing trade war. Such market uncertainty could ultimately impact U.S. real estate markets if they worsen. We believe continued strong readings in domestic U.S. economic indicators present potential tailwinds for mortgage originations, despite growing risks from global economic uncertainties.
We cannot be certain how the positive effects of a generally strong U.S. economy and the negative effects of flat or slightly increasing mortgage interest rates and global economic uncertainty will impact mortgage originations and our future results of operations from our residential business. We continually monitor mortgage origination trends and believe that, based on our ability to produce industry leading operating margins through all economic cycles, we are well positioned to adjust our operations for adverse changes in real estate activity.
Because commercial real estate transactions tend to be generally driven by supply and demand for commercial space and occupancy rates in a particular area rather than by interest rate fluctuations, we believe that our commercial real estate title insurance business is less dependent on the industry cycles discussed above than our residential real estate title business. Commercial real estate transaction volume is also often linked to the availability of financing. Factors including U.S. tax reform and a shift in U.S. monetary policy have had, or are expected to have, varying effects on availability of financing in the U.S. Lower corporate and individual tax rates and corporate tax-deductibility of capital expenditures have provided increased capacity and incentive for investments in commercial real estate. Conversely, long-term gradual increases in the Fed Funds Rate are generally expected to adversely impact availability of financing. In recent years, we have continued to experience strong demand in commercial real estate markets and from 2017 to 2019 experienced historically high volumes and fee-per-file in our commercial business.
Seasonality. Historically, real estate transactions have produced seasonal revenue fluctuations in the real estate industry. The first calendar quarter is typically the weakest quarter in terms of revenue due to the generally low volume of home sales during January and February. The second and third calendar quarters are typically the strongest quarters in terms of revenue, primarily due to a higher volume of residential transactions in the spring and summer months. The fourth quarter is typically also strong due to the desire of commercial entities to complete transactions by year-end. We have noted short-term fluctuations through recent years in resale and refinance transactions as a result of changes in interest rates.
Geographic Operations
Our direct title operations are divided into approximately 180 profit centers. Each profit center processes title insurance transactions within its geographical area, which is usually identified by a county, a group of counties forming a region, or a state, depending on the management structure in that part of the country. We also transact title insurance business through a network of approximately 5,300 agents, primarily in those areas in which agents are the more prevalent title insurance provider. Substantially all of our revenues are generated in the United States.

Table of Contents
26
The following table sets forth the approximate dollar and percentage volumes of our title insurance premium revenue by state:
Year Ended December 31, 2019 2018 2017 Amount % Amount % Amount % (Dollars in millions)
California $ 764 14.3% $ 681 13.9% $ 708 14.5%Texas 734 13.8 707 14.4 693 14.2Florida 492 9.2 432 8.8 392 8.0New York 311 5.8 310 6.3 311 6.3Illinois 273 5.1 271 5.5 283 5.8All others 2,768 51.8 2,510 51.1 2,506 51.2
Totals $ 5,342 100.0% $ 4,911 100.0% $ 4,893 100.0%
Critical Accounting Estimates
The accounting estimates described below are those we consider critical in preparing our Consolidated Financial Statements. Management is required to make estimates and assumptions that can affect the reported amounts of assets and liabilities and disclosures with respect to contingent assets and liabilities at the date of the Consolidated Financial Statements and the reported amounts of revenues and expenses during the reporting period. Actual amounts could differ from those estimates. See Note A. Business and Summary of Significant Accounting Policies to our Consolidated Financial Statements included in Item 8 of Part II of this Annual Report for additional description of the significant accounting policies that have been followed in preparing our Consolidated Financial Statements.
Reserve for Title Claim Losses. Title companies issue two types of policies, owner's and lender's policies, since both the new owner and the lender in real estate transactions want to know that their interest in the property is insured against certain title defects outlined in the policy. An owner's policy insures the buyer against such defects for as long as he or she owns the property (as well as against warranty claims arising out of the sale of the property by such owner). A lender's policy insures the priority of the lender's security interest over the claims that other parties may have in the property. The maximum amount of liability under a title insurance policy is generally the face amount of the policy plus the cost of defending the insured's title against an adverse claim; however, occasionally we do incur losses in excess of policy limits. While most non-title forms of insurance, including property and casualty, provide for the assumption of risk of loss arising out of unforeseen future events, title insurance serves to protect the policyholder from risk of loss for events that predate the issuance of the policy.
Unlike many other forms of insurance, title insurance requires only a one-time premium for continuous coverage until another policy is warranted due to changes in property circumstances arising from refinance, resale, additional liens, or other events. Unless we issue the subsequent policy, we receive no notice that our exposure under our policy has ended and, as a result, we are unable to track the actual terminations of our exposures.
Our reserve for title claim losses includes reserves for known claims as well as for losses that have been incurred but not yet reported to us (“IBNR”), net of recoupments. We reserve for each known claim based on our review of the estimated amount of the claim and the costs required to settle the claim. Reserves for IBNR claims are estimates that are established at the time the premium revenue is recognized and are based upon historical experience and other factors, including industry trends, claim loss history, legal environment, geographic considerations, and the types of policies written. We also reserve for losses arising from closing and disbursement functions due to fraud or operational error.
The table below summarizes our reserves for known claims and incurred but not reported claims related to title insurance:
December 31, 2019 % December 31, 2018 %(in millions) (in millions)
Known claims $ 176 11.7% $ 173 11.6%IBNR 1,333 88.3 1,315 88.4Total Reserve for Title Claim Losses $ 1,509 100.0% $ 1,488 100.0%
Although claims against title insurance policies can be reported relatively soon after the policy has been issued, claims may be reported many years later. Historically, approximately 60% of claims are paid within approximately five years of the policy being written. By their nature, claims are often complex, vary greatly in dollar amounts and are affected by economic and market conditions, as well as the legal environment existing at the time of settlement of the claims. Estimating future title loss payments

Table of Contents
27
is difficult because of the complex nature of title claims, the long periods of time over which claims are paid, significantly varying dollar amounts of individual claims and other factors.
Our process for recording our reserves for title claim losses begins with analysis of our loss provision rate. We forecast ultimate losses for each policy year based upon historical policy year loss emergence and development patterns and adjust these to reflect policy year and policy type differences which affect the timing, frequency and severity of claims. We also use a technique that relies on historical loss emergence and on a premium-based exposure measurement. The latter technique is particularly applicable to the most recent policy years, which have few reported claims relative to an expected ultimate claim volume. After considering historical claim losses, reporting patterns and current market information, and analyzing quantitative and qualitative data provided by our legal, claims and underwriting departments, we determine a loss provision rate, which is recorded as a percentage of current title premiums. This loss provision rate is set to provide for losses on current year policies, but due to development of prior years and our long claim duration, it periodically includes amounts of estimated adverse or positive development on prior years' policies. Any significant adjustments to strengthen or release loss reserves resulting from the comparison with our actuarial analysis are made in addition to this loss provision rate. At each quarter end, our recorded reserve for claim losses is initially the result of taking the prior recorded reserve for claim losses, adding the current provision and subtracting actual paid claims, resulting in an amount that management then compares to the range of reasonable estimates provided by the actuarial calculation.
We recorded our loss provision rate at 4.5% for the year ended December 31, 2019. Our average loss provision rate was 4.5%, 4.5% and 4.9% for the years ended December 31, 2019, 2018 and 2017, respectively. Of such annual loss provision rates, 4.5%, for each of the years ended December 31, 2019, 2018 and 2017, respectively, related to losses on policies written in the current year, and the remainder, if any related to developments on prior year policies. The provision rate in 2019, 2018, and 2017 is supported by significant payment declines for prior policy years, and qualitative factors that would indicate favorable results, including better lender underwriting standards, extension of credit to higher quality borrowers, a high proportion of refinance activity, better claims expense management, better mechanic’s lien underwriting practices, and better fraud awareness by lenders, title insurers and settlement agents. In 2017, adverse development of prior year losses of $19 million or 0.4% of 2017 premium was accounted for in the provision rate.
Due to the uncertainty inherent in the process and due to the judgment used by both management and our actuary, our ultimate liability may be greater or less than our carried reserves. If the recorded amount is within the actuarial range but not at the central estimate, we assess the position within the actuarial range by analysis of other factors in order to determine that the recorded amount is our best estimate. These factors, which are both qualitative and quantitative, can change from period to period, and include items such as current trends in the real estate industry (which we can assess, but for which there is a time lag in the development of the data), any adjustments from the actuarial estimates needed for the effects of unusually large or small claims, improvements in our claims management processes, and other cost saving measures. If the recorded amount is not within a reasonable range of our actuary's central estimate, we may have to record a charge or credit and reassess the loss provision rate on a go forward basis. We will continue to reassess the provision to be recorded in future periods consistent with this methodology.
The table below presents our title insurance loss development experience for the past three years:
2019 2018 2017 (In millions)
Beginning balance $ 1,488 $ 1,490 $ 1,487Change in reinsurance recoverable 1 — (4)Claims loss provision related to:
Current year 240 221 219Prior years — — 19
Total title claim loss provision 240 221 238Claims paid, net of recoupments related to:
Current year (11) (10) (8)Prior years (209) (213) (223)
Total title claims paid, net of recoupments (220) (223) (231)Ending balance of claim loss reserve for title insurance $ 1,509 $ 1,488 $ 1,490Title premiums $ 5,342 $ 4,911 $ 4,893

Table of Contents
28
2019 2018 2017
Provision for title insurance claim losses as a percentage of title insurance premiums: Current year 4.5% 4.5% 4.5%Prior years — — 0.4
Total provision 4.5% 4.5% 4.9%
Actual claims payments consist of loss payments and claims management expenses offset by recoupments and were as follows (in millions):
LossPayments
ClaimsManagement
Expenses RecoupmentsNet LossPayments
Year ended December 31, 2019 $ 139 $ 112 $ (31) $ 220Year ended December 31, 2018 140 118 (35) 223Year ended December 31, 2017 145 121 (35) 231
As of December 31, 2019 and 2018, our recorded reserves were $1,509 million and $1,488 million, respectively, which we determined were reasonable and represented our best estimate and these recorded amounts were within a reasonable range of the central estimates provided by our actuaries. Our recorded reserves were $34 million above the mid-point of the provided range of $1.3 billion to $1.7 billion of our actuarial estimates as of December 31, 2019. Our recorded reserves were $44 million above the mid-point of the provided range of our actuarial estimates of $1.3 billion to $1.6 billion as of December 31, 2018.
During 2019, 2018, and 2017, payment patterns were consistent with our actuaries' and management's expectations. Also, compared to prior years we have seen a leveling off of the ultimate loss ratios in more mature policy years, particularly 2005-2008. While we still see claims opened on these policy years, the proportion of our claims inventory represented by these policy years has continued to decrease. Additionally, we continued to see positive development relating to the 2009 through 2019 policy years, which we believe is indicative of more stringent underwriting standards by us and the lending industry. Further, we have seen significant positive development in residential owner's policies due to increased payments on residential lender's policies which inherently limit the potential loss on the related owner's policy to the differential in coverage amount between the amount insured under the owner's policy and the amount paid under the residential lender's policy. Also, any residential lender's policy claim paid relating to a property that is in foreclosure negates any potential loss under an owner's policy previously issued on the property as the owner has no equity in the property. Our ending open claim inventory decreased from approximately 12,800 claims at December 31, 2018 to approximately 11,800 claims at December 31, 2019. If actual claims loss development varies from what is currently expected and is not offset by other factors, it is possible that our recorded reserves may fall outside a reasonable range of our actuaries' central estimate, which may require additional reserve adjustments in future periods.
An approximate $53 million increase (decrease) in our annualized provision for title claim losses would occur if our loss provision rate were 1% higher (lower), based on 2019 title premiums of $5,342 million. A 10% increase (decrease) in our reserve for title claim losses, as of December 31, 2019, would result in an increase (decrease) in our provision for title claim losses of approximately $151 million.
Valuation of Investments. Investments in fixed maturity, equity, and preferred securities are recorded on the balance sheet at fair value. We regularly review our fixed maturity investment portfolio for factors that may indicate that a decline in fair value of an investment is other-than-temporary. Some factors considered in evaluating whether or not a decline in fair value is other-than-temporary include: (i) our intent and need to sell the investment prior to a period of time sufficient to allow for a recovery in value; (ii) the duration and extent to which the fair value has been less than cost; and (iii) the financial condition and prospects of the issuer. Such reviews are inherently uncertain and the value of the investment may not fully recover or may decline in future periods resulting in a realized loss. Investments are selected for analysis whenever an unrealized loss is greater than a certain threshold that we determine based on the size of our portfolio or by using other qualitative factors. Fixed maturity investments that have unrealized losses caused by interest rate movements are not at risk as we do not anticipate having the need or intent to sell prior to maturity. Unrealized losses on fixed maturity instruments that are susceptible to credit related declines are evaluated based on the aforementioned factors. Currently available market data is considered and estimates are made as to the duration and prospects for recovery, and the intent or ability to retain the investment until such recovery takes place. These estimates are revisited quarterly and any material degradation in the prospect for recovery will be considered in the other-than-temporary impairment analysis. We believe that our monitoring and analysis has provided for the proper recognition of other-than-temporary impairments over the past three-year period. Any change in estimate in this area will have an impact on the results of operations of the period in which a charge is taken.
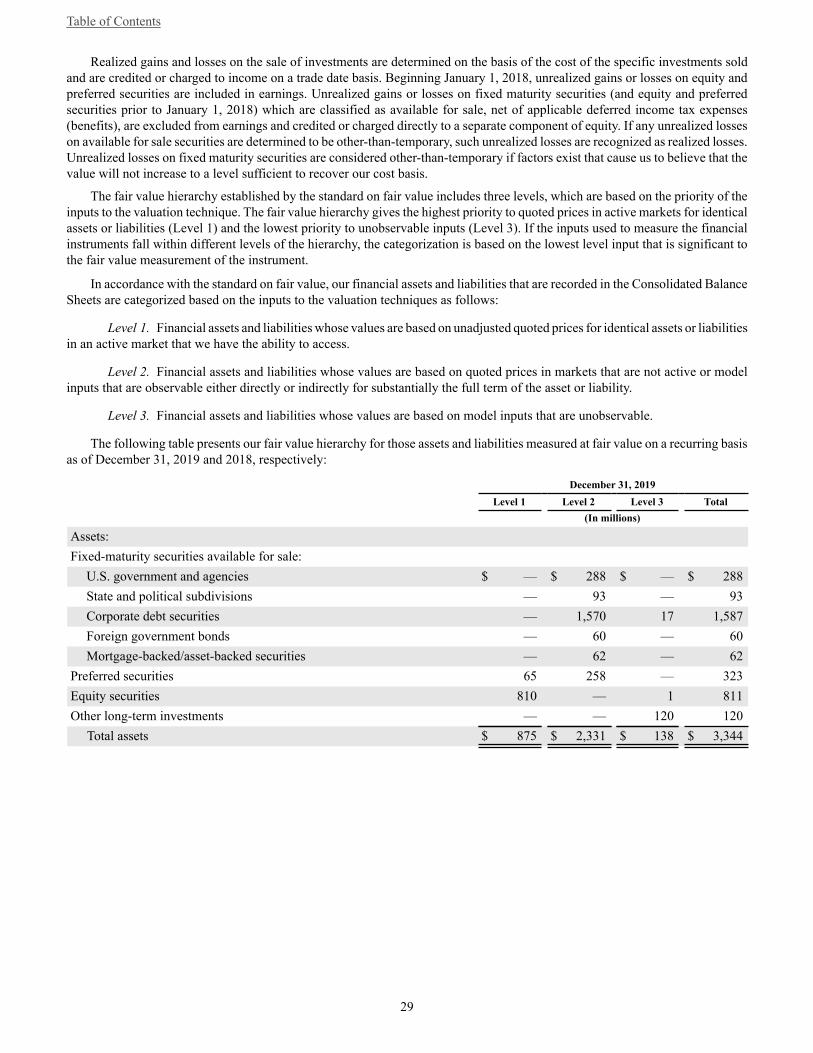
Table of Contents
29
Realized gains and losses on the sale of investments are determined on the basis of the cost of the specific investments sold and are credited or charged to income on a trade date basis. Beginning January 1, 2018, unrealized gains or losses on equity and preferred securities are included in earnings. Unrealized gains or losses on fixed maturity securities (and equity and preferred securities prior to January 1, 2018) which are classified as available for sale, net of applicable deferred income tax expenses (benefits), are excluded from earnings and credited or charged directly to a separate component of equity. If any unrealized losses on available for sale securities are determined to be other-than-temporary, such unrealized losses are recognized as realized losses. Unrealized losses on fixed maturity securities are considered other-than-temporary if factors exist that cause us to believe that the value will not increase to a level sufficient to recover our cost basis.
The fair value hierarchy established by the standard on fair value includes three levels, which are based on the priority of the inputs to the valuation technique. The fair value hierarchy gives the highest priority to quoted prices in active markets for identical assets or liabilities (Level 1) and the lowest priority to unobservable inputs (Level 3). If the inputs used to measure the financial instruments fall within different levels of the hierarchy, the categorization is based on the lowest level input that is significant to the fair value measurement of the instrument.
In accordance with the standard on fair value, our financial assets and liabilities that are recorded in the Consolidated Balance Sheets are categorized based on the inputs to the valuation techniques as follows:
Level 1. Financial assets and liabilities whose values are based on unadjusted quoted prices for identical assets or liabilities in an active market that we have the ability to access.
Level 2. Financial assets and liabilities whose values are based on quoted prices in markets that are not active or model inputs that are observable either directly or indirectly for substantially the full term of the asset or liability.
Level 3. Financial assets and liabilities whose values are based on model inputs that are unobservable.
The following table presents our fair value hierarchy for those assets and liabilities measured at fair value on a recurring basis as of December 31, 2019 and 2018, respectively:
December 31, 2019 Level 1 Level 2 Level 3 Total (In millions)
Assets:Fixed-maturity securities available for sale:
U.S. government and agencies $ — $ 288 $ — $ 288State and political subdivisions — 93 — 93Corporate debt securities — 1,570 17 1,587Foreign government bonds — 60 — 60Mortgage-backed/asset-backed securities — 62 — 62
Preferred securities 65 258 — 323Equity securities 810 — 1 811Other long-term investments — — 120 120 Total assets $ 875 $ 2,331 $ 138 $ 3,344
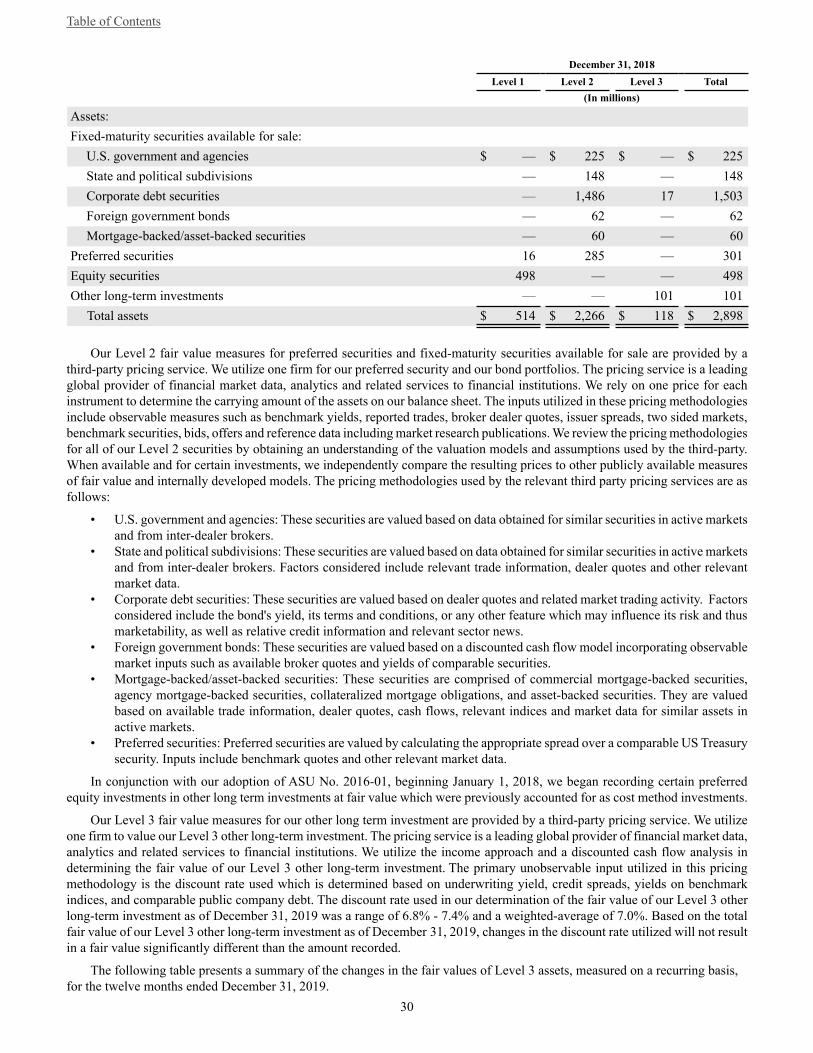
Table of Contents
30
December 31, 2018 Level 1 Level 2 Level 3 Total (In millions)
Assets:Fixed-maturity securities available for sale:
U.S. government and agencies $ — $ 225 $ — $ 225State and political subdivisions — 148 — 148Corporate debt securities — 1,486 17 1,503Foreign government bonds — 62 — 62Mortgage-backed/asset-backed securities — 60 — 60
Preferred securities 16 285 — 301Equity securities 498 — — 498Other long-term investments — — 101 101 Total assets $ 514 $ 2,266 $ 118 $ 2,898
Our Level 2 fair value measures for preferred securities and fixed-maturity securities available for sale are provided by a third-party pricing service. We utilize one firm for our preferred security and our bond portfolios. The pricing service is a leading global provider of financial market data, analytics and related services to financial institutions. We rely on one price for each instrument to determine the carrying amount of the assets on our balance sheet. The inputs utilized in these pricing methodologies include observable measures such as benchmark yields, reported trades, broker dealer quotes, issuer spreads, two sided markets, benchmark securities, bids, offers and reference data including market research publications. We review the pricing methodologies for all of our Level 2 securities by obtaining an understanding of the valuation models and assumptions used by the third-party. When available and for certain investments, we independently compare the resulting prices to other publicly available measures of fair value and internally developed models. The pricing methodologies used by the relevant third party pricing services are as follows:
• U.S. government and agencies: These securities are valued based on data obtained for similar securities in active markets and from inter-dealer brokers.
• State and political subdivisions: These securities are valued based on data obtained for similar securities in active markets and from inter-dealer brokers. Factors considered include relevant trade information, dealer quotes and other relevant market data.
• Corporate debt securities: These securities are valued based on dealer quotes and related market trading activity. Factors considered include the bond's yield, its terms and conditions, or any other feature which may influence its risk and thus marketability, as well as relative credit information and relevant sector news.
• Foreign government bonds: These securities are valued based on a discounted cash flow model incorporating observable market inputs such as available broker quotes and yields of comparable securities.
• Mortgage-backed/asset-backed securities: These securities are comprised of commercial mortgage-backed securities, agency mortgage-backed securities, collateralized mortgage obligations, and asset-backed securities. They are valued based on available trade information, dealer quotes, cash flows, relevant indices and market data for similar assets in active markets.
• Preferred securities: Preferred securities are valued by calculating the appropriate spread over a comparable US Treasury security. Inputs include benchmark quotes and other relevant market data.
In conjunction with our adoption of ASU No. 2016-01, beginning January 1, 2018, we began recording certain preferred equity investments in other long term investments at fair value which were previously accounted for as cost method investments.
Our Level 3 fair value measures for our other long term investment are provided by a third-party pricing service. We utilize one firm to value our Level 3 other long-term investment. The pricing service is a leading global provider of financial market data, analytics and related services to financial institutions. We utilize the income approach and a discounted cash flow analysis in determining the fair value of our Level 3 other long-term investment. The primary unobservable input utilized in this pricing methodology is the discount rate used which is determined based on underwriting yield, credit spreads, yields on benchmark indices, and comparable public company debt. The discount rate used in our determination of the fair value of our Level 3 other long-term investment as of December 31, 2019 was a range of 6.8% - 7.4% and a weighted-average of 7.0%. Based on the total fair value of our Level 3 other long-term investment as of December 31, 2019, changes in the discount rate utilized will not result in a fair value significantly different than the amount recorded.
The following table presents a summary of the changes in the fair values of Level 3 assets, measured on a recurring basis, for the twelve months ended December 31, 2019.
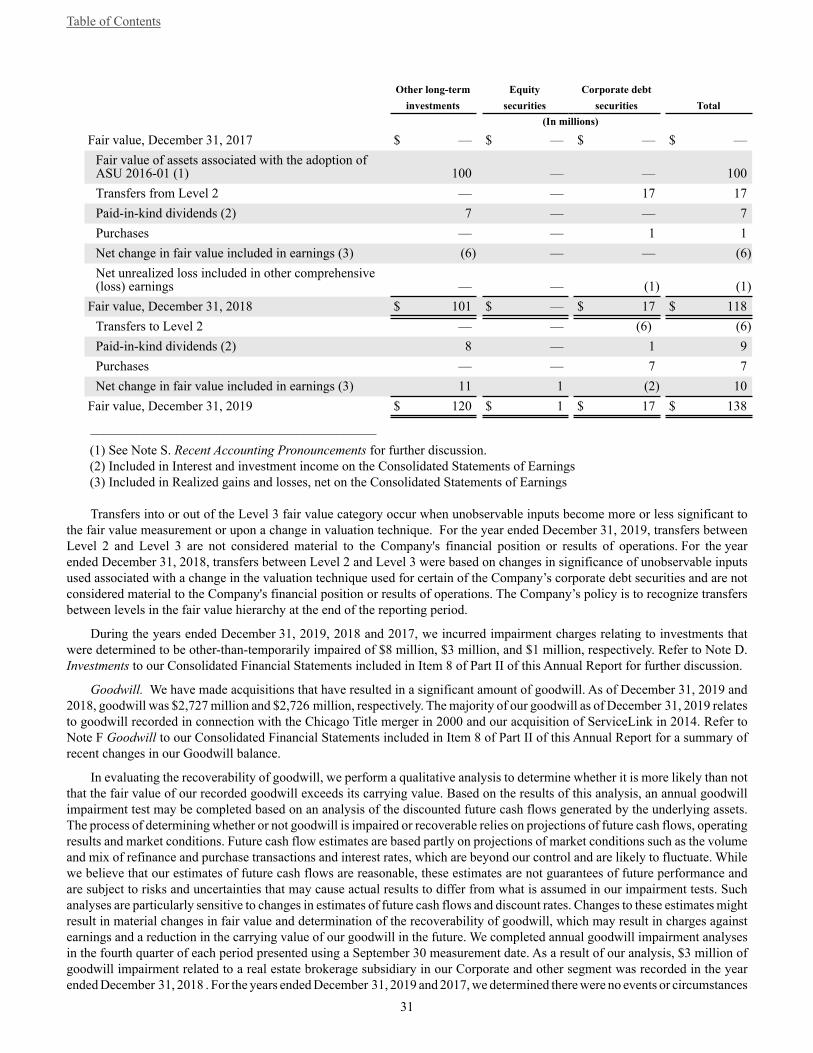
Table of Contents
31
Other long-term Equity Corporate debt investments securities securities Total (In millions)
Fair value, December 31, 2017 $ — $ — $ — $ —Fair value of assets associated with the adoption ofASU 2016-01 (1) 100 — — 100Transfers from Level 2 — — 17 17Paid-in-kind dividends (2) 7 — — 7Purchases — — 1 1Net change in fair value included in earnings (3) (6) — — (6)Net unrealized loss included in other comprehensive(loss) earnings — — (1) (1)
Fair value, December 31, 2018 $ 101 $ — $ 17 $ 118Transfers to Level 2 — — (6) (6)Paid-in-kind dividends (2) 8 — 1 9Purchases — — 7 7Net change in fair value included in earnings (3) 11 1 (2) 10
Fair value, December 31, 2019 $ 120 $ 1 $ 17 $ 138___________________________________________
(1) See Note S. Recent Accounting Pronouncements for further discussion. (2) Included in Interest and investment income on the Consolidated Statements of Earnings (3) Included in Realized gains and losses, net on the Consolidated Statements of Earnings
Transfers into or out of the Level 3 fair value category occur when unobservable inputs become more or less significant to the fair value measurement or upon a change in valuation technique. For the year ended December 31, 2019, transfers between Level 2 and Level 3 are not considered material to the Company's financial position or results of operations. For the year ended December 31, 2018, transfers between Level 2 and Level 3 were based on changes in significance of unobservable inputs used associated with a change in the valuation technique used for certain of the Company’s corporate debt securities and are not considered material to the Company's financial position or results of operations. The Company’s policy is to recognize transfers between levels in the fair value hierarchy at the end of the reporting period.
During the years ended December 31, 2019, 2018 and 2017, we incurred impairment charges relating to investments that were determined to be other-than-temporarily impaired of $8 million, $3 million, and $1 million, respectively. Refer to Note D. Investments to our Consolidated Financial Statements included in Item 8 of Part II of this Annual Report for further discussion.
Goodwill. We have made acquisitions that have resulted in a significant amount of goodwill. As of December 31, 2019 and 2018, goodwill was $2,727 million and $2,726 million, respectively. The majority of our goodwill as of December 31, 2019 relates to goodwill recorded in connection with the Chicago Title merger in 2000 and our acquisition of ServiceLink in 2014. Refer to Note F Goodwill to our Consolidated Financial Statements included in Item 8 of Part II of this Annual Report for a summary of recent changes in our Goodwill balance.
In evaluating the recoverability of goodwill, we perform a qualitative analysis to determine whether it is more likely than not that the fair value of our recorded goodwill exceeds its carrying value. Based on the results of this analysis, an annual goodwill impairment test may be completed based on an analysis of the discounted future cash flows generated by the underlying assets. The process of determining whether or not goodwill is impaired or recoverable relies on projections of future cash flows, operating results and market conditions. Future cash flow estimates are based partly on projections of market conditions such as the volume and mix of refinance and purchase transactions and interest rates, which are beyond our control and are likely to fluctuate. While we believe that our estimates of future cash flows are reasonable, these estimates are not guarantees of future performance and are subject to risks and uncertainties that may cause actual results to differ from what is assumed in our impairment tests. Such analyses are particularly sensitive to changes in estimates of future cash flows and discount rates. Changes to these estimates might result in material changes in fair value and determination of the recoverability of goodwill, which may result in charges against earnings and a reduction in the carrying value of our goodwill in the future. We completed annual goodwill impairment analyses in the fourth quarter of each period presented using a September 30 measurement date. As a result of our analysis, $3 million of goodwill impairment related to a real estate brokerage subsidiary in our Corporate and other segment was recorded in the year ended December 31, 2018 . For the years ended December 31, 2019 and 2017, we determined there were no events or circumstances
Table of Contents
32
which indicated that the carrying value exceeded the fair value. As of December 31, 2019, we have determined that our title segment goodwill has a fair value which substantially exceeds its carrying value.
Other Intangible Assets. We have other intangible assets, not including goodwill, which consist primarily of customer relationships and contracts, trademarks and tradenames, and computer software, which are generally recorded in connection with acquisitions at their fair value. Intangible assets with estimable lives are amortized over their respective estimated useful lives to their estimated residual values and reviewed for impairment whenever events or changes in circumstances indicate that the carrying amount may not be recoverable. In general, customer relationships are amortized over their estimated useful lives, generally ten years, using an accelerated method which takes into consideration expected customer attrition rates. Contractual relationships are generally amortized over their contractual life. Trademarks and tradenames are generally amortized over ten years. Capitalized software includes the fair value of software acquired in business combinations, purchased software and capitalized software development costs. Purchased software is recorded at cost and amortized using the straight-line method over its estimated useful life. Software acquired in business combinations is recorded at its fair value and amortized using straight-line or accelerated methods over its estimated useful life, ranging from five to ten years. For internal-use computer software products, internal and external costs incurred during the preliminary project stage are expensed as they are incurred. Internal and external costs incurred during the application development stage are capitalized and amortized on a product by product basis commencing on the date the software is ready for its intended use. We do not capitalize any costs once the software is ready for its intended use.
We recorded no impairment expense to other intangible assets during the year ended December 31, 2019. We recorded $3 million and $1 million in impairment expense to other intangible assets during the years ended December 31, 2018 and 2017, respectively. The impairment in 2018 primarily relates to an acquired customer relationship asset in our Title segment. The impairment in 2017 was for computer software at ServiceLink.
Accounting for Income Taxes. As part of the process of preparing the consolidated financial statements, we are required to determine income taxes in each of the jurisdictions in which we operate. This process involves estimating actual current tax expense together with assessing temporary differences resulting from differing recognition of items for income tax and accounting purposes. These differences result in deferred income tax assets and liabilities, which are included within the Consolidated Balance Sheets. We must then assess the likelihood that deferred income tax assets will be recovered from future taxable income and, to the extent we believe that recovery is not likely, establish a valuation allowance. To the extent we establish a valuation allowance or increase this allowance in a period, we must reflect this increase as expense within Income tax expense in the Consolidated Statement of Earnings. Determination of income tax expense requires estimates and can involve complex issues that may require an extended period to resolve. Further, the estimated level of annual pre-tax income can cause the overall effective income tax rate to vary from period to period. We believe that our tax positions comply with applicable tax law and that we adequately provide for any known tax contingencies. We believe the estimates and assumptions used to support our evaluation of tax benefit realization are reasonable. Final determination of prior-year tax liabilities, either by settlement with tax authorities or expiration of statutes of limitations, could be materially different than estimates reflected in assets and liabilities and historical income tax provisions. The outcome of these final determinations could have a material effect on our income tax provision, net income or cash flows in the period that determination is made.
Refer to Note K Income Taxes to our Consolidated Financial Statements in Item 8 of Part II of this Annual Report for details.
Certain Factors Affecting Comparability
Year ended December 31, 2017. As a result of the BK Distribution and the FNFV Split-Off, we have reclassified the results of operations of Black Knight and FNFV to discontinued operations for all periods presented. Refer to Note G Discontinued Operations to our Consolidated Financial Statements in Item 8 of Part II of this Annual Report, which is incorporated by reference into this Item 7 of Part II of this Annual Report for further information on the results of operations of Black Knight and FNFV.
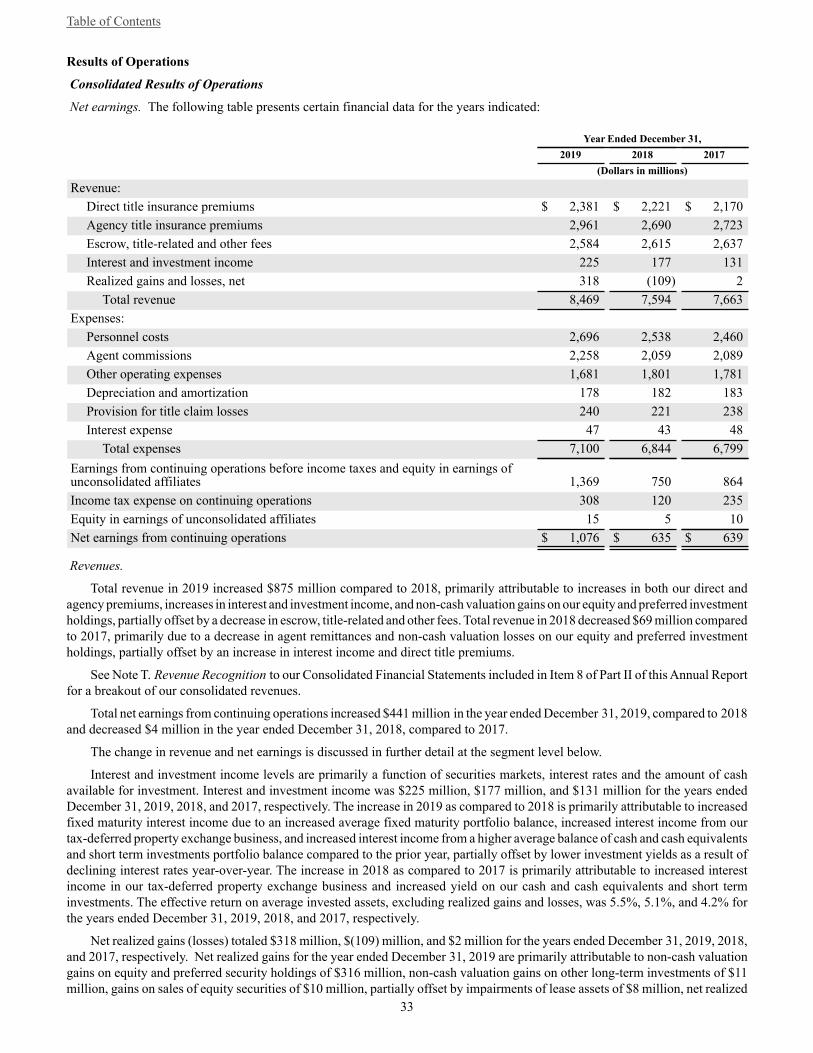
Table of Contents
33
Results of Operations
Consolidated Results of Operations
Net earnings. The following table presents certain financial data for the years indicated:
Year Ended December 31, 2019 2018 2017 (Dollars in millions)
Revenue: Direct title insurance premiums $ 2,381 $ 2,221 $ 2,170Agency title insurance premiums 2,961 2,690 2,723Escrow, title-related and other fees 2,584 2,615 2,637Interest and investment income 225 177 131Realized gains and losses, net 318 (109) 2
Total revenue 8,469 7,594 7,663Expenses:
Personnel costs 2,696 2,538 2,460Agent commissions 2,258 2,059 2,089Other operating expenses 1,681 1,801 1,781Depreciation and amortization 178 182 183Provision for title claim losses 240 221 238Interest expense 47 43 48
Total expenses 7,100 6,844 6,799Earnings from continuing operations before income taxes and equity in earnings ofunconsolidated affiliates 1,369 750 864Income tax expense on continuing operations 308 120 235Equity in earnings of unconsolidated affiliates 15 5 10Net earnings from continuing operations $ 1,076 $ 635 $ 639
Revenues.
Total revenue in 2019 increased $875 million compared to 2018, primarily attributable to increases in both our direct and agency premiums, increases in interest and investment income, and non-cash valuation gains on our equity and preferred investment holdings, partially offset by a decrease in escrow, title-related and other fees. Total revenue in 2018 decreased $69 million compared to 2017, primarily due to a decrease in agent remittances and non-cash valuation losses on our equity and preferred investment holdings, partially offset by an increase in interest income and direct title premiums.
See Note T. Revenue Recognition to our Consolidated Financial Statements included in Item 8 of Part II of this Annual Report for a breakout of our consolidated revenues.
Total net earnings from continuing operations increased $441 million in the year ended December 31, 2019, compared to 2018 and decreased $4 million in the year ended December 31, 2018, compared to 2017.
The change in revenue and net earnings is discussed in further detail at the segment level below.
Interest and investment income levels are primarily a function of securities markets, interest rates and the amount of cash available for investment. Interest and investment income was $225 million, $177 million, and $131 million for the years ended December 31, 2019, 2018, and 2017, respectively. The increase in 2019 as compared to 2018 is primarily attributable to increased fixed maturity interest income due to an increased average fixed maturity portfolio balance, increased interest income from our tax-deferred property exchange business, and increased interest income from a higher average balance of cash and cash equivalents and short term investments portfolio balance compared to the prior year, partially offset by lower investment yields as a result of declining interest rates year-over-year. The increase in 2018 as compared to 2017 is primarily attributable to increased interest income in our tax-deferred property exchange business and increased yield on our cash and cash equivalents and short term investments. The effective return on average invested assets, excluding realized gains and losses, was 5.5%, 5.1%, and 4.2% forthe years ended December 31, 2019, 2018, and 2017, respectively.
Net realized gains (losses) totaled $318 million, $(109) million, and $2 million for the years ended December 31, 2019, 2018, and 2017, respectively. Net realized gains for the year ended December 31, 2019 are primarily attributable to non-cash valuation gains on equity and preferred security holdings of $316 million, non-cash valuation gains on other long-term investments of $11 million, gains on sales of equity securities of $10 million, partially offset by impairments of lease assets of $8 million, net realized
Table of Contents
34
losses of $5 million on sales and maturities of fixed maturity investment securities, and $7 million of other net realized losses. Net realized losses for the year ended December 31, 2018 are primarily attributable to non-cash valuation losses on equity and preferred security holdings of $95 million, losses on sales of equity securities of $21 million, and asset impairments of $7 million, partially offset by net realized gains of $3 million on sales and maturities of preferred and fixed maturity investment securities and $9 million of other realized gains. The net realized gains for the year ended December 31, 2017 includes a gain of $9 millionon the sale of an other long term investment and a gain of $2 million related to the sale of fixed assets, offset by losses of $6 million on redemptions of convertible debt, net losses on sales and impairment of available for sale investments of $1 million, and $2 million of other miscellaneous losses.
See Note D. Investments to our Consolidated Financial Statements included in Item 8 of Part II of this Annual Report for a breakout of our consolidated interest and investment income and realized gains and losses.
Expenses.
Our operating expenses consist primarily of personnel costs; other operating expenses, which in our title business are incurred as orders are received and processed; and agent commissions, which are incurred as revenue is recognized. Title insurance premiums, escrow and title-related fees are generally recognized as income at the time the underlying transaction closes or other service is provided. Direct title operations revenue often lags approximately 45-60 days behind expenses and therefore gross margins may fluctuate. The changes in the market environment, mix of business between direct and agency operations and the contributions from our various business units have historically impacted margins and net earnings. We have implemented programs and have taken necessary actions to maintain expense levels consistent with revenue streams. However, a short time lag exists in reducing variable costs and certain fixed costs are incurred regardless of revenue levels.
Personnel costs include base salaries, commissions, benefits, stock-based compensation and bonuses paid to employees, and are one of our most significant operating expenses.
Agent commissions represent the portion of premiums retained by our third-party agents pursuant to the terms of their respective agency contracts.
Other operating expenses consist primarily of facilities expenses, title plant maintenance, premium taxes (which insurance underwriters are required to pay on title premiums in lieu of franchise and other state taxes), appraisal fees and other cost of sales on ServiceLink product offerings and other title-related products, postage and courier services, computer services, professional services, travel expenses, general insurance, and bad debt expense on our trade and notes receivable.
The provision for title claim losses includes an estimate of anticipated title and title-related claims, and escrow losses.
The change in operating expenses is discussed in further detail at the segment level below.
Income tax expense was $308 million, $120 million, and $235 million for the years ended December 31, 2019, 2018, and 2017, respectively. Income tax expense as a percentage of earnings from continuing operations before income taxes for the years ended December 31, 2019, 2018, and 2017 was 22.5%, 16.0%, and 27.2%, respectively. Income tax expense as a percentage of earnings before income taxes fluctuates depending on our estimate of ultimate income tax liability and changes in the characteristics of net earnings, such as the weighting of operating income versus investment income. On December 22, 2017, the U.S. government enacted comprehensive tax legislation commonly referred to as the Tax Cuts and Jobs Act (the “Tax Reform Act”). Among other provisions, the Tax Reform Act reduced the Federal statutory corporate income tax rate from 35% to 21% and limited or eliminated certain deductions. The increase in the effective rate in 2019 compared to 2018 is primarily attributable to the residual impacts of the Tax Reform Act in 2018. The decrease in the effective tax rate in 2018 compared to 2017 period is primarily attributable to the decreased federal tax rate associated with the passage of the Tax Reform Act and a $45 million decrease in tax expense in 2018 regarding the timing of payments for, and tax rate applicable to, our tax liability resulting from the decrease in our statutory premium reserves associated with the redomestication of certain of our title insurance underwriters in 2017. See Note K. Income Taxes to our Consolidated Financial Statements included in Item 8 of Part II of this Annual Report for a breakout of our income tax expense, deferred tax assets and liabilities, and effective tax rate.

Table of Contents
35
Segment Results of Operations
Title
The following table presents the results of our Title segment for the years indicated:
Year Ended December 31, 2019 2018 2017 (In millions)
Revenues: Direct title insurance premiums $ 2,381 $ 2,221 $ 2,170Agency title insurance premiums 2,961 2,690 2,723Escrow, title-related and other fees 2,389 2,204 2,181Interest and investment income 202 170 131Realized gains and losses, net 326 (110) 6
Total revenue 8,259 7,175 7,211Expenses:
Personnel costs 2,562 2,444 2,366Other operating expenses 1,509 1,421 1,404Agent commissions 2,258 2,059 2,089Depreciation and amortization 154 154 159Provision for title claim losses 240 221 238
Total expenses 6,723 6,299 6,256Earnings before income taxes $ 1,536 $ 876 $ 955Orders opened by direct title operations (in 000's) 2,066 1,818 1,942Orders closed by direct title operations (in 000's) 1,448 1,315 1,428
Total revenues in 2019 increased $1,084 million or 15% compared to 2018. Total revenues in 2018 decreased $36 million or less than 1% compared to 2017. The increase in the year ended December 31, 2019 is primarily attributable to increases in both our direct and agency premiums, increases in escrow, title-related and other fees, increases in interest and investment income, and non-cash valuation gains on our equity and preferred investment holdings. The decrease in the year ended December 31, 2018 is primarily attributable to a decrease in agency remittances and non-cash valuation losses on our equity and preferred investment holdings, partially offset by an increase in investment income and direct title premiums.
The following table presents the percentages of title insurance premiums generated by our direct and agency operations:
Year Ended December 31,
2019 2018 2017
Amount % Amount % Amount %
(Dollars in millions)
Title premiums from direct operations $ 2,381 44.6% $ 2,221 45.2% $ 2,170 44.3%Title premiums from agency operations 2,961 55.4 2,690 54.8 2,723 55.7
Total title premiums $ 5,342 100.0% $ 4,911 100.0% $ 4,893 100.0%
Title premiums increased 9% in the year ended December 31, 2019 as compared to 2018. The increase was a result of an increase in premiums from direct operations of $160 million, or 7%, and an increase in premiums from agency operations of $271 million, or 10%. Title premiums increased less than 1% in the year ended December 31, 2018 as compared to 2017.

Table of Contents
36
The following table presents the percentages of opened and closed title insurance orders generated by purchase and refinance transactions by our direct operations:
Year ended December 31,2019 2018 2017
Opened title insurance orders from purchase transactions (1) 56.7% 68.5% 63.1%Opened title insurance orders from refinance transactions (1) 43.3 31.5 36.9
100.0% 100.0% 100.0%
Closed title insurance orders from purchase transactions (1) 57.6% 68.2% 62.8%Closed title insurance orders from refinance transactions (1) 42.4 31.8 37.2
100.0% 100.0% 100.0%_______________________________________
(1) Percentages exclude consideration of an immaterial number of non-purchase and non-refinance orders.
Title premiums from direct operations increased in 2019, primarily due to an increase in closed order volumes, partially offset by a decrease in the average fee per file. Closed order volumes were 1,448,000 in the year ended December 31, 2019 compared with 1,315,000 in the year ended December 31, 2018. This represented an increase of 10.1%. The increase in closed order volumes was primarily attributable to increased residential refinance activity as a result of lower mortgage interest rates in the year ended December 31, 2019 compared to 2018.
The average fee per file in our direct operations was $2,511 and $2,585 in the years ended December 31, 2019 and 2018, respectively. The decrease in average fee per file year over year reflects the increase in residential refinance activity, partially offset by an increase in the average fee per file in both commercial and residential purchase transactions. The residential fee per file tends to change as the mix of refinance and purchase transactions changes, because purchase transactions involve the issuance of both a lender’s policy and an owner’s policy, resulting in higher fees, whereas refinance transactions only require a lender’s policy, resulting in lower fees.
Title premiums from agency operations increased $271 million, or 10%, in the year ended December 31, 2019 as compared to 2018 and decreased $33 million, or 1%, in the year ended December 31, 2018 as compared to 2017. The increase in 2019 as compared to 2018 reflects an improving residential purchase environment in many markets throughout the country and a concerted effort by management to increase remittances with existing agents as well as cultivate new relationships with potential new agents. In addition, lower mortgage rates have resulted in increased refinance business with agents. The decrease in 2018 as compared to 2017 reflects a decrease of $51 million related to adjustments to our accrued agent premiums receivable, partially offset by an increase in remittances.
Escrow, title-related and other fees increased by $185 million, or 8%, in the year ended December 31, 2019 from 2018. Escrow fees, which are more directly related to our direct operations, increased $72 million, or 9%, in the year ended December 31, 2019compared to 2018. The increase is primarily driven by the related increase in direct title premiums. Other fees in the Title segment, excluding escrow fees, increased $113 million, or 8%, in the year ended December 31, 2019 compared to 2018. The change in both escrow fees and other fees is directionally consistent with the change in title premiums from direct operations. Escrow, title related and other fees increased by $23 million, or 1%, in the year ended December 31, 2018 from 2017. Escrow fees increased $6 million, or less than 1%, in the year ended December 31, 2018 compared to 2017. The increase is primarily driven by the related increase in direct title premiums. Other fees in the Title segment, excluding escrow fees, increased $17 million, or 1%, in the year ended December 31, 2018 compared to 2017. The change in both escrow fees and other fees is directionally consistent with the change in title premiums from direct operations.
Interest and investment income levels are primarily a function of securities markets, interest rates and the amount of cash available for investment. Interest and investment income increased $32 million in the year ended December 31, 2019 compared to 2018 and increased $39 million in the year ended December 31, 2018 compared to 2017. The increase in 2019 was primarily attributable to increased fixed maturity interest income due to an increased average fixed maturity portfolio balance, increased interest income from our tax-deferred property exchange business, and increased yield on our cash and cash equivalents and short term investments.The increase in 2018 was primarily attributable to increased interest income in our tax-deferred property exchange business.
Personnel costs include base salaries, commissions, benefits, stock-based compensation and bonuses paid to employees, and are one of our most significant operating expenses. The $118 million, or 5% increase in the year ended December 31, 2019 compared to 2018 is directionally consistent with and primarily attributable to the increase in revenue. The $78 million, or 3%, increase in the year ended December 31, 2018 compared to 2017 is directionally consistent with and primarily attributable
Table of Contents
37
to the increase in revenue. Personnel costs as a percentage of total revenues from direct title premiums and escrow, title-related and other fees was 54% and 55% for years ended December 31, 2019 and 2018, respectively. Average employee count in the Title segment was 23,484 and 23,165 in the years ended December 31, 2019 and 2018, respectively.
Other operating expenses increased $88 million, or 6%, in the year ended December 31, 2019 compared to 2018. Other operating expenses as a percentage of total revenue excluding agency premiums, interest and investment income, and realized gains and losses remained flat in the year ended December 31, 2019 compared to 2018. Other operating expenses increased $17 million, or 1% in the year ended December 31, 2018 compared to 2017. Other operating expenses as a percentage of total revenue excluding agency premiums, interest and investment income, and realized gains and losses was 32% in the years ended December 31, 2019, 2018, and 2017.
Agent commissions represent the portion of premiums retained by agents pursuant to the terms of their respective agency contracts. Agent commissions and the resulting percentage of agent premiums we retain vary according to regional differences in real estate closing practices and state regulations.
The following table illustrates the relationship of agent title premiums and agent commissions:
Year Ended December 31, 2019 2018 2017 Amount % Amount % Amount % (Dollars in millions)
Agent title premiums $ 2,961 100.0% $ 2,690 100.0% $ 2,723 100.0%Agent commissions 2,258 76.3 2,059 76.5 2,089 76.7
Net retained agent premiums $ 703 23.7% $ 631 23.5% $ 634 23.3%
Net margin from agency title insurance premiums retained as a percentage of total agency premiums in the year ended December 31, 2019 increased due to increased refinance activity when compared to the 2018 and 2017 periods.
The provision for title claim losses includes an estimate of anticipated title and title-related claims and escrow losses. The estimate of anticipated title and title-related claims is accrued as a percentage of title premium revenue based on our historical loss experience and other relevant factors. Any significant adjustments to strengthen or release loss reserves resulting from the comparison with our actuarial analysis are made in addition to this loss provision rate. After considering historical claim losses, reporting patterns and current market information, and analyzing quantitative and qualitative data provided by our legal, claims and underwriting departments, we determine a loss provision rate, which is recorded as a percentage of current title premiums. This loss provision rate is set to provide for losses on current year policies, but due to development of prior years and our long claim duration, it periodically includes amounts of estimated adverse or positive development on prior years' policies. Effective October 1, 2017, we revised our loss provision rate to 4.5% from 5%. The revision was attributable to favorable development on more recent policy year claims. No revisions were made to our loss provision in the years ended December 31, 2019 or 2018.
The claim loss provision for title insurance was $240 million, $221 million, and $238 million for the years ended December 31, 2019, 2018, and 2017, respectively. These amounts reflected average claim loss provision rates of 4.5% for 2019, 4.5% for 2018,and 4.9% for 2017. We will continue to monitor and evaluate our loss provision level, actual claims paid, and the loss reserve position each quarter.

Table of Contents
38
Corporate and Other
The following table presents the results of our Corporate and Other segment for the years indicated:
Year Ended December 31, 2019 2018 2017 (In millions)
Revenues: Escrow, title-related and other fees $ 195 $ 411 $ 456Interest and investment income 23 7 —Realized gains and losses, net (8) 1 (4)
Total revenue 210 419 452Expenses:
Personnel costs 134 94 94Other operating expenses 172 380 377Depreciation and amortization 24 28 24Interest expense 47 43 48
Total expenses 377 545 543Loss before income taxes $ (167) $ (126) $ (91)
Total revenue in our Corporate and Other segment decreased $209 million, or 50%, in the year ended December 31, 2019compared to 2018 and decreased $33 million, or 7%, in the year ended December 31, 2018 compared to 2017. The decrease in 2019 is primarily attributable to the sale of Pacific Union in the third quarter of 2018, partially offset by increased revenue associated with the valuation of deferred compensation assets. The decrease in 2018 is primarily attributable to a decrease of $74 million associated with lower real estate brokerage revenue resulting from the sale of Pacific Union, partially offset by growth and acquisitions in our real estate technology businesses resulting in increased revenue of $31 million in 2018 and increased interest income on corporate cash holdings of $7 million in 2018.
Personnel costs increased $40 million, or 43%, in the year ended December 31, 2019 compared to 2018 and remained flat in the year ended December 31, 2018 compared to 2017. The increase in 2019 is primarily attributable to increased valuation of deferred compensation plan assets, increased costs resulting from growth of our real estate technology subsidiaries, and increased severance expense related to the departure of certain executives. In 2018 there were increased personnel costs related to acquisitions when compared 2017; however, these increased personnel costs were offset by the Pacific Union sale.
Other operating expenses decreased $208 million, or 55% in the year ended December 31, 2019 from 2018 and increased $3 million, or 1%, in the year ended December 31, 2018 from 2017. The decrease in 2019 from 2018 is primarily attributable to the Pacific Union sale, which is partially offset by the Reverse Termination Fee of $50 million paid to Stewart on September 12, 2019. The increase in 2018 from 2017 is primarily attributable to an increase of $13 million attributable to growth in our real estate technology subsidiaries in 2018 and the inclusion of $33 million of expense eliminations (reduction to expense) in 2017 related to elimination of expense with Black Knight, partially offset by decreased expense in 2018 resulting from the Pacific Union sale.
Interest expense increased $4 million, or 9%, in the year ended December 31, 2019 compared to 2018 and decreased $5 million, or 10%, in the year ended December 31, 2018 compared to 2017. The increase in 2019 is primarily attributable to interest associated with our 4.50% Notes issued in August 2018. The decrease in 2018 compared to 2017 is primarily attributable to the final settlement of our convertible Notes in August 2018 and 6.6% Senior Notes in the 2017 period, partially offset by interest associated with our 4.50% Notes issued in August 2018. See Note J Notes Payable to our Consolidated Financial Statements included in Item 8 of Part II of this Annual Report for further discussion of our outstanding debt.
Discontinued Operations
As a result of the FNFV Split-off and BK Distribution, the results of operations of FNFV and Black Knight are included in discontinued operations. Earnings from discontinued operations, net of tax, were $155 million in the year ended December 31, 2017. Refer to Note G Discontinued Operations to our Consolidated Financial Statements in Item 8 of Part II of this Annual Report for further information, including a breakout of the results of operations of both FNFV and Black Knight.

Table of Contents
39
Liquidity and Capital Resources
Cash Requirements. Our current cash requirements include personnel costs; operating expenses; claim payments; taxes; payments of interest and principal on our debt, including any premiums thereon, if any; capital expenditures; business acquisitions; stock repurchases and dividends on our common stock. We paid dividends of $1.26 per share during 2019, or approximately $344 million. On February 13, 2020, our Board of Directors formally declared a $0.33 per share cash dividend that is payable on March 31, 2020 to FNF shareholders of record as of March 17, 2020. There are no restrictions on our retained earnings regarding our ability to pay dividends to shareholders, although there are limits on the ability of certain subsidiaries to pay dividends to us, as described below. The declaration of any future dividends is at the discretion of our Board of Directors. Additional uses of cash flow are expected to include stock repurchases, acquisitions, and debt repayments.
As of December 31, 2019, we had cash and cash equivalents of $1,376 million, short term investments of $876 million and available capacity under our Revolving Credit Facility of $800 million. We continually assess our capital allocation strategy, including decisions relating to the amount of our dividend, reducing debt, repurchasing our stock, and/or conserving cash. We believe that all anticipated cash requirements for current operations will be met from internally generated funds, through cash dividends from subsidiaries, cash generated by investment securities, potential sales of non-strategic assets, and borrowings on our Revolving Credit Facility. Our short-term and long-term liquidity requirements are monitored regularly to ensure that we can meet our cash requirements. We forecast the needs of all of our subsidiaries and periodically review their short-term and long-term projected sources and uses of funds, as well as the asset, liability, investment and cash flow assumptions underlying such forecasts.
Our insurance subsidiaries generate cash from premiums earned and their respective investment portfolios and these funds are adequate to satisfy the payments of claims and other liabilities. Due to the magnitude of our investment portfolio in relation to our claims loss reserves, we do not specifically match durations of our investments to the cash outflows required to pay claims, but do manage outflows on a shorter time frame.
Our two significant sources of internally generated funds are dividends and other payments from our subsidiaries. As a holding company, we receive cash from our subsidiaries in the form of dividends and as reimbursement for operating and other administrative expenses we incur. The reimbursements are paid within the guidelines of management agreements among us and our subsidiaries. Our insurance subsidiaries are restricted by state regulation in their ability to pay dividends and make distributions. Each state of domicile regulates the extent to which our title underwriters can pay dividends or make distributions. As of December 31, 2019, $1,868 million of our net assets were restricted from dividend payments without prior approval from the relevant departments of insurance. During 2020, our title insurance subsidiaries can pay or make distributions to us of approximately $518 million. Our underwritten title companies and non-title insurance subsidiaries collect revenue and pay operating expenses. However, they are not regulated to the same extent as our insurance subsidiaries.
The maximum dividend permitted by law is not necessarily indicative of an insurer’s actual ability to pay dividends, which may be constrained by business and regulatory considerations, such as the impact of dividends on surplus, which could affect an insurer’s ratings or competitive position, the amount of premiums that can be written and the ability to pay future dividends. Further, depending on business and regulatory conditions, we may in the future need to retain cash in our underwriters or even contribute cash to one or more of them in order to maintain their ratings or their statutory capital position. Such a requirement could be the result of investment losses, reserve charges, adverse operating conditions in the current economic environment or changes in interpretation of statutory accounting requirements by regulators.
Cash flow from FNF's operations is expected to be used for general corporate purposes including to reinvest in operations, repay debt, pay dividends, repurchase stock, other strategic initiatives or conserving cash.
Operating Cash Flow. Our cash flows provided by operations for the years ended December 31, 2019, 2018, and 2017 were $1,121 million, $943 million and $737 million, respectively, inclusive of discontinued operations. Operating cash flows from discontinued operations for the year ended December 31, 2017 was $106 million. The increase in cash provided by operations of$178 million in the 2019 period from the 2018 period is primarily attributable to the increase in pre-tax earnings and the timing of receipts and payments of payables, partially offset by the timing of receipts and payments of prepaid assets, receivables and income taxes. Included in net earnings in the 2019 period is our payment to Stewart of the Reverse Termination Fee of $50 million. The increase in cash provided by operations of $206 million in the 2018 period from the 2017 period is primarily attributable to lower realized gains on sales of investments and assets, which are included in earnings but relate to investing activities, and a $128 million decrease in payments for income taxes by continuing operations in the 2018 period, partially offset by the inclusion of cash flows from discontinued operations in the 2017 period.
Investing Cash Flows. Our cash (used in) provided by investing activities for the years ended December 31, 2019, 2018, and 2017 were $(520) million, $(354) million and $79 million, respectively, inclusive of discontinued operations. Cash used in investing activities from discontinued operations for the year ended December 31, 2017 was $57 million. The decrease in cash provided by
Table of Contents
40
(increase in cash used in) investing activities of $(166) million in the 2019 period from the 2018 period is primarily attributable to a decrease in net cash inflow from proceeds from calls and maturities of investment securities, partially offset by reduced purchases of investment securities. The decrease in cash provided by (increase in cash used in) investing activities of $(433) millionin the 2018 period from the 2017 period is primarily attributable to $681 million increase in net outflows from purchases of investments and additional investments in unconsolidated investees, net of sales of investments and distributions of and from equity and fixed income investments, partially offset by a $160 million decrease in cash used in acquisitions, net of disposals, and a decrease in capital expenditures in the 2018 period.
Capital Expenditures. Total capital expenditures for property and equipment and capitalized software were $96 million, $83 million and $149 million for the years ended December 31, 2019, 2018, and 2017, respectively. The 2019 period primarily consists of capital expenditures in our Title segment. The 2018 period primarily consists of capital expenditures in our Title segment and the decrease from the 2017 period is primarily attributable to discontinued operations. The 2017 period consists of capital expenditures of $74 million related to our continuing operations, primarily our Title segment, and $75 million related to discontinued operations.
Financing Cash Flows. Our cash used in financing activities for the years ended December 31, 2019, 2018, and 2017 were $482 million, $442 million and $1,029 million, respectively, inclusive of discontinued operations. The increase in cash used in financing activities of $40 million in the 2019 period from the 2018 period is primarily attributable to increased purchases of treasury stock of $66 million, a decrease in the change in net borrowing activity of $72 million, a decrease in net change of secured trust deposits of $23 million, increased dividends paid of $16 million, and increased other financing activities of $25 million, partially offset by increased exercise of stock options of $20 million and the payment of the equity portion of debt conversions settled in cash of $142 million in the 2018 period. The decrease in cash used in financing activities of $587 million in the 2018period from the 2017 period is primarily attributable to a $458 million decrease in net debt service payments, net of borrowings, in the 2018 period, $109 million in cash transferred in the BK Distribution and FNFV Split-off in the 2017 period, repurchases of BKFS stock by Black Knight of $47 million in the 2017 period, and a $22 million decrease in change in secured trust deposits, partially offset by an increase in cash dividends paid of $50 million in the 2018 period.
Financing. For a description of our financing arrangements see Note J Notes Payable to the Consolidated Financial Statements included in Item 8 of Part II of this Annual Report, which is incorporated by reference into this Item 7 of Part II.
Contractual Obligations. Our long term contractual obligations generally include our loss reserves, our credit agreements and other debt facilities and operating lease payments on certain of our premises and equipment.
As of December 31, 2019, our required annual payments relating to these contractual obligations were as follows:
2020 2021 2022 2023 2024 Thereafter Total (In millions)
Notes payable principal repayment $ — $ — $ 400 $ — $ — $ 450 $ 850Operating lease payments 145 121 93 64 37 23 483Pension and other benefit payments 15 14 13 12 12 95 161Title claim loss estimated payments 220 218 173 138 97 663 1,509Interest on fixed rate notes payable 42 42 35 20 20 102 261Total $ 422 $ 395 $ 714 $ 234 $ 166 $ 1,333 $ 3,264
As of December 31, 2019, we had title insurance reserves of $1,509 million. The amounts and timing of these obligations are estimated and are not set contractually. While we believe that historical loss payments are a reasonable source for projecting future claim payments, there is significant inherent uncertainty in this payment pattern estimate because of the potential impact of changes in:
• future mortgage interest rates, which will affect the number of real estate and refinancing transactions and, therefore, the rate at which title insurance claims will emerge;
• the legal environment whereby court decisions and reinterpretations of title insurance policy language to broaden coverage could increase total obligations and influence claim payout patterns;
• events such as fraud, escrow theft, multiple property title defects, foreclosure rates and individual large loss events that can substantially and unexpectedly cause increases in both the amount and timing of estimated title insurance loss payments; and
• loss cost trends whereby increases or decreases in inflationary factors (including the value of real estate) will influence the ultimate amount of title insurance loss payments.
Table of Contents
41
Based on historical title insurance claim experience, we anticipate the above payment patterns. The uncertainty and variation in the timing and amount of claim payments could have a material impact on our cash flows from operations in a particular period.
We sponsor certain frozen pension and other post-retirement benefit plans. See Note O. Employee Benefit Plans to our Consolidated Financial Statements included in Item 8 of Part II of this Annual Report for further information.
Capital Stock Transactions. On July 17, 2018, our Board of Directors approved a new three-year stock repurchase program effective August 1, 2018 (the "2018 Repurchase Program") under which we can purchase up to 25 million shares of our FNF common stock through July 31, 2021. We may make repurchases from time to time in the open market, in block purchases or in privately negotiated transactions, depending on market conditions and other factors. During the year ended December 31, 2019, we repurchased a total of 2,120,000 FNF common shares for an aggregate of $85 million or an average of $40.09 per share. Since the original commencement of the 2018 Repurchase Program, we have repurchased a total of 2,780,000 FNF common shares for an aggregate of $106 million, or an average of $38.24 per share.
Equity and Preferred Security Investments. Our equity and preferred security investments may be subject to significant volatility. Currently prevailing accounting standards require us to record the change in fair value of equity and preferred security investments held as of any given period end within earnings. Our results of operations in future periods will be subject to such volatility.
Off-Balance Sheet Arrangements. We do not engage in off-balance sheet activities other than our escrow operations. In conducting our operations, we routinely hold customers’ assets in escrow, pending completion of real estate transactions, and are responsible for the proper disposition of these balances for our customers. Certain of these amounts are maintained in segregated bank accounts and have not been included in the accompanying Consolidated Balance Sheets, consistent with Generally Accepted Accounting Principles and industry practice. These balances amounted to $18.7 billion and $13.5 billion at December 31, 2019and 2018, respectively. As a result of holding these customers’ assets in escrow, we have ongoing programs for realizing economic benefits during the year through favorable borrowing and vendor arrangements with various banks.
Recent Accounting Pronouncements
For a description of recent accounting pronouncements, see Note S Recent Accounting Pronouncements to our Consolidated Financial Statements included in Item 8 of Part II of this Annual Report.
Item 7A. Quantitative and Qualitative Disclosure about Market Risk
In the normal course of business, we are routinely subject to a variety of risks, as described in Item 1A. Risk Factors of this Annual Report and in our other filings with the Securities and Exchange Commission. For example, we are exposed to the risk that decreased real estate activity, which depends in part on the level of interest rates, may reduce our revenues.
The risks related to our business also include certain market risks that may affect our debt and other financial instruments. At present, we face the market risks associated with our marketable equity securities subject to equity price volatility and with interest rate movements on our fixed income investments.
We regularly assess these market risks and have established policies and business practices designed to protect against the adverse effects of these exposures.
At December 31, 2019, we had $838 million in long-term debt, none of which bears interest at a floating rate. Accordingly, fluctuations in market interest rates will not have a material impact on our resulting interest expense.
Our fixed maturity investments, certain preferred securities and our floating rate debt are subject to an element of market risk from changes in interest rates. Increases and decreases in prevailing interest rates generally translate into decreases and increases in fair values of those instruments. Additionally, fair values of interest rate sensitive instruments may be affected by the creditworthiness of the issuer, prepayment options, relative values of alternative investments, the liquidity of the instrument and other general market conditions. We manage interest rate risk through a variety of measures. We monitor our interest rate risk and make investment decisions to manage the perceived risk.
Equity price risk is the risk that we will incur economic losses due to adverse changes in equity prices. In the past, our exposure to changes in equity prices primarily resulted from our holdings of equity securities. At December 31, 2019, we held $811 million in marketable equity securities (not including our investments in preferred securities of $323 million and our investments in unconsolidated affiliates of $131 million). The carrying values of investments subject to equity price risks are based on quoted market prices as of the balance sheet date. Market prices are subject to fluctuation and, consequently, the amount realized in the subsequent sale of an investment may significantly differ from the reported market value. Fluctuation in the market price of a security may result from perceived changes in the underlying economic characteristics of the investee, the relative price of alternative investments and general market conditions. Furthermore, amounts realized in the sale of a particular security may be affected by the relative quantity of the security being sold.

Table of Contents
42
Financial instruments, which potentially subject us to concentrations of credit risk, consist primarily of cash equivalents, short-term investments, and trade receivables. We require placement of cash in financial institutions evaluated as highly creditworthy.
For purposes of this Annual Report, we perform a sensitivity analysis to determine the effects that market risk exposures may have on the fair values of our debt and other financial instruments.
The financial instruments that are included in the sensitivity analysis with respect to interest rate risk include fixed maturity investments, preferred securities and notes payable. The financial instruments that are included in the sensitivity analysis with respect to equity price risk include marketable equity securities. With the exception of our equity method investments, it is not anticipated that there would be a significant change in the fair value of other long-term investments or short-term investments if there were a change in market conditions, based on the nature and duration of the financial instruments involved.
To perform the sensitivity analysis, we assess the risk of loss in fair values from the effect of hypothetical changes in interest rates and equity prices on market-sensitive instruments. The changes in fair values for interest rate risks are determined by estimating the present value of future cash flows using various models, primarily duration modeling. The changes in fair values for equity price risk are determined by comparing the market price of investments against their reported values as of the balance sheet date.
Information provided by the sensitivity analysis does not necessarily represent the actual changes in fair value that we would incur under normal market conditions because, due to practical limitations, all variables other than the specific market risk factor are held constant. For example, our reserve for title claim losses (representing 30.4% of total liabilities at December 31, 2019) is not included in the hypothetical effects.
We have no market risk sensitive instruments entered into for trading purposes; therefore, all of our market risk sensitive instruments were entered into for purposes other than trading. The results of the sensitivity analysis at December 31, 2019 and December 31, 2018, are as follows:
Interest Rate Risk
At December 31, 2019, an increase (decrease) in the levels of interest rates of 100 basis points, with all other variables held constant, would result in a (decrease) increase in the fair value of our fixed maturity securities and certain of our investments in preferred securities which are tied to interest rates of $86 million as compared with a (decrease) increase of $70 million at December 31, 2018.
Equity Price Risk
At December 31, 2019, a 20% increase (decrease) in market prices, with all other variables held constant, would result in an increase (decrease) in the fair value of our equity securities portfolio of $162 million, as compared with an increase (decrease) of $100 million at December 31, 2018.
Table of Contents
43
Item 8. Financial Statements and Supplementary Data
FIDELITY NATIONAL FINANCIAL, INC. AND SUBSIDIARIES
INDEX TO FINANCIAL INFORMATION
Page
Number
Report of Independent Registered Public Accounting Firm on Effectiveness of Internal Control over Financial ReportingReport of Independent Registered Public Accounting Firms on Consolidated Financial StatementsConsolidated Balance Sheets as of December 31, 2019 and 2018Consolidated Statements of Earnings for the years ended December 31, 2019, 2018, and 2017Consolidated Statements of Comprehensive Earnings for the years ended December 31, 2019, 2018, and 2017Consolidated Statements of Equity for the years ended December 31, 2019, 2018, and 2017Consolidated Statements of Cash Flows for the years ended December 31, 2019, 2018, and 2017Notes to Consolidated Financial Statements
4445474850515354
Table of Contents
44
REPORT OF INDEPENDENT REGISTERED PUBLIC ACCOUNTING FIRM
To the Shareholders and the Board of Directors of Fidelity National Financial, Inc.
Opinion on Internal Control over Financial Reporting
We have audited Fidelity National Financial, Inc. and subsidiaries’ internal control over financial reporting as of December 31, 2019, based on criteria established in Internal Control-Integrated Framework issued by the Committee of Sponsoring Organizations of the Treadway Commission (2013 framework) (the COSO criteria). In our opinion, Fidelity National Financial, Inc. and subsidiaries (the Company) maintained, in all material respects, effective internal control over financial reporting as of December 31, 2019, based on the COSO criteria.
We also have audited, in accordance with the standards of the Public Company Accounting Oversight Board (United States) (PCAOB), the consolidated balance sheets of the Company as of December 31, 2019 and 2018, and the related consolidated statements of earnings, comprehensive earnings, equity and cash flows for each of the three years in the period ended December 31, 2019, and the related notes and financial statement schedule listed in the Index at Item 15(a)(2) and our report dated February 14, 2020 expressed an unqualified opinion thereon.
Basis for Opinion
The Company’s management is responsible for maintaining effective internal control over financial reporting and for its assessment of the effectiveness of internal control over financial reporting included in the accompanying Management’s Annual Report on Internal Control over Financial Reporting. Our responsibility is to express an opinion on the Company’s internal control over financial reporting based on our audit. We are a public accounting firm registered with the PCAOB and are required to be independent with respect to the Company in accordance with the U.S. federal securities laws and the applicable rules and regulations of the Securities and Exchange Commission and the PCAOB.
We conducted our audit in accordance with the standards of the PCAOB. Those standards require that we plan and perform the audit to obtain reasonable assurance about whether effective internal control over financial reporting was maintained in all material respects.
Our audit included obtaining an understanding of internal control over financial reporting, assessing the risk that a material weakness exists, testing and evaluating the design and operating effectiveness of internal control based on the assessed risk, and performing such other procedures as we considered necessary in the circumstances. We believe that our audit provides a reasonable basis for our opinion.
Definition and Limitations of Internal Control Over Financial Reporting
A company’s internal control over financial reporting is a process designed to provide reasonable assurance regarding the reliability of financial reporting and the preparation of financial statements for external purposes in accordance with generally accepted accounting principles. A company’s internal control over financial reporting includes those policies and procedures that (1) pertain to the maintenance of records that, in reasonable detail, accurately and fairly reflect the transactions and dispositions of the assets of the company; (2) provide reasonable assurance that transactions are recorded as necessary to permit preparation of financial statements in accordance with generally accepted accounting principles, and that receipts and expenditures of the company are being made only in accordance with authorizations of management and directors of the company; and (3) provide reasonable assurance regarding prevention or timely detection of unauthorized acquisition, use, or disposition of the company’s assets that could have a material effect on the financial statements.
Because of its inherent limitations, internal control over financial reporting may not prevent or detect misstatements. Also, projections of any evaluation of effectiveness to future periods are subject to the risk that controls may become inadequate because of changes in conditions, or that the degree of compliance with the policies or procedures may deteriorate.
/s/ Ernst & Young LLP
Jacksonville, FloridaFebruary 14, 2020

Table of Contents
45
REPORT OF INDEPENDENT REGISTERED PUBLIC ACCOUNTING FIRM
To the Shareholders and the Board of Directors of Fidelity National Financial, Inc.
Opinion on the Financial Statements
We have audited the accompanying consolidated balance sheets of Fidelity National Financial, Inc. and subsidiaries (the Company) as of December 31, 2019 and 2018, and the related consolidated statements of earnings, comprehensive earnings, equity and cash flows for each of the three years in the period ended December 31, 2019, and the related notes and financial statement schedule listed in the Index at Item 15(a)(2) (collectively referred to as the “consolidated financial statements”). In our opinion, the consolidated financial statements present fairly, in all material respects, the financial position of the Company at December 31, 2019 and 2018, and the results of its operations and its cash flows for each of the three years in the period ended December 31, 2019, in conformity with U.S. generally accepted accounting principles.
We also have audited, in accordance with the standards of the Public Company Accounting Oversight Board (United States) (PCAOB), the Company's internal control over financial reporting as of December 31, 2019, based on criteria established in Internal Control-Integrated Framework issued by the Committee of Sponsoring Organizations of the Treadway Commission (2013 framework) and our report dated February 14, 2020 expressed an unqualified opinion thereon.
Adoption of Accounting Standards Update (ASU) No. 2016-01
As discussed in Note S to the consolidated financial statements, the Company changed its method of accounting for equity investments with readily determinable fair values in 2018 due to the adoption of ASU 2016-01, Recognition and Measurement of Financial Assets and Financial Liabilities.
Basis for Opinion
These financial statements are the responsibility of the Company's management. Our responsibility is to express an opinion on the Company’s financial statements based on our audits. We are a public accounting firm registered with the PCAOB and are required to be independent with respect to the Company in accordance with the U.S. federal securities laws and the applicable rules and regulations of the Securities and Exchange Commission and the PCAOB.
We conducted our audits in accordance with the standards of the PCAOB. Those standards require that we plan and perform the audit to obtain reasonable assurance about whether the financial statements are free of material misstatement, whether due to error or fraud. Our audits included performing procedures to assess the risks of material misstatement of the financial statements, whether due to error or fraud, and performing procedures that respond to those risks. Such procedures included examining, on a test basis, evidence regarding the amounts and disclosures in the financial statements. Our audits also included evaluating the accounting principles used and significant estimates made by management, as well as evaluating the overall presentation of the financial statements. We believe that our audits provide a reasonable basis for our opinion.
Table of Contents
46
Critical Audit Matter
The critical audit matter communicated below is a matter arising from the current period audit of the financial statements that was communicated or required to be communicated to the audit committee and that: (1) relates to accounts or disclosures that are material to the financial statements and (2) involved our especially challenging, subjective or complex judgments. The communication of the critical audit matter does not alter in any way our opinion on the consolidated financial statements, taken as a whole, and we are not, by communicating the critical audit matter below, providing a separate opinion on the critical audit matter or on the accounts or disclosures to which it relates.
Reserve for Title Claim LossesDescription of the Matter The Company’s reserve for title claim losses totaled $1.51 billion as of December 31, 2019. As
discussed in Note A to the consolidated financial statements, the reserve for title claim losses includes known claims as well as losses that have been incurred but not yet reported, net of recoupments. The Company establishes reserves for claims which are incurred but not reported at the time premium revenue is recognized based on estimated loss provision rates. There is significant uncertainty inherent in determining the loss provision rates.
Auditing the Company’s reserve for title claim losses was complex because of the highly judgmental nature of the determination of the loss provision rates used in the valuation of the reserve for title claim losses. The significant judgment was primarily due to the sensitivity of management’s estimate to claim loss history, industry trends, current legal environment, and geographic considerations.
How we Addressed theMatter in Our Audit
We obtained an understanding, evaluated the design, and tested the operating effectiveness of the Company’s controls over management’s process for the development of the loss provision rates and the recorded reserve for title claim losses. These controls included, among others, the review and approval process management has in place for the development of the loss provision rates and the estimation of the reserve for title claim losses.
To evaluate the judgment used by management in determining the loss provision rates, among other procedures, we considered claim loss history, industry trends, current legal environment and geographic considerations, and how management assessed these factors in the current period as compared to prior periods. With the assistance of our actuarial specialists, we performed an evaluation of the Company’s current year loss provision rates compared with those used in prior periods, as well as a review of loss development experience for prior years. We also independently calculated a range of reasonable reserve estimates which we compared to management’s recorded reserve for title claim losses.
/s/ Ernst & Young LLP
We have served as the Company's auditor since 2017
Jacksonville, FloridaFebruary 14, 2020
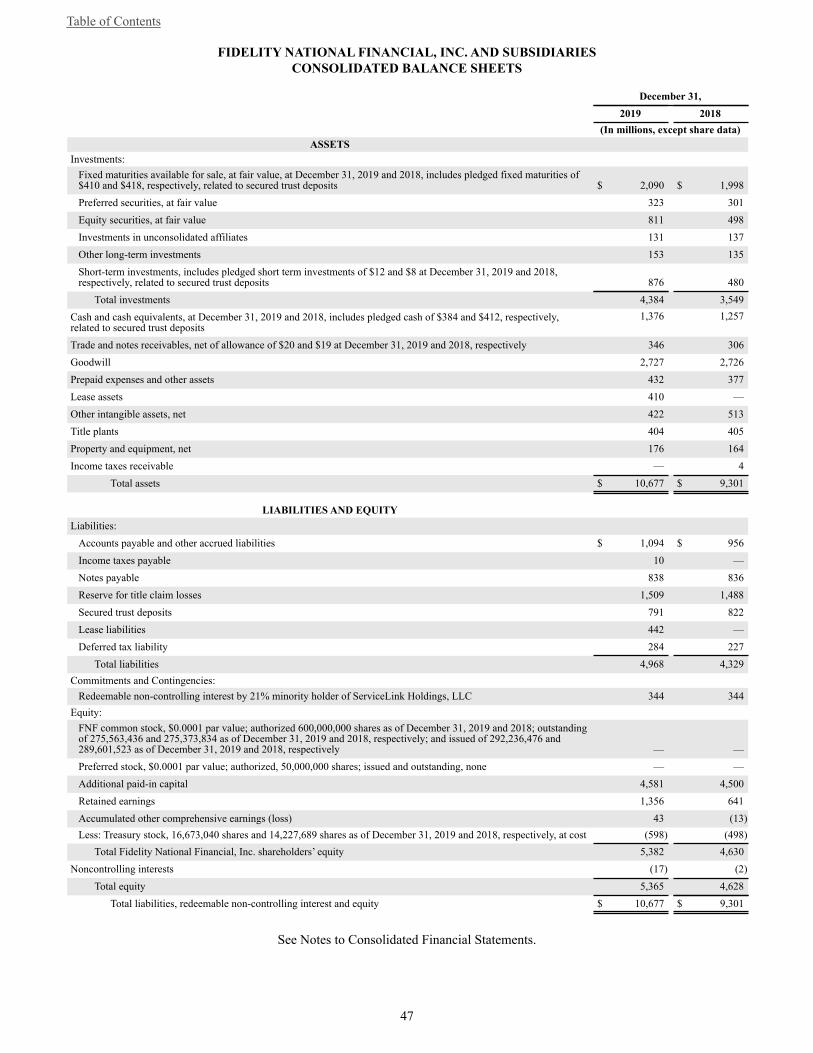
Table of Contents
47
FIDELITY NATIONAL FINANCIAL, INC. AND SUBSIDIARIESCONSOLIDATED BALANCE SHEETS
December 31, 2019 2018 (In millions, except share data)
ASSETSInvestments:
Fixed maturities available for sale, at fair value, at December 31, 2019 and 2018, includes pledged fixed maturities of$410 and $418, respectively, related to secured trust deposits $ 2,090 $ 1,998Preferred securities, at fair value 323 301Equity securities, at fair value 811 498Investments in unconsolidated affiliates 131 137Other long-term investments 153 135Short-term investments, includes pledged short term investments of $12 and $8 at December 31, 2019 and 2018,respectively, related to secured trust deposits 876 480
Total investments 4,384 3,549Cash and cash equivalents, at December 31, 2019 and 2018, includes pledged cash of $384 and $412, respectively,related to secured trust deposits
1,376 1,257
Trade and notes receivables, net of allowance of $20 and $19 at December 31, 2019 and 2018, respectively 346 306Goodwill 2,727 2,726Prepaid expenses and other assets 432 377Lease assets 410 —Other intangible assets, net 422 513Title plants 404 405Property and equipment, net 176 164Income taxes receivable — 4
Total assets $ 10,677 $ 9,301
LIABILITIES AND EQUITYLiabilities:
Accounts payable and other accrued liabilities $ 1,094 $ 956Income taxes payable 10 —Notes payable 838 836Reserve for title claim losses 1,509 1,488Secured trust deposits 791 822Lease liabilities 442 —Deferred tax liability 284 227
Total liabilities 4,968 4,329Commitments and Contingencies:
Redeemable non-controlling interest by 21% minority holder of ServiceLink Holdings, LLC 344 344Equity:
FNF common stock, $0.0001 par value; authorized 600,000,000 shares as of December 31, 2019 and 2018; outstandingof 275,563,436 and 275,373,834 as of December 31, 2019 and 2018, respectively; and issued of 292,236,476 and289,601,523 as of December 31, 2019 and 2018, respectively — —Preferred stock, $0.0001 par value; authorized, 50,000,000 shares; issued and outstanding, none — —Additional paid-in capital 4,581 4,500Retained earnings 1,356 641Accumulated other comprehensive earnings (loss) 43 (13)Less: Treasury stock, 16,673,040 shares and 14,227,689 shares as of December 31, 2019 and 2018, respectively, at cost (598) (498)
Total Fidelity National Financial, Inc. shareholders’ equity 5,382 4,630Noncontrolling interests (17) (2)
Total equity 5,365 4,628Total liabilities, redeemable non-controlling interest and equity $ 10,677 $ 9,301
See Notes to Consolidated Financial Statements.

Table of Contents
48
FIDELITY NATIONAL FINANCIAL, INC. AND SUBSIDIARIESCONSOLIDATED STATEMENTS OF EARNINGS
Year Ended December 31,2019 2018 2017
(In millions, except share data)Revenues:
Direct title insurance premiums $ 2,381 $ 2,221 $ 2,170Agency title insurance premiums 2,961 2,690 2,723Escrow, title-related and other fees 2,584 2,615 2,637Interest and investment income 225 177 131Realized gains and losses, net 318 (109) 2
Total revenues 8,469 7,594 7,663Expenses:
Personnel costs 2,696 2,538 2,460Agent commissions 2,258 2,059 2,089Other operating expenses 1,681 1,801 1,781Depreciation and amortization 178 182 183Provision for title claim losses 240 221 238Interest expense 47 43 48
Total expenses 7,100 6,844 6,799Earnings from continuing operations before income taxes and equity in earnings of unconsolidated affiliates 1,369 750 864Income tax expense on continuing operations 308 120 235Earnings from continuing operations before equity in earnings of unconsolidated affiliates 1,061 630 629Equity in earnings of unconsolidated affiliates 15 5 10Net earnings from continuing operations 1,076 635 639Earnings from discontinued operations, net of tax — — 155Net earnings 1,076 635 794Less: Net earnings attributable to non-controlling interests 14 7 23
Net earnings attributable to Fidelity National Financial, Inc. common shareholders $ 1,062 $ 628 $ 771
Amounts attributable to Fidelity National Financial, Inc., common shareholders:Net earnings from continuing operations attributable to FNF Group common shareholders $ 1,062 $ 628 $ 639Net earnings from discontinued operations attributable to FNF Group common shareholders — — 23Net earnings attributable to FNF Group common shareholders $ 1,062 $ 628 $ 662
Net earnings from discontinued operations attributable to FNFV Group common shareholders $ 109
See Notes to Consolidated Financial Statements.

Table of Contents
49
FIDELITY NATIONAL FINANCIAL, INC. AND SUBSIDIARIES
CONSOLIDATED STATEMENTS OF EARNINGS - (continued)
Year Ended December 31,
2019 2018 2017
Earnings per share
Basic
Net earnings from continuing operations attributable to FNF Group common shareholders $ 3.89 $ 2.30 $ 2.36
Net earnings from discontinued operations attributable to FNF Group common shareholders — — 0.08
Net earnings per share attributable to FNF Group common shareholders $ 3.89 $ 2.30 $ 2.44Net earnings per share from discontinued operations attributable to FNFV Group commonshareholders $ 1.68
Diluted
Net earnings from continuing operations attributable to FNF Group common shareholders $ 3.83 $ 2.26 $ 2.30
Net earnings from discontinued operations attributable to FNF Group common shareholders — — 0.08
Net earnings per share attributable to FNF Group common shareholders $ 3.83 $ 2.26 $ 2.38Net earnings per share from discontinued operations attributable to FNFV Group commonshareholders $ 1.63
Weighted average shares outstanding FNF Group common stock, basic basis 273 273 271
Weighted average shares outstanding FNF Group common stock, diluted basis 277 278 278
Weighted average shares outstanding FNFV Group common stock, basic basis 65
Weighted average shares outstanding FNFV Group common stock, diluted basis 67
See Notes to Consolidated Financial Statements.
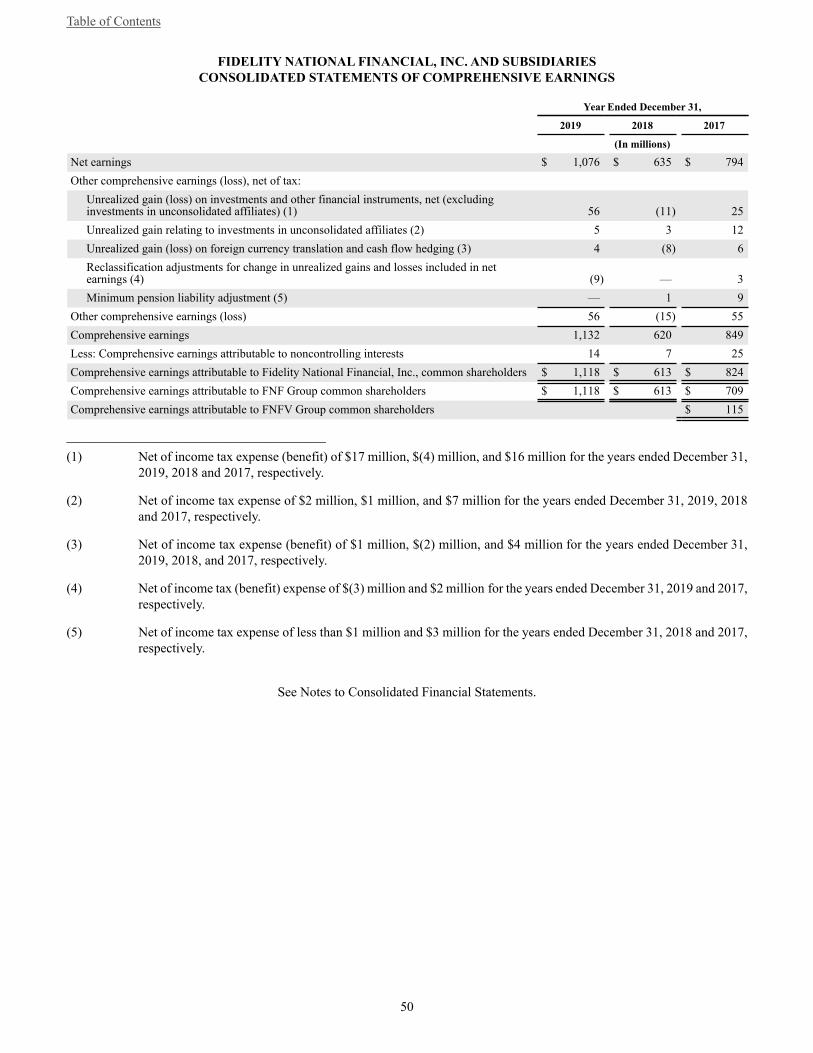
Table of Contents
50
FIDELITY NATIONAL FINANCIAL, INC. AND SUBSIDIARIESCONSOLIDATED STATEMENTS OF COMPREHENSIVE EARNINGS
Year Ended December 31,
2019 2018 2017
(In millions)
Net earnings $ 1,076 $ 635 $ 794Other comprehensive earnings (loss), net of tax:
Unrealized gain (loss) on investments and other financial instruments, net (excludinginvestments in unconsolidated affiliates) (1) 56 (11) 25Unrealized gain relating to investments in unconsolidated affiliates (2) 5 3 12Unrealized gain (loss) on foreign currency translation and cash flow hedging (3) 4 (8) 6Reclassification adjustments for change in unrealized gains and losses included in netearnings (4) (9) — 3Minimum pension liability adjustment (5) — 1 9
Other comprehensive earnings (loss) 56 (15) 55Comprehensive earnings 1,132 620 849Less: Comprehensive earnings attributable to noncontrolling interests 14 7 25Comprehensive earnings attributable to Fidelity National Financial, Inc., common shareholders $ 1,118 $ 613 $ 824Comprehensive earnings attributable to FNF Group common shareholders $ 1,118 $ 613 $ 709Comprehensive earnings attributable to FNFV Group common shareholders $ 115
_______________________________________
(1) Net of income tax expense (benefit) of $17 million, $(4) million, and $16 million for the years ended December 31, 2019, 2018 and 2017, respectively.
(2) Net of income tax expense of $2 million, $1 million, and $7 million for the years ended December 31, 2019, 2018and 2017, respectively.
(3) Net of income tax expense (benefit) of $1 million, $(2) million, and $4 million for the years ended December 31, 2019, 2018, and 2017, respectively.
(4) Net of income tax (benefit) expense of $(3) million and $2 million for the years ended December 31, 2019 and 2017, respectively.
(5) Net of income tax expense of less than $1 million and $3 million for the years ended December 31, 2018 and 2017, respectively.
See Notes to Consolidated Financial Statements.
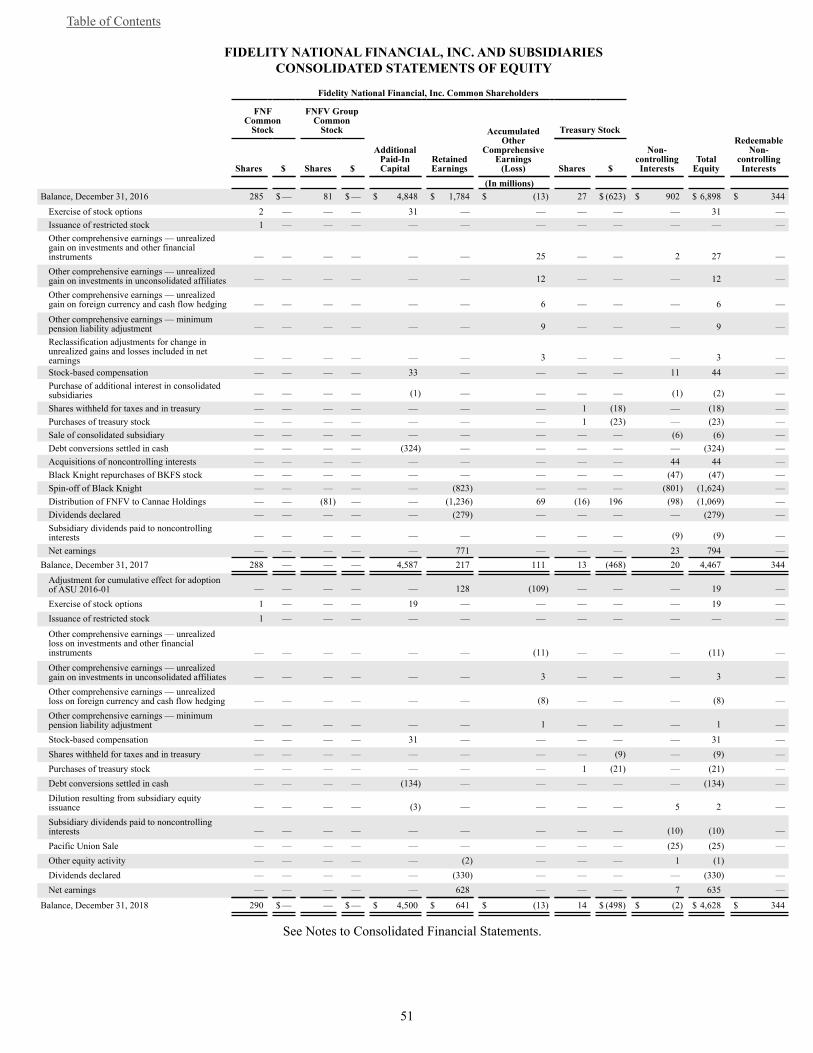
Table of Contents
51
FIDELITY NATIONAL FINANCIAL, INC. AND SUBSIDIARIES CONSOLIDATED STATEMENTS OF EQUITY
Fidelity National Financial, Inc. Common Shareholders
FNFCommon
Stock
FNFV GroupCommon
Stock
AdditionalPaid-InCapital
RetainedEarnings
AccumulatedOther
Comprehensive Earnings
(Loss)
Treasury Stock
Non-controllingInterests
TotalEquity
RedeemableNon-
controllingInterests Shares $ Shares $ Shares $
(In millions)Balance, December 31, 2016 285 $ — 81 $ — $ 4,848 $ 1,784 $ (13) 27 $ (623) $ 902 $ 6,898 $ 344
Exercise of stock options 2 — — — 31 — — — — — 31 —Issuance of restricted stock 1 — — — — — — — — — — —Other comprehensive earnings — unrealizedgain on investments and other financialinstruments — — — — — — 25 — — 2 27 —Other comprehensive earnings — unrealizedgain on investments in unconsolidated affiliates — — — — — — 12 — — — 12 —
Other comprehensive earnings — unrealizedgain on foreign currency and cash flow hedging — — — — — — 6 — — — 6 —Other comprehensive earnings — minimumpension liability adjustment — — — — — — 9 — — — 9 —Reclassification adjustments for change inunrealized gains and losses included in netearnings — — — — — — 3 — — — 3 —Stock-based compensation — — — — 33 — — — — 11 44 —Purchase of additional interest in consolidatedsubsidiaries — — — — (1) — — — — (1) (2) —Shares withheld for taxes and in treasury — — — — — — — 1 (18) — (18) —Purchases of treasury stock — — — — — — — 1 (23) — (23) —Sale of consolidated subsidiary — — — — — — — — — (6) (6) —Debt conversions settled in cash — — — — (324) — — — — — (324) —Acquisitions of noncontrolling interests — — — — — — — — — 44 44 —Black Knight repurchases of BKFS stock — — — — — — — — — (47) (47) —Spin-off of Black Knight — — — — — (823) — — — (801) (1,624) —Distribution of FNFV to Cannae Holdings — — (81) — — (1,236) 69 (16) 196 (98) (1,069) —Dividends declared — — — — — (279) — — — — (279) —Subsidiary dividends paid to noncontrollinginterests — — — — — — — — — (9) (9) —Net earnings — — — — — 771 — — — 23 794 —
Balance, December 31, 2017 288 — — — 4,587 217 111 13 (468) 20 4,467 344Adjustment for cumulative effect for adoptionof ASU 2016-01 — — — — — 128 (109) — — — 19 —Exercise of stock options 1 — — — 19 — — — — — 19 —Issuance of restricted stock 1 — — — — — — — — — — —
Other comprehensive earnings — unrealizedloss on investments and other financialinstruments — — — — — — (11) — — — (11) —Other comprehensive earnings — unrealizedgain on investments in unconsolidated affiliates — — — — — — 3 — — — 3 —Other comprehensive earnings — unrealizedloss on foreign currency and cash flow hedging — — — — — — (8) — — — (8) —Other comprehensive earnings — minimumpension liability adjustment — — — — — — 1 — — — 1 —Stock-based compensation — — — — 31 — — — — — 31 —Shares withheld for taxes and in treasury — — — — — — — — (9) — (9) —Purchases of treasury stock — — — — — — — 1 (21) — (21) —Debt conversions settled in cash — — — — (134) — — — — — (134) —Dilution resulting from subsidiary equityissuance — — — — (3) — — — — 5 2 —Subsidiary dividends paid to noncontrollinginterests — — — — — — — — — (10) (10) —Pacific Union Sale — — — — — — — — — (25) (25) —Other equity activity — — — — — (2) — — — 1 (1)Dividends declared — — — — — (330) — — — — (330) —Net earnings — — — — — 628 — — — 7 635 —
Balance, December 31, 2018 290 $ — — $ — $ 4,500 $ 641 $ (13) 14 $ (498) $ (2) $ 4,628 $ 344
See Notes to Consolidated Financial Statements.
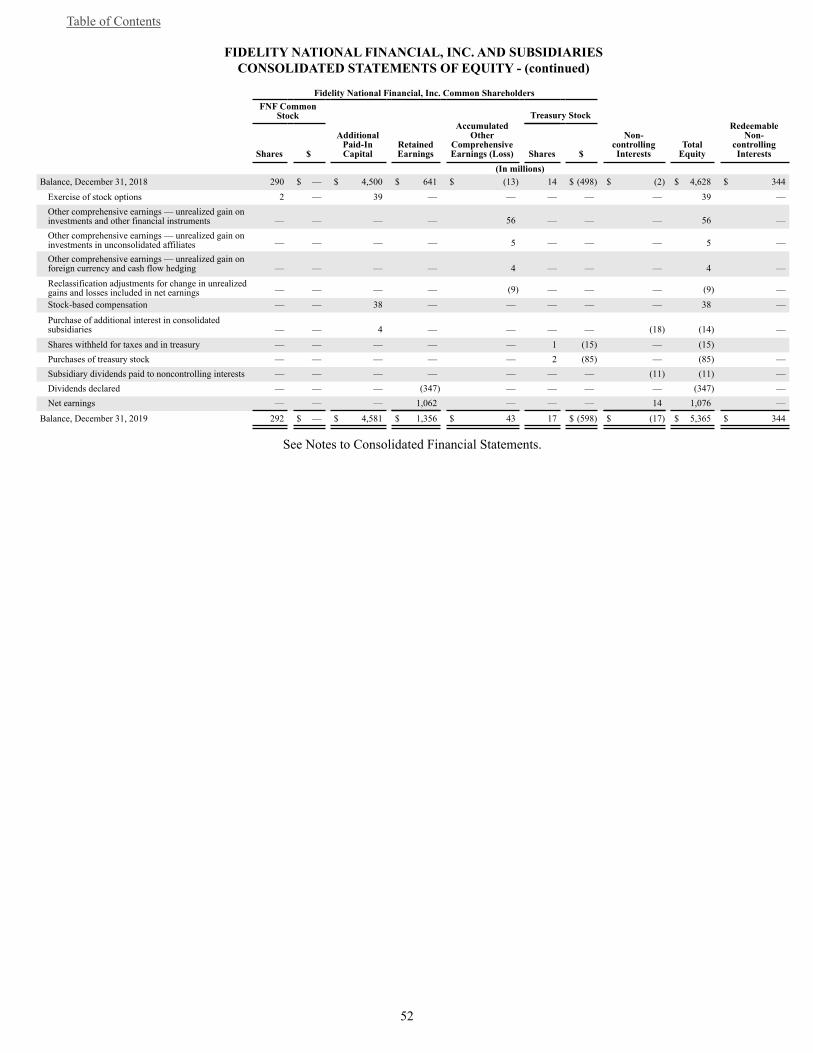
Table of Contents
52
FIDELITY NATIONAL FINANCIAL, INC. AND SUBSIDIARIES CONSOLIDATED STATEMENTS OF EQUITY - (continued)
Fidelity National Financial, Inc. Common Shareholders
FNF Common
Stock
AdditionalPaid-InCapital
RetainedEarnings
AccumulatedOther
Comprehensive Earnings (Loss)
Treasury Stock
Non-controllingInterests
TotalEquity
RedeemableNon-
controllingInterests Shares $ Shares $
(In millions)Balance, December 31, 2018 290 $ — $ 4,500 $ 641 $ (13) 14 $ (498) $ (2) $ 4,628 $ 344
Exercise of stock options 2 — 39 — — — — — 39 —Other comprehensive earnings — unrealized gain oninvestments and other financial instruments — — — — 56 — — — 56 —Other comprehensive earnings — unrealized gain oninvestments in unconsolidated affiliates — — — — 5 — — — 5 —
Other comprehensive earnings — unrealized gain onforeign currency and cash flow hedging — — — — 4 — — — 4 —Reclassification adjustments for change in unrealizedgains and losses included in net earnings — — — — (9) — — — (9) —Stock-based compensation — — 38 — — — — — 38 —
Purchase of additional interest in consolidatedsubsidiaries — — 4 — — — — (18) (14) —Shares withheld for taxes and in treasury — — — — — 1 (15) — (15)Purchases of treasury stock — — — — — 2 (85) — (85) —Subsidiary dividends paid to noncontrolling interests — — — — — — — (11) (11) —Dividends declared — — — (347) — — — — (347) —Net earnings — — — 1,062 — — — 14 1,076 —
Balance, December 31, 2019 292 $ — $ 4,581 $ 1,356 $ 43 17 $ (598) $ (17) $ 5,365 $ 344
See Notes to Consolidated Financial Statements.
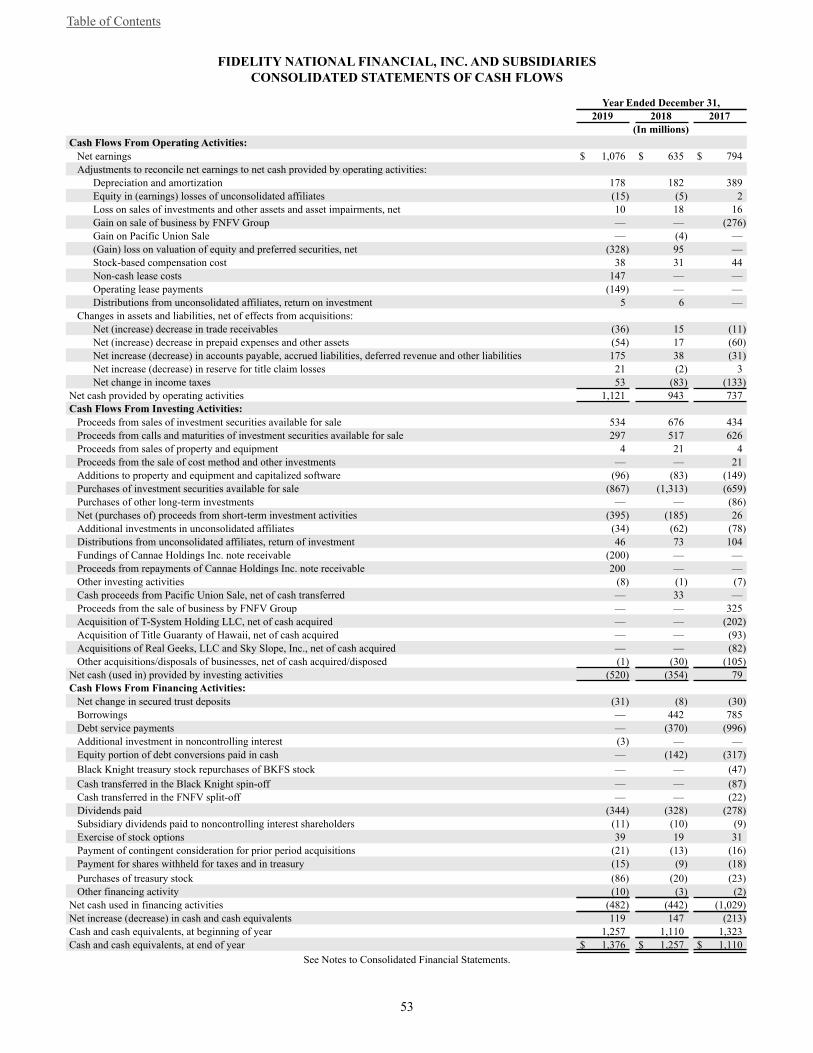
Table of Contents
53
FIDELITY NATIONAL FINANCIAL, INC. AND SUBSIDIARIESCONSOLIDATED STATEMENTS OF CASH FLOWS
Year Ended December 31,2019 2018 2017
(In millions)Cash Flows From Operating Activities:
Net earnings $ 1,076 $ 635 $ 794Adjustments to reconcile net earnings to net cash provided by operating activities:
Depreciation and amortization 178 182 389Equity in (earnings) losses of unconsolidated affiliates (15) (5) 2Loss on sales of investments and other assets and asset impairments, net 10 18 16Gain on sale of business by FNFV Group — — (276)Gain on Pacific Union Sale — (4) —(Gain) loss on valuation of equity and preferred securities, net (328) 95 —Stock-based compensation cost 38 31 44Non-cash lease costs 147 — —Operating lease payments (149) — —Distributions from unconsolidated affiliates, return on investment 5 6 —
Changes in assets and liabilities, net of effects from acquisitions:Net (increase) decrease in trade receivables (36) 15 (11)Net (increase) decrease in prepaid expenses and other assets (54) 17 (60)Net increase (decrease) in accounts payable, accrued liabilities, deferred revenue and other liabilities 175 38 (31)Net increase (decrease) in reserve for title claim losses 21 (2) 3Net change in income taxes 53 (83) (133)
Net cash provided by operating activities 1,121 943 737Cash Flows From Investing Activities:
Proceeds from sales of investment securities available for sale 534 676 434Proceeds from calls and maturities of investment securities available for sale 297 517 626Proceeds from sales of property and equipment 4 21 4Proceeds from the sale of cost method and other investments — — 21Additions to property and equipment and capitalized software (96) (83) (149)Purchases of investment securities available for sale (867) (1,313) (659)Purchases of other long-term investments — — (86)Net (purchases of) proceeds from short-term investment activities (395) (185) 26Additional investments in unconsolidated affiliates (34) (62) (78)Distributions from unconsolidated affiliates, return of investment 46 73 104Fundings of Cannae Holdings Inc. note receivable (200) — —Proceeds from repayments of Cannae Holdings Inc. note receivable 200 — —Other investing activities (8) (1) (7)Cash proceeds from Pacific Union Sale, net of cash transferred — 33 —Proceeds from the sale of business by FNFV Group — — 325Acquisition of T-System Holding LLC, net of cash acquired — — (202)Acquisition of Title Guaranty of Hawaii, net of cash acquired — — (93)Acquisitions of Real Geeks, LLC and Sky Slope, Inc., net of cash acquired — — (82)Other acquisitions/disposals of businesses, net of cash acquired/disposed (1) (30) (105)
Net cash (used in) provided by investing activities (520) (354) 79Cash Flows From Financing Activities:
Net change in secured trust deposits (31) (8) (30)Borrowings — 442 785Debt service payments — (370) (996)Additional investment in noncontrolling interest (3) — —Equity portion of debt conversions paid in cash — (142) (317)Black Knight treasury stock repurchases of BKFS stock — — (47)Cash transferred in the Black Knight spin-off — — (87)Cash transferred in the FNFV split-off — — (22)Dividends paid (344) (328) (278)Subsidiary dividends paid to noncontrolling interest shareholders (11) (10) (9)Exercise of stock options 39 19 31Payment of contingent consideration for prior period acquisitions (21) (13) (16)Payment for shares withheld for taxes and in treasury (15) (9) (18)Purchases of treasury stock (86) (20) (23)Other financing activity (10) (3) (2)
Net cash used in financing activities (482) (442) (1,029)Net increase (decrease) in cash and cash equivalents 119 147 (213)Cash and cash equivalents, at beginning of year 1,257 1,110 1,323Cash and cash equivalents, at end of year $ 1,376 $ 1,257 $ 1,110
See Notes to Consolidated Financial Statements.
Table of Contents
54
FIDELITY NATIONAL FINANCIAL, INC. AND SUBSIDIARIESNOTES TO CONSOLIDATED FINANCIAL STATEMENTS
Note A. Business and Summary of Significant Accounting Policies
The following describes the business and significant accounting policies of Fidelity National Financial, Inc. and its subsidiaries (collectively, “we,” “us,” “our,” the "Company" or “FNF”) which have been followed in preparing the accompanying Consolidated Financial Statements.
Description of Business
We are a leading provider of (i) title insurance, escrow and other title-related services, including trust activities, trustee sales guarantees, recordings and reconveyances and home warranty products and (ii) technology and transaction services to the real estate and mortgage industries. FNF is one of the nation’s largest title insurance companies operating through its title insurance underwriters - Fidelity National Title Insurance Company ("FNTIC"), Chicago Title Insurance Company ("Chicago Title"), Commonwealth Land Title Insurance Company ("Commonwealth Title"), Alamo Title Insurance and National Title Insurance of New York Inc. - which collectively issue more title insurance policies than any other title company in the United States. Through our subsidiary, ServiceLink Holdings, LLC ("ServiceLink"), we provide mortgage transaction services, including title-related services and facilitation of production and management of mortgage loans.
For information on businesses comprising our reportable segments, refer to Note R Segment Information.
Recent Developments
Termination of Stewart Merger Agreement and Payment of Reverse Termination Fee
On March 18, 2018, we signed a merger agreement (the "Stewart Merger Agreement") to acquire Stewart Information Services Corporation ("Stewart") (NYSE: STC) (the "Stewart Merger"). On, September 9, 2019, we entered into a mutual Termination Agreement with Stewart (the “Termination Agreement”), pursuant to which the parties agreed to terminate the Stewart Merger Agreement, due to the Federal Trade Commission's issuance of an administrative complaint seeking to block the merger. In connection with the termination of the Stewart Merger Agreement, we paid to Stewart, on September 12, 2019, the Reverse Termination Fee (as defined in the Stewart Merger Agreement) consisting of $50 million in cash, which is included within other operating expenses in the Consolidated Statements of Earnings.
Pending Acquisition of FGL
On February 7, 2020, we signed a merger agreement (the “Merger Agreement”) to acquire FGL Holdings (“FGL”) (NYSE: FG) (the “FGL Merger”). Subject to the terms and conditions of the Merger Agreement, which has been approved by the board of directors of FNF, at the First Effective Time (as defined in the Merger Agreement), the ordinary shares of FGL (the “Ordinary Shares”), including all restricted Ordinary Shares (whether vested or unvested), issued and outstanding as of immediately prior to the First Effective Time (other than (i) shares owned by FGL and any of its subsidiaries or FNF and any of its subsidiaries and (ii) shares in respect of which dissenters rights have been properly exercised and perfected under Cayman law) will be converted into the right to receive $12.50 in cash or 0.2558 shares (“the Stock Consideration”) of common stock of FNF (“FNF Common Stock”), at the election of the holder thereof and subject to the proration mechanics set forth in the Merger Agreement. Pursuant to the Merger Agreement, all Ordinary Shares held by FNF and its subsidiaries will be converted into the right to receive the Stock Consideration. Each Series B Cumulative Preferred Share, all of which are held by FNF and its subsidiaries, will be converted into the right to receive a number of shares of FNF Common Stock that is equal to (i) the Liquidation Preference (as defined in the Merger Agreement) divided by (ii) the Reference Parent Common Stock Price (as defined in the Merger Agreement).
Additionally, all options to purchase Ordinary Shares (“FGL Share Option”) and phantom unit denominated in Ordinary Shares (“FGL Phantom Unit”), in each case, outstanding immediately prior to the First Effective Time, will be canceled and converted into options to purchase FNF Common Stock and phantom units denominated in FNF Common Stock at the First Effective Time (collectively, the “Rollover Awards”), as applicable. The Rollover Awards will generally be subject to the same terms and conditions as applicable to the applicable canceled FGL Share Option or FGL Phantom Unit immediately prior to the First Effective Time, except that (i) all performance-vesting criteria will be deemed satisfied at the First Effective Time at the levels described in the Merger Agreement and such Rollover Awards will be subject only to time-based vesting conditions after the First Effective Time, and (ii) immediately prior to the First Effective Time, additional time-vesting credits will be provided to holders in respect of FGL Share Options and FGL Phantom Units granted prior to January 1, 2020, as described in the Merger Agreement.
The closing of the transaction is subject to certain closing conditions, including the approval by FGL stockholders, federal and state regulatory approvals, and the satisfaction of other customary closing conditions. Closing is expected in the second or third quarter of 2020.

FIDELITY NATIONAL FINANCIAL, INC. AND SUBSIDIARIES
NOTES TO CONSOLIDATED FINANCIAL STATEMENTS — (continued)
55
Note Receivable from Cannae
In November 2017, in conjunction with the split-off of our former portfolio company investments into a separate company, Cannae Holdings, Inc. ("Cannae"), we issued to Cannae a revolver note (the "Cannae Revolver") in the aggregate principal amount of up to $100 million. Cannae is considered a related party to FNF.
The Cannae Revolver accrues interest quarterly at LIBOR plus 450 basis points and matures on the five-year anniversary from the date of issuance. The maturity date is automatically extended for additional five-year terms unless notice of non-renewal is otherwise provided by either FNF or Cannae, in their sole discretion.
On February 7, 2019, Cannae borrowed $100 million from FNF under the Cannae Revolver. On June 12, 2019, Cannae repaid to FNF the entire $100 million outstanding amount under the Cannae Revolver.
On July 5, 2019, Cannae borrowed $100 million from FNF under the Cannae Revolver. On September 11, 2019, Cannae repaid to FNF the entire $100 million outstanding amount under the Cannae Revolver.
As of December 31, 2019, there is no outstanding balance under the Cannae Revolver.
We account for the Cannae Revolver as a financing receivable. Interest income is recorded ratably in periods in which principal is outstanding. Uncollectible financing receivables are written off or impaired when, based on all available information, it is probable that a loss has occurred.
Principles of Consolidation and Basis of Presentation
The accompanying Consolidated Financial Statements are prepared in accordance with generally accepted accounting principles in the United States ("GAAP") and include our accounts as well as our wholly-owned and majority-owned subsidiaries. All intercompany profits, transactions and balances have been eliminated. Our investments in non-majority-owned partnerships and affiliates are accounted for using the equity method until such time that they become wholly or majority-owned. Earnings attributable to noncontrolling interests are recorded on the Consolidated Statements of Earnings relating to majority-owned subsidiaries with the appropriate noncontrolling interest that represents the portion of equity not related to our ownership interest recorded on the Consolidated Balance Sheets in each period.
Investments
Fixed maturity securities are purchased to support our investment strategies, which are developed based on factors including rate of return, maturity, credit risk, duration, tax considerations and regulatory requirements. Fixed maturity securities which may be sold prior to maturity to support our investment strategies are carried at fair value and are classified as available for sale as of the balance sheet dates. Fair values for fixed maturity securities are principally a function of current market conditions and are valued based on quoted prices in markets that are not active or model inputs that are observable either directly or indirectly. The interest method results in the recognition of a constant rate of return on the investment equal to the prevailing rate at the time of purchase or at the time of subsequent adjustments of book value. Changes in prepayment assumptions are accounted for retrospectively.
Equity and preferred securities held are carried at fair value as of the balance sheet dates. Our equity and certain preferred securities are Level 1 financial assets and fair values are based on quoted prices in active markets. Other preferred stock holdings are Level 2 financial assets and are valued based on quoted prices in markets that are not active or model inputs that are observable either directly or indirectly.
Investments in unconsolidated affiliates are recorded using the equity method of accounting.
Other long-term investments consist of other investments and company-owned life insurance policies. Other investments are carried at fair value. See Note C Fair Value Measurements for further discussion of other investments. Company-owned life insurance policies are carried at cash surrender value.
Short-term investments consist primarily of money market instruments, which are carried at fair value, and commercial paper, which have an original maturity of one year or less and are carried at amortized cost, which approximates fair value.
Realized gains and losses on the sale of investments are determined on the basis of the cost of the specific investments sold and are credited or charged to income on a trade date basis. Beginning January 1, 2018, unrealized gains or losses on equity and preferred securities are included in earnings. Unrealized gains or losses on fixed maturity securities (and equity and preferred securities prior to January 1, 2018) which are classified as available for sale, net of applicable deferred income tax expenses (benefits), are excluded from earnings and credited or charged directly to a separate component of equity. If any unrealized losses on available for sale securities are determined to be other-than-temporary, such unrealized losses are recognized as realized losses. Unrealized losses on fixed maturity securities are considered other-than-temporary if factors exist that cause us to believe that the value will not increase to a level sufficient to recover our cost basis. Some factors considered in evaluating whether or not a decline
FIDELITY NATIONAL FINANCIAL, INC. AND SUBSIDIARIES
NOTES TO CONSOLIDATED FINANCIAL STATEMENTS — (continued)
56
in fair value is other-than-temporary include: (i) our need and intent to sell the investment prior to a period of time sufficient to allow for a recovery in value; (ii) the duration and extent to which the fair value has been less than cost; and (iii) the financial condition and prospects of the issuer. Such reviews are inherently uncertain and the value of the investment may not fully recover or may decline in future periods resulting in a realized loss.
See Note S. Recent Accounting Pronouncements for discussion of ASU No. 2016-01 Financial Instruments - Overall (Subtopic 825-10): Recognition and Measurement of Financial Assets and Financial Liabilities which changed the accounting for unrealized gains and losses on equity and preferred securities.
Cash and Cash Equivalents
Highly liquid instruments purchased as part of cash management with original maturities of three months or less are considered cash equivalents. The carrying amounts reported in the Consolidated Balance Sheets for these instruments approximate their fair value.
Fair Value of Financial Instruments
The fair values of financial instruments presented in the Consolidated Financial Statements are estimates of the fair values at a specific point in time using available market information and appropriate valuation methodologies. These estimates are subjective in nature and involve uncertainties and significant judgment in the interpretation of current market data. We do not necessarily intend to dispose of or liquidate such instruments prior to maturity.
Trade and Notes Receivables
The carrying values reported in the Consolidated Balance Sheets for trade and notes receivables approximate their fair value.
Premium revenues from agency title operations are recognized when the underlying title order and transaction closing, if applicable, are complete and reported to us. Premium revenues from agency operations and related commissions include an accrual based on estimated historical transaction volume data for policies that have closed in a particular period in which premiums have not yet been reported to us. Historically, the time lag between the closing of these transactions by our agents and the reporting of these policies, or premiums, to us has been up to 15 months, with 89% - 94% reported within three months following closing, an additional 6% - 9% reported within the next three months and the remainder within seven to fifteen months. In addition to accruing these earned but unreported agency premiums, we also accrue agent commission expense, which was 76.3% of agent premiums earned in 2019, 76.5% of agent premiums earned in 2018, and 76.7% of agent premiums earned in 2017. The amount due from our agents relating to this accrual, i.e., the agent premium less their contractual retained commission, was approximately $46 million and $44 million at December 31, 2019 and 2018, respectively. Due to the offsetting effects of reversing prior period accruals, the impact of this accrual to our recorded Agency title insurance premiums, Agent commissions and net earnings in any given period is not considered material.
Goodwill
Goodwill represents the excess of cost over fair value of identifiable net assets acquired and assumed in a business combination. Goodwill and other intangible assets with indefinite useful lives are reviewed for impairment annually or more frequently if circumstances indicate potential impairment, through a comparison of fair value to the carrying amount. In evaluating the recoverability of goodwill, we perform an annual goodwill impairment analysis based on a review of qualitative factors to determine if events and circumstances exist which will lead to a determination that the fair value of a reporting unit is greater than its carrying amount, prior to performing a full fair-value assessment.
We completed annual goodwill impairment analyses in the fourth quarter of each period presented using a September 30 measurement date. As a result of the analysis, $3 million of goodwill impairment related to a real estate brokerage reporting unit in our Corporate and other segment was recorded in the year ended December 31, 2018. For the years ended December 31, 2019and 2017, we determined there were no events or circumstances which indicated that the carrying value exceeded the fair value. See Note F. Goodwill.
Other Intangible Assets
We have other intangible assets, not including goodwill, which consist primarily of customer relationships and contracts, trademarks and tradenames, and computer software, which are generally recorded in connection with acquisitions at their fair value. Intangible assets with estimable lives are amortized over their respective estimated useful lives to their estimated residual values and reviewed for impairment whenever events or changes in circumstances indicate that the carrying amount may not be recoverable. In general, customer relationships are amortized over their estimated useful lives, generally ten years, using an accelerated method which takes into consideration expected customer attrition rates. Contractual relationships are generally amortized over their contractual life. Trademarks and tradenames are generally amortized over ten years. Capitalized software includes the fair value of software acquired in business combinations, purchased software and capitalized software development

FIDELITY NATIONAL FINANCIAL, INC. AND SUBSIDIARIES
NOTES TO CONSOLIDATED FINANCIAL STATEMENTS — (continued)
57
costs. Purchased software is recorded at cost and amortized using the straight-line method over its estimated useful life. Software acquired in business combinations is recorded at its fair value and amortized using straight-line or accelerated methods over its estimated useful life, ranging from five to ten years. For internal-use computer software products, internal and external costs incurred during the preliminary project stage are expensed as they are incurred. Internal and external costs incurred during the application development stage are capitalized and amortized on a product by product basis commencing on the date the software is ready for its intended use. We do not capitalize any costs once the software is ready for its intended use.
We recorded no impairment expense to other intangible assets during the year ended December 31, 2019. We recorded $3 million and $1 million in impairment expense to other intangible assets during the years ended December 31, 2018 and 2017, respectively. The impairment in 2018 primarily relates to an acquired customer relationship asset in our Title segment. The impairment in 2017 was for computer software at ServiceLink.
Title Plants
Title plants are recorded at the cost incurred to construct or obtain and organize historical title information to the point it can be used to perform title searches. Costs incurred to maintain, update and operate title plants are expensed as incurred. Title plants are not amortized as they are considered to have an indefinite life if maintained. Sales of title plants are reported at the amount received net of the adjusted costs of the title plant sold. Sales of title plant copies are reported at the amount received. No cost is allocated to the sale of copies of title plants unless the carrying value of the title plant is diminished or impaired. Title plants are reviewed for impairment whenever events or circumstances indicate that the carrying amounts may not be recoverable. We recorded $1 million in impairment expense to title plants during the year ended December 31, 2019 for two title plants which are no longer in use. We reviewed title plants for impairment but recorded no impairment expense related to title plants in the years ended December 31, 2018 or 2017.
Property and Equipment
Property and equipment are recorded at cost, less accumulated depreciation. Depreciation is computed primarily using the straight-line method based on the estimated useful lives of the related assets: twenty to thirty years for buildings and three to twenty-five years for furniture, fixtures and equipment. Leasehold improvements are amortized on a straight-line basis over the lesser of the term of the applicable lease or the estimated useful lives of such assets. Property and equipment are reviewed for impairment whenever events or circumstances indicate that the carrying amounts may not be recoverable.
Reserve for Title Claim Losses
Our reserve for title claim losses includes known claims as well as losses we expect to incur, net of recoupments. Each known claim is reserved based on our review as to the estimated amount of the claim and the costs required to settle the claim. Reserves for claims which are incurred but not reported are established at the time premium revenue is recognized based on historical loss experience and also take into consideration other factors, including industry trends, claim loss history, current legal environment, geographic considerations and the type of policy written.
The reserve for title claim losses also includes reserves for losses arising from closing and disbursement functions due to fraud or operational error.
If a loss is related to a policy issued by an independent agent, we may proceed against the independent agent pursuant to the terms of the agency agreement. In any event, we may proceed against third parties who are responsible for any loss under the title insurance policy under rights of subrogation.
Secured Trust Deposits
In the state of Illinois, a trust company is permitted to commingle and invest customers’ assets with its own assets, pending completion of real estate transactions. Accordingly, our Consolidated Balance Sheets reflect a secured trust deposit liability of $791 million and $822 million at December 31, 2019 and 2018, respectively, representing customers’ assets held by us and corresponding assets including cash and investments pledged as security for those trust balances.
Income Taxes
We recognize deferred tax assets and liabilities for temporary differences between the financial reporting basis and the tax basis of our assets and liabilities and expected benefits of utilizing net operating loss and credit carryforwards. Deferred tax assets and liabilities are measured using enacted tax rates expected to apply to taxable income in the years in which those temporary differences are expected to be recovered or settled. The impact on deferred taxes of changes in tax rates and laws, if any, is applied to the years during which temporary differences are expected to be settled and reflected in the financial statements in the period enacted.
FIDELITY NATIONAL FINANCIAL, INC. AND SUBSIDIARIES
NOTES TO CONSOLIDATED FINANCIAL STATEMENTS — (continued)
58
Reinsurance
In a limited number of situations, we limit our maximum loss exposure by reinsuring certain risks with other insurers. We also earn a small amount of additional income, which is reflected in our direct premiums, by assuming reinsurance for certain risks of other insurers. We cede a portion of certain policy and other liabilities under agent fidelity, excess of loss and case-by-case reinsurance agreements. Reinsurance agreements provide that in the event of a loss (including costs, attorneys’ fees and expenses) exceeding the retained amounts, the reinsurer is liable for the excess amount assumed. However, the ceding company remains primarily liable in the event the reinsurer does not meet its contractual obligations.
Revenue Recognition
Refer to Note T. Revenue Recognition for a description of our accounting for our various revenue streams.
Discontinued Operations
On November 17, 2017, we completed our previously announced split-off (the “FNFV Split-Off”) of our former wholly-owned subsidiary Cannae Holdings, Inc. (“Cannae”) which consisted of the businesses, assets and liabilities formerly attributed to our FNF Ventures ("FNFV") Group including Ceridian Holding, LLC, American Blue Ribbon Holdings, LLC and T-System Holding LLC. The FNFV Split-Off was accomplished by the Company's redemption (the “Redemption”) of all of the outstanding shares of FNFV Group common stock, par value $0.0001 per share (“FNFV common stock”) for outstanding shares of common stock of Cannae, par value $0.0001 per share (“Cannae common stock”), amounting to a redemption of each outstanding share of FNFV common stock for one share of Cannae common stock, as of November 17, 2017. As a result of the FNFV Split-Off, Cannae became a separate, publicly-traded company (NYSE: CNNE) as of November 20, 2017. All of the Company’s core title insurance, real estate, technology and mortgage related businesses, assets and liabilities currently attributed to the Company’s FNF common stock that were not held by Cannae remain with the Company. As a result of the FNFV Split-Off, the financial results of FNFV Group have been reclassified to discontinued operations for the year ended December 31, 2017.
On September 29, 2017 we completed our tax-free distribution to FNF shareholders of all 83.3 million shares of New BKH Corp. ("New BKH") common stock that we previously owned (the “BK Distribution”). Immediately following the BK Distribution, New BKH and Black Knight Financial Services, Inc. ("Black Knight") engaged in a series of transactions resulting in the formation of a new publicly traded holding company, Black Knight, Inc. ("New Black Knight"). Holders of FNF common stock received approximately 0.30663 shares of New Black Knight common stock for every one share of FNF common stock held at the close of business on September 20, 2017, the record date for the BK Distribution. New Black Knight's common stock is now listed under the symbol “BKI” on the New York Stock Exchange. The BK Distribution was generally tax-free to FNF shareholders for U.S. federal income tax purposes, except to the extent of any cash received in lieu of New Black Knight's fractional shares. As a result of the BK Distribution, the financial results of Black Knight have been reclassified to discontinued operations for the year ended December 31, 2017.
See Note G. Discontinued Operations for further details of the results and financial position of FNFV and Black Knight.
Comprehensive Earnings (Loss)
We report Comprehensive earnings (loss) in accordance with GAAP on the Consolidated Statements of Comprehensive Earnings. Total comprehensive earnings are defined as all changes in shareholders' equity during a period, other than those resulting from investments by and distributions to shareholders. While total comprehensive earnings is the activity in a period and is largely driven by net earnings in that period, accumulated other comprehensive earnings or loss represents the cumulative balance of other comprehensive earnings, net of tax, as of the balance sheet date. Amounts reclassified to net earnings relate to the realized gains (losses) on our investments and other financial instruments, excluding investments in unconsolidated affiliates, and are included in Realized gains and losses, net on the Consolidated Statements of Earnings.
Changes in the balance of Other comprehensive earnings (loss) by component are as follows:

FIDELITY NATIONAL FINANCIAL, INC. AND SUBSIDIARIES
NOTES TO CONSOLIDATED FINANCIAL STATEMENTS — (continued)
59
Unrealized gain (loss) oninvestments and otherfinancial instruments,
net (excludinginvestments in
unconsolidated affiliates)
Unrealized gain(loss) relating toinvestments inunconsolidated
affiliates
Unrealized(loss) gain on
foreign currencytranslation and
cash flowhedging
Minimumpensionliability
adjustment
TotalAccumulated
OtherComprehensive
Earnings(Loss)
(In millions)Balance December 31, 2017 $ 116 $ 11 $ (7) $ (9) $ 111
Adjustment for cumulativeeffect for adoption of ASU2016-01 (109) — — — (109)Adoption of ASU 2018-02 (1) 3 — (2) —Other comprehensiveearnings (11) 3 (8) 1 (15)
Balance December 31, 2018 (5) 17 (15) (10) (13)Reclassification adjustments (5) (4) — — (9)Other comprehensiveearnings 56 5 4 — 65
Balance December 31, 2019 $ 46 $ 18 $ (11) $ (10) $ 43
Redeemable Non-controlling Interest
Subsequent to our acquisition of Lender Processing Services, Inc. ("LPS") in January 2014, we issued a 35% ownership interest in ServiceLink to funds affiliated with Thomas H. Lee Partners ("THL" or "the minority interest holder"). THL has an option to put its ownership interests of ServiceLink to us if no public offering of the corresponding business was consummated after four years from the date of FNF's purchase of LPS. The units owned by THL (the "redeemable noncontrolling interests") may be settled in cash or common stock of FNF or a combination of both at our election. As of January 2018, no public offering was made and the redeemable noncontrolling interests were no longer subject to a holding requirement. The redeemable noncontrolling interests will be settled at the current fair value at the time we receive notice of THL's put election as determined by the parties or by a third party appraisal under the terms of the Unit Purchase Agreement. As a result of a recapitalization of ServiceLink in 2015, the ownership interest by the minority interest holder was reduced from 35% to 21%. As of December 31, 2019, the redeemable noncontrolling interests have a fair value of approximately $176 million and we do not believe the exercise of their remaining put right in ServiceLink to be probable. The redeemable noncontrolling interests are recorded at their initial value of $344 million in our consolidated balance sheets and would be adjusted to fair value were such value to rise above the initial value.
As these redeemable noncontrolling interests provide for redemption features not solely within our control, we classify the redeemable noncontrolling interests outside of permanent equity. Redeemable noncontrolling interests held by third parties in subsidiaries owned or controlled by FNF is reported on the Consolidated Balance Sheet outside of permanent equity; and the Consolidated Statement of Earnings reflects the respective redeemable noncontrolling interests in Net earnings attributable to non-controlling interests, the effect of which is removed from the net earnings attributable to Fidelity National Financial, Inc. common shareholders.
Earnings Per Share
Basic earnings per share, as presented on the Consolidated Statement of Earnings, is computed by dividing net earnings available to common shareholders by the weighted average number of common shares outstanding during the period. In periods when earnings are positive, diluted earnings per share is calculated by dividing net earnings available to common shareholders by the weighted average number of common shares outstanding plus the impact of assumed conversions of potentially dilutive securities. For periods when we recognize a net loss, diluted earnings per share is equal to basic earnings per share as the impact of assumed conversions of potentially dilutive securities is considered to be antidilutive. We have granted certain stock options, shares of restricted stock, convertible debt instruments and certain other convertible share based payments which have been treated as common share equivalents for purposes of calculating diluted earnings per share for periods in which positive earnings have been reported.
Restricted stock, options or other instruments which provide the ability to acquire shares of our common stock that are antidilutive are excluded from the computation of diluted earnings per share. For the years ended December 31, 2019 and 2018, no antidilutive shares were outstanding.
Basic and diluted earnings per share attributable to our former FNFV group common stock for the 2017 period were calculated using weighted average shares outstanding through the date of the FNFV Split-off, November 17, 2017.
FIDELITY NATIONAL FINANCIAL, INC. AND SUBSIDIARIES
NOTES TO CONSOLIDATED FINANCIAL STATEMENTS — (continued)
60
Stock-Based Compensation Plans
We account for stock-based compensation plans using the fair value method. Using the fair value method of accounting, compensation cost is measured based on the fair value of the award at the grant date, using the Black-Scholes Model, and recognized over the service period.
Management Estimates
The preparation of these Consolidated Financial Statements in conformity with GAAP requires us to make estimates and assumptions that affect the reported amounts of assets and liabilities and disclosure of contingent assets and liabilities at the date of the Consolidated Financial Statements and the reported amounts of revenues and expenses during the reporting period. Actual results could differ from those estimates.
Certain Reclassifications
Certain reclassifications have been made in the 2018 and 2017 Consolidated Financial Statements to conform to classifications used in 2019. These reclassifications have not changed net earnings or total equity, as previously reported.
See Note G. Discontinued Operations for further information on reclassifications related to disposed businesses.
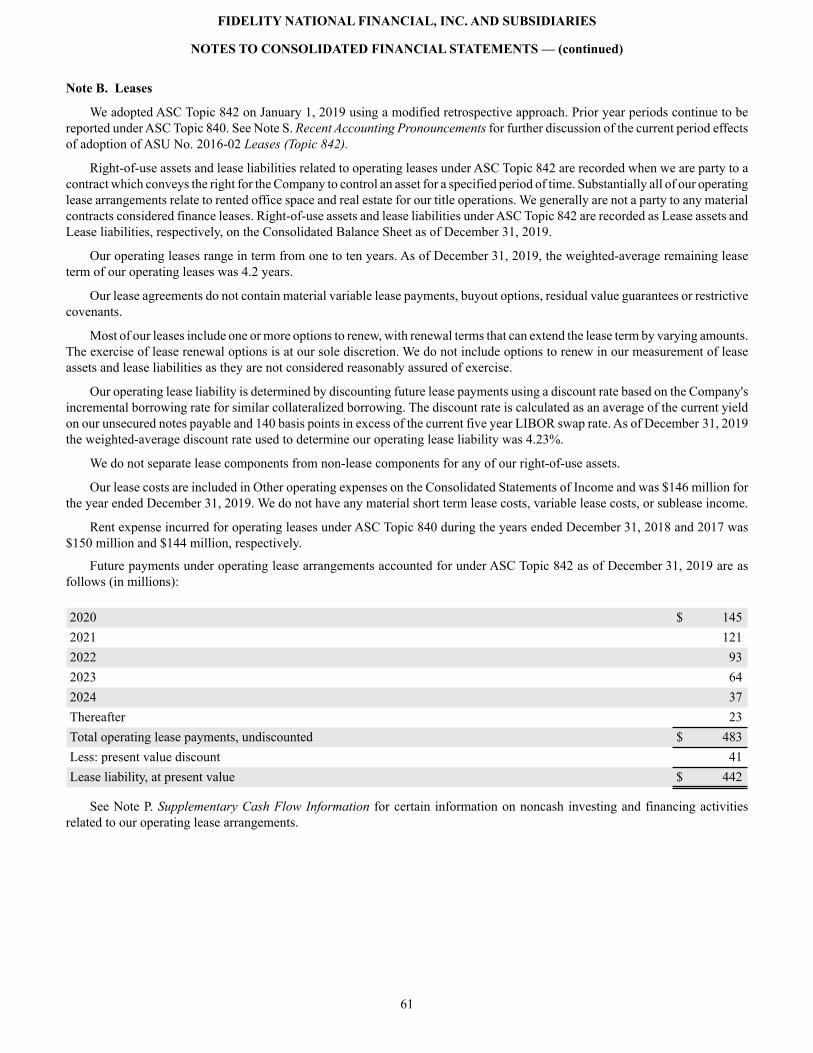
FIDELITY NATIONAL FINANCIAL, INC. AND SUBSIDIARIES
NOTES TO CONSOLIDATED FINANCIAL STATEMENTS — (continued)
61
Note B. Leases
We adopted ASC Topic 842 on January 1, 2019 using a modified retrospective approach. Prior year periods continue to be reported under ASC Topic 840. See Note S. Recent Accounting Pronouncements for further discussion of the current period effects of adoption of ASU No. 2016-02 Leases (Topic 842).
Right-of-use assets and lease liabilities related to operating leases under ASC Topic 842 are recorded when we are party to a contract which conveys the right for the Company to control an asset for a specified period of time. Substantially all of our operating lease arrangements relate to rented office space and real estate for our title operations. We generally are not a party to any material contracts considered finance leases. Right-of-use assets and lease liabilities under ASC Topic 842 are recorded as Lease assets and Lease liabilities, respectively, on the Consolidated Balance Sheet as of December 31, 2019.
Our operating leases range in term from one to ten years. As of December 31, 2019, the weighted-average remaining lease term of our operating leases was 4.2 years.
Our lease agreements do not contain material variable lease payments, buyout options, residual value guarantees or restrictive covenants.
Most of our leases include one or more options to renew, with renewal terms that can extend the lease term by varying amounts. The exercise of lease renewal options is at our sole discretion. We do not include options to renew in our measurement of lease assets and lease liabilities as they are not considered reasonably assured of exercise.
Our operating lease liability is determined by discounting future lease payments using a discount rate based on the Company's incremental borrowing rate for similar collateralized borrowing. The discount rate is calculated as an average of the current yield on our unsecured notes payable and 140 basis points in excess of the current five year LIBOR swap rate. As of December 31, 2019the weighted-average discount rate used to determine our operating lease liability was 4.23%.
We do not separate lease components from non-lease components for any of our right-of-use assets.
Our lease costs are included in Other operating expenses on the Consolidated Statements of Income and was $146 million for the year ended December 31, 2019. We do not have any material short term lease costs, variable lease costs, or sublease income.
Rent expense incurred for operating leases under ASC Topic 840 during the years ended December 31, 2018 and 2017 was $150 million and $144 million, respectively.
Future payments under operating lease arrangements accounted for under ASC Topic 842 as of December 31, 2019 are as follows (in millions):
2020 $ 1452021 1212022 932023 642024 37Thereafter 23Total operating lease payments, undiscounted $ 483Less: present value discount 41Lease liability, at present value $ 442
See Note P. Supplementary Cash Flow Information for certain information on noncash investing and financing activities related to our operating lease arrangements.
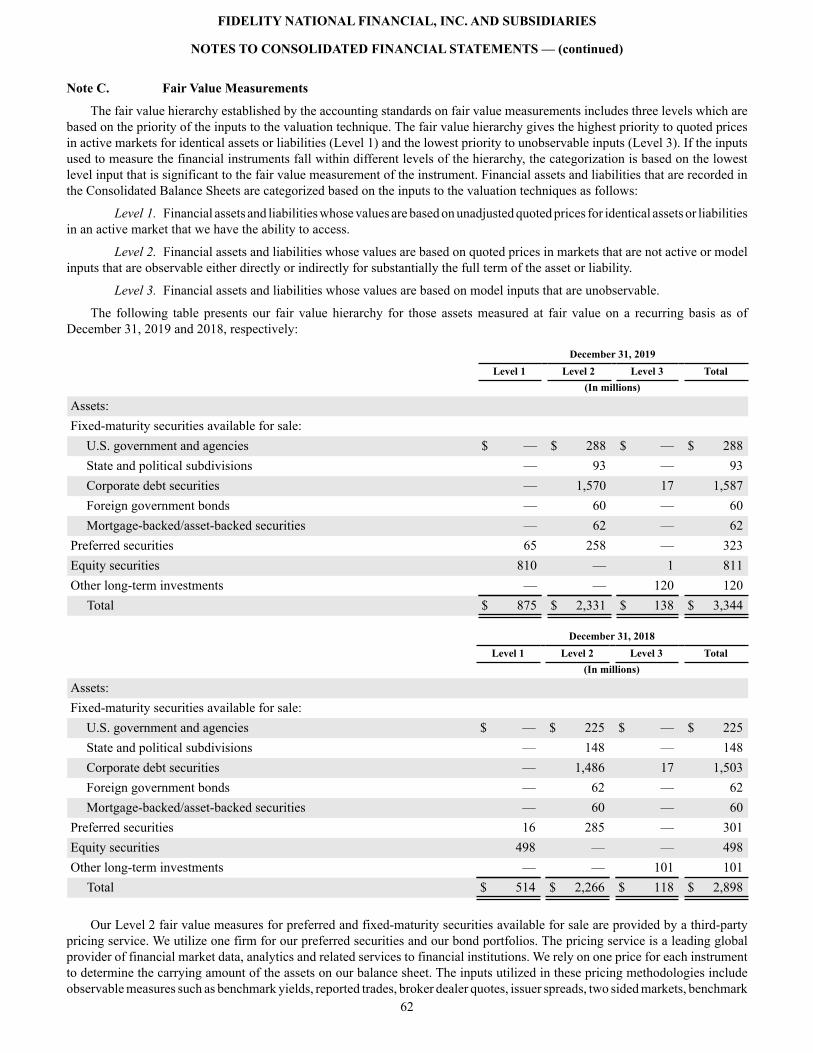
FIDELITY NATIONAL FINANCIAL, INC. AND SUBSIDIARIES
NOTES TO CONSOLIDATED FINANCIAL STATEMENTS — (continued)
62
Note C. Fair Value Measurements
The fair value hierarchy established by the accounting standards on fair value measurements includes three levels which are based on the priority of the inputs to the valuation technique. The fair value hierarchy gives the highest priority to quoted prices in active markets for identical assets or liabilities (Level 1) and the lowest priority to unobservable inputs (Level 3). If the inputs used to measure the financial instruments fall within different levels of the hierarchy, the categorization is based on the lowest level input that is significant to the fair value measurement of the instrument. Financial assets and liabilities that are recorded in the Consolidated Balance Sheets are categorized based on the inputs to the valuation techniques as follows:
Level 1. Financial assets and liabilities whose values are based on unadjusted quoted prices for identical assets or liabilities in an active market that we have the ability to access.
Level 2. Financial assets and liabilities whose values are based on quoted prices in markets that are not active or model inputs that are observable either directly or indirectly for substantially the full term of the asset or liability.
Level 3. Financial assets and liabilities whose values are based on model inputs that are unobservable.
The following table presents our fair value hierarchy for those assets measured at fair value on a recurring basis as of December 31, 2019 and 2018, respectively:
December 31, 2019 Level 1 Level 2 Level 3 Total (In millions)
Assets:Fixed-maturity securities available for sale:
U.S. government and agencies $ — $ 288 $ — $ 288State and political subdivisions — 93 — 93Corporate debt securities — 1,570 17 1,587Foreign government bonds — 60 — 60Mortgage-backed/asset-backed securities — 62 — 62
Preferred securities 65 258 — 323Equity securities 810 — 1 811Other long-term investments — — 120 120 Total $ 875 $ 2,331 $ 138 $ 3,344
December 31, 2018 Level 1 Level 2 Level 3 Total (In millions)
Assets:Fixed-maturity securities available for sale:
U.S. government and agencies $ — $ 225 $ — $ 225State and political subdivisions — 148 — 148Corporate debt securities — 1,486 17 1,503Foreign government bonds — 62 — 62Mortgage-backed/asset-backed securities — 60 — 60
Preferred securities 16 285 — 301Equity securities 498 — — 498Other long-term investments — — 101 101 Total $ 514 $ 2,266 $ 118 $ 2,898
Our Level 2 fair value measures for preferred and fixed-maturity securities available for sale are provided by a third-party pricing service. We utilize one firm for our preferred securities and our bond portfolios. The pricing service is a leading global provider of financial market data, analytics and related services to financial institutions. We rely on one price for each instrument to determine the carrying amount of the assets on our balance sheet. The inputs utilized in these pricing methodologies include observable measures such as benchmark yields, reported trades, broker dealer quotes, issuer spreads, two sided markets, benchmark
FIDELITY NATIONAL FINANCIAL, INC. AND SUBSIDIARIES
NOTES TO CONSOLIDATED FINANCIAL STATEMENTS — (continued)
63
securities, bids, offers and reference data including market research publications. We review the pricing methodologies for all of our Level 2 securities by obtaining an understanding of the valuation models and assumptions used by the third-party. When available and for certain investments, we independently compare the resulting prices to other publicly available measures of fair value and internally developed models. The pricing methodologies used by the relevant third-party pricing services are as follows:
• U.S. government and agencies: These securities are valued based on data obtained for similar securities in active markets and from inter-dealer brokers.
• State and political subdivisions: These securities are valued based on data obtained for similar securities in active markets and from inter-dealer brokers. Factors considered include relevant trade information, dealer quotes and other relevant market data.
• Corporate debt securities: These securities are valued based on dealer quotes and related market trading activity. Factors considered include the bond's yield, its terms and conditions, or any other feature which may influence its risk and thus marketability, as well as relative credit information and relevant sector news.
• Foreign government bonds: These securities are valued based on a discounted cash flow model incorporating observable market inputs such as available broker quotes and yields of comparable securities.
• Mortgage-backed/asset-backed securities: These securities are comprised of commercial mortgage-backed securities, agency mortgage-backed securities, collateralized mortgage obligations, and asset-backed securities. They are valued based on available trade information, dealer quotes, cash flows, relevant indices and market data for similar assets in active markets.
• Preferred securities: Preferred securities are valued by calculating the appropriate spread over a comparable US Treasury security. Inputs include benchmark quotes and other relevant market data.
In conjunction with our adoption of ASU No. 2016-01, beginning January 1, 2018, we began recording certain preferred equity investments included in other long term investments at fair value which were previously accounted for as cost method investments. See discussion of Recent Accounting Pronouncements in Note S. Recent Accounting Pronouncements for further information on the impact of the adoption of ASU No. 2016-01.
Our Level 3 fair value measures for our other long term investment are provided by a third-party pricing service. We utilize one firm to value our Level 3 other long-term investment. The pricing service is a leading global provider of financial market data, analytics and related services to financial institutions. We utilize the income approach and a discounted cash flow analysis in determining the fair value of our Level 3 other long-term investment. The primary unobservable input utilized in this pricing methodology is the discount rate used which is determined based on underwriting yield, credit spreads, yields on benchmark indices, and comparable public company debt. The discount rate used in our determination of the fair value of our Level 3 other long-term investment as of December 31, 2019 was a range of 6.8% - 7.4% and a weighted-average of 7.0%. Based on the total fair value of our Level 3 other long-term investment as of December 31, 2019, changes in the discount rate utilized will not result in a fair value significantly different than the amount recorded.

FIDELITY NATIONAL FINANCIAL, INC. AND SUBSIDIARIES
NOTES TO CONSOLIDATED FINANCIAL STATEMENTS — (continued)
64
The following table presents a summary of the changes in fair values of Level 3 assets, measured on a recurring basis, for the years ended December 31, 2019 and 2018:
Other long-term Equity Corporate debt investments securities securities Total (In millions)
Fair value, December 31, 2017 $ — $ — $ — $ —Fair value of assets associated with the adoption ofASU 2016-01 (1) 100 — — 100Transfers from Level 2 — — 17 17Paid-in-kind dividends (2) 7 — — 7Purchases — — 1 1Net change in fair value included in earnings (3) (6) — — (6)Net unrealized loss included in other comprehensive(loss) earnings — — (1) (1)
Fair value, December 31, 2018 $ 101 $ — $ 17 $ 118Transfers to Level 2 — — (6) (6)Paid-in-kind dividends (2) 8 — 1 9Purchases — — 7 7Net change in fair value included in earnings (3) 11 1 (2) 10
Fair value, December 31, 2019 $ 120 $ 1 $ 17 $ 138___________________________________________
(1) See Note S. Recent Accounting Pronouncements for further discussion.(2) Included in Interest and investment income on the Consolidated Statements of Earnings.(3) Included in Realized gains and losses, net on the Consolidated Statements of Earnings.
Transfers into or out of the Level 3 fair value category occur when unobservable inputs become more or less significant to the fair value measurement or upon a change in valuation technique. For the year ended December 31, 2019, transfers between Level 2 and Level 3 are not considered material to the Company's financial position or results of operations. For the year ended December 31, 2018, transfers between Level 2 and Level 3 were based on changes in significance of unobservable inputs used associated with a change in the valuation technique used for certain of the Company’s corporate debt securities and are not considered material to the Company's financial position or results of operations. The Company’s policy is to recognize transfers between levels in the fair value hierarchy at the end of the reporting period.
There were no transfers of assets or liabilities measured at fair value using Level 1 inputs to Level 2 in the years ended December 31, 2019 or 2018.
Substantially all of the unrealized gain (loss) on investments and other financial instruments, net (excluding investments in unconsolidated affiliates) on our Consolidated Statements of Comprehensive Income relate to fixed maturity securities which are considered Level 2 fair value measures.
The carrying amounts of short-term investments, accounts receivable and notes receivable approximate fair value due to their short-term nature. The fair value of our notes payable is included in Note J. Notes Payable.
Additional information regarding the fair value of our investment portfolio is included in Note D. Investments.

FIDELITY NATIONAL FINANCIAL, INC. AND SUBSIDIARIES
NOTES TO CONSOLIDATED FINANCIAL STATEMENTS — (continued)
65
Note D. Investments
The cost basis and fair values of our available for sale securities at December 31, 2019 and 2018 are as follows:
December 31, 2019
Carrying
ValueCostBasis
UnrealizedGains
UnrealizedLosses
FairValue
(In millions)
Fixed maturity investments available for sale: U.S. government and agencies $ 288 $ 282 $ 7 $ (1) $ 288States and political subdivisions 93 90 3 — 93Corporate debt securities 1,587 1,536 54 (3) 1,587Foreign government bonds 60 61 1 (2) 60Mortgage-backed/asset-backed securities 62 60 2 — 62
Total $ 2,090 $ 2,029 $ 67 $ (6) $ 2,090
December 31, 2018
Carrying
ValueCostBasis
UnrealizedGains
UnrealizedLosses
FairValue
(In millions)
Fixed maturity investments available for sale: U.S. government and agencies $ 225 $ 226 $ 1 $ (2) $ 225States and political subdivisions 148 147 1 — 148Corporate debt securities 1,503 1,510 6 (13) 1,503Foreign government bonds 62 67 — (5) 62Mortgage-backed/asset-backed securities 60 59 1 — 60
Total $ 1,998 $ 2,009 $ 9 $ (20) $ 1,998
The cost basis of fixed maturity securities available for sale includes an adjustment for amortized premium or discount since the date of purchase.
The change in net unrealized gains and (losses) on fixed maturities for the years ended December 31, 2019, 2018, and 2017was an increase (decrease) of $72 million, $(21) million, and $(1) million, respectively.
The following table presents certain information regarding contractual maturities of our fixed maturity securities at December 31, 2019:
December 31, 2019
MaturityAmortized
Cost% ofTotal
FairValue
% ofTotal
(Dollars in millions)
One year or less $ 341 16.8% $ 341 16.3%After one year through five years 1,093 53.9 1,117 53.4After five years through ten years 403 19.8 424 20.3After ten years 132 6.5 146 7.0Mortgage-backed/asset-backed securities 60 3.0 62 3.0 $ 2,029 100.0% $ 2,090 100.0%
Expected maturities may differ from contractual maturities because certain borrowers have the right to call or prepay obligations with or without call or prepayment penalties. Because of the potential for prepayment on mortgage-backed and asset-backed securities, they are not categorized by contractual maturity.
Fixed maturity securities valued at approximately $94 million and $122 million were on deposit with various governmental authorities at December 31, 2019 and 2018, respectively, as required by law.

FIDELITY NATIONAL FINANCIAL, INC. AND SUBSIDIARIES
NOTES TO CONSOLIDATED FINANCIAL STATEMENTS — (continued)
66
Net unrealized losses on investment securities and the fair value of the related securities, aggregated by investment category and length of time that individual securities have been in a continuous unrealized loss position at December 31, 2019 and 2018are as follows (in millions):
December 31, 2019 Less than 12 Months 12 Months or Longer Total
Fair
ValueUnrealized
LossesFair
ValueUnrealized
LossesFair
ValueUnrealized
Losses
Corporate debt securities $ 98 $ (2) $ 51 $ (1) 149 $ (3)U.S. government and agencies 62 (1) — — 62 (1)Foreign government bonds — — 33 (2) 33 (2)
Total temporarily impaired securities $ 160 $ (3) $ 84 $ (3) $ 244 $ (6)
December 31, 2018 Less than 12 Months 12 Months or Longer Total
Fair
ValueUnrealized
LossesFair
ValueUnrealized
LossesFair
ValueUnrealized
Losses
Corporate debt securities $ 661 $ (8) $ 301 $ (5) $ 962 $ (13)U.S. government and agencies 71 (1) 117 (1) 188 (2)Foreign government bonds 52 (3) 10 (2) 62 (5)
Total temporarily impaired securities $ 784 $ (12) $ 428 $ (8) $ 1,212 $ (20)
The unrealized losses for the corporate debt securities and U.S. government bonds were primarily caused by fluctuations in interest rates. The unrealized losses for the foreign government bonds were primarily caused by foreign exchange fluctuations. We consider the unrealized losses related to these securities to be temporary rather than changes in credit quality. We expect to recover the entire amortized cost basis of our temporarily impaired fixed maturity securities as we do not intend to sell these securities and we do not believe that we will be required to sell the fixed maturity securities before recovery of the cost basis. For these reasons, we do not consider these securities other-than-temporarily impaired at December 31, 2019. It is reasonably possible that declines in fair value below cost not considered other-than-temporary in the current period could be considered to be other-than-temporary in a future period and earnings would be reduced to the extent of the impairment.
During the years ended December 31, 2019, 2018 and 2017 we incurred impairment charges relating to investments that were determined to be other-than-temporarily impaired, which resulted in impairment charges of $8 million, $3 million and $1 million, respectively. The impairment charges in 2019 related to credit risks of certain issuers of our fixed maturity securities which have exhibited a decreasing fair value and from which we are uncertain of our ability to recover our initial investment. The impairment charges in 2018 and 2017 related to fixed maturity securities of investees entering Chapter 11 bankruptcy which have exhibited a decreasing fair market value and from which we are uncertain of our ability to recover our initial investment.
As of December 31, 2019, we held $9 million of investment securities for which other-than-temporary impairments have been previously recognized. As of December 31, 2018, we held no investment securities for which other-than-temporary impairments had been previously recognized. It is possible that future events may lead us to recognize potential future impairment losses related to our investment portfolio and that unanticipated future events may lead us to dispose of certain investment holdings and recognize the effects of any market movements in our consolidated financial statements.

FIDELITY NATIONAL FINANCIAL, INC. AND SUBSIDIARIES
NOTES TO CONSOLIDATED FINANCIAL STATEMENTS — (continued)
67
The following table presents realized gains and losses on investments and other assets and proceeds from the sale or maturity of investments and other assets for the years ended December 31, 2019, 2018, and 2017, respectively:
Year ended December 31, 2019
GrossRealized
Gains
GrossRealizedLosses
NetRealized
Gains(Losses)
GrossProceeds
from Sale/Maturity
(In millions)
Fixed maturity securities available for sale $ 4 $ (9) $ (5) $ 614Preferred stock 1 — 1 55Equity securities 10 — 10 160Valuation gain on equity securities (1) 299 —Valuation gain on preferred securities (1) 17 —Valuation of other long term investments (1) 11 —Impairment of lease assets (8) —Other realized gains and losses, net (7) —
Total $ 318 $ 829(1) See discussion of adoption of ASU 2016-01 in Note S. Recent Accounting Pronouncements
Year ended December 31, 2018
GrossRealized
Gains
GrossRealizedLosses
NetRealized
Gains(Losses)
GrossProceeds
from Sale/Maturity
(In millions)
Fixed maturity securities available for sale $ 6 $ (4) $ 2 $ 838Preferred stock 1 — 1 60Equity securities 5 (21) (16) 298Valuation loss on equity securities (1) (71) —Valuation loss on preferred securities (1) (24) —Property and equipment 5 21Asset impairments (7) —Pacific Union Sale 4 47Other realized gains and losses, net (3) —
Total $ (109) $ 1,264(1) See discussion of adoption of ASU 2016-01 in Note S. Recent Accounting Pronouncements
Year ended December 31, 2017
GrossRealized
Gains
GrossRealizedLosses
NetRealized
Gains(Losses)
GrossProceeds
from Sale/Maturity
(In millions)
Fixed maturity securities available for sale $ 7 $ (8) $ (1) $ 968Preferred stock available for sale — — — 10Other long-term investments 9 21Loss on debt conversions (6) —Property, plant and equipment 2 4Other intangible assets (1) —Other realized gains and losses, net (1) —
Total $ 2 $ 1,003
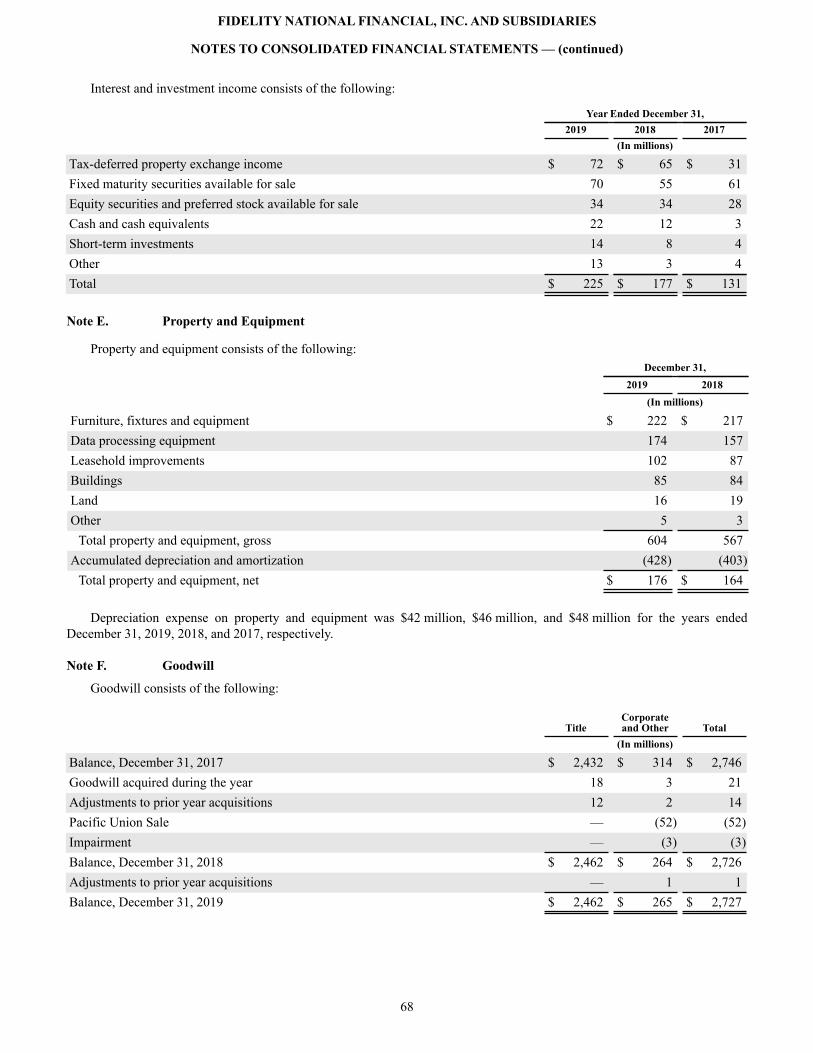
FIDELITY NATIONAL FINANCIAL, INC. AND SUBSIDIARIES
NOTES TO CONSOLIDATED FINANCIAL STATEMENTS — (continued)
68
Interest and investment income consists of the following:
Year Ended December 31, 2019 2018 2017 (In millions)
Tax-deferred property exchange income $ 72 $ 65 $ 31Fixed maturity securities available for sale 70 55 61Equity securities and preferred stock available for sale 34 34 28Cash and cash equivalents 22 12 3Short-term investments 14 8 4Other 13 3 4Total $ 225 $ 177 $ 131
Note E. Property and Equipment
Property and equipment consists of the following: December 31, 2019 2018 (In millions)
Furniture, fixtures and equipment $ 222 $ 217Data processing equipment 174 157Leasehold improvements 102 87Buildings 85 84Land 16 19Other 5 3
Total property and equipment, gross 604 567Accumulated depreciation and amortization (428) (403)
Total property and equipment, net $ 176 $ 164
Depreciation expense on property and equipment was $42 million, $46 million, and $48 million for the years ended December 31, 2019, 2018, and 2017, respectively.
Note F. Goodwill
Goodwill consists of the following:
TitleCorporateand Other Total
(In millions)
Balance, December 31, 2017 $ 2,432 $ 314 $ 2,746Goodwill acquired during the year 18 3 21Adjustments to prior year acquisitions 12 2 14Pacific Union Sale — (52) (52)Impairment — (3) (3)Balance, December 31, 2018 $ 2,462 $ 264 $ 2,726Adjustments to prior year acquisitions — 1 1Balance, December 31, 2019 $ 2,462 $ 265 $ 2,727

FIDELITY NATIONAL FINANCIAL, INC. AND SUBSIDIARIES
NOTES TO CONSOLIDATED FINANCIAL STATEMENTS — (continued)
69
Note G. Discontinued Operations
Black Knight
As a result of the BK Distribution, the financial results of Black Knight have been reclassified to discontinued operations for all periods presented in our Consolidated Statements of Earnings. We retained no ownership in Black Knight.
We have various agreements with Black Knight to provide technology, data and analytics services, as well as corporate shared services and information technology. We are also a party to certain other agreements under which we incur other expenses or receive revenues from Black Knight. We expect to continue utilizing Black Knight to provide technology and data and analytics services for the foreseeable future. The cash inflows and outflows from and to Black Knight as well as revenues and expenses included in continuing operations subsequent to the BK Distribution which were previously eliminated in our consolidated financial statements as intra-entity transactions, are not considered material to our results of operations.
A summary of the operations of Black Knight included in discontinued operations is shown below:
Year EndedDecember 31,
2017Revenues: (in millions)
Escrow, title-related and other fees $ 745Realized gains and losses, net (13)
Total revenues 732Expenses:
Personnel costs 292Other operating expenses 145Depreciation and amortization 154Interest expense 42
Total expenses 633Earnings from discontinued operations before income taxes 99Income tax expense 40Net earnings from discontinued operations 59Less: Net earnings attributable to non-controlling interests 36Net earnings attributable to Fidelity National Financial, Inc. common shareholders $ 23
Cash flow from discontinued operations data:Net cash provided by operations $ 240Net cash used in investing activities (46)
FIDELITY NATIONAL FINANCIAL, INC. AND SUBSIDIARIES
NOTES TO CONSOLIDATED FINANCIAL STATEMENTS — (continued)
70
FNFV
As a result of the FNFV Split-Off, the financial results of FNFV Group have been reclassified to discontinued operations for all periods presented in our Consolidated Statements of Earnings. Subsequent to the FNFV Split-Off, Cannae is considered a related party to FNF. The cash inflows and outflows from and to Cannae as well as revenues and expenses included in continuing operations subsequent to November 17, 2017, the date of the FNFV Split-Off, which were previously eliminated in our consolidated financial statements as intra-entity transactions, are not material to our results of operations for the year ended December 31, 2017.
In conjunction with the FNFV Split-Off, FNTIC, Chicago Title, and Commonwealth Title contributed an aggregate of $100 million to Cannae in exchange for 5,706,134 shares of Cannae common stock. As of December 31, 2019, we own approximately 7.2% of Cannae's outstanding common equity. In addition, we issued to Cannae a revolver note (the "Cannae Revolver") in the aggregate principal amount of up to $100 million, which accrues interest at LIBOR plus 450 basis points and matures on the five-year anniversary of the date of the revolver note. The maturity date is automatically extended for additional five-year terms unless notice of non-renewal is otherwise provided by either FNF or Cannae, in their sole discretion.
In connection with the FNFV Split-Off, the following material agreements were entered into by and between the Company and Cannae (the “Split-Off Agreements”):
• Reorganization Agreement, dated as of November 17, 2017, by and between the Company and Cannae, which provides for, among other things, the principal corporate transactions required to effect the Split-Off, certain conditions to the Split-Off and provisions governing the relationship between the Company and Cannae with respect to and resulting from the Split-Off;
• Tax Matters Agreement, dated as of November 17, 2017, by and between the Company and Cannae, which governs the Company’s and Cannae’s respective rights, responsibilities and obligations with respect to taxes and tax benefits, the filing of tax returns, the control of audits and other tax matters; and
• Voting Agreement, dated as of November 17, 2017, by and between the Company and Cannae, pursuant to which the Company agrees to appear or cause all shares of Cannae common stock that the Company or its subsidiaries, as applicable, own after the Split-Off to be counted as present at any meeting of the stockholders of Cannae, for the purpose of establishing a quorum, and agrees to vote all of such shares of Cannae common stock (or cause them to be voted) in the same manner as, and in the same proportion to, all shares voted by holders of Cannae common stock (other than the Company and its subsidiaries).
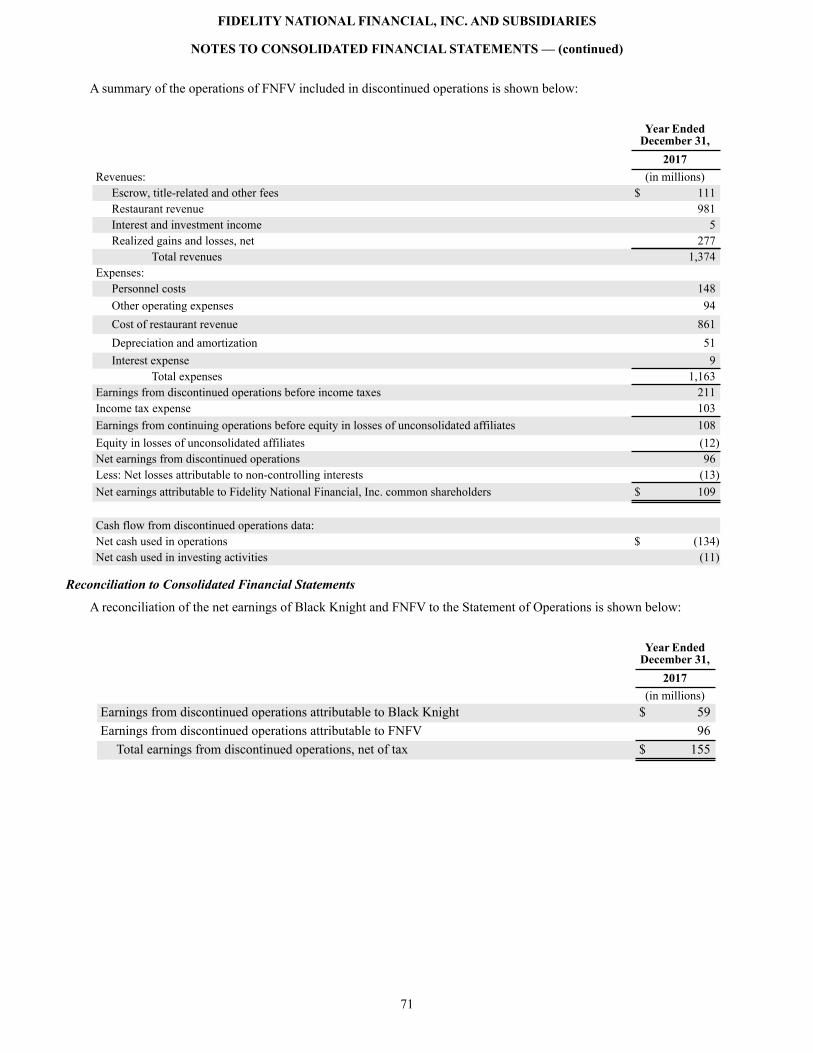
FIDELITY NATIONAL FINANCIAL, INC. AND SUBSIDIARIES
NOTES TO CONSOLIDATED FINANCIAL STATEMENTS — (continued)
71
A summary of the operations of FNFV included in discontinued operations is shown below:
Year EndedDecember 31,
2017Revenues: (in millions)
Escrow, title-related and other fees $ 111Restaurant revenue 981Interest and investment income 5Realized gains and losses, net 277
Total revenues 1,374Expenses:
Personnel costs 148Other operating expenses 94Cost of restaurant revenue 861Depreciation and amortization 51Interest expense 9
Total expenses 1,163Earnings from discontinued operations before income taxes 211Income tax expense 103Earnings from continuing operations before equity in losses of unconsolidated affiliates 108Equity in losses of unconsolidated affiliates (12)Net earnings from discontinued operations 96Less: Net losses attributable to non-controlling interests (13)Net earnings attributable to Fidelity National Financial, Inc. common shareholders $ 109
Cash flow from discontinued operations data:Net cash used in operations $ (134)Net cash used in investing activities (11)
Reconciliation to Consolidated Financial Statements
A reconciliation of the net earnings of Black Knight and FNFV to the Statement of Operations is shown below:
Year EndedDecember 31,
2017(in millions)
Earnings from discontinued operations attributable to Black Knight $ 59Earnings from discontinued operations attributable to FNFV 96
Total earnings from discontinued operations, net of tax $ 155
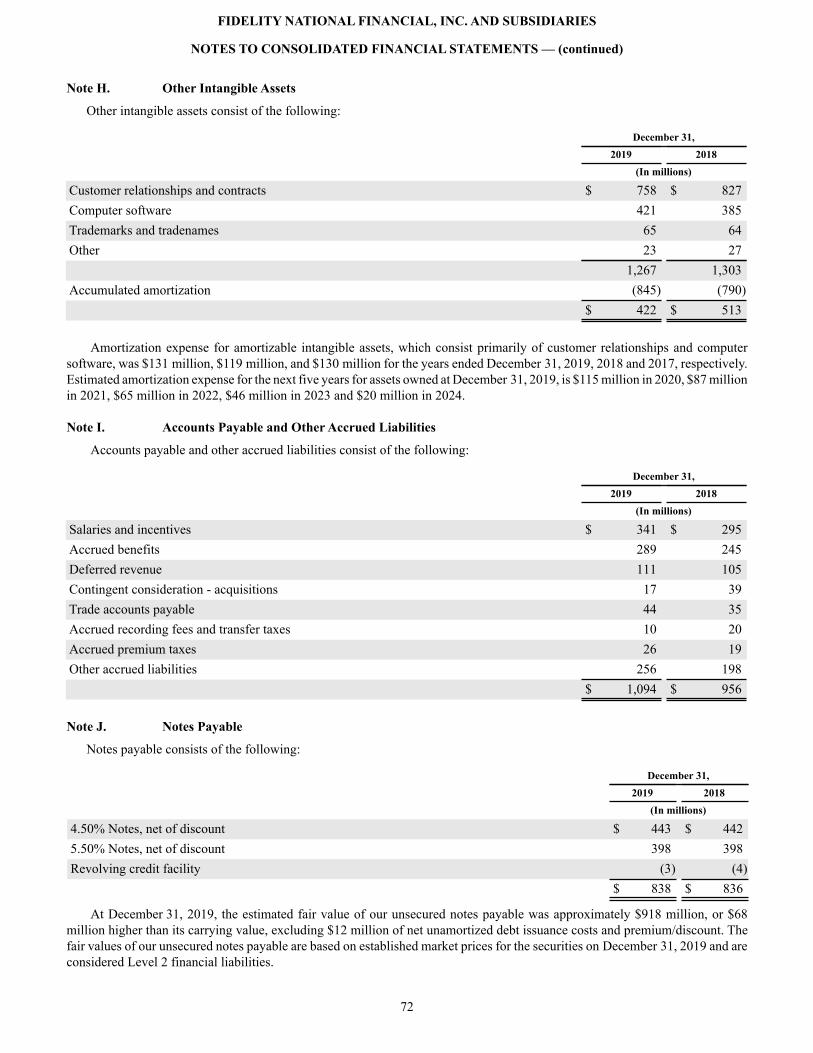
FIDELITY NATIONAL FINANCIAL, INC. AND SUBSIDIARIES
NOTES TO CONSOLIDATED FINANCIAL STATEMENTS — (continued)
72
Note H. Other Intangible Assets
Other intangible assets consist of the following:
December 31, 2019 2018 (In millions)
Customer relationships and contracts $ 758 $ 827Computer software 421 385Trademarks and tradenames 65 64Other 23 27 1,267 1,303Accumulated amortization (845) (790) $ 422 $ 513
Amortization expense for amortizable intangible assets, which consist primarily of customer relationships and computer software, was $131 million, $119 million, and $130 million for the years ended December 31, 2019, 2018 and 2017, respectively. Estimated amortization expense for the next five years for assets owned at December 31, 2019, is $115 million in 2020, $87 millionin 2021, $65 million in 2022, $46 million in 2023 and $20 million in 2024.
Note I. Accounts Payable and Other Accrued Liabilities
Accounts payable and other accrued liabilities consist of the following:
December 31, 2019 2018 (In millions)
Salaries and incentives $ 341 $ 295Accrued benefits 289 245Deferred revenue 111 105Contingent consideration - acquisitions 17 39Trade accounts payable 44 35Accrued recording fees and transfer taxes 10 20Accrued premium taxes 26 19Other accrued liabilities 256 198 $ 1,094 $ 956
Note J. Notes Payable
Notes payable consists of the following:
December 31, 2019 2018 (In millions)
4.50% Notes, net of discount $ 443 $ 4425.50% Notes, net of discount 398 398Revolving credit facility (3) (4) $ 838 $ 836
At December 31, 2019, the estimated fair value of our unsecured notes payable was approximately $918 million, or $68 million higher than its carrying value, excluding $12 million of net unamortized debt issuance costs and premium/discount. The fair values of our unsecured notes payable are based on established market prices for the securities on December 31, 2019 and are considered Level 2 financial liabilities.
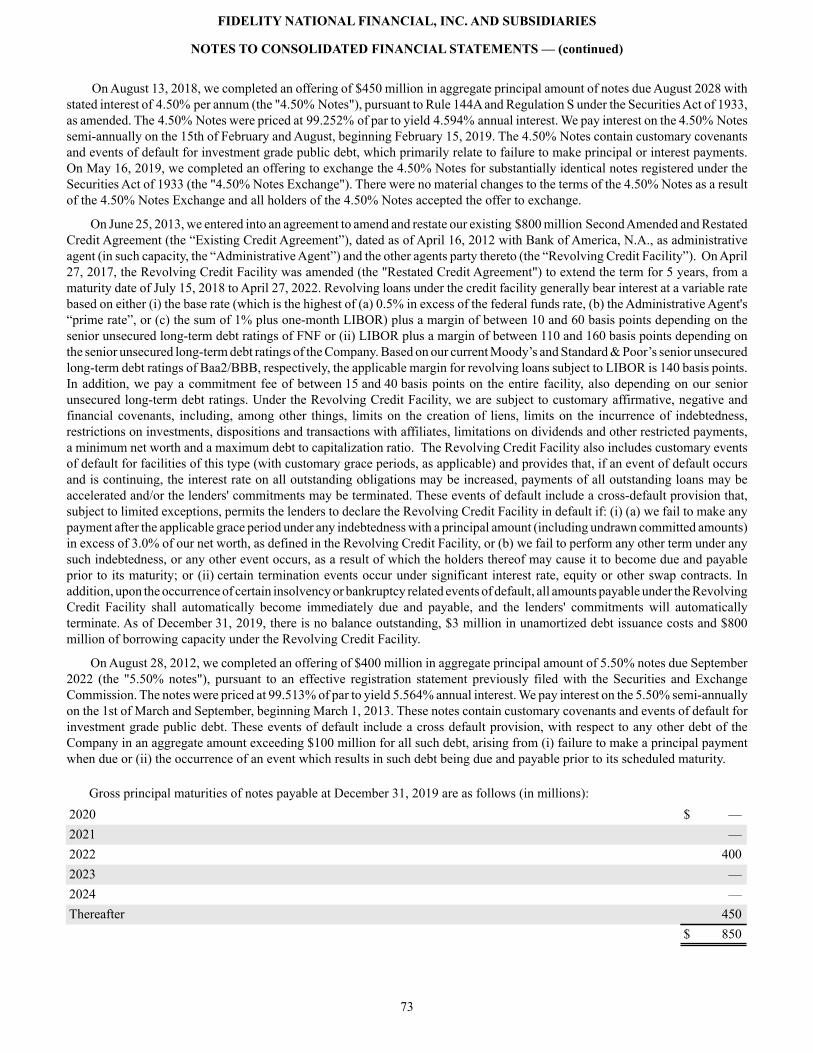
FIDELITY NATIONAL FINANCIAL, INC. AND SUBSIDIARIES
NOTES TO CONSOLIDATED FINANCIAL STATEMENTS — (continued)
73
On August 13, 2018, we completed an offering of $450 million in aggregate principal amount of notes due August 2028 with stated interest of 4.50% per annum (the "4.50% Notes"), pursuant to Rule 144A and Regulation S under the Securities Act of 1933, as amended. The 4.50% Notes were priced at 99.252% of par to yield 4.594% annual interest. We pay interest on the 4.50% Notes semi-annually on the 15th of February and August, beginning February 15, 2019. The 4.50% Notes contain customary covenants and events of default for investment grade public debt, which primarily relate to failure to make principal or interest payments. On May 16, 2019, we completed an offering to exchange the 4.50% Notes for substantially identical notes registered under the Securities Act of 1933 (the "4.50% Notes Exchange"). There were no material changes to the terms of the 4.50% Notes as a result of the 4.50% Notes Exchange and all holders of the 4.50% Notes accepted the offer to exchange.
On June 25, 2013, we entered into an agreement to amend and restate our existing $800 million Second Amended and Restated Credit Agreement (the “Existing Credit Agreement”), dated as of April 16, 2012 with Bank of America, N.A., as administrative agent (in such capacity, the “Administrative Agent”) and the other agents party thereto (the “Revolving Credit Facility”). On April 27, 2017, the Revolving Credit Facility was amended (the "Restated Credit Agreement") to extend the term for 5 years, from a maturity date of July 15, 2018 to April 27, 2022. Revolving loans under the credit facility generally bear interest at a variable rate based on either (i) the base rate (which is the highest of (a) 0.5% in excess of the federal funds rate, (b) the Administrative Agent's “prime rate”, or (c) the sum of 1% plus one-month LIBOR) plus a margin of between 10 and 60 basis points depending on the senior unsecured long-term debt ratings of FNF or (ii) LIBOR plus a margin of between 110 and 160 basis points depending on the senior unsecured long-term debt ratings of the Company. Based on our current Moody’s and Standard & Poor’s senior unsecured long-term debt ratings of Baa2/BBB, respectively, the applicable margin for revolving loans subject to LIBOR is 140 basis points. In addition, we pay a commitment fee of between 15 and 40 basis points on the entire facility, also depending on our senior unsecured long-term debt ratings. Under the Revolving Credit Facility, we are subject to customary affirmative, negative and financial covenants, including, among other things, limits on the creation of liens, limits on the incurrence of indebtedness, restrictions on investments, dispositions and transactions with affiliates, limitations on dividends and other restricted payments, a minimum net worth and a maximum debt to capitalization ratio. The Revolving Credit Facility also includes customary events of default for facilities of this type (with customary grace periods, as applicable) and provides that, if an event of default occurs and is continuing, the interest rate on all outstanding obligations may be increased, payments of all outstanding loans may be accelerated and/or the lenders' commitments may be terminated. These events of default include a cross-default provision that, subject to limited exceptions, permits the lenders to declare the Revolving Credit Facility in default if: (i) (a) we fail to make any payment after the applicable grace period under any indebtedness with a principal amount (including undrawn committed amounts) in excess of 3.0% of our net worth, as defined in the Revolving Credit Facility, or (b) we fail to perform any other term under any such indebtedness, or any other event occurs, as a result of which the holders thereof may cause it to become due and payable prior to its maturity; or (ii) certain termination events occur under significant interest rate, equity or other swap contracts. In addition, upon the occurrence of certain insolvency or bankruptcy related events of default, all amounts payable under the Revolving Credit Facility shall automatically become immediately due and payable, and the lenders' commitments will automatically terminate. As of December 31, 2019, there is no balance outstanding, $3 million in unamortized debt issuance costs and $800 million of borrowing capacity under the Revolving Credit Facility.
On August 28, 2012, we completed an offering of $400 million in aggregate principal amount of 5.50% notes due September 2022 (the "5.50% notes"), pursuant to an effective registration statement previously filed with the Securities and Exchange Commission. The notes were priced at 99.513% of par to yield 5.564% annual interest. We pay interest on the 5.50% semi-annually on the 1st of March and September, beginning March 1, 2013. These notes contain customary covenants and events of default for investment grade public debt. These events of default include a cross default provision, with respect to any other debt of the Company in an aggregate amount exceeding $100 million for all such debt, arising from (i) failure to make a principal payment when due or (ii) the occurrence of an event which results in such debt being due and payable prior to its scheduled maturity.
Gross principal maturities of notes payable at December 31, 2019 are as follows (in millions):2020 $ —2021 —2022 4002023 —2024 —Thereafter 450 $ 850

FIDELITY NATIONAL FINANCIAL, INC. AND SUBSIDIARIES
NOTES TO CONSOLIDATED FINANCIAL STATEMENTS — (continued)
74
Note K. Income Taxes
Income tax expense (benefit) on continuing operations consists of the following:
Year Ended December 31, 2019 2018 2017 (In millions)
Current $ 268 $ 64 $ 476Deferred 40 56 (241) $ 308 $ 120 $ 235
Total income tax expense was allocated as follows (in millions):
Year Ended December 31, 2019 2018 2017
Net earnings from continuing operations $ 308 $ 120 $ 235Tax expense attributable to net earnings from discontinued operations — — 144Other comprehensive earnings (loss):
Unrealized gain (loss) on investments and other financial instruments 16 (3) 25Unrealized gain (loss) on foreign currency translation and cash flow hedging 1 (2) 4Minimum pension liability adjustment — — 3
Total income tax expense (benefit) allocated to other comprehensive earnings 17 (5) 32Total income taxes $ 325 $ 115 $ 411
A reconciliation of the federal statutory rate to our effective tax rate is as follows:
Year Ended December 31, 2019 2018 2017
Federal statutory rate 21.0% 21.0% 35.0%State income taxes, net of federal benefit 1.7 3.1 1.8Deductible dividends paid to FNF 401(k) plan (0.1) (0.1) (0.2)Tax exempt interest income — (0.1) (0.4)Stock compensation (0.8) (0.5) (1.4)Tax Credits (0.1) (0.2) (0.1)Consolidated Partnerships (0.2) (0.2) —Tax reform — (7.1) (10.7)Non-deductible expenses and other, net 1.0 0.2 3.2 Effective tax rate 22.5% 16.1% 27.2%

FIDELITY NATIONAL FINANCIAL, INC. AND SUBSIDIARIES
NOTES TO CONSOLIDATED FINANCIAL STATEMENTS — (continued)
75
The significant components of deferred tax assets and liabilities at December 31, 2019 and 2018 consist of the following:
December 31, 2019 2018 (In millions)
Deferred Tax Assets: Employee benefit accruals $ 71 $ 64Net operating loss carryforwards 3 7Accrued liabilities 3 7Allowance for uncollectible accounts receivable 4 4Pension plan 3 2Tax credits 39 41State income taxes 3 3Investment securities — 3Other 9 1
Total gross deferred tax asset 135 132Less: valuation allowance 25 22Total deferred tax asset $ 110 $ 110
Deferred Tax Liabilities: Title plant $ (55) $ (55)Amortization of goodwill and intangible assets (113) (113)Other investments (6) (6)Other (11) (23)Investment securities (75) —Depreciation (12) (11)Partnerships (54) (68)Insurance reserve discounting (68) (61)
Total deferred tax liability $ (394) $ (337)Net deferred tax liability $ (284) $ (227)
Our net deferred tax liability was $284 million and $227 million at December 31, 2019, and 2018, respectively. The significant changes in the deferred taxes are as follows: the deferred tax liability for investment securities increased (prior year asset decreased) by $78 million largely due to unrealized gains recorded for investment securities. The deferred tax liability relating to partnerships decreased by $14 million primarily related to ServiceLink book intangibles not amortizable for tax.
SEC Staff Accounting Bulletin No. 118 ("SAB 118"), provided guidance for companies that had not completed their accounting for the income tax effects of the Tax Reform in the period of enactment, allowing for a measurement period of up to one year after the enactment date to finalize the recording of the related tax impacts. We completed our accounting for the tax effects of the enactment of the Tax Reform as of December 31, 2018.
At December 31, 2019, we have net operating losses ("NOL") on a pretax basis of $14 million available to carryforward and offset future federal taxable income. The net operating losses are US federal net operating losses arising from acquisitions made since 2012, including Buyers Protection Group, Inc., Digital Insurance Holdings, Inc., and ServiceLink. Most of the NOLs are subject to an annual Internal Revenue Code Section 382 limitation. These losses will begin to expire in year 2023 and we fully anticipate utilizing these losses prior to expiration with the exception of $3 million of gross net operating losses that are offset by a $1 million valuation allowance.
At December 31, 2019 and 2018, we had $39 million and $41 million of tax credits, respectively, which expire in 2032. The credits primarily consist of general business credits from historical acquisitions. We anticipate that these credits will be utilized prior to expiration after a valuation allowance of $21 million on the general business credits.
FIDELITY NATIONAL FINANCIAL, INC. AND SUBSIDIARIES
NOTES TO CONSOLIDATED FINANCIAL STATEMENTS — (continued)
76
As of December 31, 2019 and 2018, we had approximately $8 million and $9 million (including interest of $2 million), respectively, of total unrecognized tax benefits that, if recognized, would favorably affect our income tax rate. We record interest and penalties related to income taxes as a component of income tax expense.
The Internal Revenue Service (“IRS”) has selected us to participate in the Compliance Assurance Program that is a real-time audit. We are currently under audit by the IRS for the 2018 through 2020 tax years. We file income tax returns in various foreign and US state jurisdictions. Our state income tax returns for the 2014 through 2019 tax years remain subject to examination by state jurisdictions.
Note L. Summary of Reserve for Claim Losses
A summary of the reserve for claim losses follows:
Year Ended December 31, 2019 2018 2017 (Dollars in millions)
Beginning balance $ 1,488 $ 1,490 $ 1,487Change in reinsurance recoverable 1 — (4)Claim loss provision related to:
Current year 240 221 219Prior years — — 19
Total title claim loss provision 240 221 238Claims paid, net of recoupments related to:
Current year (11) (10) (8)Prior years (209) (213) (223)
Total title claims paid, net of recoupments (220) (223) (231)Ending balance of claim loss reserve for title insurance $ 1,509 $ 1,488 $ 1,490Provision for title insurance claim losses as a percentage of title insurance premiums 4.5% 4.5% 4.9%
We continually update loss reserve estimates as new information becomes known, new loss patterns emerge, or as other contributing factors are considered and incorporated into the analysis of reserve for claim losses. Estimating future title loss payments is difficult because of the complex nature of title claims, the long periods of time over which claims are paid, significantly varying dollar amounts of individual claims and other factors.
In the quarter ended December 31, 2017, we reduced the current quarter provision for claims losses to 4.5%. In response to favorable development on recent year claims, the average provision rate decreased in 2017 and remained constant in 2018 and 2019.
Due to the uncertainty inherent in the process and to the judgment used by management, the ultimate liability may be greater or less than our current reserves. If actual claims loss development varies from what is currently expected and is not offset by other factors, it is possible that our recorded reserves may fall outside a reasonable range of our actuary's central estimate, which may require additional reserve adjustments in future periods.
During the 4th quarter of 2019, three lawsuits were filed by various parties against Chicago Title Company and Chicago Title Insurance Company as its alter ego, (collectively the “Named Companies”) among others. Generally, plaintiffs claim they are investors who were solicited by Gina Champion-Cain to provide funds that purportedly were to be used for high-interest, short-term loans to parties seeking to acquire California alcoholic beverage licenses. Plaintiffs contend that under California state law, alcoholic beverage license applicants are required to escrow an amount equal to the license purchase price while their applications remain pending with the State. It is further alleged that Chicago Title Company participated with Ms. Champion-Cain and her entities in a fraud scheme involving an escrow account maintained by Chicago Title Company into which the plaintiffs’ funds were deposited.
The three lawsuits are as follows:
On October 22, 2019, a lawsuit styled, Ovation Fin. Holdings 2 LLC, Ovation Fund Mgmt. II, LLC, Banc of California, N.A. v. Chicago Title Ins. Co., Chicago Title Co., was filed in the United States District Court for the Southern District of California. Plaintiffs claim losses of more than $75 million as a result of the alleged fraud scheme, and also seek consequential,
FIDELITY NATIONAL FINANCIAL, INC. AND SUBSIDIARIES
NOTES TO CONSOLIDATED FINANCIAL STATEMENTS — (continued)
77
treble, and punitive damages. The Named Companies are defending and have filed a motion to dismiss the complaint on several grounds, or alternatively, to stay the case.
On November 5, 2019, a putative class action lawsuit styled, Blake E. Allred and Melissa M. Allred v. Chicago Title Co., Chicago Title Ins. Co., Adelle E. Ducharme, Betty Elixman, Gina Champion-Cain, Joelle Hanson, Cris Torres, and Rachel Bond, was filed in the United States District Court for the Southern District of California. Plaintiffs seek class certification and consequential, treble, and punitive damages. The Named Companies are defending and have filed a motion to dismiss the complaint on several grounds, or alternatively, to stay the case.
On December 13, 2019, a lawsuit styled, Kim Funding, LLC, Kim H. Peterson, Joseph J. Cohen, and ABC Funding Strategies, LLC v. Chicago Title Co., Chicago Title Ins. Co., Thomas Schwiebert, Adelle Ducharme, and Betty Elixman, was filed in the Superior Court of San Diego County for the State of California. Plaintiffs claim losses of more than $250 million as a result of the alleged fraud scheme, and also seek statutory, treble, and punitive damages. The Named Companies are defending and have filed a motion to dismiss the complaint on several grounds.
In addition, the Chicago Title Company is also in receipt of a pre-suit demand for approximately $30 million from another group of alleged investors. Chicago Title Company has acknowledged receipt of the claim and is investigating.
At this time, the Company is unable to ascertain its liability, if any, and is unable to make an estimate of a reasonably possible claim loss for any of these claims due to the complex nature of the claims and litigation, the early procedural status of each claim (involving unresolved questions of fact without any rulings on the merits or determinations of liability), the extent of discovery not yet conducted, potential insurance coverage, and an incomplete evaluation of possible defenses, counterclaims, crossclaims or third-party claims that may exist. Moreover, it is likely that in some instances, the claims listed above are duplicative. The Company, however, has recorded an incurred claim loss reserve for legal fees related to these matters as of December 31, 2019, which is included in its consolidated reserve for claim losses. As further information becomes available, the Company will continue to evaluate the adequacy of its consolidated reserve for claim losses.
Note M. Commitments and Contingencies
Legal and Regulatory Contingencies
In the ordinary course of business, we are involved in various pending and threatened litigation matters related to our operations, some of which include claims for punitive or exemplary damages. With respect to our title insurance operations, this customary litigation includes but is not limited to a wide variety of cases arising out of or related to title and escrow claims, for which we make provisions through our loss reserves. See Note L. Summary of Reserve for Claim Losses for further discussion. Additionally, like other companies, our ordinary course litigation includes a number of class action and purported class action lawsuits, which make allegations related to aspects of our operations. We believe that no actions, other than the matters discussed below, if any, depart from customary litigation incidental to our business.
We review lawsuits and other legal and regulatory matters (collectively “legal proceedings”) on an ongoing basis when making accrual and disclosure decisions. When assessing reasonably possible and probable outcomes, management bases its decision on its assessment of the ultimate outcome assuming all appeals have been exhausted. For legal proceedings in which it has been determined that a loss is both probable and reasonably estimable, a liability based on known facts and which represents our best estimate has been recorded. Our accrual for legal and regulatory matters was $22 million and $11 million as of December 31, 2019 and 2018, respectively. None of the amounts we have currently recorded are considered to be material to our financial condition individually or in the aggregate. Actual losses may materially differ from the amounts recorded and the ultimate outcome of our pending legal proceedings is generally not yet determinable. While some of these matters could be material to our operating results or cash flows for any particular period if an unfavorable outcome results, at present we do not believe that the ultimate resolution of currently pending legal proceedings, either individually or in the aggregate, will have a material adverse effect on our financial condition.
In a class action captioned, Patterson, et al. v. Fidelity National Title Insurance Company, et al., originally filed on October 27, 2003, and pending in the Court of Common Pleas of Allegheny County, Pennsylvania, plaintiffs allege the named Company underwriters violated Pennsylvania’s Unfair Trade Practices and Consumer Protection Law (“UTPCPL”) by failing to provide premium discounts in accordance with filed rates in refinancing transactions. Contrary to rulings in similar federal court cases that considered the rate rule and agreed with the Company’s position, the court held that the rate rule should be interpreted such that an institutional mortgage in the public record is a “proxy” for prior title insurance entitling a consumer to a discount rate when refinancing when there is a mortgage of record within the number of years required by the rate rule. The rate rule requires sufficient evidence of a prior policy, and because not all institutional mortgages were insured, the Company’s position is that a recorded first mortgage alone does not constitute sufficient evidence of an earlier policy entitling consumers to a discounted rate. The court certified the class refusing to follow prior Pennsylvania Supreme Court and appellate court decisions holding that the UTPCPL
FIDELITY NATIONAL FINANCIAL, INC. AND SUBSIDIARIES
NOTES TO CONSOLIDATED FINANCIAL STATEMENTS — (continued)
78
requires proof of reliance, an individual issue that precludes certification. After notice to the class, plaintiffs moved for partial summary judgment on liability, and defendants moved for summary judgment. On June 27, 2018, the court entered an order granting plaintiffs’ motion for partial summary judgment on liability, and denying the Company’s motion. The court also determined that a multiplier of 1.5, not treble, should be applied to the amount of damages, if any, proven by class members at trial, and that Plaintiffs should bear the responsibility of identifying class members and calculating damages. The Company’s requests for interlocutory appeals of both the liability and damage multiplier issues were denied. The parties have reached an agreement in principle to resolve the matter, and are in the process of documenting the settlement agreement for submission to the court for approval. We do not believe the settlement will have a material adverse effect on our financial condition.
From time to time we receive inquiries and requests for information from state insurance departments, attorneys general and other regulatory agencies about various matters relating to our business. Sometimes these take the form of civil investigative demands or subpoenas. We cooperate with all such inquiries and we have responded to or are currently responding to inquiries from multiple governmental agencies. Also, regulators and courts have been dealing with issues arising from foreclosures and related processes and documentation. Various governmental entities are studying the title insurance product, market, pricing, and business practices, and potential regulatory and legislative changes, which may materially affect our business and operations. From time to time, we are assessed fines for violations of regulations or other matters or enter into settlements with such authorities which may require us to pay fines or claims or take other actions. We do not anticipate such fines and settlements, either individually or in the aggregate, will have a material adverse effect on our financial condition
Escrow Balances
In conducting our operations, we routinely hold customers’ assets in escrow, pending completion of real estate transactions, and are responsible for the proper disposition of these balances for our customers. Certain of these amounts are maintained in segregated bank accounts and have not been included in the accompanying Consolidated Balance Sheets, consistent with Generally Accepted Accounting Principles and industry practice. These balances amounted to $18.7 billion at December 31, 2019. As a result of holding these customers’ assets in escrow, we have ongoing programs for realizing economic benefits during the year through favorable borrowing and vendor arrangements with various banks. There were no investments or loans outstanding as of December 31, 2019 and 2018 related to these arrangements.
Note N. Regulation and Equity
Regulation
Our insurance subsidiaries, including title insurers, underwritten title companies and insurance agencies, are subject to extensive regulation under applicable state laws. Each of the insurance underwriters is subject to a holding company act in its state of domicile which regulates, among other matters, the ability to pay dividends and enter into transactions with affiliates. The laws of most states in which we transact business establish supervisory agencies with broad administrative powers relating to issuing and revoking licenses to transact business, regulating trade practices, licensing agents, approving policy forms, accounting practices, financial practices, establishing reserve and capital and surplus as regards policyholders (“capital and surplus”) requirements, defining suitable investments for reserves and capital and surplus and approving rate schedules. The process of state regulation of changes in rates ranges from states which set rates, to states where individual companies or associations of companies prepare rate filings which are submitted for approval, to a few states in which rate changes do not need to be filed for approval.
Since we are regulated by both state and federal governments and the applicable insurance laws and regulations are constantly subject to change, it is not possible to predict the potential effects on our insurance operations, particularly the Title segment, of any laws or regulations that may become more restrictive in the future or if new restrictive laws will be enacted.
Pursuant to statutory accounting requirements of the various states in which our insurers are domiciled, these insurers must defer a portion of premiums earned as an unearned premium reserve for the protection of policyholders and must maintain qualified assets in an amount equal to the statutory requirements. The level of unearned premium reserve required to be maintained at any time is determined by statutory formula based upon either the age, number of policies and dollar amount of policy liabilities underwritten, or the age and dollar amount of statutory premiums written. As of December 31, 2019, the combined statutory unearned premium reserve required and reported for our title insurers was $1,446 million. In addition to statutory unearned premium reserves, each of our insurers maintains reserves for known claims and surplus funds for policyholder protection and business operations.
Each of our insurance subsidiaries is regulated by the insurance regulatory authority in its respective state of domicile, as well as that of each state in which it is licensed. The insurance commissioners of their respective states of domicile are the primary regulators of our title insurance subsidiaries. Each of the insurers is subject to periodic regulatory financial examination by regulatory authorities.
Our insurance subsidiaries are subject to regulations that restrict their ability to pay dividends or make other distributions of cash or property to their immediate parent company without prior approval from the Department of Insurance of their respective

FIDELITY NATIONAL FINANCIAL, INC. AND SUBSIDIARIES
NOTES TO CONSOLIDATED FINANCIAL STATEMENTS — (continued)
79
states of domicile. As of December 31, 2019, $1,868 million of our net assets are restricted from dividend payments without prior approval from the Departments of Insurance. During 2020, our title insurers can pay or make distributions to us of approximately $518 million, without prior approval.
The combined statutory capital and surplus of our title insurers was approximately $1,581 million and $1,383 million as of December 31, 2019 and 2018, respectively. The combined statutory net earnings of our title insurance subsidiaries were $583 million, $625 million, and $434 million for the years ended December 31, 2019, 2018, and 2017, respectively.
Statutory-basis financial statements are prepared in accordance with accounting practices prescribed or permitted by the various state insurance regulatory authorities. The National Association of Insurance Commissioners' (“NAIC”) Accounting Practices and Procedures manual (“NAIC SAP”) has been adopted as a component of prescribed or permitted practices by each of the states that regulate us. Each of our states of domicile for our title insurance underwriter subsidiaries have adopted a material prescribed accounting practice that differs from that found in NAIC SAP. Specifically, in both years, the timing of amounts released from the statutory unearned premium reserve under NAIC SAP differs from the states' required practice. Statutory surplus at December 31, 2019 and 2018, respectively, was lower by approximately $33 million and $28 million than if we had reported such amounts in accordance with NAIC SAP.
As a condition to continued authority to underwrite policies in the states in which our insurers conduct their business, the insurers are required to pay certain fees and file information regarding their officers, directors and financial condition. In addition, our escrow and trust business is subject to regulation by various state banking authorities.
Pursuant to statutory requirements of the various states in which our insurers are domiciled, such insurers must maintain certain levels of minimum capital and surplus. Required levels of minimum capital and surplus are not significant to the insurers individually or in the aggregate. Each of our insurers has complied with the minimum statutory requirements as of December 31, 2019.
Our underwritten title companies, primarily those domiciled in California, are also subject to certain regulation by insurance regulatory or banking authorities relating to their net worth and working capital. Minimum net worth and working capital requirements for each underwritten title company is less than $1 million. These companies were in compliance with their respective minimum net worth and working capital requirements at December 31, 2019.
There are no restrictions on our retained earnings regarding our ability to pay dividends to shareholders although there are limits on the ability of certain subsidiaries to pay dividends to us, as described above.
Equity
On July 17, 2018, our Board of Directors approved a new three-year stock repurchase program effective August 1, 2018 (the "2018 Repurchase Program") under which we can purchase up to 25 million shares of our FNF common stock through July 31, 2021. We may make repurchases from time to time in the open market, in block purchases or in privately negotiated transactions, depending on market conditions and other factors. During the year ended December 31, 2019, we repurchased a total of 2,120,000FNF common shares for an aggregate of $85 million or an average of $40.09 per share. Since the original commencement of the 2018 Repurchase Program, we repurchased a total of 2,780,000 FNF common shares for an aggregate of $106 million, or an average of $38.24 per share.
Note O. Employee Benefit Plans
Stock Purchase Plan
During the three-year period ended December 31, 2019, our eligible employees could voluntarily participate in our employee stock purchase plan (“ESPP”) sponsored by us. Pursuant to the ESPP, employees may contribute an amount between 3% and 15%of their base salary and certain commissions. We contribute varying amounts as specified in the ESPP.
We contributed $28 million, $25 million, and $23 million to the ESPP in the years ended December 31, 2019, 2018, and 2017, respectively, in accordance with our matching contribution.
401(k) Profit Sharing Plan
During the three-year period ended December 31, 2019, we have offered our employees the opportunity to participate in our 401(k) profit sharing plan (the “401(k) Plan”), a qualified voluntary contributory savings plan that is available to substantially all of our employees. Eligible employees may contribute up to 40% of their pre-tax annual compensation, up to the amount allowed pursuant to the Internal Revenue Code. We make an employer match on the 401(k) Plan of $0.375 on each $1.00 contributed up to the first 6% of eligible earnings contributed to the 401(k) Plan by employees. The employer match was $29 million, $30 million, and $26 million for the years ended December 31, 2019, 2018, and 2017, respectively, and was credited based on the participant's individual investment elections in the FNF 401(k) Plan.
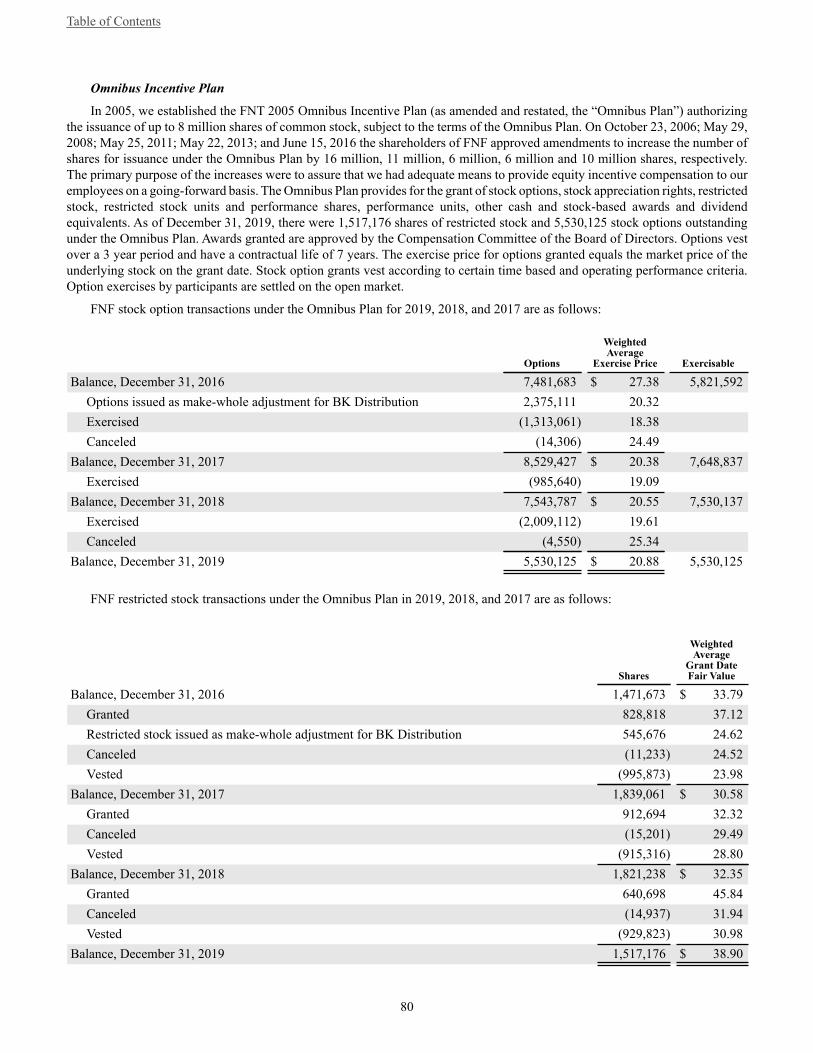
Table of Contents
80
Omnibus Incentive Plan
In 2005, we established the FNT 2005 Omnibus Incentive Plan (as amended and restated, the “Omnibus Plan”) authorizing the issuance of up to 8 million shares of common stock, subject to the terms of the Omnibus Plan. On October 23, 2006; May 29, 2008; May 25, 2011; May 22, 2013; and June 15, 2016 the shareholders of FNF approved amendments to increase the number of shares for issuance under the Omnibus Plan by 16 million, 11 million, 6 million, 6 million and 10 million shares, respectively. The primary purpose of the increases were to assure that we had adequate means to provide equity incentive compensation to our employees on a going-forward basis. The Omnibus Plan provides for the grant of stock options, stock appreciation rights, restricted stock, restricted stock units and performance shares, performance units, other cash and stock-based awards and dividend equivalents. As of December 31, 2019, there were 1,517,176 shares of restricted stock and 5,530,125 stock options outstandingunder the Omnibus Plan. Awards granted are approved by the Compensation Committee of the Board of Directors. Options vest over a 3 year period and have a contractual life of 7 years. The exercise price for options granted equals the market price of the underlying stock on the grant date. Stock option grants vest according to certain time based and operating performance criteria. Option exercises by participants are settled on the open market.
FNF stock option transactions under the Omnibus Plan for 2019, 2018, and 2017 are as follows:
Options
Weighted Average
Exercise Price Exercisable
Balance, December 31, 2016 7,481,683 $ 27.38 5,821,592Options issued as make-whole adjustment for BK Distribution 2,375,111 20.32 Exercised (1,313,061) 18.38 Canceled (14,306) 24.49
Balance, December 31, 2017 8,529,427 $ 20.38 7,648,837Exercised (985,640) 19.09
Balance, December 31, 2018 7,543,787 $ 20.55 7,530,137Exercised (2,009,112) 19.61 Canceled (4,550) 25.34
Balance, December 31, 2019 5,530,125 $ 20.88 5,530,125
FNF restricted stock transactions under the Omnibus Plan in 2019, 2018, and 2017 are as follows:
Shares
WeightedAverage
Grant DateFair Value
Balance, December 31, 2016 1,471,673 $ 33.79Granted 828,818 37.12Restricted stock issued as make-whole adjustment for BK Distribution 545,676 24.62Canceled (11,233) 24.52Vested (995,873) 23.98
Balance, December 31, 2017 1,839,061 $ 30.58Granted 912,694 32.32Canceled (15,201) 29.49Vested (915,316) 28.80
Balance, December 31, 2018 1,821,238 $ 32.35Granted 640,698 45.84Canceled (14,937) 31.94Vested (929,823) 30.98
Balance, December 31, 2019 1,517,176 $ 38.90

Table of Contents
81
The following table summarizes information related to stock options outstanding and exercisable as of December 31, 2019:
Options Outstanding Options Exercisable Weighted Weighted
Average Weighted Average Weighted
Remaining Average Remaining Average
Range of Number of Contractual Exercise Intrinsic Number of Contractual Exercise IntrinsicExercise Prices Options Life Price Value Options Life Price Value
(In years) (In millions) (In years) (In millions)
$0.00 - $17.76 2,870,481 0.89 $ 17.76 $ 79 2,870,481 0.89 $ 17.76 $ 79$17.77 - $21.84 918,236 1.84 21.84 22 918,236 1.84 21.84 22$21.85 - $25.53 1,741,408 2.83 25.53 35 1,741,408 2.83 25.53 35 5,530,125 $ 136 5,530,125 $ 136
We account for stock-based compensation plans in accordance with GAAP on share-based payments, which requires that compensation cost relating to share-based payments be recognized in the consolidated financial statements based on the fair value of each award. Using the fair value method of accounting, compensation cost is measured based on the fair value of the award at the grant date and recognized over the service period. Fair value of restricted stock awards and units is based on the grant date value of the underlying stock derived from quoted market prices. The total fair value of restricted stock awards granted in the years ended December 31, 2019, 2018 and 2017 was $29 million, $29 million, and $31 million, respectively. The total fair value of restricted stock awards which vested in the years ended December 31, 2019, 2018 and 2017 was $42 million, $29 million, and $38 million, respectively. Option awards are measured at fair value on the grant date using the Black Scholes Option Pricing Model. The intrinsic value of options exercised in the years ended December 31, 2019, 2018 and 2017 was $48 million, $19 million, and $25 million, respectively. Net earnings attributable to FNF Shareholders reflects stock-based compensation expense amounts of $38 million for the year ended December 31, 2019, $31 million for the year ended December 31, 2018, and $44 millionfor the year ended December 31, 2017, which are included in personnel costs in the reported financial results of each period.
At December 31, 2019, the total unrecognized compensation cost related to non-vested stock option grants and restricted stock grants is $45 million, which is expected to be recognized in pre-tax income over a weighted average period of 1.66 years.
Pension Plan
In 2000, FNF merged with Chicago Title Corporation ("CTC"). In connection with the merger, we assumed CTC’s noncontributory defined contribution plan and noncontributory defined benefit pension plan (the “Pension Plan”). The Pension Plan covers certain CTC employees. The benefits are based on years of service and the employee’s average monthly compensation in the highest 60 consecutive calendar months during the 120 months ending at retirement or termination. Effective December 31, 2000, the Pension Plan was frozen and there will be no future credit given for years of service or changes in salary. The accumulated benefit obligation is the same as the projected benefit obligation due to the pension plan being frozen as of December 31, 2000. Pursuant to GAAP on employers’ accounting for defined benefit pension and other post retirement plans, the measurement date is December 31.
The discount rate used to determine the benefit obligation as of the years ended December 31, 2019 and 2018 was 2.79% and 3.90%, respectively. As of the years ended December 31, 2019 and 2018, the projected benefit obligation was $160 million and $150 million, respectively, and the fair value of plan assets was $150 million and $144 million, respectively. The net pension liability and net periodic expense included in our financial position and results of operations relating to the Pension Plan is not considered material for any period presented.
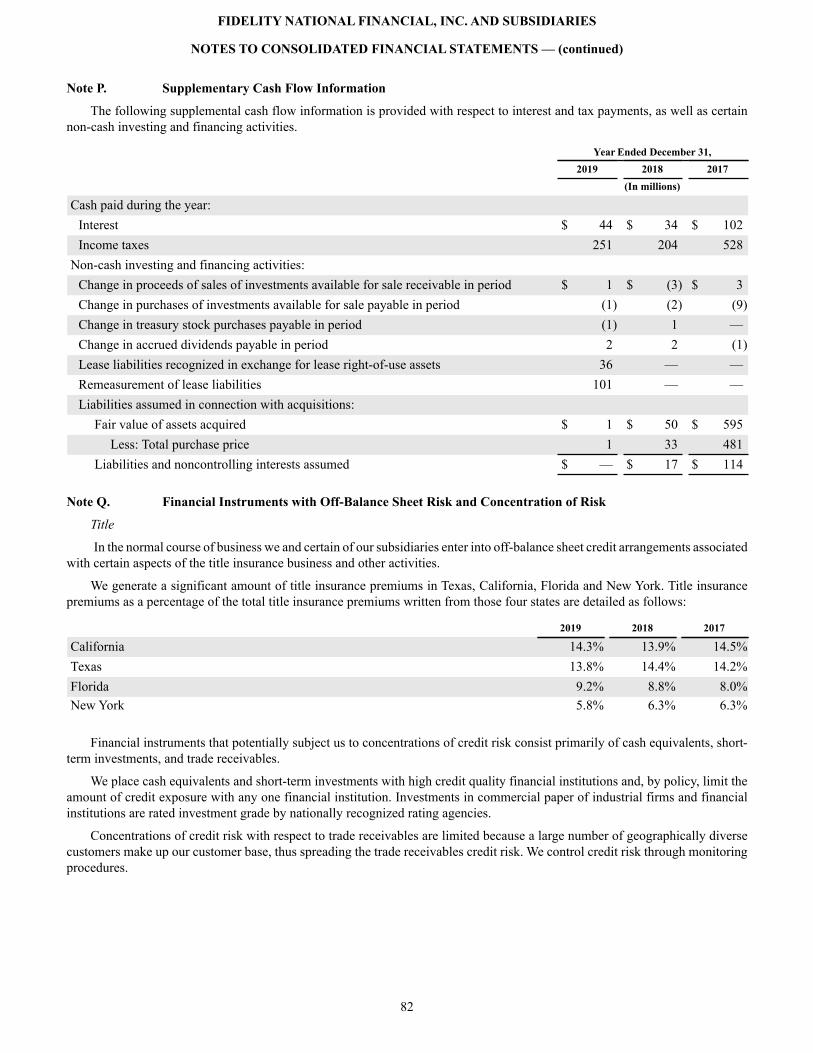
FIDELITY NATIONAL FINANCIAL, INC. AND SUBSIDIARIES
NOTES TO CONSOLIDATED FINANCIAL STATEMENTS — (continued)
82
Note P. Supplementary Cash Flow Information
The following supplemental cash flow information is provided with respect to interest and tax payments, as well as certain non-cash investing and financing activities.
Year Ended December 31, 2019 2018 2017 (In millions)
Cash paid during the year: Interest $ 44 $ 34 $ 102Income taxes 251 204 528
Non-cash investing and financing activities: Change in proceeds of sales of investments available for sale receivable in period $ 1 $ (3) $ 3Change in purchases of investments available for sale payable in period (1) (2) (9)Change in treasury stock purchases payable in period (1) 1 —Change in accrued dividends payable in period 2 2 (1)Lease liabilities recognized in exchange for lease right-of-use assets 36 — —Remeasurement of lease liabilities 101 — —Liabilities assumed in connection with acquisitions:
Fair value of assets acquired $ 1 $ 50 $ 595Less: Total purchase price 1 33 481
Liabilities and noncontrolling interests assumed $ — $ 17 $ 114
Note Q. Financial Instruments with Off-Balance Sheet Risk and Concentration of Risk
Title
In the normal course of business we and certain of our subsidiaries enter into off-balance sheet credit arrangements associated with certain aspects of the title insurance business and other activities.
We generate a significant amount of title insurance premiums in Texas, California, Florida and New York. Title insurance premiums as a percentage of the total title insurance premiums written from those four states are detailed as follows:
2019 2018 2017
California 14.3% 13.9% 14.5%Texas 13.8% 14.4% 14.2%Florida 9.2% 8.8% 8.0%New York 5.8% 6.3% 6.3%
Financial instruments that potentially subject us to concentrations of credit risk consist primarily of cash equivalents, short-term investments, and trade receivables.
We place cash equivalents and short-term investments with high credit quality financial institutions and, by policy, limit the amount of credit exposure with any one financial institution. Investments in commercial paper of industrial firms and financial institutions are rated investment grade by nationally recognized rating agencies.
Concentrations of credit risk with respect to trade receivables are limited because a large number of geographically diverse customers make up our customer base, thus spreading the trade receivables credit risk. We control credit risk through monitoring procedures.
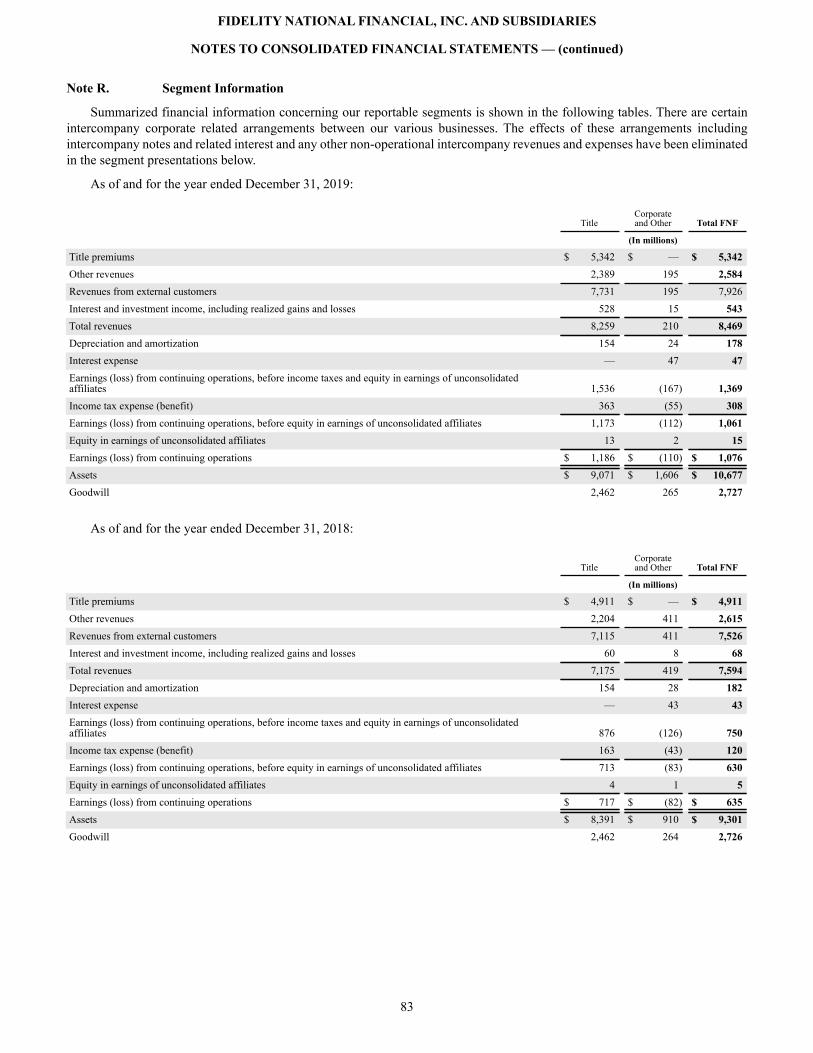
FIDELITY NATIONAL FINANCIAL, INC. AND SUBSIDIARIES
NOTES TO CONSOLIDATED FINANCIAL STATEMENTS — (continued)
83
Note R. Segment Information
Summarized financial information concerning our reportable segments is shown in the following tables. There are certain intercompany corporate related arrangements between our various businesses. The effects of these arrangements including intercompany notes and related interest and any other non-operational intercompany revenues and expenses have been eliminated in the segment presentations below.
As of and for the year ended December 31, 2019:
TitleCorporateand Other Total FNF
(In millions)
Title premiums $ 5,342 $ — $ 5,342Other revenues 2,389 195 2,584Revenues from external customers 7,731 195 7,926Interest and investment income, including realized gains and losses 528 15 543Total revenues 8,259 210 8,469Depreciation and amortization 154 24 178Interest expense — 47 47Earnings (loss) from continuing operations, before income taxes and equity in earnings of unconsolidatedaffiliates 1,536 (167) 1,369Income tax expense (benefit) 363 (55) 308Earnings (loss) from continuing operations, before equity in earnings of unconsolidated affiliates 1,173 (112) 1,061Equity in earnings of unconsolidated affiliates 13 2 15Earnings (loss) from continuing operations $ 1,186 $ (110) $ 1,076Assets $ 9,071 $ 1,606 $ 10,677Goodwill 2,462 265 2,727
As of and for the year ended December 31, 2018:
TitleCorporateand Other Total FNF
(In millions)
Title premiums $ 4,911 $ — $ 4,911Other revenues 2,204 411 2,615Revenues from external customers 7,115 411 7,526Interest and investment income, including realized gains and losses 60 8 68Total revenues 7,175 419 7,594Depreciation and amortization 154 28 182Interest expense — 43 43Earnings (loss) from continuing operations, before income taxes and equity in earnings of unconsolidatedaffiliates 876 (126) 750Income tax expense (benefit) 163 (43) 120Earnings (loss) from continuing operations, before equity in earnings of unconsolidated affiliates 713 (83) 630Equity in earnings of unconsolidated affiliates 4 1 5Earnings (loss) from continuing operations $ 717 $ (82) $ 635Assets $ 8,391 $ 910 $ 9,301Goodwill 2,462 264 2,726
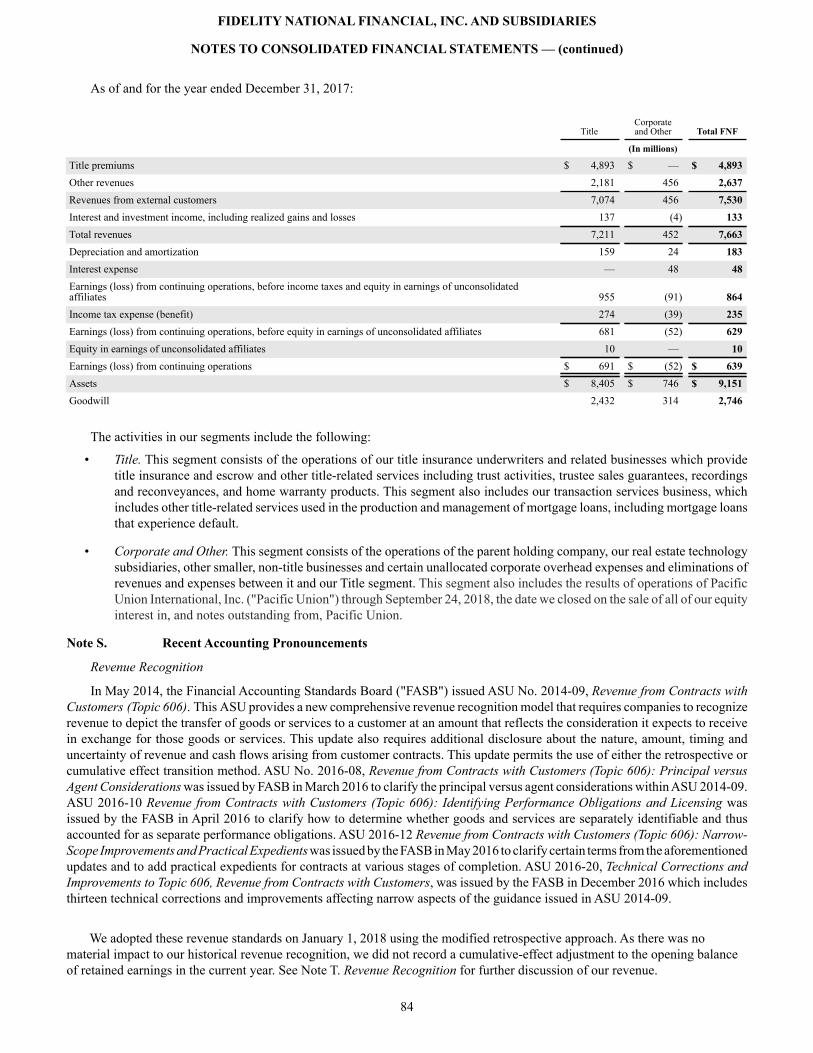
FIDELITY NATIONAL FINANCIAL, INC. AND SUBSIDIARIES
NOTES TO CONSOLIDATED FINANCIAL STATEMENTS — (continued)
84
As of and for the year ended December 31, 2017:
TitleCorporateand Other Total FNF
(In millions)
Title premiums $ 4,893 $ — $ 4,893Other revenues 2,181 456 2,637Revenues from external customers 7,074 456 7,530Interest and investment income, including realized gains and losses 137 (4) 133Total revenues 7,211 452 7,663Depreciation and amortization 159 24 183Interest expense — 48 48Earnings (loss) from continuing operations, before income taxes and equity in earnings of unconsolidatedaffiliates 955 (91) 864Income tax expense (benefit) 274 (39) 235Earnings (loss) from continuing operations, before equity in earnings of unconsolidated affiliates 681 (52) 629Equity in earnings of unconsolidated affiliates 10 — 10Earnings (loss) from continuing operations $ 691 $ (52) $ 639Assets $ 8,405 $ 746 $ 9,151Goodwill 2,432 314 2,746
The activities in our segments include the following:
• Title. This segment consists of the operations of our title insurance underwriters and related businesses which provide title insurance and escrow and other title-related services including trust activities, trustee sales guarantees, recordings and reconveyances, and home warranty products. This segment also includes our transaction services business, which includes other title-related services used in the production and management of mortgage loans, including mortgage loans that experience default.
• Corporate and Other. This segment consists of the operations of the parent holding company, our real estate technology subsidiaries, other smaller, non-title businesses and certain unallocated corporate overhead expenses and eliminations of revenues and expenses between it and our Title segment. This segment also includes the results of operations of Pacific Union International, Inc. ("Pacific Union") through September 24, 2018, the date we closed on the sale of all of our equity interest in, and notes outstanding from, Pacific Union.
Note S. Recent Accounting Pronouncements
Revenue Recognition
In May 2014, the Financial Accounting Standards Board ("FASB") issued ASU No. 2014-09, Revenue from Contracts with Customers (Topic 606). This ASU provides a new comprehensive revenue recognition model that requires companies to recognize revenue to depict the transfer of goods or services to a customer at an amount that reflects the consideration it expects to receive in exchange for those goods or services. This update also requires additional disclosure about the nature, amount, timing and uncertainty of revenue and cash flows arising from customer contracts. This update permits the use of either the retrospective or cumulative effect transition method. ASU No. 2016-08, Revenue from Contracts with Customers (Topic 606): Principal versus Agent Considerations was issued by FASB in March 2016 to clarify the principal versus agent considerations within ASU 2014-09. ASU 2016-10 Revenue from Contracts with Customers (Topic 606): Identifying Performance Obligations and Licensing was issued by the FASB in April 2016 to clarify how to determine whether goods and services are separately identifiable and thus accounted for as separate performance obligations. ASU 2016-12 Revenue from Contracts with Customers (Topic 606): Narrow-Scope Improvements and Practical Expedients was issued by the FASB in May 2016 to clarify certain terms from the aforementioned updates and to add practical expedients for contracts at various stages of completion. ASU 2016-20, Technical Corrections and Improvements to Topic 606, Revenue from Contracts with Customers, was issued by the FASB in December 2016 which includes thirteen technical corrections and improvements affecting narrow aspects of the guidance issued in ASU 2014-09.
We adopted these revenue standards on January 1, 2018 using the modified retrospective approach. As there was no material impact to our historical revenue recognition, we did not record a cumulative-effect adjustment to the opening balance of retained earnings in the current year. See Note T. Revenue Recognition for further discussion of our revenue.
FIDELITY NATIONAL FINANCIAL, INC. AND SUBSIDIARIES
NOTES TO CONSOLIDATED FINANCIAL STATEMENTS — (continued)
85
Leases
In February 2016, the FASB issued ASU No. 2016-02 Leases (Topic 842). The amendments in this ASU introduce broad changes to the accounting and reporting for leases by lessees. The main provisions of the new standard include: clarifications to the definitions of a lease, components of leases, and criteria for determining lease classification; requiring virtually all leased assets, including operating leases and related liabilities resulting from applying the fair value measurement, to be reflected on the lessee's balance sheet; and expanding and adding to the required disclosures for lessees. This update is effective for annual and interim periods beginning after December 15, 2018, including interim periods within those fiscal years. Early application of the standard is permitted. The ASU allows for a modified retrospective approach to transitioning which allows for the use of practical expedients to effectively account for leases commenced prior to the effective date in accordance with previous GAAP. In July 2018, the FASB issued ASU 2018-11 Leases (Topic 842): Targeted Improvements which allows entities the option to adopt this standard prospectively with a cumulative-effect adjustment to opening equity and include required disclosures for prior periods.
We adopted Topic 842 on January 1, 2019 using a modified retrospective approach and recorded lease right-of-use assets ("Lease assets") of $421 million and liabilities for future discounted lease payment obligations ("Lease Liabilities") of $437 millionat the date of adoption. The adoption also resulted in a decrease of $9 million and $25 million to our Prepaid expenses and other assets and Accounts payable and accrued liabilities, respectively. There was no impact to opening equity as a result of the adoption.We elected to apply the following package of practical expedients on a consistent basis permitting entities not to reassess: (i) whether any expired or existing contracts are or contain a lease; (ii) lease classification for any expired or existing leases and (iii) whether initial direct costs for any expired or existing leases qualify for capitalization under the amended guidance.
Other Pronouncements
In January 2016, the FASB issued ASU No. 2016-01 Financial Instruments - Overall (Subtopic 825-10): Recognition and Measurement of Financial Assets and Financial Liabilities. The primary amendments required by the ASU include: requiring equity investments with readily determinable fair values to be measured at fair value through net income rather than through other comprehensive income; allowing entities with equity investments without readily determinable fair values to report the investments at cost, adjusted for changes in observable prices, less impairment; requiring entities that elect the fair value option for financial liabilities to report the change in fair value attributable to instrument-specific credit risk in other comprehensive income; and clarifying that entities should assess the need for a valuation allowance on a deferred tax asset related to available-for-sale debt securities in combination with other deferred tax assets. The amendments in this ASU are effective for fiscal years beginning after December 15, 2017, including interim periods within those fiscal years. The ASU requires a cumulative-effect adjustment of the balance sheet as of the beginning of the year of adoption.
We adopted this new guidance on January 1, 2018, which resulted in the reclassification of our unrealized gains and losses on our equity and preferred securities available for sale previously included in accumulated other comprehensive income to beginning retained earnings. Changes in the fair value of our investments in equity and preferred securities subsequent to January 1, 2018 are now included in Realized gains and losses, net in our Consolidated Statements of Earnings. See Note D. Investments for further details. We reclassified a total of $109 million from Accumulated other comprehensive income to beginning Retained earnings as of January 1, 2018. The total cumulative effect on opening equity, including an increase in Retained earnings of $19 million attributable to an increase in value of certain Other long term investments resulting from recording at fair value, was an increase in Retained earnings of $128 million and decrease in Accumulated other comprehensive income of $109 million.
In November 2016, the FASB issued ASU No. 2016-18 Statement of Cash Flows (Topic 230): Restricted Cash. The amendments in this ASU require that a statement of cash flows explain the change during the period in the total of cash, cash equivalents, and amounts generally described as restricted cash or restricted cash equivalents. GAAP previously did not include specific guidance on the cash flow classification and presentation of changes in restricted cash. The Company previously excluded cash pledged related to secured trust deposits, which generally meets the definition of restricted cash, from the reconciliation of beginning-of-period to end-of-period total amounts shown on the statement of cash flows. This update is effective for annual periods beginning after December 15, 2017, including interim periods within those fiscal years. The ASU requires retrospective application to all prior periods presented upon adoption.
We adopted this ASU on January 1, 2018 and have retrospectively restated our Consolidated Statements of Cash Flows included herein. The adoption of this ASU resulted in the following retrospective changes to our Consolidated Statements of Cash Flows for the year ended December 31, 2017: an increase in the net change in cash and cash equivalents of $144 million due to the inclusion of the change in our cash pledged against secured trust deposits; an increase in cash provided by investing activities of $174 million related to the movement of cash paid/received for investments pledged against secured trust deposits from operating to investing activities; and an increase in cash used in financing activities of $30 million related to the movement of the change in secured trust deposits from operating to financing activities.
FIDELITY NATIONAL FINANCIAL, INC. AND SUBSIDIARIES
NOTES TO CONSOLIDATED FINANCIAL STATEMENTS — (continued)
86
In February 2018, the FASB issued ASU No. 2018-02 Income Statement—Reporting Comprehensive Income (Topic 220): Reclassification of Certain Tax Effects from Accumulated Other Comprehensive Income. The amendments in this ASU allow a reclassification from accumulated other comprehensive income to retained earnings for stranded tax effects resulting from Tax Reform. We adopted this ASU on April 1, 2018. Adoption of this ASU resulted in no net reclassification from Accumulated other comprehensive loss to Retained earnings.
Other Pronouncements Not Yet AdoptedIn June 2016, the FASB issued ASU No. 2016-13 Financial Instruments - Credit Losses: Measurement of Credit Losses on
Financial Instruments (Topic 326). The amendments in this and the related ASUs introduce broad changes to accounting for credit impairment of financial instruments. The primary updates include the introduction of a new current expected credit loss ("CECL") model that is based on expected rather than incurred losses and amendments to the accounting for impairment of fixed maturity securities available for sale. This update is effective for annual periods beginning after December 15, 2019, including interim periods within those fiscal years. We are finalizing the effect this new guidance will have on our Consolidated Financial Statements and related disclosures. Based on our implementation analysis performed, we have concluded that the overall effect of Topic 326 is not expected to be material to the Consolidated Financial Statements upon adoption. We did not early adopt this standard.
In January 2017, the FASB issued ASU 2017-04 Intangibles - Goodwill and Other (Topic 350): Simplifying the Test for Goodwill Impairment. The guidance simplifies the measurement of goodwill impairment by removing step 2 of the goodwill impairment test, which requires the determination of the fair value of individual assets and liabilities of a reporting unit. The new guidance requires goodwill impairment to be measured as the amount by which a reporting unit’s carrying value exceeds its fair value; however, the loss recognized should not exceed the total amount of goodwill allocated to that reporting unit. The amendments should be applied on a prospective basis. The new standard is effective for fiscal years beginning after December 15, 2019. We do not expect this guidance to have a material impact on our consolidated financial statements and related disclosures and did not early adopt this standard.
In December 2019, the FASB issued ASU 2019-12 Income Taxes - Simplifying the Accounting for Income Taxes (Topic 740), which simplifies various aspects of the income tax accounting guidance and will be applied using different approaches depending on what the specific amendment relates to and, for public entities, are effective for fiscal years, and interim periods within those fiscal years, beginning after December 15, 2020. Early adoption is permitted. We do not expect this guidance to have a material impact on our Consolidated Financial Statements and related disclosures upon adoption.

FIDELITY NATIONAL FINANCIAL, INC. AND SUBSIDIARIES
NOTES TO CONSOLIDATED FINANCIAL STATEMENTS — (continued)
87
Note T — Revenue Recognition
On January 1, 2018, we adopted ASC Topic 606 by applying the modified retrospective method. Results for reporting periods beginning after January 1, 2018 are presented under Topic 606, while prior period amounts are not adjusted and continue to be reported under the accounting standards in effect for the prior period.
The adoption of ASC Topic 606 did not have an impact on the recognition of our primary sources of revenue, direct and agency title premiums, as those revenue streams are subject to the accounting and reporting requirements under ASC Topic 944. Timing of recognition of substantially all of our remaining revenue was also not impacted and we therefore did not record any cumulative effect adjustment to opening equity.
Disaggregation of Revenue
Our revenue consists of:
Year ended December 31,
2019 2018
Revenue Stream Income Statement Classification Segment Total RevenueRevenue from insurance contracts: (in millions)
Direct title insurance premiums Direct title insurance premiums Title $ 2,381 $ 2,221
Agency title insurance premiums Agency title insurance premiums Title 2,961 2,690Home warranty Escrow, title-related and other fees Title 177 182
Total revenue from insurance contracts 5,519 5,093
Revenue from contracts with customers:Escrow fees Escrow, title-related and other fees Title 899 826Other title-related fees and income Escrow, title-related and other fees Title 639 600ServiceLink, excluding title premiums, escrow fees,and subservicing fees Escrow, title-related and other fees Title 389 379Real estate brokerage Escrow, title-related and other fees Corporate and other 39 316Real estate technology Escrow, title-related and other fees Corporate and other 110 101Other Escrow, title-related and other fees Corporate and other 46 (6)
Total revenue from contracts with customers 2,122 2,216Other revenue:
Loan subservicing revenue Escrow, title-related and other fees Title 285 217Interest and investment income Interest and investment income Various 225 177Realized gains and losses, net Realized gains and losses, net Various 318 (109)
Total revenues Total revenues 8,469 7,594
Our Direct title insurance premiums are recognized as revenue at a point-in-time upon of closing of the underlying real estate transaction as the earnings process is then considered complete. Regulation of title insurance rates varies by state. Premiums are charged to customers based on rates predetermined in coordination with each state's respective Department of Insurance. Cash associated with such revenue is typically collected at closing of the underlying real estate transaction.
Premium revenues from agency title operations is primarily comprised of premiums recognized when the underlying title order and real estate transaction closing, if applicable, are complete and reported to us. Premium revenues from agency title operations also include an accrual for premiums which have not yet been reported to us, which is estimated based on historical information.
Revenues from our home warranty business are generated from insurance contracts with customers to provide warranty for major home appliances. Substantially all of our home warranty contracts are one year in length and revenue is recognized over the term of the contract.
Escrow fees and Other title-related fees and income in our Title segment are closely related to Direct title insurance premiums and are primarily associated with managing the closing of real estate transactions including the processing of funds on behalf of the transaction participants, gathering and recording the required closing documents, providing notary and home inspection services,
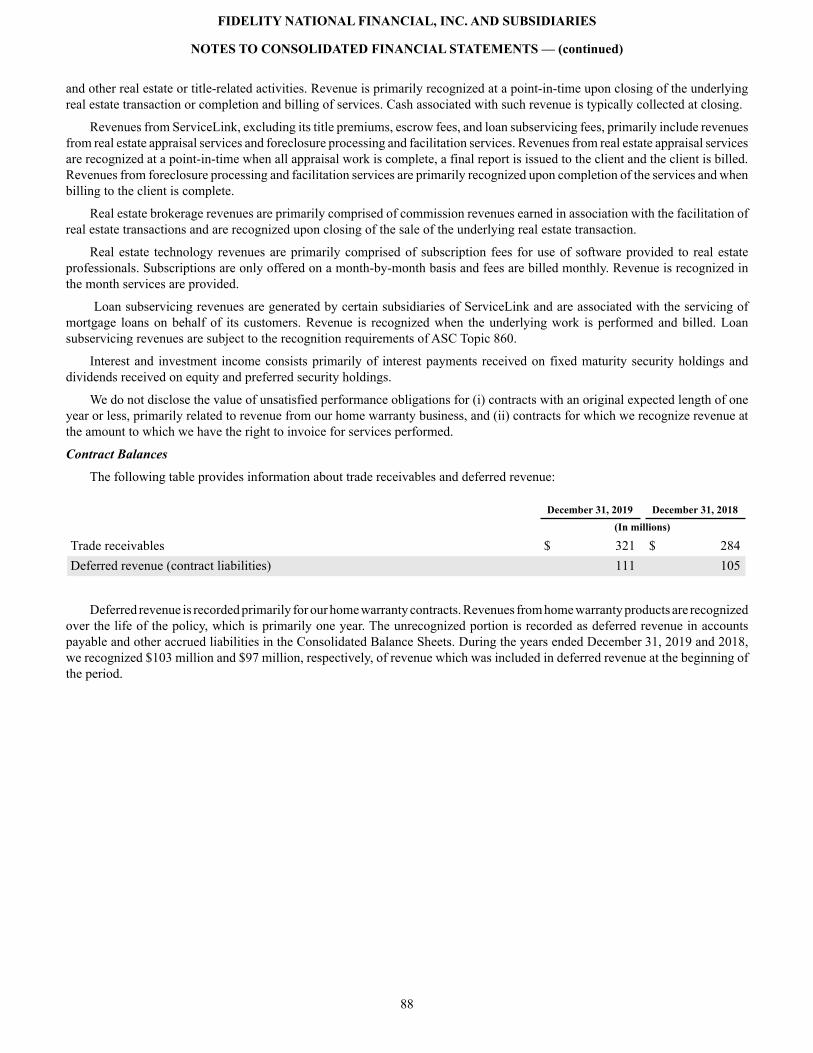
FIDELITY NATIONAL FINANCIAL, INC. AND SUBSIDIARIES
NOTES TO CONSOLIDATED FINANCIAL STATEMENTS — (continued)
88
and other real estate or title-related activities. Revenue is primarily recognized at a point-in-time upon closing of the underlying real estate transaction or completion and billing of services. Cash associated with such revenue is typically collected at closing.
Revenues from ServiceLink, excluding its title premiums, escrow fees, and loan subservicing fees, primarily include revenues from real estate appraisal services and foreclosure processing and facilitation services. Revenues from real estate appraisal services are recognized at a point-in-time when all appraisal work is complete, a final report is issued to the client and the client is billed. Revenues from foreclosure processing and facilitation services are primarily recognized upon completion of the services and when billing to the client is complete.
Real estate brokerage revenues are primarily comprised of commission revenues earned in association with the facilitation of real estate transactions and are recognized upon closing of the sale of the underlying real estate transaction.
Real estate technology revenues are primarily comprised of subscription fees for use of software provided to real estate professionals. Subscriptions are only offered on a month-by-month basis and fees are billed monthly. Revenue is recognized in the month services are provided.
Loan subservicing revenues are generated by certain subsidiaries of ServiceLink and are associated with the servicing of mortgage loans on behalf of its customers. Revenue is recognized when the underlying work is performed and billed. Loan subservicing revenues are subject to the recognition requirements of ASC Topic 860.
Interest and investment income consists primarily of interest payments received on fixed maturity security holdings and dividends received on equity and preferred security holdings.
We do not disclose the value of unsatisfied performance obligations for (i) contracts with an original expected length of one year or less, primarily related to revenue from our home warranty business, and (ii) contracts for which we recognize revenue at the amount to which we have the right to invoice for services performed.
Contract Balances
The following table provides information about trade receivables and deferred revenue:
December 31, 2019 December 31, 2018 (In millions)
Trade receivables $ 321 $ 284Deferred revenue (contract liabilities) 111 105
Deferred revenue is recorded primarily for our home warranty contracts. Revenues from home warranty products are recognized over the life of the policy, which is primarily one year. The unrecognized portion is recorded as deferred revenue in accounts payable and other accrued liabilities in the Consolidated Balance Sheets. During the years ended December 31, 2019 and 2018, we recognized $103 million and $97 million, respectively, of revenue which was included in deferred revenue at the beginning of the period.
Table of Contents
89
Item 9. Changes in and Disagreements with Accountants on Accounting and Financial Disclosure
None.
Item 9A. Controls and Procedures
As of the end of the year covered by this report, we carried out an evaluation, under the supervision and with the participation of our principal executive officer and principal financial officer, of the effectiveness of the design and operation of our disclosure controls and procedures as such term is defined in Rule 13a-15(e) or 15d-15(e) under the Exchange Act. Based on this evaluation, our principal executive officer and principal financial officer concluded that our disclosure controls and procedures are effective to ensure that information required to be disclosed by the Company in the reports that we file or submit under the Act is: (a) recorded, processed, summarized and reported, within the time periods specified in the Commission’s rules and forms; and (b) accumulated and communicated to management, including our principal executive and principal financial officers, as appropriate to allow timely decisions regarding required disclosure.
There were no changes in our internal control over financial reporting that occurred during the quarter ended December 31, 2019 that have materially affected, or are reasonably likely to materially affect, our internal control over financial reporting.
MANAGEMENT’S REPORT ON INTERNAL CONTROL OVER FINANCIAL REPORTING
Management is responsible for establishing and maintaining adequate internal control over financial reporting, as such term is defined in Exchange Act Rule 13a-15(f) or 15d-15(f). Under the supervision and with the participation of our management, including our principal executive officer and principal financial officer, we conducted an evaluation of the effectiveness of our internal control over financial reporting. Management has adopted the framework in Internal Control-Integrated Framework (2013) issued by the Committee of Sponsoring Organizations of the Treadway Commission (COSO). Based on our evaluation under this framework, our management concluded that our internal control over financial reporting was effective as of December 31, 2019. The effectiveness of our internal control over financial reporting as of December 31, 2019 has been audited by Ernst & Young LLP, an independent registered public accounting firm, as stated in their report which is included herein.
Item 9B. Other Information
None.

Table of Contents
90
PART III
Items 10-14.
Within 120 days after the close of our fiscal year, we intend to file with the Securities and Exchange Commission the matters required by these items.

Table of Contents
91
PART IV
Item 15. Exhibits, Financial Statement Schedules and Reports on Form 8-K
(a) (1) Financial Statements. The following is a list of the Consolidated Financial Statements of Fidelity National Financial, Inc. and its subsidiaries included in Item 8 of Part II:
Report of Independent Registered Public Accounting Firm on Effectiveness of Internal Control over Financial ReportingReport of Independent Registered Public Accounting Firm on Financial StatementsConsolidated Balance Sheets as of December 31, 2019 and 2018Consolidated Statements of Earnings for the years ended December 31, 2019, 2018 and 2017Consolidated Statements of Comprehensive Earnings for the years ended December 31, 2019, 2018 and 2017Consolidated Statements of Equity for the years ended December 31, 2019, 2018 and 2017Consolidated Statements of Cash Flows for the years ended December 31, 2019, 2018 and 2017Notes to Consolidated Financial Statements
(a) (2) Financial Statement Schedules. The following is a list of financial statement schedules filed as part of this annual report on Form 10-K:
Schedule II: Fidelity National Financial, Inc. (Parent Company Financial Statements)
All other schedules are omitted because they are not applicable or not required, or because the required information is included in the Consolidated Financial Statements or notes thereto.
4445474850515354
97

Table of Contents
92
(a) (3) The following exhibits are incorporated by reference or are set forth on pages to this Form 10-K:
ExhibitNumber Description
2.1 Reorganization Agreement, dated as of June 8, 2017, by and among Fidelity National Financial, Inc., Black Knight Holdings, Inc., and New BKH Corp. (incorporated by reference to Exhibit 2.1 to the Registrant’s Current Report on Form 8-K filed on June 9, 2017)
2.2 Agreement and Plan of Merger, dated as of June 8, 2017, by and among Fidelity National Financial, Inc., New BKH Corp., Black Knight Financial Services, Inc., Black Knight Holdco Corp., New BKH Merger Sub, Inc., and BKFS Merger Sub, Inc. (incorporated by reference to Exhibit 2.2 to the Registrant’s Current Report on Form 8-K filed on June 9, 2017)
2.3 Reorganization Agreement, dated as of November 17, 2017, by and between Fidelity National Financial, Inc. and Cannae Holdings, Inc. (incorporated by reference to Exhibit 2.1 to the Registrant’s Current Report on Form 8-K filed on November 20, 2017)
2.4 Agreement and Plan of Merger, dated February 7, 2020, by and between FGL Holdings, Fidelity National Financial, Inc., F Corp I and F Corp II. (incorporated by reference to Exhibit 2.1 to the Registrant's Current Report on Form 8-K filed on February 7, 2020)
3.1 Fifth Amended and Restated Certificate of Incorporation (incorporated by reference to Exhibit 3.1 to the Company's Current Report on Form 8-K filed on June 13, 2018)
3.2 Fourth Amended and Restated Bylaws of Fidelity National Financial, Inc., February 1, 2017 (incorporated by reference to Exhibit 3.1 to Fidelity National Financial, Inc.’s Current Report on Form 8-K, dated February 2, 2017)
4.1 Indenture between the Registrant and The Bank of New York Trust Company, N.A., dated December 8, 2005 (incorporated by reference to Exhibit 4.1 to the Registrant’s Annual Report on Form 10-K for the year ended December 31, 2005)
4.2 First Supplemental Indenture between the Registrant and the Bank of New York Trust Company, N.A., dated as of January 6, 2006 (incorporated by reference to Exhibit 4.1 to the Registrant’s Current Report on Form 8-K filed on January 24, 2006)
4.3 Second Supplemental Indenture, dated May 5, 2010, between the Registrant and The Bank of New York Mellon Trust Company, N.A. (incorporated by reference to Exhibit 4.1 to the Registrant's Current Report on Form 8-K filed on May 5, 2010)
4.4 Officers’ Certificate, dated August 28, 2012, pursuant to the Indenture dated December 8, 2005, as supplemented by the First Supplemental Indenture dated as of January 6, 2006 and as further supplemented by the Second Supplemental Indenture dated as of May 5, 2010 (incorporated by reference to Exhibit 4.1 to the Registrant's Current Report on Form 8-K filed on August 28, 2012)
4.5 Form of Subordinated Indenture between the Registrant and the Bank of New York Trust Company, N.A. (incorporated by reference to Exhibit 4.2 (A) to the Registrant’s Registration Statement on Form S-3 filed on November 14, 2007)
4.6 Fourth Supplemental Indenture, dated August 13, 2018, between the Registrant and The Bank of New York Mellon Trust Company, N.A. (incorporated by reference to Exhibit 4.4 to the Registrant's Current Report on Form 8-K filed on August 13, 2018)
4.7 Form of 4.50% Senior Note of the Registrant due 2028 (incorporated by reference to Exhibit A to Exhibit 4.4 to the Registrant's Current Report on Form 8-K filed on August 13, 2018).
4.8 Specimen certificate for shares of the Registrant’s FNF Group common stock, par value $0.0001 per Share (incorporated by reference to Exhibit 4.1 to the Registrant’s Registration Statement on Form S-4/A filed on May 5, 2014)
4.9 Description of FNF Common Stock10.1 Fourth Amended and Restated Credit Agreement, dated as of April 27, 2017, by and among Fidelity National Financial,
Inc., a Delaware corporation, as the borrower, Bank of America, N.A., as administrative agent, the other agents party thereto and the financial institutions party thereto as lenders (incorporated by reference to Exhibit 10.2 to the Registrant's Current Report on Form 8-K filed on May 2, 2017)
10.2 Amended and Restated Fidelity National Financial, Inc. 2005 Omnibus Incentive Plan (incorporated by reference to Annex A to the Registrant’s Schedule 14A filed on April 29, 2016) (1)
10.3 Amended and Restated Fidelity National Financial, Inc. 2013 Employee Stock Purchase Plan (incorporated by reference to Exhibit 10.3 to the Registrant's Annual Report on Form 10-K for the year ended December 31, 2018) (1)
10.4 Fidelity National Financial, Inc. Annual Incentive Plan (incorporated by reference to Annex B to the Registrant's Schedule 14A filed on April 29, 2016) (1)

Table of Contents
93
ExhibitNumber Description
10.5 Fidelity National Financial, Inc. Deferred Compensation Plan, as amended and restated, effective January 1, 2009 (incorporated by reference to Exhibit 10.18 to the Registrant’s Annual Report on Form 10-K for the year ended December 31, 2008) (1)
10.6 Form of Notice of FNF Group Stock Option Award and FNF Group Stock Option Award Agreement under Amended and Restated Fidelity National Financial, Inc. 2005 Omnibus Incentive Plan for October 2015 Awards (incorporated by reference to Exhibit 10.12 to Registrant's Annual Report on Form 10-K for the year ended December 31, 2015)(1)
10.7 Form of Notice of Stock Option Award and Stock Option Award Agreement under Amended and Restated Fidelity National Financial, Inc. 2005 Omnibus Incentive Plan for November 2013 Awards (incorporated by reference to Exhibit 10.12 to the Registrant’s Annual Report on Form 10-K for the year ended December 31, 2013)(1)
10.8 Form of Notice of Stock Option Grant and Stock Option Award Agreement under Amended and Restated Fidelity National Financial, Inc. 2005 Omnibus Incentive Plan (incorporated by reference to Exhibit 10.10 to the Registrant's Annual Report on Form 10-K for the year ended December 31, 2012) (1)
10.9 Amended and Restated Employment Agreement between the Registrant and Anthony J. Park, effective as of October 10, 2008 (incorporated by reference to Exhibit 10.11 to Registrant’s Annual Report on Form 10-K for the year ended December 31, 2008) (1)
10.10 Amendment effective February 4, 2010 to Amended and Restated Employment Agreement between the Registrant and Anthony J. Park, effective as of October 10, 2008 (incorporated by reference to Exhibit 10.13 to the Registrant's Annual Report on Form 10-K for the year ended December 31, 2009) (1)
10.11 Amendment effective as of July 1, 2012 to Amended and Restated Employment Agreement between the Registrant and Brent B. Bickett (incorporated by reference to Exhibit 10.1 to the Registrant’s Quarterly Report on Form 10-Q for the quarter ended June 30, 2012)(1)
10.12 Amendment effective as of January 1, 2012 to Amended and Restated Employment Agreement between the Registrant and Brent B. Bickett (incorporated by reference to Exhibit 10.16 to the Registrant’s Annual Report on Form 10-K for the year ended December 31, 2011)(1)
10.13 Amendment effective February 4, 2010 to Amended and Restated Employment Agreement between the Registrant and Brent B. Bickett (incorporated by reference to Exhibit 10.15 to the Registrant’s Annual Report on Form 10-K for the year ended December 31, 2009)(1)
10.14 Amended and Restated Employment Agreement between the Registrant and Brent B. Bickett, effective July 2, 2008 (incorporated by reference to Exhibit 10.17 to the Registrants Annual Report on Form 10-K for the year ended December 31, 2017) (1)
10.15 Director Services Agreement between Fidelity National Financial, Inc. and William P. Foley, II (incorporated by reference to Exhibit 10.27 to Registrant's Annual Report on Form 10-K for the year ended December 31, 2015) (1)
10.16 Amended and Restated Employment Agreement between the Registrant and Raymond R. Quirk, effective as of October 10, 2008 (incorporated by reference to Exhibit 10.16 to Registrant’s Annual Report on Form 10-K for the year ended December 31, 2008)(1)
10.17 Amendment effective February 4, 2010 to Amended and Restated Employment Agreement between the Registrant and Raymond R. Quirk, effective as of October 10, 2008 (incorporated by reference to Exhibit 10.21 to the Registrant's Annual Report on Form 10-K for the year ended December 31, 2009) (1)
10.18 Amended and Restated Employment Agreement between the Registrant and Michael L. Gravelle, effective as of January 30, 2013 (incorporated by reference to Exhibit 10.22 to the Registrant's Annual Report on Form 10-K for the year ended December 31, 2012) (1)
10.19 Amendment No. 2 to Amended and Restated Employment Agreement between the Registrant and Michael L. Gravelle, effective as of March 1, 2015 (incorporated by reference to Exhibit 10.2 to the Registrant’s Quarterly Report on Form 10-Q for the quarter ended March 31, 2015) (1)
10.20 Amended and Restated Employment Agreement between the Registrant and Peter T. Sadowski, effective as of February 4, 2010 (incorporated by reference to Exhibit 10.26 to the Registrant's Annual Report on Form 10-K for the year ended December 31, 2012) (1)
10.21 ServiceLink Holdings, LLC 2013 Management Incentive Plan (incorporated by reference to Exhibit 10.2 to the Registrant’s Current Report on Form 8-K filed on January 15, 2014)(1)
10.22 Form of ServiceLink Holdings, LLC Unit Grant Agreement (incorporated by reference to Exhibit 10.4 to the Registrant's Current Report on Form 8-K filed on January 15, 2014)(1)

Table of Contents
94
ExhibitNumber Description10.23 ServiceLink Holdings, LLC Incentive Plan (incorporated by reference to Exhibit 10.6 to the to the Registrant’s Current
Report on Form 8-K filed on January 15, 2014) (1)10.24 Amendment effective May 3, 2016 to Director Services Agreement between the Registrant and William P. Foley II
(incorporated by reference to Exhibit 10.1 to Registrant's Quarterly Report on Form 10-Q for the quarter ended June 30, 2016) (1)
10.25 Amendment effective May 3, 2016 to Amended and Restated Employment Agreement between the Registrant and Raymond R. Quirk (incorporated by reference to Exhibit 10.2 to the Registrant's Quarterly Report on Form 10-Q for the quarter ended June 30, 2016) (1)
10.26 Amendment effective May 3, 2016 to Amended and Restated Employment Agreement between the Registrant and Anthony J. Park (incorporated by reference to Exhibit 10.4 to the Registrant's Quarterly Report on Form 10-Q for the quarter ended June 30, 2016) (1)
10.27 Amendment effective May 3, 2016 to Amended and Restated Employment Agreement between the Registrant and Michael L. Gravelle (incorporated by reference to Exhibit 10.5 to the Registrant's Quarterly Report on Form 10-Q for the quarter ended June 30, 2016) (1)
10.28 Amendment effective May 3, 2016 to Amended and Restated Employment Agreement between the Registrant and Peter T. Sadowski (incorporated by reference to Exhibit 10.6 to the Registrant's Quarterly Report on Form 10-Q for the quarter ended June 30, 2016) (1)
10.29 Employment Agreement between the Registrant and Michael Nolan effective March 2, 2016 (incorporated by reference to Exhibit 10.7 to the Registrant's Quarterly Report on Form 10-Q for the quarter ended June 30, 2016) (1)
10.30 Amendment effective May 3, 2016 to Employment Agreement between the Registrant and Michael Nolan (incorporated by reference to Exhibit 10.8 to the Registrant's Quarterly Report on Form 10-Q for the quarter ended June 30, 2016) (1)
10.31 Employment Agreement between the Registrant and Roger Jewkes effective March 3, 2016 (incorporated by reference to Exhibit 10.9 to the Registrant's Quarterly Report on Form 10-Q for the quarter ended June 30, 2016) (1)
10.32 Amendment effective May 3, 2016 to Employment Agreement between the Registrant and Roger Jewkes (incorporated by reference to Exhibit 10.10 to the Registrant's Quarterly Report on Form 10-Q for the quarter ended June 30, 2016) (1)
10.33 Form of Notice of Restricted Stock Grant and FNF Restricted Stock Award Agreement under Amended and Restated Fidelity National Financial, Inc. 2005 Omnibus Incentive Plan for October 2019 Awards (1)
10.34 Form of Notice of FNF Restricted Stock Grant and FNF Restricted Stock Award Agreement under Amended and Restated Fidelity National Financial, Inc. 2005 Omnibus Incentive Plan for October 2018 Awards (incorporated by reference to Exhibit 10.38 to the Registrant's Annual Report on Form 10-K for the year ended December 31, 2018) (1)
10.35 Form of Notice of FNF Group Restricted Stock Grant and FNF Group Restricted Stock Award Agreement under Amended and Restated Fidelity National Financial, Inc. 2005 Omnibus Incentive Plan for October 2017 Awards (incorporated by reference to Exhibit 10.39 to the Registrant's Annual Report on Form 10-K for the year ended December 31, 2017) (1)
10.36 Tax Matters Agreement, dated as of November 17, 2017, by and between Fidelity National Financial, Inc. and Cannae Holdings, Inc. (incorporated by reference to Exhibit 10.1 to the Registrant's Current Report on Form 8-K filed on November 20, 2017)
10.37 Termination Agreement, dated September 9, 2019, among Stewart Information Services Corporation, Fidelity National Financial, Inc., A Holdco Corp. and S Holdco LLC (incorporated by reference to Exhibit 10.1 to the Registrant’s Current Report on Form 8-K filed on September 11, 2019)
10.38 Amendment effective November 1, 2019 to Amended and Restated Employment Agreement between the Registrant and Michael L. Gravelle effective May 3, 2016 (incorporated by reference to Exhibit 10.2 to the Registrant's Quarterly Report on Form 10-Q for the quarter ended September 30, 2019) (1)

Table of Contents
95
ExhibitNumber Description
21.1 Subsidiaries of the Registrant23.1 Consent of Ernst & Young LLP, Independent Registered Public Accounting Firm31.1 Certification of Chief Executive Officer pursuant to Section 302 of the Sarbanes-Oxley Act of 200231.2 Certification of Chief Financial Officer pursuant to Section 302 of the Sarbanes-Oxley Act of 200232.1 Certification by Chief Executive Officer of Periodic Financial Reports pursuant to Section 906 of the Sarbanes-Oxley
Act of 2002, 18 U.S.C. Section 135032.2 Certification by Chief Financial Officer of Periodic Financial Reports pursuant to Section 906 of the Sarbanes-Oxley
Act of 2002, 18 U.S.C. Section 1350101.INS Inline XBRL Instance Document (2)101.SCH Inline XBRL Taxonomy Extension Schema Document101.CAL Inline XBRL Taxonomy Extension Calculation Linkbase Document101.DEF Inline XBRL Taxonomy Extension Definition Linkbase Document101.PRE Inline XBRL Taxonomy Extension Presentation Linkbase Document101.LAB Inline XBRL Taxonomy Extension Label Linkbase Document
104 Cover Page Interactive Data File formatted in Inline XBRL and contained in Exhibit 101
(1) A management or compensatory plan or arrangement required to be filed as an exhibit to this report pursuant to Item 15(c) of Form 10-K (2) The instance document does not appear in the interactive data file because its XBRL tags are embedded within the inline XBRL document.
Item 16. Summary
None.
Table of Contents
96
SIGNATURES
Pursuant to the requirements of Section 13 or 15(d) of the Securities Exchange Act of 1934, the Registrant has duly caused this report to be signed on its behalf by the undersigned, thereunto duly authorized.
Fidelity National Financial, Inc. By: /s/ Raymond R. Quirk
Raymond R. QuirkChief Executive Officer and Director
Date: February 14, 2020
Pursuant to the requirements of the Securities Exchange Act of 1934, this report has been signed below by the followingpersons on behalf of the Registrant and in the capacities and on the dates indicated.
Signature Title Date
/s/ Raymond R. Quirk Chief Executive Officer and Director February 14, 2020Raymond R. Quirk (Principal Executive Officer)
/s/ Anthony J. Park Chief Financial Officer February 14, 2020Anthony J. Park (Principal Financial and Accounting Officer)
/s/ William P. Foley, II Director and Chairman of the Board February 14, 2020William P. Foley, II
/s/ Douglas K. Ammerman Director February 14, 2020Douglas K. Ammerman
/s/ Thomas M. Hagerty Director February 14, 2020Thomas M. Hagerty
/s/ Daniel D. (Ron) Lane Director February 14, 2020Daniel D. (Ron) Lane
/s/ Richard N. Massey Director February 14, 2020Richard N. Massey
/s/ Heather H. Murren Director February 14, 2020Heather H. Murren
/s/ John D. Rood Director February 14, 2020John D. Rood
/s/ Peter O. Shea, Jr. Director February 14, 2020Peter O. Shea, Jr.
/s/ Cary H. Thompson Director February 14, 2020Cary H. Thompson

Table of Contents
97
SCHEDULE II
FIDELITY NATIONAL FINANCIAL, INC.(Parent Company)
BALANCE SHEETS
December 31, 2019 2018 (In millions, except share data)
ASSETSCash $ 565 $ 349Short term investments 564 202Equity securities, at fair value 1 1Investment in unconsolidated affiliates 8 12Notes receivable 498 543Investments in and amounts due from subsidiaries 4,916 4,629Property and equipment, net 2 5Prepaid expenses and other assets 235 11Income taxes receivable — 4
Total assets $ 6,789 $ 5,756LIABILITIES AND EQUITY
Liabilities: Accounts payable and other accrued liabilities $ 275 $ 63Income taxes payable 10 —Deferred tax liability 284 227Notes payable 838 836
Total liabilities 1,407 1,126Equity: FNF common stock, $0.0001 par value; authorized 600,000,000 shares as of December 31, 2019 and 2018; outstanding of 275,563,436 and 275,373,834 as of December 31, 2019 and 2018, respectively; and issued of 292,236,476 and 289,601,523 as of December 31, 2019 and 2018, respectively — —Preferred stock, $0.0001 par value; authorized 50,000,000 shares, issued and outstanding, none — —Additional paid-in capital 4,581 4,500Retained earnings 1,356 641Accumulated other comprehensive earnings (loss) 43 (13)Less: Treasury stock, 16,673,040 shares and 14,227,689 shares as of December 31, 2019 and 2018, respectively, at cost (598) (498)
Total equity of Fidelity National Financial, Inc. common shareholders 5,382 4,630Total liabilities and equity $ 6,789 $ 5,756
See Notes to Financial Statements
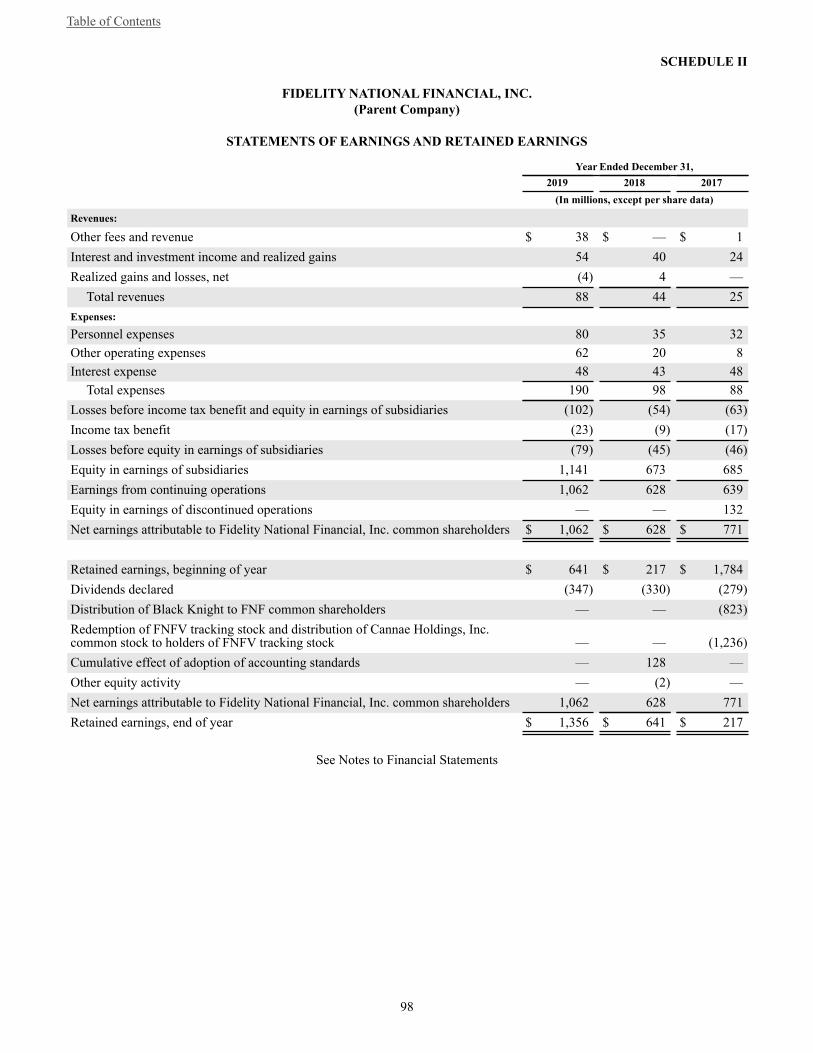
Table of Contents
98
SCHEDULE II
FIDELITY NATIONAL FINANCIAL, INC.(Parent Company)
STATEMENTS OF EARNINGS AND RETAINED EARNINGS
Year Ended December 31, 2019 2018 2017 (In millions, except per share data)
Revenues: Other fees and revenue $ 38 $ — $ 1Interest and investment income and realized gains 54 40 24Realized gains and losses, net (4) 4 —
Total revenues 88 44 25Expenses: Personnel expenses 80 35 32Other operating expenses 62 20 8Interest expense 48 43 48
Total expenses 190 98 88Losses before income tax benefit and equity in earnings of subsidiaries (102) (54) (63)Income tax benefit (23) (9) (17)Losses before equity in earnings of subsidiaries (79) (45) (46)Equity in earnings of subsidiaries 1,141 673 685Earnings from continuing operations 1,062 628 639Equity in earnings of discontinued operations — — 132Net earnings attributable to Fidelity National Financial, Inc. common shareholders $ 1,062 $ 628 $ 771
Retained earnings, beginning of year $ 641 $ 217 $ 1,784Dividends declared (347) (330) (279)Distribution of Black Knight to FNF common shareholders — — (823)Redemption of FNFV tracking stock and distribution of Cannae Holdings, Inc.common stock to holders of FNFV tracking stock — — (1,236)Cumulative effect of adoption of accounting standards — 128 —Other equity activity — (2) —Net earnings attributable to Fidelity National Financial, Inc. common shareholders 1,062 628 771Retained earnings, end of year $ 1,356 $ 641 $ 217
See Notes to Financial Statements
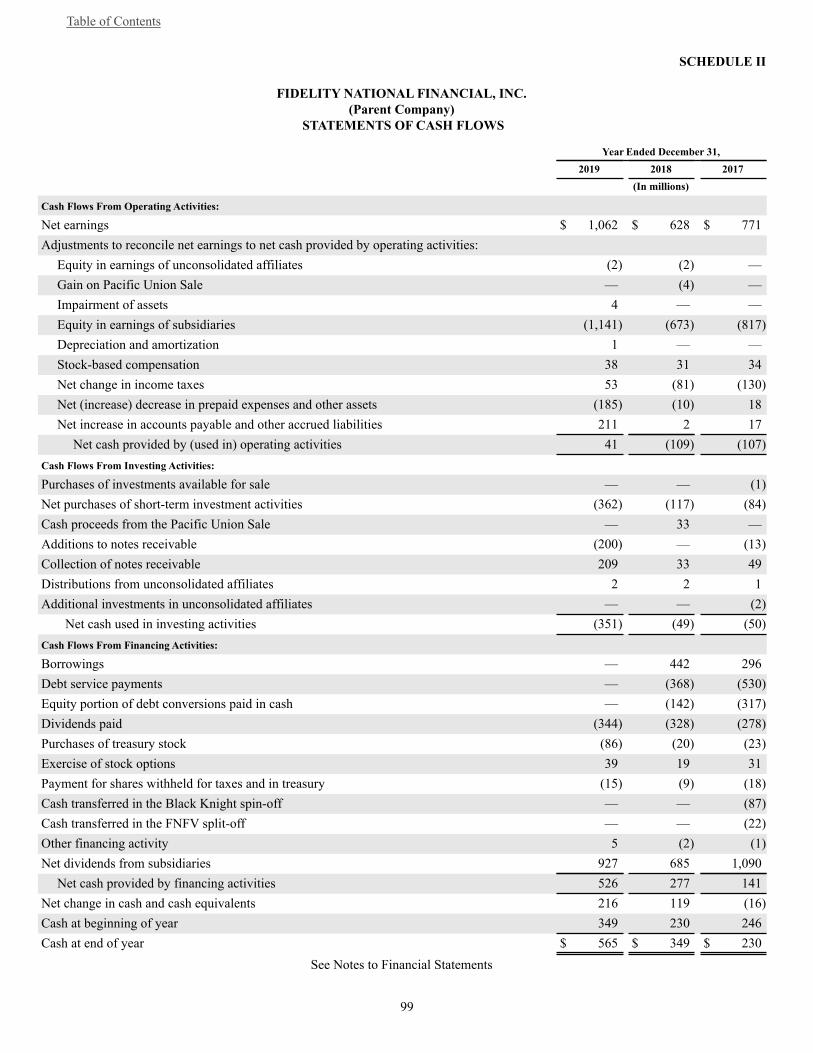
Table of Contents
99
SCHEDULE II
FIDELITY NATIONAL FINANCIAL, INC.(Parent Company)
STATEMENTS OF CASH FLOWS
Year Ended December 31, 2019 2018 2017 (In millions)
Cash Flows From Operating Activities: Net earnings $ 1,062 $ 628 $ 771Adjustments to reconcile net earnings to net cash provided by operating activities:
Equity in earnings of unconsolidated affiliates (2) (2) —Gain on Pacific Union Sale — (4) —Impairment of assets 4 — —Equity in earnings of subsidiaries (1,141) (673) (817)Depreciation and amortization 1 — —Stock-based compensation 38 31 34Net change in income taxes 53 (81) (130)Net (increase) decrease in prepaid expenses and other assets (185) (10) 18Net increase in accounts payable and other accrued liabilities 211 2 17
Net cash provided by (used in) operating activities 41 (109) (107)Cash Flows From Investing Activities: Purchases of investments available for sale — — (1)Net purchases of short-term investment activities (362) (117) (84)Cash proceeds from the Pacific Union Sale — 33 —Additions to notes receivable (200) — (13)Collection of notes receivable 209 33 49Distributions from unconsolidated affiliates 2 2 1Additional investments in unconsolidated affiliates — — (2)
Net cash used in investing activities (351) (49) (50)Cash Flows From Financing Activities: Borrowings — 442 296Debt service payments — (368) (530)Equity portion of debt conversions paid in cash — (142) (317)Dividends paid (344) (328) (278)Purchases of treasury stock (86) (20) (23)Exercise of stock options 39 19 31Payment for shares withheld for taxes and in treasury (15) (9) (18)Cash transferred in the Black Knight spin-off — — (87)Cash transferred in the FNFV split-off — — (22)Other financing activity 5 (2) (1)Net dividends from subsidiaries 927 685 1,090
Net cash provided by financing activities 526 277 141Net change in cash and cash equivalents 216 119 (16)Cash at beginning of year 349 230 246Cash at end of year $ 565 $ 349 $ 230
See Notes to Financial Statements
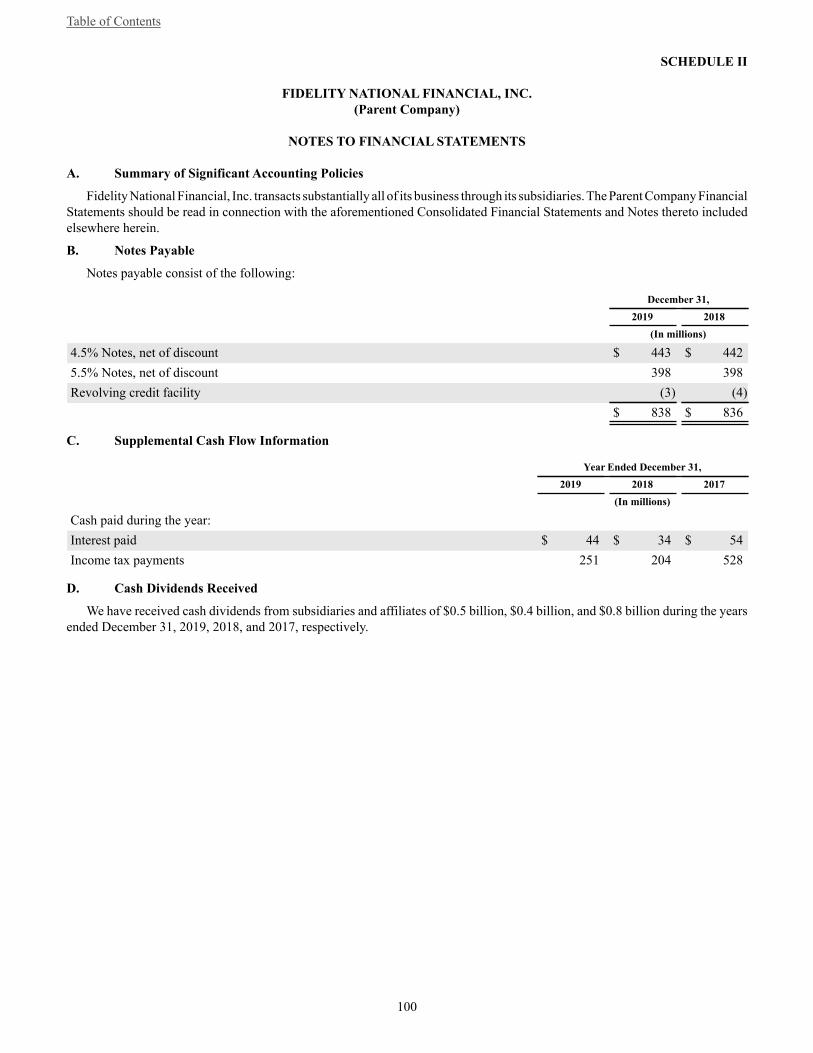
Table of Contents
100
SCHEDULE II
FIDELITY NATIONAL FINANCIAL, INC.(Parent Company)
NOTES TO FINANCIAL STATEMENTS
A. Summary of Significant Accounting Policies
Fidelity National Financial, Inc. transacts substantially all of its business through its subsidiaries. The Parent Company Financial Statements should be read in connection with the aforementioned Consolidated Financial Statements and Notes thereto included elsewhere herein.
B. Notes Payable
Notes payable consist of the following:
December 31, 2019 2018 (In millions)
4.5% Notes, net of discount $ 443 $ 4425.5% Notes, net of discount 398 398Revolving credit facility (3) (4) $ 838 $ 836
C. Supplemental Cash Flow Information
Year Ended December 31, 2019 2018 2017 (In millions)
Cash paid during the year: Interest paid $ 44 $ 34 $ 54Income tax payments 251 204 528
D. Cash Dividends Received
We have received cash dividends from subsidiaries and affiliates of $0.5 billion, $0.4 billion, and $0.8 billion during the years ended December 31, 2019, 2018, and 2017, respectively.

William P. Foley, IIChairman of the BoardFidelity National Financial, Inc.
Douglas K. AmmermanRetiredKPMG LLP
Thomas M. HagertyManaging PartnerThomas H. Lee Partners, L.P.
Daniel D. LaneChairman of the BoardLane/Kuhn Pacific
Richard N. MasseyChief Executive OfficerCannae Holdings, Inc.
Heather H. MurrenManaging PartnerMurren Family Office
Raymond R. QuirkChief Executive OfficerFidelity National Financial, Inc.
John D. RoodChairmanThe Vestcor Companies, Inc.
Peter O. Shea, Jr.President and Chief Executive OfficerJ.F. Shea Company
Cary H. ThompsonVice ChairmanBanc of America Merrill Lynch
Willie D. DavisDirector Emeritus
AUDIT COMMITTEEDouglas K. Ammerman, ChairHeather H. MurrenJohn D. Rood
COMPENSATION COMMITTEERichard N. Massey, ChairDaniel D. LaneCary H. Thompson
GOVERNANCE COMMITTEEPeter O. Shea, Jr., ChairRichard N. Massey
BOARD OF DIRECTORS
Raymond R. QuirkChief Executive Officer
Michael J. NolanPresident
Roger S. JewkesChief Operating Officer
Anthony J. ParkExecutive Vice PresidentChief Financial Officer
Peter T. SadowskiExecutive Vice PresidentChief Legal Officer
Michael L. GravelleExecutive Vice PresidentGeneral Counsel and Corporate Secretary
GENERAL INFORMATION
CORPORATE OFFICEFidelity National Financial, Inc.601 Riverside AvenueJacksonville, FL 32204www.fnf.com
STOCK TRANSFER AGENT AND REGISTRARContinental Stock Transfer andTrust Company1 State Street30th FloorNew York, NY 10004(212) [email protected]/contact
INDEPENDENT REGISTERED PUBLICACCOUNTING FIRMErnst & Young LLP12926 Gran Bay Parkway, Suite 500Jacksonville, FL 32258
PUBLICATIONSThe Company’s Annual Report on Form 10-K and quarterly reports on Form 10-Q are available on the Investor Relations section of the Company’s website at www.fnf.com.
A Notice of Annual Meeting of Stockholder and Proxy Statement are furnished to stockholders in advance of the Annual Meeting.
STOCK EXCHANGE LISTINGFidelity National Financial, Inc.common stock is listed on the New York Stock Exchange under symbol FNF.
CERTIFICATIONSFNF filed the Chief Executive Officer and Chief Financial Officer certifications required by Section 302 of the Sarbanes-Oxley Act of 2002 as exhibits to its Annual Report on Form 10-K for the fiscal year ended December 31, 2019.
INVESTOR RELATIONSPlease visit the Contact Investor Relations section of FNF's Investor Info website at FNF.com to submit a question or request to the Investor Relations department.You can also contact FNF's InvestorRelations department via email [email protected]
EXECUTIVE OFFICERS

ANNUAL REPORT2019


