29 January 2020 To Corporate Relations Department. BSE Limited 1 st Floor, New Trading Ring, Rotunda Building, P J Tower, Dalal Street, Mumbai 400 00) . . ·•·.·.·· i. BSE Code: 53297.8 . To ~BAJAJ 'lilFINSERV Corporate Listing Department. National Stock Exchange of India Ltd Exchange Plaza, 5 th Floor Plot No.C-1, G Block, ,~a,g9.r.i!-Kurla Complex, 1 Bl:indi'a'(East), Mumbai 400 051 . ··. NSE Code: BAJAJFINSV . . ... Subject: Investor Presentation for the financial results of the third quarter ended 31 December 2019- Regulation 30 Dear Sir/Madam, Further to our letter dated 17 January 2020, please.find enclosed Investor Presentation for the financial results of the third quarter ended 31 December 2019 under Regulation 30 of the SEBI (Listing Obligations and Disclosure Requirements) Regulations, 2015, read with Schedule 111 thereto. This is for your information please. Thanking you, Yours faithfully, For Bajaj Finserv Limited Company Secretary · Encl: as above Bajaj Finserv limited Corporate Office: 6th Floor, Bajaj Finserv Corporate Office, Off Pune·Ahmednagar Road, Viman Nagar, Pune - 411 014, Maharashtra, India Registered Office: Mumbai - Pune Road, Akurdi, Pune - 411 035, Maharashtra, India Tel: +91 20 30405700 Fax: +91 20 30405792 Page I of! www.bajajfinserv.in Corporate 10 No: L65923PN2007PLC130075
Transcript
29 January 2020
To Corporate Relations Department. BSE Limited 1st Floor, New Trading Ring, Rotunda Building, P J Tower, Dalal Street, Mumbai 400 00) .
. ·•·.·.·· i.
BSE Code: 53297.8 .
To
~BAJAJ 'lilFINSERV
Corporate Listing Department. National Stock Exchange of India Ltd Exchange Plaza, 5th Floor Plot No.C-1, G Block,
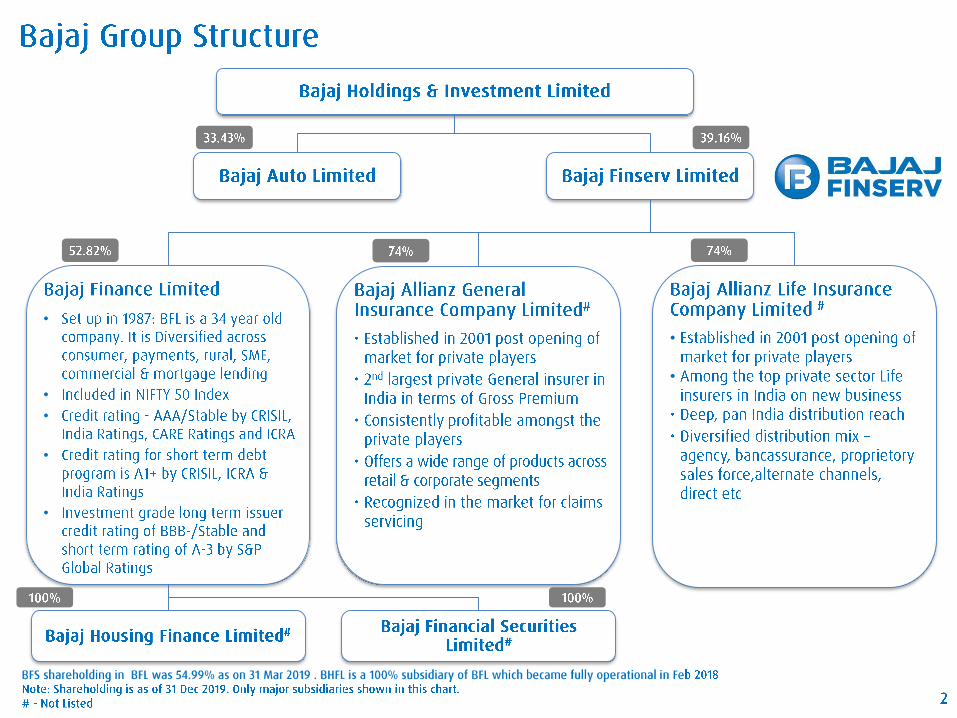
Bajaj Finserv's Vision - A diversified financial services group with a pan-India presence
1--BAJAJ
------ FINSERV
Diversified across products and markets, with a strong retail core
Family Protection
Health Insurance Life Insurance
Retail Consumer:
Life Insurance Fixed Deposits Mutual funds
Life Insurance Pensions
All Bajaj Finserv's businesses have a strong emphasis on the retail segment with a pan-India brand presence. Retail consumer is served through D2C (Direct to Customer) at Point of Sale, online, dealers for consumer lending, bancassurance and insurance agents.
SME and Corporate: Bajaj Finance provides working & growth capital in the high net worth SME space. The insurance companies serve these segments through a suite of corporate and group insurance products
Rural Focus: Bajaj Allianz Life is a leading player among private insurers in this space through its branches and business partners. Bajaj Finance has a highly diversified portfolio in the rural locations offering a wide range of products in consumer and RSME business categories under a unique hub and spoke business model. Bajaj Allianz General has penetrated rural markets through its virtual points of presence.
3
•
•
Consolidated profit components - Q3 FY20
Bajaj Finance
Bajaj Finance
5,826
Consolidated profit components for Q3 FY20 (Ind AS)
General
Life Insurance
Others
(119)
Bajaj FinservStandalone
lntercompany adjustments
(385)
Consolidated profit components for Q3 FY19 (Ind AS)
General
Life Insurance
Others
(55)
Bajaj FinservStandalone
lntercompany adjustments
,--BAJAJ
......____ FINSERV
All Figures in Rs Million
▪
▪
BAJAJ
FINSERV
Bajaj Finance Limited
7
•
•
•
•
•
•
•
•
•
•
•
•
✓
✓
✓
•
•
•
❑
❑
❑
❑
❑
❑ ₹
₹
❑
❑
•
•
BFL : growth momentum continues
1,27,568
FY18
81,429
FY18
Total Income
1,85,018
49,921
FY19 Q3 FY19
Net Interest Income
1,18,782
32,064
FY19 Q3 FY19
Bajaj Finance Consolidated results are as per Ind AS, previous years figures have been re-casted for comparability
1--BAJAJ
------ FINSERV
All Figures in Rs Million
70,259
Q3 FY20
45,369
Q3 FY20
12
BFL : Strong profit growth aided by low NPA and control on Opex
16,000
14,000
12,000
10,000
8,000
6,000
4,000
2,000
0
Loss Provision and Net NPAO/o 15,014
FY18 FY19 Q3 FY19 Q3 FY20
- Loss Provision (Rs. millions) �Net NPA %"'
2.0%
0.0%
Operating expenses as a % of NII
PAT
39,950
40.2%
•
FY18
35.3%
..
FY19
34.9%
•
Q3 FY19
33.9%
•
Q3 FY20
24,964
FY18 FY19 Q3 FY19
1--BAJAJ ----- FINSERV
All Figures in Rs Million
Q3 FY20
'''Net NPA, recognized as per extant RBI prudential norms and provisioned as per Expected Credit Loss (ECL} method prescribed in Ind AS. 13
Bajaj Allianz General Insurance
14
▪
▪
▪
▪
❑
❑
❑
❑
❑
❑
❑
❑
▪
▪
BAGIC : Combined Ratio trend BAJAJ I Allianz (ill)
Combined Ratios
103.6% 96.8%
92.3% 96.7% 94.2%
FY17 FY18 FY19 Q3 FY19 Q3 FY20
1. Combined Ratios are in accordance with the Master Circular on 'Preparation of Financial statements of General Insurance Business' issued by IRDAeffective from 1st April, 2013. (Net claims incurred divided by Net Earned Premium) + ( Expenses of management including net Commission divided byNet Written Premium).
18
BAGIC : Profit after tax and capital efficiency
PAT
9,212
7,278 7,799
2,236
FY17 FY18 FY19 Q3 FY19
Total Capital infused is Rs.2,768 Mn No Capital infusion since FY08
BAGIC - Capital Invested - Networth
35,346
FY17
··'Accumulated profit includes reserves
44,664
41,896
2,768
51,640 50,331
FY18 FY19 Q3 FY19
■ Capital Invested ■ Reserves Net Worth
BAJAJ I Allianz (ill) All Figures in Rs Million
1,906
Q3 FY20
Accumulated profi( 95% of Net worth as on 31 Dec 2019
57,779
Q3 FY20
19
BAGIC : Consistently amongst top 2 private insurers in terms of Gross Premium
1,415 1,199
FY17 FY18
FY17 FY18
Industry GDPI Trend (Rs. Bn.)
1,617
FY19
■ PSU ■ Private Insurers·,, Industry
BAGIC Premium Trend
1,10,970
FY19
■ GWP ■ NEP
BAJAJ I Allianz (ill)
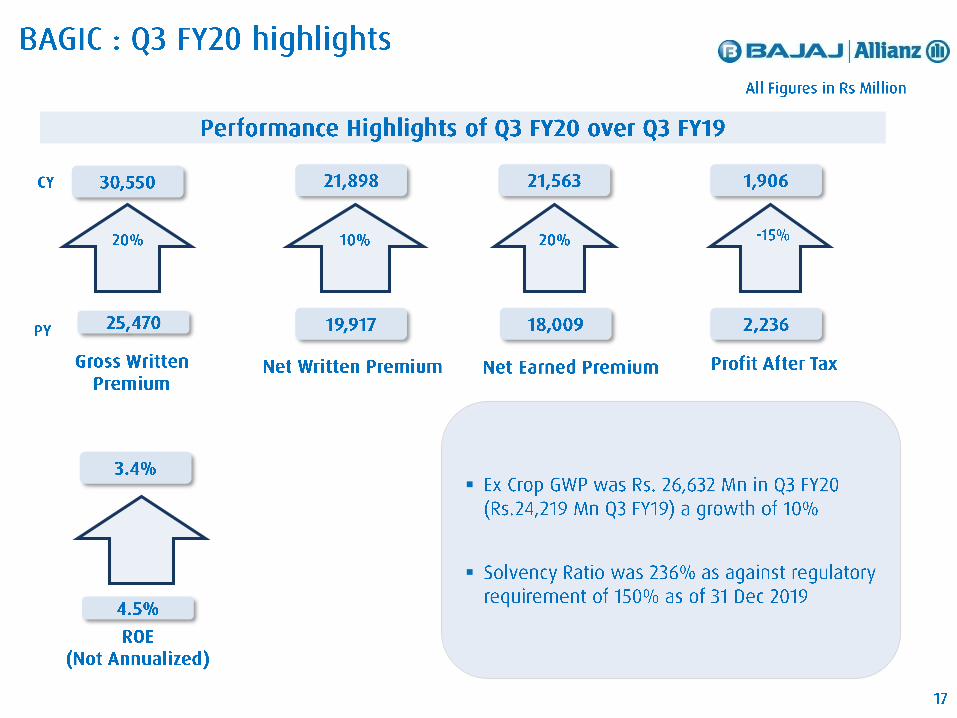
Q3 FY20 GDPI growth 9%
413 451
Q3 FY19 Q3 FY20
Q3 FY20 Premium growth 20%
Q3 FY19 Q3 FY20
Source : IRDAI, GDPI : Gross Direct Premium Income I '''Private Insurers : Includes Standalone Health Insurers, PSU excludes AIC of India, GIC and ECGC 20
▪
▪
▪
•
•
•
•
BAGIC : Assets Under Management continue to grow
AUM(cash and investments) - Rs Billion (as of end of period)
FY17 FY18 FY19 Q3 FY19 Q3 FY20
Investment Leverage : AUM as of date / Net worth as of date
BAJAJ I Allianz (ill)
BAGIC continues to grow its AUM strongly
Investments are largely in fixed income securities
Investment Leverage of 3.2x as on 31 Dec 2019
24
Bajaj Allianz Life Insurance
25
•
•
•
•
•
•
•
•
•
•
•
❑
❑
❑
❑
❑
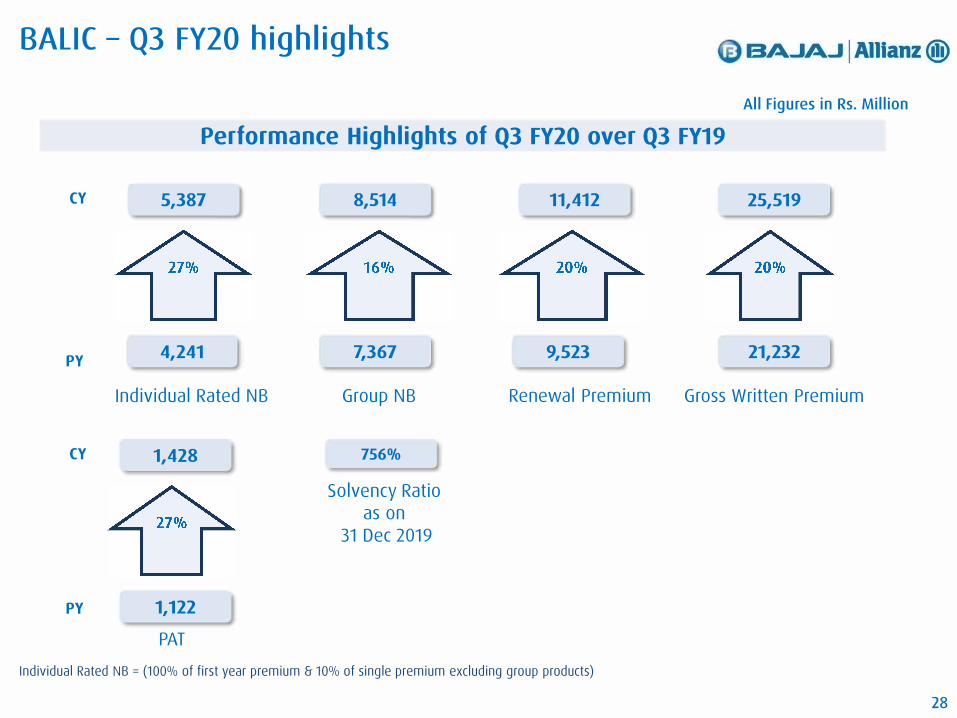
BALIC - Q3 FY20 highlights BAJAJ I Allianz (ill)
All Figures in Rs. Million
Performance Highlights of Q3 FY20 over Q3 FY19
CY 5,387 _j
PY 4,241
Individual Rated NB
CY 1,428
PY 1,122
PAT
8,514 J
7,367
Group NB
756%
Solvency Ratio as on
31 Dec 2019
11,412 25,519
9,523 21,232
Renewal Premium Gross Written Premium
Individual Rated NB = (100% of first year premium & 10% of single premium excluding group products)
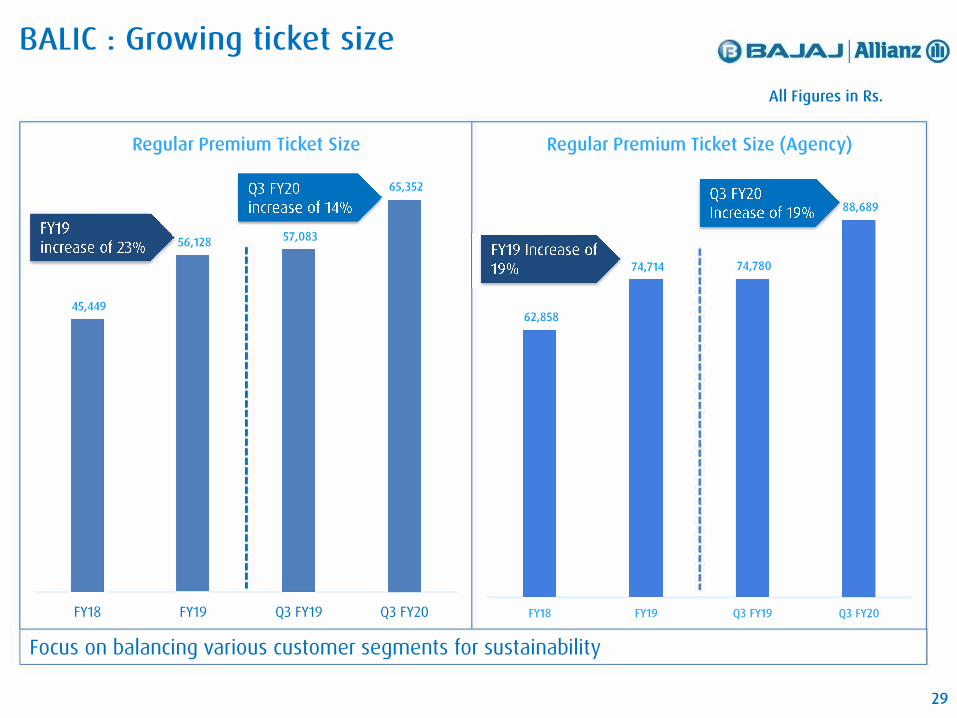
Focus on balancing various customer segments for sustainability
74,714 74,780
FY19 Q3 FY19
88,689
Q3 FY20
29
BALIC : Persistency trend
Persistency 13th Month
80%
79% 79%
77%
Persistency - 13th Month
FY18 ■ FY19 9M FY19 ■ 9M FY20
Persistency 37th Month
58%
53% 53%
49%
Persistency - 37th Month
FY18 ■ FY19 9M FY19 ■ 9M FY20
BAJAJ I Allianz (ill)
Persistency 25th Month
68% 66% 71%
58%
Persistency - 25th Month
FY18 ■ FY19 9M FY19 ■ 9M FY20
Persistency 49th Month
50%
47% 46%
42%
Persistency - 49th Month
FY18 ■ FY19 9M FY19 ■ 9M FY20
Note : Persistency as per IROAI framework I Persistency for the period ended 30 Nov 2019, measured on 31 Dec 2019 30
BALIC : Individual Rated premiums
Individual Rated NB
17,420
13,972
4,241 5,387
FY18 FY19 Q3 FY19 Q3 FY20
Institutional Business Individual Rated
NB
3,561
FY18 FY19 Q3 FY19 Q3 FY20
FY18
FY18
BAJAJ I Allianz (ill)
All Figures in Rs Million
Individual Rated NB Agency
12,039
2,945
FY19 Q3 FY19
Individual Rated NB Others
446
FY19 Q3 FY19
3,253
Q3 FY20
639
Q3 FY20
Individual Rated NB = (100% of first year premium & 10% of single premium excluding group products)
31
BALIC : Balanced product mix
Individual Rated Mix
FY18 FY19 Q3 FY19
Group NB Mix
FY18 FY19 Q3 FY19
BAJAJ I Allianz (ill)
Share of Non-ULIP business in individual business increasing
■ Individual - Unit Linked
■ Individual - Non Par
■ Individual - Par
Q3 FY20
Share of protection business in group increasing
■ Group Fund NB
■ Group Protection NB
Q3 FY20
Protection Business (Group) new business in Q3 FY20 Rs.4,918 Mn (Q3 FY19 Rs.3,731 Mn)
32
•
•
•
Annexure
1- -BA.JA.J
--------- FI NS ERV
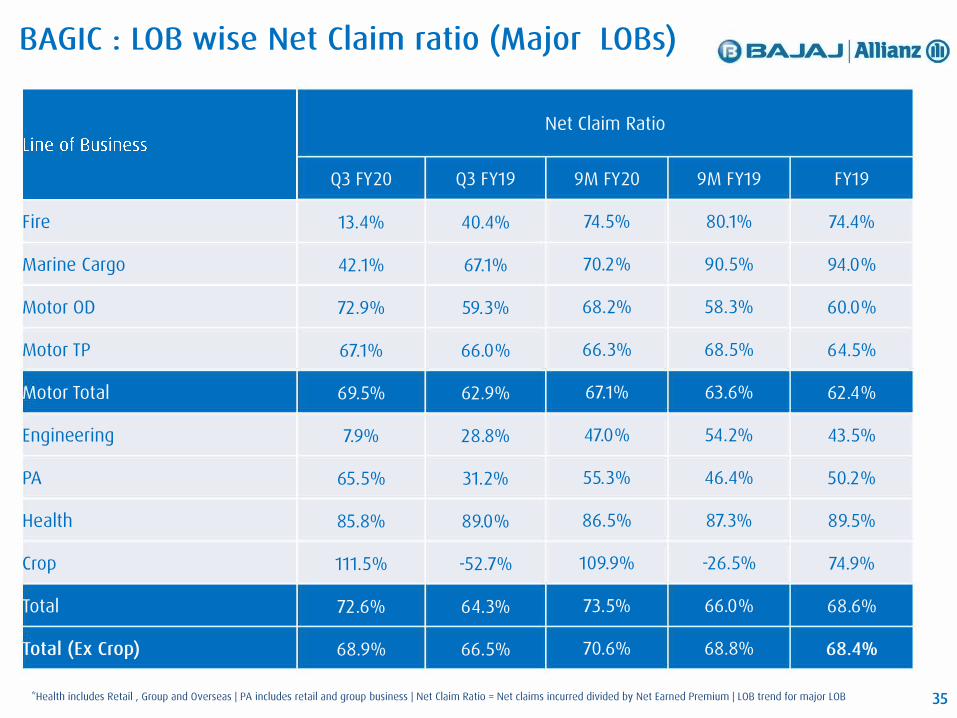
BAGIC : LOB wise Net Claim ratio {Major LOBs)
Fire
Marine Cargo
Motor OD
Motor TP
otor Total
Engineering
PA
Health
Crop
otal
otal (Ex Crop)
Q3 FY20
13.4%
42.1%
72.9%
67.1%
69.5%
7.9%
65.5%
85.8%
111.5%
72.6%
68.9%
Q3 FY19
40.4%
67.1%
59.3%
66.0%
62.9%
28.8%
31.2%
89.0%
-52.7%
64.3%
66.5%
Net Claim Ratio
9M FY20
74.5%
70.2%
68.2%
66.3%
67.1%
47.0%
55.3%
86.5%
109.9%
73.5%
70.6%
BAJAJ I Allianz (ill)
9M FY19
80.1%
90.5%
58.3%
68.5%
63.6%
54.2%
46.4%
87.3%
-26.5%
66.0%
68.8%
FY19
74.4%
94.0%
60.0%
64.5%
62.4%
43.5%
50.2%
89.5%
74.9%
68.6%
68.4%
'''Health includes Retail , Group and Overseas I PA includes retail and group business I Net Claim Ratio = Net claims incurred divided by Net Earned Premium I LOB trend for major LOB 35
Exposure to Downgraded Investments (Debt) : BALIC fr BAGIC
BALIC
Type of Fund (BALIC) (Amt in Rs. Mn)
1 PAR
2 N-PAR
3 ULIP
4 SH
Total
BAGIC
Type of Fund (BAGIC) (Amt in Rs. Mn)
1 Total
Total exposure as of 31 Dec 2019
3,879
1,346
1,925
4,621
11,771
Total exposure as of 31 Dec 2019
7,134
Of which performing
3,288
1,199
743
1,965
7,195
Of which performing
5,905
Of which (non performing)
590
147
1,182
2,656
4,576
Of which (non performing)
1,229
'''Performing : Interest and / principal payment of the security is regular as per term sheet I All exposure is shown at face value & accrued interest.
BAJAJ I Allianz (ill)
Impairment Provided for
349
88
903
2,094
3,434
Impairment Provided for
742
36
Disclaimer BAJAJ
FINSERV
This presentation has been prepared by Bajaj Finserv Limited (the "Company") solely for your information and for your use. This presentation is for information purposes only and should not be deemed to constitute or form part of any offer or invitation or inducement to sell or issue any securities, or any solicitation of any offer to purchase or subscribe for, any securities of the Company, nor shall it or any part of it or the fact of its distribution form the basis of, or be relied upon in connection with, any contract or commitment therefor. In particular, this presentation is not intended to be a prospectus or offer document under the applicable laws of any jurisdiction, including India. The financial information in this presentation may have been reclassified and reformatted for the purposes of this presentation. You may also refer to the financial statements of the Company available at www.bajajfinserv.in, before making any decision on the basis of this information.
This presentation contains statements that may not be based on historical information or facts but that may constitute forward-looking statements. These forward looking statements include descriptions regarding the intent, belief or current expectations of the Company or its directors and officers with respect to the results of operations and financial condition of the Company. Such forward-looking statements are not guarantees of future performance and involve risks and uncertainties, and actual results may differ from those in such forward-looking statements as a result of various factors and assumptions which the Company presently believes to be reasonable in light of its operating experience in recent years but these assumptions may prove to be incorrect. Any opinion, estimate or projection constitutes a judgment as of the date of this presentation, and there can be no assurance that future results or events will be consistent with any such opinion, estimate or projection. The Company does not undertake to revise any forward-looking statement that may be made from time to time by or on behalf of the Company. No representation, warranty, guarantee or undertaking, express or implied, is or will be made as to, and no reliance should be placed on, the accuracy, completeness, correctness or fairness of the information, estimates, projections and opinions contained in this presentation. Potential investors must make their own assessment of the relevance, accuracy and adequacy of the information contained in this presentation and must make such independent investigation as they may consider necessary or appropriate for such purpose. This presentation does not constitute and should not be considered as a recommendation by the Company that any investor should subscribe for, purchase or sell any of Company's securities. By viewing this presentation you acknowledge that you will be solely responsible for your own assessment of the market and the market position of the Company and that you will conduct your own analysis and be solely responsible for forming your own view of the potential future performance of the business of the Company. Company, book running lead managers, their affiliates, agents or advisors, the placement agents, promoters or any other persons that may participate in any offering of any securities of the Company shall not have any responsibility or liability whatsoever for any loss howsoever arising from this presentation or its contents or otherwise arising in connection therewith.
This presentation and its contents are confidential and should not be distributed, published or reproduced, in whole or part, or disclosed by recipients directly or indirectly to any other person. Viewing this information may not be lawful in certain jurisdictions. In other jurisdictions only certain categories of person may be allowed to view this information. Any person who wishes to view this site must first satisfy themselves that they are not subject to any local requirements which prohibit or restrict them from doing so. If you are not permitted to view this presentation on this website or are in any doubt as to whether you are permitted to view these materials, please exit this webpage.