30
2020 ACCOUNTABILITY PLAN UNIVERSITY OF CENTRAL FLORIDA BOT Approved 4/23/2020 Revised by Board of Governors Staff 7/6/2020

2020 ACCOUNTABILITY PLAN
UNIVERSITY OF CENTRAL FLORIDA BOT Approved 4/23/2020 Revised by Board of Governors Staff 7/6/2020

2020 ACCOUNTABILITY PLAN University of Central Florida
BOT Approved 4/23/2020
2
Table of Contents
INTRODUCTION ................................................................................................. 3 STRATEGY ......................................................................................................... 4
Mission Statement ............................................................................................ 4 Statement of Strategy ...................................................................................... 4 Strengths, Opportunities & Challenges ............................................................ 5 Key Initiatives & Investments ........................................................................... 5 Graduation Rate Improvement Plan Update .................................................... 6 Key Achievements for Last Year ...................................................................... 7
PERFORMANCE-BASED FUNDING METRICS ................................................ 8 PREEMINENT RESEARCH UNIVERSITY FUNDING METRICS ..................... 10 KEY PERFORMANCE INDICATORS ............................................................... 13
Teaching & Learning ...................................................................................... 13 Scholarship, Research & Innovation Metrics ................................................. 17 Institution Specific Goals ................................................................................ 18
ENROLLMENT PLANNING .............................................................................. 19 ACADEMIC PROGRAM COODINATION ......................................................... 21 DEFINITIONS .................................................................................................... 22
2020 ACCOUNTABILITY PLAN University of Central Florida
BOT Approved 4/23/2020
3
INTRODUCTION
The Accountability Plan is an annual report that is closely aligned with the Board of Governors’ 2025 System Strategic Plan. This report enhances the System’s commitment to accountability and strategic planning by fostering greater coordination between institutional administrators, University Boards of Trustees and the Board of Governors regarding each institution’s direction and priorities as well as performance expectations and outcomes on institutional and System-wide goals.
Once an Accountability Plan is approved by each institution’s respective Boards of Trustees, the Board of Governors will review and consider the plan for approval, excluding those sections of the Plan that require additional regulatory or procedural approval pursuant to law or Board regulations.

2020 ACCOUNTABILITY PLAN University of Central Florida
BOT Approved 4/23/2020
4
STRATEGY Mission Statement
The University of Central Florida is a public multi-campus, metropolitan research university that stands for opportunity. The university anchors the Central Florida city-state in meeting its economic, cultural, intellectual, environmental and societal needs by providing high-quality, broad-based education and experience-based learning; pioneering scholarship and impactful research; enriched student development and leadership growth; and highly relevant continuing education and public service initiatives that address pressing local, state, national, and international issues in support of the global community.
Statement of Strategy UCF will be the 21st-century model of a new kind of research university that’s tightly coupled with urban growth, with entrepreneurship, and with partnerships to develop the talent that simultaneously attracts and drives the innovation and investment to move our region and state forward. UCF will have a national and, in key areas, international reputation for excellence. Specifically, we will become a Top 50 public, national university in U.S. News & World Report’s College rankings. With a greater focus on enhancing research expenditures, scholarly activity, national academic members and post-doctoral appointments, UCF is committed to achieving the breadth and quality of programs of research and graduate education (as well as undergraduate education) consistent with consideration for membership in the Association of American Universities. UCF will continue to reflect and celebrate the diversity that is our state and nation’s future. We will empower students of all backgrounds to discover their full potential, with the goal of eliminating achievement gaps among student populations, while realizing an overall student success four-year graduation rate above 60%. As a model 21st-century university, UCF will also strive to achieve operational excellence, delivering services in new efficient and effective ways, leveraging technology to reduce administrative cost and increase investments in our academic and research enterprises. These are not only goals UCF will commit to, they will be the foundation upon which the next generation of UCF students and faculty will conquer our greatest challenges.

2020 ACCOUNTABILITY PLAN University of Central Florida
BOT Approved 4/23/2020
5
STRATEGY (cont.) Strengths, Opportunities & Challenges
UCF’s immediate attention is appropriately on the challenge of COVID-19. But COVID also represents an opportunity to rethink how classes are delivered, ascertain the appropriate mix of online and in-person instruction, identify which services are best provided by the university and create a more efficient and strategic budget process With record highs for first-year retention (91.5 percent) and multiple student success measures placing UCF among the Top 50 national, public universities in certain 2020 U.S. News and World Report rankings, UCF will now focus on four-year graduation rates (46.5 percent) to ensure even more students benefit from shorter time-to-degree and even less debt. UCF is fortunate to have several key areas of distinction to build upon, such as optics and lasers, modeling and simulation, engineering and computer science, hospitality and game development. In particular, UCF’s growing Academic Health Science Center and upcoming UCF Lake Nona Medical Center will expand UCF’s research and impact in health-related fields and the local economy. A key metric for the establishment of the Academic Health Science Center will be it’s ability to enable substantial growth in university research funding. This expansion would be added to our sustained growth in research funding, which again set another record for UCF this past year with $192 million.
Three Key Initiatives & Investments 1. Student Success: • Creation of the Student Learning and Academic Success unit charged with academic success and four-year
graduation with a goal to increase retention, progression and graduation rates. Over the last five years, UCF’s retention rate has improved by 3 percent, improved four-year graduation by 15 percent, and reduced excess hours by 14 percent.
• UCF will create a strategic enrollment management team, coupled with a strategic plan, that will focus on better aligning all enrollment to the university’s strategic goals with input from colleges and faculty leadership.
2. Faculty Size and Excellence: • Hire additional full-time faculty members in areas of specific focus (e.g. STEM, areas of strategic programmatic
emphasis, and emerging fields). Hiring full-time faculty members strengthens the undergraduate and graduate academic experience by ensuring course availability, decreasing class size, increasing student engagement, supporting undergraduate and graduate research, and stabilizing UCF’s student-to-faculty ratio.
• An emphasis on hiring tenured and tenure-track faculty members addresses the overall mix of faculty members while boosting UCF’s growing research promise and economic impact. Over the last five years, UCF has increased tenured and tenure-track faculty by 34 percent and reduced the student-to-faculty ratio to levels similar to 2007.
3. Research and graduate activity: • Increase the volume and impact of UCF research while enhancing graduate degree quality. • Increasing research and graduate activity ensures the university’s long-held top Carnegie Classification as a
“R1: Doctoral University: Highest Research Activity”. Achieving $1.6 billion in external research grants received in the past decade, over the last five years, UCF’s research grants have increased 32 percent.
2020 ACCOUNTABILITY PLAN University of Central Florida
BOT Approved 4/23/2020
6
STRATEGY (cont.)
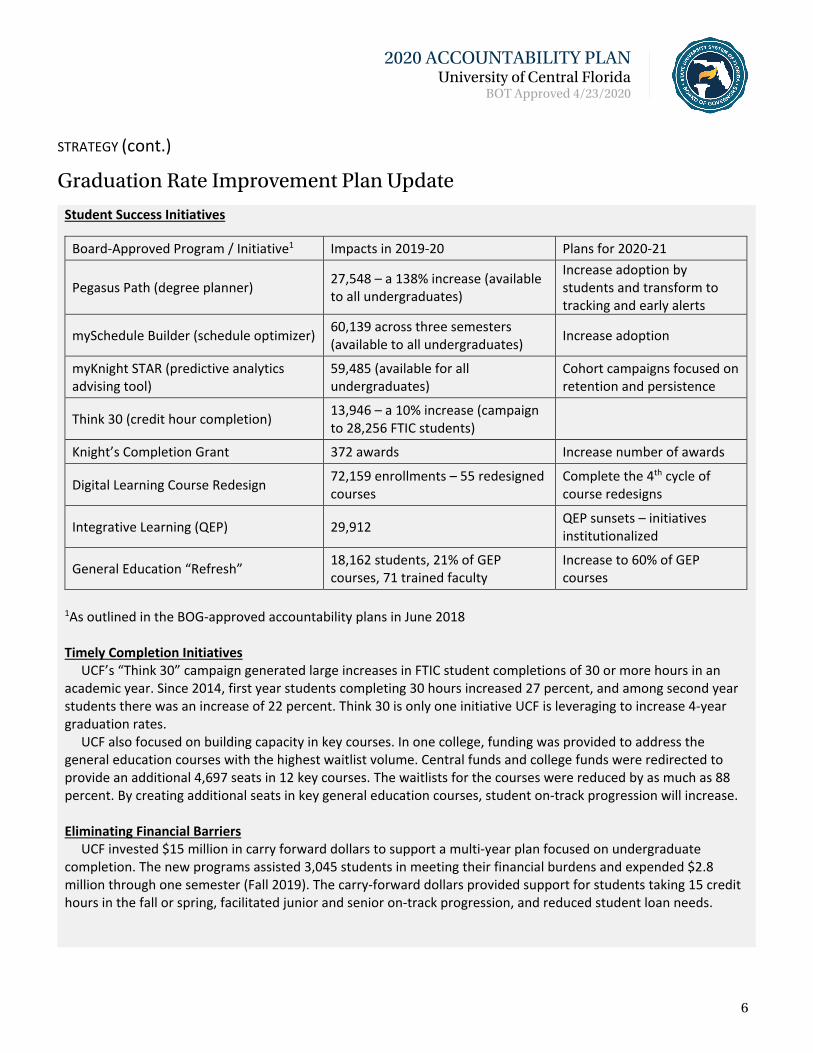
Graduation Rate Improvement Plan Update
Student Success Initiatives
1As outlined in the BOG-approved accountability plans in June 2018 Timely Completion Initiatives UCF’s “Think 30” campaign generated large increases in FTIC student completions of 30 or more hours in an academic year. Since 2014, first year students completing 30 hours increased 27 percent, and among second year students there was an increase of 22 percent. Think 30 is only one initiative UCF is leveraging to increase 4-year graduation rates. UCF also focused on building capacity in key courses. In one college, funding was provided to address the general education courses with the highest waitlist volume. Central funds and college funds were redirected to provide an additional 4,697 seats in 12 key courses. The waitlists for the courses were reduced by as much as 88 percent. By creating additional seats in key general education courses, student on-track progression will increase. Eliminating Financial Barriers UCF invested $15 million in carry forward dollars to support a multi-year plan focused on undergraduate completion. The new programs assisted 3,045 students in meeting their financial burdens and expended $2.8 million through one semester (Fall 2019). The carry-forward dollars provided support for students taking 15 credit hours in the fall or spring, facilitated junior and senior on-track progression, and reduced student loan needs.
Board-Approved Program / Initiative1 Impacts in 2019-20 Plans for 2020-21
Pegasus Path (degree planner) 27,548 – a 138% increase (available to all undergraduates)
Increase adoption by students and transform to tracking and early alerts
mySchedule Builder (schedule optimizer) 60,139 across three semesters (available to all undergraduates) Increase adoption
myKnight STAR (predictive analytics advising tool)
59,485 (available for all undergraduates)
Cohort campaigns focused on retention and persistence
Think 30 (credit hour completion) 13,946 – a 10% increase (campaign to 28,256 FTIC students)
Knight’s Completion Grant 372 awards Increase number of awards
Digital Learning Course Redesign 72,159 enrollments – 55 redesigned courses
Complete the 4th cycle of course redesigns
Integrative Learning (QEP) 29,912 QEP sunsets – initiatives institutionalized
General Education “Refresh” 18,162 students, 21% of GEP courses, 71 trained faculty
Increase to 60% of GEP courses

2020 ACCOUNTABILITY PLAN University of Central Florida
BOT Approved 4/23/2020
7
Key Achievements for Last Year (Student, Faculty, Program, Institutional)
Student Achievements 1. College of Engineering and Computer Science Cyber Defense Team students won the Department of Education’s CyberForce National Competition. 2. Florida Interactive Entertainment Academy students’ game Tablecraft won game of the year at the Interservice/Industry Training, Simulation and Education Conference. 3. UCF student recognitions included 2 Astronaut Scholars, 1 Goldwater Scholar, 5 Fulbright Scholars, 1 Critical Language Scholar, 7 National Science Foundation Scholars, and 1 Gilman Scholar. Faculty Achievements 1. College of Sciences Physics Assistant Professor Xiofeng Feng was named a Sloan Research Fellow and received $70,000 to further his research. Feng is the first faculty member earning this prestigious fellowship for UCF. 2. Rosen College of Hospitality Management Dean Youcheng Wang and Associate Dean Alan Fyall were awarded membership in the International Academy for the Study of Tourism based in Hong Kong. There are only 87 fellows worldwide. 3. Six UCF faculty earned NSF CAREER awards, a prestigious award in support of early-career faculty who have the potential to serve as academic role models in research and education. 4. Professor of Engineering Sudipta Seal was named a Materials Research Society Fellow. The prestigious international recognition is the first for UCF and the 10th in Florida. Program Achievements 1. College of Community Innovation and Education in partnership with Nemours founded the PedsAcademy, the world’s first pediatric school program providing education opportunities specific to a child’s condition. 2. Top 5 World Program Rankings: Rosen College of Hospitality Management ranks 5th in the world by both the Academic Ranking of World Universities rankings list and CEOWorld magazine. Florida Interactive Entertainment Academy (FIEA) graduate program ranks 5th in the world for Game Design according to The Princeton Review and PC Gamer magazine. 3. Twenty-seven UCF programs were nationally ranked in the top 100 of their fields by U.S. News & World Report 2020 Best Graduate Schools. Institutional Achievements 1. UCF completed the largest philanthropic campaign in the university’s 51-year history. IGNITE: The Campaign for UCF raised $531.5 million in gifts and commitments. 2. UCF ranks 31st among public universities in the nation and has been among the top 100 in the world for the past five years according to the annual rankings by the National Academy of Inventors and the Intellectual Property Owners Association. 3. UCF received official federal designation as a Hispanic Serving Institution.

2020 ACCOUNTABILITY PLAN University of Central Florida
BOT Approved 4/23/2020
8
PERFORMANCE-BASED FUNDING METRICS
1. Percent of Bachelor’s Graduates Enrolled or Employed ($25,000+) 2013-14 2014-15 2015-16 2016-17 2017-18 2018-19 2019-20 2020-21 2021-22 2022-23
ACTUAL 65.1 66.2 67.9 67.4 69.1 . . . . .
APPROVED GOALS . 65.0 67.2 68.5 69.1 69.5 69.9 70.1 . .
PROPOSED GOALS . . . . . 69.5 69.9 70.1 70.3 70.5
2. Median Wages of Bachelor’s Graduates Employed Full-time 2013-14 2014-15 2015-16 2016-17 2017-18 2018-19 2019-20 2020-21 2021-22 2022-23
ACTUAL 37,000 38,600 38,700 38,600 40,000 . . . . . APPROVED GOALS . 36,600 39,100 39,700 40,200 40,600 41,100 41,300 . . PROPOSED GOALS . . . . . 40,600 41,100 41,300 41,400 41,400
3. Average Cost to the Student [Net Tuition & Fees per 120 Credit Hours for Resident Undergraduates] 2014-15 2015-16 2016-17 2017-18 2,018-19 2019-20 2020-21 2021-22 2022-23 2023-24
ACTUAL 15,330 15,380 15,400 12,070 7,580 . . . . .
APPROVED GOALS . . 15,120 15,968 12,000 11,950 11,900 11,850 . .
PROPOSED GOALS . . . . . 7,580 7,530 7,480 7,430 7,380
4. FTIC Four-Year Graduation Rate [Full-time FTIC students only] 2011-15 2012-16 2013-17 2014-18 2015-19 2016-20 2017-21 2018-22 2019-23 2020-24
ACTUAL 40.4 43.6 43.7 45.7 46.3 . . . . .
APPROVED GOALS . 42.0 45.0 44.7 46.8 48.0 50.1 50.7 . .
PROPOSED GOALS . . . . . 48.0 50.1 50.7 51.8 52.9
5. Academic Progress Rate [Second Fall Retention Rate with at Least a 2.0 GPA for Full-time FTIC students] 2014-15 2015-16 2016-17 2017-18 2018-19 2019-20 2020-21 2021-22 2022-23 2023-24
ACTUAL 86.6 86.5 87.6 88.7 90.1 . . . . .
APPROVED GOALS . 88.0 87.4 87.9 88.9 89.5 90.0 90.2 . .
PROPOSED GOALS . . . . . 90.3 90.5 90.6 90.7 90.8

2020 ACCOUNTABILITY PLAN University of Central Florida
BOT Approved 4/23/2020
9
PERFORMANCE-BASED FUNDING METRICS (cont.)
6. Percentage of Bachelor’s Degrees Awarded within Programs of Strategic Emphasis 2014-15 2015-16 2016-17 2017-18 2018-19 2019-20 2020-21 2021-22 2022-23 2023-24
ACTUAL 49.7 52.0 51.9 51.6 51.2 . . . . .
APPROVED GOALS . 50.0 52.5 52.5 53.0 53.4 53.8 54.0 . .
PROPOSED GOALS . . . . . 53.4 53.8 54.0 54.0 54.0
7. University Access Rate [Percent of Undergraduates with a Pell grant]
FALL 2014
FALL 2015
FALL 2016
FALL 2017
FALL 2018
FALL 2019
FALL 2020
FALL 2021
FALL 2022
FALL 2023
ACTUAL 39.4 39.7 39.4 40.6 39.2 . . . . . APPROVED GOALS . 40.0 40.2 40.0 41.0 41.8 42.4 42.8 . .
PROPOSED GOALS . . . . . 41.8 42.4 42.8 42.8 42.8
8. Percentage of Graduate Degrees Awarded within Programs of Strategic Emphasis 2014-15 2015-16 2016-17 2017-18 2018-19 2019-20 2020-21 2021-22 2022-23 2023-24
ACTUAL 61.7 63.4 62.0 62.6 61.2 . . . . . APPROVED GOALS . 62.0 63.6 62.5 63.0 63.4 63.8 64.0 . . PROPOSED GOALS . . . . . 63.4 63.8 64.0 64.0 64.0
9. BOG Choice: Percent of Baccalaureate Degrees Awarded Without Excess Hours 2014-15 2015-16 2016-17 2017-18 2018-19 2019-20 2020-21 2021-22 2022-23 2023-24
ACTUAL 69.2 66.3 76.4 77.8 79.0 . . . . . APPROVED GOALS . 69.0 68.0 76.8 78.1 78.7 79.1 79.4 . . PROPOSED GOALS . . . . . 79.2 79.4 79.6 79.8 80.0
10. BOT Choice: Percent of Bachelor’s Degrees Awarded to African American and Hispanic Students 2014-15 2015-16 2016-17 2017-18 2018-19 2019-20 2020-21 2021-22 2022-23 2023-24
ACTUAL 31.5 33.2 35.0 35.5 37.9 . . . . .
APPROVED GOALS . . . . 37 38 38 39 . .
PROPOSED GOALS . . . . . 39 40 40 41 41
2020 ACCOUNTABILITY PLAN University of Central Florida
BOT Approved 4/23/2020
10
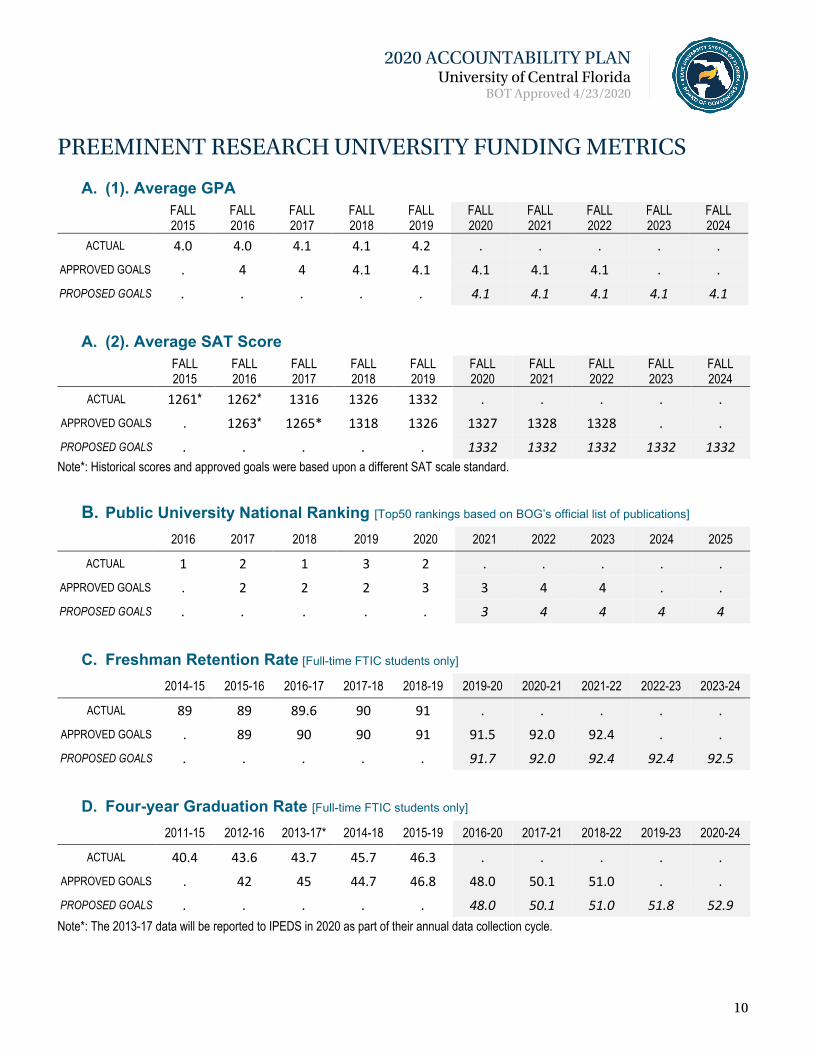
PREEMINENT RESEARCH UNIVERSITY FUNDING METRICS
A. (1). Average GPA
FALL 2015
FALL 2016
FALL 2017
FALL 2018
FALL 2019
FALL 2020
FALL 2021
FALL 2022
FALL 2023
FALL 2024
ACTUAL 4.0 4.0 4.1 4.1 4.2 . . . . .
APPROVED GOALS . 4 4 4.1 4.1 4.1 4.1 4.1 . .
PROPOSED GOALS . . . . . 4.1 4.1 4.1 4.1 4.1
A. (2). Average SAT Score
FALL 2015
FALL 2016
FALL 2017
FALL 2018
FALL 2019
FALL 2020
FALL 2021
FALL 2022
FALL 2023
FALL 2024
ACTUAL 1261* 1262* 1316 1326 1332 . . . . .
APPROVED GOALS . 1263* 1265* 1318 1326 1327 1328 1328 . .
PROPOSED GOALS . . . . . 1332 1332 1332 1332 1332 Note*: Historical scores and approved goals were based upon a different SAT scale standard.
B. Public University National Ranking [Top50 rankings based on BOG’s official list of publications] 2016 2017 2018 2019 2020 2021 2022 2023 2024 2025
ACTUAL 1 2 1 3 2 . . . . . APPROVED GOALS . 2 2 2 3 3 4 4 . . PROPOSED GOALS . . . . . 3 4 4 4 4
C. Freshman Retention Rate [Full-time FTIC students only] 2014-15 2015-16 2016-17 2017-18 2018-19 2019-20 2020-21 2021-22 2022-23 2023-24
ACTUAL 89 89 89.6 90 91 . . . . .
APPROVED GOALS . 89 90 90 91 91.5 92.0 92.4 . . PROPOSED GOALS . . . . . 91.7 92.0 92.4 92.4 92.5
D. Four-year Graduation Rate [Full-time FTIC students only] 2011-15 2012-16 2013-17* 2014-18 2015-19 2016-20 2017-21 2018-22 2019-23 2020-24
ACTUAL 40.4 43.6 43.7 45.7 46.3 . . . . .
APPROVED GOALS . 42 45 44.7 46.8 48.0 50.1 51.0 . . PROPOSED GOALS . . . . . 48.0 50.1 51.0 51.8 52.9 Note*: The 2013-17 data will be reported to IPEDS in 2020 as part of their annual data collection cycle.

2020 ACCOUNTABILITY PLAN University of Central Florida
BOT Approved 4/23/2020
11
PREEMINENT RESEARCH UNIVERSITY FUNDING METRICS (cont.)
E. National Academy Memberships 2016 2017 2018 2019 2020 2021 2022 2023 2024 2025
ACTUAL 1 6 6 6 7 . . . . .
APPROVED GOALS . 2 7 6 7 7 8 8 . .
PROPOSED GOALS . . . . . 7 8 8 8 8
F. Science & Engineering Research Expenditures ($M) 2014-15 2015-16 2016-17 2017-18 2018-19 2019-20 2020-21 2021-22 2022-23 2023-24
ACTUAL 170 166 169 176 186 . . . . . APPROVED GOALS . 174 194 194 201 206 210 210 . . PROPOSED GOALS . . . . . 206 210 210 210 210
G. Non-Medical Science & Engineering Research Expenditures ($M) 2014-15 2015-16 2016-17 2017-18 2018-19 2019-20 2020-21 2021-22 2022-23 2023-24
ACTUAL 168 158 161 165 169 . . . . .
APPROVED GOALS . 171 186 186 192 198 201 201 . .
PROPOSED GOALS . . . . . 198 201 201 201 201
H. Number of Broad Disciplines Ranked in Top 100 for Research Expenditures 2013-14 2014-15 2015-16 2016-17 2017-18 2018-19 2019-20 2020-21 2021-22 2022-23
ACTUAL 7 7 7 7 6 . . . . .
APPROVED GOALS . 7 of 8 7 of 8 7 of 8 7 of 8 7 of 8 7 of 8 7 of 8 . .
PROPOSED GOALS . . . . . 7 of 8 7 of 8 7 of 8 7 of 8 7 of 8

2020 ACCOUNTABILITY PLAN University of Central Florida
BOT Approved 4/23/2020
12
PREEMINENT RESEARCH UNIVERSITY FUNDING METRICS (cont.)
I. Utility Patents Awarded [over three calendar years] 2013-15 2014-16 2015-17 2016-18 2017-19 2018-20 2019-21 2020-22 2021-23 2022-24
ACTUAL 177 184 165 147 138 . . . . .
APPROVED GOALS . 208 192 152 138 135 135 135 . .
PROPOSED GOALS . . . . . 135 140 135 136 138
J. Doctoral Degrees Awarded Annually 2014-15 2015-16 2016-17 2017-18 2018-19 2019-20 2020-21 2021-22 2022-23 2023-24
ACTUAL 423 440 429 438 415 . . . . .
APPROVED GOALS . 445 455 440 455 470 480 490 . .
PROPOSED GOALS . . . . . 470 480 490 490 490
K. Number of Post-Doctoral Appointees
FALL 2014
FALL 2015
FALL 2016*
FALL 2017
FALL 2018
FALL 2019
FALL 2020
FALL 2021
FALL 2022
FALL 2023
ACTUAL 47 51 67 94 146 . . . .
APPROVED GOALS 64 68 72 96 112 117 123 129 . .
PROPOSED GOALS . . . . . 160 170 180 190 200 Note*: The Fall 2016 data will be reported by the Center for Measuring University Performance in their annual Top American Research Universities (TARU) report in 2020.
L. Endowment Size ($M) 2014-15 2015-16 2016-17 2017-18 2018-19 2019-20 2020-21 2021-22 2022-23 2023-24
ACTUAL 150.7 146.4 157 163 165 . . . . .
APPROVED GOALS . 169 153 165 175 182 190 190 . .
PROPOSED GOALS . . . . . 182 190 190 191 200

2020 ACCOUNTABILITY PLAN University of Central Florida
BOT Approved 4/23/2020
13
KEY PERFORMANCE INDICATORS Teaching & Learning (from the 2025 System Strategic Plan not included in PBF section)
1. Public University National Ranking [Number of Top50 Rankings based on BOG’s official list of publications] 2016 2017 2018 2019 2020 2021 2022 2023 2024 2025
ACTUAL 1 2 1 3 2 . . . . .
APPROVED GOALS . 2 2 2 3 3 4 4 . .
PROPOSED GOALS . . . . . 3 4 4 4 4
2. Freshmen in Top 10% of High School Class
FALL 2015
FALL 2016
FALL 2017
FALL 2018
FALL 2019
FALL 2020
FALL 2021
FALL 2022
FALL 2023
FALL 2024
ACTUAL 33 33 31 34 36 . . . . . APPROVED GOALS . 34 35 31 35 36 37 38 . . PROPOSED GOALS . . . . . 36 37 38 38 39
3. Time to Degree for FTICs in 120hr programs 2014-15 2015-16 2016-17 2017-18 2018-19 2019-20 2020-21 2021-22 2022-23 2023-24
ACTUAL 4.4 4.4 4.4 4.3 4.3 . . . . .
APPROVED GOALS . 4.3 4.2 4.3 4.3 4.2 4.2 4.2 . .
PROPOSED GOALS . . . . . 4.2 4.2 4.2 4.2 4.1
4. Six-Year FTIC Graduation Rates [Full-& Part-time students] 2009-15 2010-16 2011-17 2012-18 2013-19 2014-20 2015-21 2016-22 2017-23 2018-24
ACTUAL 70 68 70 72 72 . . . . .
APPROVED GOALS . 70 71 70 72 73 73 74 . .
PROPOSED GOALS . . . . . 73 73 74 74 74
5. FCS AA Transfer Three-Year Graduation Rate (Florida College System w/ Associate in Arts) 2012-15 2013-16 2014-17 2015-18 2016-19 2017-20 2018-21 2019-22 2020-23 2021-24
ACTUAL 53 54 54 51 53 . . . . . APPROVED GOALS . . . . . . . . . . PROPOSED GOALS . . . . . 53 54 54 54 55

2020 ACCOUNTABILITY PLAN University of Central Florida
BOT Approved 4/23/2020
14
KEY PERFORMANCE INDICATORS (cont.) Teaching & Learning (from the 2025 System Strategic Plan not included in PBF section)
6. Pell Recipient Four-Year Graduation Rate [for Full-Time FTIC] 2011-15 2012-16 2013-17 2014-18 2015-19 2016-20 2017-21 2018-22 2019-23 2020-24
ACTUAL 36 40 41 43 43 . . . . . APPROVED GOALS . . . . . . . . . . PROPOSED GOALS . . . . . 44 45 46 47 48
7. Bachelor’s Degrees Awarded [First Majors Only]
2014-15 2015-16 2016-17 2017-18 2018-19 2019-20 2020-21 2021-22 2022-23 2023-24
ACTUAL 12,629 12,832 13,070 13,341 13,959 . . . . . APPROVED GOALS . 12,850 13,190 13,330 13,600 13,870 14,150 14,400 . . PROPOSED GOALS . . . . . 14,100 14,250 14,400 14,550 14,700
8. Graduate Degrees Awarded [First Majors Only] 2014-15 2015-16 2016-17 2017-18 2018-19 2019-20 2020-21 2021-22 2022-23 2023-24
ACTUAL 2,673 2,681 2,647 2,752 2,884 . . . . . APPROVED GOALS . 2,770 2,700 2,670 2,793 2,833 2,868 2,996 . . PROPOSED GOALS . . . . . 2,900 2,950 3,000 3,050 3,100
9. Percentage of Bachelor’s Degrees Awarded to African-American & Hispanic Students 2014-15 2015-16 2016-17 2017-18 2018-19 2019-20 2020-21 2021-22 2022-23 2023-24
ACTUAL 32 33 35 36 38 . . . . . APPROVED GOALS . 32 33 36 37 38 38 39 . . PROPOSED GOALS . . . . . 39 40 40 41 41
10. Percentage of Adult (Aged 25+) Undergraduates Enrolled
FALL 2015
FALL 2016
FALL 2017
FALL 2018
FALL 2019
FALL 2020
FALL 2021
FALL 2022
FALL 2023
FALL 2024
ACTUAL 20 20 19 18 18 . . . . . APPROVED GOALS . 21 21 20 20 21 21 21 . . PROPOSED GOALS . . . . . 21 21 21 21 21

2020 ACCOUNTABILITY PLAN University of Central Florida
BOT Approved 4/23/2020
15
KEY PERFORMANCE INDICATORS (cont.) Teaching & Learning (from the 2025 System Strategic Plan not included in PBF section)
11. Percent of Undergraduate FTE in Online Courses 2014-15 2015-16 2016-17 2017-18 2018-19 2019-20 2020-21 2021-22 2022-23 2023-24
ACTUAL 30 31 33 34 37 . . . . .
APPROVED GOALS . 31 32 34 35 37 39 40 . .
PROPOSED GOALS . . . . . 38 39 40 40 41
12. Percent of Bachelor’s Degrees in STEM & Health 2014-15 2015-16 2016-17 2017-18 2018-19 2019-20 2020-21 2021-22 2022-23 2023-24
ACTUAL 33 34 35 34 35 . . . . .
APPROVED GOALS . 34 35 36 36 37 38 38 . .
PROPOSED GOALS . . . . . 37 38 38 38 38
13. Percent of Graduate Degrees in STEM & Health 2014-15 2015-16 2016-17 2017-18 2018-19 2019-20 2020-21 2021-22 2022-23 2023-24
ACTUAL 44 47 45 47 46 . . . . .
APPROVED GOALS . 45 47 48 48 49 50 50 . .
PROPOSED GOALS . . . . . 49 50 50 50 50

2020 ACCOUNTABILITY PLAN University of Central Florida
BOT Approved 4/23/2020
16
KEY PERFORMANCE INDICATORS (cont.) Teaching & Learning (from the 2025 System Strategic Plan not included in PBF section)
14. Professional Licensure & Certification Exam First-time Pass Rates CALENDAR YEAR 2015 2016 2017 2018 2019 2020 2021 2022 2023 2024
NURSING 97 92 96 95 97 97 97 97 97 97
US Average 87 88 90 92 91 . . . . .
MEDICINE (2YR) 100 100 97 97 98 98 98 98 98 98
US Average 96 96 96 96 97 . . . . .
CROSS-YEAR 2014-15 2015-16 2016-17 2017-18 2018-19 2019-20 2020-21 2021-22 2022-23 2023-24
MEDICINE (4Y-CK) 99 100 98 99 98 98 98 98 98 98
US Average 95 96 96 97 98 . . . . .
MEDICINE (4Y-CS) 100 99 97 96 97 97 97 97 97 97
US Average 96 97 96 95 95 . . . . .
MULTI-YEAR 2013-15 2014-16 2015-17 2016-18 2017-19 2018-20 2019-21 2020-22 2021-23 2022-24
PHYSICAL THERAPY 98 98 100 99 99 95 95 95 95 95
US Average 91 92 92 92 92 . . . . .
Exam Scores Relative to Benchmarks
2015 2016 2017 2018 2019 2020 2021 2022 2023 2024
ABOVE OR TIED 5 5 5 5 5 5 5 5 5 5
TOTAL 5 5 5 5 5 5 5 5 5 5

2020 ACCOUNTABILITY PLAN University of Central Florida
BOT Approved 4/23/2020
17
KEY PERFORMANCE INDICATORS (cont.) Scholarship, Research & Innovation Metrics
15. National Academy Memberships 2016 2017 2018 2019 2020 2021 2022 2023 2024 2025
ACTUAL 1 6 6 6 7 . . . . .
APPROVED GOALS . 2 7 6 7 7 8 8 . .
PROPOSED GOALS . . . . . 7 8 8 8 8
16. Faculty Awards
FALL 2013
FALL 2014
FALL 2015
FALL 2016
FALL 2017
FALL 2018
FALL 2019
FALL 2020
FALL 2021
FALL 2022
ACTUAL 6 7 7 8 7 . . . . .
APPROVED GOALS . 12 8 8 10 11 12 12 . .
PROPOSED GOALS . . . . . 11 12 12 12 12
17. Total Research Expenditures ($M) 2014-15 2015-16 2016-17 2017-18 2018-19 2019-20 2020-21 2021-22 2022-23 2023-24
ACTUAL 216 198 200 215 225 . . . . .
APPROVED GOALS . 218 271 248 269 290 315 315 . .
PROPOSED GOALS . . . . . 290 315 315 315 315
18. Research Expenditures from External Sources ($M) 2014-15 2015-16 2016-17 2017-18 2018-19 2019-20 2020-21 2021-22 2022-23 2023-24
ACTUAL 107 118 114 119 127 . . . . .
APPROVED GOALS . . . . . . . . . .
PROPOSED GOALS . . . . . 133 140 140 140 140

2020 ACCOUNTABILITY PLAN University of Central Florida
BOT Approved 4/23/2020
18
KEY PERFORMANCE INDICATORS (cont.) Scholarship, Research & Innovation Metrics
19. Utility Patents Awarded 2015 2016 2017 2018 2019 2020 2021 2022 2023 2024
ACTUAL 58 59 48 40 50 . . . . .
APPROVED GOALS . . 65 45 45 45 45 45 . .
PROPOSED GOALS . . . . . 45 45 45 46 47
20. Number of Licenses/Options Executed Annually 2013-14 2014-15 2015-16 2016-17 2017-18 2018-19 2019-20 2020-21 2021-22 2022-23
ACTUAL 23 38 34 40 28 . . . . .
APPROVED GOALS . 31 34 34 34 36 36 36 . .
PROPOSED GOALS . . . . . 36 36 36 36 36
21. Number of Start-up Companies Created 2013-14 2014-15 2015-16 2016-17 2017-18 2018-19 2019-20 2020-21 2021-22 2022-23
ACTUAL 8 14 9 1 0 . . . . .
APPROVED GOALS . 10 15 10 12 14 15 15 . .
PROPOSED GOALS . . . . . 14 15 15 15 15
Institution Specific Goals
UCF Lake Nona Medical Center 2016 2017 2018 2019 2020 2021 2022 2023 2024 2025
HCA PARTNER-
SHIP
BOG APPROVAL
SECURE PERMITS
BEGIN CONST-
RUCTION
CONST- RUCTION
CONTINUES OPENING ROTATIONS
4th YEAR ROTATIONS
3rd YEAR
EXPANSION – SHELLED
BEDS
APPRVL TO BUILD
NURSING COLL. ON
AHSC CAMPUS

2020 ACCOUNTABILITY PLAN University of Central Florida
BOT Approved 4/23/2020
19
ENROLLMENT PLANNING
Fall Headcount Enrollment by Student Level [all degree-seeking students, all campuses]
UNDERGRADUATE 2015 2016 2017 2018 2019 2020 2021 2022 2023 2024
ACTUAL 54,075 55,253 56,424 58,402 58,962 . . . . .
APPROVED GOALS . . 56,000 57,595 58,410 58,400 58,400 58,400 . .
PROPOSED GOALS . . . . . 59,230 59,365 59,410 59,384 59,313
GRADUATE 2015 2016 2017 2018 2019 2020 2021 2022 2023 2024 ACTUAL 8,012 8,170 8,840 9,319 9,722 . . . . .
APPROVED GOALS . . 8,590 9,148 9,500 10,000 10,400 10,710 . .
PROPOSED GOALS . . . . . 10,257 10,696 11,072 11,393 11,675
Fall Headcount Enrollment by Student Type [all degree-seeking students, all campuses] UNDERGRADUATE 2015 2016 2017 2018 2019 2020 2021 2022 2023 2024
FTIC: New 6,535 6,403 6,879 7,230 7,321 7,332 7,332 7,332 7,332 7,332
FTIC: Returning 18,675 19,115 19,426 20,110 20,935 21,618 22,136 22,521 22,808 23,023
Transfer: FCS w/ AA 21,897 22,012 21,636 21,617 21,612 21,475 21,164 20,889 20,640 20,408
Transfer: Other 5,883 6,649 7,417 8,324 7,948 7,655 7,578 7,507 7,437 7,377
Post-Baccalaureates 1,085 1,074 1,066 1,121 1,146 1,150 1,155 1,161 1,167 1,173
Subtotal 54,075 55,253 56,424 58,402 58,962 59,230 59,365 59,410 59,384 59,313
GRADUATE 2015 2016 2017 2018 2019 2020 2021 2022 2023 2024 Master’s 5,663 5,812 6,359 6,668 6,944 7,410 7,776 8,081 8,336 8,552
Research Doctoral 1,724 1,732 1,787 1,897 1,960 2,010 2,060 2,110 2,160 2,210
Professional Doctoral 625 626 694 754 818 837 860 881 897 913
Subtotal 8,012 8,170 8,840 9,319 9,722 10,257 10,696 11,072 11,393 11,675
TOTAL 62,087 63,423 65,264 67,721 68,684 69,487 70,061 70,482 70,777 70,988 Note: This table reports this number of students enrolled by student type categories. These headcounts only include those seeking a degree – unclassified students (eg, dual enrolled) are not included. The student type for undergraduates is based on the ‘Type of Student at Most Recent Admission’. The First Time in College (FTIC) student was admitted in the same fall term or in the preceding summer term – this includes those who were re-admitted as FTICs.

2020 ACCOUNTABILITY PLAN University of Central Florida
BOT Approved 4/23/2020
20
ENROLLMENT PLANNING (cont.)
Percent of Baccalaureate-Seeking Resident Undergraduates Earning 15+ Credits [Fall term] 2015 2016 2017 2018 2019 2020 2021 2022 2023 2024
ACTUAL 11 11 12 13 12 . . . . .
APPROVED GOALS . . . . 14 15 16 17 . .
PROPOSED GOALS . . . . . 15 16 17 17 17
Full-Time Equivalent (FTE) Enrollment by Course Level 2014-15 2015-16 2016-17 2017-18 2018-19 2019-20 2020-21 2021-22 2022-23 2023-24
LOWER 16,024 16,797 17,299 17,882 18,737 19,064 19,117 19,177 19,222 19,243
UPPER 29,772 30,483 31,302 32,298 33,685 34,293 34,410 34,462 34,465 34,432
GRAD 1 4,087 4,152 4,285 4,674 4,844 4,976 5,184 5,439 5,627 5,781
GRAD 2 1,431 1,383 1,406 1,480 1,591 1,673 1,698 1,736 1,794 1,851
TOTAL 51,313 52,815 54,292 56,334 58,858 60,006 60,409 60,814 61,108 61,307
Note: Full-time Equivalent (FTE) student is a measure of all instructional activity (regardless of fundability) that is based on the number of credit hours for all students during an academic (summer, fall, spring) year. FTE is based on the standard national definition, which divides undergraduate credit hours by 30 and graduate credit hours by 24. Pursuant to section 1013.31, Florida Statutes, Board facilities staff use this data as a key factor in the calculation of facility space needs for university educational plant surveys.
Percent FTE Enrollment by Method of Instruction 2014-15 2015-16 2016-17 2017-18 2018-19 2019-20 2020-21 2021-22 2022-23 2023-24
UNDERGRADUATE All Distance (100%) . 31 33 32 31 31 31 32 32 33
Primarily Dist. (80-99%) . 0 0 2 6 8 8 8 8 8
Hybrid (50-79%) . 9 10 10 11 11 11 12 12 12
Classroom (0-49%) . 60 58 56 53 50 50 48 48 47
GRADUATE All Distance (100%) . 29 31 36 38 34 35 37 37 38
Primarily Dist. (80-99%) . 0 0 0 0 4 4 3 3 3
Hybrid (50-79%) . 12 11 10 10 10 10 10 10 9
Classroom (0-49%) . 60 58 54 52 52 51 50 50 50

2020 ACCOUNTABILITY PLAN University of Central Florida
BOT Approved 4/23/2020
21
ACADEMIC PROGRAM COORDINATION
New Programs for Consideration by Institution in AY 2020-21 The SUS Council of Academic Vice Presidents Academic Program Coordination Work Group will review these programs as part of their on-going coordination efforts. The programs listed below are based on the 2019 Accountability Plan list for programs under consideration for 2020-21.
PROGRAM TITLES CIP CODE
AREA OF STRATEGIC EMPHASIS
OTHER INST W/ SAME
PROGRAM
OFFERED VIA
DISTANCE LEARNING IN
SYSTEM
PROJECTED ENROLLMENT
IN 5TH YEAR
PROPOSED DATE OF
SUBMISSION TO UBOT
UNDERGRADUATE Neuroscience 26.1501 STEM - N 400 Feb-2021
MASTER’S, SPECIALIST AND OTHER ADVANCED MASTER’S PROGRAMS Cognitive Sciences 30.2501 STEM - N 50 Oct-2020
Cyber Security 11.1003 STEM FAMU, FIU, FSU, USF, UWF Y 60 Aug-2020
Event Leadership 52.0907 - - Y 60 Aug-2020 Planetary Science and Space Exploration 40.0203 STEM - N 40 Apr-2021
Themed Experiences 50.0401 GAP UF N 120 Jun-2020 DOCTORAL PROGRAMS
Biomedical Engineering 14.0501 STEM FAMU, FIU, FSU, UF, USF N 15 Dec-2020
Kinesiology 31.0505 STEM FSU, UF N 24 Jun-2020 Planetary Science and Space Exploration 40.0203 STEM - N 40 Apr-2021
Rehabilitation Sciences 51.2314 HLTH FSU, UF N 20 Feb-2021 Social Work 51.1503 HLTH FAU N 30 Feb-2021
New Programs for Consideration by Institution in AY 2021-22 These programs will be used in the 2021 Accountability Plan list for programs under consideration for 2021-22.
PROGRAM TITLES CIP CODE
AREA OF STRATEGIC EMPHASIS
OTHER INST W/ SAME
PROGRAM
OFFERED VIA
DISTANCE LEARNING IN
SYSTEM
PROJECTED ENROLLMENT
IN 5TH YEAR
PROPOSED DATE OF
SUBMISSION TO UBOT
DOCTORAL PROGRAMS Interdisciplinary Studies 30.0000 - - Y 12 Jun-2021 Neuroscience 26.1501 STEM FSU Y 50 Sep-2021

2020 ACCOUNTABILITY PLAN University of Central Florida
BOT Approved 4/23/2020
22
DEFINITIONS Performance Based Funding (PBF)
PBF-1. Percent of Bachelor's Graduates Enrolled or Employed ($25,000+) One Year After Graduation: This metric is based on the percentage of a graduating class of bachelor’s degree recipients who are enrolled or employed (earning at least $25,000) somewhere in the United States. Students who do not have valid social security numbers and are not found enrolled are excluded. This data now includes: non-Florida data from 44 states and districts, including the District of Columbia and Puerto Rico; and military enlistment as reported by the institutions. Sources: State University Database System (SUDS), Florida Department of Economic Opportunity (DEO) analysis of Wage Record Interchange System (WRIS2), and National Student Clearinghouse (NSC).
PBF-2. Median Wages of Bachelor’s Graduates Employed Full-time One Year After Graduation This metric is based on annualized Unemployment Insurance (UI) wage data from the fourth fiscal quarter after graduation for bachelor’s recipients. This data does not include individuals who are self-employed, employed by the military, those without a valid social security number, or making less than minimum wage. This data now includes non-Florida data from 44 states and districts, including the District of Columbia and Puerto Rico. State University Database System (SUDS), Florida Department of Economic Opportunity (DEO) analysis of Wage Record Interchange System (WRIS2).
PBF-3. Cost to the Student Net Tuition & Fees for Resident Undergraduates per 120 Credit Hours This metric compares the average sticker price and the average gift aid amount. The sticker price includes: (1) tuition and fees for resident undergraduates; (2) books and supplies (we use a proxy as calculated by the College Board); and (3) the average number of credit hours attempted by students who were admitted as an FTIC student who graduated with a bachelor’s degree from a program that requires only 120 credit hours. The gift aid amount includes: (1) financial aid (grants, scholarships, waivers and third-party payments) provided to resident undergraduate students during the most recent academic year; (2) the total number of credit hours for those resident undergraduates. The average gift aid award per credit hour was multiplied by 120 and compared to the sticker price. Source: State University Database System (SUDS), the Legislature’s annual General Appropriations Act, and university required fees.
PBF-4. Four Year FTIC Graduation Rate This metric is based on the percentage of first-time-in-college (FTIC) students who started in the Fall (or summer continuing to Fall) term and were enrolled full-time in their first semester and had graduated from the same institution by the summer term of their fourth year. FTIC includes ‘early admit’ students who were admitted as a degree-seeking student prior to high school graduation. Students who were enrolled in advanced graduate programs during their 4th year were excluded. Source: State University Database System (SUDS).
PBF-5. Academic Progress Rate [2nd Year Retention with 2.0 GPA or Above] This metric is based on the percentage of first-time-in-college (FTIC) students who started in the Fall (or summer continuing to Fall) term and were enrolled full-time in their first semester and were still enrolled in the same institution during the next Fall term with a grade point average (GPA) of at least 2.0 at the end of their first year (Fall, Spring, Summer). Source: State University Database System (SUDS).

2020 ACCOUNTABILITY PLAN University of Central Florida
BOT Approved 4/23/2020
23
DEFINITIONS (cont.) PBF-6. Bachelor's Degrees within Programs of Strategic Emphasis This metric is based on the number of baccalaureate degrees awarded within the programs designated by the Board of Governors as ‘Programs of Strategic Emphasis’. A student who has multiple majors in the subset of targeted Classification of Instruction Program codes will be counted twice (i.e., double-majors are included). Source: State University Database System (SUDS).
PBF-7. University Access Rate Percent of Undergraduates with a Pell-grant This metric is based the number of undergraduates, enrolled during the fall term, who received a Pell-grant during the fall term. Students who were not eligible for Pell-grants (e.g., Unclassified, non-resident aliens, post-baccs) were excluded from the denominator for this metric. Source: State University Database System (SUDS).
PBF-8a. Graduate Degrees within Programs of Strategic Emphasis This metric is based on the number of graduate degrees awarded within the programs designated by the Board of Governors as ‘Programs of Strategic Emphasis’. A student who has multiple majors in the subset of targeted Classification of Instruction Program codes will be counted twice (i.e., double-majors are included). Source: State University Database System (SUDS).
PBF-8b. Freshmen in Top 10% of High School Class (Applies only to NCF) Percent of all degree-seeking, first-time, first-year (freshman) students who had high school class rank within the top 10% of their graduating high school class. Source: New College of Florida as reported to the Common Data Set.
PBF-9. Percent of Bachelor's Degrees Without Excess Hours This metric is based on the percentage of baccalaureate degrees awarded within 110% of the credit hours required for a degree based on the Board of Governors Academic Program Inventory. This metric excludes the following types of student credits (ie, accelerated mechanisms, remedial coursework, non-native credit hours that are not used toward the degree, non-native credit hours from failed, incomplete, withdrawn, or repeated courses, credit hours from internship programs, credit hours up to 10 foreign language credit hours, and credit hours earned in military science courses that are part of the Reserve Officers’ Training Corps (ROTC) program). Starting in 2018-19, the calculation for this metric included a new type of statutory exclusion of up to 12 credit hours for students who graduated in four years or less. Source: State University Database System (SUDS).
Note: This metric does not report the number of students who paid the “Excess Hour Surcharge” (1009.286, FS).
PBF-10.FAMU: Number of Bachelor’s Degrees Awarded to Transfers with AA Degrees from FCS: This is a count of first-major baccalaureate degrees awarded to students who entered as FCS AA Transfers. First Majors include the most common scenario of one student earning one degree in one Classification of Instructional Programs (CIP) code. A student who earns two baccalaureate degrees under two different degree CIPs is counted twice. Source: State University Database System (SUDS).

2020 ACCOUNTABILITY PLAN University of Central Florida
BOT Approved 4/23/2020
24
DEFINITIONS (cont.) PBF-10.FAU: Total Research Expenditures ($M): Total expenditures (in millions of dollars) for all research activities (including non-science and engineering activities). Source: As reported by each institution to the National Science Foundation annual survey of Higher Education Research and Development (HERD) based on the NSF rules and definitions.
PBF-10.FGCU: Number of Bachelor’s Degrees Awarded to Hispanic & African-Americans: Race/Ethnicity data is self-reported by students. Non-Hispanic Black and Hispanic do not include students classified as Non-Resident Alien or students with a missing race code. Degree data is based on first-major counts only – second majors are not included.
PBF-10.FIU: Number of Post-Doctoral Appointees: The number of Postdoctoral Appointees awarded annually. This data is based on National Science Foundation/National Institutes of Health Survey of Graduate Students and Postdoctorates in Science and Engineering (GSS).
PBF-10.FPOLY: Percent of Bachelor’s Graduates with 2+ Workforce Experiences: The percentage of Bachelor’s recipients who completed at least two workforce experiences. Workforce experiences includes: External Internships, Industry-sponsored Capstone Projects, and Undergraduate Research (students on a funded research grant), and certifications. It is a requirement for all majors to conduct an external internship prior to graduation.
PBF-10.FSU: Percent of Bachelor’s Graduates who took an Entrepreneurship Class: The percentage of Bachelor’s recipients who enrolled in one or more graded Entrepreneurship courses before graduating.
PBF-10.NCF: Percent of FTIC Graduates Completing 3+ HIP’s: The percentage of graduating seniors who started as FTIC students and who completing three or more high-impact practices as defined by the National Survey of Student Engagement (NSSE) and the Association of American Colleges & Universities. High-impact practices include: (1) capstone project or thesis, (2) internships, (3) study abroad, (4) writing-intensive courses, (5) living-learning communities, (6) undergraduate research, (7) first-year experience, (8) learning communities, (9) service learning, (10) collaborative projects. Multiple activities within the same category only count once (e.g., a student completing three internships has completed one high impact practice).
PBF#10.UCF: Percent of Bachelor’s Degrees Awarded to African American and Hispanic Students: Percentage of Degrees is based on the number of baccalaureate degrees awarded to non-Hispanic Black and Hispanic students divided by the total degrees awarded - excluding those awarded to non-resident aliens and unreported. Source: State University Database System (SUDS).
PBF-10.UF: 6-Year Graduation Rates (FT only): The First-time-in-college (FTIC) cohort is defined as undergraduates entering in fall term (or summer continuing to fall) with fewer than 12 hours earned since high school graduation. The rate is the percentage of the initial cohort that has either graduated from the same institution by the summer term of their sixth academic year. Only full-time students are included in this calculation. FTIC includes ‘early admits’ students who were admitted as a degree-seeking student prior to high school graduation. Source: State University Database System (SUDS).

2020 ACCOUNTABILITY PLAN University of Central Florida
BOT Approved 4/23/2020
25
DEFINITIONS (cont.) PBF-10.UNF: Percent of Undergraduate FTE in Online Courses: Full-time Equivalent (FTE) student is a measure of instructional activity that is based on the number of credit hours that students enroll. FTE is based on the US definition, which divides undergraduate credit hours by 30. Distance Learning is a course in which at least 80 percent of the direct instruction of the course is delivered using some form of technology when the student and instructor are separated by time or space, or both (per 1009.24(17), F.S.). Source: State University Database System (SUDS).
PBF-10.USF: 6-Year Graduation Rates (FT/PT): The First-time-in-college (FTIC) cohort is defined as undergraduates entering in fall term (or summer continuing to fall) with fewer than 12 hours earned since high school graduation. The rate is the percentage of the initial cohort that has either graduated from the same institution by the summer term of their sixth academic year. Both full-time and part-time students are used in the calculation. FTIC includes ‘early admits’ students who were admitted as a degree-seeking student prior to high school graduation. Source: State University Database System (SUDS).
PBF-10.UWF: Percent of Baccalaureate Graduates Completing 2+ Types of High-Impact Practices: The percentage of graduating seniors completing two or more high-impact practices as defined by the Association of American Colleges & Universities. High-impact practices include: (1) First Year Seminar & Experiences, (2) Common Intellectual Experience, (3) Writing-Intensive Courses, (4) Collab Assignments & Projects, (5) Diversity/Global Learning, (6) ePortolios, (7) Service Learning, Community-Based Learning, (8) Internships, (9) Capstone Courses & Projects. Multiple activities within the same category only count once (e.g., a student completing three internships has completed one high impact practice).
Preeminence Research University (PRE)
PRE-A: Average GPA & Average SAT: An average weighted grade point average of 4.0 or higher and an average SAT score of 1200 or higher for fall semester incoming freshmen, as reported annually in the admissions data that universities submit to the Board of Governors. This data includes registered FTIC (student type='B','E') with an admission action of admitted or provisionally admitted ('A','P','X'). Source: State University Database System (SUDS).
PRE-B: National University Rankings: A top-50 ranking on at least two well-known and highly respected national public university rankings, reflecting national preeminence, using most recent rankings, includes: Princeton Review, Fiske Guide, QS World University Ranking, Times Higher Education World University Ranking, Academic Ranking of World University, US News and World Report National University, US News and World Report National Public University, US News and World Report Liberal Arts Colleges, Forbes, Kiplinger, Washington Monthly Liberal Arts Colleges, Washington Monthly National University, and Center for Measuring University Performance.
PRE-C: Freshmen Retention Rate: Freshman Retention Rate (Full-time, FTIC) cohorts are based on first-year undergraduate students who enter the institution in the Fall term (or Summer term and continue into the Fall term). Percent retained is based on those who are enrolled during the second fall term. Source: State University Database System (SUDS) and data submitted by the institutions to Integrated Postsecondary Education Data System (IPEDS).

2020 ACCOUNTABILITY PLAN University of Central Florida
BOT Approved 4/23/2020
26
DEFINITIONS (cont.) PRE-D: 4-year Graduation Rate: This metric is based on the percentage of first-time-in-college (FTIC) students who started in the Fall (or summer continuing to Fall) term and were enrolled full-time in their first semester and had graduated from the same institution by the summer term of their fourth year. FTIC includes ‘early admit’ students who were admitted as a degree-seeking student prior to high school graduation. Students who were enrolled in advanced graduate programs during their 4th year were excluded. Source: State University Database System (SUDS) and data submitted by the institutions to Integrated Postsecondary Education Data System (IPEDS).
PRE-E: National Academy Memberships: National Academy Memberships held by faculty as reported by the Center for Measuring University Performance in the Top American Research Universities (TARU) annual report or the official membership directories maintained by each national academy.
PRE-F: Total Science & Engineering Research Expenditures: Research Expenditures within Science & Engineering disciplines. Source: As reported by each institution to the National Science Foundation annual survey of Higher Education Research and Development (HERD) based on the NSF rules and definitions.
PRE-G: Science & Engineering Research Expenditures in Non-Health Sciences: Research expenditures within Science & Engineering in non-medical sciences. Source: As reported by each institution to the National Science Foundation annual survey of Higher Education Research and Development (HERD) based on the NSF rules and definitions.
PRE-H: National Ranking in Research Expenditures: The NSF identifies 8 broad disciplines within Science & Engineering (Computer Science, Engineering, Environmental Science, Life Science, Mathematical Sciences, Physical Sciences, Psychology, Social Sciences). The rankings by discipline are determined by BOG staff using the NSF online database.
PRE-I: Patents Awarded: Total utility patents awarded by the United States Patent and Trademark Office (USPTO) for the most recent three calendar year period. Based on legislative staff guidance, Board staff query the USPTO database with a query that only counts utility patents: "(AN/"University Name" AND ISD/yyyymmdd->yyyymmdd AND APT/1)".
PRE-J: Doctoral Degrees Awarded Annually: Includes Doctoral research degrees and professional doctoral degrees awarded in medical and health care disciplines. Source: State University Database System (SUDS).
PRE-K: Number of Post-Doctoral Appointees: The number of Postdoctoral Appointees awarded annually. This data is based on National Science Foundation/National Institutes of Health Survey of Graduate Students and Postdoctorates in Science and Engineering (GSS).
PRE-L: Endowment Size ($M): This data comes from the National Association of College and University Business Officers (NACUBO) and Commonfund Institute's annual report of Market Value of Endowment Assets.
Key Performance Indicators (KPI)
KPI-1: Public University National Ranking: A top-50 ranking on at least two well-known and highly respected national public university rankings, reflecting national preeminence, using most recent rankings, includes: Princeton Review, Fiske Guide, QS World University Ranking, Times Higher Education World University Ranking, Academic Ranking of World University, US News and World Report National University, US News and World Report National Public University, US News and World Report Liberal Arts Colleges, Forbes, Kiplinger, Washington Monthly Liberal Arts Colleges, Washington Monthly National University, and Center for Measuring University Performance.

2020 ACCOUNTABILITY PLAN University of Central Florida
BOT Approved 4/23/2020
27
DEFINITIONS (cont.) KPI-2: Freshmen in Top 10% of High School Class: Percent of all degree-seeking, first-time, first-year (freshman) students who had high school class rank within the top 10% of their graduating high school class. Source: As reported by the university to the Common Data Set.
KPI-3: Time to Degree for FTICs in 120hr programs: This metric is the number of years between the start date (using the student entry date) and the end date (using the last month in the term degree was granted) for a graduating class of first-time, single-major baccalaureates in 120 credit hour programs within a (Summer, Fall, Spring) year. Source: State University Database System (SUDS).
KPI-4: Six-Year FTIC Graduation Rates [full-& part-time students]: The First-time-in-college (FTIC) cohort is defined as undergraduates entering in fall term (or summer continuing to fall) with fewer than 12 hours earned since high school graduation. The rate is the percentage of the initial cohort that has either graduated from the same institution by the summer term of their sixth academic year. Both full-time and part-time students are used in the calculation. FTIC includes ‘early admits’ students who were admitted as a degree-seeking student prior to high school graduation. Source: State University Database System (SUDS).
KPI-5: FCS AA Transfer Three-Year Graduation Rate [full-& part-time students]: This transfer cohort is defined as undergraduates entering in fall term (or summer continuing to fall) from the Florida College System with an Associate in Arts (AA) degree. The rate is the percentage of the initial cohort that has either graduated from the same institution by the summer term of their third academic year. Both full-time and part-time students are used in the calculation. Students who were flagged as enrolled in advanced graduate programs that would not earn a bachelor’s degree were not excluded. Source: State University Database System (SUDS).
KPI-6: Pell Recipient Four-Year Graduation Rate [for Full-Time FTIC]: This metric is based on the percentage of first-time-in-college (FTIC) students who started in the Fall (or summer continuing to Fall) term and were enrolled full-time in their first semester and who received a Pell grant during their first year and who graduated from the same institution by the summer term of their fourth year. FTIC includes ‘early admit’ students who were admitted as a degree-seeking student prior to high school graduation. Students who were flagged as enrolled in advanced graduate programs that would not earn a bachelor’s degree were excluded. Source: State University Database System (SUDS).
KPI-7: Bachelor’s Degrees Awarded & KPI-8: Graduate Degrees Awarded: This is a count of first-major baccalaureate and graduate degrees awarded. First Majors include the most common scenario of one student earning one degree in one Classification of Instructional Programs (CIP) code. In cases where a student earns a baccalaureate degree under two different degree CIPs, a distinction is made between “dual degrees” and “dual majors.” Also included in first majors are “dual degrees” which are counted as separate degrees (e.g., counted twice). In these cases, both degree CIPs receive a “degree fraction” of 1.0. The calculation of degree fractions is made according to each institution’s criteria. Source: State University Database System (SUDS).
KPI-9: Bachelor’s Degrees Awarded to African-American & Hispanic Students: Race/Ethnicity data is self-reported by students. Non-Hispanic Black and Hispanic do not include students classified as Non-Resident Alien or students with a missing race code. Degree data is based on first-major counts only – second majors are not included. Percentage of Degrees is based on the number of baccalaureate degrees awarded to non-Hispanic Black and Hispanic students divided by the total degrees awarded - excluding those awarded to non-resident aliens and unreported. Source: State University Database System (SUDS).

2020 ACCOUNTABILITY PLAN University of Central Florida
BOT Approved 4/23/2020
28
DEFINITIONS (cont.) KPI-10: Percentage of Adult (Aged 25+) Undergraduates Enrolled: This metric is based on the age of the student at the time of their Fall term enrollment - not their age upon entry. As a proxy, age is based on birth year not birth date. Note: Unclassified students with a HS diploma (or GED) and above are included in this calculation. Source: State University Database System (SUDS).
KPI-11: Percent of Undergraduate FTE in Online Courses: Full-time Equivalent (FTE) student is a measure of instructional activity that is based on the number of credit hours that students enroll. FTE is based on the US definition, which divides undergraduate credit hours by 30. Distance Learning is a course in which at least 80 percent of the direct instruction of the course is delivered using some form of technology when the student and instructor are separated by time or space, or both (per 1009.24(17), F.S.). Source: State University Database System (SUDS).
KPI-12: Percent of Bachelor’s Degrees in STEM & Health & KPI-13: Percent of Graduate Degrees in STEM & Health: The percentage of baccalaureate degrees that are classified as STEM or Health disciplines by the Board of Governors in the Academic Program Inventory. These counts include second majors. Second Majors include all dual/second majors (e.g., degree CIP receive a degree fraction that is less than 1). The calculation of degree fractions is made according to each institution’s criteria. The calculation for the number of second majors rounds each degree CIP’s fraction of a degree up to 1 and then sums the total. Second Majors are typically used when providing degree information by discipline/CIP, to better conveys the number of graduates who have specific skill sets associated with each discipline. Source: State University Database System (SUDS).
KPI-14: Licensure & Certification Exam Pass Rates: The average pass rates as a percentage of all first-time examinees for Nursing, Law, Medicine (3 subtests), Veterinary, Pharmacy, Dental (2 subtests), Physical Therapy, and Occupational Therapy, when applicable. The average pass rate for the nation or state is also provided as a contextual benchmark. The Board’s 2025 System Strategic Plan calls for all institutions to be above or tied the exam’s respective benchmark. The State benchmark for the Florida Bar Exam excludes non-Florida institutions. The national benchmark for the USMLE exams are based on rates for MD degrees from US institutions.
KPI-15: National Academy Memberships: National Academy Memberships held by faculty as reported by the Center for Measuring University Performance in the Top American Research Universities (TARU) annual report or the official membership directories maintained by each national academy.
KPI-16: Faculty Awards: Awards include: American Council of Learned Societies (ACLS) Fellows, Beckman Young Investigators, Burroughs Wellcome Fund Career Awards, Cottrell Scholars, Fulbright American Scholars, Getty Scholars in Residence, Guggenheim Fellows, Howard Hughes Medical Institute Investigators, Lasker Medical Research Awards, MacArthur Foundation Fellows, Andrew W. Mellon Foundation Distinguished Achievement Awards, National Endowment for the Humanities (NEH) Fellows, National Humanities Center Fellows, National Institutes of Health (NIH) MERIT, National Medal of Science and National Medal of Technology, NSF CAREER awards (excluding those who are also PECASE winners), Newberry Library Long-term Fellows, Pew Scholars in Biomedicine, Presidential Early Career Awards for Scientists and Engineers (PECASE), Robert Wood Johnson Policy Fellows, Searle Scholars, Sloan Research Fellows, Woodrow Wilson Fellows.
2020 ACCOUNTABILITY PLAN University of Central Florida
BOT Approved 4/23/2020
29
DEFINITIONS (cont.) KPI-17: Total Research Expenditures: Total expenditures (in millions of dollars) for all research activities (including non-science and engineering activities). Source: As reported by each institution to the National Science Foundation annual survey of Higher Education Research and Development (HERD) based on the NSF rules and definitions.
KPI-18: Research Expenditures Funded from External Sources: This metric reports the amount of research expenditures that was funded from federal, private industry and other (non-state and non-institutional) sources. Source: As reported by each institution to the National Science Foundation annual survey of Higher Education Research and Development (HERD) based on the NSF rules and definitions.
KPI-19: Utility Patents Awarded [from the USPTO]: The number of utility patents awarded by the United States Patent and Trademark Office (USPTO) by Calendar year – does not include design, plant or other types.
KPI-20: Number of Licenses/Options Executed Annually: Licenses/options executed in the fiscal year for all technologies – as reported by universities on the Association of University Technology Managers Annual (AUTM) annual Licensing Survey.
KPI-21: Number of Start-up Companies Created: The number of start-up companies that were dependent upon the licensing of University technology for initiation – as reported by universities on the Association of University Technology Managers Annual (AUTM) annual Licensing Survey.
Enrollment Planning (ENRL)
ENRL-1: Fall Headcount Enrollment by Student Level and Student Type: This table reports the number of students enrolled by student type categories. These headcounts only include those students who were seeking a degree – unclassified students (e.g., dual enrolled) are not included. The student type for undergraduates is based on the ‘Type of Student at Most Recent Admission’. The First Time in College (FTIC) student was admitted in the same fall term or in the preceding summer term – this includes those who were re-admitted as FTICs.
ENRL-2: Percent of Resident Baccalaureate-Seeking Resident Undergraduates Earning 15+ Credits: This table reports the percent of baccalaureate-seeking resident undergraduates who earned fifteen or more credit hours during the fall term as reported on the Term Credit Hours Earned element (#01089). This includes the pass/fail courses in which the student earned a passing grade and excludes audited courses.
ENRL-3 Full-Time Equivalent Enrollment by Course Level: This table reports Full-time Equivalent (FTE) enrollment which is a measure of all instructional activity (regardless of fundability) that is based on the number of credit hours that students enroll. This FTE calculation is based on the standard national definition, which divides undergraduate credit hours by 30 and graduate credit hours by 24. Pursuant to section 1013.31, Florida Statutes, Board facilities staff use this data as a key factor in the calculation of facility space needs for institution educational plant surveys.
ENRL-4: Percent FTE Enrollment by Method of Instruction: This table reports the percentages of FTE enrollment that is classified as Distance Learning for all students at all campuses regardless of funding source. Distance Learning is a course in which at least 80 percent of the direct instruction of the course is delivered using some form of technology when the student and instructor are separated by time or space, or both (per 1009.24(17), F.S.).