88
2020 Annual Report and Form 10-K

2020 Annual Report and Form 10-K

A Letter from Cass Chairman, President and Chief Executive Officer, Eric Brunngraber
As we enter 2021 with renewed enthusiasm, and a great desire to place 2020 behind us, it is gratifying
to reflect upon all the wonderful accomplishments we
achieved during the year. Before we begin however,
a few words on COVID-19, the global pandemic,
and its effects on the economy and Cass.
The pandemic, which greatly affected all of us, had a
substantial impact on Cass beginning in the spring of
2020. Our first priority was the safety of our staff and
customers. We immediately activated our Pandemic
Response Plan which, with some effort and adjustments,
allowed us to continue our daily operations and reliably
serve our customers in a safe manner. We continue
to operate under this plan today. The pandemic and
related shutdowns affected our clients in many ways,
but the net results for the year were significant declines
in items and dollars processed and reduced customer
loan demand. The federal PPP loan program, and the
associated credit we extended to bank customers, did
mitigate some of these negative effects. The final, and
most consequential issue was the drastic decline in
interest rates and the related actions taken by the Federal
Reserve that severely reduced our net interest margin.
Against this backdrop, we have much to be proud of.
We were able to keep pace with processing volumes
throughout the year in an offsite environment, develop
new solutions on the fly to assist our customers,
continue to invest in new technologies and services,
and maintain a pipeline of new business and customers.
We began and continue to reposition our balance
sheet and adjust our service mix and other elements
to lessen the impact of lower interest rates. Please visit
the Investors section of our website to see more detail,
by business unit, of many of these accomplishments.
Although the negative impact of the pandemic on the
activities of our clients combined with lower interest
rates reduced revenues and earnings from last year’s
record year, we remain very profitable, liquid, and strong.
We have also significantly augmented our leadership
team during 2020. Martin Resch joins us in the new
role of Chief Operating Officer. Matt Schuckman joins
us as our first in-house General Counsel. More recently,
Mike Normile has joined Cass and been named Chief
Financial Officer. Steve Appelbaum, our CFO for the past
15 years, will retire later this year. Matt and Mike have both
worked previously with Cass as outside counsel and
external auditor and are very familiar with our staff,
business, strategy, and culture. These individuals,
working in concert with our current leadership team, will
capably ensure the continuity of our business plan. In
addition, they bring specific new talents and experiences
that will enable us to move more quickly and with a
greater degree of agility in the future we envision.
Looking forward, we see excellent growth potential in
our markets, through both the addition of new clients
and our ability to continue to develop and market new
services. We also continue to explore new markets
where we can add value. How does Cass create value?
We provide the means to accept highly diverse inputs
spanning paper, digitized documents, digital data, and
data feeds in multiple formats. We turn unstructured
inputs into structured and actionable information,
typically around financial transactions but also including
supporting data elements for auditing purposes. We
support client/vendor relationships, inserting highly
qualified business experts and industry specialists
into the conversation. We are the trusted third party,
validating pricing and contractual agreements. We are
recognized by the high level of service we provide, while
processing millions of these transactions and billions
of dollars accurately, on time, and in a cost effective,
safe, and secure manner. We also provide payment and
financing solutions in conjunction with these services and
to customers of our subsidiary, Cass Commercial Bank.
I am delighted to direct you to the revamped Investor
section of our website. Here you will find highlights
of our recent accomplishments, the initiatives we are
currently undertaking, and our vision for the future.
We will update this information throughout the year
so you can follow our progress. I also encourage
you to read our 2020 Annual Report and Form 10-K
and other filings for further financial information.
On behalf of the Board of Directors and our leadership
team, I wish to thank you for your support and belief
in the future success of Cass. I am proud and thankful
to work with the outstanding and dedicated Cass team,
that met all the challenges of 2020 with confidence,
resourcefulness, and a lot of hard work. I remain humbly
grateful for God’s blessings, inspiration, and guidance.
Sincerely,
Dear Fellow Shareholders,
Eric H. BrunngraberChairman, President, and
Chief Executive Officer
Cass Information Systems, Inc.

UNITED STATES SECURITIES AND EXCHANGE COMMISSION
Washington, D.C. 20549
FORM 10-K (Mark One) ANNUAL REPORT PURSUANT TO SECTION 13 OR 15(d) OF THE SECURITIES
EXCHANGE ACT OF 1934 For the fiscal year ended December 31, 2020
TRANSITION REPORT PURSUANT TO SECTION 13 OR 15(d) OF THE SECURITIES EXCHANGE ACT OF 1934 For the transition period from to
Commission file number 000-20827 CASS INFORMATION SYSTEMS, INC. (Exact name of registrant as specified in its charter)
Missouri 43-1265338 (State or other jurisdiction of incorporation or organization) (I.R.S. Employer Identification No.)
12444 Powerscourt Drive, Suite 550, St. Louis, Missouri 63131 (314) 506-5500 (Address of principal executive offices) (Zip Code) (Telephone Number, incl. area code)
Securities registered pursuant to Section 12(b) of the Act: Title of each class Trading Symbol Name of each exchange on which registered
Common Stock, par value $0.50 per share
CASS The Nasdaq Global Select Market
Securities registered pursuant to Section 12(g) of the Act: Title of each Class
None
Indicate by check mark if the registrant is a well-known seasoned issuer, as defined in Rule 405 of the Securities Act. Yes No
Indicate by check mark if the registrant is not required to file reports pursuant to Section 13 or Section 15(d) of the Act. Yes No
Indicate by check mark whether the registrant (1) has filed all reports required to be filed by Section 13 or 15(d) of the Securities Exchange Act of 1934 during the preceding 12 months (or for such shorter period that the registrant was required to file such reports), and (2) has been subject to such filing requirements for the past 90 days. Yes No
Indicate by check mark whether the registrant has submitted electronically every Interactive Data File required to be submitted pursuant to Rule 405 of Regulation S-T (§232.405 of this chapter) during the preceding 12 months (or for such shorter period that the registrant was required to submit such files). Yes No
Indicate by check mark whether the registrant is a large accelerated filer, an accelerated filer, a non-accelerated filer, a smaller reporting company, or an emerging growth company. See definitions of “large accelerated filer,” “accelerated filer,” “smaller reporting company,” and “emerging growth company” in Rule 12b-2 of the Exchange Act. Large accelerated filer: Accelerated filer: Non-accelerated filer: Smaller reporting company: Emerging growth company: If an emerging growth company, indicate by check mark if the registrant has elected not to use the extended transition period for complying with any new or revised financial accounting standards provided pursuant to Section 13(a) of the Exchange Act.

Indicate by check mark whether the registrant has filed a report on and attestation to its management's assessment of the effectiveness of its internal control over financial reporting under Section 404(b) of the Sarbanes-Oxley Act (15 U.S.C. 7262(b)) by the registered public accounting firm that prepared or issued its audit report.
Indicate by check mark whether the registrant is a shell company (as defined in Rule 12b-2 of the Exchange Act). Yes No The aggregate market value of the common stock held by non-affiliates of the Registrant was approximately $550,311,000 based on the closing price of the common stock of $39.03 on June 30, 2020, as reported by The Nasdaq Global Select Market. As of February 17, 2021, the Registrant had 14,394,275 shares outstanding of common stock.
DOCUMENTS INCORPORATED BY REFERENCE
Certain information required for Part III of this report is incorporated by reference to the Registrant’s Proxy Statement for the 2021 Annual Meeting of Shareholders.
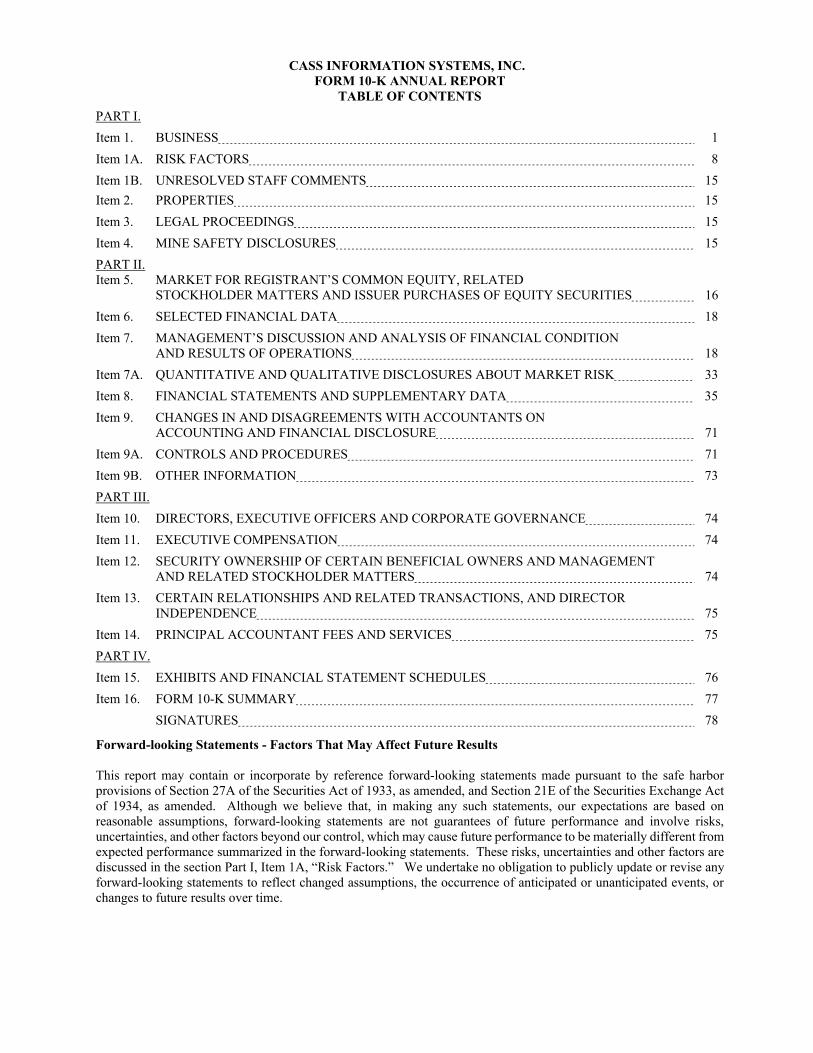
CASS INFORMATION SYSTEMS, INC. FORM 10-K ANNUAL REPORT
TABLE OF CONTENTS
PART I.
Item 1. BUSINESS 1
Item 1A. RISK FACTORS 8
Item 1B. UNRESOLVED STAFF COMMENTS 15
Item 2. PROPERTIES 15
Item 3. LEGAL PROCEEDINGS 15
Item 4. MINE SAFETY DISCLOSURES 15
PART II. Item 5. MARKET FOR REGISTRANT’S COMMON EQUITY, RELATED STOCKHOLDER MATTERS AND ISSUER PURCHASES OF EQUITY SECURITIES 16
Item 6. SELECTED FINANCIAL DATA 18
Item 7. MANAGEMENT’S DISCUSSION AND ANALYSIS OF FINANCIAL CONDITION AND RESULTS OF OPERATIONS 18
Item 7A. QUANTITATIVE AND QUALITATIVE DISCLOSURES ABOUT MARKET RISK 33
Item 8. FINANCIAL STATEMENTS AND SUPPLEMENTARY DATA 35
Item 9. CHANGES IN AND DISAGREEMENTS WITH ACCOUNTANTS ON ACCOUNTING AND FINANCIAL DISCLOSURE 71
Item 9A. CONTROLS AND PROCEDURES 71
Item 9B. OTHER INFORMATION 73
PART III.
Item 10. DIRECTORS, EXECUTIVE OFFICERS AND CORPORATE GOVERNANCE 74
Item 11. EXECUTIVE COMPENSATION 74
Item 12. SECURITY OWNERSHIP OF CERTAIN BENEFICIAL OWNERS AND MANAGEMENT AND RELATED STOCKHOLDER MATTERS 74
Item 13. CERTAIN RELATIONSHIPS AND RELATED TRANSACTIONS, AND DIRECTOR INDEPENDENCE 75
Item 14. PRINCIPAL ACCOUNTANT FEES AND SERVICES 75
PART IV.
Item 15. EXHIBITS AND FINANCIAL STATEMENT SCHEDULES 76
Item 16. FORM 10-K SUMMARY 77
SIGNATURES 78
Forward-looking Statements - Factors That May Affect Future Results This report may contain or incorporate by reference forward-looking statements made pursuant to the safe harbor provisions of Section 27A of the Securities Act of 1933, as amended, and Section 21E of the Securities Exchange Act of 1934, as amended. Although we believe that, in making any such statements, our expectations are based on reasonable assumptions, forward-looking statements are not guarantees of future performance and involve risks, uncertainties, and other factors beyond our control, which may cause future performance to be materially different from expected performance summarized in the forward-looking statements. These risks, uncertainties and other factors are discussed in the section Part I, Item 1A, “Risk Factors.” We undertake no obligation to publicly update or revise any forward-looking statements to reflect changed assumptions, the occurrence of anticipated or unanticipated events, or changes to future results over time.

[This page intentionally left blank.]

1
PART I. ITEM 1. BUSINESS Description of Business Cass Information Systems, Inc. (“Cass” or the “Company”) provides payment and information processing services to large manufacturing, distribution and retail enterprises across the United States. The Company’s services include freight invoice rating, payment processing, auditing, and the generation of accounting and transportation information. Cass also processes and pays facility-related invoices, which include electricity and gas as well as waste and telecommunications expenses, and is a provider of telecom expense management solutions. Cass solutions include a B2B payment platform for clients that require an agile fintech partner. Additionally, the Company offers an on-line platform to provide generosity services for faith-based and non-profit organizations. The Company’s bank subsidiary, Cass Commercial Bank (the “Bank”), supports the Company’s payment operations. The Bank also provides banking services to its target markets, which include privately-owned businesses and faith-based ministries in the St. Louis metropolitan area as well as other selected cities in the United States. Company Strategy and Core Competencies Cass is an information services company with a primary focus on processing payables and payables-related transactions for large corporations located in the United States. Cass possesses four core competencies that encompass most of its processing services. Data acquisition – This refers to the gathering of data elements from diverse, heterogeneous sources and the building of complete databases for our customers. Data is the raw material of the information economy. Cass gathers vital data from complex and diverse input documents, electronic media, proprietary databases and data feeds, including data acquired from vendor invoices as well as customer procurement and sales systems. Through its numerous methods of obtaining streams and pieces of raw data, Cass is able to assemble vital data into centralized data management systems and warehouses, thus producing an engine to create the power of information for managing critical corporate functions and processing systems. Data management – Once data is assembled, Cass is able to utilize the power from derived information to produce significant savings and benefits for its clients. This information is integrated into customers’ unique financial and accounting systems, eliminating the need for internal accounting processing and providing internal and external support for these critical systems. Information is also used to produce management and exception reporting for operational control, feedback, planning assistance and performance measurement. Business Intelligence – Receiving information in the right place at the right time and in the required format is paramount for business survival. Cass’ information delivery solutions provide reports, digital images, data files and retrieval capabilities through the internet or directly into customer internal systems. Cass’ proprietary internet management delivery system is the foundation for driving these critical functions. Transaction, operational, control, status and processing exception information are all delivered through this system creating an efficient, accessible and highly reliable asset for Cass customers. Financial exchange – Since Cass is unique among its competition in that it owns a commercial bank, it is also able to manage the movement of funds from its customers to their suppliers. This is a distinguishing factor, which clearly requires the processing capability, operating systems and financial integrity of a banking organization. Cass provides immediate, accurate, controlled and protected funds management and transfer system capabilities for all of its customers. Old and costly check processing and delivery mechanisms are replaced with more efficient electronic cash management and funds transfer systems. Cass’ core competencies allow it to perform the highest volumes of transaction processing in an integrated, efficient and systematic approach. Not only is Cass able to process the transaction, it is also able to collect the data defining the transaction and effect the financial payment governing its terms. These core competencies, enhanced through shared business processes, drive Cass’ strategic business units. Building upon these foundations, Cass continues to explore new business opportunities that leverage these competencies and processes. Marketing, Customers and Competition
The Company, through its Transportation Information Services business unit, is one of the largest firms in the transportation bill processing and payment industry in the United States based on the total dollars of transportation bills paid and items processed. Competition consists of a few primary competitors and numerous small transportation bill audit firms located throughout the United States. While offering transportation payment services, few of these audit firms compete on a national basis. These competitors compete mainly on price, functionality and service levels. The Company, through its Expense Management business unit, also competes with other companies located throughout the United States that pay energy and waste bills and provide management reporting. Available data indicates that the Company is one of the largest providers of energy information processing and payment services. Cass is unique among these competitors in that it is not exclusively affiliated

2
with any one energy service provider (“ESP”). Various ESPs market the Company’s services, adding value with their unique auditing, consulting and technological capabilities. Many of Cass’ services are customized for the ESPs, providing a full-featured solution without any development costs to the ESP. The Company, through its Telecom Information Services business unit, is a leader in the growing telecom expense management market and competes with other companies located throughout the United States in this market. The Company, through its Waste Expense Management business competes against small expense management companies along with large national account programs of major haulers. The Company division known as Gyve Generosity Services uses an on-line platform to provide generosity services for faith-based and non-profit organizations, which is a complementary service offering to the Bank’s faith-based customers. Also, the Company through its Integrated Financial Services business competes with providers of corporate payment solutions.
The Bank is organized as a Missouri trust company with banking powers and was founded in 1906. The Company was originally classified as a bank holding corporation due to its ownership of a federally-insured commercial bank and was originally organized in 1982 as Cass Commercial Corporation under the laws of Missouri. Approval by the Board of Governors of the Federal Reserve System was received in February 1983. The Company changed its name to Cass Information Systems, Inc. in January 2001. In December 2011, the Federal Reserve Bank (“FRB”) of St. Louis approved the election of Cass Information Systems, Inc. to become a financial holding company. As a financial holding company, Cass may engage in activities that are financial in nature or incidental to a financial activity. The Bank encounters competition from numerous banks and financial institutions located throughout the St. Louis, Missouri metropolitan area and other areas in which the Bank competes. The Bank’s principal competitors, however, are large bank holding companies that are able to offer a wide range of banking and related services through extensive branch networks. The Bank targets its services to privately held businesses located in the St. Louis, Missouri area and faith-based ministries located in St. Louis, Missouri and other selected cities located throughout the United States.
The Company holds several trademarks for the payment and rating services it provides. These include: FreightPay, Transdata, Ratemaker, Best Rate, Rate Exchange, CassPort, Cass Freight Index, Cass Truckload Linehaul Index, Cass Intermodal Price Index Expense$mart, ExpenseSmart, WasteVision™ and Direct2Carrier Payments™. The Company holds patents for methods and systems for managing employee-liable expenses and methods and systems for communicating expense management information. The Company and its subsidiaries have a varied client base and are not dependent on any one customer or group of customers for a significant portion of its business. Employees and Human Capital Resources
The Company and its subsidiaries had 862 full-time and 239 part-time employees as of February 17, 2021. Of these employees, the Bank had 63 full-time and one part-time employee. Cass has long been committed to comprehensive and competitive compensation and benefits programs to attract and retain talent in a competitive environment. Retention of skilled and highly trained employees is critical as the Company’s future operating results depend substantially upon the continued service of executive officers and key personnel. Furthering the philosophy to attract and retain a pool of talented and motivated employees who will continue to advance the Company’s purpose and contribute to overall success, compensation and benefits programs include: a noncontributory profit sharing program for most employees; a defined contribution 401(k) plan to provide retirement benefits to eligible employees; a performance-based equity compensation program for executive officers and key personnel; and incentive programs for loan and sales personnel. Cass also provides comprehensive health, dental, and vision plans to most employees, as well as free employee assistance programs to all employees and members of their families. The Company invests in employees’ future by assisting with tuition reimbursement for continued education throughout the Company’s employee ranks. Employees are also able to participate in educational seminars run by outside parties to maintain and expand professional knowledge. In order to develop a workforce that aligns with the Company’s corporate values, regularly sponsored campaigns and events occur, such as charitable workplace campaigns, food drives to assist local food banks, and toy drives to support charities during the holidays. Additionally, the Company supports a number of organizations with annual financial contributions. Cass strives to place the health and well-being of employees above all else. Never has this been more necessary than during the novel coronavirus (“COVID-19”) pandemic. In response to the COVID-19 pandemic, the Company has taken significant steps to protect the health and well-being of employees and clients. These steps include implementing a work-from-home policy for the majority of employees, establishing safety guidelines in facilities based on guidance from the U.S. Centers for Disease Control and Prevention (“CDC”), and pausing travel that was routine in the Company’s operations.
3
Supervision and Regulation The Company and its bank subsidiary are extensively regulated under federal and state law. These laws and regulations are intended to primarily protect depositors, not shareholders. The Bank is subject to regulation and supervision by the Missouri Division of Finance, the FRB and the Federal Deposit Insurance Corporation (the “FDIC”). The Company is a financial holding company within the meaning of the Bank Holding Company Act of 1956, as amended (the “BHC Act”), and as such, it is subject to regulation, supervision and examination by the FRB. Significant elements of the laws and regulations applicable to the Company and the Bank are described below. The description is qualified in its entirety by reference to the full text of the statutes, regulations and policies that are described. Also, such statutes, regulations and policies are continually under review by Congress and state legislatures and federal and state regulatory agencies. A change in statutes, regulations or regulatory policies applicable to the Company and its subsidiaries could have a material effect on the business, financial condition and results of operations of the Company. Bank Holding Company Activities – In general, the BHC Act limits the business of bank holding companies to banking, managing or controlling banks and other related activities. In addition, bank holding companies that qualify and elect to be financial holding companies, such as the Company, may engage in any activity, or acquire and retain the shares of a company engaged in any activity, that is either (i) financial in nature or incidental to such financial activity or (ii) complementary to a financial activity and does not pose a substantial risk to the safety and soundness of depository institutions or the financial system generally. Such permitted activities include securities underwriting and dealing, insurance underwriting and making merchant banking investments. To maintain financial holding company status, a financial holding company and all of its depository institution subsidiaries must be “well capitalized” and “well managed.” A depository institution subsidiary is considered to be “well capitalized” if it satisfies the requirements for this status discussed in the section “Prompt Corrective Action” below. A depository institution subsidiary is considered “well managed” if it received a composite rating and management rating of at least “satisfactory” in its most recent examination. A financial holding company’s status will also depend upon it maintaining its status as “well capitalized” and “well managed’ under applicable FRB regulations. If a financial holding company ceases to meet these capital and management requirements, the FRB may impose limitations or conditions on the conduct of its activities during the non-compliance period, and the company may not commence any of the broader financial activities permissible for financial holding companies or acquire a company engaged in such financial activities without prior approval of the FRB. If the company does not return to compliance within 180 days, the FRB may require divestiture of the holding company’s depository institutions. In order for a financial holding company to commence any new activity permitted by the BHC Act or to acquire a company engaged in any new activity permitted by the BHC Act, each insured depository institution subsidiary of the financial holding company must have received a rating of at least “satisfactory” in its most recent examination under the Community Reinvestment Act. See “Community Reinvestment Act” below. The FRB has the power to order any bank holding company or its subsidiaries to terminate any activity or to terminate its ownership or control of any subsidiary when the FRB has reasonable grounds to believe that continuation of such activity or such ownership or control constitutes a serious risk to the financial soundness, safety or stability of any bank subsidiary of the bank holding company. The BHC Act, the Bank Merger Act, and other federal and state statutes regulate acquisitions of banks and banking companies. The BHC Act requires the prior approval of the FRB for the direct or indirect acquisition by the Company of more than 5% of the voting shares or substantially all of the assets of a bank or bank holding company. Under the Bank Merger Act, the prior approval of the FRB or other appropriate bank regulatory authority is required for the Bank to merge with another bank or purchase the assets or assume the deposits of another bank. In reviewing acquisition applications, the bank regulatory authorities will consider, among other things, the competitive effect and public benefits of the transactions, the capital position of the combined organization, the risks to the stability of the U.S. banking or financial system, the applicant’s performance record under the Community Reinvestment Act and its compliance with fair housing laws. The Dodd-Frank Act – The Dodd-Frank Wall Street Reform and Consumer Protection Act (the “Dodd-Frank Act”), enacted in July 2010, significantly restructured the financial regulatory environment in the United States, affecting all bank holding companies and banks, including the Company and the Bank, some of which are described in more detail below. The impact of the Dodd-Frank Act on the Company and the Bank has been substantial. Dividends and Stock Repurchases – Both the Company and the Bank are subject to various regulations that restrict their ability to pay dividends and the amount of dividends that they may pay. Under the Federal Deposit Insurance Corporation Improvement Act of 1991, a depository institution, such as the Bank, may not pay dividends if payment would cause it to become undercapitalized or if it is already undercapitalized. The payment of dividends by the Company and the Bank may also be affected or limited by other factors, such as the requirement to maintain adequate capital and, under certain circumstances, the ability of federal regulators to prohibit dividend payments as an unsound or unsafe practice.
4
In July 2019, the federal bank regulators adopted final rules (the “Capital Simplifications Rules”) applicable to banks, like Cass, that are not subject to the advanced approaches capital framework that applies to large, internationally active banking organizations with at least $250 billion in total consolidated assets or at least $10 billion in total on-balance sheet foreign exposure. Among other things, the Capital Simplifications Rules eliminated the standalone Federal Reserve prior approval requirement in the Basel III Capital Rules for any repurchase of common stock. In certain circumstances, the Company’s repurchases of its common stock may be subject to a prior approval or notice requirement under other regulations, policies or supervisory expectations of the Federal Reserve Board. Capital Requirements – As a bank holding company, the Company and the Bank are subject to capital requirements pursuant to the FRB’s capital guidelines which include (i) risk-based capital guidelines, which are designed to make capital requirements more sensitive to various risk profiles and account for off-balance sheet exposure; (ii) guidelines that consider market risk, which is the risk of loss due to change in value of assets and liabilities due to changes in interest rates; and (iii) guidelines that use a leverage ratio which places a constraint on the maximum degree of risk to which a financial holding company may leverage its equity capital base. Effective July 2, 2013, the FRB approved final rules known as the “Basel III Capital Rules” that substantially revised the risk-based capital and leverage capital requirements applicable to bank holding companies and depository institutions, including the Company and the Bank. The Basel III Capital Rules implement aspects of the Basel III capital framework agreed upon by the Basel Committee and incorporate changes required by the Dodd-Frank Act. The Basel III Capital Rules implemented common equity Tier 1 capital as a new capital measure, which is generally defined as common stockholders’ equity and retained earnings. Tier 1 capital is generally defined as common equity Tier 1 and Additional Tier 1 capital. Additional Tier 1 capital generally includes certain noncumulative perpetual preferred stock and related surplus and minority interests in equity accounts of consolidated subsidiaries. Total capital includes Tier 1 capital (common equity Tier 1 capital plus Additional Tier 1 capital) and Tier 2 capital. Tier 2 capital is comprised of capital instruments and related surplus meeting specified requirements. Also included in Tier 2 capital is the allowance for credit losses limited to a maximum of 1.25% of risk-weighted assets and, for non-advanced approaches institutions like Cass that have exercised a one-time opt-out election regarding the treatment of Accumulated Other Comprehensive Income (“AOCI”), up to 45% of net unrealized gains on available-for-sale equity securities with readily determinable fair market values. The calculation of all types of regulatory capital is subject to deductions and adjustments specified in the regulations. For instance, the Basel III Capital Rules and the Capital Simplification Rules provide for a number of deductions from and adjustments to common equity Tier 1 capital. These include, for example, the requirement that certain deferred tax assets and significant investments in non-consolidated financial entities be deducted from Tier 1 capital to the extent that any one such category exceeds 25% of common equity Tier 1 capital. Prior to the adoption of the Capital Simplification Rules, amounts were deducted from common equity Tier 1 capital to the extent that any one such category exceeded 10% of common equity Tier 1 capital or all such items, in the aggregate, exceeded 15% of common equity Tier 1 capital. The Capital Simplification Rules took effect for the Company and the Bank as of January 1, 2020. In determining the amount of risk-weighted assets for purposes of calculating risk-based capital ratios, all assets, including certain off-balance sheet assets are multiplied by a risk weight factor assigned by the regulations based on the risks believed inherent in the type of asset. Higher levels of capital are required for asset categories believed to present greater risk. For example, a risk weight of 0% is assigned to cash and U.S. government securities, a risk weight of 50% is generally assigned to prudently underwritten first lien one to four-family residential mortgages, a risk weight of 100% is assigned to commercial and consumer loans, a risk weight of 150% is assigned to certain past due loans, and a risk weight of between 0% to 600% is assigned to permissible equity interests, depending on certain specified factors. Fully phased-in as of January 1, 2019, the Basel III Capital Rules require banking organizations, like Cass, to maintain:
a minimum ratio of common equity Tier 1 capital to risk-weighted assets of at least 4.5%, plus a 2.5% capital conservation buffer;
a minimum ratio of Tier 1 capital to risk-weighted assets of at least 6.0%, plus a 2.5% capital conservation buffer; a minimum ratio of total capital (that is, Tier 1 plus Tier 2 capital) to risk-weighted assets of at least 8.0%, plus the
2.5% capital conservation buffer; and a minimum leverage ratio of 4.0%, calculated as the ratio of Tier 1 capital to adjusted average consolidated assets.
The capital conservation buffer is designed to absorb losses during periods of economic stress. Banking institutions with a ratio of common equity Tier 1 capital to risk-weighted assets above the minimum but below the conservation buffer will face limitations on the payment of dividends, common stock repurchases and discretionary cash payments to executive officers based on the amount of the shortfall.
5
The FRB has authority to establish individual minimum capital requirements in appropriate cases upon a determination that an institution’s capital level is or may become inadequate in light of the particular risks or circumstances. As of December 31, 2020, the Company and the Bank met all capital adequacy requirements under the Basel III Capital Rules. In December 2017, the Basel Committee published standards that it described as the finalization of the Basel III post-crisis regulatory reforms (commonly referred to as “Basel IV”). Among other things, these standards revise the Basel Committee's standardized approach for credit risk (including by recalibrating risk weights and introducing new capital requirements for certain “unconditionally cancellable commitments,” such as unused credit card lines of credit) and provides a new standardized approach for operational risk capital. Under the Basel framework, these standards will generally be effective on January 1, 2022, with an aggregate output floor phasing in through January 1, 2027. Under the current U.S. capital rules, operational risk capital requirements and a capital floor apply only to advanced approaches institutions, and not to the Company or the Bank. The impact of Basel IV on the Company will depend on the manner in which it is implemented by the federal bank regulators. Source of Strength Doctrine – FRB and other regulations require bank holding companies to act as a source of financial and managerial strength to their subsidiary banks. Under this requirement, the Company is expected to commit resources to support the Bank. Any capital loans by a bank holding company to any of its subsidiary banks are subordinate in right of payment to depositors and to certain other indebtedness of such subsidiary banks. In the event of a bank holding company’s bankruptcy, any commitment by the bank holding company to a federal bank regulatory agency to maintain the capital of a subsidiary bank will be assumed by the bankruptcy trustee and entitled to priority of payment. Deposit Insurance – Substantially all of the deposits of the Bank are insured up to applicable limits by the Deposit Insurance Fund (“DIF”) of the FDIC, and the Bank is subject to deposit insurance assessments to maintain the DIF. Deposit insurance assessments are based on average consolidated total assets minus average tangible equity. Under the FDIC’s risk-based assessment system, insured institutions with less than $10 billion in assets, such as the Bank, are assigned to one of four risk categories based on supervisory evaluations, regulatory capital level, and certain other factors, with less risky institutions paying lower assessments. An institution’s assessment rate depends upon the category to which it is assigned and certain other factors. FDIC insurance expense totaled approximately $152,500, $108,700 and $222,200 for the years ended December 31, 2020, 2019 and 2018, respectively. The FDIC may terminate deposit insurance upon a finding that the institution has engaged in unsafe and unsound practices, is in an unsafe or unsound condition to continue operations, or has violated any applicable law, regulation, rule, order or condition imposed by the FDIC. Prompt Corrective Action – The Basel III Capital Rules incorporate new requirements into the prompt correction action framework, described above. The Federal Deposit Insurance Act (“FDIA”) requires that federal banking agencies take “prompt corrective action” against depository institutions that do not meet minimum capital requirements and includes the following five capital tiers: “well-capitalized,” “adequately capitalized,” “undercapitalized,” “significantly undercapitalized” and “critically undercapitalized.” A depository institution’s capital tier will depend upon how its capital levels compare with various relevant capital measures and certain other factors, as established by regulation. A depository institution is deemed to be (i) “well-capitalized” if the institution has a total risk-based capital ratio of 10% or greater, a Tier 1 risk-based capital ratio of 8% or greater, a leverage ratio of 5% or greater, a common equity Tier 1 ratio of 6.5% or greater and is not subject to any regulatory order agreement or written directive to meet and maintain a specific capital level for any capital measure; (ii) “adequately capitalized” if the institution has a total risk-based capital ratio of 8% or greater, a Tier 1 risk-based capital ratio of 6% or greater, a leverage ratio of 4% or greater, a common equity Tier 1 ratio of 4.5% or greater and does not meet the definition of “well capitalized”; (iii) “undercapitalized” if the institution has a total risk-based capital ratio that is less than 8%, a Tier 1 risk-based capital ratio of less than 6%, a leverage ratio of less than 4% or a common equity Tier 1 ratio of less than 4.5%; (iv) “significantly undercapitalized” if the institution has a total risk-based capital ratio of less than 6%, a Tier 1 risk-based capital ratio of less than 4%, a leverage ratio of less than 3% or a common equity Tier 1 ratio of less than 3%; and (v) “critically undercapitalized” if the institution has a ratio of tangible equity (as defined in the regulations) to total assets that is equal to or less than 2%. An institution may be deemed to be in a capital category that is lower than indicated by its capital ratios if it is determined to be in an unsafe or unsound condition or if it receives an unsatisfactory examination rating with respect to certain matters. A bank’s capital category is determined solely for the purpose of applying prompt corrective action regulations, and the capital category may not constitute an accurate representation of the bank’s overall financial condition or prospects for other purposes. Subject to a narrow exception, a receiver or conservator is required to be appointed for an institution that is “critically undercapitalized” within specified time frames. The regulations also provide that a capital restoration plan must be filed with the FRB within 45 days of the date an institution is deemed to have received notice that it is “undercapitalized,” “significantly undercapitalized” or “critically undercapitalized.” Compliance with the plan must be guaranteed by any parent holding company up to the lesser of 5% of the institution’s total assets when it was deemed to be undercapitalized or the amount
6
necessary to achieve compliance with applicable capital requirements. In addition, numerous mandatory supervisory actions become immediately applicable to an undercapitalized institution including, but not limited to, increased monitoring by regulators and restrictions on growth, capital distributions and expansion. The FRB could also take any one of a number of discretionary supervisory actions, including the issuance of a capital directive and the replacement of senior executive officers and directors. Significantly and critically undercapitalized institutions are subject to additional mandatory and discretionary measures. As of December 31, 2020, the most recent notification from the regulatory agencies categorized the Company and the Bank as well-capitalized. For further information regarding the capital ratios and leverage ratio of the Company and the Bank, see Item 8, Note 2 of this report. Safety and Soundness Regulations – In accordance with the FDIA, the federal banking agencies adopted guidelines establishing general standards relating to internal controls, information systems, internal audit systems, loan documentation, credit underwriting, interest rate risk exposure, asset growth, asset quality, earnings, compensation, fees and benefits. In general, the guidelines require that institutions maintain appropriate systems and practices to identify and manage the risks and exposures specified in the guidelines. The guidelines prohibit excessive compensation as an unsafe and unsound practice and describe compensation as excessive when the amounts paid are unreasonable or disproportionate to the services performed by an executive officer, employee, director or principal shareholder. In addition, regulations adopted by the federal banking agencies authorize the agencies to require that an institution that has been given notice that it is not satisfying any of such safety and soundness standards to submit a compliance plan. If the institution fails to submit an acceptable compliance plan or fails in any material respect to implement an accepted compliance plan, the agency must issue an order directing corrective actions and may issue an order directing other actions of the types to which an undercapitalized institution is subject under the “prompt corrective action” provisions of FDIA. If the institution fails to comply with such an order, the agency may seek to enforce such order in judicial proceedings and to impose civil money penalties. Loans-to-One-Borrower – The Bank generally may not make loans or extend credit to a single or related group of borrowers in excess of 15% of unimpaired capital and surplus. An additional amount may be loaned, up to 10% of unimpaired capital and surplus, if the loan is secured by readily marketable collateral, which generally does not include real estate. As of December 31, 2020, the Bank was in compliance with the loans-to-one-borrower limitations. Depositor Preference – The FDIA provides that, in the event of the “liquidation or other resolution” of an insured depository institution, the claims of depositors of the institution, including the claims of the FDIC as subrogee of insured depositors, and certain claims for administrative expenses of the FDIC as a receiver, will have priority over other general unsecured claims against the institution. If an insured depository institution fails, insured and uninsured depositors, along with the FDIC, will have priority in payment ahead of unsecured, non-deposit creditors, including depositors whose deposits are payable only outside of the United States and the parent bank holding company, with respect to any extensions of credit they have made to such insured depository institution. Community Reinvestment Act – The Community Reinvestment Act of 1977 (“CRA”) requires depository institutions to assist in meeting the credit needs of their market areas consistent with safe and sound banking practice. Under the CRA, each depository institution is required to help meet the credit needs of its market areas by, among other things, providing credit to low- and moderate-income individuals and communities. Depository institutions are periodically examined for compliance with the CRA and are assigned ratings that must be publicly disclosed. In order for a financial holding company to commence any new activity permitted by the BHC Act, or to acquire any company engaged in any new activity permitted by the BHC Act, each insured depository institution subsidiary of the financial holding company must have received a rating of at least “satisfactory” in its most recent examination under the CRA. The Bank received a rating of “satisfactory” in its most recent CRA exam. In December 2019, the FDIC joined the Office of the Comptroller of the Currency (the “OCC”) in proposing rules that would significantly change existing CRA regulations. The Federal Reserve did not join in the proposed rulemaking. The proposed rules are intended to increase bank activity in low and moderate income communities where there is significant need for credit, more responsible lending, greater access to banking services, and improvements to critical infrastructure. The proposals focus on four improvement areas: (i) clarifying what activities qualify for CRA credit; (ii) updating assessment areas where activities count for CRA credit; (iii) providing a more objective method for measuring CRA performance; and (iv) improving the timeliness and transparency of record keeping and reporting. The OCC has adopted these rules as final, but the FDIC and Federal Reserve have yet to take action that would finalize and implement new CRA regulations. As the Company is not subject to OCC regulation, it will continue to monitor CRA regulatory changes and evaluate any resulting impact on the Company’s financial condition and results of operations. Financial Privacy – Banks and other financial institutions are subject to regulations that limit their ability to disclose non-public information about consumers to nonaffiliated third parties. These limitations require disclosure of privacy policies to consumers and affect how consumer information is transmitted through diversified financial companies and conveyed to outside vendors.

7
The Bank is also subject to regulatory guidelines establishing standards for safeguarding customer information and maintaining information security programs. The standards set forth in the guidelines are intended to ensure the security and confidentiality of customer records and information, protect against any anticipated threats or hazards to the security or integrity of such records and protect against unauthorized access to or use of such records or information that could result in substantial harm or inconvenience to any customer. Transactions with Affiliates – Transactions between the Bank and its affiliates are subject to regulations that limit the types and amounts of covered transactions engaged in by the Bank and generally require those transactions to be on an arm’s-length basis. The term “affiliate” is defined to mean any company that controls or is under common control with the Bank and includes the Company and its non-bank subsidiaries. “Covered transactions” include a loan or extension of credit, as well as a purchase of securities issued by an affiliate, certain purchases of assets from the affiliate, certain derivative transactions that create a credit exposure to an affiliate, the acceptance of securities issued by the affiliate as collateral for a loan, and the issuance of a guarantee, acceptance or letter of credit on behalf of an affiliate. In general, these regulations require that any such transaction by the Bank (or its subsidiaries) with an affiliate must be secured by designated amounts of specified collateral and must be limited to certain thresholds on an individual and aggregate basis. Federal law also limits the Bank’s authority to extend credit to its directors, executive officers and 10% shareholders, as well as to entities controlled by such persons. Among other things, extensions of credit to insiders are required to be made on terms that are substantially the same as, and follow credit underwriting procedures that are not less stringent than, those prevailing for comparable transactions with unaffiliated persons. Also, the terms of such extensions of credit may not involve more than the normal risk of repayment or present other unfavorable features and may not exceed certain limitations on the amount of credit extended to such persons, individually and in the aggregate, which limits are based, in part, on the amount of the Bank’s capital. Federal Reserve System – FRB regulations require depository institutions to maintain cash reserves against their transaction accounts (primarily negotiable order of withdrawal and demand deposit accounts). A reserve of 3% is to be maintained against aggregate transaction accounts between $15.2 million and $110.2 million (subject to adjustment by the FRB) plus a reserve of 10% (subject to adjustment by the FRB between 8% and 14%) against that portion of total transaction accounts in excess of $110.2 million. The first $15.2 million of otherwise reservable balances (subject to adjustment by the FRB) is exempt from the reserve requirements. The Bank is in compliance with the foregoing requirements. Cybersecurity – In March 2015, federal regulators issued two related statements regarding cybersecurity. One statement indicates that financial institutions should design multiple layers of security controls to establish lines of defense and to ensure that their risk management processes address the risk posed by compromised customer credentials, including security measures to reliably authenticate customers accessing internet-based services of the financial institution. The other statement indicates that a financial institution’s management is expected to maintain sufficient business continuity planning processes to ensure the rapid recovery, resumption and maintenance of the institution’s operations after a cyber-attack involving destructive malware. A financial institution is expected to develop appropriate processes to enable recovery of data and business operations and address rebuilding network capabilities and restoring data if the institution or its critical service providers fall victim to this type of cyber-attack. If the Company fails to observe the regulatory guidance, it could be subject to various regulatory sanctions, including financial penalties. In the ordinary course of business, the Company relies on electronic communications and information systems to conduct operations and store sensitive data. The Company employs an in-depth, layered, defensive approach that leverages people, processes and technology to manage and maintain cybersecurity controls. The Company also employs a variety of preventative and detective tools to identify, protect, detect, respond, and recover against suspicious activity, as well as to report on any suspected advanced persistent threats. Notwithstanding the strength of the Company’s defensive measures, the threat from cyber attacks is severe, attacks are sophisticated and increasing in volume, and attackers respond rapidly to changes in defensive measures. While the Company has not experienced a significant compromise to date, significant data loss or any material financial losses related to cybersecurity attacks, the Company’s systems and those of its customers and third-party service providers are under constant threat and it is possible that the Company could experience a significant event in the future. Risks and exposures related to cybersecurity attacks are expected to remain high for the foreseeable future due to the rapidly evolving nature and sophistication of these threats, as well as due to the expanding use of internet banking, mobile banking and other technology-based products and services by the Company and its customers. See Item 1A, “Risk Factors” for a further discussion of risks related to cybersecurity. Other Regulations – The operations of the Company and the Bank are also subject to:
Truth-In-Lending Act, governing disclosures of credit terms to consumer borrowers;
Fair Credit Reporting Act, governing the provision of consumer information to credit reporting agencies and the use of consumer information;
8
Fair Debt Collection Act, governing the manner in which consumer debts may be collected by collection agencies;
Electronic Funds Transfer Act, governing automatic deposits to and withdrawals from deposit accounts and customers’ rights and liabilities arising from the use of automated teller machines and other electronic banking services.
Real Estate Settlement Procedures Act, requiring that borrowers for mortgage loans for one- to four-family residential real estate receive various disclosures, including good faith estimates of settlement costs, lender servicing and escrow account practices, and prohibiting certain practices that increase the cost of settlement services;
Equal Credit Opportunity Act, prohibiting discrimination on the basis of race, creed or other prohibited factors in extending credit;
Check Clearing for the 21st Century Act (also known as “Check 21”), which gives “substitute checks,” such as digital check images and copies made from that image, the same legal standing as the original paper check;
The USA PATRIOT Act, which requires banks and savings institutions to establish broadened anti-money laundering compliance programs and due diligence policies and controls to ensure the detection and reporting of money laundering; and
The Bank Secrecy Act, which requires U.S. financial institutions to collaborate with the U.S. government in cases of suspected money laundering and fraud.
Certain of these laws are consumer protection laws that extensively govern the Company’s relationship with its customers. Violations of applicable consumer protection laws can result in significant potential liability from litigation brought by customers, including actual damages, restitution and attorneys’ fees. Federal bank regulators, state attorneys general and state and local consumer protection agencies may also seek to enforce consumer protection requirements and obtain these and other remedies, including regulatory sanctions, customer rescission rights, action by the state and local attorneys general in each jurisdiction in which the Company operates and civil money penalties. Failure to comply with consumer protection requirements may also result in the Company’s inability to pursue merger or acquisition transactions. Website Availability of SEC Reports Cass files annual, quarterly and current reports with the Securities and Exchange Commission (the “SEC”). Cass will, as soon as reasonably practicable after they are electronically filed with or furnished to the SEC, make available free of charge on its website each of its Annual Reports on Form 10-K, Quarterly Reports on Form 10-Q, Current Reports on Form 8-K, all amendments to those reports, and its definitive proxy statements. The address of Cass’ website is: www.cassinfo.com. The reference to the Company’s website address does not constitute incorporation by reference of the information contained on the website and should not be considered part of this report. Statistical Disclosure by Bank Holding Companies For the statistical disclosure by bank holding companies, refer to Item 7, “Management’s Discussion and Analysis of Financial Condition and Results of Operations.” ITEM 1A. RISK FACTORS This section highlights specific risks that could affect the Company’s business. Although this section attempts to highlight key factors, please be aware that other risks may prove to be important in the future. New risks may emerge at any time, and Cass cannot predict such risks or estimate the extent to which they may affect the Company’s financial performance. In addition to the factors discussed elsewhere or incorporated by reference in this report, the identified risks that could cause actual results to differ materially include the following: Economic and Market Conditions Risk The COVID-19 pandemic creates significant risks and uncertainties for the Company’s business and results of operations. In March 2020, the World Health Organization (“WHO”) declared COVID-19 as a global pandemic. The COVID-19 pandemic has negatively impacted the global economy, disrupted global supply chains and manufacturing, lowered energy prices, lowered

9
equity market valuations, lowered interest rates, created significant volatility and disruption in financial markets, and increased unemployment levels. In addition, the pandemic has resulted in temporary closures of many businesses and the institution of social distancing and sheltering in place requirements in many states and communities, including those in major markets in which Cass Commercial Bank, the Company’s St. Louis, Missouri-based bank subsidiary, is located or does business. Although in various locations certain activity restrictions have been relaxed with some success, many states and localities are experiencing further significant increases in the number of COVID-19 cases, prompting a reinstatement of prior activity restrictions in some locations and the need for additional aid and other forms of relief for affected individuals, businesses and other entities. In late fiscal 2020, vaccines for combatting COVID-19 were approved by health agencies within the Company’s operating markets and began to be administered. However, initial quantities of vaccines are limited and vaccine distributions, controlled by local authorities, are being allocated, generally first to front-line health care workers and other essential workers and next to those members of individual populations believed most susceptible to severe effects from COVID-19. The timeline of full administration of the COVID-19 vaccines is uncertain and fluctuating, but is widely thought to be unlikely to occur in most jurisdictions until mid to late 2021. The impact of COVID-19, including the impact of restrictions imposed to combat its spread, could result in additional and prolonged business closures, work restrictions and activity restrictions. As a result, the demand for the Company’s products and services has been, and will continue to be, significantly impacted. Demand for payment and information processing services by manufacturing, distribution, and retail enterprises, and loans and other products and services that the Company and the Bank offer and on which success the Company relies to drive growth, is highly dependent upon the business environment in the primary markets in which the Company operates and in the United States as a whole. Business closures, including constrictions in the manufacturing sector for a portion of the year, have decreased volumes in the Company’s payment and information processing services due to the decline in customers’ business activity. In addition, the dampened demand for oil and resulting plummet in oil prices has had, and can continue to have, a negative effect on both the number of freight transactions processed and the dollar amount of invoices processed. Furthermore, the pandemic could influence the recognition of credit losses in the Company’s loan and lease portfolios and increase its allowance for credit losses, as both businesses and consumers are negatively impacted by the economic downturn. Bank regulatory agencies and various governmental authorities are urging financial institutions to work prudently with borrowers who are or may be unable to meet their contractual payment obligations because of the effects of COVID-19. In addition, the Federal Reserve has taken action to lower the Federal Funds rate, which has adversely affected, and could continue to adversely affect, interest income and therefore, the Company’s results of operations and financial condition. The Company’s business operations may also be disrupted if significant portions of its workforce are unable to work effectively, because of quarantines, illness, government actions, or other restrictions in connection with the pandemic, travel restrictions, technology limitations and/or disruptions, including remote working measures and their attendant cybersecurity risks. Furthermore, the business operations of the Company and the Bank may be disrupted due to vendors and third-party service providers being unable to work or provide services effectively, because of quarantines, illness, government actions, or other restrictions in connection with the pandemic. The extent to which the COVID-19 pandemic impacts the Company’s business, results of operations, and financial condition, as well as its regulatory capital and liquidity ratios, will depend on future developments, which are highly uncertain, including the scope and duration of the pandemic and actions taken by governmental authorities and other third parties in response to the pandemic. Moreover, the effects of the COVID-19 pandemic may heighten many of the other risks described in this Item 1A, “Risk Factors” section. including, but not limited to, risks of credit deterioration, interest rate changes, governmental actions, market volatility, security breaches and technology interruptions. General political, economic or industry conditions may be less favorable than expected. Local, domestic, and international economic, political and industry-specific conditions and governmental monetary and fiscal policies affect the industries in which the Company competes, directly and indirectly. Conditions such as inflation, recession, unemployment, volatile interest rates, tight money supply, real estate values, international conflicts and other factors outside of Cass’ control may adversely affect the Company. Economic downturns could result in the delinquency of outstanding loans, which could have a material adverse impact on Cass’ earnings. Unfavorable developments concerning customer credit quality could affect Cass’ financial results. Although the Company regularly reviews credit exposure related to its customers and various industry sectors in which it has business relationships, default risk may arise from events or circumstances that are difficult to detect or foresee. Under such circumstances, the Company could experience an increase in the level of provision for credit losses, delinquencies, nonperforming assets, net charge-offs and allowance for credit losses.
10
In certain circumstances, Cass remits payment of invoices prior to receiving funds from its customers. As such, Cass could experience losses if such funds are not received from customers after payment is remitted. Although the Company regularly reviews credit exposure related to its customers and various industry sectors in which it has business relationships, default risk may arise from events or circumstances that are difficult to detect or foresee. Under such circumstances, the Company could experience losses related to funds remitted for payment to freight carriers, utility companies and other such companies, prior to receiving funds from its customers. The Company has lending concentrations, including, but not limited to, faith-based ministries located in selected cities and privately-held businesses located in or near St. Louis, Missouri, that could suffer a significant decline which could adversely affect the Company. Cass’ customer base consists, in part, of lending concentrations in several segments and geographical areas. If any of these segments or areas is significantly affected by weak economic conditions, the Company could experience increased credit losses, and its business could be adversely affected. Fluctuations in interest rates could affect Cass’ net interest income and balance sheet. The operations of financial institutions such as the Company are dependent to a large degree on net interest income, which is the difference between interest income from loans and investments and interest expense on deposits and borrowings. Prevailing economic conditions, the fiscal and monetary policies of the federal government and the policies of various regulatory agencies all affect market rates of interest, which in turn significantly affect financial institutions’ net interest income. Fluctuations in interest rates affect Cass’ financial statements, as they do for all financial institutions. Volatility in interest rates can also result in disintermediation, which is the flow of funds away from financial institutions into direct investments, such as federal government and corporate securities and other investment vehicles, which, because of the absence of federal insurance premiums and reserve requirements, generally pay higher rates of return than financial institutions. As discussed in greater detail in Item 7A, “Quantitative and Qualitative Disclosures about Market Risk,” a low level of interest rates will continue to have a negative impact on the Company’s net interest income. The Company may be adversely impacted by the uncertainty regarding LIBOR as a reference rate. The United Kingdom’s Financial Conduct Authority announced in 2017 that after 2021 it would no longer persuade or require banks to submit the rates required to calculate the London Interbank Offered Rate (“LIBOR”). This announcement indicates that the continuation of LIBOR on the current basis could not be guaranteed after 2021 and resulted in uncertainty about the future of LIBOR and what may become accepted alternatives to LIBOR. Subsequently, the administrator of LIBOR announced it will consult on its intention to cease the publication of the one week and two month LIBOR settings immediately following the LIBOR publication on December 31, 2021, and the remaining U.S. Dollar LIBOR settings immediately following the LIBOR publication on June 30, 2023. Regulators, industry groups and certain committees (e.g., the Alternative Reference Rates Committee) have, among other things, published recommended fall-back language for LIBOR-linked financial instruments, identified recommended alternatives for certain LIBOR rates (e.g., the Secured Overnight Financing Rate as the recommended alternative to U.S. Dollar LIBOR), and proposed implementations of the recommended alternatives in floating rate instruments. At this time, it is not possible to predict whether these specific recommendations and proposals will be broadly accepted, whether they will continue to evolve, and what the effect of their implementation may be on the markets for floating-rate financial instruments. Certain of Cass’ loans and other financial instruments include attributes that are either directly or indirectly dependent on LIBOR. The transition from LIBOR could create additional costs and risk. Since proposed alternative rates are calculated differently, payments under contracts referencing new rates will differ from those referencing LIBOR. The transition will change Cass’ market risk profiles, requiring changes to risk and pricing models, valuation tools, product design and hedging strategies. Failure to adequately manage this transition process with our customers could adversely impact the Company’s reputation. Operations of the Company’s customer base are impacted by macro-economic factors such as a strong dollar and/or volatility in commodity prices. A reduction in its customers’ operations could have a material adverse effect on Cass’ results of operations. A decline in the cost of oil worldwide can have a negative effect on both the number of freight transactions processed and the dollar amount of invoices processed. For example, lower oil prices can cause a significant drop in drilling supplies being transported to fracking operations by domestic railroads and trucks. Lower oil prices can also result in lower gas and fuel prices, negatively affecting the dollar amounts of the invoices that Cass processes for its freight and shipping customers. A decline in oil prices could have an adverse effect on the Company’s revenues and could significantly impact its results of operations.

11
Business Operations and Strategic Risk Operational difficulties or cyber-security problems could damage Cass’ reputation and business. In the ordinary course of business, the Company depends on the reliable operation of its computer operations and network connections from its clients to its systems. Any failure, interruption, or breach in security of these systems would cause Cass to be unable to process transactions for its clients, resulting in decreased revenues. The Company also relies on electronic communications and information systems to store sensitive customer data. Any failure, interruption, breach in security or loss of data, whatever the cause, could reduce client satisfaction with the Company’s products and services and harm Cass’ financial results. These types of threats may derive from human error, fraud or malice on the part of external or internal parties, or may result from accidental technological failure. Further, to access the Company’s products and services, Cass’ customers may use computers and mobile devices that are beyond the Company’s security control systems. The Company’s technologies, systems, networks and software, and those of other financial institutions have been, and are likely to continue to be, the target of cybersecurity threats and attacks, which may range from uncoordinated individual attempts to sophisticated and targeted measures directed at Cass. The risk of a security breach or disruption, particularly through cyber-attack or cyber intrusion, has increased as the number, intensity and sophistication of attempted attacks and intrusions from around the world have increased. A material security problem affecting Cass could damage its reputation, deter prospects from purchasing its products and services, deter customers from using its products and services or result in liability to Cass. Cloud technologies are also critical to the operation of our systems, and our reliance on cloud technologies is growing. Service disruptions in cloud technologies may lead to delays in accessing, or the loss of, data that is important to our businesses and may hinder our customers’ access to our products and services. Although the Company makes significant efforts to maintain the security and integrity of Cass’ information systems and have implemented various measures to manage the risk of a security breach or disruption, there can be no assurance that Cass’ security efforts and measures will be effective or that attempted security breaches or disruptions would not be successful or damaging. Even the most well protected information, networks, systems and facilities remain potentially vulnerable because attempted security breaches, particularly cyber-attacks and intrusions, or disruptions will occur in the future, and because the techniques used in such attempts are constantly evolving and generally are not recognized until launched against a target, and in some cases are designed not to be detected and, in fact, may not be detected. Accordingly, the Company may be unable to anticipate these techniques or to implement adequate security barriers or other preventative measures, and thus it is virtually impossible to entirely mitigate this risk. While specific “cyber” insurance coverage is maintained, which would apply in the event of various breach scenarios, the amount of coverage may not be adequate in any particular case. Furthermore, because cyber threat scenarios are inherently difficult to predict and can take many forms, some breaches may not be covered under Cass’ cyber insurance coverage. A security breach or other significant disruption of Cass’ information systems or those related to customers, merchants and third party vendors, including as a result of cyber-attacks, could 1) disrupt the proper functioning of Cass’ networks and systems and therefore operations and/or those of certain customers; 2) result in the unauthorized access to, and destruction, loss, theft, misappropriation or release of confidential, sensitive or otherwise valuable information of the Company or its customers; 3) result in a violation of applicable privacy, data breach and other laws, subjecting the Company to additional regulatory scrutiny and expose Cass to civil litigation, governmental fines and possible financial liability; 4) require significant management attention and resources to remedy the damages that result; or 5) harm Cass’ reputation or cause a decrease in the number of customers that choose to do business with the Company. The occurrence of any of the foregoing could have a material adverse effect on Cass’ business, financial condition and results of operations. Cass must respond to rapid technological changes and these changes may be more difficult or expensive than anticipated. If competitors introduce new products and services embodying new technologies, or if new industry standards and practices emerge, the Company’s existing product and service offerings, technology and systems may become obsolete. Further, if Cass fails to adopt or develop new technologies or to adapt its products and services to emerging industry standards, Cass may lose current and future customers. Finally, Cass’ ability to adopt these technologies can also be inhibited by intellectual property rights of third parties. Any of these could have a material adverse effect on its business, financial condition and results of operations. The payment processing and financial services industries are changing rapidly and in order to remain competitive, Cass must continue to enhance and improve the functionality and features of its products, services and technologies. These changes may be more difficult or expensive than the Company anticipates. Methods of reducing risk exposures might not be effective. Instruments, systems and strategies used to hedge or otherwise manage exposure to various types of credit, interest rate, market and liquidity, operational, regulatory/compliance, business risks and enterprise-wide risks could be less effective than anticipated. As a result, the Company may not be able to effectively mitigate its risk exposures in particular market environments or against particular types of risk.

12
Customer borrowing, repayment, investment, deposit, and payable processing practices may be different than anticipated. The Company uses a variety of financial tools, models and other methods to anticipate customer behavior as part of its strategic and financial planning and to meet certain regulatory requirements. Individual, economic, political and industry-specific conditions and other factors outside of Cass’ control could alter predicted customer borrowing, repayment, investment, deposit, and payable processing practices. Such a change in these practices could adversely affect Cass’ ability to anticipate business needs, including cash flow and its impact on liquidity, and to meet regulatory requirements. The Company’s allowance for credit losses (“ACL”) is subject to continuing evaluation and may be insufficient. The Company maintains an ACL, which is a reserve established through a provision for credit losses charged to expense. The ACL is a valuation account that is deducted from the amortized cost basis to present the net amount expected to be collected on loans. Management uses a systematic, documented approach in determining the appropriate level of ACL, which represents management’s estimate of losses in loans and off-balance sheet exposures as of the balance sheet date. Management estimated the allowance balance using relevant available information from internal and external factors, relating to past events, current conditions and reasonable and supportable forecasts based on economic sources, such as Gross Domestic Product (“GDP”). Historical credit loss experience, of both the Company and similar peer banks, provides the basis for the estimation of expected credit losses. Adjustments to historical loss information are made for lending management experience, asset quality trends, borrower’s ability to pay, collateral, and other environmental factors. The ACL is measured on a collective pool basis when similar risk characteristics exist. The determination of the appropriate level of the allowance for credit losses inherently involves a high degree of subjectivity and requires management to make estimates based on risks and trends that are subject to material change. The determination and application of the ACL accounting policy involves judgments, estimates, and uncertainties that are subject to change. Changes in these assumptions, estimates or the conditions surrounding them may have a material impact on the Company’s financial condition, liquidity or results of operations. Various regulatory agencies, as an integral part of the examination process, periodically review the ACL. Such agencies may require the Company to recognize additions to the ACL or reserve increases to adversely graded classified loans based on information available to them at the time of their examinations. The application of the model used to determine the ACL could result in volatility in earnings. Additionally, if charge-offs in future periods exceed the ACL, the Company will need additional provisions to increase the ACL. Any increases in the ACL will result in a decrease in net income and, possibly, capital, and may have a material adverse effect on the Company’s business, financial condition and results of operations. See Item 7, “Management’s Discussion and Analysis of Financial Condition and Results of Operations—Provision and Allowance for Credit Losses and Unfunded Commitments” and Item 8, “Financial Statements and Supplementary Data—Note 1” for additional information. Competitive product and pricing pressure within Cass’ markets may change. The Company operates in a very competitive environment, which is characterized by competition from a number of other vendors and financial institutions in each market in which it operates. The Company competes with large payment processors and national and regional financial institutions and also smaller auditing companies and banks in terms of products and pricing. If the Company is unable to compete effectively in products and pricing in its markets, business could decline. Management’s ability to maintain and expand customer relationships may differ from expectations. The industries in which the Company operates are very competitive. The Company not only competes for business opportunities with new customers, but also competes to maintain and expand the relationships it has with its existing customers. The Company continues to experience pressures to maintain these relationships as its competitors attempt to capture its customers. The introduction, withdrawal, success and timing of business initiatives and strategies, including, but not limited to, the expansion of payment and processing activities to new markets, the expansion of products and services to existing markets and opening of new bank branches, may be less successful or may be different than anticipated. Such a result could adversely affect Cass’ business. The Company makes certain projections as a basis for developing plans and strategies for its payment processing and banking products. If the Company does not accurately determine demand for its products and services, it could result in the Company incurring significant expenses without the anticipated increases in revenue, which could result in an adverse effect on its earnings.

13
In addition, there are risks and uncertainties associated with the introduction of new products and services, including substantial investments of time and resources. The introduction and development of new products and services may not be achieved along expected timelines, or at all, and may not be successful as a result of factors beyond the Company’s control, including regulatory, competition and external market factors. Failure to successfully manage these risks in the development and implementation of new products or services, and failure to integrate such new products and services into our existing system of internal controls, could have a material adverse effect on our business, financial condition and results of operations. The Company and the Bank are subject to liquidity risk. The Company requires liquidity to meet deposit and accounts and drafts payable obligations as they come due. Access to funding sources in amounts adequate to finance the Company’s commitments and business activities or on terms that are acceptable or favorable to the Company could be impaired by risks and uncertainties that are beyond the Company’s control, including those described in this Item 1A, “Risk Factors” section. The Company’s access to deposits and accounts and drafts payable for liquidity purposes may also be adversely affected by the needs of the Company’s depositors and customers. A failure to maintain adequate liquidity could have a material adverse effect on the Company’s business, financial condition and results of operations. Management’s ability to retain key officers and employees may change. Cass’ future operating results depend substantially upon the continued service of Cass’ executive officers and key personnel. Cass’ future operating results also depend in significant part upon Cass’ ability to attract and retain qualified management, financial, technical, marketing, sales, and support personnel. Competition for qualified personnel is intense, and the Company cannot ensure success in attracting or retaining qualified personnel. There may be only a limited number of persons with the requisite skills to serve in these positions, and it may be increasingly difficult for the Company to hire personnel over time. Cass’ business, financial condition and results of operations could be materially adversely affected by the loss of any of its key employees, by the failure of any key employee to perform in his or her current position, or by Cass’ inability to attract and retain skilled employees. Regulatory, Legal and Accounting Risk The Company and the Bank are subject to extensive government regulation and supervision and possible enforcement or other legal actions that could detrimentally affect Cass’ business. The Company and the Bank are subject to extensive federal and state regulation and supervision, the primary focus of which is to protect customers, depositors, the deposit insurance fund and the safety and soundness of the banking system as a whole, and not shareholders. In addition, since the global financial crisis, financial institutions generally have been subject to increased scrutiny from regulatory authorities, with an increased focus on risk management and consumer compliance. This regulatory structure and heightened focus gives the regulatory authorities extensive discretion in connection with their supervisory and enforcement activities and examination policies, including policies with respect to capital levels, the timing and amount of dividend payments, the classification of assets and the establishment of adequate loan loss reserves for regulatory purposes. Failure to comply with applicable laws, regulations, policies or guidance could result in enforcement and other legal actions by federal and state authorities, including criminal and civil penalties, the loss of FDIC insurance, revocation of a banking charter, and other regulatory sanctions, as well as reputational damage, any of which could have a material adverse effect on the Company’s business, financial condition and results of operations. Congress and federal regulatory agencies continually review banking laws, regulations and policies for possible changes. The substance and impact of pending or future legislation or regulation, or the application thereof, cannot be predicted, although any change could impact the regulatory structure under which the Company or its competitors operate and may significantly increase costs, impede the efficiency of internal business processes, require an increase in regulatory capital, require modifications to the Company’s business strategy, and/or limit its ability to pursue business opportunities in an efficient manner. A change in statutes, regulations or regulatory policies applicable to the Company or any of its subsidiaries could have a material, adverse effect on the Company’s business, financial condition and results of operations. See Item 1, “Business—Supervision and Regulation,” and Item 8, Note 2 to the consolidated financial statements included elsewhere in this report for additional information. The Company may need to raise additional capital or sell assets if it fails to meet regulatory capital requirements or meet commitments and liquidity needs. Such capital may not be available on favorable terms, or at all. Fully phased in, the Basel III Capital rules implemented stricter capital requirements and leverage limits and methods for calculating risk-weighted assets, meaning the Company is required to hold more capital against such assets. Complying with
14
these more stringent capital requirements could result in management modifying its business strategy and could limit the Company’s ability to make distributions, including paying dividends, or buying back shares. The Company may also need to raise additional capital in the future to provide it with sufficient capital resources and liquidity to meet commitments and business needs. The ability to raise additional capital, if needed, will depend on, among other things, conditions in the capital markets at that time and the Company’s financial condition, as well as the need for other financial institutions to raise capital at the same time. Economic conditions and the loss of confidence in financial institutions may increase the cost of funding and limit access to certain customary sources of capital, including inter-bank borrowings, repurchase agreements and borrowings from the discount window of the Federal Reserve. An inability to raise additional capital on acceptable terms when needed could have a materially adverse effect on the Company’s business, financial condition and results of operations. Legal and regulatory proceedings and related matters with respect to the financial services industry, including those directly involving the Company and its subsidiaries, could adversely affect Cass or the financial services industry in general. The Company is subject to various legal and regulatory proceedings. It is inherently difficult to assess the outcome of these matters, and there can be no assurance that the Company will prevail in any proceeding or litigation. Any such matter could result in substantial cost and diversion of Cass’ efforts, which by itself could have a material adverse effect on Cass’ financial condition and operating results. Further, adverse determinations in such matters could result in actions by Cass’ regulators that could materially adversely affect Cass’ business, financial condition or results of operations. Please refer to Item 3, “Legal Proceedings.” The Company’s accounting policies and methods are the basis of how Cass reports its financial condition and results of operations, and they require management to make estimates about matters that are inherently uncertain. In addition, changes in accounting policies and practices, as may be adopted by the regulatory agencies, the Financial Accounting Standards Board, or other authoritative bodies, could materially impact Cass’ financial statements. The Company’s accounting policies and methods are fundamental to how Cass records and reports its financial condition and results of operations. Management must exercise judgment in selecting and applying many of these accounting policies and methods in order to ensure that they comply with generally accepted accounting principles and reflect management’s judgment as to the most appropriate manner in which to record and report Cass’ financial condition and results of operations. In some cases, management must select the accounting policy or method to apply from two or more alternatives, any of which might be reasonable under the circumstances yet might result in the Company reporting materially different amounts than would have been reported under a different alternative. Cass has identified one accounting policy as being “critical” to the presentation of its financial condition and results of operations because they require management to make particularly subjective and/or complex judgments about matters that are inherently uncertain and because of the likelihood that materially different amounts would be reported under different conditions or using different assumptions. More information on Cass’ critical accounting policies is contained in Item 7, “Management’s Discussion and Analysis of Financial Condition and Results of Operations.” From time to time, the regulatory agencies, the Financial Accounting Standards Board (“FASB”), and other authoritative bodies change the financial accounting and reporting standards that govern the preparation of the Company’s financial statements. These changes can be hard to predict and can materially impact how management records and reports the Company’s financial condition and results of operations. Cass is subject to examinations and challenges by tax authorities, which, if not resolved in the Company’s favor, could adversely affect the Company’s financial condition and results of operations. In the normal course of business, Cass and its affiliates are routinely subject to examinations and challenges from federal and state tax authorities regarding the amount of taxes due in connection with investments it has made and the businesses in which it is engaged. Recently, federal and state taxing authorities have become increasingly aggressive in challenging tax positions taken by financial institutions. These tax positions may relate to tax compliance, sales and use, franchise, gross receipts, payroll, property and income tax issues, including tax base, apportionment and tax credit planning. The challenges made by tax authorities may result in adjustments to the timing or amount of taxable income or deductions or the allocation of income among tax jurisdictions. If any such challenges are made and are not resolved in the Company’s favor, they could have an adverse effect on Cass’ financial condition and results of operations.
15
General Risk Factors Cass’ stock price can become volatile and fluctuate widely in response to a variety of factors. The Company’s stock price can fluctuate based on factors that can include actual or anticipated variations in Cass’ quarterly results; new technology or services by competitors; unanticipated losses or gains due to unexpected events, including losses or gains on securities held for investment purposes; significant acquisitions or business combinations, strategic partnerships, joint ventures or capital commitments by or involving the Company or its competitors; changes in accounting policies or practices; failure to integrate acquisitions or realize anticipated benefits from acquisitions; or changes in government regulations. General market fluctuations, industry factors and general economic and political conditions, such as economic slowdowns or recessions, governmental intervention, interest rate changes, credit loss trends, low trading volume or currency fluctuations also could cause Cass’ stock price to decrease regardless of the Company’s operating results. Certain events beyond the Company’s control, such as severe weather, natural disasters, terrorist activities or other hostilities, may adversely affect the general economy, financial and capital markets, specific industries, and the Company. Severe weather, natural disasters, acts of terrorism or other hostilities, and other adverse external events beyond the Company’s control, could have a significant impact on the Company’s ability to conduct business. Such events could disrupt Cass’ operations or those of its customers, affect the stability of the Bank’s deposit base, impair the ability of borrowers to repay outstanding loans, impair the value of collateral securing loans, cause significant property damage, result in loss of revenue and/or cause the Company to incur additional expenses. The occurrence of any such event in the future could have a material adverse effect on the Company’s business, which, in turn, could have a material adverse effect on the Company’s financial condition and results of operations. ITEM 1B. UNRESOLVED STAFF COMMENTS None. ITEM 2. PROPERTIES In September 2012, the Company entered into a 10-year lease for office space in St. Louis County, Missouri, to house the headquarters of the Company and the Bank. The Company’s headquarters occupy 13,991 square feet in an office center at 12444 Powerscourt Drive along with 3,563 square feet in the same center at 12412 Powerscourt Drive. The Bank’s headquarters occupy 10,564 square feet in the same center at 12412 Powerscourt Drive. The Company owns approximately 61,500 square feet of office space at 13001 Hollenberg Drive in Bridgeton, Missouri where the Company’s transportation processing activities are performed. The Company owns a production facility of approximately 45,500 square feet located at 2675 Corporate Exchange Drive, Columbus, Ohio. Additional facilities are located in Greenville, South Carolina, Wellington, Kansas, Jacksonville, Florida and Columbus, Ohio. The Company has offices in Breda, Netherlands, Basingstoke, United Kingdom, and Singapore to service its multinational customers. In addition, the Bank owns a banking facility near downtown St. Louis, Missouri, has an operating branch in the Bridgeton, Missouri location, and has additional leased facilities in Fenton, Missouri and Colorado Springs, Colorado. Management believes that these facilities are suitable and adequate for the Company’s operations. ITEM 3. LEGAL PROCEEDINGS The Company and its subsidiaries are not involved in any pending proceedings other than ordinary routine litigation incidental to their businesses. Management believes none of these proceedings, if determined adversely, would have a material effect on the business or financial conditions of the Company or its subsidiaries. ITEM 4. MINE SAFETY DISCLOSURES Not applicable.
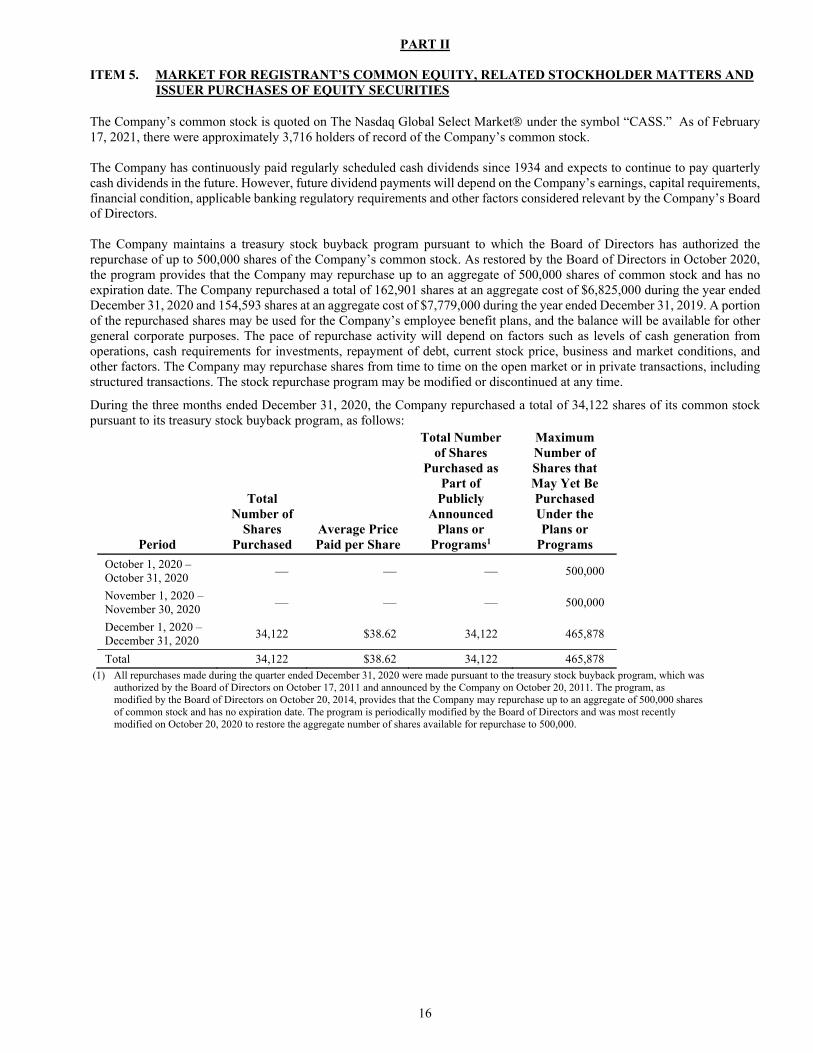
16
PART II ITEM 5. MARKET FOR REGISTRANT’S COMMON EQUITY, RELATED STOCKHOLDER MATTERS AND
ISSUER PURCHASES OF EQUITY SECURITIES The Company’s common stock is quoted on The Nasdaq Global Select Market under the symbol “CASS.” As of February 17, 2021, there were approximately 3,716 holders of record of the Company’s common stock. The Company has continuously paid regularly scheduled cash dividends since 1934 and expects to continue to pay quarterly cash dividends in the future. However, future dividend payments will depend on the Company’s earnings, capital requirements, financial condition, applicable banking regulatory requirements and other factors considered relevant by the Company’s Board of Directors. The Company maintains a treasury stock buyback program pursuant to which the Board of Directors has authorized the repurchase of up to 500,000 shares of the Company’s common stock. As restored by the Board of Directors in October 2020, the program provides that the Company may repurchase up to an aggregate of 500,000 shares of common stock and has no expiration date. The Company repurchased a total of 162,901 shares at an aggregate cost of $6,825,000 during the year ended December 31, 2020 and 154,593 shares at an aggregate cost of $7,779,000 during the year ended December 31, 2019. A portion of the repurchased shares may be used for the Company’s employee benefit plans, and the balance will be available for other general corporate purposes. The pace of repurchase activity will depend on factors such as levels of cash generation from operations, cash requirements for investments, repayment of debt, current stock price, business and market conditions, and other factors. The Company may repurchase shares from time to time on the open market or in private transactions, including structured transactions. The stock repurchase program may be modified or discontinued at any time.
During the three months ended December 31, 2020, the Company repurchased a total of 34,122 shares of its common stock pursuant to its treasury stock buyback program, as follows:
Period
Total Number of
Shares Purchased
Average Price Paid per Share
Total Number of Shares
Purchased as Part of
Publicly Announced
Plans or Programs1
Maximum Number of Shares that May Yet Be Purchased Under the Plans or
Programs
October 1, 2020 – October 31, 2020 — — — 500,000
November 1, 2020 – November 30, 2020 — — — 500,000
December 1, 2020 – December 31, 2020
34,122 $38.62 34,122 465,878
Total 34,122 $38.62 34,122 465,878 (1) All repurchases made during the quarter ended December 31, 2020 were made pursuant to the treasury stock buyback program, which was
authorized by the Board of Directors on October 17, 2011 and announced by the Company on October 20, 2011. The program, as modified by the Board of Directors on October 20, 2014, provides that the Company may repurchase up to an aggregate of 500,000 shares of common stock and has no expiration date. The program is periodically modified by the Board of Directors and was most recently modified on October 20, 2020 to restore the aggregate number of shares available for repurchase to 500,000.

17
Performance Quoted on The Nasdaq Stock Market for the Last Five Fiscal Years The following graph compares the cumulative total returns over the last five fiscal years of a hypothetical investment of $100 in shares of common stock of the Company with a hypothetical investment of $100 in The Nasdaq Stock Market (“Nasdaq”), the index of Nasdaq computer and data processing stocks, and the index of Nasdaq bank stocks. The graph assumes $100 was invested on December 31, 2015, with dividends reinvested. Returns are based on period end prices.
0.00
50.00
100.00
150.00
200.00
250.00
300.00
350.00
2015 2016 2017 2018 2019 2020
Comparison of 5 Year Cumulative Total ReturnAssumes Initial Investment of $100
December 2020
Cass Information Systems Inc NASDAQ Stock Market (US Companies)
NASDAQ Computer and Data Processing Index NASDAQ Banks Index

18
ITEM 6. SELECTED FINANCIAL DATA
The following table presents selected financial information for each of the five years ended December 31. The selected financial data should be read in conjunction with the Company’s consolidated financial statements and accompanying notes included in Item 8 of this report. (Dollars in thousands except per share data) 2020 2019 2018 2017 2016
Fee revenue and other income $ 100,441 $ 110,069 $ 104,076 $ 95,512 $ 86,136 Interest and fees on loans 37,665 36,461 32,477 28,641 29,063 Interest income on debt and equity securities 8,796 10,336 11,167 10,993 9,801 Other interest income 1,226 5,812 4,282 2,343 1,066 Total interest income 47,687 52,609 47,926 41,977 39,930 Interest expense on deposits 2,360 5,191 3,736 2,187 2,029 Interest on short-term borrowings 2 2 — — — Provision for credit/loan losses 810 250 — — (1,500) Net interest income after provision 44,515 47,166 44,190 39,790 39,401 Operating expense 114,615 119,769 111,919 100,403 93,473 Income before income tax expense 30,341 37,466 36,347 34,899 32,064 Income tax expense 5,165 7,062 6,079 9,885 (1) 7,716 Net income $ 25,176 $ 30,404 $ 30,268 $ 25,014 $ 24,348 Diluted earnings per share $ 1.73 $ 2.07 $ 2.03 $ 1.68 $ 1.63 Dividends per share 1.08 1.05 .89 .72 .68 Dividend payout ratio 61.96 % 50.11 % 43.53 % 42.68 % 40.98 % Average total assets $ 1,952,110 $ 1,749,574 $ 1,637,876 $ 1,568,112 $ 1,504,474 Average net loans 895,345 749,710 700,631 653,459 667,158 Average investment securities 365,254 423,384 448,890 426,657 352,129 Average total deposits 836,843 671,144 624,877 602,490 614,975 Average total shareholders’ equity 246,088 236,467 223,372 216,548 207,060 Return on average total assets 1.29 % 1.74 % 1.85 % 1.60 % 1.62 % Return on average equity 10.23 12.86 13.55 11.55 11.76 Average equity to assets ratio 12.61 13.52 13.64 13.81 13.76 Equity to assets ratio at year-end 11.85 13.84 13.56 14.04 13.82 Tangible common equity to tangible assets 11.14 12.93 12.83 13.25 13.04 Tangible common equity to risk-weighted
assets 20.38 17.78 18.85 20.23 20.13 Net interest margin 2.82 3.36 3.32 3.34 3.32 Allowance for credit/loan losses to loans at
year-end 1.34 1.37 1.42 1.49 1.53 Nonperforming assets to loans and foreclosed
assets — — — — .04 Net loan (recoveries) charge-offs to average
loans outstanding — (.01) — — (.01) (1) Includes one-time, non-cash Tax Cuts and Jobs Act (“TCJA”) charge of $1,824,000. ITEM 7. MANAGEMENT'S DISCUSSION AND ANALYSIS OF FINANCIAL CONDITION AND RESULTS OF
OPERATIONS
The following discussion and analysis provides information about the more significant factors that impacted the financial condition and results of operations of the Company for the years ended December 31, 2020, 2019 and 2018. This discussion and analysis should be read in conjunction with the Company’s consolidated financial statements and accompanying notes and other selected financial data presented elsewhere in this report. Refer to Item 7, “Management’s Discussion and Analysis of Financial Condition and Results of Operations” included in the Company’s Annual Report on Form 10-K/A filed with the SEC on March 6, 2020 and incorporated herein by reference for a discussion and analysis of the more significant factors that affected periods prior to 2019. Executive Overview Cass provides payment and information processing services to large manufacturing, distribution and retail enterprises from its offices/locations in St. Louis, Missouri, Columbus, Ohio, Greenville, South Carolina, Wellington, Kansas, Jacksonville, Florida, Breda, Netherlands, Basingstoke, United Kingdom, and Singapore. The Company’s services include freight invoice rating, payment processing, auditing, and the generation of accounting and transportation information. Cass also processes and pays energy invoices, which include electricity and gas as well as waste and telecommunications expenses, and is a provider of telecom expense management solutions. Cass solutions include a B2B payment platform for clients that require an agile

19
fintech partner. Additionally, the Company offers an on-line platform to provide generosity services for faith-based and non-profit organizations. The Company’s bank subsidiary, the “Bank,” supports the Company’s payment operations. The Bank also provides banking services to its target markets, which include privately-owned businesses and faith-based ministries in the St. Louis metropolitan area as well as other selected cities in the United States.
The specific payment and information processing services provided to each customer are developed individually to meet each customer’s requirements, which can vary greatly. In addition, the degree of automation such as electronic data interchange, imaging, work flow, and web-based solutions varies greatly among customers and industries. These factors combine so that pricing varies greatly among the customer base. In general, however, Cass is compensated for its processing services through service fees and investment of account balances generated during the payment process. The amount, type, and calculation of service fees vary greatly by service offering, but generally follow the volume of transactions processed. Interest income from the balances generated during the payment processing cycle is affected by the amount of time Cass holds the funds prior to payment and the dollar volume processed. Both the number of transactions processed and the dollar volume processed are therefore key metrics followed by management. Other factors will also influence revenue and profitability, such as changes in the general level of interest rates, which have a significant effect on net interest income. The funds generated by these processing activities are invested in overnight investments, investment grade securities, advances to payees, and loans generated by the Bank. The Bank earns most of its revenue from net interest income, or the difference between the interest earned on its loans and investments and the interest paid on its deposits and other borrowings. The Bank also assesses fees on other services such as cash management services.
Industry-wide factors that impact the Company include the willingness of large corporations to outsource key business functions such as freight, energy, telecommunication and environmental payment and audit. The benefits that can be achieved by outsourcing transaction processing, and the management information generated by Cass’ systems can be influenced by factors such as the competitive pressures within industries to improve profitability, the general level of transportation costs, deregulation of energy costs, and consolidation of telecommunication providers. Economic factors that impact the Company include the general level of economic activity that can affect the volume and size of invoices processed, the ability to hire and retain qualified staff, and the growth and quality of the loan portfolio. The general level of interest rates also has a significant effect on the revenue of the Company. As discussed in greater detail in Item 7A, “Quantitative and Qualitative Disclosures about Market Risk,” a decline in the general level of interest rates can have a negative impact on net interest income and conversely, a rise in the general level of interest rates can have a positive impact on net interest income. The cost of fuel is another factor that has a significant impact on the transportation sector. As the price of fuel goes up or down, the Company’s earnings increase or decrease with the dollar amount of transportation invoices. In 2020, total fee revenue and other income decreased $9,628,000, or 9%, net interest income after provision for credit losses decreased $2,651,000, or 6%, total operating expenses decreased $5,154,000, or 4%, and net income decreased $5,228,000, or 17%. This performance in 2020 was negatively impacted by the COVID-19 global pandemic. For payment processing services, business closures have led to a decrease in the number of transactions and dollars processed due to the decline in customers’ business activity, which resulted in a negative effect on total fee revenue and other income. Additionally, the Federal Reserve’s actions to lower the Federal Funds rate adversely impacted net interest income. Total operating expenses decreased as the lower number of transactions processed had a corresponding reduction in personnel expense and COVID-19 limited employee travel-related expenses. The asset quality of the Company’s loans and investments as of December 31, 2020 remained strong. Currently, management views Cass’ major opportunity as the continued expansion of its payment and information processing service offerings and customer base. Management intends to accomplish this by maintaining the Company’s leadership position in applied technology, which when combined with the security and processing controls of the Bank, makes Cass unique in the industry. Impact of New and Not Yet Adopted Accounting Pronouncements In June 2016, the FASB issued ASU No. 2016-13, Financial Instruments – Credit Losses (Topic 326): Measurement of Credit Losses on Financial Instruments (“ASU 2016-13”). The standard is effective for fiscal periods beginning after December 15, 2019. The Coronavirus Aid, Relief, and Economic Security (“CARES”) Act was signed into law on March 27, 2020 and included provisions that temporarily delayed the required implementation date of ASU 2016-13 to the earlier of the end of the national pandemic or December 31, 2020. The Consolidated Appropriations Act (“CAA”) was signed into law on December 27, 2020 and extended the deferral of required implementation of ASU 2016-13 to the earlier of the first day of a company’s fiscal year that begins after the date the COVID-19 national emergency comes to an end or January 1, 2022. The Company elected to defer the adoption of ASU 2016-13 until December 31, 2020 with an effective date of January 1, 2020. The ASU required measurement and recognition of expected credit losses for financial instruments held, as applicable, which include allowances for credit losses expected over the life of the portfolio, rather than incurred losses, which include allowances for current probable and estimable losses within the portfolio. Under this standard, the Company is required to hold an allowance equal to the expected life-of-loan losses on the loan portfolio. It also applies to off-balance sheet credit exposures
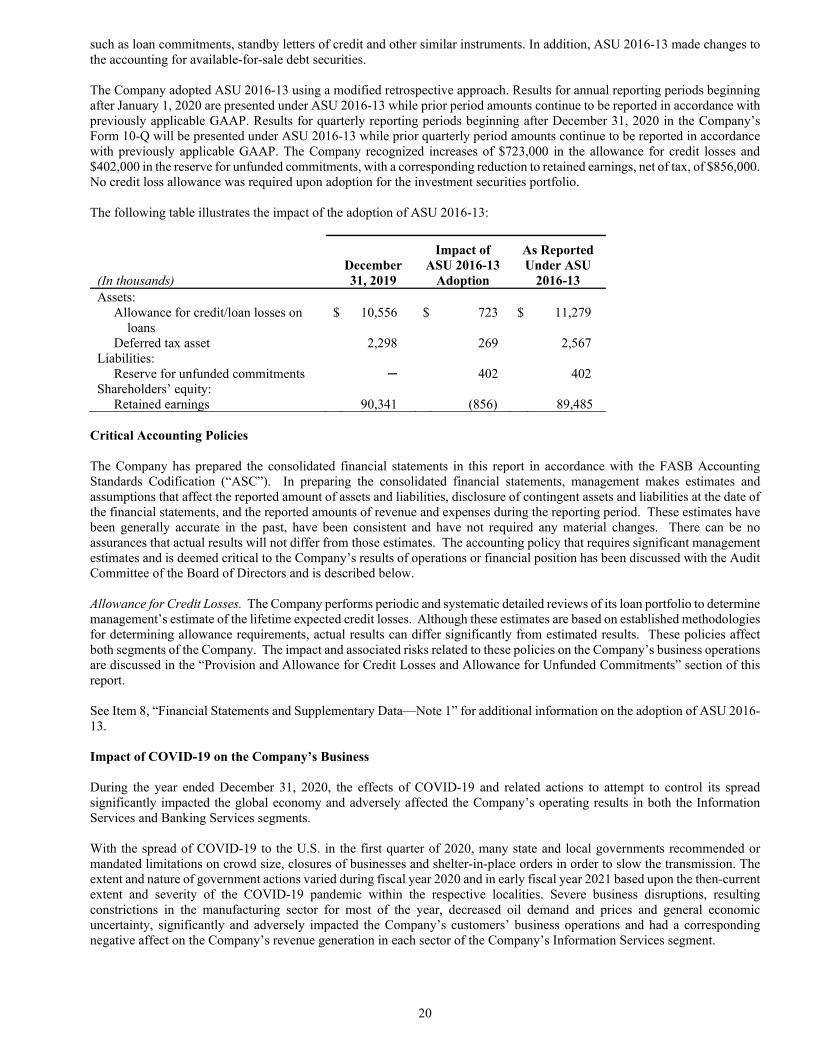
20
such as loan commitments, standby letters of credit and other similar instruments. In addition, ASU 2016-13 made changes to the accounting for available-for-sale debt securities. The Company adopted ASU 2016-13 using a modified retrospective approach. Results for annual reporting periods beginning after January 1, 2020 are presented under ASU 2016-13 while prior period amounts continue to be reported in accordance with previously applicable GAAP. Results for quarterly reporting periods beginning after December 31, 2020 in the Company’s Form 10-Q will be presented under ASU 2016-13 while prior quarterly period amounts continue to be reported in accordance with previously applicable GAAP. The Company recognized increases of $723,000 in the allowance for credit losses and $402,000 in the reserve for unfunded commitments, with a corresponding reduction to retained earnings, net of tax, of $856,000. No credit loss allowance was required upon adoption for the investment securities portfolio. The following table illustrates the impact of the adoption of ASU 2016-13:
(In thousands) December 31, 2019
Impact of ASU 2016-13
Adoption
As Reported Under ASU
2016-13 Assets: Allowance for credit/loan losses on loans
$ 10,556 $ 723 $ 11,279
Deferred tax asset 2,298 269 2,567 Liabilities: Reserve for unfunded commitments ─ 402 402 Shareholders’ equity: Retained earnings 90,341 (856) 89,485
Critical Accounting Policies The Company has prepared the consolidated financial statements in this report in accordance with the FASB Accounting Standards Codification (“ASC”). In preparing the consolidated financial statements, management makes estimates and assumptions that affect the reported amount of assets and liabilities, disclosure of contingent assets and liabilities at the date of the financial statements, and the reported amounts of revenue and expenses during the reporting period. These estimates have been generally accurate in the past, have been consistent and have not required any material changes. There can be no assurances that actual results will not differ from those estimates. The accounting policy that requires significant management estimates and is deemed critical to the Company’s results of operations or financial position has been discussed with the Audit Committee of the Board of Directors and is described below. Allowance for Credit Losses. The Company performs periodic and systematic detailed reviews of its loan portfolio to determine management’s estimate of the lifetime expected credit losses. Although these estimates are based on established methodologies for determining allowance requirements, actual results can differ significantly from estimated results. These policies affect both segments of the Company. The impact and associated risks related to these policies on the Company’s business operations are discussed in the “Provision and Allowance for Credit Losses and Allowance for Unfunded Commitments” section of this report. See Item 8, “Financial Statements and Supplementary Data—Note 1” for additional information on the adoption of ASU 2016-13. Impact of COVID-19 on the Company’s Business During the year ended December 31, 2020, the effects of COVID-19 and related actions to attempt to control its spread significantly impacted the global economy and adversely affected the Company’s operating results in both the Information Services and Banking Services segments. With the spread of COVID-19 to the U.S. in the first quarter of 2020, many state and local governments recommended or mandated limitations on crowd size, closures of businesses and shelter-in-place orders in order to slow the transmission. The extent and nature of government actions varied during fiscal year 2020 and in early fiscal year 2021 based upon the then-current extent and severity of the COVID-19 pandemic within the respective localities. Severe business disruptions, resulting constrictions in the manufacturing sector for most of the year, decreased oil demand and prices and general economic uncertainty, significantly and adversely impacted the Company’s customers’ business operations and had a corresponding negative affect on the Company’s revenue generation in each sector of the Company’s Information Services segment.
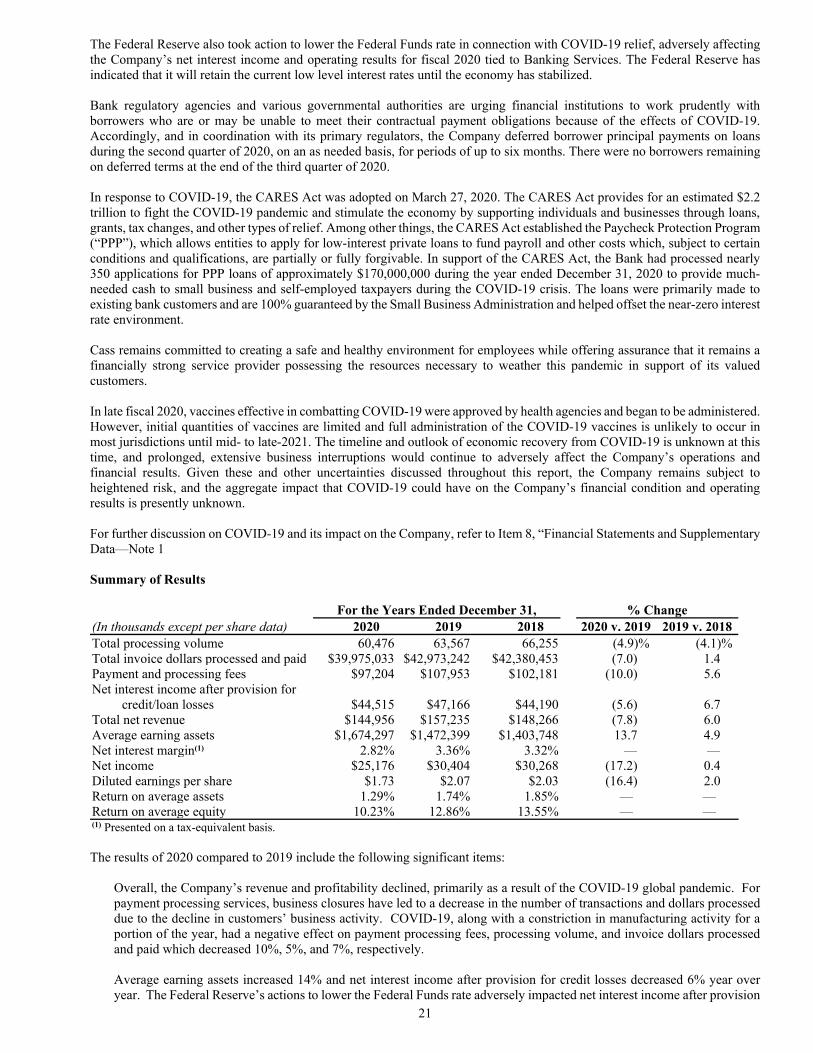
21
The Federal Reserve also took action to lower the Federal Funds rate in connection with COVID-19 relief, adversely affecting the Company’s net interest income and operating results for fiscal 2020 tied to Banking Services. The Federal Reserve has indicated that it will retain the current low level interest rates until the economy has stabilized. Bank regulatory agencies and various governmental authorities are urging financial institutions to work prudently with borrowers who are or may be unable to meet their contractual payment obligations because of the effects of COVID-19. Accordingly, and in coordination with its primary regulators, the Company deferred borrower principal payments on loans during the second quarter of 2020, on an as needed basis, for periods of up to six months. There were no borrowers remaining on deferred terms at the end of the third quarter of 2020. In response to COVID-19, the CARES Act was adopted on March 27, 2020. The CARES Act provides for an estimated $2.2 trillion to fight the COVID-19 pandemic and stimulate the economy by supporting individuals and businesses through loans, grants, tax changes, and other types of relief. Among other things, the CARES Act established the Paycheck Protection Program (“PPP”), which allows entities to apply for low-interest private loans to fund payroll and other costs which, subject to certain conditions and qualifications, are partially or fully forgivable. In support of the CARES Act, the Bank had processed nearly 350 applications for PPP loans of approximately $170,000,000 during the year ended December 31, 2020 to provide much-needed cash to small business and self-employed taxpayers during the COVID-19 crisis. The loans were primarily made to existing bank customers and are 100% guaranteed by the Small Business Administration and helped offset the near-zero interest rate environment. Cass remains committed to creating a safe and healthy environment for employees while offering assurance that it remains a financially strong service provider possessing the resources necessary to weather this pandemic in support of its valued customers. In late fiscal 2020, vaccines effective in combatting COVID-19 were approved by health agencies and began to be administered. However, initial quantities of vaccines are limited and full administration of the COVID-19 vaccines is unlikely to occur in most jurisdictions until mid- to late-2021. The timeline and outlook of economic recovery from COVID-19 is unknown at this time, and prolonged, extensive business interruptions would continue to adversely affect the Company’s operations and financial results. Given these and other uncertainties discussed throughout this report, the Company remains subject to heightened risk, and the aggregate impact that COVID-19 could have on the Company’s financial condition and operating results is presently unknown. For further discussion on COVID-19 and its impact on the Company, refer to Item 8, “Financial Statements and Supplementary Data—Note 1 Summary of Results
For the Years Ended December 31, % Change (In thousands except per share data) 2020 2019 2018 2020 v. 2019 2019 v. 2018 Total processing volume 60,476 63,567 66,255 (4.9)% (4.1)% Total invoice dollars processed and paid $39,975,033 $42,973,242 $42,380,453 (7.0) 1.4 Payment and processing fees $97,204 $107,953 $102,181 (10.0) 5.6 Net interest income after provision for credit/loan losses $44,515 $47,166 $44,190
(5.6) 6.7
Total net revenue $144,956 $157,235 $148,266 (7.8) 6.0 Average earning assets $1,674,297 $1,472,399 $1,403,748 13.7 4.9 Net interest margin(1) 2.82% 3.36% 3.32% — — Net income $25,176 $30,404 $30,268 (17.2) 0.4 Diluted earnings per share $1.73 $2.07 $2.03 (16.4) 2.0 Return on average assets 1.29% 1.74% 1.85% — — Return on average equity 10.23% 12.86% 13.55% — — (1) Presented on a tax-equivalent basis. The results of 2020 compared to 2019 include the following significant items:
Overall, the Company’s revenue and profitability declined, primarily as a result of the COVID-19 global pandemic. For payment processing services, business closures have led to a decrease in the number of transactions and dollars processed due to the decline in customers’ business activity. COVID-19, along with a constriction in manufacturing activity for a portion of the year, had a negative effect on payment processing fees, processing volume, and invoice dollars processed and paid which decreased 10%, 5%, and 7%, respectively. Average earning assets increased 14% and net interest income after provision for credit losses decreased 6% year over year. The Federal Reserve’s actions to lower the Federal Funds rate adversely impacted net interest income after provision
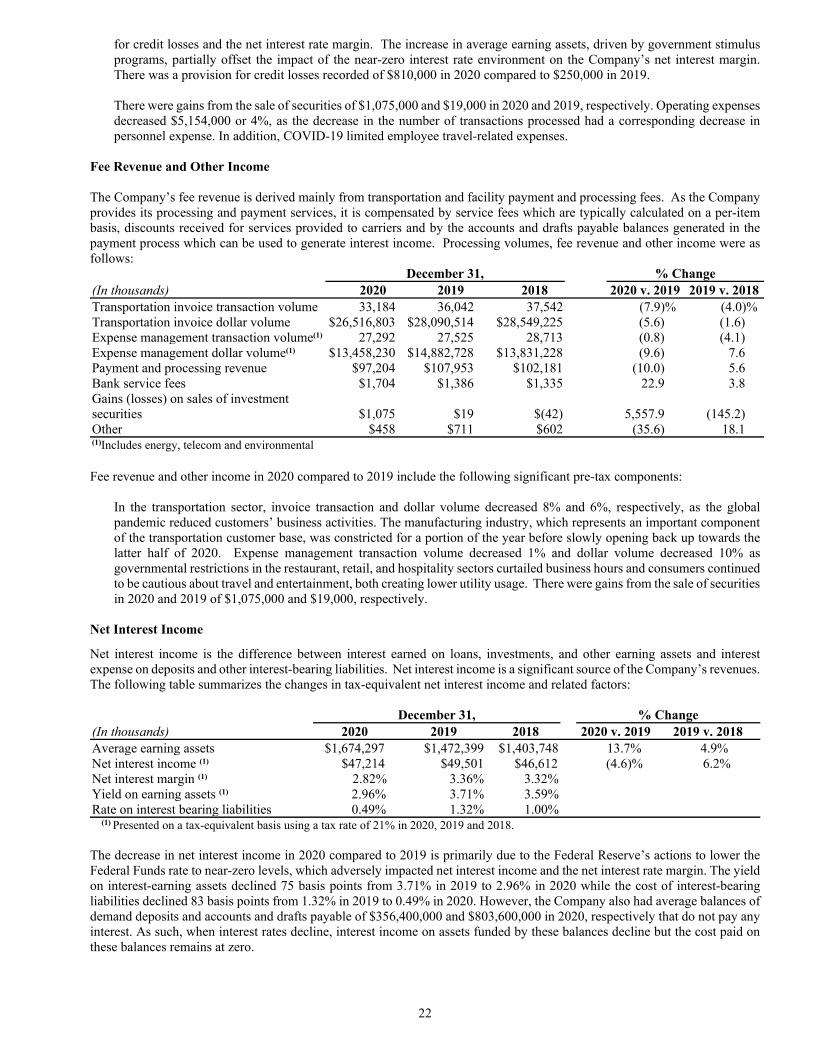
22
for credit losses and the net interest rate margin. The increase in average earning assets, driven by government stimulus programs, partially offset the impact of the near-zero interest rate environment on the Company’s net interest margin. There was a provision for credit losses recorded of $810,000 in 2020 compared to $250,000 in 2019. There were gains from the sale of securities of $1,075,000 and $19,000 in 2020 and 2019, respectively. Operating expenses decreased $5,154,000 or 4%, as the decrease in the number of transactions processed had a corresponding decrease in personnel expense. In addition, COVID-19 limited employee travel-related expenses.
Fee Revenue and Other Income The Company’s fee revenue is derived mainly from transportation and facility payment and processing fees. As the Company provides its processing and payment services, it is compensated by service fees which are typically calculated on a per-item basis, discounts received for services provided to carriers and by the accounts and drafts payable balances generated in the payment process which can be used to generate interest income. Processing volumes, fee revenue and other income were as follows:
December 31, % Change (In thousands) 2020 2019 2018 2020 v. 2019 2019 v. 2018 Transportation invoice transaction volume 33,184 36,042 37,542 (7.9)% (4.0)% Transportation invoice dollar volume $26,516,803 $28,090,514 $28,549,225 (5.6) (1.6) Expense management transaction volume(1) 27,292 27,525 28,713 (0.8) (4.1) Expense management dollar volume(1) $13,458,230 $14,882,728 $13,831,228 (9.6) 7.6 Payment and processing revenue $97,204 $107,953 $102,181 (10.0) 5.6 Bank service fees $1,704 $1,386 $1,335 22.9 3.8 Gains (losses) on sales of investment securities
$1,075
$19
$(42)
5,557.9 (145.2)
Other $458 $711 $602 (35.6) 18.1 (1)Includes energy, telecom and environmental Fee revenue and other income in 2020 compared to 2019 include the following significant pre-tax components:
In the transportation sector, invoice transaction and dollar volume decreased 8% and 6%, respectively, as the global pandemic reduced customers’ business activities. The manufacturing industry, which represents an important component of the transportation customer base, was constricted for a portion of the year before slowly opening back up towards the latter half of 2020. Expense management transaction volume decreased 1% and dollar volume decreased 10% as governmental restrictions in the restaurant, retail, and hospitality sectors curtailed business hours and consumers continued to be cautious about travel and entertainment, both creating lower utility usage. There were gains from the sale of securities in 2020 and 2019 of $1,075,000 and $19,000, respectively.
Net Interest Income
Net interest income is the difference between interest earned on loans, investments, and other earning assets and interest expense on deposits and other interest-bearing liabilities. Net interest income is a significant source of the Company’s revenues. The following table summarizes the changes in tax-equivalent net interest income and related factors:
December 31, % Change (In thousands) 2020 2019 2018 2020 v. 2019 2019 v. 2018 Average earning assets $1,674,297 $1,472,399 $1,403,748 13.7% 4.9% Net interest income (1) $47,214 $49,501 $46,612 (4.6)% 6.2% Net interest margin (1) 2.82% 3.36% 3.32% Yield on earning assets (1) 2.96% 3.71% 3.59% Rate on interest bearing liabilities 0.49% 1.32% 1.00% (1) Presented on a tax-equivalent basis using a tax rate of 21% in 2020, 2019 and 2018. The decrease in net interest income in 2020 compared to 2019 is primarily due to the Federal Reserve’s actions to lower the Federal Funds rate to near-zero levels, which adversely impacted net interest income and the net interest rate margin. The yield on interest-earning assets declined 75 basis points from 3.71% in 2019 to 2.96% in 2020 while the cost of interest-bearing liabilities declined 83 basis points from 1.32% in 2019 to 0.49% in 2020. However, the Company also had average balances of demand deposits and accounts and drafts payable of $356,400,000 and $803,600,000 in 2020, respectively that do not pay any interest. As such, when interest rates decline, interest income on assets funded by these balances decline but the cost paid on these balances remains at zero.
23
Total average loans increased $146,208,000, or 19%, to $906,361,000 largely due to the funding of PPP loans in addition to organic loan growth. Loans have a positive effect on interest income and the net interest margin due to the fact that loans are one of the Company’s highest yielding earning assets for any given maturity. Total average investment in securities and certificates of deposit decreased $59,448,000, or 14%. The investment portfolio will expand and contract over time as the Company manages its liquidity and interest rate position. Average interest bearing deposits in other financial institutions increased $94,532,000, or 82%. Average federal funds sold and other short-term investments increased $20,606,000, or 12%. These balances increased considerably in 2020 as governmental stimulus activity boosted deposit balances which contributed to the rise in federal funds sold and other short-term investments. Total average interest-bearing deposits increased $85,567,000, or 22%, largely due to the impact of government stimulus and resulting cash deposits. Average non-interest bearing demand deposits increased $80,132,000, or 29%, also largely due to the impact of government stimulus and resulting cash deposits.
Distribution of Assets, Liabilities and Shareholders' Equity; Interest Rate and Interest Differential The following table contains condensed average balance sheets for each of the periods reported, the tax-equivalent interest income and expense on each category of interest-earning assets and interest-bearing liabilities, and the average yield on such categories of interest-earning assets and the average rates paid on such categories of interest-bearing liabilities for each of the periods reported:
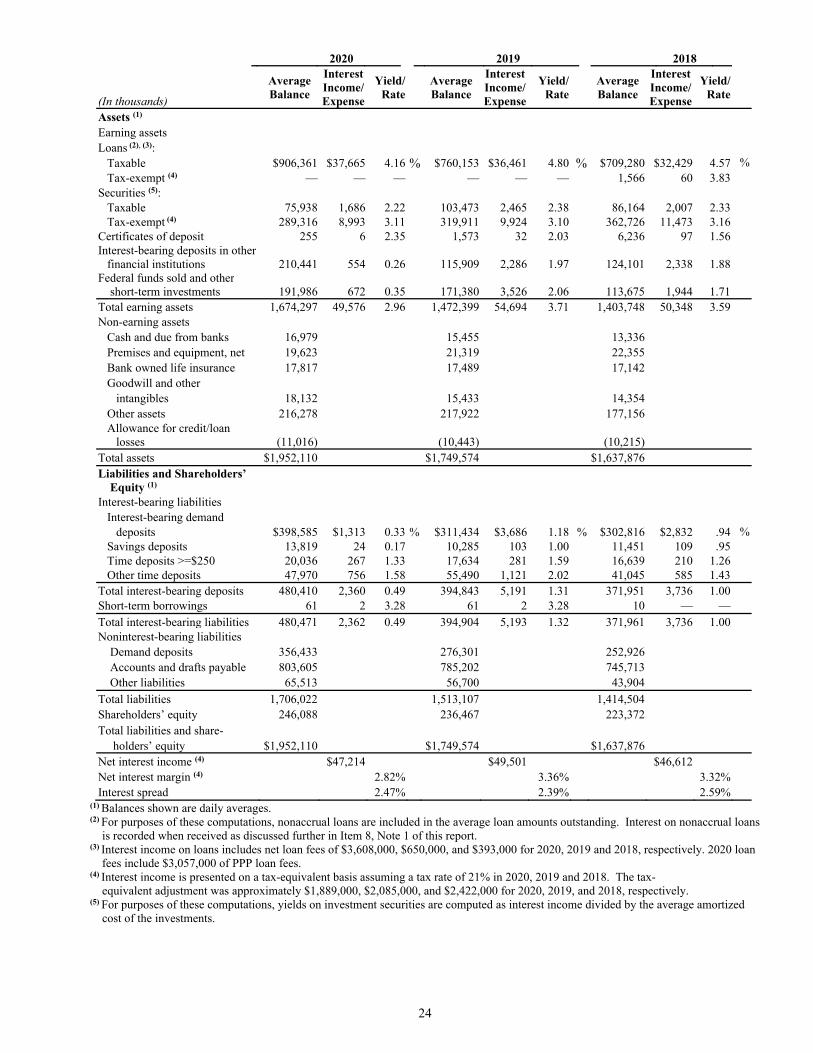
24
2020 2019 2018
(1) Balances shown are daily averages. (2) For purposes of these computations, nonaccrual loans are included in the average loan amounts outstanding. Interest on nonaccrual loans
is recorded when received as discussed further in Item 8, Note 1 of this report. (3) Interest income on loans includes net loan fees of $3,608,000, $650,000, and $393,000 for 2020, 2019 and 2018, respectively. 2020 loan fees include $3,057,000 of PPP loan fees. (4) Interest income is presented on a tax-equivalent basis assuming a tax rate of 21% in 2020, 2019 and 2018. The tax- equivalent adjustment was approximately $1,889,000, $2,085,000, and $2,422,000 for 2020, 2019, and 2018, respectively.
(5) For purposes of these computations, yields on investment securities are computed as interest income divided by the average amortized cost of the investments.
(In thousands)
Average Balance
Interest Income/Expense
Yield/ Rate
Average Balance
Interest Income/Expense
Yield/ Rate
Average Balance
Interest Income/Expense
Yield/ Rate
Assets (1) Earning assets Loans (2), (3): Taxable $906,361 $37,665 4.16 % $760,153 $36,461 4.80 % $709,280 $32,429 4.57 % Tax-exempt (4) — — — — — — 1,566 60 3.83 Securities (5): Taxable 75,938 1,686 2.22 103,473 2,465 2.38 86,164 2,007 2.33 Tax-exempt (4) 289,316 8,993 3.11 319,911 9,924 3.10 362,726 11,473 3.16 Certificates of deposit 255 6 2.35 1,573 32 2.03 6,236 97 1.56 Interest-bearing deposits in other financial institutions 210,441 554 0.26 115,909 2,286 1.97 124,101 2,338 1.88 Federal funds sold and other short-term investments 191,986 672 0.35 171,380 3,526 2.06 113,675 1,944 1.71 Total earning assets 1,674,297 49,576 2.96 1,472,399 54,694 3.71 1,403,748 50,348 3.59 Non-earning assets Cash and due from banks 16,979 15,455 13,336 Premises and equipment, net 19,623 21,319 22,355 Bank owned life insurance 17,817 17,489 17,142 Goodwill and other intangibles 18,132 15,433 14,354 Other assets 216,278 217,922 177,156 Allowance for credit/loan losses
(11,016)
(10,443)
(10,215)
Total assets $1,952,110 $1,749,574 $1,637,876 Liabilities and Shareholders’
Equity (1)
Interest-bearing liabilities Interest-bearing demand deposits $398,585 $1,313 0.33 % $311,434 $3,686 1.18 % $302,816 $2,832 .94 % Savings deposits 13,819 24 0.17 10,285 103 1.00 11,451 109 .95 Time deposits >=$250 20,036 267 1.33 17,634 281 1.59 16,639 210 1.26 Other time deposits 47,970 756 1.58 55,490 1,121 2.02 41,045 585 1.43 Total interest-bearing deposits 480,410 2,360 0.49 394,843 5,191 1.31 371,951 3,736 1.00 Short-term borrowings 61 2 3.28 61 2 3.28 10 — — Total interest-bearing liabilities 480,471 2,362 0.49 394,904 5,193 1.32 371,961 3,736 1.00 Noninterest-bearing liabilities
Demand deposits 356,433 276,301 252,926 Accounts and drafts payable 803,605 785,202 745,713 Other liabilities 65,513 56,700 43,904
Total liabilities 1,706,022 1,513,107 1,414,504 Shareholders’ equity 246,088 236,467 223,372 Total liabilities and share- holders’ equity $1,952,110 $1,749,574 $1,637,876 Net interest income (4) $47,214 $49,501 $46,612 Net interest margin (4) 2.82% 3.36% 3.32% Interest spread 2.47% 2.39% 2.59%

25
Analysis of Net Interest Income Changes
The following table presents the changes in interest income and expense between years due to changes in volume and interest rates.
2020 Over 2019 2019 Over 2018
(In thousands) Volume (1) Rate (1) Total Volume(1) Rate (1) Total
Increase (decrease) in interest income: Loans (2), (3):
Taxable $6,476 $(5,272) $1,204 $2,394 $1,638 $4,032 Tax-exempt — — — (60) — (60) Securities: Taxable (620) (159) (779) 411 47 458 Tax-exempt (4) (951) 20 (931) (1,332) (217) (1,549) Certificates of deposit (30) 4 (26) (88) 23 (65) Interest-bearing deposits in other
financial institutions 1,086 (2,818) (1,732) (159) 107 (52) Federal funds sold and other short-term
investments 381 (3,235) (2,854) 1,130 452 1,582 Total interest income $6,342 $(11,460) $(5,118) $2,296 $2,050 $4,346 Interest expense on: Interest-bearing demand deposits $828 $(3,201) $(2,373) $83 $771 $854 Savings deposits 27 (106) (79) (11) 5 (6) Time deposits >=$250 36 (50) (14) 13 58 71 Other time deposits (139) (226) (365) 245 291 536 Short-term borrowings — — — — 2 2 Total interest expense 752 (3,583) (2,831) 330 1,127 1,457 Net interest income $5,590 $(7,877) $(2,287) $1,966 $923 $2,889
(1) The change in interest due to the combined rate/volume variance has been allocated in proportion to the absolute dollar amounts of the change in each.
(2) Average balances include nonaccrual loans. (3) Interest income includes net loan fees. (4) Interest income is presented on a tax-equivalent basis assuming a tax rate of 21% in 2020, 2019 and 2018. Loan Portfolio
Interest earned on the loan portfolio is a primary source of income for the Company. The loan portfolio was $891,676,000 representing 40% of the Company's total assets as of December 31, 2020 and generated $37,665,000 in revenue during the year then ended. The following tables show the composition of the loan portfolio at the end of the periods indicated and remaining maturities for loans as of December 31, 2020.
Loans by Type December 31,
(In thousands) 2020 2019 2018 2017 2016 Commercial and industrial $298,984 $323,857 $277,091 $236,394 $214,767 Real estate (commercial and faith-based): Mortgage 434,080 407,480 411,752 410,748 425,947 Construction 48,908 41,244 32,434 35,307 17,477 PPP 109,704 — — — — Industrial Revenue Bond — — — 3,374 6,639 Other — 57 310 408 36 Total loans $891,676 $772,638 $721,587 $686,231 $664,866
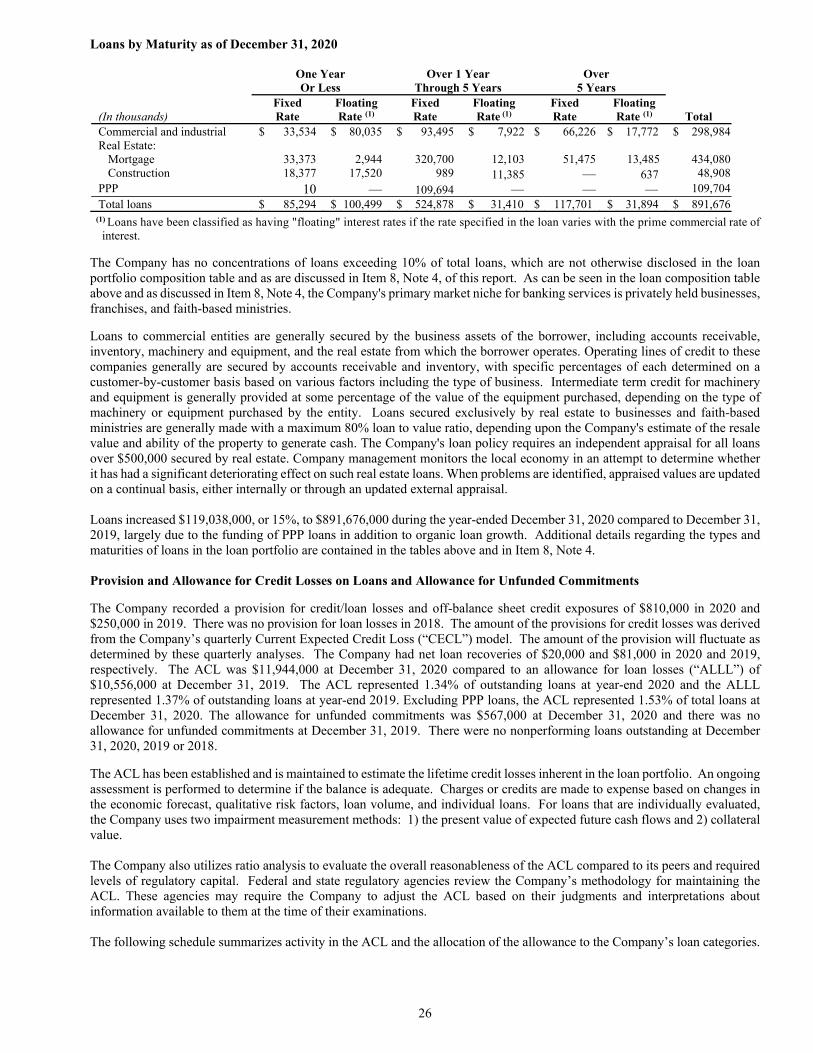
26
Loans by Maturity as of December 31, 2020
One Year Or Less
Over 1 Year Through 5 Years
Over 5 Years
(In thousands)
Fixed Rate
Floating Rate (1)
Fixed Rate
Floating Rate (1)
Fixed Rate
Floating Rate (1)
Total
Commercial and industrial $ 33,534 $ 80,035 $ 93,495 $ 7,922 $ 66,226 $ 17,772 $ 298,984 Real Estate: Mortgage 33,373 2,944 320,700 12,103 51,475 13,485 434,080 Construction 18,377 17,520 989 11,385 — 637 48,908 PPP 10 — 109,694 — — — 109,704 Total loans $ 85,294 $ 100,499 $ 524,878 $ 31,410 $ 117,701 $ 31,894 $ 891,676
(1) Loans have been classified as having "floating" interest rates if the rate specified in the loan varies with the prime commercial rate of interest.
The Company has no concentrations of loans exceeding 10% of total loans, which are not otherwise disclosed in the loan portfolio composition table and as are discussed in Item 8, Note 4, of this report. As can be seen in the loan composition table above and as discussed in Item 8, Note 4, the Company's primary market niche for banking services is privately held businesses, franchises, and faith-based ministries.
Loans to commercial entities are generally secured by the business assets of the borrower, including accounts receivable, inventory, machinery and equipment, and the real estate from which the borrower operates. Operating lines of credit to these companies generally are secured by accounts receivable and inventory, with specific percentages of each determined on a customer-by-customer basis based on various factors including the type of business. Intermediate term credit for machinery and equipment is generally provided at some percentage of the value of the equipment purchased, depending on the type of machinery or equipment purchased by the entity. Loans secured exclusively by real estate to businesses and faith-based ministries are generally made with a maximum 80% loan to value ratio, depending upon the Company's estimate of the resale value and ability of the property to generate cash. The Company's loan policy requires an independent appraisal for all loans over $500,000 secured by real estate. Company management monitors the local economy in an attempt to determine whether it has had a significant deteriorating effect on such real estate loans. When problems are identified, appraised values are updated on a continual basis, either internally or through an updated external appraisal. Loans increased $119,038,000, or 15%, to $891,676,000 during the year-ended December 31, 2020 compared to December 31, 2019, largely due to the funding of PPP loans in addition to organic loan growth. Additional details regarding the types and maturities of loans in the loan portfolio are contained in the tables above and in Item 8, Note 4. Provision and Allowance for Credit Losses on Loans and Allowance for Unfunded Commitments
The Company recorded a provision for credit/loan losses and off-balance sheet credit exposures of $810,000 in 2020 and $250,000 in 2019. There was no provision for loan losses in 2018. The amount of the provisions for credit losses was derived from the Company’s quarterly Current Expected Credit Loss (“CECL”) model. The amount of the provision will fluctuate as determined by these quarterly analyses. The Company had net loan recoveries of $20,000 and $81,000 in 2020 and 2019, respectively. The ACL was $11,944,000 at December 31, 2020 compared to an allowance for loan losses (“ALLL”) of $10,556,000 at December 31, 2019. The ACL represented 1.34% of outstanding loans at year-end 2020 and the ALLL represented 1.37% of outstanding loans at year-end 2019. Excluding PPP loans, the ACL represented 1.53% of total loans at December 31, 2020. The allowance for unfunded commitments was $567,000 at December 31, 2020 and there was no allowance for unfunded commitments at December 31, 2019. There were no nonperforming loans outstanding at December 31, 2020, 2019 or 2018. The ACL has been established and is maintained to estimate the lifetime credit losses inherent in the loan portfolio. An ongoing assessment is performed to determine if the balance is adequate. Charges or credits are made to expense based on changes in the economic forecast, qualitative risk factors, loan volume, and individual loans. For loans that are individually evaluated, the Company uses two impairment measurement methods: 1) the present value of expected future cash flows and 2) collateral value. The Company also utilizes ratio analysis to evaluate the overall reasonableness of the ACL compared to its peers and required levels of regulatory capital. Federal and state regulatory agencies review the Company’s methodology for maintaining the ACL. These agencies may require the Company to adjust the ACL based on their judgments and interpretations about information available to them at the time of their examinations. The following schedule summarizes activity in the ACL and the allocation of the allowance to the Company’s loan categories.

27
Summary of Credit Loss Experience
December 31, (In thousands) 2020 2019 2018 2017 2016 Allowance at beginning of year $11,279 $10,225 $10,205 $10,175 $11,635 Loans charged-off:
Commercial and industrial — — — — — Real estate (commercial and faith-based):
Mortgage — — — — — Construction — — — — —
Other — — — — — Total loans charged-off — — — — — Recoveries of loans previously charged-off:
Commercial and industrial 19 81 20 30 39 Real estate (commercial and faith-based):
Mortgage 1 — — — 1 Construction — — — — —
Other — — — — — Total recoveries of loans previously charged-off 20 81 20 30 40 Net loans recovered (20) (81) (20) (30) (40) Provision charged (credited) to expense 645 250 — — (1,500) Allowance at end of year $11,944 $10,556 $10,225 $10,205 $10,175 Cumulative effect of accounting change (ASU 2016-13) — 723 — — — Allowance at beginning of next year $11,944 $11,279 $10,225 $10,205 $10,175 Allowance for unfunded commitments at beginning of year $402 $ — $ — $ — $ — Provision charged to expense 165 — — — — Allowance for unfunded commitments at end of year 567 — — — — Cumulative effect of accounting change (ASU 2016-13) — 402 — — — Allowance for unfunded commitments at beginning of next year $567 $402 $ — $ — $ — Loans outstanding: Average $906,631 $760,153 $710,846 $663,653 $678,061 December 31 891,676 772,638 721,587 686,231 664,866 Ratio of allowance for credit/loan losses to loans
outstanding: Average 1.32% 1.39% 1.44% 1.54% 1.50% December 31 1.34% 1.37% 1.42% 1.49% 1.53% Ratio of net recoveries to average loans
outstanding — (.01)% — — (.01)% Allocation of allowance for credit/loan losses (1):
Commercial and industrial $4,635 $4,874 $4,179 $3,652 $3,261 Real estate (commercial and faith-based): Mortgage 6,892 5,370 5,378 5,356 5,689 Construction 417 312 244 266 132 Industrial Revenue Bond — — — 52 101 Other — — 424 879 992
Total $11,944 $10,556 $10,225 $10,205 $10,175 Percentage of categories to total loans:
Commercial and industrial 33.5% 41.9% 38.4% 34.4% 32.3% Real estate (commercial and faith-based): Mortgage 48.7% 52.8% 57.1% 59.9% 64.1% Construction 5.5% 5.3% 4.5% 5.1% 2.6% PPP 12.3% —% —% —% —% Industrial Revenue Bond —% —% —% .59% 1.0% Other —% —% —% .01% %
Total 100.0% 100.0% 100.0% 100.0% 100.0% (1) Although specific allocations exist, the entire allowance is available to absorb losses in any particular loan category.

28
Nonperforming Assets
Nonperforming loans are defined as loans on non-accrual status and loans 90 days or more past due but still accruing. Nonperforming assets include nonperforming loans plus foreclosed real estate. Troubled debt restructurings are not included in nonperforming loans unless they are on non-accrual status or past due 90 days or more. It is the policy of the Company to continually monitor its loan portfolio and to discontinue the accrual of interest on any loan for which collection is not probable. Subsequent payments received on such loans are applied to principal if collection of principal is not probable; otherwise, these receipts are recorded as interest income. There was no interest on nonaccrual loans for the years ended December 31, 2020 and 2019, respectively. There were no nonaccrual loans or foreclosed assets at December 31, 2020 or December 31, 2019. The Company does not have any foreign loans. The Company's loan portfolio does not include a significant amount of single family real estate mortgages, as the Company does not market its services to retail customers. Also, the Company had no sub-prime mortgage loans or residential development loans in its portfolio in any of the years presented. The Company does not have any other interest-earning assets which would have been included in nonaccrual, past due or restructured loans if such assets were loans. Summary of Nonperforming Assets
December 31, (In thousands) 2020 2019 2018 2017 2016 Commercial and industrial:
Nonaccrual $ — $ — $ — $ — $ — Contractually past due 90 days or more and still
accruing — — — — — Real estate – mortgage:
Nonaccrual(1) — — — — 245 Contractually past due 90 days or more and still
accruing — — — — — Total nonperforming loans $ — $ — $ — $ — $245 Total foreclosed assets — — — — — Total nonperforming assets $ — $ — $ — $ — $245
(1) In October 2017, one nonaccrual loan with a balance of $215,000 was paid in full. In February 2016, one nonaccrual loan with a balance of $2,727,000 was paid in full.
Operating Expenses Operating expenses in 2020 compared to 2019 include the following significant pre-tax components:
Personnel expense decreased $3,021,000, or 3%, to $88,062,000 as COVID-19 caused a decrease in invoice processing volumes and a corresponding decrease in personnel expense. Promotional expense decreased $1,654,000, or 43%, as employee travel-related expenses were limited throughout the year.
Income Tax Expense Income tax expense in 2020 totaled $5,165,000 compared to $7,062,000 in 2019. When measured as a percent of pre-tax income, the Company’s effective tax rate was 17% in 2020 and 19% in 2019. The decrease in the effective tax rate in 2020 compared to 2019 was primarily due to tax-exempt income from municipal bonds being a larger percentage of total pretax income, in addition to the eligibility of additional tax credits. Investment Portfolio Investment portfolio changes from December 31, 2019 to December 31, 2020:
State and political subdivision securities decreased $18,473,000, or 6%, to $305,974,000. U.S. government agency securities decreased $45,966,000 to $51,752,000. The investment portfolio provides the Company with a significant source of earnings, secondary source of liquidity, and mechanisms to manage the effects of changes in loan demand and interest rates. Therefore, the size, asset allocation and maturity distribution of the investment portfolio will vary over time depending on management’s assessment of current and future interest rates, changes in loan demand, changes in the
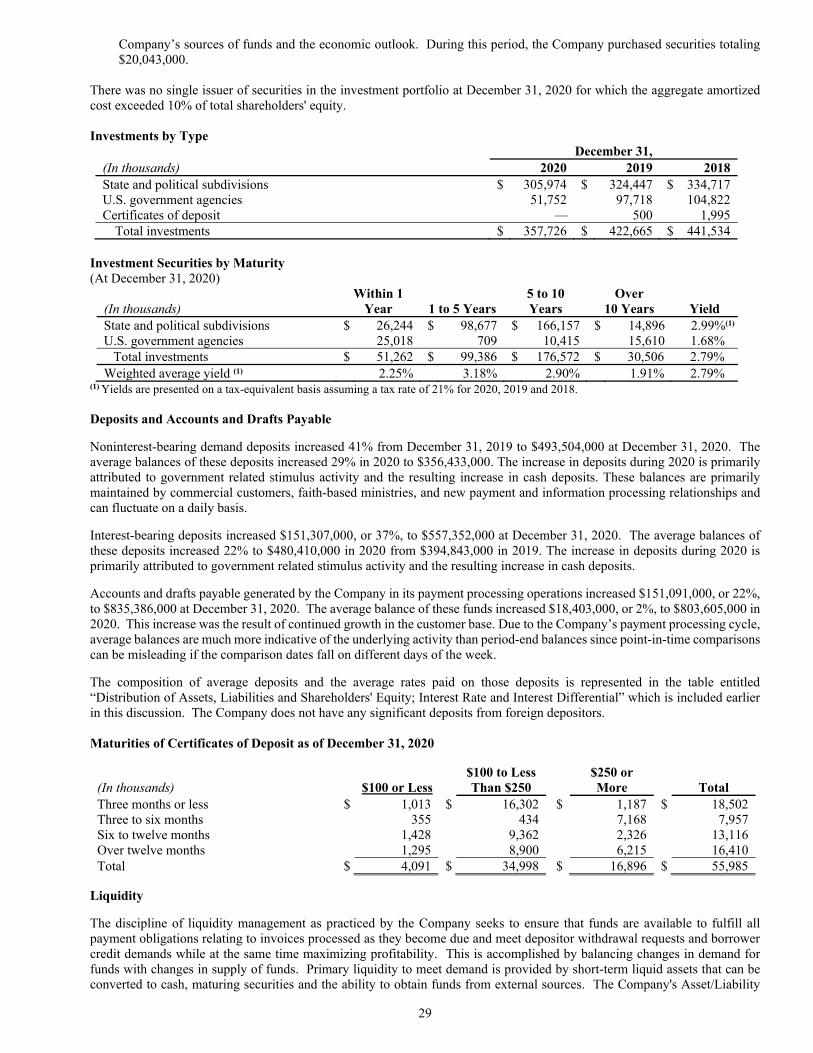
29
Company’s sources of funds and the economic outlook. During this period, the Company purchased securities totaling $20,043,000.
There was no single issuer of securities in the investment portfolio at December 31, 2020 for which the aggregate amortized cost exceeded 10% of total shareholders' equity. Investments by Type
December 31, (In thousands) 2020 2019 2018 State and political subdivisions $ 305,974 $ 324,447 $ 334,717 U.S. government agencies 51,752 97,718 104,822 Certificates of deposit 500 1,995 Total investments $ 357,726 $ 422,665 $ 441,534
Investment Securities by Maturity (At December 31, 2020)
(In thousands)
Within 1 Year
1 to 5 Years
5 to 10 Years
Over 10 Years
Yield
State and political subdivisions $ 26,244 $ 98,677 $ 166,157 $ 14,896 2.99%(1) U.S. government agencies 25,018 709 10,415 15,610 1.68% Total investments $ 51,262 $ 99,386 $ 176,572 $ 30,506 2.79% Weighted average yield (1) 2.25% 3.18% 2.90% 1.91% 2.79%
(1) Yields are presented on a tax-equivalent basis assuming a tax rate of 21% for 2020, 2019 and 2018. Deposits and Accounts and Drafts Payable
Noninterest-bearing demand deposits increased 41% from December 31, 2019 to $493,504,000 at December 31, 2020. The average balances of these deposits increased 29% in 2020 to $356,433,000. The increase in deposits during 2020 is primarily attributed to government related stimulus activity and the resulting increase in cash deposits. These balances are primarily maintained by commercial customers, faith-based ministries, and new payment and information processing relationships and can fluctuate on a daily basis.
Interest-bearing deposits increased $151,307,000, or 37%, to $557,352,000 at December 31, 2020. The average balances of these deposits increased 22% to $480,410,000 in 2020 from $394,843,000 in 2019. The increase in deposits during 2020 is primarily attributed to government related stimulus activity and the resulting increase in cash deposits.
Accounts and drafts payable generated by the Company in its payment processing operations increased $151,091,000, or 22%, to $835,386,000 at December 31, 2020. The average balance of these funds increased $18,403,000, or 2%, to $803,605,000 in 2020. This increase was the result of continued growth in the customer base. Due to the Company’s payment processing cycle, average balances are much more indicative of the underlying activity than period-end balances since point-in-time comparisons can be misleading if the comparison dates fall on different days of the week.
The composition of average deposits and the average rates paid on those deposits is represented in the table entitled “Distribution of Assets, Liabilities and Shareholders' Equity; Interest Rate and Interest Differential” which is included earlier in this discussion. The Company does not have any significant deposits from foreign depositors. Maturities of Certificates of Deposit as of December 31, 2020
(In thousands)
$100 or Less $100 to Less Than $250
$250 or More
Total
Three months or less $ 1,013 $ 16,302 $ 1,187 $ 18,502 Three to six months 355 434 7,168 7,957 Six to twelve months 1,428 9,362 2,326 13,116 Over twelve months 1,295 8,900 6,215 16,410 Total $ 4,091 $ 34,998 $ 16,896 $ 55,985
Liquidity
The discipline of liquidity management as practiced by the Company seeks to ensure that funds are available to fulfill all payment obligations relating to invoices processed as they become due and meet depositor withdrawal requests and borrower credit demands while at the same time maximizing profitability. This is accomplished by balancing changes in demand for funds with changes in supply of funds. Primary liquidity to meet demand is provided by short-term liquid assets that can be converted to cash, maturing securities and the ability to obtain funds from external sources. The Company's Asset/Liability
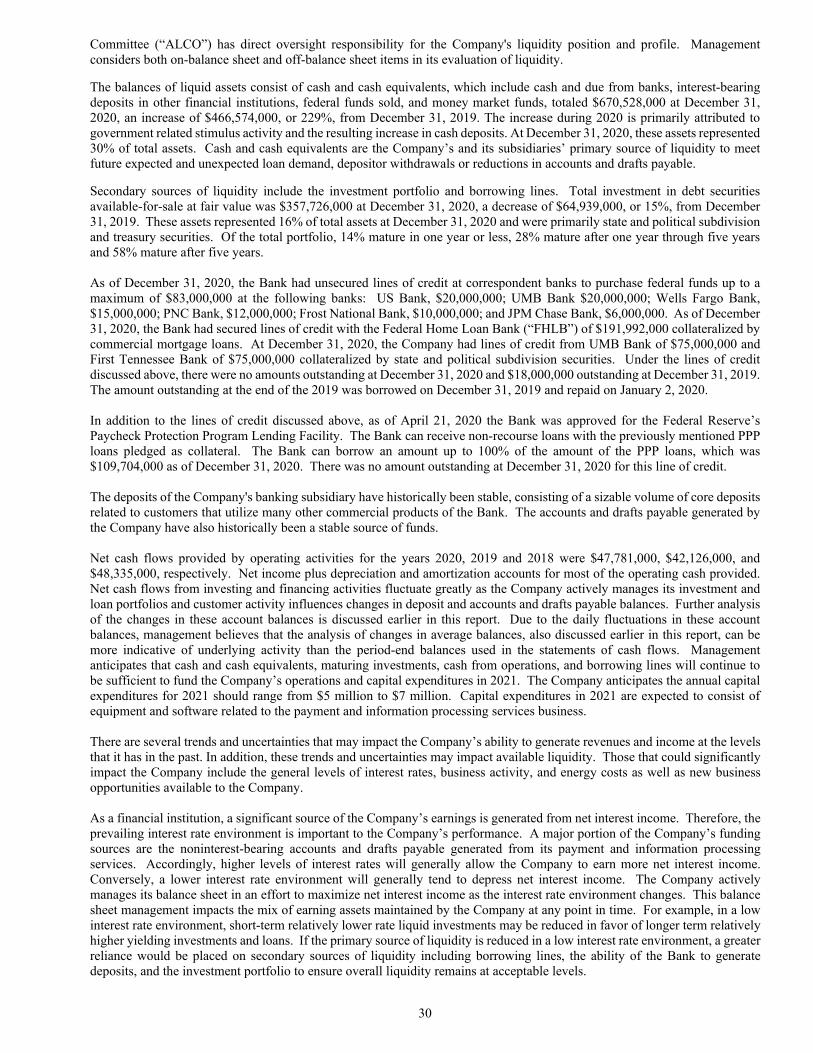
30
Committee (“ALCO”) has direct oversight responsibility for the Company's liquidity position and profile. Management considers both on-balance sheet and off-balance sheet items in its evaluation of liquidity.
The balances of liquid assets consist of cash and cash equivalents, which include cash and due from banks, interest-bearing deposits in other financial institutions, federal funds sold, and money market funds, totaled $670,528,000 at December 31, 2020, an increase of $466,574,000, or 229%, from December 31, 2019. The increase during 2020 is primarily attributed to government related stimulus activity and the resulting increase in cash deposits. At December 31, 2020, these assets represented 30% of total assets. Cash and cash equivalents are the Company’s and its subsidiaries’ primary source of liquidity to meet future expected and unexpected loan demand, depositor withdrawals or reductions in accounts and drafts payable.
Secondary sources of liquidity include the investment portfolio and borrowing lines. Total investment in debt securities available-for-sale at fair value was $357,726,000 at December 31, 2020, a decrease of $64,939,000, or 15%, from December 31, 2019. These assets represented 16% of total assets at December 31, 2020 and were primarily state and political subdivision and treasury securities. Of the total portfolio, 14% mature in one year or less, 28% mature after one year through five years and 58% mature after five years. As of December 31, 2020, the Bank had unsecured lines of credit at correspondent banks to purchase federal funds up to a maximum of $83,000,000 at the following banks: US Bank, $20,000,000; UMB Bank $20,000,000; Wells Fargo Bank, $15,000,000; PNC Bank, $12,000,000; Frost National Bank, $10,000,000; and JPM Chase Bank, $6,000,000. As of December 31, 2020, the Bank had secured lines of credit with the Federal Home Loan Bank (“FHLB”) of $191,992,000 collateralized by commercial mortgage loans. At December 31, 2020, the Company had lines of credit from UMB Bank of $75,000,000 and First Tennessee Bank of $75,000,000 collateralized by state and political subdivision securities. Under the lines of credit discussed above, there were no amounts outstanding at December 31, 2020 and $18,000,000 outstanding at December 31, 2019. The amount outstanding at the end of the 2019 was borrowed on December 31, 2019 and repaid on January 2, 2020. In addition to the lines of credit discussed above, as of April 21, 2020 the Bank was approved for the Federal Reserve’s Paycheck Protection Program Lending Facility. The Bank can receive non-recourse loans with the previously mentioned PPP loans pledged as collateral. The Bank can borrow an amount up to 100% of the amount of the PPP loans, which was $109,704,000 as of December 31, 2020. There was no amount outstanding at December 31, 2020 for this line of credit. The deposits of the Company's banking subsidiary have historically been stable, consisting of a sizable volume of core deposits related to customers that utilize many other commercial products of the Bank. The accounts and drafts payable generated by the Company have also historically been a stable source of funds. Net cash flows provided by operating activities for the years 2020, 2019 and 2018 were $47,781,000, $42,126,000, and $48,335,000, respectively. Net income plus depreciation and amortization accounts for most of the operating cash provided. Net cash flows from investing and financing activities fluctuate greatly as the Company actively manages its investment and loan portfolios and customer activity influences changes in deposit and accounts and drafts payable balances. Further analysis of the changes in these account balances is discussed earlier in this report. Due to the daily fluctuations in these account balances, management believes that the analysis of changes in average balances, also discussed earlier in this report, can be more indicative of underlying activity than the period-end balances used in the statements of cash flows. Management anticipates that cash and cash equivalents, maturing investments, cash from operations, and borrowing lines will continue to be sufficient to fund the Company’s operations and capital expenditures in 2021. The Company anticipates the annual capital expenditures for 2021 should range from $5 million to $7 million. Capital expenditures in 2021 are expected to consist of equipment and software related to the payment and information processing services business. There are several trends and uncertainties that may impact the Company’s ability to generate revenues and income at the levels that it has in the past. In addition, these trends and uncertainties may impact available liquidity. Those that could significantly impact the Company include the general levels of interest rates, business activity, and energy costs as well as new business opportunities available to the Company. As a financial institution, a significant source of the Company’s earnings is generated from net interest income. Therefore, the prevailing interest rate environment is important to the Company’s performance. A major portion of the Company’s funding sources are the noninterest-bearing accounts and drafts payable generated from its payment and information processing services. Accordingly, higher levels of interest rates will generally allow the Company to earn more net interest income. Conversely, a lower interest rate environment will generally tend to depress net interest income. The Company actively manages its balance sheet in an effort to maximize net interest income as the interest rate environment changes. This balance sheet management impacts the mix of earning assets maintained by the Company at any point in time. For example, in a low interest rate environment, short-term relatively lower rate liquid investments may be reduced in favor of longer term relatively higher yielding investments and loans. If the primary source of liquidity is reduced in a low interest rate environment, a greater reliance would be placed on secondary sources of liquidity including borrowing lines, the ability of the Bank to generate deposits, and the investment portfolio to ensure overall liquidity remains at acceptable levels.
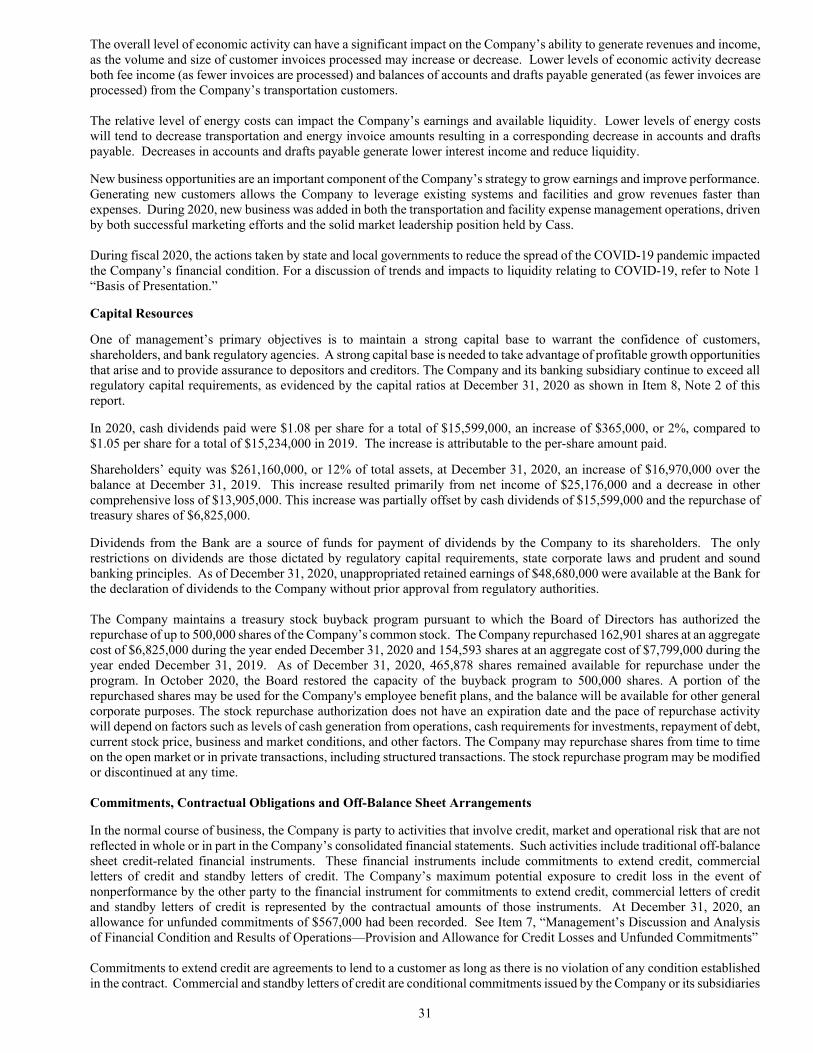
31
The overall level of economic activity can have a significant impact on the Company’s ability to generate revenues and income, as the volume and size of customer invoices processed may increase or decrease. Lower levels of economic activity decrease both fee income (as fewer invoices are processed) and balances of accounts and drafts payable generated (as fewer invoices are processed) from the Company’s transportation customers. The relative level of energy costs can impact the Company’s earnings and available liquidity. Lower levels of energy costs will tend to decrease transportation and energy invoice amounts resulting in a corresponding decrease in accounts and drafts payable. Decreases in accounts and drafts payable generate lower interest income and reduce liquidity.
New business opportunities are an important component of the Company’s strategy to grow earnings and improve performance. Generating new customers allows the Company to leverage existing systems and facilities and grow revenues faster than expenses. During 2020, new business was added in both the transportation and facility expense management operations, driven by both successful marketing efforts and the solid market leadership position held by Cass. During fiscal 2020, the actions taken by state and local governments to reduce the spread of the COVID-19 pandemic impacted the Company’s financial condition. For a discussion of trends and impacts to liquidity relating to COVID-19, refer to Note 1 “Basis of Presentation.”
Capital Resources
One of management’s primary objectives is to maintain a strong capital base to warrant the confidence of customers, shareholders, and bank regulatory agencies. A strong capital base is needed to take advantage of profitable growth opportunities that arise and to provide assurance to depositors and creditors. The Company and its banking subsidiary continue to exceed all regulatory capital requirements, as evidenced by the capital ratios at December 31, 2020 as shown in Item 8, Note 2 of this report.
In 2020, cash dividends paid were $1.08 per share for a total of $15,599,000, an increase of $365,000, or 2%, compared to $1.05 per share for a total of $15,234,000 in 2019. The increase is attributable to the per-share amount paid.
Shareholders’ equity was $261,160,000, or 12% of total assets, at December 31, 2020, an increase of $16,970,000 over the balance at December 31, 2019. This increase resulted primarily from net income of $25,176,000 and a decrease in other comprehensive loss of $13,905,000. This increase was partially offset by cash dividends of $15,599,000 and the repurchase of treasury shares of $6,825,000.
Dividends from the Bank are a source of funds for payment of dividends by the Company to its shareholders. The only restrictions on dividends are those dictated by regulatory capital requirements, state corporate laws and prudent and sound banking principles. As of December 31, 2020, unappropriated retained earnings of $48,680,000 were available at the Bank for the declaration of dividends to the Company without prior approval from regulatory authorities. The Company maintains a treasury stock buyback program pursuant to which the Board of Directors has authorized the repurchase of up to 500,000 shares of the Company’s common stock. The Company repurchased 162,901 shares at an aggregate cost of $6,825,000 during the year ended December 31, 2020 and 154,593 shares at an aggregate cost of $7,799,000 during the year ended December 31, 2019. As of December 31, 2020, 465,878 shares remained available for repurchase under the program. In October 2020, the Board restored the capacity of the buyback program to 500,000 shares. A portion of the repurchased shares may be used for the Company's employee benefit plans, and the balance will be available for other general corporate purposes. The stock repurchase authorization does not have an expiration date and the pace of repurchase activity will depend on factors such as levels of cash generation from operations, cash requirements for investments, repayment of debt, current stock price, business and market conditions, and other factors. The Company may repurchase shares from time to time on the open market or in private transactions, including structured transactions. The stock repurchase program may be modified or discontinued at any time. Commitments, Contractual Obligations and Off-Balance Sheet Arrangements
In the normal course of business, the Company is party to activities that involve credit, market and operational risk that are not reflected in whole or in part in the Company’s consolidated financial statements. Such activities include traditional off-balance sheet credit-related financial instruments. These financial instruments include commitments to extend credit, commercial letters of credit and standby letters of credit. The Company’s maximum potential exposure to credit loss in the event of nonperformance by the other party to the financial instrument for commitments to extend credit, commercial letters of credit and standby letters of credit is represented by the contractual amounts of those instruments. At December 31, 2020, an allowance for unfunded commitments of $567,000 had been recorded. See Item 7, “Management’s Discussion and Analysis of Financial Condition and Results of Operations—Provision and Allowance for Credit Losses and Unfunded Commitments” Commitments to extend credit are agreements to lend to a customer as long as there is no violation of any condition established in the contract. Commercial and standby letters of credit are conditional commitments issued by the Company or its subsidiaries
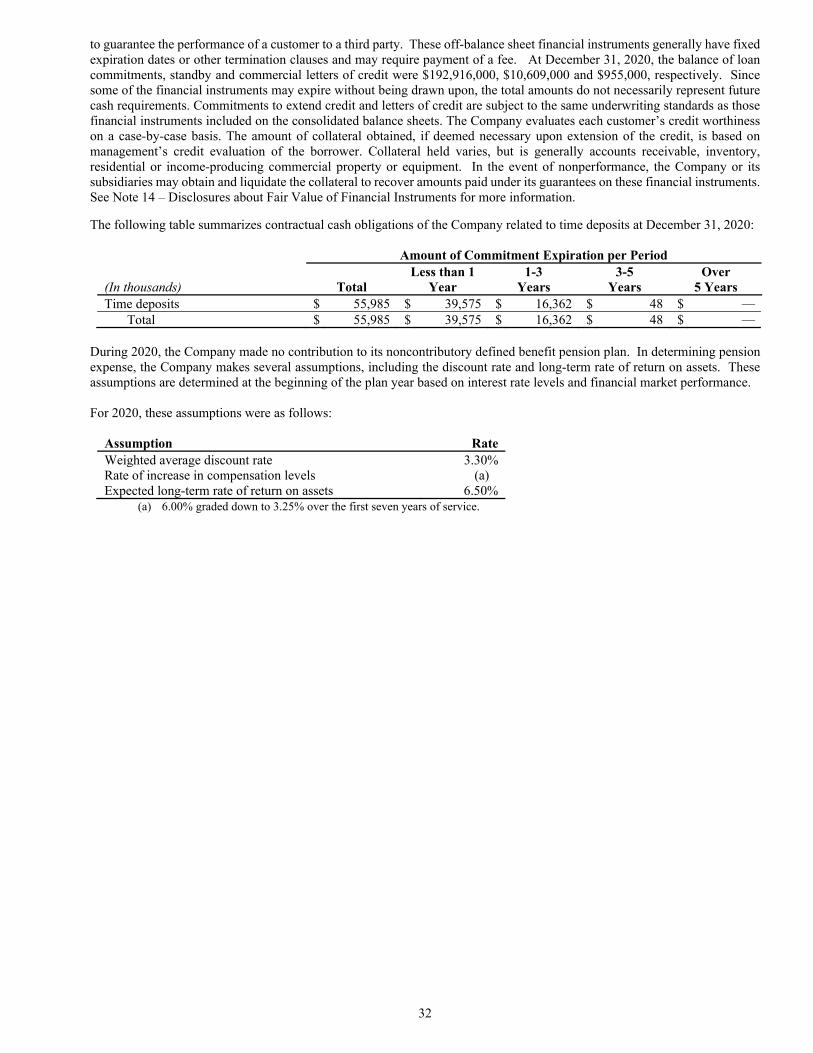
32
to guarantee the performance of a customer to a third party. These off-balance sheet financial instruments generally have fixed expiration dates or other termination clauses and may require payment of a fee. At December 31, 2020, the balance of loan commitments, standby and commercial letters of credit were $192,916,000, $10,609,000 and $955,000, respectively. Since some of the financial instruments may expire without being drawn upon, the total amounts do not necessarily represent future cash requirements. Commitments to extend credit and letters of credit are subject to the same underwriting standards as those financial instruments included on the consolidated balance sheets. The Company evaluates each customer’s credit worthiness on a case-by-case basis. The amount of collateral obtained, if deemed necessary upon extension of the credit, is based on management’s credit evaluation of the borrower. Collateral held varies, but is generally accounts receivable, inventory, residential or income-producing commercial property or equipment. In the event of nonperformance, the Company or its subsidiaries may obtain and liquidate the collateral to recover amounts paid under its guarantees on these financial instruments. See Note 14 – Disclosures about Fair Value of Financial Instruments for more information.
The following table summarizes contractual cash obligations of the Company related to time deposits at December 31, 2020:
Amount of Commitment Expiration per Period (In thousands)
Total
Less than 1 Year
1-3 Years
3-5 Years
Over 5 Years
Time deposits $ 55,985 $ 39,575 $ 16,362 $ 48 $ Total $ 55,985 $ 39,575 $ 16,362 $ 48 $
During 2020, the Company made no contribution to its noncontributory defined benefit pension plan. In determining pension expense, the Company makes several assumptions, including the discount rate and long-term rate of return on assets. These assumptions are determined at the beginning of the plan year based on interest rate levels and financial market performance. For 2020, these assumptions were as follows:
Assumption Rate Weighted average discount rate 3.30% Rate of increase in compensation levels (a) Expected long-term rate of return on assets 6.50%
(a) 6.00% graded down to 3.25% over the first seven years of service.
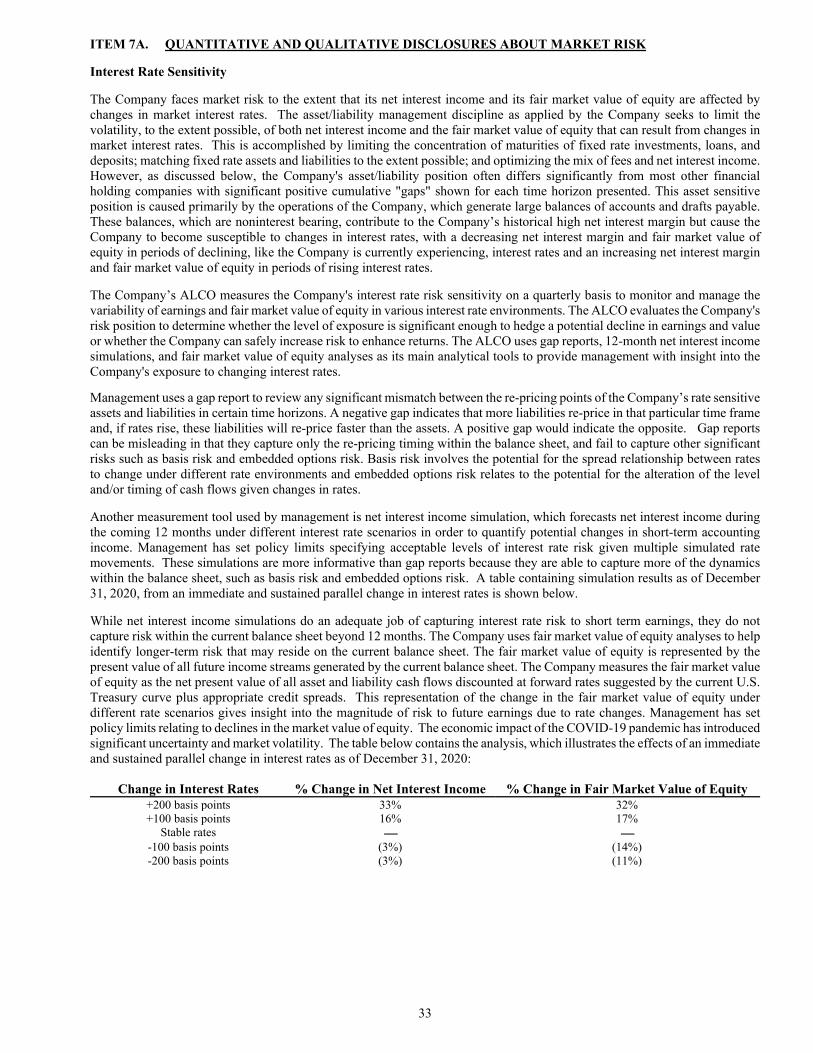
33
ITEM 7A. QUANTITATIVE AND QUALITATIVE DISCLOSURES ABOUT MARKET RISK
Interest Rate Sensitivity
The Company faces market risk to the extent that its net interest income and its fair market value of equity are affected by changes in market interest rates. The asset/liability management discipline as applied by the Company seeks to limit the volatility, to the extent possible, of both net interest income and the fair market value of equity that can result from changes in market interest rates. This is accomplished by limiting the concentration of maturities of fixed rate investments, loans, and deposits; matching fixed rate assets and liabilities to the extent possible; and optimizing the mix of fees and net interest income. However, as discussed below, the Company's asset/liability position often differs significantly from most other financial holding companies with significant positive cumulative "gaps" shown for each time horizon presented. This asset sensitive position is caused primarily by the operations of the Company, which generate large balances of accounts and drafts payable. These balances, which are noninterest bearing, contribute to the Company’s historical high net interest margin but cause the Company to become susceptible to changes in interest rates, with a decreasing net interest margin and fair market value of equity in periods of declining, like the Company is currently experiencing, interest rates and an increasing net interest margin and fair market value of equity in periods of rising interest rates.
The Company’s ALCO measures the Company's interest rate risk sensitivity on a quarterly basis to monitor and manage the variability of earnings and fair market value of equity in various interest rate environments. The ALCO evaluates the Company's risk position to determine whether the level of exposure is significant enough to hedge a potential decline in earnings and value or whether the Company can safely increase risk to enhance returns. The ALCO uses gap reports, 12-month net interest income simulations, and fair market value of equity analyses as its main analytical tools to provide management with insight into the Company's exposure to changing interest rates.
Management uses a gap report to review any significant mismatch between the re-pricing points of the Company’s rate sensitive assets and liabilities in certain time horizons. A negative gap indicates that more liabilities re-price in that particular time frame and, if rates rise, these liabilities will re-price faster than the assets. A positive gap would indicate the opposite. Gap reports can be misleading in that they capture only the re-pricing timing within the balance sheet, and fail to capture other significant risks such as basis risk and embedded options risk. Basis risk involves the potential for the spread relationship between rates to change under different rate environments and embedded options risk relates to the potential for the alteration of the level and/or timing of cash flows given changes in rates. Another measurement tool used by management is net interest income simulation, which forecasts net interest income during the coming 12 months under different interest rate scenarios in order to quantify potential changes in short-term accounting income. Management has set policy limits specifying acceptable levels of interest rate risk given multiple simulated rate movements. These simulations are more informative than gap reports because they are able to capture more of the dynamics within the balance sheet, such as basis risk and embedded options risk. A table containing simulation results as of December 31, 2020, from an immediate and sustained parallel change in interest rates is shown below.
While net interest income simulations do an adequate job of capturing interest rate risk to short term earnings, they do not capture risk within the current balance sheet beyond 12 months. The Company uses fair market value of equity analyses to help identify longer-term risk that may reside on the current balance sheet. The fair market value of equity is represented by the present value of all future income streams generated by the current balance sheet. The Company measures the fair market value of equity as the net present value of all asset and liability cash flows discounted at forward rates suggested by the current U.S. Treasury curve plus appropriate credit spreads. This representation of the change in the fair market value of equity under different rate scenarios gives insight into the magnitude of risk to future earnings due to rate changes. Management has set policy limits relating to declines in the market value of equity. The economic impact of the COVID-19 pandemic has introduced significant uncertainty and market volatility. The table below contains the analysis, which illustrates the effects of an immediate and sustained parallel change in interest rates as of December 31, 2020:
Change in Interest Rates % Change in Net Interest Income % Change in Fair Market Value of Equity +200 basis points 33% 32% +100 basis points 16% 17%
Stable rates -100 basis points (3%) (14%) -200 basis points (3%) (11%)
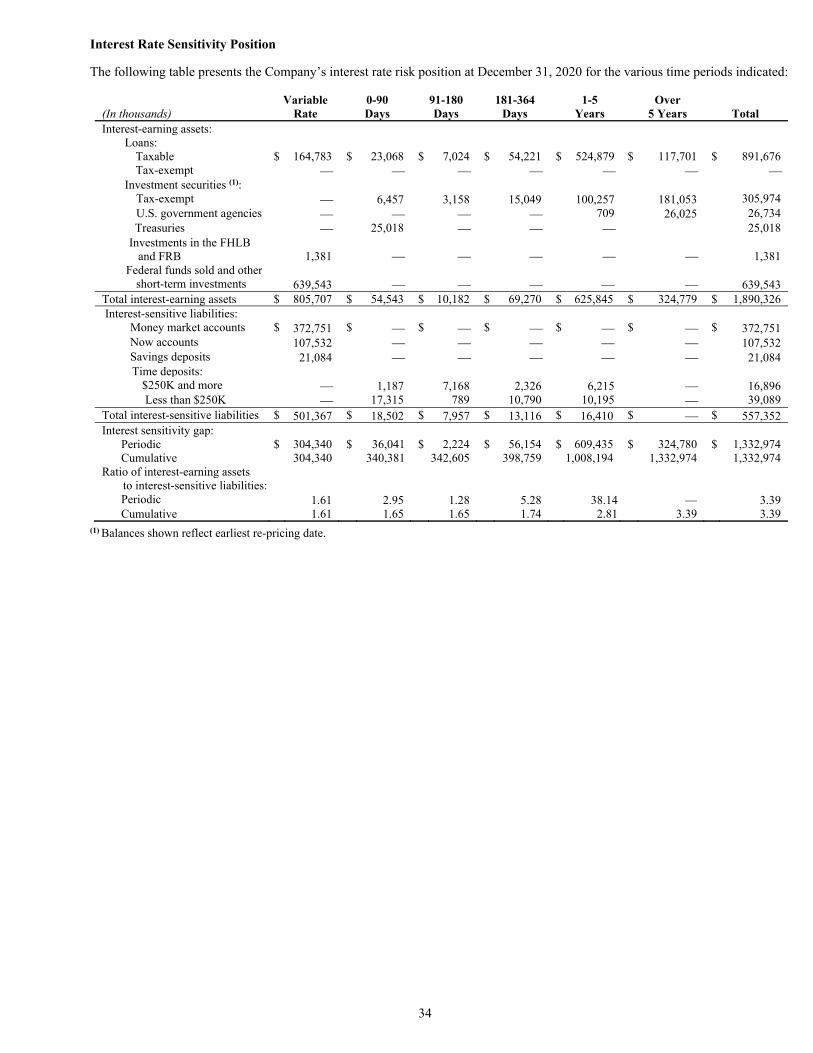
34
Interest Rate Sensitivity Position
The following table presents the Company’s interest rate risk position at December 31, 2020 for the various time periods indicated:
(In thousands)
Variable Rate
0-90 Days
91-180 Days
181-364 Days
1-5 Years
Over 5 Years
Total
Interest-earning assets: Loans: Taxable $ 164,783 $ 23,068 $ 7,024 $ 54,221 $ 524,879 $ 117,701 $ 891,676 Tax-exempt Investment securities (1): Tax-exempt 6,457 3,158 15,049 100,257 181,053 305,974 U.S. government agencies 709 26,025 26,734 Treasuries 25,018 25,018 Investments in the FHLB and FRB
1,381 1,381
Federal funds sold and other short-term investments 639,543 639,543 Total interest-earning assets $ 805,707 $ 54,543 $ 10,182 $ 69,270 $ 625,845 $ 324,779 $ 1,890,326 Interest-sensitive liabilities: Money market accounts $ 372,751 $ $ $ $ $ $ 372,751 Now accounts 107,532 107,532 Savings deposits 21,084 21,084 Time deposits: $250K and more 1,187 7,168 2,326 6,215 16,896 Less than $250K 17,315 789 10,790 10,195 39,089 Total interest-sensitive liabilities $ 501,367 $ 18,502 $ 7,957 $ 13,116 $ 16,410 $ $ 557,352 Interest sensitivity gap: Periodic $ 304,340 $ 36,041 $ 2,224 $ 56,154 $ 609,435 $ 324,780 $ 1,332,974 Cumulative 304,340 340,381 342,605 398,759 1,008,194 1,332,974 1,332,974 Ratio of interest-earning assets to interest-sensitive liabilities: Periodic 1.61 2.95 1.28 5.28 38.14 3.39 Cumulative 1.61 1.65 1.65 1.74 2.81 3.39 3.39
(1) Balances shown reflect earliest re-pricing date.
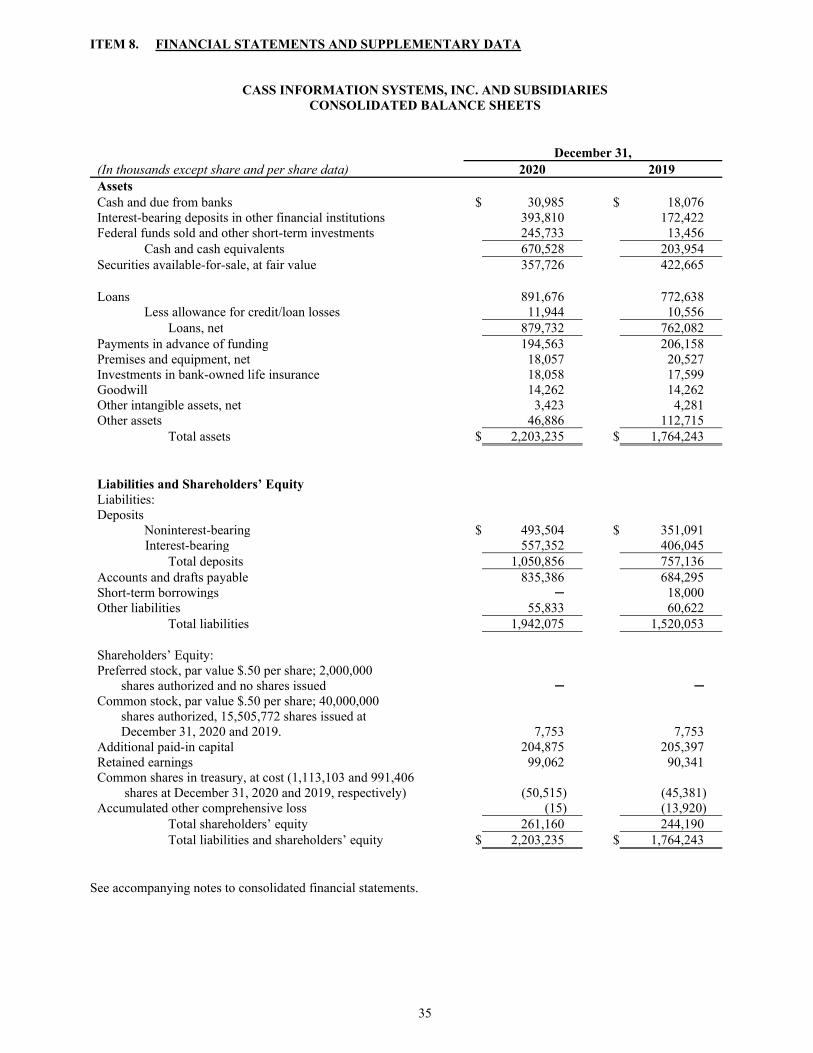
35
ITEM 8. FINANCIAL STATEMENTS AND SUPPLEMENTARY DATA
CASS INFORMATION SYSTEMS, INC. AND SUBSIDIARIES CONSOLIDATED BALANCE SHEETS
December 31, (In thousands except share and per share data) 2020 2019 Assets
Cash and due from banks $ 30,985
$ 18,076 Interest-bearing deposits in other financial institutions 393,810 172,422 Federal funds sold and other short-term investments 245,733 13,456 Cash and cash equivalents 670,528 203,954 Securities available-for-sale, at fair value 357,726 422,665 Loans 891,676 772,638 Less allowance for credit/loan losses 11,944 10,556 Loans, net 879,732 762,082 Payments in advance of funding 194,563
206,158 Premises and equipment, net 18,057
20,527 Investments in bank-owned life insurance 18,058 17,599 Goodwill 14,262 14,262 Other intangible assets, net 3,423
4,281 Other assets 46,886 112,715 Total assets $ 2,203,235
$ 1,764,243
Liabilities and Shareholders’ Equity
Liabilities:
Deposits
Noninterest-bearing $ 493,504
$ 351,091 Interest-bearing 557,352
406,045 Total deposits 1,050,856 757,136 Accounts and drafts payable 835,386
684,295 Short-term borrowings ─
18,000 Other liabilities 55,833
60,622 Total liabilities 1,942,075
1,520,053
Shareholders’ Equity:
Preferred stock, par value $.50 per share; 2,000,000
shares authorized and no shares issued ─
─ Common stock, par value $.50 per share; 40,000,000
shares authorized, 15,505,772 shares issued at
December 31, 2020 and 2019. 7,753
7,753 Additional paid-in capital 204,875
205,397 Retained earnings 99,062
90,341 Common shares in treasury, at cost (1,113,103 and 991,406
shares at December 31, 2020 and 2019, respectively) (50,515)
(45,381) Accumulated other comprehensive loss (15)
(13,920) Total shareholders’ equity 261,160
244,190 Total liabilities and shareholders’ equity $ 2,203,235
$ 1,764,243
See accompanying notes to consolidated financial statements.
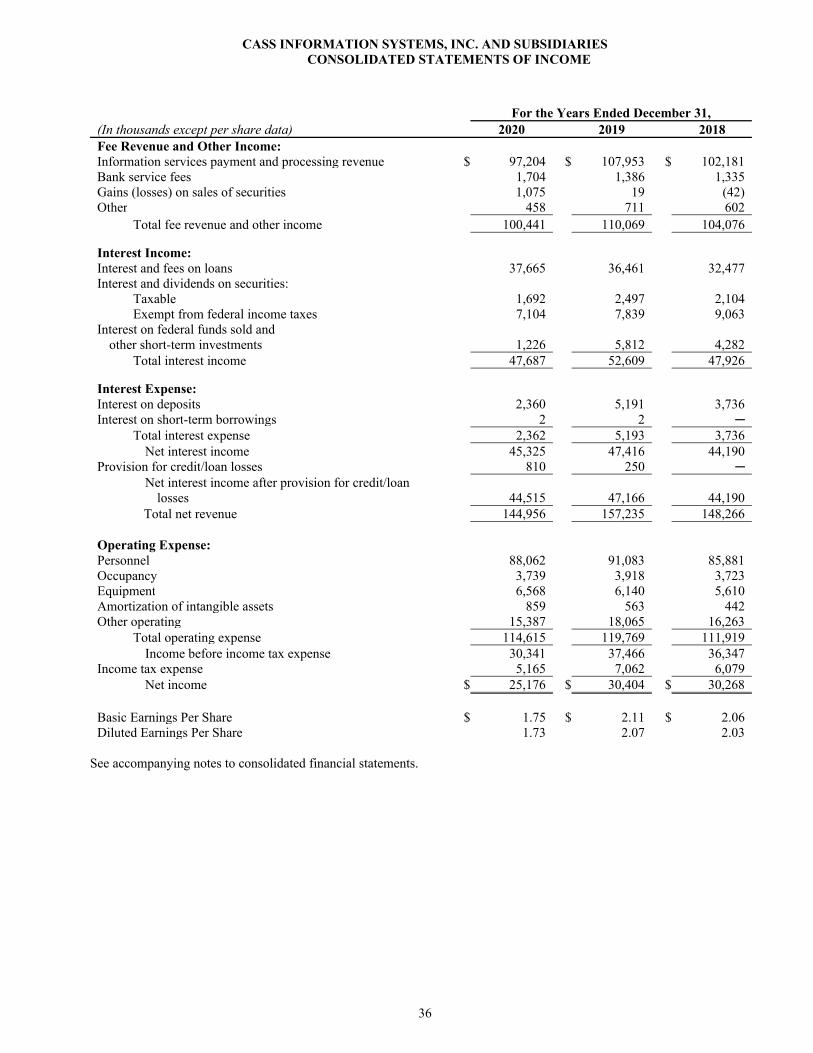
36
CASS INFORMATION SYSTEMS, INC. AND SUBSIDIARIES CONSOLIDATED STATEMENTS OF INCOME
For the Years Ended December 31, (In thousands except per share data) 2020 2019 2018 Fee Revenue and Other Income:
Information services payment and processing revenue $ 97,204 $ 107,953 $ 102,181 Bank service fees 1,704 1,386 1,335 Gains (losses) on sales of securities 1,075 19 (42) Other 458 711 602 Total fee revenue and other income 100,441 110,069 104,076
Interest Income: Interest and fees on loans 37,665 36,461 32,477 Interest and dividends on securities: Taxable 1,692 2,497 2,104 Exempt from federal income taxes 7,104 7,839 9,063 Interest on federal funds sold and other short-term investments
1,226 5,812 4,282
Total interest income 47,687 52,609 47,926
Interest Expense: Interest on deposits 2,360 5,191 3,736 Interest on short-term borrowings 2 2 ─ Total interest expense 2,362 5,193 3,736 Net interest income 45,325 47,416 44,190 Provision for credit/loan losses 810 250 ─ Net interest income after provision for credit/loan
losses
44,515
47,166
44,190 Total net revenue 144,956 157,235 148,266 Operating Expense: Personnel 88,062 91,083 85,881 Occupancy 3,739 3,918 3,723 Equipment 6,568 6,140 5,610 Amortization of intangible assets 859 563 442 Other operating 15,387 18,065 16,263 Total operating expense 114,615 119,769 111,919 Income before income tax expense 30,341 37,466 36,347 Income tax expense 5,165 7,062 6,079 Net income $ 25,176 $ 30,404 $ 30,268 Basic Earnings Per Share $ 1.75 $ 2.11 $ 2.06 Diluted Earnings Per Share 1.73 2.07 2.03
See accompanying notes to consolidated financial statements.
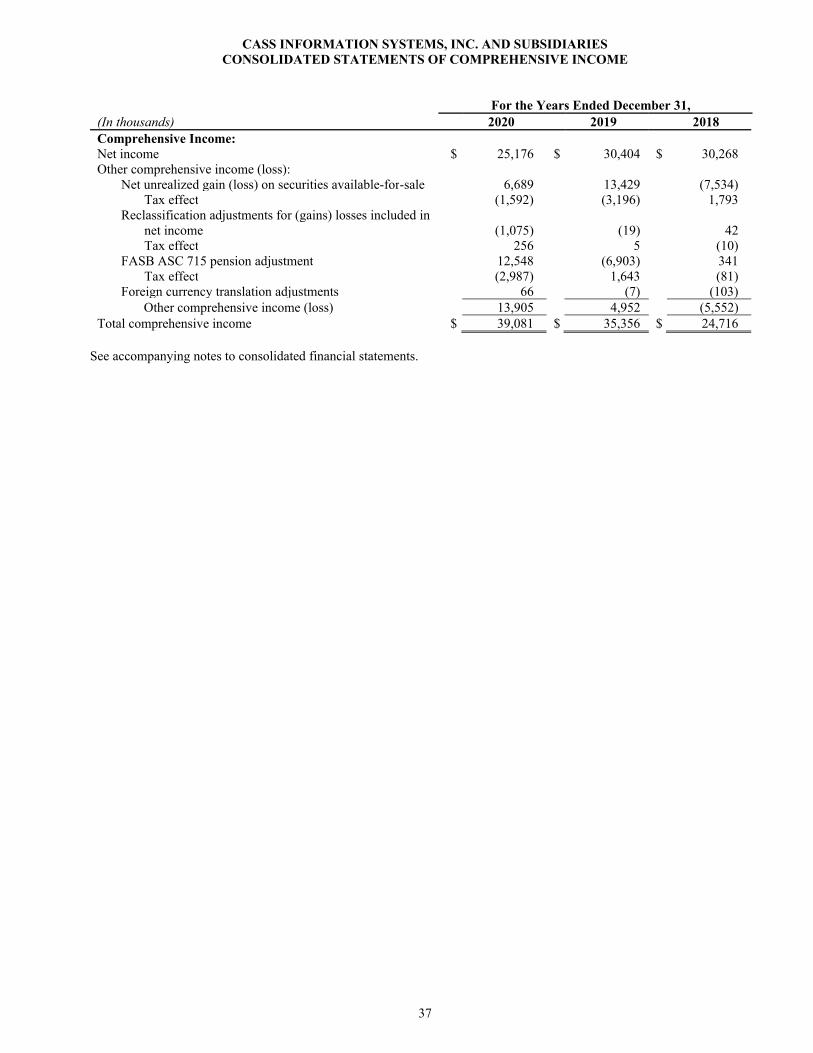
37
CASS INFORMATION SYSTEMS, INC. AND SUBSIDIARIES CONSOLIDATED STATEMENTS OF COMPREHENSIVE INCOME
For the Years Ended December 31, (In thousands) 2020 2019 2018 Comprehensive Income: Net income $ 25,176 $ 30,404 $ 30,268 Other comprehensive income (loss): Net unrealized gain (loss) on securities available-for-sale 6,689 13,429 (7,534) Tax effect (1,592) (3,196) 1,793 Reclassification adjustments for (gains) losses included in net income (1,075) (19) 42 Tax effect 256 5 (10) FASB ASC 715 pension adjustment 12,548 (6,903) 341 Tax effect (2,987) 1,643 (81) Foreign currency translation adjustments 66 (7) (103) Other comprehensive income (loss) 13,905 4,952 (5,552) Total comprehensive income $ 39,081 $ 35,356 $ 24,716
See accompanying notes to consolidated financial statements.
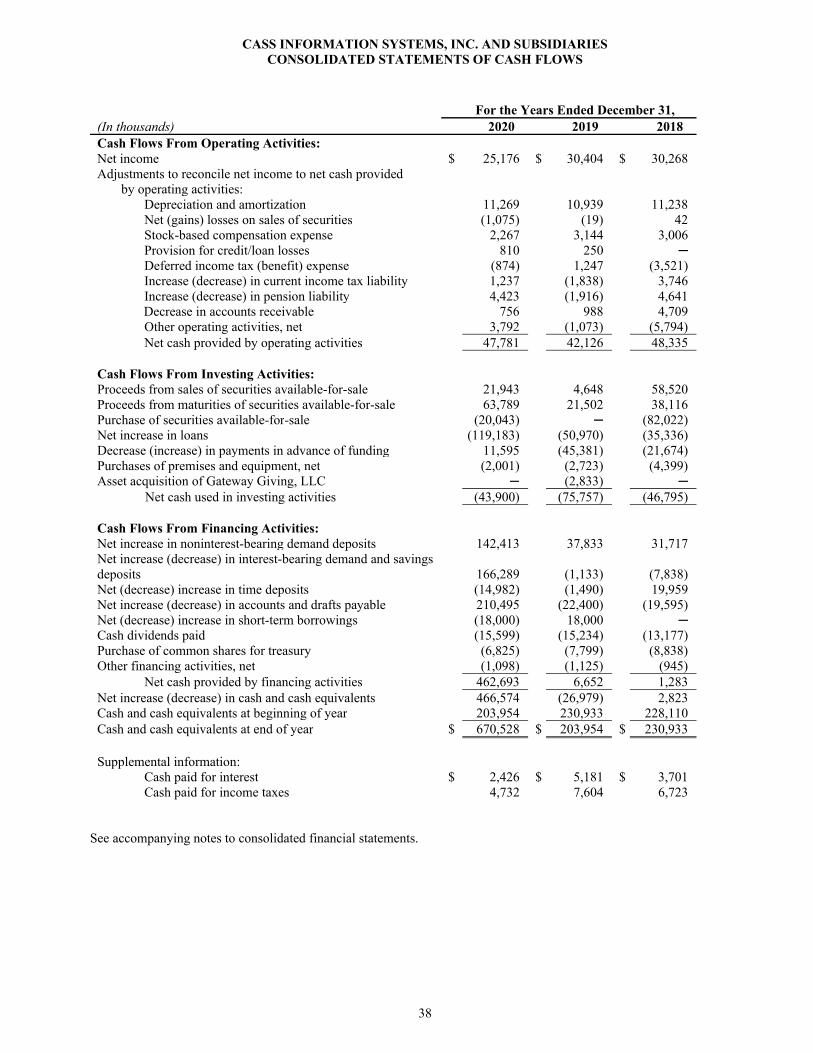
38
CASS INFORMATION SYSTEMS, INC. AND SUBSIDIARIES CONSOLIDATED STATEMENTS OF CASH FLOWS
For the Years Ended December 31, (In thousands) 2020 2019 2018 Cash Flows From Operating Activities: Net income $ 25,176 $ 30,404 $ 30,268 Adjustments to reconcile net income to net cash provided by operating activities: Depreciation and amortization 11,269 10,939 11,238 Net (gains) losses on sales of securities (1,075) (19) 42 Stock-based compensation expense 2,267 3,144 3,006 Provision for credit/loan losses 810 250 ─ Deferred income tax (benefit) expense (874) 1,247 (3,521) Increase (decrease) in current income tax liability 1,237 (1,838) 3,746 Increase (decrease) in pension liability 4,423 (1,916) 4,641 Decrease in accounts receivable 756 988 4,709 Other operating activities, net 3,792 (1,073) (5,794) Net cash provided by operating activities 47,781 42,126 48,335 Cash Flows From Investing Activities: Proceeds from sales of securities available-for-sale 21,943 4,648 58,520 Proceeds from maturities of securities available-for-sale 63,789 21,502 38,116 Purchase of securities available-for-sale (20,043) ─ (82,022) Net increase in loans (119,183) (50,970) (35,336) Decrease (increase) in payments in advance of funding 11,595 (45,381) (21,674) Purchases of premises and equipment, net (2,001) (2,723) (4,399) Asset acquisition of Gateway Giving, LLC ─ (2,833) ─ Net cash used in investing activities (43,900) (75,757) (46,795) Cash Flows From Financing Activities: Net increase in noninterest-bearing demand deposits 142,413 37,833 31,717 Net increase (decrease) in interest-bearing demand and savings deposits
166,289
(1,133)
(7,838)
Net (decrease) increase in time deposits (14,982) (1,490) 19,959 Net increase (decrease) in accounts and drafts payable 210,495 (22,400) (19,595) Net (decrease) increase in short-term borrowings (18,000) 18,000 ─ Cash dividends paid (15,599) (15,234) (13,177) Purchase of common shares for treasury (6,825) (7,799) (8,838) Other financing activities, net (1,098) (1,125) (945) Net cash provided by financing activities 462,693 6,652 1,283 Net increase (decrease) in cash and cash equivalents 466,574 (26,979) 2,823 Cash and cash equivalents at beginning of year 203,954 230,933 228,110 Cash and cash equivalents at end of year $ 670,528 $ 203,954 $ 230,933 Supplemental information: Cash paid for interest $ 2,426 $ 5,181 $ 3,701 Cash paid for income taxes 4,732 7,604 6,723
See accompanying notes to consolidated financial statements.
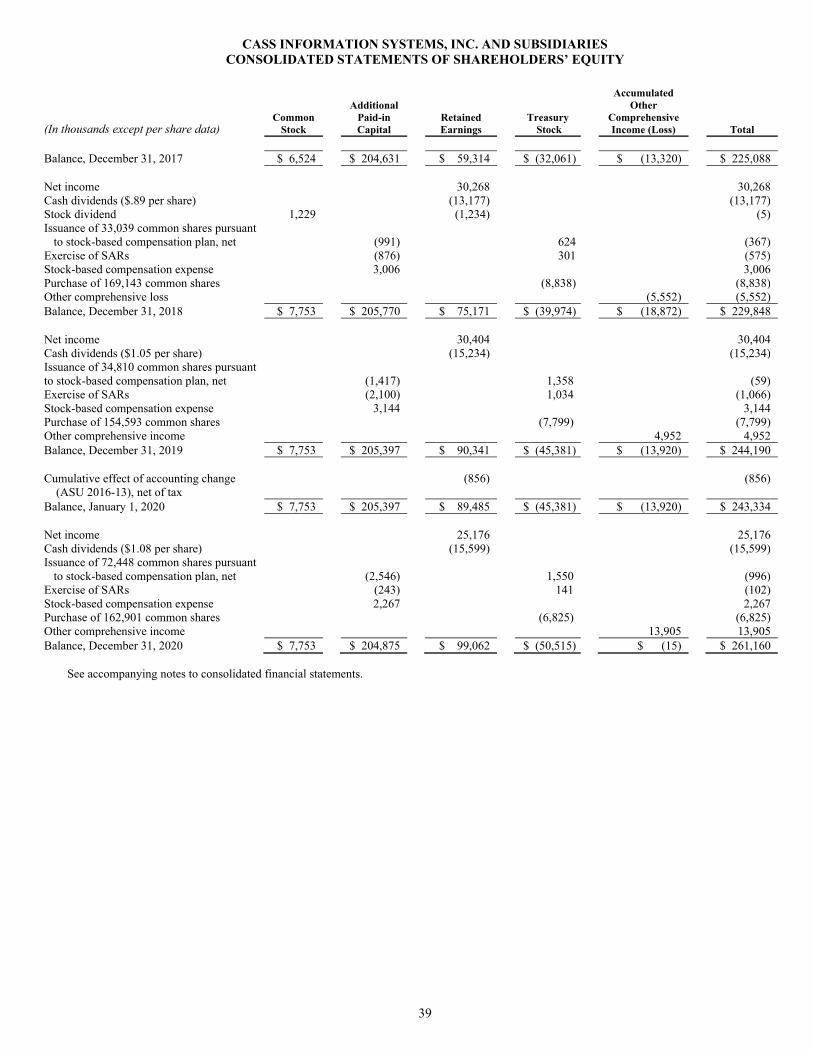
39
CASS INFORMATION SYSTEMS, INC. AND SUBSIDIARIES CONSOLIDATED STATEMENTS OF SHAREHOLDERS’ EQUITY
(In thousands except per share data)
Common Stock
Additional Paid-in Capital
Retained Earnings
Treasury Stock
Accumulated
Other Comprehensive Income (Loss)
Total
Balance, December 31, 2017 $ 6,524 $ 204,631 $ 59,314 $ (32,061) $ (13,320) $ 225,088 Net income 30,268 30,268 Cash dividends ($.89 per share) (13,177) (13,177) Stock dividend 1,229 (1,234) (5) Issuance of 33,039 common shares pursuant
to stock-based compensation plan, net
(991)
624
(367) Exercise of SARs (876) 301 (575) Stock-based compensation expense 3,006 3,006 Purchase of 169,143 common shares (8,838) (8,838) Other comprehensive loss (5,552) (5,552) Balance, December 31, 2018 $ 7,753 $ 205,770 $ 75,171 $ (39,974) $ (18,872) $ 229,848 Net income 30,404 30,404 Cash dividends ($1.05 per share) (15,234) (15,234) Issuance of 34,810 common shares pursuant to stock-based compensation plan, net
(1,417)
1,358
(59)
Exercise of SARs (2,100) 1,034 (1,066) Stock-based compensation expense 3,144 3,144 Purchase of 154,593 common shares (7,799) (7,799) Other comprehensive income 4,952 4,952 Balance, December 31, 2019 $ 7,753 $ 205,397 $ 90,341 $ (45,381) $ (13,920) $ 244,190 Cumulative effect of accounting change (ASU 2016-13), net of tax
(856) (856)
Balance, January 1, 2020 $ 7,753 $ 205,397 $ 89,485 $ (45,381) $ (13,920) $ 243,334 Net income 25,176 25,176 Cash dividends ($1.08 per share) (15,599) (15,599) Issuance of 72,448 common shares pursuant
to stock-based compensation plan, net
(2,546)
1,550
(996) Exercise of SARs (243) 141 (102) Stock-based compensation expense 2,267 2,267 Purchase of 162,901 common shares (6,825) (6,825) Other comprehensive income 13,905 13,905 Balance, December 31, 2020 $ 7,753 $ 204,875 $ 99,062 $ (50,515) $ (15) $ 261,160
See accompanying notes to consolidated financial statements.
40
NOTES TO CONSOLIDATED FINANCIAL STATEMENTS Note 1 Summary of Significant Accounting Policies Summary of Operations The Company provides payment and information services, which include processing and payment of transportation, energy, telecommunications and environmental invoices. These services include the acquisition and management of data, information delivery and financial exchange. The consolidated balance sheet captions, “Accounts and drafts payable” and “Payments in advance of funding,” represent the Company’s resulting financial position related to the payment services that are performed for customers. The Company also provides a full range of banking services to individual, corporate and institutional customers through the Bank, its wholly owned bank subsidiary.
Basis of Presentation The accounting and reporting policies of the Company and its subsidiaries conform to U.S. GAAP. The consolidated financial statements include the accounts of the Company and its wholly owned subsidiaries after elimination of intercompany transactions. Certain amounts in the 2019 and 2018 consolidated financial statements have been reclassified to conform to the 2020 presentation. Such reclassifications have no effect on previously reported net income or shareholders’ equity. Use of Estimates In preparing the consolidated financial statements, Company management is required to make estimates and assumptions which significantly affect the reported amounts in the consolidated financial statements. Cash and Cash Equivalents For purposes of the consolidated statements of cash flows, the Company considers cash and due from banks, interest-bearing deposits in other financial institutions, federal funds sold and other short-term investments as segregated in the accompanying consolidated balance sheets to be cash equivalents.
Investment in Debt Securities The Company classifies its debt marketable securities as available-for-sale. Securities classified as available-for-sale are carried at fair value. Unrealized gains and losses, net of the related tax effect, are excluded from earnings and reported in accumulated other comprehensive income, a component of shareholders’ equity. Securities are periodically evaluated for credit losses in accordance with the guidance provided in FASB ASC Topic 326, Financial Instruments – Credit Losses. For available for sale debt securities in an unrealized loss position, the entire loss in fair value is required to be recognized in current earnings if the Company intends to sell the securities or believes it likely that it will be required to sell the security before the anticipated recovery. If neither condition is met, and the Company does not expect to recover the amortized cost basis, the Company determines whether the decline in fair value resulted from credit losses or other factors. If the assessment indicates that a credit loss exists, the present value of cash flows expected to be collected is compared to the amortized cost basis of the security. If the present value of cash flows expected to be collected is less than the amortized cost basis, a credit loss has occurred, and an allowance for credit losses is recorded. The allowance for credit losses is limited by the amount that the fair value is less than the amortized cost basis. Any impairment not recorded through the provision for credit losses would be recognized in other comprehensive income. Changes in the allowance for credit losses would be recorded as a provision for credit losses on the consolidated statements of income. Losses would be charged against the allowance for credit losses on securities when management believes the uncollectibility of an available for sale security is confirmed or when either of the conditions regarding intent or requirement to sell is met. Prior to the adoption of ASU 2016 -13 as of January 1, 2020, the Company evaluated a decline in the fair value of any available-for-sale security below cost to determine whether the decline was deemed other than temporary and, if so, would result in a charge to earnings and the establishment of a new cost basis for the security. To determine whether impairment was other than temporary, the Company considered guidance provided in the FASB ASC Topic 320, Investments – Debt and Equity Securities. When determining whether a debt security was other-than-temporarily impaired, the Company assessed whether it had the intent to sell the security and whether it was more likely than not that the Company would be required to sell prior to recovery of the amortized cost basis. Evidence considered in this assessment included the reasons for impairment, the severity and duration of the impairment, changes in value subsequent to year-end and forecasted performance of the investee. Premiums and discounts are amortized or accreted to interest income over the estimated lives of the securities using the level-yield method. Interest income is recognized when earned. Gains and losses are calculated using the specific identification method. Loans Interest on loans is recognized based upon the principal amounts outstanding. It is the Company’s policy to discontinue the accrual of interest when there is reasonable doubt as to the collectability of principal or interest. Subsequent payments received on such loans are applied to principal if there is any doubt as to the collectability of such principal; otherwise, these receipts are recorded as interest income. The accrual of interest on a loan is resumed when the loan is current as to payment of
41
both principal and interest and/or the borrower demonstrates the ability to pay and remain current. Loan origination and commitment fees on originated loans, net of certain direct loan origination costs, are deferred and amortized to interest income using the level-yield method over the estimated lives of the related loans.
Allowance for Credit Losses The ACL is increased by provisions charged to expense and is available to absorb charge-offs, net of recoveries. Management utilizes a systematic, documented approach in determining the appropriate level of the ACL. Management’s approach provides for estimated credit losses on loans in accordance with ASU No. 2016-13, Financial Instruments – Credit Losses (Topic 326): Measurement of Credit Losses on Financial Instruments. These estimates are based upon a number of factors, such as payment history, financial condition of the borrower, expected future cash flows and collateral exposure. The ACL is a valuation account that is deducted from the amortized cost basis to present the net amount expected to be collected on the loans. Loans are charged off against the ACL when management believes the uncollectibility of a loan balance is confirmed. Expected recoveries for amounts previously charged off and expected to be charged off do not exceed the aggregate of amounts previously charged off and expected to be charged off. Management estimated the allowance balance using relevant available information from internal and external sources, relating to past events, current conditions and reasonable and supportable forecasts based on economic factors, such as GDP. Historical credit loss experience, of both the Company and similar peer banks, provides the basis for the estimation of expected credit losses. Adjustments to historical loss information are made for lending management experience, asset quality trends, borrower’s ability to pay, collateral, and other environmental factors. The ACL is measured on a collective pool basis when similar risk characteristics exist. Management believes the ACL is adequate to absorb expected losses in the loan portfolio. Loans The ACL is measured on a collective pool basis when similar risk characteristics exist. The Company has identified the following portfolio segments: Commercial & Industrial (“C&I”) – C&I loans consist of loans to small and medium-sized businesses in a wide variety of industries, franchise lending, and equipment financing to companies of all sizes. These loans are generally collateralized by inventory, accounts receivable, equipment, and other commercial assets, and may be supported by other credit enhancements such as personal guarantees. Risk arises primarily due to a difference between expected and actual cash flows of the borrower. However, the recoverability of these loans is also dependent on other factors primarily dictated by the type of collateral securing these loans. The fair value of the collateral securing these loans may fluctuate as market conditions change. Included within C&I are revolving loans supported by borrowing bases that fluctuate depending on the amount of underlying collateral. Commercial Real Estate (“CRE”) – CRE loans include various types of loans for which the Company holds real property as collateral. Commercial real estate lending activity is typically restricted to owner-occupied properties or to investor properties that are owned by customers with a current banking relationship. The primary risks of CRE loans include the borrower’s inability to pay and material decreases in the value of the real estate being held as collateral. Faith-based CRE – Faith-based CRE loans include loans to faith-based ministries for which the Company holds real property as collateral. The primary risks of faith-based CRE loans include the borrower’s inability to pay and material decreases in the value of the real estate being held as collateral. Construction and Land Development – The Company originates loans to finance construction projects including faith-based and commercial projects. Construction loans are generally collateralized by first liens on the real estate and have floating interest rates. The primary risks of construction loans are construction completion and timing risk. Adverse economic conditions may negatively impact the borrowers’ ability to complete the project. Additionally, the fair value of the underlying collateral may fluctuate as market conditions change. The ACL is calculated as the difference between the amortized cost basis and the projections from the weighted-average remaining maturity ("WARM") model that the Company developed. The WARM model utilizes an attrition analysis, including events such as payoffs, matured loans, and renewals in the borrowers’ control, to anticipate the length of time it would take for each portfolio segment to runoff. Management incorporates a one year GDP forecast and an immediate reversion to peer historical loss rates to determine the annual charge off rates over the estimated life of the loans. After the reasonable and supportable forecast period, the model reverts to long-run historical average loss rates of its peers. However, for the faith-based CRE ACL, beyond the reasonable and supportable forecast period, loss rates are reverted immediately to the Company’s long-run historical averages, as this represents a unique loan segment to the peer portfolios. The economic forecast is based on management’s assessment of the length and pattern of the current economic cycle. The resulting annual charge off rate determined for each year in the WARM model is applied to the loan balances estimated in the attrition analysis. Management accounts for the inherent uncertainty of the underlying economic forecast by reviewing forecast scenarios. Additionally, the ACL calculation includes subjective adjustments for qualitative risk factors that are likely to cause estimated
42
credit losses to differ from historical experience. These qualitative adjustments may increase or reduce reserve levels and include adjustments for lending management experience and risk tolerance, loan review and audit results, asset quality and portfolio trends, loan portfolio growth and loan concentrations. The Company has elected to exclude accrued interest receivable ("AIR") from the allowance for credit losses calculation. When a loan is placed on non-accrual, any recorded AIR is reversed against interest income. The determination and application of the ACL accounting policy involves judgments, estimates, and uncertainties that are subject to change. Changes in these assumptions, estimates or the conditions surrounding them may have a material impact on the Company’s financial condition, liquidity or results of operations. Various regulatory agencies, as an integral part of the examination process, periodically review the ACL. Such agencies may require the Company to recognize additions to the ACL or reserve increases to adversely graded classified loans based on information available to them at the time of their examinations. The ACL is decreased by net charge-offs and is increased by provisions for credit losses that are charged to the consolidated statements of operations. Charge-offs, if any, are typically measured for each loan based on a thorough analysis of the most probable source of repayment, such as the present value of the loan’s expected future cash flows, the loan’s estimated fair value, or the estimated fair value of the underlying collateral less costs of disposition for collateral-dependent loans. When it is determined that specific loans, or portions thereof, are uncollectible, these amounts are charged off against the ACL. Unfunded loan commitments In addition to the ACL for funded loans, the Company maintains reserves to cover the risk of loss associated with off-balance sheet unfunded loan commitments. The allowance for off-balance sheet credit losses is maintained within other liabilities in the statements of financial condition. Under the CECL framework, adjustments to this liability are recorded as provision for credit losses in the consolidated statements of operations. Unfunded loan commitment balances are evaluated by loan segment. In order to establish the required level of reserve, the Company applies average historical utilization rates and ACL loan model loss rates for each loan segment to the outstanding unfunded commitment balances. Investment securities Management evaluates all investments in an unrealized loss position on a quarterly basis, and more frequently when economic or market conditions warrant such evaluation. If the Company has the intent to sell the security or it is more likely than not that the Company will be required to sell the security, the security is written down to fair value and the entire loss is recorded in earnings. If either of the above criteria is not met, the Company will evaluate whether the decline in fair value is the result of credit losses or other factors. In making the assessment, the Company may consider various factors including the extent to which fair value is less than amortized cost, performance on any underlying collateral, downgrades in the ratings of the security by a rating agency, the failure of the issuer to make scheduled interest or principal payments and adverse conditions specifically related to the security. If the assessment indicates that a credit loss exists, the present value of cash flows expected to be collected are compared to the amortized cost basis of the security and any excess is recorded as an allowance for credit loss. For U.S. agency-backed securities where the risk of nonpayment of the amortized cost basis is zero, the Company will not measure expected credit losses on these securities. When the loss is not considered a result of credit loss, the cost basis of the security is written down to fair value, with the loss charge recognized in AOCI. Credit losses are not estimated for AIR from investment securities as interest deemed uncollectible is written off through interest income. Allowance for Loan Losses Prior to the adoption of ASU 2016-13 as of January 1, 2020, the Company determined reserves for losses on the loan portfolio in the ALLL. The ALLL was increased by provisions charged to expense and was available to absorb charge-offs, net of recoveries. Management utilized a systematic, documented approach in determining the appropriate level of the ALLL. Management’s approach provided for estimated credit losses on individually evaluated loans in accordance with FASB ASC 310, Allowance for Credit Losses (“ASC 310”). These estimates were based upon a number of factors, such as payment history, financial condition of the borrower, expected future cash flows and discounted collateral exposure. Estimated credit losses inherent in the remainder of the portfolio were estimated in accordance with FASB ASC 450, Contingencies. These loans were segmented into groups based on similar risk characteristics. Historical loss rates for each risk group, which were updated quarterly, were generally quantified using all recorded loan charge-offs and recoveries over a prescribed look-back period. These historical loss rates for each risk group were used as the starting point to determine the level of the allowance. The Company’s methodology incorporated an estimated loss emergence period for each risk group. The loss emergence period was the period of time from when a borrower experienced a loss event and when the actual loss was recognized in the financial statements, generally at the time of initial charge-off of the loan balance. The Company’s methodology also included qualitative risk factors that allowed management to adjust its estimates of losses based on the most recent information available and to address other limitations in the quantitative component that was based on historical loss rates. Such risk factors were generally reviewed and updated quarterly, as appropriate, and were adjusted to reflect changes in national and local economic conditions and developments, the volume and severity of delinquent and internally classified loans, loan concentrations, assessment of trends in collateral values, assessment of changes in borrowers’ financial stability, and changes in lending policies and procedures, including underwriting standards and collections, charge-off and recovery practices.
43
Management believed the ALLL was adequate to absorb probable losses in the loan portfolio. Additionally, various regulatory agencies, as an integral part of their examination process, periodically reviewed the Company’s ALLL. Such agencies may have required the Company to increase the ALLL based on information available to them at the time of their examinations. Impairment of Loans A loan is considered impaired when it is probable that a creditor will be unable to collect all amounts due, both principal and interest, according to the contractual terms of the loan agreement. When measuring impairment, the expected future cash flows of an impaired loan are discounted at the loan's effective interest rate. Alternatively, impairment could be measured by reference to an observable market price, if one exists, or the fair value of the collateral for a collateral-dependent loan. Regardless of the historical measurement method used, the Company measures impairment based on the fair value of the collateral when the Company determines foreclosure is probable. Additionally, impairment of a restructured loan is measured by discounting the total expected future cash flows at the loan's effective rate of interest as stated in the original loan agreement. The Company uses its nonaccrual methods as discussed above for recognizing interest on impaired loans.
Foreclosed Assets Real estate acquired as a result of foreclosure is initially recorded at fair value less estimated selling costs. Fair value is generally determined through the receipt of appraisals. Any write down to fair value at the time the property is acquired is recorded as a charge-off to the allowance for credit losses. Any decline in the fair value of the property subsequent to acquisition is recorded as a charge to non-interest expense.
Premises and Equipment Premises and equipment are stated at cost less accumulated depreciation and amortization. Depreciation is computed over the estimated useful lives of the assets, or the respective lease terms for leasehold improvements, using straight-line and accelerated methods. Estimated useful lives do not exceed 40 years for buildings, the lesser of 10 years or the life of the lease for leasehold improvements and range from 3 to 7 years for software, equipment, furniture and fixtures. Maintenance and repairs are charged to expense as incurred.
Intangible Assets Cost in excess of fair value of net assets acquired has resulted from business acquisitions. Goodwill and intangible assets with indefinite useful lives are not amortized, but instead are tested for impairment at least annually. Intangible assets with definite useful lives are amortized on a straight-line basis over their respective estimated useful lives.
Periodically, the Company reviews intangible assets for events or changes in circumstances that may indicate that the carrying amount of the assets may not be recoverable. Based on those reviews, adjustments of recorded amounts have not been required.
Non-marketable Equity Investments The Company accounts for non-marketable equity investments, in which it holds less than a 20% ownership, as equity investments without readily determinable fair values. As a result, the carrying value of the investment is determined under the measurement alternative of cost, less impairment (if any), adjusted for fair value changes when observable prices are available. The Company periodically evaluates for impairment of these investments. In performing this evaluation, the Company considers various factors including the investee's financial condition, results of operations, operating trends and other financial ratios. Non-marketable equity investments are included in other assets on the consolidated balance sheets. Treasury Stock Purchases of the Company’s common stock are recorded at cost. Upon reissuance, treasury stock is reduced based upon the average cost basis of shares held. Comprehensive Income Comprehensive income consists of net income, changes in net unrealized gains (losses) on available-for-sale securities and pension liability adjustments and is presented in the accompanying consolidated statements of shareholders' equity and consolidated statements of comprehensive income.
Information Services Revenue A majority of the Company’s revenues are attributable to fees for providing services. These services include transportation invoice rating, payment processing, auditing, and the generation of accounting and transportation information. The Company also processes, pays and generates management information from electric, gas, telecommunications, environmental, and other invoices. The specific payment and information processing services provided to each customer are developed individually to meet each customer’s specific requirements. The Company enters into service agreements with customers typically for fixed fees per transaction that are invoiced monthly. Revenues are recognized in the period services are rendered and earned under the service agreements, as long as collection is reasonably assured.
Income Taxes Deferred tax assets and liabilities are recognized for the estimated future tax consequences attributable to differences between the financial statement carrying amounts of existing assets and liabilities and their respective tax bases. Deferred tax assets and liabilities are measured using enacted tax rates in effect for the year in which those temporary differences are expected to be recovered or settled. Deferred tax assets are reduced if necessary, by a deferred tax asset valuation allowance. In the event that management determines it is more likely than not that it will not be able to realize all or part of net deferred tax assets in the future, the Company adjusts the recorded value of deferred tax assets, which would result in a direct charge to income tax expense in the period that such determination is made. Likewise, the Company will reverse the valuation allowance when realization of the deferred tax asset is expected. The effect on deferred tax assets and liabilities of a change in tax rates is recognized in income in the period that includes the enactment date. The

44
Company and its subsidiaries file U.S. federal and certain state income tax returns on a consolidated basis. In addition, certain state jurisdictions are filed on a separate company basis by the Company or its subsidiaries. The Company recognizes and measures income tax benefits using a two-step model: 1) a tax position must be more likely than not to be sustained based solely on its technical merits in order to be recognized; and 2) the benefit must be measured as the largest dollar amount of that position that is more likely than not to be sustained upon settlement. The difference between the benefit recognized for a tax position in this model and the tax benefit claimed on a tax return is treated as an unrecognized tax benefit. The Company recognizes income tax related interest and penalties in income tax expense.
Earnings Per Share Basic earnings per share is computed by dividing net income by the weighted average number of common shares outstanding. Diluted earnings per share is computed by dividing net income by the sum of the weighted average number of common shares outstanding and the weighted average number of potential common shares outstanding.
Stock-Based Compensation The Company follows FASB ASC 718, Accounting for Stock Options and Other Stock-based Compensation (“ASC 718”), which requires that all stock-based compensation be recognized as an expense in the financial statements and that such cost be measured at the fair value of the award. ASC 718 also requires that excess tax benefits related to stock option exercises and restricted stock awards be reflected as financing cash inflows instead of operating cash inflows. Pension Plans The amounts recognized in the consolidated financial statements related to pension are determined from actuarial valuations. Inherent in these valuations are assumptions including expected return on plan assets, discount rates at which the liabilities could be settled at December 31, 2020, rate of increase in future compensation levels and mortality rates. These assumptions are updated annually and are disclosed in Note 10. The Company follows FASB ASC 715, Compensation – Retirement Benefits (“ASC 715”), which requires companies to recognize the overfunded or underfunded status of a defined benefit postretirement plan as an asset or liability in its consolidated balance sheet and to recognize changes in that funded status in the year in which the changes occur through comprehensive income. The funded status is measured as the difference between the fair value of the plan assets and the projected benefit obligation as of the date of its fiscal year-end. Fair Value Measurements The Company follows the provisions of FASB ASC 820, Fair Value Measurements and Disclosures, which defines fair value, establishes a framework for measuring fair value in GAAP, and outlines disclosures about fair value measurements. Fair value is defined as the exchange price that would be received for an asset or paid to transfer a liability (an exit price) in the principal or most advantageous market for the asset or liability in an orderly transaction between market participants on the measurement date. A three-level hierarchy for valuation techniques is used to measure financial assets and financial liabilities at fair value. This hierarchy is based on whether the valuation inputs are observable or unobservable. Financial instrument valuations are considered Level 1 when they are based on quoted prices in active markets for identical assets or liabilities. Level 2 financial instrument valuations use quoted prices for similar assets or liabilities, quoted prices in markets that are not active, or other inputs that are observable or can be corroborated by observable market data. Financial instrument valuations are considered Level 3 when they are determined using pricing models, discounted cash flow methodologies or similar techniques and at least one significant model assumption or input is unobservable, and when determination of the fair value requires significant management judgment or estimation. The Company records securities available for sale at their fair values on a recurring basis using Level 2 valuations. Additionally, the Company records impaired loans and other real estate owned at their fair value on a nonrecurring basis. The nonrecurring fair value adjustments typically involve application of lower-of-cost-or-market accounting or impairment write-downs of individual assets. Impact of New and Not Yet Adopted Accounting Pronouncements In June 2016, the FASB issued ASU No. 2016-13, Financial Instruments – Credit Losses (Topic 326): Measurement of Credit Losses on Financial Instruments (“ASU 2016-13”). The standard is effective for fiscal periods beginning after December 15, 2019. The CARES Act was signed into law on March 27, 2020 and included provisions that temporarily delayed the required implementation date of ASU 2016-13 to the earlier of the end of the national pandemic or December 31, 2020. The CAA was signed into law on December 27, 2020 and extended the deferral of required implementation of ASU 2016-13 to the earlier of the first day of a company’s fiscal year that begins after the date the COVID-19 national emergency comes to an end or January 1, 2022. The Company elected to defer the adoption of ASU 2016-13 until December 31, 2020 with an effective date of January 1, 2020. The ASU required measurement and recognition of expected credit losses for financial instruments held at amortized cost, which include allowances for credit losses expected over the life of the portfolio, rather than incurred losses, which include allowances for current known and inherent losses within the portfolio. Under this standard, the Company is required to hold an allowance equal to the expected life-of-loan losses on the loan portfolio. It also applies to off-balance sheet credit exposures such as loan commitments, standby letters of credit and other similar instruments. In addition, ASU 2016-13 made changes to the accounting for available-for-sale debt securities. The Company adopted ASU 2016-13 using a modified retrospective approach. Results for annual reporting periods beginning after January 1, 2020 are presented under ASU 2016-13 while prior period amounts continue to be reported in accordance with
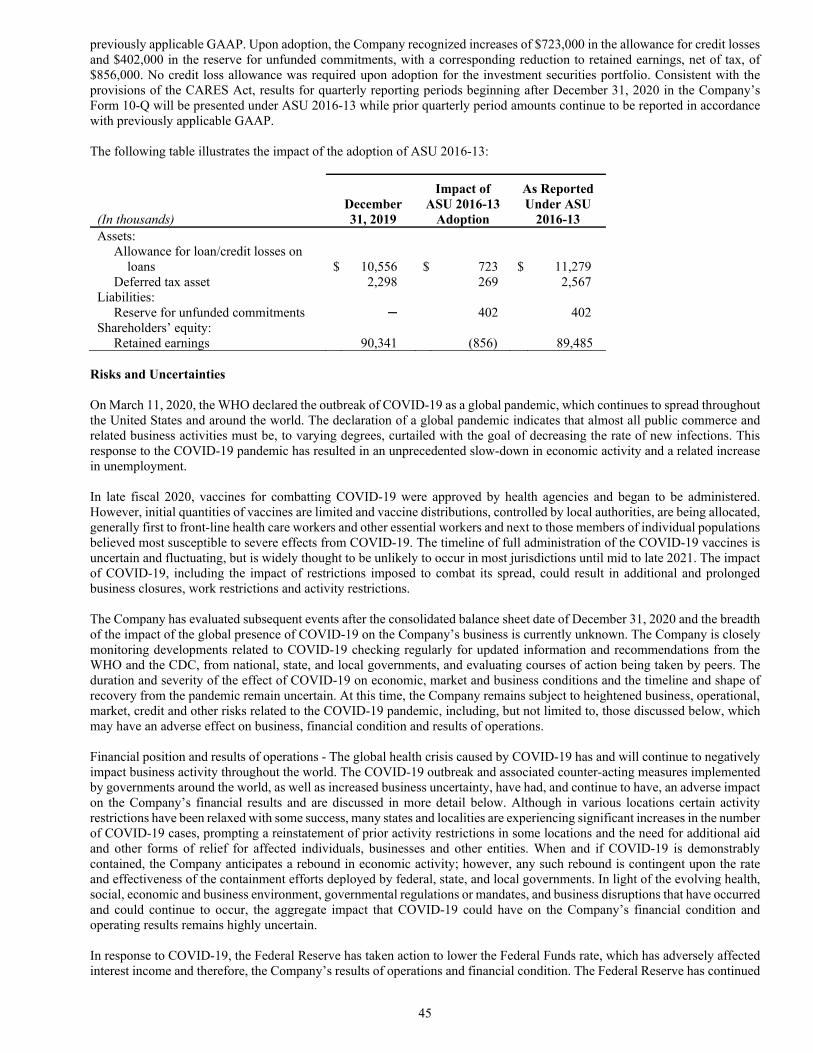
45
previously applicable GAAP. Upon adoption, the Company recognized increases of $723,000 in the allowance for credit losses and $402,000 in the reserve for unfunded commitments, with a corresponding reduction to retained earnings, net of tax, of $856,000. No credit loss allowance was required upon adoption for the investment securities portfolio. Consistent with the provisions of the CARES Act, results for quarterly reporting periods beginning after December 31, 2020 in the Company’s Form 10-Q will be presented under ASU 2016-13 while prior quarterly period amounts continue to be reported in accordance with previously applicable GAAP. The following table illustrates the impact of the adoption of ASU 2016-13:
(In thousands) December 31, 2019
Impact of ASU 2016-13
Adoption
As Reported Under ASU
2016-13 Assets: Allowance for loan/credit losses on loans
$
10,556
$
723
$
11,279
Deferred tax asset 2,298 269 2,567 Liabilities: Reserve for unfunded commitments ─ 402 402 Shareholders’ equity: Retained earnings 90,341 (856) 89,485
Risks and Uncertainties On March 11, 2020, the WHO declared the outbreak of COVID-19 as a global pandemic, which continues to spread throughout the United States and around the world. The declaration of a global pandemic indicates that almost all public commerce and related business activities must be, to varying degrees, curtailed with the goal of decreasing the rate of new infections. This response to the COVID-19 pandemic has resulted in an unprecedented slow-down in economic activity and a related increase in unemployment. In late fiscal 2020, vaccines for combatting COVID-19 were approved by health agencies and began to be administered. However, initial quantities of vaccines are limited and vaccine distributions, controlled by local authorities, are being allocated, generally first to front-line health care workers and other essential workers and next to those members of individual populations believed most susceptible to severe effects from COVID-19. The timeline of full administration of the COVID-19 vaccines is uncertain and fluctuating, but is widely thought to be unlikely to occur in most jurisdictions until mid to late 2021. The impact of COVID-19, including the impact of restrictions imposed to combat its spread, could result in additional and prolonged business closures, work restrictions and activity restrictions. The Company has evaluated subsequent events after the consolidated balance sheet date of December 31, 2020 and the breadth of the impact of the global presence of COVID-19 on the Company’s business is currently unknown. The Company is closely monitoring developments related to COVID-19 checking regularly for updated information and recommendations from the WHO and the CDC, from national, state, and local governments, and evaluating courses of action being taken by peers. The duration and severity of the effect of COVID-19 on economic, market and business conditions and the timeline and shape of recovery from the pandemic remain uncertain. At this time, the Company remains subject to heightened business, operational, market, credit and other risks related to the COVID-19 pandemic, including, but not limited to, those discussed below, which may have an adverse effect on business, financial condition and results of operations. Financial position and results of operations - The global health crisis caused by COVID-19 has and will continue to negatively impact business activity throughout the world. The COVID-19 outbreak and associated counter-acting measures implemented by governments around the world, as well as increased business uncertainty, have had, and continue to have, an adverse impact on the Company’s financial results and are discussed in more detail below. Although in various locations certain activity restrictions have been relaxed with some success, many states and localities are experiencing significant increases in the number of COVID-19 cases, prompting a reinstatement of prior activity restrictions in some locations and the need for additional aid and other forms of relief for affected individuals, businesses and other entities. When and if COVID-19 is demonstrably contained, the Company anticipates a rebound in economic activity; however, any such rebound is contingent upon the rate and effectiveness of the containment efforts deployed by federal, state, and local governments. In light of the evolving health, social, economic and business environment, governmental regulations or mandates, and business disruptions that have occurred and could continue to occur, the aggregate impact that COVID-19 could have on the Company’s financial condition and operating results remains highly uncertain. In response to COVID-19, the Federal Reserve has taken action to lower the Federal Funds rate, which has adversely affected interest income and therefore, the Company’s results of operations and financial condition. The Federal Reserve has continued

46
its commitment to this approach, indicating that the target Federal Funds rate would remain at current levels until the economy is in a more stable employment and price-stability position. To the extent the business disruption continues for an extended period, additional cost control actions will be considered. Future asset impairment charges, increases in allowance for credit losses, or restructuring charges could be more likely and will be dependent on the severity and duration of this crisis and its effect on the Company’s borrowers. For payment processing services, business closures, including constrictions in the manufacturing sector, have led to a decrease in the number of transactions and dollars processed due to the decline in customers’ business activity. In addition, the dampened demand for oil and resulting plummet in oil prices has had, and can continue to have, a negative effect on both the number of freight transactions processed and the dollar amount of invoices processed. Other financial impact could occur though such potential impact is unknown at this time. Capital and liquidity - While the Company believes that it has sufficient capital to withstand an extended economic recession brought about by COVID-19, its reported and regulatory capital ratios could be adversely impacted by future financial losses. The Company maintains access to multiple sources of liquidity. If funding costs are elevated for an extended period of time, it could have an adverse effect on the Company’s net interest margin. If an extended recession caused large numbers of the Bank’s customers to draw down deposits, the Company might become more reliant on more expensive sources of funding. Asset valuation - Currently, the Company does not expect COVID-19 to affect its ability to fairly value the assets on its balance sheet; however, this could change in future periods. While certain valuation assumptions and judgments will change to account for pandemic-related circumstances such as widening credit spreads, the Company does not anticipate significant changes in methodology used to determine the fair value of assets measured in accordance with GAAP. The economic slowdown as a result of COVID-19 could cause a further and sustained decline in the Company’s stock price or the occurrence of what management would deem to be a triggering event that could, under certain circumstances, necessitate a goodwill or intangible asset impairment test and result in an impairment charge being recorded for that period. In the event that the Company concludes that all or a portion of its goodwill is impaired, a non-cash charge for the amount of such impairment would be recorded to earnings. Such a charge would have no impact on tangible capital or regulatory capital. Processes, controls and business continuity - In accord with its federally mandated Pandemic Plan and Business Continuity Plan, Cass has deployed its remote workforce program. Most Cass employees around the globe are now working and conducting business remotely. Employees necessary to oversee certain business coordination activities or to conduct essential physical activities such as mail handling and scanning operations, remain in offices. In addition, employees are now being permitted to return to the offices on a voluntary basis. Employees are required to report any exposure or diagnosis and must adhere to the defined safety protocol to enter the offices. In the past several years, Cass has invested in sophisticated technology initiatives that enable employees to operate remotely with full system(s) access along with unified and transparent voice and electronic communications capabilities, ensuring seamless service delivery. The Company cannot predict when or how it will fully lift the actions put in place as part of the Business Continuity Plan, including work from home requirements and travel restrictions. Cass does not believe the work from home protocol has materially adversely impacted internal controls, financial reporting systems, or operations. Note 2 Capital Requirements and Regulatory Restrictions
The Company and the Bank are subject to various regulatory capital requirements administered by the federal banking agencies. Failure to meet minimum capital requirements can result in certain mandatory, and possibly additional discretionary actions by regulators that, if undertaken, could have a direct material effect on the Company’s consolidated financial statements. Under capital adequacy guidelines, the Company and the Bank must meet specific capital guidelines that involve quantitative measures of assets, liabilities and certain off-balance sheet items as calculated under regulatory accounting practices. The Company’s and the Bank’s capital amounts and classifications are also subject to qualitative judgments by the regulators about components, risk weightings and other factors.
Quantitative measures established by regulators to ensure capital adequacy require the Company and the Bank to maintain minimum amounts and ratios of total and Tier I capital and common equity Tier I capital to risk-weighted assets, and of Tier I capital to average assets. Management believes that as of December 31, 2020 and 2019, the Company and the Bank met all capital adequacy requirements to which they are subject. Effective July 2, 2013, the Federal Reserve Board approved final rules known as the “Basel III Capital Rules” that substantially revised the risk-based capital and leverage capital requirements applicable to bank holding companies and depository institutions, including the Company and the Bank. The Basel III Capital Rules implement aspects of the Basel III capital
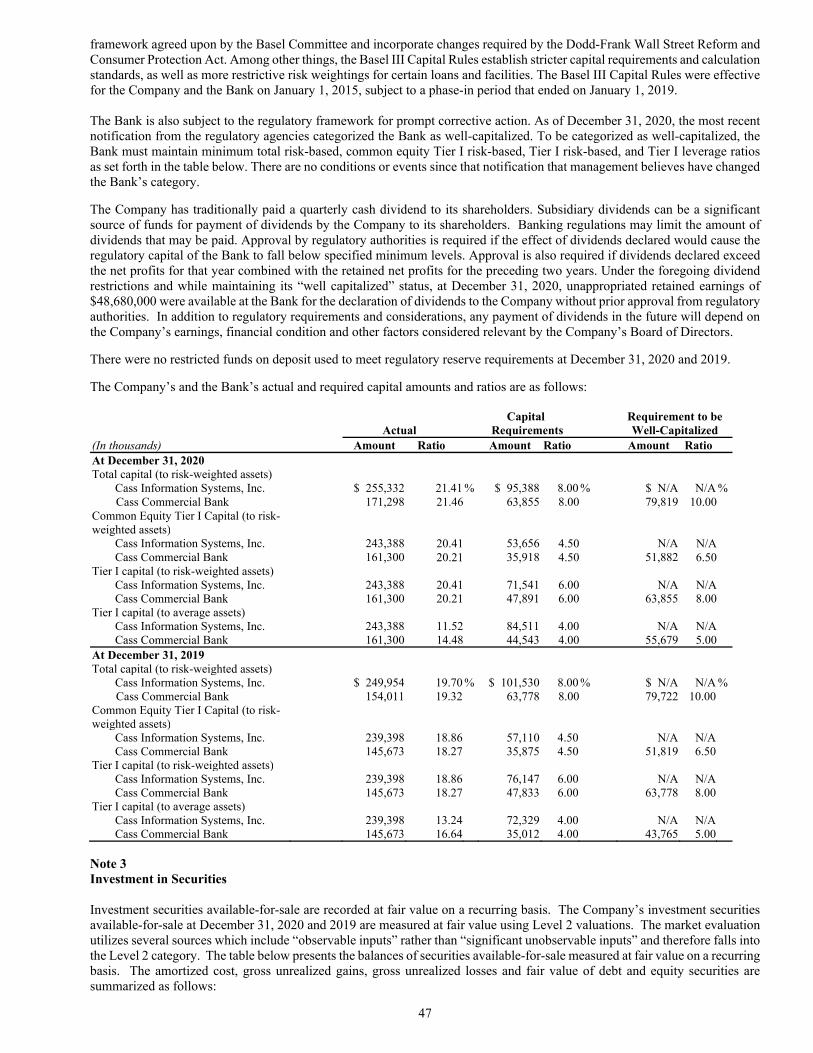
47
framework agreed upon by the Basel Committee and incorporate changes required by the Dodd-Frank Wall Street Reform and Consumer Protection Act. Among other things, the Basel III Capital Rules establish stricter capital requirements and calculation standards, as well as more restrictive risk weightings for certain loans and facilities. The Basel III Capital Rules were effective for the Company and the Bank on January 1, 2015, subject to a phase-in period that ended on January 1, 2019. The Bank is also subject to the regulatory framework for prompt corrective action. As of December 31, 2020, the most recent notification from the regulatory agencies categorized the Bank as well-capitalized. To be categorized as well-capitalized, the Bank must maintain minimum total risk-based, common equity Tier I risk-based, Tier I risk-based, and Tier I leverage ratios as set forth in the table below. There are no conditions or events since that notification that management believes have changed the Bank’s category.
The Company has traditionally paid a quarterly cash dividend to its shareholders. Subsidiary dividends can be a significant source of funds for payment of dividends by the Company to its shareholders. Banking regulations may limit the amount of dividends that may be paid. Approval by regulatory authorities is required if the effect of dividends declared would cause the regulatory capital of the Bank to fall below specified minimum levels. Approval is also required if dividends declared exceed the net profits for that year combined with the retained net profits for the preceding two years. Under the foregoing dividend restrictions and while maintaining its “well capitalized” status, at December 31, 2020, unappropriated retained earnings of $48,680,000 were available at the Bank for the declaration of dividends to the Company without prior approval from regulatory authorities. In addition to regulatory requirements and considerations, any payment of dividends in the future will depend on the Company’s earnings, financial condition and other factors considered relevant by the Company’s Board of Directors. There were no restricted funds on deposit used to meet regulatory reserve requirements at December 31, 2020 and 2019.
The Company’s and the Bank’s actual and required capital amounts and ratios are as follows:
Actual Capital
Requirements Requirement to be Well-Capitalized
(In thousands) Amount Ratio Amount Ratio Amount Ratio At December 31, 2020 Total capital (to risk-weighted assets) Cass Information Systems, Inc. $ 255,332 21.41 % $ 95,388 8.00 % $ N/A N/A % Cass Commercial Bank 171,298 21.46 63,855 8.00 79,819 10.00 Common Equity Tier I Capital (to risk-weighted assets)
Cass Information Systems, Inc. 243,388 20.41 53,656 4.50 N/A N/A Cass Commercial Bank 161,300 20.21 35,918 4.50 51,882 6.50 Tier I capital (to risk-weighted assets) Cass Information Systems, Inc. 243,388 20.41 71,541 6.00 N/A N/A Cass Commercial Bank 161,300 20.21 47,891 6.00 63,855 8.00 Tier I capital (to average assets) Cass Information Systems, Inc. 243,388 11.52 84,511 4.00 N/A N/A Cass Commercial Bank 161,300 14.48 44,543 4.00 55,679 5.00 At December 31, 2019 Total capital (to risk-weighted assets) Cass Information Systems, Inc. $ 249,954 19.70 % $ 101,530 8.00 % $ N/A N/A % Cass Commercial Bank 154,011 19.32 63,778 8.00 79,722 10.00 Common Equity Tier I Capital (to risk-weighted assets)
Cass Information Systems, Inc. 239,398 18.86 57,110 4.50 N/A N/A Cass Commercial Bank 145,673 18.27 35,875 4.50 51,819 6.50 Tier I capital (to risk-weighted assets) Cass Information Systems, Inc. 239,398 18.86 76,147 6.00 N/A N/A Cass Commercial Bank 145,673 18.27 47,833 6.00 63,778 8.00 Tier I capital (to average assets) Cass Information Systems, Inc. 239,398 13.24 72,329 4.00 N/A N/A Cass Commercial Bank 145,673 16.64 35,012 4.00 43,765 5.00
Note 3 Investment in Securities Investment securities available-for-sale are recorded at fair value on a recurring basis. The Company’s investment securities available-for-sale at December 31, 2020 and 2019 are measured at fair value using Level 2 valuations. The market evaluation utilizes several sources which include “observable inputs” rather than “significant unobservable inputs” and therefore falls into the Level 2 category. The table below presents the balances of securities available-for-sale measured at fair value on a recurring basis. The amortized cost, gross unrealized gains, gross unrealized losses and fair value of debt and equity securities are summarized as follows:
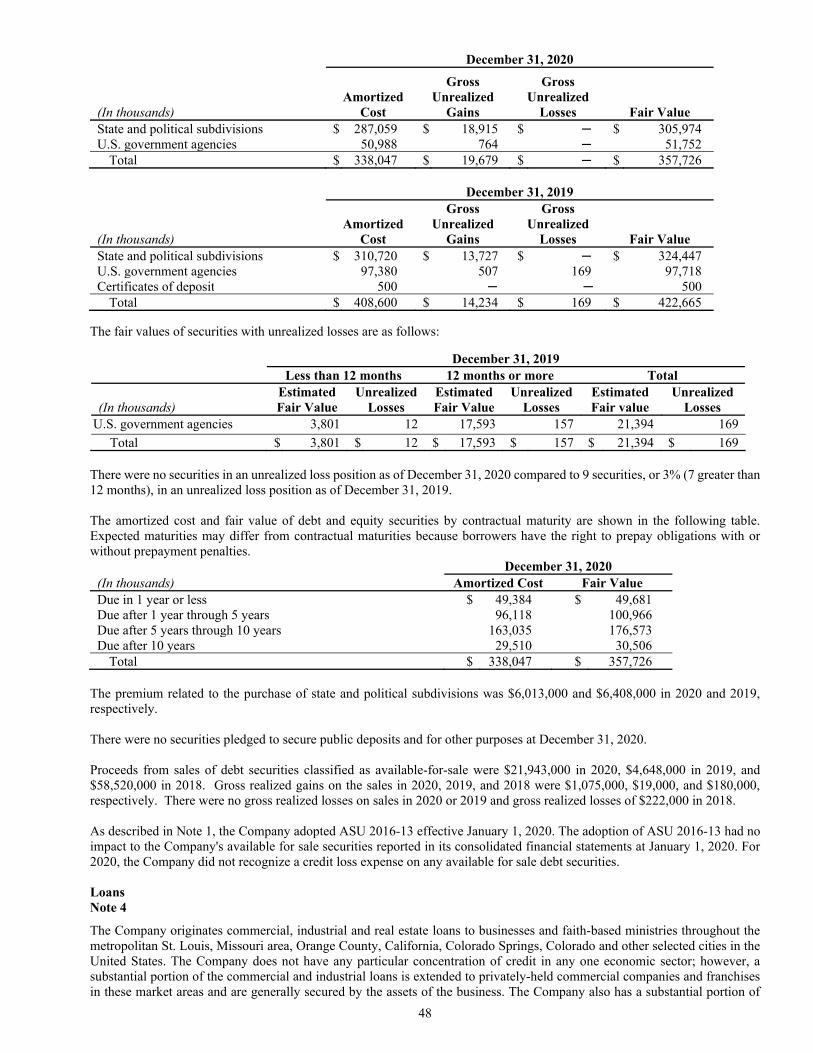
48
December 31, 2020
(In thousands) Amortized
Cost
Gross Unrealized
Gains
Gross Unrealized
Losses Fair Value State and political subdivisions $ 287,059 $ 18,915 $ ─ $ 305,974 U.S. government agencies 50,988 764 ─ 51,752 Total $ 338,047 $ 19,679 $ ─ $ 357,726
December 31, 2019
(In thousands) Amortized
Cost
Gross Unrealized
Gains
Gross Unrealized
Losses Fair Value State and political subdivisions $ 310,720 $ 13,727 $ ─ $ 324,447 U.S. government agencies 97,380 507 169 97,718 Certificates of deposit 500 ─ ─ 500 Total $ 408,600 $ 14,234 $ 169 $ 422,665
The fair values of securities with unrealized losses are as follows:
December 31, 2019 Less than 12 months 12 months or more Total Estimated Unrealized Estimated Unrealized Estimated Unrealized (In thousands) Fair Value Losses Fair Value Losses Fair value Losses
U.S. government agencies 3,801 12 17,593 157 21,394 169
Total $ 3,801 $ 12 $ 17,593 $ 157 $ 21,394 $ 169 There were no securities in an unrealized loss position as of December 31, 2020 compared to 9 securities, or 3% (7 greater than 12 months), in an unrealized loss position as of December 31, 2019. The amortized cost and fair value of debt and equity securities by contractual maturity are shown in the following table. Expected maturities may differ from contractual maturities because borrowers have the right to prepay obligations with or without prepayment penalties.
December 31, 2020 (In thousands) Amortized Cost Fair Value Due in 1 year or less $ 49,384 $ 49,681 Due after 1 year through 5 years 96,118 100,966 Due after 5 years through 10 years 163,035 176,573 Due after 10 years 29,510 30,506 Total $ 338,047 $ 357,726
The premium related to the purchase of state and political subdivisions was $6,013,000 and $6,408,000 in 2020 and 2019, respectively. There were no securities pledged to secure public deposits and for other purposes at December 31, 2020. Proceeds from sales of debt securities classified as available-for-sale were $21,943,000 in 2020, $4,648,000 in 2019, and $58,520,000 in 2018. Gross realized gains on the sales in 2020, 2019, and 2018 were $1,075,000, $19,000, and $180,000, respectively. There were no gross realized losses on sales in 2020 or 2019 and gross realized losses of $222,000 in 2018. As described in Note 1, the Company adopted ASU 2016-13 effective January 1, 2020. The adoption of ASU 2016-13 had no impact to the Company's available for sale securities reported in its consolidated financial statements at January 1, 2020. For 2020, the Company did not recognize a credit loss expense on any available for sale debt securities. Loans Note 4
The Company originates commercial, industrial and real estate loans to businesses and faith-based ministries throughout the metropolitan St. Louis, Missouri area, Orange County, California, Colorado Springs, Colorado and other selected cities in the United States. The Company does not have any particular concentration of credit in any one economic sector; however, a substantial portion of the commercial and industrial loans is extended to privately-held commercial companies and franchises in these market areas and are generally secured by the assets of the business. The Company also has a substantial portion of
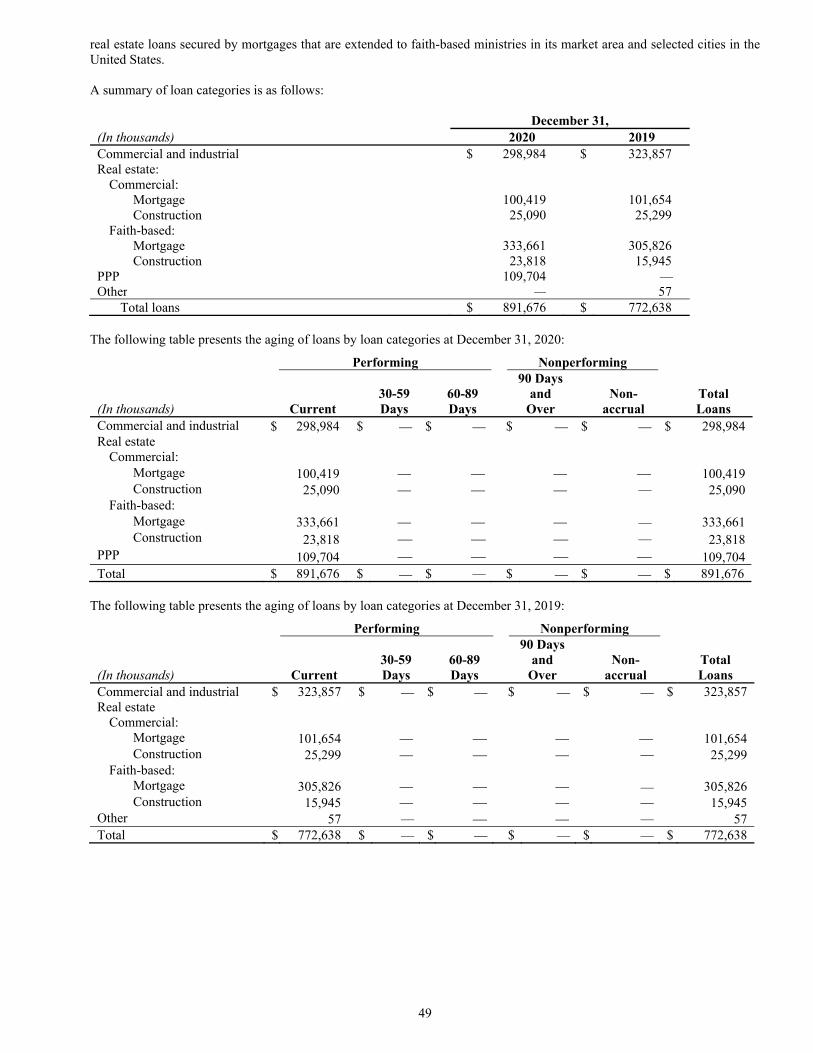
49
real estate loans secured by mortgages that are extended to faith-based ministries in its market area and selected cities in the United States. A summary of loan categories is as follows:
December 31, (In thousands) 2020 2019 Commercial and industrial $ 298,984 $ 323,857 Real estate: Commercial: Mortgage 100,419 101,654 Construction 25,090 25,299 Faith-based: Mortgage 333,661 305,826 Construction 23,818 15,945 PPP 109,704 Other 57 Total loans $ 891,676 $ 772,638
The following table presents the aging of loans by loan categories at December 31, 2020:
Performing Nonperforming
(In thousands) Current 30-59 Days
60-89 Days
90 Days and
Over Non-
accrual Total Loans
Commercial and industrial $ 298,984 $ $ $ $ $ 298,984 Real estate Commercial: Mortgage 100,419 100,419 Construction 25,090 25,090 Faith-based: Mortgage 333,661 333,661 Construction 23,818 23,818 PPP 109,704 109,704 Total $ 891,676 $ $ $ $ $ 891,676
The following table presents the aging of loans by loan categories at December 31, 2019:
Performing Nonperforming
(In thousands) Current 30-59 Days
60-89 Days
90 Days and
Over Non-
accrual Total Loans
Commercial and industrial $ 323,857 $ $ $ $ $ 323,857 Real estate Commercial: Mortgage 101,654 101,654 Construction 25,299 25,299 Faith-based: Mortgage 305,826 305,826 Construction 15,945 15,945 Other 57 57 Total $ 772,638 $ $ $ $ $ 772,638
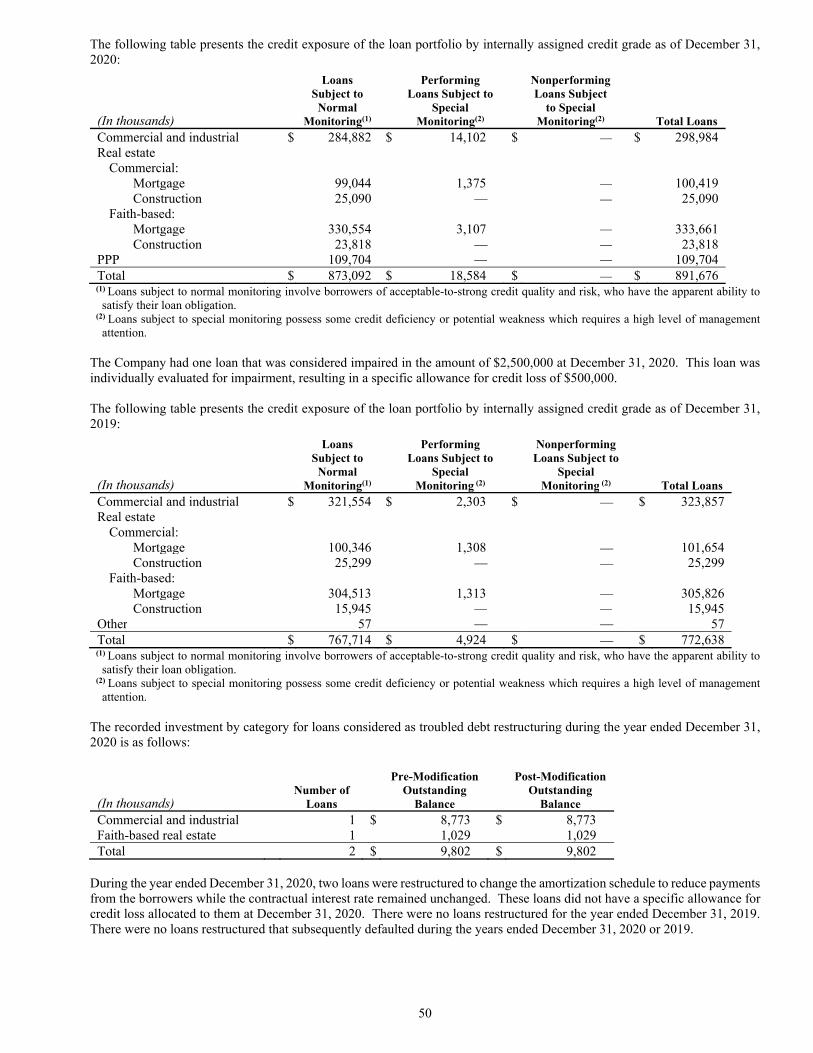
50
The following table presents the credit exposure of the loan portfolio by internally assigned credit grade as of December 31, 2020:
(In thousands)
Loans Subject to
Normal Monitoring(1)
Performing Loans Subject to
Special Monitoring(2)
Nonperforming Loans Subject
to Special Monitoring(2) Total Loans
Commercial and industrial $ 284,882 $ 14,102 $ $ 298,984 Real estate Commercial: Mortgage 99,044 1,375 100,419 Construction 25,090 25,090 Faith-based: Mortgage 330,554 3,107 333,661 Construction 23,818 23,818 PPP 109,704 109,704 Total $ 873,092 $ 18,584 $ $ 891,676 (1) Loans subject to normal monitoring involve borrowers of acceptable-to-strong credit quality and risk, who have the apparent ability to satisfy their loan obligation.
(2) Loans subject to special monitoring possess some credit deficiency or potential weakness which requires a high level of management attention.
The Company had one loan that was considered impaired in the amount of $2,500,000 at December 31, 2020. This loan was individually evaluated for impairment, resulting in a specific allowance for credit loss of $500,000. The following table presents the credit exposure of the loan portfolio by internally assigned credit grade as of December 31, 2019:
(In thousands)
Loans Subject to
Normal Monitoring(1)
Performing Loans Subject to
Special Monitoring (2)
Nonperforming Loans Subject to
Special Monitoring (2) Total Loans
Commercial and industrial $ 321,554 $ 2,303 $ $ 323,857 Real estate Commercial: Mortgage 100,346 1,308 101,654 Construction 25,299 25,299 Faith-based: Mortgage 304,513 1,313 305,826 Construction 15,945 15,945 Other 57 57 Total $ 767,714 $ 4,924 $ $ 772,638 (1) Loans subject to normal monitoring involve borrowers of acceptable-to-strong credit quality and risk, who have the apparent ability to satisfy their loan obligation.
(2) Loans subject to special monitoring possess some credit deficiency or potential weakness which requires a high level of management attention.
The recorded investment by category for loans considered as troubled debt restructuring during the year ended December 31, 2020 is as follows:
(In thousands)
Number of Loans
Pre-Modification Outstanding
Balance
Post-Modification Outstanding
Balance Commercial and industrial 1 $ 8,773 $ 8,773 Faith-based real estate 1 1,029 1,029 Total 2 $ 9,802 $ 9,802
During the year ended December 31, 2020, two loans were restructured to change the amortization schedule to reduce payments from the borrowers while the contractual interest rate remained unchanged. These loans did not have a specific allowance for credit loss allocated to them at December 31, 2020. There were no loans restructured for the year ended December 31, 2019. There were no loans restructured that subsequently defaulted during the years ended December 31, 2020 or 2019.
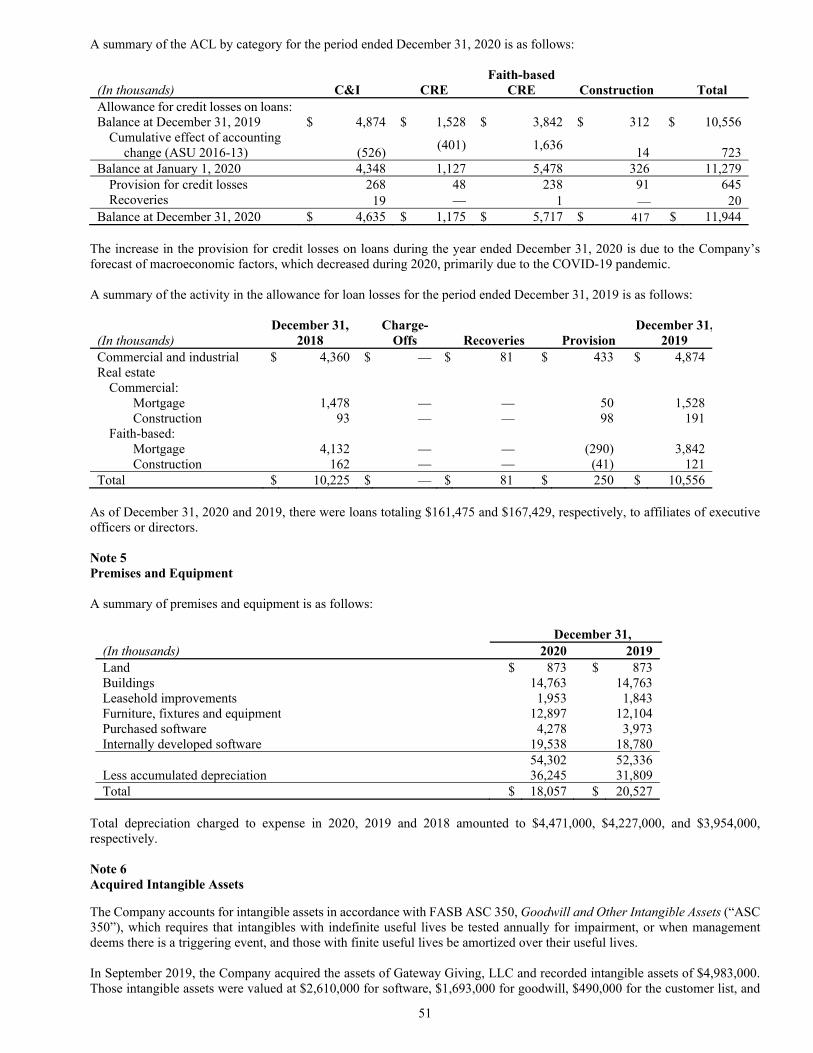
51
A summary of the ACL by category for the period ended December 31, 2020 is as follows:
(In thousands) C&I CRE Faith-based
CRE Construction Total Allowance for credit losses on loans: Balance at December 31, 2019 $ 4,874 $ 1,528 $ 3,842 $ 312 $ 10,556 Cumulative effect of accounting change (ASU 2016-13)
(526)
(401)
1,636
14
723
Balance at January 1, 2020 4,348 1,127 5,478 326 11,279 Provision for credit losses 268 48 238 91 645 Recoveries 19 1 20 Balance at December 31, 2020 $ 4,635 $ 1,175 $ 5,717 $ 417 $ 11,944
The increase in the provision for credit losses on loans during the year ended December 31, 2020 is due to the Company’s forecast of macroeconomic factors, which decreased during 2020, primarily due to the COVID-19 pandemic. A summary of the activity in the allowance for loan losses for the period ended December 31, 2019 is as follows:
(In thousands) December 31,
2018 Charge-
Offs Recoveries Provision December 31,
2019 Commercial and industrial $ 4,360 $ $ 81 $ 433 $ 4,874 Real estate Commercial: Mortgage 1,478 50 1,528 Construction 93 98 191 Faith-based: Mortgage 4,132 (290) 3,842 Construction 162 (41) 121 Total $ 10,225 $ $ 81 $ 250 $ 10,556
As of December 31, 2020 and 2019, there were loans totaling $161,475 and $167,429, respectively, to affiliates of executive officers or directors. Note 5 Premises and Equipment A summary of premises and equipment is as follows:
December 31, (In thousands) 2020 2019 Land $ 873 $ 873 Buildings 14,763 14,763 Leasehold improvements 1,953 1,843 Furniture, fixtures and equipment 12,897 12,104 Purchased software 4,278 3,973 Internally developed software 19,538 18,780 54,302 52,336 Less accumulated depreciation 36,245 31,809 Total $ 18,057 $ 20,527
Total depreciation charged to expense in 2020, 2019 and 2018 amounted to $4,471,000, $4,227,000, and $3,954,000, respectively. Note 6 Acquired Intangible Assets
The Company accounts for intangible assets in accordance with FASB ASC 350, Goodwill and Other Intangible Assets (“ASC 350”), which requires that intangibles with indefinite useful lives be tested annually for impairment, or when management deems there is a triggering event, and those with finite useful lives be amortized over their useful lives. In September 2019, the Company acquired the assets of Gateway Giving, LLC and recorded intangible assets of $4,983,000. Those intangible assets were valued at $2,610,000 for software, $1,693,000 for goodwill, $490,000 for the customer list, and
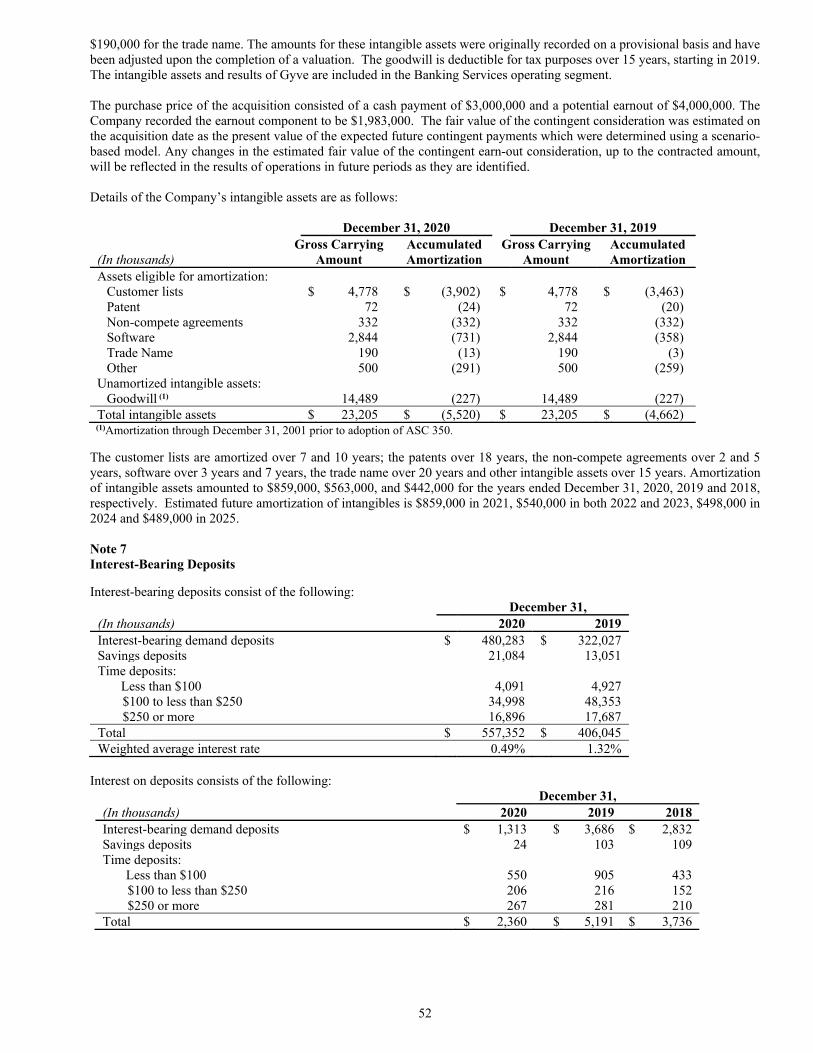
52
$190,000 for the trade name. The amounts for these intangible assets were originally recorded on a provisional basis and have been adjusted upon the completion of a valuation. The goodwill is deductible for tax purposes over 15 years, starting in 2019. The intangible assets and results of Gyve are included in the Banking Services operating segment. The purchase price of the acquisition consisted of a cash payment of $3,000,000 and a potential earnout of $4,000,000. The Company recorded the earnout component to be $1,983,000. The fair value of the contingent consideration was estimated on the acquisition date as the present value of the expected future contingent payments which were determined using a scenario-based model. Any changes in the estimated fair value of the contingent earn-out consideration, up to the contracted amount, will be reflected in the results of operations in future periods as they are identified. Details of the Company’s intangible assets are as follows:
December 31, 2020 December 31, 2019
(In thousands) Gross Carrying
Amount Accumulated Amortization
Gross Carrying Amount
Accumulated Amortization
Assets eligible for amortization: Customer lists $ 4,778 $ (3,902) $ 4,778 $ (3,463) Patent 72 (24) 72 (20) Non-compete agreements 332 (332) 332 (332) Software 2,844 (731) 2,844 (358) Trade Name 190 (13) 190 (3) Other 500 (291) 500 (259)
Unamortized intangible assets: Goodwill (1) 14,489 (227) 14,489 (227)
Total intangible assets $ 23,205 $ (5,520) $ 23,205 $ (4,662) (1)Amortization through December 31, 2001 prior to adoption of ASC 350.
The customer lists are amortized over 7 and 10 years; the patents over 18 years, the non-compete agreements over 2 and 5 years, software over 3 years and 7 years, the trade name over 20 years and other intangible assets over 15 years. Amortization of intangible assets amounted to $859,000, $563,000, and $442,000 for the years ended December 31, 2020, 2019 and 2018, respectively. Estimated future amortization of intangibles is $859,000 in 2021, $540,000 in both 2022 and 2023, $498,000 in 2024 and $489,000 in 2025. Note 7 Interest-Bearing Deposits
Interest-bearing deposits consist of the following: December 31,
(In thousands) 2020 2019 Interest-bearing demand deposits $ 480,283 $ 322,027 Savings deposits 21,084 13,051 Time deposits: Less than $100 4,091 4,927 $100 to less than $250 34,998 48,353 $250 or more 16,896 17,687 Total $ 557,352 $ 406,045 Weighted average interest rate 0.49% 1.32%
Interest on deposits consists of the following:
December 31, (In thousands) 2020 2019 2018 Interest-bearing demand deposits $ 1,313 $ 3,686 $ 2,832 Savings deposits 24 103 109 Time deposits: Less than $100 550 905 433 $100 to less than $250 206 216 152 $250 or more 267 281 210 Total $ 2,360 $ 5,191 $ 3,736

53
The scheduled maturities of time deposits are summarized as follows:
December 31, 2020 2019
(In thousands) Amount Percent
of Total Amount Percent
of Total Due within: One year $ 39,575 70.7% $ 47,881 67.5% Two years 10,470 18.7 15,813 22.3 Three years 5,892 10.5 5,584 7.8 Four years 1,689 2.4 Five years 48 0.1 Total $ 55,985 100.0% $ 70,967 100.0%
Note 8 Unused Available Lines of Credit As of December 31, 2020, the Bank had unsecured lines of credit at correspondent banks to purchase federal funds up to a maximum of $83,000,000 at the following banks: US Bank, $20,000,000; UMB Bank $20,000,000; Wells Fargo Bank, $15,000,000; PNC Bank, $12,000,000; Frost National Bank, $10,000,000; and JPM Chase Bank, $6,000,000. As of December 31, 2020, the Bank had secured lines of credit with the Federal Home Loan Bank of $191,992,000 collateralized by commercial mortgage loans. At December 31, 2020, the Company had lines of credit from UMB Bank of $75,000,000 and First Tennessee Bank of $75,000,000 collateralized by state and political subdivision securities. Under the lines of credit discussed above, there were no amounts outstanding at December 31, 2020 and $18,000,000 outstanding at December 31, 2019. The amount outstanding at the end of the 2019 was borrowed on December 31, 2019 and repaid on January 2, 2020. In addition to the lines of credit discussed above, as of April 21, 2020 the Bank was approved for the Federal Reserve’s Paycheck Protection Program Lending Facility. The Bank can receive non-recourse loans with the previously mentioned PPP loans pledged as collateral. The Bank can borrow an amount up to 100% of the amount of the PPP loans, which was $109,704,000 as of December 31, 2020. There was no amount outstanding at December 31, 2020 for this line of credit. Note 9 Common Stock and Earnings per Share The table below shows activity in the outstanding shares of the Company’s common stock during 2020.
2020 Shares outstanding at January 1 14,514,366 Issuance of common stock: Employee restricted stock grants 7,748 Employee restricted stock unit vests 1,890 Performance-based stock 20,287 Employee SARs exercised 3,484 Directors’ compensation 12,757 Shares repurchased (162,901) Shares forfeited (4,962) Shares outstanding at December 31 14,392,669
Basic earnings per share is computed by dividing net income by the weighted average number of common shares outstanding. Diluted earnings per share is computed by dividing net income by the sum of the weighted average number of common shares outstanding and the weighted average number of potential common shares outstanding. Under the treasury stock method, stock appreciation rights (“SARs”) are dilutive when the average market price of the Company’s common stock, combined with the effect of any unamortized compensation expense, exceeds the SAR price during a period. Anti-dilutive shares are those SARs with prices in excess of the current market value.

54
The calculations of basic and diluted earnings per share are as follows:
December 31, (In thousands except share and per share data) 2020 2019 2018 Basic:
Net income $ 25,176 $ 30,404 $ 30,268 Weighted average common shares outstanding 14,364,406 14,434,445 14,675,136
Basic earnings per share $ 1.75 $ 2.11 $ 2.06 Diluted:
Net income $ 25,176 $ 30,404 $ 30,268 Weighted average common shares outstanding 14,364,406 14,434,445 14,675,136
Effect of dilutive restricted stock, performance based restricted stock (“PBRS”), and SARs
202,541 257,480 239,066
Weighted average common shares outstanding assuming dilution
14,566,947
14,691,925
14,914,202
Diluted earnings per share $ 1.73 $ 2.07 $ 2.03 Note 10 Employee Benefit Plans Defined Benefit Plan The Company has a noncontributory defined-benefit pension plan (the “Plan”), which covers eligible employees. Effective December 31, 2016, the Plan was closed to all new participants. Additionally, prior to the end of 2020, the Company notified existing participants that benefits would be frozen as of February 28, 2021. The freezing of the benefits reduced the projected benefit obligation by $18,322,000 at December 31, 2020. The Company accrues and makes contributions designed to fund normal service costs on a current basis using the projected unit credit with service proration method to amortize prior service costs arising from improvements in pension benefits and qualifying service prior to the establishment of the Plan over a period of approximately 30 years. A summary of the activity in the Plan’s projected benefit obligation, assets, funded status and amounts recognized in the Company’s consolidated balance sheets is as follows:
(In thousands) 2020 2019 Projected benefit obligation: Balance, January 1 $ 119,827 $ 96,401 Service cost 4,329 3,554 Interest cost 3,908 4,103 Actuarial loss 15,087 18,334 Plan amendments (18,322) Benefits paid (2,794) (2,565) Balance, December 31 $ 122,035 $ 119,827 Plan assets: Fair value, January 1 $ 94,634 $ 74,580 Actual return 14,826 15,719 Employer contribution 6,900 Benefits paid (2,793) (2,565) Fair value, December 31 $ 106,667 $ 94,634 Funded status: Accrued pension liability $ (15,368) $ (25,192)
The following represent the major assumptions used to determine the projected benefit obligation of the Plan. For 2020, 2019 and 2018, the Plan’s expected benefit cash flows were discounted using the FTSE Above Median Double-A Curve. For 2020, the Pri-2012 Mortality Table and MP-2020 Mortality Improvement Scale were used. For 2019, the Pri-2012 Mortality Table and MP-2019 Mortality Improvement Scale were used. For 2018, the RP-2014 Mortality Table and the MP-2018 Mortality Improvement Scale were used.
2020 2019 2018 Weighted average discount rate 2.55% 3.30% 4.30% Rate of increase in compensation levels (a) (a) (a)
(a) 6.0% graded down to 3.25% over the first seven years of service.

55
The accumulated benefit obligation was $121,095,000 and $103,736,000 as of December 31, 2020 and 2019, respectively. The Company did not make a contribution during 2020, while in 2019 a contribution of $6,900,000 was made to the Plan. The Company has not determined if it will make a contribution to the Plan in 2021. The following pension benefit payments, which reflect expected future service, as appropriate, are expected to be paid by the Plan:
Amount 2021 $3,357,000 2022 3,735,000 2023 4,118,000 2024 4,340,000 2025 4,534,000 2026-2030 25,820,000
The Plan’s pension cost included the following components:
For the Year Ended December 31, (In thousands) 2020 2019 2018 Service cost – benefits earned during the year $ 4,329 $ 3,555 $ 4,017 Interest cost on projected benefit obligations 3,908 4,103 3,703 Expected return on plan assets (6,049) (4,753) (5,202) Net amortization and deferral 1,946 1,559 1,522 Net periodic pension cost $ 4,134 $ 4,464 $ 4,040
The following represent the major assumptions used to determine the net pension cost of the Plan:
2020 2019 2018 Weighted average discount rate 3.30% 4.30% 3.75% Rate of increase in compensation levels (a) (a) (a) Expected long-term rate of return on assets 6.50% 6.50% 6.50%
(a) 6.0% graded down to 3.25% over the first seven years of service For 2020, the Pri-2012 Mortality Table and the MP-2019 Mortality Improvement Table were used. For 2019, the RP-2014 Mortality Table and the MP-2018 Mortality Improvement Table were used. For 2018, the RP-2014 Mortality Table and the MP-2017 Mortality Improvement Table were used. The investment objective for the Plan is to maximize total return with a tolerance for average risk. Asset allocation is a balance between fixed income and equity investments, with a target allocation of approximately 51% fixed income, 19% U.S. equity and 30% non-U.S. equity. Due to volatility in the market, this target allocation is not always desirable and asset allocations can fluctuate between acceptable ranges. The fixed income component is invested in pooled investment grade securities. The equity components are invested in pooled large cap, small/mid cap and non-U.S. stocks. The expected one-year nominal returns and annual standard deviations are shown by asset class below:
Asset Class % of Total Portfolio One-Year Nominal
Return Annual Standard
Deviation Core Fixed Income 51% 3.04% 3.85% Large Cap U.S. Equities 14% 6.45% 16.00% Small Cap U.S. Equities 5% 7.45% 20.15% International (Developed) 25% 7.95% 17.83% International (Emerging) 5% 10.14% 25.40%
Applying appropriate correlation factors between each of the asset classes the long-term rate of return on assets is estimated to be 6.50%.

56
A summary of the fair value measurements by type of asset is as follows:
Fair Value Measurements as of December 31, 2020 2019
(In thousands) Total
Quoted Prices in Active
Markets for Identical
Assets (Level 1)
Observable Inputs
(Level 2) Total
Quoted Prices in Active
Markets for Identical
Assets (Level 1)
Observable Inputs
(Level 2) Cash $484 $484 $ ― $462 $462 $ ― Equity securities U.S. Small/Mid Cap Growth 5,530 ― 5,530 4,491 ― 4,491 Non-U. S. Core 26,342 ― 26,342 23,975 ― 23,975 U.S. Large Cap Passive 17,520 ― 17,520 13,523 ― 13,523 Emerging Markets 5,882 ― 5,882 4,559 ― 4,559 Fixed Income U.S. Core 23,467 ― 23,467 27,046 ― 27,046 U.S. Passive 21,680 ― 21,680 15,255 ― 15,255 Opportunistic 5,762 ― 5,762 5,323 ― 5,323 Total $106,667 $484 $106,183 $94,634 $462 $94,172
Supplemental Executive Retirement Plan The Company also has an unfunded supplemental executive retirement plan (“SERP”) which covers key executives of the Company whose benefits are limited by the Internal Revenue Service under the Company’s qualified retirement plan. The SERP is a noncontributory plan in which the Company’s subsidiaries make accruals designed to fund normal service costs on a current basis using the same method and criteria as the Plan.
A summary of the activity in the SERP’s projected benefit obligation and amounts recognized in the Company’s consolidated balance sheets is as follows:
December 31, (In thousands) 2020 2019 Benefit obligation: Balance, January 1 $ 11,712 $ 10,097 Service cost 121 97 Interest cost 347 408 Benefits paid (291) (262) Actuarial loss 1,523 1,372 Balance, December 31 $ 13,412 $ 11,712
The following represent the major assumptions used to determine the projected benefit obligation of the SERP. For 2020, 2019 and 2018, the SERP’s expected benefit cash flows were discounted using the FTSE Above Median Double-A Curve.
2020 2019 2018 Weighted average discount rate 2.20% 3.00% 4.10% Rate of increase in compensation levels (a) (a) (a)
(a) 6.00% graded down to 3.25% over the first seven years of service. The accumulated benefit obligation was $12,492,000 and $10,485,000 as of December 31, 2020 and 2019, respectively. Since this is an unfunded plan, there are no plan assets. Benefits paid were $291,000 in 2020, $262,000 in 2019, and $260,000 in 2018. Expected future benefits payable by the Company over the next ten years are as follows:
Amount 2021 $343,000 2022 764,000 2023 851,000 2024 849,000 2025 846,000 2026-2030 4,150,000
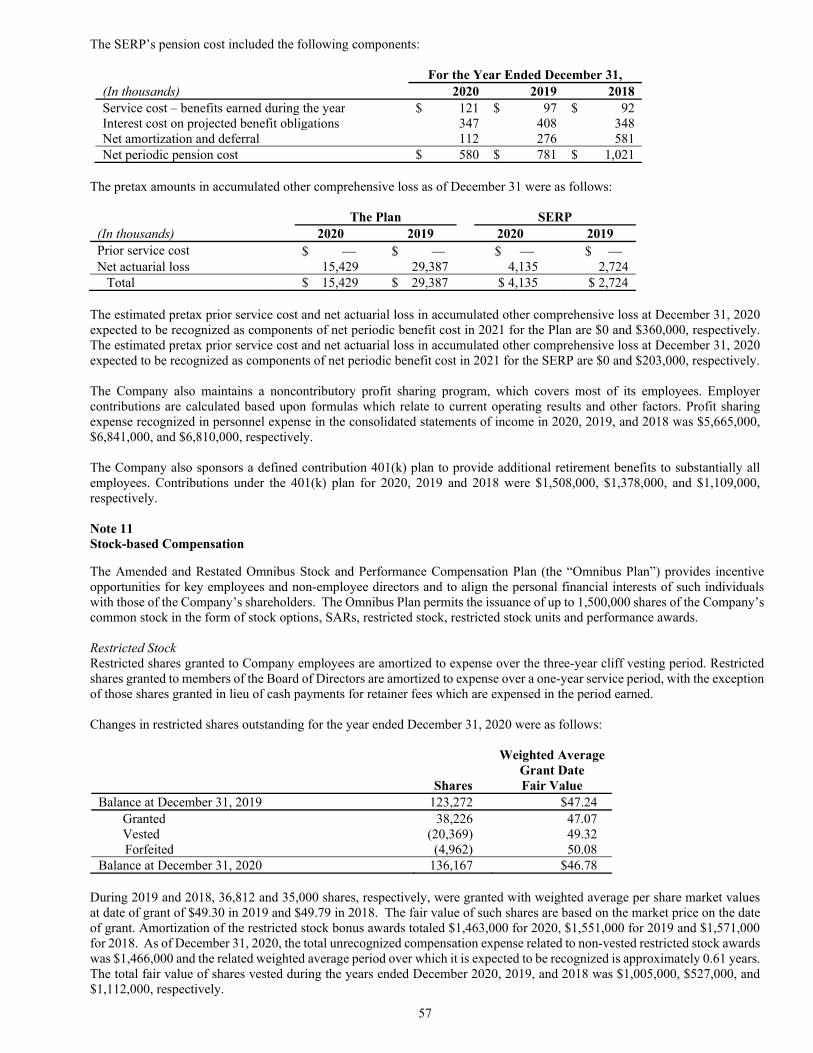
57
The SERP’s pension cost included the following components:
For the Year Ended December 31, (In thousands) 2020 2019 2018 Service cost – benefits earned during the year $ 121 $ 97 $ 92 Interest cost on projected benefit obligations 347 408 348 Net amortization and deferral 112 276 581 Net periodic pension cost $ 580 $ 781 $ 1,021
The pretax amounts in accumulated other comprehensive loss as of December 31 were as follows:
The Plan SERP (In thousands) 2020 2019 2020 2019 Prior service cost $ $ $ $ Net actuarial loss 15,429 29,387 4,135 2,724 Total $ 15,429 $ 29,387 $ 4,135 $ 2,724
The estimated pretax prior service cost and net actuarial loss in accumulated other comprehensive loss at December 31, 2020 expected to be recognized as components of net periodic benefit cost in 2021 for the Plan are $0 and $360,000, respectively. The estimated pretax prior service cost and net actuarial loss in accumulated other comprehensive loss at December 31, 2020 expected to be recognized as components of net periodic benefit cost in 2021 for the SERP are $0 and $203,000, respectively. The Company also maintains a noncontributory profit sharing program, which covers most of its employees. Employer contributions are calculated based upon formulas which relate to current operating results and other factors. Profit sharing expense recognized in personnel expense in the consolidated statements of income in 2020, 2019, and 2018 was $5,665,000, $6,841,000, and $6,810,000, respectively. The Company also sponsors a defined contribution 401(k) plan to provide additional retirement benefits to substantially all employees. Contributions under the 401(k) plan for 2020, 2019 and 2018 were $1,508,000, $1,378,000, and $1,109,000, respectively. Note 11 Stock-based Compensation
The Amended and Restated Omnibus Stock and Performance Compensation Plan (the “Omnibus Plan”) provides incentive opportunities for key employees and non-employee directors and to align the personal financial interests of such individuals with those of the Company’s shareholders. The Omnibus Plan permits the issuance of up to 1,500,000 shares of the Company’s common stock in the form of stock options, SARs, restricted stock, restricted stock units and performance awards. Restricted Stock Restricted shares granted to Company employees are amortized to expense over the three-year cliff vesting period. Restricted shares granted to members of the Board of Directors are amortized to expense over a one-year service period, with the exception of those shares granted in lieu of cash payments for retainer fees which are expensed in the period earned. Changes in restricted shares outstanding for the year ended December 31, 2020 were as follows:
Shares
Weighted Average Grant Date Fair Value
Balance at December 31, 2019 123,272 $47.24 Granted 38,226 47.07 Vested (20,369) 49.32 Forfeited (4,962) 50.08 Balance at December 31, 2020 136,167 $46.78
During 2019 and 2018, 36,812 and 35,000 shares, respectively, were granted with weighted average per share market values at date of grant of $49.30 in 2019 and $49.79 in 2018. The fair value of such shares are based on the market price on the date of grant. Amortization of the restricted stock bonus awards totaled $1,463,000 for 2020, $1,551,000 for 2019 and $1,571,000 for 2018. As of December 31, 2020, the total unrecognized compensation expense related to non-vested restricted stock awards was $1,466,000 and the related weighted average period over which it is expected to be recognized is approximately 0.61 years. The total fair value of shares vested during the years ended December 2020, 2019, and 2018 was $1,005,000, $527,000, and $1,112,000, respectively.

58
Performance-Based Restricted Stock The Company has granted three-year PBRS awards which are contingent upon the Company’s achievement of pre-established financial goals over a three-year cliff vest period. The number of shares issued ranges from 0% to 150% of the target opportunity based on the actual achievement of financial goals for the three-year performance period. Following is a summary of the activity of the PBRS, based on target value:
For the Years Ended December 31, 2020
Shares Fair Value Balance at December 31, 2019 102,116 $49.13 Granted 32,910 54.02 Vested (29,175) 49.33 Forfeited (7,441) 50.08 Balance at December 31, 2020 98,410 $50.64
The PBRS that vested during the year ended December 31, 2020 achieved financial goals of 117.3%, resulting in the issuance of 34,222 shares of common stock. The outstanding PBRS at December 31, 2020 will vest at scheduled vesting dates and the actual number of shares of common stock issued will range from 0% to 150% of the target opportunity based on the actual achievement of financial goals for the respective three-year performance period. SARs During 2020, there were no SARs granted and no expense recognized. As of December 31, 2020, there was no unrecognized compensation expense related to SARs. Changes in SARs outstanding for the year ended December 31, 2020 were as follows:
SARs Weighted Average Exercise Price Balance at December 31, 2019 155,292 $32.58 Exercised (10,293) 26.72 Forfeited Balance at December 31, 2020 144,999 32.99 Exercisable at December 31, 2020 144,999 $32.99
The total intrinsic value of SARs exercised during 2020 and 2019 was $275,000 and $2,022,000, respectively. The average remaining contractual term for SARs outstanding as of December 31, 2020 was 1.95 years, and the aggregate intrinsic value was $1,095,000. The average remaining contractual term for SARs outstanding as of December 31, 2019 was 2.92 years, and the aggregate intrinsic value was $3,908,000. The total compensation cost for share-based payment arrangements was $2,267,000, $3,144,000, and $3,006,000, in 2020, 2019, and 2018, respectively. Note 12 Other Operating Expense
Details of other operating expense are as follows: For the Years Ended December 31, (In thousands) 2020 2019 2018 Postage and supplies $ 1,465 $ 1,875 $ 2,180 Promotional expense 2,184 3,838 3,344 Professional fees 2,140 2,388 2,170 Outside service fees 5,845 5,529 4,909 Data processing services 1,900 1,283 919 Telecommunications 765 748 778 Other 1,088 2,404 1,963 Total other operating expense $ 15,387 $ 18,065 $ 16,263
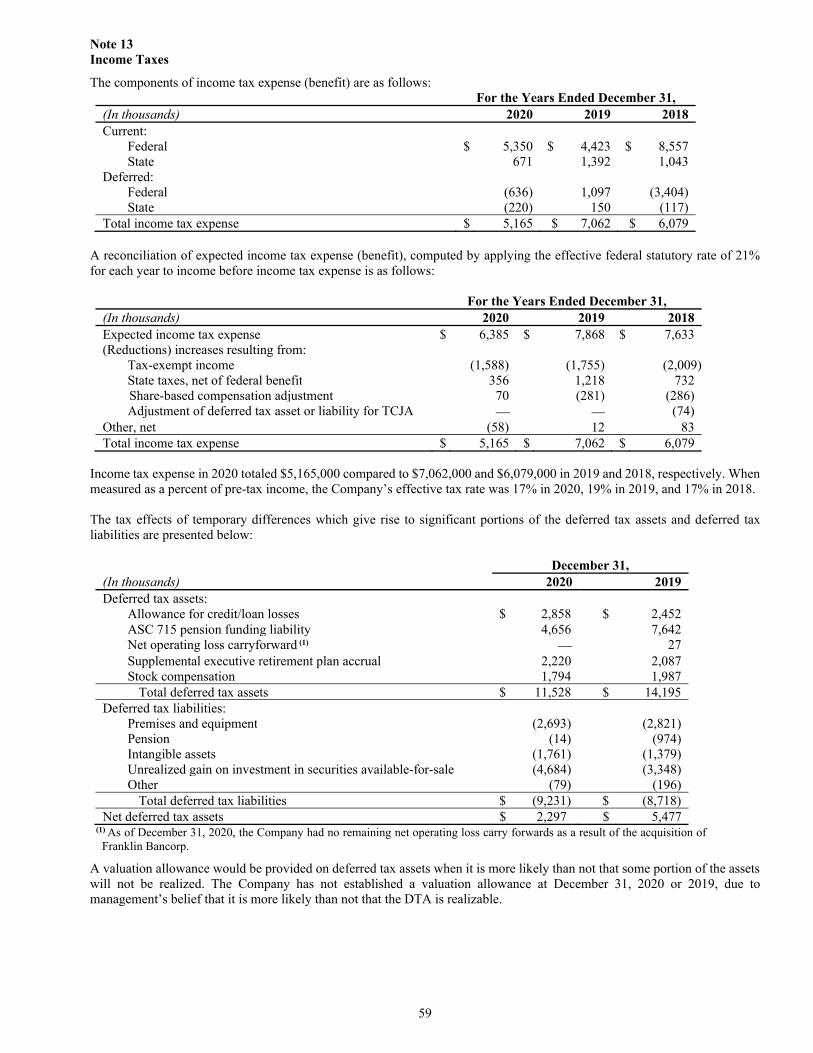
59
Note 13 Income Taxes
The components of income tax expense (benefit) are as follows: For the Years Ended December 31, (In thousands) 2020 2019 2018 Current: Federal $ 5,350 $ 4,423 $ 8,557 State 671 1,392 1,043 Deferred: Federal (636) 1,097 (3,404) State (220) 150 (117) Total income tax expense $ 5,165 $ 7,062 $ 6,079
A reconciliation of expected income tax expense (benefit), computed by applying the effective federal statutory rate of 21% for each year to income before income tax expense is as follows:
For the Years Ended December 31, (In thousands) 2020 2019 2018 Expected income tax expense $ 6,385 $ 7,868 $ 7,633 (Reductions) increases resulting from: Tax-exempt income (1,588) (1,755) (2,009) State taxes, net of federal benefit 356 1,218 732 Share-based compensation adjustment 70 (281) (286) Adjustment of deferred tax asset or liability for TCJA (74) Other, net (58) 12 83 Total income tax expense $ 5,165 $ 7,062 $ 6,079
Income tax expense in 2020 totaled $5,165,000 compared to $7,062,000 and $6,079,000 in 2019 and 2018, respectively. When measured as a percent of pre-tax income, the Company’s effective tax rate was 17% in 2020, 19% in 2019, and 17% in 2018. The tax effects of temporary differences which give rise to significant portions of the deferred tax assets and deferred tax liabilities are presented below:
December 31, (In thousands) 2020 2019 Deferred tax assets: Allowance for credit/loan losses $ 2,858 $ 2,452 ASC 715 pension funding liability 4,656 7,642 Net operating loss carryforward (1) 27 Supplemental executive retirement plan accrual 2,220 2,087 Stock compensation 1,794 1,987 Total deferred tax assets $ 11,528 $ 14,195 Deferred tax liabilities: Premises and equipment (2,693) (2,821) Pension (14) (974) Intangible assets (1,761) (1,379) Unrealized gain on investment in securities available-for-sale (4,684) (3,348) Other (79) (196) Total deferred tax liabilities $ (9,231) $ (8,718) Net deferred tax assets $ 2,297 $ 5,477
(1) As of December 31, 2020, the Company had no remaining net operating loss carry forwards as a result of the acquisition of Franklin Bancorp.
A valuation allowance would be provided on deferred tax assets when it is more likely than not that some portion of the assets will not be realized. The Company has not established a valuation allowance at December 31, 2020 or 2019, due to management’s belief that it is more likely than not that the DTA is realizable.
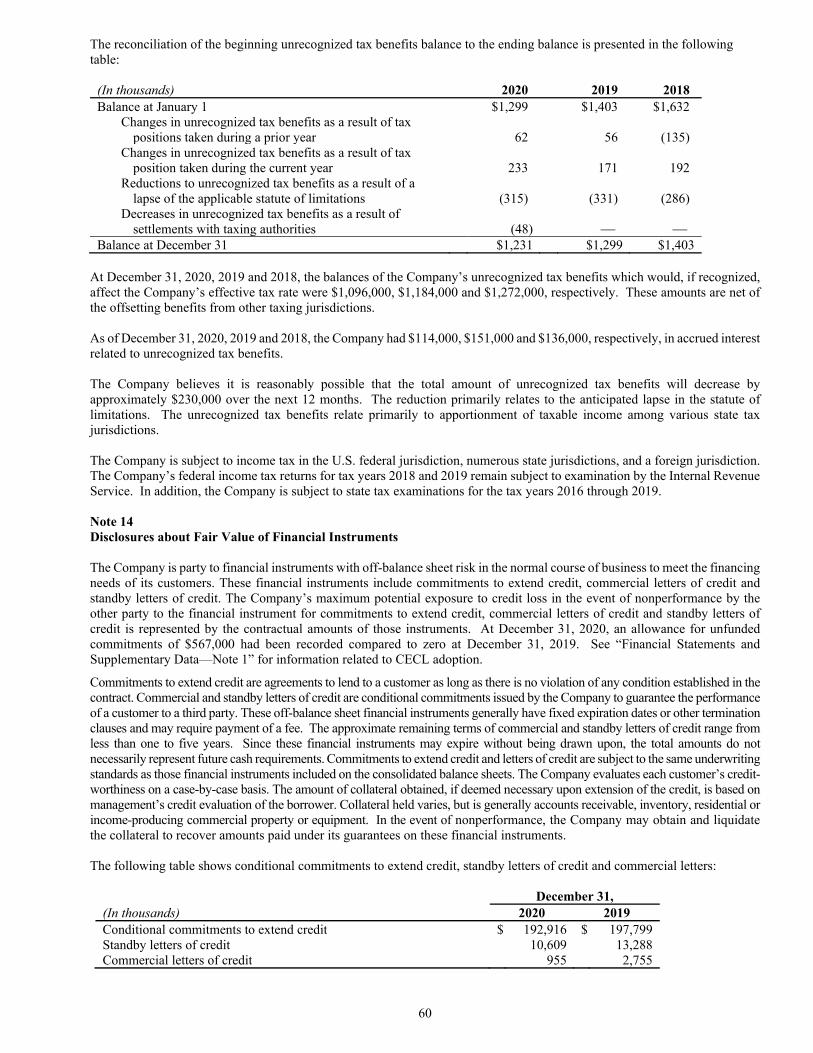
60
The reconciliation of the beginning unrecognized tax benefits balance to the ending balance is presented in the following table:
(In thousands) 2020 2019 2018 Balance at January 1 $1,299 $1,403 $1,632
Changes in unrecognized tax benefits as a result of tax positions taken during a prior year
62 56 (135)
Changes in unrecognized tax benefits as a result of tax position taken during the current year
233 171 192
Reductions to unrecognized tax benefits as a result of a lapse of the applicable statute of limitations
(315) (331) (286)
Decreases in unrecognized tax benefits as a result of settlements with taxing authorities
(48)
Balance at December 31 $1,231 $1,299 $1,403 At December 31, 2020, 2019 and 2018, the balances of the Company’s unrecognized tax benefits which would, if recognized, affect the Company’s effective tax rate were $1,096,000, $1,184,000 and $1,272,000, respectively. These amounts are net of the offsetting benefits from other taxing jurisdictions. As of December 31, 2020, 2019 and 2018, the Company had $114,000, $151,000 and $136,000, respectively, in accrued interest related to unrecognized tax benefits. The Company believes it is reasonably possible that the total amount of unrecognized tax benefits will decrease by approximately $230,000 over the next 12 months. The reduction primarily relates to the anticipated lapse in the statute of limitations. The unrecognized tax benefits relate primarily to apportionment of taxable income among various state tax jurisdictions. The Company is subject to income tax in the U.S. federal jurisdiction, numerous state jurisdictions, and a foreign jurisdiction. The Company’s federal income tax returns for tax years 2018 and 2019 remain subject to examination by the Internal Revenue Service. In addition, the Company is subject to state tax examinations for the tax years 2016 through 2019. Note 14 Disclosures about Fair Value of Financial Instruments The Company is party to financial instruments with off-balance sheet risk in the normal course of business to meet the financing needs of its customers. These financial instruments include commitments to extend credit, commercial letters of credit and standby letters of credit. The Company’s maximum potential exposure to credit loss in the event of nonperformance by the other party to the financial instrument for commitments to extend credit, commercial letters of credit and standby letters of credit is represented by the contractual amounts of those instruments. At December 31, 2020, an allowance for unfunded commitments of $567,000 had been recorded compared to zero at December 31, 2019. See “Financial Statements and Supplementary Data—Note 1” for information related to CECL adoption.
Commitments to extend credit are agreements to lend to a customer as long as there is no violation of any condition established in the contract. Commercial and standby letters of credit are conditional commitments issued by the Company to guarantee the performance of a customer to a third party. These off-balance sheet financial instruments generally have fixed expiration dates or other termination clauses and may require payment of a fee. The approximate remaining terms of commercial and standby letters of credit range from less than one to five years. Since these financial instruments may expire without being drawn upon, the total amounts do not necessarily represent future cash requirements. Commitments to extend credit and letters of credit are subject to the same underwriting standards as those financial instruments included on the consolidated balance sheets. The Company evaluates each customer’s credit-worthiness on a case-by-case basis. The amount of collateral obtained, if deemed necessary upon extension of the credit, is based on management’s credit evaluation of the borrower. Collateral held varies, but is generally accounts receivable, inventory, residential or income-producing commercial property or equipment. In the event of nonperformance, the Company may obtain and liquidate the collateral to recover amounts paid under its guarantees on these financial instruments.
The following table shows conditional commitments to extend credit, standby letters of credit and commercial letters:
December 31, (In thousands) 2020 2019 Conditional commitments to extend credit $ 192,916 $ 197,799 Standby letters of credit 10,609 13,288 Commercial letters of credit 955 2,755
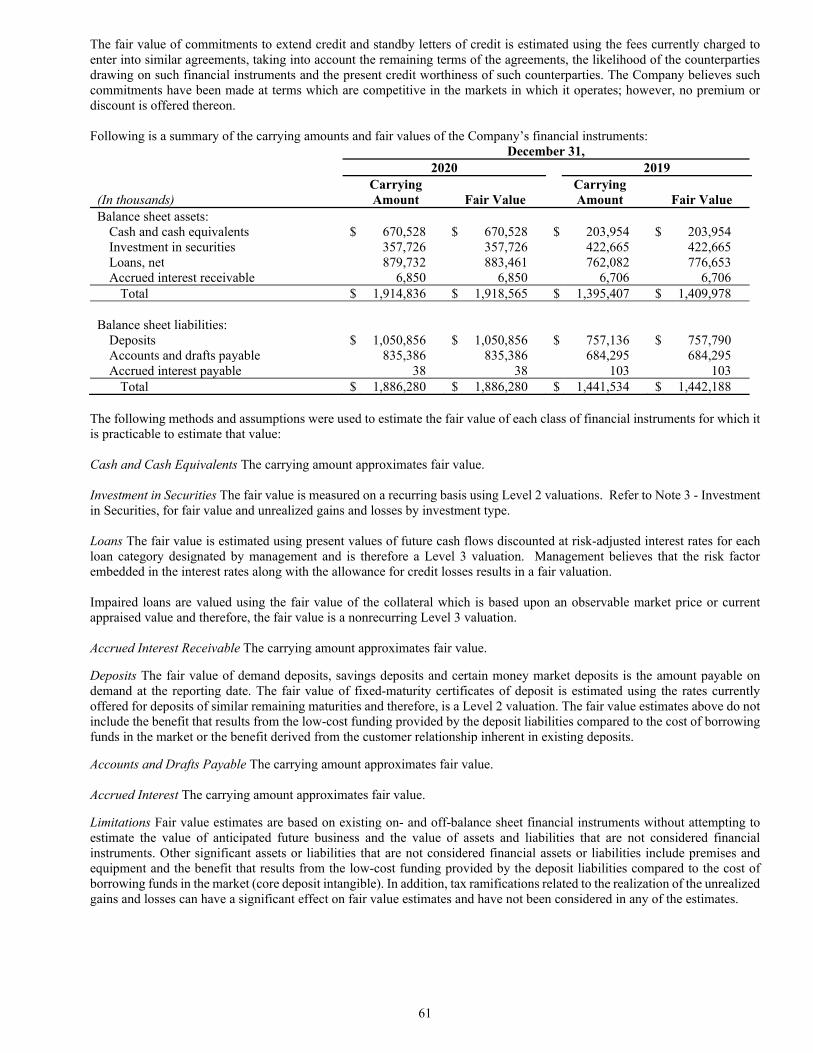
61
The fair value of commitments to extend credit and standby letters of credit is estimated using the fees currently charged to enter into similar agreements, taking into account the remaining terms of the agreements, the likelihood of the counterparties drawing on such financial instruments and the present credit worthiness of such counterparties. The Company believes such commitments have been made at terms which are competitive in the markets in which it operates; however, no premium or discount is offered thereon. Following is a summary of the carrying amounts and fair values of the Company’s financial instruments:
December 31, 2020 2019
(In thousands) Carrying Amount Fair Value
Carrying Amount Fair Value
Balance sheet assets: Cash and cash equivalents $ 670,528 $ 670,528 $ 203,954 $ 203,954 Investment in securities 357,726 357,726 422,665 422,665 Loans, net 879,732 883,461 762,082 776,653 Accrued interest receivable 6,850 6,850 6,706 6,706 Total $ 1,914,836 $ 1,918,565 $ 1,395,407 $ 1,409,978 Balance sheet liabilities: Deposits $ 1,050,856 $ 1,050,856 $ 757,136 $ 757,790 Accounts and drafts payable 835,386 835,386 684,295 684,295 Accrued interest payable 38 38 103 103 Total $ 1,886,280 $ 1,886,280 $ 1,441,534 $ 1,442,188
The following methods and assumptions were used to estimate the fair value of each class of financial instruments for which it is practicable to estimate that value: Cash and Cash Equivalents The carrying amount approximates fair value. Investment in Securities The fair value is measured on a recurring basis using Level 2 valuations. Refer to Note 3 - Investment in Securities, for fair value and unrealized gains and losses by investment type. Loans The fair value is estimated using present values of future cash flows discounted at risk-adjusted interest rates for each loan category designated by management and is therefore a Level 3 valuation. Management believes that the risk factor embedded in the interest rates along with the allowance for credit losses results in a fair valuation. Impaired loans are valued using the fair value of the collateral which is based upon an observable market price or current appraised value and therefore, the fair value is a nonrecurring Level 3 valuation. Accrued Interest Receivable The carrying amount approximates fair value. Deposits The fair value of demand deposits, savings deposits and certain money market deposits is the amount payable on demand at the reporting date. The fair value of fixed-maturity certificates of deposit is estimated using the rates currently offered for deposits of similar remaining maturities and therefore, is a Level 2 valuation. The fair value estimates above do not include the benefit that results from the low-cost funding provided by the deposit liabilities compared to the cost of borrowing funds in the market or the benefit derived from the customer relationship inherent in existing deposits.
Accounts and Drafts Payable The carrying amount approximates fair value. Accrued Interest The carrying amount approximates fair value.
Limitations Fair value estimates are based on existing on- and off-balance sheet financial instruments without attempting to estimate the value of anticipated future business and the value of assets and liabilities that are not considered financial instruments. Other significant assets or liabilities that are not considered financial assets or liabilities include premises and equipment and the benefit that results from the low-cost funding provided by the deposit liabilities compared to the cost of borrowing funds in the market (core deposit intangible). In addition, tax ramifications related to the realization of the unrealized gains and losses can have a significant effect on fair value estimates and have not been considered in any of the estimates.

62
Note 15 Contingencies The Company and its subsidiaries are not involved in any pending proceedings other than ordinary routine litigation incidental to their businesses. Management believes none of these proceedings, if determined adversely, would have a material effect on the business or financial condition of the Company or its subsidiaries.
Note 16 Revenue from Contracts with Customers On January 1, 2018, the Company adopted FASB ASU 2014-09, Revenue from Contracts with Customers (Topic 606) (“ASU 2014-09”) and selected the modified retrospective transition method. The adoption of this new standard did not impact the Company’s results of operations or balance sheet and there was no cumulative effect of initially applying this new revenue standard to the opening balance of retained earnings. Since interest income on loans and securities are both excluded from this topic, a significant portion of the Company’s revenues are not subject to the new guidance. The services that fall within the scope of ASU 2014-09 are presented within fee revenue and other income in the consolidated statements of income and are recognized as revenue as the performance obligation to the customer is satisfied. Services within the scope of ASU 2014-09 include invoice processing and payment fees, bank service fees, and other real estate owned (“OREO”). Invoice processing fees – The Company earns fees on a per-item or monthly basis for the invoice processing services rendered on behalf of customers. Per-item fees are recognized at the point in time when the performance obligation is satisfied. Monthly fees are earned over the course of a month, representing the period over which the performance obligation is satisfied. The Company also earns interest income from the balances generated during the payment cycle for the invoices processed, which is an integral component of the Company’s compensation for invoice processing services but is out-of-scope of ASU 2014-09. The contracts have no significant impact related to variable consideration and no significant financing components. Invoice payment fees – The Company earns fees on a transaction level basis for invoice payment services when making customer payments. Fees are recognized at the point in time when the payment transactions are made, which is when the performance obligation is satisfied. The contracts have no significant impact related to variable consideration and no significant financing components. Bank service fees – Revenue from service fees consists of service charges and fees on deposit accounts under depository agreements with customers to provide access to deposited funds. Service charges on deposit accounts are transaction based fees that are recognized at the point in time when the performance obligation is satisfied. Service charges are recognized on a monthly basis representing the period over which the performance obligation is satisfied. The contracts have no significant impact related to variable consideration and no significant financing components. OREO – The Company currently does not have any OREO and has not in recent years. Net gains or losses would be recorded when other real estate is sold to a third party and substantially all of the consideration for the transfer of property is received.
For the Years Ended December 31, (In thousands) 2020 2019 2018 Fee revenue and other income In-scope of ASU 2014-09 Invoice processing fees $ 74,674 $ 81,329 $ 78,461 Invoice payment fees 22,530 26,624 23,720 Information services payment and processing revenue 97,204 107,953 102,181 Bank service fees 1,704 1,386 1,335 Fee revenue (in-scope of ASU 2014-09) 98,908 109,339 103,516 Other income (out-of-scope of ASU 2014-09) 1,533 730 560 Total fee revenue and other income 100,441 110,069 104,076
Net interest income after provision for credit/loan losses (out-of-scope of ASU 2014-09)
44,515
47,166
44,190
Total net revenue $ 144,956 $ 157,235 $ 148,266

63
Note 17 Industry Segment Information
The services provided by the Company are classified into two reportable segments: Information Services and Banking Services. Each of these segments provides distinct services that are marketed through different channels. They are managed separately due to their unique service and processing requirements. The Information Services segment provides transportation, energy, telecommunication, and environmental invoice processing and payment services to large corporations. The Banking Services segment provides banking services primarily to privately held businesses and faith-based ministries, including on-line generosity services, as well as supporting the banking needs of the Information Services segment.
The Company’s accounting policies for segments are the same as those described in Note 1 of this report. Management evaluates segment performance based on tax-equivalized (as defined in the footnote to the chart on the following table) pre-tax income after allocations for corporate expenses. Transactions between segments are accounted for at what management believes to be fair value. Substantially all revenue originates from, and all long-lived assets are located within the United States, and no revenue from any customer of any segment exceeds 10% of the Company’s consolidated revenue. Funding sources represent average balances and deposits generated by Information Services and Banking Services and there is no allocation methodology used. Segment interest income is a function of the relative share of average funding sources generated by each segment multiplied by the following rates:
Information Services – one or more fixed rates depending upon the specific characteristics of the funding source, and Banking Services – a variable rate that is based upon the overall performance of the Company’s earning assets.
Any difference between total segment interest income and overall total Company interest income is included in Corporate, Eliminations, and Other.

64
Summarized information about the Company’s operations in each industry segment for the years ended December 31, 2020, 2019 and 2018 is as follows:
(In thousands) Information
Services Banking Services
Corporate, Eliminations
and Other Total 2020 Fee income from customers $ 96,548 $ 2,607 $ 1,286 $ 100,441
Interest income* 25,067 29,494 (4,985) 49,576
Interest expense ─ 2,362 ─ 2,362
Intersegment income (expense) ─ 2,315 (2,315) ─
Depreciation and amortization 5,194 135 ─ 5,329
Tax-equivalized pre-tax income* 21,902 14,025 (3,697) 32,230
Goodwill 12,433 1,829 ─ 14,262
Other intangible assets, net 735 2,688 ─ 3,423
Total Assets 967,702 1,242,688 (7,155) 2,203,235
Funding Sources 734,999 738,165 ─ 1,473,164 2019 Fee income from customers $ 108,882 $ 1,660 $ (473) $ 110,069
Interest income* 25,616 30,646 (1,568) 54,694
Interest expense ─ 5,193 ─ 5,193
Intersegment income (expense) ─ 2,107 (2,107) ─
Depreciation and amortization 4,659 131 ─ 4,790
Tax-equivalized pre-tax income* 28,542 13,048 (2,040) 39,550
Goodwill 12,433 1,829 ─ 14,262
Other intangible assets, net 1,142 3,139 ─ 4,281
Total Assets 844,483 915,341 4,419 1,764,243
Funding Sources 676,068 592,905 ─ 1,268,973 2018 Fee income from customers $ 102,839 $ 1,307 $ (70) $ 104,076
Interest income* 25,074 27,770 (2,496) 50,348
Interest expense ─ 3,736 ─ 3,736
Intersegment income (expense) ─ 1,880 (1,880) ─
Depreciation and amortization 4,254 142 ─ 4,396
Tax-equivalized pre-tax income* 27,763 13,571 (2,566) 38,768
Goodwill 12,433 136 ─ 12,569
Other intangible assets, net 1,554 ─ ─ 1,554
Total Assets 826,201 886,291 (17,316) 1,695,176
Funding Sources 642,733 572,653 ─ 1,215,386 * Presented on a tax-equivalent basis assuming a tax rate of 21% for 2020, 2019, and 2018. The tax-equivalent adjustment was approximately $1,888,000 for 2020, $2,084,000 for 2019, and $2,422,000 for 2018. Note 18 Leases On January 1, 2019, the Company adopted ASU 2016-02, Leases (ASC Topic 842). The Company leases certain premises under operating leases. As of December 31, 2020, the Company had lease liabilities of $6,185,000 and right-of-use assets of $5,578,000. Lease liabilities and right-of-use assets are reflected in other liabilities and other assets, respectively. Included in occupancy expense on the consolidated statements of income for 2020 was operating lease cost of $1,677,000, short-term lease cost of $120,000, and there was no variable lease cost. The Company paid cash of $1,832,000 for operating lease amounts included in the measurement of lease liabilities for the year ended December 31, 2020. No right-of-use assets were obtained in exchange for lease liabilities during the year ended December 31, 2020.
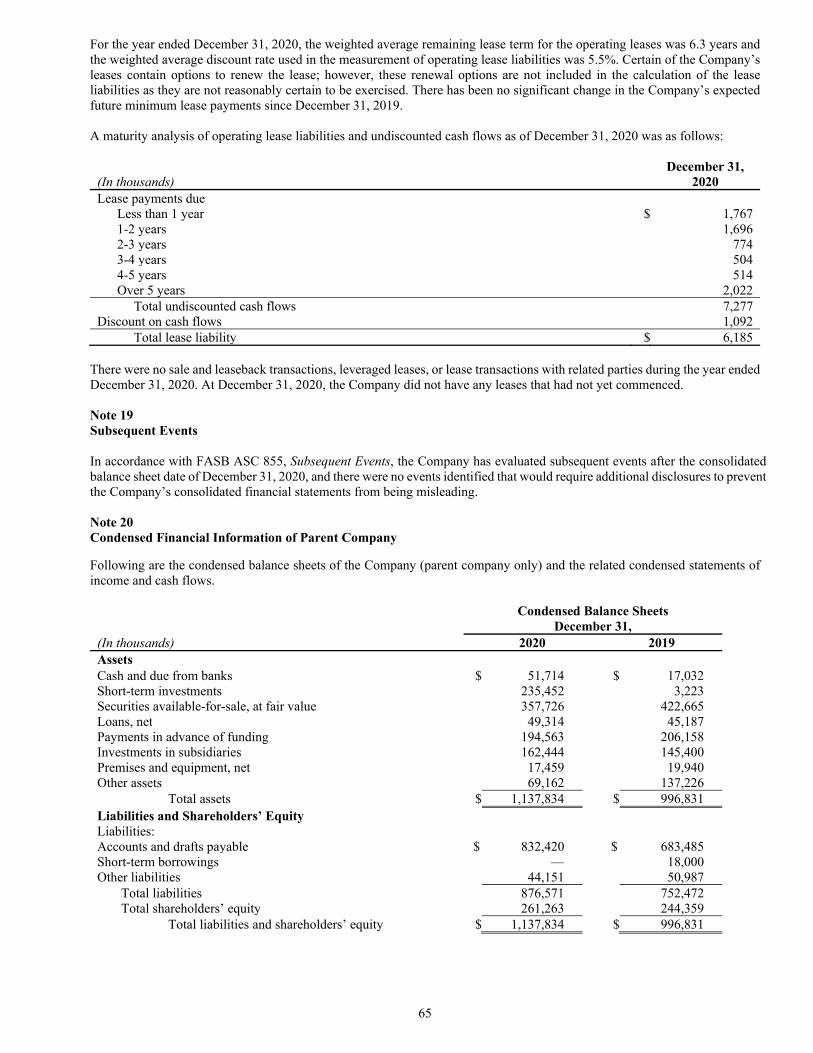
65
For the year ended December 31, 2020, the weighted average remaining lease term for the operating leases was 6.3 years and the weighted average discount rate used in the measurement of operating lease liabilities was 5.5%. Certain of the Company’s leases contain options to renew the lease; however, these renewal options are not included in the calculation of the lease liabilities as they are not reasonably certain to be exercised. There has been no significant change in the Company’s expected future minimum lease payments since December 31, 2019. A maturity analysis of operating lease liabilities and undiscounted cash flows as of December 31, 2020 was as follows:
(In thousands)
December 31, 2020
Lease payments due Less than 1 year $ 1,767 1-2 years 1,696 2-3 years 774 3-4 years 504 4-5 years 514 Over 5 years 2,022 Total undiscounted cash flows 7,277 Discount on cash flows 1,092 Total lease liability $ 6,185
There were no sale and leaseback transactions, leveraged leases, or lease transactions with related parties during the year ended December 31, 2020. At December 31, 2020, the Company did not have any leases that had not yet commenced. Note 19 Subsequent Events In accordance with FASB ASC 855, Subsequent Events, the Company has evaluated subsequent events after the consolidated balance sheet date of December 31, 2020, and there were no events identified that would require additional disclosures to prevent the Company’s consolidated financial statements from being misleading. Note 20 Condensed Financial Information of Parent Company
Following are the condensed balance sheets of the Company (parent company only) and the related condensed statements of income and cash flows.
Condensed Balance Sheets
December 31, (In thousands) 2020 2019 Assets
Cash and due from banks $ 51,714
$ 17,032 Short-term investments 235,452 3,223 Securities available-for-sale, at fair value 357,726 422,665 Loans, net 49,314 45,187 Payments in advance of funding 194,563 206,158 Investments in subsidiaries 162,444 145,400 Premises and equipment, net 17,459 19,940 Other assets 69,162 137,226 Total assets $ 1,137,834
$ 996,831 Liabilities and Shareholders’ Equity
Liabilities:
Accounts and drafts payable $ 832,420
$ 683,485 Short-term borrowings —
18,000 Other liabilities 44,151
50,987 Total liabilities 876,571
752,472 Total shareholders’ equity 261,263
244,359 Total liabilities and shareholders’ equity $ 1,137,834
$ 996,831
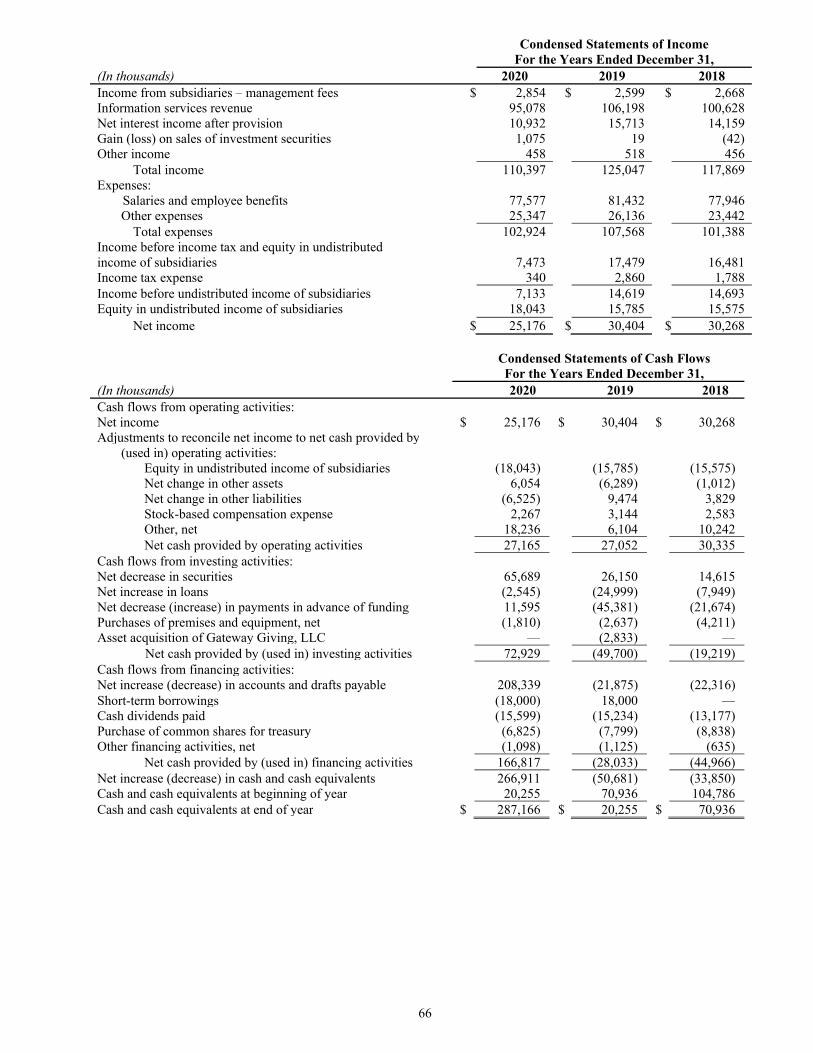
66
Condensed Statements of Income For the Years Ended December 31,
(In thousands) 2020 2019 2018 Income from subsidiaries – management fees $ 2,854 $ 2,599 $ 2,668 Information services revenue 95,078 106,198 100,628 Net interest income after provision 10,932 15,713 14,159 Gain (loss) on sales of investment securities 1,075 19 (42) Other income 458 518 456 Total income 110,397 125,047 117,869 Expenses: Salaries and employee benefits 77,577 81,432 77,946 Other expenses 25,347 26,136 23,442 Total expenses 102,924 107,568 101,388 Income before income tax and equity in undistributed income of subsidiaries
7,473
17,479
16,481
Income tax expense 340 2,860 1,788 Income before undistributed income of subsidiaries 7,133 14,619 14,693 Equity in undistributed income of subsidiaries 18,043 15,785 15,575 Net income $ 25,176 $ 30,404 $ 30,268
Condensed Statements of Cash Flows
For the Years Ended December 31, (In thousands) 2020 2019 2018 Cash flows from operating activities: Net income $ 25,176 $ 30,404 $ 30,268 Adjustments to reconcile net income to net cash provided by (used in) operating activities: Equity in undistributed income of subsidiaries (18,043) (15,785) (15,575) Net change in other assets 6,054 (6,289) (1,012) Net change in other liabilities (6,525) 9,474 3,829 Stock-based compensation expense 2,267 3,144 2,583 Other, net 18,236 6,104 10,242 Net cash provided by operating activities 27,165 27,052 30,335 Cash flows from investing activities: Net decrease in securities 65,689 26,150 14,615 Net increase in loans (2,545) (24,999) (7,949) Net decrease (increase) in payments in advance of funding 11,595 (45,381) (21,674) Purchases of premises and equipment, net (1,810) (2,637) (4,211) Asset acquisition of Gateway Giving, LLC — (2,833) — Net cash provided by (used in) investing activities 72,929 (49,700) (19,219) Cash flows from financing activities: Net increase (decrease) in accounts and drafts payable 208,339 (21,875) (22,316) Short-term borrowings (18,000) 18,000 — Cash dividends paid (15,599) (15,234) (13,177) Purchase of common shares for treasury (6,825) (7,799) (8,838) Other financing activities, net (1,098) (1,125) (635) Net cash provided by (used in) financing activities 166,817 (28,033) (44,966) Net increase (decrease) in cash and cash equivalents 266,911 (50,681) (33,850) Cash and cash equivalents at beginning of year 20,255 70,936 104,786 Cash and cash equivalents at end of year $ 287,166 $ 20,255 $ 70,936

67
Note 21 SUPPLEMENTARY FINANCIAL INFORMATION (Unaudited) (In thousands except per share data)
First Quarter
Second Quarter
Third Quarter
Fourth Quarter
YTD
2020 Fee revenue and other income $ 27,095 $ 23,174 $ 24,932 $ 25,240 $ 100,441 Interest income 12,338 11,642 11,279 12,428 47,687 Interest expense 965 481 465 451 2,362 Net interest income 11,373 11,161 10,814 11,977 45,325 Provision for credit/loan losses 325 400 — 85 810 Operating expense 28,929 27,357 28,680 29,649 114,615 Income tax expense 1,669 1,139 1,285 1,072 5,165 Net income $ 7,545 $ 5,439 $ 5,781 $ 6,411 $ 25,176 Net income per share: Basic earnings per share $ .52 $ .38 $ .40 $ .45 $ 1.75 Diluted earnings per share .52 .37 .40 .44 1.73 2019 Fee revenue and other income $ 27,013 $ 27,372 $ 28,262 $ 27,422 $ 110,069 Interest income 12,897 13,327 13,666 12,719 52,609 Interest expense 1,290 1,305 1,392 1,206 5,193 Net interest income 11,607 12,022 12,274 11,513 47,416 Provision for credit/loan losses 250 — — — 250 Operating expense 28,462 29,971 30,563 30,773 119,769 Income tax expense 1,745 1,739 1,787 1,791 7,062 Net income $ 8,163 $ 7,684 $ 8,186 $ 6,371 $ 30,404 Net income per share: Basic earnings per share $ .56 $ .53 $ .57 $ .44 $ 2.11 Diluted earnings per share .55 .52 .56 .43 2.07
68
Report of Independent Registered Public Accounting Firm
To the Shareholders and Board of Directors Cass Information Systems, Inc.: Opinion on the Consolidated Financial Statements
We have audited the accompanying consolidated balance sheets of Cass Information Systems, Inc. and subsidiaries (the Company) as of December 31, 2020 and 2019, the related consolidated statements of income, comprehensive income, cash flows, and shareholders’ equity for each of the years in the three year period ended December 31, 2020, and the related notes (collectively, the consolidated financial statements). In our opinion, the consolidated financial statements present fairly, in all material respects, the financial position of the Company as of December 31, 2020 and 2019, and the results of its operations and its cash flows for each of the years in the three year period ended December 31, 2020, in conformity with U.S. generally accepted accounting principles. We also have audited, in accordance with the standards of the Public Company Accounting Oversight Board (United States) (PCAOB), the Company’s internal control over financial reporting as of December 31, 2020, based on criteria established in Internal Control – Integrated Framework (2013) issued by the Committee of Sponsoring Organizations of the Treadway Commission, and our report dated February 26, 2021 expressed an unqualified opinion on the effectiveness of the Company’s internal control over financial reporting. Adoption of New Accounting Standard
As discussed in Note 1 to the consolidated financial statements, the Company adopted ASU No. 2016-13, Financial Instruments – Credit Losses (ASC Topic 326) effective as of January 1, 2020. As explained below, auditing the Company’s allowance for credit losses on loans, including adoption of the new accounting guidance related to the estimate of allowance for credit losses on loans, was a critical audit matter. Basis for Opinion
These consolidated financial statements are the responsibility of the Company’s management. Our responsibility is to express an opinion on these consolidated financial statements based on our audits. We are a public accounting firm registered with the PCAOB and are required to be independent with respect to the Company in accordance with the U.S. federal securities laws and the applicable rules and regulations of the Securities and Exchange Commission and the PCAOB. We conducted our audits in accordance with the standards of the PCAOB. Those standards require that we plan and perform the audit to obtain reasonable assurance about whether the consolidated financial statements are free of material misstatement, whether due to error or fraud. Our audits included performing procedures to assess the risks of material misstatement of the consolidated financial statements, whether due to error or fraud, and performing procedures that respond to those risks. Such procedures included examining, on a test basis, evidence regarding the amounts and disclosures in the consolidated financial statements. Our audits also included evaluating the accounting principles used and significant estimates made by management, as well as evaluating the overall presentation of the consolidated financial statements. We believe that our audits provide a reasonable basis for our opinion. Critical Audit Matter
The critical audit matter communicated below is a matter arising from the current period audit of the consolidated financial statements that was communicated or required to be communicated to the audit committee and that: (1) relates to accounts or disclosures that are material to the consolidated financial statements and (2) involved our especially challenging, subjective, or complex judgments. The communication of a critical audit matter does not alter in any way our opinion on the consolidated financial statements, taken as a whole, and we are not, by communicating the critical audit matter below, providing a separate opinion on the critical audit matter or on the accounts or disclosures to which it relates.
Assessment of the allowance for credit losses on loans evaluated on a collective basis As discussed in Note 1 to the consolidated financial statements, the Company adopted ASU No. 2016-13, Financial Instruments — Credit Losses (ASC Topic 326) (“ASU 2016-13”), as of December 31, 2020 with an effective date of January 1, 2020. The total allowance for credit losses on loans as of January 1, 2020 was $11.3 million, of which $11.3 million related to the allowance for credit losses on loans evaluated on a collective basis (the January 1, 2020 collective ACL). As discussed in Notes 1 and 4 to the consolidated financial statements, the Company’s allowance for credit losses on loans collectively evaluated for impairment as of December 31, 2020 was $11.9 million, of which $11.4 million was related to the allowance for credit losses on loans evaluated on a collective basis (the December 31, 2020 collective ACL). The January 1, 2020 collective ACL and December 31, 2020 collective ACL (together, the “collective ACL”) include the measure of expected credit losses on a collective (pooled) basis for those loans and leases that share similar

69
risk characteristics. The Company estimated the collective ACL using a weighted-average remaining maturity (“WARM”) model that utilizes an attrition analysis to determine expected annual remaining loan balance, including events such as payoffs, matured loans, and renewals in the borrowers’ control to anticipate the length of time it would take for each portfolio segment to runoff. The Company applies its historical loss rates for each portfolio segment to the resulting balances. Management then incorporates a reasonable and supportable forecast into the WARM model a one year single economic forecast scenario of GDP, and subsequent to the reasonable and supportable forecast period an immediate reversion to the Company’s historical loss rates for faith-based commercial real estate loans and to peer historical loss rates for the remaining segments. Additionally, the collective ACL includes subjective qualitative risk factors that are likely to cause estimated credit losses to differ from historical experience. We identified the assessment of the January 1, 2020 collective ACL and the December 31, 2020 collective ACL as a critical audit matter. A high degree of audit effort, including specialized skills and knowledge, and subjective and complex auditor judgment was involved in the assessment due to significant measurement uncertainty. Specifically, the assessment encompassed the evaluation of the collective ACL methodology, including the WARM model and its significant assumptions: portfolio segmentation, the GDP forecast scenario, the reasonable and supportable forecast period, the composition of the peer group, and the historical credit loss experience of the Company and the peer group. In addition, the assessment included the evaluation of qualitative risk factors. Such significant assumptions and qualitative risk factors are sensitive to variation, such that minor changes in the assumption can cause significant changes in the estimates. The assessment also included an evaluation of the conceptual soundness and performance of the WARM model. In addition, auditor judgment was required to evaluate the sufficiency of the audit evidence obtained. The following are the primary procedures we performed to address this critical audit matter. We evaluated the design and tested the operating effectiveness of certain internal controls related to the Company’s measurement of the collective ACL estimates, including controls over the: ‒ development of the collective ACL methodology ‒ development of the WARM model ‒ identification and determination of the significant assumptions used in the WARM model ‒ development of the qualitative framework, including the judgments used in the measurement of the qualitative
factors ‒ analysis of the collective ACL results, trends, and ratios. We evaluated the Company’s process to develop the collective ACL estimates by testing certain sources of data, factors, and assumptions that the Company used, and considered the relevance and reliability of such data, factors, and assumptions. In addition, we involved credit risk professionals with specialized skills and knowledge, who assisted in: ‒ evaluating the Company’s collective ACL methodology for compliance with U.S. generally accepted accounting
principles ‒ evaluating judgments made by the Company relative to the development of the WARM model by comparing it to
relevant Company-specific metrics and trends and the applicable industry and regulatory practices ‒ assessing the conceptual soundness of the WARM model by inspecting the model documentation to determine
whether the model is suitable for its intended use ‒ evaluating the determination of the single economic forecast scenario of GDP and underlying assumptions by
comparing it to the Company’s business environment and relevant industry practices ‒ assessing the economic forecast scenario of GDP through comparison to publicly available forecasts ‒ evaluating the length of the historical observation period of peer group data and reasonable and supportable forecast
period by comparing them to specific portfolio risk characteristics and trends ‒ determining whether the loan portfolio is segmented by similar risk characteristics by comparing to the Company’s
business environment and relevant industry practices ‒ assessing the composition of the peer group by comparing to specific portfolio risk characteristics ‒ evaluating the qualitative framework used to develop the qualitative risk factors and the effect of those factors on the
collective ACL compared with relevant credit risk factors and consistency with credit trends and identified limitations of the underlying quantitative models.
We also assessed the sufficiency of the audit evidence obtained related to the January 1, 2020 collective ACL and the December 31, 2020 collective ACL by evaluating the: ‒ cumulative results of the audit procedures ‒ qualitative aspects of the Company’s accounting practices ‒ potential bias in the accounting estimates.

70
/s/ KPMG LLP We have served as the Company’s auditor since 1983. St. Louis, Missouri February 26, 2021
71
ITEM 9. CHANGES IN AND DISAGREEMENTS WITH ACCOUNTANTS ON ACCOUNTING AND FINANCIAL DISCLOSURE
None. ITEM 9A. CONTROLS AND PROCEDURES
Conclusion Regarding the Effectiveness of Disclosure Controls and Procedures Under the supervision and with the participation of our management, including our principal executive officer and principal financial officer, we conducted an evaluation of our disclosure controls and procedures, as such term is defined in Rules 13a-15(e) and 15d-15(e) under the Securities Exchange Act of 1934, as amended (the “Exchange Act”), as of December 31, 2020. Based on this evaluation, our principal executive officer and our principal financial officer concluded that our disclosure controls and procedures were effective as of December 31, 2020. Management’s Report on Internal Control Over Financial Reporting Our management is responsible for establishing and maintaining adequate internal control over financial reporting, as such term is defined in Exchange Act Rules 13a-15(f) and 15d-15(f). All internal control systems, no matter how well designed, have inherent limitations. Therefore, even those systems determined to be effective can provide only reasonable assurance with respect to financial statement preparation and presentations. Under the supervision and with the participation of our management, including our principal executive officer and principal financial officer, we conducted an evaluation of the effectiveness of our internal control over financial reporting based on the framework in Internal Control – Integrated Framework (2013) issued by the Committee of Sponsoring Organizations of the Treadway Commission. Based on our evaluation under this framework, our management concluded that our internal control over financial reporting was effective as of December 31, 2020. There have not been changes in our internal control over financial reporting that occurred during our fourth fiscal quarter that have materially affected or are reasonably likely to materially affect our internal control over financial reporting. The effectiveness of our internal control over financial reporting as of December 31, 2020 has been audited by KPMG LLP, our independent registered public accounting firm. KPMG LLP’s report, which expresses an unqualified opinion on the effectiveness of our internal control over financial reporting as of December 31, 2020, is included below.
72
Report of Independent Registered Public Accounting Firm
To the Shareholders and Board of Directors Cass Information Systems, Inc.: Opinion on Internal Control Over Financial Reporting
We have audited Cass Information Systems, Inc. and subsidiaries’ (the Company) internal control over financial reporting as of December 31, 2020, based on criteria established in Internal Control – Integrated Framework (2013) issued by the Committee of Sponsoring Organizations of the Treadway Commission. In our opinion, the Company maintained, in all material respects, effective internal control over financial reporting as of December 31, 2020, based on criteria established in Internal Control – Integrated Framework (2013) issued by the Committee of Sponsoring Organizations of the Treadway Commission.
We also have audited, in accordance with the standards of the Public Company Accounting Oversight Board (United States) (PCAOB), the consolidated balance sheets of the Company as of December 31, 2020 and 2019, the related consolidated statements of income, comprehensive income, cash flows, and shareholders’ equity for each of the years in the three-year period ended December 31, 2020, and the related notes (collectively, the consolidated financial statements), and our report dated February 26, 2021 expressed an unqualified opinion on those consolidated financial statements.
Basis for Opinion
The Company’s management is responsible for maintaining effective internal control over financial reporting and for its assessment of the effectiveness of internal control over financial reporting, included in the accompanying Management’s Report on Internal Control Over Financial Reporting. Our responsibility is to express an opinion on the Company’s internal control over financial reporting based on our audit. We are a public accounting firm registered with the PCAOB and are required to be independent with respect to the Company in accordance with the U.S. federal securities laws and the applicable rules and regulations of the Securities and Exchange Commission and the PCAOB.
We conducted our audit in accordance with the standards of the PCAOB. Those standards require that we plan and perform the audit to obtain reasonable assurance about whether effective internal control over financial reporting was maintained in all material respects. Our audit of internal control over financial reporting included obtaining an understanding of internal control over financial reporting, assessing the risk that a material weakness exists, and testing and evaluating the design and operating effectiveness of internal control based on the assessed risk. Our audit also included performing such other procedures as we considered necessary in the circumstances. We believe that our audit provides a reasonable basis for our opinion.
Definition and Limitations of Internal Control Over Financial Reporting
A company’s internal control over financial reporting is a process designed to provide reasonable assurance regarding the reliability of financial reporting and the preparation of financial statements for external purposes in accordance with generally accepted accounting principles. A company’s internal control over financial reporting includes those policies and procedures that (1) pertain to the maintenance of records that, in reasonable detail, accurately and fairly reflect the transactions and dispositions of the assets of the company; (2) provide reasonable assurance that transactions are recorded as necessary to permit preparation of financial statements in accordance with generally accepted accounting principles, and that receipts and expenditures of the company are being made only in accordance with authorizations of management and directors of the company; and (3) provide reasonable assurance regarding prevention or timely detection of unauthorized acquisition, use, or disposition of the company’s assets that could have a material effect on the financial statements.
Because of its inherent limitations, internal control over financial reporting may not prevent or detect misstatements. Also, projections of any evaluation of effectiveness to future periods are subject to the risk that controls may become inadequate because of changes in conditions, or that the degree of compliance with the policies or procedures may deteriorate. /s/ KPMG LLP St. Louis, Missouri February 26, 2021

73
ITEM 9B. OTHER INFORMATION None.

74
PART III. ITEM 10. DIRECTORS, EXECUTIVE OFFICERS AND CORPORATE GOVERNANCE Certain information required by this Item 10 is incorporated herein by reference to the following sections of the Company’s definitive Proxy Statement for its 2021 Annual Meeting of Shareholders (“2021 Proxy Statement”), a copy of which will be filed with the SEC no later than 120 days after the close of the fiscal year: “Election of Directors – Proposal 1,” “Executive Compensation and Related Information,” and “Beneficial Ownership of Securities.” The Company has adopted a Code of Conduct and Business Ethics policy, applicable to all Company directors, executive officers and employees. The policy is publicly available and can be viewed on the Company’s website at www.cassinfo.com. The Company intends to satisfy the disclosure requirement under Item 5.05 of Form 8-K regarding the amendment to, or a waiver of, a provision of this policy that applies to the Company’s principal executive officer, principal financial officer, principal accounting officer or controller, or persons performing similar functions, and that relates to any element of the code of ethics definition enumerated in Item 406(b) of Regulation S-K by posting such information on its website. There were no material changes to the procedures by which shareholders may recommend nominees to the Board during the fourth quarter of fiscal 2020. ITEM 11. EXECUTIVE COMPENSATION Certain information required pursuant to this Item 11 is incorporated herein by reference to the sections entitled “Election of Directors – Proposal 1” and “Executive Compensation and Related Information” of the Company’s 2021 Proxy Statement, a copy of which will be filed with the SEC no later than 120 days after the close of the fiscal year. ITEM 12. SECURITY OWNERSHIP OF CERTAIN BENEFICIAL OWNERS AND MANAGEMENT AND RELATED STOCKHOLDER MATTERS Information required pursuant to this Item 12 is incorporated herein by reference to the section entitled “Beneficial Ownership of Securities” of the Company’s 2021 Proxy Statement, a copy of which will be filed with the SEC no later than 120 days after the close of the fiscal year. Securities Authorized for Issuance under Equity Compensation Plans The following information is as of December 31, 2020:
Plan Category
Number of securities to be issued upon exercise of outstanding options,
warrants and rights (a)
Weighted-average exercise price of
outstanding options, warrants
and rights (b)
Number of securities remaining available for future issuance under equity compensation
plans (excluding securities reflected in
column (a)) (c)
Equity compensation plans approved by security holders (1)(2)
379,576
$42.51
352,060
Equity compensation plans not approved by security holders
_ _ _
Total 379,576 $42.51 352,060 (1) Amount disclosed relates to awards issued under the Amended and Restated Omnibus Stock and Performance Compensation Plan
(the “Omnibus Plan”). (2) Includes restricted stock units, restricted stock, SARs, and performance-based stock. Performance-based stock is included assuming 100% attainment of the targets. The actual number of shares of performance-based stock to be awarded at the end of applicable performance periods ranges from 0% to 150% of the target amount awarded depending on the Company’s achievement of pre-established financial goals.
Refer to Note 11 to the consolidated financial statements for information concerning the Omnibus Plan.

75
ITEM 13. CERTAIN RELATIONSHIPS AND RELATED TRANSACTIONS, AND DIRECTOR INDEPENDENCE Information required by this Item 13 is incorporated herein by reference to the section entitled “Election of Directors – Proposal 1” of the Company’s 2021 Proxy Statement, a copy of which will be filed with the SEC no later than 120 days after the close of the fiscal year. ITEM 14. PRINCIPAL ACCOUNTANT FEES AND SERVICES Information concerning our principal accountant’s fees and services is incorporated herein by reference to the section entitled “Ratification of Appointment of Independent Registered Public Accounting Firm – Proposal 3” of the Company’s 2021 Proxy Statement, a copy of which will be filed with the SEC no later than 120 days after the close of the fiscal year.
76
PART IV. ITEM 15. EXHIBITS AND FINANCIAL STATEMENT SCHEDULES (a) The following documents are incorporated by reference in or filed as an exhibit to this report: (1) and (2) Financial Statements and Financial Statement Schedules Included in Item 8 of this report. (3) Exhibits listed under (b) of this Item 15. (b) Exhibits 3.1 Restated Articles of Incorporation of Registrant, incorporated by reference to Exhibit 4.1 to Form S-8 Registration Statement No. 333-44499, filed with the SEC on January 20, 1998.
3.2 Amendment to Restated Articles of Incorporation, incorporated by reference to Exhibit 3.1 to the current report on Form 8-K, filed with the SEC on April 19, 2013.
3.3 Articles of Merger of Cass Commercial Corporation, incorporated by reference to Exhibit 3.1 to the quarterly report on Form 10-Q for the quarter ended September 30, 2006. 3.4 Second Amended and Restated Bylaws of Registrant, incorporated by reference to Exhibit
3.1 to the current report on Form 8-K, filed with the SEC on July 21, 2016.
4.1 Description of the Registrant’s securities, incorporated by reference to Exhibit 4.1 to the Annual report on Form 10-K filed with the SEC on February 28, 2020.
10.1 Form of Directors’ Indemnification Agreement, incorporated by reference to Exhibit 10.1 to the quarterly report on Form 10-Q for the quarter ended March 31, 2003.*
10.2 Amended and Restated Omnibus Stock and Performance Compensation Plan, incorporated
by reference to Exhibit 10.1 to the current report on Form 8-K, filed with the SEC on April 19, 2013.*
10.3 Amendment and Restatement of the Supplemental Executive Retirement Plan, incorporated
by reference to Exhibit 10.2 to the quarterly report on Form 10-Q for the quarter ended September 30, 2007.*
10.4 Form of Stock Appreciation Rights Award Agreement, incorporated by reference to Exhibit
10.4 to the quarterly report on Form 10-Q for the quarter ended September 30, 2007.* 10.5 Form of Restricted Stock Award Agreement, incorporated by reference to Exhibit 10.8 to
the annual report on Form 10-K for the year ended December 31, 2016.* 10.6 Form of Restricted Stock Unit Agreement, incorporated by reference to Exhibit 10.9 to the
annual report on Form 10-K for the year ended December 31, 2016.* 10.7 Description of Cass Information Systems, Inc. Profit Sharing Program, incorporated by
reference to Exhibit 10.7 to the annual report on For 10-K for the year ended December 31, 2018.*
21 Subsidiaries of registrant 23 Consent of Independent Registered Public Accounting Firm.
31.1 Certification Pursuant to Section 302 of the Sarbanes-Oxley Act of 2002. 31.2 Certification Pursuant to Section 302 of the Sarbanes-Oxley Act of 2002.
77
32 .1 Certification Pursuant to 18 U.S.C. Section 1350, as Adopted Pursuant to Section 906 of the Sarbanes-Oxley Act of 2002.
32 .2 Certification Pursuant to 18 U.S.C. Section 1350, as Adopted Pursuant to Section 906 of
the Sarbanes-Oxley Act of 2002. 101.INS XBRL Instance Document. 101.SCH XBRL Taxonomy Extension Schema Document. 101.CAL XBRL Taxonomy Extension Calculation Linkbase Document. 101.LAB XBRL Taxonomy Extension Label Linkbase Document. 101.PRE XBRL Taxonomy Extension Presentation Linkbase Document. 101.DEF XBRL Taxonomy Extension Definition Linkbase Document. 104 Cover Page Interactive Data File *Management contract or compensatory plan arrangement
(c) None. ITEM 16. FORM 10-K SUMMARY None.

78
SIGNATURES
Pursuant to the requirements of the Securities Exchange Act of 1934, this report has been signed below by the following persons on behalf of the registrant and in the capacities and on the dates indicated.
CASS INFORMATION SYSTEMS, INC.
Date: February 26, 2021 By /s/ Eric H. Brunngraber Eric H. Brunngraber Chairman, President and Chief Executive Officer (Principal Executive Officer)
Date: February 26, 2021 By /s/ P. Stephen Appelbaum P. Stephen Appelbaum Executive Vice President and Chief Financial Officer (Principal Financial and Accounting Officer) Pursuant to the requirements of the Securities Exchange Act of 1934, this report has been signed below on the dates indicated by the following persons on behalf of the registrant and in their capacity as a member of the Board of Directors of the Company.
Date: February 26, 2021 By /s/ Eric H. Brunngraber Eric H. Brunngraber Date: February 26, 2021 By /s/ Ralph W. Clermont Ralph W. Clermont Date: February 26, 2021 By /s/ Robert A. Ebel Robert A. Ebel Date: February 26, 2021 By /s/ Benjamin F. Edwards, IV Benjamin F. Edwards, IV Date: February 26, 2021 By /s/ James J. Lindemann James J. Lindemann Date: February 26, 2021 By /s/ Sally H. Roth Sally H. Roth Date: February 26, 2021 By /s/ Joseph D. Rupp Joseph D. Rupp Date: February 26, 2021 By /s/ Randall L. Schilling Randall L. Schilling Date: February 26, 2021 By /s/ Franklin D. Wicks, Jr. Franklin D. Wicks, Jr.

[This page intentionally left blank.]

[This page intentionally left blank.]

Shareholder Information
CORPORATE HEADQUARTERSCass Information Systems, Inc.12444 Powerscourt Drive, Suite 550Saint Louis, Missouri [email protected]
COMMON STOCKThe company’s common stock trades on the NASDAQ stock market under the symbol CASS.
ANNUAL MEETINGThe annual meeting of shareholderswill be held April 20, 2021 at 8:30 a.m.at the Cass office at 13001 Hollenberg Drive, Bridgeton, Missouri 63044.
No presentations are planned.
INVESTOR RELATIONSSecurity analysts, investment man-agers and others seeking financial information about the Company should contact:
Investor Relations DepartmentCass Information Systems, Inc.12444 Powerscourt Drive, Suite 550Saint Louis, Missouri 63131314-506-5500
INDEPENDENT AUDITORSKPMG LLP10 South Broadway, Suite 900Saint Louis, Missouri 63102
TRANSFER AGENTShareholder correspondence should be mailed to:
ComputershareP.O. Box 505000Louisville, KY 40233
Overnight correspondence should be mailed to:
Computershare462 South 4th Street, Suite 1600Louisville, KY 40202
SHAREHOLDER WEBSITE:www.computershare.com/investor
SHAREHOLDER ONLINE INQUIRIES:https://www-us.computershare.com /investor/Contact
TOLL-FREE PHONE:866-323-8170
Cass Information Systems 10-K
Board of Directors
Eric H. BrunngraberChairman, President, and Chief Executive Officer
Ralph W. ClermontRetired Managing Partner,KPMG LLP, Saint Louis, Missouri
Robert A. EbelRetired Chief Executive Officer,Universal Printing Company
Benjamin F. (Tad) Edwards, IVChairman, Chief ExecutiveOfficer, and President,Benjamin F. Edwards & Company
James J. LindemannRetired Executive Vice President,Emerson
Sally H. RothRetired Area President — Upper Midwest, Regions Bank
Joseph D. RuppLead Director and Retired Chairman, President, and Chief Executive Officer, Olin Corporation
Randall L. SchillingChief Executive Officer, OPO Startups, LLC
Franklin D. Wicks, Jr., Ph.D.Retired Executive Vice President and President, Applied Markets, Sigma-Aldrich
Executive Officers
Eric H. BrunngraberChairman, President, and Chief Executive Officer
Mark A. CampbellPresident, TransportationInformation Services
James M. CavellierExecutive Vice President and Chief Information Officer
Dwight D. Erdbruegger President, Cass Commercial Bank Gary B. LangfittPresident, Expense Management Services Michael J. NormileExecutive Vice President and Chief Financial Officer
Martin H. Resch Executive Vice President and Chief Operating Officer
Matthew S. Schuckman Executive Vice President, General Counsel, and Corporate Secretary

12444 Powerscourt Drive, Suite 550 Saint Louis, Missouri 63131 314-506-5500
www.cassinfo.com


