19
2020 | ENVIRONMENTAL, SOCIAL, GOVERNANCE AND SUSTAINABILITY REPORT Consistent with Edison Electric Institute (EEI) and American Gas Association (AGA) template

2020 | ENVIRONMENTAL, SOCIAL, GOVERNANCE AND SUSTAINABILITY REPORT
Consistent with Edison Electric Institute (EEI) and American Gas Association (AGA) template

2020 • ENVIRONMENTAL, SOCIAL, GOVERNANCE AND SUSTAINABILITY REPORT • CMS ENERGY & CONSUMERS ENERGY • 1
2020
Environmental, Social, Governance (ESG) and Sustainability Report
SECTION 1: QUALITATIVE INFORMATION
Introduction
CMS Energy and our primary subsidiary, Consumers Energy, have integrated sustainable principles throughout our company. Our commitment to the triple bottom line — people, planet and prosperity — is our foundation. As Michigan’s largest utility,
consideration of environmental, social and governance (ESG) issues is embedded in our strategy, business planning and enterprise risk management processes. These commitments align with our purpose: World Class Performance Delivering Hometown Service. The triple bottom line balances the interests of all stakeholders, including co-workers,
customers, suppliers, regulators, Michigan residents and the investment community.
CMS Energy is participating in a voluntary industry initiative, coordinated by the Edison Electric Institute (EEI) and the American Gas Association (AGA), to provide the public, our customers and shareholders uniform and consistent ESG and sustainability-related metrics. This report supplements our existing disclosure on these issues, including our 2019 Sustainability Report and our sustainability website. You can find more stories about our sustainability efforts and the people who are making a real and positive impact for Michigan here.
At CMS Energy, we know climate change
is happening and we can do our part
to care for the planet by focusing
on a clean and lean operating strategy.

2020 • ENVIRONMENTAL, SOCIAL, GOVERNANCE AND SUSTAINABILITY REPORT • CMS ENERGY & CONSUMERS ENERGY • 2
ENVIRONMENT
Climate Change
In the past five years, Consumers Energy has created a cleaner, more sustainable energy future for Michigan by taking a leadership position in reducing air emissions, water use and landfill waste.
“Our actions speak louder than words and we have a track record of doing more than is required. Our actions to date have reduced our carbon emissions by over 35 percent, reduced our water use by over 40 percent and avoided over one million cubic yards of landfill disposal,” said Patti Poppe, president and CEO of CMS Energy and Consumers Energy.
But we are not satisfied. In February 2020, Consumers Energy announced a goal to achieve net zero carbon emissions by 2040
for our electric generation business, the next step in an industry-leading Clean Energy Plan that protects the planet for future generations. This carbon-reduction goal is one of the nation’s most
aggressive among similarly sized utilities. Consumers Energy is embracing a cleaner and leaner vision, focused on eliminating wasted energy and adding more renewable energy sources such as wind and solar.
In addition to our efforts to reduce the electric utility’s carbon footprint, we are also helping to reduce the gas utility’s methane footprint. In 2019, Consumers Energy set an industry-leading goal of net zero methane emissions from its natural gas delivery system by 2030 as outlined in our Methane Reduction Plan.
We plan to reduce methane emissions from our system about 80 percent by replacing aging pipe, rehabilitating or retiring outdated infrastructure, and adopting new technologies and practices. Remaining emissions will be eliminated by purchasing and/or producing renewable natural gas, which offsets greenhouse gases by capturing emissions that would otherwise go to the atmosphere.
Renewable Energy
As outlined in our Clean Energy Plan approved by Michigan’s Public Service Commission in 2019, we plan to add 550 megawatts of wind to help us reach Michigan’s 15 percent renewable energy
Air Emissions 2005 – 2019
20192005 2007100%
50%
0%
ParticulateMatter
96%Reduction
CarbonDioxide CO2
37%Reduction
Mercury(Since 2007)
91%Reduction
86%Reduction
NitrogenOxide NOX
SulfurDioxide SO2
93%Reduction
2020 • ENVIRONMENTAL, SOCIAL, GOVERNANCE AND SUSTAINABILITY REPORT • CMS ENERGY & CONSUMERS ENERGY • 3
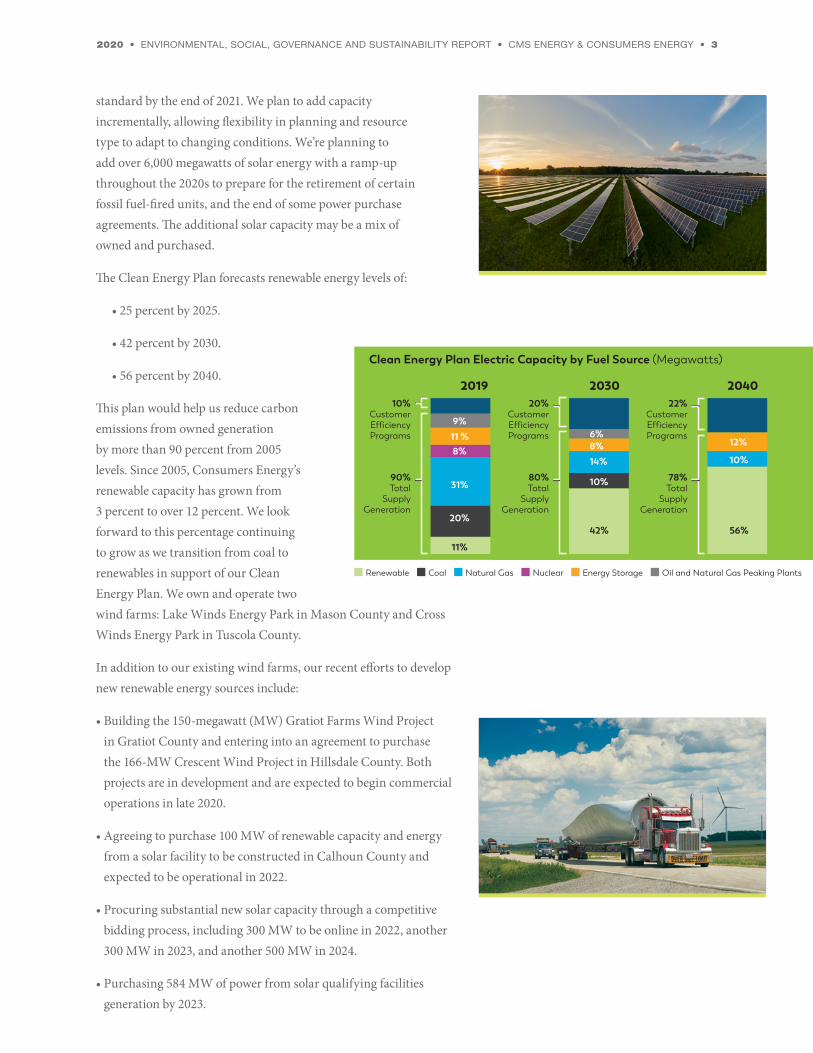
standard by the end of 2021. We plan to add capacity incrementally, allowing flexibility in planning and resource type to adapt to changing conditions. We’re planning to add over 6,000 megawatts of solar energy with a ramp-up throughout the 2020s to prepare for the retirement of certain fossil fuel-fired units, and the end of some power purchase agreements. The additional solar capacity may be a mix of owned and purchased.
The Clean Energy Plan forecasts renewable energy levels of:
• 25 percent by 2025.
• 42 percent by 2030.
• 56 percent by 2040.
This plan would help us reduce carbon emissions from owned generation by more than 90 percent from 2005 levels. Since 2005, Consumers Energy’s renewable capacity has grown from 3 percent to over 12 percent. We look forward to this percentage continuing to grow as we transition from coal to renewables in support of our Clean Energy Plan. We own and operate two wind farms: Lake Winds Energy Park in Mason County and Cross Winds Energy Park in Tuscola County.
In addition to our existing wind farms, our recent efforts to develop new renewable energy sources include:
• Building the 150-megawatt (MW) Gratiot Farms Wind Project in Gratiot County and entering into an agreement to purchase the 166-MW Crescent Wind Project in Hillsdale County. Both projects are in development and are expected to begin commercial operations in late 2020.
• Agreeing to purchase 100 MW of renewable capacity and energy from a solar facility to be constructed in Calhoun County and expected to be operational in 2022.
• Procuring substantial new solar capacity through a competitive bidding process, including 300 MW to be online in 2022, another 300 MW in 2023, and another 500 MW in 2024.
• Purchasing 584 MW of power from solar qualifying facilities generation by 2023.
20%CustomerEfficiencyPrograms
80%Total
SupplyGeneration
22%CustomerEfficiencyPrograms
78%Total
SupplyGeneration
204020302019 10%
CustomerEfficiencyPrograms
90%Total
SupplyGeneration
56%
11%
42%
Nuclear Energy Storage Oil and Natural Gas Peaking PlantsRenewable Coal Natural Gas
10%
20%
31%
8%
11 %
9% 6% 8% 12%
10%
14%
Clean Energy Plan Electric Capacity by Fuel Source (Megawatts)

2020 • ENVIRONMENTAL, SOCIAL, GOVERNANCE AND SUSTAINABILITY REPORT • CMS ENERGY & CONSUMERS ENERGY • 4
• Adding 76 MW of additional wind turbines to our Cross Winds Energy Park in 2019.
• Operating community solar power plants at Grand Valley State and Western Michigan universities that collectively generate up to 4 MW of clean energy; we’ll be adding another half MW to this program in Cadillac in 2021.
• Launching a pilot program to allow businesses to purchase 100 percent clean energy, helping businesses achieve their corporate sustainability goals.
Waste Reduction and Energy Efficiency
Consumers Energy continues its long history of promoting energy waste reduction and energy efficiency. Energy waste reduction is an important part of our efforts to build a more sustainable future for Michigan.
“Reducing energy waste is good for people, the planet and Michigan’s prosperity by saving money for household budgets, reducing carbon emissions and putting people to work,” said Brian Rich, Consumers Energy’s Senior Vice President and Chief Customer Officer.
In 2019, Consumers Energy’s energy waste reduction program helped customers save nearly $600,000 on their energy bills, boosting our total customer savings since 2009 to $3.1 billion and preventing nearly 9 million tons of carbon dioxide emissions. The energy savings delivered in 2019 by our residential programs represents enough savings to supply electricity to 23,000 homes and natural gas to 14,000 homes for a year.
Recognizing these efforts, Consumers Energy received the U.S. Environmental Protection Agency 2019 Energy STAR® Partner of the Year Sustained Excellence Award. Consumers Energy’s Clean Energy Plan also maintains energy waste reduction as a key to reducing the company’s carbon emissions for years to come.
Electric Vehicle Support:
PowerMIDrive Program
In 2019, Consumers Energy launched its PowerMIDrive program, a three-year pilot, to help customers realize the economic and environmental benefits of electric vehicles (EVs) by expanding charging and grid capabilities.
2009
383
137,178
2010 2011 2012 2013 2014 2015 2016 2017 2018
2009 2010 2011 2012 2013 2014 2015 2016 2017 2018
Natural Gas Savings (MMcf)Cumulative Net Realized Savings
Electric Savings (MWh)Cumulative Net Realized Savings
4,134,132
2019
2019
18,865

2020 • ENVIRONMENTAL, SOCIAL, GOVERNANCE AND SUSTAINABILITY REPORT • CMS ENERGY & CONSUMERS ENERGY • 5
Since the program launched, we increased EV charging capabilities and public charging infrastructure across our electric service territory, including:
• Awarding 314 home charger rebates and 120 FleetCarma C2 incentives to residential participants.
• Awarding 85 of a planned 200 public level 2 EV charger rebates.
• Awarding, in a partnership with the Michigan Department of Environment, Great Lakes and Energy (EGLE), 6 of a planned 36 Direct Current Fast Charger rebates, all in different cities.
Consumers Energy also enrolled more than 500 customers in a new time-of-use EV rate, which provides lowering rates for off-peak EV charging. Initial residential load profile data showed this rate’s effectiveness, with 90 percent of charging occurring off-peak on weekdays and over 75 percent off-peak charging on weekends.
Water Use Reduction,
Landfill Waste Reduction
and Land Protections
Consumers Energy has made great strides in reducing its impact on other key parts of the environment, including our water use. For example, we reduced our water use by nearly 50% after retiring seven coal-fired generation units in 2016 known as the Classic Seven.
Also in 2018, Consumers Energy began working toward the following five-year targets:
• Save 1 billion gallons of water.
• Enhance, restore or protect 5,000 acres of land in Michigan.
• Reduce waste sent to landfills by 35 percent.
As of 2019, Consumers Energy made significant progress on each of its goals to protect the environment and reduce carbon footprint:
• Reduced water usage by over 400 million gallons.
• Enhanced, restored, or protected over 2,200 acres of land.
• Reduced the amount of waste taken to landfills by 10 percent.

2020 • ENVIRONMENTAL, SOCIAL, GOVERNANCE AND SUSTAINABILITY REPORT • CMS ENERGY & CONSUMERS ENERGY • 6
SOCIAL
Our Culture
We enable our co-workers to live the values of our company culture: caring, empowered, deliberate, agility and ownership. This includes caring for our co-workers and the communities we serve. In addition to focusing on ESG-related issues in our core business, we leverage our corporate giving initiatives and employee volunteerism to focus on people, planet and prosperity.
Health and Safety
The health and safety of our employees and the public is always a top priority. We have worked hard to improve our safety culture and performance which has resulted in a 70-percent decrease in safety incidents since 2008. Edison Electric Institute (EEI) ranked Consumers Energy in the top quartile for utility standards and safety performance. However, we remain dedicated to our goal of zero safety incidents and have partnered with EEI to develop a new proactive risk-based safety model. The model will allow us to ensure we have controls in place to prevent serious injuries or fatalities. We are also continuing to focus on cyber security and have a dedicated team focused on detecting and responding to threats in close coordination with state and federal partners.
Human Rights
CMS Energy respects human rights. All co-workers are expected to be strong ethical community partners — forming positive relationships wherever we do business. We are committed to valuing and respecting human rights across our operations and to conduct business in a way that leaves a positive impact on people and the communities we serve. Our Human Rights Policy further details our commitment.

2020 • ENVIRONMENTAL, SOCIAL, GOVERNANCE AND SUSTAINABILITY REPORT • CMS ENERGY & CONSUMERS ENERGY • 7
Diversity, Equity & Inclusion
We are committed to creating a world where all people are:
• Respected and included.
• Valued for their unique qualities and abilities.
• Treated fairly.
• Afforded the opportunity to advance.
Realizing this vision requires re-examining our business operations to consider how decisions impact diversity, equity and inclusion (DE&I) for our co-workers, our customers and the communities we serve.
We’re building a world-class, inclusive workforce and customer experience by embedding diversity, equity and inclusion into everything we do. That means deliberately evaluating how we recruit, hire, retain, lead, reward and develop co-workers, empowering all to embody DE&I.
We connect DE&I standards to our corporate values: Caring, Empowered, Deliberate, Agility and Ownership. We make them integral to all we do, from improving the co-worker experience to ensuring alignment and engagement with our customers and suppliers as we equitably support our communities.
These efforts, which recently led Forbes Magazine to name us Best Employer for Women in the utility sector and one of the best employers in Michigan, include:
• Created a virtual safety and inclusion “tailboard” to use before all remote work meetings, reminding co-workers how to keep themselves and their colleagues physically and emotionally safe.
• Established Employee Resource Groups (ERGs) to encourage collaboration, support inclusion and provide community for co-workers who are: women, minorities, LGBTQ+, veterans, differently abled and multi-generational.
• Changed our parental leave policy to allow birthing mothers six months (24 weeks) paid leave, and a four-month (16 weeks) paid leave to a non-birthing parent.
• Appointed Angela Thompkins as Vice President & Chief Diversity Officer to set and monitor our diversity, equity and inclusion (DE&I) strategy.

2020 • ENVIRONMENTAL, SOCIAL, GOVERNANCE AND SUSTAINABILITY REPORT • CMS ENERGY & CONSUMERS ENERGY • 8
We’re also serving as a driving force for good by implementing a holistic DE&I strategy focusing on co-workers, customers, communities and shareholders. Our recent efforts include:
• Donated $100,000 in grants to support the Black Lives Matter movement, fight racism, shape systemic change and create opportunities in Michigan.
• Helped lead efforts to add gender identity and sexual orientation to the list of protected classes under the state’s Elliott-Larsen Civil Rights Act.
• Supported non-discrimination and anti-racism efforts in Jackson, our hometown and the site of our corporate headquarters.
• Committed to increasing supplier diversity and our spending with Michigan-based and minority-owned businesses.
Michigan’s Prosperity
We have taken on several initiatives to grow our local economy and resources. We are committed to improving workforce training in Michigan by aligning education and training resources across the state and by raising awareness of career pathways in the energy industry. We are also supporters and advocates for science, technology, engineering and math education in the state, which is important for Michigan to attract great talent. The Consumers Energy Foundation provides monetary contributions to a variety of educational programs and other programs that support the success of small businesses. Additionally, Consumers Energy is committed to spending $7.5 billion with Michigan-based suppliers over a five-year period that started in June 2019 as part of the Pure Michigan Business Connect initiative. All these efforts, and more, help boost Michigan’s prosperity.
Our COVID-19 Response
The company has taken many steps to protect our co-workers and customers from the spread of COVID-19 and to help those directly affected. In alignment with Centers for Disease Control guidelines and the orders and rules from the State of Michigan, we have changed customer interactions to promote health and safety. We are also equipping our frontline co-workers with appropriate personal protective equipment and adjusting employee policies to provide better support. In addition, we have made emotional well-being of all employees a top priority during this difficult time.
2020 • ENVIRONMENTAL, SOCIAL, GOVERNANCE AND SUSTAINABILITY REPORT • CMS ENERGY & CONSUMERS ENERGY • 9
We’ve also created a $12 million fund to help Michigan residents and small businesses struggling to pay their energy bills due to COVID 19, providing a lifeline to help those in need stay on their feet. Consumers Energy has set a goal to help about 25,000 households and 1,000 small businesses with this new assistance. Learn more here and please see our Emergency Response webpage for additional information.
Consumers Energy Foundation
Since 1990, the Consumers Energy Foundation has provided grants and mobilized volunteers to strengthen local education, social services, the environment and community, economic and cultural development. Since 2009, the Foundation has donated more than $44 million, and Consumers Energy has donated an additional $69 million – for a combined amount of $110 million.
Foundation giving is separate from other company contributions and cannot be used to directly benefit the corporation.
The foundation is funded by company donations not included in customer rates, along with contributions from employee and retirees to support nonprofit organizations across Michigan, to help cultivate sustainable communities. In 2019, the company donated $11.5 million to Michigan nonprofits. This support went to organizations and efforts that help people, protect the planet and promote prosperity:
• People: $6 million
• Planet: $1.3 million
• Prosperity: $4.2 million
As of October 2020, the Foundation gave about $5 million focused on emergency and COVID-19 relief, in addition to the $12 million fund focused specifically on COVID-19 discussed above. Learn more about how our foundation is helping during the pandemic here.
In addition, the spirit of giving goes beyond our corporate donations as Consumers Energy’s president and CEO, Patti Poppe, made a personal commitment during the early days of the COVID-19 pandemic to donate $1 million to help small businesses in the company’s hometown of Jackson, Mich. Poppe and her husband, Eric, made the donation to the Jackson Community Foundation

2020 • ENVIRONMENTAL, SOCIAL, GOVERNANCE AND SUSTAINABILITY REPORT • CMS ENERGY & CONSUMERS ENERGY • 10
to create a separate fund known as the Dream Maker Small Business Emergency Relief Fund. More information is available at www.DreamMakerFund.org.
Volunteerism
Our company has a long history of supporting active co-worker volunteerism in a variety of areas. The company targets key volunteer opportunities that make a difference — in 2019 alone, our co-workers recorded more than 16,000 volunteer hours at 570 Michigan nonprofits. These events included park and waterway cleanups during Earth Month, youth robotics competitions and community and neighborhood revitalization activities.
Governance
CMS Energy and Consumers Energy have multiple levels of sustainability oversight integrated into daily operations. We use several governance and risk-management tools when addressing ESG and sustainability matters. These include oversight by the CMS Energy and Consumers Energy board of directors (board), an enterprise risk management program, and robust strategic and business planning processes.
The board is comprised of directors with experience and knowledge of ESG and sustainability issues and has the highest level of oversight over our ESG and sustainability practices. Review of these practices occurs at the board level by the:
• Audit Committee
• Governance, Sustainability and Public Responsibility Committee
• Compensation and Human Resources Committee
The Audit Committee oversees our enterprise risk management framework, which includes strategic and operational risks, as well as the processes, guidelines and policies for identifying, assessing monitoring and mitigating such risks.
Risk management is embedded into business processes and key decisions at all levels of the company. The Governance Committee is responsible for reviewing and evaluating the composition of the board, recommending board nominees, broadly overseeing the corporate governance and advising and assisting the board on public responsibility and sustainability matters.

2020 • ENVIRONMENTAL, SOCIAL, GOVERNANCE AND SUSTAINABILITY REPORT • CMS ENERGY & CONSUMERS ENERGY • 11
Acknowledging the growing importance of sustainability and climate-related matters, the board in 2018 formally tasked the Governance, Sustainability and Public Responsibility Committee with oversight of sustainability practices by adding this responsibility to its charter. The Compensation Committee is responsible for our executive compensation structure, benefit and compensation plans and critical human resource programs. The committee charters can be found at CMSEnergy.com.
We also have an Environment & Sustainability Council (E&SC), comprised of senior leadership that influences our environmental compliance and sustainability programs and governs decisions that support our commitment to the planet. This includes short- and long-term strategic decisions pertaining to environmental issues including climate and ESG disclosure reporting.
In addition to a robust oversight structure, CMS Energy has an enterprise risk management (ERM) program to ensure risks that may significantly impact the business are known and understood and inform risk-mitigation strategies. The scope, objectives and roles and responsibilities related to the ERM program are included in the company’s corporate risk policy, which is approved by the board’s audit committee. The ERM program covers risks for CMS Energy and its subsidiaries across several areas: strategic, operational, regulatory, environmental, financial, information technology operations and cyber security.
One area addressed through our risk program is the physical impacts of climate change. The company has a cross-functional team to discuss these potential impacts on our assets and how to address those issues in a cost-effective manner.
Strategy and Integration
Internal and external data sources are leveraged as input into our long-term strategic planning. This data is analyzed and synthesized into an update on trends critical to our current and future business. This data influences multiple areas of our strategy including distributed energy resources, wholesale markets, customer energy usage trends and climate policy. This information is used to assess our strategic choices and underlying assumptions. The senior team and board engage with the insights from this work throughout the year to evaluate the strategic choices and test for potential new opportunities or threats.

2020 • ENVIRONMENTAL, SOCIAL, GOVERNANCE AND SUSTAINABILITY REPORT • CMS ENERGY & CONSUMERS ENERGY • 12
Stakeholder Engagement
We spend significant time and effort listening to our customers and key stakeholders before making decisions. Our long-term resource plans and our environmental and sustainability strategies consider people, the planet and prosperity. In 2017 and 2018, for example, we engaged stakeholders in developing our Clean Energy Breakthrough Goals and our Integrated Resource Plan (IRP) filing. This engagement included a series of widely promoted public forums to give stakeholders an opportunity to provide input on our long-term resource plans. These forums were designed as informational and educational sessions with the chance to offer comments and ask questions about topics such as renewable energy, energy efficiency and emerging technology. In 2019, we met with a group of Michigan environmental nonprofit organizations to discuss our progress towards Clean Energy Breakthrough Goals and collect feedback. We are hosting similar stakeholder engagement activities as part of our 2021 IRP development.
We also have an ongoing outreach program to develop and maintain communication with our shareholders. We value these discussions, and the board considers feedback when evaluating corporate governance issues. Management regularly participates in shareholder and industry conferences to discuss performance and ESG topics. Shareholders, co-workers and third parties may contact the board with any inquiry or issue by the methods described on our website. The board will respond as appropriate.
Other Resources
We provide extensive public reporting in disclosures about ESG and sustainability, including our environmental stewardship and long-term strategy. We address these matters in Securities and Exchange Commission, Environmental Protection Agency and other regulatory agency filings, and by voluntarily reporting efforts such as our CDP Climate Report and CDP Water Report. CMS Energy also published a Climate Assessment Report in November 2018.
We continually update and enhance disclosures relating to sustainability efforts on our website and in our Sustainability Report, which provide a better understanding of the breadth and depth of our climate-related planning and practices and can be found here.
2020 • ENVIRONMENTAL, SOCIAL, GOVERNANCE AND SUSTAINABILITY REPORT • CMS ENERGY & CONSUMERS ENERGY • 13
Baseline
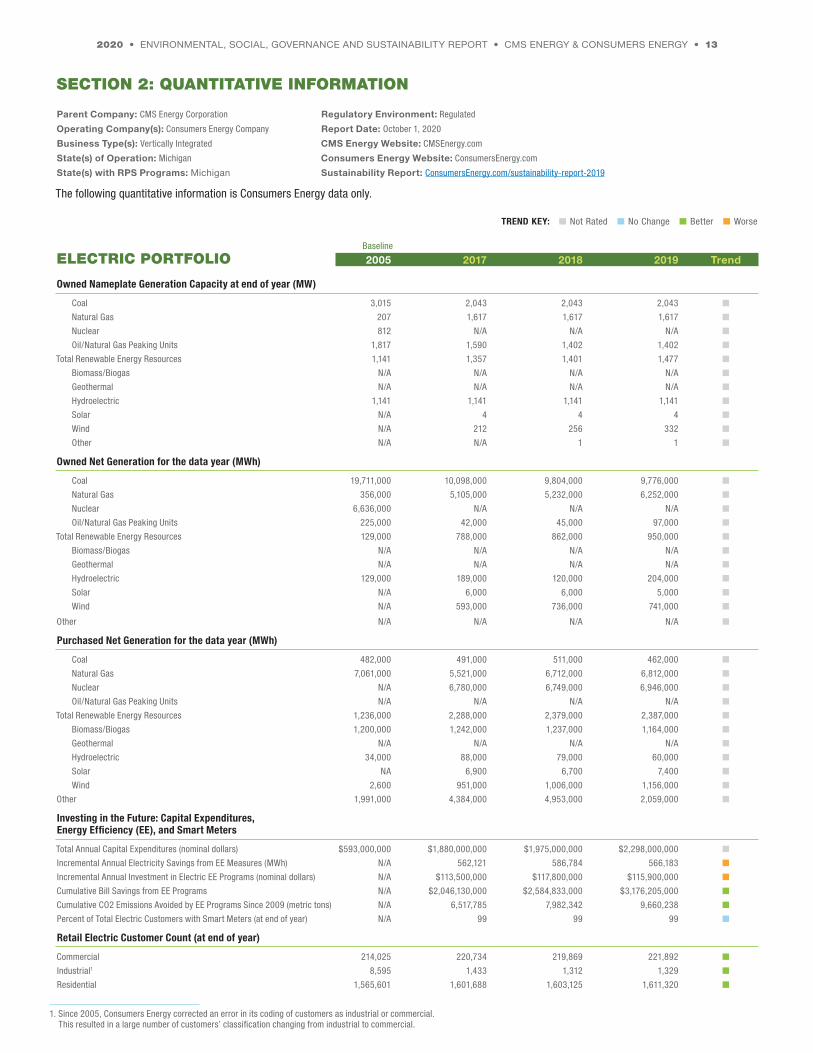
ELECTRIC PORTFOLIO 2005 2017 2018 2019 Trend
Owned Nameplate Generation Capacity at end of year (MW)
Coal 3,015 2,043 2,043 2,043 n
Natural Gas 207 1,617 1,617 1,617 n
Nuclear 812 N/A N/A N/A n
Oil/Natural Gas Peaking Units 1,817 1,590 1,402 1,402 n
Total Renewable Energy Resources 1,141 1,357 1,401 1,477 n
Biomass/Biogas N/A N/A N/A N/A n
Geothermal N/A N/A N/A N/A n
Hydroelectric 1,141 1,141 1,141 1,141 n
Solar N/A 4 4 4 n
Wind N/A 212 256 332 n
Other N/A N/A 1 1 n
Owned Net Generation for the data year (MWh)
Coal 19,711,000 10,098,000 9,804,000 9,776,000 n
Natural Gas 356,000 5,105,000 5,232,000 6,252,000 n
Nuclear 6,636,000 N/A N/A N/A n
Oil/Natural Gas Peaking Units 225,000 42,000 45,000 97,000 n
Total Renewable Energy Resources 129,000 788,000 862,000 950,000 n
Biomass/Biogas N/A N/A N/A N/A n
Geothermal N/A N/A N/A N/A n
Hydroelectric 129,000 189,000 120,000 204,000 n
Solar N/A 6,000 6,000 5,000 n
Wind N/A 593,000 736,000 741,000 n
Other N/A N/A N/A N/A n
Purchased Net Generation for the data year (MWh)
Coal 482,000 491,000 511,000 462,000 n
Natural Gas 7,061,000 5,521,000 6,712,000 6,812,000 n
Nuclear N/A 6,780,000 6,749,000 6,946,000 n
Oil/Natural Gas Peaking Units N/A N/A N/A N/A n
Total Renewable Energy Resources 1,236,000 2,288,000 2,379,000 2,387,000 n
Biomass/Biogas 1,200,000 1,242,000 1,237,000 1,164,000 n
Geothermal N/A N/A N/A N/A n
Hydroelectric 34,000 88,000 79,000 60,000 n
Solar NA 6,900 6,700 7,400 n
Wind 2,600 951,000 1,006,000 1,156,000 n
Other 1,991,000 4,384,000 4,953,000 2,059,000 n
Investing in the Future: Capital Expenditures, Energy Efficiency (EE), and Smart Meters
Total Annual Capital Expenditures (nominal dollars) $593,000,000 $1,880,000,000 $1,975,000,000 $2,298,000,000 n
Incremental Annual Electricity Savings from EE Measures (MWh) N/A 562,121 586,784 566,183 n
Incremental Annual Investment in Electric EE Programs (nominal dollars) N/A $113,500,000 $117,800,000 $115,900,000 n
Cumulative Bill Savings from EE Programs N/A $2,046,130,000 $2,584,833,000 $3,176,205,000 n
Cumulative CO2 Emissions Avoided by EE Programs Since 2009 (metric tons) N/A 6,517,785 7,982,342 9,660,238 n
Percent of Total Electric Customers with Smart Meters (at end of year) N/A 99 99 99 n
Retail Electric Customer Count (at end of year)
Commercial 214,025 220,734 219,869 221,892 n
Industrial1 8,595 1,433 1,312 1,329 n
Residential 1,565,601 1,601,688 1,603,125 1,611,320 n
TREND KEY: n Not Rated n No Change n Better n Worse
Parent Company: CMS Energy Corporation
Operating Company(s): Consumers Energy Company
Business Type(s): Vertically Integrated
State(s) of Operation: Michigan
State(s) with RPS Programs: Michigan
The following quantitative information is Consumers Energy data only.
Regulatory Environment: Regulated
Report Date: October 1, 2020
CMS Energy Website: CMSEnergy.com
Consumers Energy Website: ConsumersEnergy.com
Sustainability Report: ConsumersEnergy.com/sustainability-report-2019
SECTION 2: QUANTITATIVE INFORMATION
1. Since 2005, Consumers Energy corrected an error in its coding of customers as industrial or commercial. This resulted in a large number of customers’ classification changing from industrial to commercial.

2020 • ENVIRONMENTAL, SOCIAL, GOVERNANCE AND SUSTAINABILITY REPORT • CMS ENERGY & CONSUMERS ENERGY • 14
Baseline
EMISSIONS 2005 2017 2018 2019 Trend
GHG Emissions: Carbon Dioxide (CO2) and Carbon Dioxide Equivalent (CO2e)
Owned Generation
Carbon Dioxide (CO2)
Total Owned Generation CO2 Emissions (MT) 20,219,000 12,465,000 12,682,000 12,604,000 n
Total Owned Generation CO2 Emissions Intensity (MT/Net MWh) 0.754 0.775 0.795 0.741 n
Carbon Dioxide Equivalent (CO2e)
Total Owned Generation CO2e Emissions (MT) N/A 12,889,000 12,743,000 12,659,000 n
Total Owned Generation CO2e Emissions Intensity (MT/Net MWh) N/A 0.801 0.799 0.744 n
Purchased Power
Carbon Dioxide (CO2)
Total Purchased Generation CO2 Emissions (MT) 4,999,000 5,548,000 6,373,000 5,121,000 n
Total Purchased Generation CO2 Emissions Intensity (MT/Net MWh) 0.464 0.285 0.299 0.276 n
Carbon Dioxide Equivalent (CO2e)
Total Purchased Generation CO2e Emissions (MT) N/A 5,587,000 6,419,000 5,150,000 n
Total Purchased Generation CO2e Emissions Intensity (MT/Net MWh) N/A 0.287 0.301 0.276 n
Owned Generation + Purchased Power
Carbon Dioxide (CO2)
Total Owned + Purchased Generation CO2 Emissions (MT) 25,218,000 18,013,000 19,055,000 17,725,000 n
Total Owned + Purchased Generation CO2 Emissions Intensity (MT/Net MWh) 0.671 0.507 0.512 0.497 n
Carbon Dioxide Equivalent (CO2e)
Total Owned + Purchased Generation CO2e Emissions (MT) N/A 18,476,000 19,162,000 17,809,000 n
Total Owned + Purchased Generation CO2e Emissions Intensity (MT/Net MWh) N/A 0.520 0.514 0.499 n
Non-Generation CO2e Emissions
Fugitive CO2e emissions of sulfur hexafluoride (MT) N/A 176 2,100 2,533 n
Electric & Gas Scope 1, 2 and 3 Greenhouse Gas Emissions
Carbon Dioxide Equivalent (CO2e)
Scope 1 CO2e emissions (MT) N/A 13,046,000 13,165,000 13,509,000 n
Scope 2 CO2e emissions (MT)1 N/A 380,000 424,000 279,500 n
Scope 3 CO2e emissions (MT)2 N/A 20,216,000 22,780,000 20,574,000 n
Nitrogen Oxide (NOx), Sulfur Dioxide (SO2), Mercury (Hg)
Generation basis for calculation Fossil
Nitrogen Oxide (NOx)
Total NOx Emissions (MT) 28,400 3,900 3,900 4,100 n
Total NOx Emissions Intensity (MT/Net MWh) 1.06E-03 2.44E-04 2.44E-04 2.41E-04 n
Sulfur Dioxide (SO2)
Total SO2 Emissions (MT) 83,600 5,100 5,200 5,700 n
Total SO2 Emissions Intensity (MT/Net MWh) 3.12E-03 3.18E-04 3.29E-04 3.35E-04 n
Mercury (Hg)
Total Hg Emissions (kg) N/A 24 26 33 n
Total Hg Emissions Intensity (kg/Net MWh) N/A 1.47E-06 1.64E-06 1.94E-06 n
TREND KEY: n Not Rated n No Change n Better n Worse
1. The Scope 2 numbers shown here were recently updated to include line losses on the electric distribution system for purchased power. Scope 2 numbers in prior public reports do not reflect this additional analysis.
2. Consumers Energy reports known emissions associated with four Scope 3 categories, including emissions associated with purchased power (i.e., fuel-and-energy related activities not included in scope 1 or 2), combustion of natural gas sold (i.e., use of sold products), business travel and employee commuting.

2020 • ENVIRONMENTAL, SOCIAL, GOVERNANCE AND SUSTAINABILITY REPORT • CMS ENERGY & CONSUMERS ENERGY • 15
Baseline
RESOURCES 2005 2017 2018 2019 Trend
Human Resources
Total Number of Employees 8,114 7,496 8,121 8,253 n
Total Number on Board of Directors/Trustees 12 10 10 12 n
Total Women on Board of Directors/Trustees 1 4 4 5 n
Total Minorities on Board of Directors/Trustees 1 2 2 3 n
Total Females in Senior Leadership N/A N/A 8 9 n
Percent Females in Senior Leadership N/A N/A 30% 32% n
Total Minorities in Senior Leadership N/A N/A 7 6 n
Percent Minorities in Senior Leadership N/A N/A 26% 21% n
Total Females in Management N/A N/A 125 132 n
Percent Females in Management N/A N/A 30% 31% n
Total Minorities in Management N/A N/A 51 53 n
Percent Minorities in Management N/A N/A 12% 12% n
Total Female Employees N/A N/A 2,304 2,342 n
Percent Female Employees N/A N/A 28% 28% n
Total Minority Employees N/A N/A 1,162 1,180 n
Percent Minority N/A N/A 14% 14% n
Total Veteran Employees N/A N/A 699 825 n
Percent Veteran Employees N/A N/A 9% 10% n
Total Disability Status Employees N/A N/A 372 397 n
Percent Disability Status Employees N/A N/A 5% 5% n
Employee Safety Metrics
Recordable Incident Rate 7.01 0.75 1.21 1.23 n
Lost-time Case Rate 2.00 0.11 0.34 0.50 n
Days Away, Restricted, and Transfer (DART) Rate 3.22 0.40 0.75 0.84 n
Work-related Fatalities 1.00 0.00 1.00 0.00 n
Fresh Water Resources
Water Withdrawals - Consumptive (Billions of Liters/Net MWh) N/A 2.94E-07 3.19E-07 3.74E-07 n
Water Withdrawals - Non-Consumptive (Billions of Liters/Net MWh) N/A 7.61E-05 7.74E-05 6.88E-05 n
Waste Products
Amount of Hazardous Waste Manifested for Disposal (tons) N/A 52.1 23.9 23.7 n
Percent of Coal Combustion Products Beneficially Used N/A 10% 13% 15% n
TREND KEY: n Not Rated n No Change n Better n Worse
2020 • ENVIRONMENTAL, SOCIAL, GOVERNANCE AND SUSTAINABILITY REPORT • CMS ENERGY & CONSUMERS ENERGY • 16
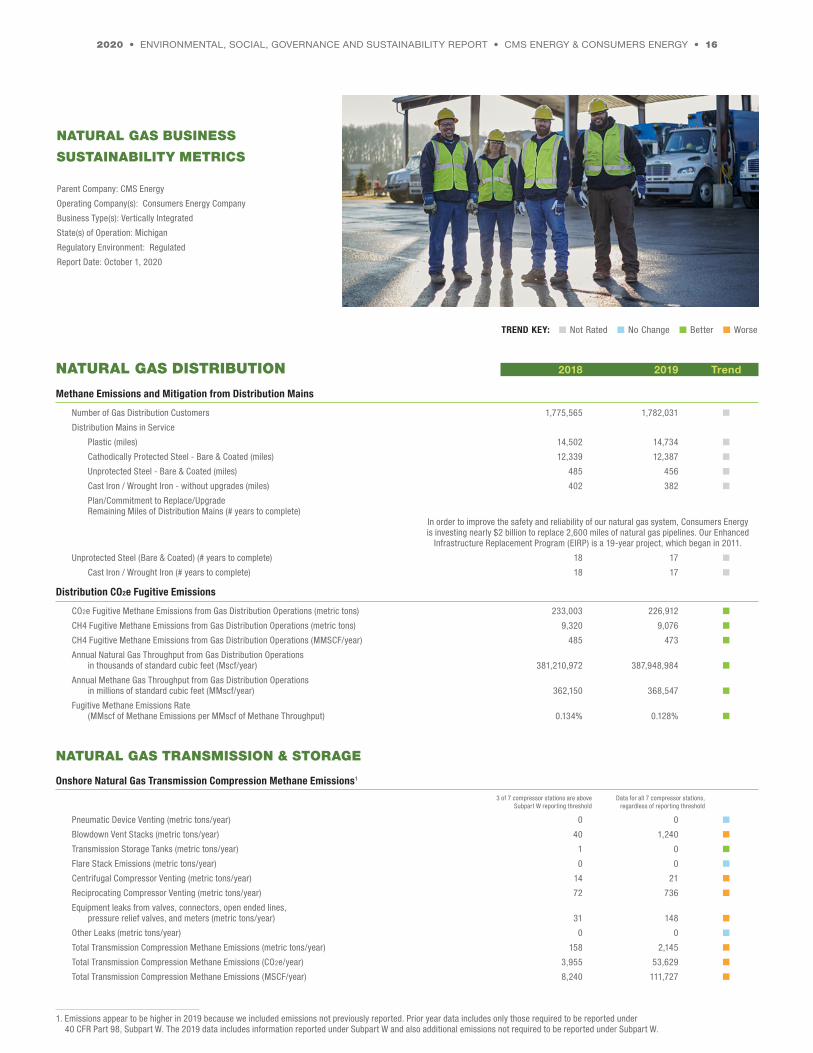
NATURAL GAS DISTRIBUTION 2018 2019 Trend
Methane Emissions and Mitigation from Distribution Mains
Number of Gas Distribution Customers 1,775,565 1,782,031 n
Distribution Mains in Service
Plastic (miles) 14,502 14,734 n
Cathodically Protected Steel - Bare & Coated (miles) 12,339 12,387 n
Unprotected Steel - Bare & Coated (miles) 485 456 n
Cast Iron / Wrought Iron - without upgrades (miles) 402 382 n
Plan/Commitment to Replace/Upgrade Remaining Miles of Distribution Mains (# years to complete) In order to improve the safety and reliability of our natural gas system, Consumers Energy is investing nearly $2 billion to replace 2,600 miles of natural gas pipelines. Our Enhanced Infrastructure Replacement Program (EIRP) is a 19-year project, which began in 2011.
Unprotected Steel (Bare & Coated) (# years to complete) 18 17 n
Cast Iron / Wrought Iron (# years to complete) 18 17 n
Distribution CO2e Fugitive Emissions
CO2e Fugitive Methane Emissions from Gas Distribution Operations (metric tons) 233,003 226,912 n
CH4 Fugitive Methane Emissions from Gas Distribution Operations (metric tons) 9,320 9,076 n
CH4 Fugitive Methane Emissions from Gas Distribution Operations (MMSCF/year) 485 473 n
Annual Natural Gas Throughput from Gas Distribution Operations in thousands of standard cubic feet (Mscf/year) 381,210,972 387,948,984 n
Annual Methane Gas Throughput from Gas Distribution Operations in millions of standard cubic feet (MMscf/year) 362,150 368,547 n
Fugitive Methane Emissions Rate (MMscf of Methane Emissions per MMscf of Methane Throughput) 0.134% 0.128% n
NATURAL GAS TRANSMISSION & STORAGE
Onshore Natural Gas Transmission Compression Methane Emissions1
3 of 7 compressor stations are above Data for all 7 compressor stations, Subpart W reporting threshold regardless of reporting threshold
Pneumatic Device Venting (metric tons/year) 0 0 n
Blowdown Vent Stacks (metric tons/year) 40 1,240 n
Transmission Storage Tanks (metric tons/year) 1 0 n
Flare Stack Emissions (metric tons/year) 0 0 n
Centrifugal Compressor Venting (metric tons/year) 14 21 n
Reciprocating Compressor Venting (metric tons/year) 72 736 n
Equipment leaks from valves, connectors, open ended lines, pressure relief valves, and meters (metric tons/year) 31 148 n
Other Leaks (metric tons/year) 0 0 n
Total Transmission Compression Methane Emissions (metric tons/year) 158 2,145 n
Total Transmission Compression Methane Emissions (CO2e/year) 3,955 53,629 n
Total Transmission Compression Methane Emissions (MSCF/year) 8,240 111,727 n
TREND KEY: n Not Rated n No Change n Better n Worse
NATURAL GAS BUSINESS
SUSTAINABILITY METRICS
Parent Company: CMS Energy
Operating Company(s): Consumers Energy Company
Business Type(s): Vertically Integrated
State(s) of Operation: Michigan
Regulatory Environment: Regulated
Report Date: October 1, 2020
1. Emissions appear to be higher in 2019 because we included emissions not previously reported. Prior year data includes only those required to be reported under 40 CFR Part 98, Subpart W. The 2019 data includes information reported under Subpart W and also additional emissions not required to be reported under Subpart W.

2020 • ENVIRONMENTAL, SOCIAL, GOVERNANCE AND SUSTAINABILITY REPORT • CMS ENERGY & CONSUMERS ENERGY • 17
NATURAL GAS TRANSMISSION AND STORAGE 2018 2019 Trend
Underground Natural Gas Storage Methane Emissions1
Below reporting threshold for Subpart W
Pneumatic Device Venting (metric tons/year) N/A n
Flare Stack Emissions (metric tons/year) N/A n
Centrifugal Compressor Venting (metric tons/year) N/A n
Reciprocating Compressor Venting (metric tons/year) N/A n
Equipment leaks from valves, connectors, open ended lines, pressure relief valves, and meters (metric tons/year) N/A n
Other Equipment Leaks (metric tons/year) N/A n
Equipment leaks from valves, connectors, open-ended lines, and pressure relief valves associated with storage wellheads (metric tons/year) 77.4 n
Other equipment leaks from components associated with storage wellheads (metric tons/year) N/A n
Total Storage Compression Methane Emissions (metric tons/year) 77.4 n
Total Storage Compression Methane Emissions (CO2e/year) 1,935.0 n
Total Storage Compression Methane Emissions (MSCF/year) 4,031.3 n
Onshore Natural Gas Transmission Pipeline Blowdowns1
Below reporting threshold for Subpart W
Transmission Pipeline Blowdown Vent Stacks (metric tons/year) 863 n
Transmission Pipeline Blowdown Vent Stacks (CO2e/year) 21,574 n
Transmission Pipeline Blowdown Vent Stacks (MSCF/year) 44,946 n
Other Non-Sub W Emissions Data
Total Methane Emissions from additional sources not recognized by 40 CFR 98 Subpart W (metric tons/year) N/A 1,287 n
Total Methane Emissions from additional sources not recognized by 40 CFR 98 Subpart W (CO2e/year) N/A 32,172 n
Total Methane Emissions from additional sources not recognized by 40 CFR 98 Subpart W (MSCF/year) N/A 67,024 n
Summary and Metrics1
Total Transmission and Storage Methane Emissions (MMSCF/year) 8 228 n
Annual Natural Gas Throughput from Gas Transmission and Storage Operations (MSCF/year) 293,722,672 543,706,132 n
Annual Methane Gas Throughput from Gas Transmission and Storage Operations (MMSCF/year) 279,037 516,521 n
Fugitive Methane Emissions Rate (MMscf of Methane Emissions per MMscf of Methane Throughput) 0.003% 0.044% n
NATURAL GAS GATHERING AND BOOSTING2
Methane Emissions
Gathering and Boosting Pipelines, Blow Down Volumes, and Emissions N/A N/A n
Total Miles of Gathering Pipeline Operated by gas utility (miles) N/A N/A n
Volume of Gathering Pipeline Blow Down Emissions (scf) N/A N/A n
Gathering Pipeline Blow-Down Emissions outside storage and compression facilities (metric tons CO2e) N/A N/A n
CO2e Combustion Emissions for Gathering and Boosting Compression
CO2e Emissions for Gathering & Boosting Compression Stations (metric tons) N/A N/A n
Conventional Combustion Emissions From Gathering and Boosting Compression N/A N/A n
Emissions reported for all permitted sources (minor or major)
NOx ( metric tons per year) N/A N/A n
VOC (metric tons per year) N/A N/A n
TREND KEY: n Not Rated n No Change n Better n Worse
1. Emissions appear to be higher in 2019 because we included emissions not previously reported. Prior year data includes only those required to be reported under 40 CFR Part 98, Subpart W. The 2019 data includes information reported under Subpart W and also additional emissions not required to be reported under Subpart W.
2. Consumers Energy does not own such facilities, but is including this section in our report to be consistent with other utilities using the same reporting template.

2020 • ENVIRONMENTAL, SOCIAL, GOVERNANCE AND SUSTAINABILITY REPORT • CMS ENERGY & CONSUMERS ENERGY • 18
This report contains “forward-looking statements” which may cause our results to differ materially. All forward-looking statements should be considered in the context of the risk and other factors detailed from time to time in CMS Energy’s and Consumers Energy’s Securities and Exchange Commission (“SEC”) filings. Forward-looking statements should be read in conjunction with “FORWARD-LOOKING STATEMENTS AND INFORMATION” and “RISK FACTORS” sections of our most recent Form 10-K and as updated in other reports we file with the SEC, which can be found on our Regulatory Filings page. CMS Energy and Consumers Energy have no obligation to update or revise forward-looking statements regardless of whether new information, future events, or any other factors affect the information contained in the statements.


