1 Survey Description: The data provided in this report are from 1742 Ontario respondents who participated in an online survey between January 19 th and February 8 th in 2021. Respondents were asked a number of questions about farmland, farmland values, and rental rates for the previous year, 2020. Many respondents did not answer specific questions, so we provide you with the number of responses for each question that we report. A total of 18,910 potential respondents were contacted by email with the support of OFA. The cooperation of OFA and OMAFRA, and the survey respondents, is greatly appreciated. However, any mistakes in the survey should be attributed to the above contact person. When interpreting the results presented in this report, a few issues should be kept in mind. First, respondents were not randomly sampled from each region, and therefore results are not necessarily representative of each region. Instead, results reflect the responses of those who voluntarily answered the survey. We recognize that rental rates and land prices can vary considerably within a region, and for this reason the survey asked questions with the aim of eliciting information about central tendencies – e.g., average cash rent for average quality cropland in a region. Admittedly, respondents’ knowledge of this information varies with respect to accuracy. And importantly, rental rates and farmland values can vary considerably depending on individual parcel characteristics. For this reason, these results will not be useful in assigning a particular rental rate or land value to a specific parcel. It is also important to note that reported results on land values are not derived from actual farm sales or specific rental contracts. At the regional level, we report median values for per-acre rental rates and land prices. In most cases, these median values are close to the mean values. For cases where the median and mean rental rate or price in a region differ considerably, we report the mean in a footnote. ___________________ Additional survey updates will be provided here: www.onfarmlandsurvey.com, and on twitter: @BradyDeatonJr. 2020 Farmland Value and Rental Value Survey Summary of Findings March 2021 Respondent Breakdown Figure 1 below presents the number of survey respondents who classified themselves into the following categories: farmland owner, active farmer, tenant, landlord, farm manager, and ‘other’. We asked respondents to select all applicable categories, and therefore the categories displayed below are not mutually exclusive (ex. approximately 70.9% of respondents who identified themselves as a “farmland owner” also identified themselves as an “active farmer”).
Transcript
1
Survey Description:
The data provided in this report are from 1742 Ontario respondents who participated in an online survey between January 19th and February 8th in 2021. Respondents were asked a number of questions about farmland, farmland values, and rental rates for the previous year, 2020. Many respondents did not answer specific questions, so we provide you with the number of responses for each question that we report.
A total of 18,910 potential respondents were contacted by email with the support of OFA. The cooperation of OFA and OMAFRA, and the survey respondents, is greatly appreciated. However, any mistakes in the survey should be attributed to the above contact person.
When interpreting the results presented in this report, a few issues should be kept in mind. First, respondents were not randomly sampled from each region, and therefore results are not necessarily representative of each region. Instead, results reflect the responses of those who voluntarily answered the survey. We recognize that rental rates and land prices can vary considerably within a region, and for this reason the survey asked questions with the aim of eliciting information about central tendencies – e.g., average cash rent for average quality cropland in a region. Admittedly, respondents’ knowledge of this information varies with respect to accuracy. And importantly, rental rates and farmland values can vary considerably depending on individual parcel characteristics. For this reason, these results will not be useful in assigning a particular rental rate or land value to a specific parcel. It is also important to note that reported results on land values are not derived from actual farm sales or specific rental contracts.
At the regional level, we report median values for per-acre rental rates and land prices. In most cases, these median values are close to the mean values. For cases where the median and mean rental rate or price in a region differ considerably, we report the mean in a footnote.
___________________
Additional survey updates will be provided here: www.onfarmlandsurvey.com, and on twitter: @BradyDeatonJr.
2020 Farmland Value and Rental Value Survey Summary of Findings
March 2021
Respondent Breakdown Figure 1 below presents the number of survey respondents who classified themselves into the following categories: farmland owner, active farmer, tenant, landlord, farm manager, and ‘other’. We asked respondents to select all applicable categories, and therefore the categories displayed below are not mutually exclusive (ex. approximately 70.9% of respondents who identified themselves as a “farmland owner” also identified themselves as an “active farmer”).
2020 Farmland Value Rental Value Survey March 2021
2
Note: Categories with less than 20 responses were bundled into the ‘Other’ category shown above. This included: Assessor (3); Realtor (7); Lender (6); Government employee with a focus on the agricultural sector (5); and ‘other – respondent specified’ (29).
Key Respondent Characteristics
Table 1 below displays summary data for key respondent characteristics, including what they reported about their owned and rented farmland. For each variable we provide the number of responses (n), central tendencies (mean and median), standard deviation, minimum and maximum values.
Table 1: Key Respondent Characteristics
Respondent Characteristic n Mean Median Std. Dev. Min Max
Age
Sex (Male=0, Female=1)
Acres Owned
Acres Rented, Leased, Cropshared or Custom Farmed in
Ratio of Acres Rented, Leased, Cropshared or Custom Farmed in to Acres Owned1
Number of Landlords2
Landlords Require Stipulations (1=yes, 0=no/NA)
1690
1695
1591
797
771
778
1063
61.42
0.15
308.80
351.01
1.59
4.12
0.18
63
0
150
150
0.67
3
0
12.07
0.36
489.80
659.95
4.35
4.40
0.38
23
0
2
1
0.003
1
0
104
1
9000
10,000
93.33
20
1 1This ratio was calculated by dividing acres rented, leased, cropshared or custom farmed in by acres owned for each respondent that reported both owning land and operating land as a tenant. 2A maximum response of ‘20+’ was allowed for this question, and these responses were treated as ‘20’ for the purposes of generating summary statistics.
2020 Farmland Value Rental Value Survey March 2021
3
The following table provides per tillable acre values for median cash rent and median price of farmland in each region surveyed. The survey questions used to elicit these values are identified in the table column headings. Respondents answered these questions for the region that they were most familiar with, and these regions are indicated in the first column of the table.
The final column of the table provides a rent/price ratio for each region, expressed in percentage terms. These rent/price ratios were calculated by taking the median reported cash rental value in each region and dividing it by the median reported price. These ratios are an approximation of net-income divided by property value, which is often referred to as the capitalization rate – or "cap-rate". This measure does not account for a host of important factors (ex. taxes, land appreciation, etc.). Nonetheless, it is useful for comparing and assessing the returns to an asset like farmland. In our survey, the cap-rates appear relatively low compared to historic comparisons in other places (see, for example: http://bit.ly/2nZ9kqO). One long term goal of this survey is to continue to collect this measure over time, in order to compare present information with historic trends.
We only report median rental rates and prices for regions that had more than 10 responses for each. We provide the number of responses used to generate these medians for each region reported (n). For regions with mean rental rates or prices that vary significantly from the medians (a difference of 50% or greater) we report the means in footnotes.
Farmland Rental Rates and Farmland Values by Region
Table 2: Farmland Rental Rates and Farmland Values by Region
Region
Survey Question
Rent/Price Ratio (%)
In 2020, approximately what was the typical (or average) cash rent for
[average quality cropland], per tillable acre, in the
region that you selected? [Median reported]
In 2020, approximately what was the typical (or
average) price, per tillable acre, for average quality cropland in this region?
[Median reported]
Brant (Census Division)
Bruce (County)
Chatham-Kent (Census Division)
Dufferin (County)
Durham (Regional Municipality)
Elgin (County)
Essex (County)
Grey (County)
Haldimand (County)
Huron (County)
Kawartha Lakes (Census Division)
Lambton (County)
$200 (n=24)
$200 (n=47)
$300 (n=45)
$100 (n=18)
$100 (n=18)
$250 (n=41)
$250 (n=37)
$150 (n=38)
$100 (n=18)
$300 (n=65)
$100 (n=20)
$250 (n=48)
$11,000 (n=21)
$10,000 (n=44)
$15,000 (n=54)
$12,000 (n=20)
$11,000 (n=15)
$15,000 (n=37)
$10,000 (n=40)
$10,000 (n=38)
$9,000 (n=18)
$16,000 (n=74)
$10,000 (n=18)
$12,000 (n=59)
1.8%
2.0%
2.0%
0.8%
0.9%
1.7%
2.5%
1.5%
1.1%
1.9%
1.0%
2.1%
2020 Farmland Value Rental Value Survey March 2021
4
Table 2 (Continued): Farmland Rental Rates and Farmland Values by Region
Region
Survey Question
Rent/Price Ratio (%)
In 2020, approximately what was the typical (or average) cash rent for [average quality
cropland], per tillable acre, in the region that you selected? [Median reported]
In 2020, approximately what was the typical (or average) price, per
tillable acre, for average quality cropland in this
region? [Median reported]
Leeds and Grenville (United Counties)1
Lennox and Addington (County)
Middlesex (County)
Niagara (Regional Municipality)2
Norfolk (County)
Northumberland (County)
Ottawa (Census Division)
Oxford (County)
Perth (County)
Peterborough (County)3
Prescott and Russell (United Counties)
Prince Edward (Census Division)
Renfrew (County)
Simcoe (County)
Stormont, Dundas and Glengarry (United Counties)
Waterloo (Regional Municipality)
Wellington (County)
York (Regional Municipality)4
$50 (n=15)
$50 (n=12)
$250 (n=76)
$100 (n=32)
$250 (n=41)
$50 (n=17)
$150 (n=29)
$300 (n=44)
$300 (n=54)
$50 (n=13)
$200 (n=16)
$50 (n=17)
$50 (n=14)
$100 (n=38)
$150 (n=38)
$200 (n=25)
$200 (n=44)
$100 (n=13)
$5,000 (n=16)
$3,400 (n=12)
$18,000 (n=76)
$13,000 (n=47)
$14,000 (n=35)
$7,000 (n=16)
$10,600 (n=31)
$24,500 (n=44)
$20,000 (n=57)
$5,600 (n=16)
$12,000 (n=20)
$7,000 (n=15)
$4,400 (n=22)
$12,000 (n=44)
$12,000 (n=42)
$20,000 (n=27)
$20,000 (n=45)
$17,500 (n=14)
1.0%
1.5%
1.4%
0.8%
1.8%
0.7%
1.4%
1.2%
1.5%
0.9%
1.7%
0.7%
1.1%
0.8%
1.3%
1.0%
1.0%
0.6%
1The mean rent in this region is significantly higher than the median, at approximately $97. The rent/price ratio calculated with this higher mean rent would be 1.9%. 2The mean rent and price in this region are both significantly higher than the median. The mean rent is approximately $231, and the mean price is approximately $19,723. The rent/price ratio calculated with these higher means would be 1.2%. 3The mean rent in this region is significantly higher than the median, at approximately $88. The rent/price ratio calculated with this higher mean rent would be 1.6%. 4The mean price in this region is significantly higher than the median, at approximately $31,971. The rent/price ratio calculated with this higher mean price would be 0.3%.
2020 Farmland Value Rental Value Survey March 2021
5
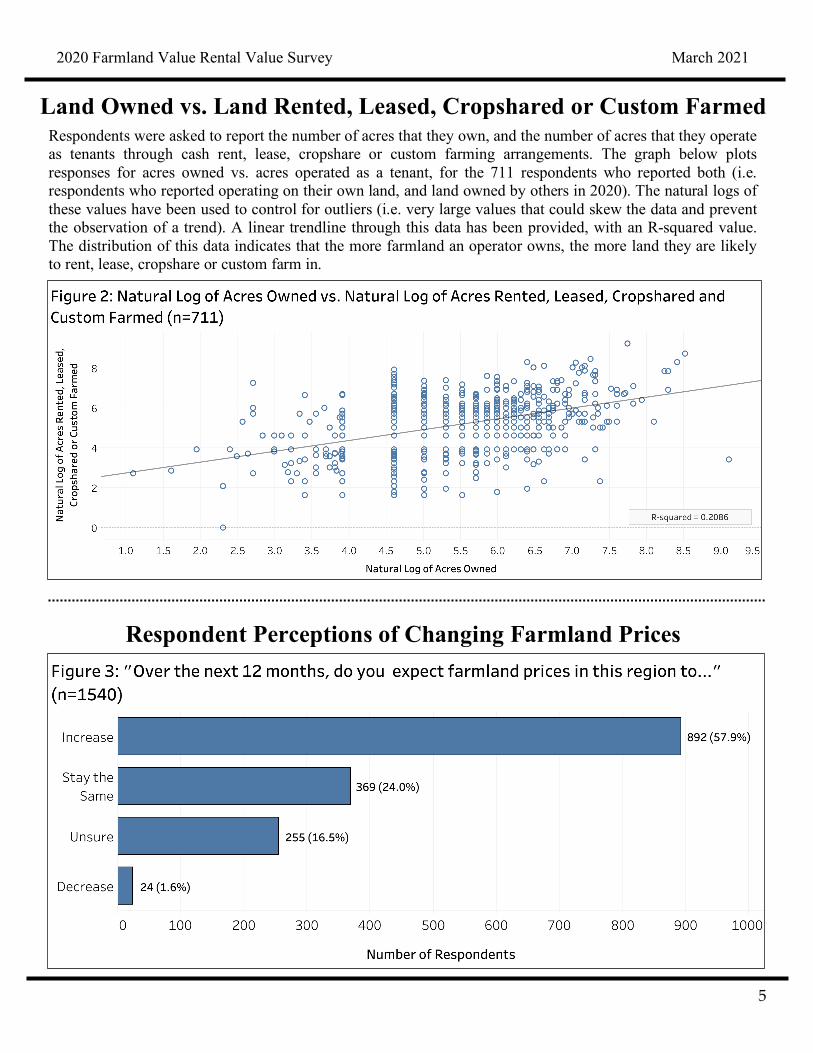
Land Owned vs. Land Rented, Leased, Cropshared or Custom Farmed
Respondent Perceptions of Changing Farmland Prices
Respondents were asked to report the number of acres that they own, and the number of acres that they operate as tenants through cash rent, lease, cropshare or custom farming arrangements. The graph below plots responses for acres owned vs. acres operated as a tenant, for the 711 respondents who reported both (i.e. respondents who reported operating on their own land, and land owned by others in 2020). The natural logs of these values have been used to control for outliers (i.e. very large values that could skew the data and prevent the observation of a trend). A linear trendline through this data has been provided, with an R-squared value. The distribution of this data indicates that the more farmland an operator owns, the more land they are likely to rent, lease, cropshare or custom farm in.
2020 Farmland Value Rental Value Survey March 2021
6
Respondent Perceptions of Farmland Buyers Respondents were asked to report their perception of the percentage of farmland sales in their region that had been made by farmers in the past 12 months. For the overall sample (792 respondents answered this question), the median reported percentage of farmland sales to farmers was 80% (the mean was lower, at approximately 67%). However, there was considerable spatial variation in responses to this question. Table 3 below provides the median reported percentage of farmland sales to farmers in each region surveyed. As with the rent and price data, we only report on regions that had greater than 10 responses to this question, and the number of responses for each region is given in the table (n).
Table 3: “During the past 12 months, approximately what percentage of farmland purchases in [familiar] region were made by farmers?” Region
Perceived Percentage of Farmland Sales Made by Farmers [median reported]
Brant (Census Division)
Bruce (County)
Chatham-Kent (Census Division)
Dufferin (County)
Elgin (County)
Essex (County)
Grey (County)
Huron (County)
Lambton (County)
Leeds and Grenville (United Counties)
Middlesex (County)
Niagara (Regional Municipality)
Norfolk (County)
Northumberland (County)
Ottawa (Census Division)
Oxford (County)
Peel (Regional Municipality)
Perth (County)
Peterborough (County)
Prince Edward (Census Division)
Renfrew (County)
Simcoe (County)
Stormont, Dundas and Glengarry (United Counties)
Wellington (County)
York (Regional Municipality)
82.5% (n=14)
85% (n=27)
90% (n=34)
25% (n=13)
82.5% (n=28)
60% (n=19)
75% (n=33)
90% (n=52)
90% (n=40)
75% (n=11)
75% (n=57)
40% (n=29)
75% (n=21)
55% (n=14)
87.5% (n=20)
90% (n=35)
5% (n=11)
95% (n=50)
30% (n=11)
50% (n=15)
80% (n=15)
50% (n=33)
100% (n=29)
90% (n=26)
0% (n=14)
2020 Farmland Value Rental Value Survey March 2021
7
Respondent Perceptions of the Impact of COVID-19 on Farmland Rents