55
Delivering a Smoke-Free Future 2020 First-Quarter Results April 21, 2020
Delivering a Smoke-Free Future
2020 First-Quarter Results
April 21, 2020
Introduction
• A glossary of key terms and definitions, including the definition for reduced-risk products, or "RRPs," additional heated tobacco unit market data, as well as adjustments, other calculations and reconciliations to the most directly comparable U.S. GAAP measures and our business transformation metrics are at the end of today’s webcast slides, which are posted on our website
• Unless otherwise stated, all references to IQOS are to our IQOS heat-not-burn products
• Comparisons are presented on a "like-for-like" basis reflecting pro forma 2019 results, which have been adjusted for the deconsolidation of our Canadian subsidiary, Rothmans, Benson & Hedges, Inc. (RBH), effective March 22, 2019
2

Forward-Looking and Cautionary Statements
• This presentation and related discussion contain projections of future results and other forward-looking statements. Achievement offuture results is subject to risks, uncertainties and inaccurate assumptions. In the event that risks or uncertainties materialize, orunderlying assumptions prove inaccurate, actual results could vary materially from those contained in such forward-looking statements.Pursuant to the “safe harbor” provisions of the Private Securities Litigation Reform Act of 1995, PMI is identifying important factors that,individually or in the aggregate, could cause actual results and outcomes to differ materially from those contained in any forward-lookingstatements made by PMI
• PMI's business risks include: excise tax increases and discriminatory tax structures; increasing marketing and regulatory restrictions thatcould reduce our competitiveness, eliminate our ability to communicate with adult consumers, or ban certain of our products; healthconcerns relating to the use of tobacco and other nicotine-containing products and exposure to environmental tobacco smoke; litigationrelated to tobacco use; intense competition; the effects of global and individual country economic, regulatory and political developments,natural disasters and conflicts; changes in adult smoker behavior; lost revenues as a result of counterfeiting, contraband and cross-borderpurchases; governmental investigations; unfavorable currency exchange rates and currency devaluations, and limitations on the ability torepatriate funds; adverse changes in applicable corporate tax laws; adverse changes in the cost and quality of tobacco and otheragricultural products and raw materials; and the integrity of its information systems and effectiveness of its data privacy policies. PMI'sfuture profitability may also be adversely affected should it be unsuccessful in its attempts to produce and commercialize reduced-riskproducts or if regulation or taxation do not differentiate between such products and cigarettes; if it is unable to successfully introduce newproducts, promote brand equity, enter new markets or improve its margins through increased prices and productivity gains; if it is unableto expand its brand portfolio internally or through acquisitions and the development of strategic business relationships; or if it is unable toattract and retain the best global talent. Future results are also subject to the lower predictability of our reduced-risk product category'sperformance
• PMI is further subject to other risks detailed from time to time in its publicly filed documents, including those described under Item 1A."Risk Factors" in PMI’s annual report on Form 10-K for the year ended December 31, 2019. PMI cautions that the foregoing list ofimportant factors is not a complete discussion of all potential risks and uncertainties. PMI does not undertake to update any forward-looking statement that it may make from time to time, except in the normal course of its public disclosure obligations
3
Forward-Looking and Cautionary Statements (COVID-19)
• The COVID-19 pandemic has created significant societal and economic disruption, and resulted in closures of stores, factories and offices,and restrictions on manufacturing, distribution and travel, all of which will adversely impact our business, results of operations, cash flowsand financial position during the continuation of the pandemic. Although we have business continuity plans and other safeguards in place,there is no assurance that such plans and safeguards will be effective. While much of the COVID-19 pandemic and its effect on ourbusiness is still unknown, currently, significant risks include our diminished ability to convert adult smokers to our RRPs, significant volumedeclines in our duty-free business and certain other key markets, disruptions or delays in our manufacturing and supply chain, increasedcurrency volatility, and delays in certain cost saving, transformation and restructuring initiatives. Our business could also be adverselyimpacted if key personnel or a significant number of employees or business partners become unavailable due to the COVID-19 outbreak.The significant adverse impact of COVID-19 on the economic or political conditions in markets in which we operate could result in changesto the preferences of our adult consumers, lower demand for our products, particularly for our mid-price or premium-price brands, andincreased illicit trade. Continuation of the pandemic could disrupt our access to the credit markets or increase our borrowing costs.Governments may temporarily be unable to focus on the development of science based regulatory frameworks for the development andcommercialization of RRPs or on the enforcement or implementation of regulations that are significant to our business. In addition,messaging about the potential negative impacts of the use of our products on COVID-19 risks may lead to increasingly restrictiveregulatory measures on the sale and use of our products, negatively impact demand for our products, the willingness of adult consumers toswitch to our RRPs and our efforts to advocate for the development of science-based regulatory frameworks for the development andcommercialization of RRPs
• Despite our efforts to manage these risks, their impact also depends on factors beyond our knowledge or control, including the durationand severity of the outbreak and actions taken to contain its spread and to mitigate its public health effects, and the ultimate economicconsequences thereof
4

5
• Our main focus is the health and wellbeing of our employees, their families and the communities in which we operate
• Implemented policies and measures to protect, support and reassure employees
• Outstanding strength and spirit shown by all our people
• Committed to supporting the wider effort to fight the pandemic, with numerous initiatives ongoing
• Ensuring continuity of supply to our consumers, and supporting commercial partners through these challenging times
Supporting Our Employees and Communities Through the COVID-19 Pandemic

Source: PMI Financials or estimates
Our Business and Organization has Shown Resilience in Challenging Times
• Very strong Q1, 2020, with continued structural growth momentum
• Our business continues to function well:
⎼ Sufficient inventories and consumer access to our products
⎼ Strong balance sheet, liquidity and cash generation
• Restrictions have temporary negative impact on operating environment:
⎼ Main effects on Duty-Free sales, delayed IQOS user acquisition and regulatory price enforcement in Indonesia
• Withdrawing 2020 annual guidance and replacing with quarterly guidance (where visibility is relatively better)
• Confident strong IQOS user acquisition will start to resume as restrictions ease
6

(a) As a percentage of PY combustible tobacco net revenuesNote: For reconciliations to the most directly comparable U.S. GAAP measures for the estimated impact related to COVID-19, refer to slides 41, 43, 45, 47, and 49Source: PMI Financials or estimates 7
Q1, 2020: Strong Start to Year(Variance vs. PY)
Includingestimated impact
related to COVID-19PMI HTU Shipment Volume(billion units) 16.7 (+45%) +0.4PMI Total Shipment Volume(like-for-like) (0.6)% +1.7pp
Net Revenues(ex-currency, like-for-like) +10.0% +2.0pp
Adjusted Diluted EPS(ex-currency, like-for-like) +30.1% +6.8pp
Adjusted OI Margin(ex-currency, like-for-like) +510bps +110bps
Combustible Tobacco Pricing(a)
(like-for-like) +7.7% (0.1)pp
Source: PMI Financials or estimates
IQOSUser Acquisition
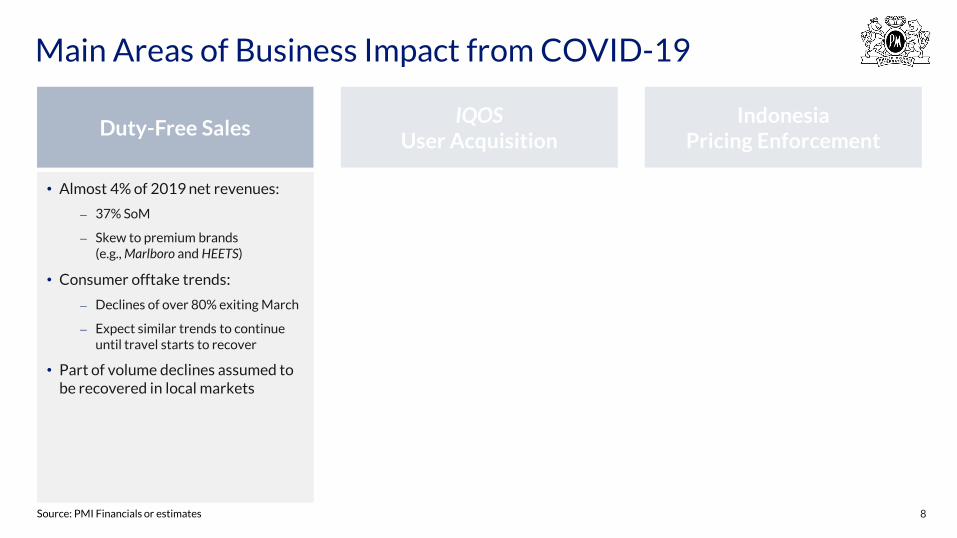
• Almost 4% of 2019 net revenues:
⎼ 37% SoM
⎼ Skew to premium brands (e.g., Marlboro and HEETS)
• Consumer offtake trends:
⎼ Declines of over 80% exiting March
⎼ Expect similar trends to continue until travel starts to recover
• Part of volume declines assumed to be recovered in local markets
Main Areas of Business Impact from COVID-19
8
Duty-Free SalesIndonesia
Pricing Enforcement

Source: PMI Financials or estimates
• Lockdown/restrictive measures hamper ability to engage with adult smokers
• IQOS retail touchpoints closed in a number of markets; footfall significantly down:
⎼ Digital tools and flexible commercial engine allow us to mitigate the impact
• Average user acquisition rate expected to be around 50% lower than previously anticipated (for as long as widespread restrictions continue)
• Expect strong underlying momentum to return as restrictions ease
Main Areas of Business Impact from COVID-19
9
Duty-Free SalesIQOS
User AcquisitionIndonesia
Pricing Enforcement
• Almost 4% of 2019 net revenues:
⎼ 37% SoM
⎼ Skew to premium brands (e.g., Marlboro and HEETS)
• Consumer offtake trends:
⎼ Declines of over 80% exiting March
⎼ Expect similar trends to continue until travel starts to recover
• Part of volume declines assumed to be recovered in local markets

Main Areas of Business Impact from COVID-19
10
IndonesiaPricing Enforcement
• 2020, already an abnormal year of catch-up on excise tax and pricing
• New minimum RSP enforcement delayed until June, due to COVID-19 restrictions
• Prolongs unfavorable price gaps, an added headwind for:
⎼ The risk of down-trading
⎼ The timing of price increases
⎼ Market share
Source: PMI Financials or estimates
Duty-Free SalesIQOS
User Acquisition
• Almost 4% of 2019 net revenues:
⎼ 37% SoM
⎼ Skew to premium brands (e.g., Marlboro and HEETS)
• Consumer offtake trends:
⎼ Declines of over 80% exiting March
⎼ Expect similar trends to continue until travel starts to recover
• Part of volume declines assumed to be recovered in local markets
• Lockdown/restrictive measures hamper ability to engage with adult smokers
• IQOS retail touchpoints closed in a number of markets; footfall significantly down:
⎼ Digital tools and flexible commercial engine allow us to mitigate the impact
• Average user acquisition rate expected to be around 50% lower than previously anticipated (for as long as widespread restrictions continue)
• Expect strong underlying momentum to return as restrictions ease
Source: PMI Financials or estimates
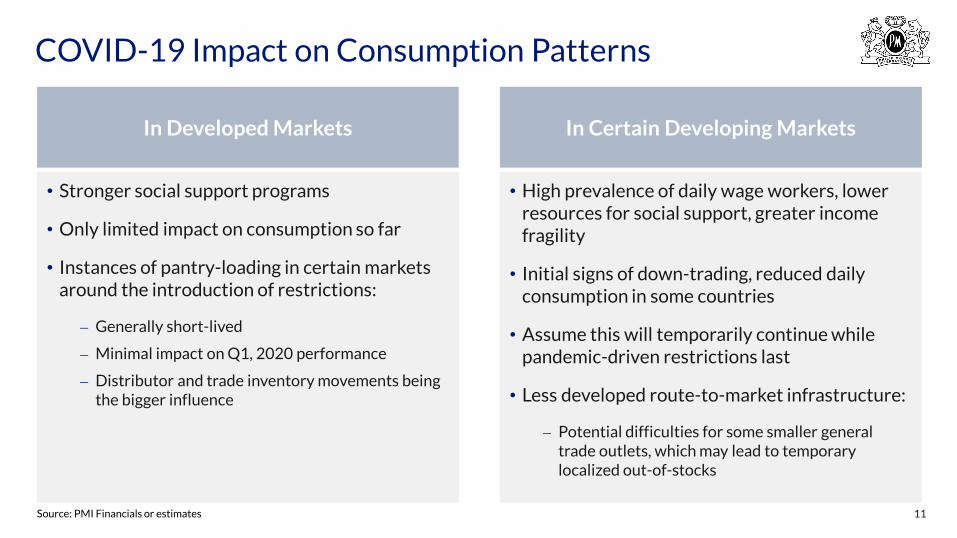
• Stronger social support programs
• Only limited impact on consumption so far
• Instances of pantry-loading in certain markets around the introduction of restrictions:
⎼ Generally short-lived
⎼ Minimal impact on Q1, 2020 performance
⎼ Distributor and trade inventory movements being the bigger influence
COVID-19 Impact on Consumption Patterns
11
In Developed Markets In Certain Developing Markets
• High prevalence of daily wage workers, lower resources for social support, greater income fragility
• Initial signs of down-trading, reduced daily consumption in some countries
• Assume this will temporarily continue while pandemic-driven restrictions last
• Less developed route-to-market infrastructure:
⎼ Potential difficulties for some smaller general trade outlets, which may lead to temporary localized out-of-stocks

Source: PMI Financials or estimates (status on April 21, 2020)
• Implemented contingency measures to ensure continuity of production and customer supply
• Inventories remain healthy, on average:
⎼ >2 months on HTUs
⎼ >3 months on IQOS devices
⎼ >1.5 months on cigarettes
• All HTU factories are currently operating with sufficient capacity
• Around 20% of cigarette production capacity currently affected by temporary shutdowns
• Currently, do not expect any out-of-stocks in major operating income markets
Our Supply Chain and Inventories are Resilient
12
Manufacturing & Distribution Operations Functioning Well

Source: PMI Financials or estimates
• Ample liquidity sources
• Strong balance sheet
• As of March 31, 2020:
⎼ Approximately $3.7 billion in cash and cash equivalents⎼ $1.1 billion of commercial paper (around 30-day average term)⎼ $7.5 billion in stand-by revolving credit facilities⎼ Well-laddered bond portfolio ($0.3 billion of bonds maturing
through end of 2020)⎼ Net debt of 1.9x adjusted EBITDA (12 months rolling)
• Cash outgoings:
⎼ Repaid $3.6 billion in bond maturities in Q1, 2020⎼ Paid around $3.6 billion in dividends to shareholders YTD April⎼ Committed to the dividend
• Further deleveraging, at prevailing exchange rates, may be delayed vs. previous expectations
Strong Liquidity, Balance Sheet and Cost Management
13
Liquidity & Balance Sheet Cost Management
• Our cost efficiency programs continue
• Well on track to deliver over $1 billion in efficiencies by 2021
• Reprioritizing spending plans
• Now forecast 2020 capital expenditures at $0.8 billion (vs. approximately $1.0 billion, previously):
⎼ Reduction unrelated to RRP investments
Source: PMI Financials or estimates
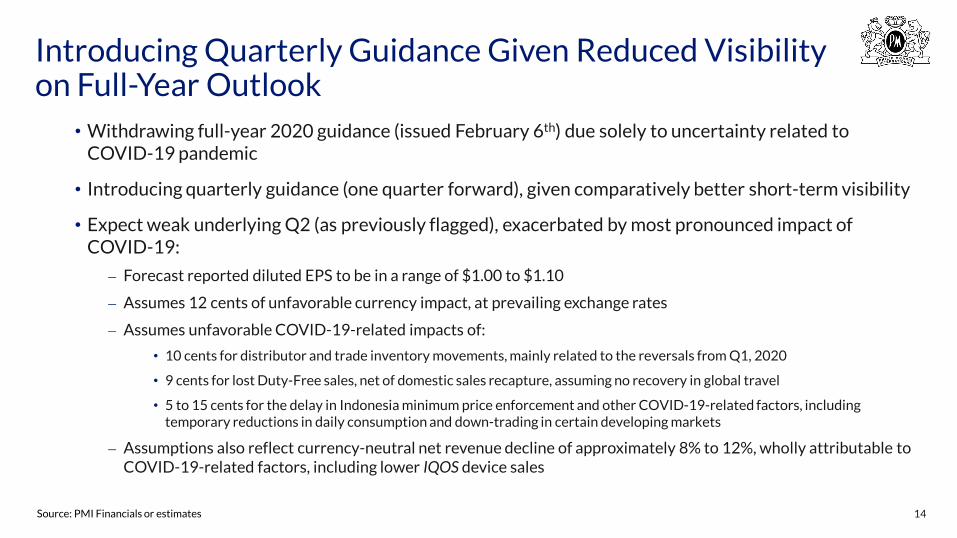
Introducing Quarterly Guidance Given Reduced Visibility on Full-Year Outlook
• Withdrawing full-year 2020 guidance (issued February 6th) due solely to uncertainty related to COVID-19 pandemic
• Introducing quarterly guidance (one quarter forward), given comparatively better short-term visibility
• Expect weak underlying Q2 (as previously flagged), exacerbated by most pronounced impact of COVID-19:
⎼ Forecast reported diluted EPS to be in a range of $1.00 to $1.10
⎼ Assumes 12 cents of unfavorable currency impact, at prevailing exchange rates
⎼ Assumes unfavorable COVID-19-related impacts of:
• 10 cents for distributor and trade inventory movements, mainly related to the reversals from Q1, 2020
• 9 cents for lost Duty-Free sales, net of domestic sales recapture, assuming no recovery in global travel
• 5 to 15 cents for the delay in Indonesia minimum price enforcement and other COVID-19-related factors, including temporary reductions in daily consumption and down-trading in certain developing markets
⎼ Assumptions also reflect currency-neutral net revenue decline of approximately 8% to 12%, wholly attributable to COVID-19-related factors, including lower IQOS device sales
14

15Source: PMI Financials or estimates
164.3 157.0
11.5 16.7
175.8 173.7
Q1, 2019 Q1, 2020
HTUs
Shipments(billion units)
Cigarettes
Q1, 2020: Total PMI Shipment Volume
Total
100
Like-for Like Change vs. PY
45.5%
(3.8)%
(0.6)%
(Shipments)
35.6%
(6.7)%
(3.7)%
(IMS)
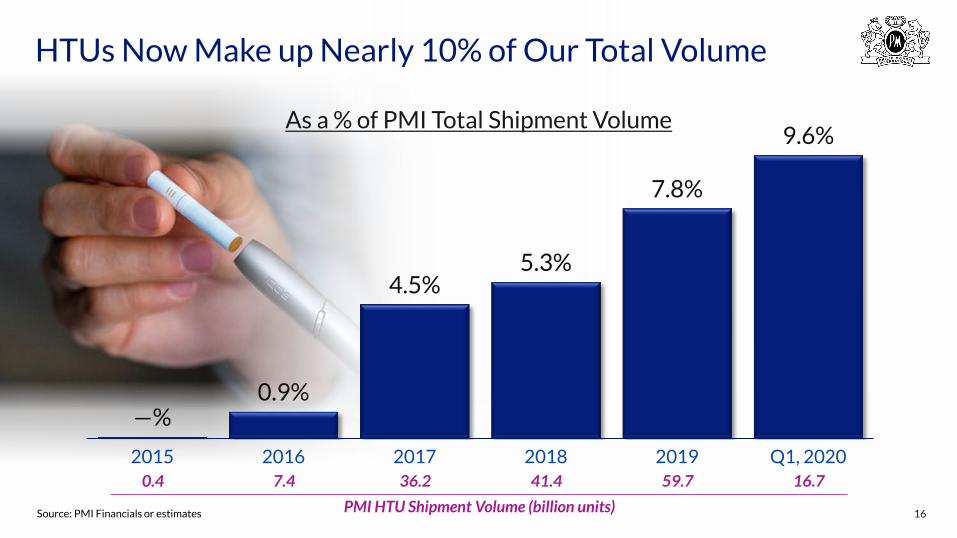
HTUs Now Make up Nearly 10% of Our Total Volume
16Source: PMI Financials or estimates
—%0.9%
4.5%5.3%
7.8%
9.6%
2015 2016 2017 2018 2019 Q1, 2020
As a % of PMI Total Shipment Volume
7.4 59.7
PMI HTU Shipment Volume (billion units)
41.436.20.4 16.7
Source: PMI Financials or estimates
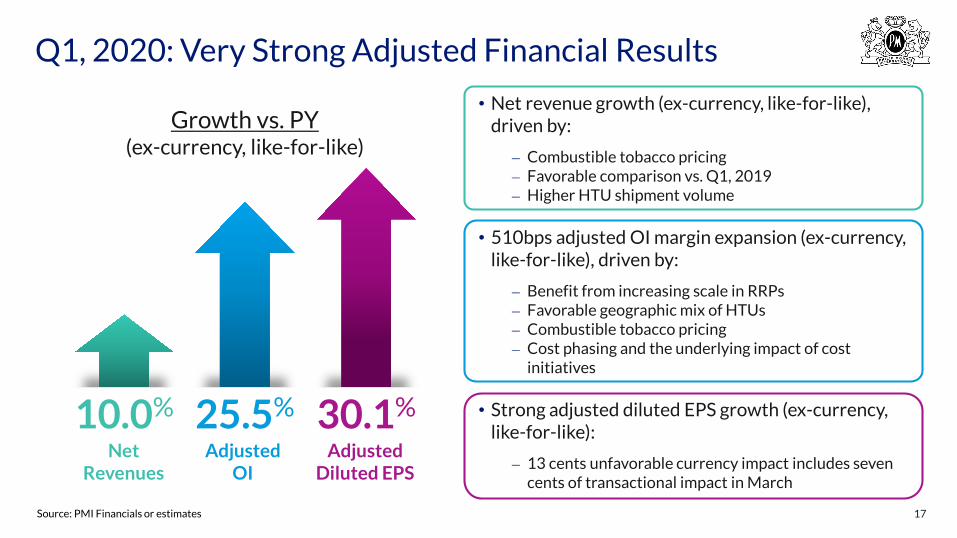
Q1, 2020: Very Strong Adjusted Financial Results
17
• Net revenue growth (ex-currency, like-for-like), driven by:
⎼ Combustible tobacco pricing⎼ Favorable comparison vs. Q1, 2019 ⎼ Higher HTU shipment volume
• 510bps adjusted OI margin expansion (ex-currency, like-for-like), driven by:
⎼ Benefit from increasing scale in RRPs⎼ Favorable geographic mix of HTUs⎼ Combustible tobacco pricing⎼ Cost phasing and the underlying impact of cost
initiatives
• Strong adjusted diluted EPS growth (ex-currency, like-for-like):
⎼ 13 cents unfavorable currency impact includes seven cents of transactional impact in March
Growth vs. PY(ex-currency, like-for-like)
AdjustedDiluted EPS
30.1%
NetRevenues
10.0%
AdjustedOI
25.5%

Strong RRP Net Revenue Growth Continues in Q1, 2020
18Source: PMI Financials or estimates
—% 0.2%2.7%
12.7%13.8%
18.7%
21.7%
2014 2015 2016 2017 2018 2019 Q1, 2020$0.7 $1.6
RRP Net Revenues ($ in billions)
$4.1$3.6$0.1 $5.6
As a % of Total PMI Net Revenues
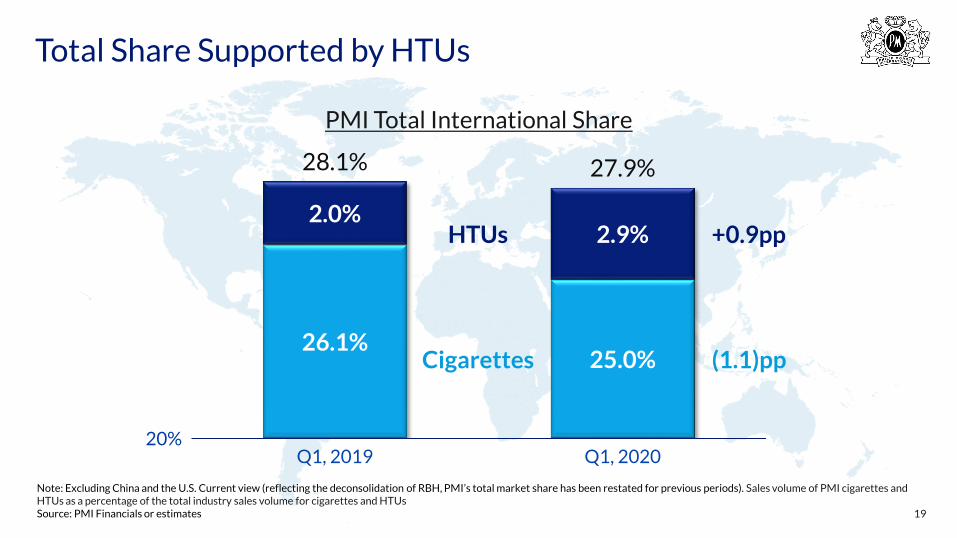
Total Share Supported by HTUs
19
20%
Note: Excluding China and the U.S. Current view (reflecting the deconsolidation of RBH, PMI’s total market share has been restated for previous periods). Sales volume of PMI cigarettes and HTUs as a percentage of the total industry sales volume for cigarettes and HTUsSource: PMI Financials or estimates
HTUs
Cigarettes26.1%
25.0%
2.0%2.9%
28.1% 27.9%
Q1, 2019 Q1, 2020
PMI Total International Share
+0.9pp
(1.1)pp

Indonesia: 2020 Headwinds Exacerbated by COVID-19
20
32.7%30.4%
Q1, 2019 Q1, 2020
PMI Cigarette Share• Cigarette industry volume down by 0.6% in Q1, 2020, reflecting favorable trade inventory movements (likely to reverse in Q2, 2020)
• Pricing taken on all main premium and mid-price brands:
⎼ PMI price increases since October 2019 representing approximately 85% of the weighted-average pass-on of the 2020 excise increase
• PMI share down in Q1, 2020, due to:
⎼ Mid and low-priced brands (wide price gaps vs. super-low manufacturers)
⎼ Partly offset by premium Sampoerna A Mild (reduced price gap vs. directly competitive brands)
Source: PMI Financials or estimates

(a) See Glossary for definitionSource: PMI Financials or estimates, IQOS user panels and PMI Market Research
Q1 Q2 Q3 Q4 Q1 Q2 Q3 Q4 Q13.0
14.6
73%
21
Estimated users who have stopped smoking and switched to IQOS(a)
Estimated users who are in various stages of conversion to IQOS(a)
Total IQOS users(a)
Approaching 15 Million IQOS Users(in millions)
7.6
67%
8.3
67%
8.8
67%
9.6
69%
10.4
70%
11.3
70%
12.3
71%
13.6
71%
2018 2019 2020

Third-Largest Tobacco ‘Brand’ in IQOS Markets
22Note: Excluding the U.S. Reflects sales volume as a percentage of the total industry sales volume for cigarettes and HTUsSource: PMI Financials or estimates
#3
11.6%
6.6%
3.9%
Marlboro(cigarettes)
Winston L&MPMI HTUs Rothmans
Share in IQOS Markets (Q1, 2020)

Source: PMI Financials or estimates
Sequential Performance(vs. Q4, 2019)
SoM: +0.7ppIMS Volume: +13.0%
23
Q1, 2019 Q1, 2020
EU Region: Very Strong HEETS Share Growth
2.1%
3.9%
+1.8pp
Source: PMI Financials or estimates
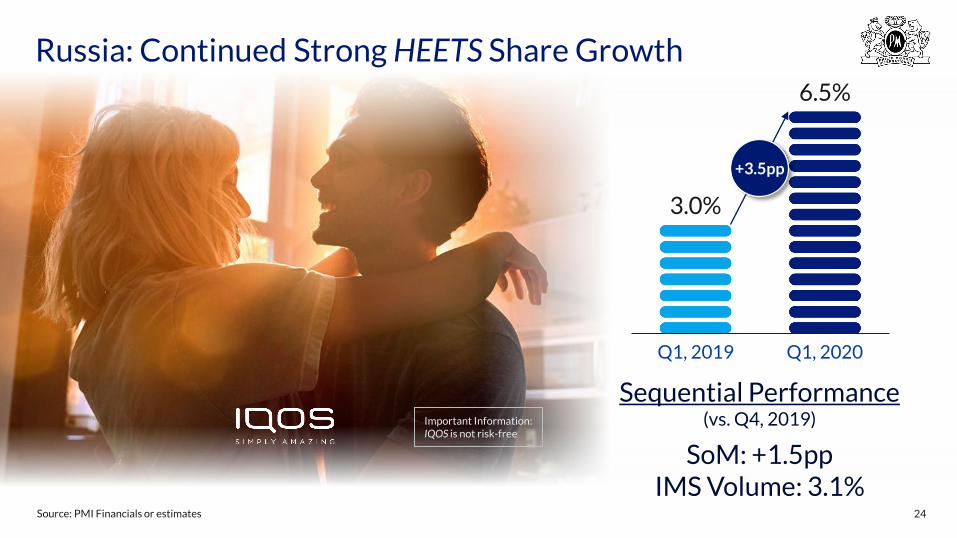
Sequential Performance(vs. Q4, 2019)
SoM: +1.5ppIMS Volume: 3.1%
Russia: Continued Strong HEETS Share Growth
3.0%
6.5%
24
+3.5pp
Q1, 2019 Q1, 2020
Important Information:IQOS is not risk-free

Japan: PMI HTU Share Performance
15.2%
17.0% 16.6%17.1%
19.1%
17.7%
25
2018 2019 2020Q4 Q1 Q2 Q3 Q4 Q1
15.4% 16.6% 16.5% 16.3% 17.1%Adjusted
Total Tobacco SoM(a)
17.7%
(a) Excluding the impact of estimated trade inventory movements, and including the cigarillo category Source: PMI Financials or estimates
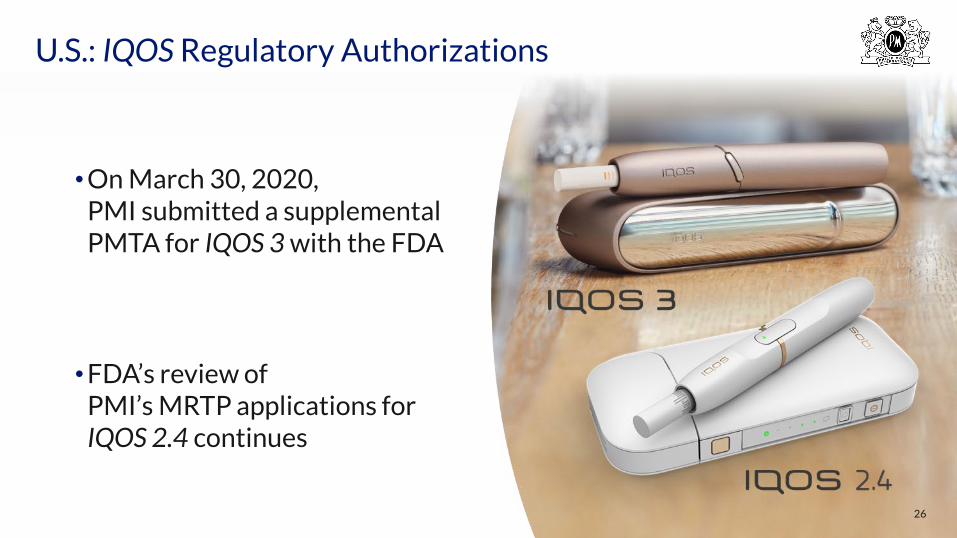
• On March 30, 2020, PMI submitted a supplemental PMTA for IQOS 3 with the FDA
• FDA’s review of PMI’s MRTP applications for IQOS 2.4 continues
U.S.: IQOS Regulatory Authorizations
26

Expect Robust Underlying Trends to Provide Resilience in Highly Uncertain Times
Source: PMI Financials or estimates
• Continued strong underlying business momentum, especially the impressive growth of RRPs
• Remain confident in structural mid-term growth prospects. When headwinds pass, expect to resume growth consistent with targeted 2019-2021 CAGR of:
⎼ ≥5% in net revenues, ex-currency⎼ ≥8% in adjusted diluted EPS, ex-currency
• Strong organization, liquidity and balance sheet
• Strong commitment to our dividend
• Focused on our employees, consumers, shareholders and the Smoke-Free Future
27
Delivering a Smoke-Free Future
2020 First-Quarter Results
Questions & Answers
iOS Download Android DownloadHave you downloaded the PMI Investor Relations App yet?
The free IR App is available to download at the Apple App Store for iOS devices and at Google Play for Android mobile devices
Or go to: www.pmi.com/irapp

Delivering a Smoke-Free Future
2020 First-Quarter Results
April 21, 2020

30
Glossary of Key Terms and Definitions, Appendix, and
Reconciliation of Non-GAAP Measures
Glossary: General Terms • "PMI" refers to Philip Morris International Inc. and its subsidiaries
• Until March 28, 2008, PMI was a wholly owned subsidiary of Altria Group, Inc. ("Altria"). Since that time the company has been independent and is listed on the New York Stock Exchange (ticker symbol "PM")
• "RBH" refers to PMI’s Canadian subsidiary, Rothmans, Benson & Hedges Inc.
• The Companies’ Creditors Arrangement Act (CCAA) is a Canadian federal law that permits a Canadian business to restructure its affairs while carrying on its business in the ordinary course
• Trademarks are italicized
• Comparisons are made to the same prior-year period unless otherwise stated
• Unless otherwise stated, references to total industry, total market, PMI shipment volume and PMI market share performance reflect cigarettes and heated tobacco units
• References to total international market, defined as worldwide cigarette and heated tobacco unit volume excluding the U.S., total industry, total market and market shares are PMI estimates for tax-paid products based on the latest available data from a number of internal and external sources and may, in defined instances, exclude the People's Republic of China and/or PMI's duty free business. In addition, to reflect the deconsolidation of PMI's Canadian subsidiary, Rothmans, Benson & Hedges, Inc. (RBH), effective March 22, 2019, PMI's total market share has been restated for previous periods
• "OTP" is defined as "other tobacco products," primarily roll-your-own and make-your-own cigarettes, pipe tobacco, cigars and cigarillos, and does not include reduced-risk products
• "Combustible products" is the term PMI uses to refer to cigarettes and OTP, combined
• In-market sales, or "IMS," is defined as sales to the retail channel, depending on the market and distribution model
• "Total shipment volume" is defined as the combined total of cigarette shipment volume and heated tobacco unit shipment volume
31
Glossary: General Terms (cont.)• "EU" is defined as the European Union Region
• "EE" is defined as the Eastern Europe Region
• "ME&A" is defined as the Middle East & Africa Region and includes PMI's duty free business
• "S&SA" is defined as the South & Southeast Asia Region
• "EA&A" is defined as the East Asia & Australia Region
• "LA&C" is defined as the Latin America & Canada Region
• Following the deconsolidation of PMI's Canadian subsidiary, Rothmans, Benson & Hedges, Inc. (RBH), PMI will continue to report the volume of brands sold by RBH for which other PMI subsidiaries are the trademark owner. These include HEETS, Next, Philip Morris and Rooftop
• From time to time, PMI’s shipment volumes are subject to the impact of distributor inventory movements, and estimated total industry/market volumes are subject to the impact of inventory movements in various trade channels that include estimated trade inventory movements of PMI’s competitors arising from market-specific factors that significantly distort reported volume disclosures. Such factors may include changes to the manufacturing supply chain, shipment methods, consumer demand, timing of excise tax increases or other influences that may affect the timing of sales to customers. In such instances, in addition to reviewing PMI shipment volumes and certain estimated total industry/market volumes on a reported basis, management reviews these measures on an adjusted basis that excludes the impact of distributor and/or estimated trade inventory movements. Management also believes that disclosing PMI shipment volumes and estimated total industry/market volumes in such circumstances on a basis that excludes the impact of distributor and/or estimated trade inventory movements, such as on an IMS basis, improves the comparability of performance and trends for these measures over different reporting periods
• "Illicit trade" refers to domestic non-tax paid products
• "RSP" stands for retail selling price
• "SoM" stands for share of market
• "SoS" stands for share of segment
32
Glossary: Financial Terms • Net revenues related to combustible products refer to the operating revenues generated from the sale of these products, including shipping
and handling charges billed to customers, net of sales and promotion incentives, and excise taxes. PMI recognizes revenue when control is transferred to the customer, typically either upon shipment or delivery of goods
• Net revenues related to RRPs represent the sale of heated tobacco units, IQOS devices and related accessories, and other nicotine-containing products, primarily e-vapor products, including shipping and handling charges billed to customers, net of sales and promotion incentives, and excise taxes. PMI recognizes revenue when control is transferred to the customer, typically either upon shipment or delivery of goods
• "Adjusted Operating Income (OI) Margin" is calculated as adjusted OI, divided by net revenues
• "Adjusted EBITDA" is defined as earnings before interest, taxes, depreciation, amortization and equity (income)/loss in unconsolidated subsidiaries, excluding asset impairment and exit costs, and unusual items
• "Net debt" is defined as total debt, less cash and cash equivalents
• Management reviews net revenues, OI, OI margins, operating cash flow and earnings per share, or "EPS," on an adjusted basis, which may exclude the impact of currency and other items such as acquisitions, asset impairment and exit costs, tax items and other special items. For example, PMI’s adjusted diluted EPS and other impacted results reflect the loss on deconsolidation of RBH and the Canadian tobacco litigation-related expense, recorded in the first quarter of 2019, and the Russia excise & VAT charge, recorded in the third quarter of 2019. PMI believes that the adjusted measures, including pro forma measures, will provide useful insight into underlying business trends and results, and will provide a more meaningful performance comparison for the period during which RBH remains under CCAA protection. For PMI's 2018 pro forma adjusted diluted EPS by quarter and year-to-date, see Schedule 3 in PMI's first-quarter 2019 earnings release
• "Fair value adjustment for equity security investments" reflects the adjustment resulting from share price movements in passive investments for publicly traded entities that are not controlled or influenced by PMI. Under U.S. GAAP, such adjustments are required, since January 1, 2018, to be reflected directly in the income statement
• The estimated impact from the COVID-19 pandemic primarily reflects management’s estimate for shipments to distributors and tradepartners that have been made solely for the purpose of increasing safety stocks. The impact also includes the estimated reduction of shipments to duty free distributors and trade partners resulting from the pandemic-related decline in international travel
33

Glossary: Reduced-Risk Products• "Reduced-risk products," or "RRPs," is the term PMI uses to refer to products that present, are likely to present, or have the potential to
present less risk of harm to smokers who switch to these products versus continuing smoking. PMI has a range of RRPs in various stages of development, scientific assessment and commercialization. PMI RRPs are smoke-free products that produce an aerosol that contains far lower quantities of harmful and potentially harmful constituents than found in cigarette smoke
• "Aerosol" refers to a gaseous suspension of fine solid particles and/or liquid droplets
• "Combustion" is the process of burning a substance in oxygen, producing heat and often light
• "Smoke" is a visible suspension of solid particles, liquid droplets and gases in air, emitted when a material burns
• "Heated tobacco units," or "HTUs," is the term PMI uses to refer to heated tobacco consumables, which for PMI include the company's HEETS, HEETS Creations, HEETS Marlboro and HEETS FROM MARLBORO, defined collectively as HEETS, as well as Marlboro HeatSticks and Parliament HeatSticks
• The IQOS heat-not-burn device is a precisely controlled heating device into which a specially designed and proprietary tobacco unit is inserted and heated to generate an aerosol
• HTU "offtake volume" represents the estimated retail offtake of HTUs based on a selection of sales channels that vary by market, but notably include retail points of sale and e-commerce platforms
• HTU "offtake share" represents the estimated retail offtake volume of HTUs divided by the sum of estimated total offtake volume for cigarettes and HTUs
• National market share for HTUs is defined as the total sales volume for HTUs as a percentage of the total estimated sales volume for cigarettes and HTUs
• "Total IQOS users" is defined as the estimated number of Legal Age (minimum 18 years) IQOS users that used PMI HTUs for at least 5% of their daily tobacco consumption over the past seven days
• "Converted IQOS Users" is defined as the estimated number of Legal Age (minimum 18 years) IQOS users that used PMI HTUs for over 95% of their daily tobacco consumption over the past seven days
34

Glossary: Reduced-Risk Products (cont.)• "Predominant IQOS Users" is defined as the estimated number of Legal Age (minimum 18 years) IQOS users that used PMI HTUs units for
between 70% and 95% of their daily tobacco consumption over the past seven days
• "Situational IQOS Users" is defined as the estimated number of Legal Age (minimum 18 years) IQOS users that used PMI HTUs for between 5% and less than 70% of their daily tobacco consumption over the past seven days
• "Abandoned IQOS Users" is defined as the estimated number of Legal Age (minimum 18 years) IQOS users that used PMI HTUs for less than 5% of their daily tobacco consumption over the past seven days
• The estimated number of people who have "stopped smoking and switched to IQOS" is defined as: for markets where IQOS is the only heat-not-burn product, daily individual consumption of PMI HTUs represents the totality of their daily tobacco consumption in the past seven days; for markets where IQOS is one among other heat-not-burn products, daily individual consumption of HTUs represents the totality of their daily tobacco consumption in the past seven days, of which at least 70% are PMI HTUs
• "FDA" stands for the U.S. Food & Drug Administration
• "MRTP" stands for Modified Risk Tobacco Product, the term used by the U.S. FDA to refer to RRPs
• "MRTP application" stands for Modified Risk Tobacco Product application under section 911 of the FD&C Act
• "PMTA" stands for Premarket Tobacco Application under section 910 of the FD&C Act
35

Glossary: IQOS in the United States• On April 30, 2019, the U.S. Food and Drug Administration (FDA) announced that the marketing of a version of IQOS, PMI's heat-not-burn
product, together with its heated tobacco units (the term PMI uses to refer to heated tobacco consumables), is appropriate for the protection of public health and authorized it for sale in the U.S. The FDA’s decision follows its comprehensive assessment of PMI’s premarket tobacco product applications (PMTAs) submitted to the Agency in 2017. In the third quarter of 2019, PMI brought a version of its IQOS Platform 1 device and three variants of its heated tobacco units to the U.S. through its license with Altria Group, Inc., whosesubsidiary, Philip Morris USA Inc., is responsible for marketing the product and complying with the provisions set forth in the FDA's marketing order. On March 30, 2020, PMI submitted a supplemental PMTA for the IQOS 3 tobacco heating device with the U.S. Food and Drug Administration
• Shipment volume of heated tobacco units to the U.S. is included in the heated tobacco unit shipment volume of the Latin America & Canada segment. Revenues from shipments of Platform 1 devices, heated tobacco units and accessories to Altria Group, Inc. for sale under license in the U.S. are included in Net Revenues of the Latin America & Canada segment
36
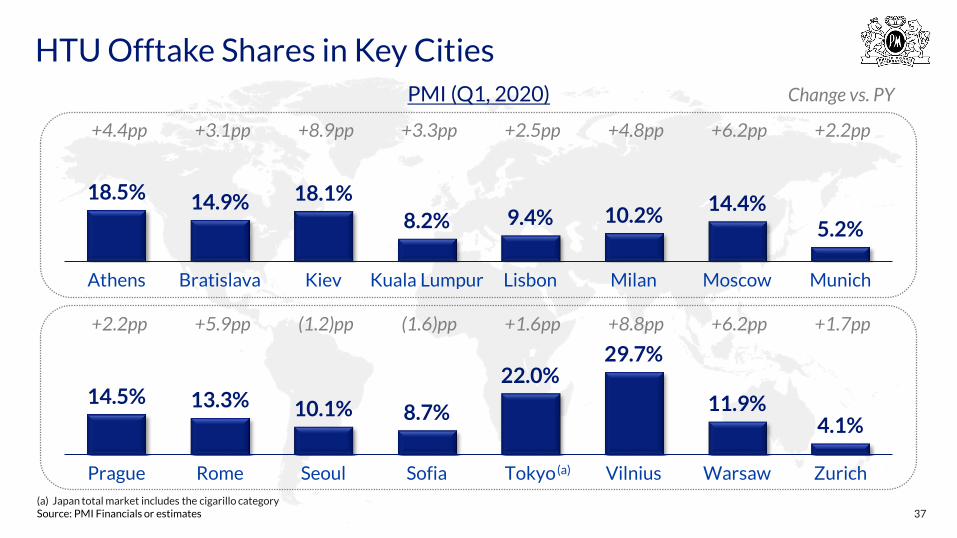
HTU Offtake Shares in Key Cities
37(a) Japan total market includes the cigarillo category Source: PMI Financials or estimates
18.5% 14.9% 18.1%8.2% 9.4% 10.2%
14.4%5.2%
Athens Bratislava Kiev Kuala Lumpur Lisbon Milan Moscow Munich
14.5% 13.3% 10.1% 8.7%
22.0%29.7%
11.9%4.1%
Prague Rome Seoul Sofia Tokyo Vilnius Warsaw Zurich
+4.4pp +3.1pp +8.9pp +3.3pp +2.5pp +4.8pp +2.2pp
+2.2pp +5.9pp (1.2)pp (1.6)pp +1.6pp +8.8pp +1.7pp
PMI (Q1, 2020)
+6.2pp
+6.2pp
Change vs. PY
(a)

EU Region: HEETS SoM Performance in Select Markets
Q1, 2020Growthvs. PY Q1, 2020
Growthvs. PY Q1, 2020
Growthvs. PY
Bulgaria 4.7% (1.0)pp Hungary 7.4% 7.4 pp Portugal 7.5% 2.2 pp
Croatia 4.3 +1.6 Italy 7.4 +3.7 Romania 3.0 +0.5
CzechRepublic 9.4 +4.5 Latvia 10.9 +7.7 Slovak
Republic 9.4 +4.2
Germany 2.4 +1.4 Lithuania 20.7 +8.9 Slovenia 4.7 +2.0
Greece 11.5 +2.8 Poland 4.3 +2.5 Switzerland 3.7 +1.2
Note: Select markets where HEETS share is ≥ 1%Source: PMI Financials or estimates 38

11.7% 11.2%9.6% 9.5% 10.3%
66.2%
62.8%65.1%
67.2%65.5%
Q1 Q2 Q3 Q4 Q1
(a) Excluding the impact of estimated trade inventory movements Source: PMI Financials or estimates
Korea: Sequential Share Performance
39
20192018
8.5%
7.8% 7.8% 7.0% 6.3% 6.7% PMI Adjusted SoS(a)
2019
HEETS SoM
7.3% 7.3%
6.2% 6.3% 6.6%
2020
6.4%
2020
Heated Tobacco Category SoM
Industry Adjusted(a)
Adjusted(a)
Q4 Q1 Q2 Q3 Q4 Q1

40
2015 2016 2017 2018 2019Aspiration(b)
by 2025
R&D expenditure(smoke-free/total) 70% 72% 74% 92% 98%
Commercial expenditure (smoke-free/total) 8% 15% 39% 60% 71%
Net revenues(c)
(smoke-free/total) 0.2% 2.7% 12.7% 13.8% 18.7% 38-42%
Smoke-free product shipment ratio(d)
(smoke-free/total) 0.1% 0.9% 4.4% 5.1% 7.6% >30%
Estimated users who have stopped smoking and switched to IQOS(e) (in millions) n/a 1.5 4.7 6.6 9.7 >40
Shifting Our Resources to Deliver a Smoke-Free Future Business Transformation Metrics(a)
(a) As of December 31, 2019(b) Assuming constant PMI market share. We do not set aspirational targets for R&D and commercial expenditure but we expect both ratios to continue increasing to enable the stated outcome in terms of shipment volume. Note: Aspirational targets do not constitute financial projections(c) Excluding excise taxes. For future periods, at today’s pricing and excise tax assumptions(d) The smoke-free product shipment ratio is computed based on millions of units. Smoke-free products include heated tobacco units and e-cigarettes. Total products include smoke-free products, cigarettes and other combustible products(e) See Glossary for definitionSource: PMI Financials or estimates, IQOS user panels and PMI Market Research

Total PMI
2020 2019 % Change
Total Shipment Volume 173,745 175,795 (1.2)%
Shipment Volume for RBH-owned brands (1,008)
Total Shipment Volume 173,745 174,787 (0.6)%
Estimated impact related to COVID-19 (3,000)
Total Shipment Volume 170,745 174,787 (2.3)%
Total HTU Shipment Volume 16,727 11,498 45.5%
Estimated impact related to COVID-19 (400)
Total HTU Shipment Volume 16,327 11,498 42.0%
Quarters Ended March 31,
41
PHILIP MORRIS INTERNATIONAL INC. and SubsidiariesReconciliation of Non-GAAP Measures
Shipment Volume Adjusted for the Impact of RBH Deconsolidation and COVID-19(in million units) / (Unaudited)
(a) Includes Duty Free sales in Canada(b) Represents volume for RBH-owned brands from January 1, 2019 through March 21, 2019(c) Pro forma(d) Pro forma, excluding COVID-19Note: Shipment Volume includes Cigarettes and Heated Tobacco Units; following the deconsolidation of RBH, we report the volume of brands sold by RBH for which other PMI subsidiaries are the trademark owners
(a) (b)
(c)
(d) (c)
(d)

PHILIP MORRIS INTERNATIONAL INC. and SubsidiariesReconciliation of Non-GAAP Measures
42
Reconciliation of Reported Diluted EPS to Reported Diluted EPS, excluding Currency,and Reconciliation of Reported Diluted EPS to Adjusted Diluted EPS, excluding Currency
(Unaudited)
Quarters Ended March 31,
2020 2019 % Change
Reported Diluted EPS $ 1.17 $ 0.87 34.5%
Less: Currency (0.13)
Reported Diluted EPS, excluding Currency $ 1.30 $ 0.87 49.4%
Quarters Ended March 31, Year Ended
2020 2019 % Change 2019
Reported Diluted EPS $ 1.17 $ 0.87 34.5% $ 4.61
Asset impairment and exit costs - 0.01 0.23
Canadian tobacco litigation-related expense - 0.09 0.09
Loss on deconsolidation of RBH - 0.12 0.12
Russia excise and VAT audit charge - - 0.20
Fair value adjustment for equity security investments 0.04 - (0.02)
Tax items - - (0.04)
Adjusted Diluted EPS $ 1.21 $ 1.09 11.0% $ 5.19
Less: Currency (0.13)
Adjusted Diluted EPS, excluding Currency $ 1.34 $ 1.09 22.9%
PHILIP MORRIS INTERNATIONAL INC. and SubsidiariesReconciliation of Non-GAAP Measures
43
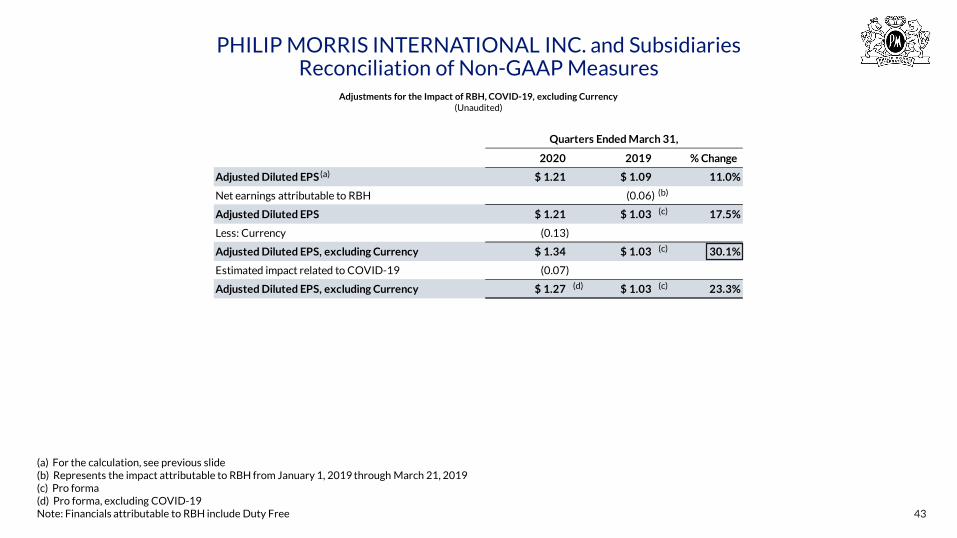
(a) For the calculation, see previous slide(b) Represents the impact attributable to RBH from January 1, 2019 through March 21, 2019(c) Pro forma(d) Pro forma, excluding COVID-19Note: Financials attributable to RBH include Duty Free
Quarters Ended March 31,
2020 2019 % Change
Adjusted Diluted EPS $ 1.21 $ 1.09 11.0%
Net earnings attributable to RBH (0.06)
Adjusted Diluted EPS $ 1.21 $ 1.03 17.5%
Less: Currency (0.13)
Adjusted Diluted EPS, excluding Currency $ 1.34 $ 1.03 30.1%
Estimated impact related to COVID-19 (0.07)
Adjusted Diluted EPS, excluding Currency $ 1.27 $ 1.03 23.3%
(c)
(c)
(a)
(b)
Adjustments for the Impact of RBH, COVID-19, excluding Currency(Unaudited)
(c)(d)
PHILIP MORRIS INTERNATIONAL INC. and SubsidiariesReconciliation of Non-GAAP Measures
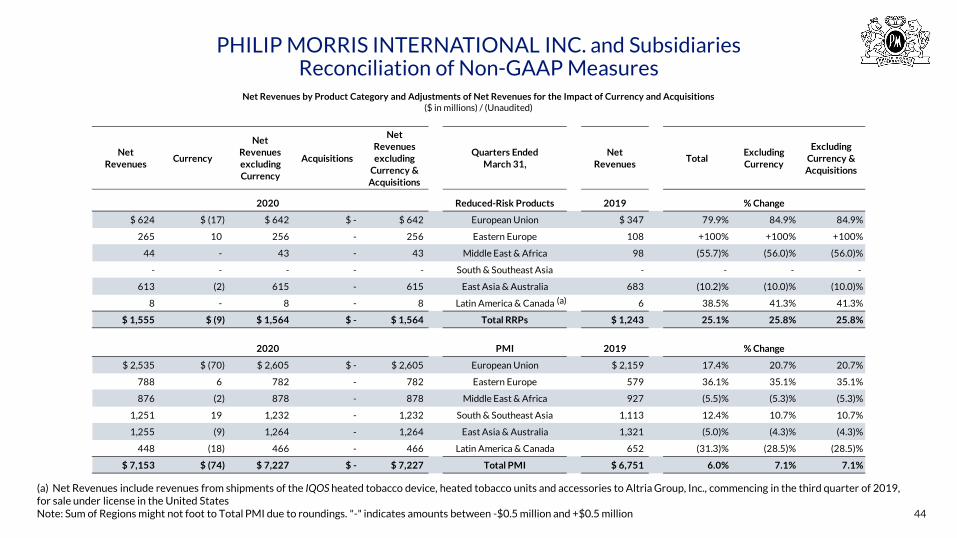
Net Revenues by Product Category and Adjustments of Net Revenues for the Impact of Currency and Acquisitions($ in millions) / (Unaudited)
44
NetRevenues
Currency
NetRevenuesexcluding Currency
Acquisitions
NetRevenues excluding
Currency & Acquisitions
Quarters EndedMarch 31,
NetRevenues
TotalExcluding Currency
Excluding Currency &
Acquisitions
2020 Reduced-Risk Products 2019 % Change
$ 624 $ (17) $ 642 $ - $ 642 European Union $ 347 79.9% 84.9% 84.9%
265 10 256 - 256 Eastern Europe 108 +100% +100% +100%
44 - 43 - 43 Middle East & Africa 98 (55.7)% (56.0)% (56.0)%
- - - - - South & Southeast Asia - - - -
613 (2) 615 - 615 East Asia & Australia 683 (10.2)% (10.0)% (10.0)%
8 - 8 - 8 Latin America & Canada 6 38.5% 41.3% 41.3%
$ 1,555 $ (9) $ 1,564 $ - $ 1,564 Total RRPs $ 1,243 25.1% 25.8% 25.8%
2020 PMI 2019 % Change
$ 2,535 $ (70) $ 2,605 $ - $ 2,605 European Union $ 2,159 17.4% 20.7% 20.7%
788 6 782 - 782 Eastern Europe 579 36.1% 35.1% 35.1%
876 (2) 878 - 878 Middle East & Africa 927 (5.5)% (5.3)% (5.3)%
1,251 19 1,232 - 1,232 South & Southeast Asia 1,113 12.4% 10.7% 10.7%
1,255 (9) 1,264 - 1,264 East Asia & Australia 1,321 (5.0)% (4.3)% (4.3)%
448 (18) 466 - 466 Latin America & Canada 652 (31.3)% (28.5)% (28.5)%
$ 7,153 $ (74) $ 7,227 $ - $ 7,227 Total PMI $ 6,751 6.0% 7.1% 7.1%
(a) Net Revenues include revenues from shipments of the IQOS heated tobacco device, heated tobacco units and accessories to Altria Group, Inc., commencing in the third quarter of 2019, for sale under license in the United StatesNote: Sum of Regions might not foot to Total PMI due to roundings. "-" indicates amounts between -$0.5 million and +$0.5 million
(a)
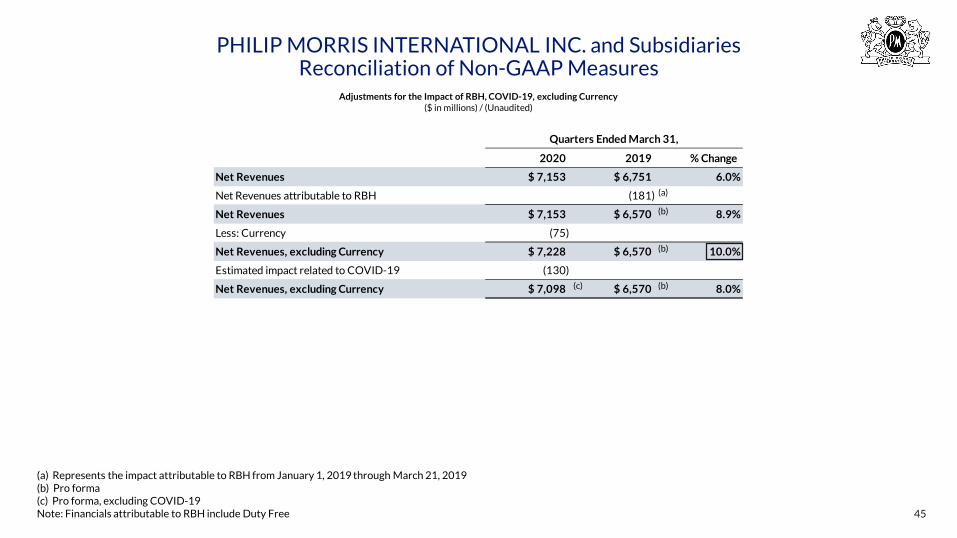
Quarters Ended March 31,
2020 2019 % Change
Net Revenues $ 7,153 $ 6,751 6.0%
Net Revenues attributable to RBH (181)
Net Revenues $ 7,153 $ 6,570 8.9%
Less: Currency (75)
Net Revenues, excluding Currency $ 7,228 $ 6,570 10.0%
Estimated impact related to COVID-19 (130)
Net Revenues, excluding Currency $ 7,098 $ 6,570 8.0%
PHILIP MORRIS INTERNATIONAL INC. and SubsidiariesReconciliation of Non-GAAP Measures
45
Adjustments for the Impact of RBH, COVID-19, excluding Currency($ in millions) / (Unaudited)
(b)
(b)
(a)
(a) Represents the impact attributable to RBH from January 1, 2019 through March 21, 2019(b) Pro forma(c) Pro forma, excluding COVID-19Note: Financials attributable to RBH include Duty Free
(b)(c)

PHILIP MORRIS INTERNATIONAL INC. and SubsidiariesReconciliation of Non-GAAP Measures
Reconciliation of Operating Income to Adjusted Operating Income, excluding Currency and Acquisitions($ in millions) / (Unaudited)
Operating Income
Asset Impairment & Exit Costs
Adjusted Operating
IncomeCurrency
Adjusted Operating
Income excluding Currency
Acqui-sitions
Adjusted Operating
Income excluding Currency& Acqui-
sitions
Operating Income
Asset Impairment& Exit Costs
Adjusted Operating
IncomeTotal
Excluding Currency
Excluding Currency& Acqui-
sitions
2020 2019
$ 1,158 $ - $ 1,158 $ (65) $ 1,223 $ - $ 1,223 European Union $ 896 $ - $ 896 29.2% 36.5% 36.5%
99 - 99 (92) 191 - 191 Eastern Europe 129 - 129 (23.3)% 48.1% 48.1%
321 - 321 (19) 340 - 340 Middle East & Africa 344 - 344 (6.7)% (1.2)% (1.2)%
599 - 599 19 580 - 580 South & Southeast Asia 440 (20) 460 30.2% 26.1% 26.1%
486 - 486 (4) 490 - 490 East Asia & Australia 427 - 427 13.8% 14.8% 14.8%
126 - 126 (35) 161 - 161 Latin America & Canada (186) (433) 247 (49.0)% (34.8)% (34.8)%
$ 2,789 $ - $ 2,789 $ (196) $ 2,985 $ - $ 2,985 Total PMI $ 2,050 $ (453) $ 2,503 11.4% 19.3% 19.3%
% ChangeQuarters Ended
March 31,
46(a) Represents asset impairment and exit costs(b) Includes the Canadian tobacco litigation-related expense ($194 million) and the loss on deconsolidation of RBH ($239 million)
(a)
(b)
PHILIP MORRIS INTERNATIONAL INC. and SubsidiariesReconciliation of Non-GAAP Measures
47
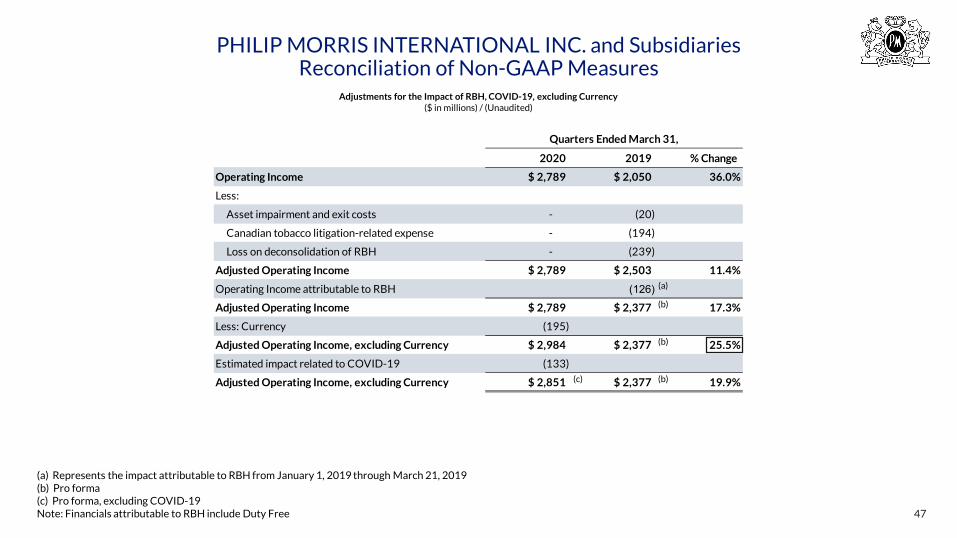
Quarters Ended March 31,
2020 2019 % Change
Operating Income $ 2,789 $ 2,050 36.0%
Less:
Asset impairment and exit costs - (20)
Canadian tobacco litigation-related expense - (194)
Loss on deconsolidation of RBH - (239)
Adjusted Operating Income $ 2,789 $ 2,503 11.4%
Operating Income attributable to RBH (126) Adjusted Operating Income $ 2,789 $ 2,377 17.3%
Less: Currency (195)
Adjusted Operating Income, excluding Currency $ 2,984 $ 2,377 25.5%
Estimated impact related to COVID-19 (133)
Adjusted Operating Income, excluding Currency $ 2,851 $ 2,377 19.9%
(b)
(b)
(a)
(a) Represents the impact attributable to RBH from January 1, 2019 through March 21, 2019(b) Pro forma(c) Pro forma, excluding COVID-19Note: Financials attributable to RBH include Duty Free
Adjustments for the Impact of RBH, COVID-19, excluding Currency($ in millions) / (Unaudited)
(b)(c)

PHILIP MORRIS INTERNATIONAL INC. and SubsidiariesReconciliation of Non-GAAP Measures
Reconciliation of Adjusted Operating Income Margin, excluding Currency and Acquisitions($ in millions) / (Unaudited)
48(a) For the calculation of Adjusted Operating Income and Adjusted Operating Income excluding currency and acquisitions refer to slide 46(b) For the calculation of Net Revenues excluding currency and acquisitions refer to slide 44
Adjusted Operating
Income(a)
Net Revenues
Adjusted Operating
IncomeMargin
Adjusted Operating
Incomeexcluding Currency
(a)
Net Revenues excluding Currency
(b)
Adjusted Operating
Income Margin
excluding Currency
Adjusted Operating
Income excluding Currency & Acqui-
sitions (a)
Net Revenues excluding Currency & Acqui-
sitions (b)
Adjusted Operating
Income Margin
excluding Currency & Acqui-
sitions
Adjusted Operating
Income(a)
NetRevenues
Adjusted Operating
IncomeMargin
Adjusted Operating
IncomeMargin
Adjusted Operating
Income Margin
excluding Currency
Adjusted Operating
Income Margin
excluding Currency & Acqui-
sitions
2020 2019 % Points Change
$ 1,158 $ 2,535 45.7% $ 1,223 $ 2,605 46.9% $ 1,223 $ 2,605 46.9% European Union $ 896 $ 2,159 41.5% 4.2 5.4 5.4
99 788 12.6% 191 782 24.4% 191 782 24.4% Eastern Europe 129 579 22.3% (9.7) 2.1 2.1
321 876 36.6% 340 878 38.7% 340 878 38.7% Middle East & Africa 344 927 37.1% (0.5) 1.6 1.6
599 1,251 47.9% 580 1,232 47.1% 580 1,232 47.1% South & Southeast Asia 460 1,113 41.3% 6.6 5.8 5.8
486 1,255 38.7% 490 1,264 38.8% 490 1,264 38.8% East Asia & Australia 427 1,321 32.3% 6.4 6.5 6.5
126 448 28.1% 161 466 34.5% 161 466 34.5% Latin America & Canada 247 652 37.9% (9.8) (3.4) (3.4)
$ 2,789 $ 7,153 39.0% $ 2,985 $ 7,227 41.3% $ 2,985 $ 7,227 41.3% Total PMI $ 2,503 $ 6,751 37.1% 1.9 4.2 4.2
Quarters EndedMarch 31,
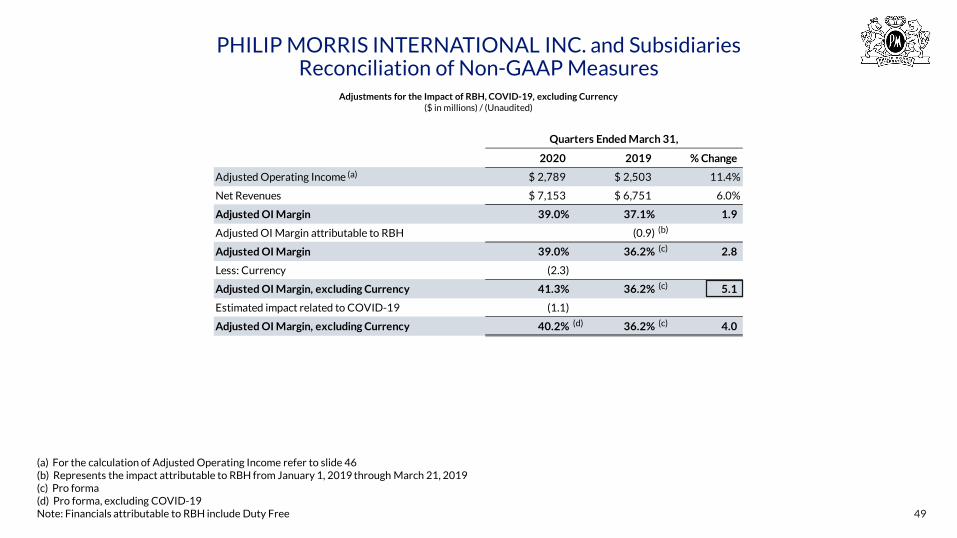
Quarters Ended March 31,
2020 2019 % Change
Adjusted Operating Income $ 2,789 $ 2,503 11.4%
Net Revenues $ 7,153 $ 6,751 6.0%
Adjusted OI Margin 39.0% 37.1% 1.9
Adjusted OI Margin attributable to RBH (0.9)
Adjusted OI Margin 39.0% 36.2% 2.8
Less: Currency (2.3)
Adjusted OI Margin, excluding Currency 41.3% 36.2% 5.1
Estimated impact related to COVID-19 (1.1)
Adjusted OI Margin, excluding Currency 40.2% 36.2% 4.0
PHILIP MORRIS INTERNATIONAL INC. and SubsidiariesReconciliation of Non-GAAP Measures
49
(b)
(c)
(c)
(a) For the calculation of Adjusted Operating Income refer to slide 46(b) Represents the impact attributable to RBH from January 1, 2019 through March 21, 2019(c) Pro forma(d) Pro forma, excluding COVID-19Note: Financials attributable to RBH include Duty Free
(a)
(c)(d)
Adjustments for the Impact of RBH, COVID-19, excluding Currency($ in millions) / (Unaudited)

PHILIP MORRIS INTERNATIONAL INC. and SubsidiariesReconciliation of Non-GAAP Measures
50(a) For the period April to December 2019, Others include the Russia excise and VAT charge ($374 million). For the year ended December 31, 2019, Others include the Canadian tobacco litigation-related expense ($194 million), the loss on deconsolidation of RBH ($239 million) and the Russia excise and VAT audit charge ($374 million)
Calculation of Total Debt to Adjusted EBITDA and Net Debt to Adjusted EBITDA Ratios($ in millions, except ratios) / (Unaudited)
April ~ December January ~ March 12 months2019 2020 rolling
Net Earnings $ 6,264 $ 1,987 $ 8,251 $ 7,728
Equity investments and securities (income)/loss, net (138) 54 (84) (149)
Provision for income taxes 1,869 596 2,465 2,293
Interest expense, net 418 129 547 570
Depreciation and amortization 724 241 965 964
Asset impairment and exit costs and Others 776 - 776 1,229
Adjusted EBITDA $ 9,913 $ 3,007 $ 12,920 $ 12,635
March 31, December 31,2020 2019
Short-term borrowings $ 1,438 $ 338
Current portion of long-term debt 1,933 4,051
Long-term debt 24,999 26,656
Total Debt $ 28,370 $ 31,045
Cash and cash equivalents 3,746 6,861
Net Debt $ 24,624 $ 24,184
Ratios:
Total Debt to Adjusted EBITDA 2.20 2.46
Net Debt to Adjusted EBITDA 1.91 1.91
Year Ended December 31,
2019
Year Ended March 31, 2020
(a)
PHILIP MORRIS INTERNATIONAL INC. and SubsidiariesReconciliation of Non-GAAP Measures
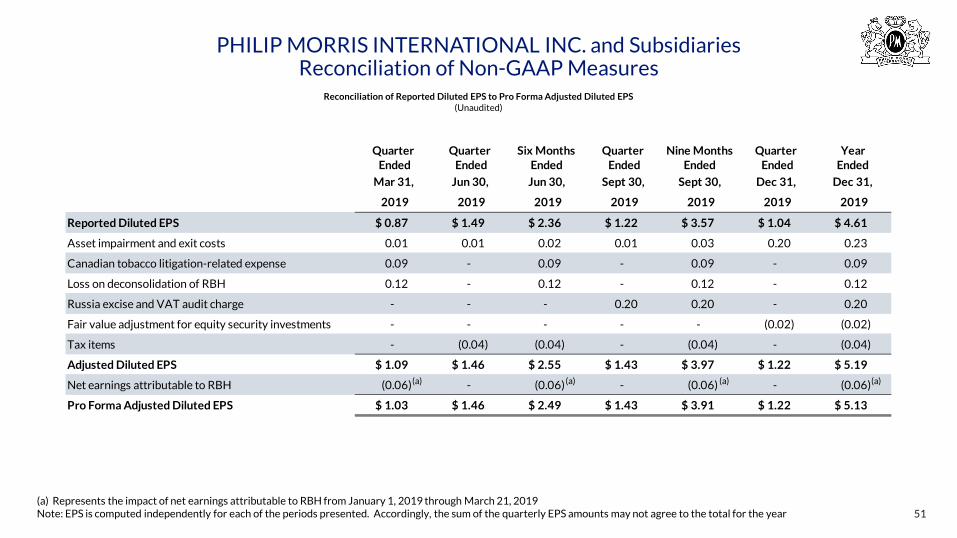
Reconciliation of Reported Diluted EPS to Pro Forma Adjusted Diluted EPS(Unaudited)
(a) Represents the impact of net earnings attributable to RBH from January 1, 2019 through March 21, 2019Note: EPS is computed independently for each of the periods presented. Accordingly, the sum of the quarterly EPS amounts may not agree to the total for the year
Reported Diluted EPS $ 0.87 $ 1.49 $ 2.36 $ 1.22 $ 3.57 $ 1.04 $ 4.61
Asset impairment and exit costs 0.01 0.01 0.02 0.01 0.03 0.20 0.23
Canadian tobacco litigation-related expense 0.09 - 0.09 - 0.09 - 0.09
Loss on deconsolidation of RBH 0.12 - 0.12 - 0.12 - 0.12
Russia excise and VAT audit charge - - - 0.20 0.20 - 0.20
Fair value adjustment for equity security investments - - - - - (0.02) (0.02)
Tax items - (0.04) (0.04) - (0.04) - (0.04)
Adjusted Diluted EPS $ 1.09 $ 1.46 $ 2.55 $ 1.43 $ 3.97 $ 1.22 $ 5.19
Net earnings attributable to RBH (0.06) - (0.06) - (0.06) - (0.06)
Pro Forma Adjusted Diluted EPS $ 1.03 $ 1.46 $ 2.49 $ 1.43 $ 3.91 $ 1.22 $ 5.13
Quarter Ended
Dec 31,
2019
Year Ended
Dec 31,
2019
Nine Months Ended
Sept 30,
2019 2019
Quarter Ended
Mar 31,
Quarter Ended
Jun 30,
2019
Six Months Ended
Jun 30,
2019
Quarter Ended
Sept 30,
2019
(a) (a) (a) (a)
51

PHILIP MORRIS INTERNATIONAL INC. and SubsidiariesReconciliation of Non-GAAP Measures
Net Revenues by Product Category and Adjustments of Net Revenues for the Impact of Currency and Acquisitions($ in millions) / (Unaudited)
52
NetRevenues
Currency
NetRevenuesexcluding Currency
Acquisitions
NetRevenues excluding
Currency & Acquisitions
Years EndedDecember 31,
NetRevenues
TotalExcluding Currency
Excluding Currency &
Acquisitions
2019 Reduced-Risk Products 2018 % Change
$ 1,724 $ (98) $ 1,822 $ - $ 1,822 European Union $ 865 99.2% +100% +100%
844 (19) 864 - 864 Eastern Europe 324 +100% +100% +100%
321 (1) 322 - 322 Middle East & Africa 382 (15.8)% (15.7)% (15.7)%
- - - - - South & Southeast Asia - - - -
2,671 13 2,658 - 2,658 East Asia & Australia 2,506 6.6% 6.0% 6.0%
27 (1) 28 - 28 Latin America & Canada 19 41.9% 49.9% 49.9%
$ 5,587 $ (106) $ 5,693 $ - $ 5,693 Total RRPs $ 4,096 36.4% 39.0% 39.0%
2019 PMI 2018 % Change
$ 9,817 $ (563) $ 10,380 $ - $ 10,380 European Union $ 9,298 5.6% 11.6% 11.6%
3,282 (108) 3,390 - 3,390 Eastern Europe 2,921 12.4% 16.1% 16.1%
4,042 (162) 4,204 - 4,204 Middle East & Africa 4,114 (1.8)% 2.2% 2.2%
5,094 (10) 5,104 - 5,104 South & Southeast Asia 4,656 9.4% 9.6% 9.6%
5,364 (26) 5,390 - 5,390 East Asia & Australia 5,580 (3.9)% (3.4)% (3.4)%
2,206 (68) 2,274 - 2,274 Latin America & Canada 3,056 (27.8)% (25.6)% (25.6)%
$ 29,805 $ (937) $ 30,742 $ - $ 30,742 Total PMI $ 29,625 0.6% 3.8% 3.8%
(a)
(a) Net Revenues include revenues from shipments of the IQOS heated tobacco device, heated tobacco units and accessories to Altria Group, Inc., commencing in the third quarter of 2019, for sale under license in the United StatesNote: Sum of Regions might not foot to Total PMI due to roundings. "-" indicates amounts between -$0.5 million and +$0.5 million

PHILIP MORRIS INTERNATIONAL INC. and SubsidiariesReconciliation of Non-GAAP Measures
Net Revenues by Product Category and Adjustments of Net Revenues for the Impact of Currency and Acquisitions($ in millions) / (Unaudited)
53Note: Sum of Regions might not foot to Total PMI due to roundings. "-" indicates amounts between -$0.5 million and +$0.5 million
NetRevenues
Currency
NetRevenuesexcluding Currency
Acquisitions
NetRevenues excluding
Currency & Acquisitions
Years EndedDecember 31,
NetRevenues
TotalExcluding Currency
Excluding Currency &
Acquisitions
2017 Reduced-Risk Products 2016 % Change
$ 269 $ 5 $ 264 $ - $ 264 European Union $ 57 +100% +100% +100%
55 3 52 - 52 Eastern Europe 6 +100% +100% +100%
94 (3) 98 - 98 Middle East & Africa 4 +100% +100% +100%
- - - - - South & Southeast Asia - - - -
3,218 (94) 3,312 - 3,312 East Asia & Australia 666 +100% +100% +100%
4 - 4 - 4 Latin America & Canada 1 +100% +100% +100%
$ 3,640 $ (89) $ 3,729 $ - $ 3,729 Total RRPs $ 733 +100% +100% +100%
2017 PMI 2016 % Change
$ 8,318 $ 45 $ 8,273 $ - $ 8,273 European Union $ 8,162 1.9% 1.4% 1.4%
2,711 229 2,482 - 2,482 Eastern Europe 2,484 9.1% (0.1)% (0.1)%
3,988 (520) 4,508 - 4,508 Middle East & Africa 4,516 (11.7)% (0.2)% (0.2)%
4,417 (63) 4,480 - 4,480 South & Southeast Asia 4,396 0.5% 1.9% 1.9%
6,373 (74) 6,447 - 6,447 East Asia & Australia 4,285 48.7% 50.5% 50.5%
2,941 (54) 2,995 - 2,995 Latin America & Canada 2,842 3.5% 5.4% 5.4%
$ 28,748 $ (437) $ 29,185 $ - $ 29,185 Total PMI $ 26,685 7.7% 9.4% 9.4%
PHILIP MORRIS INTERNATIONAL INC. and SubsidiariesReconciliation of Non-GAAP Measures
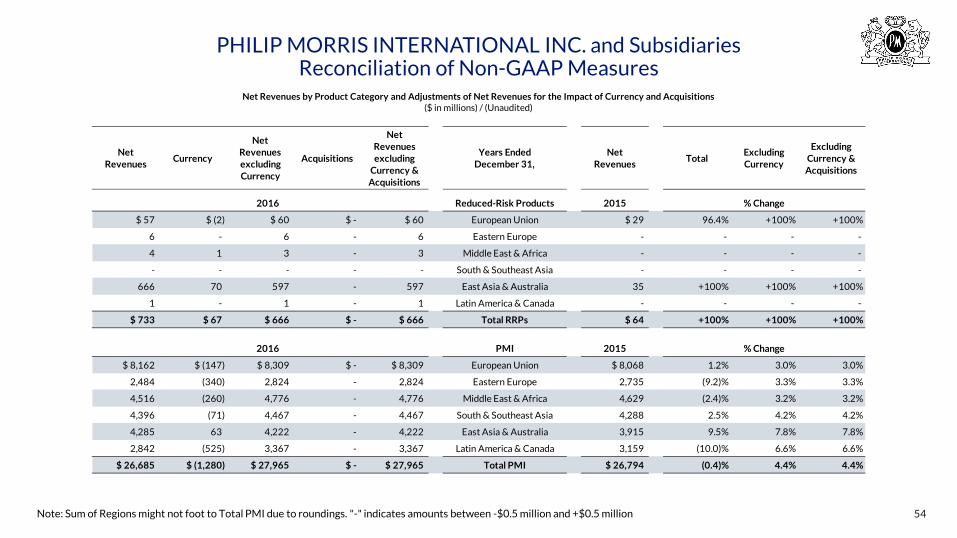
Net Revenues by Product Category and Adjustments of Net Revenues for the Impact of Currency and Acquisitions($ in millions) / (Unaudited)
54Note: Sum of Regions might not foot to Total PMI due to roundings. "-" indicates amounts between -$0.5 million and +$0.5 million
NetRevenues
Currency
NetRevenuesexcluding Currency
Acquisitions
NetRevenues excluding
Currency & Acquisitions
Years EndedDecember 31,
NetRevenues
TotalExcluding Currency
Excluding Currency &
Acquisitions
2016 Reduced-Risk Products 2015 % Change
$ 57 $ (2) $ 60 $ - $ 60 European Union $ 29 96.4% +100% +100%
6 - 6 - 6 Eastern Europe - - - -
4 1 3 - 3 Middle East & Africa - - - -
- - - - - South & Southeast Asia - - - -
666 70 597 - 597 East Asia & Australia 35 +100% +100% +100%
1 - 1 - 1 Latin America & Canada - - - -
$ 733 $ 67 $ 666 $ - $ 666 Total RRPs $ 64 +100% +100% +100%
2016 PMI 2015 % Change
$ 8,162 $ (147) $ 8,309 $ - $ 8,309 European Union $ 8,068 1.2% 3.0% 3.0%
2,484 (340) 2,824 - 2,824 Eastern Europe 2,735 (9.2)% 3.3% 3.3%
4,516 (260) 4,776 - 4,776 Middle East & Africa 4,629 (2.4)% 3.2% 3.2%
4,396 (71) 4,467 - 4,467 South & Southeast Asia 4,288 2.5% 4.2% 4.2%
4,285 63 4,222 - 4,222 East Asia & Australia 3,915 9.5% 7.8% 7.8%
2,842 (525) 3,367 - 3,367 Latin America & Canada 3,159 (10.0)% 6.6% 6.6%
$ 26,685 $ (1,280) $ 27,965 $ - $ 27,965 Total PMI $ 26,794 (0.4)% 4.4% 4.4%

Delivering a Smoke-Free Future
2020 First-Quarter Results
April 21, 2020


