84


* AS OF JANUARY 2, 2021 THE COMPANY ALSO SERVES 1,277 INDEPENDENT CARQUEST BRANCHES.
Total Net Sales in 2020
Stores and Branches*
Returned to Shareholders in 2020 through the combination
of Share Repurchases and the Company’s Quarterly Dividend
2020 HIGHLIGHTSCARE + SPEED – We responded quickly with
innovations to serve our customers as the pandemic took
hold in North America.
• Branded Advance Same DayTM – a customer-centric
suite of same day services that includes Free In Store
Pickup, Free Curbside and Free Same Day Delivery.
• Launched our mobile app for fast, simple shopping.
• Developed virtual instructor-led training courses for
repair shop owners and their employees to assist our
professional customers.
DIEHARD IS BACK – We officially launched
DieHard® batteries in all Advance stores and participating
Carquest independent locations during July 2020.
Our #DieHardisBack campaign increased Advance’s brand awareness and category sales throughout the second half
of the year, leading DieHard to be a billion-dollar business.
Watch the film at www.youtube.com/advanceautoparts.
* . As of January 2, 2021 the Company also serves 1,277 Independent Carquest locations
D E A R F E L L O W A D V A N C E A U T O P A R T S S H A R E H O L D E R S
I hope each of you are safe and healthy as we start 2021 under the unique circumstances the world has faced
over the past year. As I write this letter, I am reminded that it was at this time just one year ago that we were
in the final stages of planning the launch of our newly acquired DieHard® brand. At that time, we certainly had
no idea of what was to come in 2020. I found a quote recently that I feel summarizes my personal experience
over this timeframe – “Nothing in life is to be feared; it is only to be understood. Now is the time to understand
more, so that we may fear less.” This quote came from the great scientist Marie Curie.
The resiliency we have demonstrated this past year has put Advance in
a strong position to weather the current crisis and build long-term value
for all stakeholders. I am so grateful to our team members for all their
hard work in 2020, and I have never been so optimistic for the future.
– TOM GRECO President and Chief Executive Officer
Without a doubt, it has been a year in which
understanding more about something took on
a whole new meaning. Before 2020, I believed
global pandemics that could threaten every man,
woman and child on Earth for months on end were
a part of our history books. Such threats seemed
to belong more in the days of Madame Curie
herself when cholera and the flu gripped the world
at different times in her life. We certainly had no
playbook for COVID-19. It had to be built from
understanding how the virus would impact our DIY
consumers, professional customers, independent
partners, suppliers and AAP team members. It
has been a valuable reminder of the tremendous
importance of deeply understanding trends that
are impacting consumer and employee behavior.
Working diligently to improve their respective
experiences has been and always will be the best
response to any challenging environment we face.
Indeed, we witnessed abrupt changes in consumer
behavior that required rapid adjustments to our
standard operating procedures in response to
COVID-19. Our response was swift, focused and
ultimately led to improved results. Our entire
organization rose to the occasion as we remained
focused on three overarching priorities to address
the rapidly evolving situation.
FIRST, we have prioritized the health, safety and
wellbeing of our team members and customers.
This was not a new concept at AAP, but it has taken
on new meaning in the face of the crisis. From the
onset of the pandemic, we responded quickly in
our stores and distribution centers to implement
social distancing, enhance sanitation practices,
require mandatory employee face coverings and
install plexiglass barriers. We also made critical
changes to how our team members operated
and mandated health check screenings. For our
customers, we brought innovative solutions to
market to ensure personal safety like our Advance
Same Day™ suite of fulfillment options for our DIY
omnichannel customers. For our professional
customers, we introduced contactless services
to deliver parts in a way that reduced human
interaction and adhered to unique protocols
individual repair shops put in place. As a result of
— continued
SECOND, during the crisis, we’ve stayed laser-
focused on delivering sales, operating earnings and
protecting the financials of the company. Initially, as
we faced many unknowns, this included preserving
cash. Late in the first quarter, we launched a series
of initiatives to achieve these goals and made
ongoing refinements to strengthen our plans as the
pandemic unfolded. Shortly after the pandemic hit,
we added $1 billion in liquidity to the balance sheet
and temporarily suspended our share repurchase
activity. These important steps solidified our cash
position and helped us weather the initial storm
while creating an environment for positive recovery.
Our rapid actions drove results. From the second
quarter through the end of 2020, we delivered 9.6%
in net sales growth, 44 weeks of consecutive DIY
market share gains, 160 basis points in adjusted
operating income margin expansion and 32.4%
adjusted earnings per share growth. As the year
progressed and our sales began to rebound from
trough levels, we resumed our share repurchase
program. In fact, we ended 2020 by returning
approximately $515 million to shareholders
through a combination of these repurchases and
the company’s quarterly cash dividend payments.
THIRD, we prepared Advance to be stronger over
the long term following this crisis. We spent several
months last summer reviewing our strategic
plan initiatives through a “Post COVID-19 Lens.”
This resulted in the reprioritization of certain
projects and updated targets for others in order
to respond and thrive in the new environment we
are competing in. The challenges of the pandemic
also resulted in an intensification of our focus on
communication, innovation and training. I believe
this is building a stronger culture and execution
mindset overall. The goal of our updated strategic
plan is to drive top quartile shareholder returns
over the next three years through top-line growth
at or above the market, an acceleration of margin
expansion and a capital allocation strategy
focused on returning cash to shareholders.
Our commitment to these priorities has been
mirrored at all levels of the company as our team
members worked tirelessly to adapt to our evolving
pandemic protocols. They too continued to be
innovative and resourceful, accommodating new
ways of serving our customers safely and efficiently.
It is their efforts which have allowed Advance to
effectively respond to the increased demand, while
also executing on our strategic objectives.
Before taking a closer look at the financial highlights
of the year, I want to thank each of our team
members and Independent partners for their hard
work throughout the past twelve months. I am
particularly humbled by how the company has
come together throughout this challenging time.
We have continued to do our part to keep motorists,
including essential frontline workers, on the road
and without them, we certainly would not have been
able to deliver the performance described below.
F I N A N C I A L H I G H L I G H T S
While 2020 was a highly volatile year, in the end,
we grew sales, operating income and DIY market
share resulting in record earnings per share.
Following a sharp decline in sales early in the year,
demand for auto parts, particularly within our DIY
omnichannel business, rebounded significantly in
the last three quarters of the year. This was largely
driven by the impact COVID-19 had on the economy
and changes in consumer behavior. For the first
time in our history, Advance surpassed $10 billion
in net sales, which was a 4.1% increase from 2019
results. Adjusted operating income of $827 million
increased 4.1% versus the prior year in spite of
approximately $60 million of unplanned expense
attributable to COVID-19. Our continued focus on
cash has led to a 302-basis point improvement
in our Accounts Payable Ratio, leading us to set
a new record for free cash flow of $702 million,
up 18% versus 2019. Throughout this uncertain
period, we remained committed to both investing
in our business and returning value directly to
shareholders through our quarterly cash dividend
and share repurchase program. — continued
our actions and investments, our infection rates across the company have been significantly below the national average.

From a channel perspective, our industry clearly
benefitted in 2020 from accelerated DIY growth.
That said, our results would not have been
possible without our successful launch of the
iconic DieHard brand, which we purchased at the
end of 2019 and officially launched in our stores
in July 2020. I believe our DIY market share
gains were the result of our DieHard launch and
relentless focus on improved store execution,
enhanced brand awareness and increased
customer loyalty. In addition, the launch of our
Advance Same Day suite of services and mobile
app contributed to increased differentiation.
Meanwhile, our Speed Perks loyalty program and
improved digital platforms, contributed to double
digit year-over-year sales growth in e-commerce.
Our professional business experienced more
challenges from a demand perspective from
COVID-19 as much of the country was subject to
stay at home orders throughout the year, which
dramatically reduced miles driven. Throughout
the pandemic, we continued to elevate our
support for our pro customers. As a result, we
also believe that our professional customers
now have an increased appreciation for the
broad set of tools we offer to help make their
businesses successful. This extends beyond our
industry leading product assortment and now
includes virtual instructor led trainings for repair
shop owners and their technicians, contact free
delivery of parts and new tools like MotoLogic®.
As the economy began to open in the back half of
the year, we saw a gradual recovery in both miles
driven and our professional business.
Throughout 2020, we also continued to drive our
four pillars of margin expansion. This resulted in
gross margin improvement of 38 basis points
for the year as a result of supply chain leverage,
increased owned brand penetration and strategic
pricing actions. In terms of SG&A, we increased
sales and profit per store, leveraged store payroll,
consolidated our field structure and continued to
drive our integration agenda, including back-office
consolidation. We believe we have a particularly
strong opportunity within broader retail to expand
operating margins and expect to accelerate the
rate of our margin expansion in 2021.
— continued
(1) Operating Income Margin and Diluted earnings per share have been reported on an adjusted basis to exclude certain non-operational and non-cash expenses in 2020, 2019 and 2018, including General Parts International, Inc. (“GPI”) integration and store closure and consolidation expenses, GPI amortization of acquired intangible assets, transformation expenses, make-whole provisions, tender premiums and debt issuance costs resulting from the early redemption of our 2023, 2022 and 2020 senior unsecured notes, an out-of-period correction and the net impact of the Tax Cuts and Jobs Act. A reconciliation of the adjusted financial results to the most comparable GAAP results for 2020 and 2019 can be found on pages 22 and 23 of “Management’s Discussion and Analysis of Financial Condition and Results of Operations” in our Form 10-K included within our 2020 Annual Report. A reconciliation of the adjusted financial results to the most comparable GAAP results for 2018 can be found on pages 18 and 21 of “Management’s Discussion and Analysis of Financial Condition and Results of Operations” in our Form 10-K included within our 2019 Annual Report. (2) Free cash flow is a non-GAAP measure and should be considered in addition to, but not as a substitute for, information contained in our “Consolidated Statements of Cash Flows” that can be found on page 39 in our Form 10-K included within our 2020 Annual Report. Free cash flow of $702 million, $597 million and $617 million can be reconciled to net cash provided by operating activities on a GAAP basis of $970 million, $867 million and $811 million by adding back purchases of property and equipment of $268 million, $270 million and $194 million.
2020 2019 2018
Total Net Sales (in billions) $10.1 $9.7 $9.6
Comparable Store Sales 2.4% 1.1% 2.3%
Operating Income Margin 7.4% 7.0% 6.3%
Adjusted Operating Income Margin (1) 8.2% 8.2% 7.8%
Diluted Earnings Per Share $7.14 $6.84 $5.73
Adjusted Earnings Per Share (1) $8.51 $8.19 $7.13
Operating Cash Flow (in millions) $970 $867 $811
Free Cash Flow (2) (in millions) $702 $597 $617
S E L E C T E D F I N A N C I A L H I G H L I G H T S
A D VA N C I N G O U R C U LT U R E
In all of this, we have taken a long-term view of what
is needed for continued success. We fully recognize
that the culture we build is not only crucial for dealing
with the global pandemic, it is also foundational
to delivering future growth. That means we must
remain steadfast in our commitment to building
a premier workplace where “diversity, equity and
inclusion” is not just a catch phrase. Our team
members are a differentiator for Advance and they
must know they are heard, valued and respected
through both recognition and enhanced training. Part
of our cultural evolution involves building a company
that is known for giving back to the communities we
serve and being good stewards of the environment.
Despite our continued focus on the pandemic in
2020, we made progress in each of these areas.
Among our accomplishments are the following:
Appointed our first Chief Diversity, Equity
and Inclusion Officer whose mandate it is to
create meaningful and substantive change
and who reports directly to me
Granted over 3,000 Advance stock awards
valued at almost $11 million to frontline
team members through our industry-leading
Fuel the Frontline recognition program,
helping to significantly reduce turnover in the
field. Since its inception in 2016, we have
granted over 22,000 awards and in excess
of $60 million to frontline team members
Launched a learning series called “Leading
with Care,” covering topics like caring for
yourself and others, crisis leadership, virtual
leadership and inspirational leadership,
to help leaders implement new skillsets
needed to adapt in the current environment
while building for our future needs
Completed the year as one of the largest
corporate contributors to the American Heart
Association and Building Homes for Heroes
Improved our score from “B” to “A-” in our
second submission to the CDP’s climate
change report
The strength of our culture is evidenced by the 76% of our team members reporting a favorable opinion of the company in our latest organizational health survey. This is our highest score to date and four points higher than in 2019. More details on our efforts to support our people, planet and community are available in our Corporate Sustainability and Social Report, which we published in March 2021. This was our first report using the framework established by the Sustainability Accounting Standards Board (SASB), further demonstrating our commitment to transparency.
The resiliency we have demonstrated this past year has put Advance in a strong position to weather the current crisis and build long-term value for all stakeholders. I am so grateful to our team members for all their hard work in 2020, and I have never been so optimistic for
the future. Thank you for your continued support.
Tom Greco President and Chief Executive Officer
UNITED STATESSECURITIES AND EXCHANGE COMMISSION
Washington, D.C. 20549________________________
FORM 10-K ________________________________________________
☒ ANNUAL REPORT PURSUANT TO SECTION 13 OR 15(d) OF THE SECURITIESEXCHANGE ACT OF 1934
For the fiscal year ended January 2, 2021
☐ TRANSITION REPORT PURSUANT TO SECTION 13 OR 15(d) OF THE SECURITIESEXCHANGE ACT OF 1934
For the transition period from ________ to ________.
Commission file number 001-16797 ________________________
ADVANCE AUTO PARTS, INC. (Exact name of registrant as specified in its charter)
________________________
Delaware 54-2049910(State or other jurisdiction of incorporation or organization) (I.R.S. Employer Identification No.)
2635 East Millbrook Road, Raleigh, North Carolina 27604 (Address of principal executive offices) (Zip Code)
(540) 362-4911(Registrant’s telephone number, including area code)
Securities Registered Pursuant to Section 12(b) of the Act:
Title of each class Trading symbol Name of each exchange on which registeredCommon Stock, $0.0001 par value AAP New York Stock Exchange
Securities Registered Pursuant to Section 12(g) of the Act: None
Indicate by check mark if the registrant is a well-known seasoned issuer, as defined in Rule 405 of the Securities Act. Yes ☒ No ☐
Indicate by check mark if the registrant is not required to file reports pursuant to Section 13 or Section 15(d) of the Act.Yes ☐ No ☒

Indicate by check mark whether the registrant (1) has filed all reports required to be filed by Section 13 or 15(d) of the Securities Exchange Act of 1934 during the preceding 12 months (or for such shorter period that the registrant was required to file such reports), and (2) has been subject to such filing requirements for the past 90 days.
Yes ☒ No ☐
Indicate by check mark whether the registrant has submitted electronically every Interactive Data File required to be submitted pursuant to Rule 405 of Registration S-T (§232.405 of this chapter) during the preceding 12 months (or for such shorter period that the registrant was required to submit such files). Yes ☒ No ☐
Indicate by check mark whether the registrant is a large accelerated filer, an accelerated filer, a non-accelerated filer, a smaller reporting company or an emerging growth company. See the definitions of “large accelerated filer,” “accelerated filer,” “smaller reporting company” and “emerging growth company” in Rule 12b-2 of the Exchange Act.
Large accelerated filer ☒ Accelerated filer ☐Non-accelerated filer ☐ Smaller reporting company ☐
Emerging growth company ☐
If an emerging growth company, indicate by check mark if the registrant has elected not to use the extended transition period for complying with any new or revised financial accounting standards provided pursuant to Section 13(a) of the Exchange Act. o
Indicate by check mark whether the registrant has filed a report on and attestation to its management’s assessment of the effectiveness of its internal control over financial reporting under Section 404(b) of the Sarbanes-Oxley Act (15 U.S.C 7262(b)) by the registered public accounting firm that prepared or issued its audit report. ☒
Indicate by check mark whether the registrant is a shell company (as defined in Rule 12b-2 of the Exchange Act). Yes ☐ No ☒
As of the last business day of the registrant’s most recently completed second fiscal quarter, July 10, 2020, the aggregate market value of common stock held by non-affiliates of the registrant was $9,274,738,343, based on the last sales price on July 10, 2020, as reported by the New York Stock Exchange.
As of February 17, 2021, the number of shares of the registrant’s common stock outstanding was 65,524,420 shares.
Documents Incorporated by Reference:
Portions of the registrant’s definitive proxy statement for its 2021 Annual Meeting of Stockholders, to be held on May 26, 2021, are incorporated by reference into Part III of this Form 10-K.

TABLE OF CONTENTS PagePart I. Item 1. Business . . . . . . . . . . . . . . . . . . . . . . . . . . . . . . . . . . . . . . . . . . . . . . . . . . . . . . . . . . . . . . 2 Item 1A. Risk Factors . . . . . . . . . . . . . . . . . . . . . . . . . . . . . . . . . . . . . . . . . . . . . . . . . . . . . . . . . . . 6 Item 1B. Unresolved Staff Comments . . . . . . . . . . . . . . . . . . . . . . . . . . . . . . . . . . . . . . . . . . . . . . 14 Item 2. Properties . . . . . . . . . . . . . . . . . . . . . . . . . . . . . . . . . . . . . . . . . . . . . . . . . . . . . . . . . . . . . 15 Item 3. Legal Proceedings . . . . . . . . . . . . . . . . . . . . . . . . . . . . . . . . . . . . . . . . . . . . . . . . . . . . . . 15 Item 4. Mine Safety Disclosures . . . . . . . . . . . . . . . . . . . . . . . . . . . . . . . . . . . . . . . . . . . . . . . . . . 15 Part II. Item 5. Market for the Registrant's Common Equity, Related Stockholder Matters and Issuer
Purchases of Equity Securities . . . . . . . . . . . . . . . . . . . . . . . . . . . . . . . . . . . . . . . . . . . . . 16 Item 6. Selected Consolidated Financial Data . . . . . . . . . . . . . . . . . . . . . . . . . . . . . . . . . . . . . . . 18
Item 7. Management's Discussion and Analysis of Financial Condition and Results of Operations . . . . . . . . . . . . . . . . . . . . . . . . . . . . . . . . . . . . . . . . . . . . . . . . . . . . . . . . . . . . 19
Item 7A. Quantitative and Qualitative Disclosures About Market Risks . . . . . . . . . . . . . . . . . . . . 28 Item 8. Financial Statements and Supplementary Data . . . . . . . . . . . . . . . . . . . . . . . . . . . . . . . . 29
Item 9. Changes in and Disagreements with Accountants on Accounting and Financial
Disclosure . . . . . . . . . . . . . . . . . . . . . . . . . . . . . . . . . . . . . . . . . . . . . . . . . . . . . . . . . . . . . 29
Item 9A. Controls and Procedures . . . . . . . . . . . . . . . . . . . . . . . . . . . . . . . . . . . . . . . . . . . . . . . . . . 29
Item 9B. Other Information . . . . . . . . . . . . . . . . . . . . . . . . . . . . . . . . . . . . . . . . . . . . . . . . . . . . . . . 30
Part III.
Item 10. Directors, Executive Officers and Corporate Governance . . . . . . . . . . . . . . . . . . . . . . . . 31
Item 11. Executive Compensation . . . . . . . . . . . . . . . . . . . . . . . . . . . . . . . . . . . . . . . . . . . . . . . . . 31
Item 12. Security Ownership of Certain Beneficial Owners and Management and Related Stockholder Matters . . . . . . . . . . . . . . . . . . . . . . . . . . . . . . . . . . . . . . . . . . . . . . . . . . . . . 31
Item 13. Certain Relationships and Related Transactions, and Director Independence . . . . . . . . . 31
Item 14. Principal Accountant Fees and Services . . . . . . . . . . . . . . . . . . . . . . . . . . . . . . . . . . . . . . 31
Part IV.
Item 15. Exhibits, Financial Statement Schedules . . . . . . . . . . . . . . . . . . . . . . . . . . . . . . . . . . . . . 32
Item 16. Form 10-K Summary . . . . . . . . . . . . . . . . . . . . . . . . . . . . . . . . . . . . . . . . . . . . . . . . . . . . 67
Signatures 68

(This page intentionally left blank.)

FORWARD-LOOKING STATEMENTS
Certain statements in this Annual Report on Form 10-K are “forward-looking statements” within the meaning of the Private Securities Litigation Reform Act of 1995. All statements, other than statements of historical facts, may be forward-looking statements. Forward-looking statements are usually identified by the use of words such as “anticipate,” “believe,” “could,” “estimate,” “expect,” “forecast,” “intend,” “likely,” “may,” “plan,” “position,” “possible,” “potential,” “probable,” “project,” “projection,” “should,” “strategy,” “will,” or similar expressions. These statements are based upon assessments and assumptions of management in light of historical results and trends, current conditions and potential future developments that often involve judgment, estimates, assumptions and projections. Forward-looking statements reflect current views about our plans, strategies and prospects, which are based on information currently available as of the date of this report. Except as required by law, we undertake no obligation to update any forward-looking statements to reflect events or circumstances after the date of such statements. Forward-looking statements are subject to risks and uncertainties, many of which are outside our control, which could cause actual results to differ materially from these statements. Therefore, you should not place undue reliance on those statements. Refer to “Item 1A. Risk Factors” included in this report and other filings made by us with the Securities and Exchange Commission (“SEC”) for additional description of risks that could materially affect our actual results.
1

PART I
Item 1. Business.
Unless the context otherwise requires, “Advance,” “we,” “us,” “our,” and similar terms refer to Advance Auto Parts, Inc., its subsidiaries and their respective operations on a consolidated basis. Our fiscal year consists of 52 or 53 weeks ending on the Saturday closest to December 31st of each year. Our fiscal year ended January 2, 2021 (“2020”), included 53 weeks of operation. Fiscal year ended December 28, 2019 (“2019”) and fiscal year ended December 29, 2018 (“2018”) included 52 weeks of operations.
Overview
We are a leading automotive aftermarket parts provider in North America, serving both professional installers (“Professional”) and “do-it-yourself” (“DIY”) customers, as well as independently owned operators. Our stores and branches offer a broad selection of brand name, original equipment manufacturer (“OEM”) and private label automotive replacement parts, accessories, batteries and maintenance items for domestic and imported cars, vans, sport utility vehicles and light and heavy duty trucks. As of January 2, 2021, we operated 4,806 total stores and 170 branches primarily under the trade names “Advance Auto Parts,” “Autopart International,” “Carquest” and “Worldpac.”
We were founded in 1929 as Advance Stores Company, Incorporated and operated as a retailer of general merchandise until the 1980s. During the 1980s, we began targeting the sale of automotive parts and accessories to DIY customers. We initiated our Professional delivery program in 1996 and have steadily increased our sales to Professional customers since 2000. We have grown significantly as a result of comparable store sales growth, new store openings and strategic acquisitions. Advance Auto Parts, Inc., a Delaware corporation, was incorporated in 2001 in conjunction with the acquisition of Discount Auto Parts, Inc. In 2014, we acquired General Parts International, Inc. (“GPI”), a privately held company that was a leading distributor and supplier of original equipment and aftermarket automotive replacement products for Professional markets operating under the Carquest and Worldpac trade names.
Stores and Branches
Through our integrated operating approach, we serve our Professional and DIY customers through a variety of channels ranging from traditional “brick and mortar” store locations to self-service e-commerce sites. We believe we are better able to meet our customers’ needs by operating under several trade names, which are as follows:
Advance Auto Parts — Our 4,287 stores as of January 2, 2021 are generally located in freestanding buildings with a focus on both Professional and DIY customers. The average size of an Advance Auto Parts store is approximately 7,700 square feet. These stores carry a wide variety of products serving aftermarket auto part needs for both domestic and import vehicles. Our Advance Auto Parts stores carry a product offering of approximately 21,000 stock keeping units (“SKUs”), generally consisting of a custom mix of product based on each store’s respective market. Supplementing the inventory on-hand at our stores, additional less common SKUs are available in many of our larger stores (known as “HUB” stores). These additional SKUs are typically available on a same-day or next-day basis.
Autopart International — Our 161 stores as of January 2, 2021 operate primarily in the Northeastern and Mid-Atlantic regions of the United States with a focus on Professional customers. These stores specialize in imported aftermarket and private label branded auto parts. Autopart International stores offer approximately 47,000 SKUs.
Carquest — Our 358 stores as of January 2, 2021, including 145 stores in Canada, are generally located in freestanding buildings with a primary focus on Professional customers, but also serve DIY customers. The average size of a Carquest store is approximately 7,200 square feet. These stores carry a wide variety of products serving the aftermarket auto part needs for both domestic and import vehicles with a product offering of approximately 19,000 SKUs. As of January 2, 2021, Carquest also served 1,277 independently owned stores that operate under the “Carquest” name.
Worldpac — Our 170 branches as of January 2, 2021 principally serve Professional customers utilizing an efficient and sophisticated on-line ordering and fulfillment system. Worldpac branches are generally larger than our other store locations averaging approximately 25,000 square feet in size. Worldpac specializes in imported, OEM parts. Worldpac’s complete product offering includes over 200,000 SKUs for import and domestic vehicles.
As part of our transformation efforts, we have consolidated 8 Autopart International (“AI”) stores into the Worldpac format during 2020. Under our strategic business plan, we plan to continue integrating the operations of AI and Worldpac.
2
Our Products
The following table shows some of the types of products that we sell by major category of items:
Parts & Batteries Accessories & Chemicals Engine MaintenanceBatteries and battery accessories Air conditioning chemicals and accessories Air filtersBelts and hoses Air fresheners Fuel and oil additivesBrakes and brake pads Antifreeze and washer fluid Fuel filtersChassis parts Electrical wire and fuses Grease and lubricantsClimate control parts Electronics Motor oilClutches and drive shafts Floor mats, seat covers and interior accessories Oil filtersEngines and engine parts Hand and specialty tools Part cleaners and treatmentsExhaust systems and parts Lighting Transmission fluidHub assemblies Performance partsIgnition components and wire Sealants, adhesives and compoundsRadiators and cooling parts Tire repair accessoriesStarters and alternators Vent shades, mirrors and exterior accessoriesSteering and alignment parts Washes, waxes and cleaning supplies
Wiper blades
We provide our customers with quality products that are often offered at a good, better or best recommendation differentiated by price and quality. We accept customer returns for many new, core and warranty products.
Our Customers
Our Professional customers consist primarily of customers for whom we deliver product from our store or branch locations to their places of business, including garages, service stations and auto dealers. Our Professional sales represented approximately 57%, 60% and 58% of our sales in 2020, 2019 and 2018. We also serve 1,277 independently owned Carquest stores with shipments directly from our distribution centers. Our DIY customers are primarily served through our stores, but can also order online to pick up merchandise at a conveniently located store or have their purchases shipped directly to them. Except where prohibited, we also provide a variety of services at our stores free of charge to our customers, including:
• Battery and wiper installation;• Check engine light scanning;• Electrical system testing, including batteries, starters and alternators;• “How-To” video clinics;• Oil and battery recycling; and• Loaner tool programs.
We also serve our customers online at www.AdvanceAutoParts.com. Our Professional customers can conveniently place their orders electronically, including through MyAdvance.com, by phone, or in-store and we deliver product from our store or branch locations to their places of business.
Store Development
The key factors used in selecting sites and market locations in which we operate include population, demographics, traffic count, vehicle profile, number and strength of competitors’ stores and the cost of real estate. As of January 2, 2021, 4,809 stores and branches were located in 49 U.S. states and 2 U.S. territories and 167 stores and branches were located in 9 Canadian provinces.
We serve our stores and branches primarily from our principal corporate offices in Raleigh, NC and Roanoke, VA. We also maintain store support centers in Newark, CA and Norton, MA.
3
Supply Chain
Our supply chain consists of a network of distribution centers, HUBs, stores and branches that enable us to provide same-day or next-day availability to our customers. As of January 2, 2021, we operated 51 distribution centers, ranging in size from approximately 50,000 to 950,000 square feet with total square footage of approximately 11.6 million.
Merchandise, Marketing and Advertising
In 2020, we purchased merchandise from over 1,100 vendors, with no single vendor accounting for more than 10% of purchases. Our purchasing strategy involves negotiating agreements to purchase merchandise over a specified period of time along with other provisions, including pricing, volume and payment terms.
Our merchandising strategy is to carry a broad selection of high quality and reputable brand name automotive parts and accessories that we believe will appeal to our Professional customers and also generate DIY customer traffic. Some of our brands include Bosch®, Castrol®, Dayco®, Denso®, Gates®, Moog®, Monroe®, NGK®, Prestone®, Purolator®, Trico® and Wagner®. In addition to these branded products, we stock a wide selection of high-quality private label products with a goal of appealing to value-conscious customers. These lines of merchandise include chemicals, interior automotive accessories, batteries and parts under various private label names such as Autocraft®, Autopart International®, Driveworks®, Tough One®
and Wearever® as well as the Carquest® brand.
On December 23, 2019, we purchased the DieHard® brand for a cash purchase price of $200.0 million. This purchase gave us the right to sell DieHard® batteries and enables us to extend the DieHard® brand into other automotive and vehicular categories. We granted the seller an exclusive royalty-free, perpetual license to develop, market and sell DieHard® branded products in certain non-automotive categories.
Our marketing and advertising program is designed to drive brand awareness, consideration by consumers and omnichannel traffic by position in aftermarket auto parts category. We strive to exceed our customers’ expectations end-to-end through a comprehensive online and in-store pick up experience, extensive parts assortment, quality brands, experienced parts professionals, Professional programs that are designed to build loyalty with our customers and our DIY customer loyalty program. Our DIY campaign was developed around a multi-channel communications plan that brings together radio, television, digital marketing, social media, sponsorships, store execution, public relations and Speed Perks.
Seasonality
Our business is somewhat seasonal in nature, with the highest sales usually occurring in the spring and summer months. In addition, our business can be affected by weather conditions. While unusually heavy precipitation tends to soften sales as elective maintenance is deferred during such periods, extremely hot or cold weather tends to enhance sales by causing automotive parts to fail at an accelerated rate. Our fourth quarter is generally our most volatile as weather and spending trade-offs typically influence our Professional and DIY sales.
Human Capital Management
As of January 2, 2021, we employed approximately 40,000 full-time Team Members and approximately 28,000 part-time Team Members. Our workforce consisted of 82% of our Team Members employed in store-level operations, 12% employed in distribution and 6% employed in our corporate offices. As of January 2, 2021, approximately 1.2% of our Team Members were represented by labor unions. We believe our People are Our Best Part, and we have adopted six Cultural Beliefs to help us foster a culture that fully engages our Team Members with our business: Speak Up, Be Accountable, Take Action, Move Forward, Grow Talent and Champion Inclusion. Our Cultural Belief of Grow Talent highlights the importance to us of developing our Team Members in their careers, and we seek to not only recruit the best talent, but also retain and promote the best talent. Through another of our Cultural Beliefs, Champion Inclusion, we seek to fully leverage the ideas and talents of all our Team Members in caring for our customers. We encourage our Team Members to Speak Up and promote their engagement through a variety of programs and networks within our organization. In 2020, we had record response to our annual organizational health survey, evidencing high engagement company wide, and we plan to continue to invest in our Team Members to help create long-term value for our stakeholders.
4
Intellectual Property
We own a number of trade names, service marks and trademarks, including “Advance Auto Parts®,” “Advance Same DayTM,” “Autopart International®,” “Carquest®,” “CARQUEST Technical Institute®,” “DieHard®,” “DriverSide®,” “MotoLogic®,” “MotoShop®,” “speedDIAL®,” “TECH-NET Professional Auto Service®” and “Worldpac®” for use in connection with the automotive parts business. In addition, we own and have registered a number of trademarks for our private label brands. We believe that these trade names, service marks and trademarks are important to our merchandising strategy. We do not know of any infringing uses that would materially affect the use of these trade names and marks and we actively defend and enforce them.
Competition
We operate in both the Professional and DIY markets of the automotive aftermarket industry. Our primary competitors are (i) both national and regional chains of automotive parts stores, including AutoZone, Inc., NAPA, O’Reilly Automotive, Inc., The Pep Boys-Manny, Moe & Jack and Auto Plus (formerly Uni-Select USA, Inc.), (ii) internet-based retailers, (iii) discount stores and mass merchandisers that carry automotive products, (iv) wholesalers or jobbers stores, including those associated with national parts distributors or associations, (v) independently owned stores and (vi) automobile dealers that supply parts. We believe that chains of automotive parts stores that, like us, have multiple locations in one or more markets, have competitive advantages in customer service, marketing, inventory selection, purchasing and distribution as compared to independent retailers and jobbers that are not part of a chain or associated with other retailers or jobbers. The principal methods of competition in our business include customer service, product offerings, availability, quality, price and store location.
Environmental and Other Regulatory Matters
We are subject to various federal, state and local laws and governmental regulations relating to the operation of our business, including those governing collection, transportation and recycling of automotive lead-acid batteries, used motor oil and other recyclable items and ownership and operation of real property. We sell products containing hazardous materials as part of our business. In addition, our customers may bring automotive lead-acid batteries, used motor oil or other recyclable items onto our properties. We currently provide collection and recycling programs for used lead-acid batteries, used oil and other recyclable items at a majority of our stores as a service to our customers. Pursuant to agreements with third-party vendors, lead-acid batteries, used motor oil and other recyclable items are collected by our Team Members, deposited onto pallets or into vendor supplied containers and stored by us until collected by the third-party vendors for recycling or proper disposal. The terms of our contracts with third party vendors require that they are in compliance with all applicable laws and regulations. Our third-party vendors who arrange for the removal, disposal, treatment or other handling of hazardous or toxic substances may be liable for the costs of removal or remediation at any affected disposal, treatment or other site affected by such substances. Based on our experience, we do not believe that there are any material environmental costs associated with the current business practice of accepting lead-acid batteries, used oil and other recyclable items as these costs are borne by the respective third-party vendors.
We own and lease real property. Under various environmental laws and regulations, a current or previous owner or operator of real property may be liable for the cost of removal or remediation of hazardous or toxic substances on, under or in such property. These laws often impose joint and several liability and may be imposed without regard to whether the owner or operator knew of, or was responsible for, the release of such hazardous or toxic substances. Other environmental laws and common law principles also could be used to impose liability for releases of hazardous materials into the environment or work place, and third parties may seek recovery from owners or operators of real properties for personal injury or property damage associated with exposure to released hazardous substances. From time to time, we receive notices from the U.S. Environmental Protection Agency and state environmental authorities indicating that there may be contamination on properties we own, lease or operate or may have owned, leased or operated in the past or on adjacent properties for which we may be responsible. Compliance with these laws and regulations and clean-up of released hazardous substances have not had a material impact on our operations to date.
We are also subject to numerous regulations including those related to labor and employment, discrimination, anti-bribery/anti-corruption, product quality and safety standards, data privacy and taxes. Compliance with any such laws and regulations has not had a material adverse effect on our operations to date. For more information, see the following disclosures in “Part I. Item 1A, Risk Factors” elsewhere in this report.
5
Available Information
Our Internet address is www.AdvanceAutoParts.com. Our website and the information contained therein or linked thereto are not part of this Annual Report on Form 10-K for 2020. We make available free of charge through our Internet website our annual reports on Form 10-K, quarterly reports on Form 10-Q, current reports on Form 8-K, proxy statements, registration statements and amendments to those reports filed or furnished pursuant to the Securities Exchange Act of 1934 (“Exchange Act”) as soon as reasonably practicable after we electronically file such material with, or furnish them to the SEC. The SEC maintains a website that contains reports, proxy statements and other information regarding issuers that file electronically with the SEC. These materials may be obtained electronically by accessing the SEC’s website at www.sec.gov.
Item 1A. Risk Factors.
You should consider carefully the risks and uncertainties described below together with the other information included in this Annual Report on Form 10-K, including without limitation our consolidated financial statements and related notes thereto and “Item 7-Management’s Discussion and Analysis of Financial Condition and Results of Operations-Critical Accounting Policies.” The occurrence of any of the following risks could materially adversely affect our business, financial condition, results of operations, cash flows and future prospects, which could in turn materially affect the price of our common stock.
Risks Related to Our Operations and Growth Strategy
If we are unable to successfully implement our business strategy, including increasing sales to Professional and DIY customers, expanding our margins and increasing our return on invested capital, our business, financial condition, results of operations and cash flows could be adversely affected.
We have identified several initiatives as part of our business strategy to increase sales to both Professional and DIY customers and expand our margins in order to increase our earnings and cash flows. We are currently making and expect to continue to make significant investments to pursue our strategic initiatives. If we are unable to implement our strategic initiatives efficiently and effectively, our business, financial condition, results of operations and cash flows could be adversely affected. We could also be adversely affected if we have not appropriately prioritized and balanced our initiatives or if we are unable to effectively manage change throughout our organization. Implementing strategic initiatives could disrupt or reduce the efficiency of our operations and may not provide the anticipated benefits, or may provide them on a delayed schedule or at a higher cost. These risks increase when significant changes are undertaken.
If we are unable to successfully implement our growth strategy, keep existing store locations or open new locations in desirable places on favorable terms, it could adversely affect our business, financial condition, results of operations and cash flows.
We intend to continue to expand the markets we serve as part of our growth strategy, which may include opening new stores or branches, as well as expansion of our online business. We may also grow our business through strategic acquisitions. As we expand our market presence, it becomes more critical that we have consistent and effective execution across all of our Company’s locations and brands. We are unsure whether we will be able to open and operate new locations on a timely or sufficiently profitable basis, or that opening new locations in markets we already serve will not harm the profitability or comparable store sales of existing locations. The newly opened and existing locations’ profitability will depend on the competition we face as well as our ability to properly stock, market and price the products desired by customers in these markets. The actual number and format of any new locations to be opened and the success of our growth strategy will depend on a number of factors, including, among other things:
• the availability of desirable locations; • the negotiation of acceptable lease or purchase terms for new locations;• the availability of financial resources, including access to capital at cost-effective interest rates;• our ability to expand our on-line offerings and sales; and• our ability to manage the expansion and to hire, train and retain qualified Team Members.
6
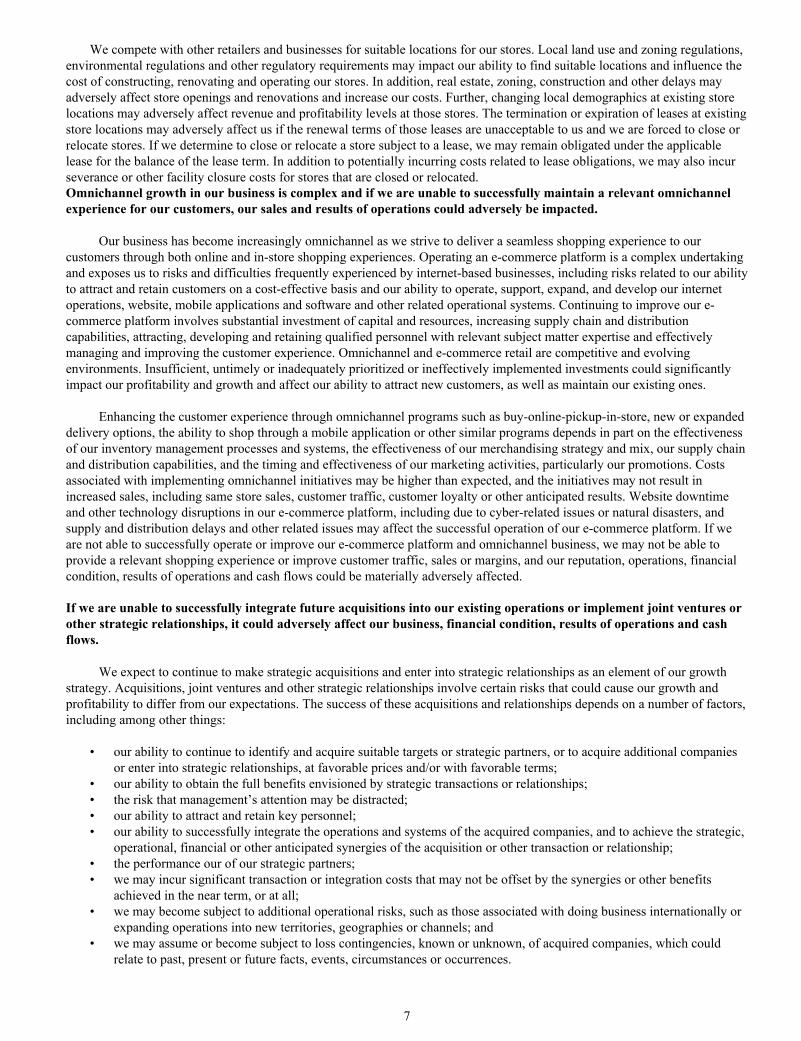
We compete with other retailers and businesses for suitable locations for our stores. Local land use and zoning regulations, environmental regulations and other regulatory requirements may impact our ability to find suitable locations and influence the cost of constructing, renovating and operating our stores. In addition, real estate, zoning, construction and other delays may adversely affect store openings and renovations and increase our costs. Further, changing local demographics at existing store locations may adversely affect revenue and profitability levels at those stores. The termination or expiration of leases at existing store locations may adversely affect us if the renewal terms of those leases are unacceptable to us and we are forced to close or relocate stores. If we determine to close or relocate a store subject to a lease, we may remain obligated under the applicable lease for the balance of the lease term. In addition to potentially incurring costs related to lease obligations, we may also incur severance or other facility closure costs for stores that are closed or relocated.Omnichannel growth in our business is complex and if we are unable to successfully maintain a relevant omnichannel experience for our customers, our sales and results of operations could adversely be impacted.
Our business has become increasingly omnichannel as we strive to deliver a seamless shopping experience to our customers through both online and in-store shopping experiences. Operating an e-commerce platform is a complex undertaking and exposes us to risks and difficulties frequently experienced by internet-based businesses, including risks related to our ability to attract and retain customers on a cost-effective basis and our ability to operate, support, expand, and develop our internet operations, website, mobile applications and software and other related operational systems. Continuing to improve our e-commerce platform involves substantial investment of capital and resources, increasing supply chain and distribution capabilities, attracting, developing and retaining qualified personnel with relevant subject matter expertise and effectively managing and improving the customer experience. Omnichannel and e-commerce retail are competitive and evolving environments. Insufficient, untimely or inadequately prioritized or ineffectively implemented investments could significantly impact our profitability and growth and affect our ability to attract new customers, as well as maintain our existing ones.
Enhancing the customer experience through omnichannel programs such as buy-online-pickup-in-store, new or expanded delivery options, the ability to shop through a mobile application or other similar programs depends in part on the effectiveness of our inventory management processes and systems, the effectiveness of our merchandising strategy and mix, our supply chain and distribution capabilities, and the timing and effectiveness of our marketing activities, particularly our promotions. Costs associated with implementing omnichannel initiatives may be higher than expected, and the initiatives may not result in increased sales, including same store sales, customer traffic, customer loyalty or other anticipated results. Website downtime and other technology disruptions in our e-commerce platform, including due to cyber-related issues or natural disasters, and supply and distribution delays and other related issues may affect the successful operation of our e-commerce platform. If we are not able to successfully operate or improve our e-commerce platform and omnichannel business, we may not be able to provide a relevant shopping experience or improve customer traffic, sales or margins, and our reputation, operations, financial condition, results of operations and cash flows could be materially adversely affected.
If we are unable to successfully integrate future acquisitions into our existing operations or implement joint ventures or other strategic relationships, it could adversely affect our business, financial condition, results of operations and cash flows.
We expect to continue to make strategic acquisitions and enter into strategic relationships as an element of our growth strategy. Acquisitions, joint ventures and other strategic relationships involve certain risks that could cause our growth and profitability to differ from our expectations. The success of these acquisitions and relationships depends on a number of factors, including among other things:
• our ability to continue to identify and acquire suitable targets or strategic partners, or to acquire additional companies or enter into strategic relationships, at favorable prices and/or with favorable terms;
• our ability to obtain the full benefits envisioned by strategic transactions or relationships;• the risk that management’s attention may be distracted;• our ability to attract and retain key personnel; • our ability to successfully integrate the operations and systems of the acquired companies, and to achieve the strategic,
operational, financial or other anticipated synergies of the acquisition or other transaction or relationship;• the performance our of our strategic partners; • we may incur significant transaction or integration costs that may not be offset by the synergies or other benefits
achieved in the near term, or at all; • we may become subject to additional operational risks, such as those associated with doing business internationally or
expanding operations into new territories, geographies or channels; and• we may assume or become subject to loss contingencies, known or unknown, of acquired companies, which could
relate to past, present or future facts, events, circumstances or occurrences.
7

If we experience difficulties implementing various information systems, including our new enterprise resource planning system (“ERP”), our ability to conduct or business could be negatively impacted.
We are dependent on information systems to facilitate the day-to-day operations of the business and to produce timely, accurate and reliable information on financial and operational results. We are in process of implementing various information systems, including a new ERP. These implementations will require significant investment of human and financial resources, and we may experience significant delays, increased costs and other difficulties with these projects. Any significant disruption or deficiency in the design and implementation of these information systems could adversely affect our ability to process orders, ship product, send invoices and track payments, fulfill contractual obligations or otherwise operate our business. While we have invested meaningful resources in planning, project management and training, additional and serious implementation issues may arise as we integrate onto these new information systems that may disrupt our operations and negatively impact our business, financial condition, results of operations and cash flows.
If we are unable to maintain adequate supply chain capacity and improve supply chain efficiency, we will not be able to expand our business, which could adversely affect our business, financial condition, results of operations and cash flows.
Our store inventories are primarily replenished by shipments from our network of distribution centers, warehouses and HUB stores. As we expand our market presence, we will need to increase the efficiency and maintain adequate capacity of our supply chain network in order to achieve the business goal of reducing inventory costs while improving availability and movement of goods throughout our supply chain to meet consumer product needs and channel preferences. We continue to streamline and optimize our supply chain network and systems. If our investments in our supply chain do not provide the anticipated benefits, we could experience sub-optimal inventory levels or increases in our costs, which could adversely affect our business, financial condition, results of operations and cash flows.
We are dependent on our suppliers to supply us with products that comply with safety and quality standards at competitive prices.
We are dependent on our vendors continuing to supply us quality products on payment terms that are favorable to us. If our merchandise offerings do not meet our customers’ expectations regarding safety and quality, we could experience lost sales, increased costs and exposure to legal and reputational risk. Our suppliers are subject to applicable product safety laws, and we are dependent on them to ensure that the products we buy comply with all safety and quality standards. Events that give rise to actual, potential or perceived product safety concerns could expose us to government enforcement action and private litigation and result in costly product recalls and other liabilities. To the extent our suppliers are subject to additional government regulation of their product design and/or manufacturing processes, the cost of the merchandise we purchase may rise. In addition, negative customer perceptions regarding the safety or quality of the products we sell could cause our customers to seek alternative sources for their needs, resulting in lost sales. In those circumstances, it may be difficult and costly for us to regain the confidence of our customers.
Our reliance on suppliers subjects us to various risks and uncertainties which could affect our financial results.
We source the products we sell from a wide variety of domestic and international suppliers. Our financial results depend on us securing acceptable terms with our suppliers for, among other things, the price of merchandise we purchase from them, funding for various forms of promotional programs, payment terms and terms covering returns and factory warranties. To varying degrees, our suppliers may be able to leverage their competitive advantages - for example, their financial strength, the strength of their brand with customers, their own stores or online channels or their relationships with other retailers - to our commercial disadvantage. Generally, our ability to negotiate favorable terms with our suppliers is more difficult with suppliers for whom our purchases represent a smaller proportion of their total revenues, consequently impacting our profitability from such vendor relationships. We have established standards for product safety and quality and workplace standards that we require all our suppliers to meet. We do not condone human trafficking, forced labor, child labor, harassment or abuse of any kind, and we expect our suppliers to operate within these same principles. Our ability to find qualified suppliers who can supply products in a timely and efficient manner that meet our standards can be challenging. Suppliers may also fail to invest adequately in design, production or distribution facilities, may reduce their customer incentives, advertising and promotional activities or change their pricing policies. If we encounter any of these issues with our suppliers, our business, financial condition, results of operations and cash flows could be adversely impacted.
8

We depend on the services of many qualified executives and other Team Members, whom we may not be able to attract, develop and retain.
Our success depends to a significant extent on the continued engagement, services and experience of our executives and other Team Members. We may not be able to retain our current executives and other key Team Members or attract and retain additional qualified executives and Team Members who may be needed in the future. Our ability to attract, develop and retain an adequate number of qualified Team Members depends on factors such as employee morale, our reputation, competition from other employers, availability of qualified personnel, our ability to offer competitive compensation and benefit packages and our ability to maintain a safe working environment. We also believe our future success will depend in part upon our ability to attract and retain highly skilled personnel for whom the market is highly competitive, particularly for individuals with certain types of technical skills. Failure to recruit or retain qualified employees may impair our efficiency and effectiveness and our ability to pursue growth opportunities. Additionally, turnover in executive or other key positions can disrupt progress in implementing business strategies, result in a loss of institutional knowledge, cause other Team Members to take on substantially more responsibility, resulting in greater workload demands and diverting attention away from key areas of the business, or otherwise negatively impact our growth prospects or future operating results.
We operate in a competitive labor market and there is a risk that market increases in compensation could have an adverse effect on our profitability. Market or government regulated increases to employee hourly wage rates, along with our ability to implement corresponding adjustments within our labor model and wage rates, could have a significant impact to the profitability of our business. In addition, approximately one percent of our Team Members are represented by unions. If these Team Members were to engage in a strike, work stoppage, or other slowdown, or if the terms and conditions in labor agreements were renegotiated, we could experience a disruption in our operations and higher ongoing labor costs. If we fail or are unable to maintain competitive compensation, our customer service and execution levels could suffer by reason of a declining quality of our workforce, which could adversely affect our business, financial condition, results of operations and cash flows.
Because we are involved in litigation from time to time, and are subject to numerous laws and governmental regulations, we could incur substantial judgments, fines, legal fees and other costs.
We are sometimes the subject of complaints or litigation, which may include class action litigation from customers, Team Members or others for various actions. From time to time, we are involved in litigation involving claims related to, among other things, breach of contract, tortious conduct, employment, discrimination, breach of laws or regulations (including The Americans With Disabilities Act), payment of wages, exposure to asbestos or potentially hazardous product, real estate and product defects. The damages sought against us in some of these litigation proceedings are substantial. Although we maintain liability insurance for some litigation claims, if one or more of the claims were to greatly exceed our insurance coverage limits or if our insurance policies do not cover a claim, this could have a material adverse effect on our business, financial condition, results of operations and cash flows. For instance, we are currently subject to a putative securities class action regarding past public disclosures (see Item 3, "Legal Proceedings" of this Annual Report on Form 10-K) and to numerous lawsuits alleging injury as a result of exposure to asbestos-containing products (see Note 13, Contingencies, of the Notes to the Consolidated Financial Statements included herein).
We are subject to numerous federal, state and local laws and governmental regulations relating to, among other things, environmental protection, product quality and safety standards, building and zoning requirements, labor and employment, discrimination, anti-bribery/anti-corruption, data privacy and income taxes. Compliance with existing and future laws and regulations could increase the cost of doing business and adversely affect our results of operations. If we fail to comply with existing or future laws or regulations, we may be subject to governmental or judicial fines or sanctions, while incurring substantial legal fees and costs, as well as reputational risk. In addition, our capital and operating expenses could increase due to remediation measures that may be required if we are found to be noncompliant with any existing or future laws or regulations.
9

We work diligently to maintain the privacy and security of our customer, supplier, Team Member and business information and the functioning of our computer systems, website and other on-line offerings. In the event of a security breach or other cyber security incident, we could experience adverse operational effects or interruptions and/or become subject to legal or regulatory proceedings, any of which could lead to damage to our reputation in the marketplace and substantial costs.
The nature of our business requires us to receive, retain and transmit certain personally identifiable information about our customers, suppliers and Team Members, some of which is entrusted to third-party service providers. While we have taken and continue to undertake significant steps to protect such personally identifiable information and other confidential information and to protect the functioning of our computer systems, website and other online offerings, a compromise of our data security systems or those of businesses we interact with could result in information related to our customers, suppliers, Team Members or business being obtained by unauthorized persons or adverse operational effects or interruptions, which could have a material adverse effect on our business, financial condition, results of operations and cash flows. We develop, maintain and update processes and systems in an effort to try to prevent this from occurring, but these actions are costly and require constant, ongoing attention as technologies change, privacy and information security regulations change, and efforts to overcome security measures by bad actors continue to become ever more sophisticated. The cost of complying with stricter and more complex data privacy (such as the California Consumer Privacy Act, which grants expanded rights to access and delete personal information and opt out of certain personal information sharing), data collection and information security laws and standards could also be significant to us. Such laws and standards may also increase our responsibility and liability in relation to personal data that we process, and we may be required to put in place additional mechanisms ensuring compliance with privacy laws and regulations.
Despite our efforts, our security measures may be breached in the future due to a cyber-attack, computer malware viruses, exploitation of hardware and software vulnerabilities, Team Member error, malfeasance, fraudulent inducement (including so-called “social engineering” attacks and “phishing” scams) or other acts. While we have experienced threats to our data and systems, including phishing attacks, to date we are not aware that we have experienced a material cyber-security breach that has in any manner hindered our operational capabilities. Unauthorized parties may in the future obtain access to our data or the data of our customers, suppliers or Team Members or may otherwise cause damage to or interfere with our equipment, our data and/or our network including our supply chain. While the Company maintains insurance coverage that may, subject to policy terms and conditions, cover certain aspects of cyber risks, such insurance coverage may be insufficient to cover losses in any particular situation. Any breach, damage to or interference with our equipment or our network, or unauthorized access in the future could result in significant operational difficulties including legal and financial exposure and damage to our reputation that could potentially have an adverse effect on our business. While we also seek to obtain assurances that others we interact with will protect confidential information, there is always the risk that the confidentiality or accessibility of data held or utilized by others may be compromised. If a compromise of our data security or function of our computer systems or website were to occur, it could have a material adverse effect on our operating results and financial condition and possibly subject us to additional legal, regulatory and operating costs and damage our reputation in the marketplace.
Business interruptions may negatively impact our store hours, operability of our computer systems and the availability and cost of merchandise, which may adversely impact our sales and profitability.
Hurricanes, tornadoes, earthquakes or other natural disasters, war or acts of terrorism, public health issues or pandemics or the threat of any of these incidents or others, may have a negative impact on our ability to obtain merchandise to sell in our stores, result in certain of our stores being closed for an extended period of time, negatively affect the lives of our customers or Team Members, or otherwise negatively impact our operations. Some of our merchandise is imported from other countries. If imported goods become difficult or impossible to import into the United States due to business interruption (including regulation of exporting or importing), and if we cannot obtain such merchandise from other sources at similar costs and without an adverse delay, our sales and profit margins may be negatively affected.
In the event that commercial transportation, including the global shipping industry, is curtailed or substantially delayed, our business may be adversely impacted as we may have difficulty receiving merchandise from our suppliers and/or transporting it to our stores.
Terrorist attacks, war in the Middle East, geopolitical unrest or uncertainty or insurrection involving any oil producing country could result in an abrupt increase in the price of crude oil, gasoline and diesel fuel. Such price increases would increase the cost of doing business for us and our suppliers, and also negatively impact our customers’ disposable income, causing an adverse impact on our business, sales, profit margins and results of operations.
10
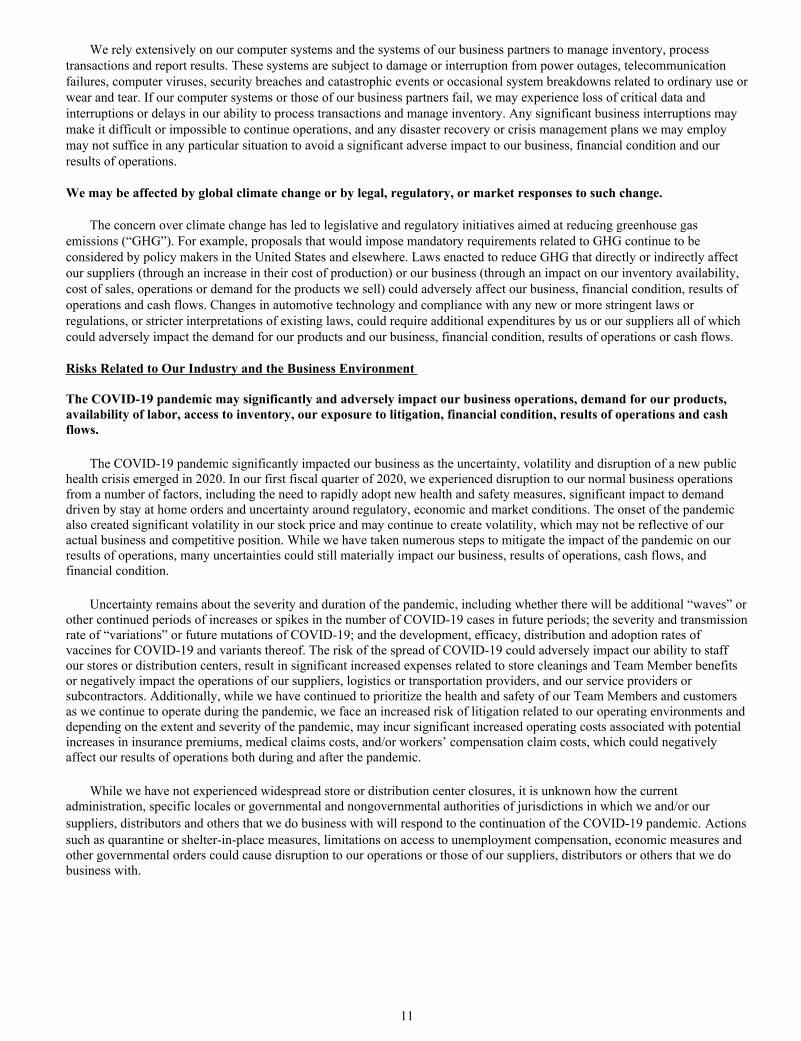
We rely extensively on our computer systems and the systems of our business partners to manage inventory, process transactions and report results. These systems are subject to damage or interruption from power outages, telecommunication failures, computer viruses, security breaches and catastrophic events or occasional system breakdowns related to ordinary use or wear and tear. If our computer systems or those of our business partners fail, we may experience loss of critical data and interruptions or delays in our ability to process transactions and manage inventory. Any significant business interruptions may make it difficult or impossible to continue operations, and any disaster recovery or crisis management plans we may employ may not suffice in any particular situation to avoid a significant adverse impact to our business, financial condition and our results of operations.
We may be affected by global climate change or by legal, regulatory, or market responses to such change.
The concern over climate change has led to legislative and regulatory initiatives aimed at reducing greenhouse gas emissions (“GHG”). For example, proposals that would impose mandatory requirements related to GHG continue to be considered by policy makers in the United States and elsewhere. Laws enacted to reduce GHG that directly or indirectly affect our suppliers (through an increase in their cost of production) or our business (through an impact on our inventory availability, cost of sales, operations or demand for the products we sell) could adversely affect our business, financial condition, results of operations and cash flows. Changes in automotive technology and compliance with any new or more stringent laws or regulations, or stricter interpretations of existing laws, could require additional expenditures by us or our suppliers all of which could adversely impact the demand for our products and our business, financial condition, results of operations or cash flows.
Risks Related to Our Industry and the Business Environment
The COVID-19 pandemic may significantly and adversely impact our business operations, demand for our products, availability of labor, access to inventory, our exposure to litigation, financial condition, results of operations and cash flows.
The COVID-19 pandemic significantly impacted our business as the uncertainty, volatility and disruption of a new public health crisis emerged in 2020. In our first fiscal quarter of 2020, we experienced disruption to our normal business operations from a number of factors, including the need to rapidly adopt new health and safety measures, significant impact to demand driven by stay at home orders and uncertainty around regulatory, economic and market conditions. The onset of the pandemic also created significant volatility in our stock price and may continue to create volatility, which may not be reflective of our actual business and competitive position. While we have taken numerous steps to mitigate the impact of the pandemic on our results of operations, many uncertainties could still materially impact our business, results of operations, cash flows, and financial condition.
Uncertainty remains about the severity and duration of the pandemic, including whether there will be additional “waves” or other continued periods of increases or spikes in the number of COVID-19 cases in future periods; the severity and transmission rate of “variations” or future mutations of COVID-19; and the development, efficacy, distribution and adoption rates of vaccines for COVID-19 and variants thereof. The risk of the spread of COVID-19 could adversely impact our ability to staff our stores or distribution centers, result in significant increased expenses related to store cleanings and Team Member benefits or negatively impact the operations of our suppliers, logistics or transportation providers, and our service providers or subcontractors. Additionally, while we have continued to prioritize the health and safety of our Team Members and customers as we continue to operate during the pandemic, we face an increased risk of litigation related to our operating environments and depending on the extent and severity of the pandemic, may incur significant increased operating costs associated with potential increases in insurance premiums, medical claims costs, and/or workers’ compensation claim costs, which could negatively affect our results of operations both during and after the pandemic.
While we have not experienced widespread store or distribution center closures, it is unknown how the current administration, specific locales or governmental and nongovernmental authorities of jurisdictions in which we and/or our suppliers, distributors and others that we do business with will respond to the continuation of the COVID-19 pandemic. Actions such as quarantine or shelter-in-place measures, limitations on access to unemployment compensation, economic measures and other governmental orders could cause disruption to our operations or those of our suppliers, distributors or others that we do business with.
11

If overall demand for the products we sell declines, our business, financial condition, results of operations and cash flows will suffer. Decreased demand could also negatively impact our stock price.
Overall demand for products sold by our stores depends on many factors and may decrease due to any number of reasons, including:
• a decrease in the total number of vehicles on the road or in the number of annual miles driven or significant increase in the use of ridesharing services, because fewer vehicles means less maintenance and repairs, and lower vehicle mileage, which decreases the need for maintenance and repair;
• the economy, as consumers reduce their discretionary spending by deferring vehicle maintenance or repair, sales may decline and as new car purchases increase, the number of cars requiring maintenance and repair may decrease.
• the weather, because milder weather conditions may lower the failure rates of automobile parts while extended periods of rain and winter precipitation may cause our customers to defer elective maintenance and repair of their vehicles;
• the average duration of vehicle manufacturer warranties and average age of vehicles being driven, because newer cars typically require fewer repairs and will be repaired by the manufacturers’ dealer networks using dealer parts pursuant to warranties (which have gradually increased in duration and/or mileage expiration over the recent past), while vehicles that are seven years old and older are generally no longer covered under manufacturers’ warranties and tend to need more maintenance and repair than newer vehicles;
• an increase in internet-based retailers, because potentially favorable prices and ease of use of purchasing parts via other websites on the internet may decrease the need for customers to visit and purchase their aftermarket parts from our physical stores and may cause fewer customers to order aftermarket parts on our website;
• technological advances, such as battery electric vehicles, and the increase in quality of vehicles manufactured, because vehicles that need less frequent maintenance or have lower part failure rates will require less frequent repairs using aftermarket parts and, in the case of battery electric vehicles, do not require oil changes; and
• the refusal of vehicle manufacturers to make available diagnostic, repair and maintenance information to the automotive aftermarket industry that our Professional and DIY customers require to diagnose, repair and maintain their vehicles, because this may force consumers to have a majority of diagnostic work, repairs and maintenance performed by the vehicle manufacturers’ dealer networks.
If we are unable to compete successfully against other companies in the automotive aftermarket industry, we may lose customers and our revenues may decline.
The sale of automotive parts, accessories and maintenance items is highly competitive and influenced by a number of factors, including name recognition, location, price, quality, product availability and customer service. We compete in both the Professional and DIY categories of the automotive aftermarket industry, primarily with: (i) national and regional chains of automotive parts stores, (ii) internet-based retailers, (iii) discount stores and mass merchandisers that carry automotive products, (iv) wholesalers or jobbers stores, including those associated with national parts distributors or associations (v) independently owned stores and (vi) automobile dealers that supply parts. These competitors and the level of competition vary by market. Some of our competitors may possess advantages over us in certain markets we share, including with respect to the level of marketing activities, number of stores, store locations, store layouts, operating histories, name recognition, established customer bases, vendor relationships, prices and product warranties. Internet-based retailers may possess cost advantages over us due to lower overhead costs, time and travel savings and ability to price competitively. In order to compete favorably, we may need to increase delivery speeds and incur higher shipping costs. Consolidation among our competitors could enhance their market share and financial position, provide them with the ability to achieve better purchasing terms and allow them to provide more competitive prices to customers for whom we compete.
In addition, our reputation is critical to our continued success. Customers are increasingly shopping, reading reviews and comparing products and prices on-line. If we fail to maintain high standards for; or receive negative publicity (whether through social media or traditional media channels) relating to, product safety and quality or our integrity and reputation, we could lose customers to our competition. The product we sell is branded both in brands of our vendors and in our owned private label brands. If the perceived quality or value of the brands we sell declines in the eyes of our customers, our results of operations could be negatively affected.
Competition may require us to reduce our prices below our normal selling prices or increase our promotional spending, which could lower our revenue and profitability. Competitive disadvantages may also prevent us from introducing new product lines, require us to discontinue current product offerings, or change some of our current operating strategies. If we do not have the resources, expertise and consistent execution, or otherwise fail to develop successful strategies, to address these potential competitive disadvantages, we may lose customers, our revenues and profit margins may decline and we may be less profitable or potentially unprofitable.
12
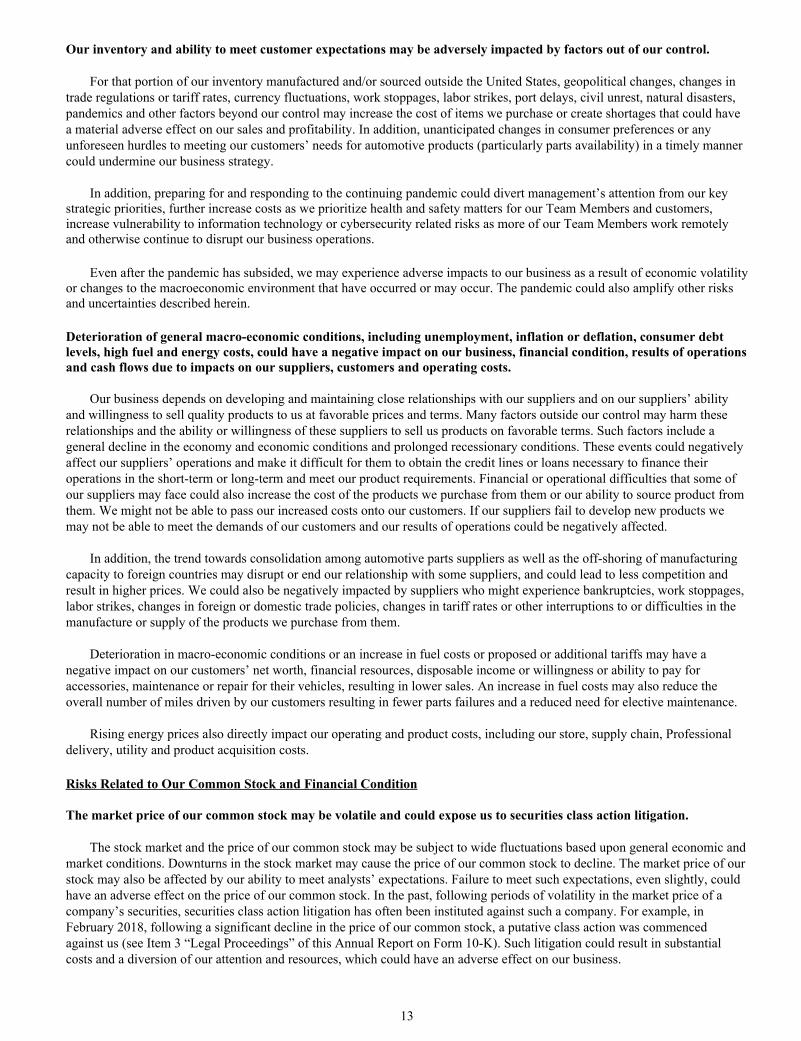
Our inventory and ability to meet customer expectations may be adversely impacted by factors out of our control.
For that portion of our inventory manufactured and/or sourced outside the United States, geopolitical changes, changes in trade regulations or tariff rates, currency fluctuations, work stoppages, labor strikes, port delays, civil unrest, natural disasters, pandemics and other factors beyond our control may increase the cost of items we purchase or create shortages that could have a material adverse effect on our sales and profitability. In addition, unanticipated changes in consumer preferences or any unforeseen hurdles to meeting our customers’ needs for automotive products (particularly parts availability) in a timely manner could undermine our business strategy.
In addition, preparing for and responding to the continuing pandemic could divert management’s attention from our key strategic priorities, further increase costs as we prioritize health and safety matters for our Team Members and customers, increase vulnerability to information technology or cybersecurity related risks as more of our Team Members work remotely and otherwise continue to disrupt our business operations.
Even after the pandemic has subsided, we may experience adverse impacts to our business as a result of economic volatility or changes to the macroeconomic environment that have occurred or may occur. The pandemic could also amplify other risks and uncertainties described herein.
Deterioration of general macro-economic conditions, including unemployment, inflation or deflation, consumer debt levels, high fuel and energy costs, could have a negative impact on our business, financial condition, results of operations and cash flows due to impacts on our suppliers, customers and operating costs.
Our business depends on developing and maintaining close relationships with our suppliers and on our suppliers’ ability and willingness to sell quality products to us at favorable prices and terms. Many factors outside our control may harm these relationships and the ability or willingness of these suppliers to sell us products on favorable terms. Such factors include a general decline in the economy and economic conditions and prolonged recessionary conditions. These events could negatively affect our suppliers’ operations and make it difficult for them to obtain the credit lines or loans necessary to finance their operations in the short-term or long-term and meet our product requirements. Financial or operational difficulties that some of our suppliers may face could also increase the cost of the products we purchase from them or our ability to source product from them. We might not be able to pass our increased costs onto our customers. If our suppliers fail to develop new products we may not be able to meet the demands of our customers and our results of operations could be negatively affected.
In addition, the trend towards consolidation among automotive parts suppliers as well as the off-shoring of manufacturing capacity to foreign countries may disrupt or end our relationship with some suppliers, and could lead to less competition and result in higher prices. We could also be negatively impacted by suppliers who might experience bankruptcies, work stoppages, labor strikes, changes in foreign or domestic trade policies, changes in tariff rates or other interruptions to or difficulties in the manufacture or supply of the products we purchase from them.
Deterioration in macro-economic conditions or an increase in fuel costs or proposed or additional tariffs may have a negative impact on our customers’ net worth, financial resources, disposable income or willingness or ability to pay for accessories, maintenance or repair for their vehicles, resulting in lower sales. An increase in fuel costs may also reduce the overall number of miles driven by our customers resulting in fewer parts failures and a reduced need for elective maintenance.
Rising energy prices also directly impact our operating and product costs, including our store, supply chain, Professional delivery, utility and product acquisition costs.
Risks Related to Our Common Stock and Financial Condition
The market price of our common stock may be volatile and could expose us to securities class action litigation.
The stock market and the price of our common stock may be subject to wide fluctuations based upon general economic and market conditions. Downturns in the stock market may cause the price of our common stock to decline. The market price of our stock may also be affected by our ability to meet analysts’ expectations. Failure to meet such expectations, even slightly, could have an adverse effect on the price of our common stock. In the past, following periods of volatility in the market price of a company’s securities, securities class action litigation has often been instituted against such a company. For example, in February 2018, following a significant decline in the price of our common stock, a putative class action was commenced against us (see Item 3 “Legal Proceedings” of this Annual Report on Form 10-K). Such litigation could result in substantial costs and a diversion of our attention and resources, which could have an adverse effect on our business.
13

The amount and frequency of our share repurchases and dividend payments may fluctuate.
The amount, timing and execution of our share repurchase program may fluctuate based on our priorities for the use of cash for other purposes such as operational spending, capital spending, acquisitions or repayment of debt. Changes in cash flows, tax laws and our share price could also impact our share repurchase program and other capital activities. Additionally, decisions to return capital to shareholders, including through our repurchase program or the issuance of dividends on our common stock, remain subject to determination of our Board of Directors that any such activity is in the best interests of our shareholders and is in compliance with all applicable laws and contractual obligations.
Our level of indebtedness, a downgrade in our credit ratings or a deterioration in global credit markets could limit the cash flow available for operations and could adversely affect our ability to service our debt or obtain additional financing.
Our level of indebtedness could restrict our operations and make it more difficult for us to satisfy our debt obligations. For example, our level of indebtedness could, among other things:
• affect our liquidity by limiting our ability to obtain additional financing for working capital;• limit our ability to obtain financing for capital expenditures and acquisitions or make any available financing more
costly;• require us to dedicate all or a substantial portion of our cash flow to service our debt, which would reduce funds
available for other business purposes, such as capital expenditures, dividends or acquisitions;• limit our flexibility in planning for or reacting to changes in the markets in which we compete;• place us at a competitive disadvantage relative to our competitors who may have less indebtedness;• render us more vulnerable to general adverse economic and industry conditions; and• make it more difficult for us to satisfy our financial obligations.
The indenture governing our notes and credit agreement governing our credit facilities contain financial and other restrictive covenants. Our failure to comply with those covenants could result in an event of default which, if not cured or waived, could result in the acceleration of all of our debt, including such notes.
In addition, our overall credit rating may be negatively impacted by deteriorating and uncertain credit markets or other factors that may or may not be within our control. The interest rates on our publicly issued debt and revolving credit facility are linked directly to our credit ratings. Accordingly, any negative impact on our credit ratings would likely result in higher interest rates and interest expense on any borrowings under our revolving credit facility or future issuances of public debt and less favorable terms on other operating and financing arrangements. In addition, it could reduce the attractiveness of certain vendor payment programs whereby third-party institutions finance arrangements to our vendors based on our credit rating, which could result in increased working capital requirements.
Conditions and events in the global credit market could have a material adverse effect on our access to short and long-term borrowings to finance our operations and the terms and cost of that debt. It is possible that one or more of the banks that provide us with financing under our revolving credit facility may fail to honor the terms of our existing credit facility or be financially unable to provide the unused credit as a result of significant deterioration in such bank’s financial condition. An inability to obtain sufficient financing at cost-effective rates could have a material adverse effect on our business, financial condition, results of operations and cash flows.
Item 1B. Unresolved Staff Comments.
None.
14

Item 2. Properties.
The following table summarizes the location, ownership status and total square footage of space utilized for distribution centers, principal corporate offices and retail stores and branches at the end of 2020:
Square Footage (in thousands)Location Leased Owned
Distribution centers 51 locations in 32 U.S. states and 4 Canadian provinces 7,304 4,401
Principal corporate offices:Raleigh, NC Raleigh, NC 387 — Roanoke, VA Roanoke, VA 265 —
Stores and branches4,809 stores and branches in 49 U.S. states and 2 U.S. territories and 167 stores and branches in 9 Canadian
provinces 34,755 6,307
Item 3. Legal Proceedings.
On February 6, 2018, a putative class action on behalf of purchasers of our securities who purchased or otherwise acquired their securities between November 14, 2016 and August 15, 2017, inclusive (the “Class Period”), was commenced against us and certain of our current and former officers in the U.S. District Court for the District of Delaware. The plaintiff alleges that the defendants failed to disclose material adverse facts about our financial well-being, business relationships, and prospects during the alleged Class Period in violation of Section 10(b) of the Securities Exchange Act of 1934 and Rule 10b-5 promulgated thereunder. On February 7, 2020 the court granted in part and denied in part our motion to dismiss. The surviving claims are subject to discovery. On November 6, 2020 the court granted plaintiff’s motion for class certification. In addition, derivative complaints purportedly on behalf of the Company were filed against us as nominal defendant and certain of our current and former officers and directors related to similar allegations for the Class Period on April 29, 2020 in the U.S. District Court for the District of Delaware and August 13, 2020 in the Delaware Court of Chancery. The defendants have moved to dismiss the federal derivative complaint and the state court derivative claim is stayed pending the determination of the federal motion to dismiss. We strongly dispute the allegations of the complaints and intend to defend the cases vigorously.
Refer to discussion in Note 13, Contingencies, of the Notes to the Consolidated Financial Statements included herein for information relating to additional legal proceedings.
Item 4. Mine Safety Disclosures.
Not applicable.
15

PART II
Item 5. Market for Registrant’s Common Equity, Related Stockholder Matters and Issuer Purchases of Equity Securities.
Our common stock is listed on the New York Stock Exchange (“NYSE”) under the symbol “AAP.”
At February 17, 2021, there were 293 holders of record of our common stock, which does not include the number of beneficial owners whose shares were represented by security position listings.
Our share repurchase program authorizing the repurchase of up to $400.0 million in common stock was authorized by our Board of Directors on August 7, 2019. On November 8, 2019 our Board of Directors authorized $700 million as an addition to the existing share repurchase program. The following table sets forth information with respect to repurchases of our common stock for the fourth quarter ended January 2, 2021:
Period
Total Number of Shares
Purchased (1)
Average Price Paid
per Share (1)
Total Number of Shares Purchased
as Part of Publicly
Announced Programs
Maximum Dollar Value that May Yet
Be Purchased Under the Programs
(In thousands)October 4, 2020 to October 30, 2020 492,429 $ 154.31 492,429 $ 676,170 November 1, 2020 to November 28, 2020 592,062 147.07 582,298 590,534 November 29, 2020 to January 2, 2021 1,026,947 154.15 1,026,939 432,234 Total 2,111,438 $ 152.20 2,101,666 $ 432,234
(1) The aggregate cost of repurchasing shares in connection with the net settlement of shares issued as a result of the
vesting of restricted stock units was $1.4 million, or an average price of $147.24 per share, during the twelve weeks ended January 2, 2021.
16

Stock Price Performance
The following graph shows a comparison of the cumulative total return on our common stock, the Standard & Poor’s (“S&P”) 500 Index and the Standard & Poor’s Retail Index. The graph assumes that the value of an investment in our common stock and in each such index was $100 on January 2, 2016, and that any dividends have been reinvested. The comparison in the graph below is based solely on historical data and is not intended to forecast the possible future performance of our common stock.
COMPARISON OF CUMULATIVE TOTAL RETURN AMONGADVANCE AUTO PARTS, INC., S&P 500 INDEX
AND S&P RETAIL INDEX
Advance Auto Parts S&P 500 Index S&P Retail Index
01/02/1612/31/16
12/30/1712/29/18
12/28/1901/02/21
$50.00
$100.00
$150.00
$200.00
$250.00
$300.00
Company/IndexJanuary 2,
2016December 31,
2016December 30,
2017December 29,
2018December 28,
2019January 2,
2021Advance Auto Parts $ 100.00 $ 112.36 $ 66.23 $ 103.29 $ 105.21 $ 104.65 S&P 500 Index $ 100.00 $ 100.00 $ 136.40 $ 129.31 $ 171.94 $ 203.04 S&P Retail Index $ 100.00 $ 104.64 $ 135.08 $ 150.14 $ 192.14 $ 277.63
17
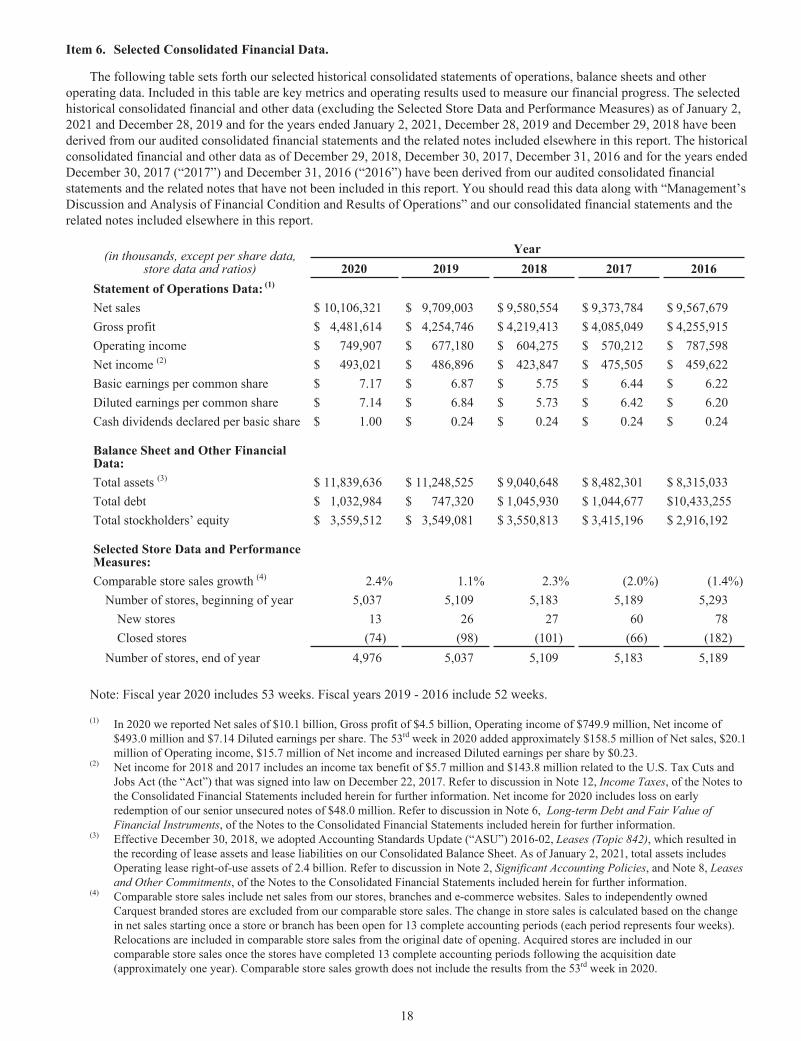
Item 6. Selected Consolidated Financial Data.
The following table sets forth our selected historical consolidated statements of operations, balance sheets and other operating data. Included in this table are key metrics and operating results used to measure our financial progress. The selected historical consolidated financial and other data (excluding the Selected Store Data and Performance Measures) as of January 2, 2021 and December 28, 2019 and for the years ended January 2, 2021, December 28, 2019 and December 29, 2018 have been derived from our audited consolidated financial statements and the related notes included elsewhere in this report. The historical consolidated financial and other data as of December 29, 2018, December 30, 2017, December 31, 2016 and for the years ended December 30, 2017 (“2017”) and December 31, 2016 (“2016”) have been derived from our audited consolidated financial statements and the related notes that have not been included in this report. You should read this data along with “Management’s Discussion and Analysis of Financial Condition and Results of Operations” and our consolidated financial statements and the related notes included elsewhere in this report.
(in thousands, except per share data, store data and ratios)
Year2020 2019 2018 2017 2016
Statement of Operations Data: (1)
Net sales $ 10,106,321 $ 9,709,003 $ 9,580,554 $ 9,373,784 $ 9,567,679 Gross profit $ 4,481,614 $ 4,254,746 $ 4,219,413 $ 4,085,049 $ 4,255,915 Operating income $ 749,907 $ 677,180 $ 604,275 $ 570,212 $ 787,598 Net income (2) $ 493,021 $ 486,896 $ 423,847 $ 475,505 $ 459,622 Basic earnings per common share $ 7.17 $ 6.87 $ 5.75 $ 6.44 $ 6.22 Diluted earnings per common share $ 7.14 $ 6.84 $ 5.73 $ 6.42 $ 6.20 Cash dividends declared per basic share $ 1.00 $ 0.24 $ 0.24 $ 0.24 $ 0.24
Balance Sheet and Other Financial Data:Total assets (3) $ 11,839,636 $ 11,248,525 $ 9,040,648 $ 8,482,301 $ 8,315,033 Total debt $ 1,032,984 $ 747,320 $ 1,045,930 $ 1,044,677 $ 10,433,255 Total stockholders’ equity $ 3,559,512 $ 3,549,081 $ 3,550,813 $ 3,415,196 $ 2,916,192
Selected Store Data and Performance Measures:Comparable store sales growth (4) 2.4% 1.1% 2.3% (2.0%) (1.4%)
Number of stores, beginning of year 5,037 5,109 5,183 5,189 5,293 New stores 13 26 27 60 78 Closed stores (74) (98) (101) (66) (182)
Number of stores, end of year 4,976 5,037 5,109 5,183 5,189
Note: Fiscal year 2020 includes 53 weeks. Fiscal years 2019 - 2016 include 52 weeks.
(1) In 2020 we reported Net sales of $10.1 billion, Gross profit of $4.5 billion, Operating income of $749.9 million, Net income of $493.0 million and $7.14 Diluted earnings per share. The 53rd week in 2020 added approximately $158.5 million of Net sales, $20.1 million of Operating income, $15.7 million of Net income and increased Diluted earnings per share by $0.23.
(2) Net income for 2018 and 2017 includes an income tax benefit of $5.7 million and $143.8 million related to the U.S. Tax Cuts and Jobs Act (the “Act”) that was signed into law on December 22, 2017. Refer to discussion in Note 12, Income Taxes, of the Notes to the Consolidated Financial Statements included herein for further information. Net income for 2020 includes loss on early redemption of our senior unsecured notes of $48.0 million. Refer to discussion in Note 6, Long-term Debt and Fair Value of Financial Instruments, of the Notes to the Consolidated Financial Statements included herein for further information.
(3) Effective December 30, 2018, we adopted Accounting Standards Update (“ASU”) 2016-02, Leases (Topic 842), which resulted in the recording of lease assets and lease liabilities on our Consolidated Balance Sheet. As of January 2, 2021, total assets includes Operating lease right-of-use assets of 2.4 billion. Refer to discussion in Note 2, Significant Accounting Policies, and Note 8, Leases and Other Commitments, of the Notes to the Consolidated Financial Statements included herein for further information.
(4) Comparable store sales include net sales from our stores, branches and e-commerce websites. Sales to independently owned Carquest branded stores are excluded from our comparable store sales. The change in store sales is calculated based on the change in net sales starting once a store or branch has been open for 13 complete accounting periods (each period represents four weeks). Relocations are included in comparable store sales from the original date of opening. Acquired stores are included in our comparable store sales once the stores have completed 13 complete accounting periods following the acquisition date (approximately one year). Comparable store sales growth does not include the results from the 53rd week in 2020.
18

Item 7. Management’s Discussion and Analysis of Financial Condition and Results of Operations.
The following discussion and analysis of financial condition and results of operations should be read in conjunction with our consolidated historical financial statements and the notes to those statements that appear elsewhere in this report. Our discussion contains forward-looking statements based upon current expectations that involve risks and uncertainties, such as our plans, objectives, expectations and intentions. Actual results and the timing of events could differ materially from those anticipated in these forward-looking statements as a result of a number of factors, including those set forth under the section titled “Part 1. Item 1A. Risk Factors” elsewhere in this report.
Impact of COVID-19 on Our Business
During the COVID-19 pandemic, we continued to prioritize the health, safety and wellbeing of our Team Members and customers; worked to drive financial performance by preserving our cash position, scrutinized planned spending and the prioritization of various initiatives; and worked to help ensure that when the current period of crisis passes, our team will emerge even stronger.
In response to the COVID-19 pandemic, we have continued to take additional measures to help ensure the health, safety and wellbeing of our Team Members and customers. Such measures include retro-fitting our stores with plexiglass care shields, the continuation of certain labor-related benefits for Team Members, social distancing practices, sanitation practices, the use of health check screenings and offering contactless delivery.
Government imposed restrictions and stay at home orders related to the pandemic occurred during our first quarter of 2020. These contributed to negative impacts to demand, primarily during the last six weeks of the sixteen weeks ended April 18, 2020. However, as the second and third quarters of 2020 progressed, we experienced a significant improvement in demand, particularly in our DIY omnichannel business. While government restrictions began to tighten again in the fourth quarter of 2020, we still experienced increased demand, resulting in increased comparable store sales.
In addition to external factors, we believe the execution of prioritized internal initiatives, including our new marketing campaign and providing a variety of shopping choices for customers with our Advance Same Day options, contributed to driving demand and the improvement in our results. We have also continued to make progress on the execution of our key supply chain initiatives, including cross-banner replenishment and our single warehouse management system.
Despite the increase in Net sales during the fifty-three weeks ended January 2, 2021, the COVID-19 pandemic remains an evolving situation. We continue to actively monitor developments that may cause us to take further actions that alter our business operations as may be required by federal, state or local authorities or that we determine are in the best interests of our Team Members, customers, suppliers and stockholders.
Management Overview
Net sales increased 4.1% in 2020 as compared to 2019, which was primarily driven by an increase in comparable store sales of 2.4% resulting from growth in our DIY omnichannel business, with the remaining increase attributable to 2020 including a 53rd week of operations versus only 52 weeks of operations in 2019. We experienced positive comparable store sales across every region, with Southeast, Florida and Central having the strongest growth. Our West, Mid Atlantic and Northeast regions had the lowest comparable sales growth.
We generated Diluted earnings per share (“Diluted EPS”) of $7.14 during 2020 compared to $6.84 in 2019. When adjusted for the following non-operational items, our Adjusted diluted earnings per share (“Adjusted EPS”) in 2020 was $8.51 compared to $8.19 during 2019:
Year Ended January 2,
2021December 28,
2019Transformation expenses $ 0.55 $ 0.81 General Parts International, Inc. (“GPI”) amortization of acquired intangible assets $ 0.30 $ 0.29 Other adjustments $ 0.52 $ 0.25
19
Refer to “Reconciliation of Non-GAAP Financial Measures” for further details of our comparable adjustments and the usefulness of such measures to investors.
A high-level summary of our financial results and other highlights from 2020 includes:
• Net sales during 2020 were $10.1 billion, an increase of 4.1% as compared to 2019, primarily driven by an increase in comparable store sales of 2.4%, led by growth in our DIY omnichannel business, as well as $158.5 million of Net sales attributable to the additional week in 2020.
• Gross profit margin for 2020 was 44.3% of Net sales, an increase of 52 basis points as compared to 2019. This increase was primarily due to favorable channel mix, growth in our DIY omnichannel business, supply chain leverage, inventory management, including decrease in inventory shrink and favorable pricing actions.
• Operating income for 2020 was $749.9 million, an increase of $72.7 million from 2019. As a percentage of total sales, operating income was 7.4%, an increase of 45 basis points as compared to 2019. The favorable impact in Gross profit was offset by deleveraging SG&A costs compared to prior year due to increased marketing spend on advertising, lease termination costs as we optimize our real estate footprint and higher supplies and cleaning costs related to COVID-19.
• We generated cash flow from operations of $969.7 million during 2020, an increase of 11.9% compared to 2019, primarily due to an increase in Net income, as well as improvements related to working capital.
Refer to “Results of Operations” and “Liquidity and Capital Resources” for further details on our results.
Business Update
We continue to make progress on the various elements of our strategic business plan, which is focused on improving the customer experience and driving consistent execution for both Professional and “do-it-yourself” (“DIY”) customers. To achieve these improvements, we have undertaken planned strategic initiatives to help build a foundation for long-term success across the organization, which include:
• Continued development of a demand-based assortment, leveraging purchase and search history from our common catalog, versus our existing push-down supply approach.
• Advancement towards optimizing our footprint by market, including consolidating our Worldpac and Autopart International businesses, to drive share, repurpose our in-market store and asset base and streamline our distribution network.
• Continued evolution of our marketing campaigns, which focus on our customers and how we serve them every day with care and speed and the launch of the iconic DieHard® brand.
• Progress in the implementation of a more efficient end-to-end supply chain to deliver our broad assortment.• Enhancement of ‘Advance Same Day’ Curbside Pick Up, ‘Advance Same Day’ Home Delivery and our mobile
application and eCommerce performance.• Actively pursuing new store openings in 2021, including through lease acquisition opportunities as available and
appropriate, in existing markets and new markets, as well as expansion of our independent Carquest network.
Industry Update
Operating within the automotive aftermarket industry, we are influenced by a number of general macroeconomic factors, many of which are similar to those affecting the overall retail industry. In addition to the “Impact of COVID-19 on Our Business” section included within Management’s Discussion and Analysis of Financial Condition and Results of Operations, these factors include, but are not limited to:
• Fuel costs• Unemployment rates• Consumer confidence• Competition• Changes in new car sales• Miles driven• Vehicle manufacturer warranties• Average age of vehicles in operation• Economic and political uncertainty• Deferral of elective automotive maintenance and improvements in new car quality
While these factors tend to fluctuate, we remain confident in the long-term growth prospects for the automotive parts industry.
20

Results of Operations
The following table sets forth certain of our operating data expressed as a percentage of net sales for the periods indicated.
Year Ended 2020 vs. 2019
$ ChangeBasis Points
2019 vs. 2018
$ ChangeBasis Points(in millions) January 2, 2021 December 28, 2019 December 29, 2018
Net sales $ 10,106.3 100.0 % $ 9,709.0 100.0 % $ 9,580.6 100.0 % $ 397.3 — $ 128.4 — Cost of sales 5,624.7 55.7 5,454.3 56.2 5,361.1 56.0 170.4 (52) 93.1 22
Gross profit 4,481.6 44.3 4,254.7 43.8 4,219.4 44.0 226.9 52 35.3 (22) SG&A 3,731.7 36.9 3,577.6 36.8 3,615.1 37.7 154.1 8 (37.6) (89) Operating income 749.9 7.4 677.2 7.0 604.3 6.3 72.8 45 72.9 67 Interest expense (46.9) (0.5) (39.9) (0.4) (56.6) (0.6) (7.0) (5) 16.7 18 Loss on debt extinguishment (48.0) (0.5) (10,756) (0.1) — — (37.2) (36) (10.8) (11) Other income, net (4.0) 0.0 11.2 0.1 7.6 0.1 (15.2) (15) 3.6 4 Provision for income taxes 158.0 1.6 150.9 1.6 131.4 1.4 7.1 1 19.4 18 Net income $ 493.0 4.9 % $ 486.8 5.0 % $ 423.8 4.4 % $ 6.3 (14) $ 63.0 59
Note 1: Table amounts may not foot due to rounding.Note 2: Fiscal year 2020 includes 53 weeks. Fiscal years 2019 and 2018 include 52 weeks.
2020 Compared to 2019
Net Sales
The year ended January 2, 2021 consisted of 53 weeks compared to 52 weeks in 2019. Net sales for 2020 were $10.1 billion, an increase of $397.3 million, or 4.1%, from Net sales in 2019. This increase primarily reflected the impact of our positive comparable store sales 2.4% resulting from growth in our DIY omnichannel business, as well as $158.5 million of Net sales attributable to the additional week in 2020. We experienced positive comparable store sales across every region, with Southeast, Florida and Central having the strongest growth. Our West, Mid Atlantic and Northeast regions had the lowest comparable sales growth.
We calculate comparable store sales based on the change in store or branch sales starting once a location has been open for 13 complete accounting periods (approximately one year) and by including e-commerce sales. Sales to independently owned Carquest stores are excluded from our comparable store sales. Acquired stores are included in our comparable store sales once the stores have completed 13 complete accounting periods following the acquisition date. We include sales from relocated stores in comparable store sales from the original date of opening. Net sales for the 53rd week in a year are not included in the comparable sales calculation for that year. For example, our comparable sales results for 2020 compare weeks 1 through 52 in 2020 to the 52-week period reported for 2019. Comparable sales is intended only as supplemental information and is not a substitute for Net sales presented in accordance with accounting principles generally accepted in the United States of America (“GAAP”).
Gross Profit
Gross profit for 2020 was $4.5 billion, or 44.3% of net sales, as compared to $4.3 billion, or 43.8% of net sales, in 2019, an increase of 52 basis points. The increase in gross profit as a percentage of net sales was primarily due to favorable channel mix, growth in our DIY omnichannel business, operational productivity relating to our ability to leverage our supply chain, inventory management including a decrease in inventory shrink and favorable pricing actions.
As a result of changes in our last in, first out (“LIFO”) reserve, a benefit of $13.8 million, an expense of $101.3 million and a benefit of $39.8 million were included in Cost of Sales in 2020, 2019 and 2018.
21

Selling, general and administrative expenses (“SG&A”)
SG&A for 2020 was $3.7 billion, or 36.9% of net sales, as compared to $3.6 billion, or 36.8% of net sales, for 2019, an increase of 8 basis points. This increase as a percentage of net sales was primarily due to increased marketing spend on advertising, lease termination costs as we optimize our real estate footprint and higher supplies and cleaning costs related to COVID-19. The additional week in 2020 contributed $53.5 million to SG&A.
Interest expense
Interest expense for 2020 was $46.9 million, an increase of $7.0 million when compared to 2019. This increase was primarily due to the issuance of our $500.0 million 2030 senior unsecured notes on April 16, 2020 and our $350.0 million 2027 senior unsecured notes on September 29, 2020. Refer to Note 6, Long-term Debt and Fair Value of Financial Instruments of the Notes to the Consolidated Financial Statements included herein for further details.
Loss on early redemptions of senior unsecured notes
During the fifty-three weeks ended January 2, 2021, we incurred charges of $48.0 million related to the early redemption of our 2022 and 2023 senior unsecured notes. During the fifty-two weeks ended December 28, 2019, we incurred charges of $10.8 million related to the early redemption of our 2020 senior unsecured notes. Refer to Note 6, Long-term Debt and Fair Value of Financial Instruments of the Notes to the Consolidated Financial Statements included herein for further details.
Provision for income taxes
Our Provision for income taxes for 2020 was $158.0 million, as compared to $150.9 million for 2019, an increase of $7.1 million primarily due to an increase in taxable income. Our effective tax rate was 24.3% for 2020 and 23.7% for 2019. During 2019, the driver of the lower tax expense resulted from a benefit relating to a release of a valuation allowance that was previously established against the deferred tax asset related to our federal foreign tax credit carryforward.
2019 Compared to 2018
A discussion of changes in our results of operations in 2019 compared to 2018 has been omitted from this Form10-K, but may be found in “Item 7. Management’s Discussion and Analysis of Financial Condition and Results of Operations” of our Form 10-K for the fiscal year ended December 28, 2019, filed with the SEC on February 18, 2020, which is available free of charge on the SECs website at www.sec.gov and at www.AdvanceAutoParts.com, by clicking “Investor Relations” located at the bottom of the home page.
Reconciliation of Non-GAAP Financial Measures
“Management’s Discussion and Analysis of Financial Condition and Results of Operations” includes certain financial measures not derived in accordance with accounting principles generally accepted in the United States of America. Non-GAAP financial measures, including Adjusted net income and Adjusted EPS, should not be used as a substitute for GAAP financial measures, or considered in isolation, for the purpose of analyzing our operating performance, financial position or cash flows. We have presented these non-GAAP financial measures as we believe that the presentation of our financial results that exclude transformation expenses under our strategic business plan and non-cash amortization related to the acquired GPI intangible assets and other non-recurring adjustments are useful and indicative of our base operations because the expenses vary from period to period in terms of size, nature and significance and/or relate to store closure and consolidation activity in excess of historical levels. These measures assist in comparing our current operating results with past periods and with the operational performance of other companies in our industry. The disclosure of these measures allows investors to evaluate our performance using the same measures management uses in developing internal budgets and forecasts and in evaluating management’s compensation. Included below is a description of the expenses we have determined are not normal, recurring cash operating expenses necessary to operate our business and the rationale for why providing these measures is useful to investors as a supplement to the GAAP measures.
22

Transformation Expenses — Costs incurred in connection with our business plan that focuses on specific transformative activities that relate to the integration and streamlining of our operating structure across the enterprise, that we do not view to be normal cash operating expenses. These expenses will include, but not be limited to the following:
• Restructuring costs - Costs primarily relating to the early termination of lease obligations, asset impairment charges, other facility closure costs and Team Member severance in connection with our 2018 Store Rationalization plan and 2017 Store and Supply Chain Rationalization plan.
• Third-party professional services - Costs primarily relating to services rendered by vendors for assisting us with the development of various information technology and supply chain projects in connection with our enterprise integration initiatives.
• Other significant costs - Costs primarily relating to accelerated depreciation of various legacy information technology and supply chain systems in connection with our enterprise integration initiatives and temporary off-site workspace for project teams who are primarily working on the development of specific transformative activities that relate to the integration and streamlining of our operating structure across the enterprise.
GPI Amortization of Acquired Intangible Assets — As part of our acquisition of GPI, we obtained various intangible assets, including customer relationships, non-compete contracts and favorable leases agreements, which we expect to be subject to amortization through 2025.
We have included a reconciliation of this information to the most comparable GAAP measures in the following table.
Year Ended
(in thousands, except per share data)January 2,
2021December 28,
2019Net income (GAAP) $ 493,021 $ 486,896 Cost of sales adjustments:
Transformation expenses:Restructuring costs — 3,345 Other significant costs 3,161 —
Other adjustment (1) — 13,010 SG&A adjustments:
GPI amortization of acquired intangible assets 27,337 27,500 Transformation expenses:
Restructuring costs 16,765 19,028 Third-party professional services 14,117 35,579 Other significant costs 15,965 19,351
Other income adjustment (2) 48,022 10,756 Provision for income taxes on adjustments (3) (31,342) (32,142) Adjusted net income (Non-GAAP) $ 587,046 $ 583,323
Diluted earnings per share (GAAP) $ 7.14 $ 6.84 Adjustments, net of tax 1.37 1.35 Adjusted diluted earnings per share (Non-GAAP) $ 8.51 $ 8.19
(1) During the sixteen weeks ended April 20, 2019, we made an out-of-period correction, which increased Cost of sales by $13.0 million, related to received not invoiced inventory.
(2) During the twelve weeks ended October 3, 2020, we incurred charges relating to a make-whole provision and tender premiums of $46.3 million and debt issuance costs of $1.7 million resulting from the early redemption of our 2022 and 2023 Notes. During the sixteen weeks ended April 20, 2019, we incurred charges relating to a make-whole provision and debt issuance costs of $10.1 million and $0.7 million resulting from the early redemption of our 2020 senior unsecured notes.
(3) The income tax impact of non-GAAP adjustments is calculated using the estimated tax rate in effect for the respective non-GAAP adjustments.
23

Liquidity and Capital Resources
Overview
Our primary cash requirements necessary to maintain our current operations include payroll and benefits, inventory purchases, contractual obligations, capital expenditures, payment of income taxes, funding of initiatives under our strategic business plan and other operational priorities. Historically, we have used available funds to repay borrowings under our credit facility, to periodically repurchase shares of our common stock under our stock repurchase program, to pay our quarterly cash dividends and for acquisitions; however, given uncertainties related to the COVID-19 pandemic, our future uses of cash may differ if our relative priorities, including the weight we place on the preservation of cash and liquidity change. Typically, we have funded our cash requirements primarily through cash generated from operations, supplemented by borrowings under our credit facilities and notes offerings as needed. We believe funds generated from our expected results of operations, available cash and cash equivalents, and available borrowings under our credit facility will be sufficient to fund our obligations for the next year.
Share Repurchases
On November 8, 2019, our Board of Directors authorized a $700.0 million share repurchase program as an addition to the previous $400.0 million share repurchase program that was authorized by our Board of Directors in August 2019.
During 2020, we repurchased 3.0 million shares of our common stock at an aggregate cost of $458.5 million, or an average price of $150.65 per share, in connection with our share repurchase program. We had $432.2 million remaining under our share repurchase program as of January 2, 2021. During 2019, we repurchased 3.4 million shares of our common stock at an aggregate cost of $487.4 million, or an average price of $144.23 per share, under our share repurchase program.
Capital Expenditures
Our primary capital requirements have been the funding of our investments in supply chain and information technology, e-commerce and maintenance of existing stores and branches. We lease approximately 84% of our stores and branches.
Our capital expenditures were $267.6 million in 2020, a decrease of $2.6 million from 2019. Our capital expenditures were primarily related to several information technology projects, including our Finance enterprise resource planning system, as well as investments in supply chain and store improvements.
Our future capital requirements will depend in large part on the timing or number of the investments we make in information technology and supply chain network initiatives and existing stores and new store development (leased and owned locations) within a given year. In 2021, we anticipate that our capital expenditures related to such investments will range from $275 million to $325 million, but may vary with business conditions.
Analysis of Cash Flows
The following table summarizes our cash flows from operating, investing and financing activities:
Year Ended
(in millions)January 2,
2021December 28,
2019December 29,
2018Cash flows provided by operating activities $ 969.7 $ 866.9 $ 811.0 Cash flows used in investing activities (266.9) (462.9) (191.8) Cash flows used in financing activities (286.0) (882.2) (263.9) Effect of exchange rate changes on cash (0.5) 0.3 (5.7)
Net (decrease) increase in cash and cash equivalents $ 416.3 $ (477.9) $ 349.6
24

Operating Activities
For 2020, net cash provided by operating activities increased $102.8 million to $969.7 million. The net increase in cash flows provided by operating activities compared to the prior year was primarily driven by an increase in Net income, improvements in working capital and the deferral of payroll taxes under the CARES Act. In the current year, working capital included an increase in cash provided by Accrued expenses, partially offset by a decrease in cash provided by Accounts payable and an increase in cash used by Inventories. Refer to “Results of Operations” for further details on our results.
For 2019, net cash provided by operating activities increased $55.9 million to $866.9 million. The net increase in operating cash flows compared to the prior year was primarily driven by an increase in Net income, which was partially offset by a decrease in working capital.
Investing Activities
For 2020, net cash used in investing activities decreased by $196.0 million to $266.9 million compared to 2019. Cash used in investing activities for 2020 consisted primarily of purchases of property and equipment, which was comparable to capital expenditures in 2019. The decrease in cash used in investing activities in 2020 is attributable to the DieHard® brand acquisition on December 23, 2019, which we purchased for a cash purchase price of $200.0 million.
For 2019, net cash used in investing activities increased by $271.1 million to $462.9 million compared to 2018. The increase in cash used in investing activities was primarily driven by the acquisition of the DieHard® brand on December 23, 2019 for a cash purchase price of $200.0 million. This purchase gave us the right to sell DieHard® batteries and enables us to extend the DieHard® brand into other automotive and vehicular categories. Additionally, the remaining increase was in capital expenditures related to several IT projects, including our Finance enterprise resource planning system, as well as investments in supply chain, e-commerce and store improvements.
Financing Activities
For 2020, net cash used in financing activities decreased by $596.2 million to $286.0 million compared to 2019. This decrease was primarily a result of the net proceeds of $244.5 million received in 2020 that resulted from the issuance of our $500.0 million 2030 senior unsecured notes on April 16, 2020 and our $350.0 million 2027 senior unsecured notes on September 29, 2020, offset by the redemption of all of our $300.0 million 2022 senior unsecured notes on September 16, 2020 and the cash tender offer on September 29, 2020 for a portion of the 2023 senior secured notes. In 2019, we used $310.0 million to redeem all $300.0 million aggregate principal amount of our outstanding 2020 senior unsecured notes.
For 2019, net cash used in financing activities increased by $618.2 million to $882.2 million compared to 2018. This increase was primarily a result of returning cash to shareholders in the form of share repurchases and dividends, as well as on February 28, 2019, we redeemed all $300.0 million aggregate principal amount of our outstanding 2020 Notes. We incurred charges relating to a make-whole provision and debt issuance costs of $10.1 million and $0.7 million resulting from the early redemption of our 2020 Notes.
Our Board of Directors has declared a quarterly cash dividend since 2006. Any payments of dividends in the future will be at the discretion of our Board of Directors and will depend upon our results of operations, cash flows, capital requirements and other factors deemed relevant by our Board of Directors. On February 10, 2021, our Board of Directors declared a quarterly cash dividend of $0.25 per share to be paid on April 2, 2021 to all common shareholders of record as of March 19, 2021.
Long-Term Debt
As of January 2, 2021, we had a credit rating from Standard & Poor’s of BBB- and from Moody’s Investor Service of Baa2. The current outlooks by Standard & Poor’s and Moody’s are both stable. The current pricing grid used to determine our borrowing rate under our revolving credit facility is based on our credit ratings. If these credit ratings decline, our interest rate on outstanding balances may increase and our access to additional financing on favorable terms may be limited. In addition, it could reduce the attractiveness of certain vendor payment programs whereby third-party institutions finance arrangements to our vendors based on our credit rating, which could result in increased working capital requirements. Conversely, if these credit ratings improve, our interest rate may decrease.
For additional information on transactions entered into relating to Long-term debt during the fifty-three weeks ended January 2, 2021, refer to Note 6, Long-term Debt and Fair Value of Financial Instruments of the Notes to the Consolidated Financial Statements included herein.
25
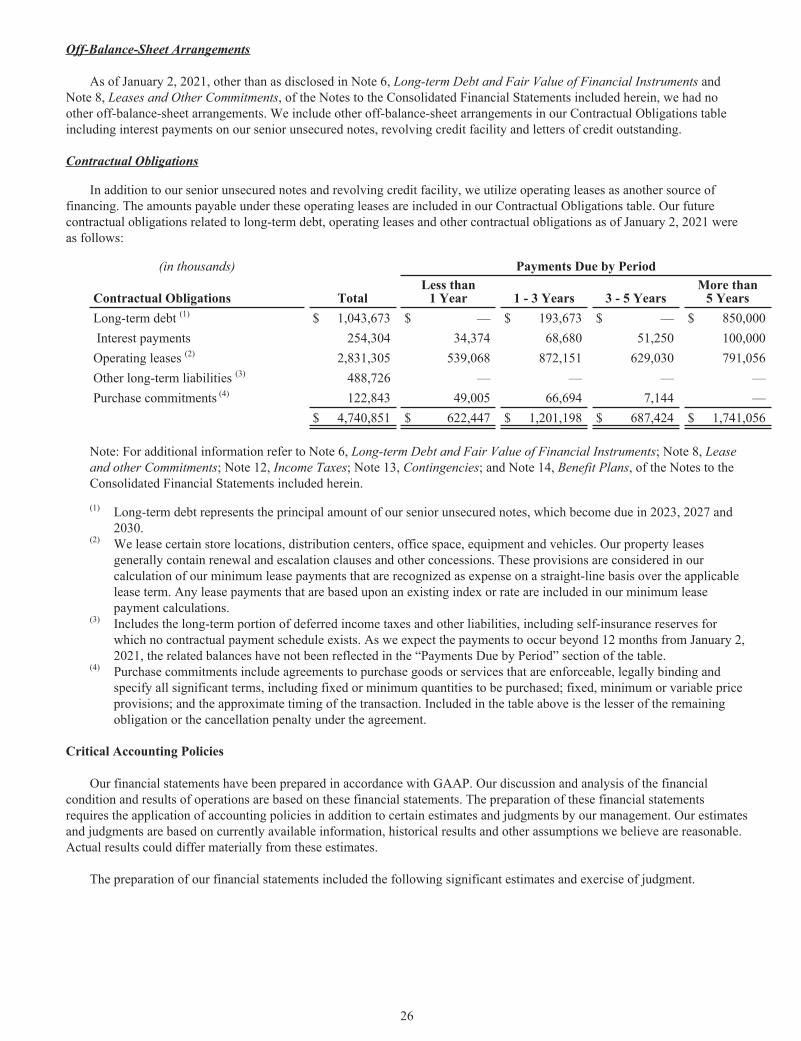
Off-Balance-Sheet Arrangements
As of January 2, 2021, other than as disclosed in Note 6, Long-term Debt and Fair Value of Financial Instruments and Note 8, Leases and Other Commitments, of the Notes to the Consolidated Financial Statements included herein, we had no other off-balance-sheet arrangements. We include other off-balance-sheet arrangements in our Contractual Obligations table including interest payments on our senior unsecured notes, revolving credit facility and letters of credit outstanding.
Contractual Obligations
In addition to our senior unsecured notes and revolving credit facility, we utilize operating leases as another source of financing. The amounts payable under these operating leases are included in our Contractual Obligations table. Our future contractual obligations related to long-term debt, operating leases and other contractual obligations as of January 2, 2021 were as follows:
(in thousands) Payments Due by Period
Contractual Obligations TotalLess than
1 Year 1 - 3 Years 3 - 5 YearsMore than
5 YearsLong-term debt (1) $ 1,043,673 $ — $ 193,673 $ — $ 850,000 Interest payments 254,304 34,374 68,680 51,250 100,000 Operating leases (2) 2,831,305 539,068 872,151 629,030 791,056 Other long-term liabilities (3) 488,726 — — — — Purchase commitments (4) 122,843 49,005 66,694 7,144 —
$ 4,740,851 $ 622,447 $ 1,201,198 $ 687,424 $ 1,741,056
Note: For additional information refer to Note 6, Long-term Debt and Fair Value of Financial Instruments; Note 8, Lease and other Commitments; Note 12, Income Taxes; Note 13, Contingencies; and Note 14, Benefit Plans, of the Notes to the Consolidated Financial Statements included herein.
(1) Long-term debt represents the principal amount of our senior unsecured notes, which become due in 2023, 2027 and 2030.
(2) We lease certain store locations, distribution centers, office space, equipment and vehicles. Our property leases generally contain renewal and escalation clauses and other concessions. These provisions are considered in our calculation of our minimum lease payments that are recognized as expense on a straight-line basis over the applicable lease term. Any lease payments that are based upon an existing index or rate are included in our minimum lease payment calculations.
(3) Includes the long-term portion of deferred income taxes and other liabilities, including self-insurance reserves for which no contractual payment schedule exists. As we expect the payments to occur beyond 12 months from January 2, 2021, the related balances have not been reflected in the “Payments Due by Period” section of the table.
(4) Purchase commitments include agreements to purchase goods or services that are enforceable, legally binding and specify all significant terms, including fixed or minimum quantities to be purchased; fixed, minimum or variable price provisions; and the approximate timing of the transaction. Included in the table above is the lesser of the remaining obligation or the cancellation penalty under the agreement.
Critical Accounting Policies
Our financial statements have been prepared in accordance with GAAP. Our discussion and analysis of the financial condition and results of operations are based on these financial statements. The preparation of these financial statements requires the application of accounting policies in addition to certain estimates and judgments by our management. Our estimates and judgments are based on currently available information, historical results and other assumptions we believe are reasonable. Actual results could differ materially from these estimates.
The preparation of our financial statements included the following significant estimates and exercise of judgment.
26

Vendor Incentives
We receive incentives in the form of reductions to amounts owed and/or payments from vendors related to volume rebates and other promotional considerations. Many of these incentives are under agreements with terms in excess of one year, while others are negotiated on an annual basis or less. Volume rebates and vendor promotional allowances are earned based on inventory purchases and initially recorded as a reduction to inventory, except for amounts that are offset in SG&A when circumstances exist as described below. These deferred amounts are recorded as a reduction to cost of sales as the inventory is sold.
Vendor promotional allowances provided as a reimbursement of specific, incremental and identifiable costs incurred to promote a vendor’s products are included as an offset to SG&A when the cost is incurred if the fair value of that benefit can be reasonably estimated. Certain of our vendor agreements contain purchase volume incentives that provide for increased funding when graduated purchase volumes are met. Amounts accrued throughout the year could be impacted if actual purchase volumes differ from projected annual purchase volumes.
Similarly, we recognize other promotional incentives earned under long-term agreements as a reduction to Cost of sales. However, these incentives are recognized based on the cumulative net purchases as a percentage of total estimated net purchases over the life of the agreement. Short-term incentives with terms less than one year are generally recognized as a reduction to cost of sales over the duration of the agreements.
Amounts received or receivable from vendors that are not yet earned are reflected as deferred revenue. Our estimate of the portion of deferred revenue that will be realized within one year of the balance sheet date is included in Other current liabilities. Earned amounts that are receivable from vendors are included in Receivables, net except for that portion expected to be received after one year, which is included in Other assets, net. We regularly review the receivables from vendors to ensure they are able to meet their obligations. Historically, the change in our reserve for receivables related to vendor funding has not been significant.
Self-Insurance Reserves
Our self-insurance reserves consist of the estimated exposure for claims filed, claims incurred but not yet reported and projected future claims, and are established using actuarial methods followed in the insurance industry and our historical claims experience. Specific factors include, but are not limited to, assumptions about health care costs, the severity of accidents and the incidence of illness and the average size of claims. Generally, claims for automobile and general liability and workers’ compensation take several years to settle. We classify the portion of our self-insurance reserves that is not expected to be settled within one year in long-term liabilities.
While we do not expect the amounts ultimately paid to differ significantly from our estimates, our self-insurance reserves and corresponding SG&A could be affected if future claim experience differs significantly from historical trends and actuarial assumptions. A 10% change in our self-insurance liabilities at January 2, 2021 would result in a change in expense of approximately $14.4 million for 2020.
New Accounting Pronouncements
For a description of recently adopted and issued accounting standards, including the expected dates of adoption and estimated effects, if any, on our consolidated financial statements, see “Recently Issued Accounting Pronouncements” in Note 2, Significant Accounting Policies, of the Notes to the Consolidated Financial Statements included herein.
Supplemental Guarantor Financial Information
The following is a description of the terms and conditions of the guarantees with respect to all senior unsecured notes for which Advance Auto Parts, Inc. (“Issuer”) is an issuer or provides full and unconditional guarantee.
Certain 100% wholly owned domestic subsidiaries of the Issuer, including our Material Subsidiaries (as defined in the 2017 Credit Agreement) serve as guarantors (“Guarantor Subsidiaries”) of our senior unsecured notes. The subsidiary guarantees related to our senior unsecured notes are full and unconditional and joint and several, and there are no restrictions on the ability of the Issuer to obtain funds from its Guarantor Subsidiaries. Certain of our wholly owned subsidiaries, including all of our foreign subsidiaries and captive insurance subsidiary, do not serve as guarantors of our senior unsecured notes (“Non-Guarantor Subsidiaries”).
27

The following tables present summarized financial information for the Issuer and Guarantor Subsidiaries on a combined basis after elimination of (i) intercompany transactions and balances among the Issuer and the Guarantor Subsidiaries and (ii) equity in earnings from and investments in any subsidiaries that are a Non-Guarantor Subsidiary.
Summarized Financial Information
Balance SheetsIssuer and Guarantor
Subsidiaries
(in millions)January 2,
2021December 28,
2019Assets
Current assets (1) $ 5,796.3 $ 5,329.9 Non-current assets (2) $ 5,395.4 $ 5,403.6
LiabilitiesCurrent liabilities $ 4,539.1 $ 4,264.3 Intercompany payables, net due to Non-Guarantor Subsidiaries $ 290.7 $ 342.8 Other non-current liabilities $ 3,401.7 $ 3,128.2
(1) Current assets includes $4,318.6 million and $4,234.2 million of Inventories as of January 2, 2021 and December 28, 2019.
(2) Non-current assets includes $1,585.9 million and $1,613.8 million of Goodwill and Intangible assets, net as of January 2, 2021 and December 28, 2019.
Statements of OperationsIssuer and Guarantor
SubsidiariesFifty-Three
Weeks EndedFifty-Two
Weeks Ended
(in millions)January 2,
2021December 28,
2019Net sales $ 9,735.8 $ 9,342.2 Gross profit $ 4,335.1 $ 4,089.8 Operating income $ 687.8 $ 605.5 Income before provision for income taxes $ 598.0 $ 569.0 Net income $ 453.4 $ 486.9
Item 7A. Quantitative and Qualitative Disclosures about Market Risks.
We are subject to interest rate risk to the extent we borrow against our revolving credit facility as it is based, at our option, on adjusted LIBOR, plus a margin, or an alternate base rate, plus a margin. As of January 2, 2021 and December 28, 2019, we had no borrowings outstanding under our revolving credit facility.
Our financial assets that are exposed to credit risk consist primarily of trade accounts receivable and vendor receivables. We are exposed to normal credit risk from customers. Our concentration of credit risk is limited because our customer base consists of a large number of customers with relatively small balances, which allows the credit risk to be spread across a broad base. We have not historically had significant credit losses.
We are exposed to foreign currency exchange rate fluctuations for the portion of our inventory purchases denominated in foreign currencies. We believe that the price volatility relating to foreign currency exchange rates is partially mitigated by our ability to adjust selling prices. During 2020, 2019 and 2018, foreign currency transactions did not significantly impact net income.
28

Item 8. Financial Statements and Supplementary Data.
See financial statements included in Item 15 “Exhibits, Financial Statement Schedules” of this annual report.
Item 9. Changes in and Disagreements with Accountants on Accounting and Financial Disclosure.
None.
Item 9A. Controls and Procedures.
Disclosure Controls and Procedures
Disclosure controls and procedures (as that term is defined in Rules 13a-15(e) and 15d-15(e) under the Securities Exchange Act of 1934, as amended (the “Exchange Act”), are our controls and other procedures that are designed to ensure that information required to be disclosed by us in our reports that we file or submit under the Exchange Act is recorded, processed, summarized and reported within the time periods specified in the SEC’s rules and forms, and that such information is accumulated and communicated to our management, including our principal executive officer and principal financial officer, as appropriate to allow timely decisions regarding required disclosure. Internal controls over financial reporting, no matter how well designed, have inherent limitations, including the possibility of human error and the override of controls. Therefore, even those systems determined to be effective can provide only “reasonable assurance” with respect to the reliability of financial reporting and financial statement preparation and presentation. Further, because of changes in conditions, the effectiveness may vary over time.
Evaluation of Disclosure Controls and Procedures
Our management evaluated, with the participation of our principal executive officer and principal financial officer, the effectiveness of our disclosure controls and procedures as of January 2, 2021. Based on this evaluation, our principal executive officer and our principal financial officer have concluded that, as of the end of the period covered by this report, our disclosure controls and procedures were effective to accomplish their objectives at the reasonable assurance level.
Management’s Report on Internal Control over Financial Reporting
Our management is responsible for establishing and maintaining adequate internal control over financial reporting as defined in Rule 13(a) - 15(f) under the Exchange Act. Our internal control over financial reporting is a process designed under the supervision of our principal executive officer and principal financial officer, and effected by our Board of Directors, management and other personnel, to provide “reasonable assurance” regarding the reliability of financial reporting and the preparation of our financial statements for external purposes in accordance with GAAP. Our internal control over financial reporting includes policies and procedures that (1) pertain to the maintenance of records that, in reasonable detail, accurately and fairly reflect the transactions and dispositions of our assets; (2) provide reasonable assurance that transactions are recorded as necessary to permit preparation of financial statements in accordance with GAAP, and that our receipts and expenditures are being made only in accordance with authorizations of our management and directors; and (3) provide “reasonable assurance” regarding prevention or timely detection of unauthorized acquisition, use, or disposition of our assets that could have a material effect on the financial statements.
As of January 2, 2021, management, including our principal executive officer and principal financial officer, assessed the effectiveness of the Company’s internal control over financial reporting based on the criteria established in Internal Control - Integrated Framework (2013) issued by the Committee of Sponsoring Organizations of the Treadway Commission (COSO). Based on this assessment, management has determined that our internal control over financial reporting as of January 2, 2021 is effective.
Changes in Internal Control Over Financial Reporting
There were no changes in our internal control over financial reporting (as that term is defined in Rules 13a-15(f) and 15d-15(f) under the Exchange Act) that occurred during the quarter ended January 2, 2021 that have materially affected, or are reasonably likely to materially affect, our internal control over financial reporting.
29

Attestation Report of Registered Public Accounting Firm
Our internal control over financial reporting as of January 2, 2021 has been audited by Deloitte & Touche LLP, an independent registered public accounting firm, which also audited our consolidated financial statements for the year ended January 2, 2021, as stated in their report included herein, which expresses an unqualified opinion on the effectiveness of our internal control over financial reporting as of January 2, 2021.
Item 9B. Other Information.
None.
30

PART III
Item 10. Directors, Executive Officers and Corporate Governance.
For a discussion of our directors, executive officers and corporate governance, see the information set forth in the sections entitled “Proposal No. 1 - Election of Directors,” “Corporate Governance,” “Meetings and Committees of the Board,” “Information About Our Executive Officers,” “Audit Committee Report,” and “Delinquent Section 16(a) Reports,” “Code of Ethics and Business Conduct” and “Code of Ethics for Finance Professionals” in our proxy statement for the 2021 annual meeting of stockholders to be filed with the SEC within 120 days after the end of the year ended January 2, 2021 (the “2021 Proxy Statement”), which is incorporated herein by reference.
Item 11. Executive Compensation.
See the information set forth in the sections entitled “Meetings and Committees of the Board,” “Compensation Committee Report,” “Compensation Discussion and Analysis,” “Additional Information Regarding Executive Compensation” and “Director Compensation” in the 2021 Proxy Statement, which is incorporated herein by reference.
Item 12. Security Ownership of Certain Beneficial Owners and Management and Related Stockholder Matters.
See the information set forth in the sections entitled “Equity Compensation Plan Information” and “Security Ownership of Certain Beneficial Owners and Management” in the 2021 Proxy Statement, which is incorporated herein by reference.
Item 13. Certain Relationships and Related Transactions, and Director Independence.
See the information set forth in the sections entitled “Corporate Governance-Related Party Transactions,” “Corporate Governance-Director Independence” and “Meetings and Committees of the Board” in the 2021 Proxy Statement, which is incorporated herein by reference.
Item 14. Principal Accountant Fees and Services.
See the information set forth in the section entitled “2020 and 2019 Audit Fees” in the 2021 Proxy Statement, which is incorporated herein by reference.
31

PART IV
Item 15. Exhibits, Financial Statement Schedules.
(a)(1) Financial Statements
Audited Consolidated Financial Statements of Advance Auto Parts, Inc. and Subsidiaries for the years ended January 2, 2021, December 28, 2019 and December 29, 2018:Reports of Independent Registered Public Accounting Firm . . . . . . . . . . . . . . . . . . . . . . . . . . . . . . . . . . . . . 33Consolidated Balance Sheets . . . . . . . . . . . . . . . . . . . . . . . . . . . . . . . . . . . . . . . . . . . . . . . . . . . . . . . . . . . . . 36Consolidated Statements of Operations . . . . . . . . . . . . . . . . . . . . . . . . . . . . . . . . . . . . . . . . . . . . . . . . . . . . . 37Consolidated Statements of Comprehensive Income . . . . . . . . . . . . . . . . . . . . . . . . . . . . . . . . . . . . . . . . . . . 37Consolidated Statements of Changes in Stockholders' Equity . . . . . . . . . . . . . . . . . . . . . . . . . . . . . . . . . . . . 38Consolidated Statements of Cash Flows . . . . . . . . . . . . . . . . . . . . . . . . . . . . . . . . . . . . . . . . . . . . . . . . . . . . 39Notes to the Consolidated Financial Statements . . . . . . . . . . . . . . . . . . . . . . . . . . . . . . . . . . . . . . . . . . . . . . 40
(2) Financial Statement Schedule
Schedule II - Valuation and Qualifying Accounts . . . . . . . . . . . . . . . . . . . . . . . . . . . . . . . . . . . . . . . . . . . . . . 62
(3) Exhibits
Exhibit Index 63
32

REPORT OF INDEPENDENT REGISTERED PUBLIC ACCOUNTING FIRM
To the stockholders and the Board of Directors of Advance Auto Parts, Inc.
Opinion on the Financial Statements
We have audited the accompanying consolidated balance sheets of Advance Auto Parts, Inc. and subsidiaries (the "Company") as of January 2, 2021 and December 28, 2019, the related consolidated statements of operations, comprehensive income, changes in stockholders' equity, and cash flows for each of the three years in the period ended January 2, 2021, and the related notes and the schedule listed in the Index at Item 15 (collectively referred to as the "financial statements"). In our opinion, the financial statements present fairly, in all material respects, the financial position of the Company as of January 2, 2021 and December 28, 2019, and the results of its operations and its cash flows for each of the three years in the period ended January 2, 2021, in conformity with accounting principles generally accepted in the United States of America.
We have also audited, in accordance with the standards of the Public Company Accounting Oversight Board (United States) (PCAOB), the Company's internal control over financial reporting as of January 2, 2021, based on criteria established in Internal Control — Integrated Framework (2013) issued by the Committee of Sponsoring Organizations of the Treadway Commission and our report dated February 22, 2021, expressed an unqualified opinion on the Company's internal control over financial reporting.
Change in Accounting Principle
As discussed in Note 2 to the consolidated financial statements, effective December 30, 2018, the Company adopted Accounting Standards Update (“ASU”) 2016-12, Leases (Topic 842), using the alternative transition method provided in ASU 2018-11, Leases (Topic 842): Targeted Improvements.
Basis for Opinion
These financial statements are the responsibility of the Company's management. Our responsibility is to express an opinion on the Company's financial statements based on our audits. We are a public accounting firm registered with the PCAOB and are required to be independent with respect to the Company in accordance with the U.S. federal securities laws and the applicable rules and regulations of the Securities and Exchange Commission and the PCAOB.
We conducted our audits in accordance with the standards of the PCAOB. Those standards require that we plan and perform the audit to obtain reasonable assurance about whether the financial statements are free of material misstatement, whether due to error or fraud. Our audits included performing procedures to assess the risks of material misstatement of the financial statements, whether due to error or fraud, and performing procedures that respond to those risks. Such procedures included examining, on a test basis, evidence regarding the amounts and disclosures in the financial statements. Our audits also included evaluating the accounting principles used and significant estimates made by management, as well as evaluating the overall presentation of the financial statements. We believe that our audits provide a reasonable basis for our opinion.
Critical Audit Matter
The critical audit matter communicated below is a matter arising from the current-period audit of the financial statements that was communicated or required to be communicated to the audit committee and that (1) relates to accounts or disclosures that are material to the financial statements and (2) involved our especially challenging, subjective, or complex judgments. The communication of critical audit matters does not alter in any way our opinion on the financial statements, taken as a whole, and we are not, by communicating the critical audit matter below, providing a separate opinion on the critical audit matter or on the accounts or disclosures to which it relates.
33

Vendor Incentives - Refer to Note 2 to the Consolidated Financial Statements
Critical Audit Matter Description
The Company receives incentives in the form of reductions in amounts owed to and/or payments due from vendors related to volume rebates and other promotions. Volume rebates and vendor promotional allowances are earned based on inventory purchases and initially recorded as a reduction to inventory, except for allowances provided as reimbursement of specific, incremental and identifiable costs incurred to promote a vendor’s products that are offset in selling, general andadministrative expenses. The deferred amounts are recorded as a reduction in cost of sales as the inventory is sold. Total deferred vendor incentives included as a reduction of inventories were $141.9 million as of January 2, 2021.
The Company purchases inventory from a significant number of vendors, with no single vendor accounting for more than 10% of purchases. While many of these incentives are under long-term agreements in excess of one year, others are negotiated on an annual basis or shorter. Accordingly, auditing vendor incentives was challenging due to the extent of audit effort required to evaluate whether the vendor incentives were recorded in accordance with the terms of the vendor agreements.
How the Critical Audit Matter Was Addressed in the Audit
Our audit procedures related to whether the vendor incentives were recorded in accordance with the terms of the vendor agreements included the following, among others:
• We tested the effectiveness of controls over the process that ensures that all vendor agreements are communicated to accounting.
• We tested the effectiveness of controls over the recording of vendor incentives as a reduction in inventories, and subsequently as a reduction in cost of sales as the related inventory was sold.
• We selected a sample of vendor incentives earned during the year and deferred at year-end and recalculated, using the terms of the vendor agreement, both the amount recorded as deferred vendor incentives as a reduction in inventories and the amount recognized in earnings as a reduction in cost of sales.
• We selected a sample of vendors from the Company’s inventory purchases made during the year and from vendor incentives recorded as a reduction in cost of sales and confirmed directly with the vendor that the agreement obtained from the Company and used in the determination of deferred vendor incentives as a reduction in cost of sales was the most recent between the parties.
• We tested the amount of the deferred vendor incentives recorded as a reduction in cost of sales by developing an expectation of the amount based on the historical amounts recorded as a percentage of total cost of sales and compared our expectation to the amount recorded.
/s/ Deloitte & Touche LLP
Charlotte, North CarolinaFebruary 22, 2021
We have served as the Company’s auditor since 2002.
34
REPORT OF INDEPENDENT REGISTERED PUBLIC ACCOUNTING FIRM
To the stockholders and the Board of Directors of Advance Auto Parts, Inc.
Opinion on Internal Control over Financial Reporting
We have audited the internal control over financial reporting of Advance Auto Parts, Inc. and subsidiaries (the “Company”) as of January 2, 2021, based on criteria established in Internal Control - Integrated Framework (2013) issued by the Committee of Sponsoring Organizations of the Treadway Commission (COSO). In our opinion, the Company maintained, in all material respects, effective internal control over financial reporting as of January 2, 2021, based on criteria established in Internal Control - Integrated Framework (2013) issued by COSO.
We have also audited, in accordance with the standards of the Public Company Accounting Oversight Board (United States) (PCAOB), the consolidated financial statements and financial statement schedule as of and for the year ended January 2, 2021, of the Company and our report dated February 22, 2021, expressed an unqualified opinion on those consolidated financial statements and financial statement schedule.
Basis for Opinion
The Company's management is responsible for maintaining effective internal control over financial reporting and for its assessment of the effectiveness of internal control over financial reporting, included in the accompanying Management's Report on Internal Control over Financial Reporting. Our responsibility is to express an opinion on the Company's internal control over financial reporting based on our audit. We are a public accounting firm registered with the PCAOB and are required to be independent with respect to the Company in accordance with the U.S. federal securities laws and the applicable rules and regulations of the Securities and Exchange Commission and the PCAOB.
We conducted our audit in accordance with the standards of the PCAOB. Those standards require that we plan and perform the audit to obtain reasonable assurance about whether effective internal control over financial reporting was maintained in all material respects. Our audit included obtaining an understanding of internal control over financial reporting, assessing the risk that a material weakness exists, testing and evaluating the design and operating effectiveness of internal control based on the assessed risk, and performing such other procedures as we considered necessary in the circumstances. We believe that our audit provides a reasonable basis for our opinion.
Definition and Limitations of Internal Control over Financial Reporting
A company’s internal control over financial reporting is a process designed to provide reasonable assurance regarding the reliability of financial reporting and the preparation of financial statements for external purposes in accordance with generally accepted accounting principles. A company’s internal control over financial reporting includes those policies and procedures that (1) pertain to the maintenance of records that, in reasonable detail, accurately and fairly reflect the transactions and dispositions of the assets of the company; (2) provide reasonable assurance that transactions are recorded as necessary to permit preparation of financial statements in accordance with generally accepted accounting principles, and that receipts and expenditures of the company are being made only in accordance with authorizations of management and directors of the company; and (3) provide reasonable assurance regarding prevention or timely detection of unauthorized acquisition, use, or disposition of the company’s assets that could have a material effect on the financial statements.
Because of its inherent limitations, internal control over financial reporting may not prevent or detect misstatements. Also, projections of any evaluation of effectiveness to future periods are subject to the risk that controls may become inadequate because of changes in conditions, or that the degree of compliance with the policies or procedures may deteriorate.
/s/ Deloitte & Touche LLP
Charlotte, North CarolinaFebruary 22, 2021
35

Advance Auto Parts, Inc. and SubsidiariesConsolidated Balance Sheets
(in thousands, except per share data)
January 2,2021
December 28,2019Assets
Current assets: Cash and cash equivalents $ 834,992 $ 418,665 Receivables, net 749,999 689,469 Inventories 4,538,199 4,432,168 Other current assets 146,811 155,241
Total current assets 6,270,001 5,695,543 Property and equipment, net of accumulated depreciation of $2,189,165 and $2,037,849 1,462,602 1,433,213
Operating lease right-of-use assets 2,379,987 2,365,325 Goodwill 993,590 992,240 Intangible assets, net 681,127 709,756 Other assets 52,329 52,448 $ 11,839,636 $ 11,248,525
Liabilities and Stockholders’ Equity Current liabilities:
Accounts payable $ 3,640,639 $ 3,421,987 Accrued expenses 606,804 535,863 Other current liabilities 496,472 519,852
Total current liabilities 4,743,915 4,477,702 Long-term debt 1,032,984 747,320 Noncurrent operating lease liabilities 2,014,499 2,017,159 Deferred income taxes 342,445 334,013 Other long-term liabilities 146,281 123,250 Commitments and contingenciesStockholders’ equity:
Preferred stock, nonvoting, $0.0001 par value,10,000 shares authorized; no shares issued or outstanding — —
Common stock, voting, $0.0001 par value, 200,000 shares authorized;76,305 shares issued and 66,361 outstanding at January 2, 202176,051 shares issued and 69,232 outstanding at December 28, 2019 8 8
Additional paid-in capital 783,709 735,183 Treasury stock, at cost, 9,944 and 6,819 shares (1,394,080) (924,389) Accumulated other comprehensive loss (26,759) (34,569) Retained earnings 4,196,634 3,772,848
Total stockholders’ equity 3,559,512 3,549,081 $ 11,839,636 $ 11,248,525
The accompanying notes to the consolidated financial statements are an integral part of these statements.
36

Advance Auto Parts, Inc. and SubsidiariesConsolidated Statements of Operations
(in thousands, except per share data)
Year EndedJanuary 2,
2021December 28,
2019December 29,
2018Net sales $ 10,106,321 $ 9,709,003 $ 9,580,554 Cost of sales, including purchasing and warehousing costs 5,624,707 5,454,257 5,361,141
Gross profit 4,481,614 4,254,746 4,219,413 Selling, general and administrative expenses 3,731,707 3,577,566 3,615,138
Operating income 749,907 677,180 604,275 Other, net:
Interest expense (46,886) (39,898) (56,588) Loss on early redemptions of senior unsecured notes (48,022) (10,756) — Other income, net (3,984) 11,220 7,577
Total other, net (98,892) (39,434) (49,011) Income before provision for income taxes 651,015 637,746 555,264
Provision for income taxes 157,994 150,850 131,417 Net income $ 493,021 $ 486,896 $ 423,847
Basic earnings per common share $ 7.17 $ 6.87 $ 5.75 Weighted average common shares outstanding 68,748 70,869 73,728
Diluted earnings per common share $ 7.14 $ 6.84 $ 5.73 Weighted average common shares outstanding 69,003 71,165 73,991
Fiscal year 2020 includes 53 weeks. Fiscal years 2019 and 2018 include 52 weeks.
Consolidated Statements of Comprehensive Income(in thousands)
Year EndedJanuary 2,
2021December 28,
2019December 29,
2018Net income $ 493,021 $ 486,896 $ 423,847 Other comprehensive income (loss):
Changes in net unrecognized other postretirement benefit costs, net of tax of $54, $67 and $103 (152) (142) (294) Currency translation adjustments 7,962 9,766 (18,945)
Total other comprehensive income (loss) 7,810 9,624 (19,239) Comprehensive income $ 500,831 $ 496,520 $ 404,608
Fiscal year 2020 includes 53 weeks. Fiscal years 2019 and 2018 include 52 weeks.
The accompanying notes to the consolidated financial statements are an integral part of these statements.
37
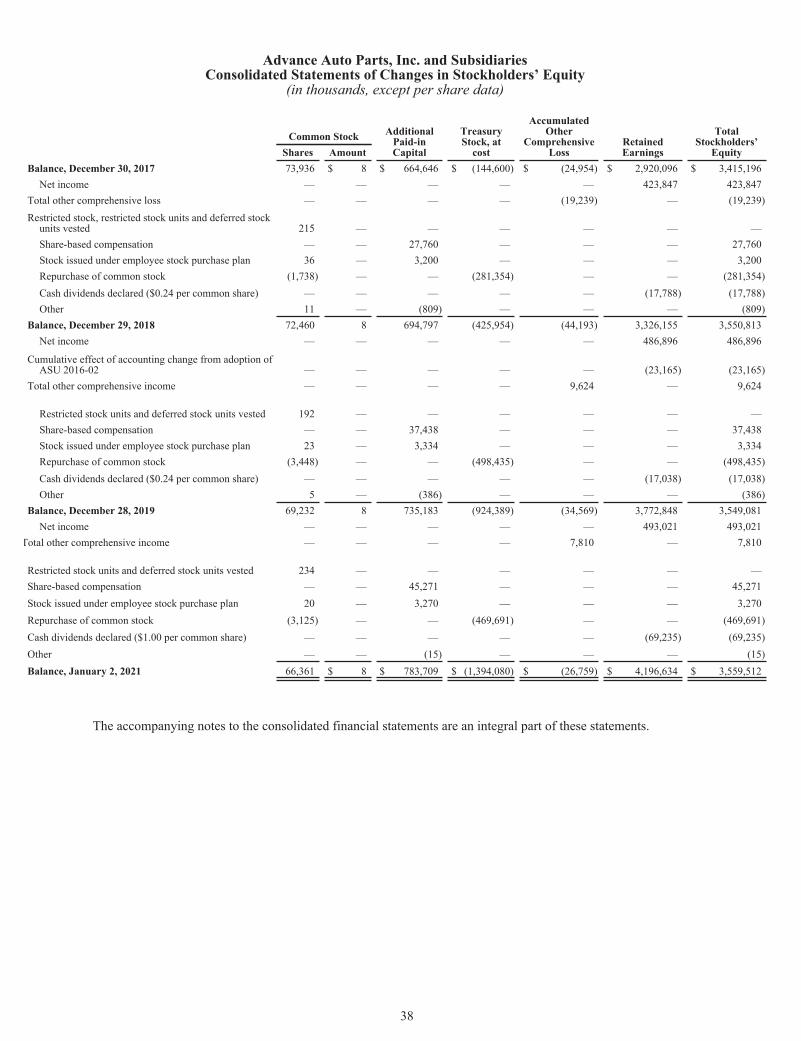
Advance Auto Parts, Inc. and SubsidiariesConsolidated Statements of Changes in Stockholders’ Equity
(in thousands, except per share data)
Common Stock Additional Paid-in Capital
Treasury Stock, at
cost
Accumulated Other
Comprehensive Loss
Retained Earnings
Total Stockholders’
Equity Shares AmountBalance, December 30, 2017 73,936 $ 8 $ 664,646 $ (144,600) $ (24,954) $ 2,920,096 $ 3,415,196
Net income — — — — — 423,847 423,847 Total other comprehensive loss — — — — (19,239) — (19,239) Restricted stock, restricted stock units and deferred stock
units vested 215 — — — — — — Share-based compensation — — 27,760 — — — 27,760 Stock issued under employee stock purchase plan 36 — 3,200 — — — 3,200 Repurchase of common stock (1,738) — — (281,354) — — (281,354) Cash dividends declared ($0.24 per common share) — — — — — (17,788) (17,788) Other 11 — (809) — — — (809)
Balance, December 29, 2018 72,460 8 694,797 (425,954) (44,193) 3,326,155 3,550,813 Net income — — — — — 486,896 486,896
Cumulative effect of accounting change from adoption of ASU 2016-02 — — — — — (23,165) (23,165)
Total other comprehensive income — — — — 9,624 — 9,624
Restricted stock units and deferred stock units vested 192 — — — — — — Share-based compensation — — 37,438 — — — 37,438 Stock issued under employee stock purchase plan 23 — 3,334 — — — 3,334 Repurchase of common stock (3,448) — — (498,435) — — (498,435) Cash dividends declared ($0.24 per common share) — — — — — (17,038) (17,038) Other 5 — (386) — — — (386)
Balance, December 28, 2019 69,232 8 735,183 (924,389) (34,569) 3,772,848 3,549,081 Net income — — — — — 493,021 493,021
Total other comprehensive income — — — — 7,810 — 7,810
Restricted stock units and deferred stock units vested 234 — — — — — — Share-based compensation — — 45,271 — — — 45,271 Stock issued under employee stock purchase plan 20 — 3,270 — — — 3,270 Repurchase of common stock (3,125) — — (469,691) — — (469,691) Cash dividends declared ($1.00 per common share) — — — — — (69,235) (69,235) Other — — (15) — — — (15) Balance, January 2, 2021 66,361 $ 8 $ 783,709 $ (1,394,080) $ (26,759) $ 4,196,634 $ 3,559,512
The accompanying notes to the consolidated financial statements are an integral part of these statements.
38
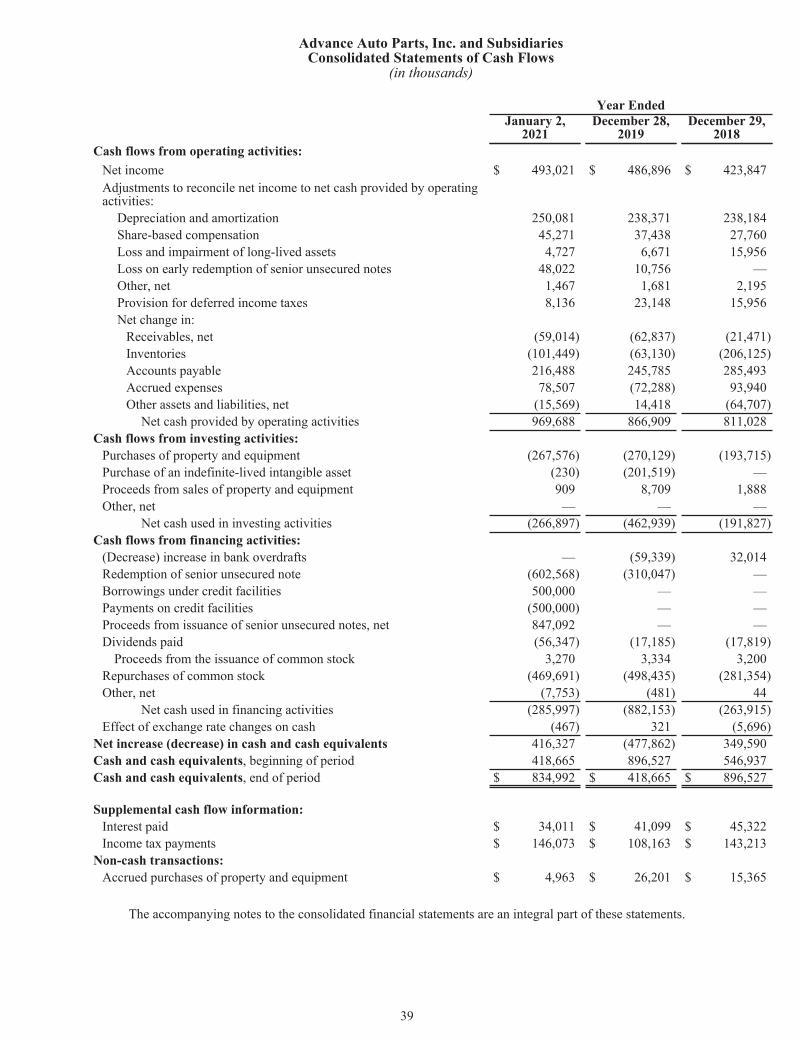
Advance Auto Parts, Inc. and SubsidiariesConsolidated Statements of Cash Flows
(in thousands)
Year EndedJanuary 2,
2021December 28,
2019December 29,
2018Cash flows from operating activities:
Net income $ 493,021 $ 486,896 $ 423,847 Adjustments to reconcile net income to net cash provided by operating activities:
Depreciation and amortization 250,081 238,371 238,184 Share-based compensation 45,271 37,438 27,760 Loss and impairment of long-lived assets 4,727 6,671 15,956 Loss on early redemption of senior unsecured notes 48,022 10,756 — Other, net 1,467 1,681 2,195 Provision for deferred income taxes 8,136 23,148 15,956 Net change in:
Receivables, net (59,014) (62,837) (21,471) Inventories (101,449) (63,130) (206,125) Accounts payable 216,488 245,785 285,493 Accrued expenses 78,507 (72,288) 93,940 Other assets and liabilities, net (15,569) 14,418 (64,707)
Net cash provided by operating activities 969,688 866,909 811,028 Cash flows from investing activities:
Purchases of property and equipment (267,576) (270,129) (193,715) Purchase of an indefinite-lived intangible asset (230) (201,519) — Proceeds from sales of property and equipment 909 8,709 1,888 Other, net — — —
Net cash used in investing activities (266,897) (462,939) (191,827) Cash flows from financing activities:
(Decrease) increase in bank overdrafts — (59,339) 32,014 Redemption of senior unsecured note (602,568) (310,047) — Borrowings under credit facilities 500,000 — — Payments on credit facilities (500,000) — — Proceeds from issuance of senior unsecured notes, net 847,092 — — Dividends paid (56,347) (17,185) (17,819)
Proceeds from the issuance of common stock 3,270 3,334 3,200 Repurchases of common stock (469,691) (498,435) (281,354) Other, net (7,753) (481) 44
Net cash used in financing activities (285,997) (882,153) (263,915) Effect of exchange rate changes on cash (467) 321 (5,696)
Net increase (decrease) in cash and cash equivalents 416,327 (477,862) 349,590 Cash and cash equivalents, beginning of period 418,665 896,527 546,937 Cash and cash equivalents, end of period $ 834,992 $ 418,665 $ 896,527
Supplemental cash flow information:Interest paid $ 34,011 $ 41,099 $ 45,322 Income tax payments $ 146,073 $ 108,163 $ 143,213
Non-cash transactions:Accrued purchases of property and equipment $ 4,963 $ 26,201 $ 15,365
The accompanying notes to the consolidated financial statements are an integral part of these statements.
39
1. Nature of Operations and Basis of Presentation:
Description of Business
Advance Auto Parts, Inc. and subsidiaries is a leading automotive aftermarket parts provider in North America, serving both professional installers (“Professional”) and “do-it-yourself” (“DIY”) customers. The accompanying consolidated financial statements have been prepared by us and include the accounts of Advance Auto Parts, Inc., including, its wholly owned subsidiaries, Advance Stores Company, Incorporated (“Advance Stores”) and Neuse River Insurance Company, Inc., and their subsidiaries (collectively referred to as “Advance,” “we,” “us,” or “our”).
As of January 2, 2021, our operations are comprised of 4,806 stores and 170 branches primarily within the United States, with additional locations in Canada, Puerto Rico and the U.S. Virgin Islands. Our stores operate primarily under the trade names “Advance Auto Parts,” “Carquest” and “Autopart International,” and our branches operate under the “Worldpac” trade name. In addition, we served 1,277 independently owned Carquest branded stores across the same geographic locations served by our stores and branches in addition to Mexico, Grand Cayman, the Bahamas, Turks and Caicos and British Virgin Islands.
In March 2020, the World Health Organization categorized the COVID-19 outbreak as a pandemic. As a majority of our stores and facilities have remained open, we have taken additional measures to help protect the health and safety of our Team Members and customers. Such measures, among others, include the implementation of other labor-related benefits for Team Members and increased sanitation practices across Advance. Since the assumptions underpinning our long-term revenue and cash flow growth rates, operating models and business strategies have not been significantly impacted, there was no material impairment of our various assets during the fifty-three weeks ended January 2, 2021.
The COVID-19 pandemic remains an evolving situation. If a period of decreased demand were to reoccur, it may lead to increased asset recovery and valuation risks in the future, such as impairment of goodwill, intangible assets and store and other assets. We will continue to assess the impact of the pandemic on our financial position. The extent to which the COVID-19 pandemic will impact our operations, liquidity, compliance with debt covenants or financial results in subsequent periods is uncertain, but such impact could be material.
Accounting Period
Our fiscal year ends on the Saturday nearest the end of December. All references herein for the years “2020,” “2019” and “2018” represent the fiscal year ended January 2, 2021, which consist of 53 weeks, and fiscal years ended December 28, 2019 and December 29, 2018, which both had 52 weeks.
Basis of Presentation
The consolidated financial statements include the accounts of Advance and its wholly owned subsidiaries prepared in accordance with accounting principles generally accepted in the United States of America (“GAAP”). All intercompany balances and transactions have been eliminated in consolidation. Certain amounts in the prior years’ consolidated statements of changes in stockholders’ equity and statements of cash flows have been reclassified to conform to the current year presentation.
Use of Estimates
The preparation of financial statements in conformity with GAAP requires management to make estimates and assumptions that affect the reported amounts of assets and liabilities and the disclosure of contingent assets and liabilities at the date of the financial statements and the reported amounts of revenues and expenses during the reporting period. Actual results could differ materially from those estimates.
40
2. Significant Accounting Policies:
Cash and Cash Equivalents
Cash and cash equivalents consist of cash in banks and money market funds with original maturities of three months or less. Also, included in cash equivalents are credit card and debit card receivables from banks, which generally settle in less than four business days.
Inventory
Our inventory consists primarily of parts, batteries, accessories and other products used on vehicles that have reasonably long shelf lives and is stated at the lower of cost or market. The cost of our merchandise inventory is primarily determined using the last-in, first-out (“LIFO”) method. Under the LIFO method, our cost of sales reflects the costs of the most recently purchased inventories, while the inventory carrying balance represents the costs relating to prices paid in 2020 and prior years. We regularly review inventory quantities on-hand, consider whether we may have excess inventory based on our current approach for managing slower moving inventory and adjust the carrying value as necessary.
Vendor Incentives
We receive incentives in the form of reductions to amounts owed to and/or payments from vendors related to volume rebates and other promotional considerations. Many of these incentives are under long-term agreements in excess of one year, while others are negotiated on an annual basis or shorter. Advertising allowances provided as a reimbursement of specific, incremental and identifiable costs incurred to promote a vendor’s products are included as an offset to selling, general and administrative expenses (“SG&A”) when the cost is incurred. Volume rebates and allowances that do not meet the requirements for offsetting in SG&A are recorded as a reduction to inventory as they are earned based on inventory purchases. Total deferred vendor incentives recorded as a reduction of Inventories were $141.9 million and $173.8 million as of January 2, 2021 and December 28, 2019.
We recognize other promotional incentives earned under long-term agreements not specifically related to volume of purchases as a reduction to cost of sales. However, these incentives are not deferred as a reduction of inventory and are recognized based on the cumulative net purchases as a percentage of total estimated net purchases over the life of the agreement. Short-term incentives with terms less than one year are generally recognized as a reduction to cost of sales over the duration of the agreements. Amounts received or receivable from vendors that are not yet earned are reflected as deferred revenue in the accompanying consolidated balance sheets.
Property and Equipment
Property and equipment are stated at cost less accumulated depreciation. Expenditures for maintenance and repairs are charged directly to expense when incurred; major improvements are capitalized. When items are sold or retired, the related cost and accumulated depreciation are removed from the account balances, with any gain or loss reflected in the consolidated statements of operations.
Depreciation of land improvements, buildings, furniture, fixtures and equipment and vehicles is provided over the estimated useful lives of the respective assets using the straight-line method. Depreciation of building and leasehold improvements is provided over the shorter of the original useful lives of the respective assets or the term of the lease using the straight-line method.
41

Goodwill and Indefinite-Lived Intangible Assets
We perform our evaluation for the impairment of goodwill and indefinite-lived intangible assets for our reporting units annually as of the first day of the fourth quarter, or when indications of potential impairment exist. These indicators would include a significant change in operating performance, the business climate, legal factors, competition, or a planned sale or disposition of a significant portion of the business, among other factors. We assess qualitative factors such as current company performance and overall economic factors to determine if it is more-likely-than-not that the goodwill might be impaired and whether it is necessary to perform a quantitative goodwill impairment test. In the quantitative goodwill test, we compare the carrying value of a reporting unit to its fair value. If the fair value of the reporting unit is lower than its carrying amount, goodwill is written down for the amount by which the carrying amount exceeds the reporting unit's fair value. Our indefinite-lived intangible assets are tested for impairment at the asset group level. Indefinite-lived intangibles are evaluated by comparing the carrying amount of the asset to the future discounted cash flows that the asset is expected to generate. If the fair value based on the future discounted cash flows exceeds the carrying value, we conclude that no intangible asset impairment has occurred. If the carrying value of the indefinite-lived intangible asset exceeds the fair value, we recognize an impairment loss.
We have five operating segments, defined as “Northern Division,” “Southern Division,” “Carquest Canada,” “Independents” and “Worldpac.” As each operating segment represents a reporting unit, goodwill is assigned to each reporting unit.
Valuation of Long-Lived Assets
We evaluate the recoverability of our long-lived assets, including finite-lived intangible assets, whenever events or changes in circumstances indicate that the carrying amount of an asset might not be recoverable and exceeds its fair value. When such an event occurs, we estimate the undiscounted future cash flows expected to result from the use of the long-lived asset or asset group and its eventual disposition. These impairment evaluations involve estimates of asset useful lives and future cash flows. If the undiscounted expected future cash flows are less than the carrying amount of the asset and the carrying amount of the asset exceeds its fair value, an impairment loss is recognized. When an impairment loss is recognized, the carrying amount of the asset is reduced to its estimated fair value based on quoted market prices or other valuation techniques (e.g., discounted cash flow analysis).
Self-Insurance
We are self-insured for general and automobile liability, workers’ compensation and health care claims of its employees, or Team Members, while maintaining stop-loss coverage with third-party insurers to limit its total liability exposure. Expenses associated with these liabilities are calculated for (i) claims filed, (ii) claims incurred but not yet reported and (iii) projected future claims using actuarial methods followed in the insurance industry as well as our historical claims experience. We include the current and long-term portions of its self-insurance reserves in Accrued expenses and Other long-term liabilities in the accompanying consolidated balance sheets.
Warranty Liabilities
The warranty obligation on the majority of merchandise sold by us with a manufacturer’s warranty is the responsibility of our vendors. However, we have an obligation to provide customers replacement of certain merchandise at no cost or merchandise at a prorated cost if under a warranty and not covered by the manufacturer. As of January 2, 2021 and December 28, 2019, our warranty liability primarily consisted of batteries with warranty coverage sold by us. We estimate our warranty obligation at the time of sale based on the historical return experience, sales level and cost of the respective product sold. To the extent vendors provide upfront allowances in lieu of accepting the obligation for warranty claims and the allowance is in excess of the related warranty expense, the excess is recorded as a reduction to cost of sales.
Leases
We lease certain store locations, distribution centers, office spaces, equipment and vehicles. We recognize lease expense on a straight-line basis over the initial term of the lease unless external economic factors exist such that renewals are reasonably certain. In those instances, the renewal period would be included in the lease term to determine the period in which to recognize the lease expense. Most leases require us to pay taxes, maintenance, insurance and other certain costs applicable to the leased premises.
42
Effective December 30, 2018, we adopted Accounting Standards Update (“ASU”) 2016-02, Leases (Topic 842) (“ASU 2016-02”), using the alternative transition method provided in ASU 2018-11, Leases (Topic 842): Targeted Improvements. Using the alternative transition method, we applied the transition requirements at the effective date of ASU 2016-02 with the impact of initially applying ASU 2016-02 recognized as a cumulative-effect adjustment to retained earnings in the first quarter of 2019.
We elected the package of practical expedients permitted under the transition guidance within the new standard. In addition, as a practical expedient relating to our store locations, distribution centers, office spaces and vehicle leases, we elected not to separate lease components from nonlease components.
The adoption of ASU 2016-02 resulted in the recording of operating lease assets and lease liabilities of $2.4 billion as of December 30, 2018. At the date of adoption, there was a difference between the operating lease right-of-use assets and lease liabilities recorded that included an adjustment to retained earnings, net of a $7.9 million deferred tax impact, which primarily resulted from the impairment of operating lease right-of-use assets. For 2019, the adoption of the new standard did not have a material impact on our condensed consolidated statements of operations and condensed consolidated statements of cash flows as substantially all of our leases are operating in nature.
Fair Value Measurements
A three-level valuation hierarchy, based upon observable and unobservable inputs, is used for fair value measurements. Observable inputs reflect market data obtained from independent sources, while unobservable inputs reflect market assumptions based on the best evidence available. These two types of inputs create the following fair value hierarchy: Level 1 - Quoted prices for identical instruments in active markets; Level 2 - Quoted prices for similar instruments in active markets, quoted prices for identical or similar instruments in markets that are not active and model-derived valuations whose significant inputs are observable; and Level 3 - Instruments whose significant inputs are unobservable. Financial instruments are transferred in and/or out of Level 1, 2 or 3 at the beginning of the accounting period in which there is a change in the valuation inputs.
Share-Based Payments
We provide share-based compensation to our eligible Team Members and Board of Directors. We are required to exercise judgment and make estimates when determining the (i) fair value of each award granted and (ii) projected number of awards expected to vest. We calculate the fair value of all share-based awards at the date of grant and use the straight-line method to amortize this fair value as compensation cost over the requisite service period.
Revenues
Effective December 31, 2017, we adopted ASC 606, Revenue From Contracts With Customers (Topic 606) (“ASC 606”). The results of applying Topic 606 using the modified retrospective approach were insignificant and did not have a material impact on our consolidated financial condition, results of operations, cash flows, business process, controls or systems.
ASC 606 defines a performance obligation as a promise in a contract to transfer a distinct good or service to the customer and is considered the unit of account. The majority of our contracts have one single performance obligation as the promise to transfer the individual goods is not separately identifiable from other promises in the contracts and is, therefore, not distinct. Discounts and incentives are treated as separate performance obligations. We allocate the contract’s transaction price to each of these performance obligations separately using explicitly stated amounts or our best estimate using historical data. Additionally, we estimate and record gift card breakage as redemptions occur.
In accordance with ASC 606 revenue is recognized at the time the sale is made, at which time our walk-in customers take immediate possession of the merchandise or same-day delivery is made to our Professional delivery customers, which include certain independently-owned store locations. Payment terms are established for our Professional delivery customers based on pre-established credit requirements. Payment terms vary depending on the customer and generally range from 1 to 30 days. Based on the nature of receivables, no significant financing components exist. For e-commerce sales, revenue is recognized either at the time of pick-up at one of our store locations or at the time of shipment depending on the customer's order designation. Sales are recorded net of discounts, sales incentives and rebates, sales taxes and estimated returns and allowances. We estimate the reduction to Net sales and Cost of sales for returns based on current sales levels and our historical return experience.
43

We provide assurance type warranty coverage primarily on batteries, brakes and struts whereby we are required to provide replacement product at no cost or a reduced cost for a set period of time.
The following table summarizes financial information for each of our product groups.
Year EndedJanuary 2,
2021December 28,
2019December 29,
2018Percentage of Sales, by Product Group
Parts and Batteries 66 % 67 % 66 %Accessories and Chemicals 21 21 20 Engine Maintenance 12 11 13 Other 1 1 1
Total 100 % 100 % 100 %
Receivables, net consist primarily of receivables from Professional customers. We grant credit to certain Professional customers who meet our pre-established credit requirements. Accounts receivable is stated at net realizable value. We regularly review accounts receivable balances and maintains allowances for doubtful accounts for estimated losses whenever events or circumstances indicate the carrying value may not be recoverable. We consider the following factors when determining if collection is reasonably assured: customer creditworthiness, past transaction history with the customer, current economic and industry trends and changes in customer payment terms. We control credit risk through credit approvals, credit limits and accounts receivable and credit monitoring procedures.
Cost of Sales
Cost of sales includes actual product cost, warranty costs, vendor incentives, cash discounts on payments to vendors, costs associated with operating our distribution network, including payroll and benefits costs, occupancy costs and depreciation, in-bound freight-related costs from our vendors, impairment of inventory resulting from store closures and costs associated with moving merchandise inventories from our distribution centers to stores, branch locations and customers. Selling, General and Administrative Expenses
SG&A includes payroll and benefits costs for store and corporate Team Members, occupancy costs of store and corporate
facilities, depreciation and amortization related to store and corporate assets, share-based compensation expense, advertising, self-insurance, costs of consolidating, converting or closing facilities, including early termination of lease obligations, severance and impairment charges, professional services and costs associated with our Professional delivery program, including payroll and benefit costs, and transportation expenses associated with moving merchandise inventories from stores and branches to customer locations.
Advertising Costs
We expense advertising costs as incurred. Advertising expense, net of qualifying vendor promotional funds, was $132.3 million, $117.3 million and $120.9 million in 2020, 2019 and 2018. Vendor promotional funds, which reduced advertising expense, amounted to $48.5 million and $45.7 million and $26.9 million in 2020, 2019 and 2018.
Foreign Currency Translation
The assets and liabilities of our foreign operations are translated into U.S. dollars at current exchange rates, and revenues, expenses and cash flows are translated at average exchange rates for the year. Resulting translation adjustments are reflected as a separate component in the consolidated statements of comprehensive income. Losses from foreign currency transactions, which are included in Other income, net, were $6.9 million, 1.7 million and 5.0 million in 2020, 2019 and 2018.
44

Income Taxes
We account for income taxes under the asset and liability method, which requires the recognition of deferred tax assets and liabilities for the expected future tax consequences of events that have been included in the financial statements. Under the asset and liability method, deferred tax assets and liabilities are determined based on the differences between the financial statements and tax basis of assets and liabilities using enacted tax rates in effect for the year in which the differences are expected to reverse. Deferred income taxes reflect the net income tax effect of temporary differences between the basis of assets and liabilities for financial reporting purposes and for income tax reporting purposes. The effect of a change in tax rates on deferred tax assets and liabilities is recognized in income in the period of the enactment date.
We recognize tax benefits and/or tax liabilities for uncertain income tax positions based on a two-step process. The first step is to evaluate the tax position for recognition by determining if the weight of available evidence indicates that it is more likely than not that the position will be sustained on audit, including resolution of related appeals or litigation processes, if any. The second step requires us to estimate and measure the tax benefit as the largest amount that is more than 50% likely to be realized upon ultimate settlement. It is inherently difficult and subjective to estimate such amounts as we must determine the probability of various possible outcomes.
We reevaluate these uncertain tax positions on a quarterly basis or when new information becomes available to management. The reevaluations are based on many factors, including but not limited to, changes in facts or circumstances, changes in tax law, successfully settled issues under audit, expirations due to statutes of limitations and new federal or state audit activity. Any change in either our recognition or measurement could result in the recognition of a tax benefit or an increase to the tax accrual.
Earnings per Share
Basic earnings per share of common stock has been computed based on the weighted-average number of common shares outstanding during the period. Diluted earnings per share is calculated by including the effect of dilutive securities. Diluted earnings per share of common stock reflects the weighted-average number of shares of common stock outstanding, outstanding deferred stock units and the impact of outstanding stock options and stock appreciation rights (collectively “share-based awards”). Share-based awards containing performance conditions are included in the dilution impact as those conditions are met.
Segment Information
Operating segments are defined as components of an enterprise for which discrete financial information is available that is evaluated regularly by the chief operating decision maker (“CODM”) for purposes of allocating resources and evaluating financial performance. Our CODM, the Chief Executive Officer, reviews financial information presented on a consolidated basis, accompanied by information about our five operating segments, for purposes of allocating resources and evaluating financial performance.
We have one reportable segment as the five operating segments are aggregated due primarily to the economic and operational similarities of each operating segment as the stores and branches have similar characteristics, including the nature of the products and services, customer base and the methods used to distribute products and provide service to its customers.
Recently Issued Accounting Pronouncements
In December 2019, the FASB issued ASU 2019-12, Income Taxes (Topic 740): Simplifying the Accounting for Income Taxes, which simplifies the accounting for income taxes. This ASU will be effective for fiscal years, and interim periods within those years, beginning after December 15, 2020. We expect the adoption of this new standard to have an insignificant impact on our consolidated financial condition, results of operations or cash flows.
45

During the first quarter of 2020, we adopted Financial Accounting Standard Board (“FASB”) Accounting Standards Update 2016-13 (“ASU 2016-13”), Financial Instruments - Credit Losses (Topic 326): Measurement of Credit Losses on Financial Instruments, which required us to measure all expected credit losses for financial instruments held at the reporting date based on historical experience, current conditions and reasonable supportable forecasts. This replaced the existing incurred loss model and is applicable to the measurement of credit losses on financial assets, including trade receivables. The adoption of ASU 2016-13 did not have a material impact on our consolidated financial statements.
During the second quarter of 2020, we early adopted the SEC’s, Financial Disclosures About Guarantors and Issuers of Guaranteed Securities and Affiliates Whose Securities Collateralize a Registrant’s Securities rules, which simplify the disclosure requirements related to the Company’s registered securities under Rule 3-10 of Regulation S-X. The final rule also allows for the simplified disclosure to be included within Management’s Discussion and Analysis of Financial Condition and Results of Operations.
3. Inventories:
We used the LIFO method of accounting for approximately 88.3% of Inventories at January 2, 2021 and December 28, 2019. As a result of changes in the LIFO reserve, we recorded a reduction to Cost of sales of $13.8 million in 2020, an increase to Cost of sales of $101.3 million in 2019 and a reduction to cost of sales of $39.8 million in 2018.
Purchasing and warehousing costs included in Inventories as of January 2, 2021 and December 28, 2019, were $464.7 million and $476.3 million.
Inventory balances were as follows:
(in thousands)January 2,
2021December 28,
2019Inventories at first in, first out (“FIFO”) $ 4,382,779 $ 4,290,565 Adjustments to state inventories at LIFO 155,420 141,603 Inventories at LIFO $ 4,538,199 $ 4,432,168
4. Goodwill and Intangible Assets:
Goodwill
At January 2, 2021 and December 28, 2019, the carrying amount of Goodwill in the accompanying consolidated balance sheets was $993.6 million and $992.2 million. The change in goodwill during 2020 and 2019 was $1.4 million and $2.0 million related to foreign currency translation.Intangible Assets Other Than Goodwill
On December 23, 2019, we purchased the DieHard® brand for a cash purchase price of $200.0 million, exclusive of $1.5 million of capitalizable transaction costs. This purchase gives us the right to sell DieHard® batteries and enables us to extend the DieHard® brand into other automotive and vehicular categories. We granted the seller an exclusive royalty-free, perpetual license to develop, market, and sell DieHard® branded products in non-automotive categories. We accounted for this transaction as a purchase of an indefinite-lived intangible asset, which is included within the Brands, trademarks and tradenames category below, and is not subject to amortization.
46

Amortization expense was $31.6 million, $31.7 million and $40.7 million for 2020, 2019 and 2018. A summary of the composition of the gross carrying amounts and accumulated amortization of acquired intangible assets are presented in the following table:
January 2, 2021 December 28, 2019
(in thousands)
Gross Carrying Amount
Accumulated Amortization Net
Gross Carrying Amount
Accumulated Amortization Net
Amortized intangible assets:Customer relationships $ 351,056 $ (209,440) $ 141,616 350,352 (179,220) $ 171,132 Non-compete and other 38,492 (37,632) 860 38,256 (37,318) 938
389,548 (247,072) 142,476 388,608 (216,538) 172,070
Indefinite-lived intangible assets:Brands, trademark and tradenames 538,651 — 538,651 537,686 — 537,686 Total intangible assets $ 928,199 $ (247,072) $ 681,127 $ 926,294 $ (216,538) $ 709,756
Future Amortization Expense
The table below shows expected amortization expense for the next five years and thereafter for acquired intangible assets recorded as of January 2, 2021:
Year Amount(in thousands)
2021 $ 30,227 2022 $ 30,131 2023 $ 27,243 2024 $ 27,421 2025 $ 27,370
Thereafter $ 84 $ 142,476
5. Receivables, net:
Receivables, net consist of the following:
(in thousands)January 2,
2021December 28,
2019Trade $ 449,403 $ 422,403 Vendor 278,180 249,009 Other 34,345 32,306
Total receivables 761,928 703,718 Less: allowance for doubtful accounts (11,929) (14,249) Receivables, net $ 749,999 $ 689,469
47

6. Long-term Debt and Fair Value of Financial Instruments:
Long-term debt consists of the following:
(in thousands)January 2,
2021December 28,
20194.50% Senior Unsecured Notes (net of unamortized discount and debt issuance costs of $559 at December 28, 2019) due January 15, 2022 — 299,441
4.50% Senior Unsecured Notes (net of unamortized discount and debt issuance costs of $683 and $2,121 at January 2, 2021 and December 28, 2019) due December 1, 2023 192,990 447,879
1.75% Senior Unsecured Notes (net of unamortized discount and debt issuance costs of $4,145 at January 02, 2021) due October 1, 2027 345,854 —
3.90% Senior Unsecured Notes (net of unamortized discount and debt issuance costs of $5,600 at January 2, 2021) due April 15, 2030 494,140 —
Long-term debt, excluding current portion $ 1,032,984 $ 747,320
Fair value of long-term debt $ 1,145,000 $ 795,000
Fair Value of Financial Assets and Liabilities
The fair value of our senior unsecured notes was determined using Level 2 inputs based on quoted market prices. We believe the carrying value of its other long-term debt approximates fair value. The carrying amounts of our cash and cash equivalents, receivables, accounts payable and accrued expenses approximate their fair values due to the relatively short-term nature of these instruments.
Bank Debt
On January 31, 2017, we entered into a new 5 year credit agreement that provides a $1.0 billion unsecured revolving credit facility (the “2017 Credit Agreement”) with Advance Stores, as Borrower, the lenders party thereto, and Bank of America, N.A., as the administrative agent and replaces a prior credit agreement entered into in 2013. The 2017 Credit Agreement provides for the issuance of letters of credit with a sublimit of $200.0 million. We may request that the total revolving commitment be increased by an amount not exceeding $250.0 million during the term of the 2017 Credit Agreement. Voluntary prepayments and voluntary reductions of the revolving loan balance, if any, are permitted in whole or in part, at our option, in minimum principal amounts as specified in the 2017 Credit Agreement.
On January 31, 2018, we entered into Amendment No. 1 to the 2017 Credit Agreement (the “Amendment”), among Advance Stores, as Borrower, the lenders party thereto, and Bank of America, N.A., Administrative Agent. The Amendment: (i) provided for LIBOR replacement rates in the event that LIBOR is unavailable in the future; (ii) modified the definitions of the financial covenants (and the testing level relating thereto) with respect to a maximum leverage ratio and a minimum coverage ratio that we are required to comply with; and (iii) extended the termination date of the 2017 Credit Agreement from January 31, 2022 until January 31, 2023. We have the option to make one additional written request of the lenders to extend the termination date then in effect for one additional year.
On January 10, 2019, we entered into Amendment No. 2 to the 2017 Credit Agreement (the “ Second Amendment”), among Advance Stores Company, Incorporated, as Borrower, Advance Auto Parts, Inc., as Parent, the banks, financial institutions and other institutional lenders parties thereto and Bank of America, N.A., as Administrative Agent. The Second Amendment: (i) added a new definition of "Insurance Subsidiary" to the 2017 Credit Agreement meaning each wholly owned subsidiary of Parent that is maintained as a special purpose self-insurance subsidiary and any of its subsidiaries; (ii) provided that an Insurance Subsidiary does not serve as a Guarantor of the 2017 Credit Agreement; and (iii) provided that Insurance Subsidiaries are permitted to incur intercompany indebtedness. Insurance Subsidiaries will not be required to serve as Guarantors of the Parent's senior unsecured notes so long as they are not guarantors of the 2017 Credit Agreement.
As of January 2, 2021, we had no outstanding borrowings under 2017 Credit Agreement and borrowing availability was $1.0 billion. Under the 2017 Credit Agreement, we had no letters of credit outstanding as of January 2, 2021.
48

Interest on any borrowings on the revolver will be based at our option, on an adjusted LIBOR, plus a margin, or an alternate base rate, plus a margin. After an initial interest period, we may elect to convert a particular borrowing to a different type. The initial margins per annum for the revolving loan are 1.10% for the adjusted LIBOR and 0.10% for alternate base rate borrowings. A facility fee of 0.15% per annum is charged on the total revolving facility commitment, payable quarterly in arrears. Under the terms of the 2017 Credit Agreement, the interest rate spread and facility fee are based on our credit rating. The interest rate spread ranges from 0.91% to 1.50% for adjusted LIBOR borrowings and 0.00% to 0.50% for alternate base rate borrowings.
The 2017 Credit Agreement contains customary covenants restricting the ability of: (a) Advance Stores and its subsidiaries to, among other things, (i) create, incur or assume additional debt (only with respect to subsidiaries of Advance Stores), (ii) incur liens, (iii) guarantee obligations, and (iv) change the nature of its business conducted by itself and its subsidiaries; (b) Advance, Advance Stores and their subsidiaries to, among other things (i) enter into certain hedging arrangements, (ii) enter into restrictive agreements limiting their ability to incur liens on any of their property or assets, pay distributions, repay loans, or guarantee indebtedness of their subsidiaries; and (c) Advance, among other things, to change the holding company status of Advance. Advance Stores is required to comply with financial covenants with respect to a maximum leverage ratio and a minimum coverage ratio. The 2017 Credit Agreement also provides for customary events of default, including non-payment defaults, covenant defaults and cross-defaults of Advance Stores’ other material indebtedness. We were in compliance with our financial covenants with respect to the 2017 Credit Agreement as of January 2, 2021.
As of January 2, 2021 and December 28, 2019, we had $100.0 million and $111.6 million of bilateral letters of credit issued separately from the 2017 Credit Agreement, none of which were drawn upon. These bilateral letters of credit generally have a term of one year or less and primarily serve as collateral for our self-insurance policies.
Senior Unsecured Notes
Our 4.50% senior unsecured notes due January 15, 2022 (the “2022 Notes”) were issued in January 2012 at 99.97% of the principal amount of $300.0 million. The 2022 Notes bear interest at a rate of 4.50% per year payable semi-annually in arrears on January 15 and July 15 of each year. Our 4.50% senior unsecured notes due December 1, 2023 (the “2023 Notes”) were issued in December 2013 at 99.69% of the principal amount of $450.0 million. The 2023 Notes bear interest at a rate of 4.50% per year payable semi-annually in arrears on June 1 and December 1 of each year.
On April 16, 2020, we issued $500.0 million aggregate principal amount of senior unsecured notes (the “Original Notes”). The Original Notes were issued at 99.65% of the principal amount of $500.0 million, are due April 15, 2030 and bear interest at 3.90% per year payable semi-annually in arrears on April 15 and October 15 of each year (collectively with the 2023 Notes and 2027 Notes, referred to as our “senior unsecured notes”). During the second quarter of 2020, we commenced an exchange offer to exchange the Original Notes in the aggregate principal amount of $500.0 million, which were not registered under the Securities Act of 1933, as amended (the “Securities Act”), for a like principal amount of 3.90% senior unsecured notes due 2030 (the “Exchange Notes” or “2030 Notes”), which have been registered under the Securities Act. The Original Notes were substantially identical to the Exchange Notes, except that the Exchange Notes are registered under the Securities Act and are not subject to the transfer restrictions and certain registration rights agreement provisions applicable to the Original Notes. On July 28, 2020, the Original Notes were successfully exchanged for the Exchange Notes.
On September 16, 2020, we redeemed all $300.0 million aggregate principal amount of our outstanding 2022 Notes. In connection with this early redemption, we incurred charges relating to a make-whole provision and debt issuance costs of $15.8 million and $0.3 million.
On September 29, 2020, we issued $350.0 million aggregate principal amount of senior unsecured notes (the “2027 Notes”). The 2027 Notes were issued at 99.67% of the principal amount of $350.0 million, are due October 1, 2027 and bear interest at 1.75% per year payable semi-annually in arrears on April 1 and October 1 of each year. In connection with the 2027 Notes offering, we incurred $2.9 million of debt issuance costs.
Pursuant to a cash tender offer that was completed on September 29, 2020, we repurchased $256.3 million of our 2023 Notes with the net proceeds from the 2027 Notes. In connection with this tender offer, we incurred charges relating to tender premiums and debt issuance costs of $30.5 million and $1.4 million.
49

The terms of the senior unsecured notes are governed by an indenture (as amended, supplemented, waived or otherwise modified, the “Indenture”) among Advance, the subsidiary guarantors from time to time party thereto and Wells Fargo Bank, National Association, as Trustee.
We may redeem some or all of the senior unsecured notes at any time or from time to time, at the redemption price described in the Indenture. In addition, in the event of a Change of Control Triggering Event (as defined in the Indenture for the senior unsecured notes), we will be required to offer to repurchase the senior unsecured notes at a price equal to 101% of the principal amount thereof, plus accrued and unpaid interest to the repurchase date. The senior unsecured notes are currently fully and unconditionally guaranteed, jointly and severally, on an unsubordinated and unsecured basis by each of the subsidiary guarantors. We will be permitted to release guarantees without the consent of holders of the senior unsecured notes under the circumstances described in the Indenture: (i) upon the release of the guarantee of our other debt that resulted in the affected subsidiary becoming a guarantor of this debt; (ii) upon the sale or other disposition of all or substantially all of the stock or assets of the subsidiary guarantor; or (iii) upon our exercise of our legal or covenant defeasance option.
The Indenture contains customary provisions for events of default including for: (i) failure to pay principal or interest when due and payable; (ii) failure to comply with covenants or agreements in the Indenture or the Notes and failure to cure or obtain a waiver of such default upon notice; (iii) a default under any debt for money borrowed by us or any of our subsidiaries that results in acceleration of the maturity of such debt, or failure to pay any such debt within any applicable grace period after final stated maturity, in an aggregate amount greater than $25.0 million without such debt having been discharged or acceleration having been rescinded or annulled within 10 days after receipt by us of notice of the default by the Trustee or holders of not less than 25% in aggregate principal amount of the Notes then outstanding; and (iv) events of bankruptcy, insolvency or reorganization affecting us and certain of its subsidiaries. In the case of an event of default, the principal amount of the Notes plus accrued and unpaid interest may be accelerated. The Indenture also contains covenants limiting the ability of us and our subsidiaries to incur debt secured by liens and to enter into sale and lease-back transactions.
Future Payments
As of January 2, 2021, the aggregate future annual maturities of long-term debt instruments are as follows:
Year Amount(in thousands)
2021 $ — 2022 — 2023 193,673 2024 — 2025 —
Thereafter 850,000 $ 1,043,673
Debt Guarantees
We are a guarantor of loans made by banks to various independently owned Carquest-branded stores that are customers of ours totaling $23.6 million as of January 2, 2021. These loans are collateralized by security agreements on merchandise inventory and other assets of the borrowers. The approximate value of the inventory collateralized by these agreements is $57.5 million as of January 2, 2021. We believe that the likelihood of performance under these guarantees is remote.
50

7. Property and Equipment:
Property and equipment consists of the following:
(in thousands) Useful LivesJanuary 2,
2021December 28,
2019Land and land improvements 0 - 10 years $ 469,640 $ 457,960 Buildings 30 - 40 years 514,199 498,871 Building and leasehold improvements 1 - 15 years 560,070 535,082 Furniture, fixtures and equipment 2 - 20 years 1,969,011 1,850,485 Vehicles 8 years 14,574 14,612 Construction in progress 124,273 114,052
3,651,767 3,471,062 Less - Accumulated depreciation (2,189,165) (2,037,849) Property and equipment, net $ 1,462,602 $ 1,433,213
Depreciation expense relating to Property and equipment was $218.5 million, $206.7 million and $201.6 million for 2020, 2019 and 2018. We capitalized $58.4 million, $29.1 million and $13.0 million incurred for the development of internal use computer software during 2020, 2019 and 2018. These costs are currently classified in the Construction in progress category above, but once placed into service within the Furniture, fixtures equipment category, these costs will be depreciated on the straight-line method over 3 to 10 years.
In 2020, 2019 and 2018 we recognized impairment losses of $0.2 million, $2.3 million and $13.4 million, primarily on store and corporate assets.
8. Leases and Other Commitments:
Leases
Substantially all of our leases are for facilities and vehicles. The initial term for facilities are typically 5 years to 10 years, with renewal options at 5 year intervals, with the exercise of lease renewal options at our sole discretion. Our vehicle and equipment leases are typically 3 years to 6 years. Our lease agreements do not contain any material residual value guarantees or material restrictive covenants.
Operating lease liabilities consist of the following:
(in thousands)January 2,
2021December 28,
2019Total operating lease liabilities $ 2,477,087 $ 2,495,141 Less: Current portion of operating lease liabilities (462,588) (477,982) Noncurrent operating lease liabilities $ 2,014,499 $ 2,017,159
The current portion of operating lease liabilities is included in Other current liabilities in the accompanying condensed consolidated balance sheet.
51
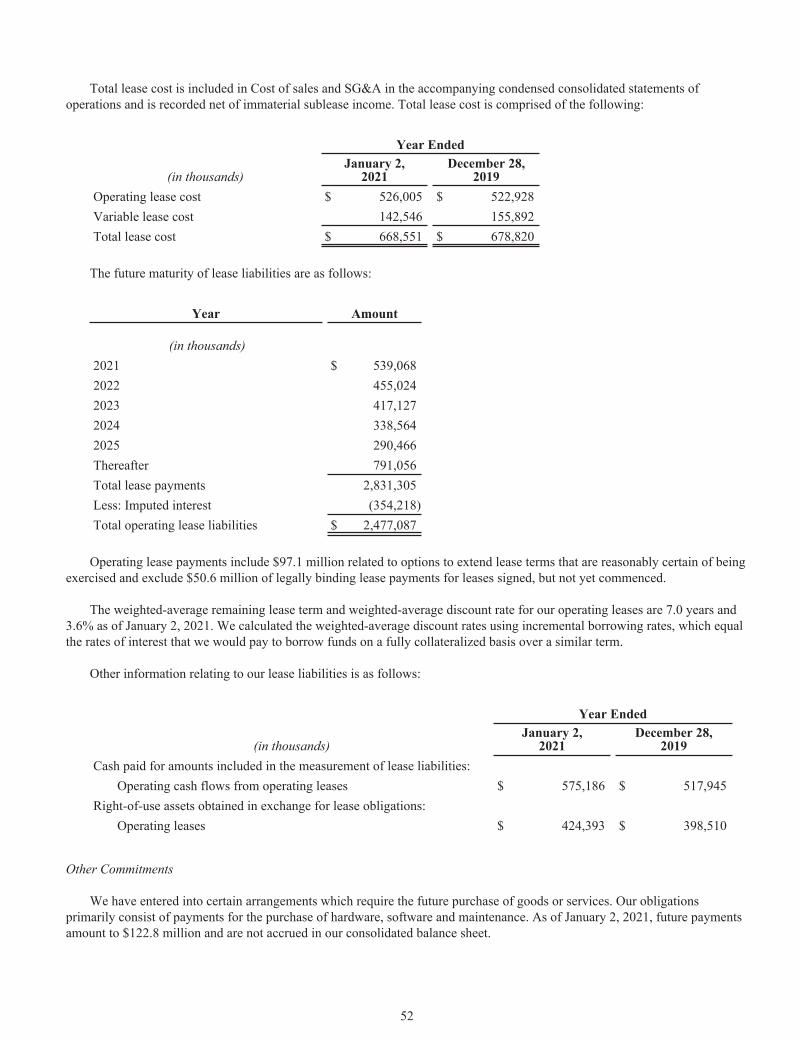
Total lease cost is included in Cost of sales and SG&A in the accompanying condensed consolidated statements of operations and is recorded net of immaterial sublease income. Total lease cost is comprised of the following:
Year Ended
(in thousands)January 2,
2021December 28,
2019Operating lease cost $ 526,005 $ 522,928 Variable lease cost 142,546 155,892 Total lease cost $ 668,551 $ 678,820
The future maturity of lease liabilities are as follows:
Year Amount
(in thousands)2021 $ 539,068 2022 455,024 2023 417,127 2024 338,564 2025 290,466 Thereafter 791,056 Total lease payments 2,831,305 Less: Imputed interest (354,218) Total operating lease liabilities $ 2,477,087
Operating lease payments include $97.1 million related to options to extend lease terms that are reasonably certain of being exercised and exclude $50.6 million of legally binding lease payments for leases signed, but not yet commenced.
The weighted-average remaining lease term and weighted-average discount rate for our operating leases are 7.0 years and 3.6% as of January 2, 2021. We calculated the weighted-average discount rates using incremental borrowing rates, which equal the rates of interest that we would pay to borrow funds on a fully collateralized basis over a similar term.
Other information relating to our lease liabilities is as follows:
Year Ended
(in thousands)January 2,
2021December 28,
2019Cash paid for amounts included in the measurement of lease liabilities:
Operating cash flows from operating leases $ 575,186 $ 517,945 Right-of-use assets obtained in exchange for lease obligations:
Operating leases $ 424,393 $ 398,510
Other Commitments
We have entered into certain arrangements which require the future purchase of goods or services. Our obligations primarily consist of payments for the purchase of hardware, software and maintenance. As of January 2, 2021, future payments amount to $122.8 million and are not accrued in our consolidated balance sheet.
52
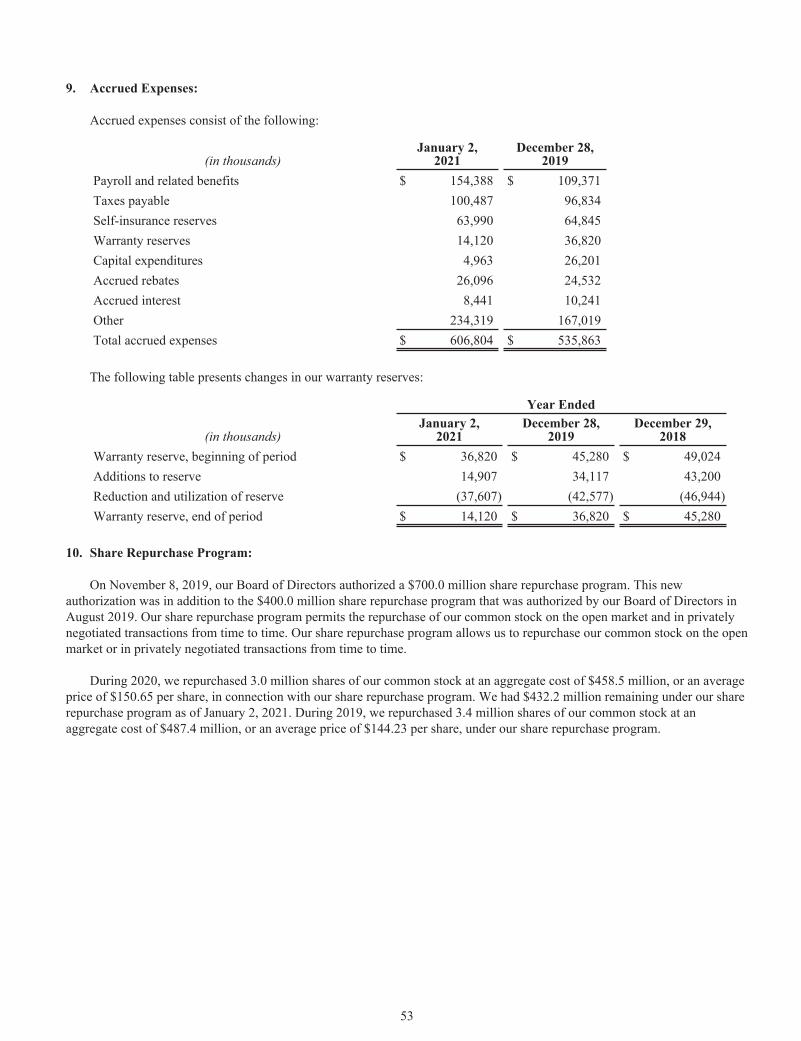
9. Accrued Expenses:
Accrued expenses consist of the following:
(in thousands)January 2,
2021December 28,
2019Payroll and related benefits $ 154,388 $ 109,371 Taxes payable 100,487 96,834 Self-insurance reserves 63,990 64,845 Warranty reserves 14,120 36,820 Capital expenditures 4,963 26,201 Accrued rebates 26,096 24,532 Accrued interest 8,441 10,241 Other 234,319 167,019 Total accrued expenses $ 606,804 $ 535,863
The following table presents changes in our warranty reserves:
Year Ended
(in thousands)January 2,
2021December 28,
2019December 29,
2018Warranty reserve, beginning of period $ 36,820 $ 45,280 $ 49,024 Additions to reserve 14,907 34,117 43,200 Reduction and utilization of reserve (37,607) (42,577) (46,944) Warranty reserve, end of period $ 14,120 $ 36,820 $ 45,280
10. Share Repurchase Program:
On November 8, 2019, our Board of Directors authorized a $700.0 million share repurchase program. This new authorization was in addition to the $400.0 million share repurchase program that was authorized by our Board of Directors in August 2019. Our share repurchase program permits the repurchase of our common stock on the open market and in privately negotiated transactions from time to time. Our share repurchase program allows us to repurchase our common stock on the open market or in privately negotiated transactions from time to time.
During 2020, we repurchased 3.0 million shares of our common stock at an aggregate cost of $458.5 million, or an average price of $150.65 per share, in connection with our share repurchase program. We had $432.2 million remaining under our share repurchase program as of January 2, 2021. During 2019, we repurchased 3.4 million shares of our common stock at an aggregate cost of $487.4 million, or an average price of $144.23 per share, under our share repurchase program.
53
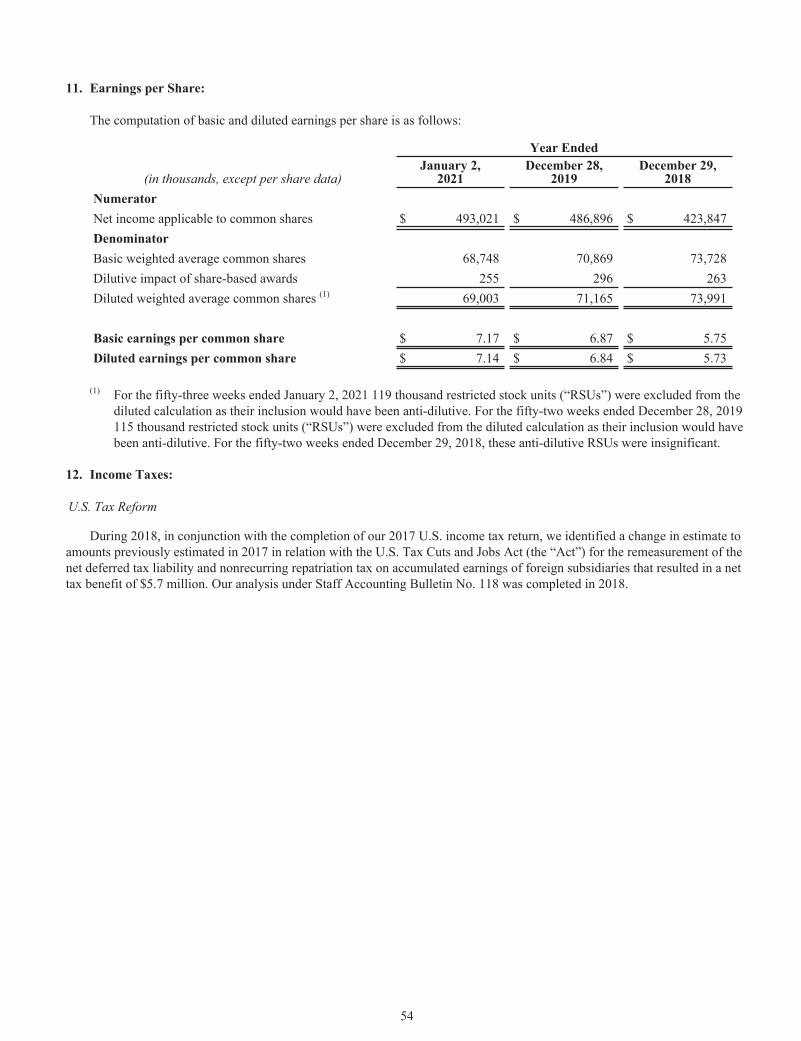
11. Earnings per Share:
The computation of basic and diluted earnings per share is as follows:
Year Ended
(in thousands, except per share data)January 2,
2021December 28,
2019December 29,
2018NumeratorNet income applicable to common shares $ 493,021 $ 486,896 $ 423,847 DenominatorBasic weighted average common shares 68,748 70,869 73,728 Dilutive impact of share-based awards 255 296 263 Diluted weighted average common shares (1) 69,003 71,165 73,991
Basic earnings per common share $ 7.17 $ 6.87 $ 5.75 Diluted earnings per common share $ 7.14 $ 6.84 $ 5.73
(1) For the fifty-three weeks ended January 2, 2021 119 thousand restricted stock units (“RSUs”) were excluded from the diluted calculation as their inclusion would have been anti-dilutive. For the fifty-two weeks ended December 28, 2019 115 thousand restricted stock units (“RSUs”) were excluded from the diluted calculation as their inclusion would have been anti-dilutive. For the fifty-two weeks ended December 29, 2018, these anti-dilutive RSUs were insignificant.
12. Income Taxes:
U.S. Tax Reform
During 2018, in conjunction with the completion of our 2017 U.S. income tax return, we identified a change in estimate to amounts previously estimated in 2017 in relation with the U.S. Tax Cuts and Jobs Act (the “Act”) for the remeasurement of the net deferred tax liability and nonrecurring repatriation tax on accumulated earnings of foreign subsidiaries that resulted in a net tax benefit of $5.7 million. Our analysis under Staff Accounting Bulletin No. 118 was completed in 2018.
54

Provision for Income Taxes
Provision for income taxes consists of the following:
(in thousands) Current Deferred Total2020
Federal $ 112,096 $ 7,718 $ 119,814 State 23,779 1,066 24,845 Foreign 13,983 (648) 13,335
$ 149,858 $ 8,136 $ 157,994 2019
Federal $ 84,490 $ 13,618 $ 98,108 State 26,924 8,117 35,041 Foreign 16,288 1,413 17,701
$ 127,702 $ 23,148 $ 150,850 2018
Federal $ 72,598 $ 14,745 $ 87,343 State 19,571 3,439 23,010 Foreign 23,292 (2,228) 21,064
$ 115,461 $ 15,956 $ 131,417
The provision for income taxes differed from the amount computed by applying the federal statutory income tax rate due to:
Year Ended
(in thousands)January 2,
2021December 28,
2019December 29,
2018
Income before provision for income taxes at statutory U.S. federal income tax rate (21% for 2020, 2019 and 2018) $ 136,713 $ 133,927 $ 116,605 State income taxes, net of federal income tax benefit 18,610 27,682 18,178
Impact of the Act — — (5,655) Other, net 2,671 (10,759) 2,289
$ 157,994 $ 150,850 $ 131,417
55
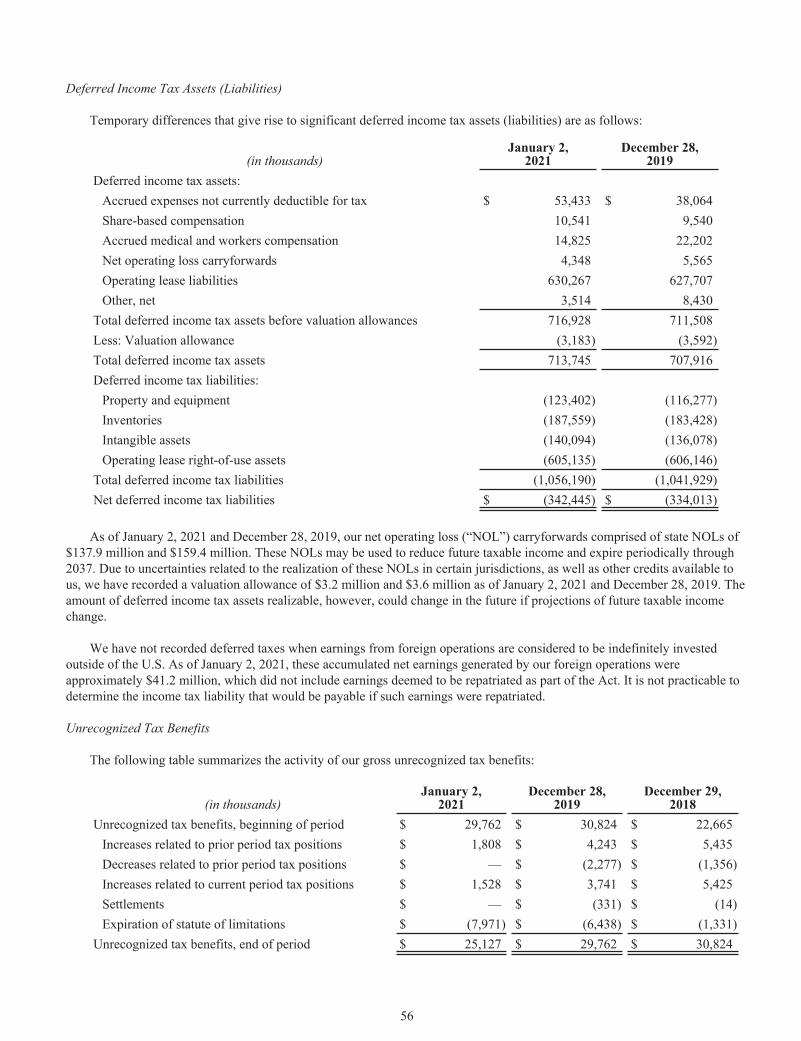
Deferred Income Tax Assets (Liabilities)
Temporary differences that give rise to significant deferred income tax assets (liabilities) are as follows:
(in thousands)January 2,
2021December 28,
2019Deferred income tax assets:
Accrued expenses not currently deductible for tax $ 53,433 $ 38,064 Share-based compensation 10,541 9,540 Accrued medical and workers compensation 14,825 22,202 Net operating loss carryforwards 4,348 5,565 Operating lease liabilities 630,267 627,707 Other, net 3,514 8,430
Total deferred income tax assets before valuation allowances 716,928 711,508 Less: Valuation allowance (3,183) (3,592) Total deferred income tax assets 713,745 707,916 Deferred income tax liabilities:
Property and equipment (123,402) (116,277) Inventories (187,559) (183,428) Intangible assets (140,094) (136,078) Operating lease right-of-use assets (605,135) (606,146)
Total deferred income tax liabilities (1,056,190) (1,041,929) Net deferred income tax liabilities $ (342,445) $ (334,013)
As of January 2, 2021 and December 28, 2019, our net operating loss (“NOL”) carryforwards comprised of state NOLs of $137.9 million and $159.4 million. These NOLs may be used to reduce future taxable income and expire periodically through 2037. Due to uncertainties related to the realization of these NOLs in certain jurisdictions, as well as other credits available to us, we have recorded a valuation allowance of $3.2 million and $3.6 million as of January 2, 2021 and December 28, 2019. The amount of deferred income tax assets realizable, however, could change in the future if projections of future taxable income change.
We have not recorded deferred taxes when earnings from foreign operations are considered to be indefinitely invested outside of the U.S. As of January 2, 2021, these accumulated net earnings generated by our foreign operations were approximately $41.2 million, which did not include earnings deemed to be repatriated as part of the Act. It is not practicable to determine the income tax liability that would be payable if such earnings were repatriated.
Unrecognized Tax Benefits
The following table summarizes the activity of our gross unrecognized tax benefits:
(in thousands)January 2,
2021December 28,
2019December 29,
2018Unrecognized tax benefits, beginning of period $ 29,762 $ 30,824 $ 22,665
Increases related to prior period tax positions $ 1,808 $ 4,243 $ 5,435 Decreases related to prior period tax positions $ — $ (2,277) $ (1,356) Increases related to current period tax positions $ 1,528 $ 3,741 $ 5,425 Settlements $ — $ (331) $ (14) Expiration of statute of limitations $ (7,971) $ (6,438) $ (1,331)
Unrecognized tax benefits, end of period $ 25,127 $ 29,762 $ 30,824
56

As of January 2, 2021, December 28, 2019 and December 29, 2018, the entire amount of unrecognized tax benefits, if recognized, would reduce our annual effective tax rate. During 2020 and 2019, we recorded expenses relating to income tax-related interest and penalties of $0.2 million and $1.6 million due to uncertain tax positions included in Provision for income taxes in the accompanying consolidated statements of operations. During 2018, we recorded a gain relating to income tax-related interest and penalties of $0.9 million due to uncertain tax positions included in Provision for income taxes in the accompanying consolidated statements of operations. As of January 2, 2021 and December 28, 2019, we recorded a liability for potential interest of $4.7 million and $4.9 million and for potential penalties of $0.1 million and $0.1 million. We did not provide for any penalties associated with tax contingencies unless considered probable of assessment. We do not expect our unrecognized tax benefits to change significantly over the next 12 months. With few exceptions, we are no longer subject to U.S. federal, state and local or non-U.S. income tax examinations by tax authorities for years before 2016.
13. Contingencies:
We are currently and from time to time subject to litigation, claims and other disputes, including legal and regulatory proceedings, arising in the normal course of business. We record a loss contingency liability when a loss is considered probable and the amount can be reasonably estimated. Although the final outcome of these legal matters cannot be determined, based on the facts presently known, it is management’s opinion that the final outcome of any pending matters will not have a material adverse effect on our consolidated financial position, results of operations or cash flows.
Our Western Auto subsidiary, together with other defendants (including Advance and other of its subsidiaries), has been named as a defendant in lawsuits alleging injury as a result of exposure to asbestos-containing products. The plaintiffs have alleged that certain products contained asbestos and were manufactured, distributed and/or sold by the various defendants. Many of the cases pending against us are in the early stages of litigation. While the damages claimed against the defendants in some of these proceedings are substantial, we believe many of these claims are at least partially covered by insurance and historically asbestos claims against us have been inconsistent in fact patterns alleged and immaterial. We do not believe the cases currently pending will have a material adverse effect on our financial position, results of operations or cash flows.
14. Benefit Plans:
401(k) Plan
We maintain a defined contribution benefit plan, which covers substantially all Team Members after one year of service and who have attained the age of 21. The plan allows for Team Member salary deferrals, which are matched at our discretion. Company contributions to these plans were $21.3 million, $17.9 million and $15.0 million in 2020, 2019 and 2018.
Deferred Compensation
We maintain a non-qualified deferred compensation plan for certain Team Members. This plan provides for a minimum and maximum deferral percentage of the Team Member’s base salary and bonus, as determined by the Retirement Plan Committee. We established and maintained a deferred compensation liability for this plan. As of January 2, 2021 and December 28, 2019, these liabilities were $16.1 million and $15.0 million. 15. Share-Based Compensation:
Overview
We grant share-based compensation awards to our Team Members and members of our Board of Directors as provided for under our 2014 Long-Term Incentive Plan (“2014 LTIP”), which was approved by our shareholders on May 14, 2014. In 2020, 2019 and 2018, we granted share-based compensation in the form of restricted stock units (“RSUs”) or deferred stock units (“DSUs”). No share-based compensation was granted in the form of stock appreciation rights (“SARs”) in 2020, 2019 and 2018. Our grants, which have three methods of measuring fair value, generally include a time-based service, a performance-based or a market-based portion, which collectively represent the target award.
As of January 2, 2021, the aggregate intrinsic value of outstanding and exercisable time-based and performance-based SARs was insignificant. In 2020, 2019 and 2018, all related activity related to SARs, including grants, exercises and forfeitures, was insignificant.
57

At January 2, 2021, there were 4.6 million shares of common stock available for future issuance under the 2014 LTIP based on management’s current estimate of the probable vesting outcome for performance-based awards. We issue new shares of common stock upon exercise of SARs. Shares forfeited and shares withheld for payment of taxes due become available for reissuance and are included in availability. Availability also includes shares that became available for reissuance in connection with the exercise of SARs.
Restricted Stock Units
For time-based RSUs, the fair value of each award was determined based on the market price of our common stock on the date of grant. Time-based RSUs generally vest over a three-year period in equal annual installments beginning on the first anniversary of the grant date. During the vesting period, holders of RSUs are entitled to receive dividend equivalents, but are not entitled to voting rights.
For performance-based RSUs, the fair value of each award was determined based on the market price of our common stock on the date of grant. Performance-based awards generally may vest following a three-year period subject to our achievement of certain financial goals as specified in the grant agreements. Depending on our results during the three-year performance period, the actual number of awards vesting at the end of the period generally ranges from 0% to 200% of the performance award. Performance-based RSUs generally do not have dividend equivalent rights and do not have voting rights until the shares are earned and issued following the applicable performance period. The number of performance-based awards outstanding is based on the number of awards that we believed were probable of vesting at January 2, 2021. Performance-based RSU’s granted during 2020 are presented as grants in the table at their respective target levels. The change in units based on performance represents the change in the number of granted awards expected to vest based on the updated probability assessment as of January 2, 2021. Compensation expense for performance-based awards of $9.4 million, $7.8 million, and $5.4 million in 2020, 2019 and 2018, was determined based on management’s estimate of the probable vesting outcome.
For market-based RSUs, the fair value of each award was determined using a Monte Carlo simulation model. The model uses multiple input variables that determined the probability of satisfying the market condition requirements as follows:
Monte Carlo Simulation Model Assumptions 2021 2019 2018Risk-free interest rate (1) 0.9 % 2.5 % 2.4 %Expected dividend yield 0.8 % 0.2 % 0.2 %Expected stock price volatility (2) 34.0 % 33.5 % 34.0 %
(1) The risk-free interest rate is based on the U.S. Treasury constant maturity interest rate having term consistent with the vesting period of the award.
(2) Expected volatility is determined based on historical volatility over a matching look-back period and is consistent with the correlation coefficients between our stock prices and our peer group.
Additionally, we estimated a liquidity discount of 10.1% using the Chaffe Protective Put Method to adjust the fair value for the post-vest restrictions. Market-based RSU’s vesting depends on our relative total shareholder return among a designated group of peer companies during a three-year period and will be subject to a one-year holding period after vesting.
58
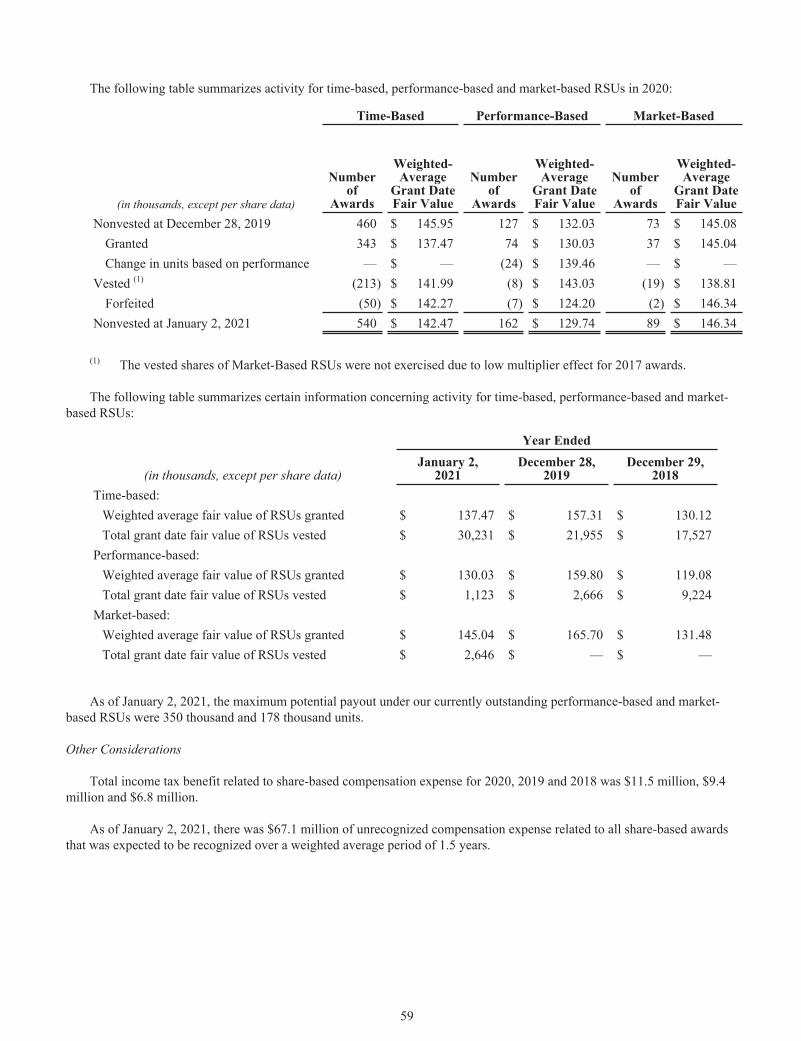
The following table summarizes activity for time-based, performance-based and market-based RSUs in 2020:
Time-Based Performance-Based Market-Based
(in thousands, except per share data)
Number of
Awards
Weighted-Average
Grant Date Fair Value
Number of
Awards
Weighted-Average
Grant Date Fair Value
Number of
Awards
Weighted-Average
Grant Date Fair Value
Nonvested at December 28, 2019 460 $ 145.95 127 $ 132.03 73 $ 145.08 Granted 343 $ 137.47 74 $ 130.03 37 $ 145.04 Change in units based on performance — $ — (24) $ 139.46 — $ —
Vested (1) (213) $ 141.99 (8) $ 143.03 (19) $ 138.81 Forfeited (50) $ 142.27 (7) $ 124.20 (2) $ 146.34
Nonvested at January 2, 2021 540 $ 142.47 162 $ 129.74 89 $ 146.34
(1) The vested shares of Market-Based RSUs were not exercised due to low multiplier effect for 2017 awards.
The following table summarizes certain information concerning activity for time-based, performance-based and market-based RSUs:
Year Ended
(in thousands, except per share data)January 2,
2021December 28,
2019December 29,
2018Time-based:
Weighted average fair value of RSUs granted $ 137.47 $ 157.31 $ 130.12 Total grant date fair value of RSUs vested $ 30,231 $ 21,955 $ 17,527
Performance-based:Weighted average fair value of RSUs granted $ 130.03 $ 159.80 $ 119.08 Total grant date fair value of RSUs vested $ 1,123 $ 2,666 $ 9,224
Market-based:Weighted average fair value of RSUs granted $ 145.04 $ 165.70 $ 131.48 Total grant date fair value of RSUs vested $ 2,646 $ — $ —
As of January 2, 2021, the maximum potential payout under our currently outstanding performance-based and market-based RSUs were 350 thousand and 178 thousand units.
Other Considerations
Total income tax benefit related to share-based compensation expense for 2020, 2019 and 2018 was $11.5 million, $9.4 million and $6.8 million.
As of January 2, 2021, there was $67.1 million of unrecognized compensation expense related to all share-based awards that was expected to be recognized over a weighted average period of 1.5 years.
59

Deferred Stock Units (“DSUs”)
We grant share-based awards annually to our Board of Directors in connection with its annual meeting of stockholders. These awards are granted in the form of DSUs as provided for in the Advance Auto Parts, Inc. Deferred Stock Unit Plan for Non-Employee Directors and Selected Executives (“DSU Plan”). Each DSU is equivalent to one share of our common stock and will be distributed in common shares after the director’s service on the Board ends. DSUs granted vest over a one year service period. Additionally, the DSU Plan provides for the deferral of compensation earned in the form of (i) an annual retainer for directors, and (ii) wages for certain highly compensated Team Members. These DSUs are settled in common stock with the participants at a future date, or over a specified time period, as elected by the participants in accordance with the DSU Plan.
We granted 12 thousand DSUs in 2020. The weighted average fair value of DSUs granted during 2020, 2019 and 2018 was $130.14, $156.47, and $127.14. The DSUs are awarded at a price equal to the market price of our underlying common stock on the date of the grant. For 2020, 2019 and 2018, we recognized $1.6 million, $1.9 million and $1.9 million of share-based compensation expense for these DSU grants.
Employee Stock Purchase Plan
We also offer an employee stock purchase plan (“ESPP”). Under the ESPP, eligible Team Members may elect salary deferrals to purchase our common stock at a discount of 10% from its fair market value on the date of purchase. There are annual limitations on the amounts a Team Member may elect of either $25 thousand per Team Member or 10% of compensation, whichever is less. As of January 2, 2021, there were 0.9 million shares available to be issued under the ESPP.
16. Accumulated Other Comprehensive Loss:
Accumulated other comprehensive loss, net of tax, consisted of the following:
(in thousands)
Unrealized Gain (Loss) on
Postretirement PlanForeign Currency
Translation
Accumulated Other Comprehensive (Loss) Income
Balance, December 30, 2017 $ 1,758 $ (26,712) $ (24,954) 2018 activity (294) (18,945) (19,239) Balance, December 29, 2018 1,464 (45,657) (44,193) 2019 activity (142) 9,766 9,624 Balance, December 28, 2019 1,322 (35,891) (34,569) 2020 activity (152) 7,962 7,810 Balance, January 2, 2021 $ 1,170 $ (27,929) $ (26,759)
60
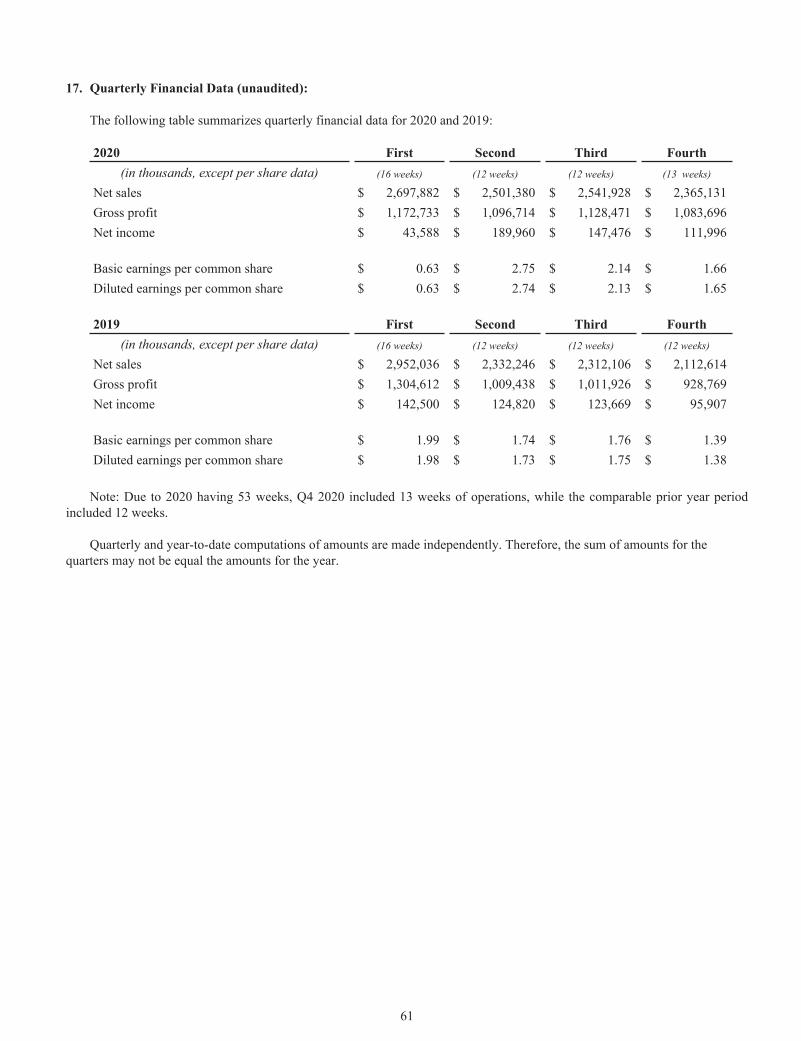
17. Quarterly Financial Data (unaudited):
The following table summarizes quarterly financial data for 2020 and 2019:
2020 First Second Third Fourth(in thousands, except per share data) (16 weeks) (12 weeks) (12 weeks) (13 weeks)
Net sales $ 2,697,882 $ 2,501,380 $ 2,541,928 $ 2,365,131 Gross profit $ 1,172,733 $ 1,096,714 $ 1,128,471 $ 1,083,696 Net income $ 43,588 $ 189,960 $ 147,476 $ 111,996
Basic earnings per common share $ 0.63 $ 2.75 $ 2.14 $ 1.66 Diluted earnings per common share $ 0.63 $ 2.74 $ 2.13 $ 1.65
2019 First Second Third Fourth(in thousands, except per share data) (16 weeks) (12 weeks) (12 weeks) (12 weeks)
Net sales $ 2,952,036 $ 2,332,246 $ 2,312,106 $ 2,112,614 Gross profit $ 1,304,612 $ 1,009,438 $ 1,011,926 $ 928,769 Net income $ 142,500 $ 124,820 $ 123,669 $ 95,907
Basic earnings per common share $ 1.99 $ 1.74 $ 1.76 $ 1.39 Diluted earnings per common share $ 1.98 $ 1.73 $ 1.75 $ 1.38
Note: Due to 2020 having 53 weeks, Q4 2020 included 13 weeks of operations, while the comparable prior year period included 12 weeks.
Quarterly and year-to-date computations of amounts are made independently. Therefore, the sum of amounts for the quarters may not be equal the amounts for the year.
61

Advance Auto Parts, Inc.Schedule II - Valuation and Qualifying Accounts
(in thousands)
Allowance for doubtful accounts receivable
Balance at Beginning of
PeriodCharges to Expenses Deductions(1)
Balance at End of Period
December 29, 2018 $ 18,219 $ 18,445 $ (18,622) $ 18,042 December 28, 2019 $ 18,042 $ 11,949 $ (15,742) $ 14,249 January 2, 2021 $ 14,249 $ 14,933 $ (17,253) $ 11,929
(1) Accounts written off during the period. These amounts did not impact our statement of operations for any year presented.
Other valuation and qualifying accounts have not been reported in this schedule because they are either not applicable or because the information has been included elsewhere in this report.
62
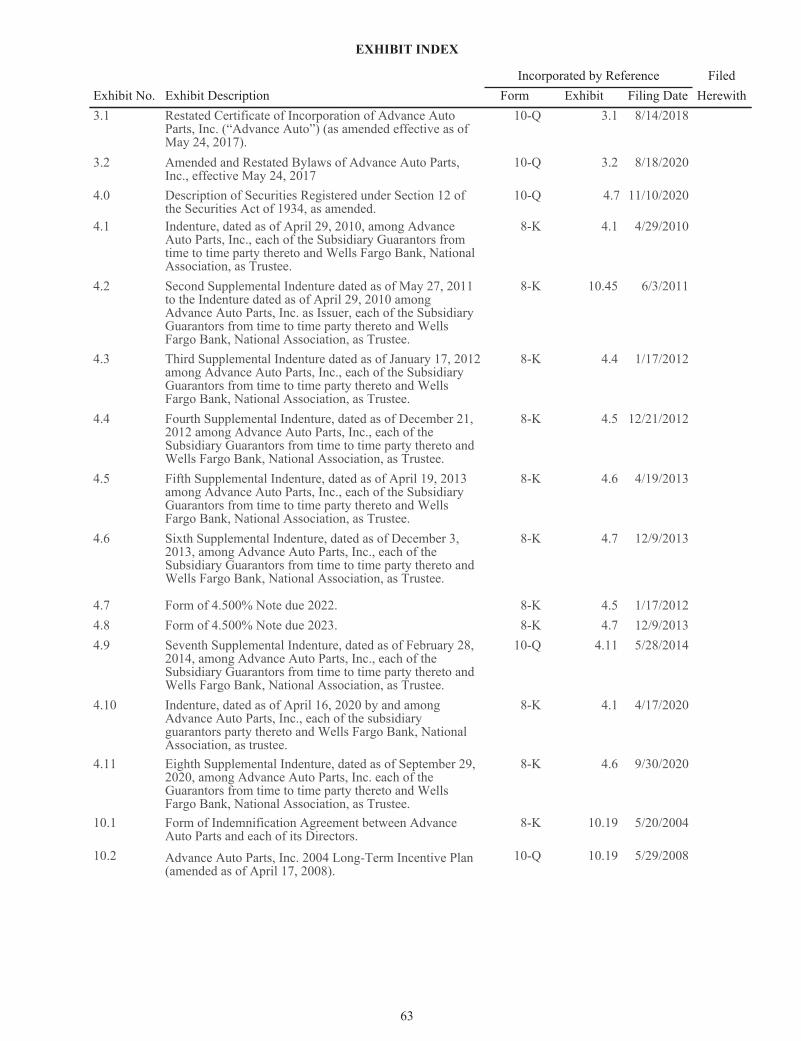
EXHIBIT INDEX
Incorporated by Reference FiledExhibit No. Exhibit Description Form Exhibit Filing Date Herewith3.1 Restated Certificate of Incorporation of Advance Auto
Parts, Inc. (“Advance Auto”) (as amended effective as of May 24, 2017).
10-Q 3.1 8/14/2018
3.2 Amended and Restated Bylaws of Advance Auto Parts, Inc., effective May 24, 2017
10-Q 3.2 8/18/2020
4.0 Description of Securities Registered under Section 12 of the Securities Act of 1934, as amended.
10-Q 4.7 11/10/2020
4.1 Indenture, dated as of April 29, 2010, among Advance Auto Parts, Inc., each of the Subsidiary Guarantors from time to time party thereto and Wells Fargo Bank, National Association, as Trustee.
8-K 4.1 4/29/2010
4.2 Second Supplemental Indenture dated as of May 27, 2011 to the Indenture dated as of April 29, 2010 among Advance Auto Parts, Inc. as Issuer, each of the Subsidiary Guarantors from time to time party thereto and Wells Fargo Bank, National Association, as Trustee.
8-K 10.45 6/3/2011
4.3 Third Supplemental Indenture dated as of January 17, 2012 among Advance Auto Parts, Inc., each of the Subsidiary Guarantors from time to time party thereto and Wells Fargo Bank, National Association, as Trustee.
8-K 4.4 1/17/2012
4.4 Fourth Supplemental Indenture, dated as of December 21, 2012 among Advance Auto Parts, Inc., each of the Subsidiary Guarantors from time to time party thereto and Wells Fargo Bank, National Association, as Trustee.
8-K 4.5 12/21/2012
4.5 Fifth Supplemental Indenture, dated as of April 19, 2013 among Advance Auto Parts, Inc., each of the Subsidiary Guarantors from time to time party thereto and Wells Fargo Bank, National Association, as Trustee.
8-K 4.6 4/19/2013
4.6 Sixth Supplemental Indenture, dated as of December 3, 2013, among Advance Auto Parts, Inc., each of the Subsidiary Guarantors from time to time party thereto and Wells Fargo Bank, National Association, as Trustee.
8-K 4.7 12/9/2013
4.7 Form of 4.500% Note due 2022. 8-K 4.5 1/17/20124.8 Form of 4.500% Note due 2023. 8-K 4.7 12/9/20134.9 Seventh Supplemental Indenture, dated as of February 28,
2014, among Advance Auto Parts, Inc., each of the Subsidiary Guarantors from time to time party thereto and Wells Fargo Bank, National Association, as Trustee.
10-Q 4.11 5/28/2014
4.10 Indenture, dated as of April 16, 2020 by and among Advance Auto Parts, Inc., each of the subsidiary guarantors party thereto and Wells Fargo Bank, National Association, as trustee.
8-K 4.1 4/17/2020
4.11 Eighth Supplemental Indenture, dated as of September 29, 2020, among Advance Auto Parts, Inc. each of the Guarantors from time to time party thereto and Wells Fargo Bank, National Association, as Trustee.
8-K 4.6 9/30/2020
10.1 Form of Indemnification Agreement between Advance Auto Parts and each of its Directors.
8-K 10.19 5/20/2004
10.2 Advance Auto Parts, Inc. 2004 Long-Term Incentive Plan (amended as of April 17, 2008).
10-Q 10.19 5/29/2008
63

Incorporated by Reference FiledExhibit No. Exhibit Description Form Exhibit Filing Date Herewith10.3 Advance Auto Parts, Inc. Deferred Stock Unit Plan for
Non-Employee Directors and Selected Executives (as amended January 1, 2008), including First Amendment to the Advance Auto Parts, Inc. Deferred Stock Unit Plan for Non-Employee Directors and Selected Executives (as amended and restated effective as of January 1, 2009) and Second Amendment to the Advance Auto Parts, Inc. Deferred Stock Unit Plan for Non-Employee Directors and Selected Executives (as amended and restated effective as of January 1, 2010).
10-K 10.17 3/1/2011
10.5 Form of Advance Auto Parts, Inc. SAR Award Agreement under 2004 Long-Term Incentive Plan.
10-K 10.33 2/28/2012
10.6 Supplement No. 1 to Guarantee Agreement. 8-K 10.1 12/21/201210.8 Third Amendment to the Advance Auto Parts, Inc.
Deferred Stock Unit Plan for Non-Employee Directors and Selected Executives (Effective as of January 1, 2013).
10-K 10.34 2/25/2013
10.9 Form of Advance Auto Parts, Inc. SARs Award Agreement and Restricted Stock Unit Award Agreement under 2004 Long-Term Incentive Plan.
10-K 10.36 2/25/2013
10.10 Credit Agreement, dated as of December 5, 2013, among Advance Auto Parts, Inc. Advance Stores Company, Incorporated, the lenders party thereto, and JPMorgan Chase Bank, N.A., as Administrative Agent.
8-K 10.1 12/9/2013
10.11 Guarantee Agreement, dated as of December 5, 2013, among Advance Auto Parts, Inc. Advance Stores Company, Incorporated, the other lenders from time to time party lenders party thereto and JPMorgan Chase Bank, N.A., as Administrative Agent for the lenders.
8-K 10.2 12/9/2013
10.12 Supplement No. 1 to Guarantee Agreement. 10-K 10.45 2/25/201410.13 Form of Advance Auto Parts, Inc. SARs Award
Agreement and Restricted Stock Unit Award Agreement.10-K 10.48 2/25/2014
10.15 Fourth Amendment to the Advance Auto Parts, Inc. Deferred Stock Unit Plan for Non-Employee Directors and Selected Executives (As Amended and Restated Effective as of January 1, 2008).
10-K 10.52 3/3/2015
10.17 Fifth Amendment to the Advance Auto Parts, Inc. Deferred Stock Unit Plan for Non-Employee Directors and Selected Executives (As Amended and Restated Effective as of January 1, 2008).
10-K 10.54 3/3/2015
10.18 Agreement, dated as of November 11, 2015, by and among Advance Auto Parts, Inc. and Starboard.
8-K 10.1 11/13/2015
10.19 Employment Agreement effective March 28, 2016 between Advance Auto Parts, Inc. and Thomas Greco. 10-Q 10.1 5/31/2016
10.20 First Amendment to Employment Agreement effective April 2, 2016 between Advance Auto Parts, Inc. and Thomas R. Greco. 10-Q 10.2 5/31/2016
10.22 2016 time-Based SARs Award Agreement (Stock Settled - Inducement Award) between Advance Auto Parts, Inc. and Thomas Greco dated April 14, 2016.
10-Q 10.5 5/31/2016
10.23 Form of Restricted Stock Unit Award Agreement between Advance Auto Parts, Inc. and Thomas Greco.
10-Q 10.7 5/31/2016
10.24 Credit Agreement, dated as January 31, 2017, among Advance Auto Parts, Inc., Advance Stores Company, Incorporated, the lenders party thereto, and Bank of America, N.A., as Administrative Agent.
8-K 10.1 2/6/2017
64
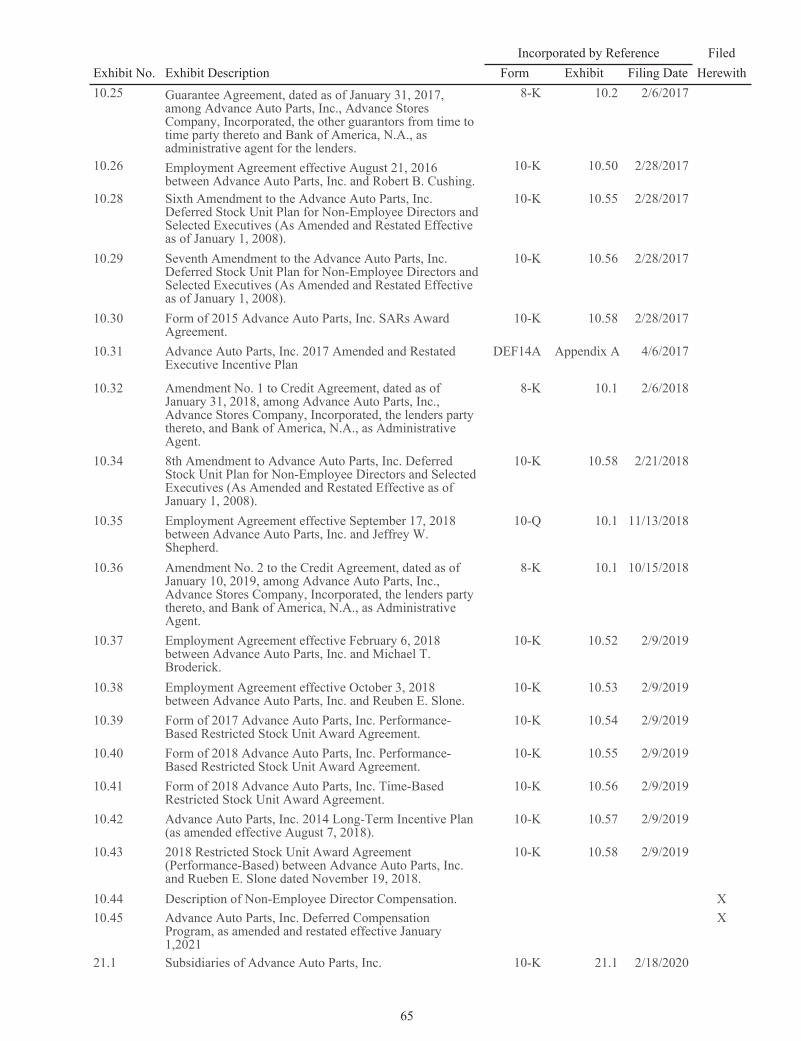
Incorporated by Reference FiledExhibit No. Exhibit Description Form Exhibit Filing Date Herewith10.25 Guarantee Agreement, dated as of January 31, 2017,
among Advance Auto Parts, Inc., Advance Stores Company, Incorporated, the other guarantors from time to time party thereto and Bank of America, N.A., as administrative agent for the lenders.
8-K 10.2 2/6/2017
10.26 Employment Agreement effective August 21, 2016 between Advance Auto Parts, Inc. and Robert B. Cushing.
10-K 10.50 2/28/2017
10.28 Sixth Amendment to the Advance Auto Parts, Inc. Deferred Stock Unit Plan for Non-Employee Directors and Selected Executives (As Amended and Restated Effective as of January 1, 2008).
10-K 10.55 2/28/2017
10.29 Seventh Amendment to the Advance Auto Parts, Inc. Deferred Stock Unit Plan for Non-Employee Directors and Selected Executives (As Amended and Restated Effective as of January 1, 2008).
10-K 10.56 2/28/2017
10.30 Form of 2015 Advance Auto Parts, Inc. SARs Award Agreement.
10-K 10.58 2/28/2017
10.31 Advance Auto Parts, Inc. 2017 Amended and Restated Executive Incentive Plan
DEF14A Appendix A 4/6/2017
10.32 Amendment No. 1 to Credit Agreement, dated as of January 31, 2018, among Advance Auto Parts, Inc., Advance Stores Company, Incorporated, the lenders party thereto, and Bank of America, N.A., as Administrative Agent.
8-K 10.1 2/6/2018
10.34 8th Amendment to Advance Auto Parts, Inc. Deferred Stock Unit Plan for Non-Employee Directors and Selected Executives (As Amended and Restated Effective as of January 1, 2008).
10-K 10.58 2/21/2018
10.35 Employment Agreement effective September 17, 2018 between Advance Auto Parts, Inc. and Jeffrey W. Shepherd.
10-Q 10.1 11/13/2018
10.36 Amendment No. 2 to the Credit Agreement, dated as of January 10, 2019, among Advance Auto Parts, Inc., Advance Stores Company, Incorporated, the lenders party thereto, and Bank of America, N.A., as Administrative Agent.
8-K 10.1 10/15/2018
10.37 Employment Agreement effective February 6, 2018 between Advance Auto Parts, Inc. and Michael T. Broderick.
10-K 10.52 2/9/2019
10.38 Employment Agreement effective October 3, 2018 between Advance Auto Parts, Inc. and Reuben E. Slone.
10-K 10.53 2/9/2019
10.39 Form of 2017 Advance Auto Parts, Inc. Performance-Based Restricted Stock Unit Award Agreement.
10-K 10.54 2/9/2019
10.40 Form of 2018 Advance Auto Parts, Inc. Performance-Based Restricted Stock Unit Award Agreement.
10-K 10.55 2/9/2019
10.41 Form of 2018 Advance Auto Parts, Inc. Time-Based Restricted Stock Unit Award Agreement.
10-K 10.56 2/9/2019
10.42 Advance Auto Parts, Inc. 2014 Long-Term Incentive Plan (as amended effective August 7, 2018).
10-K 10.57 2/9/2019
10.43 2018 Restricted Stock Unit Award Agreement (Performance-Based) between Advance Auto Parts, Inc. and Rueben E. Slone dated November 19, 2018.
10-K 10.58 2/9/2019
10.44 Description of Non-Employee Director Compensation. X10.45 Advance Auto Parts, Inc. Deferred Compensation
Program, as amended and restated effective January 1,2021
X
21.1 Subsidiaries of Advance Auto Parts, Inc. 10-K 21.1 2/18/2020
65
Incorporated by Reference FiledExhibit No. Exhibit Description Form Exhibit Filing Date Herewith22.1 List of Issuers and its Guarantor Subsidiaries 10-Q 22.1 11/10/202023.1 Consent of Deloitte & Touche LLP. X31.1 Certification of Chief Executive Officer Pursuant to
Section 302 of the Sarbanes-Oxley Act of 2002.X
31.2 Certification of Chief Financial Officer Pursuant to Section 302 of the Sarbanes-Oxley Act of 2002.
X
32.1 Certifications of Chief Executive Officer and Chief Financial Officer Pursuant to Section 906 of the Sarbanes-Oxley Act of 2002.
X
101.INS XBRL Instance Document. X101.SCH XBRL Taxonomy Extension Schema Document. X101.CAL XBRL Taxonomy Extension Calculation Linkbase
Document.X
101.DEF XBRL Taxonomy Extension Definition Linkbase Document.
X
101.LAB XBRL Taxonomy Extension Labels Linkbase Document. X101.PRE XBRL Taxonomy Extension Presentation Linkbase
Document. X104.1 Cover Page Interactive Data File (Embedded within the
Inline XBRL document and included in Exhibit. X
66

Item 16. Form 10-K Summary.
None.
67
Signatures
Pursuant to the requirements of Section 13 or 15(d) of the Securities Exchange Act of 1934, the registrant has duly caused this report to be signed on its behalf by the undersigned, thereunto duly authorized.
ADVANCE AUTO PARTS, INC.Dated: February 22, 2021 By: /s/ Jeffrey W. Shepherd
Jeffrey W. ShepherdExecutive Vice President, Chief Financial Officer
Pursuant to the requirements of the Securities Exchange Act of 1934, this report has been signed below by the following persons on behalf of the registrant and in the capacities and on the dates indicated.
Signature Title Date
/s/ Thomas R. Greco President and Chief Executive Officer and Director February 22, 2021Thomas R. Greco (Principal Executive Officer)
/s/ Jeffrey W. Shepherd Executive Vice President, Chief Financial Officer February 22, 2021Jeffrey W. Shepherd (Principal Financial Officer)
/s/ Andrew E. Page Senior Vice President, Controller and Chief Accounting Officer February 22, 2021Andrew E. Page (Principal Accounting Officer)
/s/ Eugene I. Lee, Jr. Chairman and Director February 22, 2021Eugene I. Lee, Jr.
/s/ Carla J. Bailo Director February 22, 2021Carla J. Bailo
/s/ John F. Bergstrom Director February 22, 2021John F. Bergstrom
/s/ Brad W. Buss Director February 22, 2021Brad W. Buss
/s/ John F. Ferraro Director February 22, 2021John F. Ferraro
/s/ Jeffrey J. Jones II Director February 22, 2021Jeffrey J. Jones II
/s/ Sharon L. McCollam Director February 22, 2021Sharon L. McCollam
/s/ Douglas A. Pertz Director February 22, 2021Douglas A. Pertz
/s/ Nigel Travis Director February 22, 2021Nigel Travis
/s/ Arthur L. Valdez Jr. Director February 22, 2021Arthur L. Valdez Jr.
68

(This page intentionally left blank.)

(This page intentionally left blank.)

(This page intentionally left blank.)

Corporate Office:2635 East Millbrook Road, Raleigh, North Carolina 27604877-238-2623
Internet Site:www.AdvanceAutoParts.com
Annual Meeting:May 26, 2021 at 8:30 a.m. Eastern Time www.virtualshareholdermeeting.com/AAP2021There will be no physical location for this year’s meeting.
Registrar and Transfer Agent: ComputershareP.O. Box 505000Louisville, Kentucky 40233-5000 or 462 South 4th Street, Suite 1600 Louisville, Kentucky 40202866-865-6327Foreign Shareholders: 201-680-6578
TDD for Hearing Impaired: 800-490-1493
Internet Site:www.computershare.com/investor
Common Stock:Ticker Symbol: AAPListing: New York Stock Exchange
Independent Registered Public Accounting Firm:Deloitte & Touche LLP650 South Tryon St., Suite 1800Charlotte, North Carolina 28202
SEC FORM 10-K:Shareholders may obtain free of charge a copy of the Advance Auto Parts Annual Report on Form 10-K as filed with the Securities and Exchange Commission (SEC) by writing to the Investor Relations Department, 2635 East Millbrook Road, Raleigh, North Carolina 27604 or by accessing the Company’s website at ir.advanceautoparts.com.
The SEC maintains a website that contains reports, proxy statements and other information regarding issuers that file electronically with the SEC. These materials may be obtained electronically by accessing the SEC’s website at http://www.sec.gov.
S H A R E H O L D E R I N F O R M AT I O N

Committee Membership: 1 – Audit 2 – Compensation 3 – Nominating and Corporate Governance
*As of March 29, 2021
S E N I O R L E A D E R S H I P T E A M *
Thomas R. Greco† President and Chief Executive Officer
Michael C. Creedon, Jr.† Executive Vice President, U.S. Stores
Robert B. Cushing† Executive Vice President, Professional
Tammy M. Finley† Executive Vice President, General Counsel and Corporate Secretary
Jason B. McDonell† Executive Vice President, Merchandising, Marketing
Andrew E. Page† Senior Vice President, Controller and Chief Accounting Officer
Natalie S. Schechtman† Executive Vice President, Human Resources Jeffrey W. Shepherd† Executive Vice President, Chief Financial Officer
Reuben E. Slone† Executive Vice President, Supply Chain
Sri R. Donthi Executive Vice President, Chief Technology Officer
Elisabeth L. Eisleben Senior Vice President, Communications and Investor Relations Dena R. LeMar Vice President, Chief Diversity, Equity and Inclusion Officer Robert V. Speranza Senior Vice President, Strategy and Transformation Herman L. Word, Jr Division President, Carquest North America
†Executive Officers
Eugene I. Lee, Jr. Chair of the Board, Advance Auto Parts, Inc., and President and Chief Executive Officer, Darden Restaurants, Inc. Carla J. Bailo (3) President and Chief Executive Officer, The Center for Automotive Research
John F. Bergstrom (2Δ) Chair and Chief Executive Officer, Bergstrom Corporation
Brad W. Buss (1Δ) Retired Chief Financial Officer, SolarCity Corporation
John F. Ferraro (1,3Δ) Past Global Chief Operating Officer, Ernst & Young
Thomas R. Greco President and Chief Executive Officer, Advance Auto Parts, Inc.
Jeffrey J. Jones II (2,3) President and Chief Executive Officer, H&R Block, Inc.
Sharon L. McCollam (1) Retired Executive Vice President, Chief Administrative and Chief Financial Officer, Best Buy Co., Inc.
Douglas A. Pertz (2) President and Chief Executive Officer, The Brink’s Company Nigel Travis (3) Former Chair of the Board and Retired Chief Executive Officer, Dunkin’ Brands Group, Inc.
Arthur L. Valdez, Jr. (1) Executive Vice President, Chief Supply Chain and Logistics Officer, Target Corporation
B OA R D O F D I R E C TO R S * ΔCommittee Chair
E X E C U T I V E T E A M
and e-commerce

2635 EAST MILLBROOK ROAD | RALEIGH, NORTH CAROLINA 27604 | 877.238.2623 | ADVANCEAUTOPARTS.COM


