2020 Insights Report Based on 2019 Data and Information A Report from the Member Research Subcommittee of the American Academy of Neurology This report is intended for AAN members and staff only, and any requests for dissemination outside of AAN membership should be requested through AAN Member Services ([email protected]).
Transcript
2020 Insights Report Based on 2019 Data and Information A Report from the Member Research Subcommittee of the American Academy of Neurology
This report is intended for AAN members and staff only, and any requests for dissemination outside of AAN membership should be requested through AAN Member Services ([email protected]).
Insights Team Member Research Subcommittee: Benn E. Smith MD, FAAN, Chair Patricia K. Crumrine, MD, FAAN, Vice-Chair Diana Goodman, MD Jessica Jung, MD, PhD Rodney O. Leacock, MD Lucretia Long, CNP Jason J. Sico, MD, FAAN Marsha Smith, MD, FAAN Thomas R. Vidic, MD, FAAN, Immediate Past Chair David Gloss, MD, FAAN (thru April 2019) Richard S. Isaacson, MD, FAAN (thru April 2019)
AAN Member Insights Department: Chris Keran, BA (Liaison to MRS) Carol Rheaume, MSPH Carolyn Cahill, BA Tasha Ostendorf, MS
Organization of Report ................................................................................................................................................... 6
Data Collection ............................................................................................................................................................... 6
Insights and Recommendations Organized by 2019 Board Goals .......................................................................................... 7 Section 1. Information from the AAN Member Profile ......................................................................................................... 10
MEMBER INFORMATION .................................................................................................................................................. 10
Table 1. Number of Members ...................................................................................................................................... 10
Figure 1. Percent of Members with Data for Various Member Profile Fields .............................................................. 10
Table 2. All Members: Member Type ........................................................................................................................... 11
Figure 2. Tenure of Current Members by Member Type (excludes Students, Juniors, and Interns) ........................... 11
Table 3. All Members: Member Type by Gender ......................................................................................................... 12
Table 4. Gender, Age, Race and Hispanic Origin .......................................................................................................... 12
Table 5. Race and Hispanic Origin ................................................................................................................................ 13
Table 6. Age by Gender ................................................................................................................................................ 13
Table 7. All Members: World Regions .......................................................................................................................... 13
Figure 3. Age Distribution by Gender for All Members ................................................................................................ 14
Figure 4. Age Distribution by Gender for US Neurologists ........................................................................................... 14
Figure 5. Map of US Neurologists within the United States......................................................................................... 15
Figure 6. Map of US Neurologists per 100,000 population in the United States ......................................................... 15
Table 8. The 10 States with Highest Numbers of US Neurologists .............................................................................. 16
Table 9. Self-identified Profession for All Members and US Members ........................................................................ 16
Table 10. Practice Setting ............................................................................................................................................. 17
Table 11. Employment Status ...................................................................................................................................... 17
US NEUROLOGIST INFORMATION .................................................................................................................................... 18
Table 12. US Neurologists: Practice Size by Practice Setting ....................................................................................... 18
Table 13. US Neurologists: Practice Size by Employment Status ................................................................................. 18
Table 14. US Neurologists: Mean Percent of Time Spent in Professional Activities .................................................... 18
Table 15. US Neurologists: Mean Percent of Time Spent in Professional Activities by Gender .................................. 19
Table 16. US Neurologists: Time Spent in Professional Activities by Practice Setting ................................................. 19
Table 17. US Neurologists: Time Spent in Professional Activities by Employment Status ........................................... 19
Table 18. US Neurologists: Subspecialty ...................................................................................................................... 20
Table 19. US Neurologists: Age by Practice Setting ..................................................................................................... 21
March 13, 2020 | 4
Table 20. US Neurologists: Gender by Practice Setting ............................................................................................... 21
Table 21. US Neurologists: Age by Primary Subspecialty ............................................................................................. 22
Table 22. US Neurologists: Gender by Primary Subspecialty ....................................................................................... 23
Section 2: Key Findings from AAN Original Research ........................................................................................................... 24 Participation Rates by Project Type .................................................................................................................................. 24
2019 Neurology on the Hill Evaluations ....................................................................................................................... 26
American Brain Foundation .............................................................................................................................................. 26
2019 American Brain Foundation Member Pop-up Survey ......................................................................................... 26
2019 American Brain Foundation Public Survey .......................................................................................................... 26
2018 Analysis of AAMC Data ........................................................................................................................................ 30
Class of 2019 Intensive Leadership Evaluations ........................................................................................................... 32
March 13, 2020 | 5
2019 Live Well, Lead Well Leadership Program Evaluation ......................................................................................... 33
2019 Live Well, Lead Well: Well-being Champion Program Evaluation ....................................................................... 33
2019 Current FAAN Survey ........................................................................................................................................... 34
2019 FAAN-eligible Member Survey ............................................................................................................................ 34
2019 Career Satisfaction Pop-up Survey ...................................................................................................................... 34
Practice ............................................................................................................................................................................. 34
2019 Gender Disparities in Academic Neurology Research ......................................................................................... 35
External Research (outside of AAN Insights Department) .................................................................................................... 36 2019 AAN Neurology Compensation and Productivity Survey .................................................................................... 36
Appendix: In-progress and Upcoming Projects:.................................................................................................................... 37 Surveys ......................................................................................................................................................................... 37
Data Analysis Projects .................................................................................................................................................. 37
March 13, 2020 | 6
Objective The primary goal of the Insights Report is to provide data, insights, and recommendations on our constituents—primarily AAN members—to the Board Planning Committee. Information contained in this report is used to assist the Board of Directors in strategic prioritization.
Organization of Report This report is organized into three sections: The first section contains independent data analysis of the AAN member database, the second section contains primary research conducted by the AAN Member Insights Department and generally sponsored by an AAN committee, and the third section contains research conducted outside of the Member Insights Department or from entities outside the AAN. Adjacent to the research title in Section 2 are participation statistics…
Data Collection Information in the first section was obtained from the AAN Member Profile (demographic data are self-reported) on December 31, 2019, and limited to those records from the AAN’s data warehouse which identify AAN members in good standing at the end of 2019. The 2008 information is either from internal AAN records on October 31, 2008, or the AAN’s Neurologists 2009 Report. Information in the second section was obtained from surveys, evaluations, focus groups, interviews, and data mining conducted by the AAN Member Insight Department in 2019. Information for the third section was obtained from outside of the AAN Member Insights Department.
Definitions 1. Total Members: Members in arrears plus Members in good standing (N > 36,000). No analysis will be conducted
on this category. 2. Member in arrears: Any retainable dues paying member who paid membership dues in 2018 but did not renew
membership for 2019. No analysis will be conducted on this category. 3. Member in good standing: Any member in a dues-paying category whose membership dues were paid for 2019,
or member in a non-dues-paying category who joined or auto-renewed for 2019. Analysis will be conducted on this category and will be referred to as Members or All Members.
4. US Member: Member in good standing who resides in the United States. Analysis will be conducted on this category.
5. US Neurologist: A US Member with a member type of Neurologist. Analysis will be conducted on this category.
Membership Cycle Note In 2018, the AAN made a significant shift in its membership by implementing a new membership cycle for members in the Student, Intern, and Junior category to better align with their membership needs and career stage. For the purposes of the 2020 Insights Report, the data reported for those members on an academic year cycle are exclusive to members in the 2018-2019 academic year cycle (July 1, 2018 through June 30, 2019). Any member who joined between July 2019 through December 2019 who was not a previous member is not included in this report. All other member types are on a calendar year cycle, running January 1 through December 31, 2019.
March 13, 2020 | 7
Insights and Recommendations Organized by 2019 Board Goals Goal 1: Demonstrate and assert the value of neurology to policymakers and other major stakeholders
Insight Recommendation Members other than US neurologists increased in percentage from 45% to 58% from 2008 to 2019. Source: Table 1
The addition of professional members other than US neurologists may help to demonstrate and assert the value of neurology.
Goal 2: Expand the neurology workforce to meet future needs for patient care
Insight Recommendation One factor associated with an increased likelihood of entering neurology was a student's rating of excellent for their basic neuroscience course and neurology clerkship. Source: 2018 Analysis of AAMC Data
Efforts to improve basic neuroscience courses and clerkships at all medical schools may help attract more students to the field of neurology.
Almost all respondents (91%) indicated their institution has a required clinical neurology experience. For those with required experiences, almost three-fourths (72%) are taken prior to the start of the final academic year. Source: 2019 Required Neurology Experience Clerkship Directors Survey
Having the neurology clinical experience prior to the 4th year is important for residency decision-making.
Research Corner at the Annual Meeting was popular among trainees, and, compared to other Areas, Maximizing Your Value/Advocacy to Action had a higher proportion of Advanced Practice Providers. Source: 2019 Annual Meeting Experiential Learning Area Evaluations
Delivering personalized member experiences to trainees and APPs are important targets for expanding the neurology workforce and can enhance member satisfaction.
March 13, 2020 | 8
Goal 3: Ensure the health of the organization by enhancing member satisfaction, well-being, and engagement Insight Recommendation Participants increased their confidence in approaching a trainee about a serious error (55%), approaching a trainee about behavior change or poor professionalism (55%), and talking to a trainee about coping with the loss of a patient (35%). Source: 2019 Live Well Lead Well: Well-being Champion Program Evaluation
Because only 2% of physicians are neurologists, and therefore strong leaders are necessary to advance the field, continue incorporating aspects of this course into other “train the trainer” type events, such as the program directors’ meeting at the Annual Meeting.
85% of members agreed their membership experience was sufficiently personalized (low of 84% to high of 87%). Source: 2019 Board Scorecard Satisfaction Survey
AAN should continue to work on ensuring member satisfaction with successful personalization efforts.
80% of FAAN eligible members were aware of the FAAN status and 78% were not familiar with the eligibility requirements. Source: 2019 FAAN-eligible Member Survey
Increasing awareness of FAAN eligibility requirements may be important for enhancing member engagement and ensuring the health of the organization.
Goal 4: Provide resources to support the financial well-being of the practice of neurology
Insight Recommendation A record number of respondents (n= 3,268) contributed data to the Neurology Compensation and Productivity Survey, further validating that this report has become an essential resource for neurologists, advanced practice providers, and practice administrators in all settings and employment types. Source: 2019 AAN Neurology Compensation and Productivity Survey
Continue to periodically conduct this benchmarking survey.
Goal 5: Expand neuroscience training and research funding
Insight Recommendation 77% of the responding public were not familiar with the American Brain Foundation. Source: 2019 American Brain Foundation Public Survey
Improving public awareness of ABF is important for expanding neuroscience research funding and demonstrating and asserting the value of neurology.
Poster presenters attend the Annual Meeting primarily because they are presenting. Source: 2019 Annual Meeting Evaluations
Continue to offer opportunities to present scientific findings.
March 13, 2020 | 9
Goal 6: Educate and assist members in providing high value clinical care Insight Recommendation 40% of Annual Meeting attendees did not attend any plenary. Source: 2019 Annual Meeting Evaluations
Ask those who do not attend plenaries for their reasoning or if another topic or format would be more helpful.
Attendees across all five groups generally found the all-inclusive registration pricing, shorter courses, and flexibility in planning which sessions to attend to be improvements to the Annual Meeting. Source: 2019 Annual Meeting Changes Focus Groups
Keep the Annual Meeting registration and formatting changes, assuming they financially make sense.
Only 29% of AAN members subscribed to Continuum. Source: 2019 Continuum Subscriber Demographic Analysis
Consider determining how many members “share” a subscription or have access to an institutional subscription in order to estimate percent of members who have access to Continuum.
All groups generally found AAN.com to be difficult to search and navigate despite changes made to the website in late 2018. Source: 2019 AAN.com Focus Groups
Member dissatisfaction with AAN.com navigation and the search function is an important insight to keep in mind to enhance member satisfaction and engagement.
Participants from both patient groups emphasized a need for clear, concise, and easy to read information. Source: 2019 Guideline Patient Focus Groups
Developing easy-to-read patient guidelines is important for educating patients and assisting members in providing high value clinical care.
Goal 7: Strengthen advocacy on behalf of members and their patients
Insight Recommendation Member satisfaction with federal advocacy efforts increased 9 percentage points from 2018 (65%) to 2019 (74%). 2019 Board Scorecard Satisfaction Survey
Continue efforts to improve federal advocacy.
NOH attendees found the speakers to be engaging and found value in Capitol Hill visits, but also indicated a need for more direct asks, specific bill numbers, and concrete requests to communicate to the congressional staff/Congress members. Source: 2019 Neurology on the Hill Evaluations
Continue to improve NOH by considering this attendee feedback.
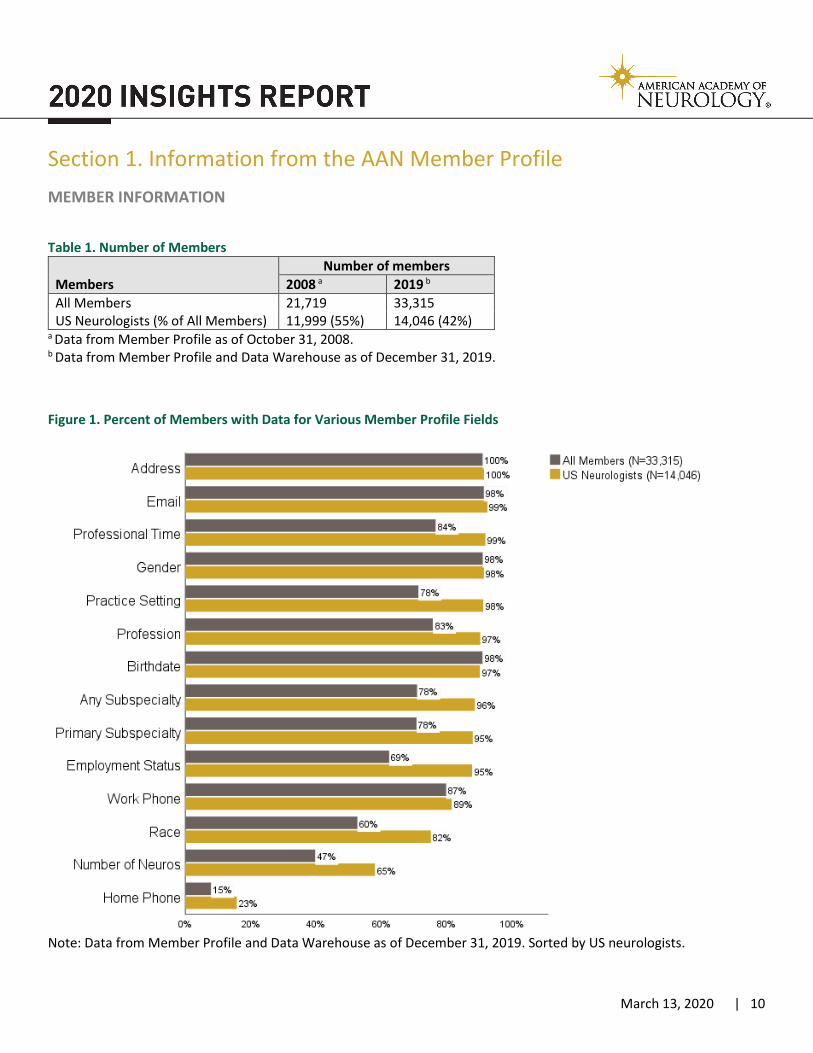
March 13, 2020 | 10
Section 1. Information from the AAN Member Profile MEMBER INFORMATION
Table 1. Number of Members
Members Number of members
2008 a 2019 b All Members 21,719 33,315 US Neurologists (% of All Members) 11,999 (55%) 14,046 (42%)
a Data from Member Profile as of October 31, 2008. b Data from Member Profile and Data Warehouse as of December 31, 2019.
Figure 1. Percent of Members with Data for Various Member Profile Fields
Note: Data from Member Profile and Data Warehouse as of December 31, 2019. Sorted by US neurologists.
March 13, 2020 | 11
Table 2. All Members: Member Type
Member Type (sorted by 2019) 2008 a 2019 b
Count Percent Count Percent Neurologist 14,908 69% 17,854 54% Student 1,071 6% 4,955 15% Junior 3,505 16% 4,948 15% Senior 1,249 6% 2,277 7% Advanced Practice Provider 345 2% 1,409 4% Researcher 364 2% 821 2% Intern c NA NA 440 1% Business Administrator 211 1% 314 1% Physician Affiliate c NA NA 254 1% Honorary 66 <1% 43 <1% Total 21,719 100% 33,315 100%
a Data from Member Profile as of October 31, 2008. b Data from Member Profile and Data Warehouse as of December 31, 2019. c This Member Type did not exist in 2008.
Figure 2. Tenure of Current Members by Member Type (excludes Students, Juniors, and Interns)
a Data from Member Profile and Data Warehouse as of December 31, 2019.
Table 4. Gender, Age, Race and Hispanic Origin
Demographics
All Members US Neurologists 2008 a
(N=21,719) 2019 b
(N=33,315) 2008 a
(N=11,999) 2019 b
(N=14,046) Female 29.0% 39.8% 24.7% 34.7% Age: mean (median) 49.2 (49) 46.7 (43) 51.3 (51) 52.4 (52) White 78.2% 66.7% 80.3% 68.1% Asian 19.1% 22.7% 17.0% 22.5% Hispanic or Latino 7.0% 8.3% 4.9% 7.2% Other Race NA 5.4% NA 5.0% Black or African American 1.8% 2.9% 1.7% 2.8% American Indian or Alaska Native 0.6% 0.5% 0.6% 0.5% Native Hawaiian or Other Pacific Islander 0.3% 0.4% 0.4% 0.4%
a Gender and age from internal AAN records as of October 31, 2008, and race is from the Neurologists 2009 Report. Missing data for All Members: gender (890 out of 12,308), age (2,410/12,308), and race (unknown) and for US Neurologists: gender (208/7,464), age (2,410/12,308), and race (unknown). b Data from Member Profile and Data Warehouse as of December 31, 2019. Missing data for All Members: gender (673), age (694), and race (12,595) and for US Neurologists: gender (232), age (404), and race (2,047). Note: Race sums to more than 100% because members can select multiple categories.
March 13, 2020 | 13
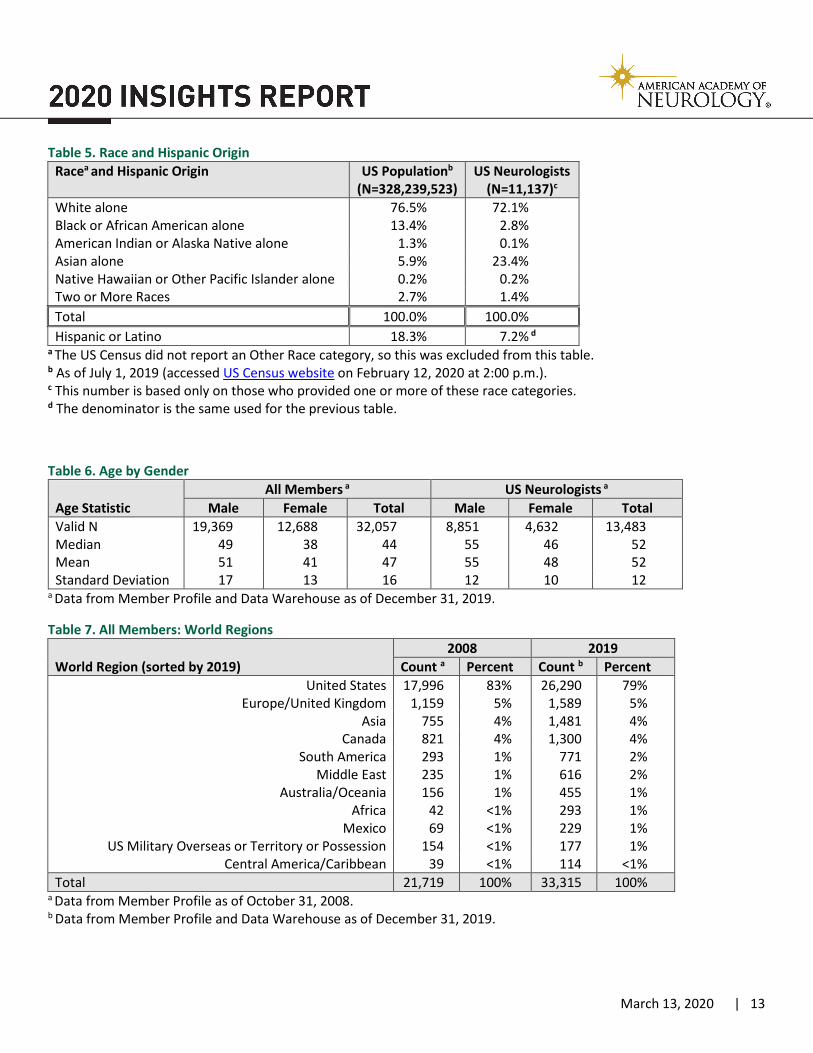
Table 5. Race and Hispanic Origin Racea and Hispanic Origin US Populationb
(N=328,239,523) US Neurologists
(N=11,137)c White alone 76.5% 72.1% Black or African American alone 13.4% 2.8% American Indian or Alaska Native alone 1.3% 0.1% Asian alone 5.9% 23.4% Native Hawaiian or Other Pacific Islander alone 0.2% 0.2% Two or More Races 2.7% 1.4% Total 100.0% 100.0% Hispanic or Latino 18.3% 7.2% d
a The US Census did not report an Other Race category, so this was excluded from this table. b As of July 1, 2019 (accessed US Census website on February 12, 2020 at 2:00 p.m.). c This number is based only on those who provided one or more of these race categories. d The denominator is the same used for the previous table.
Table 6. Age by Gender
Age Statistic All Members a US Neurologists a
Male Female Total Male Female Total Valid N 19,369 12,688 32,057 8,851 4,632 13,483 Median 49 38 44 55 46 52 Mean 51 41 47 55 48 52 Standard Deviation 17 13 16 12 10 12
a Data from Member Profile and Data Warehouse as of December 31, 2019.
Table 7. All Members: World Regions
World Region (sorted by 2019) 2008 2019
Count a Percent Count b Percent United States 17,996 83% 26,290 79%
US Military Overseas or Territory or Possession 154 <1% 177 1% Central America/Caribbean 39 <1% 114 <1%
Total 21,719 100% 33,315 100% a Data from Member Profile as of October 31, 2008. b Data from Member Profile and Data Warehouse as of December 31, 2019.
Figure 3. Age Distribution by Gender for All Members
Figure 4. Age Distribution by Gender for US Neurologists
March 13, 2020 | 15
Figure 5. Map of US Neurologists within the United States
Note: Data from Member Profile and Data Warehouse as of December 31, 2019. The United States includes the 50 US states plus Washington, DC. Not shown: CT=216, DC=88, DE=47, HI=55, MA=645, MD=417, NH=74, NJ=425, RI=61, and VT=38.
Figure 6. Map of US Neurologists per 100,000 population in the United States The average across the US is 4.6 neurologists per 100k population.
Note: 2019 state population data from http://worldpopulationreview.com/states/ and accessed January 10, 2020. Not shown: CT=6.1, DC=12.2, DE=4.8, HI=3.9, MA=9.2, MD=6.9, NH=5.4, NJ=4.8, RI=5.8, and VT=6.1.
Table 8. The 10 States with Highest Numbers of US Neurologists
State US Neurologists
Count a Percent California 1,528 11% New York 1,229 9% Texas 898 6% Florida 863 6% Pennsylvania 708 5% Massachusetts 645 5% Ohio 559 4% Illinois 536 4% Michigan 433 3% New Jersey 425 3% All other 6,222 44% Total 14,046 100%
a Data from Member Profile and Data Warehouse as of December 31, 2019.
Table 9. Self-identified Profession for All Members and US Members Profession
All Members US Members Count a Percent Count a Percent
a Data from Member Profile and Data Warehouse as of December 31, 2019.
March 13, 2020 | 17
Table 10. Practice Setting
Practice Setting
2008 All Members a
2019 All Members b
2008 US Neurologists a
2019 US Neurologists b
Count % Count % Count % Count % Solo Practice 2,123 18% 2,888 11% 1,680 23% 1,685 12% Neurology Group 2,396 20% 4,819 18% 1,936 27% 3,162 23% Multispecialty Group 951 8% 2,276 9% 810 11% 1,766 13% Academic based 2,799 24% 8,692 33% 1,669 23% 4,300 31% Government based 768 6% 911 3% 324 4% 454 3% Hospital based c NA NA 4,756 18% NA NA 1,600 12% Industry (Pharma or Device
Company) c NA NA 129 <1% NA NA 56 <1%
Other Public or Private Hospital or Clinic
846 7% 1,613 6% 449 6% 765 6%
Total 11,758 100% 26,084 100% 6,868 100% 13,788 100% a Respondents to 2008 Member Census. b Data from Member Profile and Data Warehouse as of December 31, 2019. c This practice setting was not captured in 2008.
Table 11. Employment Status
Employment Status
2019 All Members a
2019 US Neurologists a
Count % Count % Employed - Hospital 11,422 49% 5,887 44% Employed - Practice 5,167 22% 3,860 29% Owner or Partner 3,043 13% 2,185 16% Other 3,465 15% 1,375 10% Total 23,097 100% 13,307 100%
a Data from Member Profile and Data Warehouse as of December 31, 2019.
March 13, 2020 | 18
US NEUROLOGIST INFORMATION Data from Member Profile and Data Warehouse as of December 31, 2019.
Table 12. US Neurologists: Practice Size by Practice Setting
Practice Setting
Number of neurologists in your practice setting
Count Mean Std Dev Median Neurology group 2,137 7 10 4 Multispecialty group 1,183 9 18 3 Academic based 2,980 16 24 6 Government based 293 6 12 3 Hospital based 1,059 7 13 1 Industry (Pharma or Device Company) 37 9 15 1 Other Public or Private Hospital or Clinic 443 6 13 1 Total 8,132 11 19 3 Totals from 2008 4,950 14 6 Totals from 2004 4,428 12 6 Totals from 2000 4,010 11 5 Totals from 1998 3,799 10 5 Totals from 1996-1997 7,898 9 4
NOTE: Prior year totals from Neurologists 2009 Report.
Table 13. US Neurologists: Practice Size by Employment Status
Employment Status
Number of neurologists in your employment status
Count Mean Std Dev Median Employed - Hospital 4,053 12 20 3 Employed - Practice 2,491 9 17 3 Owner or Partner 1,368 4 7 1 Other 892 11 19 2
Total 8,804 10 18 3
Table 14. US Neurologists: Mean Percent of Time Spent in Professional Activities
Professional Activities Mean (N=13,876)
Median (N=13,876)
Clinical Practice 73% 80% Research 11% <1% Teaching 7% 5% Administration 7% <1% Other 3% <1%
NOTE: The means may not sum to 100% due to rounding.
March 13, 2020 | 19
Table 15. US Neurologists: Mean Percent of Time Spent in Professional Activities by Gender
Professional Activities Male (N=8,894)
Female (N=4,752)
Clinical Practice 73% 73% Research 11% 10% Teaching 6% 7% Administration 7% 6% Other 2% 3%
NOTE: The means may not sum to 100% due to rounding.
Table 16. US Neurologists: Time Spent in Professional Activities by Practice Setting
Practice Setting Count
Mean percent of time in professional activities Clinical Practice
Research Teaching Admin Other
Solo practice 1,682 83% 3% 3% 5% 5% Neurology group 3,156 86% 4% 4% 5% 2% Multispecialty group 1,766 85% 4% 4% 6% 2% Academic based 4,298 57% 22% 11% 8% 2% Government based 453 59% 11% 9% 16% 5% Hospital based 1,600 80% 6% 6% 7% 1% Industry (Pharma or Device Company) 56 3% 51% 2% 10% 34% Other Public or Private Hospital or Clinic 763 70% 13% 4% 7% 6% Total 13,774 74% 11% 7% 7% 3% Totals from 2008 6,843 77% 9% 6% 7% 1% Totals from 2004 6,268 77% 10% 6% 6% 1% Totals from 2000 5,833 76% 9% 7% 6% 1% Totals from 1998 6,904 76% 9% 7% 7% 2% Totals from 1996-1997 7,898 74% 10% 8% 6% 2%
NOTE: Prior year totals from Neurologists 2009 Report. NOTE: The means across professional activities may not sum to 100% due to rounding.
Table 17. US Neurologists: Time Spent in Professional Activities by Employment Status
Employment Status Count
Mean percent of time in professional activities Clinical Practice
a Due to most respondents choosing more than one subspecialty, the counts sum to 32,565 responses and the percent sums to more than 100 percent. b Beginning October 2019, the AAN removed Child Neurology from the list of subspecialties and started collecting it as a specialty.
Due to this change, we are no longer able to report data in this format. Child specialty data will be reported starting with the 2021 Insights Report.
March 13, 2020 | 21
Table 19. US Neurologists: Age by Practice Setting
Practice Setting (sorted by median) Age
Count Median Mean Std Dev Solo practice 1,653 61 60 10 Industry (Pharma or Device Company) 55 55 55 11 Government based 439 55 55 11 Neurology group 3,077 54 54 11 Multispecialty group 1,715 52 53 11 Other Public or Private Hospital or Clinic 733 49 51 12 Academic based 4,185 46 49 12 Hospital based 1,550 45 48 12 Total 13,407 52 52 12
Table 20. US Neurologists: Gender by Practice Setting
Practice Setting Male Female
Count Percent Count Percent Solo practice 1,267 14% 395 8% Neurology group 2,141 24% 968 21% Multispecialty group 1,189 13% 551 12% Academic based 2,540 29% 1,687 36% Government based 261 3% 187 4% Hospital based 987 11% 576 12% Industry (Pharma or Device Company) 40 <1% 16 <1% Other Public or Private Hospital or Clinic 420 5% 333 7% Total 8,845 100% 4,713 100%
March 13, 2020 | 22
Table 21. US Neurologists: Age by Primary Subspecialty
Section 2: Key Findings from AAN Original Research
Participation Rates by Project Type
Table 23: Survey Projects Project Title Received/Sent Response Rate
2019 World Federation of Neurology Continuum Coordinators Survey
39/53 74%
2019 AUPN Department Chairs Survey 95/157 61% 2019 Current FAAN Survey 391/1,000 39% 2019 FAAN Eligible Member Survey 382/1,000 38% 2019 Required Neurology Experience Clerkship Directors Survey 48/138 35% 2019 Corticosteroid Survey 194/989 20% 2019 American Brain Foundation Public Survey 511 (500 Quota) ---
Mean (median) response rate: 45% (39%)
Table 24: Website Pop-up Survey Projects Project Title Received/Sent Response Rate 2019 Career Satisfaction Pop-up Survey 370/1,847 20% 2019 American Brain Foundation Member Pop-up Survey 448/2,327 19% 2019 Board Scorecard Satisfaction Survey 1,602/8,136 19%
February 400/1,874 21% May 402/2,022 20% August 400/2,278 18% November 400/1,962 20%
Mean (median) response rate: 20% (20%)
Table 25: Focus Group/Interview Projects Project Title Attended/
Confirmed Attendance
Rate 2019 Annual Meeting Changes Focus Groups 35/40 88% 2019 Gender Disparities in Academic Neurology Research Focus
Groups 45/59 76%
2019 AAN Conference App and AAN.com Focus Groups 25/40 62% 2019 Guideline Patient Focus Groups 12/20 60%
Mean (median) attendance rate: 72% (69%)
March 13, 2020 | 25
Table 26: Evaluation Projects Project Title Received/Sent Response Rate Class of 2019 Intensive Leadership Pre-program Evaluation 58/58 100% -Diversity Leadership Program 10/10 100% -Transforming Leaders Program 10/10 100% -Women Leading in Neurology 12/12 100% -Emerging Leaders Program 16/16 100% -Practicing Leadership Program 10/10 100% Class of 2019 Intensive Leadership Post-program Evaluation 58/58 100% -Diversity Leadership Program 10/10 100% -Transforming Leaders Program 10/10 100% -Women Leading in Neurology 12/12 100% -Emerging Leaders Program 16/16 100% -Practicing Leadership Program 10/10 100% Class of 2019 Live Well, Lead Well Program Evaluation 13/13 100% Class of 2019 Live Well, Lead Well: Well-being Champion Program
Evaluation 20/20 100%
2019 Neurology on the Hill Evaluations 173/220 79% 2019 Fall Conference Session Evaluations 561/762 74% 2019 APP Pre-Fall Conference Evaluation 130/176 74% 2019 Residency In-Service Training Examination Evaluation:
2019 Annual Meeting Overall Evaluation 2,204/11,586 17% 2019 Annual Meeting Experiential Learning Area Evaluations 3,397/Unknown NA Mean (median) response rate: 75% (100%)
March 13, 2020 | 26
Advocacy
2019 Neurology on the Hill Evaluations 79% (173/220) Evaluate the event that took place in Washington, DC on Monday, February 25 and Tuesday, February 26, 2019. Data will be used by the AAN Advocacy and Marketing teams to plan and develop marketing strategies for future NOH events.
1. 37% of respondents were first-time attendees. 2. 72% of first-time attendees and 61% of veteran attendees indicated that NOH exceeded their expectations. 3. Attendees found the speakers to be engaging, found value in Capitol Hill visits, but also indicated a need for
more direct asks, specific bill numbers, and concrete requests to communicate to the congressional staff/Congress members.
Feedback: Information will be used to continue to improve the Neurology on the Hill program.
American Brain Foundation
2019 American Brain Foundation Member Pop-up Survey 19% (448/2,327) Obtain member feedback to inform the strategic planning of the American Brain Foundation (ABF) and continue trending awareness of the current ABF name as well as the past name American Academy of Neurology Foundation.
1. 75% were aware of the American Brain Foundation and 25% were aware of the American Academy of Neurology Foundation prior to the survey.
2. Most likely to have first heard of the ABF via a booth or sign at the AAN Annual Meeting (30%), while joining or renewing membership at the AAN (26%), and email (12%).
3. Increase in association with “a cure for one is a cure for many” from 3% in 2017-18 to 13% in 2019. Feedback: Feedback used by the ABF to trend AAN member awareness, and impressions, of the ABF.
2019 American Brain Foundation Public Survey 511 (500 Quota) Obtain public feedback to inform the strategic planning of the American Brain Foundation (ABF) and to continue benchmarking for future trending.
1. 29% of respondents indicated that they knew someone affected by brain disease. After being presented with a list of brain diseases, 71% of respondents indicated that they knew someone affected by brain disease.
2. 23% of respondents selected the correct statistic of 1 in 6 Americans being affected by brain disease. 3. 77% of respondents were not familiar with the American Brain Foundation.
Feedback: Continue to trend public awareness of the ABF and of brain disease.
March 13, 2020 | 27
Conferences
2019 Annual Meeting Evaluations (response rates are for unique responses) Overall Evaluation 17% (2,204/11,586) Education Courses and Science Session Evaluation 52% (3,562/7,761) Understand who attends, why they attend, what are they doing at the Annual Meeting, and did it meet their needs. WHO is attending?
1. Biggest demographic change: more US/Canada and less international attendees 2. For 40% of attendees, this is their first meeting in more than 5 years 3. South US region under-represented 4 of the last 5 years
WHY are they attending?
4. Biggest reason is for education and CME 5. Then get updates on therapies and research 6. Poster presenters attend primarily because they are presenting
WHAT are they doing during the meeting?
7. Most attended topic is General neurology, but MS is most popular when you factor in the number of offerings 8. 40% did not attend any plenary
WERE their needs met?
9. Overall ratings were very high and program objectives were met 10. For the few who had criticism
a. Some felt should return to a tighter acceptance rate for abstracts b. Some felt the convention center difficult to navigate
2019 Annual Meeting Poster Evaluation 25% (554/2,245) Evaluate the poster presenters’ experience at the 2019 AAN Annual Meeting.
1. 92% indicated that presenting a poster impacted presenter’s decision to attend the Annual Meeting (65% a lot, 27% a little).
2. Satisfaction with the poster presentation experience varied by poster type with 87% satisfied with traditional poster, 81% with neuroimaging poster, and 50% of e-poster.
3. Respondents appreciated the opportunity to present their posters to the broad and varied Annual Meeting attendees. However, they complained that low traffic and poster hall navigation challenges limited discussions with attendees during standby time. E-poster presenters said attendees could easily change their presentation to a different presentation, so they had to constantly check to ensure their presentation was in place. Interestingly, many recommended moving to an all e-poster format.
Feedback: Data will be used by the Science Committee and conference staff to plan future poster sessions.
2019 Annual Meeting Experiential Learning Area Evaluations 3,397/Unknown Gain feedback on the non-CME Experiential Learning Areas (ELAs), quality of presentations, and assess usefulness of each Area.
March 13, 2020 | 28
1. Most attendees filling out ELA evaluations identified as neurologists (68%). Research Corner was popular among trainees, and, compared to other Areas, Maximizing Your Value/Advocacy to Action had a higher proportion of Advanced Practice Providers.
2. Across all Areas, when asked about the presentations they were evaluating, attendees agreed that the speakers were engaging (90%), the talk met their expectations (90%), and the talk should be repeated in the future (93%).
3. When asked about the Areas, attendees agreed that the purpose of the Area was clear (91%), the Area was visually appealing (91%), and the information in the Area was useful (94%).
Feedback: Staff and workgroup members used the feedback to determine who will be asked to speak at the 2020 Annual Meeting ELAs.
2019 Annual Meeting Exhibitor Evaluation 25% (74/300) Gain feedback on the overall exhibitor experience, quality of pre-meeting information, and satisfaction with meeting services/logistics/execution.
1. Almost all respondents (95%) were either very or somewhat satisfied with pre-exhibit information and support. 2. Over three-fourths of respondents (78%) were very or somewhat satisfied with their exhibit experience. Roughly
one quarter of respondents (24%) were very satisfied with traffic to their booth, and only 16% were very satisfied with traffic in the exhibit hall.
3. Almost half of respondents (47%) plan to exhibit at the 2020 Annual Meeting in Toronto, Ontario, and the other half (48%) are undecided. Customs requirements seems to be the biggest barrier to exhibiting in Canada.
Feedback: The Industry Sales Team are using the survey results to improve exhibitor experiences at future Annual Meetings.
2019 AAN Conference App and AAN.com Focus Groups Focus groups (4 groups) 63% (25/40)
Medical Students 6/10 Juniors 7/10 Academic Neurologists 8/10 Non-Academic Neurologists 4/10
Learn more about 1) how different types of members use the AAN Conferences Mobile app, 2) what features they find useful/not useful, 3) how they interact with the app, and 4) how the app could be improved. Other goals were to learn more about 1) how members interact with AAN.com, 2) their reasons for visiting, 3) the types of tasks they complete on the website, and 4) feedback they have on improving the website.
1. Participants across all groups were familiar with the AAN Conferences app and AAN.com and were generally comfortable using apps and websites.
2. Preference and use of the app varied more on an individual basis, and personal comfort level, than on age or career stage basis.
3. Use of AAN.com also varied widely, with most participants visiting the site for journal access, CME, and other task-related actions while younger members found the site very useful for planning their careers during medical school and for residency information. All groups generally found AAN.com to be difficult to search and navigate.
Feedback: Findings will be used to improve AAN.com, as well as the AAN Conferences Mobile app for the 2020 Toronto Annual Meeting.
March 13, 2020 | 29
2019 Annual Meeting Changes Focus Groups Focus groups (5 groups) (88%) 35/40
Medical Students 7/8 Juniors 7/8 Academic Neurologists 7/8 Practicing Neurologists 7/8 International members 7/8
Learn more about 1) what factors impact members’ decisions to attend the AAN Annual Meeting, 2) what content/programming they attend, and 3) how information presented in Annual Meeting programming impacts their research or practice.
1. Attendees across all five groups generally found the all-inclusive registration pricing, shorter courses, and flexibility in planning sessions to attend to be improvements to the Annual Meeting.
2. Although many found the inclusion of food in registration to be important, participants also felt that the general quality of food has declined compared to past Annual Meetings and suggested the Annual Meeting change to simpler food items.
3. Continuing to have a variety of Annual Meeting resources, such as paper mailings, the AAN Conferences app, and emailed materials may help individuals customize their own grouping of resources that fits their needs.
Feedback: Findings will be used to inform improvements to future AAN Annual Meetings.
2019 Sports Concussion Conference Evaluation Overall Evaluation 34% (133/391) Education Courses and Science Session Evaluation 55% (216/391) Gather attendee feedback to continue to improve the conference.
1. Upon completion of the program, almost all (92%) said they would be able to accurately and appropriately diagnose concussion, as well as educate others on key issues rated to concussion (91%).
2. Education appears to be the most important factor on their decision to attend the Sports Concussion Conference since almost all (98%) rated it either important or very important, and almost all (92%) agreed their education needs were met.
3. Less than two-thirds (62%) plan to attend the Sports Concussion Conferences next year, citing the decision to attend every 2-3 years, location, cost, and a desire for other clinical topics as the primary reasons.
2019 Fall Conference Evaluation Overall Evaluation 33% (260/787) Education Courses and Science Session Evaluation 74% (561/762) Gather attendee feedback to continue to improve the conference.
1) Education appears to be the most important factor driving attendance since almost all (97%) rated it either important or very important, and most (92%) agreed their education needs were met.
2) Based on their 2019 experience, most (83%) plan to attend the Fall Conference again next year. 3) Reasons for not attending next year included attendance at other meetings (including the AAN’s Annual
Meeting), preferring the APP pre-conference to the regular conference, high costs, and getting time off.
March 13, 2020 | 30
2019 APP Pre-Fall Conference Evaluation Pre-Conference Evaluation 74% (130/176) Evaluate the first iteration of the APP Pre-Conference and find ways to improve upon the format.
1) About two-thirds (67%) rated the pre-conference as excellent and most (60%) said the program matched the pre-meeting description extremely well.
2) Almost all (94%) said that information from this program will to some degree change their practice and/or provide better patient care and almost all (98%) would recommend the conference to others.
3) When asked if they would prefer a stand-alone conference in 2020, about half of attendees (54%) said they would, almost a quarter (22%) said it depends on content, 13% would keep the status quo, and 11% had no preference.
Education
2018 Analysis of AAMC Data Publication: Gutmann L, Cahill C, Jordan JT, Gamaldo CE, Santini V, Ali I, Soni M, Wilson RB, Said R, Czeisler BM, Smith AG. Characteristics of Graduating US Allopathic Medical Students Pursuing a Career in Neurology. Neurology 2019 Apr 23; 92 (17): e2051-e2063. Attract more medical students to neurology by identifying factors associated with medical students becoming neurologists.
1. De-identified data from the Association of American Medical Colleges (AAMC) Matriculating Student Questionnaire (MSQ) and Graduation Questionnaire (GQ) were obtained for the graduation years 2013/2014 through 2016/2017. Logistic regression was used to assess demographic characteristics and responses to training and career-related questions in association with specialty choice (intent to enter neurology).
2. Of the 51,816 students with complete data, 1,456 (2.8%) indicated an intent to enter a neurology residency. Factors associated with an increased likelihood of entering neurology were a student's rating of excellent for their basic neuroscience course and neurology clerkship, participation in an MD/PhD program, majoring in neuroscience or psychology as an undergraduate, a selection response of "content of the specialty was a strong influence on career choice," and indicating interest in neurology on the MSQ. Factors associated with a decreased likelihood of entering neurology were a higher-priority response on the GQ for salary, work/life balance, and personal fit of the specialty.
3. Data from surveys at the entry into and graduation from medical school suggest several approaches to increase the number of medical students entering neurology, including a focus on the student-reported quality of the basic neuroscience course and neurology clerkships, targeted engagement with MD/PhD students, and mentoring programs for students interested in neurology. Efforts to improve salaries for neurologists, to reduce medical school debt, and to improve work/life balance may also help to attract more students.
2019 Required Neurology Experience Clerkship Directors Survey 35% (48/138) The goal of the 2019 Required Neurology Experience Clerkship Director Survey was to identify best practices for undergraduate clinical neurology experiences by surveying clerkship directors.
1. Almost all respondents (91%) indicated their institution has a required clinical neurology experience. For those with required experiences, almost three-fourths (72%) are taken prior to the start of the final academic year, and almost a quarter (23%) have the option to take it before the penultimate year.
2. The most common theme regarding successful components of a neurology clerkship was high-quality resident and faculty teaching.
March 13, 2020 | 31
3. The most common theme among the least successful components of a neurology clerkship was shadowing/observing during outpatient experiences (rather than seeing patients independently).
Feedback: The Required Neurology Experience Workgroup will use these results to advocate for making neurology a required clerkship at US medical schools.
2019 Residency In-Service Training Examination (RITE) Evaluations Examinee 20% (621/3,073) Proctor 63% (139/220) Goal: In February 2019, the RITE (Residency In-Service Training Examination) was administered for the first time as a computerized test. The goal of these evaluations was to understand what worked and did not work about the new online administration process.
1. Overall, most examinees (87%) and most proctors (80%) were satisfied with their 2019 RITE exam experiences. 2. Examinees recommended the following changes to the format of the RITE: shorten the exam, explore flexible
exam dates, and change question format. 3. About half of the proctors rated the following tasks as somewhat or very difficult: working with system
administrator to download SecureClient (53%), testing SecureClient compatibility (50%), reserving a room (49%), and securing hardware for the exam (40%).
Feedback: Results will be used by AAN staff and the Residency Examination Advisory Panel to modify the exam processes for future RITE administrations.
Executive Administration
2019 Board Scorecard Satisfaction Survey Total across all 4 iterations 19% (1,602/8,136) February 21% (400/1,874) May 20% (402/2,022) August 18% (400/2,278) November 20% (400/1,962) The goal of the 2019 Board Scorecard Satisfaction Survey was to measure member satisfaction on a quarterly basis, and the results are included as metrics on the Board Scorecard.
1. Member satisfaction averaged 90% (low of 88% to high of 93%). 2. Federal advocacy satisfaction averaged 74% (low of 74% to high of 75%) for US members (65% in 2018). 3. Those who felt their membership experience was sufficiently personalized averaged 85% (low of 84% to high of
87%). 4. The Net Promotor Score averaged +57 (low of +50 to high of +62) on a scale of -100 to +100.
2019 AUPN Department Chairs Survey 61% (95/157) NOTE: RESULTS ARE EMBARGOED UNTIL PUBLISHED Collect information from academic neurology department chairs about 1) overall departmental financial health, 2) effects of finances on clinical responsibilities, research, teaching and faculty development, 3) department structure and diversity, and 4) to conduct a longitudinal comparison to data collected in the 2002 survey.
March 13, 2020 | 32
Guidelines
2019 Guideline Patient Focus Groups Focus Groups (2) 60% (12/20)
Group 1 (10:30 a.m. at 2019 Brain Health Fair) 5/10 Group 2 (2:00 p.m. at 2019 Brain Health Fair) 7/10
Learn more about how patients, caregivers, and their families interact with patient guideline resources created by the AAN, and any improvements that can be made to the design and content of the guideline patient summaries.
1. Participants from both groups emphasized a need for clear, concise, and easy-to-read information. 2. Although both groups highlighted favorable design elements, some felt the designed example was distracting
and busy, especially for those with neurologic conditions. 3. Both groups praised the materials and strongly preferred receiving physical materials instead of searching for
information online. Feedback: Findings will be used to inform content and design elements of future AAN patient guideline resources.
Leadership Programs
Class of 2019 Intensive Leadership Evaluations 100% (58/58) Pre (week prior) Post (week after) Diversity in Leadership Program 100% (10/10) 100% (10/10) Emerging Leaders Program 100% (16/16) 100% (16/16) Practicing Leaders Program 100% (10/10) 100% (10/10) Transforming Leaders Program 100% (10/10) 100% (10/10) Women Leading in Neurology 100% (12/12) 100% (12/12) Evaluate the AAN’s Class of 2019 Intensive Leadership Programs. Data will be used by the Leadership Development Committee to plan and develop future Leadership Programs. Post Program Feedback
1. Participants felt their leadership program taught them how to lead others (95%), their organization/profession (95%), and themselves (93%). It also prepared them for leadership positions inside (97%) and outside (97%) of the AAN. They felt that the program influenced their professional life (97%), leadership skills, (95%), confidence in their leadership abilities (93%), and personal life (80%)
2. The words most frequently used to describe their leadership program were transforming, inspiring, engaging, empowering and collaborative. The top program take-aways most commonly cited were learning the value of change; developing a clear vision; that self-reflection is essential to successful leadership; that leadership is a continuous, life-long journey; and, the power and importance of an expanded network of peers.
3. The most common ways participants indicated the AAN could assist them in furthering their leadership potential was through helping them become engaged with the AAN, communicating upcoming leadership opportunities, expanding the leadership programs, and creating and supporting alumni groups.
Pre- to Post-Program Changes
4. Activities: Participants gained confidence pre to post (p<0.05) in each of the eight leadership activities. From largest to smallest change, the activities were proposing a leadership goal, planning a leadership goal, developing
March 13, 2020 | 33
strategies for leading, executing a leadership goal, achieving a personal leadership goal, setting a personal leadership goal, presenting results of a leadership goal, and developing leadership skills.
5. Well-being: While participants showed improvement across all burnout and well-being questions, only the overall quality of life was significant.
6. Leadership: Significant differences were seen from pre to post in participants understanding the AAN’s committee structure and function, having a strong network of colleagues, understanding the AAN’s vision and mission, and feeling like their contributions are personally meaningful.
7. Engagement: Becoming more aware of opportunities to be involved in the AAN as well as improving their current and desired levels of engagement were found to be significant changes from pre- to post-evaluation.
2019 Live Well, Lead Well Leadership Program Evaluation 100% (13/13) Evaluate the AAN’s Class of 2019 Live Well, Lead Well Leadership Programs, reframed this year from an Intensive Leadership Program to an Immersive Leadership Program (1 day at the Annual Meeting).
1. Participants rated the overall program (100%), their interaction with facilitators and facilitator knowledge (100%), their interaction with staff (85%), the quality (100%) and effectiveness (92%) of the program materials as excellent.
2. Participants increased their confidence in five key activities: communicating an elevator pitch for well-being (69%), advancing their ideas (69%), presenting a well-being project (69%), understanding project barriers (69%), and implementing individual well-being practices (54%).
3. Participants felt that the program reinforced the importance of physician wellness and the need to target wellness at all levels. They enjoyed the camaraderie with coaches, mentors, and other participants as well as the interactive exercises and working on their projects. All would recommend the program to a peer.
Feedback: Data will be used by the Leadership Development Committee to plan and develop future LWLW Programs.
2019 Live Well, Lead Well: Well-being Champion Program Evaluation 100% (20/20) Evaluate the AAN’s Class of 2019 Live Well, Lead Well: Well-being Champion Leadership Program, developed this year from an identified need related to Accreditation Council for Graduate Medical Education (ACGME) requirements (two days at the Annual Meeting). Participants are generally program or clerkship directors.
1. Participants rated the overall program (85%), their interaction with facilitators and AAN staff (85%), the consultants’ knowledge (85%), and quality and effectiveness of the program materials (80%) as excellent.
2. Participants increased their confidence in four key activities: advocating for change in wellness planning (65%), approaching a trainee about a serious error (55%), approaching a trainee about behavior change or poor professionalism (55%), and talking to a trainee about coping with the loss of a patient (35%).
3. They enjoyed the program, sharing that it was a good venue to discuss trainee well-being. They enjoyed the camaraderie with fellow participants and felt that the program reinforced the importance of trainee wellness. All would recommend the program to a peer.
Feedback: Data will be used by the Leadership Development Committee to plan and develop future Live Well, Lead Well programs.
March 13, 2020 | 34
Membership
2019 Current FAAN Survey 39% (391/1,000) Obtain feedback from current FAAN members on the FAAN status program and use that feedback to assess whether new marketing or communication efforts should be undertaken to promote applications for FAAN.
1. Top reasons members became FAANs were to elevate their AAN membership, elevate their professional status, and add the credential to their designation.
2. 58% felt being an FAAN has had little to no impact on their careers. 3. Current FAANs felt the AAN could improve awareness of the FAAN status by advertising the benefits and
application process. Feedback: Information will be used to enhance the benefits of becoming a Fellow of the AAN and to encourage current FAANs to nominate their colleagues for this prestigious membership category.
2019 FAAN-eligible Member Survey 38% (382/1,000) Obtain member opinion and feedback on the FAAN status program from FAAN-eligible members and use that feedback to assess whether new marketing or communication efforts should be undertaken to promote applications for FAAN.
1. 80% were aware of the FAAN status, 78% were not familiar with the eligibility requirements. 2. 42% were not at all likely to apply for FAAN status within the next year. 3. Top reasons for not applying for FAAN status included not knowing if they met the eligibility requirements, not
knowing what the requirements are, and concern for not having enough special achievements in the neurosciences.
Feedback: Information will be used to better market the AAN’s elite Fellow membership and to gain insight on how to improve the application process.
2019 Career Satisfaction Pop-up Survey 20% (370/1,847) Measure progress towards the “…enhance member career satisfaction” portion of the AAN mission statement.
1. 89% would recommend to a current medical student that they pursue a career as a neurologist (84% for US neurologists and 95% for all other members).
2. For the few who would not recommend a career as a neurologist, the pay was the common theme.
Practice
2019 Corticosteroid Survey 20% (194/989) NOTE: RESULTS ARE EMBARGOED UNTIL PUBLISHED Gather information regarding AAN members’ 1) administration of oral and intravenous corticosteroids, 2) patient counseling of side effects/side effect monitoring, 3) practice behaviors for corticosteroid administration, and 4) awareness of corticosteroid practice guidelines.
March 13, 2020 | 35
Publications
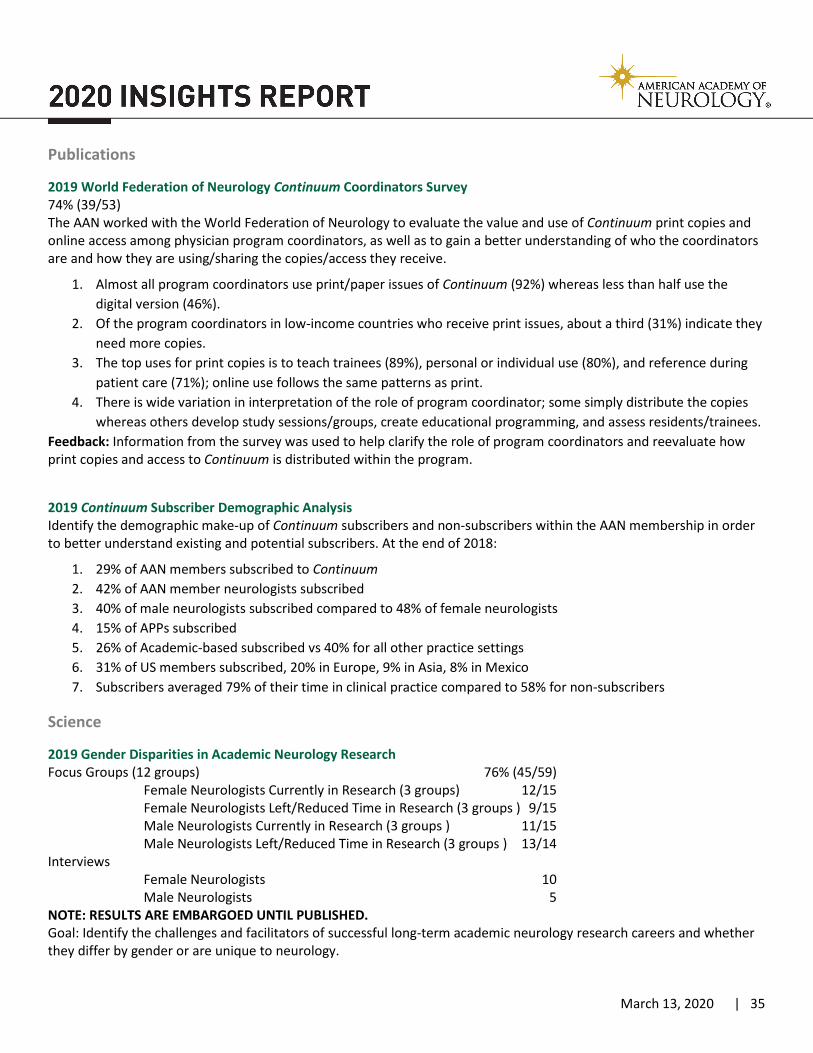
2019 World Federation of Neurology Continuum Coordinators Survey 74% (39/53) The AAN worked with the World Federation of Neurology to evaluate the value and use of Continuum print copies and online access among physician program coordinators, as well as to gain a better understanding of who the coordinators are and how they are using/sharing the copies/access they receive.
1. Almost all program coordinators use print/paper issues of Continuum (92%) whereas less than half use the digital version (46%).
2. Of the program coordinators in low-income countries who receive print issues, about a third (31%) indicate they need more copies.
3. The top uses for print copies is to teach trainees (89%), personal or individual use (80%), and reference during patient care (71%); online use follows the same patterns as print.
4. There is wide variation in interpretation of the role of program coordinator; some simply distribute the copies whereas others develop study sessions/groups, create educational programming, and assess residents/trainees.
Feedback: Information from the survey was used to help clarify the role of program coordinators and reevaluate how print copies and access to Continuum is distributed within the program.
2019 Continuum Subscriber Demographic Analysis Identify the demographic make-up of Continuum subscribers and non-subscribers within the AAN membership in order to better understand existing and potential subscribers. At the end of 2018:
1. 29% of AAN members subscribed to Continuum 2. 42% of AAN member neurologists subscribed 3. 40% of male neurologists subscribed compared to 48% of female neurologists 4. 15% of APPs subscribed 5. 26% of Academic-based subscribed vs 40% for all other practice settings 6. 31% of US members subscribed, 20% in Europe, 9% in Asia, 8% in Mexico 7. Subscribers averaged 79% of their time in clinical practice compared to 58% for non-subscribers
Science
2019 Gender Disparities in Academic Neurology Research Focus Groups (12 groups) 76% (45/59)
Female Neurologists Currently in Research (3 groups) 12/15 Female Neurologists Left/Reduced Time in Research (3 groups ) 9/15 Male Neurologists Currently in Research (3 groups ) 11/15 Male Neurologists Left/Reduced Time in Research (3 groups ) 13/14
Interviews Female Neurologists 10 Male Neurologists 5
NOTE: RESULTS ARE EMBARGOED UNTIL PUBLISHED. Goal: Identify the challenges and facilitators of successful long-term academic neurology research careers and whether they differ by gender or are unique to neurology.
March 13, 2020 | 36
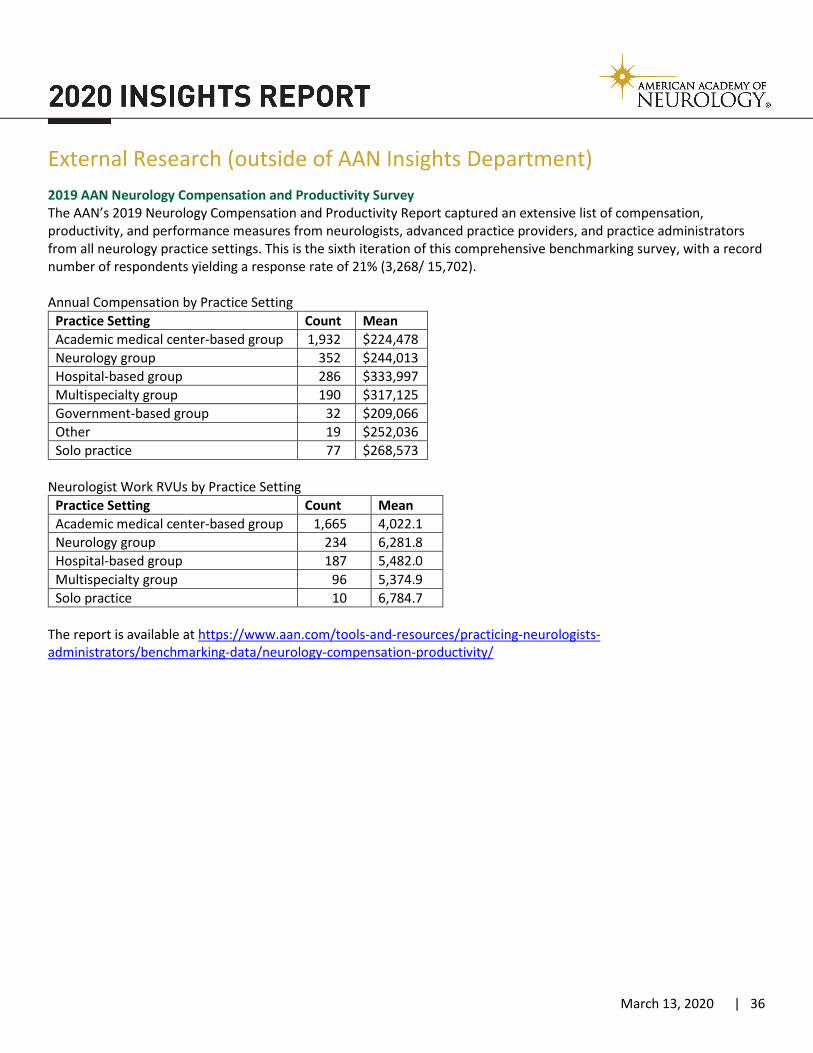
External Research (outside of AAN Insights Department) 2019 AAN Neurology Compensation and Productivity Survey The AAN’s 2019 Neurology Compensation and Productivity Report captured an extensive list of compensation, productivity, and performance measures from neurologists, advanced practice providers, and practice administrators from all neurology practice settings. This is the sixth iteration of this comprehensive benchmarking survey, with a record number of respondents yielding a response rate of 21% (3,268/ 15,702). Annual Compensation by Practice Setting
Practice Setting Count Mean Academic medical center-based group 1,932 $224,478 Neurology group 352 $244,013 Hospital-based group 286 $333,997 Multispecialty group 190 $317,125 Government-based group 32 $209,066 Other 19 $252,036 Solo practice 77 $268,573
Neurologist Work RVUs by Practice Setting
Practice Setting Count Mean Academic medical center-based group 1,665 4,022.1 Neurology group 234 6,281.8 Hospital-based group 187 5,482.0 Multispecialty group 96 5,374.9 Solo practice 10 6,784.7
The report is available at https://www.aan.com/tools-and-resources/practicing-neurologists-administrators/benchmarking-data/neurology-compensation-productivity/
Appendix: In-progress and Upcoming Projects: Surveys
1. 2019 Curbing Delay in Diagnosis of ALS – Phase III 2. 2019 DBS and Parkinson’s Survey 3. 2019 Guideline Development Program Evaluation Survey 4. 2019 Guideline Dissemination Program Evaluation Survey 5. 2019 Guideline Topic Prioritization Pop-up Survey 6. 2019 Language Implying Levels of Obligation Used in AAN Guidelines Survey 7. 2019 Medical Economics Communication and Education Survey 8. 2019 National Epilepsy Education and Awareness Collaborative Practice Patterns Survey 9. 2019 Neurology Health IT Assessment Survey 10. 2020 ABF Public Survey 11. 2020 Gender Disparities in Neurology Survey 12. 2020 Online Learning Needs Assessment 13. 2020 International Member Survey 14. 2020 Early Career Member Survey 15. 2020 Former Member Survey
Pop-up Surveys 1. 2019 Promotion of Compensation Survey Using a Pop-up Survey 2. 2019 Legislative and Advocacy Priorities for 2020 Pop-up Survey 3. 2020 ABF Member Pop-up Survey 4. 2020 Board Scorecard Pop-up Survey
Evaluations 1. Class of 2020 Intensive Leadership Program Pre- and Post-Evaluations 2. 2020 Intensive Leadership Program (All Graduates) Follow-up Evaluation 3. 2020 Annual Meeting Immersive Leadership Program Evaluations 4. 2020 Annual Meeting Evaluations 5. 2020 Fall Conference Evaluations 6. 2020 NOH Evaluations 7. 2020 PALF Evaluations 8. 2020 Sports Concussion Conference Evaluations 9. 2020 ELA Evaluations 10. 2020 Exhibitor Evaluations
Focus Groups/Interviews 1. 2018-2020 Neurology® Clinical Practice Interviews 2. 2019 Gender Disparities in Neurology Focus Groups and Interviews 3. 2020 Member Perception of Quality and Use of Tools Focus Groups 4. 2020 Neurology Podcast Focus Groups 5. 2020 Service Lines Interviews