128
2020 INVESTOR DAY January 9, 2020

2020 INVESTOR DAYJanuary 9, 2020

Safe harbor statementsThis presentation is dated as of January 9, 2020 and speaks as of that date.
Forward-Looking Statements
This presentation contains statements that may constitute forward-looking statements within the meaning of the Private Securities Litigation Reform Act of 1995. These forward-looking statements include any statements relating to our possible or assumed future results of operations, business strategies, growth opportunities, and performance improvements at our stores. There are a number of known and unknown risks, uncertainties, and other factors that may cause our actual results to differ materially from any future results expressed or implied by those forward-looking statements, including our ability to execute our strategic plan or to realize benefits therefrom, as well as other risks, uncertainties and factors which are described in our most recent annual report on Form 10-K and quarterly reports on Form 10-Q, as filed with the Securities and Exchange Commission and available on our website. Any forward-looking statements contained in this presentation represent our current views as of the date of this presentation with respect to future events, and Casey's disclaims any intention or obligation to update this presentation or revise any forward-looking statements in this presentation whether as a result of new information, future events, or otherwise.
Use of Non-GAAP Measures
This presentation includes refers to "EBITDA," which we define as net income before net interest expense, depreciation and amortization, and income taxes. EBITDA is not presented in accordance with accounting principles generally accepted in the United States ("GAAP"). We believe EBITDA is useful to investors in evaluating our operating performance because securities analysts and other interested parties use such calculations as a measure of financial performance and debt service capabilities, and it is regularly used by management for internal purposes including our capital budgeting process, evaluating acquisition targets, and assessing store performance. EBITDA is not a recognized term under GAAP and should not be considered a substitute for net income, cash flows from operating activities or other income or cash flow statement data. EBITDA has limitations as an analytical tool, and should not be considered in isolation or as a substitute for analysis of our results as reported under GAAP. We strongly encourage investors to review our financial statements and publicly filed reports in their entirety and not to rely on any single financial measure. Because non-GAAP financial measures are not standardized, EBITDA, as defined by us, may not be comparable to similarly titled measures reported by other companies. It therefore may not be possible to compare our use of this non-GAAP financial measure with those used by other companies. Reconciliations of EBITDA to GAAP net income for completed fiscal years can be found in our annual reports on Form 10-K, filed with the SEC and in Appendix A, attached hereto.

Darren rebelez President & Chief Executive Officer

4th largest convenience store, 5th largest pizza chain business in the United States1,2
$7.2BTotal Enterprise Value
2,181+Locations in 16 States
665M+Guests Transactions per Year
38,000+Total Team Members
S T O R E S B Y P O P U L A T I O N :
56%
14%
12%
12%
6%
20,001-100,000
5,001-10,000Less than 5,000
10,001-20,000
Over 100,000
C A S E Y ’ S S T O R E F O O T P R I N T :
Note: Market data as of January 6, 2020. Number of locations, transactions, team members as of FY20 Q2 1 4th largest convenience store by number of stores in United States (Source: CSP Daily News) 2 5th largest pizza chain business by number of kitchens in United States

History of success
+ 50+ year legacy of serving midwestern communities
+ Successfully branded and easily recognizable chain of convenience stores
+ Significant growth to nearly 2,200 stores spanning 16 states
+ Part of the fabric of the communities we serve
+ Unique attributes have accelerated growth

Evolution toward the future
+ Building on our proud heritage and distinct advantages to grow
+ Macro trends, retail shifts, and consumer habits are rapidly evolving
+ We are moving forward with a broadened set of performance drivers
+ Becoming more contemporary through new capabilities, technology, data, and processes

INDUSTRY PERSPECTIVE

The MacroEconomy
THE FARM ECONOMY REMAINS SLUGGISH
2011 2014 2016 20172012 20152013 2018 2019
% Change in Revenue Growth
US Agriculture Revenue, 2011 – 2019
Net Farm Income- 42%
Net Cash Farm Income-30%
2013 - 2019
Source: IBIS World US Agriculture Industry Report

TECHNOLOGY IS DRIVING UNPRECEDENTED CHANGES
Source: eMarketer; NPD Group; QSR Magazine
plan to use in-store kiosks in the next year
>50%
projected 2023 US mobile payment transaction value
$220B
projected 2023 US mobile payment users
80M+
$21 $22 $23 $23 $23 $22 $22 $21 $21
$10 $12 $16 $20 $25 $31 $38$46
$55
201820172014 2021E2020E2015 2016 2019 2022E
+12% CAGR
Offline Digital
Projected US Restaurant Delivery Revenue ($B)
of consumers have replaced a dine-in meal with a delivery meal in last 6 months
>40%
of restaurant industry’s growth is projected to be driven by delivery in next 5 yrs.
30%
est. value of interactive kiosk market by 2023
$31B
The MacroEconomy

CONSUMERS NOTION OF CONVENIENCE IS SHIFTING
Source: US Census Bureau; eMarketer; Deloitte Consumer Change Survey, 2017-2018
of consumers are willing to pay extra for same- or next-day delivery
50%of consumers plan to use delivery or pickup services in the next year
>70%2018-2019 growth in convenience-related trips across all channels vs. 2% growth in general retail trips
16%
32%28%
22%18%
Quick and easy to find products online and in store
Availability of products Easy checkout processConvenience to shop
Demand for convenience provides opportunities for retailers to win through experienceConsumers’ top reasons to select a retailer
The MacroEconomy
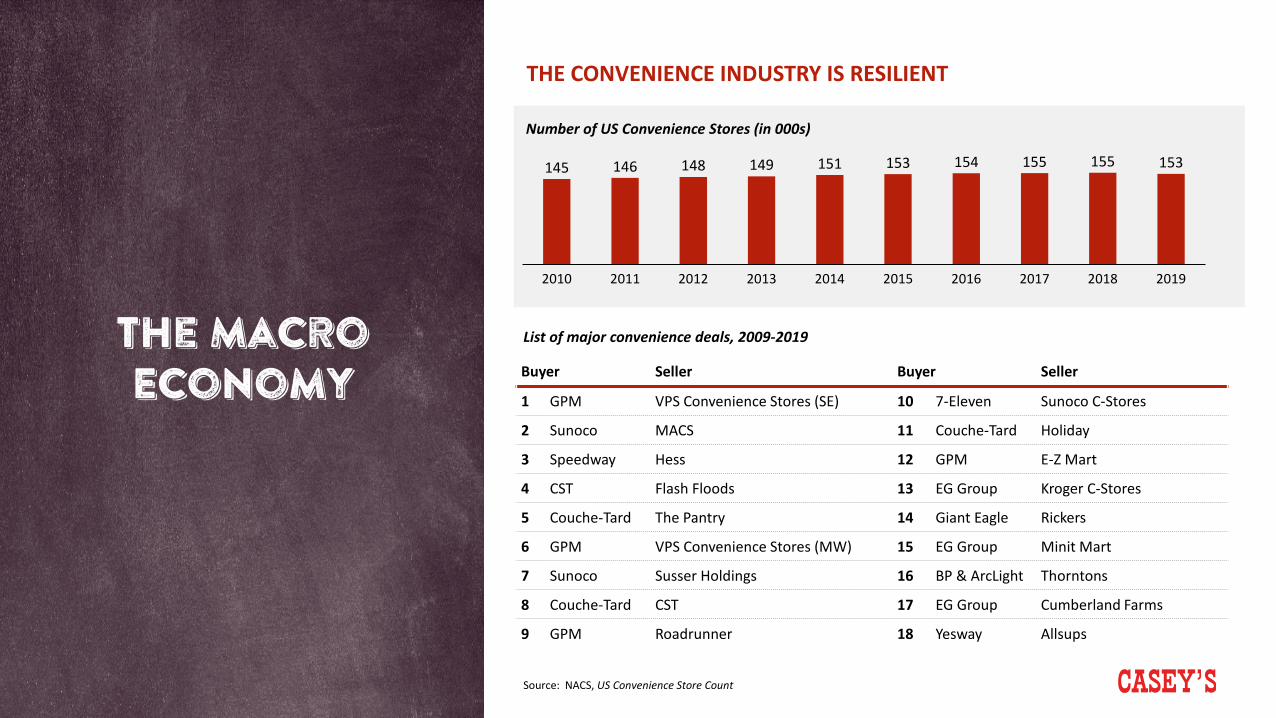
THE CONVENIENCE INDUSTRY IS RESILIENT
Number of US Convenience Stores (in 000s)
Source: NACS, US Convenience Store Count
145 146 148 149 151 153 154 155 155 153
201720112010 2012 2015 201620142013 2018 2019
List of major convenience deals, 2009-2019
Buyer Seller Buyer Seller
1 GPM VPS Convenience Stores (SE) 10 7-Eleven Sunoco C-Stores
2 Sunoco MACS 11 Couche-Tard Holiday
3 Speedway Hess 12 GPM E-Z Mart
4 CST Flash Floods 13 EG Group Kroger C-Stores
5 Couche-Tard The Pantry 14 Giant Eagle Rickers
6 GPM VPS Convenience Stores (MW) 15 EG Group Minit Mart
7 Sunoco Susser Holdings 16 BP & ArcLight Thorntons
8 Couche-Tard CST 17 EG Group Cumberland Farms
9 GPM Roadrunner 18 Yesway Allsups
The MacroEconomy

Casey’s is well-postured for success
INDUSTRY
HIGHLY FRAGMENTED INDUSTRY
CASEY’S
SCALE TO INVESTSmaller players have limited ability to invest in infrastructure and technology at the scale we can
INDUSTRY CONSOLIDATION ABILITY TO ACQUIREWe have demonstrated a strong, disciplined acquisition approach that drives immediate value creation
SHIFT TO FOOD SERVICE STRONG FOOD HERITAGECasey’s is known for our food program, which is a strategic differentiator for our guests
VULNERABILITY TO DECLINING CATEGORIES FAVORABLE PRODUCT MIXThe diversity of our product mix makes us less susceptible to declining category head winds
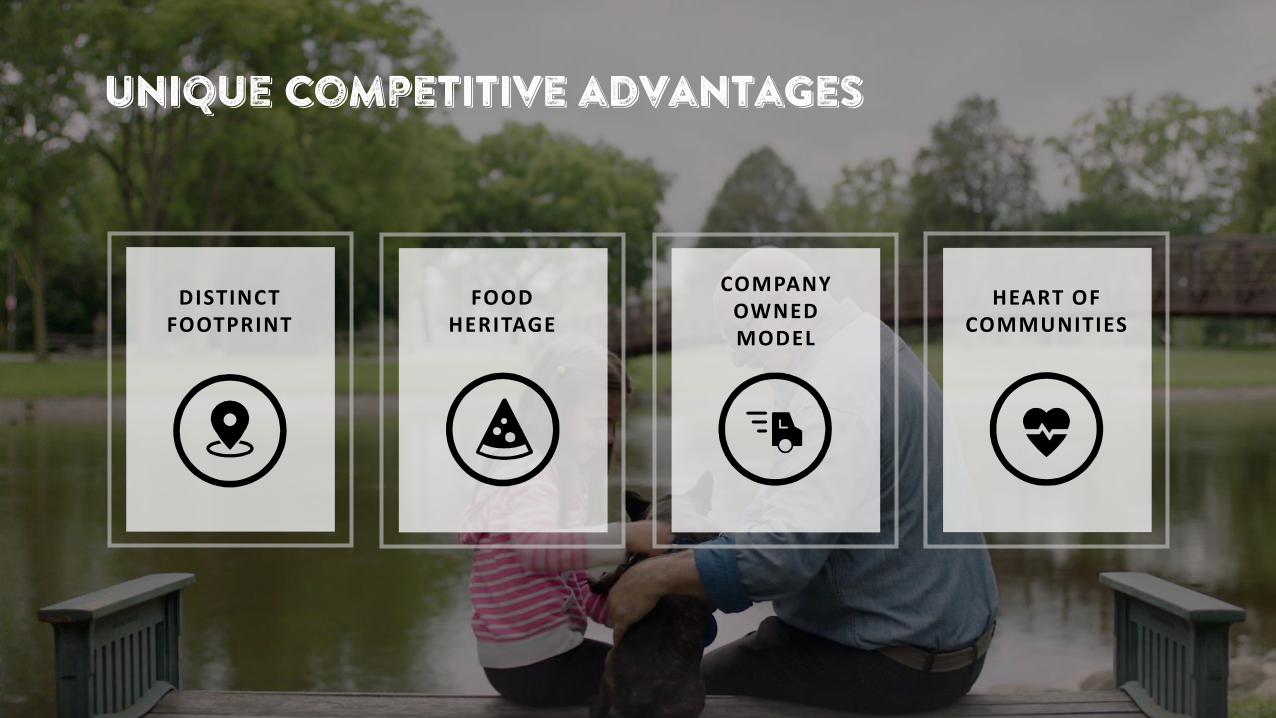
Unique competitive advantages
DISTINCT FOOTPRINT
FOOD HERITAGE
COMPANY OWNED MODEL
HEART OF COMMUNITIES

Our Competitive advantages drive industry-leading performance
33%
23%
FOOD % OF INSID E REVENUE CIG ARETTES % OF INSID E REVENUE
Source: NACS 2019 SOI Study
Casey’s Industry average
23%31%
Casey’s Industry average
INSID E PROF IT MARG IN %
41%34%
Casey’s Industry average
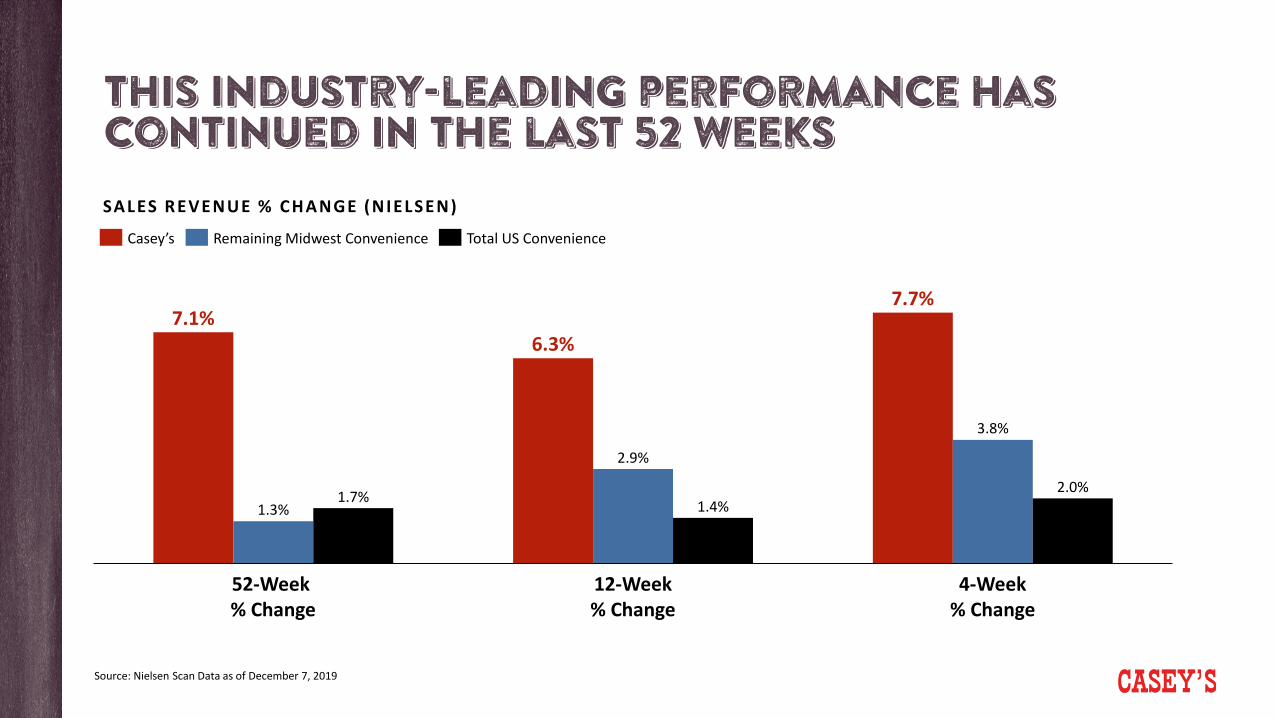
this Industry-leading performance has continued in the last 52 weeks
7.1%6.3%
7.7%
1.3%
2.9%
3.8%
1.7% 1.4%2.0%
4-Week% Change
52-Week% Change
12-Week% Change
Casey’s Remaining Midwest Convenience Total US Convenience
SALES REVENUE % CHANGE (NIELSEN)
Source: Nielsen Scan Data as of December 7, 2019

$4.7 $4.6
$5.6
$7.0 $7.3$7.8 $7.8
$7.1$7.5
$8.4
$9.4
20132009 2010 201620152011 2012 20172014 2018 2019
+ 7 . 1 % R E V E N U E C A G R
1.2 1.3 1.4 1.5 1.51.7
1.82.0 2.1
2.2 2.3
20132009 2010 20192011 20162012 2014 2015 2017 2018
$1.4 $1.4 $1.6 $1.9 $2.0 $2.2$2.6 $2.9 $3.0 $3.2 $3.4
201420112009 2010 20152012 2013 2016 2017 2018 2019
+ 9 . 8 % I N S I D E S A L E S C A G RCasey’s annual revenue ($B), FY09-FY19 Casey’s inside sales – G&OM + PF&F ($B), FY09-FY19
+ 6 . 3 % F U E L G A L L O N S C A G RCasey’s fuel gallons (B), FY09-FY19
DEMONSTRATED ABILITY TO DELIVER
CONSISTENT GROWTH
1,478 1,5311,637 1,699 1,749 1,808 1,878 1,931 1,978 2,073 2,146
20132011 20142009 20152010 2012 2016 2017 2018 2019
+ 3 . 8 % U N I T C A G RCasey’s total units (#), fiscal year end, FY09-FY19

$219M
$365M
$563M
20192009 2014
+ 9 . 9 % E B I T D A C A G RCasey’s annual EBITDA ($M), FY09-FY191
DEMONSTRATED ABILITY TO DELIVER
CONSISTENT GROWTH
C A S E Y ’ S S H A R E P R I C E V S . S & P 5 0 0
20%
13%
Average annual return, 2009 – 2019
Note: Returns based on CASY and S&P 500 Index close price annually on December 31 from 2009 to 20191 See Appendix A for reconciliations of EBITDA to GAAP net income for completed fiscal years

EVOLVING OUR STRATEGY

To make life better for communities and guests every day
O U R P U R P O S E :

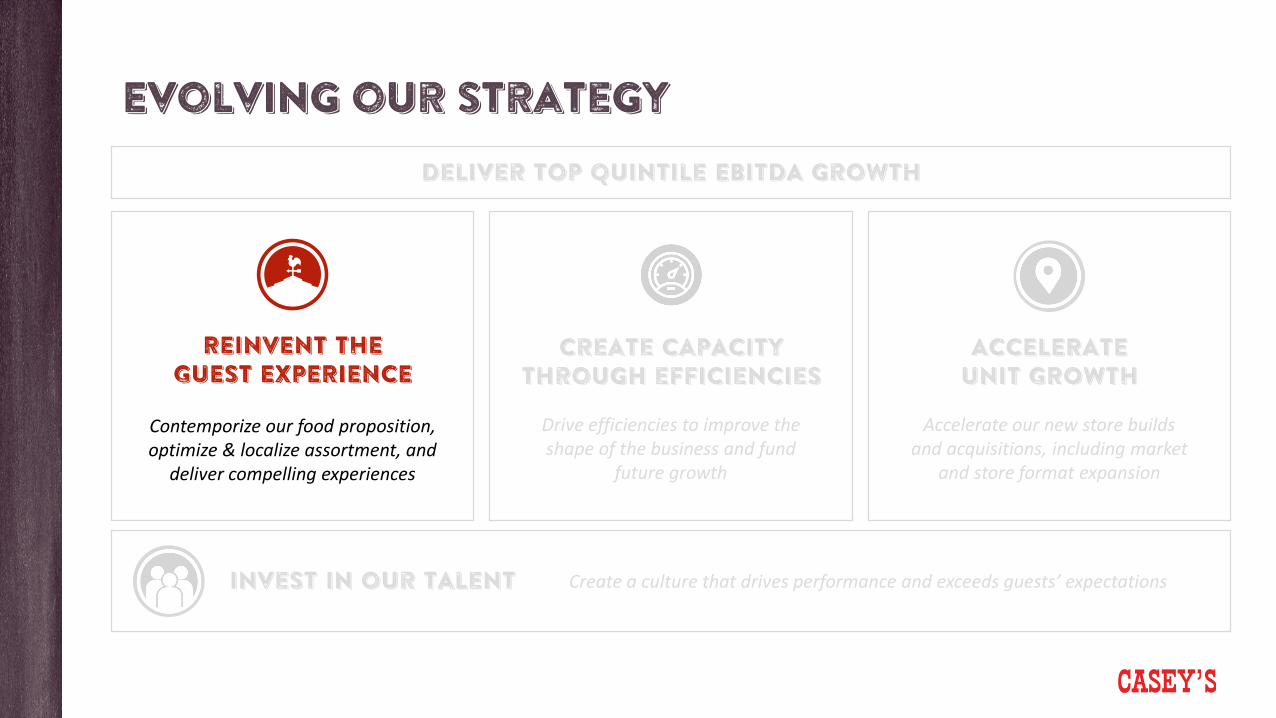
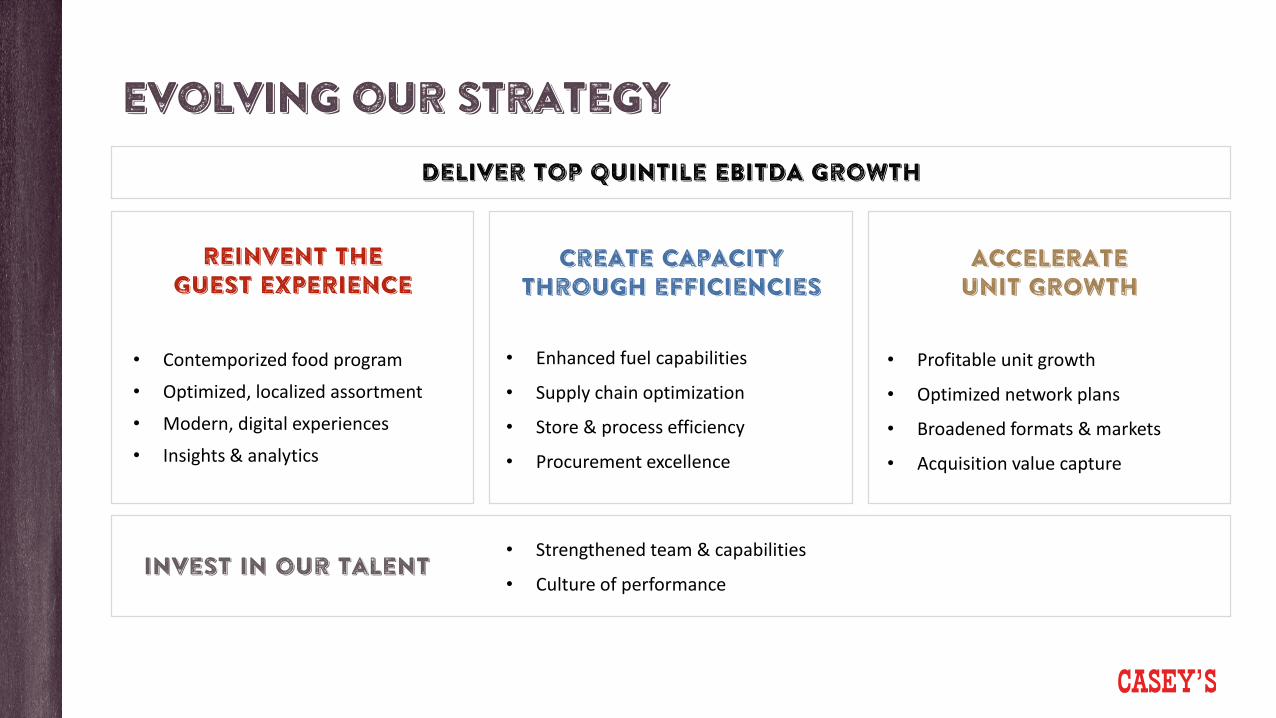
Evolving our strategy
Create capacity through efficiencies
ACCELERATE UNIT GROWTH
REINVENT THE GUEST EXPERIENCE
Contemporize our food proposition, optimize & localize assortment, and
deliver compelling experiences
Drive efficiencies to improve the shape of the business and fund
future growth
Accelerate our new store builds and acquisitions, including market
and store format expansion
Create a culture that drives performance and exceeds guests’ expectations
Deliver top quintile EBITDA growth
Invest in our talent
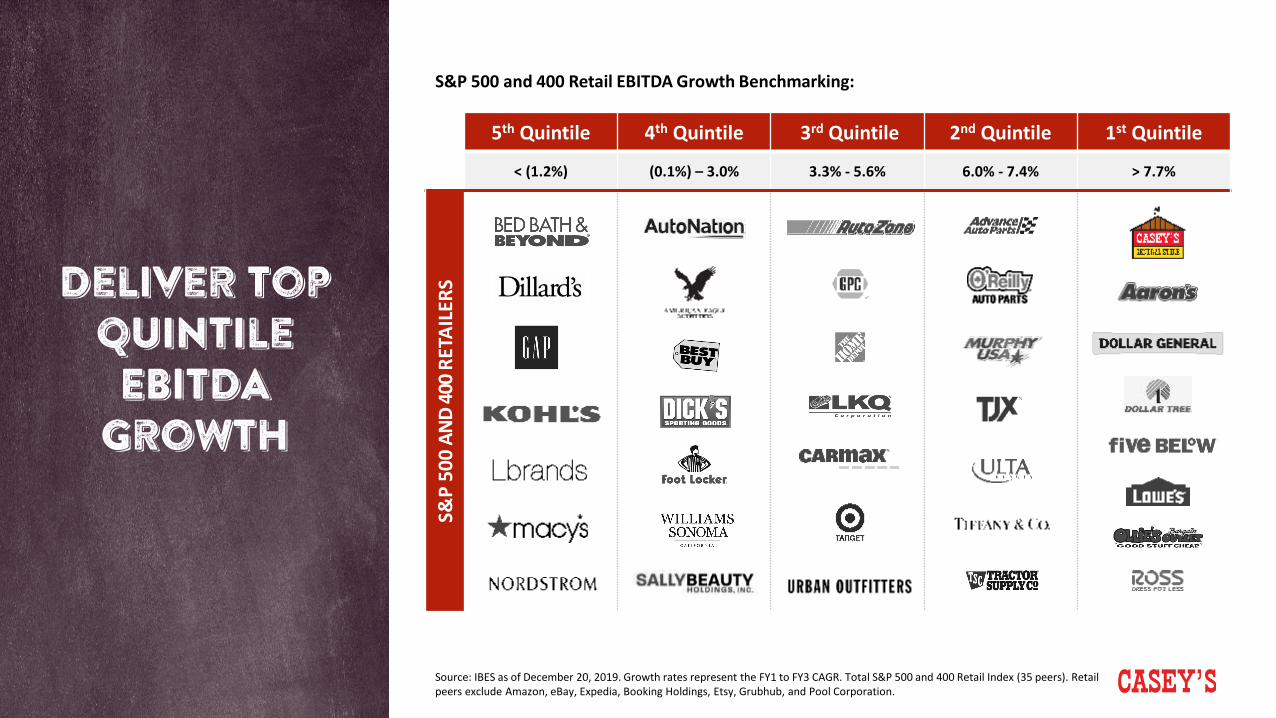
Deliver top quintile EBITDA
growth
5th Quintile 4th Quintile 3rd Quintile 2nd Quintile 1st Quintile
< (1.2%) (0.1%) – 3.0% 3.3% - 5.6% 6.0% - 7.4% > 7.7%
S&P
500
AND
400
RETA
ILER
S
Source: IBES as of December 20, 2019. Growth rates represent the FY1 to FY3 CAGR. Total S&P 500 and 400 Retail Index (35 peers). Retail peers exclude Amazon, eBay, Expedia, Booking Holdings, Etsy, Grubhub, and Pool Corporation.
S&P 500 and 400 Retail EBITDA Growth Benchmarking:

Reinventthe guest experience
• Contemporized food proposition
• Optimized, localized assortment
• Modern, digitally-enabled experiences
• Insight-driven engagement & loyalty
• Advanced analytics to drive performance

Create capacity through efficiencies
• Business optimization and cost reduction
• Execution excellence to deliver consistent, compelling experiences
• New capabilities for enterprise-wide efficiency
• Capacity to reinvest in future growth

Accelerateunit growth
• Expansion within addressable market
• Profitable unit growth
• Optimized network plans
• Broadened scope of formats and markets
• Value capture from acquisitions

Invest in our talent
• Strengthened, diverse team
• Capabilities to drive business performance
• Focused development programs
• Increased engagement to make life better for guests and communities

Creating long-term shareholder value
+ + +
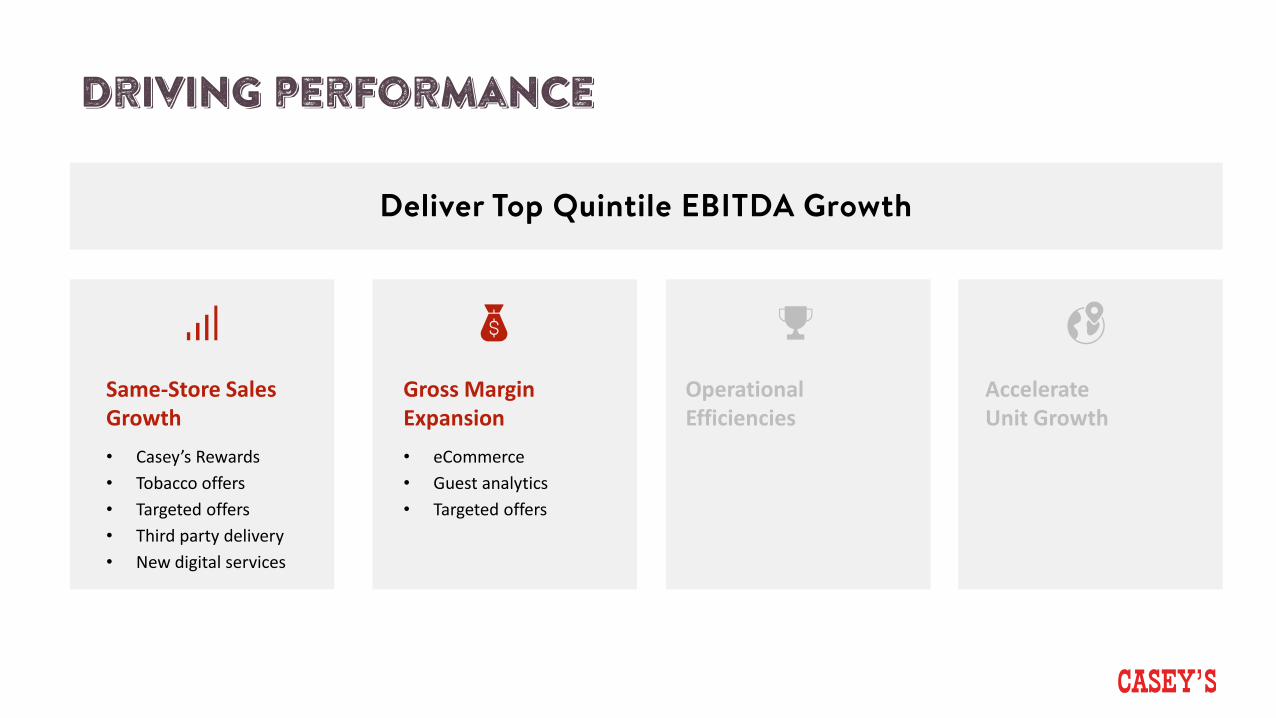
Deliver Top Quintile EBITDA Growth
Gross Margin Expansion
Same-Store Sales Growth
Operational Efficiencies
Accelerate Unit Growth

Reinvent the guest experience

Chris jonesSVP & Chief Marketing Officer
Evolving our strategy
Create capacity through efficiencies
ACCELERATE UNIT GROWTH
Invest in our talent
REINVENT THE GUEST EXPERIENCE
Contemporize our food proposition, optimize & localize assortment, and
deliver compelling experiences
Drive efficiencies to improve the shape of the business and fund
future growth
Accelerate our new store builds and acquisitions, including market
and store format expansion
Create a culture that drives performance and exceeds guests’ expectations
Deliver top quintile EBITDA growth
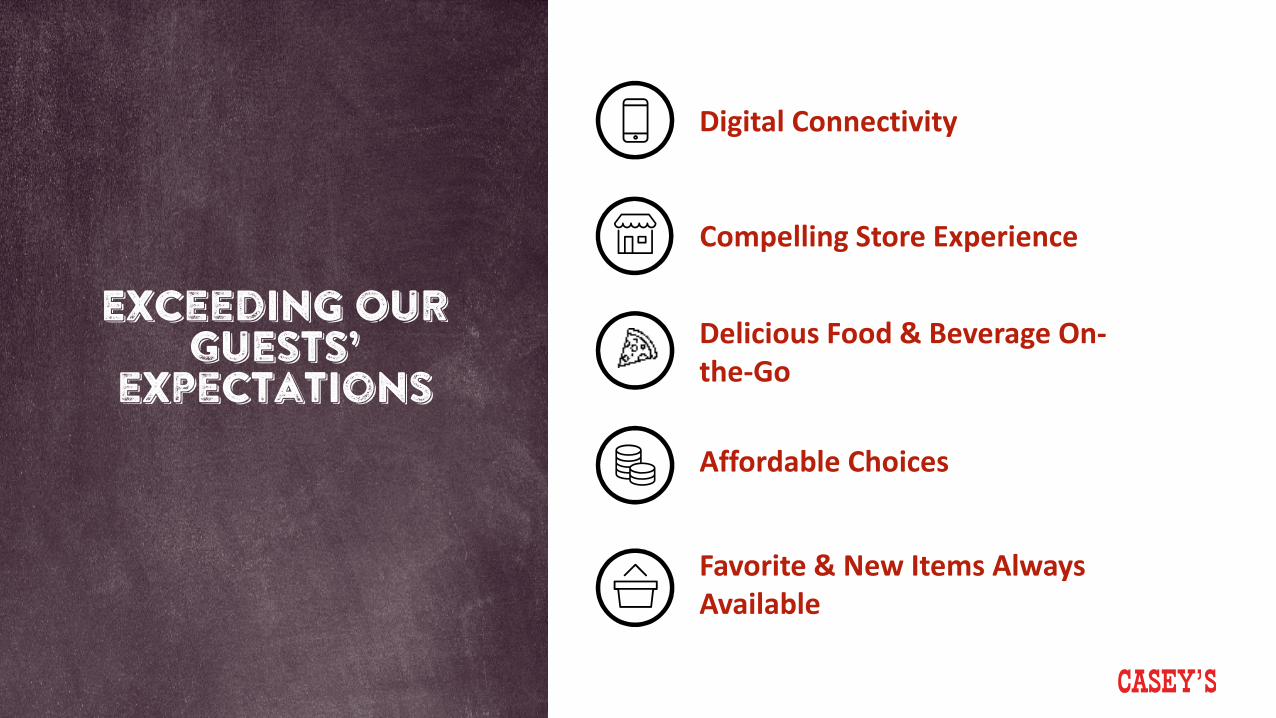
Exceeding OUR GUESTS’
expectations
Digital Connectivity
Compelling Store Experience
Delicious Food & Beverage On-the-Go
Favorite & New Items Always Available
Affordable Choices
Exceeding OUR GUESTS’
expectationsDelicious Food & Beverage On-the-Go
Favorite & New Items Always Available
Affordable Choices
Digital Connectivity
Compelling Store Experience

Source: eMarketer, LEK, NPD Group, Cowen & Company
DIGITAL CONNECTIVITY
Hours spent per day, by device
0.3
0.7
2.2
2.3
2.0
0.3
2.3
3.5
0.2
2013
2008
2018
MobileOther Connected Devices Desktop/Laptop
growth of restaurant digital orders since 2015
>20%
projected percent of restaurant revenue driven by digital by 2022
>70%

Compelling store experience
Source: MarketingDive; Interbrand; Casey’s target consumer survey
will abandon a brand or retailer due to a poor or impersonal experience
47%lift in consumers’ purchase intent following a positive, emotional brand experience
7x
dominates the top rated convenience attributes
STORE ENVIRONMENT
“I feel like their stores are part of my community” is the #2 driver of choice
#2 driver
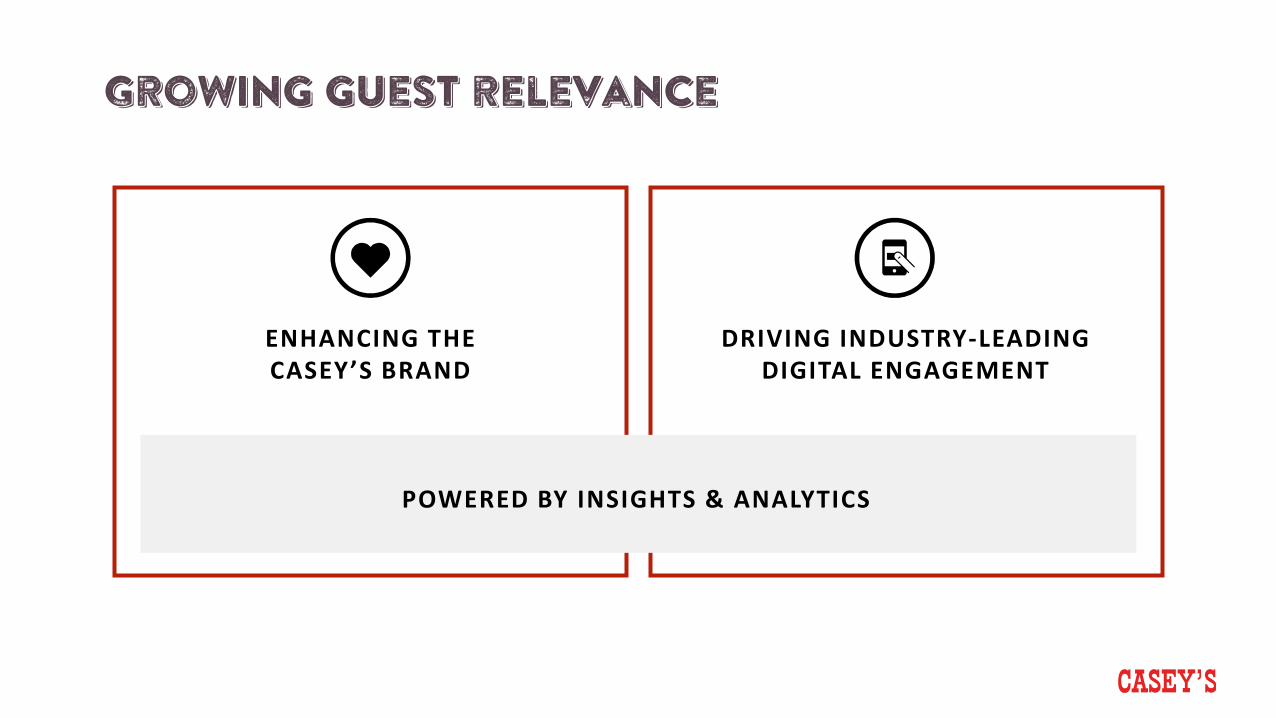
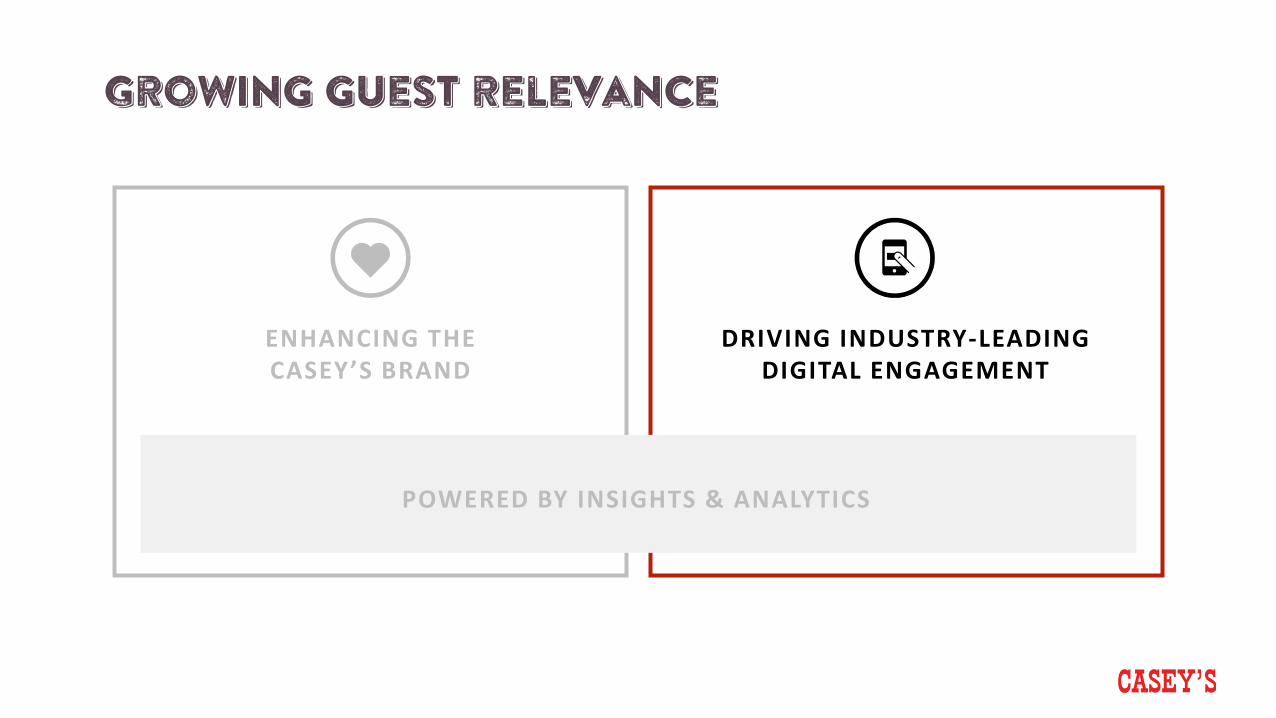
Growing guest relevance
ENHANCING THE CASEY’S BRAND
DRIVING INDUSTRY-LEADING DIGITAL ENGAGEMENT
POWERED BY INSIGHTS & ANALYTICS

Growing guest relevance
ENHANCING THE CASEY’S BRAND
DRIVING INDUSTRY-LEADING DIGITAL ENGAGEMENT
POWERED BY INSIGHTS & ANALYTICS
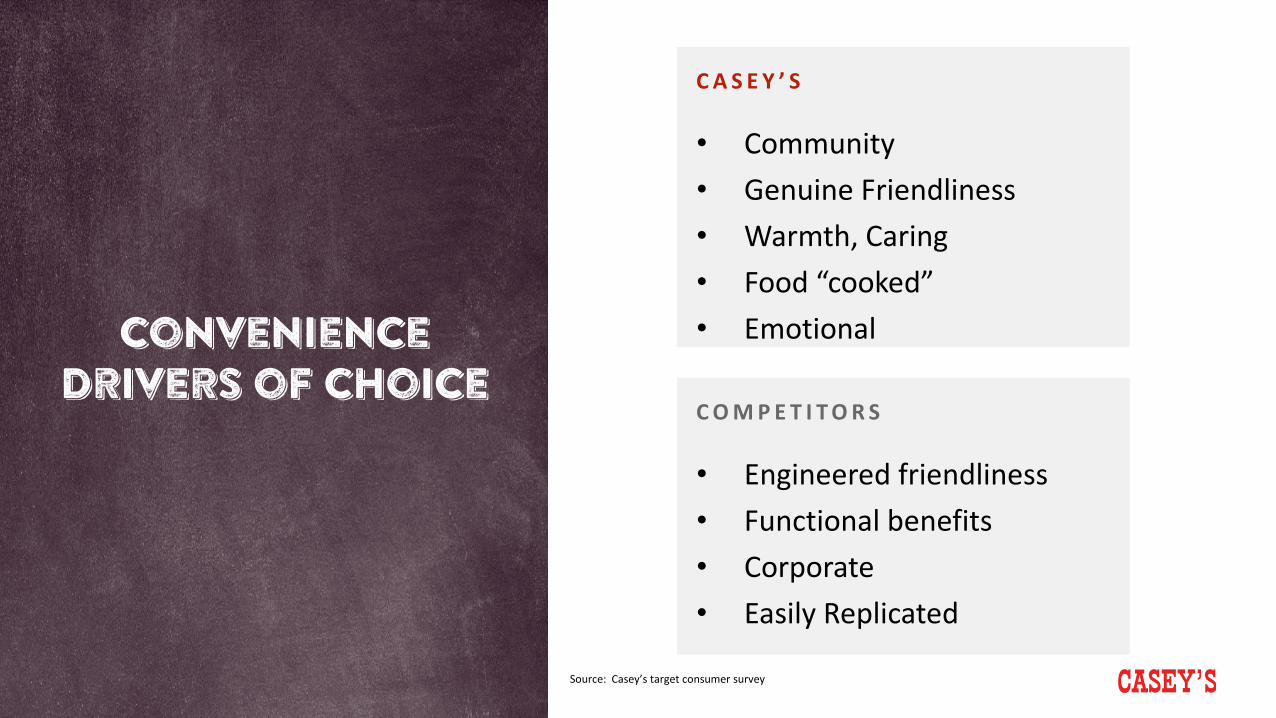
Convenience Drivers of Choice
C A S E Y ’ S
• Community• Genuine Friendliness• Warmth, Caring• Food “cooked” • Emotional
C O M P E T I T O R S
• Engineered friendliness• Functional benefits• Corporate• Easily Replicated
Source: Casey’s target consumer survey

Casey’s is a clear leader in our geographic footprint
Rank Fits into the community Prepared food items
1 Casey’s General Stores Casey’s General Stores
2 Hy-Vee Gas QuikTrip
3 QuikTrip Kwik Star/ Kwik Trip
4 Thornton’s (tie)Kwik Star/ Kwik Trip (tie) Hy-Vee Gas
5 Holiday Holiday
Source: Casey’s target consumer survey
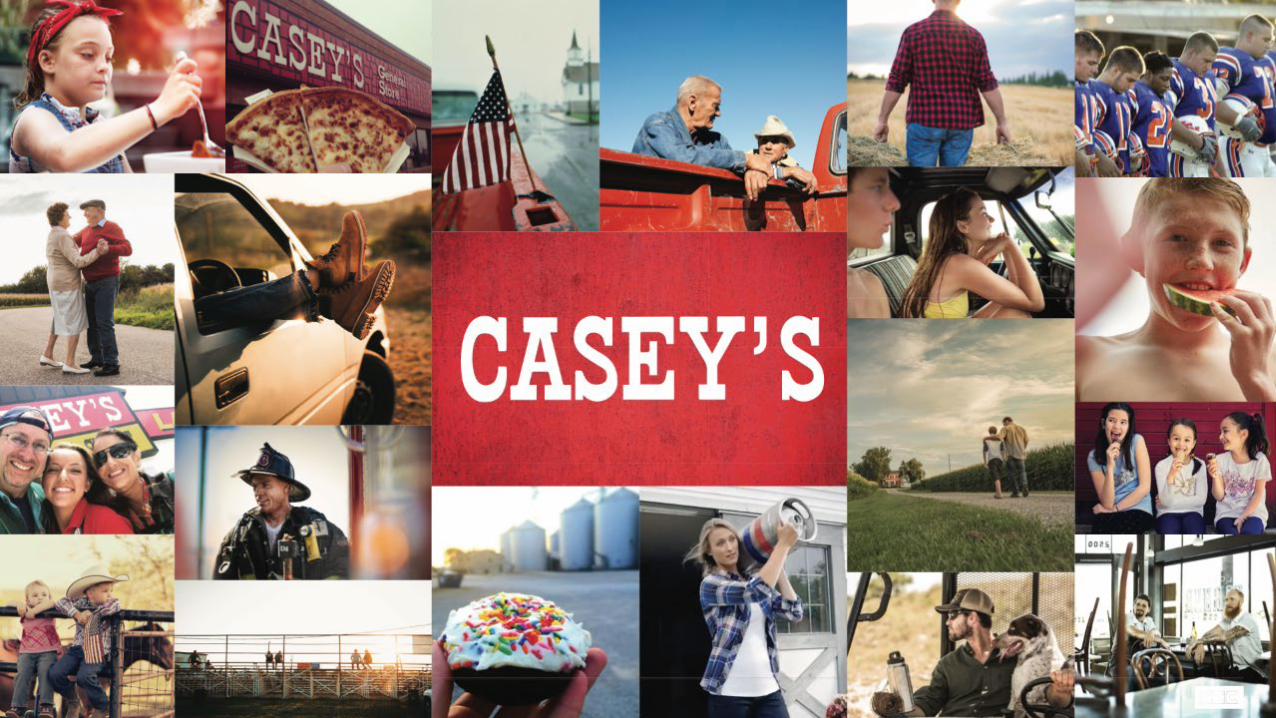
Casey’s is at the heart of every community we’re in.

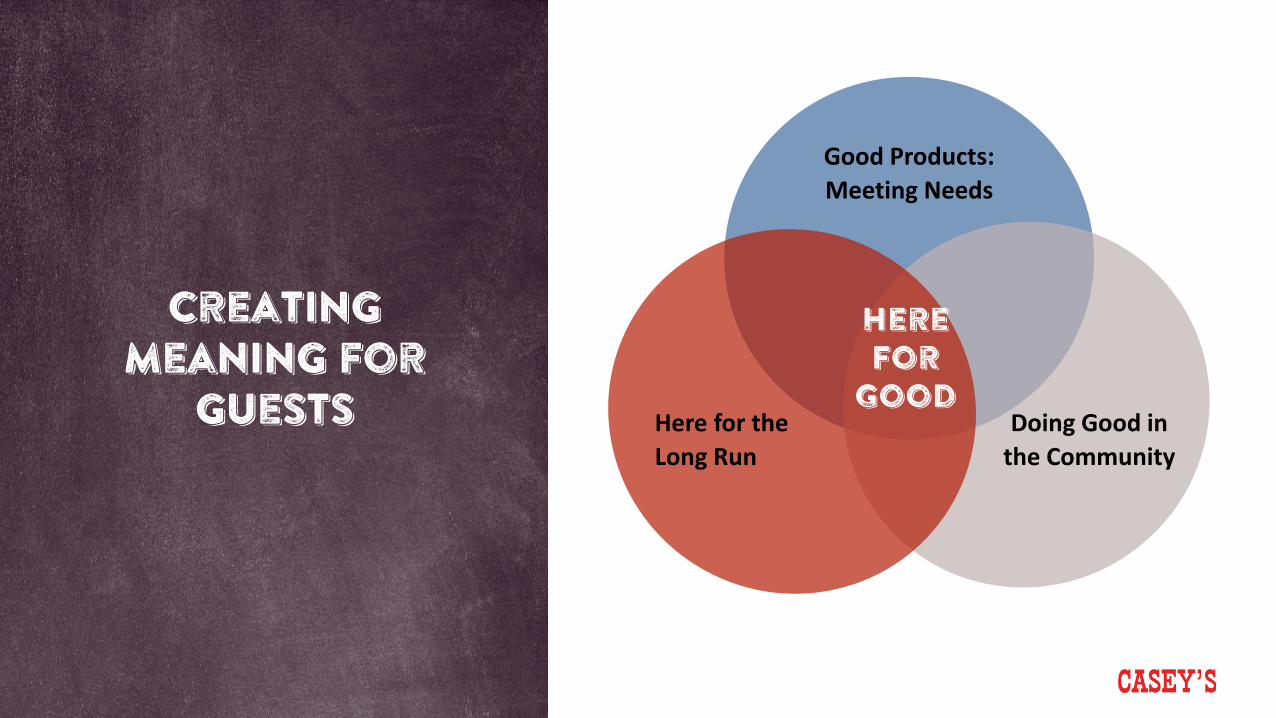
Creating meaning for
guests
Good Products: Meeting Needs
HereFor
GoodHere for the Long Run
Doing Good in the Community
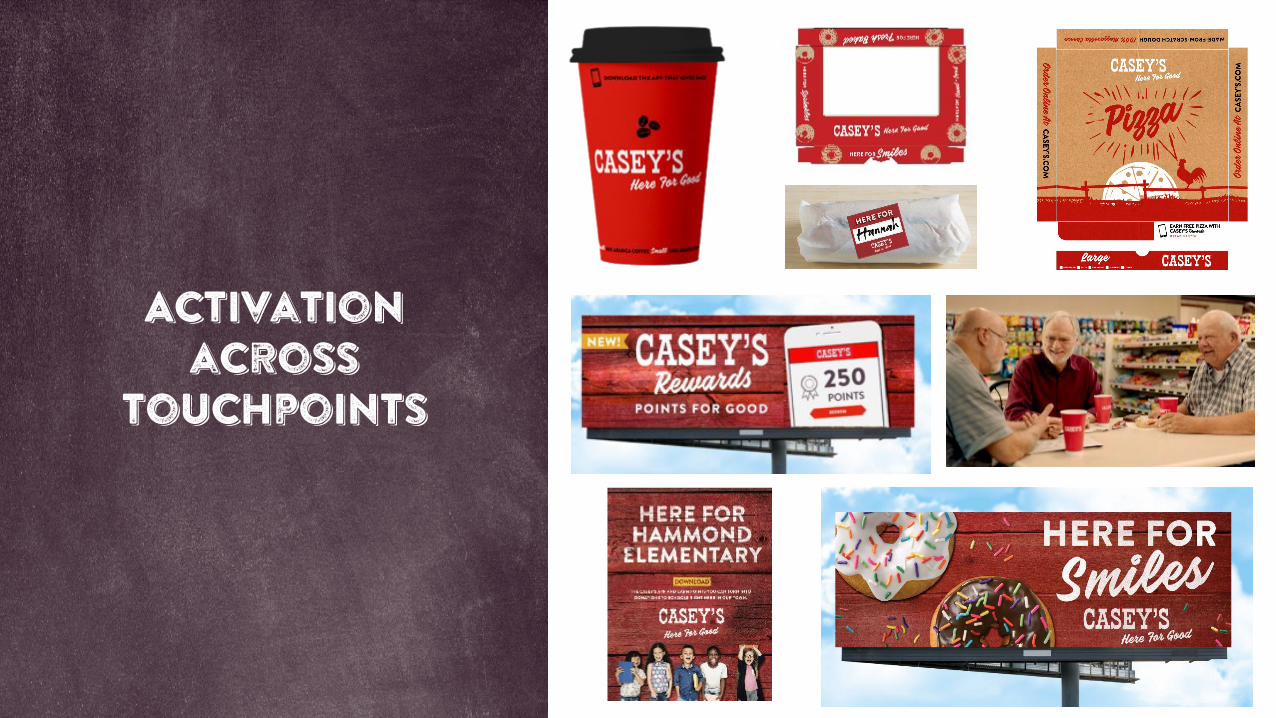
Activation across
touchpoints

Playing a Unique role in communities
44
Growing guest relevance
ENHANCING THE CASEY’S BRAND
DRIVING INDUSTRY-LEADING DIGITAL ENGAGEMENT
POWERED BY INSIGHTS & ANALYTICS
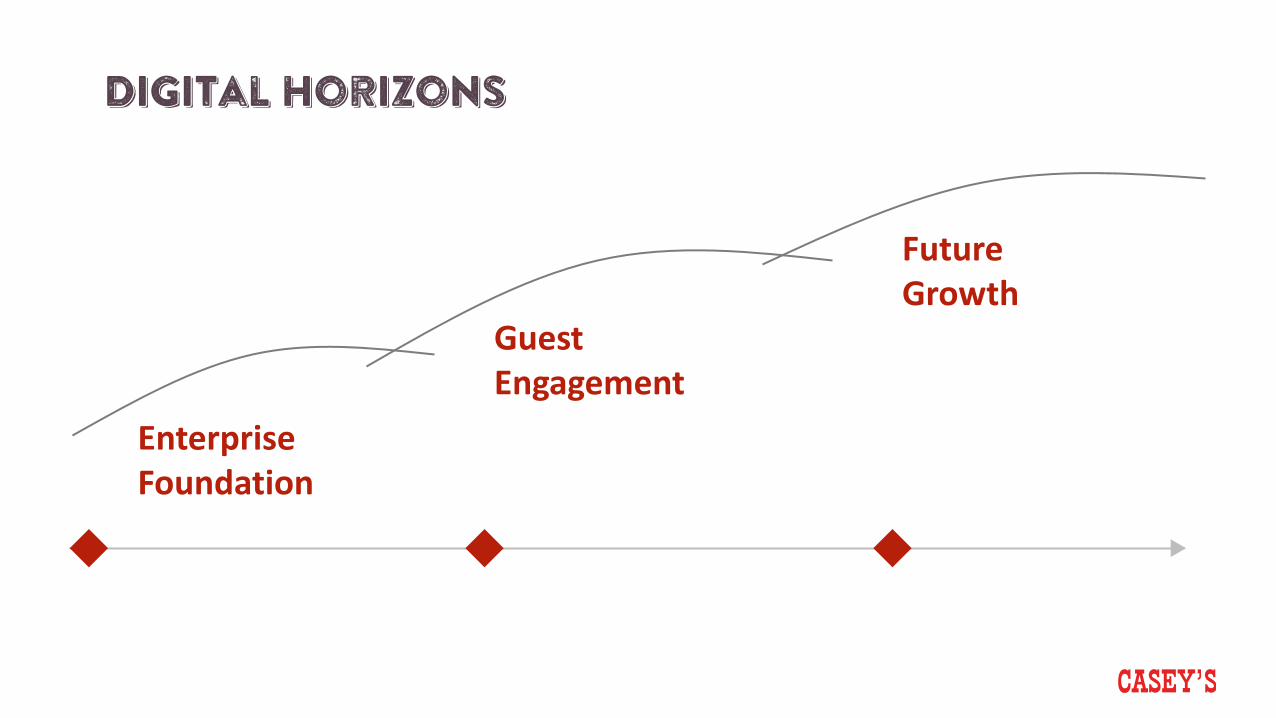
Digital horizons
Enterprise Foundation
Future Growth
Guest Engagement
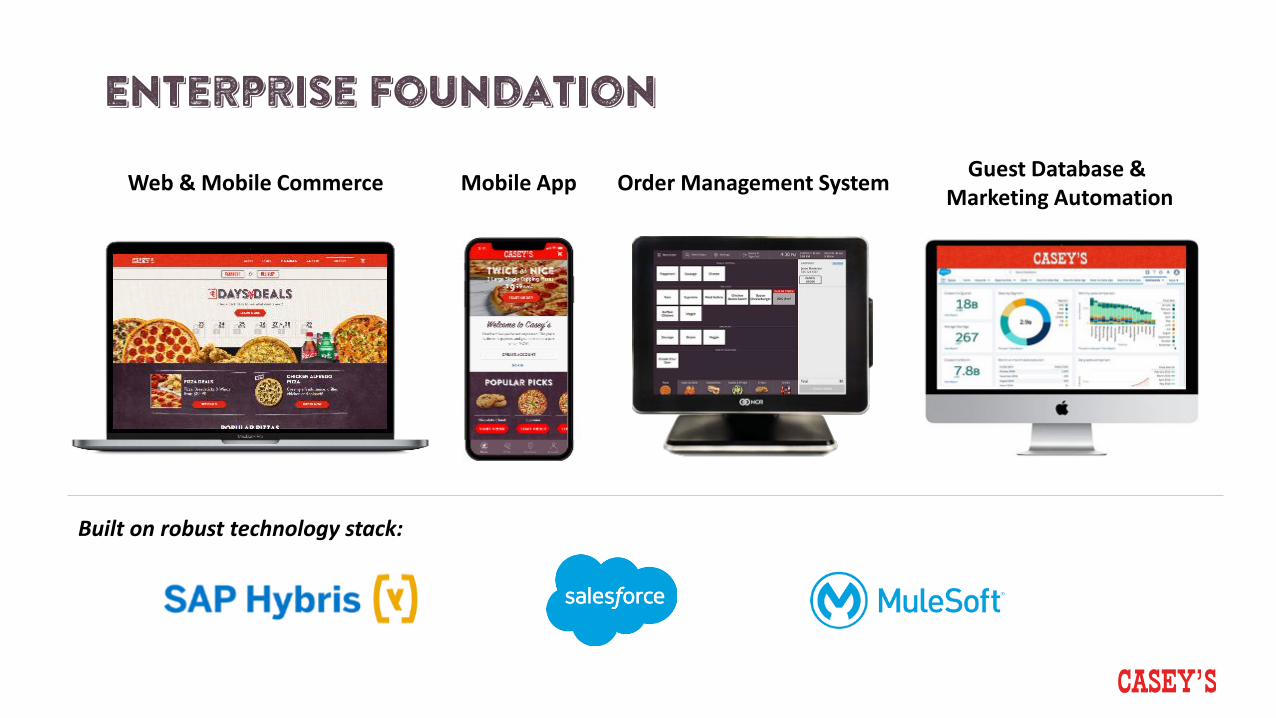
Enterprise foundation
Web & Mobile Commerce Mobile App Order Management System Guest Database & Marketing Automation
Built on robust technology stack:
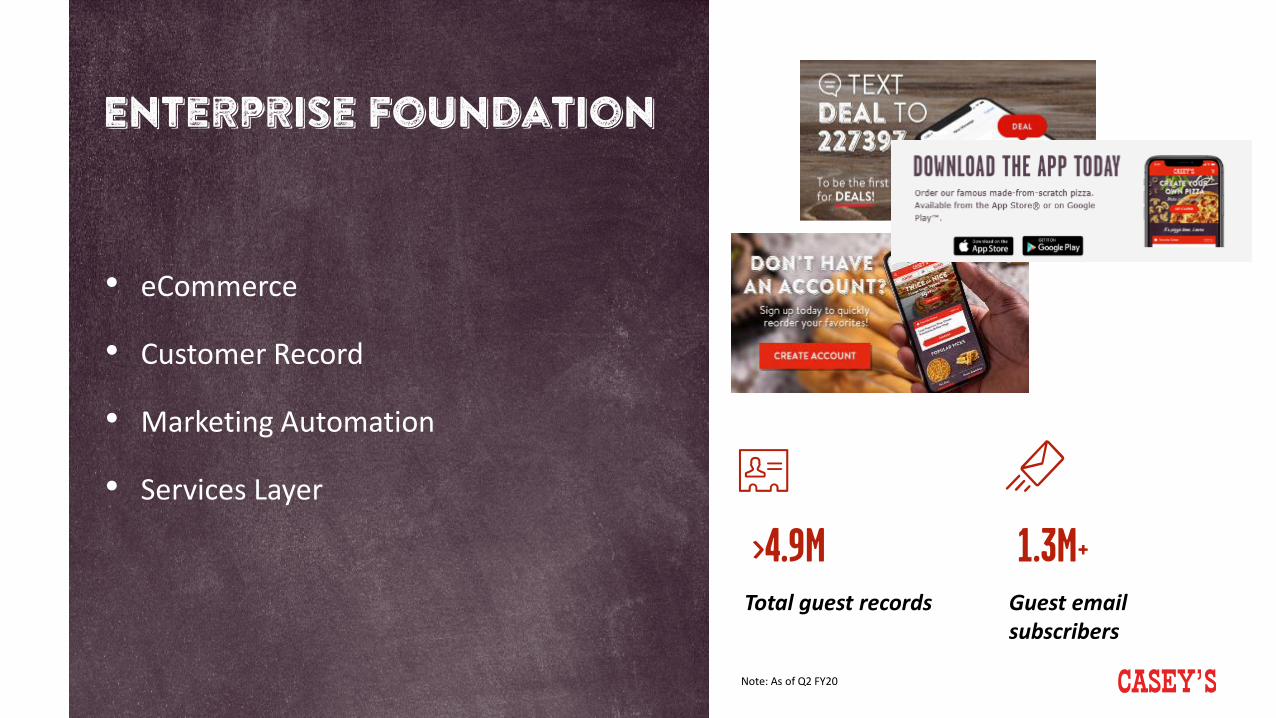
Enterprise foundation
• eCommerce
• Customer Record
• Marketing Automation
• Services Layer
Guest email subscribers
1.3M+Total guest records
>4.9M
Note: As of Q2 FY20

Guest engagement
• Casey’s Rewards
• Promotional Activation
• Segmentation and Targeted Experiences
• Guest Acquisition

Deepening loyalty with Casey's rewards
• 1:1 Engagement
• One-of-a-kind Guest Engagement
• Guest insights to drive enterprise
• Food-forward
• A program that will evolve

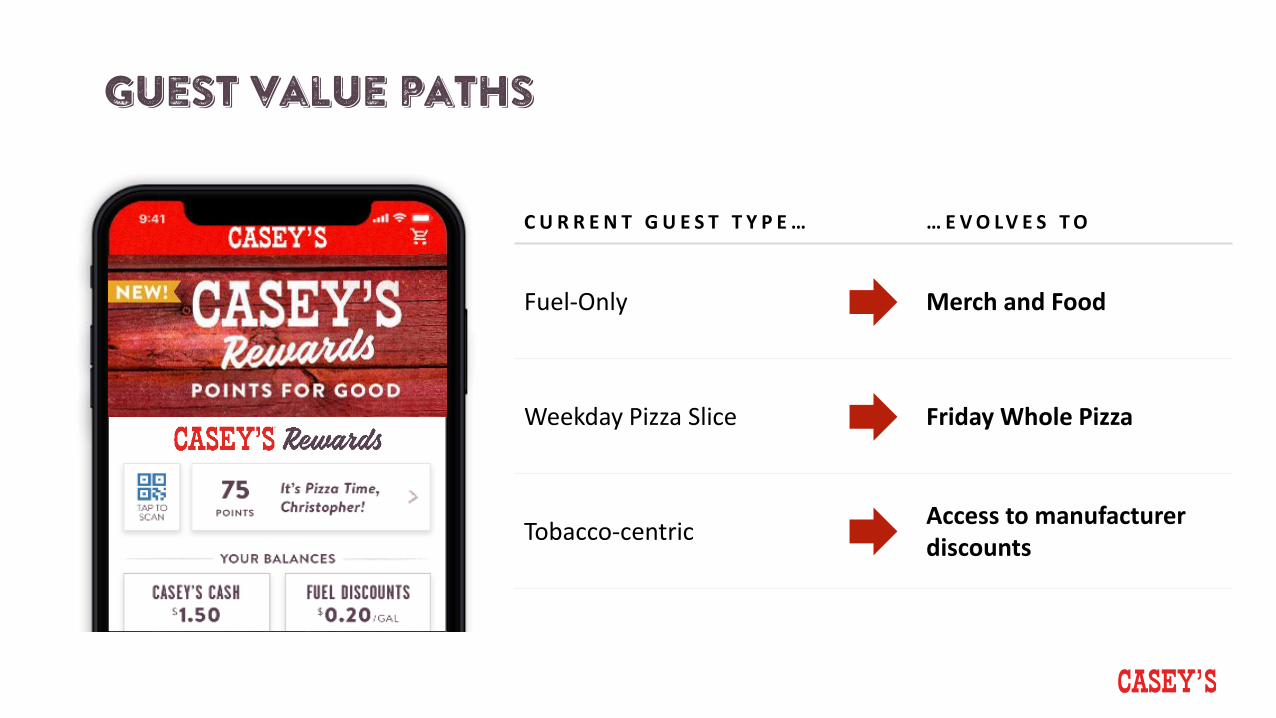
Guest value paths
C U R R E N T G U E S T T Y P E … … E V O LV E S T O
Fuel-Only Merch and Food
Weekday Pizza Slice Friday Whole Pizza
Tobacco-centric Access to manufacturer discounts

Future growth
• Third Party Delivery
• Accelerate customized Food
• New Convenience
• New Services
… enabled and accelerated by Casey’s Enterprise Digital Foundation
Bulk delivery
Curbside, rapid pick-up
In-store kiosk
3rd party delivery

Digital horizons
Enterprise Foundation• eCommerce• Customer Record• Marketing Automation• Services Layer
Future Growth• Third Party Delivery• Curbside/Rapid Pick-Up• Bulk goods delivery to
Guests
Guest Engagement• Rewards• Targeted Experiences• Segmentation• Optimized promotion

Growing guest relevance
ENHANCING THE CASEY’S BRAND
DRIVING INDUSTRY-LEADING DIGITAL ENGAGEMENT
POWERED BY INSIGHTS & ANALYTICS
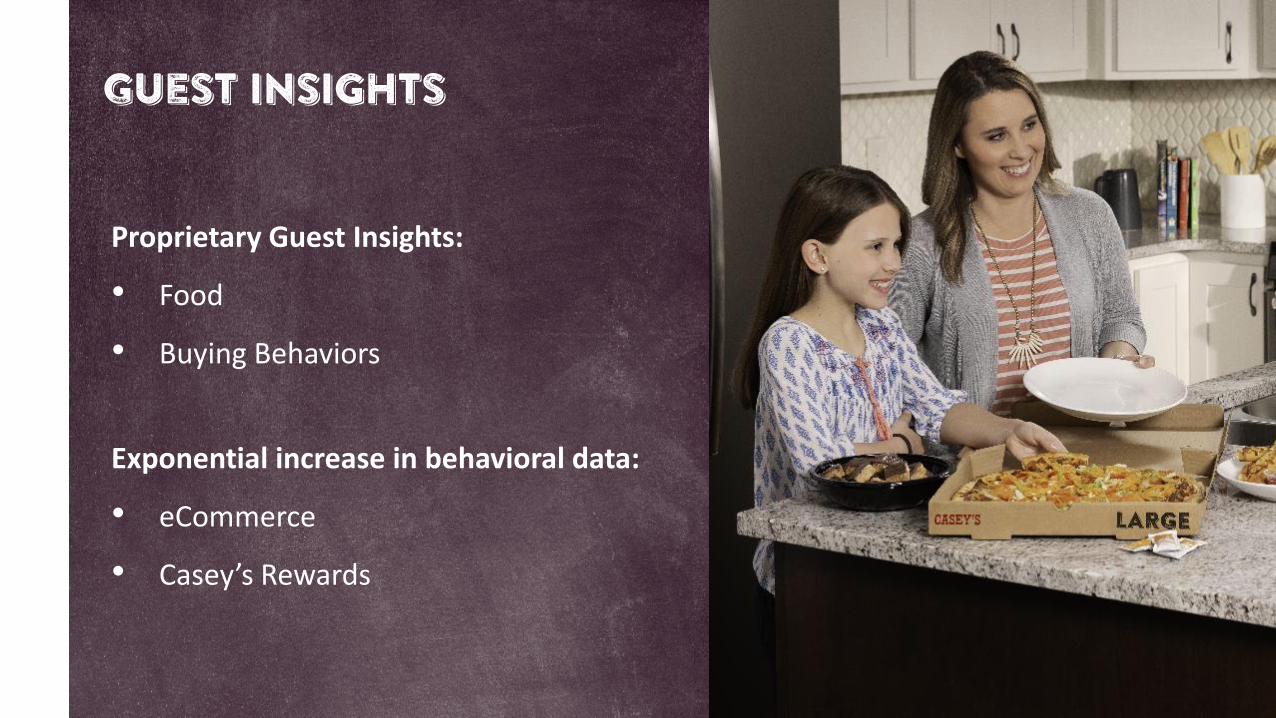
Guest insights
Proprietary Guest Insights:
• Food
• Buying Behaviors
Exponential increase in behavioral data:
• eCommerce
• Casey’s Rewards

Enterprise analytics
• Digital platform
• Fuel pricing
• Price optimization
• Store performance
Core Business Enhancement• Promotion optimization
• Store network and site selection
• Assortment
• Guest programs
• Predictive tools for products & services
Scaling Impact
Driving performance
Same-Store Sales Growth• Casey’s Rewards• Tobacco offers• Targeted offers• Third party delivery• New digital services
Gross Margin Expansion• eCommerce• Guest analytics• Targeted offers
Operational Efficiencies
Accelerate Unit Growth
Deliver Top Quintile EBITDA Growth

Tom brennanSVP & Chief Merchandising Officer

Exceeding OUR GUESTS’
expectationsDelicious Food & Beverage On-the-Go
Favorite & New Items Always Available
Affordable Choices
Digital Connectivity
Compelling Store Experience
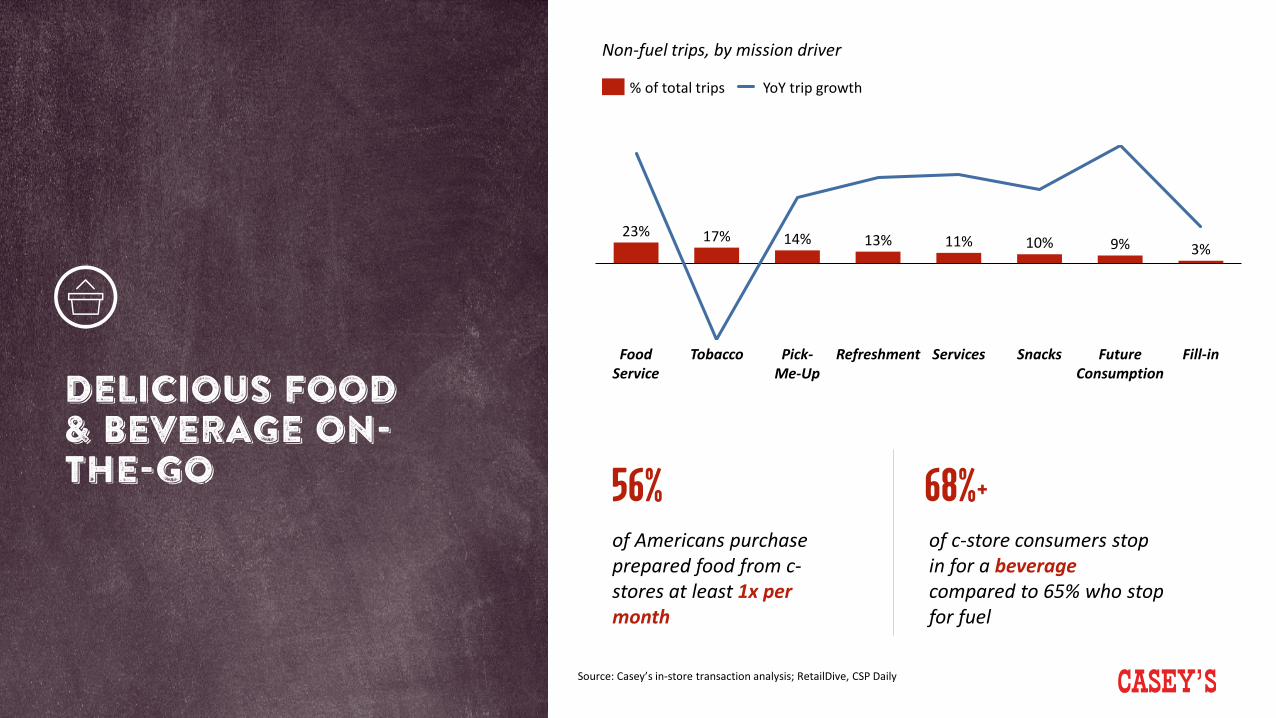
of Americans purchase prepared food from c-stores at least 1x per month
56%of c-store consumers stop in for a beverage compared to 65% who stop for fuel
68%+
Source: Casey’s in-store transaction analysis; RetailDive, CSP Daily
DELICIOUS FOOD & BEVERAGE ON-THE-GO
Non-fuel trips, by mission driver
23% 17% 14% 13% 11% 10% 9% 3%
Fill-inFood Service
Tobacco Pick-Me-Up
Future Consumption
SnacksServicesRefreshment
% of total trips YoY trip growth

Equity ofCasey’s food
PROGRAM
Casey’s ranked # 1 in prepared food:
#1 #2 #3 #4 #5
Source: Casey’s target consumer survey; NACS 2019 SOI Study
33%23%
41%34%
FOOD % OF INSIDE REVENUE: INSIDE MARGIN %
Industry AverageCasey’sCasey’s Industry Average
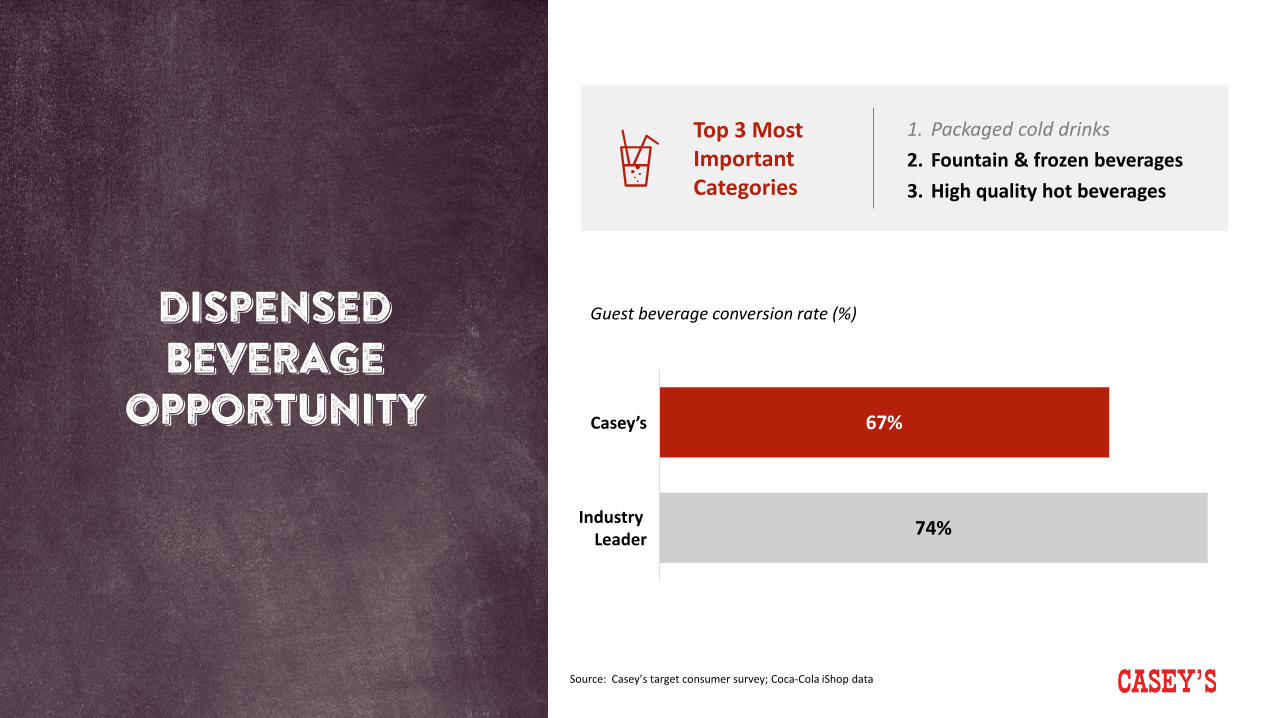
DISPENSED BEVERAGE
OPPORTUNITY
Top 3 Most Important Categories
1. Packaged cold drinks2. Fountain & frozen beverages3. High quality hot beverages
Guest beverage conversion rate (%)
Source: Casey’s target consumer survey; Coca-Cola iShop data
67%
74%
Casey’s
Industry Leader

RESTAURANT MINDSET FOR INNOVATION, QUALITY & CONSISTENCY
• Experienced restaurant talent to lead food service team
• Culinary innovation process & pipeline
• Refreshed, expanded dispensed beverage program
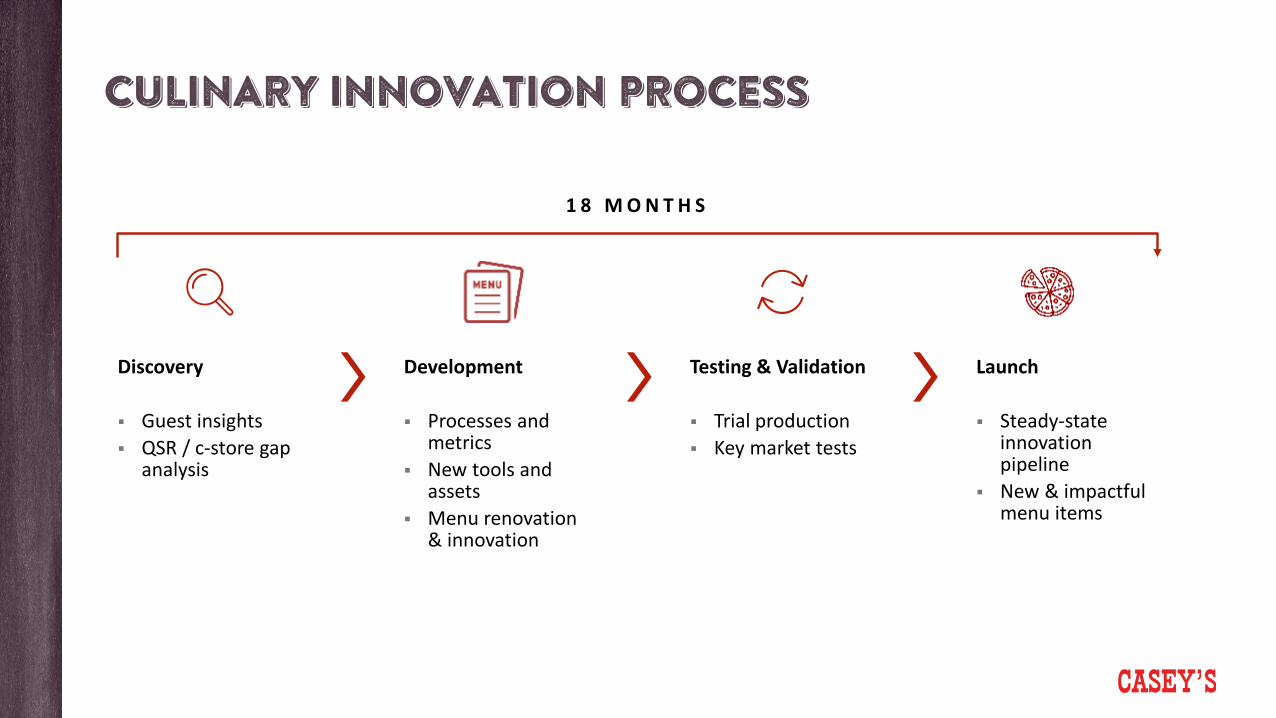
CULINARY INNOVATION PROCESS
1 8 M O N T H S
Development
Processes and metrics
New tools and assets
Menu renovation & innovation
Discovery
Guest insights QSR / c-store gap
analysis
Launch
Steady-state innovation pipeline
New & impactful menu items
Testing & Validation
Trial production Key market tests
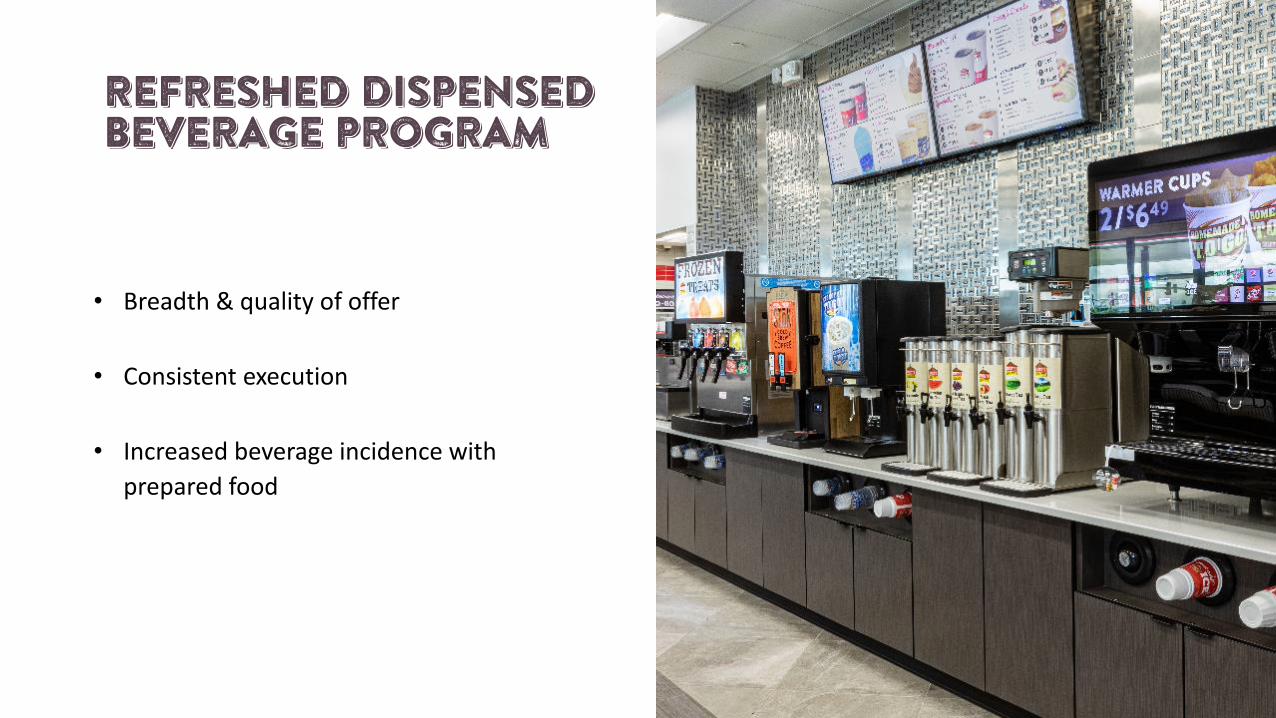
REFRESHED DISPENSED BEVERAGE PROGRAM
• Breadth & quality of offer
• Consistent execution
• Increased beverage incidence with prepared food

Affordable choices
Casey’s has been able to sustain a price differential vs. competitors:
A wider assortment of affordable choices will improve our value proposition for more guests:
1/3 of Casey’s guests have incomes below $50K/year
Low-income households have declining discretionary income
-16%Discretionary income decrease 2007 - 2016
avg. pizza price vs. $5.99 - $8.99$9.99 - $11.99
Source: CMV Brand Study, Casey’s target consumer survey
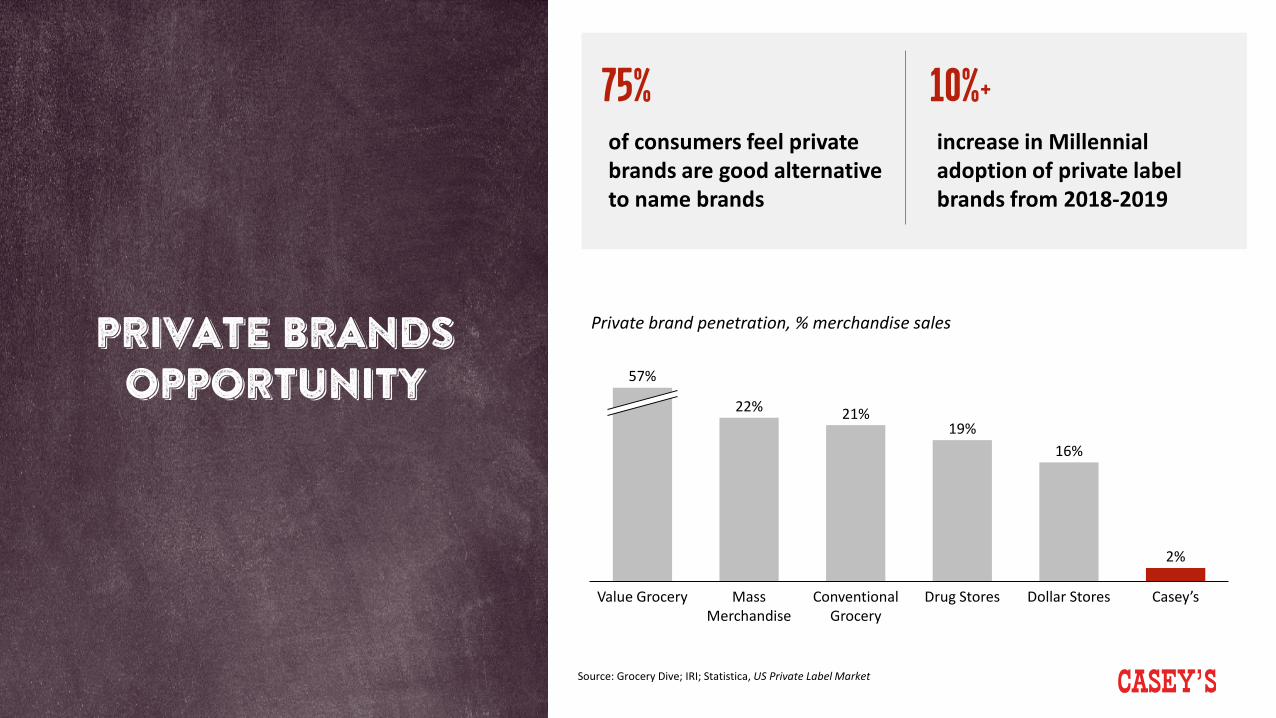
PRIVATE BRANDS OPPORTUNITY
increase in Millennial adoption of private label brands from 2018-2019
10%+of consumers feel private brands are good alternative to name brands
75%
Source: Grocery Dive; IRI; Statistica, US Private Label Market
22% 21%19%
16%
2%
Drug StoresValue Grocery Dollar StoresMass Merchandise
Conventional Grocery
Casey’s
57%
Private brand penetration, % merchandise sales

Private brands expansion
• Renewed private brand strategy
• Expanded breadth and depth
• Improved quality
• Affordable price points
• Enhanced margins
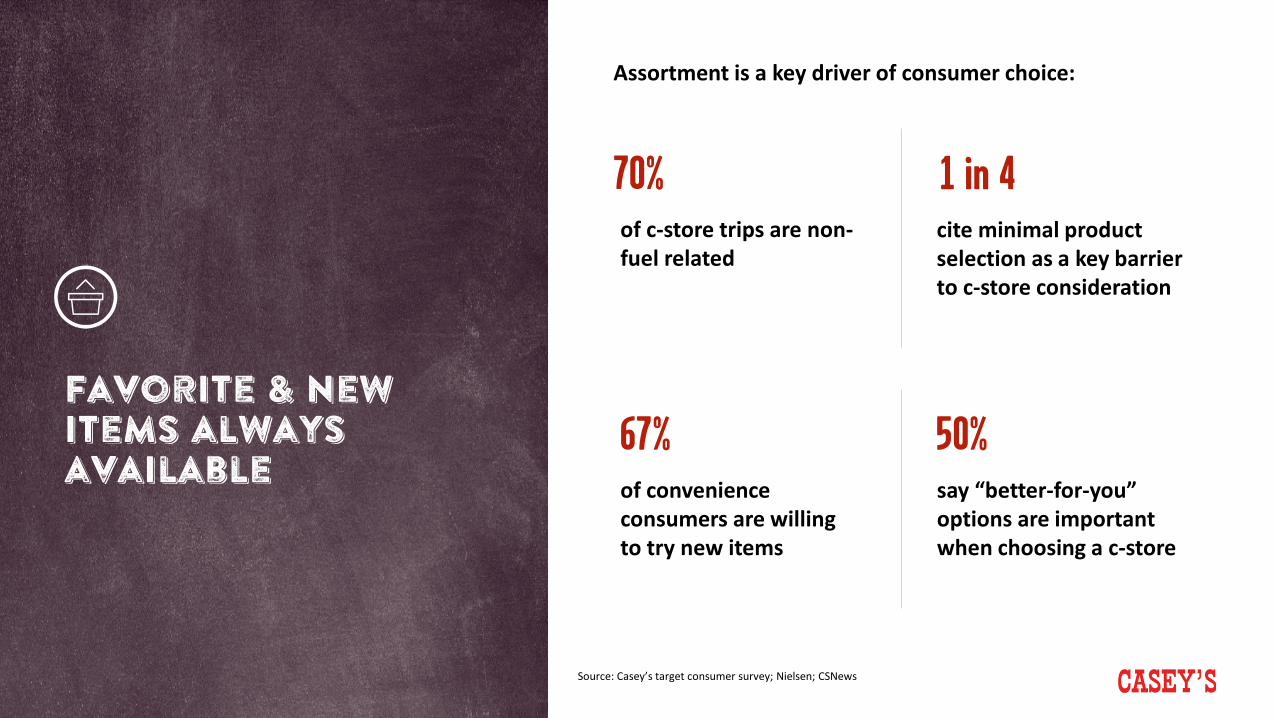
Assortment is a key driver of consumer choice:
Source: Casey’s target consumer survey; Nielsen; CSNews
of convenience consumers are willing to try new items
67%
cite minimal product selection as a key barrier to c-store consideration
1 in 4
say “better-for-you” options are important when choosing a c-store
50%
of c-store trips are non-fuel related
70%
Favorite & new items always available
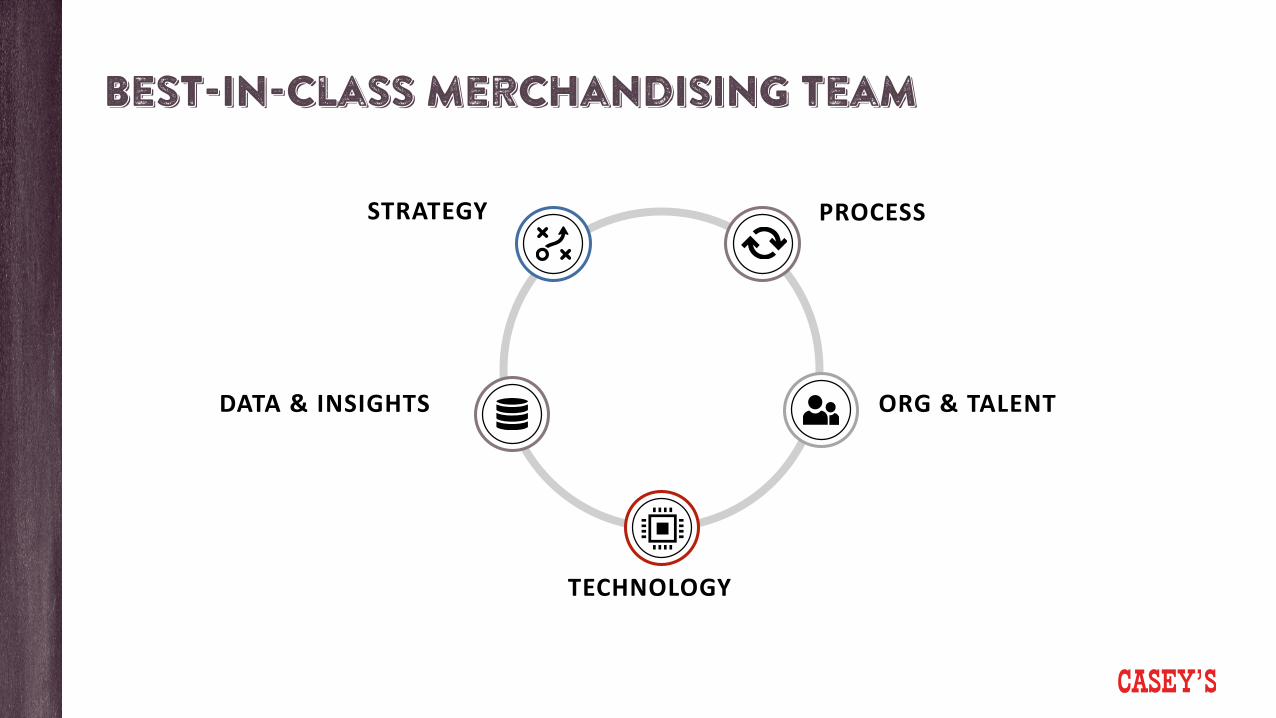
Best-in-class merchandising team
STRATEGY
DATA & INSIGHTS ORG & TALENT
PROCESS
TECHNOLOGY

Same-Store Sales Growth• Culinary innovation
pipeline• Dispensed beverage• Assortment breadth &
depth
Gross Margin Expansion• Private brands
Operational Efficiencies• Rationalized menu• Simplified kitchen
Accelerate Unit Growth
Deliver Top Quintile EBITDA Growth
Driving performance

Create capacity through efficiencies

Jay soupeneSenior VP, Operations

Evolving our strategy
ACCELERATE UNIT GROWTH
Invest in our talent
REINVENT THE GUEST EXPERIENCE
Contemporize our food proposition, optimize & localize assortment, and
deliver compelling experiences
Accelerate our new store builds and acquisitions, including market
and store format expansion
Create a culture that drives performance and exceeds guests’ expectations
Deliver top quintile EBITDA growth
Create capacity through efficiencies
Drive efficiencies to improve the shape of the business and fund
future growth
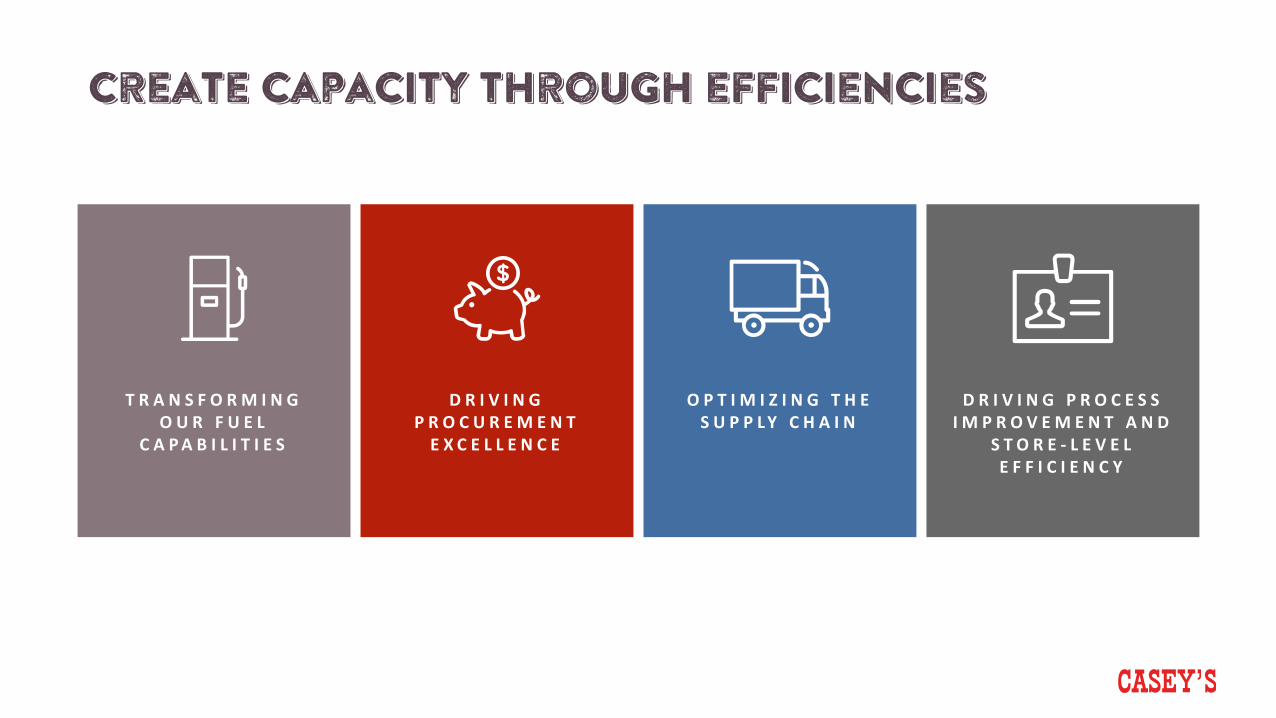
Create capacity through efficiencies
T R A N S F O R M I N G O U R F U E L
C A P A B I L I T I E S
D R I V I N G P R O C U R E M E N T
E X C E L L E N C E
O P T I M I Z I N G T H E S U P P L Y C H A I N
D R I V I N G P R O C E S S I M P R O V E M E N T A N D
S T O R E - L E V E L E F F I C I E N C Y
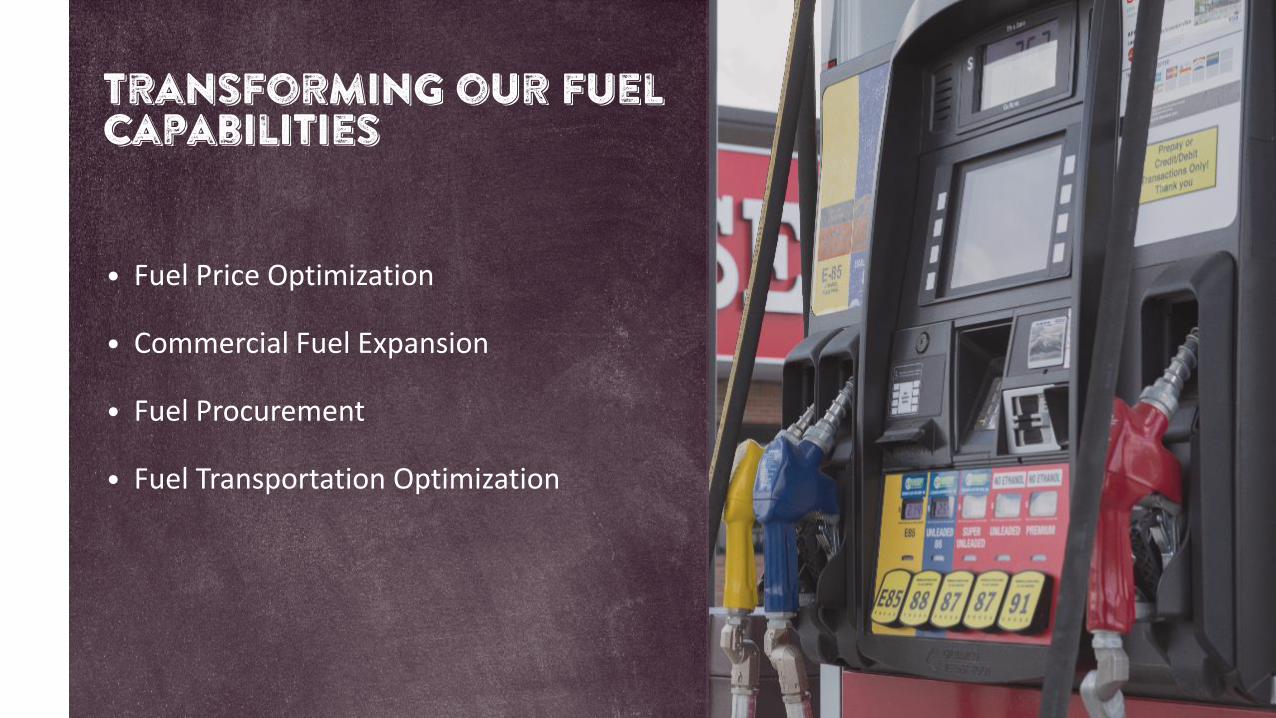
Transforming our fuel capabilities
• Fuel Price Optimization
• Commercial Fuel Expansion
• Fuel Procurement
• Fuel Transportation Optimization

Transforming our fuel capabilities
C A S E Y ’ S F U E L B Y T H E N U M B E R S :
6.5Mper day
2.4Bper year
G A L L O N S S O L D
1.2Kper day
75%owned fleet
F U E L D E L I V E R I E S
295drivers
110+trucks
C A S E Y ’ S F L E E T
55suppliers
180terminals
F U E L S U P P L I E R S
4%FY19
37%FY20 Q2
G A L L O N S U N D E R C O N T R A C T
50%FY21+ EST.
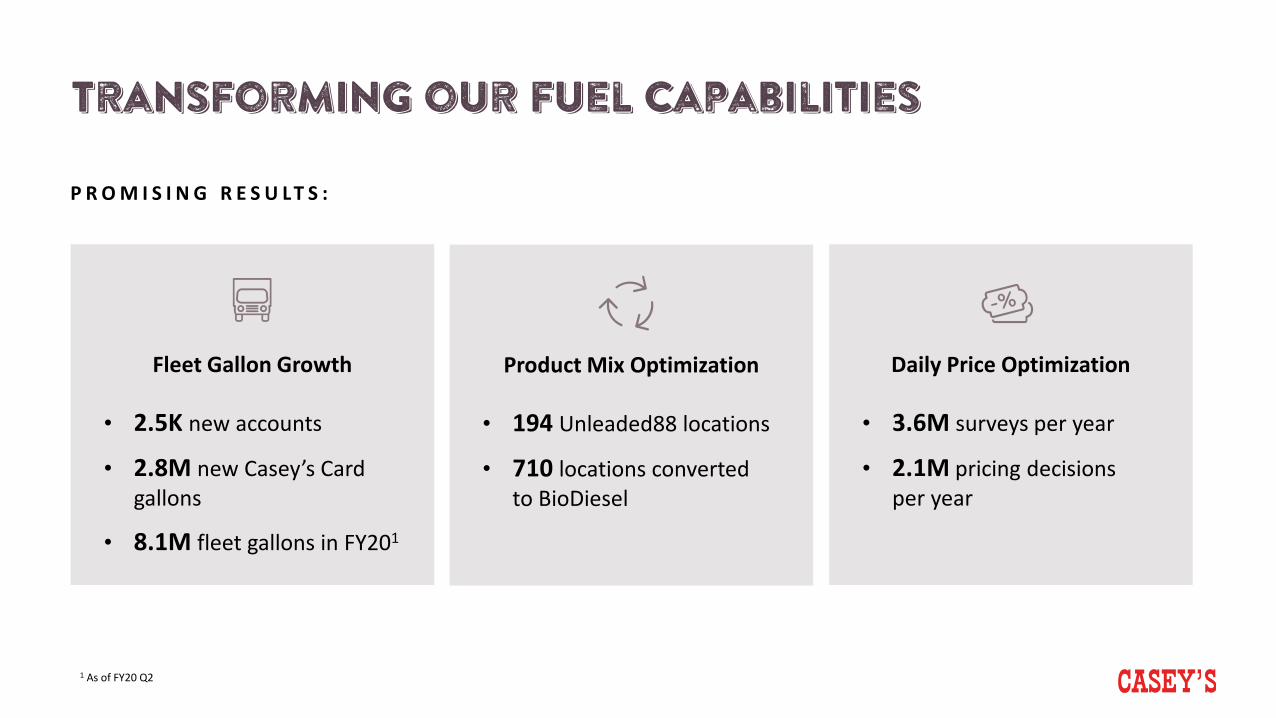
Transforming our fuel capabilities
P R O M I S I N G R E S U LT S :
Daily Price Optimization
• 3.6M surveys per year
• 2.1M pricing decisions per year
Product Mix Optimization
• 194 Unleaded88 locations
• 710 locations converted to BioDiesel
Fleet Gallon Growth
• 2.5K new accounts
• 2.8M new Casey’s Card gallons
• 8.1M fleet gallons in FY201
1 As of FY20 Q2

S A M E S T O R E G A L L O N SSame-store fuel gallons, % change
A V E R A G E M A R G I NAverage fuel margin, CPG
F U E L G R O S S P R O F I TYoY change in fuel gross profit, $000s and %
2.1% 2.3%
FY17 FY18 FY19 LTM1
(2.9%)
(1.7%)
18.4 18.520.3
22.1
FY17 FY18 FY19 LTM1
$86,719
(1%)
15%
FY17 FY18
8%
LTM1FY19
20%
(3,312)
$28,464
$59,296
1 Last 12 months ended October 31, 2019
I M P A C T O N P E R F O R M A N C E :
Transforming our fuel capabilities

Transforming our fuel capabilities
FROM… TO…
• Decentralized pricing program
• Single pronged fuel buying
• Constrained processes
• Centralized price optimization
• Diversified supply strategy
• Dynamic org & capabilities

Operating Expenses
Capital Expenditure
Driving Procurement
Excellence
Store Construction& Maintenance
Fleet & LightDuty Vehicles
Information Technology
Grocery &Other Merchandise
Food Ingredients
Food & Packaging
Health Insurance
Utilities
Marketing
Cost of Goods Sold
K E Y S P E N D C A T E G O R I E SIllustrative depiction of relative spend

Driving Procurement Excellence
CURRENT-STATE: FUTURE-STATE:
• $2.7B spend across COGS, CapEx, OpEx
• Decentralized processes
• Under-leverage of Casey’s size and scale
• Centralized processes and leveraged scale
• Contemporary, strategic negotiation practices
• Sourcing and spend analytics
• Tools and technologies to enable automation
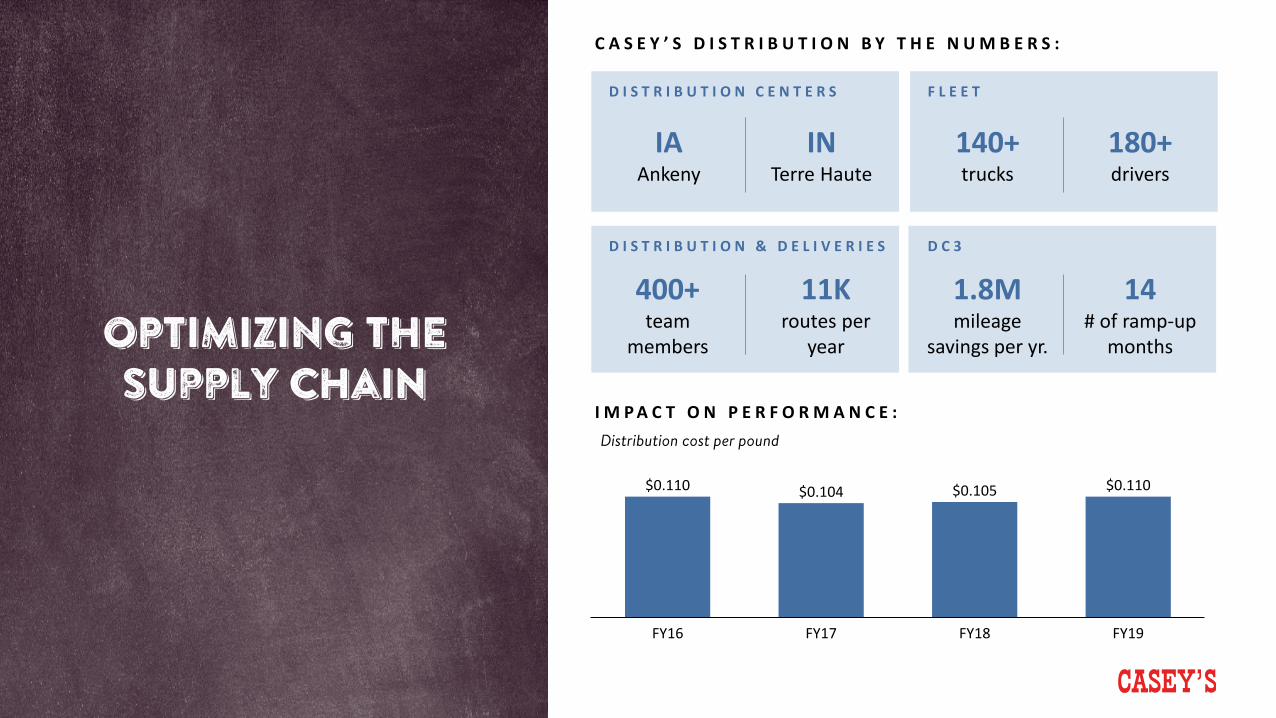
OPTIMIZING THE Supply chain
C A S E Y ’ S D I S T R I B U T I O N B Y T H E N U M B E R S :
IAAnkeny
INTerre Haute
D I S T R I B U T I O N C E N T E R S
140+trucks
180+drivers
F L E E T
400+team
members
D I S T R I B U T I O N & D E L I V E R I E S
11Kroutes per
year
D C 3
I M P A C T O N P E R F O R M A N C E :
$0.110 $0.104 $0.105 $0.110
FY16 FY17 FY18 FY19
Distribution cost per pound
1.8Mmileage
savings per yr.
14# of ramp-up
months

OPTIMIZING THE Supply chain
• Fully integrated grocery supply chain
• Continuous improvement and optimization to support growth
• Right product, right time, right place, as safely and efficiently as possible

DRIVING process improvement and
store-level efficiency
Leadership by the numbers:
• 7 regional managers
• 40+ district managers
• 215+ area supervisors
C A S E Y ’ S S T O R E O P E R A T I O N S
• Tenured and successful teams
• Execute a variety of initiatives to drive performance
• Complexities for the business continue to grow

DRIVING process improvement and store-level efficiency
Elevate In-Store ExecutionCross-functional teams,
analytics and automation to drive performance
Enhance Workforce EfficienciesOptimized workforce based
on demand
Expand Asset ProtectionEnhanced framework for
execution and efficiency gains

Same-Store Sales Growth
Gross Margin Expansion• Fuel capability
enhancement• Centralized procurement• Supply chain efficiency
Operational Efficiencies• Centralized procurement• Supply chain efficiency• Process improvement
Accelerate Unit Growth
Deliver Top Quintile EBITDA Growth
Driving performance

Accelerate unit growth

BRIAN JOHNSONSenior VP, Store Development

Evolving our strategy
Invest in our talent
REINVENT THE GUEST EXPERIENCE
Contemporize our food proposition, optimize & localize assortment, and
deliver compelling experiences
Create a culture that drives performance and exceeds guests’ expectations
Deliver top quintile EBITDA growth
Create capacity through efficiencies
Drive efficiencies to improve the shape of the business and fund
future growth
ACCELERATE UNIT GROWTH
Accelerate our new store builds and acquisitions, including market
and store format expansion
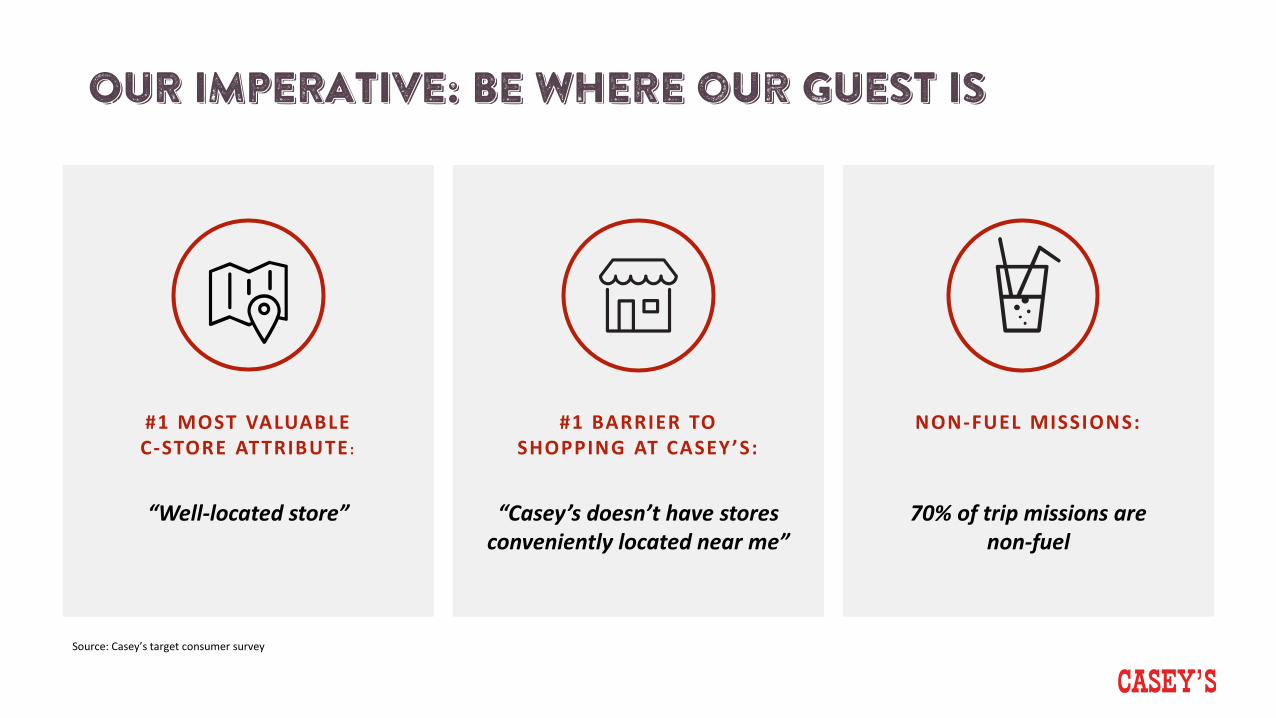
OUR IMPERATIVE: BE WHERE our GUEST IS
#1 MOST VALUABLE C-STORE ATTRIBUTE:
“Well-located store”
#1 BARRIER TO SHOPPING AT CASEY’S:
“Casey’s doesn’t have stores conveniently located near me”
NON-FUEL MISSIONS:
70% of trip missions are non-fuel
Source: Casey’s target consumer survey
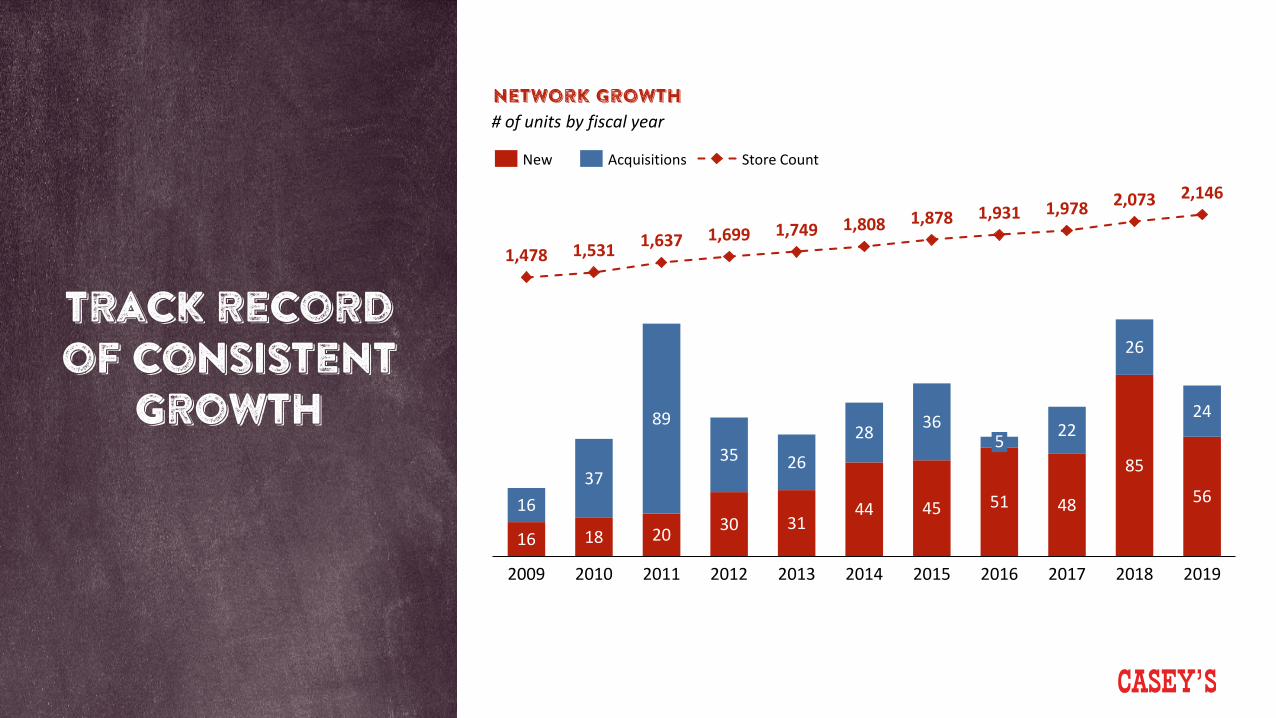
Track record of consistent
growth
Network Growth# of units by fiscal year
16 18 20 30 3144 45 51 48
85
561637
89
35 26
28 36 22
26
24
1,478 1,531 1,637 1,699 1,749 1,808 1,878 1,931 1,978 2,073 2,146
20112009 20132010
5
2012 20152014 2016 2017 2018 2019
New Acquisitions Store Count

New units deliver strong performance
1.21.7
+42%
FUEL GALLONSAnnual average per store; in millions
$1.4$2.0
+43%
INSIDE SALESAnnual average per store; $ in millions
ROIC%1
Annual average per store
1Return on investment is defined as store-level EBITDA / Total Investment. Total investment includes cost of land.2Steady state assumed to reflect maturity of individual store’s operating lifeNote: 377 convenience stores included; based on stores with full 12 months of operations (FY11 and newer)
YR1 STEADY STATE 2
YR1 STEADY STATE 2
YR1 STEADY STATE 2
6.5%
15.5%
+900 bps
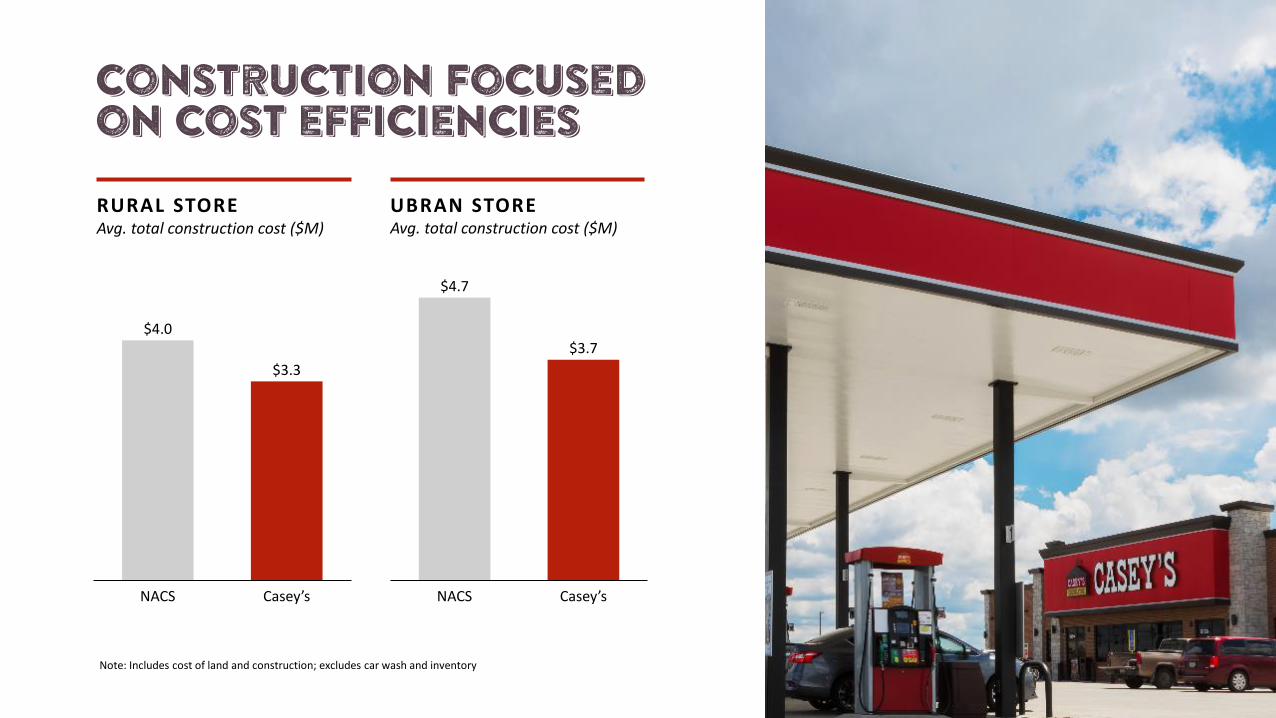
Note: Includes cost of land and construction; excludes car wash and inventory
Construction Focused on cost efficiencies
$4.0
$3.3
Casey’sNACS
$4.7
$3.7
Casey’sNACS
RURAL STOREAvg. total construction cost ($M)
UBRAN STOREAvg. total construction cost ($M)

Targeted expansion
via M&A
Proven Track recordAnnual M&A activity, fiscal year end
16
37
89
3526 28
36
5
22 26 24
20172012 20142009 20132010 2011 2015 2016 2018 2019
Accelerating from 2016-2019 trend via…• Dedicated M&A team• More proactive outreach• Over 400 small operators, 2,500 stores in chains under 100 identified
in our addressable market
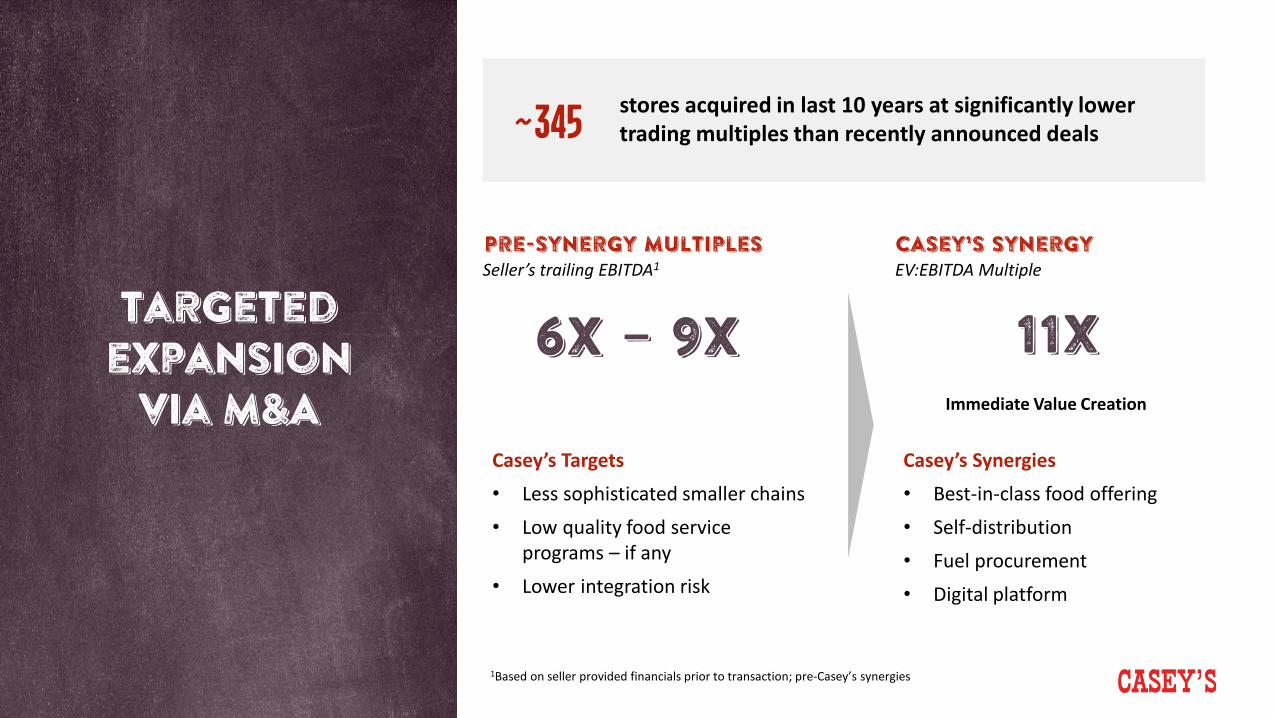
Targeted expansion
via M&A
Pre-synergy multiplesSeller’s trailing EBITDA1
Casey’s Synergy EV:EBITDA Multiple
6x – 9x
Casey’s Synergies• Best-in-class food offering• Self-distribution• Fuel procurement• Digital platform
11XImmediate Value Creation
1Based on seller provided financials prior to transaction; pre-Casey’s synergies
Casey’s Targets• Less sophisticated smaller chains• Low quality food service
programs – if any• Lower integration risk
stores acquired in last 10 years at significantly lower trading multiples than recently announced deals~345
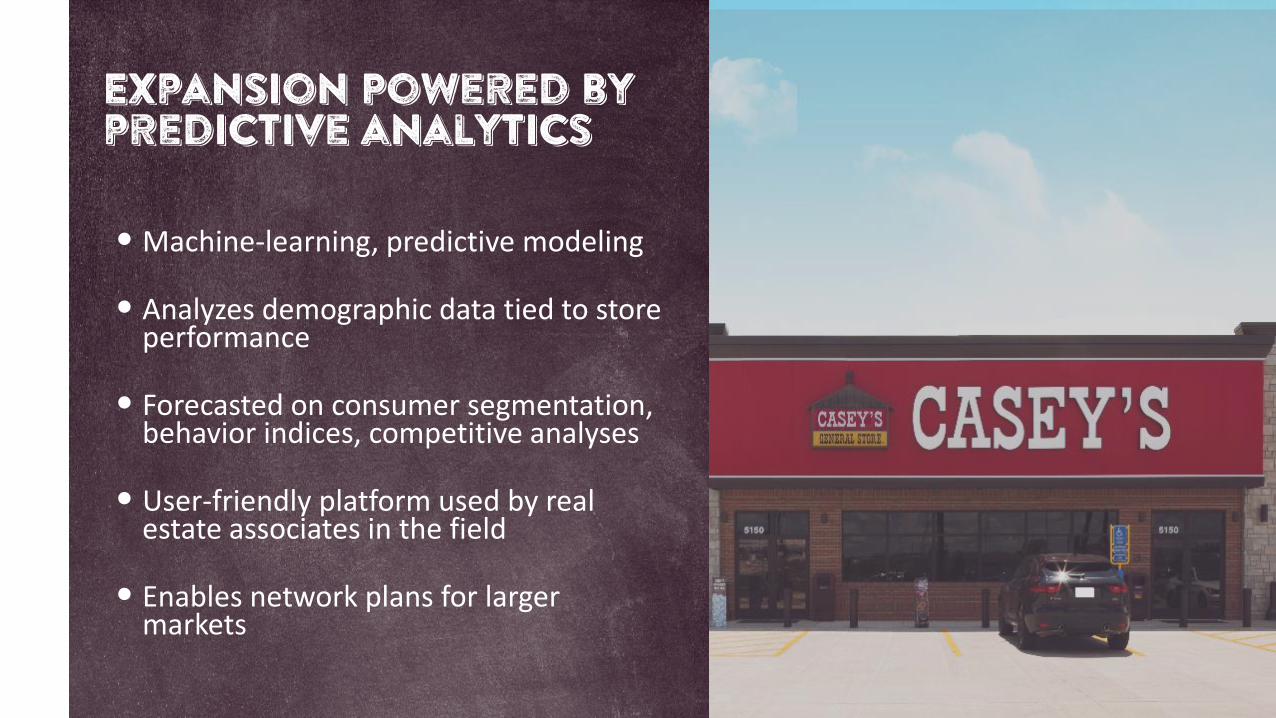
Expansion Powered by predictive analytics
• Machine-learning, predictive modeling
• Analyzes demographic data tied to store performance
• Forecasted on consumer segmentation, behavior indices, competitive analyses
• User-friendly platform used by real estate associates in the field
• Enables network plans for larger markets

Targeting mid-markets
• Demonstrated success
• Reasonable real estate investment costs
• Synergies with field leadership
• Efficient maintenance operations
• Effective media spend
<to insert relevant image>

CURRENT-STATE
Existing location
TERRE HAUTE, INTown of 60,000+ population
Illustrative

Existing location
New Store Location
TERRE HAUTE, INTown of 60,000+ population
Illustrative
Organic growth

Existing location
New Store Location
M&A Target
Targeted acquisitions
TERRE HAUTE, INTown of 60,000+ population
Illustrative
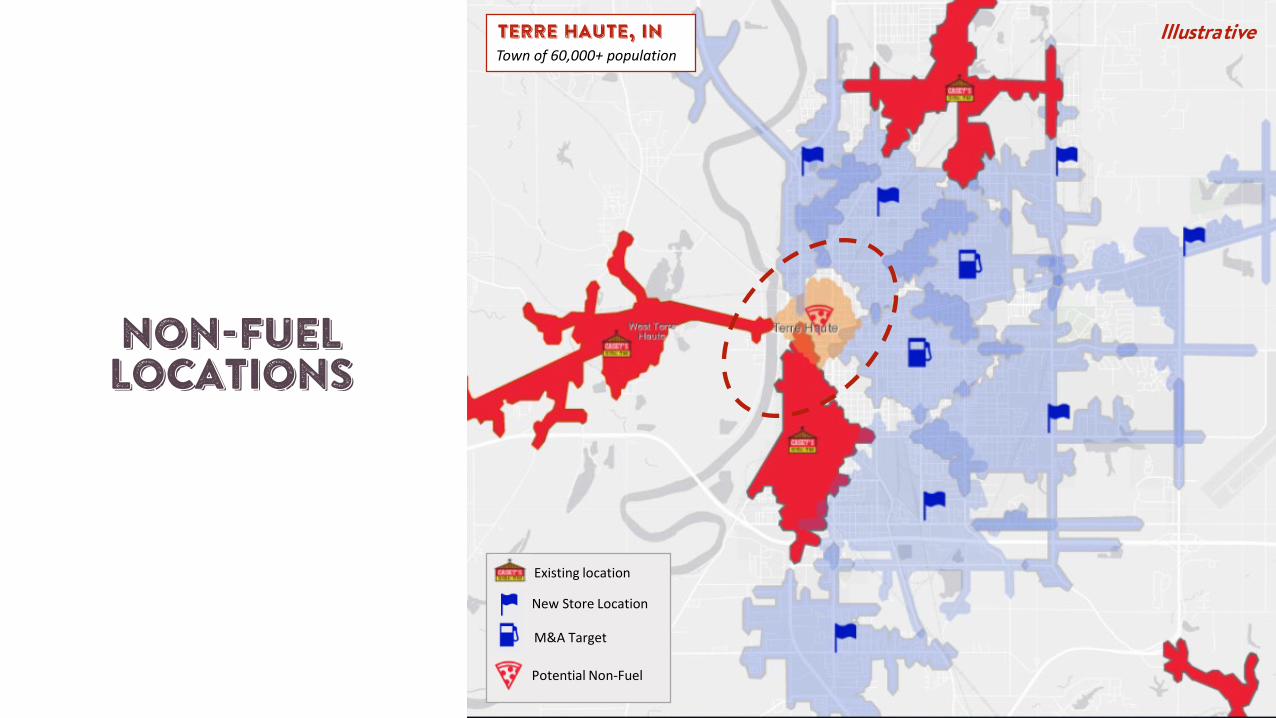
NON-FUEL LOCATIONS
Existing location
New Store Location
M&A Target
TERRE HAUTE, INTown of 60,000+ population
Illustrative
Potential Non-Fuel

STRONG returns today will CONTINUE TO IMPROVE
• Predictive analytics to reduce under-performers
• Reduced construction costs
• New indirect spend procurement capabilities
• Digital guest engagement efforts
• Merchandising & food service enhancements
• Fuel profitability improvements
• Store operations efficiencies
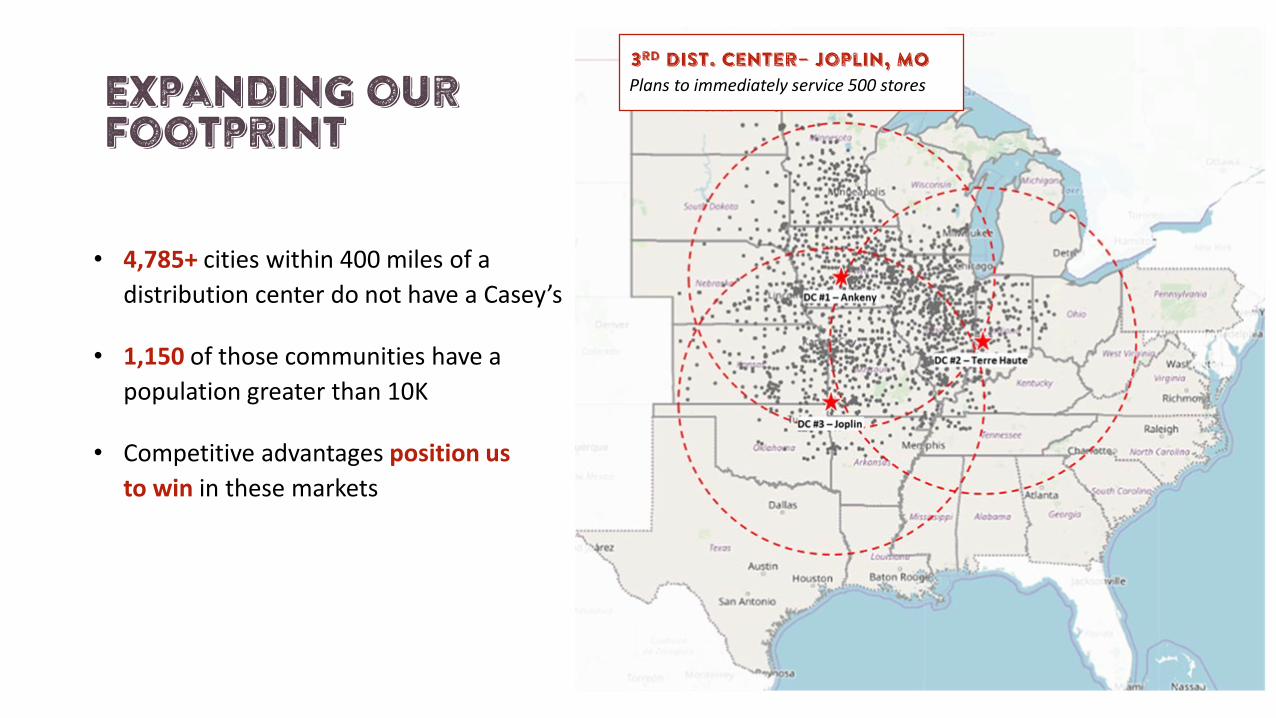
Expanding our Footprint
• 4,785+ cities within 400 miles of a distribution center do not have a Casey’s
• 1,150 of those communities have a population greater than 10K
• Competitive advantages position us to win in these markets
3rd Dist. center– Joplin, MOPlans to immediately service 500 stores
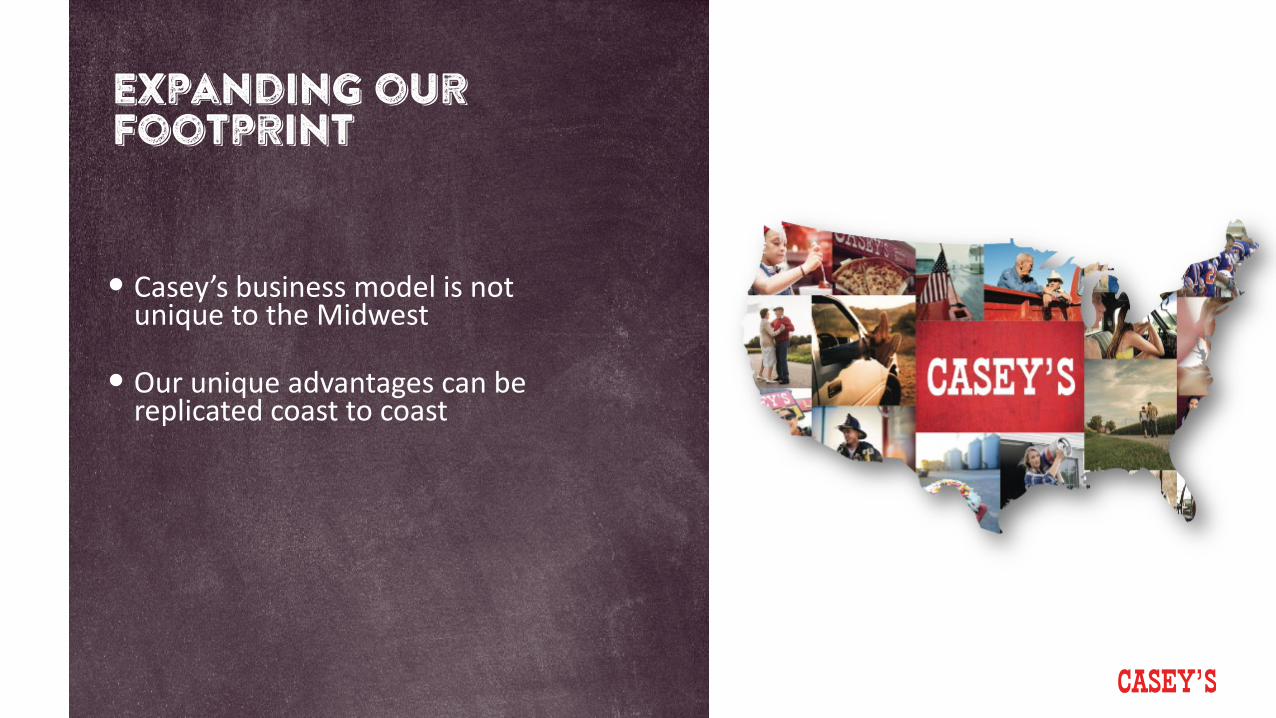
Expanding our Footprint
• Casey’s business model is not unique to the Midwest
• Our unique advantages can be replicated coast to coast
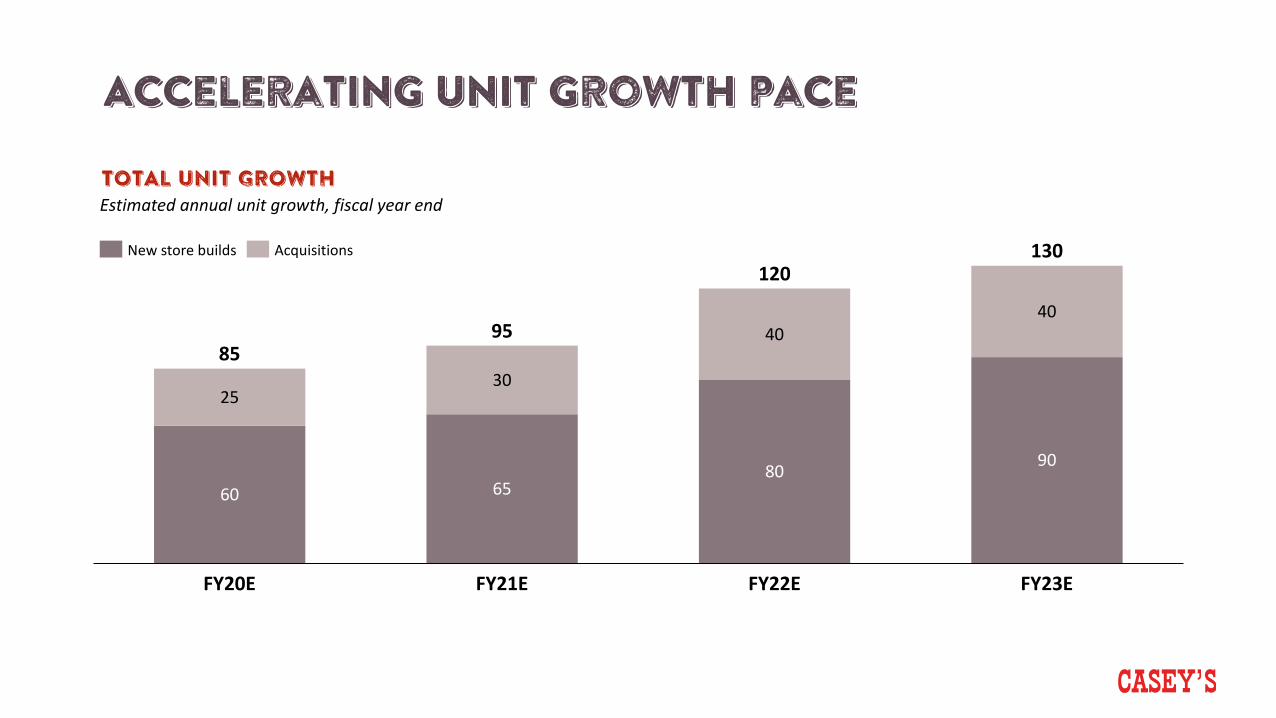
Accelerating unit growth pace
60 6580 90
2530
4040
120
FY20E
85
FY21E
95
FY23EFY22E
130New store builds Acquisitions
TOTAL UNIT GROWTHEstimated annual unit growth, fiscal year end
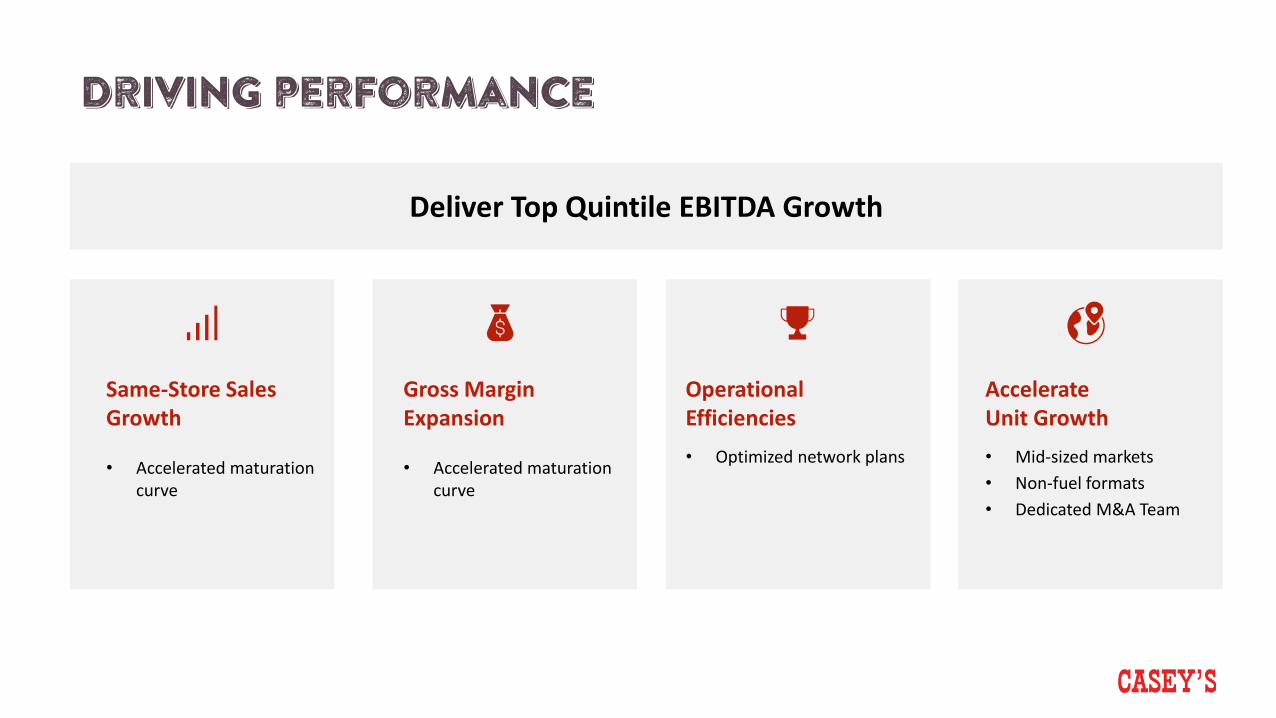
Same-Store Sales Growth
• Accelerated maturation curve
Gross Margin Expansion
• Accelerated maturation curve
Operational Efficiencies• Optimized network plans
Accelerate Unit Growth• Mid-sized markets• Non-fuel formats• Dedicated M&A Team
Deliver Top Quintile EBITDA Growth
Driving performance

Financial long-term outlook

Bill walljasperSVP & Chief Financial Officer
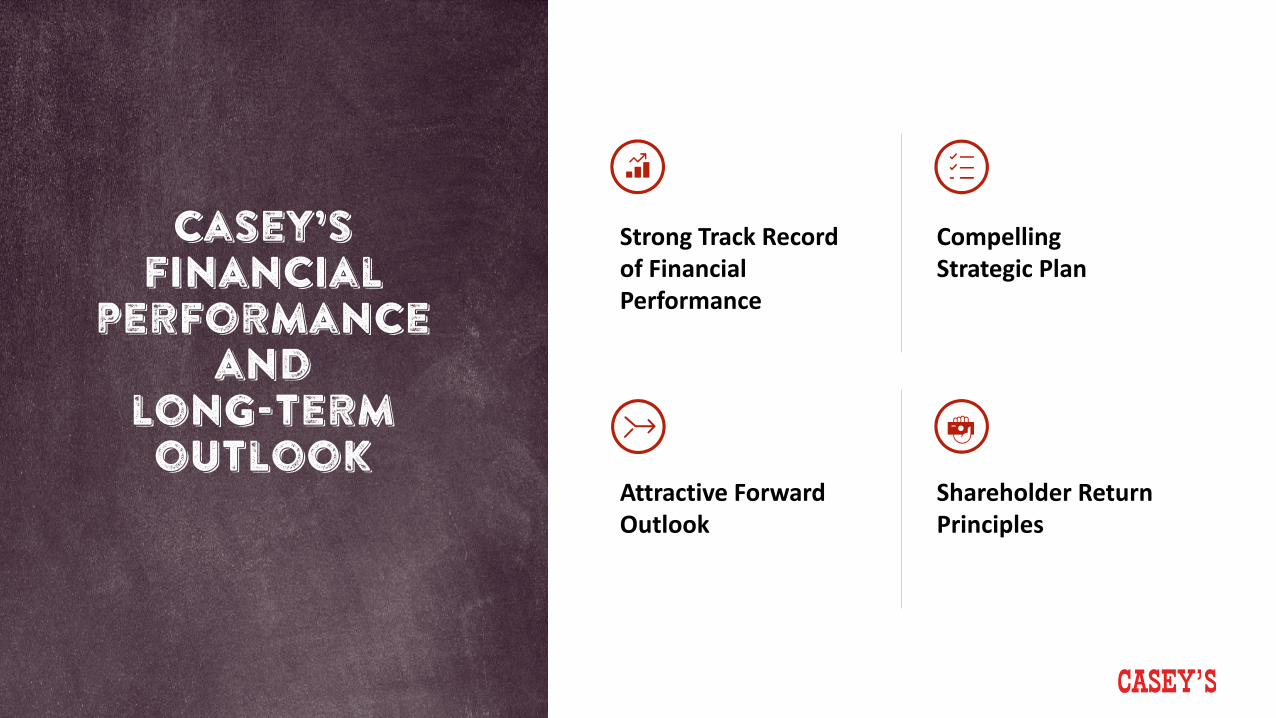
Casey’s financial
performance and
long-term outlook
Strong Track Record of Financial Performance
Compelling Strategic Plan
Attractive Forward Outlook
Shareholder Return Principles
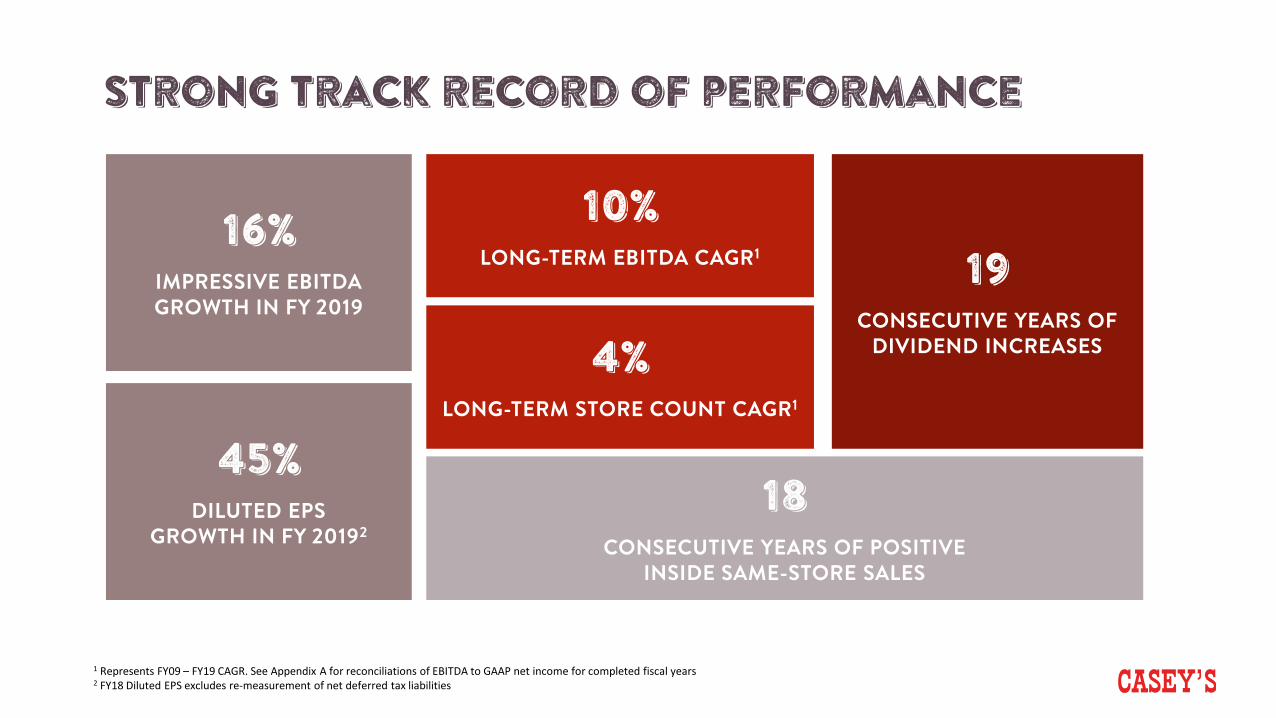
Strong track record of performance
16% IMPRESSIVE EBITDA GROWTH IN FY 2019
10%LONG-TERM EBITDA CAGR1 19
CONSECUTIVE YEARS OF DIVIDEND INCREASES
18CONSECUTIVE YEARS OF POSITIVE
INSIDE SAME-STORE SALES
45% DILUTED EPS
GROWTH IN FY 20192
4% LONG-TERM STORE COUNT CAGR1
1 Represents FY09 – FY19 CAGR. See Appendix A for reconciliations of EBITDA to GAAP net income for completed fiscal years2 FY18 Diluted EPS excludes re-measurement of net deferred tax liabilities
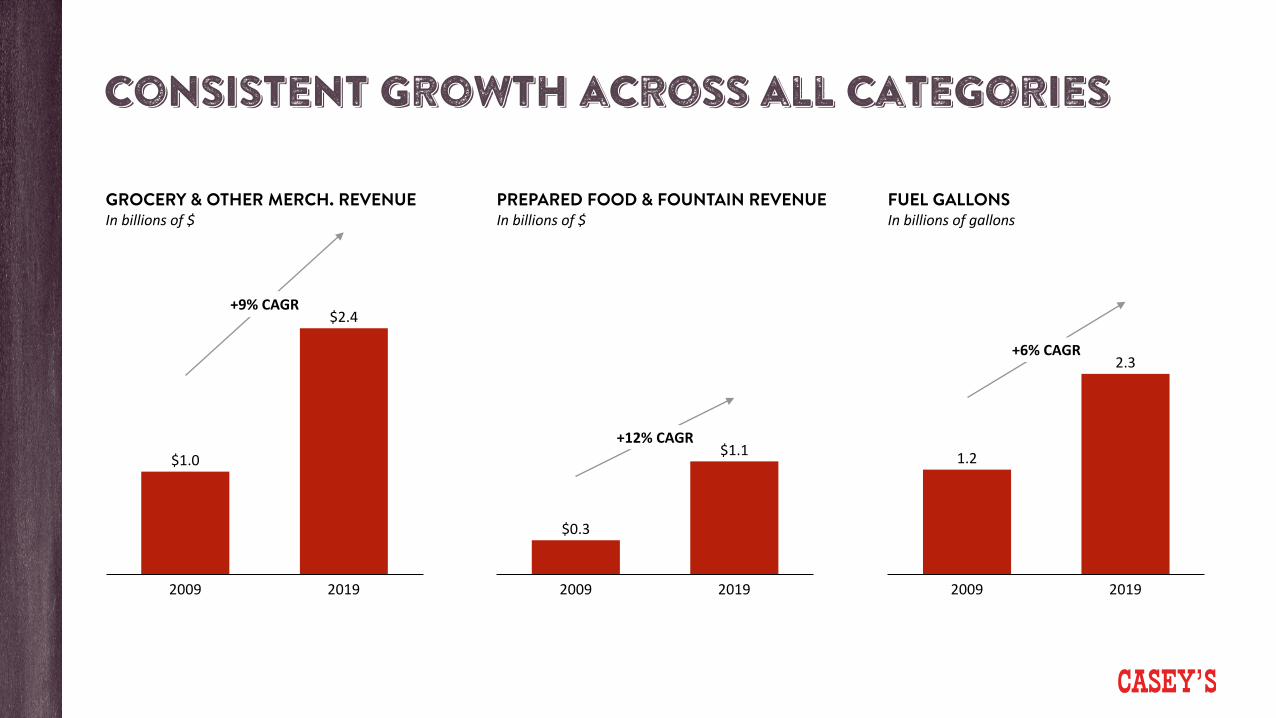
Consistent growth across all categories
GROCERY & OTHER MERCH. REVENUEIn billions of $
PREPARED FOOD & FOUNTAIN REVENUEIn billions of $
FUEL GALLONSIn billions of gallons
$1.0
$2.4
2009 2019
+9% CAGR
$0.3
$1.1
2009 2019
+12% CAGR1.2
2.3
20192009
+6% CAGR
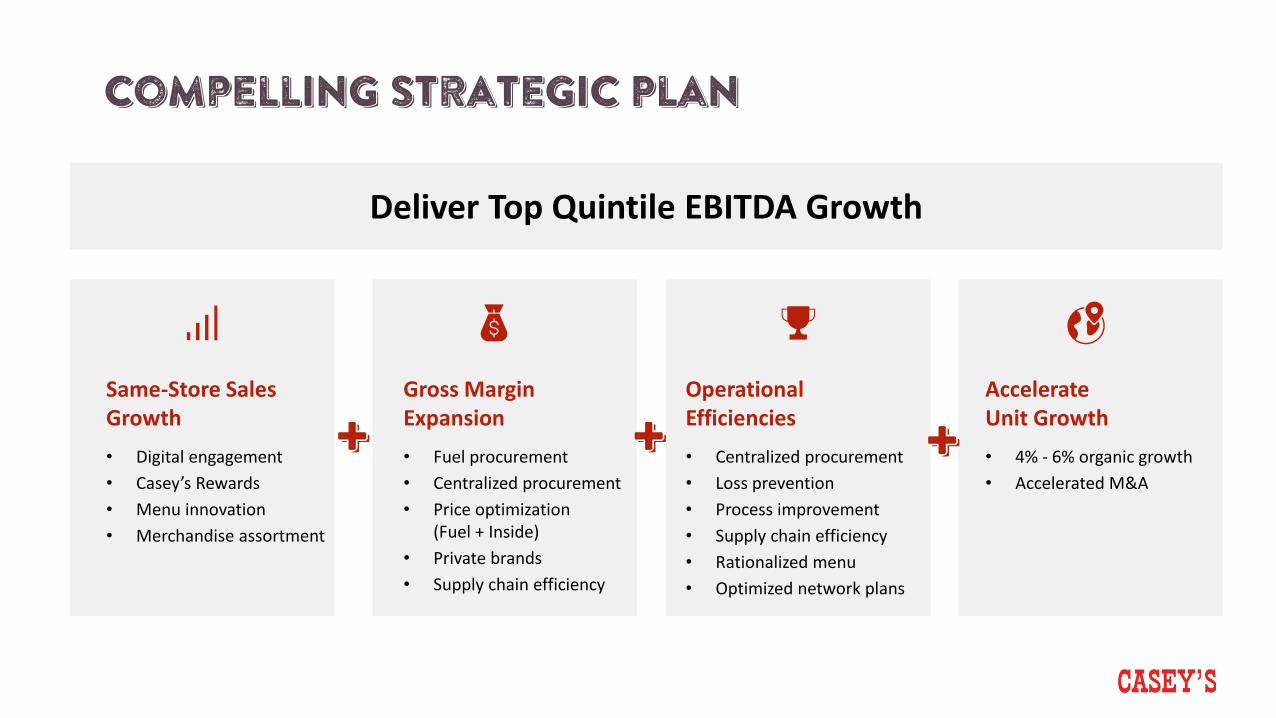
Compelling Strategic Plan
Same-Store Sales Growth• Digital engagement• Casey’s Rewards• Menu innovation• Merchandise assortment
Gross Margin Expansion• Fuel procurement• Centralized procurement• Price optimization
(Fuel + Inside)• Private brands• Supply chain efficiency
Operational Efficiencies• Centralized procurement• Loss prevention• Process improvement• Supply chain efficiency• Rationalized menu• Optimized network plans
Accelerate Unit Growth• 4% - 6% organic growth• Accelerated M&A
+ + +
Deliver Top Quintile EBITDA Growth

our strategy impact will evolve over time
1 Impact measured by % total EBITDA $ contribution by project across 3-year phased roadmap2 Growth & Innovation denote projects that will accelerate top-line growth across PF&F, G&OM, and Fuel; Savings/Efficiency projects denote cost savings and waste reduction efforts aimed at improving margin and freeing up investment capacity; Capability-building refers to projects investing in core talent, systems, processes, etc. to enable future growth
I M P A C T O F P O R T F O L I O O V E R T I M E 1 , 2
60%
100%
40%
10%
50%
20%
70%
90%
30%
80%
FY20-FY21 FY22 FY23
Growth & Innovation
Savings/Efficiency
Capability-Building

Casey’s growth model focused on driving results for shareholders
EBITDA % GROWTH 8% to 10% CAGR through FY2023
STORE GROWTH ~350 additional new and acquired stores by FY2023
SAME-STORE SALES Fuel gallons: flat-to-low single digitInside sales: low-to-mid single digit
GROSS PROFIT MARGIN % Margin expansion inside and outside the store
OPERATIONAL EFFICIENCIES Operating expense % growth below EBITDA % growth
CASH FLOWS Cash flows from operating activities greater than capital expenditures
Management Guidance
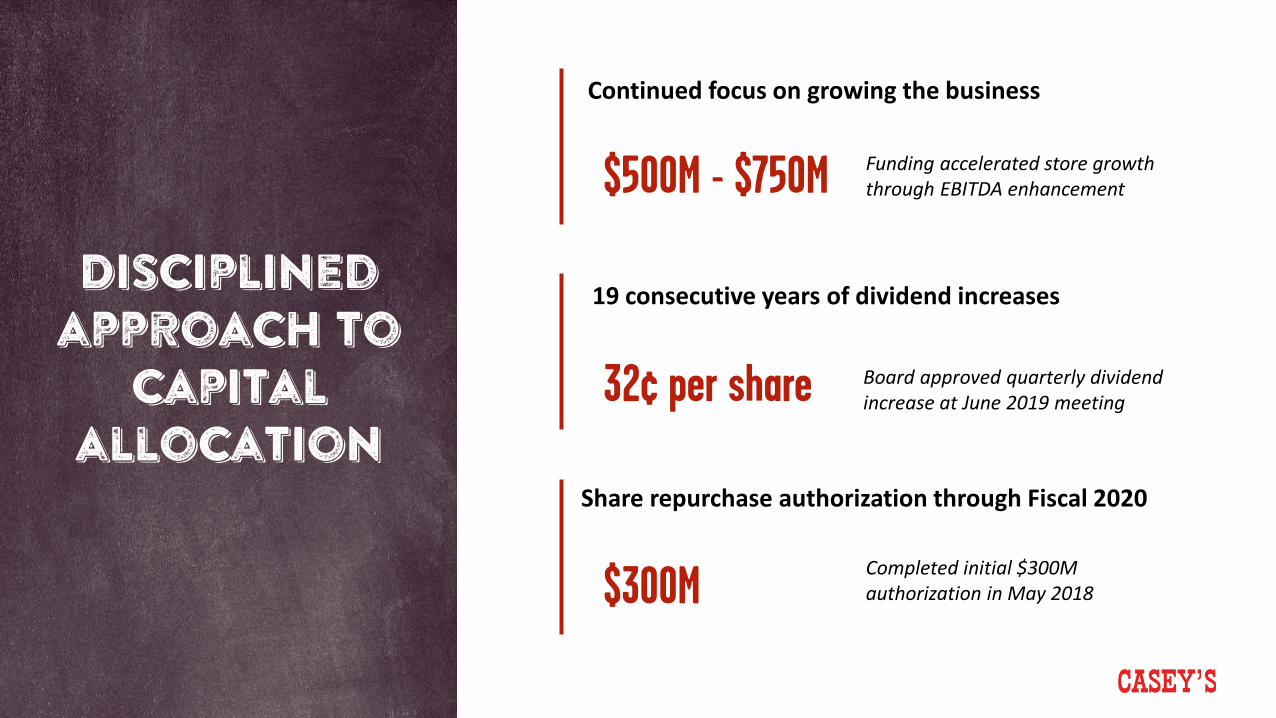
Disciplined approach to
capital allocation
Continued focus on growing the business
$500M - $750M
19 consecutive years of dividend increases
32¢ per share Board approved quarterly dividend increase at June 2019 meeting
Share repurchase authorization through Fiscal 2020
$300MCompleted initial $300M authorization in May 2018
Funding accelerated store growth through EBITDA enhancement

Strong balance sheet WITH ACCESS TO LOW COST FINANCING
LTM Net Debt|EBITDA ratio
2.1x
Access to low cost financing
$569M 5.22% debt to be refinanced in near-term
LTM Additional Debt Capacity
$798M Growing capacity provides significant flexibility
Historically ~2.0x – 2.5x
Issuance
Outstanding Principal (in $M)
Interest Rate Due
2006 (Series B) 7.5 5.72% Mar 2020
2010 569 5.22% Aug 2020
2013 (Series A) 150 3.67% Jun 2028
2013 (Series B) 50 3.75% Dec 2028
2016 (Series C) 50 3.65% May 2031
2016 (Series D) 50 3.72% Oct 2031
2017 (Series E) 150 3.51% Jun 2025
2017 (Series F) 250 3.77% Aug 2028
Senior Notes
$300M Revolving Credit Facility
Note: Net Debt | EBITDA and additional capacity shown as LTM metrics as of 10/31/2019; additional debt capacity based on current 3.5x covenant as set forth in the Company’s current Senior Notes

Key Takeaways
• Consistent track record of profitable growth
• Multiple levers to sustain and accelerate performance
• Clear strategy for next period with cross-functional alignment
• Numerous avenues for continued growth including robust innovation
• Commitment to efficient capital allocation

Conclusion
Darren rebelezPresident & Chief Executive Officer

Evolving our strategy
REINVENT THE GUEST EXPERIENCE
Contemporize our food proposition, optimize & localize assortment, and
deliver compelling experiences
Deliver top quintile EBITDA growth
Create capacity through efficiencies
Drive efficiencies to improve the shape of the business and fund
future growth
ACCELERATE UNIT GROWTH
Accelerate our new store builds and acquisitions, including market
and store format expansion
Invest in our talent Create a culture that drives performance and exceeds guests’ expectations

A Blend of deep casey’s experience and relevant industry expertise
Relevant Convenience, QSR, Retail and CPG experiences…
Darren RebelezPresident & Chief Executive Officer
Bill WalljasperSVP, Chief Financial Officer
Chris BolingVP, Store Operations
Hal BrownVP, Support Services
Megan ElfersVP, Marketing
Deb GrimesVP, Fuel Procurement & Delivery
Kirk HaworthVP, Real Estate
Sam JamesVP, Finance
James PistilloVP, Accounting & Treasurer
Rich SchappertVP, Information Technology
Art SebastianVP, Digital Customer Experience
Ed VaskeVP, Transportation & Distribution
New to Casey’s
Chris JonesSVP, Chief Marketing Officer
Tom BrennanSVP, Chief Merchandising Officer
Jay SoupeneSVP, Operations
Chad FrazellSVP, Chief Human Resources Officer
Julie JackowskiSVP, CorporateGeneral Counsel
Brian JohnsonSVP, Store Development

Darren RebelezPresident & CEO of Casey’s General Stores
H. Lynn HorakBoard Chair, Past Regional Chairman with Wells Fargo Regional Banking
Diane BridgewaterEVP, Chief Financial and Administrative Officerof LCS
Donald FriesonEVP Supply Chain, Lowe’s Companies
Cara HeidenRetired Co-President of Wells Fargo Home Mortgage
David LenhardtFormer President and CEO of PetSmart, Inc.
Larree RendaRetired Executive Vice President of Safeway, Inc.
Judy SchmelingFormer COO of HSN, Inc. and former President of Cornerstone Brands
Allison WingChief Consumer Officer of Bright Health
Diversity in our board of directors
Experienced board with a strong track record…
New to Casey’s BOD
Evolving our strategy
Create capacity through efficiencies
ACCELERATE UNIT GROWTH
Invest in our talent
REINVENT THE GUEST EXPERIENCE
• Contemporized food program
• Optimized, localized assortment
• Modern, digital experiences
• Insights & analytics
• Enhanced fuel capabilities
• Supply chain optimization
• Store & process efficiency
• Procurement excellence
• Profitable unit growth
• Optimized network plans
• Broadened formats & markets
• Acquisition value capture
• Strengthened team & capabilities
• Culture of performance
Deliver top quintile EBITDA growth

CONFIDENCE IN OUR EXECUTION ABILITY
GROUNDED IN GUEST INSIGHTS
BREADTH OF VALUE LEVERS
SIZEABLE ADDRESSABLE MARKET
POSITIVE CONTROL
BUILDING ON LEGACY STRENGTHS

Q&A
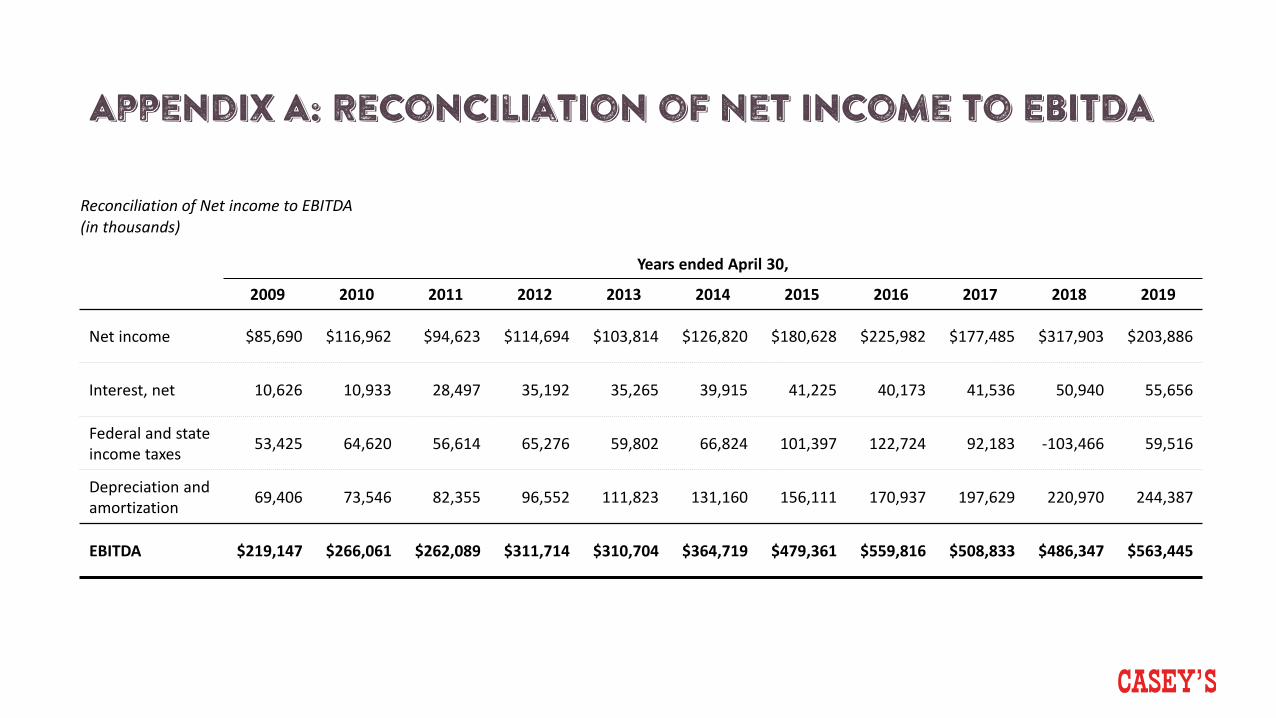
Appendix A: Reconciliation of Net income to EBITDA
Years ended April 30,
2009 2010 2011 2012 2013 2014 2015 2016 2017 2018 2019
Net income $85,690 $116,962 $94,623 $114,694 $103,814 $126,820 $180,628 $225,982 $177,485 $317,903 $203,886
Interest, net 10,626 10,933 28,497 35,192 35,265 39,915 41,225 40,173 41,536 50,940 55,656
Federal and state income taxes 53,425 64,620 56,614 65,276 59,802 66,824 101,397 122,724 92,183 -103,466 59,516
Depreciation and amortization 69,406 73,546 82,355 96,552 111,823 131,160 156,111 170,937 197,629 220,970 244,387
EBITDA $219,147 $266,061 $262,089 $311,714 $310,704 $364,719 $479,361 $559,816 $508,833 $486,347 $563,445
Reconciliation of Net income to EBITDA(in thousands)


![PM 2014 investor day 2014-06-26-Operations Investor Day Slides [FINAL]](https://static.documents.pub/doc/80x56/577cbc651a28aba7118da314/pm-2014-investor-day-2014-06-26-operations-investor-day-slides-final.jpg)


