May 10, 2016
2020 Mid-Term Business Plan
‒ “Change ourselves and bridge to the future! 2020 Mid-term” ‒
Theme of the 2020 Mid-term Business Plan for the Fujikura Group
Masahiko Ito, President & CEO
Fujikura Ltd.
Become a company that holds future promise
and will continue in the future
based on high earning power and the power
of strong “metabolism”
as a company that creates value for customers!
1
Table of Contents
1. Reflecting on the 2015 Mid-term
Business Plan
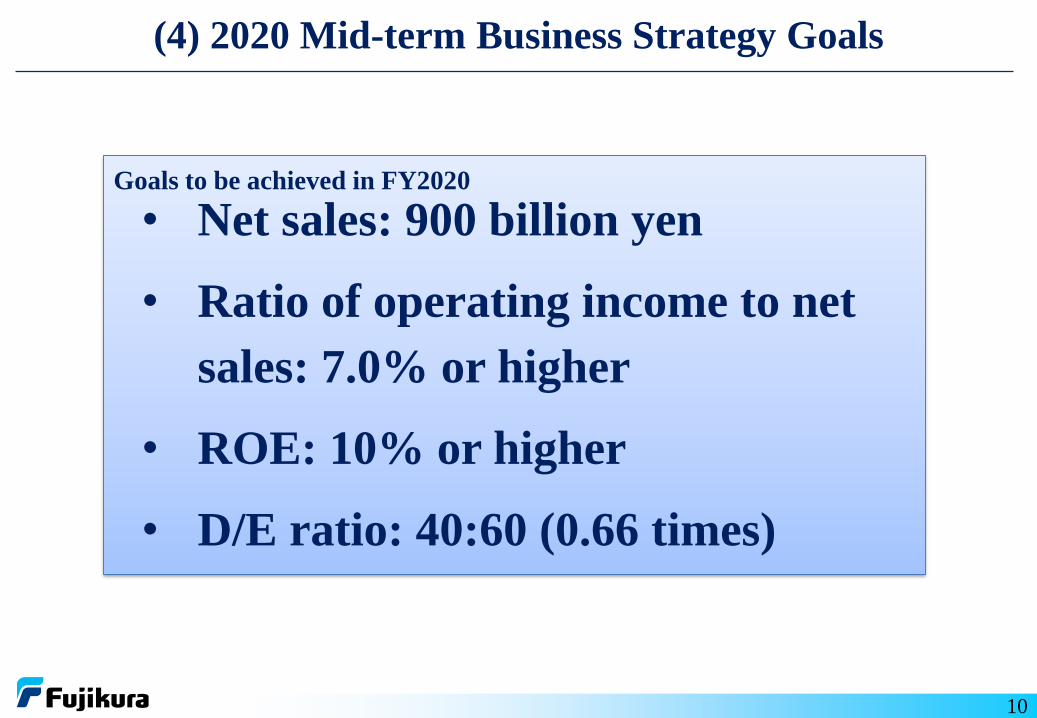
2. 2020 Mid-term Business Plan
3. Business Strategy by Segment
4. Policy on Shareholder Return
2
Net
Sales
Operating
Margin
Net
Sales
Operating
Margin
Power Systems 190.0 212.7
Telecommunication Systems 145.0 151.4
Power & Telecommunication Systems 335.0 5.4% 364.1 4.3%
Electronics Business*1 145.0 6.0% 161.2 7.5%
Automotive Products 110.0 5.5% 135.9 1.7%
Real Estate Business 10.0 50.0% 10.7 50.4%
Other 4.0 -25.0% - -
New Business Development Area - - 6.6 -44.2%
Total for Company 650.0 6.3% 678.5 4.8%
2015 Mid-term Plan FY2015 ResultsIn-house Company Names
(Units: Billions of yen, %)
671.9 5.3%Excluding new businesses not included in the 2015 Mid-term Plan
*1 After the damage incurred by the flood in Thailand, the only revision made to the Mid-term Plan was to Electronics. The initial plan was 190 billion yen, 6.8%.
Final fiscal year of the 2015 Mid-term Plan: Ratio of operating income to net sales, 80% achieved
4
(1) 2015 Mid-term Results
Restructure the business Set-up & conduct checks of locations in
Japan and overseas
Clarify business responsibilities
・Collaborate with Mitsubishi Cable Industries, Ltd., consolidate sales locations in Japan, and consolidate distribution locations in Japan・Introduce an in-house company system
High-profit company
5
Accelerate global development
Pave the way to the future & break into new markets Environment & energy
Cloud communication
Medical, nursing care, & healthcare
・Establish a new business promotion center・Commercialize the fiber laser
Expand infrastructure-related business overseas
Establish a global business promotion structure
・Launch the EPC business in Myanmar・Establish the company in Indonesia and
Brazil・Expand and strengthen the automotive
business Establish a tri-regional structure
Corporate R&D
(Fujikura research)
Strengthen unified group management and improve efficiency
Establish a foundation to support optimal management for the company as a whole
Promote efficiency through IT use
Establish the environment for global utilization of personnel
・Continuing to work on this
Power &
Telecommunication Systems
Company
Electronics
Business
Company
Automotive
Products
Company
Growth Strategy & Key Measures
1
3
2
Transit points on the way to becoming a high-profit company during the 2015 Mid-term Plan
Strategic Goals (Actual Results)
Net Sales: 650 billion yen 678.5 billion yen
Operating Margin: 6.3% or higher 4.8%
4
(2) Progress on Growth Strategy & Key Measures and Issues
Changing Business Environment
The economic downturn in China is having a spill-over effect on the global economy
Spread of Free Trade Agreements and equalization of global economies
Sense of stagnation in Abenomics in Japan
Spread of evaluation of ESG (Environmental, Social, & Governance aspects of business) and the increasing impact on corporate value
Issues to Resolve
Further enhance earning power and achieve sound growth
Speed up new business creation by strengthening “metabolic” power
Improve responses to ESG issues
Prepare for a major disaster, BCP/BCM
7
(1) On Formulating the 2020 Mid-term Business Plan
The Fujikura Group will contribute to the creation of value for customers by using
"Tsunagu" (connecting) technologies.
• “Utmost importance on profitability” to ensure sound growth
Growth Strategy & Key Measures in the 2020 Mid-term Business Plan
Basic Policies on the
2020 Mid-term Business Plan“Change ourselves and bridge to the future! 2020 Mid-term”
• Build a company that creates value for customers by accelerating “metabolism”
• To secure sustainability, establish corporate governance
and enhance reputations of environment and social aspects.
• Management reform &business structural reform
• Speed up new business creation
• Open innovation• Developing deeper ties with
strategic customers
Corporate
Philosophy
(Mission)
2020 Mid-term Plan
Business Strategy Goals
8
Fujikura’s DNA: “Tsunagu” (connecting) technologies
(2) Policy on the 2020 Mid-term Business Plan
Developing deeper ties with strategic customers
Mine strategic customers, and- work to achieve greater business growth
- seize new business opportunities
Speed up new business creation
Strengthen the structure for promoting new business
Key areas- Automotive-related
- Industrial machinery
- Medical devices
Open innovation Supply the missing pieces of portfolios and value chains and create new value
for customers.
Speed up technology development, business development, and business growth
Management reform &business structural
reform
Response to a Corporate Governance Code
Improve the quality and speed of decision-making in a diverse range of
businesses
Strengthen the management base
Become a company that holds future promise and will continue in the future based on high earning power and the power of strong “metabolism”
as a company that creates value for customers!
9
(3) Growth Strategy & Key Measures
• Net sales: 900 billion yen
• Ratio of operating income to net
sales: 7.0% or higher
• ROE: 10% or higher
• D/E ratio: 40:60 (0.66 times)
Goals to be achieved in FY2020
10
(4) 2020 Mid-term Business Strategy Goals
900.0810.0
690.0678.5
63.050.0
28.032.6
7.0%6.2%
4.1%4.8%
Operating IncomeNet SalesRatio of Operating Income to Net Sales
FY2020: Ratio of operating income to net sales 7.0% or higher;
Net sales 900 billion yen
Net Sales and Ratio of Operating Income to Net Sales
(Billions of yen)
million yen)
・・・・ ・・・・
11
(5) Management Goals: Net Sales and Ratio of Operating Income to Net Sales of
Consolidated companies
FY2015
Results
FY2016
Forecast
FY2018
Goal
FY2020
Goal
ROE (%) 5.4 7.1 9.0 or higher 10.0 or higher
Exchange rate (JPY/USD)
[Average rate]120.16 110.00 110.00 110.00
Copper base (market price, ¥Thousands/ton)
[Average during period]677 550 550 550
12
Implement a growth strategy that takes balance in the business portfolio into consideration
By Segment: Composition of Net Sales and Operating Income
FY2015 Results
(Final year of the 2015 Mid-term Plan) FY2020 GoalFY2016 Forecast
Net sales: 690.0 billion yen Net sales: 900.0 billion yen
Operating income: 28.0 billion yen
(Ratio of operating income to net sales: 4.1%)Operating income: 63.0 billion yen
(Ratio of operating income to net sales: 7%)
Net sales: 678.5 billion yen
Operating income: 32.6 billion yen
(Ratio of operating income to net sales: 4.8%)
Power &Telecommunication
Systems52%
Electronics Business26%
Real Estate2%
Power & Telecommunication
Systems53%
Electronics Business24%
AutomotiveProducts
20%
Real Estate2%
Other▲9%
Power &Telecommunication
Systems48%
Real Estate17%
AutomotiveProducts
7%
Electronics Business37%
Other1%
AutomotiveProducts
19%A
imin
g a
t th
e 2020 M
id-t
erm
P
lan
Other1%
Power &Telecommunication
Systems49%
Electronics Business29%
Real Estate1%
AutomotiveProducts
20%
Other1%
Other▲5%
Power &Telecommunication
Systems44%
Real Estate15%
AutomotiveProducts
14%
Electronics Business32%
Power &Telecommunication
Systems49%
Real Estate7%
AutomotiveProducts
15%
Electronics Business29%
Other0%
(5) Management Goals: By Segment
Exec
uti
on
of
the
Gro
wth
S
trate
gy
13
678.5
900.0
FY2015
Results
FY2020
Goal
Power &Telecommunication
Systems
+70.9
+44.1
Other
+2.7
Electronics Business
AutomotiveProducts+103.8
Net Sales
(Billions of yen)
vs. FY2015: +221.5
(5) 2020 Mid-term Business Plan: Factors Behind Changes in Net Sales
14
32.6
63.0
FY2015
Results
FY2020
Goal
Net increase inAutomotive
Products+15.0
+7.4
Net increase inElectronics
Business
+5.9
Net increase inPower &
TelecommunicationSystems
+2.0
New Business,
Other
Operating Income
vs. FY2015: +30.4
(5) 2020 Mid-term Business Plan: Factors Behind Changes in Operating Income
(Billions of yen)
15
Total cumulative capital investment during the 2020 Mid-term Business Plan: 200 billion yen invested in growth areas
Final Fiscal Year of the 2020 Mid-term Business Plan: Total Cumulative Capital Investment, Net Sales, and Operating Income by Segment
2020 Mid-term PlanTotal Cumulative
Capital Investment200 billion yen
73.0
64.0
31.0
15.017.0
Electronics Business32%
Automotive Products
16%
Real Estate
7%
Total Companyin Common
8%
Final Fiscal Year of the 2020 Mid-term PlanNet Sales & Operating Income
49% 49%
29% 29%
20% 15%
1% 7%1% 0%
Net Sales Operating Income
Power & Telcommunication Systems Electronics Business
Automotive Products Real Estate
Other
Power &Telecommunication
Systems37%
70.0
86.0
11.0
23.0
10.0
Electronics35%
Automotive Products
12%
Real Estate
5%
Total Company in Common
5% Power &Telecommunication
Systems43%
2020 Mid-term PlanTotal Cumulative
Depreciation200 billion yen
OtherOther
(5) 2020 Mid-term Business Plan: Capital Investment
151.4 150.0
210.0
212.7 213.3
0
225.0
364.1 363.3
4.3% 3.4%
7.1%
Strengthen the EPC business
Enhance proposals of solutions
Maximize the benefits of integrating industrial cable and wire
Finish restructuring the metal cable business
Telecommunication Systems
Expand business to FTTx and data centers
- Launch products that differentiate the company on an ongoing basis
Maintain a firm hold on our top level global ranking in the optical fiber business
- Expand sales of high-performance fiber and improve productivity
Continuously introduce new models and improve the profitability of the fusion splicer business
Expand fiber laser sales
Power systems
Expand and grow business globally
Generate innovation
Complete restructuring
Net Sales
(Billions of yen)
Power systems
Telecommunication Systems
Ratio of Operating Income to Net Sales
FY2015Results
FY2016Forecast
FY2020Goal
17
435.0
(1) Power and Telecommunication Systems Company
97.2123.4
190.0
50.0
30.6
29.2
25.0
34.8
161.2
265.0
180.1
7.5%
5.0%
6.8%
OtherConnectors
FPCRatio of Operating Income to Net Sales
26.1
Manage with the main focus on “quality”
Achieve growth by staying closely connected to strategic customers(both existing and new)
Expand business aimed at automotive market
Deepen relationships with main customers
- Respond quickly and efficiently, and reinforce the structure
Expand the automotive FPC business
- Pursue automotive quality
Respond rapidly to technological innovations by customers
FPC
Reinforce response to business with main customers
- Automate and reduce labor to an absolute minimum
Expand business aimed at automotive market
Seek out industrial machinery/FA business
- FA, welding equipment, vehicles, overseas expansion
Connector
Net Sales
FY2015Results
FY2016Forecast
FY2020Goal
Use selection and concentration in product groups
Enhance development of composite products based on connectors
Other
18
(2) Electronics Business Company
(Billions of yen)
Automotive Products
Focus on main customers in expanding business
- Expand the number of new customers(in the process of jointly developing customers with multiple companies)
Strengthen the profit structure
- Move into lower cost areas (transfer production)
Improve monozukuri skills (improve quality and control labor costs)
- Pursue automation and IT use
Configure a structure for all of Fujikura
- Environmental response (EV-related products, etc.)High voltage, aluminum, etc.
- New technology aimed at achieving high functionality (automatic driving, etc.)Thin wiring modules, E-BOX, etc.
Net Sales
New Business Creation
Achieve solid growth based on the wire harness business
Generate new business aimed at the future of the automotive market
135.9131.4
180.0
1.7%2.9%
5.4%
Ratio of Operating Income to Net Sales
19
(3) Automotive Products Company
(Billions of yen)
FY2015Results
FY2016Forecast
FY2020Goal
Key measures in the 2020 Mid-term Business Plan
- Select & concentrate R&D themes
- Build a global research structure
- Pursue open innovation
- Develop human resources skilled in development from a commercially minded perspective
20
Strengthen the core technology base that supports “Tsunagu” (connecting) technologies and secure a competitive edge
Anticipate social changes and customer needs in the five business domains and accelerate metabolism of these through the generation of new businesses
Make use of global human resources
Key Measures
Invest 90 billion yen
in R&D expenditures over five years
Advance “tsunagu” technologies that will create the future of an environmentally friendly, information-based society:
2D/3D wiring & sensing
Automotive products
Optical telecommunication network components
Medical devicesFiber laser equipment
High-temperature superconductors
Three core technology bases and five business domains
FiberlasersImage
fibers
Medical & industrial equipment
Tel
eco
mm
un
ica
tio
n
Electronics
Energy
AutomotiveProducts
FPC
Optical fiber
Optical connectors
Optical fusion splicer
Optical fiber line components
Optical devices
Optical fibers
Optical Cables
Electroniccomponents
Membrane SW
Millimeter wave modules
Planarwiring
Optical
Heat pipes
Sensors
Connectors
Electronic wires
High-temperature superconductors
Automotivewire harnesses
Coaxial cable
Industrial wiring
Electrical wire & cable
Embedded PCB
(4) R&D
Take balance into consideration in distributing profits
Make key investments in growth businesses
(to achieve the next stage of growth)
Improve financial status (equity ratio, D/E ratio)
Be flexible about acquiring the company’s own shares
22
Increase earnings per share
Implement stable dividends
(1) Basic Policy on Profit Distribution
Base shareholder return on providing stable dividends on a consistent basis
Dividends per share
– FY2014: 7.0 yen per share (Actual)
– FY2015: 8.0 yen per share (Forecast)
– FY2016: 10.0 yen per share (Projection)
23
Dividend payout ratio of 20% or higher
(2) Shareholder Return
Please note:
This document is a compilation of Fujikura’s management policies (intentions) from FY2016 through FY2020. Projections for sales,
profits, and other factors in future fiscal years quantify the intentions of Fujikura in regard to investment and incorporate market
decisions based on the latest available data, including projections for FY2016. Future results may differ as a result of changes in the
business environment and other unforeseeable factors.