65
2020 MNDOT SUSTAINABILITY AND PUBLIC HEALTH REPORT Sustainability and Public Health JULY 2021

2020MNDOT SUSTAINABILITY AND PUBLIC HEALTH REPORT
Sustainability and Public HealthJULY 2021

SUSTAINABILITY AND PUBLIC HEALTH 2020 ANNUAL REPORT i
Sustainability and Public Health
To request this document in an alternative format, please contact The Office of Equity and Diversity at 651-366-4723 or 1-800-657-3774 (Greater Minnesota); 711 or 1-800-627-3529 (Minnesota Relay). You may also send an email to [email protected].
Please request at least one week in advance.
This report was prepared by the Minnesota Department of Transportation’s Office of Sustainability and Public Health with acknowledgment to the MnDOT Sustainable Transportation Steering Committee for their insight, guidance, and support.
Special thanks to Siri Simons for leading development of the report and to all the MnDOT staff throughout the agency who supported the measures and actions reported in the report.
Tim Sexton Assistant Commissioner, Sustainability and Public Health
651-366-3622
Prepared with support from: HDR

SUSTAINABILITY AND PUBLIC HEALTH 2020 ANNUAL REPORT ii
ContentsCommissioner’s Letter ............................................................................................................................. iii
Executive Summary .................................................................................................................................. ivStrategic Goals ...................................................................................................................................................... iv
How We’re Measuring Progress .......................................................................................................................... iv
Where We’re at Today ........................................................................................................................................... v
What’s Next ............................................................................................................................................................ vi
Introduction ............................................................................................................................................... 12020 in Context ...................................................................................................................................................... 1
Advancing Sustainability and Public Health in the Transportation Sector ..................................................... 1
Guiding Statutes and Executive Direction .......................................................................................................... 2
Collaboration and Partnerships .......................................................................................................................... 3
Reporting Framework............................................................................................................................................ 6
Transportation Sector ............................................................................................................................... 8Overview ................................................................................................................................................................. 8
2020 Accomplishments ......................................................................................................................................... 8
Measuring Progress ............................................................................................................................................... 9
Transportation Sector: 2021 Planned Actions Table ....................................................................................... 11
Facilities .................................................................................................................................................... 13Overview ............................................................................................................................................................... 13
2020 Accomplishments ....................................................................................................................................... 14
District 7 Saves Money and Reduces Carbon Pollution with Switch to LEDs ............................................... 14
Measuring Progress ............................................................................................................................................. 15
MnDOT Facilities: 2021 Planned Actions Table ................................................................................................ 18
Fleet ........................................................................................................................................................... 19Overview ............................................................................................................................................................... 19
2020 Accomplishments ....................................................................................................................................... 19
District 6 Pilots Higher Level Biofuel Diesel Blend ........................................................................................... 20
Measuring Progress ............................................................................................................................................. 21
MnDOT Fleet: 2021 Planned Actions Table....................................................................................................... 24
Highway Operations ................................................................................................................................ 25Overview ............................................................................................................................................................... 25
2020 Accomplishments ....................................................................................................................................... 25
Teamwork and Technology Reduces Salt Use in District 4 ............................................................................. 26
Measuring Progress ............................................................................................................................................. 27
Highway Operations: 2021 Planned Actions Table .......................................................................................... 29

SUSTAINABILITY AND PUBLIC HEALTH 2020 ANNUAL REPORT
Roadside Vegetation ................................................................................................................................ 30Overview ............................................................................................................................................................... 30
2020 Accomplishments ....................................................................................................................................... 30
Metro District Partners with Local Entities and Office of Environmental Stewardship to Plant Native Species ........................................................................................................................................ 31
Measuring Progress ............................................................................................................................................. 32
Roadside Vegetation: 2021 Planned Actions Table ......................................................................................... 33
Construction ............................................................................................................................................. 34Overview ............................................................................................................................................................... 34
2020 Accomplishments ....................................................................................................................................... 34
District 8 uses Cold In Place Recycling Technique ........................................................................................... 35
Measuring Progress ............................................................................................................................................. 36
Construction: 2021 Planned Actions Table ....................................................................................................... 37
Walking, Biking, and Transit ................................................................................................................... 39Overview ............................................................................................................................................................... 39
2020 Accomplishments ....................................................................................................................................... 40
District 3 Installs a Demonstration Project in Sauk Centre ............................................................................. 40
Measuring Progress ............................................................................................................................................. 41
Walking, Biking and Transit: 2021 Planned Actions Table .............................................................................. 44
Transportation Equity and Safety .......................................................................................................... 45Overview ............................................................................................................................................................... 45
2020 Accomplishments ....................................................................................................................................... 45
District 1 Builds Relationships Earlier to Improve Transportation Equity .................................................... 46
Measuring Progress ............................................................................................................................................. 47
Transportation Equity & Safety: 2021 Planned Actions Table ....................................................................... 50
Climate Resilience.................................................................................................................................... 52Overview ............................................................................................................................................................... 52
2020 Accomplishments ....................................................................................................................................... 52
District 2 Conducts Climate Vulnerability Assessment .................................................................................... 53
Measuring Progress ............................................................................................................................................. 54
Climate Resilience: 2021 Planned Actions Table .............................................................................................. 55
The Road Ahead ....................................................................................................................................... 57
iii
SUSTAINABILITY AND PUBLIC HEALTH 2020 ANNUAL REPORT iv
Commissioner’s LetterThe pivotal events of 2020 will shape our future – in ways we are already seeing and many that we may not fully comprehend yet.
At MnDOT, we’ve recommitted ourselves to asking the hard questions, leading through action, and making impactful changes that better align us with our vision of a multimodal transportation system that maximizes the health of people, the environment, and our economy.
We’re continuing to build on the work of the past to address systemic inequities, ensure all people have a voice in transportation decision-making, embracing sustainable practices in all our work, and building for the needs of future generations.
I’m pleased to present MnDOT’s 2020 Sustainability and Public Health Report, the fifth annual installment of this work. In the pages that follow, you’ll find valuable information about our strategic goals, how we’re measuring progress, what we’ve accomplished so far, and what comes next.
One major development in 2020 was the establishment of our Sustainable Transportation Advisory Council (STAC), a partnership of leaders from business, nonprofits, local governments, and other community organizations to help us develop strategies and reduce carbon pollution in Minnesota. The members of the STAC are deeply engaged in this work, MnDOT has already adopted many of their recommendations, and we look forward to continued successes together in the years ahead.
We’ve also made progress in many other areas, including:
� Exceeding our goal to reduce emissions from MnDOT facilities by 30% (-39% in 2020).
� Exceeding our goal to reduce water use at MnDOT by 15% (-27% in 2020).
� Nearly achieving our goal to convert all highway lighting to LED (97% in 2020).
Despite this progress, we know that we still have work to do.
� We are still not on track to reduce emissions from the transportation sector 30% by 2025 (-7% in 2018).
� More work is needed to include more transportation options on MnDOT projects, including work towards meeting our goal to meet 90% of needs for biking (62% in 2020) and our goal to reduce the number of nonmotorized serious injuries and fatalities (trending up in 2020).
MnDOT is so much more than just a highway department.
We are responsible for providing equitable access and ways to get around safely, no matter how people travel—by car, bus, train, plane, bike, walking or wheels. It is also our duty—by statutory requirement and because it is the right thing to do—to curb carbon pollution and lead the way towards a sustainable, low-carbon, healthier transportation future.
We’re listening, we’re improving, we’re committed to doing more—and we look forward to the rewarding work ahead.
Margaret Anderson Kelliher
MnDOT Commissioner

SUSTAINABILITY AND PUBLIC HEALTH 2020 ANNUAL REPORT v
Executive SummaryThe MnDOT Office of Sustainability and Public Health is pleased to present the 2020 Sustainability and Public Health Report.
2020 was a year of change. The COVID-19 pandemic caused a major shift in how people travel: increases in telework, decreases in transit usage, and more people biking and walking for work and pleasure. At the same time, the killing of George Floyd and subsequent social action and unrest heightened public awareness of the inequities that exist throughout our state, including in the transportation system. 2020 was also the second hottest year on record, highlighting the omnipresent risk of climate change. Unchanged in 2020 is that transportation remained the number one source of carbon pollution in the US.
The 2020 MnDOT Sustainability and Public Health report supports agency efforts to address these and other challenges that have clear connections to our transportation system in Minnesota. The report outlines performance measures that reflect effort by MnDOT to lead by example, support broad actions that influence transportation statewide, and prepare the transportation system for the unavoidable impacts of climate change.
MnDOT is committed to reducing carbon pollution from the transportation sector in a way that supports equity, addresses the climate crisis, and improves public health for all Minnesotans.
Climate change will impact public health, especially for our residents least capable of adapting to change, and solutions must prioritize the health and adaptive capacity of those same marginalized populations. This report is our first attempt to introduce performance measures for public health and climate resilience and is meant to support action and transparency in these areas.
Strategic GoalsMnDOT’s Office of Sustainability and Public Health was created in December 2019. The division’s strategic goals are to:
� Reduce transportation carbon pollution
� Lead by example through MnDOT sustainability efforts
� Support transportation that improves public health for all Minnesotans
� Improve resilience of the transportation system in Minnesota
� Expand communication and engagement on sustainability and public health
The Sustainability and Public Health Division leads sustainability and public health planning at MnDOT, but relies heavily on other agencies, external partners, and the public to guide sustainable transportation efforts.
MnDOT also coordinates with internal and external groups to initiate new relationships, build upon existing ones, and actively seek input on climate policy solutions. Three examples include:
� Sustainable Transportation Advisory Council (STAC)
� Governor’s Climate Change Subcabinet
� MnDOT Sustainable Transportation Steering Committee
Learn more about collaboration and partnerships on pages 3–5 of this report.
How We’re Measuring ProgressThe strategic goals are organized to align with the focus areas identified in the Sustainability and Public Health 2020 Strategic Plan. Each focus area is accompanied by a set of metrics that measure progress toward targets, helping MnDOT make decisions and evaluate the effectiveness of policies, strategies, and investments.

SUSTAINABILITY AND PUBLIC HEALTH 2020 ANNUAL REPORT
The focus areas include a table of planned actions to help make progress on the targets. These actions will be led and/or supported by the MnDOT Sustainability and Public Health Division along with other agency partners in 2021. The planned actions tables list actions along with their status indicator, anticipated completion date, responsible entity, and co-benefits. This information helps hold MnDOT accountable while providing another opportunity to garner input and feedback from stakeholders, other Minnesota agencies, and the public.
Where We’re at TodayMnDOT remains focused on helping Minnesota transition to a low-carbon transportation system consistent with statutory goals for energy and emissions reductions, while recognizing the
importance of continued work toward improving safety, reducing inequities, and supporting economic development.
While there is still work to be done, we’ve seen several success stories from MnDOT Districts around the state. Each section in this report gives a detailed look into additional accomplishments from various focus areas in 2020 with respect to:
� Facilities � Fleet � Highway operations � Roadside vegetation � Construction
� Walking, biking, and transit � Transportation equity and safety � Climate resilience
Review the tables below for a summarized look at specific goals and their current statuses. A green circle ( ) indicates a goal has been achieved, while a red square ( ) indicates results not yet met.
REDUCE TRANSPORTATION CARBON POLLUTIONCATEGORY TARGET RESULTS (2019-2020)
Transportation sector GHG emissions 30% reduction from 2005 levels by 2025 7% reduction
Vehicle miles traveled MnDOT is working with partners to adopt a VMT reduction goal 1% increase (2018-19)
Electric vehicles 20% of statewide light-duty vehicles are electric by 2030 18,749 EVs registered (0.4% total)
LEAD BY EXAMPLE THROUGH MNDOT SUSTAINABILITY EFFORTSCATEGORY TARGET RESULTS (2019-2020)
Facilities GHG emissions 30% reduction from 2005 levels by 2025 39% reduction
Energy intensity 30% reduction from 2008 levels by 2025 33% reduction
Renewable energy 25% of agency energy needs met using renewable energy by 2025 13% of energy use
Water consumption 15% water use reduction from 2017 levels by 2025 27% reduction
Municipal solid waste recycling rate 75% recycling and composting rate achieved by 2030 Data not yet available
Fleet GHG emissions 30% emissions reduction by MnDOT vehicles by 2025 20% increase
Fleet fossil fuel use 30% reduction in use from MnDOT vehicles by 2025 20% increase
Light duty fuel efficiency 30 mpg average fuel efficiency or more achieved by 2025 17 mpg average
Electric vehicles (fleet) 100% transition of MnDOT sedans and SUVs to zero emission vehicles by 2030 2% transition
Salt use 100% of Adjusted Recommendation by the Decision Model 99% use
LED bulb replacement Convert all lighting on MnDOT roadways to LEDs by 2020 97% complete
Native seeding 75% of project acres planted with native seeds by 2025 68% planted
MnDOT construction projects GHG emissions 30% reduction from 2018 levels by 2025 23% reduction
vi
SUSTAINABILITY AND PUBLIC HEALTH 2020 ANNUAL REPORT vii
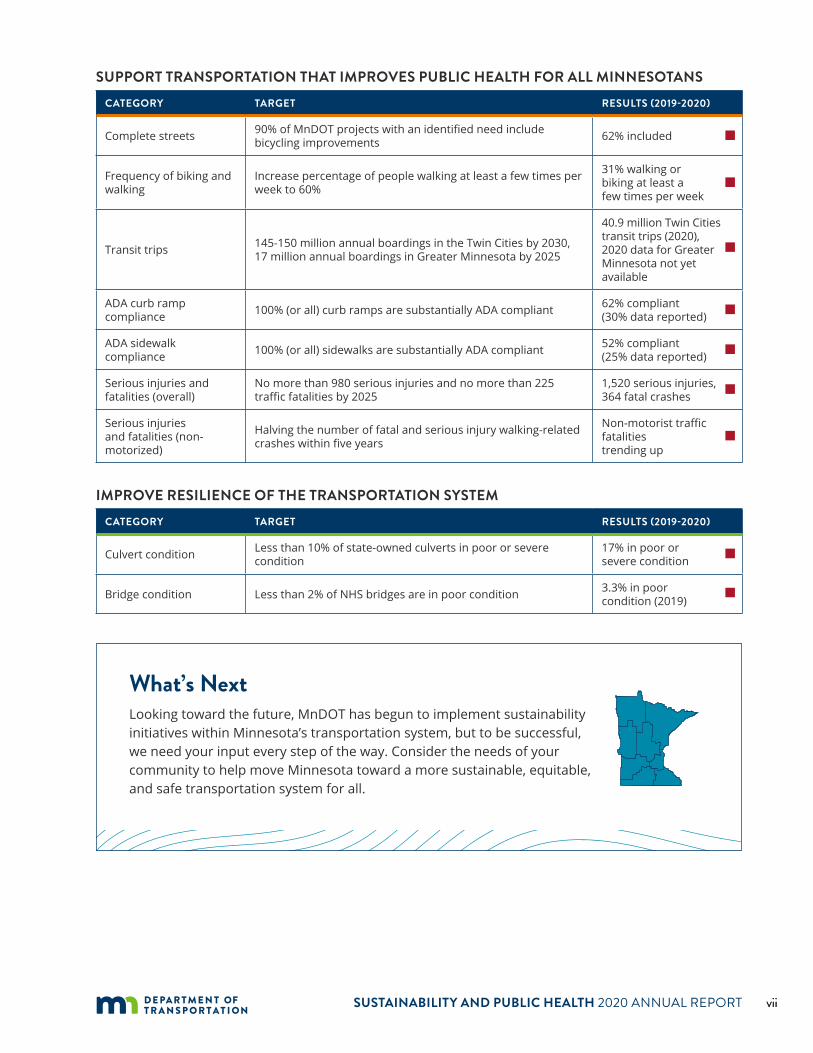
SUPPORT TRANSPORTATION THAT IMPROVES PUBLIC HEALTH FOR ALL MINNESOTANSCATEGORY TARGET RESULTS (2019-2020)
Complete streets 90% of MnDOT projects with an identified need include bicycling improvements 62% included
Frequency of biking and walking
Increase percentage of people walking at least a few times per week to 60%
31% walking or biking at least a few times per week
Transit trips 145-150 million annual boardings in the Twin Cities by 2030, 17 million annual boardings in Greater Minnesota by 2025
40.9 million Twin Cities transit trips (2020),2020 data for Greater Minnesota not yet available
ADA curb ramp compliance 100% (or all) curb ramps are substantially ADA compliant 62% compliant
(30% data reported)
ADA sidewalk compliance 100% (or all) sidewalks are substantially ADA compliant 52% compliant
(25% data reported)
Serious injuries and fatalities (overall)
No more than 980 serious injuries and no more than 225 traffic fatalities by 2025
1,520 serious injuries, 364 fatal crashes
Serious injuries and fatalities (non-motorized)
Halving the number of fatal and serious injury walking-related crashes within five years
Non-motorist traffic fatalities trending up
IMPROVE RESILIENCE OF THE TRANSPORTATION SYSTEMCATEGORY TARGET RESULTS (2019-2020)
Culvert condition Less than 10% of state-owned culverts in poor or severe condition
17% in poor or severe condition
Bridge condition Less than 2% of NHS bridges are in poor condition 3.3% in poor condition (2019)
What’s NextLooking toward the future, MnDOT has begun to implement sustainability initiatives within Minnesota’s transportation system, but to be successful, we need your input every step of the way. Consider the needs of your community to help move Minnesota toward a more sustainable, equitable, and safe transportation system for all.
vii

SUSTAINABILITY AND PUBLIC HEALTH 2020 ANNUAL REPORT 1
Introduction
1 Preliminary US Greenhouse Gas Emissions Estimates for 2020, Rhodium Group2 2020 Strategic Plan, MnDOT Sustainability and Public Health Division
2020 in Context2020 was a difficult and unusual year because of the global pandemic and its emotional and economic impacts.
Across the US, measures put in place to slow the pace of infection affected all aspects of American life, including how people traveled.
Transportation remained the largest source of greenhouse gas emissions in the US. According to preliminary estimates from the Rhodium Group, greenhouse gas emissions from transportation in 2020 dropped by nearly 15% as millions of people stopped driving to work and airlines canceled flights. Travel picked up again in the latter half of the year as states lifted restrictions, but Americans drove 15% fewer miles overall in 2020 compared to 2019 and the demand for jet fuel fell by more than one-third. While 2020 greenhouse gas emissions data are not yet available for Minnesota, it’s very likely that state-level transportation emissions mirrored the national trend. Daily traffic volumes in Minnesota briefly dropped 70% below the historical baseline in April 2020 and moved closer to typical levels by the fall.
“Unfortunately, 2020 tells us little about what we can expect to see in 2021 and beyond,” the Rhodium report concluded. “The vast majority of 2020’s emission reductions were due to decreased economic activity and not from any structural changes that would deliver lasting reductions in the carbon intensity of our economy.”1
Amid the global pandemic, the US also experienced a national response to racial injustice. On May 25, 2020, George Floyd was killed while in
the custody of the Minneapolis Police Department, evoking feelings of rage, disbelief, shock, and sorrow. Racial injustice is a public health crisis and transportation planning plays a role in addressing past actions and ensuring that future actions do not place a disproportionate burden on our most marginalized communities. It is important to think about not only where transportation projects are located but also the impact of a historical focus on personal vehicle transportation in place of walking, biking, and transit.
Advancing Sustainability and Public Health in the Transportation SectorMnDOT is committed to reducing carbon pollution from the transportation sector in a way that supports equity and public health.
The MnDOT Sustainability and Public Health Division was created in December 2019 to address the climate crisis and improve public health for all Minnesotans, especially our most vulnerable populations. As outlined in the SPHD 2020 Strategic Plan,2 the division’s strategic goals are as follows:
Reduce transportation carbon pollution
Lead by example through MnDOT sustainability efforts
Support transportation that improves public health for all Minnesotans
Improve resilience of the transportation system in Minnesota
Expand communication and engagement on sustainability and public health
SUSTAINABILITY AND PUBLIC HEALTH 2020 ANNUAL REPORT 2
Guiding Statutes and Executive Direction
The following statutes and executive directions guide MnDOT work on sustainability and public health.
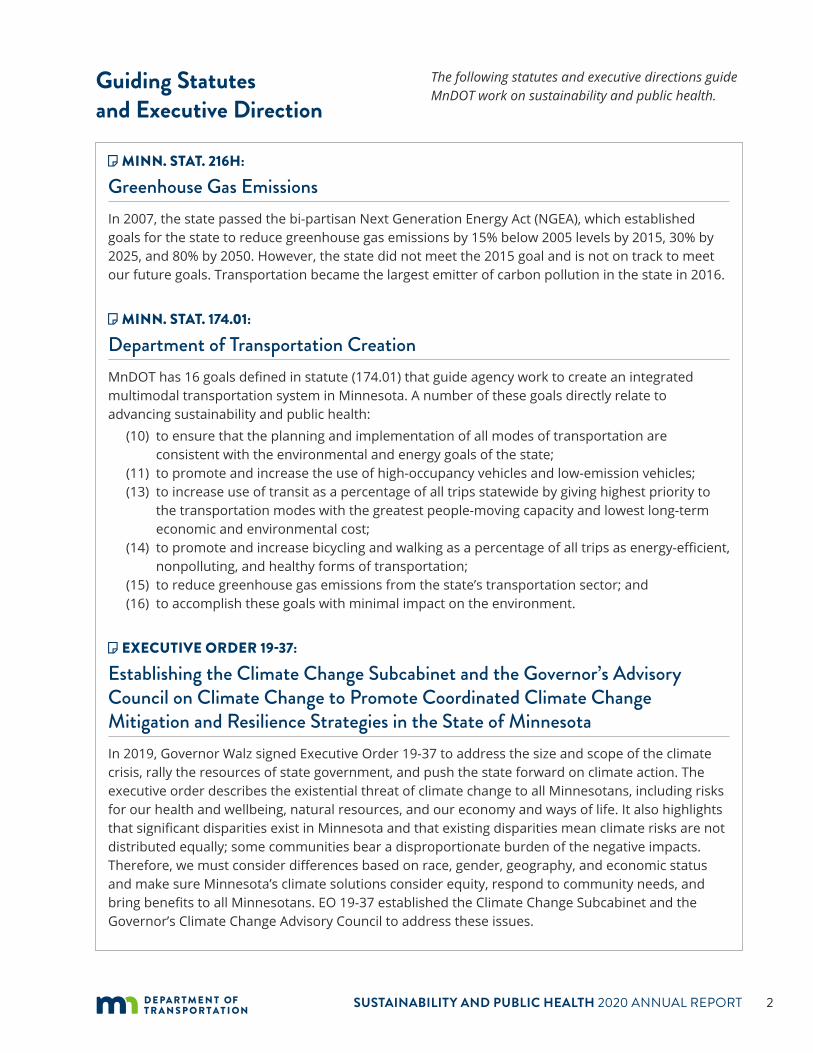
MINN. STAT. 216H:
Greenhouse Gas EmissionsIn 2007, the state passed the bi-partisan Next Generation Energy Act (NGEA), which established goals for the state to reduce greenhouse gas emissions by 15% below 2005 levels by 2015, 30% by 2025, and 80% by 2050. However, the state did not meet the 2015 goal and is not on track to meet our future goals. Transportation became the largest emitter of carbon pollution in the state in 2016.
MINN. STAT. 174.01:
Department of Transportation CreationMnDOT has 16 goals defined in statute (174.01) that guide agency work to create an integrated multimodal transportation system in Minnesota. A number of these goals directly relate to advancing sustainability and public health:
(10) to ensure that the planning and implementation of all modes of transportation are consistent with the environmental and energy goals of the state;
(11) to promote and increase the use of high-occupancy vehicles and low-emission vehicles;(13) to increase use of transit as a percentage of all trips statewide by giving highest priority to
the transportation modes with the greatest people-moving capacity and lowest long-term economic and environmental cost;
(14) to promote and increase bicycling and walking as a percentage of all trips as energy-efficient, nonpolluting, and healthy forms of transportation;
(15) to reduce greenhouse gas emissions from the state’s transportation sector; and (16) to accomplish these goals with minimal impact on the environment.
EXECUTIVE ORDER 19-37:
Establishing the Climate Change Subcabinet and the Governor’s Advisory Council on Climate Change to Promote Coordinated Climate Change Mitigation and Resilience Strategies in the State of MinnesotaIn 2019, Governor Walz signed Executive Order 19-37 to address the size and scope of the climate crisis, rally the resources of state government, and push the state forward on climate action. The executive order describes the existential threat of climate change to all Minnesotans, including risks for our health and wellbeing, natural resources, and our economy and ways of life. It also highlights that significant disparities exist in Minnesota and that existing disparities mean climate risks are not distributed equally; some communities bear a disproportionate burden of the negative impacts. Therefore, we must consider differences based on race, gender, geography, and economic status and make sure Minnesota’s climate solutions consider equity, respond to community needs, and bring benefits to all Minnesotans. EO 19-37 established the Climate Change Subcabinet and the Governor’s Climate Change Advisory Council to address these issues.

SUSTAINABILITY AND PUBLIC HEALTH 2020 ANNUAL REPORT 3
EXECUTIVE ORDER 19-27:
Directing State Government to Conserve Energy and Water, and Reduce Waste to Save MoneyExecutive Order 19-27 requires MnDOT report and make progress on six sustainability goals:
� Reduce fleet fossil fuel consumption: 30% reduction of state fleet consumption of fossil fuels by 2027 relative to a 2017 adjusted baseline � Reduce water consumption: 15% reduction of water use by 2025 relative to a 2017 adjusted baseline � Sustainable Procurement: 25% of total spend on priority contracts are sustainable purchases by 2025
� Reduce greenhouse gas emissions: 30% reduction of greenhouse gas emissions by 2025 relative to a 2005 calculated baseline � Reduce energy consumption: 30% reduction in consumption of energy per square foot by 2027 relative to a 2017 adjusted baseline � Reduce solid waste: 75% combined recycling and composting rate of solid waste by 2030
Collaboration and Partnerships The Sustainability and Public Health Division leads sustainability and public health planning and coordination at MnDOT but progress hinges on involvement from staff across the agency. MnDOT also relies on partnerships with other state agencies, regional and local partners, and the public to set sustainability and public health strategies for the agency to implement. In addition to the key groups listed below, the Sustainability and Public Health Division collaborates with topic-specific internal work groups and broader national coalitions to guide agency sustainable transportation efforts.
Internal Stakeholders SUSTAINABLE TRANSPORTATION STEERING COMMITTEEThe internal MnDOT Sustainable Transportation Steering Committee (STSC) was created in 2016 to provide leadership, strategic direction, and oversight for high-priority natural resource issues and agency-wide environmental sustainability agency activities, including greenhouse gas mitigation, climate adaptation, and promoting public health and healthy communities.
The STSC helps identify agency sustainable transportation priorities and performance indicators. Members support sustainable transportation communications to ensure agency-wide understanding and adherence to sustainable transportation policies, guidance, and direction. The STSC also coordinates and supports other agencies and the Governor’s office on statewide sustainability efforts.
Pages from the first Sustainability Report commissioned by the STSC in 2016
MnDOT 2016 Sustainability Report
10
Facilities Metric Target Results Trend Analysis
Greenhouse Gas Emissions Total carbon dioxide equivalent (CO2e)emissions generated annually by MnDOT-owned facilities
21,880metric tons CO2e
-30% by 2005 from 2025
30,113 metric tons CO2e
*
2015
1.8 MMT CO2e5 reduction (-3% from CY15 total) needed
each year to meet 2025 target.
Progress Needed: -27%
Total Energy UseTotal annual electricity and natural gas consumption at MnDOT-owned facilities in billion British Thermal Units (BBTU)
236 BBTU
-20% from 2008 to 20255
2716
BBTU2015
MnDOT used less energy in 2015 than in 2008. Usage fluctuates partly due to weather. 3.5 BBTU average reduction (-1% from CY15 total) needed each year to meet target.
Progress Needed: -13%
Renewable Energy Amount of renewable energy as percent of total energy used by MnDOT**
25%Total energy by 20257
0.3%Capacity
Solar = 40 kWWind=35 kW
Geothermal=80,000 kBTU
2.5% annual increase needed to meet 2025 target.
Progress Needed: +25 percentage points
Waste Generated Total annual waste generated by the Metro District facilities owned by MnDOT
To be set in 2018 -25% from 2017 by
2025
1765 metric tons***
2014
Metro District data is illustrative as MnDOT begins collecting statewide data in CY17. Related efforts include agency-wide elimination of F-list hazardous chemicals.
Progress Needed: NA
Waste Recycled Total annual waste diverted through recycling by Metro District facilities owned at MnDOT8
60% reduction until 2030 then 75% for Metro9
79%of total waste generated***
2014
MnDOT begins collecting statewide data in CY17. Metro District data is illustrative only.
Progress Needed: Target currently exceeded for Metro District
Water Consumption Total water consumed at MnDOT-owned sites annually
TBD 114 million gallons****
MnDOT conserves water through EPA Water Sense best practices and on-site treatment. Weather also affects water needs for winter brine and summer dust control.
296271
FacilitiesEnergy Use
236
0
350000000
ElectricityNatural gas1508 25
1514 1765FacilitiesWaste Generated
08 14Waste Landfilled Waste Recycled
79%
FacilitiesWaste Recycled
0
100
25
60%75%
08 14
Desir
ed Tr
end
Desir
ed Tr
end
Desir
ed Tr
end
Desir
ed Tr
end
* Some minor differences in report GHG emissions stem from historical GHG emissions calculated using B3 benchmarking system and future emissions based on emissions from The Climate Registry.** Includes MnDOT 35 kW wind turbine at D8 Slayton Truck Station and 40 kW solar array at D6 headquarters in Rochester. Geothermal energy indirectly helps MnDOT with on-site renewable energy goals by reducing the total energy we consume. *** Currently, Metro District only. 2016 waste generation data will be available for all Districts beginning March 2017.**** Annual water consumption includes a combination of metered values and estimates typical wastewater flow rates for various facility types and sources (e.g., rest areas, office buildings, etc.)
FacilitiesWater Consumption
Facilities and Operations Rest Areas
80 M34 M
15
14
13
12
11
10
09
08
FacilitiesGreenhouse Gases
31.2 K
08 15 25
30.121.8
MnDOT 2016 Sustainability Report
17
Appendix A The following are statutes and Executive Orders related to efforts in the 2016 MnDOT Sustainability Report.
State Laws
• MN Statute 174.01 – Transportation Goals
• (10) ensure planning and implementation of all modes of transportation are consistent with the environmental and energy goals of the state
• (15) reduce GHG emissions from state transportation sector
• MN Statute 174.02 Subd 1a (3): Department mission that, within department resources, commissioner shall endeavor to minimize degradation of air, water, and the climate, including reducing GHG emissions.
• MN Statute 174.03 Subd 1a (3): [in the SMTP] identify performance targets for measuring progress and achievement of transportation system goals, objectives or policies
• MN Statute 216H.02 (Next Generation Energy Act): Set goal to reduce statewide GHG emissions across all sectors, including transportation, at least 15% below 2005 levels by 2015, 30% below 2005 levels by 2025, and 80% below 2005 levels by 2050.
Executive Orders
• EO 11-12 (Providing for Job Creation through Energy Efficiency and Renewable Energy Programs for Minnesota’s Public Buildings): directs state agencies to adopt cost-effective energy conservation and renewable energy to reduce energy consumption by up to 25%
• EO 11-13 (Strengthening State Agency Environmental, Energy and Transportation Sustainability): directs state agencies to prevent pollution through waste reduction and recycling and conserve energy and reduce GHG emissions from state buildings and vehicles.
• EO 16-07 (Directing Steps to Reverse Pollinator Decline and Restore Pollinator Health in Minnesota): directs state agencies to coordinate efforts to promote pollinator health.
International Agreements
• Under 2 MOU: Minnesota commits to 80% - 90% GHG reduction targets from 1990 levels by 2050, including a transportation goal to further adopt ZEVs. 167 jurisdictions in 3 counties on six continents have signed on.
Minnesota Department of Transportation
SUSTAINABILITY REPORTEstablishing a Baseline (2016)
FEBRUARY 2017

SUSTAINABILITY AND PUBLIC HEALTH 2020 ANNUAL REPORT 4
External Stakeholders SUSTAINABLE TRANSPORTATION ADVISORY COUNCILThe Sustainable Transportation Advisory Council (STAC) makes recommendations to the MnDOT Commissioner to help the agency reduce carbon pollution from the transportation sector in Minnesota, consistent with the MnDOT statutory goals outlined in Minn. Statute 174.01, the Next Generation Energy Act, and the annual MnDOT Sustainability Report.
MnDOT views the STAC as long form public engagement. Recommendations that prioritize climate action and equity are driven by the members.
The goal of the STAC is to help Minnesota transition to a low-carbon transportation system consistent with statutory goals for energy and emissions reductions to maximize benefits to Minnesota, while recognizing the importance of improving safety, reducing inequities, and supporting economic development.
GOVERNOR’S CLIMATE CHANGE SUBCABINET The Governor’s Climate Change Subcabinet includes executives from 15 state agencies, departments, and boards. The subcabinet was established to take on several actions.
� Identify policies and strategies that will put Minnesota back on track to meet or exceed the Next Generation Act goals to reduce greenhouse gas emissions
� Identify policies and strategies to enhance the climate resiliency of Minnesota’s natural resources, working lands, and communities, and to assist state agencies, businesses, and local communities to prepare for climate change impacts that cannot be avoided or mitigated
� Engage with Minnesotans on these complex issues
� Promote equitable policy solutions that reduce disparities in Minnesota, ensure a just transition for impacted workers and communities, and encourage green economic development and job creation
Members of Sustainable Transportation Advisory Council together on March 5, 2020 (pre-COVID 19)

SUSTAINABILITY AND PUBLIC HEALTH 2020 ANNUAL REPORT 5
To help identify the most effective policies and strategies, state leaders created action teams to bring together subject matter experts across state agencies and gather deep knowledge about different sectors of our economy and society and the challenges and opportunities each faces from climate change. Action teams engage with thought leaders, community groups, and other stakeholders to initiate new relationships, build upon existing ones, and actively seek input and feedback on climate policy solutions.
MnDOT participates on three action teams to gather input to inform state-level transportation, sustainability, and public health strategies:
� Climate Engagement Team: Executive Order (EO) 19-37 calls for the Climate Change Subcabinet to conduct extensive engagement with Minnesotans to identify opportunities to reduce emissions and build resiliency in
our communities. The Climate Engagement Team is co-led by the EQB, the MPCA, and MnDOT, and tracks engagement activities to coordinate the various levels of engagement happening within the Subcabinet structure.
� Transportation Climate Action Team: MnDOT leads the Transportation Climate Action Team to address climate change and decarbonize the transportation sector in Minnesota. Examples of work include developing analysis, implementation plans, and policies to support the Climate Change Subcabinet.
� Resilience and Adaptation Action Team: MnDOT participates on the Resilience and Adaptation Action Team that leverages a pre-existing inter-agency team to identify the policies and strategies that build resiliency and adaptation called for in EO 19-37.
ADDITIONAL RESOURCES:
Learn more about the STAC � www.dot.state.mn.us/sustainability/advisory-council.html
Learn more about the Governor’s Climate Change Subcabinet � climate.state.mn.us

SUSTAINABILITY AND PUBLIC HEALTH 2020 ANNUAL REPORT 6
Reporting FrameworkThe annual MnDOT Sustainability and Public Health Report is developed by the agency’s Sustainability and Public Health Division.
It is organized to align with the focus areas identified in the Sustainability and Public Health 2020 Strategic Plan.
Each content section begins with an overview of the focus area, a collection of recent accomplishments, and a success story from within the MnDOT districts. Then detailed information about the relevant metrics, targets, and actions is provided.
MetricsEach focus area describes progress on a set of metrics used to measure progress toward targets and help MnDOT make decisions and evaluate the effectiveness of policies, strategies, and investments.
TargetsTargets in the report were established by state statute, executive orders, the MnDOT family of plans, and the Sustainable Transportation Steering Committee.
Planned ActionsEach focus area includes a table of planned actions that were identified by MnDOT subject matter experts and Sustainability and Public Health Division staff to make progress on the targets. The Planned Actions tables list actions along with their status indicator, anticipated completion date, responsible entity, and co-benefits.
MnDOT subject matter experts and Sustainability and Public Health Division staff evaluated the co-benefits of each action based on the evaluation criteria listed to the right.
Focus Areas
Reduce transportation carbon pollution
Lead by example through MnDOT sustainability efforts
� Facilities � Fleet � Highway Operations � Roadside Vegetation � Construction
Support transportation that improves public health for all Minnesotans
� Walking, Biking & Transit � Transportation Equity & Safety
Improve resilience of the transportation system in Minnesota
Evaluating Co-benefitsPotential to reduce greenhouse gas emissions
� Does this action decrease greenhouse gas emissions?
Potential to improve public health � Does the action enhance safety and injury prevention, physical activity and active transportation, environmental health, connectivity, and access or equity?
Potential to support climate resilience � Does the action achieve any of the following?
� Reduce vulnerability of infrastructure or community, increase flood resilience, and support evacuation and emergency response
SUSTAINABILITY AND PUBLIC HEALTH 2020 ANNUAL REPORT
SECTION 1
Reduce Transportation Carbon Pollution
SUSTAINABILITY AND PUBLIC HEALTH 2020 ANNUAL REPORT 8
Transportation Sector
3 MnDOT 2019 Omnibus Study Final Report4 Pathways to Decarbonizing Transportation in Minnesota, August 2019
OverviewTransportation is the number one source of carbon pollution in Minnesota and the US. Emissions sources in the transportation sector include on-road vehicles, airplanes and other aviation equipment, trains, vehicle air conditioning, and natural gas pipelines. Past work to reduce carbon pollution has been directed by the legislature and through internal leadership in related plans, goals, and performance measures.
Despite past efforts, limited progress has been made to reduce carbon pollution from transportation to meet our state’s climate change goals. Some Minnesotans believe that MnDOT could champion further progress. 58% of 2019 Omnibus Survey respondents agreed that “MnDOT strives to reduce the transportation sector’s impact on our climate and planet.”3
In 2019, MnDOT initiated the inter-agency Pathways to Decarbonizing Transportation project to identify options to move toward a low-carbon transportation future and put the state on track to meet climate goals in the Next Generation Energy Act (NGEA). The project built on goals MnDOT adopted in 2017 to apply the NGEA goal to the transportation sector in Minnesota.
Pathways explored opportunities to reduce carbon pollution from surface transportation:
� Passenger cars and trucks
� Medium-duty and heavy-duty trucks
� Buses
� Motorcycles
� Mobile air conditioning
MnDOT used feedback from technical experts and the public to identify a set of actions and recommendations described in the Pathways to Decarbonizing Transportation report.4
2020 Accomplishments � MnDOT established the Sustainable Transportation Advisory Council (STAC) to partner with business, nonprofits, local governments, and community groups to help reduce carbon pollution from transportation in Minnesota.
� The MnDOT Sustainability and Public Health Division launched the Clean Transportation Pilot program that will distribute up to $2,000,000 annually in grants ranging from $25,000 to $500,000 to pilot, test, and increase adoption of clean transportation technologies with a focus on environmental justice and rural Minnesota where cost can be a barrier to implementation.
� MnDOT leadership served on the Governor’s Climate Change Subcabinet to help the Walz-Flanagan Administration pursue bold and collaborative action to combat climate change.
� MnDOT began analyzing carbon pollution from transportation project construction and operations (traffic emissions) as part of the environmental analysis process.
� Transportation sector greenhouse gas emissions
� Vehicle miles traveled
� Vehicle miles traveled per capita
� Electric vehicles
� Biofuel use
MET
RIC
S

SUSTAINABILITY AND PUBLIC HEALTH 2020 ANNUAL REPORT 9
Measuring Progress
2014
40.9M
2015
39.9M
2016
40.2M
2017
40.2M
2018
40.2M
2019
42.2M
MET
RIC
TON
S C
O2e (
MIL
LIO
NS)
Figure 1.1: Sector GHG Emissions
TARGET: 29.5 M
MnDOT Estimate
Transportation Sector Carbon Pollution
TARGET: Reduce carbon pollution from this sector to 29.5 million tons CO2e by 2025 (30% reduction from 2005 levels)
RESULTS: Carbon pollution from transportation in Minnesota decreased by 7% from 2005 to 2018.
Carbon pollution from transportation in Minnesota decreased by 7% from 2005 to 2018, with reductions credited to federal fuel efficiency standards. However, little progress has been made since 2009. Within the transportation sector, more than 70% of emissions come from passenger vehicles, light-duty trucks (including SUVs), and medium- and heavy-duty trucks.
The consumer trend of owning larger vehicles and driving them more miles is preventing more significant emissions reductions in this sector. MnDOT predicts a slight increase in transportation-related carbon pollution in 2019.
Vehicle Miles Traveled
PRELIMINARY TARGET: MnDOT is working with partners to adopt a vehicle miles traveled (VMT) reduction goal
RESULTS: In 2019, VMT increased 1% from 2018 levels.
VMT in Minnesota has continued to increase since 2016. VMT grew to 60.7 billion in 2019, a 1% increase from 2018 that mirrors the 1% population growth during the same time period. Higher use of single occupancy vehicles, higher housing costs, and a disconnect between jobs and transit access are likely contributors to this trend. In 2021, MnDOT agreed to a VMT reduction goal of 20% by the year 2050, as recommended by the STAC. The agency will work with partners to finalize the goal in early 2022.
VMT can vary by geography and by mode. MnDOT is creating a new intergovernmental climate change council to guide VMT reduction strategies that take factors like geography and mode into account.

SUSTAINABILITY AND PUBLIC HEALTH 2020 ANNUAL REPORT 10
Vehicle Miles Traveled Per CapitaIn 2019, VMT per capita was 9,862 miles by non-freight motor vehicles. Twin Cities VMT per capita was 8,720 miles, and Greater Minnesota VMT per capita was 11,286 miles. These numbers show a slight decrease from 2018 VMT per capita, but an increase from 2016. Understanding Minnesotans’ travel habits, especially by single occupancy vehicle, provides one lens for understanding how travel impacts greenhouse gas emissions. Although the issue is complex, higher use of single occupancy vehicles contributes to higher emissions.
Electric Vehicles
TARGET: 20% of light-duty vehicles in Minnesota are electric by 2030
RESULTS: As of February 2021, 18,749 EVs were registered in Minnesota.
Electric vehicle (EV) registrations continued to increase in 2020. As of February 2021, 18,749 EVs were registered in Minnesota. Growth in battery electric vehicle registrations outpaced growth in plug-in hybrid electric vehicle registrations at 55% and 37%, respectively, between 2019 and 2020. Over 80% of the EVs are registered in the seven-county Metro area. More than one million additional EVs are needed in the next ten years to achieve the state goal.
Statewide Biofuel UseBiofuel consumption in Minnesota increased 5.7% between 2017 and 2018. 2020 biofuel use data is not yet available.
MIL
ES T
RAVE
LED
Figure 1.2: Vehicle Miles Traveled
2017
59.9Mmiles
9,942 miles
2018
60.4Mmiles
9,927 miles
2019
60.8Mmiles
9,862 miles
Miles per capita trend line
2016
58.8Mmiles
9,823 miles
Figure 1.3: Electric Vehicles
VEH
ICLE
S (T
HO
USA
ND
S)
2016
Plug-in Hybrid Electric Vehicle Battery Electric Vehicle
2018
3,871
4,057
2019
5,528
7,221
2020
7,565
11,184
2017
2,442
1,962
749 543
BARR
ELS
Figure 1.4: Statewide Biofuel Use
2014 2015 2016 2017 2018 2019
7.4M 7.8M 8M 7.9 7.7M 7.5M
1.6M1.8M 1.9M 1.9M 2.8M 3.6M
Ethanol Barrels Biodiesel Barrels

SUSTAINABILITY AND PUBLIC HEALTH 2020 ANNUAL REPORT 11
Transportation Sector: 2021 Planned Actions Table The following actions will be led and/or supported by the MnDOT Sustainability and Public Health Division along with other agency partners in 2021. These include actions initiated by MnDOT and those developed in response to STAC recommendations. The table identifies actions with a clear role in reducing carbon pollution,
improving public health, and supporting climate resilience. For example, reducing emissions from tailpipes has the potential to benefit public health as vehicles make up about a quarter of air pollution emissions in Minnesota and are a primary source of health risks from outdoor air pollution in the state. Additional mode-specific actions are described in the “Walking, Biking, and Transit” section of the report.
ACTION STATUS COMPLETE BY
POTENTIAL TO…
Reduce GHG emissions
Improve public health
Support climate resilience
1 Lead a stakeholder process to develop a Clean Fuels Policy for the state (pending legislative support (update for release)
NOT STARTED
End of 2021
2 Lead development of Minnesota 2021 Strategic EV Plan IN PROGRESS
Summer 2021
3 Co-lead development of multi-state EV corridor Memorandum of Understanding
IN PROGRESS
Fall 2021
4 Serve on steering committee to clarify opportunities to co-locate broadband and electricity transmission along highways
IN PROGRESS
Summer 2021
5 Finalize statewide and per capita VMT reduction goals through engagement on the Statewide Multimodal Transportation Plan update
NOT STARTED
Winter 2022
6 Add a new top tier for travel demand management to existing mobility investment approach
NOT STARTED
End of 2021
7 Create new intergovernmental climate change committee to identify options to reduce VMT and carbon pollution
NOT STARTED
Summer 2021
8 Develop communications to highlight benefits of transit and high occupancy vehicles on MnDOT projects
NOT STARTED
End of 2021

SUSTAINABILITY AND PUBLIC HEALTH 2020 ANNUAL REPORT
SECTION 2
Lead by Example through MnDOT Sustainability Efforts

SUSTAINABILITY AND PUBLIC HEALTH 2020 ANNUAL REPORT 13
Facilities
5 Executive Order 19-27, Directing State Government to Conserve Energy and Water, and Reduce Waste to Save Money6 Executive Order 19-25, Advancing Energy Efficiency and Renewable Energy Programs for Minnesota’s Public Buildings
� Facilities greenhouse gas emissions
� Energy intensity
� Renewable energy
� Water consumption
� Municipal solid waste recycling rate
MET
RIC
S
OverviewMnDOT is committed to using resources efficiently at agency-owned and operated facilities. The agency owns over 1,000 buildings totaling over 6.2 million square feet. Operating facilities consumes energy, water, and waste. Executive Order 19-275 directs state agencies to use these resources responsibly. Resource use at agency facilities declined in 2020 as some MnDOT staff and members of the public worked from home and traveled less.
EnergyNatural gas or propane are used for most building heating systems and electricity is typically used for operating appliances, lighting, and cooling. MnDOT facilities are served by over 80 different utilities, including investor-owned utilities, local public utilities, municipal utilities, and electric cooperatives.
Executive Order 19-256 requires state agencies to adopt cost-effective energy efficiency and renewable energy strategies to reduce energy use per square foot by 30% from 2008 levels by 2027 and pursue renewable energy strategies to reduce greenhouse gas emissions by 30% from 2005 levels by 2025. MnDOT is required to
establish site-specific goals to reduce energy use at agency-owned facilities.
WaterWater is used for plumbing and irrigation at MnDOT facilities. Treating and pumping water uses energy and generates carbon pollution. Reducing water offers many benefits including reducing energy and costs, and less wear and tear on equipment. Less water use also means less drawdown on local aquifers, less treated wastewater being discharged into the watershed, and increased resiliency in our wastewater system to handle extreme climatic events.
WasteMnDOT office workers create municipal solid waste (MSW), which includes items like paper, cans, and cardboard, and most MnDOT facilities offer recycling and trash collection for staff and visitors. Agency operations also produce specialty waste, which includes items like fluorescent lightbulbs, motor oil, and batteries. MnDOT encourages staff to recycle specialty waste whenever possible.
Chaska truck station, with rainwater collection system and geothermal heat pumps for heating and cooling
SUSTAINABILITY AND PUBLIC HEALTH 2020 ANNUAL REPORT 14
2020 Accomplishments � Worked with solar developer to install one MW solar garden at former gravel pit in Afton
� Completed five-year facility energy plans in Metro District and District 4 to identify energy efficiency and renewable energy strategies
� Continued to implement temperature set point standards
� Upgraded building automation systems, including at St. Cloud headquarters
� Chiller replacement at Maplewood Lab
� Continued retro-commissioning efforts
� Achieved significant water savings at Enterprise Rest Area in District 6. In 2019, the District replaced high flow toilets. Between 2018 and 2020, water consumption dropped from 1.1 million gallons to 245,000 gallons.
� Installed washwater reuse stations at two truck stations to make brine
� Used 80% less paper in 2020 compared to 2019
DISTRICT IN THE SPOTLIGHT:
District 7 Saves Money and Reduces Carbon Pollution with Switch to LEDs
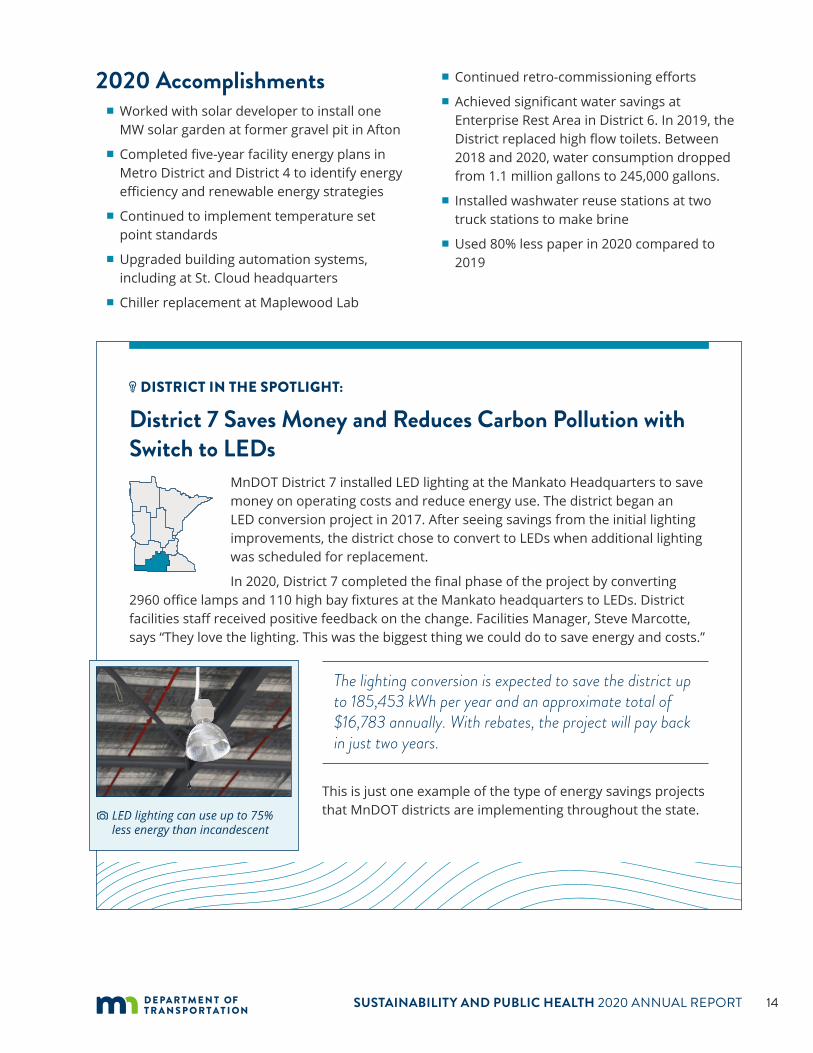
MnDOT District 7 installed LED lighting at the Mankato Headquarters to save money on operating costs and reduce energy use. The district began an LED conversion project in 2017. After seeing savings from the initial lighting improvements, the district chose to convert to LEDs when additional lighting was scheduled for replacement.
In 2020, District 7 completed the final phase of the project by converting 2960 office lamps and 110 high bay fixtures at the Mankato headquarters to LEDs. District facilities staff received positive feedback on the change. Facilities Manager, Steve Marcotte, says “They love the lighting. This was the biggest thing we could do to save energy and costs.”
The lighting conversion is expected to save the district up to 185,453 kWh per year and an approximate total of $16,783 annually. With rebates, the project will pay back in just two years.
This is just one example of the type of energy savings projects that MnDOT districts are implementing throughout the state.LED lighting can use up to 75%
less energy than incandescent

SUSTAINABILITY AND PUBLIC HEALTH 2020 ANNUAL REPORT 15
Measuring Progress
2008 2014
39,448
34,090 33,698 32,88830,694
35,89434,598
31,584
28,588 27,85228,894 28,594
23,943
2009 20152010 20162011 20172012 20182013 2019 2020
MET
RIC
TON
S C
O2e
Figure 2.1: Facility GHG Emissions
Facilities Greenhouse Gas Emissions
TARGET: Reduce greenhouse gas emissions by 30% from 2005 levels by 2025
RESULTS: Between 2008 and 2020, the agency reduced greenhouse gas emissions from MnDOT owned and operated facilities by 39%.
Between 2008 and 2020, the agency reduced greenhouse gas emissions from MnDOT owned and operated facilities by 39%. A cleaner electricity grid, energy efficiency projects, and renewable energy projects drove the improvements between 2008 and 2019. During that time, statewide average energy grid intensity improved by approximately 30%. Between 2019 and 2020, greenhouse gas emissions from MnDOT facilities dropped by 16% because of energy efficiency improvements, mild weather, and increased teleworking. Additional details about these factors are provided above.
7 Weather normalized data demonstrates the energy facilities would have used under average weather conditions.
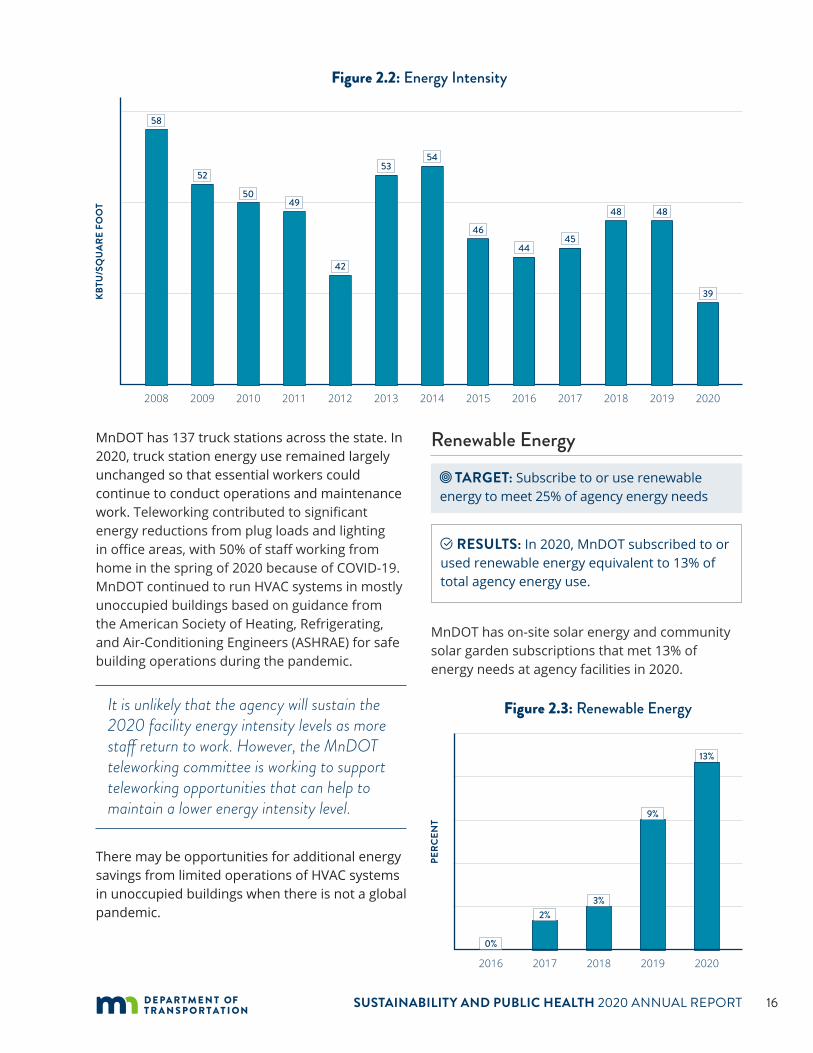
Energy Intensity
TARGET: Reduce energy intensity by 30% from 2008 levels by 2025
RESULTS: Between 2008 and 2020, the agency reduced energy consumption per square foot by 33%.
Between 2008 and 2020, the agency reduced energy consumption per square foot by 33%. Energy efficiency projects drove the improvements between 2008 and 2019. Between 2019 and 2020, facility energy intensity dropped by 19% from 48 KBTU/square foot to 39 KBTU/square foot because of energy efficiency improvements, mild weather, and increased teleworking. In 2020, the agency continued to implement energy efficiency projects. The weather-normalized energy intensity7 between 2019 and 2020 decreased by 6%.
SUSTAINABILITY AND PUBLIC HEALTH 2020 ANNUAL REPORT 16
2008 2014
58
52
5049
42
5354
46
4445
48 48
39
2009 20152010 20162011 20172012 20182013 2019 2020
KBTU
/SQ
UAR
E FO
OT
Figure 2.2: Energy Intensity
MnDOT has 137 truck stations across the state. In 2020, truck station energy use remained largely unchanged so that essential workers could continue to conduct operations and maintenance work. Teleworking contributed to significant energy reductions from plug loads and lighting in office areas, with 50% of staff working from home in the spring of 2020 because of COVID-19. MnDOT continued to run HVAC systems in mostly unoccupied buildings based on guidance from the American Society of Heating, Refrigerating, and Air-Conditioning Engineers (ASHRAE) for safe building operations during the pandemic.
It is unlikely that the agency will sustain the 2020 facility energy intensity levels as more staff return to work. However, the MnDOT teleworking committee is working to support teleworking opportunities that can help to maintain a lower energy intensity level.
There may be opportunities for additional energy savings from limited operations of HVAC systems in unoccupied buildings when there is not a global pandemic.
Renewable Energy
TARGET: Subscribe to or use renewable energy to meet 25% of agency energy needs
RESULTS: In 2020, MnDOT subscribed to or used renewable energy equivalent to 13% of total agency energy use.
MnDOT has on-site solar energy and community solar garden subscriptions that met 13% of energy needs at agency facilities in 2020.
PERC
ENT
Figure 2.3: Renewable Energy
2016 2017 2018 2019 2020
0%
2%3%
9%
13%

SUSTAINABILITY AND PUBLIC HEALTH 2020 ANNUAL REPORT 17
The agency made significant progress on the renewable target in 2019 by subscribing to two community solar gardens for 6.6 million kWh of electricity annually. In 2020, MnDOT worked with a solar developer to install a one MW community solar garden at a former gravel pit in Afton, Minnesota. The agency receives utility bill credits for 40% of the energy production from the garden. The MnDOT Metro District saved $995 through bill credits received for 49,784 kWh of solar production from the Afton community solar garden between October and December 2020.
Water Consumption
TARGET: Reduce water use by 15% from 2017 levels by 2025
RESULTS: Between 2017 and 2020, MnDOT reduce water use at agency owned and operated facilities by 27%.
Between 2017 and 2020, MnDOT used 27% less water at agency-owned and operated facilities. Building closures, fixture replacements, and operational changes due to COVID-19 drove the significant change in water use between 2019
and 2020. In 2020, approximately 70% of MnDOT facilities used less water than in 2019. It is unlikely that the agency will sustain the 2020 water use levels as more staff return to work. However, MnDOT is working to support teleworking opportunities and implement water conservation measures that can help to maintain efficient water use at MnDOT facilities.
Municipal Solid Waste Recycling Rate
TARGET: Achieve 75% recycling and composting rate by 2030
RESULTS: Agency facilities had a 14% recycling rate, not including recycling data from Central Office in St. Paul.
The Municipal Solid Waste (MSW) recycling rate at MnDOT held steady at 24% from 2018 to 2019. 2020 saw an increase in the number of sites reporting waste data: 217 MnDOT sites provided waste data in 2020 compared to 184 the year before. The recycling rate is generally higher at district headquarters and truck stations than rest areas. Data from Central Office were not availble to compute the overall recycling rate for 2020.
*2020 data do not include Central Office waste reporting.
2017
GAL
LON
S
Figure 2.4: Water Consumption
2018 2019 2020
52,607,940
43,809,200
36,060,830
49,635,460
2016 2017
PERC
ENT
OF
WAS
TE R
ECYC
LED
Figure 2.5: MSW Recycling Rate
2018 2019 2020
6% 6%
24% 24%
14%*

SUSTAINABILITY AND PUBLIC HEALTH 2020 ANNUAL REPORT 18
MnDOT Facilities: 2021 Planned Actions Table Many of the planned actions have the potential to reduce greenhouse gas emissions by using less energy or using renewable energy. By drawing less energy from power plants, the actions will
reduce air pollutants and improve public health. The actions that reduce water consumption have the potential to support climate resilience by drawing less on local aquifers, discharging less wastewater into the watershed, and increasing the wastewater system capacity to handle extreme climatic events.
ACTION STATUS COMPLETE BY
POTENTIAL TO…
Reduce GHG emissions
Improve public health
Support climate resilience
1 Develop facility energy plans for two additional MnDOT Districts that identify energy efficiency and renewable energy projects
NOT STARTED
End of 2021
2 Remove barriers to implementation for compliance with agency temperature set points
IN PROGRESS
Ongoing
3 Continue energy efficiency projects, e.g., building automation, upgrades to equipment, and lighting
IN PROGRESS
Ongoing
4 Issue RFP for community solar garden subscriptions for Metro District facilities
IN PROGRESS
Spring 2021
5 Pilot organics recycling at MnDOT facilities in Greater Minnesota NOT STARTED
End of 2021
6 Evaluate opportunities to expand organics recycling at Metro District facilities
NOT STARTED
End of 2021
7 Implement water fixture improvements in the 2018 Facility Water Reduction Assessment
IN PROGRESS
Ongoing
8 Add urinals to reduce water use in bathrooms as they are updated
IN PROGRESS
Ongoing
9 Add water conservation measures in new building construction and existing building renovation
IN PROGRESS
Ongoing

SUSTAINABILITY AND PUBLIC HEALTH 2020 ANNUAL REPORT 19
Fleet
8 Minn. Stat. 16C.137 Minimizing Energy Use; Renewable Fuels
� Fleet greenhouse gas emissions
� Fleet fossil fuel use
� Light duty fuel efficiency
� Electric vehicles
� Employee-owned auto mileage
MET
RIC
S
OverviewMnDOT uses a variety of vehicles and fuels to perform maintenance, deliver snow and ice services, transport employees, perform electrical work, assess environmental conditions, and provide services for safety of the traveling public. The agency used more than 4,500 vehicles in 2020, including over 1,300 light-duty vehicles (33 hybrid vehicles and 39 electric), 2,200 medium- and heavy-duty vehicles, and 1,000 off-road vehicles. The agency is committed to reducing fossil fuel use from MnDOT fleet vehicles by purchasing fuel efficient vehicles, using clean fuels, and operating vehicles efficiently.
The agency has a long-range capital improvement plan that tracks fleet life-cycles, purchase price, and projected future capital costs to inform decision-making about fleet replacement and purchasing. MnDOT also has a light duty fleet selection tool that guides fleet managers toward smaller vehicles for moving people and electric options when purchasing sedans and SUVs. Minn. Stat. 16C.1378 calls for state departments, whenever legally, technically, and economically feasible, subject to the specific needs of the department and responsible management of agency finances, ensure that all new on-road vehicles purchased, excluding emergency and law enforcement vehicles, use “cleaner fuels”, have fuel efficiency ratings over 30 miles per gallon for city usage or 35 miles per gallon for highway usage, or are powered solely by electricity.
2020 Accomplishments � Began statewide rollout of nearly 3,000 telematics devices to track vehicle use and idling
� Performed a needs analysis for EV chargers for the MnDOT fleet
� Developed educational materials for MnDOT staff use of EVs and chargers
� Partnered with biofuel industry leader MEG Corp to train staff on use and storage of biofuels
� Piloted use of higher biofuel blends on a small sample of MnDOT heavy-duty vehicles during the “shoulder season”
� Continued to partner with the University of Minnesota to research on snow plow engine performance and route design to reduce fuel consumption
� Continued implementing standards for idle reduction and fuel savings

SUSTAINABILITY AND PUBLIC HEALTH 2020 ANNUAL REPORT 20
DISTRICT IN THE SPOTLIGHT:
District 6 Pilots Higher Level Biofuel Diesel BlendMnDOT District 6 successfully used higher blends of biodiesel in October and November of 2020. MnDOT currently uses at least 5% biodiesel (B5) fuel from October to April based on the minimum standards in Minn. Stat. 239.77.1 However, it is technically feasible to use at least 20% biodiesel (B20) at temperatures down to 20°F. Higher blends of biodiesel have lower carbon intensity and support the agricultural economy in Minnesota.2
In 2020, MnDOT launched a pilot to test a new process for using B20 and B10 instead of B5 based on weather conditions during October and November. The Office of Sustainability and Public Health staff provided a simple tool for inventory staff and shop supervisors that combined historic and forecasted weather data with specifications for B10 and B20 use. District 6 inventory staff, shop supervisors, and Sustainability and Public Health staff worked together to develop fuel orders for the Owatonna and Rochester MnDOT bulk fuel tanks used for MnDOT fleet vehicles.
At the Owatonna headquarters, fleet drivers used B10 through mid-November. By purchasing 3,000 gallons of B10 and 6,000 gallons of B20 instead of B5, District 6 reduced petroleum diesel consumption by 1,050 gallons.3
Districts 7 and 8 also tested higher level biofuel blends of diesel fuel in October and November 2020. The pilot will continue in the spring of 2021. MnDOT will use the final results of the pilot to inform the development of agency-wide recommendations on biodiesel purchasing at agency bulk fuel sites.
1 Minn. Stat. 239.77 Biodiesel Content Mandate2 Benefits of Biofuel Production and Use in Minnesota, U.S. Department of Energy3 B20 is 80% diesel, B10 is 90% diesel, and B5 is 95% diesel
A gallon of B20 biodiesel generates 15% less carbon pollution than a gallon of B5 biodiesel

SUSTAINABILITY AND PUBLIC HEALTH 2020 ANNUAL REPORT 21
Measuring ProgressFleet Greenhouse Gas Emissions
TARGET: Reduce greenhouse gas emissions from fuel used by MnDOT vehicles 30% from 2017 levels by 2025
RESULTS: Between 2017 and 2020, fleet greenhouse gas emissions increased by 20%.
Between 2017 and 2020, fleet greenhouse gas emissions increased by 20%. MnDOT generated 11% less greenhouse gas emissions from fleet in 2020 compared to 2019. Greenhouse gas emissions were lower because the agency used less fossil fuel.
Fleet Fossil Fuel Use
TARGET: Reduce fossil fuel use from MnDOT vehicles by 30% from 2017 levels by 2025
RESULTS: Between 2017 and 2020, fossil fuel use by MnDOT vehicles increased 20%.
9 Minnesota Executive Order 20-20 Directing Minnesotans to Stay Home
MnDOT fleet vehicles used 11% less fossil fuel in 2020 compared to 2019, reversing the multi-year trend of increased fossil fuel use.
Heavy duty vehicles drove the reduction, using about 20% less fuel in 2020 than 2019. Part of this is likely due to the less severe winter and fewer construction projects. Light duty vehicles used 8% less fuel in 2020 than 2019 because motor pool vehicle use declined starting in March 2020 when Governor Walz directed all workers who could work from home to do so.9
MET
RIC
TON
S C
O2e
Figure 2.6: Fleet GHG Emissions
2017
36,313
2018
42,601
2019
49,412
2020
43,667
TARGET: 26.5
B5 Diesel B20 Diesel Gas Ethanol
GAL
LON
S
Figure2.7: Fossil Fuel Use
2017 2018 2019 2020
Total fossil fuel targets:
2.4MGallons
1.8MGallons
Diesel fossil fuel target:TARGET: 2.4M
1,670,505
803,694
897,447
80,072
2,007,501
1,162,791
945,765
82,851
2,662,273
938,298
1,238,501
36,357
2,035,821
1,002,046
1,382,145
11,645
SUSTAINABILITY AND PUBLIC HEALTH 2020 ANNUAL REPORT 22
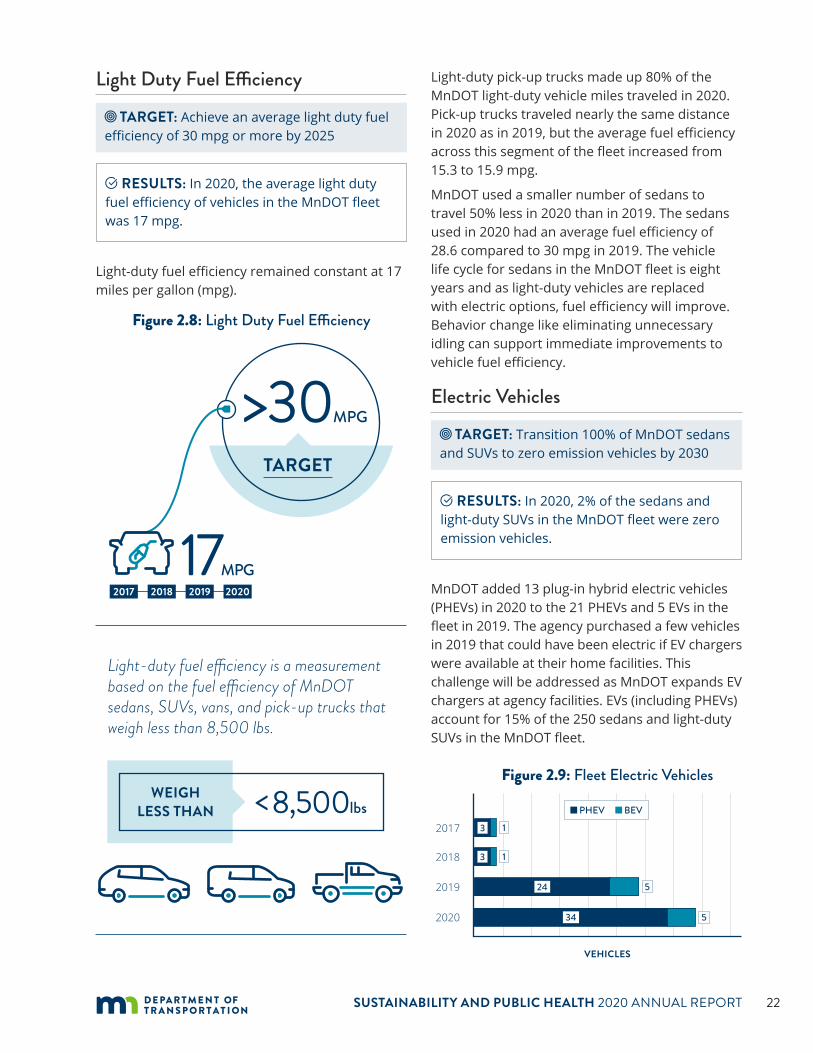
Light Duty Fuel Efficiency
TARGET: Achieve an average light duty fuel efficiency of 30 mpg or more by 2025
RESULTS: In 2020, the average light duty fuel efficiency of vehicles in the MnDOT fleet was 17 mpg.
Light-duty fuel efficiency remained constant at 17 miles per gallon (mpg).
Light-duty fuel efficiency is a measurement based on the fuel efficiency of MnDOT sedans, SUVs, vans, and pick-up trucks that weigh less than 8,500 lbs.
Light-duty pick-up trucks made up 80% of the MnDOT light-duty vehicle miles traveled in 2020. Pick-up trucks traveled nearly the same distance in 2020 as in 2019, but the average fuel efficiency across this segment of the fleet increased from 15.3 to 15.9 mpg.
MnDOT used a smaller number of sedans to travel 50% less in 2020 than in 2019. The sedans used in 2020 had an average fuel efficiency of 28.6 compared to 30 mpg in 2019. The vehicle life cycle for sedans in the MnDOT fleet is eight years and as light-duty vehicles are replaced with electric options, fuel efficiency will improve. Behavior change like eliminating unnecessary idling can support immediate improvements to vehicle fuel efficiency.
Electric Vehicles
TARGET: Transition 100% of MnDOT sedans and SUVs to zero emission vehicles by 2030
RESULTS: In 2020, 2% of the sedans and light-duty SUVs in the MnDOT fleet were zero emission vehicles.
MnDOT added 13 plug-in hybrid electric vehicles (PHEVs) in 2020 to the 21 PHEVs and 5 EVs in the fleet in 2019. The agency purchased a few vehicles in 2019 that could have been electric if EV chargers were available at their home facilities. This challenge will be addressed as MnDOT expands EV chargers at agency facilities. EVs (including PHEVs) account for 15% of the 250 sedans and light-duty SUVs in the MnDOT fleet.
Figure 2.8: Light Duty Fuel Efficiency
TARGET
17MPG
>30MPG
2017 2018 2019 2020
WEIGH LESS THAN <8,500lbs
Figure 2.9: Fleet Electric Vehicles
VEHICLES
2017
2018
2019
2020
3
3
24
34
1
1
5
5
PHEV BEV

SUSTAINABILITY AND PUBLIC HEALTH 2020 ANNUAL REPORT 23
Employee-owned Auto MileageMnDOT has no target for reducing employee owned auto mileage and does not currently track employee fuel use consistently. MnDOT encourages employees to use the right mode for the right job, including virtual meetings. Employee-owned auto mileage dropped by 46%, primarily due to COVID-19.
During the peak of the pandemic in the spring of 2020, 50% of MnDOT staff worked from home and non-essential travel was eliminated. The MnDOT teleworking committee is working to develop recommendations to reduce employee owned auto mileage when employees return to work in 2021.
MIL
ES T
RAVE
LED
Figure 2.10: Reimbursable Employee-Owned Auto Mileage
2017
2,737,669
2018
2,747,321
2019
3,029,546
2020
1,634,153

SUSTAINABILITY AND PUBLIC HEALTH 2020 ANNUAL REPORT 24
MnDOT Fleet: 2021 Planned Actions Table The following actions are planned for 2021 to reduce the fossil fuel use and greenhouse gas
emissions from the MnDOT fleet. Fleet vehicles powered by fossil fuel generate air pollution, which is a health risk, and reducing emissions from the MnDOT fleet benefits public health.
ACTION STATUS COMPLETE BY
POTENTIAL TO…
Reduce GHG emissions
Improve public health
Support climate resilience
1 Pilot B10 and B20 in MnDOT Districts 6 and 7 fleet, pending weather
IN PROGRESS
Spring 2021
2 Pilot B30 and B50 in one or more MnDOT District fleets NOT STARTED
Fall 2021
3 Track and communicate flags to District staff to eliminate unnecessary idling at MnDOT facilities
IN PROGRESS
Fall 2021
4 Develop recommendations to reduce snow plow route fuel use through route optimization and idle reduction
IN PROGRESS
End of 2021
5 Test anti-idling technology for medium, heavy-duty, and/or off-road vehicles in one or more MnDOT District fleets
NOT STARTED
End of 2021
6 Partner with Xcel Energy and Sawatch labs to electrify MnDOT vehicles and address charging needs
IN PROGRESS
Fall 2021
SUSTAINABILITY AND PUBLIC HEALTH 2020 ANNUAL REPORT 25
Highway Operations
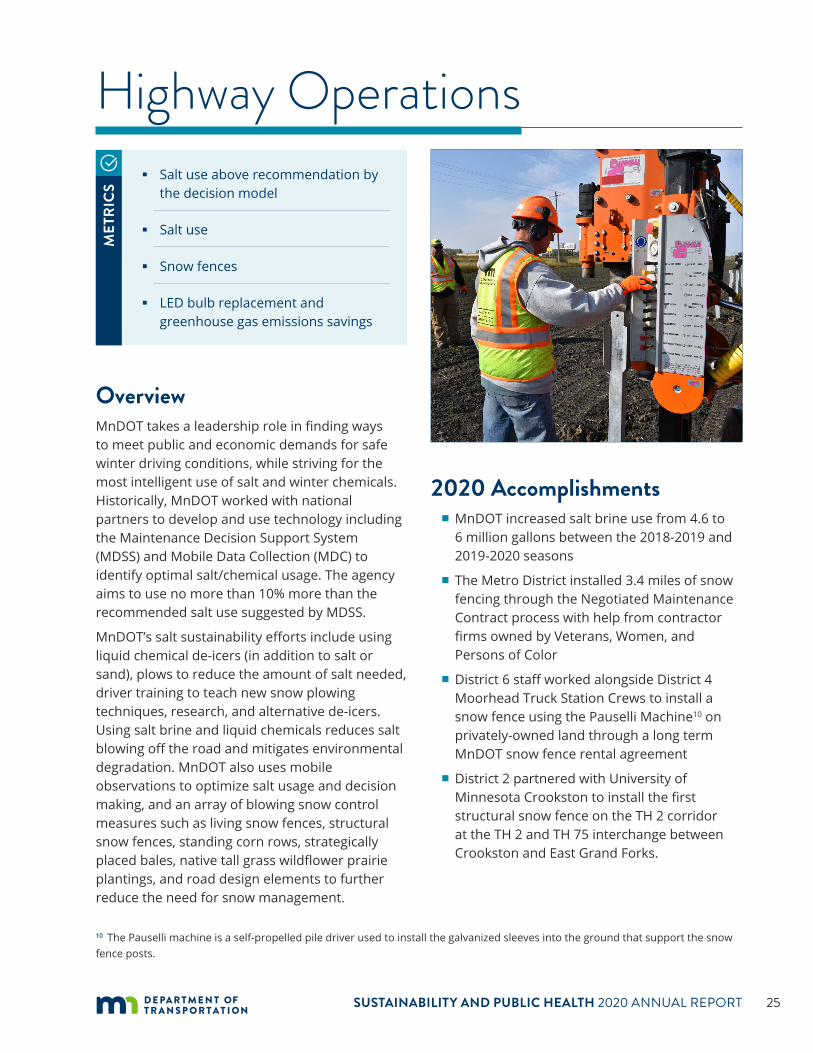
10 The Pauselli machine is a self-propelled pile driver used to install the galvanized sleeves into the ground that support the snow fence posts.
� Salt use above recommendation by the decision model
� Salt use
� Snow fences
� LED bulb replacement and greenhouse gas emissions savings
MET
RIC
S
OverviewMnDOT takes a leadership role in finding ways to meet public and economic demands for safe winter driving conditions, while striving for the most intelligent use of salt and winter chemicals. Historically, MnDOT worked with national partners to develop and use technology including the Maintenance Decision Support System (MDSS) and Mobile Data Collection (MDC) to identify optimal salt/chemical usage. The agency aims to use no more than 10% more than the recommended salt use suggested by MDSS.
MnDOT’s salt sustainability efforts include using liquid chemical de-icers (in addition to salt or sand), plows to reduce the amount of salt needed, driver training to teach new snow plowing techniques, research, and alternative de-icers. Using salt brine and liquid chemicals reduces salt blowing off the road and mitigates environmental degradation. MnDOT also uses mobile observations to optimize salt usage and decision making, and an array of blowing snow control measures such as living snow fences, structural snow fences, standing corn rows, strategically placed bales, native tall grass wildflower prairie plantings, and road design elements to further reduce the need for snow management.
2020 Accomplishments � MnDOT increased salt brine use from 4.6 to 6 million gallons between the 2018-2019 and 2019-2020 seasons
� The Metro District installed 3.4 miles of snow fencing through the Negotiated Maintenance Contract process with help from contractor firms owned by Veterans, Women, and Persons of Color
� District 6 staff worked alongside District 4 Moorhead Truck Station Crews to install a snow fence using the Pauselli Machine10 on privately-owned land through a long term MnDOT snow fence rental agreement
� District 2 partnered with University of Minnesota Crookston to install the first structural snow fence on the TH 2 corridor at the TH 2 and TH 75 interchange between Crookston and East Grand Forks.

SUSTAINABILITY AND PUBLIC HEALTH 2020 ANNUAL REPORT 26
DISTRICT IN THE SPOTLIGHT:
Teamwork and Technology Reduces Salt Use in District 4District 4 significantly decreased salt use during the 2019-2020 season. Over the last five years, the District reduced its five-year running annual average salt use from 14,000 to 11,000 tons. This success came from a coordinated approach to preparing for snow and ice events. Coordination begins before snow and ice season and combines education and conversations between snowplow operators and supervisors about the capabilities and limitations
of salt and alternative chemicals. Staff learn how much ice one pound of salt can melt at different temperatures and how that ties into operational costs.
Before each snow and ice event, staff look ahead to the forecast and decide on the approach to take based on the predicted weather conditions.
During the event, operators account for a variety of factors such as their experience, training, changing weather conditions, MDSS system recommendations, discussions with their peers, and recommendations from their supervisors to decide how much salt to apply.
District leadership also plays a critical role in salt reduction by supporting investment in liquid storage tanks, liquid chemical application equipment, brine makers, ice breakers, tow plows, and other new technology for salt reduction. District 4 is well positioned to blend liquid salt brine with alternative chemicals, such as calcium chloride, at every truck station in the district.
When placed at the recommended rate, one gallon of liquid salt brine uses approximately 70% less rock salt compared to using rock salt alone. At a cost of up to $140/ton, salt reduction efforts reduce operational costs and create efficiencies. MnDOT is committed to reducing salt across the agency and District 4 offers just one example of how staff are leading progress toward MnDOT salt sustainability goals.
The Moorhead Truck Station snow plow truck has the capacity to carry approximately 2800 gallons of salt brine distributed between the side saddle tanks, an inbox storage tank and tanks mounted on the tow plow it pulls behind it.

SUSTAINABILITY AND PUBLIC HEALTH 2020 ANNUAL REPORT 27
Measuring ProgressSalt Use Above Recommendation by the Decision Model
TARGET: Salt use at 100% of Adjusted Recommendation by the Decision Model
RESULTS: During the winter of 2019-2020, salt use was 99% of the adjusted recommendation by the decision model.
The application of salt plays a key role in keeping roads safe during winter months because it lowers the freezing point of water. MnDOT uses a decision model to determine the recommended amount of salt to use on roads, which depends on many variables such as storm type. The decision model performance measure shows how well MnDOT performs against the recommended amount of salt use suggested by the model. The experience gained each winter season allows for continual refinement and improvement of the decision model. The percentage of the recommended amount used in each winter season depends on weather patterns, temperature, and other factors.
Three of the past four winter seasons have hovered just above or slightly below the recommendation by the decision model. The 2018-2019 winter season is a notable exception, using 87% of the recommended amount. The variability in the data is due in part to a model that is continually being modified and improved.
Salt UseSalt use declined during the 2019-2020 season to 210,000 tons because of weather, fewer events, better understanding of the MDSS target of achieving 100% recommended usage by operators, and the improved performance of liquids versus rock salt.
Snow FencesLong-term snow fence activity (living and structural snow fencing) increased by 8.28 miles statewide from the previous year. MnDOT’s standing corn row program grew by nearly three miles from the previous year largely because of repeat farmers participating in the program and the corn soybean crop rotation working in our favor for farmers along Trunk Highway 169 corridor near Belle Plaine. MnDOT Districts are increasing the use of MnDOT’s Blowing Snow Control Shared Service for plan development and construction inspection assistance.
TON
S
Figure 2.12: Salt Use
2016-2017
102%197,400
2017-2018
104%254,418
2018-2019
87%246,505
2019-2020
99%210,000
Percentage of MDSS recommended amount used
Figure 2.13: Snow Fences
MILES
2014
2015
2016
2017
2018
2019
2020
65.7
68.5
69.2
75.7
79.7
83
92
6.2
16.8
16.8
52.3
53
62
65
Structural Temporary

SUSTAINABILITY AND PUBLIC HEALTH 2020 ANNUAL REPORT 28
LED Bulb Replacement
TARGET: Convert all lighting on MnDOT roadways to LEDs by 2020
RESULTS: In 2020, 97% of LED conversions on MnDOT roadways were complete.
MnDOT is very close to converting all lighting on MnDOT roadways to LEDs. Conversions are complete in the Metro District and several districts in Greater Minnesota. Lighting that
has not yet been converted tends to be in more remote locations and the agency plans to complete these conversions soon.
While the data does not include lighting at all rest areas and tunnels, MnDOT is working to convert lighting in these areas. Two tunnels in Duluth are currently programmed for LED conversion in 2022. The estimated GHG reduction for each light converted from high pressure sodium (HPS) to LED is 1,433 lbs CO2 e (or 65%).
Figure 2.14: LED Bulb Replacement vs. GHG Emissions ReductionsLE
D B
ULB
REP
LAC
EMEN
T (P
ERC
ENT)
GH
G E
MIS
SIO
NS
RED
UC
TIO
NS
FRO
M L
ED
(MET
RIC
TON
S)
60 10,000
80 15,000
100 20,000
50 7,500
58%
2015 2016 2017 2018 2019 2020
14,92415,466
16,266 16,307
14,121
82%
10,266
87%
91%94%
97%

SUSTAINABILITY AND PUBLIC HEALTH 2020 ANNUAL REPORT 29
Highway Operations: 2021 Planned Actions TableThe following actions have the potential to lower GHG emissions by reducing the distance MnDOT
fleet vehicles drive to apply salt and chemicals to roadways. Using less salt also has the potential to improve public health by supporting water quality.
ACTION STATUS COMPLETE BY
POTENTIAL TO…
Reduce GHG emissions
Improve public health
Support climate resilience
1 Use anti-icing and pre-wetting to optimize the treatment and use of salt on roads
IN PROGRESS
Ongoing
2 Continue to enhance the use of our maintenance decision support technology to assist operators in the application of salt
IN PROGRESS
Ongoing
3 Use non-traditional equipment, like ice breakers, underbody plows, and slurry systems to enhance the removal of ice and snow
IN PROGRESS
Ongoing
4 Train drivers on new and existing snow plowing techniques IN PROGRESS
Ongoing
5 Research alternative chemicals and equipment innovations to reduce the need for salt use
IN PROGRESS
Ongoing
6 Continue with our active salt sustainability/solutions program which brings information to and educates operators on chemical usage and snow and ice strategies
IN PROGRESS
Ongoing
7 Install blowing snow control measures IN PROGRESS
Ongoing

SUSTAINABILITY AND PUBLIC HEALTH 2020 ANNUAL REPORT 30
Roadside Vegetation � Native seeding
� Native planting
MET
RIC
S
OverviewRoadside vegetation serves critical functions for operating a transportation system, including safety, drainage, erosion control, stormwater treatment, and invasive species control. Because of underlying ecological principles, these objectives are often accomplished more effectively with diverse, locally adapted native species. When native vegetation is used, roadsides can also provide additional benefits such as improved aesthetics, wildlife habitat, carbon sequestration, and protection of biodiversity.
There is also institutional and public support for native vegetation on roadsides. This is reflected in Minn. Stat. 160.232 which states “road authorities are encouraged to utilize low maintenance, native vegetation…,” in MN Executive Order 19-28 which states that “[MnDOT] shall manage state-owned transportation properties and rights of way to create, protect, and enhance pollinator habitat,” and the Presidential Memorandum of July 20, 2014, which directs the federal DOT to work with state DOTs to promote pollinator-friendly practices. There is also regulatory pressure to use native vegetation as a result of the recent listing under the Endangered Species Act of the rusty-patch bumblebee and potential listing of the monarch butterfly and other pollinator species.
Planting recommendations are provided by the Office of Environmental Stewardship, either through general guidance or project-specific recommendations. Project managers and design staff have the flexibility to modify those recommendations based on project
needs. Construction staff are responsible for implementing those designs, but sometimes make adjustments in the field that may not meet intended habitat design outcomes. Long-term viability of roadside vegetation ultimately lies with maintenance staff in each district.
2020 Accomplishments � Provided support for a Local Road Research Board project that will monitor roadside plantings as part of a pollinator habitat study; this will provide data on the strengths and weaknesses of MnDOT’s approach to roadside seeding
� Monitored and observed successful results from an experimental seeding that can help improve the establishment of native seed mixes
� Started revisions to standard seed mixes and also began coordination with key stakeholders (BWSR and Seed Vendors) regarding those updates
� Made progress on design guidance (drafts of Facility Design Guide and of three seed mix fact sheets)

SUSTAINABILITY AND PUBLIC HEALTH 2020 ANNUAL REPORT 31
DISTRICT IN THE SPOTLIGHT:
Metro District Partners with Local Entities and Office of Environmental Stewardship to Plant Native Species
The MnDOT Office of Environmental Stewardship helped Metro District solve flooding issues on Highway 13 in the City of Burnsville with a rain garden and native plantings. The project was made possible through a cooperative agreement between MnDOT, Dakota County, and the City of Burnsville.
To carry out the project, MnDOT purchased a lot in a neighborhood adjacent to Highway 13 for the rain garden. The Office of Environmental Stewardship
provided seed mix recommendations for the garden based on the MnDOT Seeding Manual. The seeds were planted in late summer by a consultant and paid for by the City of Burnsville.
90% of the plant material installed on the project was made up of native species.
The rain garden will provide environmental benefits including pollinator habitat in an urban area, stormwater management, and an amenity for local residents who live near the site. It will also provide carbon sequestration services for the neighborhood. The project highlights the benefits of partnership and leveraging resources like the MnDOT Seeding Manual and the Plant Selector Tool. It serves as a model for other MnDOT Districts aiming to make progress on agency native seeding and planting goals. Individual project outcomes contribute to a cumulative impact that helps us to meet the state and federal directives described in the Overview above.
Rain garden installed in late summer 2020 in Burnsville just South of Hwy 13

SUSTAINABILITY AND PUBLIC HEALTH 2020 ANNUAL REPORT 32
Measuring Progress
2014
34%
2015
51%
2016
27%
2017
65%
2018
57%
2019
46%
PERC
ENT
OF
ACRE
S(O
N L
ARG
ER P
ROJE
CTS
PLA
NTE
D W
ITH
NAT
IVE
SEED
S)Figure 2.15: Native Seeding
2020
68%TARGET: 75%
Native Seeding
TARGET: 75% of acres are planted with native seeds as part of large MnDOT projects by 2025
RESULTS: In 2020, 68% of acres on large MnDOT projects were planted with native seeds.
To meet this target, environmental staff work with design, construction, and maintenance project managers to develop plans and procedures that support increased native vegetation.
MnDOT regularly provides manuals and recommendations to help project managers select the right native seed mix for their project. Native seeding on projects declined between 2017 and 2019. The 2020 data shows a promising reversal of that trend, with 68% of acres planted with native seeds. The percentage of acres planted
with native seeds has historically fluctuated year to year.
Native PlantingIn 2021, the Sustainable Transportation Steering Committee set a new target to plant 80% of urban projects and 90% of rural projects with native plant material. This target is not 100% because non-invasive, non-native species and cultivars are also used where they are needed to withstand site specific functions.
MnDOT is working to collect data to track progress on this target and will include the data in the 2021 MnDOT Sustainability Report, which will be released in the spring of 2022.

SUSTAINABILITY AND PUBLIC HEALTH 2020 ANNUAL REPORT 33
Roadside Vegetation: 2021 Planned Actions Table The planned actions to support sustainable roadside vegetation have the potential to improve public health by supporting environmental
quality. Reducing air and water pollution can improve public health and quality of life. Actions that reduce the vulnerability of infrastructure by supporting stormwater management have the potential to support climate resilience.
ACTION STATUS COMPLETE BY
POTENTIAL TO…
Reduce GHG emissions
Improve public health
Support climate resilience
1 Update design and construction standards by re-writing seeding manual
IN PROGRESS
Summer 2021
2 Revise seed mixes to improve establishment speed of native mixes and increase native components of non-native mixes
IN PROGRESS
End of 2021
3 Create four fact sheets on seed mix expectations and establishment needs
IN PROGRESS
End of 2021
4 Formulate roadside vegetation vision and goals NOT STARTED
Summer 2021
5 Share information about the benefits of native vegetation with three statewide groups within MnDOT
NOT STARTED
End of 2021
6 Develop designs emphasizing native plants and seeding (landscape construction and partnership, bio-engineering, negotiated maintenance, living snowfence, visual management)
IN PROGRESS
Summer 2021
7 Update Facility Design Guide to reflect sustainability objectives for roadside vegetation
IN PROGRESS
Summer 2021
8 Write specialized roadside vegetation management plans for three locations
IN PROGRESS
End of 2021
9 Explore methods of tracking the planting, seeding, and establishment of vegetation; such as mapping plans and mapping with the Collector app
NOT STARTED
End of 2021
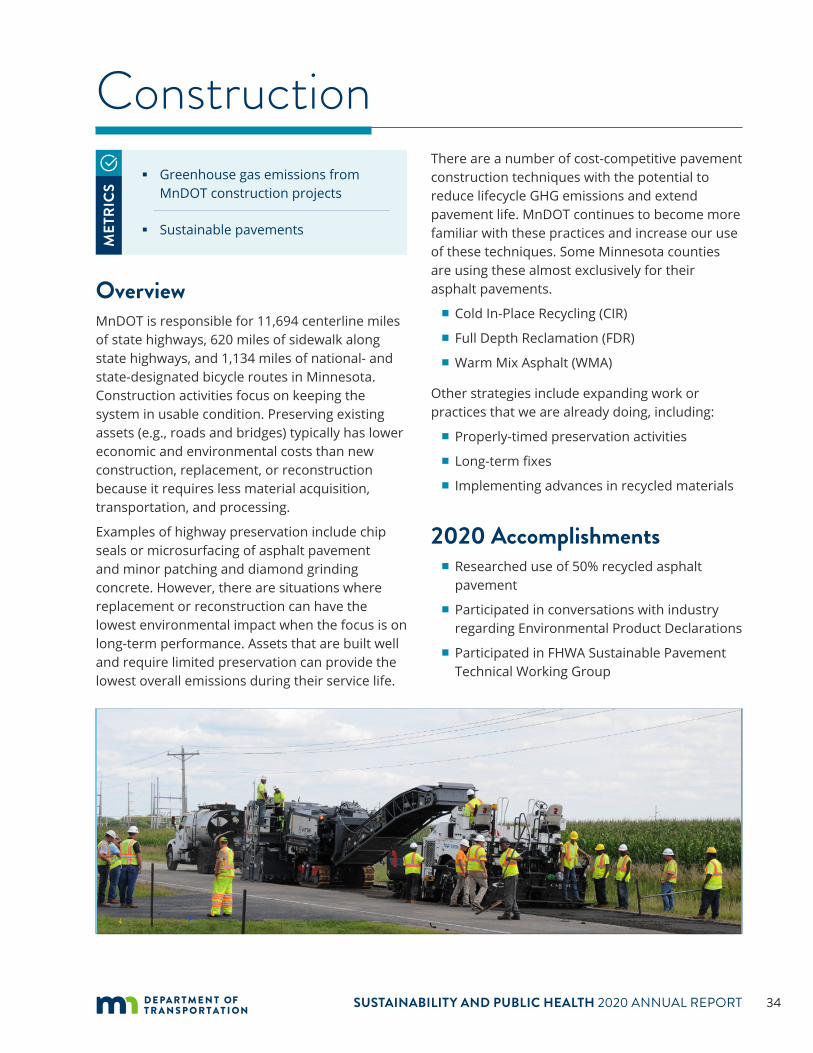
SUSTAINABILITY AND PUBLIC HEALTH 2020 ANNUAL REPORT 34
Construction � Greenhouse gas emissions from
MnDOT construction projects
� Sustainable pavements
MET
RIC
S
OverviewMnDOT is responsible for 11,694 centerline miles of state highways, 620 miles of sidewalk along state highways, and 1,134 miles of national- and state-designated bicycle routes in Minnesota. Construction activities focus on keeping the system in usable condition. Preserving existing assets (e.g., roads and bridges) typically has lower economic and environmental costs than new construction, replacement, or reconstruction because it requires less material acquisition, transportation, and processing.
Examples of highway preservation include chip seals or microsurfacing of asphalt pavement and minor patching and diamond grinding concrete. However, there are situations where replacement or reconstruction can have the lowest environmental impact when the focus is on long-term performance. Assets that are built well and require limited preservation can provide the lowest overall emissions during their service life.
There are a number of cost-competitive pavement construction techniques with the potential to reduce lifecycle GHG emissions and extend pavement life. MnDOT continues to become more familiar with these practices and increase our use of these techniques. Some Minnesota counties are using these almost exclusively for their asphalt pavements.
� Cold In-Place Recycling (CIR)
� Full Depth Reclamation (FDR)
� Warm Mix Asphalt (WMA)
Other strategies include expanding work or practices that we are already doing, including:
� Properly-timed preservation activities
� Long-term fixes
� Implementing advances in recycled materials
2020 Accomplishments � Researched use of 50% recycled asphalt pavement
� Participated in conversations with industry regarding Environmental Product Declarations
� Participated in FHWA Sustainable Pavement Technical Working Group

SUSTAINABILITY AND PUBLIC HEALTH 2020 ANNUAL REPORT 35
DISTRICT IN THE SPOTLIGHT:
District 8 uses Cold In Place Recycling TechniqueDistrict 8 used Cold in-place recycling (CIR) while resurfacing Highway 75 from Bellingham to Madison in Lac Qui Parle County. Cold in-place recycling is a method of removing and reusing the existing asphalt surface of the road. The CIR processes uses a single- or multi- unit train to mill and crush reclaimed asphalt pavement material, mix it with a recycling agent, and use it to pave the roadway.
District 8 uses CIR when resurfacing bituminous pavement over concrete because it prevents cracks in the concrete from being mirrored on the surface. It can also reduce project construction greenhouse gas emissions by reducing the amount of new bituminous material produced and transported, as well as annualized lifecycle greenhouse gas emissions by extending pavement life.
In previous projects, District 8 encountered issues with too much moisture entering the pavement while it was setting. However, staff found that fog sealing the roadway afterwards helped the road set properly.
There had been some public skepticism about previous projects utilizing CIR because the roadway base was in poor condition. However, CIR projects have produced very good quality such that the same concerns weren’t voiced about SP 3703-25. Seal coating and pavement marking remains to be done in 2021, but new roadway surface provides excellent ride quality.
Multi-unit CIR train milling and crushing an asphalt pavement A successfully completed CIR project in District 8

SUSTAINABILITY AND PUBLIC HEALTH 2020 ANNUAL REPORT 36
Measuring ProgressGreenhouse Gas Emissions from MnDOT Construction Projects
TARGET: 30% reduction from 2018 levels by 2025
RESULTS: Between 2018 and 2019, GHG emissions from MnDOT construction projects decreased by 23%.
The total estimated greenhouse gas emissions from construction projects let in 2019 is 154,098 metric tons of CO2e. This is a 23% decrease from the total from the 2018 inventory and is much closer to MnDOT’s target of 140,000 Mt CO2e by 2025. Most of the difference is due to fewer and smaller bridge reconstruction projects, and fewer miles of roadway projects. The inventory is a best guess based on the information available and the assumptions built into the calculator.
While there are mitigation techniques in limited use, the vast majority of the reduction is driven by the relative intensity of the yearly construction plan. For example, the 2018-2019 difference in emissions from roadway projects (pavement rehabilitation, new construction, widening or adding lanes, etc.) was 14,123 Mt CO2e.
Of the 82 roadway rehabilitation projects, mitigation techniques were used in six, accounting for a reduction of 669 Mt C02e (~5%). If cold in-place recycling and full-depth reclamation, the two techniques used in this project had been deployed to 80% of the lane-mileage rehabilitated, total emissions would have been reduced by 13,779 Mt CO2e (~10%) to 124,010 Mt CO2e.
Sustainable PavementsFull Depth Reclamation (FDR) and Cold In-Place Recycling (CIR) can lower construction GHG emissions by reducing the amount of material that needs to be extracted and produced, as well as transported on site. Additionally, Stabilized Full Depth Reclamation (SFDR) produces a stronger roadway base and requires less new asphalt. All three techniques extend pavement life, further reducing lifecycle GHG emissions.
MnDOT used sustainable pavement practices in 20 projects in 2020, increased from 14 in 2019. With increased experience using these techniques, districts can implement them more often. However, they are situationally dependent, limiting the scope of their implementation.
MET
RIC
TON
S C
O2e
Figure 2.16: Construction GHGs
2018
200,835
2019
154,098
TARGET: 140,000
30%Reduction
Figure 2.17: Sustainable Pavement
PROJECTS
2014
2015
2016
2017
2018
2019
2020
8
3
3
9
13
10
14
1
2
3
4
6
FDR CIR

SUSTAINABILITY AND PUBLIC HEALTH 2020 ANNUAL REPORT 37
Construction: 2021 Planned Actions Table The following actions are planned for 2021 to increase understanding of sustainable pavement opportunities. Applying learnings
from the case studies, environmental product declaration information, and peer exchanges will reduce greenhouse gas emissions from MnDOT construction projects, improve public health, and support climate resilience.
ACTION STATUS COMPLETE BY
POTENTIAL TO…
Reduce GHG emissions
Improve public health
Support climate resilience
1 Promote sustainable pavement case studies to MnDOT staff IN PROGRESS
Summer 2021
2 Research Environmental Product Declarations IN PROGRESS
End of 2021
3 Continue to participate in FHWA Sustainable Pavement Peer Exchange
IN PROGRESS
Ongoing
SUSTAINABILITY AND PUBLIC HEALTH 2020 ANNUAL REPORT
SECTION 3
Support Transportation that Improves Public Health for all Minnesotans

SUSTAINABILITY AND PUBLIC HEALTH 2020 ANNUAL REPORT 39
Walking, Biking, and Transit
11 Robert Wood Johnson Foundation, October 201212 Minnesota GO, Health Trends in Minnesota13 Smart Growth America, Complete Streets Mean Equitable Streets14 Minnesota Public Health Data Access Portal, Traffic in Minnesota
� Complete streets projects that meet pedestrian and bicyclist needs
� Frequency of walking and biking
� Transit ridership and availability
MET
RIC
S
OverviewProviding walking, biking, and transit facilities plays a critical role in the health of our communities. For example, walkable, bikeable, and transit-oriented communities support physical activity, which can improve people’s health and decrease health care costs.11
Increases in physical activity levels are one of the most straightforward ways to improve public health outcomes, and can mitigate some of the most pressing public health issues in Minnesota. Individuals who engage in at least 60 minutes of moderate physical activity each week show modest improvements in health outcomes, and those who reach 150 minutes reduce their risk of chronic diseases and other poor health outcomes.12
These are also important mobility options to advance transportation equity for those who cannot drive due to disability, age, economics, or personal preference. Latinx and African American households are much more likely to not have access to a vehicle, and people of color who are also low-income are even more likely not to have a car.13 Providing transportation options for all users, which is the center of MnDOT’s Complete Streets Policy, is essential for ensuring that all people have access to a transportation system that connects them to education, employment, religious, and
cultural institutions, and friends and family. Providing walking, biking, and transit options that are available, connected, and attainable is also important for supporting transportation-related GHG reduction goals and cleaner air.
More walkable, bikeable, and transit-oriented communities can cost-effectively reduce the need for vehicle travel and related emissions. Vehicle traffic contributes to local air pollution and is not spread evenly across urban areas in Minnesota. Long-term exposure to traffic-related pollution is a risk factor for developing lung and heart diseases. Asthma rates are higher in communities near major air pollutant generators, such as freeways. This is especially concerning for lower-income areas and communities of color in the Minneapolis-St. Paul metro area that tend to have higher levels of traffic-related air pollution.14
Providing pedestrian and bicycle facilities on roadway projects is supported by federal legislation, Minnesota State Statutes, and MnDOT policy and practice. MnDOT is focused on making walking and biking safer, easier, and more desirable. The agency has created several design and engineering resources to support walking and biking and is actively planning to determine where MnDOT needs to improve facilities. The agency also administers transit assistance grants for public transit systems in Greater Minnesota, provides rural transit technical assistance, and partners on transit planning efforts.

SUSTAINABILITY AND PUBLIC HEALTH 2020 ANNUAL REPORT 40
2020 Accomplishments � Completed an evaluation of the MnDOT Complete Streets Policy to identify opportunities to improve implementation.
� Completed the 2020 Safe Routes to School Strategic Plan to support a Minnesota transportation system where youth can safely, confidently, and conveniently walk, bike, and roll to school and in daily life.
� Continued to work with communities to install short-term, low-cost bicycle and pedestrian demonstration projects to allow communities to evaluate potential infrastructure improvements before investing in permanent changes.
� Continued to work with communities to implement bicycle and pedestrian project recommendations through the MnDOT Non-Motorized Scoping Field Walk program.
DISTRICT IN THE SPOTLIGHT:
District 3 Installs a Demonstration Project in Sauk CentreIn 2020, MnDOT installed nine demonstration projects across Minnesota. Demonstration projects are short-term, low-cost, temporary roadway projects to promote walking and bicycling. Many projects can be included, such as crosswalk markings, curb extensions, and median safety islands. In the short term, demonstration projects use low-cost and easily available materials to quickly improve safety for people walking and bicycling on a street or at an intersection.
Temporary demonstration projects give a community the opportunity to see and react to one potential option for roadway improvements while final decisions on the project are being developed. This can help local partners and residents reimagine the street as a place for people walking and biking and ultimately influence design decisions.
In District 3, Highway 71 in Sauk Center is slated for reconstruction in 2025 and locations along Hwy 71 are candidates for bicycle and pedestrian safety improvements. Demonstration projects, including a temporary separated bike lane on the Hwy 71 bridge and temporary curb extensions at two intersections, were installed in three locations along Hwy 71 in Summer and Fall 2020.
District 3 staff surveyed Sauk Centre residents about their experience of the demonstration project and received positive feedback about the improved ease of bicycling and walking in downtown Sauk Centre, and constructive feedback about changes residents would like to make to the infrastructure. Feedback received from residents will be incorporated into the final design of the project. In Sauk Centre and other locations around Minnesota, demonstration projects give communities the chance to engage in the planning process and advocate for infrastructure that fits their needs to increase their transportation options.

SUSTAINABILITY AND PUBLIC HEALTH 2020 ANNUAL REPORT 41
Measuring Progress
73%
88%
80%
97%
68%
91%
80%
44%48%
78%
62%
82%
2015 2016 2017 2018 2019 2020
PERC
ENTA
GE
Figure 3.1: Complete Streets Projects Meeting User Needs
Bike needs Pedestrian needs
Complete Streets BIKING
TARGET: 90% of MnDOT projects with an identified need include bicycling improvements
RESULTS: 62% of FY2020 MnDOT projects with identified needs included improvements for bicyclists.
From 2015-2020, 28% of projects with Complete Streets Project Reports indicated that existing conditions were not meeting bicyclist needs. The percentage of projects that include improvements to address identified bicyclist needs declined from 2016-2018, with an upward trend starting in 2019. The majority of these project reports indicated that expanding the project scope beyond pavement preservation to meet bicyclist needs was not feasible either due to funding constraints, time, or need for partner coordination.
WALKINGMost MnDOT projects with identified pedestrian needs include improvements to address those needs. This may be linked to MnDOT’s priority of achieving ADA compliance. From 2015-2020, 42% of projects with completed Complete Streets Project Reports indicated that existing conditions were not meeting pedestrian needs. The percentage of projects that include improvements to address pedestrian needs has remained fairly consistent since 2015, with a slight downward trend.
Frequency of Biking and WalkingBIKINGThe percentage of 2019 MnDOT Omnibus survey respondents who biked a few times per week as their most frequent mode of transportation remained flat from 2017 to 2019 (9% to 8%). This is the sixth highest mode of transportation used most frequently by respondents behind driving alone, walking, teleworking, transit, or carpool/vanpool.

SUSTAINABILITY AND PUBLIC HEALTH 2020 ANNUAL REPORT 42
WALKING
TARGET: Increase the percentage of people walking at least a few times per week to 60%
RESULTS: 31% of 2019 Omnibus Survey Respondents walked or rolled at least a few times per week.
The percentage of 2019 MnDOT Omnibus survey respondents who walked, used a wheelchair, or personal mobility device a few times per week as their most frequent mode of transportation was relatively consistent from 2017 to 2019 (from 28% to 31%).
This is the second highest mode of transportation used most frequently by respondents behind primarily driving alone in a vehicle a few times a week (83% in 2019).
Figure 3.2: Frequency of Biking and Walking
2016 2017 2019
8% 11% 12%
10%
36%
15%
28%
13%
31%
15%
9% 8%Daily/Few times per week
Daily/Few times per week
A few times per month
A few times per month

SUSTAINABILITY AND PUBLIC HEALTH 2020 ANNUAL REPORT 43
TransitTRANSIT AVAILABILITYSatisfaction with the availability of public transit has remained consistent with previous years. Those significantly more satisfied than their counterparts include metro area residents, African Americans, and Minnesotans under age 35. There has been a decrease in satisfaction with availability of public transit among residents in Greater Minnesota. Among those who said they were dissatisfied, lack of availability remains the reason cited most often for dissatisfaction.
TRANSIT RIDERSHIP
TARGET: 145-150 million annual boardings in the Twin Cities by 2030 and 17 million annual boardings in Greater Minnesota by 2025
RESULTS: In 2020, 40.9 million transit trips were taken in the Twin Cities. In 2019, 11.5 million transit trips were taken in Greater Minnesota.
Twin Cities transit ridership, measured by annual number of boardings, decreased by roughly 55% in 2020. This sharp decline is largely attributed to the COVID-19 pandemic. Within the decline, bus rapid transit declines were less than other transit services and Metro Transit ridership declines were less than smaller regional providers. The 2020 data for Greater Minnesota transit boardings is not yet available.
2015
2017
2019
Figure 3.3: Availability of Public Transit
66%65%
63%
98.8M
12.2M 11.7M 11.8M 11.9M 11.5M
Not yet available
40.9M
91.6M94.2M95.4M96.3M
2015 2016 2017 2018 2019 2020
RID
ERS
Figure 3.4: Transit Ridership
Metro Greater MN
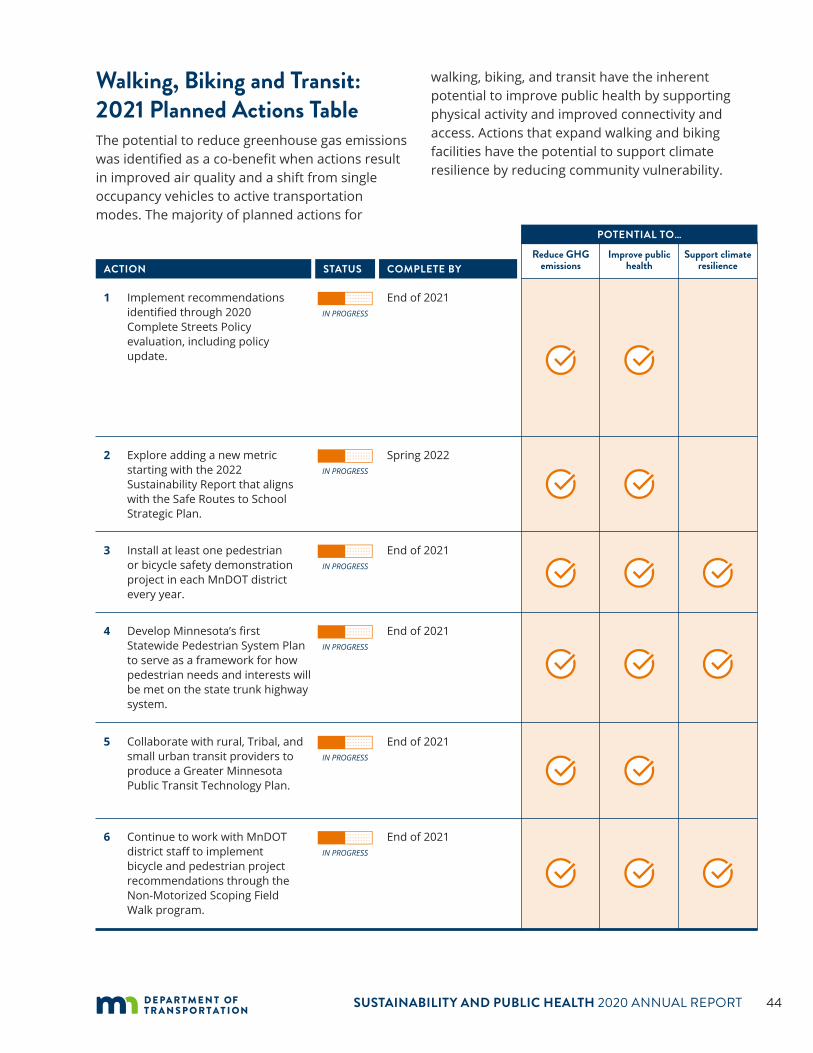
SUSTAINABILITY AND PUBLIC HEALTH 2020 ANNUAL REPORT 44
Walking, Biking and Transit: 2021 Planned Actions Table The potential to reduce greenhouse gas emissions was identified as a co-benefit when actions result in improved air quality and a shift from single occupancy vehicles to active transportation modes. The majority of planned actions for
walking, biking, and transit have the inherent potential to improve public health by supporting physical activity and improved connectivity and access. Actions that expand walking and biking facilities have the potential to support climate resilience by reducing community vulnerability.
ACTION STATUS COMPLETE BY
POTENTIAL TO…
Reduce GHG emissions
Improve public health
Support climate resilience
1 Implement recommendations identified through 2020 Complete Streets Policy evaluation, including policy update.
IN PROGRESS
End of 2021
2 Explore adding a new metric starting with the 2022 Sustainability Report that aligns with the Safe Routes to School Strategic Plan.
IN PROGRESS
Spring 2022
3 Install at least one pedestrian or bicycle safety demonstration project in each MnDOT district every year.
IN PROGRESS
End of 2021
4 Develop Minnesota’s first Statewide Pedestrian System Plan to serve as a framework for how pedestrian needs and interests will be met on the state trunk highway system.
IN PROGRESS
End of 2021
5 Collaborate with rural, Tribal, and small urban transit providers to produce a Greater Minnesota Public Transit Technology Plan.
IN PROGRESS
End of 2021
6 Continue to work with MnDOT district staff to implement bicycle and pedestrian project recommendations through the Non-Motorized Scoping Field Walk program.
IN PROGRESS
End of 2021

SUSTAINABILITY AND PUBLIC HEALTH 2020 ANNUAL REPORT 45
Transportation Equity and Safety
15 https://smartgrowthamerica.org/wp-content/uploads/2021/03/Dangerous-By-Design-2021.pdf16 https://minnesotago.org/application/files/7214/5825/5846/Racial_Inequality_Public_Final.pdf
� ADA compliance
� Serious injuries and fatalities
MET
RIC
S
OverviewMinnesota is seeing a larger share of non-motorized crashes resulting in fatal and serious injuries. Both speed-related and total fatalities have increased.
Minnesota is also seeing disparities in equitable access and safety for all users on the transportation system. Older adults, people walking in low-income communities, and American Indian/Alaskan Native, Black/African American, and Hispanic people are at greatest risk of dying while walking.15
This is especially important given the income gap that persists between people of color and white Minnesotans. American Indians and Black Minnesotans have the lowest household incomes of all groups in Minnesota, and, alarmingly, have
seen their median household incomes fall at more significant rates than other Minnesotans since 1999. Regardless of income, people living in areas of concentrated poverty are more likely to walk for transportation than those living in the rest of the metro area.16
MnDOT committed to studying “...how transportation affects equity and identify transportation strategies that will meaningfully reduce disparities” as part of the 2017 Statewide Multimodal Transportation Plan update.
Several research projects and the Community Conversations Engagement Project were identified as early steps in this commitment. These efforts compliment other equity-focused initiatives at MnDOT, such as a process review focused on changing internal MnDOT policies and practices related to equity and the roll-out of MnDOT’s new Equity Lens Framework.
The agency’s long-standing focus on safety fits into a comprehensive approach to transportation equity.
For example, the Minnesota Towards Zero Deaths (TZD) program is the cornerstone traffic safety program, which is focused on creating a culture where traffic fatalities and serious injuries are no longer acceptable. MnDOT supports the statewide initiative and coordinates the grassroots efforts of regional partners.
2020 Accomplishments � Completed 5 of 7 Community Conversations in MnDOT districts as part of a series of in-person conversations between MnDOT and individuals who work with and represent underserved communities in Minnesota.

SUSTAINABILITY AND PUBLIC HEALTH 2020 ANNUAL REPORT 46
� Created the MnDOT Equity Lens Framework that guides staff through identifying and understanding equity implications of agency policies and programs.
� Completed 14 County Roadways Safety Plan updates, which include pedestrian and bicycle safety recommendations.
� Developed the 2020 Minnesota Bicycle Facility Design Manual to support the development of safe, consistent, and predictable bicycle facilities along MnDOT’s trunk highway system.
� Developed the Demonstration Project Guide to support the development of safe, consistent, and predictable pedestrian and bicycle facilities.
DISTRICT IN THE SPOTLIGHT:
District 1 Builds Relationships Earlier to Improve Transportation Equity
MnDOT District 1 staff have been focused on building deeper relationships with communities and partners to identify challenges and advance equity. Staff met with 34 organizations serving or representing key communities in 2020 as
part of the agency’s Community Conversations Engagement Project. This effort identified themes for staff to consider as they prioritize improving equitable outcomes, such as the importance of working with local partners to improve safety and accessibility for people who walk or bike to their destinations.
In addition to this project, District staff have also revised their project community engagement process to better understand holistic community needs even before projects are scoped. Staff look beyond project boundaries and work with the community to develop community-wide transportation plans that better identify how safe and accessible connections can be made.
For example, MnDOT supported development of the Proctor Transportation Action Plan, completed in 2020, which articulates a community transportation vision and city-wide transportation goals to provide a clear direction forward for the next decade of transportation in Proctor. MnDOT worked with the City of Proctor to install a demonstration project as part of the Plan to engage the community in potential future active transportation street changes.
This earlier and more robust planning and engagement process is helping to build trust, create shared understanding, and identify meaningful ways for MnDOT to continue supporting more equitable outcomes for all transportation users.
MnDOT staff install a demonstration project in the City of Proctor

SUSTAINABILITY AND PUBLIC HEALTH 2020 ANNUAL REPORT 47
Measuring Progress
47.3%
28.5%
2015
49%
35%
2016
56%
42%
2017
60%
51.7%
2018
62%
52.2%
2019
OVE
RALL
CO
MPL
IAN
CE
Figure 3.5: State-Owned Sidewalk and Curb Ramp Miles Substantially Compliant with ADA Standards
Due to COVID-19 restrictions, a complete dataset for the 2019 construction season will not be available until 2021. The reported 2019 data represents roughly 30% of the total curb ramps and 25% of the total sidewalk constructed.
Curb ramp ADA compliance
Sidewalk ADA compliance
ADA ComplianceTransportation is a key aspect in an individual’s independence and quality of life. MnDOT is committed to making accessibility improvements in its right-of-way to offer people with disabilities the opportunity to live, learn, work, and enjoy life alongside everyone else in the community.
CURB RAMP COMPLIANCE
TARGET: 100% (or all) curb ramps are substantially compliant with ADA standards
RESULTS: In 2019, of the 30% of total curb ramps for which data is available, 62% were ADA compliant.
Accessibility improvements were made to 6,952 curb ramps from 2014-2019. This brings approximately 52% of MnDOT owned right-of-way curb ramps into compliance with the Access Board’s Public Right of Way (PROW) Guidance.
The slight growth over time in compliant ramps is due in part to MnDOT adding new curb ramps and improving existing curb ramps at many locations previously served by one diagonal curb ramp that are now served by two perpendicular ramps. The data for 2019 and 2020 are
preliminary, as MnDOT was not able to provide a complete data set for the construction season due to COVID-19 restrictions.
SIDEWALK COMPLIANCE
TARGET: 100% (or all) sidewalks are substantially compliant with ADA standards
RESULTS: In 2019, of the 25% of total sidewalks for which data is available, 52% were ADA compliant.
Accessibility improvements were made to 98.3 miles of sidewalks from 2015-2019. This brings 62% of sidewalks maintained by MnDOT into compliance with the Public Right of Way Guidance. Driveways with excessive slope are the most common deficiency in the network. Near-term changes in sidewalk condition are expected to be modest due to limited budget and the long life cycle of sidewalks.
MnDOT often delays sidewalk improvements until the adjacent roadway needs reconstruction because it’s typically more cost effective to replace highways and sidewalks at the same time. The data for 2019 and 2020 are preliminary, as MnDOT was not able to provide a complete data set for the construction season due to COVID-19 restrictions.
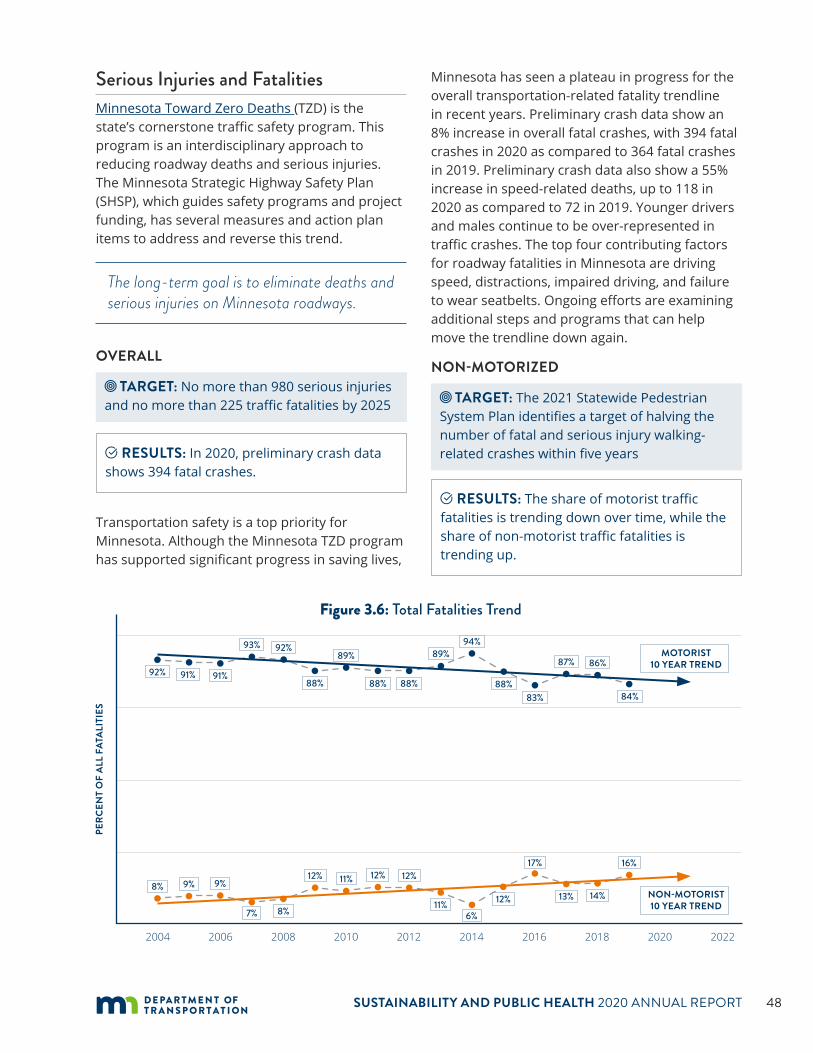
SUSTAINABILITY AND PUBLIC HEALTH 2020 ANNUAL REPORT 48
Serious Injuries and FatalitiesMinnesota Toward Zero Deaths (TZD) is the state’s cornerstone traffic safety program. This program is an interdisciplinary approach to reducing roadway deaths and serious injuries. The Minnesota Strategic Highway Safety Plan (SHSP), which guides safety programs and project funding, has several measures and action plan items to address and reverse this trend.
The long-term goal is to eliminate deaths and serious injuries on Minnesota roadways.
OVERALL
TARGET: No more than 980 serious injuries and no more than 225 traffic fatalities by 2025
RESULTS: In 2020, preliminary crash data shows 394 fatal crashes.
Transportation safety is a top priority for Minnesota. Although the Minnesota TZD program has supported significant progress in saving lives,
Minnesota has seen a plateau in progress for the overall transportation-related fatality trendline in recent years. Preliminary crash data show an 8% increase in overall fatal crashes, with 394 fatal crashes in 2020 as compared to 364 fatal crashes in 2019. Preliminary crash data also show a 55% increase in speed-related deaths, up to 118 in 2020 as compared to 72 in 2019. Younger drivers and males continue to be over-represented in traffic crashes. The top four contributing factors for roadway fatalities in Minnesota are driving speed, distractions, impaired driving, and failure to wear seatbelts. Ongoing efforts are examining additional steps and programs that can help move the trendline down again.
NON-MOTORIZED
TARGET: The 2021 Statewide Pedestrian System Plan identifies a target of halving the number of fatal and serious injury walking-related crashes within five years
RESULTS: The share of motorist traffic fatalities is trending down over time, while the share of non-motorist traffic fatalities is trending up.
PERC
ENT
OF
ALL
FATA
LITI
ES
Figure 3.6: Total Fatalities Trend
2004 2008 2012 2016 20202006 2010 2014 2018 2022
NON-MOTORIST 10 YEAR TREND
MOTORIST 10 YEAR TREND
92% 91% 91%
93% 92%
88%
89%
88% 88%
89%94%
88%83%
87% 86%
84%
8% 9%
7%
9%
8%
12% 11% 12% 12%
11%6%
12%
17%
13% 14%
16%

SUSTAINABILITY AND PUBLIC HEALTH 2020 ANNUAL REPORT 49
PERC
ENT
Metro (7-county) Greater Minnesota
Figure 3.7: Non-Motorist Fatalities by Geography (2015–2019)1
1 : Minnesota Motor Vehicle Crashes, MnDOT Office of Traffic Engineering. Pedestrian and Bicyclist Data Program, MnDOT Office of Transit and Active Transportation. May 2021. www.mndot.gov/bike-ped-counting/index.html
Non-motorized Traffic Fatalities65%
55%
35%
45%
Minnesota is seeing a rising trend of more non-motorized crashes resulting in fatal and serious injuries. This is similar to a rising national trend. Nationwide, the number of people struck and killed by drivers while walking increased 45% over the last decade (2010-2019), with the four most recent years recorded as the most deadly for pedestrians.
GEOGRAPHICMinnesota rural counties continue to experience a higher traffic fatality rate than metro counties. The majority of fatalities from 2015-2019 occurred in rural areas of the state with under 1,000 people. Specific to non-motorized crashes, people walking and biking in rural Minnesota communities are more likely to be struck and killed by drivers than in Minnesota metro communities.
Specific to bicycling safety, those expressing concerns through the 2019 MnDOT Omnibus survey identified not enough dedicated bike lanes or lack of shoulder width as top issues. Poor road maintenance was more of a concern for metro residents than in Greater Minnesota. Among those expressing concerns about walking safety, both metro area and Greater Minnesota residents identified not enough sidewalks or trails as the greatest concern.
RACECommunities of color have suffered as a result of transit and transportation policies. The national narrative of racial inequality and transportation has played out in Minnesota as well. People of color in Minnesota continue to experience a larger burden of being struck and killed by drivers than White/Non-Hispanic Americans.
WHITE
Figure 3.8: Non-Motorist Fatalities by Race, Statewide (2015-2019)
0% 20% 40% 60% 80% 100%
BLACK
AMERICAN INDIAN
HISPANIC
ASIAN
PACIFIC ISLANDER
MULTIPLE RACES
81%76%
6%11%
1%7%
5%5%
5%2%
0%0%
2%0%
Percent of Population Percent of Fatalities

SUSTAINABILITY AND PUBLIC HEALTH 2020 ANNUAL REPORT 50
Transportation Equity & Safety: 2021 Planned Actions Table The potential to reduce greenhouse gas emissions was identified as a co-benefit when actions result in improved air quality and a shift from single occupancy vehicles to active transportation modes. Planned actions that have the potential to improve equity by incorporating inclusive public
engagement during the transportation decision-making process and supporting multimodal options that are affordable, reliable, efficient, safe, and easy to use were identified as having public health co-benefits. Actions that reduce the vulnerability of the community by expanding safe walking and biking facilities were identified as having the potential to support climate resilience.
ACTION STATUS COMPLETE BY
POTENTIAL TO…
Reduce GHG emissions
Improve public health
Support climate resilience
1 Finalize Community Conversations Engagement Project, completing conversations in Districts 7 and 3.
IN PROGRESS
End of 2021
2 Continue transportation equity research, including the Equity in Performance Measurement (early 2022) and Gender Equity in Transportation projects (late 2022).
IN PROGRESS
Late 2022
3 Conduct an Equity and Health Assessment pilot for the TH 252/ I-94 project.
IN PROGRESS
Equity and Health Conditions Report by mid-2022; Equity and Health Recommendations Report by 2023
4 Incorporate more pedestrian and bicycle safety recommendations in the County Roadways Safety Plan updates.
IN PROGRESS
17 counties to be complete by the end of 2021
5 Explore adding new metrics starting with the 2022 Sustainability Report that align with the MnDOT Safe Routes to School Strategic Plan, Pedestrian Plan, and Complete Streets project reporting update.
IN PROGRESS
Spring 2022
6 Implement strategies and tactics identified in the Strategic Highway Safety Plan.
IN PROGRESS
Ongoing
7 Explore adding a metric to track MnDOT’s contribution to creating inviting and environmentally sustainable bicycle, pedestrian, and transit environments.
IN PROGRESS
Spring 2022
SUSTAINABILITY AND PUBLIC HEALTH 2020 ANNUAL REPORT
SECTION 4
Improve Resilience of the Transportation System

SUSTAINABILITY AND PUBLIC HEALTH 2020 ANNUAL REPORT 52
Climate Resilience
17 Climate Central, 2013
� Culvert conditions
� Bridge conditions
MET
RIC
S
OverviewIn Minnesota, climate change is already having major impacts and our winters are warming faster than any other state in the continental USA.17 Minnesota has seen at least 14 mega-rain events, with a sharp uptick since 2000. Of these 14 events, two were in the 1970s, two were in the 1980s, zero were in the 1990s, but six occurred in the 2000s, with four more in the 2010s. The 20 years from 2000-2019 have seen 2.5 times as many mega-rains as the 27 years spanning 1973-1999.
MnDOT infrastructure will become increasingly stressed by climate change and extreme weather, particularly from projected precipitation increases and larger and more frequent storm events. MnDOT is committed to providing a resilient transportation system that serves Minnesota as our climate changes.
This section focuses on climate resilience. The agency is currently developing an analysis of projected climate change risks on bridges and culverts (via projected extreme precipitation scenarios) for each district to inform decision-making and outreach for MnDOT projects.
The agency continues to develop our response to climate impacts with the support of leadership and the internal Resilience Advisory Team. The two critical needs are 1) understanding impacts of climate change, and 2) developing tools or strategies to decrease risk. Resilience tools need to balance multiple factors such as cost, safety, capacity, and likelihood and magnitude of
potential impacts and the time horizon for when impacts could inform decisions about the best adaptation response.
MnDOT also collaborates on climate resilience, especially to reduce flood risk, with other state agencies through the Governor’s Climate Subcabinet Resilience and Adaptation Action Team. Measures in this report focus on system vulnerability and serve as proxies for future resilience measures that will be developed in the future.
2020 Accomplishments � Selected climate projections of future precipitation scenarios that will be used to assess MnDOT asset vulnerability to extreme flooding.
� Completed a pilot project with MnDOT District 2 and a University of Minnesota graduate capstone team to collect qualitative data on climate risks by asking district staff: “What keeps you up at night?”
� Created guidance to incorporate more resilient design (i.e., “betterment”) in repairs following a disaster.
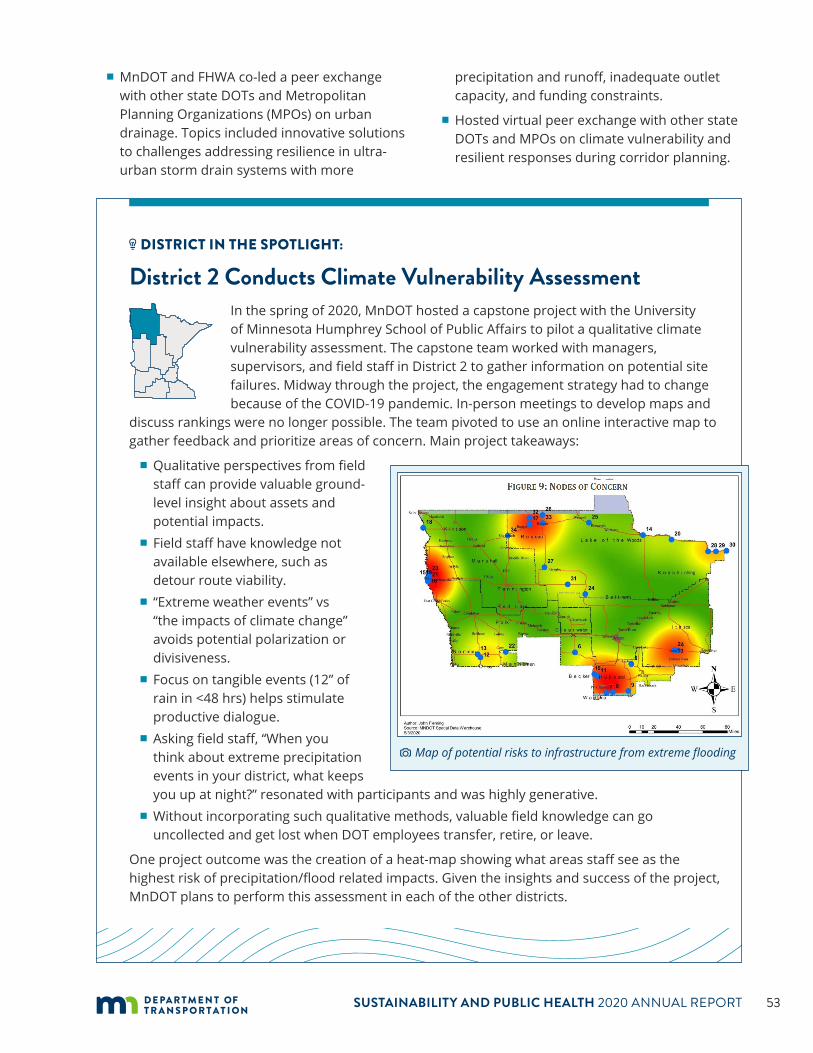
SUSTAINABILITY AND PUBLIC HEALTH 2020 ANNUAL REPORT 53
� MnDOT and FHWA co-led a peer exchange with other state DOTs and Metropolitan Planning Organizations (MPOs) on urban drainage. Topics included innovative solutions to challenges addressing resilience in ultra-urban storm drain systems with more
precipitation and runoff, inadequate outlet capacity, and funding constraints.
� Hosted virtual peer exchange with other state DOTs and MPOs on climate vulnerability and resilient responses during corridor planning.
DISTRICT IN THE SPOTLIGHT:
District 2 Conducts Climate Vulnerability AssessmentIn the spring of 2020, MnDOT hosted a capstone project with the University of Minnesota Humphrey School of Public Affairs to pilot a qualitative climate vulnerability assessment. The capstone team worked with managers, supervisors, and field staff in District 2 to gather information on potential site failures. Midway through the project, the engagement strategy had to change because of the COVID-19 pandemic. In-person meetings to develop maps and
discuss rankings were no longer possible. The team pivoted to use an online interactive map to gather feedback and prioritize areas of concern. Main project takeaways:
� Qualitative perspectives from field staff can provide valuable ground-level insight about assets and potential impacts.
� Field staff have knowledge not available elsewhere, such as detour route viability.
� “Extreme weather events” vs “the impacts of climate change” avoids potential polarization or divisiveness.
� Focus on tangible events (12” of rain in <48 hrs) helps stimulate productive dialogue.
� Asking field staff, “When you think about extreme precipitation events in your district, what keeps you up at night?” resonated with participants and was highly generative.
� Without incorporating such qualitative methods, valuable field knowledge can go uncollected and get lost when DOT employees transfer, retire, or leave.
One project outcome was the creation of a heat-map showing what areas staff see as the highest risk of precipitation/flood related impacts. Given the insights and success of the project, MnDOT plans to perform this assessment in each of the other districts.
Map of potential risks to infrastructure from extreme flooding

SUSTAINABILITY AND PUBLIC HEALTH 2020 ANNUAL REPORT 54
Measuring ProgressCulvert Condition
TARGET: Less than 10% of state-owned culverts are in poor or severe condition
RESULTS: In 2020, 17% of culverts were in poor or severe condition.
Extreme weather can exacerbate poor culvert condition and increase the risk of infrastructure damage or failure. Understanding culvert condition can help MnDOT assess climate vulnerability. Highway culverts include those smaller than a ten-foot span under traffic lanes that move surface water through a roadway embankment or away from the highway. Since 2014, the percentage of culverts in severe or poor condition has held steady between 15% and 17%.
Bridge Condition
TARGET: Less than 2% of NHS bridges are in poor condition
RESULTS: In 2019, 3.3% of NHS bridges were in poor condition.
A plan of action (POA) is a management plan to address scour critical bridges.
Fewer Plans of Action (POAs) mean less infrastructure that is highly vulnerable to climate risks like extreme weather. Over the last five years, the number of bridges with a POA significantly declined. The number of vulnerable culverts has also decreased slightly.
The percentage of bridge deck area in poor condition exceeded the target in 2019 when a set of large twin bridges (2.1% of the total NHS deck area) on interstate 494 over the Minnesota River were rated poor. These bridges are scheduled for repair work in 2023.
PERC
ENTA
GE
Figure 4.1: Culverts in Poor or Severe Condition
2015
16%
2016
15%
2017
15%
2018
15%
2019
16%
2020
17%
TARGET:10%
BRID
GE
ELEM
ENTS
Figure 4.2: Bridge Condition (all bridges statewide)
2015
1,184
1,999
1,321
2016
1,119
1,909
1,317
2017
1,062
1,881
1,298
2018
999
1,879
1,313
2019
979
1,893
1,323
POA for Scour Culverts Rated Channels Rated Percent of NHS poor condition rating trend line
3.3%
1.0%1.4%
3.3%3.0%
Channel: A waterway connecting two bodies of water or containing moving water
Scour: Removal of a streambed or bank area by stream flow; erosion of streambed or bank material due to flowing water; often considered as being localized around piers and abutments of bridges

SUSTAINABILITY AND PUBLIC HEALTH 2020 ANNUAL REPORT 55
Climate Resilience: 2021 Planned Actions Table The following actions are planned for 2021 to understand and address climate change risks
to MnDOT infrastructure. Implementing the recommendations and findings from the research will reduce the potential for damage from extreme weather and support community safety and public health.
ACTION STATUS COMPLETE BY
POTENTIAL TO…
Reduce GHG emissions
Improve public health
Support climate resilience
1 Support the STAC resilience working group and develop MnDOT response to the recommendations.
IN PROGRESS
Summer 2021
2 Resilient Corridor tabletop exercise and pilot. NOT STARTED
Summer 2021
3 Perform qualitative vulnerability assessment in each of the districts. NOT STARTED
Approximately one per year
4 Continue freeze thaw research to understand potential impact of warmer temperatures on pavements.
IN PROGRESS
Phase 1 completed Summer 2021
6 Research climate change adaptation of urban stormwater infrastructure.
IN PROGRESS
Ongoing
7 Research flood-frequency analysis in the Midwest: Addressing potential nonstationary annual peak-flow records (cooperative agreement with USGS).
IN PROGRESS
Ongoing
8 Complete extreme flood vulnerability assessment to analyze climate change and precipitation data and integrate that information into the agency’s asset management approach.
IN PROGRESS
Winter 2022

SUSTAINABILITY AND PUBLIC HEALTH 2020 ANNUAL REPORT
LOOKING FORWARD
The Road Ahead

SUSTAINABILITY AND PUBLIC HEALTH 2020 ANNUAL REPORT 57
The Road AheadMnDOT is committed to leading through action to transition our state to a low-carbon future that improves safety, reduces inequities, advances public health, and supports economic opportunity.
There are many opportunities ahead to accelerate our state’s progress. Since 2016, MnDOT has worked collaboratively to identify meaningful actions, quantify results, and openly communicate about sustainability. This report is the latest snapshot of the important steps we’re taking on our journey to a low-carbon future—from leading by example through MnDOT agency operations to working with partners to support safe, vibrant, and healthy communities that have reliable, convenient, and affordable transportation options. It’s clear we’ve made important progress, but we also have substantial work ahead of us.
Examples of work planned in 2021 and 2022 include the following:
� Lead update to MnDOT Complete Streets Policy
� Lead development of state EV Strategic Plan
� Lead and support engagement to finalize a new VMT reduction goal and related tools and guidance
� Support District Energy Assessments
� Lead efforts to electrify the MnDOT fleet and provide public use chargers around the State of Minnesota, including a partnership with Xcel Energy
� Continue to lead the MnDOT Clean Transportation Pilot program
� Develop a new MnDOT Strategic Partnerships Program that promotes nontraditional partnerships and creative uses of public space
� Depending on legislative direction and funding, lead stakeholder process to develop a Clean Fuels Policy for Minnesota, coordinate District climate vulnerability assessments, and develop statewide EV charging program
We’ll continue to communicate about efforts through this annual report to help us track progress, create accountability, and provide transparency. The MnDOT Sustainability and Public Health website is a resource for more frequent updates on our work.
Creating a multimodal, sustainable, low-carbon transportation system that better serves all Minnesotans will require us to take more urgent, bolder actions. We look forward to continued collaboration amongst MnDOT staff and with partners and communities in the years to come to meet the challenge.


