2020 NORTH AMERICAN INDUSTRIAL OUTLOOK WEBCAST Rebecca Rockey Global Head of Forecasting David Bitner Americas Head of Capital Markets Research Carolyn Salzer Americas Head of Logistics & Industrial Research Tray Anderson Logistics & Industrial Services Lead, Americas
Transcript
CUSHMAN & WAKEFIELD | 2020 NORTH AMERICAN INDUSTRIAL OUTLOOK 1
2020 NORTH AMERICAN INDUSTRIAL OUTLOOK
WEBCAST
Rebecca RockeyGlobal Head of Forecasting
David BitnerAmericas Head of Capital Markets Research
Carolyn SalzerAmericas Head of Logistics & Industrial Research
CUSHMAN & WAKEFIELD | 2020 NORTH AMERICAN INDUSTRIAL OUTLOOK 9
NET ABSORPTION/ASKING RENT
4Q TRAILING AVERAGE
$0.00
$1.00
$2.00
$3.00
$4.00
$5.00
$6.00
$7.00
$8.00
(200,000,000)
(100,000,000)
-
100,000,000
200,000,000
300,000,000
400,000,000
Net Absorption, MSF Weighted Asking Rent, $ PSF
Forecast
CUSHMAN & WAKEFIELD | 2020 NORTH AMERICAN INDUSTRIAL OUTLOOK 10
459.9 573.4ABSORPTION (MSF) DELIVERIES (MSF)
5.2% $6.95VACANCY (%) RENTS (PSF)
North American Industrial 2020-2021 Outlook
CUSHMAN & WAKEFIELD | 2020 NORTH AMERICAN INDUSTRIAL OUTLOOK 11
EconomicOutlook
CUSHMAN & WAKEFIELD | 2020 NORTH AMERICAN INDUSTRIAL OUTLOOK 12
THEME #1: GROWTH DECELERATING
Note: *In local currency units.Source: U.S. Bureau of Economic Analysis, Statistics Canada, Instituto Nacional de Estadística Geografía e Informática, Moody’s Analytics, Oxford Economics, International Monetary Fund, Cushman & Wakefield Research
2.9%
3.0%
3.1%
3.2%
3.3%
3.4%
3.5%
3.6%
3.7%
3.8%
3.9%
2010-2018Average
2018 2019 2020
Global Real GDP Growth
-1.0%
0.0%
1.0%
2.0%
3.0%
4.0%
2009Q3-2019Q3 2018 2019 2020F
Real GDP Growth*Canada Mexico U.S.
CUSHMAN & WAKEFIELD | 2020 NORTH AMERICAN INDUSTRIAL OUTLOOK 13
THEME #2: PRODUCTION ECONOMY SOFT
Note: *Canada does not have an ISM-equivalent although alternative PMI indices are available for the country (using different methodologies).Source: Oxford Econoomics, Statistics Canada, Board of Governors of the Federal Reserve, Instituto Nacional de Estadística Geografía e Informática,Cushman & Wakefield Research
-2,500
-2,000
-1,500
-1,000
-500
0
500
1,000
2001
2002
2003
2004
2005
2006
2007
2008
2009
2010
2011
2012
2013
2014
2015
2016
2017
2018
2019
2020
F
Manufacturing JobsCanada Mexico U.S.
-10
-5
0
5
10
15
20
2010
2011
2012
2013
2014
2015
2016
2017
2018
2019
Output is FallingCanadian Industrial Production Mexican Industrial ProductionU.S. Industrial Production Cass Shipments Index (3-mma)
-34k jobs-333k jobs-22k jobs
CUSHMAN & WAKEFIELD | 2020 NORTH AMERICAN INDUSTRIAL OUTLOOK 14
THEME #3: TRADE UNCERTAINTY TO PERSIST
Source: U.S. Department of Treasury, U.S. Congressional Budget Office, Moody’s Analytics, U.S. Bureau of Economic Analysis, Statistics Canada, Instituto Nacional de Estadística Geografía e Informática, PolicyUncertainty.com, Cushman & Wakefield Research
$0
$20
$40
$60
$80
$100
$120
$140
Corporate Tax CutSavings (TCJA)
Individual IncomeTax Savings (TJCA)
Cost of Tariffs
Billio
ns
Tariffs Offsetting Other Tailwinds
2018 2019-40
-30
-20
-10
0
10
20
30
40
50
60
2003
2004
2005
2006
2007
2008
2009
2010
2011
2012
2013
2014
2015
2016
2018
2019
Business Confidence is DownGlobal Business Confidence North American Business Confidence
U.S.-China trade war begins
Great Recession
CUSHMAN & WAKEFIELD | 2020 NORTH AMERICAN INDUSTRIAL OUTLOOK 15
THEME #3: INVESTMENT PULLBACK BROAD-BASED
Source: CPB World Trade Monitor, International Monetary Fund, Cushman & Wakefield Research
-20%
-15%
-10%
-5%
0%
5%
10%
15%
20%
25%
30%
Canada Mexico U.S. NAFTA World
Bilateral Gross Trade Flows with China(Jan-Oct Total, Yr/Yr %Change)
2016 2017 2018 2019
-20%
-15%
-10%
-5%
0%
5%
10%
15%
20%
25%
30%
2010
2011
2012
2013
2014
2015
2016
2017
2018
2019
2020
Investment Pulling BackCanada Mexico U.S.
CUSHMAN & WAKEFIELD | 2020 NORTH AMERICAN INDUSTRIAL OUTLOOK 16
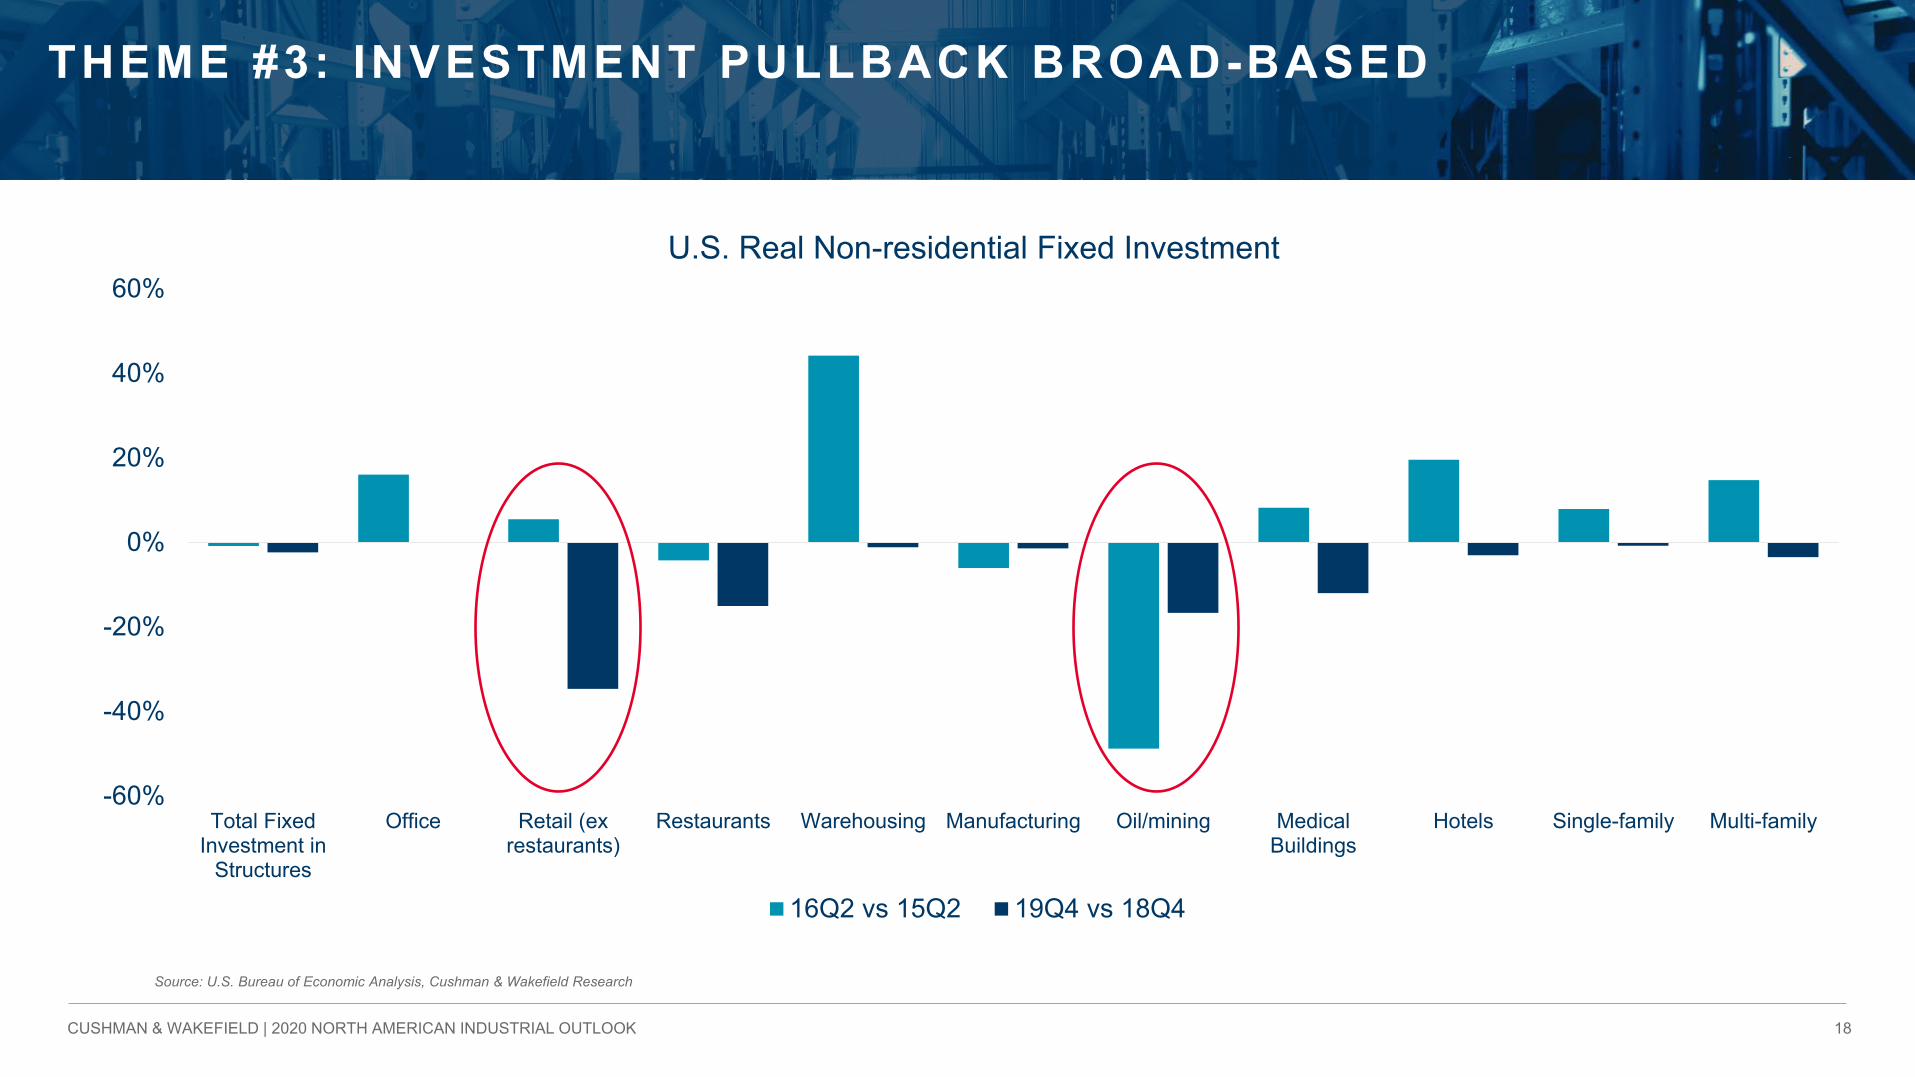
THEME #3: INVESTMENT PULLBACK BROAD-BASED
Source: U.S. Bureau of Economic Analysis, Cushman & Wakefield Research
CUSHMAN & WAKEFIELD | 2020 NORTH AMERICAN INDUSTRIAL OUTLOOK 20
WITH EXCEPTIONS…
THEME #4: LOW INFLATION, LOW INTEREST RATES
Note: *Core PCE inflation, **Private Consumption Deflator, ***Consumer Price IndexSource: U.S. Bureau of Economic Analysis, Statistics Canada, Cabinet Office of Japan, Statistical Office of the European Communities, Oxford Economics, Federal Reserve Bank of Philadelphia Survey of Professional Forecasters, Cushman & Wakefield Research