36
2020 OIL AND GAS OILFIELD SERVICES (OFS) COMPENSATION REPORT ANALYSIS OF COMPENSATION ARRANGEMENTS AMONG THE LARGEST U.S. OFS COMPANIES

2020
OIL AND GAS OILFIELD SERVICES (OFS) COMPENSATION REPORTANALYSIS OF COMPENSATION ARRANGEMENTS AMONG THE LARGEST U.S. OFS COMPANIES
© 2
020
Alva
rez
& M
arsa
l Hol
ding
s, L
LC. A
ll rig
hts
rese
rved
. 906
33
9
13
19
26
1
28
2
30
5
31
32
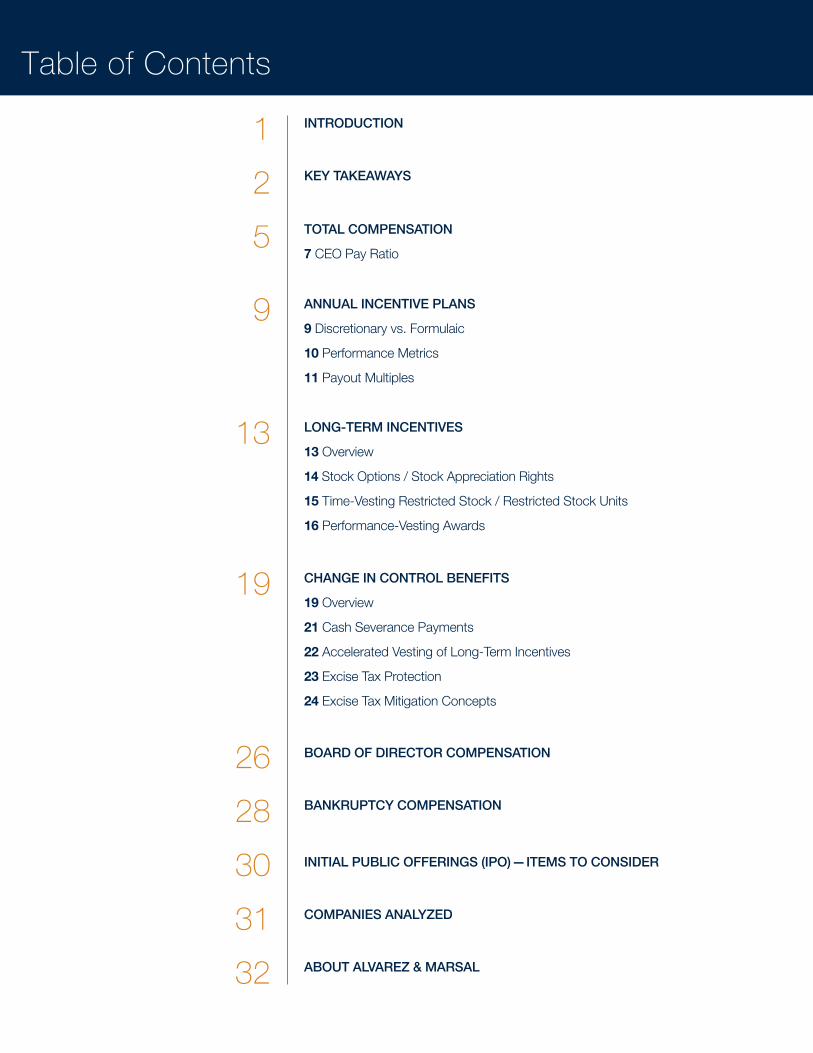
INTRODUCTION
KEY TAKEAWAYS
TOTAL COMPENSATION
7 CEO Pay Ratio
ANNUAL INCENTIVE PLANS
9 Discretionary vs. Formulaic
10 Performance Metrics
11 Payout Multiples
LONG-TERM INCENTIVES
13 Overview
14 Stock Options / Stock Appreciation Rights
15 Time-Vesting Restricted Stock / Restricted Stock Units
16 Performance-Vesting Awards
CHANGE IN CONTROL BENEFITS
19 Overview
21 Cash Severance Payments
22 Accelerated Vesting of Long-Term Incentives
23 Excise Tax Protection
24 Excise Tax Mitigation Concepts
BOARD OF DIRECTOR COMPENSATION
BANKRUPTCY COMPENSATION
INITIAL PUBLIC OFFERINGS (IPO)—ITEMS TO CONSIDER
COMPANIES ANALYZED
ABOUT ALVAREZ & MARSAL
Table of Contents
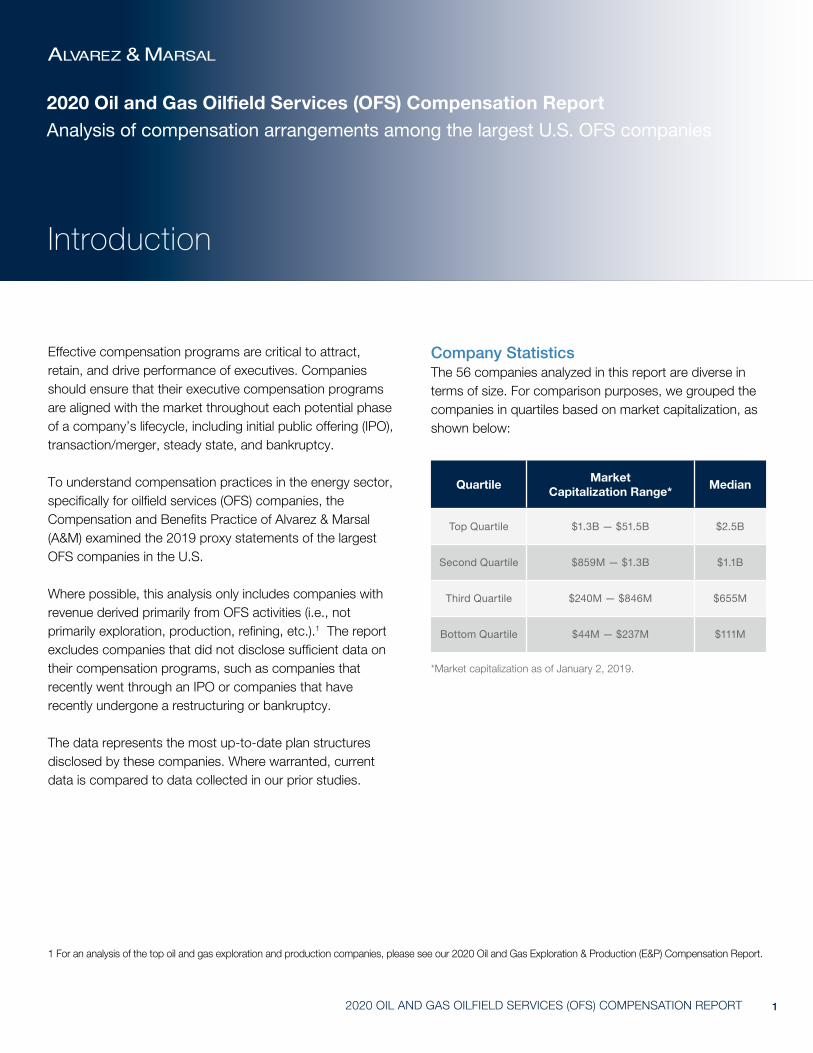
Company StatisticsThe 56 companies analyzed in this report are diverse in terms of size. For comparison purposes, we grouped the companies in quartiles based on market capitalization, as shown below:
Effective compensation programs are critical to attract, retain, and drive performance of executives. Companies should ensure that their executive compensation programs are aligned with the market throughout each potential phase of a company’s lifecycle, including initial public offering (IPO), transaction/merger, steady state, and bankruptcy.
To understand compensation practices in the energy sector, specifically for oilfield services (OFS) companies, the Compensation and Benefits Practice of Alvarez & Marsal (A&M) examined the 2019 proxy statements of the largest OFS companies in the U.S.
Where possible, this analysis only includes companies with revenue derived primarily from OFS activities (i.e., not primarily exploration, production, refining, etc.).1 The report excludes companies that did not disclose sufficient data on their compensation programs, such as companies that recently went through an IPO or companies that have recently undergone a restructuring or bankruptcy.
The data represents the most up-to-date plan structures disclosed by these companies. Where warranted, current data is compared to data collected in our prior studies.
Introduction
12020 OIL AND GAS OILFIELD SERVICES (OFS) COMPENSATION REPORT
1 For an analysis of the top oil and gas exploration and production companies, please see our 2020 Oil and Gas Exploration & Production (E&P) Compensation Report.
QuartileMarket
Capitalization Range*Median
Top Quartile $1.3B — $51.5B $2.5B
Second Quartile $859M — $1.3B $1.1B
Third Quartile $240M — $846M $655M
Bottom Quartile $44M — $237M $111M
*Market capitalization as of January 2, 2019.
2020 Oil and Gas Oilfield Services (OFS) Compensation ReportAnalysis of compensation arrangements among the largest U.S. OFS companies

2
Annual and Long-Term Incentive Compensation
§ On average, incentive compensation — including annual and long-term incentives — comprises approximately 83 percent of a CEO’s and 77 percent of a CFO’s total compensation package.
§ Only 7 percent of companies in the top three quartiles utilize annual incentive plans (AIPs) where payout is determined on a purely discretionary basis, while approximately 29 percent of companies in the bottom quartile utilize totally discretionary performance metrics.
§ The types of AIP metrics utilized within the sector are varied and diverse. EBITDA is the most prevalent performance metric (83 percent). The next three most prevalent metrics are health, safety and environmental (60 percent); cash flow (27 percent); and return on capital (12 percent).
§ The prevalence of LT I awards varies by company size, but time-vesting restricted stock / restricted stock units and performance-vesting awards are most common, utilized by 95 percent and 75 percent of companies, respectively.
§ For performance-based LT I awards, relative total shareholder return is the most common performance metric, used by 76 percent of companies. The most common performance period is 3 years, used by 96 percent of all companies.
Total Compensation
§ Compared to last year, the average total compensation for CEOs and CFOs remained relatively flat.
§ While it remains unclear what constitutes a “good” CEO pay ratio, the data indicates that a ratio of 50x–200x is most prevalent.
Key Takeaways
CEO
-1%Decrease
2019 Average$5,656,015
CFO
0%Remained Flat
2019 Average$2,280,889
95%
95% of companies utilize time-vesting restricted stock / RSUs
76%Companies using relative TSR
as a performance metric.

32020 OIL AND GAS OILFIELD SERVICES (OFS) COMPENSATION REPORT
Change in Control Benefits
§ The most common cash severance multiple for CEOs and CFOs is 2x to 2.99x compensation (52 percent and 62 percent, respectively).
§ The most valuable benefit received in connection with a change in control is accelerated vesting and payout of LT I, making up 50 percent and 43 percent of the total for CEOs and CFOs, respectively.
§ Double trigger equity vesting (termination required) is most prevalent (65 percent), while single trigger equity vesting (no termination required) is less common (31 percent).
§ Only 9 percent of CEOs and CFOs are entitled to receive excise tax “gross-up” payments — meaning the company pays the executive the amount of any excise tax imposed, thereby making the executive “whole” on an after-tax basis. 67 percent of companies do not address excise tax protection at all.
§ Since gross-ups are becoming less common, other excise tax mitigation concepts should be explored. A reasonable compensation analysis is a commonly utilized mitigation concept, whereby a portion of the total parachute payments is attributed to reasonable compensation for services rendered either before or after the CIC.
Bankruptcy Compensation
§ More than 175 OFS companies in the U.S. filed for bankruptcy since 2015.
§ Incentive programs, when properly structured, can help bridge the compensation gap between the onset of financial hardship and a healthy go-forward restructuring.
§ Just as incentive plans may be effective tools prior to and during the bankruptcy process, equity granted by companies upon emergence from bankruptcy is utilized to motivate and retain employees after the company has emerged from bankruptcy protection.
Initial Public Offerings (IPOs) — Items to Consider
§ As commodity prices rebounded from 2017 until late 2018, the industry saw an increased demand for fracking and various other maintenance services. Accordingly, the OFS sector experienced approximately 16 IPOs over the period from 2017–2018.
§ The market for IPOs softened in 2019; however we would expect to see the number of IPOs increase as commodity prices improve.
§ 10 OFS companies that recently completed an IPO are included in this report.
Only 9% of CEOs and CFOs are entitled to receive excise tax “gross ups”
175+OFS companies in the U.S. have filed for bankruptcy since 2015
9%

“ Total compensation of CEOs and CFOs remained relatively flat year-over-year.”
52020 OIL AND GAS OILFIELD SERVICES (OFS) COMPENSATION REPORT
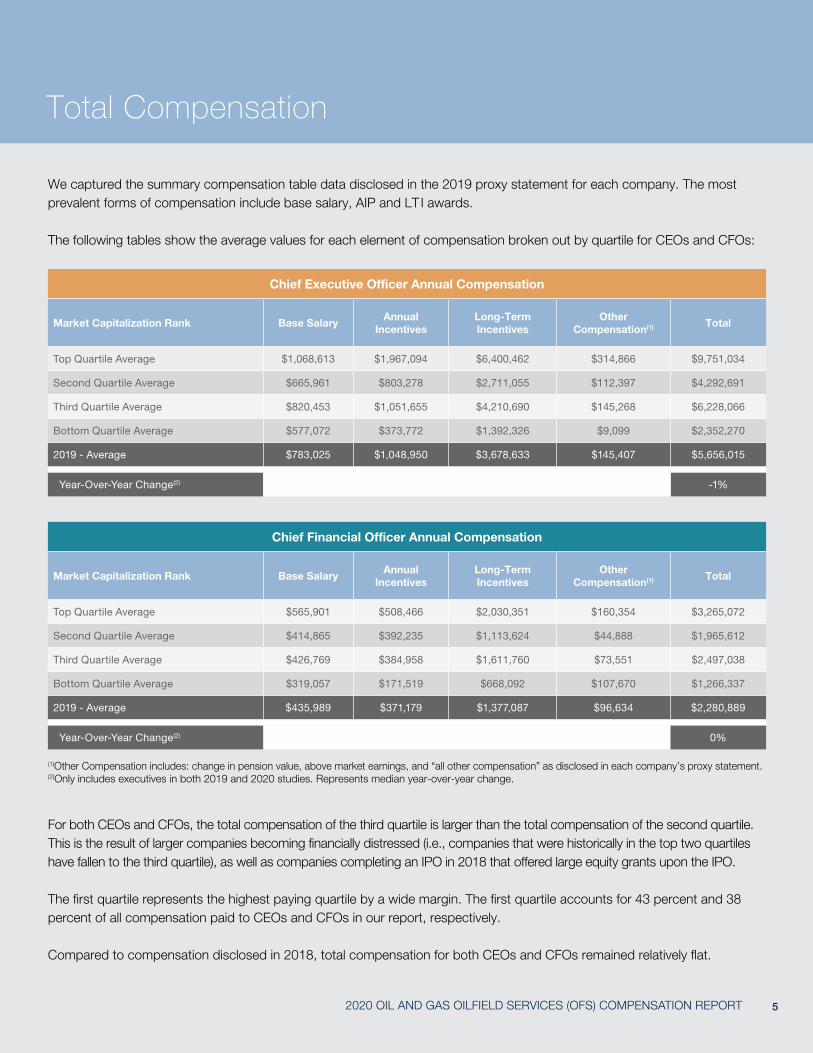
We captured the summary compensation table data disclosed in the 2019 proxy statement for each company. The most prevalent forms of compensation include base salary, AIP and LT I awards.
The following tables show the average values for each element of compensation broken out by quartile for CEOs and CFOs:
For both CEOs and CFOs, the total compensation of the third quartile is larger than the total compensation of the second quartile. This is the result of larger companies becoming financially distressed (i.e., companies that were historically in the top two quartiles have fallen to the third quartile), as well as companies completing an IPO in 2018 that offered large equity grants upon the IPO.
The first quartile represents the highest paying quartile by a wide margin. The first quartile accounts for 43 percent and 38 percent of all compensation paid to CEOs and CFOs in our report, respectively.
Compared to compensation disclosed in 2018, total compensation for both CEOs and CFOs remained relatively flat.
Chief Executive Officer Annual Compensation
Market Capitalization Rank Base SalaryAnnual
IncentivesLong-Term Incentives
Other Compensation(1) Total
Top Quartile Average $1,068,613 $1,967,094 $6,400,462 $314,866 $9,751,034
Second Quartile Average $665,961 $803,278 $2,711,055 $112,397 $4,292,691
Third Quartile Average $820,453 $1,051,655 $4,210,690 $145,268 $6,228,066
Bottom Quartile Average $577,072 $373,772 $1,392,326 $9,099 $2,352,270
2019 - Average $783,025 $1,048,950 $3,678,633 $145,407 $5,656,015
Year-Over-Year Change(2) -1%
Chief Financial Officer Annual Compensation
Market Capitalization Rank Base SalaryAnnual
IncentivesLong-Term Incentives
Other Compensation(1) Total
Top Quartile Average $565,901 $508,466 $2,030,351 $160,354 $3,265,072
Second Quartile Average $414,865 $392,235 $1,113,624 $44,888 $1,965,612
Third Quartile Average $426,769 $384,958 $1,611,760 $73,551 $2,497,038
Bottom Quartile Average $319,057 $171,519 $668,092 $107,670 $1,266,337
2019 - Average $435,989 $371,179 $1,377,087 $96,634 $2,280,889
Year-Over-Year Change(2) 0%
(1)Other Compensation includes: change in pension value, above market earnings, and “all other compensation” as disclosed in each company’s proxy statement.(2)Only includes executives in both 2019 and 2020 studies. Represents median year-over-year change.
Total Compensation

6
On average, incentive compensation — including annual and long-term incentives — comprises 80 percent of an executive’s total compensation package. The charts on the right show the proportion of total direct compensation delivered in base salary, AIP, LT I awards and other compensation for CEOs and CFOs.
Because incentive compensation is such an integral part of the total compensation package for executives at most companies, we examine annual and long-term incentive programs in greater detail later in this report.
Total Compensation
Average portion of an executive’s total compensation package derived from
incentive compensation
80%
CEO Total Compensation
CFO Total Compensation
18%65%
14%3%
Base SalaryAIPLT IOther Compensation
16%
61%
19%4%
Base SalaryAIPLT IOther Compensation
72020 OIL AND GAS OILFIELD SERVICES (OFS) COMPENSATION REPORT
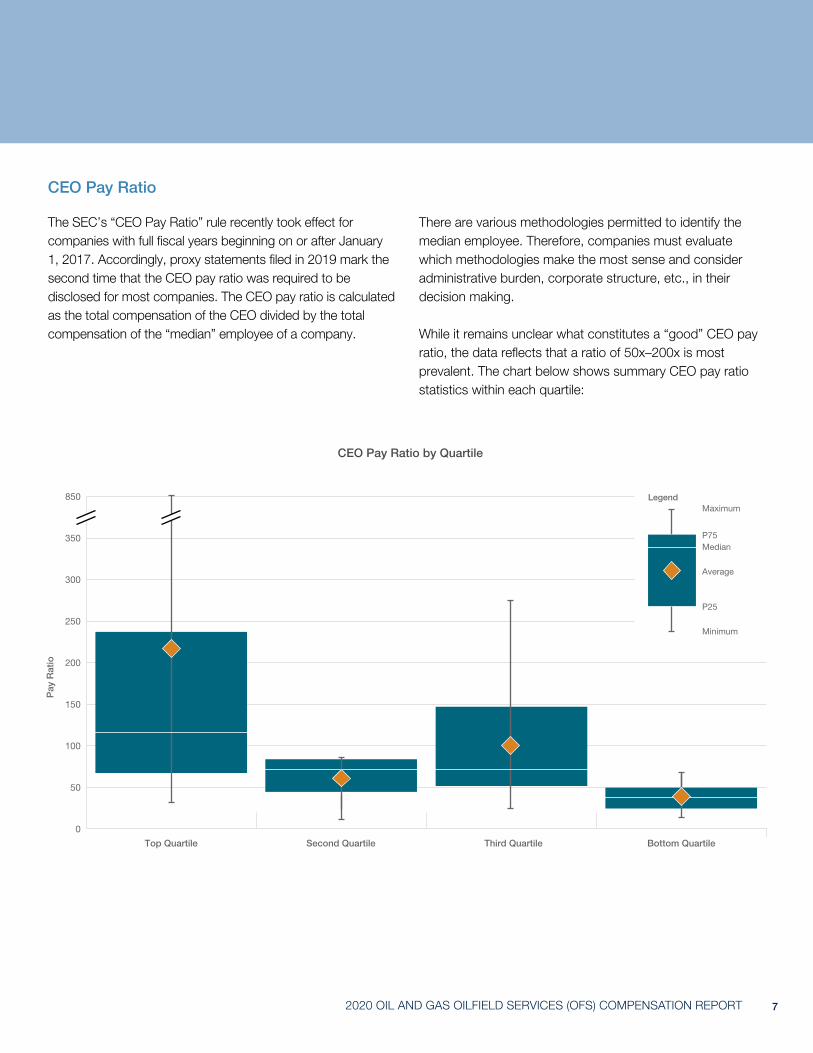
CEO Pay Ratio
CEO Pay Ratio by Quartile
850
350
300
250
200
150
100
50
0
Pay
Rat
io
Top Quartile Second Quartile Third Quartile Bottom Quartile
The SEC’s “CEO Pay Ratio” rule recently took effect for companies with full fiscal years beginning on or after January 1, 2017. Accordingly, proxy statements filed in 2019 mark the second time that the CEO pay ratio was required to be disclosed for most companies. The CEO pay ratio is calculated as the total compensation of the CEO divided by the total compensation of the “median” employee of a company.
There are various methodologies permitted to identify the median employee. Therefore, companies must evaluate which methodologies make the most sense and consider administrative burden, corporate structure, etc., in their decision making.
While it remains unclear what constitutes a “good” CEO pay ratio, the data reflects that a ratio of 50x–200x is most prevalent. The chart below shows summary CEO pay ratio statistics within each quartile:
LegendMaximum
Median
Average
P25
Minimum
P75

8
“Annual incentives drive executive performance in the short term.”
92020 OIL AND GAS OILFIELD SERVICES (OFS) COMPENSATION REPORT
Annual Incentive Plans
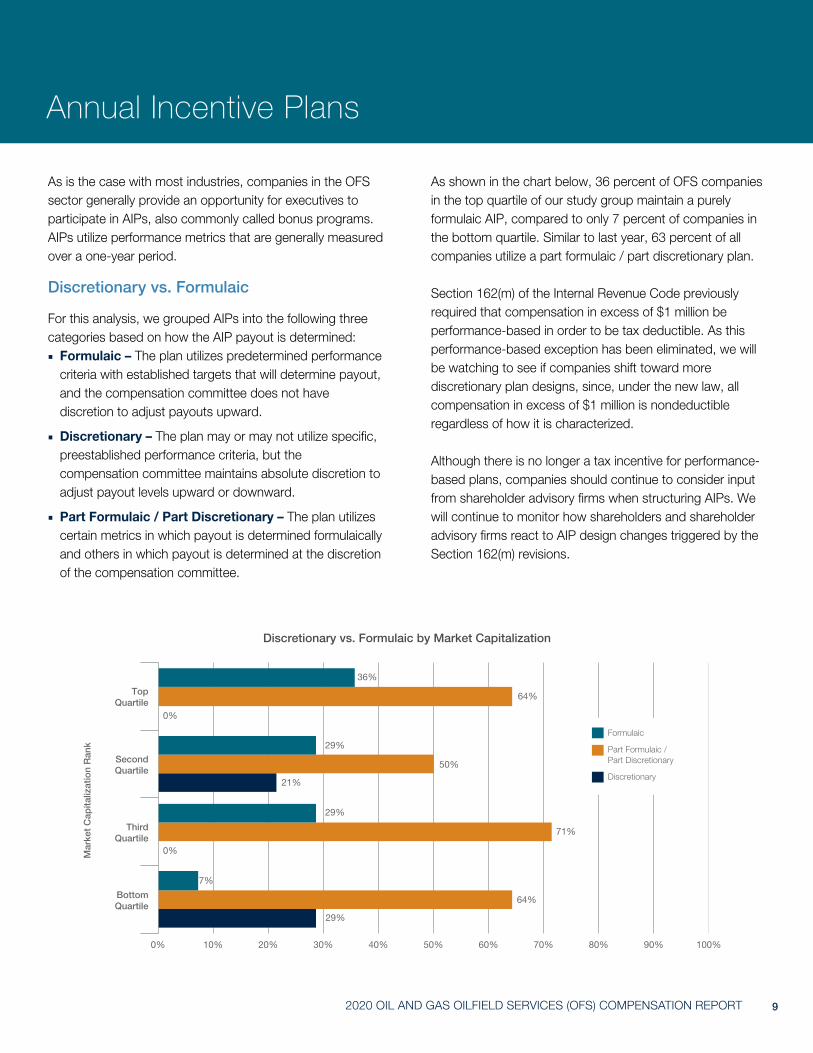
As is the case with most industries, companies in the OFS sector generally provide an opportunity for executives to participate in AIPs, also commonly called bonus programs. AIPs utilize performance metrics that are generally measured over a one-year period.
Discretionary vs. Formulaic
For this analysis, we grouped AIPs into the following three categories based on how the AIP payout is determined: ■ Formulaic – The plan utilizes predetermined performance criteria with established targets that will determine payout, and the compensation committee does not have discretion to adjust payouts upward.
■ Discretionary – The plan may or may not utilize specific, preestablished performance criteria, but the compensation committee maintains absolute discretion to adjust payout levels upward or downward.
■ Part Formulaic / Part Discretionary – The plan utilizes certain metrics in which payout is determined formulaically and others in which payout is determined at the discretion of the compensation committee.
As shown in the chart below, 36 percent of OFS companies in the top quartile of our study group maintain a purely formulaic AIP, compared to only 7 percent of companies in the bottom quartile. Similar to last year, 63 percent of all companies utilize a part formulaic / part discretionary plan.
Section 162(m) of the Internal Revenue Code previously required that compensation in excess of $1 million be performance-based in order to be tax deductible. As this performance-based exception has been eliminated, we will be watching to see if companies shift toward more discretionary plan designs, since, under the new law, all compensation in excess of $1 million is nondeductible regardless of how it is characterized.
Although there is no longer a tax incentive for performance-based plans, companies should continue to consider input from shareholder advisory firms when structuring AIPs. We will continue to monitor how shareholders and shareholder advisory firms react to AIP design changes triggered by the Section 162(m) revisions.
0% 20% 40% 60% 80%10% 30% 50% 70% 90% 100%
36%
0%
0%
29%
29%
7%
64%
71%
50%
64%
21%
29%
Formulaic
Part Formulaic / Part Discretionary
Discretionary
Discretionary vs. Formulaic by Market Capitalization
Top Quartile
Second Quartile
Mar
ket
Cap
italiz
atio
n R
ank
Third Quartile
Bottom Quartile

10
Annual Incentive Plans
Companies utilize formulaic compensation programs to provide clarity to executives and shareholders on how compensation will be determined. Some companies maintain discretion over the payout of AIPs to allow them to adjust the payouts for events that are unforeseen and/or out of the executives’ control. Some companies exercise discretion by implementing an AIP with a formulaic trigger (e.g., achieving a certain level of EBITDA, or cash flow) to fund a bonus pool, which can then be allocated within the discretion of the board.
Performance MetricsGenerally, as market capitalization increases, companies have a stronger tendency to utilize stated performance metrics. It is important to note that simply because a plan utilizes performance metrics, it may not necessarily be classified as “formulaic.” Based on the terms of the plan, it may ultimately be classified as “discretionary” if the board retains full discretion to adjust payouts (higher or lower) under the plan.
The following chart displays the most prevalent metrics used in AIPs. EBITDA is the most prevalent metric, utilized by 83 percent of companies. Health, safety and environmental is the next most prevalent metric, utilized by 60 percent of OFS companies, followed by cash flow, utilized by 27 percent of OFS companies.
The prevalence of performance metrics generally remained consistent with last year’s results.
100%
80%
60%
71%
57%
64%
60%
26%
21%
27%
17%
14% 14%10% 10%
5%
12%10%
4%
83% 83%
40%
20%
0%
201720182019
Performance Metric Prevalence
EBITDA Cash Flow EarningsHealth / Safety / Environmental
Return on Capital Discretion
Per
cent
age
of
Co
mp
anie
s G
rant
ing

112020 OIL AND GAS OILFIELD SERVICES (OFS) COMPENSATION REPORT
Payout Multiples
The chart below shows the target level of AIP payouts as a percentage of base salary for CEOs and CFOs. The median target payout is approximately 100 percent of base salary for CEOs and 80 percent of base salary for CFOs. When disclosed, threshold payout generally ranges from 25 percent to 50 percent of the target, and maximum payout is generally 200 percent of the target.
Target Annual Incentive Payout
160%
140%
120%
100%
80%
60%
40%
20%
0%
Tar
get
Pay
out
%
CEOs CFOs
LegendMaximum
Median
Average
P25
Minimum
P75

12
“Long-term incentives comprise the largest portion of executive compensation packages.”

132020 OIL AND GAS OILFIELD SERVICES (OFS) COMPENSATION REPORT
Overview
Companies grant LT I awards to motivate and retain executives and to align the interests of executives and shareholders. LT I generally consists of stock options, stock appreciation rights (SARs), time-vesting restricted stock or restricted stock units (RSUs), and performance-vesting awards (i.e., awards that vest upon satisfaction of some performance criteria rather that solely based on the passage of time). For purposes of this analysis, we grouped awards into three categories: (1) time-vesting stock options and SARs, (2) time-vesting restricted stock and RSUs, and (3) performance-vesting awards.
Award Type Prevalence
The chart on the right shows the prevalence of stock options / SARs, time-vesting restricted stock / RSUs, and performance-vesting awards for all companies: ■ Time-vesting restricted stock / RSUs and performance-vesting awards remained the most prevalent vehicles year-over-year.
■ Stock options / SARs remained the least prevalent LT I vehicle utilized, as they provide little to no value to an executive in a down or flat market, which also reduces (or eliminates) any retentive value from this type of award.
■ Most companies that utilize performance-vesting awards or stock options also grant time-vesting restricted stock or RSUs to balance out the retentive goal of their LTI program.
Long-Term Incentives
LTI Award Prevalence
100%
80%
60%
40%
20%
0%
28%
88% 88%
30%
91%
84%
14%
95%
75%
Time-Vesting Stock Options / SARs
Time-Vesting Restricted Stock /
RSUs
Performance-Vesting Awards
201720182019
Per
cent
of
Co
mp
anie
s G
rant
ing
Award Prevalence by Market Capitalization
A&M also analyzed whether a company’s size (in terms of market capitalization) impacts the prevalence of awards that are provided. As shown in the chart on the right: ■ Stock options / SARs vary in their usage, but are more prevalent at larger companies.
■ Time-vesting restricted stock / RSUs are utilized fairly uniformly across all company sizes.
■ Performance-vesting awards are less prevalent at smaller companies.
Consistent with prior years, a majority of companies (73 percent) grant two or more types of LT I vehicles.
Award Type Prevalence by Market Capitalization Rank
100%
80%
60%
40%
20%
0%
29%
7% 7%14%
86%
71%79%
57%
93%100% 100%
93%
Stock Options / SARs
Time-Vesting Restricted Stock / RSUs
Performance-Vesting Awards
Top Quartile
Second Quartile
Third Quartile
Bottom Quartile
Per
cent
of
Co
mp
anie
s G
rant
ing
14
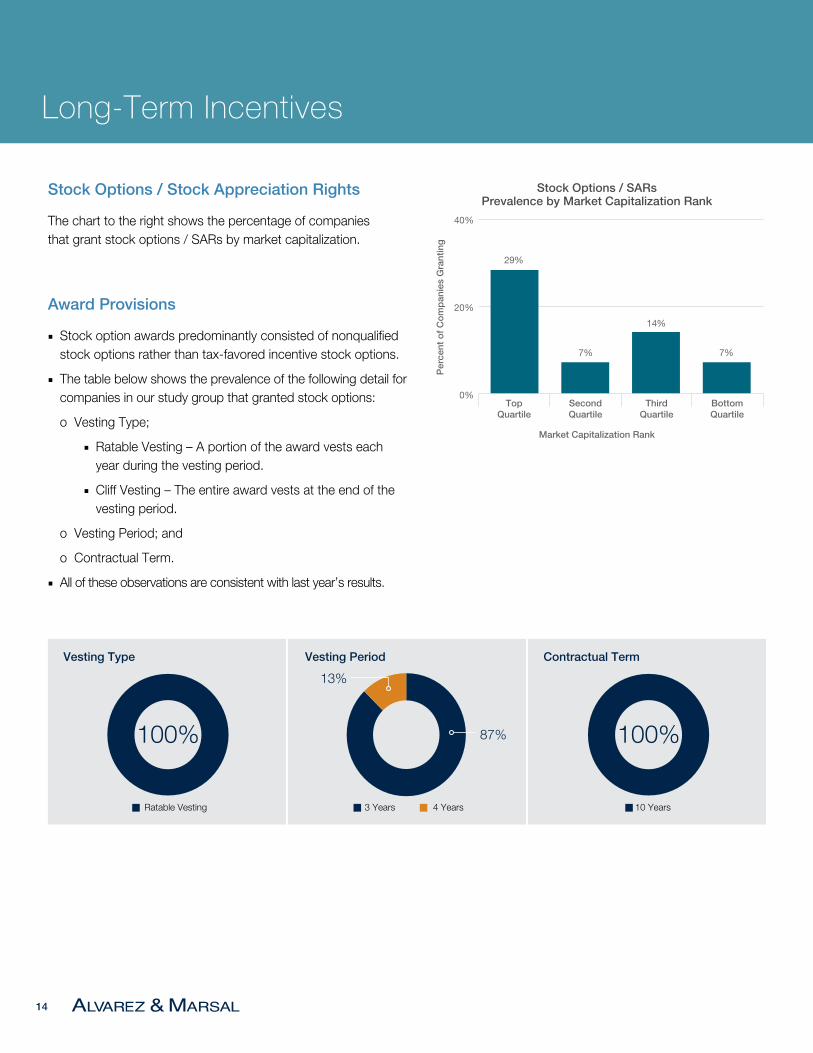
Stock Options / Stock Appreciation Rights
The chart to the right shows the percentage of companies that grant stock options / SARs by market capitalization.
Award Provisions
■ Stock option awards predominantly consisted of nonqualified stock options rather than tax-favored incentive stock options.
■ The table below shows the prevalence of the following detail for companies in our study group that granted stock options:
o Vesting Type;
■ Ratable Vesting – A portion of the award vests each year during the vesting period.
■ Cliff Vesting – The entire award vests at the end of the vesting period.
o Vesting Period; and
o Contractual Term.
■ All of these observations are consistent with last year’s results.
Long-Term Incentives
Vesting Type Vesting Period Contractual Term
Ratable Vesting 10 Years3 Years 4 Years
87%
13%
100% 100%
Stock Options / SARs Prevalence by Market Capitalization Rank
40%
20%
0%
29%
7% 7%
14%
Top Quartile
Second Quartile
Third Quartile
Bottom Quartile
Market Capitalization RankP
erce
nt o
f C
om
pan
ies
Gra
ntin
g

152020 OIL AND GAS OILFIELD SERVICES (OFS) COMPENSATION REPORT
Time-Vesting Restricted Stock / Restricted Stock Units
The chart on the right shows the percentage of companies that grant time-vesting restricted stock / RSUs by market capitalization. The prevalence is fairly high, exceeding 85 percent for all sizes of companies.
Award Provisions
■ Of companies that grant time-vesting restricted stock / RSUs, it is almost twice as prevalent for companies to grant RSUs than restricted stock. One of the reasons is that RSUs can give executives the ability to defer payout beyond vesting.
■ A three-year vesting period is the most common vesting period (utilized by 87 percent of companies).
■ As shown in the chart on the right, the vast majority of companies continue to utilize awards that vest ratably rather than cliff vest.
Time-Vesting Restricted Stock / RSUs Prevalence by Market Capitalization Rank
100%
80%
60%
40%
20%
0%
86%
100% 100%93%
Top Quartile
Second Quartile
Third Quartile
Bottom Quartile
Market Capitalization RankP
erce
nt o
f C
om
pan
ies
Gra
ntin
g
Restricted Stock / RSUs Ratable Vesting vs. Cliff Vesting
100%
80%
60%
40%
20%
0%Ratable Vesting Cliff Vesting
91%
9%
93%
7%
92%
8%
Per
cent
of
Co
mp
anie
s G
rant
ing
201720182019
16
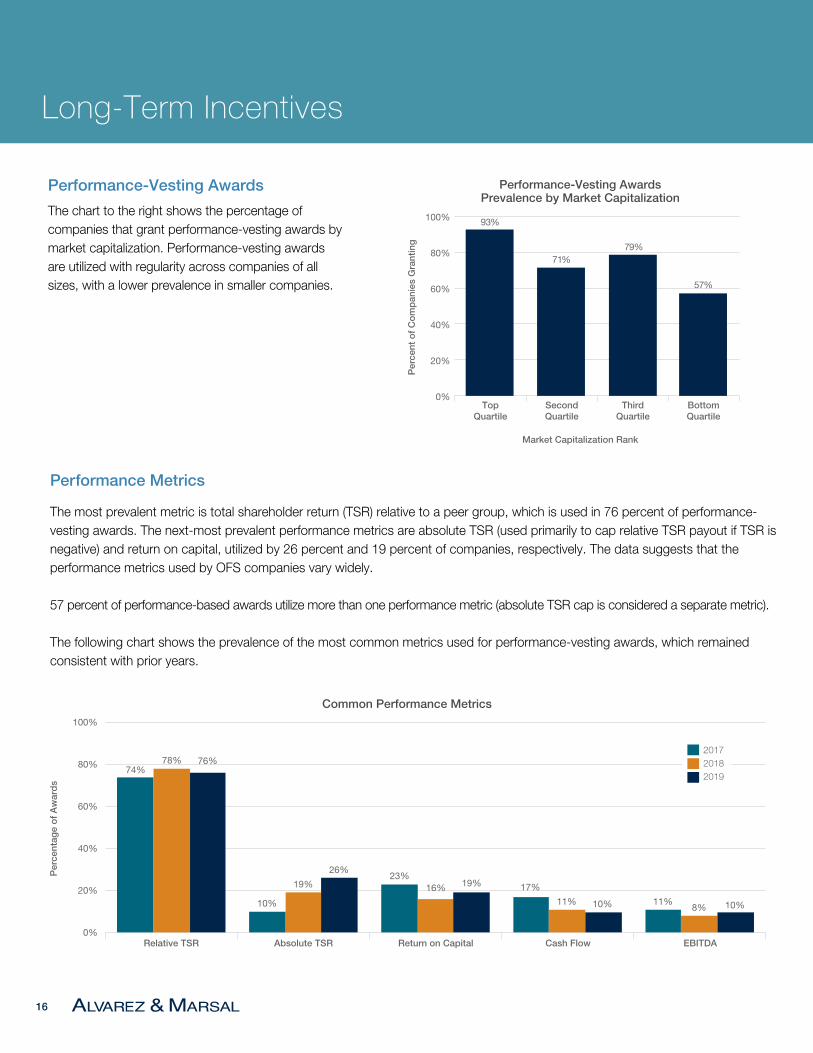
Performance Metrics
The most prevalent metric is total shareholder return (TSR) relative to a peer group, which is used in 76 percent of performance-vesting awards. The next-most prevalent performance metrics are absolute TSR (used primarily to cap relative TSR payout if TSR is negative) and return on capital, utilized by 26 percent and 19 percent of companies, respectively. The data suggests that the performance metrics used by OFS companies vary widely.
57 percent of performance-based awards utilize more than one performance metric (absolute TSR cap is considered a separate metric).
The following chart shows the prevalence of the most common metrics used for performance-vesting awards, which remained consistent with prior years.
Common Performance Metrics
100%
80%
60%
40%
20%
0%Relative TSR Return on CapitalAbsolute TSR Cash Flow EBITDA
201720182019
74%
10%
23%17%
11%
78%
19% 16%
11%8%
76%
26%19%
10% 10%
Per
cent
age
of
Aw
ard
s
Performance-Vesting Awards Prevalence by Market Capitalization
100%
80%
60%
40%
20%
0%
71%79%
57%
93%
Top Quartile
Second Quartile
Third Quartile
Bottom Quartile
Market Capitalization Rank
Performance-Vesting Awards
The chart to the right shows the percentage of companies that grant performance-vesting awards by market capitalization. Performance-vesting awards are utilized with regularity across companies of all sizes, with a lower prevalence in smaller companies.
Long-Term Incentives
Per
cent
of
Co
mp
anie
s G
rant
ing
172020 OIL AND GAS OILFIELD SERVICES (OFS) COMPENSATION REPORT
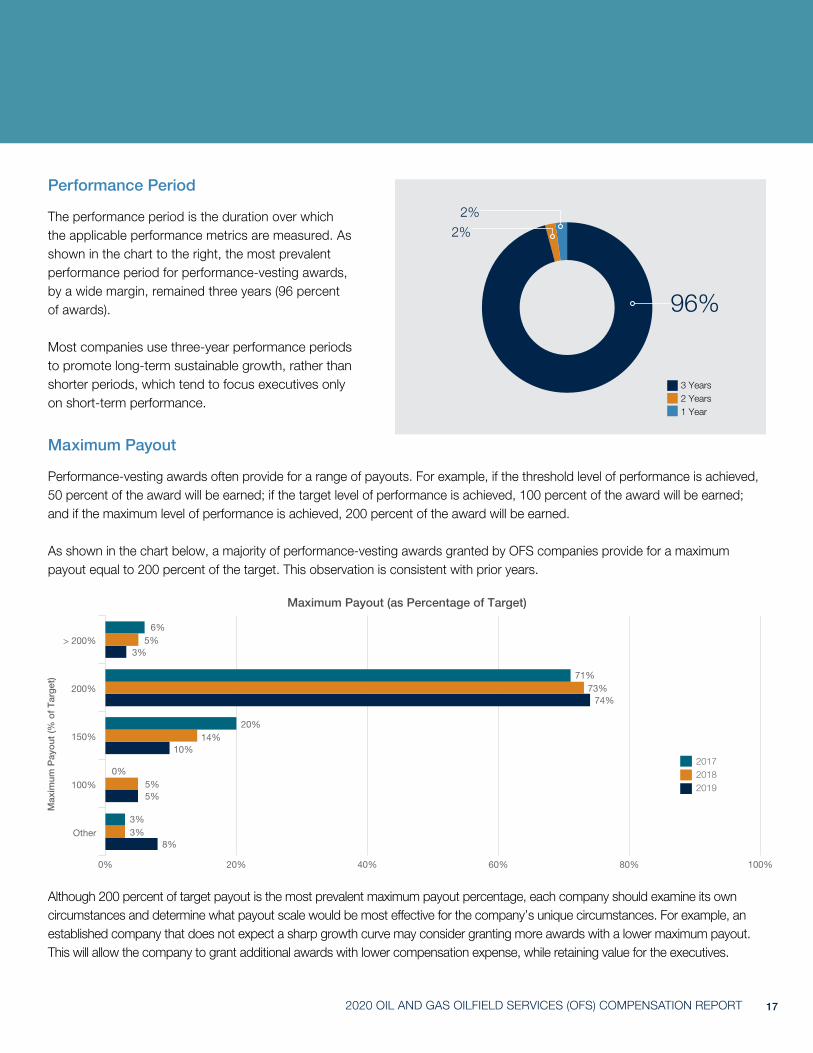
Maximum Payout
Performance-vesting awards often provide for a range of payouts. For example, if the threshold level of performance is achieved, 50 percent of the award will be earned; if the target level of performance is achieved, 100 percent of the award will be earned; and if the maximum level of performance is achieved, 200 percent of the award will be earned.
As shown in the chart below, a majority of performance-vesting awards granted by OFS companies provide for a maximum payout equal to 200 percent of the target. This observation is consistent with prior years.
Although 200 percent of target payout is the most prevalent maximum payout percentage, each company should examine its own circumstances and determine what payout scale would be most effective for the company’s unique circumstances. For example, an established company that does not expect a sharp growth curve may consider granting more awards with a lower maximum payout. This will allow the company to grant additional awards with lower compensation expense, while retaining value for the executives.
Maximum Payout (as Percentage of Target)
> 200%
200%
0% 40% 80%20% 60% 100%
Other
100%
150%
3%
10%
74%
5%
8%
5%
14%
73%
5%
3%
6%
20%
71%
0%
3%
Max
imum
Pay
out
(% o
f T
arg
et)
Performance Period
The performance period is the duration over which the applicable performance metrics are measured. As shown in the chart to the right, the most prevalent performance period for performance-vesting awards, by a wide margin, remained three years (96 percent of awards).
Most companies use three-year performance periods to promote long-term sustainable growth, rather than shorter periods, which tend to focus executives only on short-term performance.
2%
2%
3 Years2 Years1 Year
96%
201720182019

18
“ In uncertain circumstances, change in control arrangements help to keep executive talent retained and focused.”

192020 OIL AND GAS OILFIELD SERVICES (OFS) COMPENSATION REPORT
Change in Control Benefits
Overview
In recent years, external forces have continued to advocate for more transparency and change with respect to executive compensation. As a result of the Say-on-Pay advisory vote, shareholders now have a louder voice with which to communicate their satisfaction or displeasure with the company’s compensation programs. One area of executive compensation that is often embattled with criticism is change in control provisions.
Typical change in control benefits include severance payments, accelerated vesting of equity awards, enhanced retirement benefits and excise tax protection. The charts below show the average value of change in control benefits for CEOs and CFOs:
As with compensation in general, the amount of CIC benefits payable to CEOs and CFOs varies dramatically based on company size. The decrease in year-over-year CIC benefits payable to CEOs and CFOs is primarily the result of depressed stock prices, which have lowered the value related to the accelerated vesting of LT I awards.
Change in Control Benefit Values for CEOs
Market Capitalization Rank SeveranceAnnual
IncentivesLong-Term Incentives
Retirement Benefits
Excise Tax Gross-Up
Other(1) Average Total Benefit
Top Quartile $3,301,260 $880,597 $8,178,662 $549,597 $401,403 $197,175 $13,508,693
Second Quartile $2,841,380 $207,881 $3,472,035 $160,934 - $60,448 $6,742,678
Third Quartile $4,635,976 $574,600 $4,872,095 $4,137 - $364,563 $10,451,370
Bottom Quartile $2,271,712 $722,329 $1,112,198 - $288,607 $79,886 $4,474,732
2019 - Average $3,262,582 $596,352 $4,408,747 $178,667 $172,502 $175,518 $8,794,368
Year-Over-Year Change(2) -18%
Change in Control Benefit Values for CFOs
Market Capitalization Rank SeveranceAnnual
IncentivesLong-Term Incentives
Retirement Benefits
Excise Tax Gross-Up
Other(1) Average Total Benefit
Top Quartile $1,512,076 $210,753 $1,941,011 $235,444 $185,049 $115,124 $4,199,457
Second Quartile $1,057,509 $113,907 $1,381,811 $141,126 - $37,307 $2,731,659
Third Quartile $1,840,935 $147,740 $1,255,190 - - $94,297 $3,338,163
Bottom Quartile $902,564 $326,606 $707,452 - $134,235 $19,073 $2,089,929
2019 - Average $1,334,663 $195,946 $1,345,781 $99,471 $79,274 $67,712 $3,122,847
Year-Over-Year Change(2) -15%
(1)Other includes health & welfare benefit continuation, outplacement services, and other benefits received in connection with a change in control.(2)Only includes executives in both 2019 and 2020 studies. Represents median year-over-year change.
20
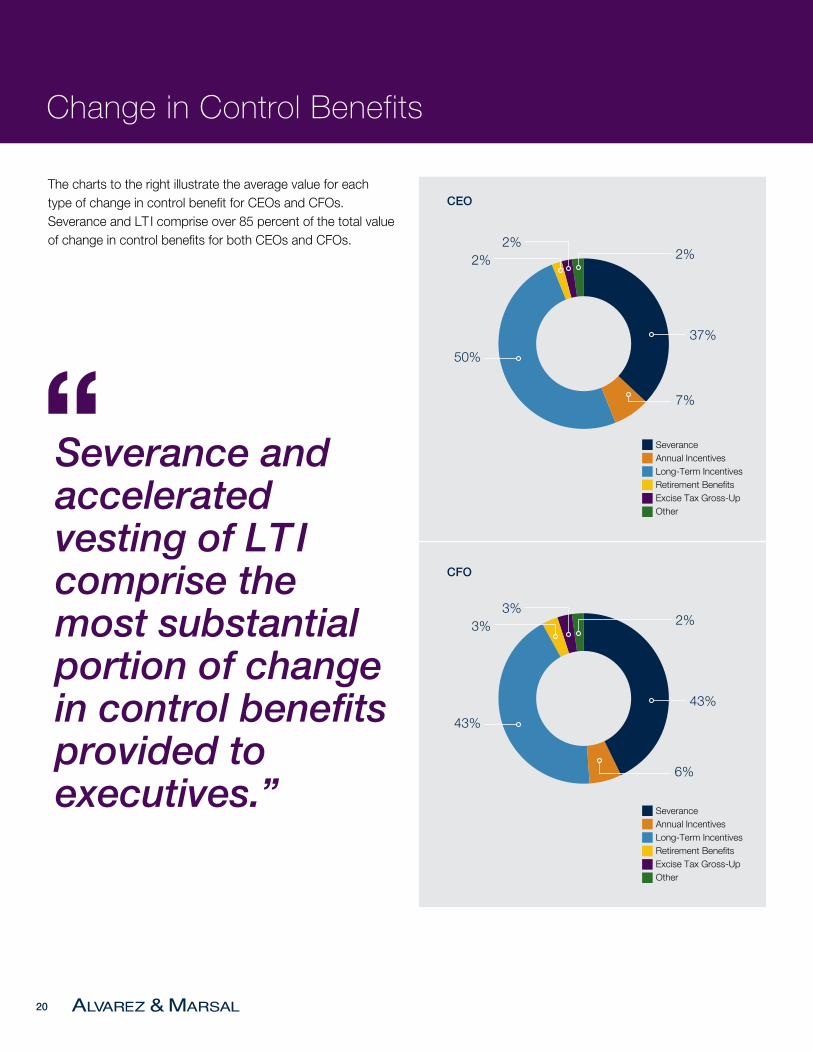
The charts to the right illustrate the average value for each type of change in control benefit for CEOs and CFOs. Severance and LT I comprise over 85 percent of the total value of change in control benefits for both CEOs and CFOs.
Severance and accelerated vesting of LTI comprise the most substantial portion of change in control benefits provided to executives.”
“
CEO
CFO
Change in Control Benefits
37%
43%
50%
43%
2%
2%
7%
6%
2%
3%
2%
3%
SeveranceAnnual Incentives Long-Term IncentivesRetirement Benefits Excise Tax Gross-Up Other
SeveranceAnnual Incentives Long-Term IncentivesRetirement Benefits Excise Tax Gross-Up Other
212020 OIL AND GAS OILFIELD SERVICES (OFS) COMPENSATION REPORT
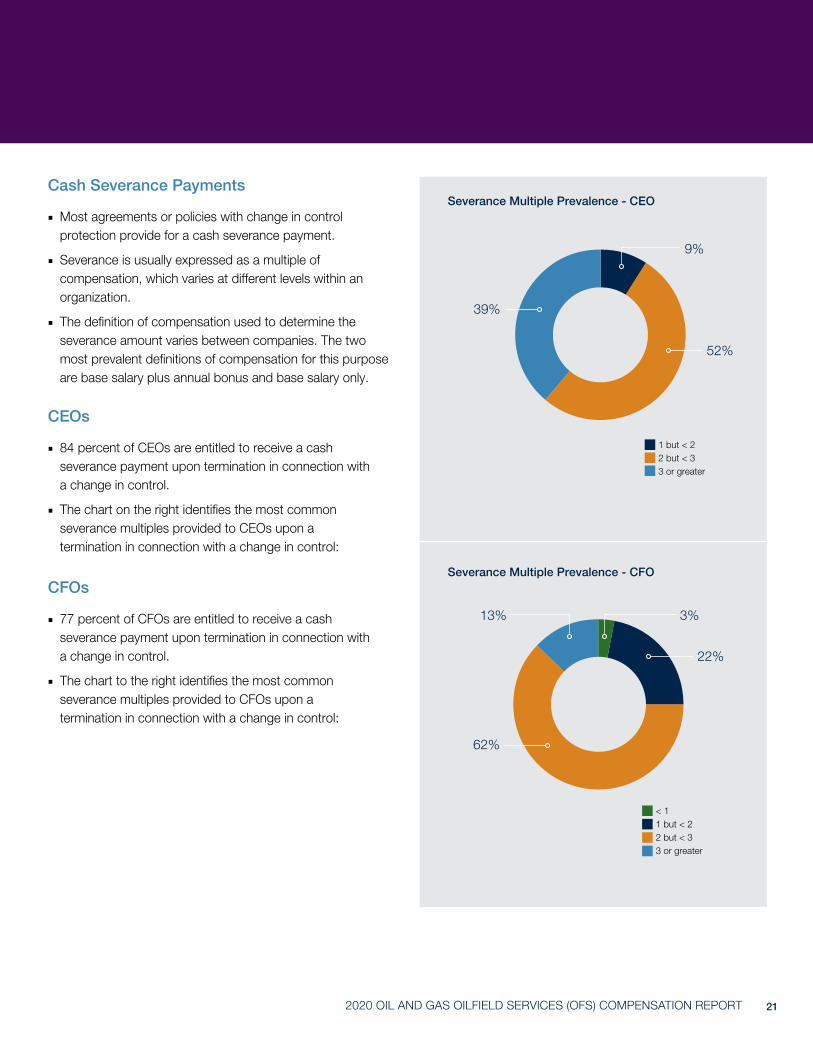
Cash Severance Payments
■ Most agreements or policies with change in control protection provide for a cash severance payment.
■ Severance is usually expressed as a multiple of compensation, which varies at different levels within an organization.
■ The definition of compensation used to determine the severance amount varies between companies. The two most prevalent definitions of compensation for this purpose are base salary plus annual bonus and base salary only.
CEOs
■ 84 percent of CEOs are entitled to receive a cash severance payment upon termination in connection with a change in control.
■ The chart on the right identifies the most common severance multiples provided to CEOs upon a termination in connection with a change in control:
CFOs
■ 77 percent of CFOs are entitled to receive a cash severance payment upon termination in connection with a change in control.
■ The chart to the right identifies the most common severance multiples provided to CFOs upon a termination in connection with a change in control:
Severance Multiple Prevalence - CEO
Severance Multiple Prevalence - CFO
1 but < 22 but < 33 or greater
< 11 but < 22 but < 33 or greater
62%
52%
3%13%
22%
39%
9%

22
Accelerated Vesting of Long-Term Incentives
Trigger Description
Single Only a change in control must occur for vesting to be accelerated.
Double* A change in control plus termination without cause or resignation for “good reason” must occur within a certain period after the change in control.
Discretionary The Board has the discretion to trigger the vesting of an award after a change in control.
* Sometimes companies allow for single trigger vesting if the acquiring company does not assume the equity awards, but require double trigger vesting if the awards are assumed by the acquirer. For the purposes of this study, this treatment was included in the double trigger vesting category.
There are generally three types of change in control payout triggers for equity awards:
The most common trigger found in equity plans is double trigger (65 percent), while only 31 percent of companies have at least some equity awards outstanding with a single trigger. Only 4 percent of companies provide the board with discretion to accelerate the vesting of outstanding equity awards.
We have observed a steady increase in the use of double trigger vesting. We attribute the shift toward double trigger vesting to pressure from shareholders and shareholder advisory services. Accordingly, we expect the trend toward double trigger vesting to continue into the future.
The chart on the right shows the prevalence of change in control triggers for outstanding equity awards of CEOs and CFOs:
2017
2018
2019
100%
80%
60% 59%
43%
31%
38%
3% 3% 4%
54%
65%
40%
20%
0%
Equity Vesting Triggers
Single - CIC Double - Termination and CIC
Discretionary
Change in Control Benefits
Per
cent
of
Co
mp
anie
s G
rant
ing

232020 OIL AND GAS OILFIELD SERVICES (OFS) COMPENSATION REPORT
Excise Tax Protection
Provision Description
Gross-up The company pays the executive the full amount of any excise tax imposed. The gross-up payment thereby makes the executive “whole” on an after-tax basis. The gross-up includes applicable federal, state and local taxes resulting from the payment of the excise tax.
Modified Gross-up
The company will gross-up the executive if the payments exceed the “safe harbor” limit by a certain amount (e.g., $50,000) or percentage (e.g., 10%). Otherwise, payments are cut back to the “safe harbor” limit to avoid any excise tax.
Cut Back The company cuts back parachute payments to the “safe harbor” limit to avoid any excise tax.
Valley Provision
The company cuts back parachute payments to the “safe harbor” limit, if it is more financially advantageous to the executive. Otherwise, the company does not adjust the payments and the executive is responsible for paying the excise tax.
None Some companies do not address the excise tax; therefore, executives are solely responsible for the excise tax.
The “Golden Parachute” rules impose a 20 percent excise tax on an executive if the executive receives a parachute payment greater than the “safe harbor” limit. Companies may address this excise tax issue in one of the following ways:
9 percent of companies provide a gross-up to their CEO or CFO (down from 13 percent in 2018). A majority of companies (67 percent) do not provide any form of excise tax protection.
The prevalence of these provisions for CEOs and CFOs is illustrated in the pie chart to the right:
Excise Tax Protection Among CEOs and CFOs
Gross-UpCut BackValley ProvisionNone
67%
9%
2%
22%
24
Change in Control Benefits
Excise Tax Mitigation Concepts
Since excise tax gross-ups are becoming less common, other excise tax mitigation concepts should be explored. A reasonable compensation analysis is a commonly utilized mitigation concept, whereby a portion of the total parachute payments is attributed to reasonable compensation for services rendered either before or after the CIC. Alternatively, rather than focusing on the value of parachute payments, base amount planning can help increase an executive’s safe harbor limit.
• Pre-Change in Control Reasonable Compensation – Section 280G provides that an excess parachute payment is reduced by the portion of the payment established by clear and convincing evidence to be reasonable compensation for personal services rendered before the date of the change in control.
• Post-Change in Control Reasonable Compensation – Section 280G provides that the amount treated as a parachute payment does not include the portion of a payment established by clear and convincing evidence to be reasonable compensation for personal services to be rendered on or after the date of the change in control.
A common payment that can be treated as post-change in control reasonable compensation is a payment for a covenant not to compete that is intended to keep an individual from competing with his employer after the change in control. An expert valuation of the covenant not to compete should be performed.
• Base Amount Planning – If it is known far enough in advance that a change in control will occur in a future calendar year, there may be an opportunity for base amount planning. It would be advantageous to include as many payments as possible to a disqualified individual in the calendar year prior to the change in control. This will increase the base amount and Section 280G threshold of the disqualified individual, which can lower or completely eliminate any excess parachute payments. Section 409A should be considered when accelerating any payments.

252020 OIL AND GAS OILFIELD SERVICES (OFS) COMPENSATION REPORT
“An effective mitigation concept may reduce or eliminate the risk of excise taxes and lost deductions.”
26
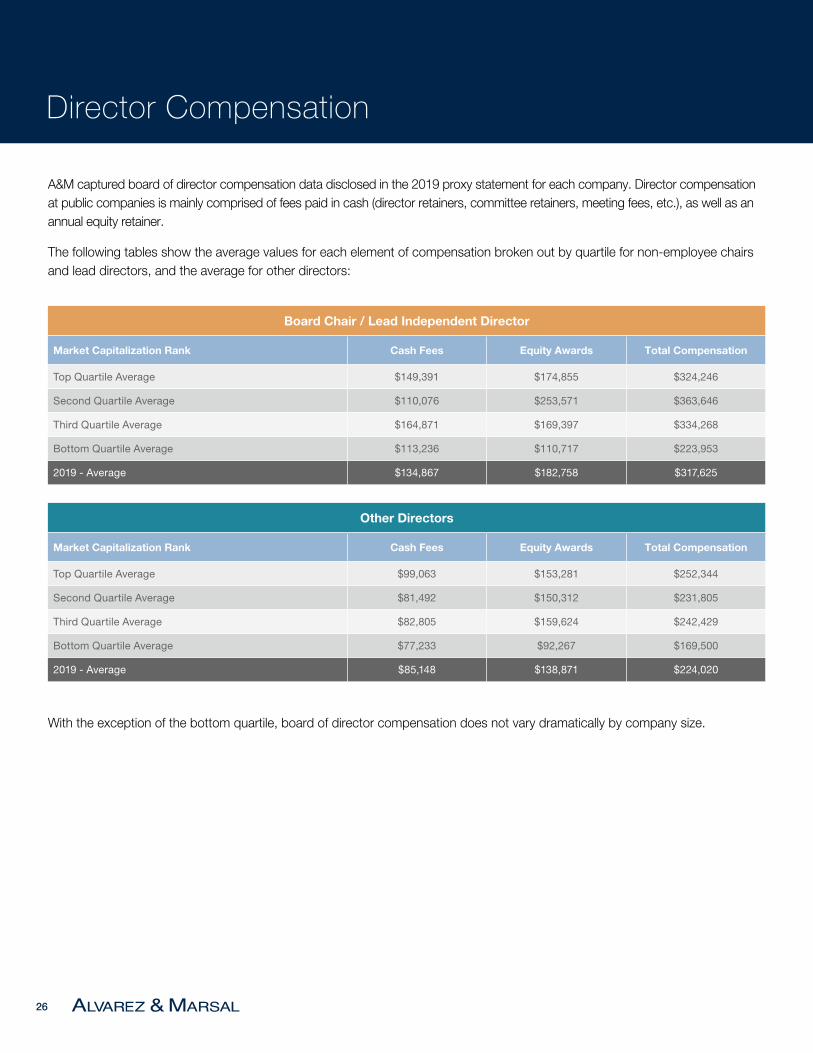
Director Compensation
A&M captured board of director compensation data disclosed in the 2019 proxy statement for each company. Director compensation at public companies is mainly comprised of fees paid in cash (director retainers, committee retainers, meeting fees, etc.), as well as an annual equity retainer.
The following tables show the average values for each element of compensation broken out by quartile for non-employee chairs and lead directors, and the average for other directors:
With the exception of the bottom quartile, board of director compensation does not vary dramatically by company size.
Board Chair / Lead Independent Director
Market Capitalization Rank Cash Fees Equity Awards Total Compensation
Top Quartile Average $149,391 $174,855 $324,246
Second Quartile Average $110,076 $253,571 $363,646
Third Quartile Average $164,871 $169,397 $334,268
Bottom Quartile Average $113,236 $110,717 $223,953
2019 - Average $134,867 $182,758 $317,625
Other Directors
Market Capitalization Rank Cash Fees Equity Awards Total Compensation
Top Quartile Average $99,063 $153,281 $252,344
Second Quartile Average $81,492 $150,312 $231,805
Third Quartile Average $82,805 $159,624 $242,429
Bottom Quartile Average $77,233 $92,267 $169,500
2019 - Average $85,148 $138,871 $224,020
272020 OIL AND GAS OILFIELD SERVICES (OFS) COMPENSATION REPORT
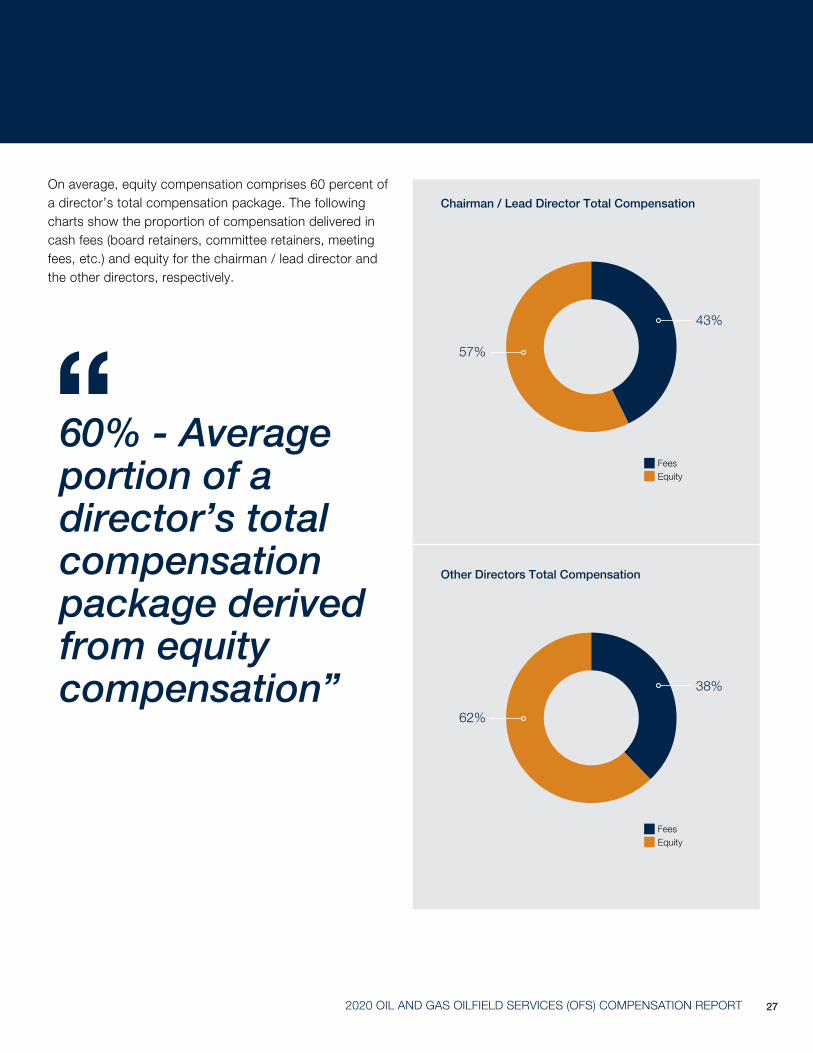
On average, equity compensation comprises 60 percent of a director’s total compensation package. The following charts show the proportion of compensation delivered in cash fees (board retainers, committee retainers, meeting fees, etc.) and equity for the chairman / lead director and the other directors, respectively.
60% - Average portion of a director’s total compensation package derived from equity compensation”
“
Chairman / Lead Director Total Compensation
Other Directors Total Compensation
FeesEquity
FeesEquity
57%
62%
43%
38%
28
Bankruptcy Compensation
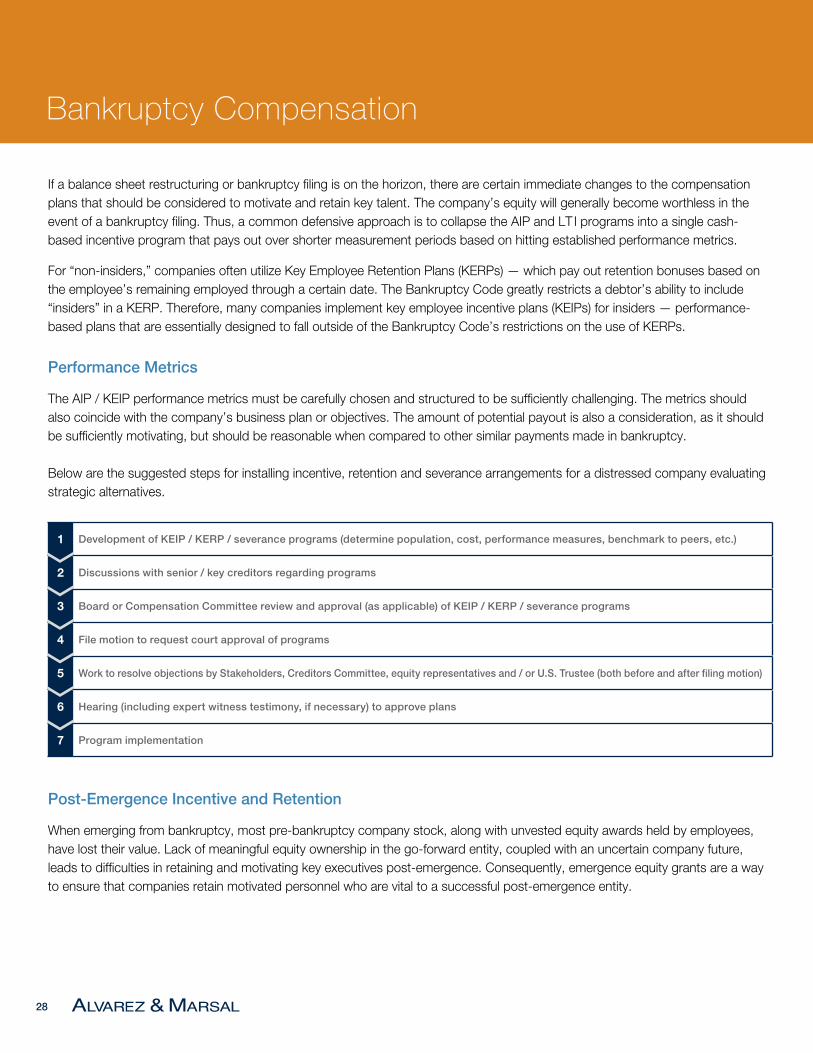
If a balance sheet restructuring or bankruptcy filing is on the horizon, there are certain immediate changes to the compensation plans that should be considered to motivate and retain key talent. The company’s equity will generally become worthless in the event of a bankruptcy filing. Thus, a common defensive approach is to collapse the AIP and LT I programs into a single cash-based incentive program that pays out over shorter measurement periods based on hitting established performance metrics.
For “non-insiders,” companies often utilize Key Employee Retention Plans (KERPs) — which pay out retention bonuses based on the employee’s remaining employed through a certain date. The Bankruptcy Code greatly restricts a debtor’s ability to include “insiders” in a KERP. Therefore, many companies implement key employee incentive plans (KEIPs) for insiders — performance-based plans that are essentially designed to fall outside of the Bankruptcy Code’s restrictions on the use of KERPs.
Performance Metrics
The AIP / KEIP performance metrics must be carefully chosen and structured to be sufficiently challenging. The metrics should also coincide with the company’s business plan or objectives. The amount of potential payout is also a consideration, as it should be sufficiently motivating, but should be reasonable when compared to other similar payments made in bankruptcy.
Below are the suggested steps for installing incentive, retention and severance arrangements for a distressed company evaluating strategic alternatives.
Post-Emergence Incentive and Retention
When emerging from bankruptcy, most pre-bankruptcy company stock, along with unvested equity awards held by employees, have lost their value. Lack of meaningful equity ownership in the go-forward entity, coupled with an uncertain company future, leads to difficulties in retaining and motivating key executives post-emergence. Consequently, emergence equity grants are a way to ensure that companies retain motivated personnel who are vital to a successful post-emergence entity.
1 Development of KEIP / KERP / severance programs (determine population, cost, performance measures, benchmark to peers, etc.)
2 Discussions with senior / key creditors regarding programs
3 Board or Compensation Committee review and approval (as applicable) of KEIP / KERP / severance programs
4 File motion to request court approval of programs
5 Work to resolve objections by Stakeholders, Creditors Committee, equity representatives and / or U.S. Trustee (both before and after filing motion)
6 Hearing (including expert witness testimony, if necessary) to approve plans
7 Program implementation

292020 OIL AND GAS OILFIELD SERVICES (OFS) COMPENSATION REPORT
“ Incentive programs, when properly structured, can help bridge the compensation gap between the onset of financial hardship and a healthy go-forward restructuring.”
30
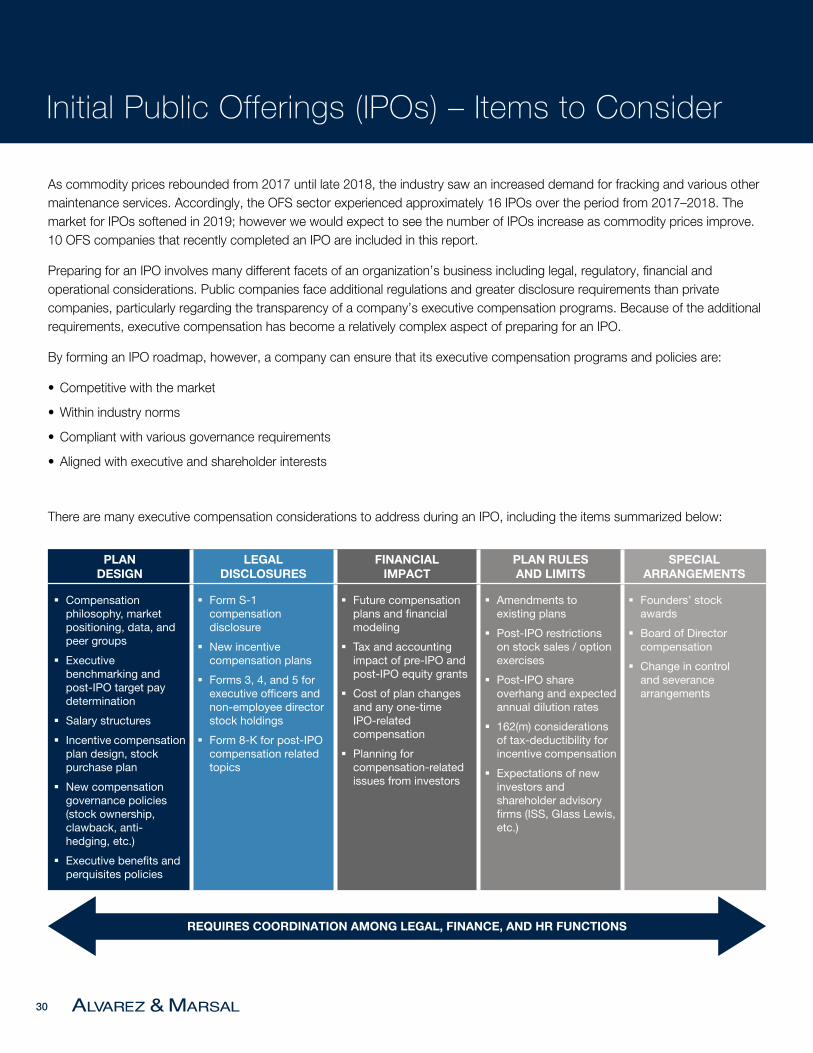
Initial Public Offerings (IPOs) – Items to Consider
As commodity prices rebounded from 2017 until late 2018, the industry saw an increased demand for fracking and various other maintenance services. Accordingly, the OFS sector experienced approximately 16 IPOs over the period from 2017–2018. The market for IPOs softened in 2019; however we would expect to see the number of IPOs increase as commodity prices improve. 10 OFS companies that recently completed an IPO are included in this report.
Preparing for an IPO involves many different facets of an organization’s business including legal, regulatory, financial and operational considerations. Public companies face additional regulations and greater disclosure requirements than private companies, particularly regarding the transparency of a company’s executive compensation programs. Because of the additional requirements, executive compensation has become a relatively complex aspect of preparing for an IPO.
By forming an IPO roadmap, however, a company can ensure that its executive compensation programs and policies are:
• Competitive with the market
• Within industry norms
• Compliant with various governance requirements
• Aligned with executive and shareholder interests
There are many executive compensation considerations to address during an IPO, including the items summarized below:
PLAN DESIGN
LEGAL DISCLOSURES
FINANCIAL IMPACT
PLAN RULES AND LIMITS
SPECIAL ARRANGEMENTS
§ Compensation philosophy, market positioning, data, and peer groups
§ Executive benchmarking and post-IPO target pay determination
§ Salary structures
§ Incentive compensation plan design, stock purchase plan
§ New compensation governance policies (stock ownership, clawback, anti-hedging, etc.)
§ Executive benefits and perquisites policies
§ Form S-1 compensation disclosure
§ New incentive compensation plans
§ Forms 3, 4, and 5 for executive officers and non-employee director stock holdings
§ Form 8-K for post-IPO compensation related topics
§ Future compensation plans and financial modeling
§ Tax and accounting impact of pre-IPO and post-IPO equity grants
§ Cost of plan changes and any one-time IPO-related compensation
§ Planning for compensation-related issues from investors
§ Amendments to existing plans
§ Post-IPO restrictions on stock sales / option exercises
§ Post-IPO share overhang and expected annual dilution rates
§ 162(m) considerations of tax-deductibility for incentive compensation
§ Expectations of new investors and shareholder advisory firms (ISS, Glass Lewis, etc.)
§ Founders’ stock awards
§ Board of Director compensation
§ Change in control and severance arrangements
REQUIRES COORDINATION AMONG LEGAL, FINANCE, AND HR FUNCTIONS
312020 OIL AND GAS OILFIELD SERVICES (OFS) COMPENSATION REPORT
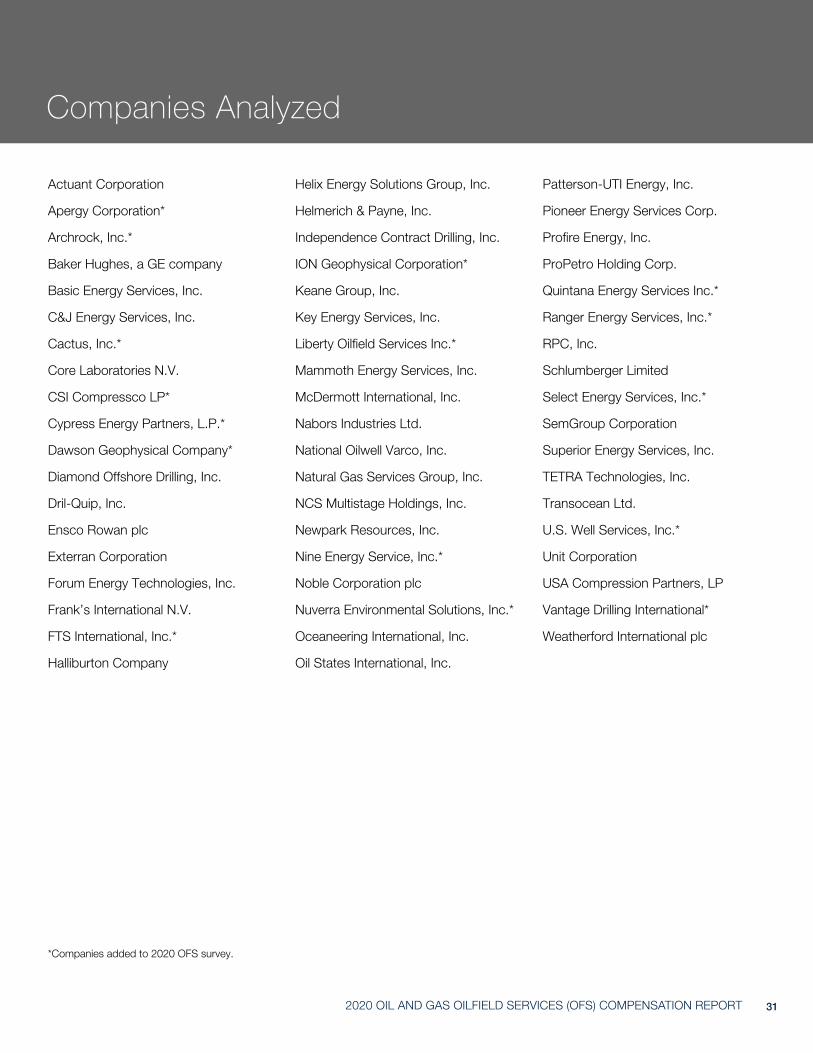
Companies Analyzed
Actuant Corporation
Apergy Corporation*
Archrock, Inc.*
Baker Hughes, a GE company
Basic Energy Services, Inc.
C&J Energy Services, Inc.
Cactus, Inc.*
Core Laboratories N.V.
CSI Compressco LP*
Cypress Energy Partners, L.P.*
Dawson Geophysical Company*
Diamond Offshore Drilling, Inc.
Dril-Quip, Inc.
Ensco Rowan plc
Exterran Corporation
Forum Energy Technologies, Inc.
Frank’s International N.V.
FTS International, Inc.*
Halliburton Company
Helix Energy Solutions Group, Inc.
Helmerich & Payne, Inc.
Independence Contract Drilling, Inc.
ION Geophysical Corporation*
Keane Group, Inc.
Key Energy Services, Inc.
Liberty Oilfield Services Inc.*
Mammoth Energy Services, Inc.
McDermott International, Inc.
Nabors Industries Ltd.
National Oilwell Varco, Inc.
Natural Gas Services Group, Inc.
NCS Multistage Holdings, Inc.
Newpark Resources, Inc.
Nine Energy Service, Inc.*
Noble Corporation plc
Nuverra Environmental Solutions, Inc.*
Oceaneering International, Inc.
Oil States International, Inc.
Patterson-UTI Energy, Inc.
Pioneer Energy Services Corp.
Profire Energy, Inc.
ProPetro Holding Corp.
Quintana Energy Services Inc.*
Ranger Energy Services, Inc.*
RPC, Inc.
Schlumberger Limited
Select Energy Services, Inc.*
SemGroup Corporation
Superior Energy Services, Inc.
TETRA Technologies, Inc.
Transocean Ltd.
U.S. Well Services, Inc.*
Unit Corporation
USA Compression Partners, LP
Vantage Drilling International*
Weatherford International plc
*Companies added to 2020 OFS survey.

The Compensation and Benefits Practice of Alvarez & Marsal assists companies in designing compensation and benefits plans, evaluating and enhancing existing plans, benchmarking compensation and reviewing programs for compliance with changing laws and regulations. We do so in a manner that manages risks associated with tax, financial and regulatory burdens related to such plans. Through our services, we help companies lower costs, improve performance, boost the bottom line and attract and retain key performers.
EXECUTIVE COMPENSATION § Executive compensation consulting, including the design of tax-efficient compensation packages and competitive benchmarking
§ Preparation of executive compensation disclosures for publicly-held entities
§ Annual / long-term incentive and deferred compensation design
MERGERS AND ACQUISITIONS § Pre- and post-merger integration services, including:
§ Executive compensation design
§ Golden parachute analysis (Section 280G)
§ Due diligence of welfare / pension considerations
§ Severance / retention planning
BANKRUPTCY § Bankruptcy-related compensation, including:
§ Design of key employee incentive plans, retention plans and severance plans
§ Expert witness testimony
§ Post-emergence management incentive plans
ALVAREZ & MARSAL’S COMPENSATION AND BENEFITS PRACTICE
Executive Compensation Advisory Consulting
Bankruptcy Compensation Design
Risk Management Consulting
Pre- & Post-Merger and Acquisition Advisory
Incentive & Deferred Compensation Design
Global Incentive Compensation Services
ALVAREZ & MARSAL’S EXECUTIVE COMPENSATION SERVICE OFFERINGS

ACKNOWLEDGMENTSEditor: Ryan Wells
Research Assistance and Data Compilation: Matt Porter, Vance Yudell, Alexa Morgan, Ben Robinson, Emily Nelson and Jake Reistroffer
Follow us on:
ABOUT ALVAREZ & MARSAL
Companies, investors and government entities around the world turn to Alvarez & Marsal (A&M) when conventional approaches are not enough to make change and achieve results. Privately held since its founding in 1983, A&M is a leading global professional services firm that provides advisory, business performance improvement and turnaround management services. With over 4,000 people across four continents, we deliver tangible results for corporates, boards, private equity firms, law firms and government agencies facing complex challenges. Our senior leaders, and their teams, help organizations transform operations, catapult growth and accelerate results through decisive action. Comprised of experienced operators, world-class consultants, former regulators and industry authorities, A&M leverages its restructuring heritage to turn change into a strategic business asset, manage risk and unlock value at every stage of growth.
To learn more, visit: AlvarezandMarsal.com © 2
020
Alva
rez
& M
arsa
l Hol
ding
s, L
LC. A
ll rig
hts
rese
rved
. 906
33
J.D. IVYMANAGING DIRECTOR
+1 214 438 1028
BRIAN L. CUMBERLANDMANAGING DIRECTOR
+1 214 438 1013


