116


Canadian Natural 2020 Annual Report 1
TABLE OF CONTENTS
01 2020 Performance Highlights 03 Letter to our ShareholdersT1-T8 Our World Class Team05 2020 Year-End Reserves 08 Management’s Discussion and Analysis 48 Consolidated Financial Statements 49 Management’s Report
50 Management’s Assessment of Internal Control over Financial Reporting51 Report of Independent Registered Public Accounting Firm 58 Notes to the Consolidated Financial Statements 95 Supplementary Oil and Gas Information 103 Ten-Year Review105 Corporate Information
2020 Performance HighlightsCanadian Natural’s diverse and balanced asset base along with a continued focus on effective and efficient operations delivered industry leading free cash flow, creating significant value for the Company’s shareholders in 2020.
2020 2019 2018
FINANCIAL ($ millions, except per common share amounts)
Product sales $ 17,491 $ 24,394 $ 22,282
Net earnings (loss) $ (435) $ 5,416 $ 2,591
Per common share – basic $ (0.37) $ 4.55 $ 2.13
– diluted $ (0.37) $ 4.54 $ 2.12
Adjusted net earnings (loss) from operations (1) $ (756) $ 3,795 $ 3,263
Per common share – basic $ (0.64) $ 3.19 $ 2.68
– diluted $ (0.64) $ 3.18 $ 2.67
Cash flows from operating activities $ 4,714 $ 8,829 $ 10,121
Adjusted funds flow (2) $ 5,200 $ 10,267 $ 9,088
Per common share – basic $ 4.40 $ 8.62 $ 7.46
– diluted $ 4.40 $ 8.61 $ 7.43
Cash flows used in investing activities $ 2,819 $ 7,255 $ 4,814
Net capital expenditures (3) $ 3,206 $ 7,121 $ 4,731
Long-term debt (4) $ 21,453 $ 20,982 $ 20,623
Shareholders’ equity $ 32,380 $ 34,991 $ 31,974
Debt to book capitalization (5) 40% 37% 39%
(1) Adjusted net earnings from operations is a non-GAAP measure that the Company utilizes in evaluating its performance, as it demonstrates the Company’s ability to generate after-tax operating earnings from its core business areas. The reconciliation “Adjusted Net Earnings (Loss) from Operations, as Reconciled to Net Earnings (Loss)” is presented in the Company’s Management’s Discussion and Analysis (“MD&A”).
(2) Adjusted funds flow is a non-GAAP measure that the Company considers a key measure in evaluating its performance as it demonstrates the Company’s ability to generate the cash flow necessary to fund future growth through capital investment and to repay debt. The reconciliation “Adjusted Funds Flow, as Reconciled to Cash Flows from Operating Activities” is presented in the Company’s MD&A.
(3) Net capital expenditures is a non-GAAP measure that the Company considers a key measure as it provides an understanding of the Company’s capital spending activities in comparison to the Company’s annual capital budget. The reconciliation “Net Capital Expenditures, as Reconciled to Cash Flows used in Investing Activities” is presented in the “Net Capital Expenditures” section of the Company’s MD&A.
(4) Includes the current portion of long-term debt.(5) Calculated as net current and long-term debt; divided by the book value of common shareholders’ equity plus net current and long-term debt.

2Canadian Natural 2020 Annual Report
1,164,000BOE/D
TOTAL PRODUCTION
47%
OF BOE PRODUCTION IS SCO, LIGHT CRUDE OIL & NGLS
2020 2019 2018
OPERATING
Daily production, before royalties (1)
Crude oil and NGLs (Mbbl/d)
North America - excluding Oil Sands Mining and Upgrading 460 406 351
North America - Oil Sands Mining and Upgrading 417 395 426
North Sea 23 28 24
Offshore Africa 17 21 20
918 850 821
Natural gas (MMcf/d)
North America 1,450 1,443 1,490
North Sea 12 24 32
Offshore Africa 15 24 26
1,477 1,491 1,548
Barrels of oil equivalent (MBOE/d) (2) 1,164 1,099 1,079
Drilling activity (3)
North America 71 102 504
North Sea 1 5 4
Offshore Africa – 1 2
72 108 510
(1) Numbers may not add due to rounding.(2) A barrel of oil equivalent (“BOE”) is derived by converting six thousand cubic feet of natural gas to one barrel of crude oil (6 Mcf:1 bbl). This conversion may
be misleading, particularly if used in isolation, since the 6 Mcf:1 bbl ratio is based on an energy equivalency conversion method primarily applicable at the burner tip and does not represent a value equivalency at the wellhead. In comparing the value ratio using current crude oil prices relative to natural gas prices, the 6 Mcf:1 bbl conversion ratio may be misleading as an indication of value.
(3) Net wells. Excludes net stratigraphic test and service wells.

Canadian Natural 2020 Annual Report 3
$1.70/common shareANNUAL DIVIDENDS
$2.2 BILLIONRETURNED TO SHAREHOLDERS
Letter to our ShareholdersThe impact of the COVID-19 pandemic in 2020 affected the very way we conducted our lives and the way we operated our businesses. Through the year we took protocols to protect our stakeholders and would like to thank our employees, contractors, suppliers and shareholders for their support through this challenging year. Despite the challenges of COVID-19 in 2020, the Company had a strong year operationally and financially. Our effective and efficient operations and long life low decline asset base proved their robustness in this challenging year. We were nimble in 2020, quickly lowering capital with minimal impact to annual production as we stayed within the Company’s original production guidance range, effectively managing through a volatile commodity price environment and low crude oil demand. This was achieved through the commitment and hard work of our employees, who were rewarded with no economic layoffs due to the impacts of COVID-19. In 2020 the Company generated strong adjusted funds flow while effectively allocating to the Company’s four pillars of capital allocation; balance sheet strength, returns to shareholders, resource value growth, and opportunistic acquisitions.
Canadian Natural achieved record annual average production of 1,164 MBOE/d in 2020, a 6% increase compared to 2019 levels. The resilience and sustainability of our business model was evident in 2020 as annual adjusted funds flow was strong at approximately $5.3 billion, excluding the provision relating to the Keystone XL pipeline project. Excluding the Painted Pony acquisition costs and the Keystone XL provision, we completely covered our capital program, and dividend, generating approximately $690 million in free cash flow in 2020. Canadian Natural exited 2020 with a strong balance sheet, as net debt, before acquisitions, was essentially unchanged from 2019 levels and liquidity remained strong with approximately $5.4 billion available including cash and cash equivalents and short-term investments. Canadian Natural was patient and disciplined, maintaining its 13% quarterly dividend increase in March 2020 of $0.425 per common share throughout the year. Additionally, in March 2021, the sustainability of our free cash flow generation provided the Board of Directors confidence to increase our dividend by 11% to $1.88 per common share annually, marking the 21st consecutive year of dividend increases.
Environmental, Social and Governance (“ESG”) performance remains a top priority and investments to improve the Company’s performance and reduce environmental footprint continue. The Company’s unique portfolio, supported by long life low decline assets affords Canadian Natural numerous opportunities to deploy new technology and capture innovation to reduce the Company’s Greenhouse Gas (“GHG”) emissions, while enhancing economic margins through continuous improvement initiatives. Canadian Natural has a defined pathway that is driving a long-term reduction of GHG emissions through an integrated emissions management strategy that includes investment in research, technology and innovation, all of which contribute to the Company reaching its aspirational goal of net zero oil sands emissions. Over the last decade Canadian Natural has invested $3.7 billion in research and development, driving the necessary improvements to help the Company successfully reduce our corporate GHG emission intensity by 18% and methane emissions by 28%, from 2016 levels. Our safety record is top tier, as corporate total recordable injury frequency (“TRIF”) improved to 0.21 in 2020, a reduction of 58% from 2016 levels. The Company also reached significant environmental milestones, including the cumulative sequestration at our Quest facility of five million tonnes of CO2 captured from the Scotford Upgrader and the cumulative planting of two and a half million trees at our Oil Sands Mining and Upgrading operations.
Canadian Natural is committed to a long-term presence in the communities where we operate in Canada, the United Kingdom and Africa. This group of stakeholders includes more than 24,000 landowners, 160 municipalities and 80 Indigenous communities in Western Canada, as well as industry, governments, regulators, academia, and non-governmental groups. The Company works with these diverse communities to identify opportunities for education and training, employment, business development and community investment. Canadian Natural also has a strong commitment to corporate governance, which assures stakeholders that the Company always operates with the highest levels of integrity and ethical standards.
Oil Sands Mining and Upgrading was approximately 36% of total corporate production, averaging 417,351 bbl/d of Synthetic Crude Oil (“SCO”), an increase of 6% compared to 2019 levels and the segment delivered impressive results through a combination of high utilization and operational enhancements. Canadian Natural achieved record low annual operating costs of $20.46/bbl of SCO, a decrease of $2.10/bbl or 9% from 2019 levels. During planned turnaround activities at AOSP, gross capacity at the Scotford Upgrader was increased by 20,000 bbl/d to 320,000 bbl/d. The long life, zero decline, high value nature of these assets at Horizon and AOSP continue to deliver free cash flow, maximizing value for our shareholders.

4Canadian Natural 2020 Annual Report
Thermal in situ oil sands operations produced a record 248,971 bbl/d, which represented approximately 21% of total production in 2020, an increase of 48% over 2019 levels. This increase was primarily the result of a full year of operatorship at Jackfish, as well as increased production at Kirby North. Thermal in situ operating costs decreased by 13% to $9.44/bbl compared to 2019 levels, primarily as a result of operational synergies and higher production levels, offset by higher fuel costs. Canadian Natural continued to see positive results during 2020 from its on-going solvent enhanced oil recovery technology pilot at Kirby South, targeting increased bitumen production, a reduction in the steam-to-oil ratio of up to 50%, a reduction of GHG intensity of up to 50% and a high solvent recovery. The Company will continue to monitor results of the pilot throughout 2021 as this technology has the potential for application throughout the Company’s extensive thermal in situ asset base.
Canadian Natural’s North American E&P operations include crude oil, natural gas and NGL producing assets and represented approximately 40% of the Company’s total BOE production in 2020. These assets delivered 211,472 bbl/d of liquids production, a decrease of 11% from 2019 levels as a result of natural declines and strategic decisions to limit capital investment. Natural gas prices strengthened during 2020 creating an opportunity for Canadian Natural to capitalize on the Company’s deep inventory of high-quality natural gas opportunities, resulting in production averaging 1,450 MMcf/d, comparable with 2019 levels. Strong base production, highly economic volumes additions and acquired production in the second half of the year resulted in significant exit rate volume of 1,624 MMcf/d in December 2020.
International operations averaged production of approximately 40,100 bbl/d in 2020, a decrease of 19% from 2019 levels, primarily as a result of the cessation of production at the Banff and Kyle fields in the North Sea and natural declines. In offshore South Africa, where Canadian Natural holds a 20% non-operated working interest, the operator made a significant gas condensate discovery during the second half of 2020. The operator is currently evaluating development scenarios following the successful discovery wells.
Canadian Natural is optimistic for 2021 and confident that its portfolio of assets underpinned by a significant base of long life low decline assets, combined with our flexible, high value E&P assets make Canadian Natural a truly unique, sustainable and robust company. The 2021 capital budget of approximately $3.2 billion drives annual production growth of approximately 61,000 BOE/d at the mid-point from 2020 levels and robust free cash flow generation at annual strip pricing of approximately US$57 WTI per barrel, which is targeted to be allocated towards strengthening the Company’s balance sheet.
Through the hard work and dedication of Canadian Natural’s committed and talented teams, the Company remains well-positioned to continue to deliver effective and efficient operations and top-tier operational results. Canadian Natural is committed to sustainable, growing returns to shareholders and reducing our environmental footprint through innovative technology and a culture of continuous improvement and targets to build upon its history of creating premium value for its shareholders.
N. MURRAY EDWARDS Executive Chairman
N. MURRAY EDWARDSExecutive Chairman
TIM S. MCKAYPresident
MARK A. STAINTHORPEChief Financial Officer and Senior Vice-President, Finance
MARK A. STAINTHORPEChief Financial Officer and Senior Vice-President, Finance
TIM S. MCKAYPresident

Canadian Natural 2020 Annual ReportT1
G. Aalders, E. Aasen, A. Abadier, L. Abadier, A. Abakar, Z. Abbas, T. Abbasi, D. Abbott, M. Abbott, I. Abdi, A. Abdolmaleki, M. Abdulrhman, A. Abeda, W. Abeda, D. Abel, R. Abel, V. Abeng, T. Abercrombie, G. Abou Mechrek, R. Abrams, A. Abramyan, N. Abro, C. Acharya, J. Acosta, J. Acteson-Grill, T. Adair, I. Adam, S. Adam, A. Adams, D. Adams, K. Adams, M. Adams, D. Adamson, P. Adamson, C. Adan, T. Adbous, D. Addinall, A. Adebayo, Y. Adebayo, S. Adel, M. Aden, A. Adesanya, O. Adigun, B. Adjoussou, B. Adkins, N. Agarwal, J. Agate, F. Agbadou, A. Agnihotri, K. Agombar, I. Agu, U. Agu, R. Aguilera Maestre, A. Agustin, C. Agyemang-Badu, A. Ahmad, I. Ahmad, J. Ahmad, M. Ahmad, N. Ahmad, R. Ahmad, S. Ahmad, A. Ahmadi, M. Ahmadi, F. Ahmadloo, A. Ahmari, R. Ahmed, S. Ahmed, M. Ahoonmanesh, R. Aidoo, R. Aikens, D. Aikins, G. Ailsby, J. Airton, S. Aitken, S. Ajayi, T. Ajayi, J. Ajedegba, L. Ajijolaiya, S. Akhtar, R. Akinde, D. Akins, A. Akinsanya, J. Akolkar, N. Akolkar, S. Akolkar, C. Alarcon, J. Alcala, E. Alconcel, N. Aldi, J. Aleman, A. Alexander, D. Alexander, J. Alexander, P. Alexander, A. Ali, G. Ali, R. Aliazas, H. Aljanabi, M. Al-Kaisy, C. Allan, E. Allan, J. Allan, E. Allard, J. Allard, L. Allegretto, A. Allen, B. Allen, J. Allen, T. Allen, W. Allerton, J. Allison, R. Allison, S. Allport, J. Allsop, A. Almaktary, S. Almstrong, Y. Alnumi, J. Alonso, Y. Al-Saeedi, R. Al-Samarrai, S. Al-Siani, A. Alstad, J. Alvarez, B. Alyman, D. Amalaman, G. Amalia, J. Aman, M. Amar, T. Amara, A. Amay, A. Amer, B. Amer, K. Amer, J. Amero, D. Ames, E. Amos, W. Amy, A. Amyotte, D. Anctil, J. Andel, D. Andersen, T. Andersen, A. Anderson, B. Anderson, C. Anderson, D. Anderson, J. Anderson, K. Anderson, L. Anderson, M. Anderson, N. Anderson, P. Anderson, R. Anderson, S. Anderson, W. Anderson, I. Andonov, D. Andreoli, C. Andres, B. Andrews, D. Andrews, K. Andrews, T. Andrews, E. Anfort, C. Angeles, P. Angell, L. Angen, K. Angerman, M. Anis, L. Anongba, M. Ansah-Sam, A. Ansell, C. Ansong-Danquah, D. Ansorger, R. Anstett, V. Anstey, L. Antal, W. Anthony, E. Antle, C. Antoine, M. Antoine, A. Anton, K. Antonishyn, J. Antoniuk, A. Antunes, H. Aparicio Ramos, P. Appiah, J. Aquila, R. Aranguren, F. Arano, L. Arbour, J. Argan, H. Arias, L. Arias, J. Arizaleta, S. Arjomandi, J. Arkley, T. Armfelt, A. Armstrong, D. Armstrong, J. Armstrong, J. Arnault, B. Arneson, B. Arnold, C. Arnold, J. Arnold, V. Aron, F. Arrau, F. Arrieta, M. Arsenault, K. Arstall, A. Arthur Brown, B. Artz, S. Arunachalam, B. Asake, J. Ashe, Z. Ashmore, A. Aslam, M. Aslam, R. Aslin, R. Asmundson, R. Aspden, S. Aspden, H. Aspeslet, M. Asselstine, D. Assinger, J. Asso, V. Assohou-Ouattara, J. Assoignon, A. Assoum, S. Assoumane, A. Astalos, R. Astalos, I. Astete, M. Atchudda Reddy, N. Athavan, A. Atienza, R. Atkins, J. Atkinson, K. Atkinson, L. Attreo, E. Au, G. Au, J. Auch, J. Aucoin, P. Aucoin, W. Aucoin, A. Auger, D. Auger, L. Auger, P. Auger, S. Auger, C. Aular, C. Austin, R. Austin, F. Avery, S. Avery, M. Avila, C. Aviles, O. Awodein, A. Ayasse, W. Ayles, A. Ayoub, J. Ayub, F. Azam, Z. Azim, A. Babiarz, O. Babiker, K. Babu, C. Bachelet, C. Bachman, W. Bachmeier, C. Backer, A. Badamchi Zadeh, W. Bader, N. Badgley, O. Baffoh, G. Baggs, N. Bagheri, K. Bagley, A. Bagnall, M. Bahiraei, B. Bahlieda, D. Baichev, D. Baier, J. Baier, R. Bailer, A. Bailey, B. Bailey, J. Bailey, K. Bailey, S. Bailey, T. Bailey, S. Baillargeon, M. Baillie, B. Bain, E. Bain, C. Baird, E. Baird, D. Baisley, D. Bak, L. Bakaas, A. Baker, C. Baker, D. Baker, J. Baker, R. Baker, A. Bakhtiary Fard, F. Bakita, D. Bakkar, J. Bakker, J. Balacang, M. Balan, B. Balaski, B. Baldonado, J. Baldonado, C. Baldwin, G. Baldwin, M. Baldwin, R. Baldwin, M. Baleja, R. Balfour, I. Balicanta, J. Balkam, C. Balko, G. Ball, J. Ball, L. Ball, M. Ball, P. Ball, K. Ballantyne, J. Ballard, S. Ballas, B. Balog, D. Balogoum, A. Balsom, D. Balson, J. Baltesson, B. Baluyot, R. Bama, L. Bamba, B. Bamber, R. Bamotra, R. Banack, J. Banak, M. Banas, D. Banash, J. Banawa, N. Banerjee, R. Banfield, S. Banfield, O. Bango, J. Banks, L. Banks, C. Ban-Nelson, R. Bannerholt, B. Bannis, M. Banwait, R. Barabe, L. Barbaro, D. Barber, G. Barber, J. Barbour, L. Bardoel, G. Barfield, M. Bari, M. Barilea, R. Barker, S. Barker, S. Barlund, D. Barnes, M. Barnes, N. Barnes, R. Barnes, V. Barnes, B. Barnett, D. Barr, S. Barr, E. Barreto, C. Barrett, M. Barrett, R. Barrett, T. Barrett, S. Barriault, C. Barrie, D. Barron, R. Barron, D. Barry, A. Barstad, G. Bartel, P. Barter, B. Bartlett, C. Bartlett, M. Bartlett, D. Bartman, M. Bartman, N. Bartsch, A. Barysheva, J. Basabe, K. Basarab, N. Basi, R. Basile, L. Basines, P. Bass, S. Basso, C. Bast, A. Bastardo, H. Bastidas Martinez, C. Bastien, S. Basu, M. Batac, S. Batarseh, C. Bateman, M. Bateman, P. Bateman, T. Bateman, G. Bates-Vasileiou, D. Bath, L. Bath, S. Batina, M. Batovanja, D. Batt, U. Batta, R. Batten, C. Battrum, B. Battyanie, D. Bauer, R. Bauer, T. Bauld, C. Baumgardner, J. Baxter, J. Bayles, D. Bayley, F. Bayuk, A. Bazowski, B. Beach, A. Beacon, W. Beals, C. Beaman, G. Beamish, J. Beamish, D. Bean, G. Bean, R. Bear, C. Beaton, G. Beaton, N. Beaton, A. Beattie, C. Beattie, S. Beattie, J. Beauchamp, S. Beauchamp, C. Beaudoin, J. Beaudoin, R. Beaudoin, C. Beaudrie, B. Beaulac, J. Beaulieu, M. Beaulieu, L. Beaunoyer, M. Beaunoyer, J. Becaria, D. Bechtel, N. Beck, C. Becker, H. Becker, R. Becker-Faubert, R. Beckner, S. Beckow, J. Beda, L. Bedard, M. Bedard, D. Bedell, G. Bedi, M. Bednarchuk, S. Beebe, T. Beebe, M. Beeks, C. Beeler, K. Begg, W. Behnke, J. Behrens, A. Belah, R. Belanger, H. Belas, L. Belcourt, R. Belcourt, J. Belik, R. Belisle, A. Bell, D. Bell, J. Bell, K. Bell, L. Bell, N. Bell, R. Bell, S. Bell, J. Bellavance, J. Beller, M. Beller, E. Bellerose, A. Bellettini, J. Belliveau, A. Bellows, C. Bellows, M. Belzile, M. Bembridge, A. Bendahmane, K. Bendahmane, C. Bender, R. Benedictson, M. Benko, D. Benn, T. Benn, K. Benner, C. Bennett, D. Bennett, J. Bennett, R. Bennett, S. Bennett, A. Benoit, P. Benoit, D. Bensley, M. Benson, A. Benson- Bartko, A. Bentley, R. Bentley, I. Bentsianov, J. Berdan, D. Berg, R. Berg, L. Berge, O. Bergeron, J. Bergeson, M. Bergeson, B. Bergley, J. Bergsma, D. Berlinguette, J. Bernardin, T. Bernhard, J. Bernier, K. Berreth, R. Berry, W. Berscht, D. Bershadsky, S. Bertelmann, G. Bertolin, A. Bertrand, B. Bertrand, J. Bertrand, M. Bertsch, M. Bertucci, B. Berube, R. Besinger, C. Best, J. Best, C. Betancur Pelaez, T. Betteridge, S. Bettinson, W. Bewski, B. Beyer, J. Beytell, S. Bezpalchuk, J. Bezruchak, M. Bezugley, A. Bhadauria, A. Bhaduri, L. Bhamare, J. Bhangoo, H. Bhathal, H. Bhatia, J. Bhatt, K. Bhatt, R. Bhatt, V. Bhekare, J. Bianchini, L. Bianco, M. Bibars, K. Bibby, A. Bibo, J. Bick, S. Biddle, T. Biddlecombe, C. Bieber, D. Bieber, D. Bielech, E. Bieleski, D. Biendarra, D. Biener, V. Biesinger, K. Biever, C. Biggin, M. Biggs, A. Bilal, D. Biles, B. Bill, L. Billard, T. Billard, J. Bilous, D. Bilston, M. Binder, B. Binns, R. Bintz, C. Bird, T. Bisbing, B. Bischoff, C. Bischoff, R. Bischoff, S. Bischoff, C. Bish, H. Bishop, J. Bishop, K. Bishop, T. Bishop, C. Bisschop, L. Bissell, C. Bisson, D. Bittner, J. Bizuk, A. Black, B. Black, C. Black, J. Black, K. Black, R. Black, V. Black, P. Blackburn, W. Blackburn, T. Blackett, K. Blackmore, R. Blackmore, T. Blackwell, A. Blacquiere, D. Blain, G. Blain, A. Blair, D. Blair, K. Blair, L. Blair, J. Blais, A. Blake, D. Blake, J. Blake, L. Blake, T. Blake, P. Blakely, B. Blakney, J. Blanc, A. Blanchard, D. Blanchard, G. Blanchard, T. Blanchard, R. Blanchett, K. Blanchette, A. Blanco, G. Blanco, U. Blanco, W. Blanco, L. Bland, S. Blaquiere, E. Blawat, S. Blaydes, K. Blencowe, J. Blesa, A. Blesa Gomez, N. Bligh, M. Blinkhorn, S. Blize, R. Blonar, R. Blondin, G. Blouin, P. Bluemke, J. Blume, J. Blundon, C. Blyan, C. Boadas Salazar, J. Bobbett, A. Bobrowski, H. Bocalan, R. Bock, G. Boddy, J. Bodell, R. Bodell, S. Bodell, A. Bodnar, K. Bodnar, J. Bodnarchuk, V. Bodnarchuk, B. Bodner, G. Bodner, D. Bodoano, D. Boeckx, M. Boehm, D. Boehmer, D. Boettcher, D. Boettger, M. Boggust, L. Boghici, T. Bohach, A. Bohemier, B. Bohlken, J. Bohlken, E. Bohme, N. Bohning, J. Bohorquez, J. Boire, J. Boissoneault, C. Boisvert, J. Boisvert, M. Boisvert, D. Bokota, R. Boksteyn, S. Bolduc, G. Bolin, D. Bolster, B. Bolt, J. Bolt, G. Bolzon, G. Bond, K. Bond, N. Bond, S. Bond, T. Bond, E. Bondarenko, T. Bondaruk, N. Bonderoff, A. Bone, C. Bonebrake, A. Bonilla, E. Bonnefon, C. Bonogofski, A. Bonwick, T. Bonwick, S. Booker, J. Boomgaarden, A. Boone, B. Boone, C. Boos, K. Booth, M. Booth, B. Borbely, K. Bordeleau, R. Bordeleau, J. Borg, C. Borgel, C. Borgland, P. Bork, J. Borkowski, S. Borkowsky, M. Borlaza, M. Born, N. Born, D. Borowski Grimaldi, K. Borromeo, E. Borsa, E. Borsini Marin, M. Borst, J. Borstel, K. Borysiuk, D. Bosch, J. Bosch, S. Bosch, J. Boschman, S. Bose, G. Bosma, L. Bosoi, P. Bossel, A. Botha, H. Botha, K. Bothwell, J. Botterill, D. Bouchard, L. Bouchard, T. Bouchard, J. Bouchard Lacoste, C. Boucher, T. Boucher, J. Boudreault, K. Bougie, B. Boulton, J. Boulton, T. Bouma, J. Bounds, C. Bourassa, L. Bourassa, R. Bourassa, S. Bourassa, T. Bourassa, J. Bourdon, J. Bourgeois, C. Bourlon, D. Bourque, S. Bourrie, C. Boutier, M. Boutilier, D. Bouvier, K. Boven, C. Bowal, M. Bowal, C. Bowditch, S. Bowers, D. Bowes, B. Bowie, J. Bowie, M. Bowles, J. Bowman, K. Bowman, N. Bowman, E. Bown, W. Bowness, J. Boxer, D. Boyarski, R. Boyce, T. Boyce, S. Boychuk, J. Boyd, R. Boyd, J. Boyde, A. Boyer, C. Boyer, V. Boyko, D. Boyle, L. Boyle, N. Boyle, D. Bradbury, A. Bradley, B. Bradley, P. Bradley, P. Bradner, G. Brady, J. Brady, M. Brady, J. Bragg, S. Braithwaite, N. Brake, S. Brake, J. Branderhorst, J. Brannick, B. Brant, D. Brant, P. Brar, C. Brassard, M. Brataschuk, K. Bratt, K. Brattebo, R. Brattston, C. Brausen, M. Brautigam, K. Bravo, L. Bravo, T. Bray, A. Brazeau, J. Breau, M. Brecht, S. Bredy, D. Breen, M. Breen, S. Breen, B. Brekke, E. Brekke, D. Bremner, C. Brennan, L. Brennan, M. Brennan, J. Brenton, L. Brenton, R. Brenton, T. Bresson, K. Brethour, T. Bretzer, R. Bretzlaff, A. Brewer, J. Breytenbach, R. Brezinski, W. Briand, S. Briard, B. Bricker, M. Brideau, C. Bridger, J. Bridger, M. Brietzke, C. Briggs, M. Briggs, J. Bright, L. Brinkworth, S. Brinson, S. Brinston, J. Briscoe, C. Brisebois, L. Brisebois, B. Britton, P. Britton, S. Britton, J. Brock, M. Brock, K. Brocke, A. Broderick, S. Broderson, S. Brodeur, T. Brodie, D. Brodziak, E. Broidioi, K. Bromley, J. Bronkhorst, G. Bronson, D. Brooks, J. Brooks, R. Brooks, S. Broomfield, G. Brophy-Maclean, K. Brosowsky, K. Brost, C. Brousseau, C. Brow, N. Brow, A. Brown, B. Brown, C. Brown, D. Brown, E. Brown, G. Brown, J. Brown, K. Brown, L. Brown, M. Brown, N. Brown, P. Brown, R. Brown, S. Brown, T. Brown, W. Brown, D. Brownrigg, J. Bruce, R. Bruce, T. Bruce, L. Bruchanski, A. Brucker, R. Brue, K. Bruggencate, F. Brugger, V. Brule, S. Brulotte, N. Brummitt, D. Brundige, R. Brundige, K. Bruner, M. Brunet, M. Brushett, R. Bryan, B. Bryant, P. Bryant, R. Bryant, T. Bryant, T. Brydges, E. Bryenton, H. Bryenton, B. Bryks, J. Bryla, M. Bryson, S. Bryson, G. Buchan, P. Buchanan, C. Buchholz, M. Buchinski, J. Buck, D. Buckley, M. Buckley, G. Buckshaw, T. Budd, N. Budden, R. Bueckert, S. Bugden, W. Bugiak, N. Buhler, S. Bukhari, C. Bull, R. Bullen, T. Bullen, I. Bulloch, J. Bullock, G. Bungay, L. Bungay, Q. Bunten-Walberg, D. Burak, T. Burchenski, L. Burden, J. Burdett, D. Burgess, B. Burk, G. Burkart, T. Burkart, D. Burke, L. Burke, S. Burke, G. Burkhart, P. Burness, J. Burnett, J. Burnouf, J. Burns, R. Burris, C. Burroughs, B. Burry, D. Burry, S. Burry, D. Bursey, A. Burt, S. Burt, G. Burton, J. Burton, K. Burton, M. Burton, N. Burton, R. Burton, T. Burton, W. Burton, R. Busato, K. Bush, D. Bushey, J. Bushfield, T. Bushie, N. Bussiere, M. Butchart, C. Butler, D. Butler, H. Butler, I. Butler, M. Butler, R. Butler, T. Butler, D. Butlin, B. Butt, K. Butt, M. Butt, Q. Butt, S. Butt, T. Butt, W. Butt, M. Buttigieg, K. Butts, R. Butts, P. Buxton, B. Bye, J. Byrne, M. Byrne, J. Byrtus, I. Byvald, L. Cabatuando, A. Cabral, J. Cachene-Clark, T. Cadieux, R. Cahoon, B. Cain, A. Caines, H. Cairns, E. Caissie, W. Calabio, B. Calder, L. Calder, J. Caldwell, P.
Caldwell, C. Caleffi, D. Callander, C. Callihoo, P. Callin, R. Calliou, M. Camargo, S. Cameron, A. Campbell, B. Campbell, C. Campbell, D. Campbell, E. Campbell, G. Campbell, K. Campbell, N. Campbell, P. Campbell, S. Campbell, W. Campbell, A. Campeau, N. Campeau, W. Campeau, A. Campos, M. Canchica, G. Cane, C. Canning, M. Canning, J. Cannon, E. Cantlon, J. Cantwell, M. Cao, A. Caouette, D. Caouette, G. Caouette, K. Cap, A. Capadosa, M. Capitaneanu, L. Cappelle, M. Capstick, B. Carabin, G. Carde, A. Cardenas, L. Cardenas Schulz, F. Cardinal, L. Cardinal, R. Cardinal, W. Cardinal, M. Carew, J. Carey, W. Carey, D. Carleton, J. Carleton, T. Carleton, K. Carlos, F. Carlos Sanchez, J. Carlson, W. Carlson, D. Carnes, D. Caron, R. Caron, S. Caron, G. Carpo, C. Carr, D. Carr, J. Carr, L. Carranza, V. Carrasco Rueda, M. Carrier, T. Carrier, D. Carroll, I. Carroll, J. Carroll, M. Carroll, R. Carroll, S. Carroll, C. Carruthers, C. Carsh, B. Carson, E. Cartaya, D. Carter, E. Carter, J. Carter, K. Carter, N. Carter, R. Carter, S. Carter Hicks, C. Cartier, X. Cartron, J. Cartwright, G. Case, P. Cashin, B. Cassell, T. Cassidy, D. Cassie, J. Cassivi, L. Casson, F. Castellanos, A. Castillo, K. Castle, C. Castro, J. Castro, J. Caswell, A. Cater, N. Catley, L. Catto, J. Cauchie, L. Caul, D. Cavacciuti, A. Cavanagh, N. Cavanagh, D. Cavers, J. Cayabo, C. Cayer, D. Cazabon, C. Celis, M. Cenon, A. Centeno, S. Cervantes, B. Chaba, D. Chadwick, A. Chafe, A. Chaisson, S. Chakraborty, S. Chakravarty, M. Chalaturnyk, A. Chalifoux, C. Chalifoux, M. Chalmers, A. Chamanara, C. Chambers, T. Chambers, K. Champagne, L. Champagne, A. Chan, C. Chan, D. Chan, I. Chan, J. Chan, L. Chan, M. Chan, R. Chan, S. Chan, T. Chan, A. Chaney, J. Chanski, T. Chantler, H. Chaouach, K. Chapman, M. Chapman, S. Chapman, B. Chapple, R. Chaput, W. Charanek, N. Charest, S. Charette, D. Charlish, J. Charlton, Y. Charniauski, L. Charrois, R. Chartrand, P. Chase, A. Chatman, A. Chatterjee, M. Chaudhry, D. Chauvet, S. Chavda, D. Chavez, M. Chawla, T. Chayko, C. Chaytor, P. Chaytor, M. Chechile, W. Cheladyn, B. Chen, C. Chen, D. Chen, H. Chen, K. Chen, T. Chen, X.
Our World-Class TeamOur proven strategy and disciplined business approach are supported by our dedicated teams and experienced management team. Canadian Naturals exponential growth reflects dedication, planning and resilience from its main resource: our employees.

T2Canadian Natural 2020 Annual Report
Chen, Z. Chen, C. Cheng, J. Cheng, N. Cheng, D. Chenier, N. Cheraghi, Z. Cherniawsky, M. Chernichen, T. Cherry, O. Chervyakova, B. Chester, J. Chester, A. Chesterman, D. Chetcuti, A. Cheung, I. Cheung, J. Cheung, K. Cheung, W. Cheung, L. Cheveldeaw, B. Cheyne, B. Chhualsingh, F. Chiasson, B. Chichak, K. Chichak, D. Chick, T. Chick, D. Chidley, D. Childs, S. Childs, A. Chin, S. Chin, Y. Chin, C. Ching, T. Chipiuk, M. Chiplin, A. Chisholm, B. Chisholm, T. Chisholm, T. Chislett, P. Chiu, J. Chohan, D. Choi, J. Cholka, N. Chondropoulos, R. Chong, B. Chopping, B. Chorney, M. Chorney, C. Chornohos, C. Chorostecki, S. Choudhury, M. Chourio, A. Chow, K. Chow, R. Chowdhury, S. Chowdhury, G. Choy, A. Chretien, B. Christensen, L. Christensen, R. Christensen, T. Christensen, J. Christian, N. Christian, K. Christiansen, S. Christiansen, D. Christianson, M. Christianson, D. Christie, R. Christie, S. Christie, T. Christie, J. Chrobot, A. Chu, C. Chua, R. Chubaty, G. Chubbs, D. Chudobiak, V. Chui, H. Chung, H. Church, C. Churchill, D. Churchill, G. Churchill, J. Churchill, N. Churchill, J. Churko, D. Chute, K. Chychul, O. Chyon, V. Cimon, K. Cisse-Banny, D. Clapperton, W. Clapperton, T. Clare, A. Clark, C. Clark, J. Clark, K. Clark, R. Clark, T. Clark, B. Clarke, J. Clarke, K. Clarke, L. Clarke, M. Clarke, R. Clarke, S. Clarke, T. Clarke, W. Clarke, C. Clarkson, D. Clarkson, W. Clarkson, S. Clavette, J. Clelland, T. Clelland, R. Clemit, R. Clemmer, J. Clevenger, C. Closs, Z. Closter, A. Clouston, J. Clouter, R. Cloutier, J. Clowater, M. Cnossen, J. Coates, R. Coates, T. Coates, E. Cobaj, C. Cobaleda, D. Coburn, M. Cochet, B. Cochrane, E. Cochrane, J. Cochrane, D. Cockerill, F. Codd, E. Code, A. Codner, C. Codner, K. Codner, H. Cody, R. Coen, J. Coers, M. Coffin, L. Colborne, M. Colbourne, A. Cole, B. Cole, C. Cole, M. Cole, P. Cole, J. Coleman, M. Coles, P. Colley, D. Collicutt, M. Collie, B. Collins, J. Collins, M. Collins, O. Collins, R. Collins, S. Collins, C. Collinson, C. Colliou, A. Collison, G. Collison, A. Collyer, R. Colnar, E. Comeau, R. Comer, K. Compagnon, W. Compagnon, C. Compton, Q. Conacher, E. Connell, M. Connell, M. Connellan, K. Conner, G. Connors, P. Connors, D. Conrad, B. Conroy, J. Conroy, S. Constant, D. Conway, M. Conway, D. Conybeare, C. Cook, D. Cook, G. Cook, J. Cook, K. Cook, L. Cook, N. Cook, P. Cook, S. Cook, G. Cooke, H. Cooke, J. Cooke, L. Cooke, A. Cookson, D. Cookson, K. Cookson, L. Cookson, H. Coolidge, J. Coombs, K. Coombs, L. Coonan, L. Cooper, M. Cooper, J. Cooze, R. Copan, C. Copeland, N. Copeland, R. Copland, R. Coppard, M. Coppola, D. Corbett, N. Corbett, N. Corbiere, F. Corbin, E. Corcoran, J. Corcoran, F. Cordingley, M. Corell, E. Coreman, I. Cormier, S. Cormier, V. Cornejo, D. Cornish, R. Cornish, S. Correll, C. Corrigan, D. Corrigan, R. Corrigan, D. Corriveau, C. Corry, B. Cortez, P. Corticelli, C. Corzo De Canchica, D. Cosby, G. Cossani, H. Costello, J. Costello, S. Costello, J. Costigan, B. Cote, C. Cote, E. Cote, J. Cote, A. Cote Simard, E. Cotten, L. Cottreau, L. Coulibaly, S. Coulibaly, D. Coull, J. Courchene, R. Courchesne, J. Courtemanche, B. Courtney, G. Courtney, T. Courtney, D. Courts, P. Cousin, J. Cousins, M. Cousins, T. Coutney, P. Covell, E. Cowan, B. Cox, G. Cox, J. Cox, R. Cox, E. Cozicor, W. Crabtree, R. Craft, C. Craig, D. Craig, R. Craig, H. Craigie, K. Cramb, P. Cramb, S. Cramb, S. Cramm, M. Crane, S. Crane, A. Crawford, H. Crawley, J. Crawley, G. Crayford, N. Cressey, L. Cressman, R. Crichton, P. Crisby, C. Critch, J. Critch, R. Critchard, D. Crittall, A. Critten, W. Crockford, A. Croft, S. Croft, G. Crooks, A. Crosby, D. Crosley, T. Crosley, C. Cross, R. Cross, T. Cross, D. Crossley, S. Croteau, K. Crouser, T. Crouser, C. Crowe, S. Crowe, D. Crowle, E. Crowley, P. Crozier, D. Crum, L. Cruttenden, J. Cruz, A. Csabay, B. Csatari, S. Cseke, P. Cudak, E. Cuello, H. Cui, J. Cullen, M. Culligan, E. Cullimore, A. Cunanan, A. Cunningham, D. Cunningham, S. Cunningham, E. Cupac-Cingel, J. Curran, S. Curran, S. Currie, R. Currier, B. Curry, K. Cusack, M. Cusson, D. Cutler, J. Cutler, S. Cutler, J. Cuu, C. Cyr, D. Cyr, G. Cyr, S. Cyr, J. Cyrenne, D. Cyron, K. Cytko, P. Czajko, J. Czarnecki, M. Czerwinski, R. Czerwony, K. d’Abadie, V. Daboin, A. Dabrowski, M. Dacillo-Basallajes, F. Dadashov, R. Dadey, M. Dadi, G. Dafoe, J. Dafoe, W. Dagley, C. Dahl, J. Dai, J. Daigle, B. Daignault, P. Dale, D. Dalgarno, L. Dalgetty-Rouse, H. Dalipe, J. Dallaire, B. Dalley, G. Dalley, M. Dalton, G. Daly, G. Dalziel, R. Damer, D. D’Amour, E. Dana, C. Danaher, A. Danbrook, T. Danbrook, W. Danchak, S. Daneshmand, J. Daniels, T. Daniels, D. Danilkewich, G. Dann, I. Dantiwala, C. Danyluk, P. Danyluk, D. Daraban, S. Darai, M. D’arcangelo, A. Dareichuk, V. Darel, E. Dargatz, C. Daria, M. Darling, S. Darrah, D. Das, F. Daub, D. Dave, M. Dave, C. Davey, G. David, L. David, P. David, G. Davidson, J. Davidson, M. Davidson, S. Davidson, T. Davidson, C. Davies, D. Davies, J. Davies, L. Davies, M. Davies, N. Davies, S. Davies, C. Davis, H. Davis, J. Davis, K. Davis, R. Davis, S. Davis, T. Davis, E. Davison, P. Davison, D. Dawe, L. Dawe, J. Dawson, R. Dawyduk, S. Day, T. Day, J. Daye, V. Daze, M. de Chavez, H. de Graaf, R. De Jesus, R. de Jong, R. De Leeuw, B. De Lorenzo, D. De Oliveira, R. de Ruiter, V. de Ruiter, C. de Wit, B. de Witt, B. Deacon, K. Deacon-Rosamond, I. Deaconu, P. Deagle, A. Dean, M. Dean, R. Dean, A. Dearaway, G. Dearden, C. Deaver, T. Debler, R. Debnath, S. Debnath, D. Deboer, R. deBoer, W. DeBona, S. DeBruycker, P. DeBusschere, D. Dechaine, J. Dechaine, M. Dechaine, R. Dechaine, P. Dechant, R. Dechesne, B. Decker, D. Decker, J. Decker, R. Decker, J. Decoeur, D. Decoine, W. Dedam, E. Dee, L. Deep, M. Deering, L. Defoort, S. DeFord, B. DeHaan, A. Deibert, R. DeJong Dyck, B. DeLair, I. Delaney, P. Delany, E. DeLaRonde, J. Delaurier, A. Delavarmoghaddam, C. Delawski, M. Dell, M. DelMastro, M. DeLorme, R. Demarsh, B. Demirdal, C. DeMone, R. DeMott, G. Dempsey, S. Dempsey, M. Denault, D. Deneau, G. Denney, S. Dennis, D. Dennison, S. Denny, C. Denslow, J. Dent, L. Depencier, H. Derakhshan, D. Derbyshire, J. deRidder, J. Derix, K. Derkowski, B. Derochie, M. Derry, A. Desai, C. Desai, D. Desai, G. Desai, R. Desai, S. Desai, M. Deschambeau, T. Deschamps, D. Deschenes, A. Desharnais, V. Deshpande, D. Desjardins, C. Desjardins-Knowlden, G. Desjardins-Knowlden, C. Desmarais, S. Desmarais, J. Desnoyers, L. Despins, D. Dessario, M. Detta, P. Deutcheu, K. Deutsch, A. Deutscher, S. Deval, B. Devereux, L. Devey, N. Devlin, J. DeVries, T. Dew, C. Dewar, J. Dewar, K. Deyaegher, M. Deyan, G. Dhaliwal, H. Dhaliwal, J. Dhaliwal, M. Dhaliwal, P. Dhalwala, B. Dhanesha, K. Dhanoa, J. Dharamsi, M. Dhariwal, K. Diallo, B. Diamond, L. Diane, D. Diaz, L. Diaz, M. Diaz, A. Dick, R. Dicken, K. Dickey, A. Dicks, E. Dicks, B. Dickson, C. Dickson, G. Dickson, A. Didenko, J. Diederich, S. Dietrich, P. Diggle, S. Diggle, M. Diiorio, I. Dikau, A. Dillabough, E. Dillabough, R. Dillman, K. Dilts, A. Dimapilis, L. Dimion, X. Ding, Y. Ding, M. Dingley, G. Dingwell, H. Dinn, R. Dinn, K. Dinney, M. Diomande, S. Dionne, R. Diputado, M. Dirk, S. Dirk, E. Ditzler, A. Dixit, C. Dixon, D. Dixon, R. Dixon, T. Dixon, K. Do, W. Dobchuk, C. Dobek, G. Dobek, L. Dobson, S. Dobson, R. Docksteader, L. Dodd, R. Dodunski, R. Doering, J. Doetzel, A. Doherty-Snelgrove, J. Doiron, K. Doiron, G. Dolan, P. Dolan, S. Dolhanty, D. Dolynchuk, D. Doma, G. Doma, G. Domalain, R. Domazet, B. Dombrova, M. Dombrova, D. Domin, K. Donahue, K. Donald, E. Donaldson, S. Donaldson, R. Donaleshen, M. Dong, J. Donohoe, J. Donovan, N. Donovan, J. Doonanco, S. Dorer, A. Dorey, J. Dorusak, A. Dosanjh, J. Dosman, I. Dosso, M. Doty, M. Doucet, D. Doucette, A. Douglas, J. Douglas, J. Doust, T. Dove, R. Dow, A. Dowd, J. Dowd, J. Dowhay, P. Downes, A. Downey, D. Downey, J. Downey, P. Downey, A. Downs, R. Doyer, G. Doyle, S. Doyon, R. Drainville, S. Drake, P. Drapeau, G. Draper, K. Draper, T. Draper, W. Draper, J. Dreaddy, S. Drebit, K. Dreger, C. Drescher, J. Drescher, D. Dressler, C. Drevant, B. Drew, D. Drew, B. Driscoll, S. Driscoll, T. Driscoll, E. Drolet, R. Drolet, R. Drosu, A. Drover, B. Drover, J. Drover, R. Drover, R. Drummond, C. Drury, D. Drury, S. Dryden, S. Drysdall, H. D’Souza, P. D’Souza, V. D’Souza, C. Du, M. Du, M. Du Preez, P. Duan, C. Duane, C. Duarte, B. Dube, M. Dube, N. Dube, R. Dube, T. Dube, A. Dubetz, T. Dubie, G. Dubois, J. Dubois, L. DuBois, J. Dubuc, D. Duby, C. Dubyk, M. Ducey, R. Ducey, R. Ducharme, P. Duchesnay, J. Duchscherer, J. Duczek, P. Duda, L. Dueck, G. Duff, C. Duffett, D. Duffy, K. Duford, E. Dufour, P. Dugay, C. Duggan, D. Duguid, A. Duhaime, A. Dumanowski, J. Dumas, T. Dumba, O. Dumitrache, Y. Dumont, C. Dunbar, B. Duncan, H. Duncan, J. Duncan, R. Duncan, S. Duncan, D. Dunn, J. Dunn, N. Dunn, P. Dunn, R. Dunn, S. Dunn, J. Dunnigan, C. Dunsmore, J. Dunsmuir, D. DuPerrier, D. Dupuis, J. Durdle, A. Durham, J. Duris, K. Durocher, B. Dusterhoft, J. Dutchak, J. Duthie, R. Duthie, O. Dutka, N. Duval, R. Duval, M. Dux, C. Duynisveld, B. Dwyer, C. Dwyer, R. Dwyer, D. Dybala, J. Dybala, A. Dyck, C. Dyck, J. Dyer, L. Dyke, B. Dzirasah, K. Dzwonek, B. Eagle, J. Eagleson, M. Eamer, R. Earl, J. Easthope, B. Eastman, J. Eastman, J. Easton, K. Eberle, R. Ebuna, G. Ecker, D. Edgington, A. Edmunds, A. Edoukou, A. Edugyan, D. Edwards, J. Edwards, P. Edwards, T. Edwards, T. Eeuwes, S. Effiong, A. Effray, L. Egeland, R. Eggen, C. Eggleton, A. Egresits, C. Ehalt, C. Ehnes, C. Ehresman, M. Eidet, B. Eitzen, M. Ejo, D. Ekdahl, S. Ekstrom, R. Elaschuk, I. Elgarni, M. Elgarni, M. El-Harakeh, D. Elia, T. Elias, M. Elias Neira, C. Elkink, K. Elladen, P. Ellingson, B. Elliott, D. Elliott, H. Elliott, J. Elliott, R. Elliott, S. Elliott, T. Elliott, D. Ellis, K. Ellis, R. Ellis, S. Ellis, P. Ellison, C. Ellsworth, K. Ellsworth, A. Elmobarik, M. Elms, O. El-Sayed, E. Elson, J. Elson, T. Ely, C. Emberley, V. Embleton, H. Emery, G. Emmott, J. Engel, K. Engelking, R. Engler, T. Engler, J. English, M. Enns, J. Entz, J. Epp, T. Epp, J. Erasmus, S. Erb, D. Ereaut, B. Eresman, D. Eresman, C. Erfle, B. Erickson, J. Erickson, S. Erickson, M. Ernst, P. Ersh, C. Erskine, D. Ertmoed, W. Esau, P. Escalona, O. Esharefasa, N. Eskandar, G. Eskandari, M. Espejo, L. Espie-Winsor, A. Espindola, M. Espiritu, R. Esslemont, B. Estey, O. Estrada, J. Etcheverry, D. Etherington, S. Etherington, A. Evans, D. Evans, J. Evans, R. Evans, T. Evans, R. Evasco, K. Evdokimoff, J. Eveleigh, L. Eveleigh, S. Eveleigh, A. Everson, C. Eves, J. Ewald, J. Ewen, J. Eyma, B. Eyolfson, V. Ezeronye, B. Facco, D. Fader, R. Faechner, B. Fagan, M. Fahad, E. Faichney, S. Fairfield, M. Faiz, S. Fallahi, M. Fallen, Y. Fang, D. Fanning, T. Fanoiki, H. Farah, S. Farea, S. Farhan, A. Faria, H. Farid, S. Farn, D. Farney, M. Farokhshad, A. Farquhar, D. Farrell, G. Farrell, J. Farrell, T. Farrell, R. Farrer, T. Farrer, D. Farrow, S. Farrow, S. Faruqi, W. Faryna, B. Fast, R. Fast, S. Fast, A. Faucher, C. Faucher, S. Faucher, J. Faulkner, R. Faustini, E. Fauth, C. Fayant, R. Fayant, M. Fear, R. Featherstone, S. Feaver, T. Feaver, N. Fecteau, M. Federucci, D. Fedoruk, E. Fedossova, C. Fedun, M. Fedyk, T. Fedyna, E. Feely, J. Feener, D. Fehr, D. Feland, J. Feland, E. Feldkamp, J. Feldmeier, D. Feller, R. Fells, R. Feltham, E. Fender, M. Feng, L. Fentie, A. Ferdjallah, K. Ferdous, S. Ferenc, K. Ference, B. Ferguson, C. Ferguson, H. Ferguson, M. Ferguson, R. Ferguson, S. Ferguson, M. Ferhatbegovic, B. Fernandes, A. Fernandez, E. Fernandez, J. Fernandez, L. Fernandez Exposito, N. Ferrer, M. Ferry, R. Fersch, S. Fetinko, C. Fetter, L. Fetter, D. Fewer, J. Fewer, V. Fiacco, C. Fibke, D. Fichter, T. Fichter, M. Ficke, C. Ficko, B. Field, C. Field, M. Fielden, J. Fielding, K. Fielding, W. Fielding, B. Fifield, C. Filewych, C. Filgate, M. Filipponi, D. Fillier, T. Fillmore, B. Finch, N. Findlay, T. Findlay, A. Fink, B. Finlayson, J. Finley, D. Finnamore, C. Finnebraaten, K. Finnerty, R. Finney, E. Finnigan, K. Finnigan, T. Finnigan, C. Fischer, L. Fischer, W. Fischer, J. Fish, C. Fisher, D. Fisher, B. Fitzgerald, C. Fitzgerald, J. FitzGerald, S. Fitzner, R. Fitzpatrick, S. Fitzpatrick, K. Flack, M. Flahr, C. Flamont, J. Flamont, D. Flannery, B. Fleck, M. Flegel, A. Fleming, D. Fleming, J. Fleming, P. Fleming, S. Fleming, T. Fleming, N. Flemming, A. Fletcher, J. Fletcher, L. Fletcher, P. Flett, R. Flett, M. Flette, J. Fleury, B. Flier, T. Flight, B. Flockhart, I. Florea, B. Flottvik, J. Fluney, B. Flynn, C. Flynn, J. Flynn, R. Flynn, S. Flynn, C. Fogal, D. Fokema, S. Foline, E. Follis, R. Folmer, P. Foming, G. Fondjo, Y. Fong, A. Fontaine, D. Fontaine, G. Fontaine, R. Fontaine, B. Foord, R. Foran, D. Forbes, M. Forbes, D. Forbister, A. Forcade, G. Ford, T. Ford, W. Ford, J. Foreman, B. Forest, C. Forget, L. Forget, D. Forman, C. Formanek, R. Formanek, T. Fornwald, G. Forrest, B. Forrester, R. Forrester, B. Forrister, J. Forsberg, B. Forshner, K. Forshner, M. Forster, S. Forster, H. Forte, A. Fortier, C. Fortier, D. Fortin, J. Forward, B. Foss, S. Foss, D. Fosseneuve, B. Foster, C. Foster, D. Foster, J. Foster, K. Foster, R. Foster, S. Foster, D. Fotty, C. Fotur, O. Fouego, A. Fougere, K. Foulds, R. Foulkes, G. Fountain, J. Fountain, B. Fouracres, H. Fowell, J. Fowler, D. Fox, J. Fox, M. Foxton, S. Foxton, K. Fraboni, S. Fraino, C. Frampton, C. France, R. France, M.
9,993STRONG
DIVERSITY. TALENT. EXPERTISE. To develop people to work together
to create value for the Company’s shareholders by doing it right with fun and integrity.

Canadian Natural 2020 Annual ReportT3
Francescone, D. Franche, O. Franchi, D. Francis, N. Franck, M. Franco, C. Frank, D. Frank, A. Frankiw, P. Fransen, K. Franson, W. Franson, S. Franssen, R. Frasch, B. Fraser, C. Fraser, G. Fraser, K. Fraser, M. Fraser, R. Fraser, J. Frayn, K. Frazer, C. Freake, B. Frechette, A. Freeman, G. Freeman, M. Freeman, U. Freiberg, E. Frejoles, J. French, R. French, B. Frenette, K. Frenzel, J. Frese, K. Freyman, K. Friedrich, D. Friedt, W. Friend, D. Friesen, F. Friesen, H. Friesen, J. Friesen, K. Friesen, M. Friesen, N. Friesen, R. Friesen, A. Frizorguer, D. Frizzell, C. Froc, J. Froc, A. Froh, C. Froude, S. Froude, A. Fry, T. Fryer, X. Fu, N. Fucile, B. Fudge, C. Fudge, L. Fudge, R. Fudge, K. Fujimoto, D. Fukushima, W. Fulkerson, J. Fuller, D. Fung, J. Fung, S. Fung-Yau, C. Funk, K. Funk, R. Funk, M. Funke, J. Furey, M. Furey, A. Furgiuele, A. Furlong, L. Furlong, T. Furuya, C. Fuster, A. Fyith, A. Gabr, K. Gabrielson, D. Gabruck, K. Gadzala, R. Gaetz, N. Gafuik, A. Gage, J. Gage, C. Gagne, D. Gagne, D. Gagnon, E. Gagnon, J. Gagnon, K. Gagnon, S. Gagnon, W. Gail, B. Galbraith, P. Gale, M. Galea, J. Galey, R. Gallagher, F. Gallant, M. Gallant, R. Gallant, F. Gallardo, J. Galliott, S. Gallo, M. Gallon, G. Galloway, J. Galotta, W. Gamache, B. Gamble, D. Gamblin, C. Gamboa, L. Gamboa, F. Gan, A. Gandhi, P. Gandhi, V. Gandhi, J. Ganie, D. Ganske, B. Gantz, V. Gapaz, M. Garbin, A. Garcia, C. Garcia, A. Garcia Varganova, D. Gardham, K. Gardiner, S. Gardiner, E. Gardner, S. Gardner, J. Gareau, R. Gareau, T. Gareau, R. Garg, V. Garg, K. Garland, A. Garneau, W. Garner, T. Garthwaite, L. Garvey, E. Gashaw, M. Gates, J. Gatrell, S. Gauchan, C. Gaudet, F. Gaudet, G. Gaudet, W. Gaugler, L. Gauld, M. Gaulin, N. Gautam, C. Gauthier, D. Gauthier, J. Gauthier, M. Gauthier, N. Gauthier, P. Gauthier, S. Gauthier, T. Gauthier, K. Gautschi, S. Gavronsky, T. Gaydos, G. Gayton, N. Gazdag, A. Gboko, B. Geall, J. Geddes, D. Geitz, O. Gelowitz, M. Gemmell, J. Genereux, M. Genereux, C. Geng, G. Genge, B. Gensollen del Barco, P. Gentles, C. George, J. George, M. George, M. Georgescu, R. Georgescu, J. Georget, S. Geremia, J. Gergely, B. Gerke, G. Gerla, J. Gerlinger, K. Gernat, K. Gerow, S. Gerow, E. Gervais, K. Gervais, M. Gervais, K. Gessner, T. Getchell, S. Getson, K. Getzinger, V. Ghadamyari, L. Ghasem Rashid, H. Ghazimoradi, M. Ghorbanie, J. Ghosh, E. Ghoubrial, D. Gibb, I. Gibbon, S. Gibbon, E. Gibbs, D. Gibson, J. Giebelhaus, S. Giefer, A. Gierach, C. Giesbrecht, D. Giesbrecht, E. Giesbrecht, J. Giesbrecht, T. Giesbrecht, J. Gigg, D. Giggs, G. Gilbert, J. Gilbert, C. Giles, M. Giles, S. Giles, T. Giles, V. Giles, J. Gilhang, J. Gill, K. Gill, L. Gill, M. Gill, N. Gill, R. Gill, S. Gill, J. Gillam, D. Gillan, J. Gillatt, S. Gillespie, M. Gillies, A. Gillingham, D. Gillingham, J. Gillingham, L. Gillingham, S. Gillingham, E. Gillis, E. Gillmore, M. Gillund, C. Gilman, K. Gilman, E. Gimenez, R. Gimoro, G. Gin, K. Ginter, M. Ginter, K. Ginther, T. Ginther, L. Giraldo, D. Girard, G. Girard, S. Girard, S. Girbav, D. Girouard, J. Girouard, P. Girouard, B. Gisby, M. Gisondo Crawford, E. Giuliani, D. Gladue, J. Gladue, B. Glaicar, G. Glanville, D. Glasco, A. Glasrud, K. Glavine, M. Glavine, R. Gleasure, J. Glen, J. Glendenning, G. Glenn, D. Gliddon, D. Gloade, D. Glover, S. Glubish, M. Go, R. Go, J. Godin, B. Godkin, D. Godwin, L. Goerzen, C. Goeson, C. Gogol, J. Gogol, B. Gogowich, H. Goldberg, D. Golden, E. Goldhart, P. Goldsney, A. Goll, D. Goll, P. Goll, M. Gomaa, R. Goman, C. Gomez, E. Gomez, J. Gomez, C. Gomuwka, E. Gong, K. Gong, M. Gonzales, I. Gonzalez, N. Gonzalez, Y. Gonzalez, C. Good, P. Good, J. Goodair, A. Goodine, C. Goodman, P. Goodman, W. Goodwin, B. Goodyear, J. Goodyear, R. Gooler, J. Gorai, K. Gordeyko, I. Gordon, J. Gordon, K. Gordon, L. Gordon, S. Gordon, T. Gordon, J. Gorgichuk, D. Gorrie, J. Gorski, R. Goshi, B. Gosse, D. Gosse, R. Gosse, T. Gosse, Y. Gosselin, B. Gosselink, C. Goudreau, C. Gough, A. Gould, B. Gould, J. Gould, T. Goulding, C. Goulet, J. Goulet, P. Goulet, J. Gourlie, G. Gouthro, S. Gouthro, J. Gover, A. Goyal, M. Goyal, L. Goymer, J. Graca, R. Graf Jr., L. Graff, J. Grageda, C. Graham, D. Graham, G. Graham, J. Graham, M. Graham, R. Graham, S. Graham, T. Graham, E. Grandillo, I. Grandy, R. Grandy, B. Granger, J. Granger, A. Grant, C. Grant, J. Grant, L. Grant, M. Grant, R. Grant, S. Grant, T. Grant, B. Gravel, R. Graveline, R. Gravell, T. Graveson, A. Gray, B. Gray, C. Gray, D. Gray, J. Gray, L. Gray, N. Gray, R. Gray, S. Gray, C. Grayston, J. Greaves, G. Grebowski, A. Greeley, C. Green, D. Green, G. Green, J. Green, K. Green, M. Green, T. Green, W. Green, C. Greenawalt, D. Greenawalt, C. Greene, D. Greene, T. Greene, A. Greenfield, K. Greenwood, M. Greenwood, R. Greenwood, A. Grenier, J. Grenon, J. Greter, A. Grewal, S. Grewal, B. Grice, C. Grice, R. Grice, C. Grieder, R. Griemann, S. Grier, D. Grieve, R. Grieve, J. Griffin, M. Griffin, P. Griffin, E. Griffiths, J. Griffiths, K. Griffiths, A. Grise, R. Griswold, R. Groenen, A. Groeneveld, M. Grosseth, A. Grossi, W. Grotkowski, J. Grouchy, B. Grove, P. Grove, L. Groves, D. Grundner, D. Grzela, S. Gu, Y. Guan, V. Guardia-Mendez, C. Guay, D. Guay, C. Gudjonson, C. Gudmundson, S. Gue, P. Guedez, J. Guerin, D. Guevohe, M. Gueye, D. Guglielmin, A. Guillen, J. Guilmette, K. Guimond, C. Guinup, R. Guinup, A. Guitard, A. Gulamhusein, K. Gulamhusein, R. Gulati, S. Guled, R. Gulutzan, J. Gumbley, I. Gunning, R. Gunning, A. Gupta, J. Gurba, E. Gushue, J. Gushue, T. Gushue, T. Gusnowski, R. Gussen, C. Gustafson, G. Gustafson, M. Gustafson, J. Gustavson, P. Gut, M. Gutierrez, R. Gutknecht, J. Gysler, D. Ha, T. Ha, E. Haag, B. Haahr, B. Haas, C. Haas, S. Haas, M. Haberoth, C. Hachey, L. Hachey, K. Hachey-Lalonde, S. Hackett, E. Hadada, V. Haddad, L. Hadi, T. Hadji, N. Hadskis, S. Haefliger, K. Hagan, S. Hagan, T. Hagen, L. Hagg, A. Hagi-Memet, C. Hagstrom, K. Hague, S. Hahn, J. Haidasz, O. Haight, K. Haines, A. Haj Hamdan, M. Haj Hamdan, S. Hajar, S. Haji, S. Hajizadeh, S. Halaburda, C. Hales, D. Halewich, K. Halewich, B. Haley, R. Haley, J. Halford, D. Halifax, B. Hall, C. Hall, J. Hall, M. Hall, R. Hall, S. Hall, S. Halland, S. Hallas, R. Halldorson, G. Hallett, R. Hallock, A. Halvorson, A. Hamad, C. Hambly, B. Hamborg, A. Hameed, K. Hameed, J. Hamel, P. Hamel, T. Hamel, J. Hamelin, B. Hamer, D. Hamer, S. Hamill, A. Hamilton, D. Hamilton, G. Hamilton, J. Hamilton, K. Hamilton, M. Hamilton, R. Hamilton, T. Hamilton, T. Hamitaj, K. Hamm, A. Hammami, M. Hammel, S. Hammel, R. Hammer, D. Hammerlindl, K. Hammersley, S. Hammersley, B. Hammond, G. Hammond, M. Hammond, C. Hampton, B. Hamrell, E. Han, G. Hanas, E. Hancock, M. Hancock, B. Hancott, R. Hanlon, S. Hanlon, E. Hann, R. Hann, B. Hanna, A. Hansen, D. Hansen, J. Hansen, K. Hansen, L. Hansen, R. Hansen, V. Hansen, D. Hanson, K. Hanson, L. Hanson, R. Hanson, T. Hanson, I. Harb, B. Harbin, C. Harder, L. Harder, C. Harding, P. Harding, G. Hardisty, J. Hardisty, B. Hardy, F. Hardy, H. Hardy, J. Hardy, A. Hare, A. Hargreaves, E. Harikumar, K. Harke, J. Harker, A. Harlal, D. Harley, E. Haroldson, B. Harpell, J. Harpell, G. Harper, E. Harrietha, R. Harrietha, R. Harriman, A. Harris, B. Harris, C. Harris, J. Harris, M. Harris, S. Harris, W. Harris, C. Harrison, D. Harrison, N. Harrison, R. Harsany, D. Hart, C. Hartery, C. Hartl, P. Hartwick, A. Harty, J. Harty, A. Harvey, B. Harvey, D. Harvey, J. Harvey, K. Harvey, P. Harvey, R. Harvey, S. Harvey, M. Hashem, I. Hashi, B. Hassan, I. Hassan, M. Hassan, O. Hassan, R. Hasselmann, B. Hassen, C. Hassenrueck, J. Hatala, J. Hatcher, G. Hatto, D. Haub, G. Haub, R. Hauger, T. Hauger, B. Haugo, J. Haukeness, W. Hausch, M. Havig, A. Hawco, S. Hawco, T. Hawco, C. Hawkings, D. Hawkins, H. Hawkins, S. Hawryliw, A. Hawthorne, S. Haxton, N. Hay, D. Hayashi, C. Hayden, E. Hayden, J. Hayden, D. Hayes, P. Hayes, K. Hayko, D. Haynes, J. Haynes, L. Haynes, A. Hayward, M. Hayward, R. Hayward, T. Hayward, J. Hazin, J. He, S. He, T. He, Y. He, K. Head, T. Head, M. Headrick, B. Heagy, C. Heagy, J. Heagy, A. Heale, L. Healy, K. Heard, B. Hearn, B. Heasley, A. Heath, B. Heath, C. Heath, D. Heath, L. Heath, B. Heatley, D. Heavens, S. Heawood, T. Hebel, B. Hebert, D. Hebert, J. Hebert, M. Hebert, S. Heck, T. Heck, D. Heemeryck, K. Heffernan, C. Heffner, D. Hefford, C. Hehr, T. Heid, R. Heide, T. Heidebrecht, M. Heigl, R. Hein, J. Heinen, R. Heinrichs, B. Heise, R. Heiz, R. Helland, B. Helliker, R. Hellum, A. Hellyer, Q. Helm, D. Helms, R. Helyar, C. Hemington, D. Hemmelgarn, W. Hemminger, T. Hempel, B. Hemstock, J. Henderson, R. Henderson, S. Henderson, W. Henderson, E. Hendrickson, K. Hendrickson, T. Hendriks, S. Hendry, K. Hennessey, A. Hennig, E. Henriquez, C. Henry, H. Henschel, D. Herauf, K. Herba, C. Herbst, W. Hergott, B. Herman, D. Herman, W. Herman, A. Hernandez, E. Hernandez, G. Hernandez, M. Hernandez, P. Hernandez, G. Herrebout, C. Herring, R. Herrington, D. Hertzsprung, M. Herzog, D. Heshka, R. Heska, A. Hess, B. Hess, M. Hessenbruch, B. Heugh, A. Heuthorst, J. Hevey, J. Hewitt, K. Hewitt, M. Hewitt, T. Hewitt, T. Hewko, J. Hewlett, K. Hewlin, A. Heydari Gorji, C. Heywood, R. Hibbs, D. Hicke, M. Hickey, P. Hickey, R. Hickey, B. Hicks, R. Hicks, L. Hiebert, R. Hiebert, M. Hiemstra, T. Hiemstra, E. Hietanen, R. Higa, J. Higdon, A. Higgins, J. Higgins, L.
Higgins, M. Higgins, R. Higgins, P. Higgitt, J. Higuerey De Sanchez, C. Hildahl, C. Hildebrand, C. Hill, D. Hill, H. Hill, J. Hill, K. Hill, T. Hill, D. Hillier, J. Hillier, M. Hillier, R. Hillier, S. Hillier, C. Hills, T. Hills, D. Hillyard, T. Hilsendager, R. Hilton, B. Hindmarch, K. Hingley, W. Hinkle, T. Hinks, K. Hinton, N. Hinze, M. Hird, K. Hirsch, D. Hiscock, S. Hiscock, F. Hiscox, D. Hitra, G. Ho, J. Ho, M. Ho, T. Ho, J. Hoare, W. Hobart, A. Hobbi, J. Hobbs, P. Hocaloski, R. Hoda, C. Hodder, G. Hodder, J. Hodder, O. Hodder, D. Hodge, R. Hodgins, D. Hodgson, A. Hoeg, C. Hoeppner, A. Hoey, N. Hoey, M. Hoffart, L. Hoffman, R. Hoffman, M. Hofstrand, G. Hogan, S. Hogan, A. Hogg, M. Hogg, R. Hogg, B. Holaki, J. Holben, D. Holik, K. Holladay, A. Holland, K. Holland, M. Holland, C. Hollands, I. Hollenbeck, P. Hollett, D. Holley, D. Hollingshead, G. Holloway, J. Holloway, L. Holloway, J. Hollowell, C. Holman, D. Holman, R. Holman, J. Holmes, K. Holmes, M. Holmes, T. Holmes, M. Holt, B. Holthe, C. Holthe, J. Holton, J. Holuk, D. Holwell, A. Holz, J. Holz, G. Homann, D. Honing, C. Hood, D. Hood, J. Hood, G. Hook, J. Hook, J. Hooper, R. Hooper, S. Hopkins, Y. Hopkins, N. Hopner, M. Hopp, C. Hopps, T. Hopwood, A. Hordy, R. Horn, T. Hornberger, Z. Horne, A. Hornseth, K. Hornseth, B. Horobec, K. Horvath, R. Horvath, J. Horyn, K. Hosker, B. Hossain, M. Hossain, S. Hosseini, A. Hosseinpoor, T. Hou, S. Houck, L. Houghton, E. Houlihan, A. House, G. House, P. House, R. House, T. House, L. Houseman, K. Hovdebo, T. Howard, C. Howden, L. Howell, K. Howes, P. Howie, S. Howlader, J. Howse, M. Hoyles, T. Hoyles, R. Hoyt, B. Hoza, J. Hripko, D. Hrycak, T. Hrycay, B. Hryniw, A. Hrynkevych, R. Hrynyk, J. Hu, M. Hu, T. Hu, Y. Hu, D. Huang, J. Huang, N. Huang, Q. Huang, G. Huber, R. Huber, W. Hubert, C. Huber-Yau, S. Hucal, J. Hucik, T. Huckabone, K. Huculak, W. Huddlestun, A. Hudkins, A. Hudson, D. Hudson, L. Hudson, P. Hudson, S. Huebner, K. Huey, V. Huey, J. Huffman, B. Hughes, D. Hughes, J. Hughes,

T4Canadian Natural 2020 Annual Report
E. Huh, K. Hui, R. Hui, M. Hulan, C. Hulbert, D. Hull, F. Hulme, M. Human, R. Humphrey, J. Humphreys, A. Humphries, C. Humphries, S. Humphries, T. Humphries, I. Hundeby, M. Hundessa, M. Hung, C. Hunt, D. Hunt, M. Hunt, B. Hunter, C. Hunter, D. Hunter, K. Hunter, L. Hunter, P. Hunter, R. Hunter, S. Hunter, W. Hunter, M. Hupchuk, K. Hupp, J. Hurd, K. Hurd, C. Hurford, G. Hurley, S. Hurley, R. Hurtado, R. Hurtubise, N. Husain, A. Hussain, S. Hussaini, G. Hussey, C. Hussynec, T. Hustad, A. Hutchinson, C. Hutchinson, D. Hutchinson, R. Hutchinson, C. Hutchison, R. Hutscal, E. Hutton, A. Huynh, M. Huys, S. Hwang, S. Hyatt, K. Hygard, A. Hymanyk, A. Hynes, D. Hynes, E. Hynes, J. Hynes, K. Hynes, M. Hynes, N. Hynes, S. Hyrcha, G. Iannattone, L. Iannattone, R. Ibbotson, K. Ibrahim, S. Ibrahim, T. Idler, G. Iervella, N. Ilchuk, R. Imankulov, D. Imbeau, E. Imbery, W. Imeson, K. Imlach, M. Imran, S. Imrie, J. Inch, R. Inder, C. Inglis, J. Inglis, R. Inglis, E. Ingram, G. Ingram, C. Inkster, B. Inman, C. Innes, M. Inscho, D. Ip, M. Ippolito, M. Iqbal, R. Irani, J. Ireland, R. Ireton, M. Irfan, J. Irons, K. Ironstand, R. Irvine, S. Irwin, J. Isaacs, C. Isaka, C. Isea Natera, B. Ish, H. Ishaque, U. Islam, O. Issa, J. Ivanova, B. Ivany, L. Iversen, C. Ives, J. Ivezic, C. Jabusch, M. Jackman, B. Jackson, D. Jackson, G. Jackson, J. Jackson, K. Jackson, R. Jackson, S. Jackson, T. Jackson, J. Jacob, S. Jacob, C. Jacobs, J. Jacobs, K. Jacobs, M. Jacobs, K. Jacobson, A. Jacques, A. Jacula, C. Jacula, M. Jacula, D. Jaeger, A. Jaffer, H. Jaggard, M. Jahangiri, R. Jahanshahi, V. Jain, M. Jaindl, K. Jaji, R. Jakher, R. Jakubowski, H. Jalali, M. Jalali, G. Jaleel, M. Jama, S. Jamam, D. Jaman, T. Jaman, A. Jambrosic, D. James, T. James, W. James, J. Jamieson, M. Jamieson, R. Jamieson, S. Jamieson, T. Jamieson, D. Jamilano Jr., A. Janes, D. Janes, J. Janes, Z. Janosova-Den Boer, S. Jansky, T. Janusc, A. Janzen, L. Janzen, M. Janzen, L. Jardie, C. Jardine, J. Jardine, S. Jardine, N.
Jaricha, C. Jarocki, C. Jarratt, B. Jarvis, J. Jarvis, K. Jarvis, K. Jaschke, S. Jaume, K. Jay, M. Jay-Rivas, N. Jeang, J. Jechow, W. Jellison, G. Jenkins, J. Jenkins, T. Jenkins, R. Jenner, R. Jenniex, S. Jenniex, D. Jennings, A. Jensen, B. Jensen, D. Jensen, K. Jensen, L. Jensen, Q. Jensen, R. Jensen, T. Jensen, V. Jensen, D. Jerkovic, M. Jeroncic, R. Jeronymo, T. Jervis, C. Jesso, M. Jesso, T. Jessome, J. Jesson, S. Jevne, M. Jewel, C. Jezowski, N. Jiang, S. Jiang, Y. Jiang, Z. Jiang, R. Jimeno, X. Jing, P. Jingar, N. Jivani, K. Jivraj, R. Jivraj, D. Joa, M. Joarder, P. Jobin, N. Jobson, J. Jocksch, D. Jodoin, L. Jodoin, G. Joe, J. Joffre, G. Johal, I. Johanson, K. Johansson, T. Johns, A. Johnson, B. Johnson, C. Johnson, D. Johnson, G. Johnson, I. Johnson, J. Johnson, K. Johnson, M. Johnson, N. Johnson, R. Johnson, S. Johnson, T. Johnson, A. Johnston, D. Johnston, H. Johnston, M. Johnston, N. Johnston, R. Johnston, C. Johnstone, G. Johnstone, S. Johnstone, D. Johnston-Watson, J. Jonasson, A. Jones, B. Jones, C. Jones, D. Jones, E. Jones, G. Jones, K. Jones, L. Jones, M. Jones, N. Jones, R. Jones, V. Jones, N. Jongkind, P. Joo, J. Jorawsky, D. Jordan, M. Jordan, B. Jorgensen, C. Jorgensen, D. Jorgensen, M. Jorgensen, L. Jorgenson Donahue, D. Joseph, P. Joseph, A. Jose-Sadzius, A. Joshi, H. Joshi, T. Joshi, U. Joshi, S. Joshua, S. Josselyn, R. Jost, M. Jovic, D. Jowsey, L. Joy, M. Juanerio, R. Jubinville, T. Juett, A. Juhasz, K. Juhasz, A. Junaid, J. Jung, S. Jung, C. Jungen, R. Jungkind, G. Junio, C. Jurgenliemk, K. Jurouloff, T. Kabyn, A. Kachra, C. Kada, T. Kadi, T. Kadikoff, L. Kadutski, C. Kaglea, A. Kaid, M. Kaid, G. Kailas, K. Kajorinne, H. Kakadiya, M. Kakooei, S. Kalbag, V. Kalbag, O. Kalinchuk, L. Kalinin, D. Kalinowski, J. Kallis, A. Kalmet, D. Kalynchuk, A. Kamate, B. Kamath, E. Kambylis, A. Kamieniak, A. Kamke, G. Kamon, S. Kanarek, A. Kandasamy, S. Kandulva Chakrapany, J. Kane, L. Kane, R. Kane, S. Kane, K. Kang, N. Kang, Z. Kanji, J. Kanzig, P. Kapadia, S. Kapeluck, M. Kapp, Y. Karayan Moosafi, P. Karimi, R. Karlowsky, J. Karlson, S. Karlstrom, S. Karmakar, T. Karnes, C. Karpan, M. Karpan, C. Karpiak, K. Kartushyn, P. Karval, D. Kary, U. Karymbaev, E. Kasatkin, N. Kashirina, C. Kaskiw, M. Kaspers, L. Kassapian, A. Katebi, M. Kathan, D. Katnick, H. Katrip, A. Katyayan, J. Kaufman, M. Kaur, S. Kaur, S. Kaushik, T. Kavalec, J. Kavanagh, T. Kawadza, K. Kay, O. Kay, G. Kaya, L. Kayyali, G. Kazimirowich, D. Ke, M. Kealey, R. Kean, J. Kearley, M. Kearley, R. Kearns, K. Keating, F. Kebede, M. Keck, B. Keddie, R. Keddie, A. Keebler, C. Keehn, T. Keenan, P. Keglowitsch, P. Kehler, C. Keil, G. Keith, J. Kelenc, F. Keller, K. Keller, C. Kelley, E. Kellough, J. Kelloway, M. Kelloway, R. Kelloway, C. Kellsey, C. Kelly, J. Kelly, M. Kelly, P. Kelly, S. Kelsey, T. Kemmer, G. Kemp, L. Kempe, S. Kempner, J. Kempton, R. Kendall, S. Kendall, C. Kendell, D. Kendell, R. Kendell, M. Kendrick, D. Kendze, B. Kennedy, G. Kennedy, J. Kennedy, K. Kennedy, M. Kennedy, R. Kennedy, S. Kennedy, W. Kennedy, J. Kenny, R. Kenny, L. Kenstavicius, D. Kent, M. Kent, S. Kent, V. Kenyon, K. Keough, S. Kermanshachi, S. Kernachan, C. Kerpan, J. Kerr, S. Kerr, S. Kers, D. Ketchum, D. Kett, B. Kevol, I. Khabarova, M. Khalil, T. Khambalkar, A. Khan, F. Khan, G. Khan, M. Khan, S. Khan, N. Khatri, R. Khatri, J. Kho, F. Khodayari, S. Khong, S. Kiasosua, I. Kidd, R. Kidd, D. Kidger, B. Kidmose, B. Kiedyk, C. Kiehn, K. Kieley, C. Kilback, D. Kilbreath, M. Kilcollins, C. Killick, O. Kilo, B. Kim, H. Kim, C. Kimler, D. Kimmie, M. Kinden, B. King, C. King, D. King, G. King, I. King, J. King, M. King, N. King, R. King, T. King, W. King, R. Kingcott, T. Kingsbury, K. Kinnaird, S. Kinnear, C. Kinniburgh, P. Kip, B. Kirby-Graham, T. Kirchner, M. Kireev, T. Kirilo, D. Kirkham, L. Kirkpatrick, M. Kirkwood, A. Kiss, B. Kiss, B. Kissel, M. Kissoon, G. Kjelshus, T. Kjemhus, J. Klaffl, J. Klapstein, D. Klassen, J. Klassen, R. Klassen, C. Klatt, D. Klause, R. Klautt, B. Klenk, R. Klimek, M. Klimkiewicz, E. Klitiris, J. Klotz, G. Kluthe, C. Knapper, R. Knee, S. Knelsen, W. Knelson, R. Kneteman, M. Kniebel, G. Knight, J. Knight, R. Knight, J. Knight-Ehiwe, J. Knipe, L. Knoblauch, D. Knoblich, B. Knopf, D. Knott, W. Knouse, J. Knox, K. Knox, P. Knull, M. Kobelka, D. Kobes, B. Kobzey, B. Koch, M. Koch, E. Kodjo Gaba, R. Koenig, K. Koffi, L. Koffi, S. Koffi, C. Kohls, B. Kohrs, J. Kohut, B. Koizumi, C. Kolberg, M. Kolenchuk, M. Kolesnikov, D. Kolundzic, B. Koma, C. Komant, M. Komant, S. Kompally, M. Kondor, B. Kondratowicz, B. Kone, L. Kone, V. Kone, Y. Kone, L. Kong, D. Konowalec, M. Konschuh, E. Kontuk, B. Kootenay, R. Kootnekoff, S. Korchagin, M. Koren, P. Kornacki, B. Korolischuk, C. Koroluk, D. Korrey, J. Kosanovich, A. Kosasih, I. Koshcheev, D. Kosinski, J. Kosior, B. Kosowan, V. Kostic, K. Kostrub, B. Kotchi, K. Kotkas, M. Kotty, D. Kotze, M. Koua, P. Kouadio, A. Kouakou, D. Kouame, A. Kouassi, H. Kouassi, G. Koumba Lendoye, A. Kourbaj, M. Koutou, B. Kovacs, S. Kovacs, R. Kovalenko, R. Kovasin, M. Kowalchuk, J. Kowalewski, R. Kowalski, K. Kowbel, R. Kowbel, M. Kozak, E. Kozakevich, G. Kozakevich, T. Kozina, A. Kozler, A. Kozlowski, B. Kozuback, D. Krajci, B. Kraljic, J. Kramers, K. Kramps, R. Kranitz, T. Kratz, W. Kraus, G. Krause, R. Krauss, R. Kravitz, B. Krawchuk, C. Krawchuk, D. Krawec, J. Krawetz, M. Krawetz, J. Kreft, T. Kreics, M. Kreiser, B. Krell, J. Krenbrink, B. Kress, K. Krewulak, A. Krishnamoorthy, R. Krishnamurthy, D. Krismer, B. Kristianson, K. Kristman, N. Krochmal, R. Kroeker, K. Krogh, P. Krol, R. Krueger, G. Kruger, K. Kruger, G. Kruk, N. Krupka, N. Krush, T. Krushel, R. Ku, C. Kubik, C. Kucinar, G. Kucy, J. Kuhberg, M. Kulkarni, C. Kully, B. Kumar, P. Kumar, R. Kumar, S. Kumar, C. Kung, D. Kunitz, J. Kunka, J. Kuntz, P. Kuppers, S. Kurczaba, D. Kurek, M. Kureshi, M. Kurowski, K. Kurschenska, D. Kurtz, K. Kurtz, R. Kurtz, F. Kurucz, G. Kushe, D. Kusmiadji, B. Kutash, K. Kuzevanova, F. Kuzmic, C. Kwan, K. Kwan, R. Kwiatkowski, S. Kwiatkowski, V. Kwiatkowski, A. Kwon, J. Kwong, T. Ky, J. Kyes, K. Kyffin, D. Kyle, J. Kynock, R. Kynock, T. La Grange, D. Labby, J. LaBossiere, J. Laboucan, R. Laboucan, D. Labrecque, T. Lacey, A. LaChance, N. Lachance, S. Lachance, J. Lacharite, K. Lacombe, R. Lacombe, P. Lacoste-Bouchet, D. Lacroix, M. Lacroix, S. Lacroix, L. Lacuna, A. Laderoute, K. Ladji, K. Lafferty, S. Lafond, D. Lafontaine, R. Laforge, D. Lafreniere, L. Lafreniere, G. Lagace, M. Lagimodiere, A. Laguduva, M. Laha, B. Lahoda, D. Lahoda, J. Lahoda, C. Lai, R. Lai, S. Lai, E. Laidlaw, A. Laing, R. Laing, S. Laird, M. Lake, J. Lakes, K. Lal, P. Lalani, J. Laliberte, P. Lalonde, C. Lam, E. Lam, I. Lam, J. Lam, M. Lam, N. Lam, R. Lam, S. Lam, K. Lamb, T. Lamb, Z. Lamba, D. Lambert, E. Lambert, J. Lambert, D. Lameman, T. Laminski, J. Lamontagne, R. Lamontagne, J. Lamoureux, T. Lamoureux, W. Lamoureux, W. Lamptey, A. Landry, E. Landry, G. Landry, J. Landry, L. Landry, M. Landry, S. Landry, Y. Landry, X. Landry-Pellerin, W. Landsburg, B. Lane, M. Lane, S. Lane, W. Lane, R. Lanfranchi, J. Langdon, K. Langdon, G. Lange, L. Lange, N. Lange, O. Lange, S. Lange, S. Langford, W. Langford, T. Langill, J. Langman, C. Langpap, K. Langworthy, B. Lanh, R. Laniec, C. Lanthier, L. Lanza, S. Lanza, C. Lapp, C. Lappin, M. Larade, G. Laramee, G. Lardner, S. Larkam, J. Larkin, J. Larochelle, A. Larocque, J. Larocque, G. Larrivee, R. Larsen, J. Larson, L. Larson, P. Larson, R. Larson, B. Larsson, A. Laser, J. LaSha Pool, M. Laslo, C. Lassey, W. Latchuk, A. Latif, Z. Latif, C. Latimer, M. LaTorre, P. Latus, J. Lau, S. Lau, L. Laube, A. Lauder, B. Laughlin, P. Laughman, K. Laurin, M. Lausen, R. Lauze, J. Lauzon, D. Laventure, K. Laverty, P. Lavery, B. Lavigne, J. Lavigne, C. Lavoie, Y. Law, P. Lawless, S. Lawlor, B. Lawrence, D. Lawrence, E. Lawrence, L. Lawrence, R. Lawrence, S. Lawrence, W. Lawrence, Y. Lawrence, R. Lawrie, G. Lawson, J. Laya, C. Layes, K. Layland, P. Layland, T. Layland, S. Layton, K. Layug, G. Lazaruk, L. Le, M. Le, N. Le, T. Le, R. Le Manne, B. Leach, T. Leach, R. Leahy, C. Leamon, K. Leamon, L. Leamon, A. Leather, M. Lebas, C. LeBlanc, E. LeBlanc, J. Leblanc, R. Leblanc, T. Leblanc, W. LeBlanc, C. Lebrun, S. LeBrun, S. Lebsack, S. Leclair, G. Ledger, C. Ledrew, A. Lee, C. Lee, D. Lee, J. Lee, K. Lee, L. Lee, M. Lee, R. Lee, S. Lee, T. Lee, B. Leeman, M. Lefaivre, G. Lefebure, D. Lefebvre, S. Lefebvre, M. LeForte, D. Legault, K. Legault, J. Legere, P. Legere, M. Legge, M. LeGrow, K. Lehal, B. Lehbauer, C. Lehmann, M. Lehouillier, S. Lei, T. Leibel, P. Leier, M. Leitch, S. Leithoff, B. Lekach, J. Leman, R. Lemoine, Z. LeMoine,

Canadian Natural 2020 Annual ReportT5
T. Lemon, P. Leniuk, P. Lennon, C. Lenz, S. Lenz, J. Lenzner, T. Leon, C. Leong, G. Leong, H. Leong, K. Lepage, T. LePage, S. Lepine, S. Lepp, L. Leppaie, P. Lepper, Y. Lerner, C. Leroux, E. Leroy, C. Leschinski, T. Lesko, R. Leslie, S. Lester, B. Lesyk, C. Lesyk, K. Letby, M. Lethaby, F. Letkeman, P. Letkeman, T. Letkeman, A. Letourneau, M. Letourneau, H. Lett, A. Leung, D. Leung, J. Leung, K. Leung, M. Leung, P. Leung, R. Leung, Y. Leung, J. Levac, J. Levesque, R. Levesque, S. Lewchuk, C. Lewis, D. Lewis, J. Lewis, K. Lewis, P. Lewis, T. Lewis, W. Lewis, R. Lewiski, W. Leyland, N. L’Heureux, J. L’Hirondelle, B. Li, H. Li, J. Li, Q. Li, S. Li, W. Li, Y. Li, B. Liang, S. Liao, C. Liba, P. Libari, M. Liber, N. Liegman, H. Lien, S. Lien, C. Lieverse, J. Lieverse, D. Lightburn, A. Likhar, D. Lilburn, H. Lim, M. Lim, F. Lin, H. Lin, J. Lin, Q. Lin, Y. Lin, K. Linaker, B. Lind, S. Lindballe, K. Linder, T. Lindley, G. Lindner, E. Lindsay, D. Lindskog, A. Linggon, D. Link, P. Linklater, N. Linnell, J. Linton, M. Liou-McKinstry, R. Liske, C. Little, G. Little, J. Little, S. Little, J. Littlechilds, C. Litwin, H. Liu, J. Liu, L. Liu, M. Liu, T. Liu, W. Liu, X. Liu, Y. Liu, J. Liu Prest, E. Liv, J. Lively, J. Livingston, K. Livingston, R. Livingston, S. Livingstone, C. Lizee, J. Llanos, R. Lloy, M. Lloyd, R. Lloyd, A. Lobban, A. Lobbes, G. Lobdell, J. Lochansky, F. Locke, R. Locke, T. Locke, A. Lockhart, N. Lockhart, R. Lockhart, C. Loder, J. Lodoen, K. Loewen, S. Loewen, C. Lofstrom, C. Logan, R. Logan, S. Logan, D. Loggie, R. Logozar, R. Loke, J. Lomada, D. Londo, C. Long, D. Long, Y. Long, S. Longman, S. Longson, C. Longston, I. Lonsbury, K. Loo, K. Lopez, J. Lopez Sanchez, D. Lord, N. Lord, C. Lorenson, N. Lorentz, T. Lorenz, J. Lorette, K. Lorette, M. Lorincz, B. Lorinczy, M. Loring, K. Lorteau, M. Loshny, M. Lotfi, J. Lotito, T. Lougheed, A. Loughran, E. Louie, L. Louie, S. Lourido, J. Louw, C. Love, M. Love, D. Loveless, J. Loveless, W. Loveless, I. Lovera-Figueroa, M. Lovestrom, E. Lovmo, N. Low, C. Lowe, D. Lowe, C. Lowen, J. Lowen, K. Loyer, L. Loyola, E. Lozano, C. Lozinski-Kumpula, A. Lu, J. Lu, M. Lu, G. Lucas, I. Lucas, J. Lucas, B. Lucy, E. Ludwig, S. Lui, L. Luiken, C. Luk, K. Luk, K. Lukan, L. Lukey, H. Lund, W. Lundell, K. Lundrigan, E. Lunn, R. Lunn, J. Lunt, C. Lunzmann, X. Luo, M. Lupul, B. Lush, J. Lush, R. Lusk, A. Lussier, K. Lussier, C. Lutsch, D. Lutwick, J. Lutyck, K. Lutz, A. Ly, K. Lyall, T. Lychuk, G. Lykidis, D. Lynch, L. Lynch, R. Lynett, M. Lynn, M. Lyon, W. Lyon, N. Lyons, R. Lyric, D. Lysak, H. Ma, V. Ma, N. Maawia, M. MacBeth, L. MacCallum, K. MacComish, M. MacConnell, L. Macdaid, A. MacDonald, C. MacDonald, D. Macdonald, J. MacDonald, L. MacDonald, M. MacDonald, P. MacDonald, R. Macdonald, T. MacDonald, W. MacDonald, G. MacDonell, A. MacDougall, J. MacDougall, M. MacDougall, S. MacDougall, T. Macdougall-Sinclair, C. MacEachern, J. MacEachern, L. MacEachern, M. MacEachern, T. MacEachern, Y. Macedo, C. MacFarlane, M. Macfarlane, K. MacGillis, A. Macgillivray, D. MacGregor, G. MacGregor, K. Machado Rodriguez, S. MacHale, R. Maciborski, J. Maciejewski, T. Macijuk, A. MacInnis, B. MacInnis, S. MacInnis, L. MacIntosh, J. MacIntyre, T. Macintyre, A. Mack, C. Mack, L. Mack, S. Mack, B. MacKay, C. Mackay, G. MacKay, K. Mackay, L. Mackay, M. MacKay, S. MacKay, R. Mackelvie, A. MacKenzie, C. Mackenzie, D. Mackenzie, K. MacKenzie, M. MacKenzie, S. MacKenzie, T. Mackenzie, V. MacKenzie, B. MacKey, P. Mackey, S. Mackey, T. Mackey, M. Mackie, A. MacKinnon, B. MacKinnon, J. MacKinnon, K. MacKinnon, T. MacKinnon, P. Mackintosh, N. Macklin, T. MacLaren, B. Maclean, C. MacLean, E. MacLean, K. MacLean, M. MacLean, R. MacLean, A. MacLellan, D. Maclellan, G. MacLellan, M. MacLellan, J. MacLennan, A. MacLeod, I. MacLeod, J. MacLeod, L. MacLeod, M. MacLeod, T. MacLeod, W. MacLeod, N. MacMillan, S. Macmullin, A. Macneil, B. MacNeil, C. Macneil, J. Macneil, A. MacNiven, W. MacPherson, B. MacPhie, H. Macrae, M. MacRitchie, E. MacVicar, T. MacVicar, B. Macwilliams, C. Madadi, A. Madhukar, H. Madi, R. Madigan, C. Madill, H. Madlung, D. Madoche, G. Madsen, L. Madsen, M. Maennchen, L. Maga, D. Maganga, J. Magbanua, D. Magee, B. Mageza, S. Magill, C. Magnan, D. Magnusson, M. Magnusson, J. Magpali, A. Magro, V. Magsila, D. Magson, R. Maguet, D. Mah, M. Mah, R. Mah, N. Mahar, K. Mahboobi, Z. Mahe, A. Maida, T. Mailandt, M. Mailhot, D. Maillet, E. Maillet, J. Maillet, P. Mailloux, R. Mailman, J. Mainville, R. Mairena, B. Maisey, D. Maisey, S. Majdnia, J. Majeau, A. Majidi, P. Major, J. Makahnouk, M. Makhoul, D. Makin, M. Makin, L. Makowichuk, G. Makumbe, A. Malabad, D. Malabad, E. Malabad, J. Malazdrewicz, S. Malcolm, H. Maldonado, M. Malech, P. Malhame, A. Malimban, T. Malkova, J. Mallard, K. Mallard, S. Mallay, G. Mallette, T. Malley, C. Mallory, G. Malo, T. Maloney, D. Malowski, A. Maltseva, G. Malvar, M. Malyk, O. Malyshev, S. Mamedov, F. Manangu, D. Manarang, M. Manderscheid, D. Mandley, D. Manengyao, L. Manfredi, J. Manful, J. Mangrove, M. Manhera, T. Manji, E. Mankowski, D. Mann, G. Mann, K. Mann, R. Mann, S. Mann, J. Manning, K. Manolov, J. Mansfield, D. Manshanden, R. Mantei, A. Manthorne, E. Mantilla, G. Manuel, J. Manuel, G. Manuel-Goodyear, L. Manzano Weffer, H. Maralli, N. Maralli, D. Marazzo, G. Marceau, A. Marcel, L. Marchand, N. Marchand, F. Marchesan, M. Marchi, R. Marcichiw, A. Marcinkoski, T. Marcotte, L. Marcucci, N. Marcy, J. Margetson, W. Margison, V. Maries, E. Marilao, S. Marin, P. Marinzi, S. Marion, D. Mark, S. Markle, S. Markosyan, K. Markstrom, M. Markussen, P. Marolt, U. Maroney, B. Marple, A. Marquardt, T. Marquis, K. Marriner, R. Marrington, C. Marriott, A. Marsh, B. Marsh, M. Marsh, P. Marsh, C. Marshall, D. Marshall, G. Marshall, S. Marshall, J. Marston, A. Martakoush, P. Martell, D. Martens, S. Martens, B. Martin, C. Martin, D. Martin, J. Martin, K. Martin, M. Martin, S. Martin, T. Martin, D. Martinat, S. Martin-Courtright, S. Martinella, M. Martinez, Z. Martinez, D. Martinez Gomez, O. Martis, D. Martyn, R. Martyn, M. Martynuik, A. Martyshuk, M. Martyshuk, J. Maruniak, K. Mashayekh, R. Maskoni, B. Mason, C. Mason, K. Mason, R. Mason, D. Massey, M. Massiah, K. Massick, A. Massicotte, P. Massicotte, M. Mata, A. Matatko, T. Matatko, A. Matchem, H. Mateen, D. Mathers, D. Matheson, E. Matheson, L. Matheson, S. Matheson, T. Matheson, A. Mathew, L. Mathew, D. Mathieson, F. Mathieson, C. Mathiot, J. Matkowski, B. Matsalla, N. Matsushita, A. Matthews, B. Matthews, C. Matthews, D. Matthews, E. Matthews, N. Matthews, J. Matthiessen, R. Matychuk, P. Maurice, S. Maurice, A. Maurier, N. Mavani, D. Mavridis, A. Mawer, V. Maximo, C. Maxsom, J. Maxwell, R. Maxwell, K. May, R. May, C. Maye, F. Mayell, J. Mayer, S. Mayer, R. Mayers, A. Maynard, W. Maynard, A. Mayo, B. Mayo, C. Mays, A. Mazur, C. Mazuryk, H. Mc Gee, D. McAlister, C. Mcallister, D. McAllister, J. McAllister, M. McAlpine, D. McArthur, K. Mcarthur, E. McAvoy, N. McBain, D. McBrearty, K. McBride, R. McBrien, G. McCabe, T. McCabe, S. McCaffrey, R. McCallum, S. McCann, D. McCarry, J. McCarthy, J. McCarty, K. McClary, D. McClelland, I. McClelland, B. McClure, J. Mcclyment, B. McConachie, C. McConnell, M. McCormack, C. Mccoy, S. McCracken, B. McCrady, K. McCrae, C. McCrea, G. McCrea, J. McCrea, J. Mccready, S. McCreery, G. Mccubbing, B. McCullagh, B. McCullough, C. McCullough, D. McCullough, E. McCullough, R. McCullough, A. McDaniel, C. McDonald, D. McDonald, J. McDonald, K. McDonald, T. McDonald, L. McDonnell, K. McDougall, M. McDougall, S. McDougall, J. McDowell, R. McEachnie, M. McElroy, N. McElroy, J. McEwen, W. McEwen, J. Mcfarland, M. McFarlane, B. McFaul, L. McFeeters, M. McGannon, F. McGaw, L. McGean, D. McGee, L. McGee, P. McGinnis, G. Mcgonigal, C. McGovern, G. McGowan, A. McGrath, C. McGrath, D. Mcgrath, K. Mcgrath, L. McGrath, M. McGrath, T. McGrath, S. McGregor, T. McGregor, S. McHardy, L. McHugh, D. McIlvaney, A. McIntosh, G. McIntosh, M. Mcintosh, W. McIntosh, C. McIntyre, P. McIntyre, R. McIntyre, C. McIver, T. McKague, B. Mckay, C. McKay, J. McKay, K. McKay, L. McKay, N. McKay, R. McKay, S. McKay, T. McKay, N. McKeachnie, T. McKee, W. McKellar,
N. McKendry, M. McKenna, P. McKenna, T. McKenna, B. McKenzie, K. McKenzie, M. McKenzie, R. McKenzie, D. Mckersie, H. McKiel, C. McKim, S. McKinney, A. McKinnon, J. Mckinnon, K. Mckinnon, S. McKinnon, R. McLachlen, M. McLane, C. McLaren, D. McLaren, M. McLaren, H. McLarty, S. McLaughlan, T. Mclaughlan, K. McLaughlin, R. McLaughlin, K. McLean, M. McLean, N. McLean, R. McLean, W. Mclean, A. McLellan, B. McLellan, C. McLellan, J. McLellan, K. McLellan, T. McLellan, C. McLenaghan, M. McLenehan, G. McLennan, C. McLeod, D. McLeod, I. McLeod, M. McLeod, S. McLeod, T. McLeod, P. Mcloughlin, G. McMahon, L. McMahon, K. McMann, N. McManus, J. McMaster, R. McMaster, S. McMichael, J. McMillan, R. McNabb, R. McNair, D. McNamara, K. McNaughton, R. McNaughton, M. McNay, D. McNeil, H. McNeil, K. McNeil, M. McNeil, P. McNeil, R. McNeil, T. McNelly, L. McPhee, R. McPhee, J. McPherson, K. McPherson, J. McQuade, C. McQuaker, A. McQueen, E. McQueen, J. McQueen, C. McQuiggin, L. McQuiston, K. McRae, R. McRae, A. McSharry, J. McTamney, B. McTavish, T. McTavish, C. McWhan, C. McWhinnie, M. Meade, D. Meador, B. Meadus, P. Meadus, S. Meagher, M. Meckelborg, M. Medhurst, I. Medina, N. Medina, D. Medlicott Lymburner, B. Medway, J. Meeks, K. Meh, M. Mehaney, F. Mehdiyev, N. Mehta, V. Mehta, D. Meier, C. Mejia, J. Mejia, B. Melanson, D. Melanson, J. Melanson, R. Melanson, T. Melindy, H. Mellafont, L. Mello, G. Mellom, C. Mellott, K. Melnyk, M. Melnyk, R. Melnyk, A. Melo, J. Melville, A. Menard, L. Mendenhall, P. Mendes, M. Mendonca, A. Mendoza, N. Meneses, F. Meng, D. Menjivar, B. Mennie, P. Menzel, M. Mer, G. Merali, C. Mercer, G. Mercer, J. Mercer, L. Mercer, J. Mercier, C. Merkel, G. Merkel, D. Merkley, A. Merle, S. Merralls, M. Merrill, M. Merriman, C. Merritt, N. Merritt, R. Merritt, U. Meservy, S. Metcalfe, T. Methuen, C. Metz, S. Meunier, R. Mewis, C. Mews, D. Mews, R. Mews, T. Michaelis, L. Michalishen, C. Michalko, B. Michaud, T. Michel, M. Michelin, K. Mickel, N. Mickelson, J. Miclat, D. Midgley, K. Mielty, J. Mihai, J. Mihailoff, M. Miiller, D. Mikalson, A. Mikhailov, S. Mikloukhine, J. Miko, G. Milan Garcia, J. Milce, J. Mildenberger, R. Miles, R. Millar, B. Miller, D. Miller, G. Miller, J. Miller, L. Miller, R. Miller, S. Miller, T. Miller, W. Miller, L. Milligan, C. Mills, D. Mills, G. Mills, H. Mills, J. Mills, R. Mills, S. Mills, T. Mills, J. Millwater, A. Milne, J. Milne, D. Milward, F. Mingle, A. Minhas, M. Minick, W. Minni, W. Minns, D. Mino, J. Minor, A. Minty, J. Minty, A. Mir, S. Mir, T. Mir, W. Mirabal, A. Mirza, B. Mirza, W. Mirza, O. Mishchenko, J. Mistecki, D. Mistry, C. Mitchell, G. Mitchell, J. Mitchell, M. Mitchell, R. Mitchell, T. Mitchell, W. Mitchell, Y. Mitchell, N.

T6Canadian Natural 2020 Annual Report
Mitchell-Banks, M. Mitton, P. Mo, V. Modak, B. Moelbert, I. Moffat, J. Moffat, R. Mogensen, A. Mognin, A. Mohamed, S. Mohamed, B. Mohammed, G. Mohammed, A. Mohideen, J. Mohl, D. Moisan, M. Molde, N. Molder, N. Molina, R. Mollison, J. Molnar, T. Mombourquette, R. Monahan, R. Money, P. Monfette, C. Montague, F. Montefresco-Gentile, R. Monteith, J. Montgomery, M. Montinola, S. Moojelsky, K. Moon, P. Moon, B. Moore, D. Moore, E. Moore, J. Moores, L. Mora, A. Morado, A. Morelli, K. Morency, L. Moreno, J. Moretto, A. Morey, C. Morgan, J. Morgan, T. Morgan, M. Moriarty, A. Morin, J. Morin, M. Morin, P. Morin, R. Morin, J. Morley, R. Morley, K. Morphy, K. Morrell, B. Morris, D. Morris, I. Morris, J. Morris, K. Morris, M. Morris, S. Morris, J. Morriseau, C. Morrison, J. Morrison, S. Morrison, C. Morriss, W. Morrow, S. Morse, D. Morsette, A. Mortlock, K. Morton, L. Morton, M. Morvik, D. Mose, D. Moser, J. Moshenko, T. Moskol, M. Moss, P. Mossey, C. Mostowich, J. Mostyn, S. Mothersele, L. Motowylo, B. Mottle, S. Moul, L. Mounkes, I. Mountain, P. Mouori Mbani, S. Mousazadeh, O. Moussa, M. Mousseau, D. Mouton, R. Moyle, C. Moyls, M. Mubarak, W. Mudryk, T. Mudzviti, T. Mueller, Z. Mueller, T. Muessle, A. Mugford, R. Mugford, M. Mughal, S. Muhammad, K. Muir, D. Muise, L. Muise, G. Mullen, S. Muller, C. Mullett, B. Mulligan, R. Mullin, N. Mulvena, S. Mundt, K. Munn, A. Munro, J. Munro, L. Munro, R. Munro, C. Murdoch, J. Murdoch, G. Murley, A. Murphy, B. Murphy, C. Murphy, D. Murphy, J. Murphy, K. Murphy, P. Murphy, R. Murphy, T. Murphy, J. Murrant, B. Murray, C. Murray, G. Murray, L. Murray, S. Murray, E. Murrin, S. Murrin, M. Musaid, A. Mushava, I. Musiwarwo, W. Muss, D. Musselman, T. Musselman, N. Musterer, Z. Musuna, A. Muthuswamy, R. Mutschler, T. Mutter, I. Muwhen, J. Mweshi, D. Myers, E. Myers, L. Myhre, S. Myles, D. Myshak, G. Nabi, J. Nachtigal, B. Nadeau, S. Nadeau, M. Naderikia, S. Nagare, A. Nagra, J. Nagy, J. Nagy-Kolodychuk, L. Nahas, J. Naidu, J. Nair, R. Nair, S. Nair, S. Najeeb, L. Najoan, B. Nalder, N. Namoca, E. Namur, J. Napier, R. Napier, C. Naqvi, H. Naqvi, S. Naqvi, P. Narayan, K. Narayanan, A. Narcise, S. Naser, D. Nater, M. Nathwani-Crowe, A. Naughton, D. Naugler, P. Nava, D. Navas, R. Navas, V. Navratil, M. Nawab, B. Nawaz, S. Nayak, C. Nazarko, N. N’Doye, T. Neacsu, D. Neal, N. Neale, M. Neate, A. Neddjar, D. Neergaard, J. Neff, S. Negi, Y. Neguse, D. Neigum, A. Neilson, S. Neilson, D. Nein, K. Nelligan, A. Nelson, B. Nelson, C. Nelson, D. Nelson, J. Nelson, K. Nelson, M. Nelson, R. Nelson, V. Nelson, M. Nergaard, N. Nernberg, G. Nesbitt, B. Nessman, K. Netter, K. Nettesheim, G. Netzel, C. Neufeld, O. Neufeld, F. Neumaier, D. Neumann, D. Nevil, W. Nevills, A. Nevokshonoff, D. Newbury, B. Newell, R. Newitt, A. Newman, J. Newman, L. Newman, P. Newman, R. Newman, A. Newton, K. Newton, D. Ng, J. Ng, K. Ng, R. Ng, S. Ng, V. Nganzo, P. N’Gbesso, H. Ngo, N. Ngo-Schneider, H. Ngowe, C. Nguyen, M. Nguyen, S. Nguyen, T. Nguyen, H. Ni, D. Niamke, F. Nichol, J. Nicholl, D. Nichols, J. Nichols, A. Nicholson, J. Nicholson, S. Nicholson, A. Nickel, D. Nickerson, K. Nickerson, J. Nicolajsen, E. Nicolas, T. Nicolas, J. Nicoll, J. Nie, C. Nielsen, K. Nielsen, M. Nielsen, T. Nielsen, O. Nieto, M. Nieves, P. Nihon, W. Nikiforuk, C. Nikipelo, R. Nimco, T. Ninovska, R. Nippard, S. Nippard, D. Nissen, J. Nistico, O. Niven, R. Nixdorf, K. Nixon, P. Niziolek, A. N’Kesse, G. Noble, M. Nobles, C. Noel, D. Noel, P. Noel, A. Noftall, Z. Noftall, J. Noga, B. Nolan, P. Nolan, R. Nolan, S. Nolan, B. Nolin, G. Nolin, R. Noot, W. Nordin, J. Norgaard, A. Nori, A. Noriel, V. Norkin, B. Norman, D. Norman, J. Norman, M. Norman, P. Norman, R. Norman, T. Norman, T. Normand, Y. Normand, C. Normore, B. Norquay, L. Norrad, J. Norris, K. Norton, R. Norton, B. Noseworthy, A. Noskey, K. Notenbomer, F. Nothnagel, E. Notter, J. Novak, O. Novikova, D. Nowicki, R. Nunweiler, D. Nwagbogwu, R. Nycholat, C. Nyen, E. Nyenhuis, C. Nyman, W. Oak, R. Oakes, W. Oakes, K. Oaks, A. Obad, D. Ober, J. Oberg, N. Obi, F. Obiri, P. Oblozinsky, S. O’Bomsawin-Corriveau, E. Oborowsky, B. O’Brien, D. O’Brien, H. O’Brien, P. O’Brien, J. Obrigewitsch, J. Obuck, M. Ochran, J. O’Connell, M. O’Connell, G. O’Connor, D. Oczkowski, M. Odo, P. O’Donnell, T. Oele, J. Oestreicher, H. Offet, I. Offor, E. Ofuya, L. O’Gallagher, J. Oganwu, O. Ogbodo, I. Ogbuke, A. Ogden, M. Ogden, M. Ogg, A. Ogilvie, D. Ogilvie, J. O’Grady, D. Ogren, B. Ogurian, J. Oh, T. Oh, T. Oickle, R. Okada, C. O’Keefe, E. O’Keefe, S. O’Keefe, L. Okemow, A. Okeynan, R. Oksanen, K. Okuszko, E. Okyere, F. Oladebo, P. Olaniyan, S. Olar, B. Olaski, M. Oldford, S. O’Leary, B. Olenik, D. Olesen, B. Olheiser, T. Olinek, D. Oliver, N. Oliver, A. Oliverio, C. Olivier, D. Ollenberger, S. Ollerhead, J. Ollikka, V. Olofernes, G. Oloumi, J. Olsen, K. Olsen, M. Olsen, R. Olsen, S. Olsen, C. Olson, D. Olson, J. Olson, V. Olson, W. Olson, K. Olszewski, O. Oluwole, M. Omosun, P. Onciul, D. O’Neil, D. Ong, K. Onuoha, P. Onyszko, C. Opper, C. Oragui, R. O’Regan, A. O’Reilly, M. O’Reilly, N. O’Reilly, M. Orosz, J. O’Rourke, L. Orpilla Jr, A. Orr, N. Orr, S. Orser, M. Ortega, P. Ortega, K. Orth, R. Osachoff, C. Osborne, J. Osborne, D. O’Shea, J. Oshman, D. Osinchuk, M. Osman, K. Osmond, T. Osmond, L. Osorio, H. Osorio Lobo, A. Ospino, B. Ostenberg, A. Ostrzenski, J. O’Sullivan, D. Oswald, J. Otis, J. O’Toole, G. Ott, C. Ottenbreit, L. Otteson, W. Otteson, J. Otto, T. Otway, T. Ouart, L. Ouch, D. Ouellette, J. Ouellette, S. Ouellette, E. Overbye, M. Overwater, A. Owsianicki, A. Oxford, M. Oxford, P. Oza, P. Ozar, A. Paananen, L. Paananen, J. Paarsmarkt, M. Pachan, F. Pacheco, M. Pacheco, D. Pacholok, S. Pacholok, T. Packard, J. Paddington, R. Padilla, T. Padron, M. Pady, S. Page, Q. Pagnucco, T. Pagura, G. Pahl, D. Pahljina, S. Paiement, K. Paige, R. Paine, K. Painter, J. Pak, V. Pak, A. Palani, C. Palchewich, B. Pallan, B. Palmer, D. Palmer, E. Palmer, J. Palmer, K. Palmer, L. Palmer, O. Palomino, A. Palou, J. Palsis, F. Pana, I. Panas, J. Panas, B. Panchal, V. Pandey, D. Pandher, S. Pandya, L. Pantazi, F. Pantilag, S. Panuganty, A. Papadoulis, M. Papcun, J. Papp, V. Papuga, P. Paquette, R. Paquette, L. Paquin, D. Paradis, E. Paradis, J. Paradis, T. Paradis, M. Paranjape, B. Parathundathil, G. Parchewsky, P. Parchure, M. Pardy, E. Parece, L. Paredes, B. Parent, B. Parenteau, C. Parenteau, J. Parenteau, L. Parillo, R. Parillo, B. Parker, D. Parker, J. Parker, D. Parlee, M. Parmar, C. Paron, B. Parsons, C. Parsons, G. Parsons, M. Parsons, S. Parsons, T. Parsons, W. Parsons, A. Partsch, K. Pascoe, J. Pashko, M. Pasichnuk, W. Pasko, J. Pasos, N. Pasowisty, E. Pastor, A. Patel, B. Patel, D. Patel, H. Patel, J. Patel, K. Patel, M. Patel, N. Patel, P. Patel, R. Patel, S. Patel, T. Patel, V. Patel, N. Pateliya, C. Pater, A. Paterson, H. Paterson, J. Paterson, B. Patey, D. Patey, I. Patey, J. Patey, M. Patey, T. Patey, J. Patience, P. Patil, K. Patmore, C. Paton, G. Paton, C. Patrie, E. Patten, B. Patterson, C. Patterson, J. Patterson, K. Patterson, W. Patterson, Z. Patterson, C. Pattinson, C. Paul, G. Paul, J. Paul, K. Paul, T. Paul, M. Paulgaard, E. Paulin, J. Paulsen, B. Paulson, B. Paulssen, B. Pauwels, D. Pavelick, M. Pavlic, M. Pavuluri, C. Pawlachuk, A. Pawlowich, M. Pawluk, C. Pay, C. Paylor, B. Payne, C. Payne, D. Payne, G. Payne, J. Payne, M. Payne, P. Payne, S. Payson, P. Pazienza, K. Peach, B. Peacock, E. Peacock, L. Peacock, D. Pearson, E. Pearson, J. Pearson, T. Peats, T. Peciulis, M. Peck, E. Peddle, D. Pedersen, J. Pedersen, K. Pedersen, P. Pedersen, S. Pedersen, B. Pederson, C. Pederson, L. Pederson, B. Peebles, J. Peeke, M. Peeke, R. Peel, D. Peet, K. Peeters, E. Pegg, C. Peifer, F. Pelayo, K. Pelayo, M. Pelkey, G. Pellegrino, D. Pelletier, M. Pelletier, T. Pelletier, I. Pelly, M. Pelypiw, D. Pemberton, L. Pena, Y. Peng, J. Penman, C. Pennell, T. Pennell, S. Pennemann, S. Penner, T. Penner, C. Penney, D. Penney, E. Penney, J. Penney, M. Penney, P. Penney, J. Penzo, I. Pepper, K. Pepper, D. Peramanu, S. Peramanu, R. Peraza, M. Perdue, C. Peregrym, M. Perehudoff, S. Perehudoff, J. Perepelecta, F. Perez, L. Perez, J. Perez-Licera, D. Perkins, M. Perkins, R. Perkins, S. Perkins, T. Perkins, J. Pernitsch, J. Peroramas, D. Perreault, N. Perron, B. Perry, C. Perry, D. Perry, G. Perry, J. Perry, O. Perry, R. Perry, S. Perry, V. Perry, T. Persaud, B. Persson, D. Perumal, B. Pesowski, P. Peter, D. Peters, G. Peters, J. Peters, K. Peters, M. Peters, R. Peters, E. Petersen, A. Peterson, B. Peterson, E. Peterson, J. Peterson, M. Peterson, S. Peterson, T. Peterson, C. Petkau, D. Petkau, B. Petkus, L. Petrillo, N. Petrola, R. Pettigrew, B. Pettipas, S. Pettit, D. Petz, A. Pewekar, K. Peyman, J. Peyton, K. Pfannmuller, R. Pfriem, L. Pham, L. Phan, B. Phillips, D. Phillips, J. Phillips, K. Phillips, L. Phillips, T. Phillips, D. Philp, B. Philpott, T. Philpott, Z. Philpott-Belzil, G. Phinney, M. Phippen, L. Phoenix, L. Picard, W. Picard, E. Picard-Goulet, K. Picco, J. Picken, K. Pickering, A. Pickersgill, P. Pickersgill, B. Piderman, D. Pierce, J. Piercey, S. Piercey, J. Pieroway, S. Pierzchala, A. Pietrusik, R. Pighin, J. Pihowich, J. Pike, P. Pilecki, B. Pilgrim, S. Pilgrim, T. Pilgrim, M. Pili, D. Pilisko, J. Piliszanski, R. Pillai, L. Pillaveethil, N. Pilote, J. Pilsner, G. Pimienta, C. Pinchak, M. Pineda, L. Pineda Perez, E. Pinituj-Flores, T. Pinksen, J. Pintaric, B. Pipa, J. Pipke, C. Pirnak, D. Pirvan, K. Pisio, M. Pitman, M. Pitre, A. Pittman, C. Pittman, D. Pittman, E. Pittman, I. Pittman, J. Pittman, M. Pittman, S. Pittman, W. Pittman, S. Pituka, M. Plamondon, R. Plamondon, E. Plante, J. Plata, D. Plepelic, I. Plesa, J. Plessis, G. Plews, N. Plouffe, S. Plouffe, T. Plouffe, J. Plowman, J. Plummer, I. Pocaterra, J. Pocock, S. Podhorodeski, A. Poetker, H. Poffenroth, D. Pohl, A. Poirier, D. Poirier, D. Poitras, J. Polacik, D. Pole, E. Poliquin, C. Pollard, R. Pollard, T. Pollard, T. Pollett, A. Pollock, J. Pollock, M. Pollock, J. Polsfut, M. Polujan, G. Pome Franco, S. Pon, M. Poncelet, D. Poncsak, B. Pond, D. Pond, J. Pond, B. Ponjevic, N. Ponkiya, H. Ponnurangan, T. Poole, K. Poon, G. Pope, T. Pope, C., J. Popoff, J. Popowich, M. Popowich, C. Portelance, J. Portelli, A. Porter, C. Porter, I. Porter, L. Porter, M. Posnikoff, P. Postlewaite, R. Postnikoff, N. Pothier, C. Potorti, M. Potorti, J. Potter, T. Potter, K. Potts, R. Potts, J. Poulin, R. Poulter, K. Pounall, I. Pouncey, C. Povse, C. Powell, D. Powell, J. Powell,
P. Powell, R. Powell, B. Power, C. Power, E. Power, J. Power, K. Power, L. Power, M. Power, P. Power, S. Power, T. Power, M. Prajapati, D. Prasad, G. Pratch, G. Prather, K. Pratt, R. Pratt, S. Pratt, L. Praud, W. Prawdzik, D. Prediger, M. Preece, J. Prefontaine, D. Preshyon, J. Preshyon, D. Presley, A. Preston, J. Preston, R. Preteau, A. Price, W. Price, J. Priest, D. Pringle, T. Prins, A. Pritchard, R. Pritchett, S. Pritchett, K. Proc, G. Prochner, K. Proctor, D. Procyshyn, M. Profiri, N. Proll, M. Pronk, J. Properzi, M. Prosper, D. Prostler, I. Proudfoot, D. Proulx, T. Prudhomme, S. Prud’Homme, C. Prybylski, C. Przybylski, S. Pshyk, Y. Puerto, J. Puhl, C. Pumphrey, M. Pumphrey, A. Punko, K. Pupneja, S. Pupneja, B. Purcell, S. Purchase, C. Purdy, J. Purdy, T. Purves, D. Pushak, S. Pushak, M. Pye, J. Pyke, R. Pyke, W. Pyne, F. Pynn, J. Pyper, A. Pyra, M. Qian, W. Qian, L. Qing, J. Qu, C. Quach, A. Quan, G. Quan, L. Quan, A. Quarin, R. Quartermain, K. Quaschnick, K. Quayle-Thomson, J. Quiba, D. Quigley, R. Quigley, S. Quigley, C. Quinlan, M. Quintin, G. Quinton, B. Quipp, S. Qureshi, J. Raban Mardelli, L. Rabbitt, J. Rabby, B. Rabusic, M. Raby, D. Rach, D. Rachkewich, D. Raciborski, W. Raczynski, L. Radesh, K. Radke, R. Radke, A. Radtke, M. Radu, J. Rae, R. Rae, I. Rafiyev, G. Raghavan Nair, J. Raher, A. Rahmani, M. Rahmani, P. Rai, J. Rainnie, M. Raistrick, A. Raivio, K. Raj, M. Raj, J. Rajotte, J. Ralph, P. Ralph, S. Raman, J. Ramazani, D. Ramburrun, D. Ramirez, J. Ramirez, M. Ramirez, P. Ramirez, R. Ramirez, C. Ramos, J. Ramsay, M. Ramsay, S. Ramsay, K. Ramsbottom, D. Randell, L. Randell, M. Randell, T. Randell, W. Randell, R. Rane, J. Rankin, M. Rankin, D. Ranola, J. Ransom, P. Rao, M. Raoufi, R. Raposo, S. Rasch, T. Rasheed, C. Rasko, K. Raskob-Smith, S. Rasmussen, R. Raso, H. Rassi, W. Ratcliffe, D. Rath, R. Rathburn, S. Ratkovic, M. Rattray, H. Ratzlaff, A. Rau, M. Rausch, B. Rawling, C. Rawson, W. Rawson, A. Ray, B. Ray, D. Ray, K. Ray, S. Ray, K. Rayment, D. Raymond, E. Rayner, J. Rayner, R. Rayner, M. Raza, K. Razniak, F. Re, B. Read, D. Read, W. Reashore, R. Reaume, C. Reber, D. Reber,

Canadian Natural 2020 Annual ReportT7
D. Rechenmacher, Y. Redda, G. Redding, B. Redlich, E. Redlon, J. Redmann, G. Reed, J. Reed, S. Reed, P. Regan, R. Reginato, C. Regnier, R. Regnier, P. Regular, H. Rehman, M. Rehman, B. Reid, C. Reid, D. Reid, E. Reid, G. Reid, J. Reid, K. Reid, M. Reid, R. Reid, T. Reid, D. Reilly, H. Reilly, S. Reilly, T. Reilly, D. Reimer, I. Reimer, M. Reinders, T. Reinders, J. Reiniger, T. Reiniger, M. Reinkens, E. Reis, R. Reis, G. Reiter, H. Reithaug, T. Reitsma, D. Rejman, D. Relkow, B. Relland, P. Rellosa, W. Remmer, C. Rempel, L. Rempel, P. Rempel, T. Rempel, L. Ren, S. Ren, R. Renaud, T. Renkema, A. Rennie, J. Rennie, L. Rennie, M. Reno, J. Rentar, J. Repchuk, S. Resus, C. Revereza, M. Rew, E. Reyes, O. Reyes, J. Reynolds, P. Reynolds, S. Reynolds, T. Reynolds, M. Rezkallah, D. Reznik, N. Rhemtulla, C. Rhode, I. Riach, G. Ricard, S. Ricci, D. Rice, J. Rice, R. Rice, C. Richard, J. Richard, K. Richard, M. Richard, B. Richards, C. Richards, D. Richards, G. Richards, H. Richards, A. Richardson, K. Richardson, T. Richardson, B. Riche, P. Richer, W. Ricker, C. Ricketson, A. Ricketts, M. Ricketts, W. Ricketts, R. Riddell, J. Riddle, J. Rideout, M. Rideout, R. Rideout, T. Rider, C. Riegling, C. Ries, W. Riewe, M. Rigg, A. Riley, D. Riley, S. Riley, D. Rimmer, D. Rinas, G. Ringheim, R. Rioux, S. Rioux, J. Ripka, P. Riseley, J. Risling, S. Risling, S. Ristic, L. Ritchat, D. Ritchie, R. Ritchie, D. Ritter, K. Ritter, A. Riutta, S. Rivard, E. Rivera, J. Rivera, O. Rizvi, M. Rizwan, T. Robb, N. Robbins, R. Roberge, A. Robert, C. Roberts, D. Roberts, J. Roberts, M. Roberts, G. Robertson, M. Robertson, P. Robertson, S. Robertson, K. Robertson-Baldwin, B. Robia, J. Robichaud, M. Robideau, H. Robillard, A. Robinson, B. Robinson, D. Robinson, G. Robinson, J. Robinson, K. Robinson, M. Robinson, N. Robinson, S. Robinson, T. Robinson, W. Robleto, C. Robson, S. Robson, A. Rocha, L. Roche, J. Rochemont, R. Rock, S. Rodberg, T. Rodgers, J. Rodriguez, M. Rodriguez, P. Roett, D. Rogal, K. Rogalsky, P. Rogatschnigg, C. Rogers, K. Rogers, S. Rogers, M. Rogne, M. Rogozinski, L. Rojas, S. Rolling, K. Rolseth, T. Rolseth, P. Roman, L. Romanchuk, T. Romanchuk, D. Romanyshyn, M. Rombough, A. Romero, G. Romero, J. Romero, S. Rommelaere, D. Rondeau, J. Roney, S. Roney, L. Rong, P. Ronnie, A. Rook, J. Rooney, M. Rooney, S. Roop, C. Root, A. Roozendaal, T. Rosciski, B. Rose, C. Rose, J. Rose, K. Rose, M. Rose, P. Rose, R. Rose, M. Rose-Atkins, R. Rosenthal, D. Rosgen, S. Roskey, M. Rosloot, T. Rosner, A. Ross, D. Ross, E. Ross, I. Ross, J. Ross, M. Ross, R. Ross, W. Ross, R. Rossburger, G. Rosser, G. Rosso, J. Rostad, B. Rosychuk, R. Rosychuk, B. Roszell, C. Roth, K. Roth, M. Roth, R. Roth, T. Roth, B. Rott, T. Rotzien, J. Rotzoll, S. Rouf, D. Rough, D. Roughton, N. Rouidi, J. Rouleau, A. Routhier, D. Routhier, R. Routhier, R. Routley, K. Row, A. Rowbottom, M. Rowe, S. Rowein, D. Rowley, M. Rowley, C. Rowsell, P. Rowsell, F. Roxas, A. Roy, B. Roy, D. Roy, R. Roy, S. Roy, D. Royston, Z. Ruda, V. Ruddy, D. Rudkevitch, K. Rudolf, C. Rudolph, K. Rudra, K. Ruecker, L. Ruesga, S. Ruether, D. Rueve, I. Rugg, M. Ruggles, M. Ruiz, S. Rumball, D. Rumbolt, T. Rumbolt, J. Rumjan, M. Rundle, J. Rusk, N. Rusk, T. Rusnak, C. Russell, D. Russell, E. Russell, J. Russell, P. Russell, S. Russell, T. Russell, R. Rustad, D. Rutberg, B. Rutherford, J. Rutherford, M. Rutherford, S. Rutherford, D. Rutley, M. Rutter, T. Ruttle, H. Rutz, N. Rvachew, F. Rwirangira, S. Ryali, J. Ryalls, A. Ryan, C. Ryan, D. Ryan, K. Ryan, M. Ryan, T. Ryan, S. Ryback, R. Rybchinsky, C. Ryder, D. Ryder, J. Ryll, C. Rymut, J. Saaedi, E. Saar, J. Saastad, R. Saastad, R. Sabas, M. Sabo, A. Sabourov, J. Sachs, F. Sackey-Forson, J. Sacrey, N. Sacrey, S. Sacrey, V. Sacrey, J. Saeed, J. Sagan, S. Sagrafena, A. Saha, K. Sahni, S. Sahoo, A. Saini, J. Sair, K. Saiyed, K. Sakowsky, R. Sakwattanapong, A. Salakunov, A. Salaudeen, A. Salazar, C. Salazar, D. Salazar, E. Salazar, N. Salazar, P. Salazar Misslin, A. Saleh, E. Saleh, O. Saleh, M. Salehi, J. Sali, M. Salman, E. Salmon, A. Salonga, S. Saltwater, B. Saluk, J. Salvador, R. Salyn, C. Salzl, A. Samadi, A. Samarathunge, S. Samida, M. Samimi, K. Samms, A. Samoisette, D. Sampang, J. Sampang, S. Sampanthamoorthy, A. Sampson, H. Sampson, J. Sampson, T. Sampson, B. Samson, R. Samson, T. Samuelson, S. Samy, V. Sanchala, E. Sanchez, M. Sanchez, R. Sanchez Hernandez, M. Sanders, P. Sanders, R. Sanders, T. Sanders, D. Sanderson, I. Sanderson, L. Sanderson, S. Sanderson, C. Sandford, S. Sandhar, N. Sandhawalia, G. Sando, T. Sanelli, N. Sanftleben, J. Sangha, E. Sangroniz, L. Sanoko, M.
Santarossa, T. Santos, M. Santucci, J. Sanyal, R. Sarabin, J. Sarai, A. Saran, S. Saran, R. Sarauskas, A. Sarawanski, M. Sarbah, D. Saretsky, D. Sargent, M. Saric, I. Sarjeant, S. Sarkar, D. Sarmiento, A. Saroop, A. Sartori, M. Sartoris, M. Sas, S. Sashuk, G. Sasidharan, B. Sather, T. Sather, M. Satra, H. Sattar, E. Saucier, J. Saucier, E. Saulnier, G. Saunders, L. Saunders, M. Saunders, S. Saurette, J. Savage, C. Savard, F. Savaria, B. Savla, D. Savoie, M. Savoie, C. Savostianik, A. Savtchenko, S. Sawchuk, B. Sawler, A. Saxena, D. Saxty, C. Sayer, R. Sayer, E. Sayewich, K. Sayko, K. Scagliarini, R. Scammell, J. Scarfe, J. Scarff, B. Scarth, R. Scarth, R. Schaap, T. Schable, K. Schachtel, B. Schade, D. Schaffer, B. Schamehorn, M. Schanzenbach, G. Schappert, T. Schatkoske, R. Schatschneider, C. Schaub, P. Schaub, J. Schechtel, J. Schedlosky, C. Scheerschmidt, A. Schell, S. Schell, S. Schellenberg, L. Schelske, L. Scheper, C. Scherger, C. Scheu, D. Schick, J. Schick, S. Schick, A. Schill, K. Schille, C. Schiller, J. Schiller, L. Schiller, A. Schindel, C. Schindel, R. Schlachter, G. Schlamp, M. Schlamp, D. Schledt, D. Schlosser, D. Schmaltz, L. Schmaus, S. Schmid, A. Schmidt, J. Schmidt, K. Schmidt, N. Schmidt, R. Schmidt, T. Schmidt, P. Schmuland, D. Schneider, G. Schneider, M. Schneider, P. Schneider, S. Schneider, K. Schnell, S. Schnell, C. Schnepf, A. Schnick, J. Schnieder, R. Schnieder, D. Schnitzler, C. Schnurer, J. Schoengut, E. Schofield, N. Schofield, S. Schofield, L. Schonhoffer, M. Schreiner, K. Schroeder, R. Schroeder, S. Schroeder, R. Schuh, N. Schuler, E. Schulte, C. Schultz, D. Schultz, J. Schultz, P. Schultz, S. Schultz, M. Schultze, T. Schulz, K. Schumacher, D. Schwank, R. Schwank, B. Schwartz, D. Schwarz, C. Schwenning, L. Schwetz, J. Schwindt, T. Scimia, R. Scoles, J. Scollard, C. Scott, D. Scott, E. Scott, G. Scott, J. Scott, K. Scott, M. Scott, R. Scott, S. Scott, R. Scoville, M. Scragg, J. Scribner, R. Scrimshaw, C. Scullion, S. Seabrook, M. Seafoot, K. Seaman, C. Sears, G. Seaton, T. Seaward, M. Sebastian, S. Sedghi, K. Seehagel, D. Seel, C. Seely, M. Seguin, L. Sehn, K. Seidel, P. Seipp, K. Seitz, R. Sekel, B. Sekulich, E. Sekura, D. Selby, K. Self, D. Selinger, M. Selman, R. Selvarajan, T. Semashkewich, A. Semchanka, L. Semeniuk, K. Seminchuk, R. Senecal, T. Senecal, T. Senger, P. Senk, T. Senner, H. Seo, F. Sepnio, A. Sequeira, C. Sereda, R. Sereda, B. Serfas, R. Serfas, P. Sergeant, J. Serino, E. Serniak, R. Serson, K. Setareh-Kokab, B. Severight, J. Seward, B. Sewell, C. Sexsmith, P. Sexton, S. Seyed Tarrah, G. Sgambaro, M. Sgambaro, R. Sgambaro, C. Shackleton, M. Shad, B. Shah, H. Shah, M. Shah, N. Shah, R. Shah, S. Shah, V. Shah, M. Shahebrahimi, S. Shahzad, S. Shaikh, K. Shakir, K. Shakotko, V. Shakouri, A. Shandroski, L. Shang, C. Shank, B. Shanmugam, J. Shannon, T. Shao, A. Sharifi, A. Sharma, D. Sharma, K. Sharma, R. Sharma, T. Sharma, M. Sharman, N. Sharp, J. Sharpe, K. Sharpe, T. Sharpe, R. Sharron, R. Shaver, B. Shaw, E. Shaw, K. Shaw, M. Shaw, R. Shaw, O. Shaykina, K. Shea, L. Shea, C. Shears, D. Sheaves, L. Sheaves, W. Sheaves, A. Shehata, K. Sheikh, M. Sheikh, O. Sheikh, C. Shen, B. Shenton, R. Shepel, I. Shepherd, C. Sheppard, D. Sheppard, G. Sheppard, J. Sheppard, M. Sheppard, P. Sheppard, R. Sheppard, T. Sheppard, A. Shergill, T. Sheridan, M. Sherman, R. Sherman, S. Sherman, A. Sherriffs, M. Sheth, N. Sheth, V. Shetty, C. Sheward, D. Shewchuk, L. Shi, A. Shideler, C. Shields, J. Shields, A. Shiers, N. Shihinski, S. Shiledarbaxi, K. Shill, C. Shimbashi, P. Shiner, W. Shipley, J. Shire, V. Shirhatti, B. Shmoury, B. Shmyr, M. Shobeiri, N. Shohel, R. Shonhiwa, S. Short, T. Short, D. Shortland, D. Shortreed, J. Shott, M. Shott, C. Shoup, S. Shravge, R. Shrestha, L. Shuai, M. Shukalov, T. Shukin, K. Shukla, D. Shular, J. Shumate, F. Shupenia, S. Shymoniak, D. Shypitka, J. Shysh, C. Sibeudu, I. Siddhanta, A. Siddiqui, M. Siddiqui, R. Sidloski, C. Sieben, D. Sieben, J. Sieben, E. Siemens, R. Siewert, A. Sifton, R. Sigsworth, J. Sikora, W. Sikorski, L. Silas, R. Silbernagel, T. Silbernagel, B. Silue, N. Silue, I. Silva, J. Silva, L. Silva, J. Silver, G. Silvis, C. Simard, D. Simard, K. Simard, R. Simard, D. Simbi, C. Simcock, G. Simmelink, T. Simmonds, J. Simmons, C. Simms, D. Simms, F. Simms, R. Simms, M. Simoes, A. Simon, P. Simon, T. Simon, R. Simper, G. Simpkins, C. Simpson, D. Simpson, G. Simpson, J. Simpson, L. Simpson, R. Simpson, S. Simpson, W. Simpson, C. Sims, D. Sinclair, E. Sinclair, R. Sinclair, S. Sinclair, D. Sine, A. Singh, H. Singh, K. Singh, S. Singh, Y. Singh, S. Singla, M. Sinkova-Hovdestad, A. Sinnett, B. Sinnicks, L. Sinnicks, R. Sison, J. Sjonnesen, D. Skanderup, W. Skaret, B. Skinner, T. Skinner, M. Skipper, J. Skjeie, G. Skoczek, J. Skog, Z. Skoko, M. Skolski, R. Skrepnek, S. Skulmoski, M. Skulski, J. Skwara, M. Skyrpan, M. Slavin, K. Slemko, D. Slemp, A. Sleno, A. Slipchuk, J. Sloan, M. Sloan, R. Sloan, R. Slobodian, K. Slotwinski, J. Sloychuk, S. Slywka, E. Smart, N. Smart, P. Smart, R. Smart, J. Smid, S. Smiegielski, C. Smillie, A. Smith, B. Smith, C. Smith, D. Smith, E. Smith, G. Smith, J. Smith, K. Smith, L. Smith, M. Smith, R. Smith, S. Smith, T. Smith, C. Smitham, L. Smollet, E. Smolyaninova, A. Smyl, R. Smyl, J. Sneddon, K. Snee, R. Snell, T. Snell, G. Snider, J. Snider, I. Snook, J. Snow, K. Snow, D. Snowdon, J. Snowdon, D. Snyder, J. Soar, J. Soenen, D. Sohlbach, D. Sokoloski, S. Solanki, J. Solano, J. Soley, V. Sollid, M. Sollows, S. Soloshy, A. Soloway, K. Soltys, L. Somerville, L. Sommer, R. Somorai, D. Soni, A. Sonpal, N. Soodyall, W. Sookram, M. Soolagallu, T. Sopatyk, G. Sopczak, H. Sorensen, R. Sorensen, C. Sorenson, L. Sorge, I. Soro, C. Sorochan, L. Sorochan, D. Soroko, L. Soucy, M. Soucy, R. Soucy, A. Soundararaj, L. Soutar, J. Southern, E. Spagrud, D. Spanics, M. Sparks, E. Spearman, B. Speedtsberg, G. Speer, D. Spencer, R.

T8Canadian Natural 2020 Annual Report
Spencer, S. Spencer, B. Spendiff, D. Spidell, K. Spiker, A. Spohn, M. Spreacker, M. Sprinkle, C. Spurr, A. Spurrell, E. Spurrell, N. Spurrell, P. Spurvey, R. Spychka, C. Spykerman, N. Squarek, J. Squire, C. Squires, P. Squires, T. Squires, R. Sran, A. Sriram, S. St. Croix, R. St. Jean, R. St. Martin, J. St. Onge, E. St. Pierre, M. St. Pierre, R. St. Pierre, L. Staats, A. Stacey, K. Stacey, I. Stacey-Salmon, P. Stackhouse, G. Stadnichuk, S. Stadnichuk, S. Stadnyk, D. Stagg, J. Stagg, K. Stagg, T. Stagg, M. Stainthorpe, K. Stairs, J. Stajkowski, M. Stalker, B. Stamp, R. Stamp, A. Stan, A. Standing, J. Stanford, C. Stang, M. Stang, R. Stang, R. Stanger, M. Stangl, J. Stanley, T. Stanley, A. Staples, J. Staples, P. Stapleton, K. Stark, L. Stark, R. Staruiala, R. Stasiuk, D. Staszewski, K. Staszkiewicz, S. Stauth, A. Stavropoulos, K. Stawinski, E. Stearns, M. Stebner, M. Stec, R. Steele, B. Steeves, L. Steeves, S. Stefan, T. Stefansson, A. Stefura, M. Stein, M. Steinbach, J. Steinkey, S. Steinkey, D. Stemmann, W. Stenhouse, G. Stephen, M. Stephens, T. Stephens, B. Stephenson, J. Stephenson, L. Stephenson, G. Stetar, G. Stevens, N. Stevens, R. Stevens, A. Stevens-Dicks, D. Stevens-Dicks, A. Stevenson, M. Stevenson, N. Stevenson, R. Stevenson, T. Stevers, C. Stewart, D. Stewart, J. Stewart, L. Stewart, M. Stewart, R. Stewart, T. Stewart, B. Stich, W. Stickel, R. Stieben, M. Stiefel, D. Stinn, M. St-Jacques, M. Stobart, D. Stobbe, J. Stober, M. Stockes, C. Stocking, M. Stockton, C. Stoddard, J. Stokes, T. Stokke, S. Stoller, C. Stolz, T. Stolz, D. Stone, M. Stone, T. Stone, M. Stordahl, J. Storey, D. Stormo, B. Stortz, D. Stout, R. Stoutenberg, D. Stoyles, S. Strachan, A. Stranaghan, R. Stranberg, C. Strand, W. Strand, J. Strandquist, C. Strang, R. Strang, D. Strankman, N. Strantz, B. Stratichuk, D. Stratmoen, M. Straughan, M. Street, S. Street, R. Stretch, W. Stretch, H. Strickland, R. Strickland, R. Striegler, J. Strilchuk, M. Stroh, J. Strong, R. Strong, M. Stronski, R. Struski, D. Strynadka, D. Stuart, L. Stuart, P. Stuart, C. Stubbs, G. Stuber, K. Stuckey, P. Stuckey, V. Stuckey, N. Stuckless, R. Stuckless, T. Stuckless, C. Study, J. Stuebing, G. Sturdy, F. Sturge, J. Sturge, P. Sturge, J. Sturgeon, P. Sturgeon, D. Sturrock, A. Styles, L. Su, W. Su, M. Suarez, V. Subasic, I. Subasinghe, V. Subban, J. Subramaniam, R. Subramaniam, B. Suchan, A. Suhel, R. Sukkel, J. Sukoveoff, J. Sullivan, M. Sullivan, R. Sullivan, T. Sullivan, P. Sultanian, B. Summerfelt, C. Summers, D. Summers, E. Summers, E. Sumner, T. Sun, X. Sun, U. Sundar, U. Sundaram, P. Sundaravadivelu, C. Surgenor, A. Surugiu, G. Surugiu, L. Sutcliffe, T. Sutcliffe, C. Sutherland, D. Sutherland, K. Sutherland, L. Sutherland, B. Sutton, P. Sutton, S. Sverdahl, T. Svoboda, A. Swain, D. Swain, S. Swain, T. Swallow, D. Swan, M. Swan, J. Swannack, C. Swanson, J. Swanson, N. Swanson, R. Swarnkar, E. Sweeney, S. Sweetapple, C. Swenarchuk, N. Swennumson, E. Switzer, A. Sychak, K. Sydorko, D. Syed, W. Syed, J. Sykes, T. Sylvester, D. Sylvestre, B. Symington, A. Symons, M. Symons, D. Syrnyk, G. Sywake, N. Szalay, E. Szeto, C. Szmata, A. Szoke, C. Szpecht, D. Sztukowski, D. Sztym, S. Szubzda, M. Szucs, C. Szutiak, K. Szydlik, J. Ta, C. Tacadena, M. Tade, D. Taggart, A. Taghipour, P. Taiani, M. Tainsh, D. Tainton, D. Tait, G. Tait, O. Tait, J. Taite, A. Tajik, D. Tajiri, S. Takala, G. Talati, S. Talati, C. Talbot, J. Talbot, M. Talerico, C. Tallack, D. Tallas, B. Talma, K. Tam, B. Tamas, B. Tan, C. Tan, K. Tan, S. Tan, M. Tanasescu, B. Tancowny, L. Tang, X. Tang, T. Tanigami, M. Tapley, G. Tapp, C. Tarache, A. Tarasenco, R. Tarasoff, C. Tardif, G. Tarditi, B. Tarkowski, M. Taron, D. Tarrant, B. Tasek, J. Tatarin, R. Tatro, N. Tavassoli, A. Taylor, B. Taylor, C. Taylor, H. Taylor, J. Taylor, K. Taylor, L. Taylor, M. Taylor, N. Taylor, P. Taylor, R. Taylor, S. Taylor, W. Taylor, J. Taylor-Kay, M. Teeple, A. Tegnander, P. Teha, J. Teixeira, S. Tejpar, A. Telan, M. Teleptean, R. Tellier, B. Temesgen, J. Temple, C. Templeton, S. Tenhunen, L. Tennant, K. Tenney, J. Teppin, G. Teske, A. Teslak, L. Tessier, W. Teszeri, W. Tetachuk, C. Tetreau, J. Tettensor, B. Tetz, J. Tetz, S. Tetz, F. Thaddaues, L. Thai, T. Tham, P. Thannhauser, J. Thauberger, J. Theis, S. Theoret, G. Theriault, B. Thevarajah, W. Thew, R. Thibodeau, C. Thiessen, J. Thiessen, R. Thiessen, T. Thiessen, M. Thoen, D. Thomas, E. Thomas, L. Thomas, M. Thomas, S. Thomas, J. Thomas Cotton, T. Thomassen, G. Thomlison, A. Thompson, C. Thompson, E. Thompson, I. Thompson, J. Thompson, K. Thompson, L. Thompson, R. Thompson, S. Thompson, T. Thompson, J. Thomsen, P. Thomsen, A. Thomson, J. Thomson, K. Thomson, P. Thomson, S. Thomson, T. Thomson, W. Thomson, K. Thorburn, T. Thorburne, L. Thorhaug, J. Thorleifson, B. Thorn, D. Thorne, L. Thorne, B. Thornhill, E. Thornton, K. Thornton, N. Thorp, K. Thors, K. Threndyle, E. Thunaes, D. Thurman, M. Thyer, T. Tian, M. Tiedje, P. Tieu, B. Tiffin, T. Tilbury, D. Tillapaugh, J. Tiller, D. Tilley, M. Tilley, K. Tillotson, T. Tillotson, S. Timothy, N. Tindall, M. Tineo, D. Tipper, B. Titus, D. Tiwary, R. Tiwary, C. Tkach, B. Tobin, C. Tobin, K. Tobin, V. Tobin, K. Tobler, B. Todd, C. Todd, S. Todd, T. Tolen, D. Tomar, B. Tomchuk, G. Tomchuk, D. Tomiuk, C. Tomlinson, M. Tompkins, A. Tomszak, N. Tomte, W. Tong, M. Tonon, S. Tookey, A. Toop, V. Topacio, S. Topolnitsky, K. Tordon, P. Torrance, C. Torraville, F. Torraville, J. Torraville, N. Torres, D. Toth, D. Touchette, S. Touchette, D. Toullelan, T. Tourand, M. Townsend, O. Tozser, A. Tran, C. Tran, D. Tran, J. Tran, M. Trang, C. Trapp, G. Trask, L. Trautman, M. Travers, P. Traverse, J. Tredger, G. Treen, J. Treen, J. Trelinski, W. Trelinski, J. Treliving, L. Tremblay, M. Tremblay, C. Tremblett, W. Tremblett, J. Trenholm, J. Trieu, J. Trieu-Ly, W. Trigger, A. Trinh, D. Trinh, J. Trinier, E. Triumbari, C. Troake, P. Troy, J. Trto, J. Trudeau, R. Trudeau, F. Truefitt, B. Trumpf, A. Truong, H. Truong, S. Truong, H. Tsagalas, L. Tsaprailis, C. Tse, Y. Tse, G. Tsemenko, M. Tsineli, D. Tsui, Y. Tu, A. Tuck, B. Tucker, D. Tucker, J. Tucker, R. Tucker, R. Tuerke, A. Tuico, D. Tuite, S. Tulan, B. Tulk, J. Tulk, B. Tulloch, N. Tulloch, B. Tumbach, P. Tung, M. Tunke, T. Tupper, T. Turbide, J. Turcotte, T. Turgeon, B. Turner, C. Turner, D. Turner, J. Turner, P. Turner, S. Turner, D. Turpin, T. Turpin, V. Turska, S. Turton, R. Tuttle, I. Tutto, L. Tuttosi, J. Tweten, P. Twomey, D. Twyne, O. Tyan, A. Tyler, M. Tyler, D. Tymchyna, R. Tymchyna, N. Tynan, C. Tyssen, J. Uddin, S. Udupa, T. Uhrich, S. Ulloa, J. Ulmer, C. Ulrich, E. Ulrich, J. Umali, O. Umana, U. Umoh, A. Umpleby, L. Underhill, K. Underwood, N. Underwood, R. Underwood, T. Ung, B. Unrath, L. Unrau, H. Unruh, P. Unruh, M. Upadhyay, S. Upadhyay, U. Upadhyaya, C. Upham, M. Uponi, D. Urban, L. Urbina, J. Urdaneta, C. Urlacher, A. Ustariz, P. Uwabor, K. Uyanwune, R. Vachon, S. Vadnai, K. Vaideswaran, M. Vajdik, V. Vajihinejad, G. Valencia, A. Valentine, D. Valin, T. Valin, A. Valiquette, G. Valiquette, J. Valle, L. Vallee, M. Vallee, W. Vallee, G. Vallis, A. Valmadrid, K. Van Buskirk, C. Van de Reep, W. Van den Oever, M. van der Burgh, N. Van Der Merwe, A. Van Donkervoort, H. Van Dyck, M. Van Dyk, B. van Dyke, N. Van Dyke, P. van Eerde, D. Van Genne, L. Van Genne, L. van Heerden, J. Van Nes, C. van Niekerk, F. Van Overloop, S. Van Rensburg, C. Van Rooijen, D. Van Rootselaar, C. Van Schoor, K. van Son, R. Van Steinburg, R. van Zanden, M. Vanberg, D. Vanbocquestal, J. Vancoughnett, K. Vandaelle, J. Vandeligt, R. Vandemark, T. Vandemark, D. Vandenberg, G. Vander Veen, N. Vandergriend, J. Vanderkley, T. Vandermeer, A. Vandersalm, J. Vandervoort, E. Vanopian, G. van’t Wout, L. Varela Avendano, S. Varey, M. Varga, D. Varty, N. Vaschetto, A. Vashisht, A. Vasquez, C. Vasquez, M. Vasquez-Placid, J. Vasseur, R. Vassov, R. Vaudan, A. Vaughan, N. Vaughan, O. Vedmedenko, F. Veenbaas, S. Vekved, B. Velagapudi, B. Velichka, M. Velmurugan, R. Veloso, R. Veneracion, S. Venkatesh, G. Venkateshvaralu, R. Venn, D. Venning, J. Vera, L. Verbaas, D. Verbeek, D. Verbicky, M. Verburg, A. Verge, J. Verge, M. Verge, B. Verhoeven, K. Vernon, S. Veroba, J. Verot, B. Verreau, D. Versnick-Brown, S. Vetsch, K. Veysey, J. Vezina, C. Viana, G. Vibert, J. Vicic, N. Vick, D. Vickery, G. Viljoen, R. Villanueva, J. Villemaire, M. Villemaire, C. Villemere, K. Vincent, R. Vincent, R. Vindevoghel, S. Vineham, B. Viney, R. Vinkle, G. Virus, K. Virus, A. Visotto, R. Vivian, N. Vizcuna Alvarado, R. Vloet, S. Voight, B. Volkmann, R. Volkmann, J. Vollman, W. Volschenk, L. Vondermuhll, A. Vosburgh, A. Votta, A. Vredegoor, J. Vrolson, N. Vucic, L. Vuong, Q. Vuong, G. Wack, E. Waddell, T. Waddell, K. Waddy, J. Wade, W. Wade, T. Wagil, C. Wagner, D. Wagner, G. Wagner, J. Wagner, K. Wagner, N. Wagner, M. Wahl, D. Wakaruk, L. Wakaruk, L. Wakefield, T. Wakulchyk, A. Walchuk, D. Waldner, K. Waldron, A. Walintschek, C. Walker, D. Walker, G. Walker, J. Walker, K. Walker, R. Walker, S. Walker, T. Walker, K. Walko, D. Wall, S. Wall, A. Wallace, C. Wallace, D. Wallace, E. Wallace, H. Wallace, K. Wallace, V. Wallace, M. Wallis, V. Wallwork, T. Walraven, A. Walsh, B. Walsh, E. Walsh, M. Walsh, P. Walsh, R. Walsh, S. Walsh, T. Walsh, W. Walsh, L. Walter, A. Walters, D. Walters, J. Walters, I. Walton, K. Wambolt, N. Wan, D. Wanchuk, C. Wang, H. Wang, J. Wang, L. Wang, R. Wang, S. Wang, T. Wang, W. Wang, X. Wang, Y. Wang, Z. Wang, B. Wangler, D. Wannas, S. Waquan, T. Warburton, E. Ward, K. Ward, R. Ward, B. Warehime, D. Warford, W. Warholik, J. Waring, C. Wark, W. Warman, F. Warraich, G. Warren, J. Warren, K. Warren, R. Warren, S. Warren, D. Warrington, M. Warsame, K. Warwaruk, J. Washburn, M. Washington, A. Wasikowski, P. Wassell, C. Wasylciw, W. Wasylucha, D. Waterfield, C. Waters, D. Watson, G. Watson, J. Watson, K. Watson, M. Watson, S. Watson, D. Watt, G. Watt, B. Watton, B. Watts, J. Watts, T. Wawro, B. Weatherby, D. Weatherby, C. Weatherhead, H. Weaver, A. Webb, G. Webb, P. Webb, R. Webb, B. Webber, D. Webber, J. Webber, O. Websdale, K. Webster, D. Weed, E. Weening, E. Weenink, B. Wegenast, B. Wei, Z. Wei, J. Weibrecht, J. Weigl, J. Weik, D. Weimer, C. Weingarten, R. Weir, G. Weisbeck, R. Weisbrot, M. Weishaar, C. Weiss, J. Weller, P. Weller, B. Wellman, M. Wellman, A. Wells, C. Wells, D. Wells, E. Wells, L. Wells, N. Wells, R. Wells, T. Wells, A. Welsh, W. Welte, W. Welygan, Z. Wen, G. Weng, P. Wenger, J. Wenisch, G. Wennberg, P. Wennerstrom, A. Wentworth, J. Wentworth, K. Wenzel, D. Werbowy, C. Werner, N. Wert, B. Weslake, E. Wessel, D. West, R. West, M. Westad, D. Westbrook, K. Westland, B. Wetthuhn, D. Wheating, L. Wheating, J. Wheaton, S. Wheaton, A. Wheeler, B. Wheeler, C. Wheeler, J. Wheeler, K. Wheeler, L. Wheeler, N. Wheeler, C. Whelan, D. Whelan, K. Whelan, R. Whelan, R. Whelan-Maloney, A. White, B. White, D. White, F. White, H. White, J. White, M. White, P. White, R. White, S. White, T. White, Z. White, J. Whitehead, L. Whitehead, V. Whitehead, D. Whitehouse, K. Whiteknife, N. Whiteknife, J. Whitelaw, A. Whiteside, C. Whitford, R. Whitman, H. Whitmore, K. Whitney, M. Whittaker, A. Whitten, H. Whitten, D. Whitty, A. Whitwell, K. Wickenhauser, A. Wickins, C. Wickwire, G. Wideman, M. Widing, A. Wiebe, D. Wiebe, M. Wiebe, N. Wiebe, T. Wiebe, D. Wiege, T. Wielgus, B. Wiesener, C. Wietzel, Z. Wigglesworth, S. Wight, T. Wight, D. Wijesingha, C. Wilbee, D. Wilbee, A. Wilcott, J. Wilcox, M. Wilcox, D. Wilde, E. Wildeman, D. Wiles, R. Wiles, C. Wilk, T. Wilk, C. Wilkes, N. Wilkes, D. Wilkins, J. Wilkinson, K. Wilkinson, P. Will, D. Willard, E. Willard, B. Willburn, A. Willcott, B. Willcott, J. Willems, R. Willey, A. Williams, B. Williams, C. Williams, G. Williams, M. Williams, N. Williams, R. Williams, T. Williams, W. Williams, C. Williamson, D. Williamson, J. Williamson, K. Williamson, M. Williamson, J. Willick, M. Willis, R. Willis, S. Williscroft, J. Williston, D. Willms, S. Wills, G. Willshire, C. Willson, D. Willson, M. Wilschut, A. Wilson, C. Wilson, D. Wilson, G. Wilson, H. Wilson, J. Wilson, K. Wilson, L. Wilson, M. Wilson, S. Wilson, W. Wilson, J. Wiltshire, A. Winfield, P. Winfield, B. Wingate, A. Wingert, J. Winia, B. Winiarz, I. Winland, R. Winnicky, L. Winquist, T. Winquist, R. Winslow, J. Winsor, O. Winsor, T. Winter, C. Winterhalt, G. Winters, R. Winters, G. Wirachowsky, J. Wirachowsky, M. Wiseman, P. Wiseman, W. Wiseman, I. Wishart, M. Witmer, Z. Witt, B. Wittenborn, C. Wlad, A. Wlos, M. Woehleke, D. Woitas, J. Woitas, T. Woitte, R. Wojtowicz, S. Wolf, D. Wolfe, J. Wolfe, D. Wollum, C. Woloshyn, J. Wolstenholme, B. Wolstoncroft, J. Wolter, R. Wolters, A. Wong, C. Wong, G. Wong, J. Wong, K. Wong, L. Wong, N. Wong, C. Woo, J. Woo, L. Woo, A. Wood, G. Wood, L. Wood, P. Wood, R. Woodburne, J. Woodd, M. Woodfin, S. Woodfine, N. Woodford, S. Woodford, T. Woodford, A. Woodger, C. Woodhead, M. Woodhead, D. Woods, J. Woods, T. Woods, M. Woodske, J. Wooldridge, B. Wooley, S. Woolfitt, T. Woolley, R. Woolner, R. Wootton, M. Workman, M. Workun, M. Woroniuk, B. Worthington, C. Worthman, J. Wotten, B. Woytenko, K. Woytiuk, T. Wozney, C. Wright, L. Wright, R. Wright, G. Wrinn, B. Wu, C. Wu, D. Wu, H. Wu, J. Wu, M. Wu, P. Wuorinen, B. Wurzer, K. Wutzke, E. Wylie, G. Wyman, G. Wyndham, D. Wyshynski, L. Wysocki, S. Wytrychowski, Y. Xia, Y. Xiao, Y. Xie, H. Xu, J. Xu, Q. Xu, Z. Xu, M. Xue, D. Yackel, K. Yakemchuk, K. Yakimowich, L. Yakiwchuk, J. Yamniuk, P. Yan, D. Yang, L. Yang, D. Yanke, G. Yanota, K. Yao, L. Yao, W. Yao, H. Yare, A. Yaremko, R. Yarmuch, J. Yaroslawsky, S. Yasin, M. Yaychuk, P. Yazdani, B. Ye, P. Yeboah, B. Yeboue, B. Yee, G. Yee, R. Yee, C. Yen, D. Yep, P. Yepes, J. Yeremiy, J. Yeske, A. Yevtushenko, C. Ying, O. Ying, Y. Ying, J. Yip, K. Yip, L. Yip, F. Yohannes, R. Yong, J. Yoo, F. York, P. York, A. Yoshikawa, X. You, M. Youell, B. Young, D. Young, E. Young, J. Young, L. Young, M. Young, P. Young, S. Young, T. Young, N. Younis, P. Youssef, R. Yowney, E. Yu, G. Yu, J. Yu, M. Yu, C. Yuen, D. Yuill, J. Yuill, R. Yuristy, S. Yuzyk, R. Zabek, A. Zabloski, A. Zacharias, C. Zacharias, T. Zachoda, C. Zackowski, J. Zaderey, N. Zaderey, B. Zagoruy, S. Zagozewski, E. Zahacy, B. Zaitsoff, S. Zakeri, R. Zamudio Baca, B. Zandstra, D. Zanoni, C. Zaparyniuk, S. Zardynezhad, D. Zarowny, G. Zarowny, K. Zarowny, M. Zarowny, Z. Zarowny, S. Zawada, K. Zayac, D. Zazula, R. Zazula, S. Zbrodoff, K. Zeer, T. Zeiser, I. Zelazny, D. Zelman, B. Zembik, D. Zemlak, A. Zenide, W. Zeniuk, G. Zeran, K. Zern, J. Zerpa, K. Zerr, M. Zerr, S. Zgurski, B. Zhang, J. Zhang, M. Zhang, Q. Zhang, W. Zhang, X. Zhang, Y. Zhang, Z. Zhang, B. Zhao, L. Zhao, R. Zhao, G. Zheng, S. Zheng, W. Zheng, H. Zhou, Q. Zhou, Y. Zhou, J. Zhu, L. Zhu, W. Zhu, E. Zhuromsky, P. Zia, S. Ziadeh, C. Ziebart, K. Zielinski, A. Zielke, D. Zilinski, E. Zimmer, C. Zimmerman, R. Zoerb, A. Zoglauer, L. Zseder, J. Zuk, S. Zukanovic, N. Zukiwski, S. Zukowski, S. Zwyer, S. Zyha.

Canadian Natural 2020 Annual Report 5
2020 Year-End ReservesDETERMINATION OF RESERVES
For the year ended December 31, 2020, the Company retained Independent Qualified Reserves Evaluators (IQREs), Sproule Associates Limited, Sproule International Limited and GLJ Ltd., to evaluate and review all of the Company’s proved and proved plus probable reserves. The evaluation and review was conducted and prepared in accordance with the standards contained in the Canadian Oil and Gas Evaluation Handbook. The reserves disclosure is presented in accordance with NI 51-101 requirements using forecast prices and escalated costs.
The Reserves Committee of the Company’s Board of Directors has met with and carried out independent due diligence procedures with the IQREs as to the Company’s reserves.
Additional reserves information is disclosed in the Company’s Annual Information Form.
RESERVES INFORMATION HIGHLIGHTS ■ Canadian Natural’s crude oil, SCO, bitumen, natural gas and NGL reserves were evaluated and reviewed by Independent
Qualified Reserves Evaluators. The following highlights are based on the Company’s reserves using forecast prices and costs at December 31, 2020 (all reserves values are Company Gross unless stated otherwise).
■ Total proved reserves increased 10% to 12.106 billion BOE with reserves additions and revisions of 1.538 billion BOE. Total proved plus probable reserves increased 12% to 15.925 billion BOE with reserves additions and revisions of 2.099 billion BOE. • The strength and depth of the Company’s assets are evident as approximately 80% of total proved reserves are long
life low decline. This results in a total proved BOE reserves life index of 29.8 years and a total proved plus probable BOE reserves life index of 39.2 years.
– Additionally, high value, zero decline, SCO is approximately 58% of total proved reserves with a reserve life index of approximately 45 years.
■ Canadian Natural’s 2020 performance has once again consistently delivered superior finding and development costs: • Finding, Development and Acquisition (“FD&A”) costs, excluding changes in Future Development Cost (“FDC”), are
$1.91/BOE for total proved reserves and $1.40/BOE for total proved plus probable reserves. • FD&A costs, including changes in FDC, are $4.46/BOE for total proved reserves and $3.46/BOE for total proved plus
probable reserves.
■ Total proved reserves additions and revisions replaced 2020 production by 361%. Total proved plus probable reserves additions and revisions replaced 2020 production by 493%.
■ Proved developed producing reserves additions and revisions are 1.032 billion BOE, replacing 2020 production by 242%. The proved developed producing BOE reserves life index is 21.2 years.
■ The net present value of future net revenues, before income tax, discounted at 10%, is $80.7 billion for total proved reserves, $98.0 billion for total proved plus probable reserves and $61.4 billion for proved developed producing reserves.

6Canadian Natural 2020 Annual Report
Summary of Company Gross ReservesAs of December 31, 2020 Forecast Prices and Costs
Light and Medium
Crude Oil
Primary Heavy
Crude Oil
Pelican Lake
Heavy Crude Oil
Bitumen (Thermal
Oil)Synthetic Crude Oil
Natural Gas
Natural Gas
Liquids
Barrels of Oil
Equivalent(MMbbl) (MMbbl) (MMbbl) (MMbbl) (MMbbl) (Bcf) (MMbbl) (MMBOE)
Total Company
Proved
Developed Producing 142 81 216 580 6,870 3,725 98 8,607
Developed Non-Producing 24 12 — 27 — 264 4 111
Undeveloped 149 84 49 1,876 92 5,476 225 3,388
Total Proved 315 177 265 2,483 6,962 9,465 326 12,106
Probable 148 82 130 1,674 534 6,457 174 3,819
Total Proved plus Probable 463 260 395 4,157 7,496 15,922 500 15,925
Reconciliation of Company Gross ReservesAs of December 31, 2020 Forecast Prices and Costs
TOTAL PROVED Light and Medium
Crude Oil
Primary Heavy
Crude Oil
Pelican Lake
Heavy Crude Oil
Bitumen (Thermal
Oil)Synthetic Crude Oil
Natural Gas
Natural Gas
Liquids
Barrels of Oil
Equivalent(MMbbl) (MMbbl) (MMbbl) (MMbbl) (MMbbl) (Bcf) (MMbbl) (MMBOE)
Total CompanyDecember 31, 2019 357 202 293 2,438 6,352 6,460 275 10,993Discoveries — — — — — — — —Extensions 2 — — 17 720 226 11 787Infill Drilling 3 3 — — — 290 13 66Improved Recovery — — — 73 — — — 73Acquisitions 1 — — — — 2,932 31 521Dispositions — — — — — (4) — (1)Economic Factors (20) (10) (13) — — (197) (8) (83)Technical Revisions 4 8 6 45 43 297 19 175Production (31) (26) (21) (91) (153) (541) (15) (426)December 31, 2020 315 177 265 2,483 6,962 9,465 326 12,106
TOTAL PROVED PLUS PROBABLE
Light and Medium
Crude Oil
Primary Heavy
Crude Oil
Pelican Lake
Heavy Crude Oil
Bitumen (Thermal
Oil)Synthetic Crude Oil
Natural Gas
Natural Gas
Liquids
Barrels of Oil
Equivalent(MMbbl) (MMbbl) (MMbbl) (MMbbl) (MMbbl) (Bcf) (MMbbl) (MMBOE)
Total CompanyDecember 31, 2019 519 293 425 4,108 6,897 9,607 408 14,252Discoveries — — — — — — — —Extensions 3 1 — 21 717 374 20 825Infill Drilling 4 4 — — — 384 17 88Improved Recovery — — — 106 — — — 106Acquisitions 1 — — — — 6,238 62 1,102Dispositions — — — — — (5) — (1)Economic Factors (18) (13) (5) — — (249) (9) (86)Technical Revisions (15) 1 (4) 13 34 113 17 65Production (31) (26) (21) (91) (153) (541) (15) (426)December 31, 2020 463 260 395 4,157 7,496 15,922 500 15,925

Canadian Natural 2020 Annual Report 7
NOTES TO RESERVES:
1. Company Gross reserves are working interest share before deduction of royalties and excluding any royalty interests.
2. Information in the reserves data tables may not add due to rounding. BOE values and oil and gas metrics may not calculate exactly due to rounding.
3. Forecast pricing assumptions utilized by the Independent Qualified Reserves Evaluators in the reserves estimates were provided by Sproule Associates Limited:
2021 2022 2023 2024 2025
Crude oil and NGL
WTI US$/bbl 46.00 48.00 53.00 54.06 55.14
WCS C$/bbl 43.51 46.10 52.60 53.65 54.72
Canadian Light Sweet C$/bbl 54.55 57.14 63.64 64.91 66.21
Cromer LSB C$/bbl 54.55 56.64 62.64 63.89 65.17
Edmonton C5+ C$/bbl 55.84 58.40 64.82 66.11 67.44
Brent US$/bbl 48.00 50.00 55.00 56.10 57.22
Natural gas
AECO C$/MMBtu 2.86 2.78 2.69 2.75 2.80
BC Westcoast Station 2 C$/MMBtu 2.76 2.68 2.59 2.64 2.69
Henry Hub US$/MMBtu 3.00 3.00 3.00 3.06 3.12
All prices increase at a rate of 2%/year after 2025.
A foreign exchange rate of 0.7700 US$/C$ for 2021 and 0.7700 US$/C$ after 2021 was used in the year-end 2020 evaluation.
4. A barrel of oil equivalent (“BOE”) is derived by converting six thousand cubic feet of natural gas to one barrel of crude oil (6 Mcf:1 bbl). This conversion may be misleading, particularly if used in isolation, since the 6 Mcf:1 bbl ratio is based on an energy equivalency conversion method primarily applicable at the burner tip and does not represent a value equivalency at the wellhead. In comparing the value ratio using current crude oil prices relative to natural gas prices, the 6 Mcf:1 bbl conversion ratio may be misleading as an indication of value.
5. Oil and gas metrics included herein are commonly used in the crude oil and natural gas industry and are determined by Canadian Natural as set out in the notes below. These metrics do not have standardized meanings and may not be comparable to similar measures presented by other companies and may be misleading when making comparisons. Management uses these metrics to evaluate Canadian Natural’s performance over time. However, such measures are not reliable indicators of Canadian Natural’s future performance and future performance may vary.
6. Reserves additions and revisions are comprised of all categories of Company Gross reserves changes, exclusive of production.
7. Reserves replacement or Production replacement ratio is the Company Gross reserves additions and revisions, for the relevant reserves category, divided by the Company Gross production in the same period.
8. Reserves Life Index is based on the amount for the relevant reserves category divided by the 2021 proved developed producing production forecast prepared by the Independent Qualified Reserves Evaluators.
9. Finding, Development and Acquisition (“FD&A”) costs excluding changes in Future Development Costs (“FDC”) are calculated by dividing the sum of total exploration, development and acquisition capital costs incurred in 2020 by the sum of total additions and revisions for the relevant reserves category.
10. FD&A costs including changes in FDC are calculated by dividing the sum of total exploration, development and acquisition capital costs incurred in 2020 and net changes in FDC from December 31, 2019 to December 31, 2020 by the sum of total additions and revisions for the relevant reserves category. FDC excludes all abandonment, decommissioning and reclamation costs.
11. Abandonment, decommissioning and reclamation (“ADR”) costs included in the calculation of the Future Net Revenue (FNR) consist of both the Company’s total Asset Retirement Obligation (“ARO”), before inflation and discounting, for development existing as at December 31, 2020 and forecast estimates of ADR costs attributable to future development activity.

8Canadian Natural 2020 Annual Report
Management’s Discussion and Analysis
Table of ContentsDefinitions and Abbreviations 9
Advisory 10
Objectives and Strategy 12
Financial and Operational Highlights 13
Business Environment 18
Analysis of Changes in Product Sales 20
Daily Production 21
Exploration and Production 23
Oil Sands Mining and Upgrading 27
Midstream and Refining 28
Corporate and Other 29
Net Capital Expenditures 32
Liquidity and Capital Resources 34
Commitments and Contingencies 36
Reserves 37
Risks and Uncertainties 38
Environment 39
Accounting Policies and Standards 42
Control Environment 44
Outlook 45
Other 45

Canadian Natural 2020 Annual Report 9
Definitions and Abbreviations
AECO Alberta natural gas reference location
AIF Annual Information Form
AOSP Athabasca Oil Sands Project
API specific gravity measured in degrees on the American Petroleum Institute scale
ARO asset retirement obligations
bbl barrel
bbl/d barrels per day
Bcf billion cubic feet
Bcf/d billion cubic feet per dayBitumen a naturally occurring solid or semi-solid
hydrocarbon consisting mainly of heavier hydrocarbons that are too heavy or thick to flow at reservoir conditions, and recoverable at economic rates using thermal in situ recovery methods
BOE barrels of oil equivalent
BOE/d barrels of oil equivalent per day
Brent Dated Brent
C$ Canadian dollars
CAGR compound annual growth rate
CAPEX capital expenditures
CO2 carbon dioxide
CO2e carbon dioxide equivalentsCrude oil includes light and medium crude oil,
primary heavy crude oil, Pelican Lake heavy crude oil, bitumen (thermal oil), and synthetic crude oil
CSS Cyclic Steam Stimulation
EOR Enhanced Oil Recovery
E&P Exploration and Production
FASB Financial Accounting Standards BoardFPSO Floating Production, Storage and
Offloading Vessel
GHG greenhouse gas
GJ gigajoules
GJ/d gigajoules per day
Horizon Horizon Oil Sands
IASB International Accounting Standards Board
IFRS International Financial Reporting Standards
LIBOR London Interbank Offered Rate
Mbbl thousand barrels
Mbbl/d thousand barrels per day
MBOE thousand barrels of oil equivalent
MBOE/d thousand barrels of oil equivalent per day
Mcf thousand cubic feet
Mcfe thousand cubic feet equivalent
Mcf/d thousand cubic feet per day
MMbbl million barrels
MMBOE million barrels of oil equivalent
MMBtu million British thermal units
MMcf million cubic feet
MMcf/d million cubic feet per day
NGLs natural gas liquids
NWRP North West Redwater Partnership
NYMEX New York Mercantile Exchange
NYSE New York Stock Exchange
OPEC+ Organization of the Petroleum Exporting Countries Plus
PRT Petroleum Revenue Tax
SAGD Steam-Assisted Gravity Drainage
SCO synthetic crude oil
SEC United States Securities and Exchange Commission
Tcf trillion cubic feet
TSX Toronto Stock Exchange
UK United Kingdom
US United States
US GAAP generally accepted accounting principles in the United States
US$ United States dollars
WCS Western Canadian Select
WCS Heavy Differential
WCS Heavy Differential from WTI
WTI West Texas Intermediate reference location at Cushing, Oklahoma

10Canadian Natural 2020 Annual Report
AdvisorySPECIAL NOTE REGARDING FORWARD-LOOKING STATEMENTSCertain statements relating to Canadian Natural Resources Limited (the "Company") in this document or documents incorporated herein by reference constitute forward-looking statements or information (collectively referred to herein as "forward-looking statements") within the meaning of applicable securities legislation. Forward-looking statements can be identified by the words "believe", "anticipate", "expect", "plan", "estimate", "target", "continue", "could", "intend", "may", "potential", "predict", "should", "will", "objective", "project", "forecast", "goal", "guidance", "outlook", "effort", "seeks", "schedule", "proposed", "aspiration" or expressions of a similar nature suggesting future outcome or statements regarding an outlook. Disclosure related to expected future commodity pricing, forecast or anticipated production volumes, royalties, production expenses, capital expenditures, income tax expenses and other targets provided throughout this Management’s Discussion and Analysis ("MD&A") of the financial condition and results of operations of the Company, constitute forward-looking statements. Disclosure of plans relating to and expected results of existing and future developments, including, without limitation, those in relation to the Company's assets at Horizon, AOSP, Primrose thermal oil projects, the Pelican Lake water and polymer flood projects, the Kirby Thermal Oil Sands Project, the Jackfish Thermal Oil Sands Project, the North West Redwater bitumen upgrader and refinery, construction by third parties of new, or expansion of existing, pipeline capacity or other means of transportation of bitumen, crude oil, natural gas, NGLs or SCO that the Company may be reliant upon to transport its products to market, the development and deployment of technology and technological innovations, the assumption of operations at processing facilities, the financial capacity of the Company to complete its growth projects and responsibly and sustainably grow in the long term, and the "Outlook" section of this MD&A, particularly in reference to the 2021 targets provided with respect to budgeted capital expenditures, also constitute forward-looking statements. These forward-looking statements are based on annual budgets and multi-year forecasts, and are reviewed and revised throughout the year as necessary in the context of targeted financial ratios, project returns, product pricing expectations and balance in project risk and time horizons. These statements are not guarantees of future performance and are subject to certain risks. The reader should not place undue reliance on these forward-looking statements as there can be no assurances that the plans, initiatives or expectations upon which they are based will occur.
In addition, statements relating to "reserves" are deemed to be forward-looking statements as they involve the implied assessment based on certain estimates and assumptions that the reserves described can be profitably produced in the future. There are numerous uncertainties inherent in estimating quantities of proved and proved plus probable crude oil, natural gas and NGLs reserves and in projecting future rates of production and the timing of development expenditures. The total amount or timing of actual future production may vary significantly from reserves and production estimates.
The forward-looking statements are based on current expectations, estimates and projections about the Company and the industry in which the Company operates, which speak only as of the date such statements were made or as of the date of the report or document in which they are contained, and are subject to known and unknown risks and uncertainties that could cause the actual results, performance or achievements of the Company to be materially different from any future results, performance or achievements expressed or implied by such forward-looking statements. Such risks and uncertainties include, among others: general economic and business conditions (including as a result of effects of the novel coronavirus ("COVID-19") pandemic and the actions of OPEC+) which may impact, among other things, demand and supply for and market prices of the Company’s products, and the availability and cost of resources required by the Company's operations; volatility of and assumptions regarding crude oil and natural gas and NGLs prices including due to actions of OPEC+ taken in response to COVID-19 or otherwise; fluctuations in currency and interest rates; assumptions on which the Company’s current targets are based; economic conditions in the countries and regions in which the Company conducts business; political uncertainty, including actions of or against terrorists, insurgent groups or other conflict including conflict between states; industry capacity; ability of the Company to implement its business strategy, including exploration and development activities; impact of competition; the Company’s defense of lawsuits; availability and cost of seismic, drilling and other equipment; ability of the Company and its subsidiaries to complete capital programs; the Company’s and its subsidiaries’ ability to secure adequate transportation for its products; unexpected disruptions or delays in the mining, extracting or upgrading of the Company’s bitumen products; potential delays or changes in plans with respect to exploration or development projects or capital expenditures; ability of the Company to attract the necessary labour required to build, maintain, and operate its thermal and oil sands mining projects; operating hazards and other difficulties inherent in the exploration for and production and sale of crude oil and natural gas and in mining, extracting or upgrading the Company’s bitumen products; availability and cost of financing; the Company’s and its subsidiaries’ success of exploration and development activities and its ability to replace and expand crude oil and natural gas reserves; the Company’s ability to meet its targeted production levels; timing and success of integrating the business and operations of acquired companies and assets; production levels; imprecision of reserves estimates and estimates of recoverable quantities of crude oil, natural gas and NGLs not currently classified as proved; actions by governmental authorities (including production curtailments mandated by the Government of Alberta); government regulations and the expenditures required to comply with them (especially safety and environmental laws and regulations and the impact of climate change initiatives on capital expenditures and production expenses); asset retirement obligations; the sufficiency of the Company’s liquidity to support its growth strategy and to sustain its operations in the short, medium, and long term; the strength of the Company’s balance sheet; the flexibility of the Company’s capital structure; the adequacy of the

Canadian Natural 2020 Annual Report 11
Company’s provision for taxes; the continued availability of the Canada Emergency Wage Subsidy ("CEWS") or other subsidies; and other circumstances affecting revenues and expenses.
The Company’s operations have been, and in the future may be, affected by political developments and by national, federal, provincial, state and local laws and regulations such as restrictions on production, changes in taxes, royalties and other amounts payable to governments or governmental agencies, price or gathering rate controls and environmental protection regulations. Should one or more of these risks or uncertainties materialize, or should any of the Company’s assumptions prove incorrect, actual results may vary in material respects from those projected in the forward-looking statements. The impact of any one factor on a particular forward-looking statement is not determinable with certainty as such factors are dependent upon other factors, and the Company’s course of action would depend upon its assessment of the future considering all information then available.
Readers are cautioned that the foregoing list of factors is not exhaustive. Unpredictable or unknown factors not discussed in this MD&A could also have adverse effects on forward-looking statements. Although the Company believes that the expectations conveyed by the forward-looking statements are reasonable based on information available to it on the date such forward-looking statements are made, no assurances can be given as to future results, levels of activity and achievements. All subsequent forward-looking statements, whether written or oral, attributable to the Company or persons acting on its behalf are expressly qualified in their entirety by these cautionary statements. Except as required by applicable law, the Company assumes no obligation to update forward-looking statements in this MD&A, whether as a result of new information, future events or other factors, or the foregoing factors affecting this information, should circumstances or the Company's estimates or opinions change.
SPECIAL NOTE REGARDING NON-GAAP FINANCIAL MEASURESThis MD&A includes references to financial measures commonly used in the crude oil and natural gas industry, such as: adjusted net earnings (loss) from operations; adjusted funds flow and net capital expenditures. These financial measures are not defined by IFRS and therefore are referred to as non-GAAP financial measures. The non-GAAP financial measures used by the Company may not be comparable to similar measures presented by other companies. The Company uses these non-GAAP financial measures to evaluate its performance. The non-GAAP financial measures should not be considered an alternative to or more meaningful than net earnings (loss), cash flows from operating activities, and cash flows used in investing activities as determined in accordance with IFRS, as an indication of the Company’s performance. The non-GAAP financial measure adjusted net earnings (loss) from operations is reconciled to net earnings (loss), as determined in accordance with IFRS, in the "Financial and Operational Highlights" section of this MD&A. Additionally, the non-GAAP financial measure adjusted funds flow is reconciled to cash flows from operating activities, as determined in accordance with IFRS, in the "Financial and Operational Highlights" section of this MD&A. The non-GAAP financial measure net capital expenditures is reconciled to cash flows used in investing activities, as determined in accordance with IFRS, in the "Net Capital Expenditures" section of this MD&A. The Company also presents certain non-GAAP financial ratios and their derivation in the "Liquidity and Capital Resources" section of this MD&A.
SPECIAL NOTE REGARDING CURRENCY, FINANCIAL INFORMATION, PRODUCTION AND RESERVESThis MD&A should be read in conjunction with the audited consolidated financial statements for the year ended December 31, 2020. It should also be read in conjunction with the Company's MD&A for the three months and year ended December 31, 2020, which is incorporated herein by reference. All dollar amounts are referenced in millions of Canadian dollars, except where noted otherwise. The Company’s consolidated financial statements and this MD&A have been prepared in accordance with IFRS as issued by the IASB.
Production volumes, per unit statistics and reserves data are presented throughout this MD&A on a "before royalties" or "company gross" basis, and realized prices are net of blending and feedstock costs and exclude the effect of risk management activities. In addition, reference is made to crude oil and natural gas in common units called barrel of oil equivalent ("BOE"). A BOE is derived by converting six thousand cubic feet ("Mcf") of natural gas to one barrel ("bbl") of crude oil (6 Mcf:1 bbl). This conversion may be misleading, particularly if used in isolation, since the 6 Mcf:1 bbl ratio is based on an energy equivalency conversion method primarily applicable at the burner tip and does not represent a value equivalency at the wellhead. In comparing the value ratio using current crude oil prices relative to natural gas prices, the 6 Mcf:1 bbl conversion ratio may be misleading as an indication of value. In addition, for the purposes of this MD&A, crude oil is defined to include the following commodities: light and medium crude oil, primary heavy crude oil, Pelican Lake heavy crude oil, bitumen (thermal oil), and SCO. Production on an "after royalties" or "company net" basis is also presented in this MD&A for information purposes only.
The following discussion and analysis refers primarily to the Company’s 2020 financial results compared to 2019 and 2018, unless otherwise indicated. In addition, this MD&A details the Company's targeted capital program for 2021. Additional information relating to the Company, including its quarterly MD&A for the three months and year ended December 31, 2020, its Annual Information Form for the year ended December 31, 2020, and its audited consolidated financial statements for the year ended December 31, 2020, is available on SEDAR at www.sedar.com, and on EDGAR at www.sec.gov. Information on the Company's website does not form part of and is not incorporated by reference in this MD&A. This MD&A is dated March 3, 2021.
12Canadian Natural 2020 Annual Report
Objectives and Strategy The Company’s objectives are to increase crude oil and natural gas production, reserves, cash flow and net asset value (1)
on a per common share basis through the economic and sustainable development of its existing crude oil and natural gas properties and through the discovery and/or acquisition of new reserves. The Company strives to meet these objectives in a sustainable and responsible way, maintaining a commitment to environmental stewardship and safety excellence.
The Company strives to meet these objectives by having a defined growth and value enhancement plan for each of its products and segments. The Company takes a balanced approach to growth and investments and focuses on creating long-term shareholder value. The Company allocates its capital by maintaining:
■ Balance among its products, namely light and medium crude oil and NGLs, primary heavy crude oil, Pelican Lake heavy crude oil (2), bitumen (thermal oil), SCO and natural gas;
■ A large, balanced, diversified, high quality, long-life low decline asset base; ■ Balance among acquisitions, development and exploration; ■ Balance between sources and terms of debt financing and a strong financial position; and ■ Commitment to environmental stewardship throughout the decision-making process.
(1) Discounted value of crude oil and natural gas reserves plus value of unproved land, less net debt.(2) Pelican Lake heavy crude oil is 12–17º API oil, which receives medium quality crude netbacks due to lower production expense and lower royalty rates.
The Company’s three-phase crude oil marketing strategy includes:
■ Blending various crude oil streams with diluents to create more attractive feedstock; ■ Supporting and participating in pipeline expansions and/or new additions; and ■ Supporting and participating in projects that will increase the downstream conversion capacity for heavy crude oil and
bitumen (thermal oil).
Operational discipline, safe, effective and efficient operations, and cost control are fundamental to the Company and embrace the key piece of the Company's mission statement: "doing it right". By consistently managing costs throughout all cycles of the industry, the Company believes it will achieve continued growth. Effective and efficient operations and cost control are attained by developing area knowledge, and by maintaining high working interests and operator status in the Company’s properties.
The Company is committed to maintaining a strong balance sheet and flexible capital structure. The Company believes it has built the necessary financial capacity to complete its growth projects. Additionally, the Company periodically utilizes its risk management hedging program to reduce the risk of volatility in commodity prices and foreign exchange rates and to support the Company’s cash flow for its capital expenditure programs.
Strategic accretive acquisitions are a key component of the Company’s strategy. The Company has used a combination of internally generated cash flows and debt and equity financing to selectively acquire properties generating future cash flows in its core areas. The Company's financial discipline, commitment to a strong balance sheet, and capacity to internally generate cash flows provides the means to responsibly and sustainably grow in the long term.

Canadian Natural 2020 Annual Report 13
Financial and Operational Highlights ($ millions, except per common share amounts) 2020 2019 2018
Product sales (1) $ 17,491 $ 24,394 $ 22,282
Crude oil and NGLs $ 15,579 $ 22,950 $ 20,668
Natural gas $ 1,478 $ 1,419 $ 1,614
Net earnings (loss) $ (435) $ 5,416 $ 2,591
Per common share – basic $ (0.37) $ 4.55 $ 2.13
– diluted $ (0.37) $ 4.54 $ 2.12
Adjusted net earnings (loss) from operations (2) $ (756) $ 3,795 $ 3,263
Per common share – basic $ (0.64) $ 3.19 $ 2.68
– diluted $ (0.64) $ 3.18 $ 2.67
Cash flows from operating activities $ 4,714 $ 8,829 $ 10,121
Adjusted funds flow (3) $ 5,200 $ 10,267 $ 9,088
Per common share – basic $ 4.40 $ 8.62 $ 7.46
– diluted $ 4.40 $ 8.61 $ 7.43
Dividends declared per common share (4) $ 1.70 $ 1.50 $ 1.34
Total assets $ 75,276 $ 78,121 $ 71,559
Total long-term liabilities $ 37,818 $ 36,493 $ 34,823
Cash flows used in investing activities $ 2,819 $ 7,255 $ 4,814
Net capital expenditures (5) $ 3,206 $ 7,121 $ 4,731
Average sales price (6)
Crude oil and NGLs - Exploration and Production ($/bbl) $ 31.90 $ 55.08 $ 46.92
Natural gas - Exploration and Production ($/Mcf) $ 2.40 $ 2.34 $ 2.61
Oil Sands Mining and Upgrading ($/bbl) $ 43.98 $ 70.18 $ 68.61
Daily production, before royalties (BOE/d) 1,164,136 1,098,957 1,078,813
Crude oil and NGLs (bbl/d) 917,958 850,393 820,778
Natural gas (MMcf/d) 1,477 1,491 1,548
(1) Further details related to product sales are disclosed in note 22 to the Company's audited consolidated financial statements.(2) Adjusted net earnings (loss) from operations is a non-GAAP financial measure that represents net earnings (loss) as presented in the Company's consolidated
Statements of Earnings (Loss), adjusted for the after-tax effects of certain items of a non-operational nature. The Company considers adjusted net earnings (loss) from operations a key measure in evaluating its performance, as it demonstrates the Company’s ability to generate after-tax operating earnings from its core business areas. The reconciliation "Adjusted Net Earnings (Loss) from Operations, as Reconciled to Net Earnings (Loss)" is presented in this MD&A. Adjusted net earnings (loss) from operations may not be comparable to similar measures presented by other companies.
(3) Adjusted funds flow is a non-GAAP financial measure that represents cash flows from operating activities as presented in the Company's consolidated Statements of Cash Flows, adjusted for the net change in non-cash working capital, abandonment expenditures and movements in other long-term assets, including the unamortized cost of the share bonus program, accrued interest on subordinated debt advances to NWRP and prepaid cost of service tolls. The Company considers adjusted funds flow a key measure in evaluating its performance as it demonstrates the Company’s ability to generate the cash flow necessary to fund future growth through capital investment and to repay debt. The reconciliation "Adjusted Funds Flow, as Reconciled to Cash Flows from Operating Activities" is presented in this MD&A. Adjusted funds flow may not be comparable to similar measures presented by other companies.
(4) On March 3, 2021, the Board of Directors approved an increase in the quarterly dividend to $0.47 per common share, beginning with the dividend payable on April 5, 2021. On March 4, 2020, the Board of Directors approved an increase in the quarterly dividend to $0.425 per common share. On March 6, 2019, the Board of Directors approved an increase in the quarterly dividend to $0.375 per common share. On February 28, 2018, the Board of Directors approved an increase in the quarterly dividend to $0.335 per common share.
(5) Net capital expenditures is a non-GAAP financial measure that represents cash flows used in investing activities as presented in the Company's consolidated Statements of Cash Flows, adjusted for the net change in non-cash working capital, the repayment of NWRP subordinated debt advances, investment in other long-term assets, abandonment expenditures and other. The Company considers net capital expenditures a key measure as it provides an understanding of the Company’s capital spending activities in comparison to the Company's annual capital budget. The reconciliation "Net Capital Expenditures, as Reconciled to Cash Flows used in Investing Activities" is presented in the "Net Capital Expenditures" section of this MD&A. Net capital expenditures may not be comparable to similar measures presented by other companies.
(6) Net of blending and feedstock costs and excluding risk management activities.

14Canadian Natural 2020 Annual Report
ADJUSTED NET EARNINGS (LOSS) FROM OPERATIONS, AS RECONCILED TO NET EARNINGS (LOSS)
($ millions) 2020 2019 2018
Net earnings (loss), as reported $ (435) $ 5,416 $ 2,591
Share-based compensation, net of tax (1) (86) 210 (146)
Unrealized risk management (gain) loss, net of tax (2) (31) 14 (36)
Unrealized foreign exchange (gain) loss, net of tax (3) (116) (548) 706Realized foreign exchange gain on settlement of cross currency swaps,
net of tax (4) (166) — —
Realized foreign exchange loss on repayment of US dollar debt securities, net of tax (5) — — 146
Gain on acquisition, disposition and revaluation, net of tax (6) (217) — (372)
Loss from investments, net of tax (7) (8) 185 321 374
Provision for pipeline project, net of tax (9) 110 — —
Effect of statutory tax rate and other legislative changes on deferred income tax liabilities (10) — (1,618) —
Adjusted net earnings (loss) from operations $ (756) $ 3,795 $ 3,263
(1) Share-based compensation includes costs incurred under the Company's Stock Option Plan and Performance Share Unit ("PSU") plan. The Company’s Stock Option Plan provides for a cash payment option. The PSU plan provides certain executive employees of the Company with the right to receive a cash payment, the amount of which is determined by individual employee performance and the extent to which certain other performance measures are met. Accordingly, the fair value of the outstanding vested options is recognized as a liability on the Company’s balance sheets and periodic changes in the fair value are recognized in net earnings (loss) or are charged to (recovered from) the Oil Sands Mining and Upgrading segment.
(2) Derivative financial instruments are recognized at fair value on the Company’s balance sheets, with changes in the fair value of non-designated hedges recognized in net earnings (loss). The amounts ultimately realized may be materially different than those amounts reflected in the financial statements due to changes in prices of the underlying items hedged, primarily crude oil, natural gas and foreign exchange.
(3) Unrealized foreign exchange gains and losses result primarily from the translation of US dollar denominated long-term debt to period-end exchange rates, partially offset by the impact of cross currency swaps, and are recognized in net earnings (loss).
(4) During 2020, the Company settled the US$500 million cross currency swaps designated as cash flow hedges of the US$500 million 3.45% US dollar debt securities due November 2021. The Company realized cash proceeds of $166 million on settlement.
(5) During 2018, the Company repaid US$600 million of 1.75% notes and US$400 million of 5.90% notes.(6) During 2020, the Company recognized a pre- and after-tax gain of $217 million related to the acquisition of Painted Pony Energy Ltd. ("Painted Pony"). During
2018, the Company recognized a pre-tax gain of $16 million ($12 million after-tax) on the disposition of a 30% interest in the exploration right in South Africa. Additionally, the Gabonese Republic approved cessation of production from the Company’s Olowi field and associated asset retirement obligations, as well as the terms of termination of the Olowi Production Sharing Contract and the surrender of the permit area back to the Gabonese Republic, resulting in a pre-tax gain on disposition of property of $20 million ($14 million after-tax). The Company recognized a pre-tax gain of $277 million ($263 million after-tax) related to acquisitions in the North America Exploration and Production segment. The Company recognized a pre-tax gain of $120 million ($72 million after-tax) on the acquisition of the remaining interest at Ninian in the North Sea and a pre-tax gain of $19 million ($11 million after-tax) relating to the revaluation of the Company's previously held interest at Ninian.
(7) The Company's investment in the 50% owned NWRP is accounted for using the equity method of accounting. Included in the non-cash loss from investments is the Company's pro rata share of NWRP's equity loss recognized for the period.
(8) The Company’s investments in PrairieSky Royalty Ltd. ("PrairieSky") and Inter Pipeline Ltd. ("Inter Pipeline") have been accounted for at fair value through profit and loss and are remeasured each period with changes in fair value recognized in net earnings (loss).
(9) During 2020, the Company recognized a provision in transportation, blending and feedstock expense of $143 million ($110 million after-tax) relating to the Keystone XL pipeline project.
(10) All substantively enacted adjustments in applicable income tax rates and other legislative changes are applied to the underlying assets and liabilities on the Company's balance sheets in determining deferred income tax assets and liabilities. The impact of these tax rate and other legislative changes is recognized in net earnings (loss) during the period the legislation is substantively enacted. During 2019, the Government of Alberta enacted legislation that decreased the provincial corporate income tax rate from 12% to 11% effective July 1, 2019, with a further 1% rate reduction every year on January 1 until the provincial corporate income tax rate is 8% on January 1, 2022. As a result of this corporate income tax rate reduction, the Company's deferred corporate income tax liability decreased by $1,618 million. During 2020, the Government of Alberta substantively enacted legislation to accelerate this reduction, lowering the corporate tax rate from 10% to 8%, effective July 1, 2020. This acceleration did not have a significant impact on the Company's deferred corporate income tax liability for 2020.
ADJUSTED FUNDS FLOW, AS RECONCILED TO CASH FLOWS FROM OPERATING ACTIVITIES
($ millions) 2020 2019 2018
Cash flows from operating activities $ 4,714 $ 8,829 $ 10,121
Net change in non-cash working capital 166 1,033 (1,346)
Abandonment expenditures (1) 249 296 290
Other (2) 71 109 23
Adjusted funds flow $ 5,200 $ 10,267 $ 9,088
(1) The Company includes abandonment expenditures in "Net Capital Expenditures, as Reconciled to Cash Flows used in Investing Activities" in the "Net Capital Expenditures" section of this MD&A.
(2) Movements in other long-term assets, including the unamortized cost of the share bonus program, accrued interest on subordinated debt advances to NWRP and prepaid cost of service tolls.

Canadian Natural 2020 Annual Report 15
CONSOLIDATED NET EARNINGS (LOSS) AND ADJUSTED NET EARNINGS (LOSS) For 2020, the Company reported a net loss of $435 million compared with net earnings of $5,416 million for 2019 (2018 – net earnings of $2,591 million). The net loss for 2020 included net after-tax income of $321 million related to the effects of share-based compensation, risk management activities, fluctuations in foreign exchange rates, the foreign exchange gain on the settlement of the cross currency swaps, the gain on acquisition, disposition and revaluation, the loss from investments, and a provision relating to the Keystone XL pipeline project (2019 – $1,621 million after-tax income; 2018 – $672 million after-tax expense). Excluding these items, the adjusted net loss from operations for 2020 was $756 million compared with adjusted net earnings from operations of $3,795 million for 2019 (2018 – adjusted net earnings from operations of $3,263 million).
The net loss and the adjusted net loss from operations for 2020 compared with net earnings and adjusted net earnings from operations for 2019 primarily reflected:
■ lower crude oil and NGLs netbacks in the Exploration and Production segments; ■ lower realized SCO prices in the Oil Sands Mining and Upgrading segment; and ■ higher depletion, depreciation and amortization;
partially offset by:
■ higher crude oil and NGLs sales volumes in the North America Exploration and Production segment; ■ higher SCO sales volumes in the Oil Sands Mining and Upgrading segment; and ■ higher natural gas netbacks in the Exploration and Production segments.
A detailed reconciliation of the changes in the Company's product sales is provided in the "Analysis of Changes in Product Sales" section of this MD&A.
The impacts of share-based compensation, risk management activities, fluctuations in foreign exchange rates, the gain on acquisition, disposition, and revaluation, and the impact of statutory tax rate and other legislative changes on deferred income tax liabilities also contributed to the movements in net earnings (loss) for 2020 from 2019. These items are discussed in detail in the relevant sections of this MD&A.
CASH FLOWS FROM OPERATING ACTIVITIES AND ADJUSTED FUNDS FLOWCash flows from operating activities for 2020 were $4,714 million compared with $8,829 million for 2019 (2018 – $10,121 million). The decrease in cash flows from operating activities for 2020 from 2019 were primarily due to the factors previously noted relating to the fluctuations in net earnings (loss) and adjusted net earnings (loss) from operations (excluding the effects of depletion, depreciation and amortization, the gain on acquisition, disposition and revaluation and the impact of statutory tax rate and other legislative changes on deferred income tax liabilities), as well as due to the impact of changes in non-cash working capital.
Adjusted funds flow for 2020 was $5,200 million ($4.40 per common share) compared with $10,267 million for 2019 ($8.62 per common share) (2018 – $9,088 million; $7.46 per common share). The decrease in adjusted funds flow for 2020 from 2019 was primarily due to the factors noted above relating to the fluctuations in cash flows from operating activities excluding the impact of the net change in non-cash working capital, abandonment expenditures and movements in other long-term assets, including the unamortized cost of the share bonus program, accrued interest on subordinated debt advances to NWRP and prepaid cost of service tolls.
PRODUCTION VOLUMESTotal production of crude oil and NGLs before royalties for 2020 increased 8% to average 917,958 bbl/d from 850,393 bbl/d in 2019 (2018 – 820,778 bbl/d). The increase in crude oil and NGLs production for 2020 from 2019 primarily reflected the acquisition of Jackfish assets, increased thermal oil production at Kirby North, and high utilization rates and operational enhancements in the Oil Sands Mining and Upgrading segment.
Total natural gas production before royalties for 2020 averaged 1,477 MMcf/d, comparable with 1,491 MMcf/d in 2019 (2018 – 1,548 MMcf/d).
Total production before royalties for 2020 of 1,164,136 BOE/d increased 6% from 1,098,957 BOE/d in 2019 (2018 – 1,078,813 BOE/d). Crude oil and NGLs and natural gas production volumes are discussed in detail in the "Daily Production" section of this MD&A.

16Canadian Natural 2020 Annual Report
PRODUCT PRICESThe Company’s realized pricing reflects prevailing benchmark pricing. In the Company’s Exploration and Production segments, the 2020 crude oil and NGLs sales price decreased 42% to average $31.90 per bbl from $55.08 per bbl in 2019 (2018 – $46.92 per bbl), and the 2020 natural gas price increased 3% to average $2.40 per Mcf from $2.34 per Mcf in 2019 (2018 – $2.61 per Mcf). In the Oil Sands Mining and Upgrading segment, the Company’s 2020 SCO sales price decreased 37% to average $43.98 per bbl from $70.18 per bbl in 2019 (2018 – $68.61 per bbl). Crude oil and NGLs and natural gas product prices are discussed in detail in the "Business Environment", "Exploration and Production" and the "Oil Sands Mining and Upgrading" sections of this MD&A.
PRODUCTION EXPENSEIn the Company’s Exploration and Production segments, the 2020 crude oil and NGLs production expense decreased 10% to average $12.42 per bbl from $13.81 per bbl in 2019 (2018 – $15.69 per bbl), and the 2020 natural gas production expense decreased 3% to average $1.18 per Mcf from $1.22 per Mcf in 2019 (2018 – $1.36 per Mcf). In the Oil Sands Mining and Upgrading segment, the Company's 2020 production cost decreased 9% to average $20.46 per bbl from $22.56 per bbl in 2019 (2018 – $21.75 per bbl). Crude oil and NGLs and natural gas production expense is discussed in detail in the "Exploration and Production" and the "Oil Sands Mining and Upgrading" sections of this MD&A.
SUMMARY OF QUARTERLY FINANCIAL RESULTSThe following is a summary of the Company’s quarterly financial results for the eight most recently completed quarters:
($ millions, except per common share amounts)
2020 Total Dec 31 Sep 30 Jun 30 Mar 31
Product sales (1) $ 17,491 $ 5,219 $ 4,676 $ 2,944 $ 4,652
Crude oil and NGLs $ 15,579 $ 4,592 $ 4,202 $ 2,462 $ 4,323
Natural gas $ 1,478 $ 496 $ 338 $ 307 $ 337
Net earnings (loss) $ (435) $ 749 $ 408 $ (310) $ (1,282)
Net earnings (loss) per common share
– basic $ (0.37) $ 0.63 $ 0.35 $ (0.26) $ (1.08)
– diluted $ (0.37) $ 0.63 $ 0.35 $ (0.26) $ (1.08)
($ millions, except per common share amounts)
2019 Total Dec 31 Sep 30 Jun 30 Mar 31
Product sales (1) $ 24,394 $ 6,335 $ 6,587 $ 5,931 $ 5,541
Crude oil and NGLs $ 22,950 $ 5,947 $ 6,324 $ 5,597 $ 5,082
Natural gas $ 1,419 $ 382 $ 257 $ 324 $ 456
Net earnings (loss) $ 5,416 $ 597 $ 1,027 $ 2,831 $ 961
Net earnings (loss) per common share
– basic $ 4.55 $ 0.50 $ 0.87 $ 2.37 $ 0.80
– diluted $ 4.54 $ 0.50 $ 0.87 $ 2.36 $ 0.80
(1) Further details related to product sales are disclosed in note 22 to the Company's audited consolidated financial statements.
Volatility in the quarterly net earnings (loss) over the eight most recently completed quarters was primarily due to:
■ Crude oil pricing – Fluctuating global supply/demand including crude oil production levels from OPEC+ and its impact on world supply; the impact of geopolitical and market uncertainties, including those due to COVID-19 and in connection with governmental responses to COVID-19, on worldwide benchmark pricing; the impact of shale oil production in North America; the impact of the WCS Heavy Differential from WTI including the impact of a shortage of takeaway capacity out of the Western Canadian Sedimentary Basin (the "Basin"); the impact of the differential between WTI and Brent benchmark pricing in the North Sea and Offshore Africa; and the impact of production curtailments mandated by the Government of Alberta that came into effect on January 1, 2019 and were suspended effective December 1, 2020.
■ Natural gas pricing – The impact of fluctuations in both the demand for natural gas and inventory storage levels, third-party pipeline maintenance and outages and the impact of shale gas production in the US.

Canadian Natural 2020 Annual Report 17
■ Crude oil and NGLs sales volumes – Fluctuations in production due to the cyclic nature of the Company’s Primrose thermal oil projects, production from the Kirby Thermal Oil Sands Project, the results from the Pelican Lake water and polymer flood projects, fluctuations in the Company’s drilling program in North America and the International segments, the impact and timing of acquisitions, including the acquisition of assets from Devon Canada Corporation ("Devon"), as well as the impact of turnarounds and pitstops in the Oil Sands Mining and Upgrading segment, production curtailments mandated by the Government of Alberta that came into effect January 1, 2019 and were suspended effective December 1, 2020, and the impact of shut-in production due to lower demand during COVID-19. Sales volumes also reflected fluctuations due to timing of liftings and maintenance activities in the International segments.
■ Natural gas sales volumes – Fluctuations in production due to the Company’s allocation of capital to higher return crude oil projects, natural decline rates, shut-in production due to low commodity prices and the impact and timing of acquisitions, including the acquisition of Painted Pony.
■ Production expense – Fluctuations primarily due to the impact of the demand and cost for services, fluctuations in product mix and production volumes, the impact of seasonal costs, the impact of increased carbon tax and energy costs, cost optimizations across all segments, the impact and timing of acquisitions, the impact of turnarounds and pitstops in the Oil Sands Mining and Upgrading segment, and maintenance activities in the International segments.
■ Transportation, blending and feedstock expense – Fluctuations due to the provision recognized relating to the Keystone XL pipeline project in 2020.
■ Depletion, depreciation and amortization expense – Fluctuations due to changes in sales volumes including the impact and timing of acquisitions and dispositions, proved reserves, asset retirement obligations, finding and development costs associated with crude oil and natural gas exploration, estimated future costs to develop the Company’s proved undeveloped reserves, fluctuations in International sales volumes subject to higher depletion rates, and the impact of turnarounds and pitstops in the Oil Sands Mining and Upgrading segment.
■ Share-based compensation – Fluctuations due to the measurement of fair market value of the Company's share-based compensation liability.
■ Risk management – Fluctuations due to the recognition of gains and losses from the mark-to-market and subsequent settlement of the Company’s risk management activities.
■ Interest expense – Fluctuations due to changing long-term debt levels, and the impact of movements in benchmark interest rates on outstanding floating rate long-term debt.
■ Foreign exchange – Fluctuations in the Canadian dollar relative to the US dollar, which impact the realized price the Company receives for its crude oil and natural gas sales, as sales prices are based predominantly on US dollar denominated benchmarks. Fluctuations in realized and unrealized foreign exchange gains and losses were also recorded with respect to US dollar denominated debt, partially offset by the impact of cross currency swap hedges.
■ Gain on acquisition and gains/losses on investments – Fluctuations due to the recognition of a gain on the acquisition of Painted Pony, fair value changes in the investments in PrairieSky and Inter Pipeline shares, and the equity loss on the Company's interest in NWRP.
■ Income tax expense – Fluctuations due to statutory tax rate and other legislative changes substantively enacted in the various periods.

18Canadian Natural 2020 Annual Report
Business EnvironmentGlobal benchmark crude oil prices decreased significantly in the first half of 2020 due to the erosion of global demand, reflecting the severity of COVID-19 and related economic conditions. In April 2020, in response to the collapse of crude oil prices, OPEC+ agreed to cut 9.7 MMbbl/d of production through July 2020. As the global economy improved in the latter part of the year, OPEC+ agreed to ease these production cuts to 7.2 MMbbl/d, as of January 2021. Furthermore, the initial rollout of the COVID-19 vaccine in the fourth quarter of 2020 had an overall positive impact on global demand for crude oil. Pricing improved in the fourth quarter of 2020 with WTI benchmark pricing averaging US$42.67 per bbl and the WCS Heavy Differential averaging US$9.30 per bbl. Subsequent to December 31, 2020, Saudi Arabia committed to reduce its production by 1.0 MMbbl/d, which had a further positive impact on crude oil pricing.
PRODUCTION FLEXIBILITY AND COST CONTROLThe Company continues to be nimble and act decisively to make appropriate operational improvements to increase efficiencies and cost control and mitigate the impact of the decline in commodity pricing across all of its operations. To mitigate the impact of realized pricing on certain crude oil products, the Company optimizes the production profile across its diverse asset base. The Company implemented changes to its compensation program in light of current commodity volatility, and these changes had an immediate impact on the Company's costs, effective April 2020. The Company is also working diligently to reduce production costs wherever possible, asking all stakeholders to contribute to the sustainability of operations.
The Company continued to prioritize the optimization of higher value light crude oil, NGLs and SCO, representing approximately 47% of total corporate BOE production volumes for 2020. Optimization of production volumes continues to be a key focus of the Company at current commodity price levels.
Production costs throughout 2020 also reflected the impact of measures to promote social distancing and other precautionary measures related to COVID-19 at the Company's head office and field locations, both internationally and in North America. The Company continues to mitigate the impact of these costs through its focus on cost control and efficiencies across the asset base.
CANADA EMERGENCY WAGE SUBSIDY On March 27, 2020, in response to COVID-19, the Government of Canada announced the CEWS. The CEWS enables eligible Canadian employers who have been impacted by COVID-19 to apply for a subsidy of a specified amount of eligible employee wages. The Company was eligible for the subsidy in 2020 as its qualifying revenues declined by the specified amount as compared with the prior year reference period.
LIQUIDITYAs at December 31, 2020, the Company had undrawn revolving bank credit facilities of $4,958 million. Including cash and cash equivalents and short-term investments, the Company had approximately $5,447 million in liquidity. The Company also has certain other dedicated credit facilities supporting letters of credit.
The Company remains committed to maintaining a strong balance sheet, adequate available liquidity and a flexible capital structure. Refer to the “Liquidity and Capital Resources” section of this MD&A for further details.
CAPITAL SPENDINGSafe, reliable, effective and efficient operations continues to be a focus for the Company. On December 9, 2020, the Company announced its 2021 capital budget targeted at approximately $3,205 million, of which $1,345 million is related to conventional and unconventional assets and $1,860 million is allocated to long-life low decline assets. Production for 2021 is targeted between 1,190,000 BOE/d and 1,260,000 BOE/d. Annual budgets are developed and scrutinized throughout the year and can be changed, if necessary, in the context of price volatility, project returns and the balancing of project risks and time horizons. The 2021 capital budget and production targets constitute forward-looking information. Refer to the "Advisory" section of this MD&A for further details on forward-looking statements.
RISKS AND UNCERTAINTIESCOVID-19 continues to have the potential to further disrupt the Company’s operations, projects and financial condition through the disruption of the local or global supply chain and transportation services, or the loss of manpower resulting from quarantines that affect the Company’s labour pools in their local communities, workforce camps or operating sites or that are instituted by local health authorities as a precautionary measure, any of which may require the Company to temporarily reduce or shutdown its operations depending on their extent and severity.
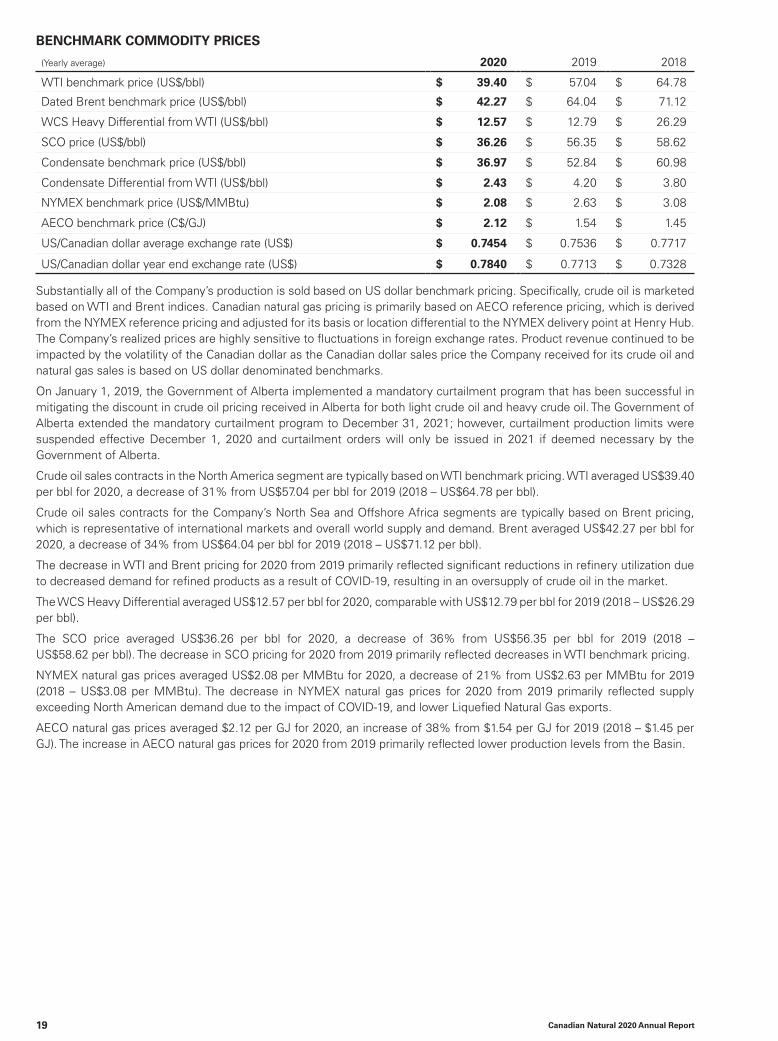
Canadian Natural 2020 Annual Report 19
BENCHMARK COMMODITY PRICES
(Yearly average) 2020 2019 2018
WTI benchmark price (US$/bbl) $ 39.40 $ 57.04 $ 64.78
Dated Brent benchmark price (US$/bbl) $ 42.27 $ 64.04 $ 71.12
WCS Heavy Differential from WTI (US$/bbl) $ 12.57 $ 12.79 $ 26.29
SCO price (US$/bbl) $ 36.26 $ 56.35 $ 58.62
Condensate benchmark price (US$/bbl) $ 36.97 $ 52.84 $ 60.98
Condensate Differential from WTI (US$/bbl) $ 2.43 $ 4.20 $ 3.80
NYMEX benchmark price (US$/MMBtu) $ 2.08 $ 2.63 $ 3.08
AECO benchmark price (C$/GJ) $ 2.12 $ 1.54 $ 1.45
US/Canadian dollar average exchange rate (US$) $ 0.7454 $ 0.7536 $ 0.7717
US/Canadian dollar year end exchange rate (US$) $ 0.7840 $ 0.7713 $ 0.7328
Substantially all of the Company’s production is sold based on US dollar benchmark pricing. Specifically, crude oil is marketed based on WTI and Brent indices. Canadian natural gas pricing is primarily based on AECO reference pricing, which is derived from the NYMEX reference pricing and adjusted for its basis or location differential to the NYMEX delivery point at Henry Hub. The Company’s realized prices are highly sensitive to fluctuations in foreign exchange rates. Product revenue continued to be impacted by the volatility of the Canadian dollar as the Canadian dollar sales price the Company received for its crude oil and natural gas sales is based on US dollar denominated benchmarks.
On January 1, 2019, the Government of Alberta implemented a mandatory curtailment program that has been successful in mitigating the discount in crude oil pricing received in Alberta for both light crude oil and heavy crude oil. The Government of Alberta extended the mandatory curtailment program to December 31, 2021; however, curtailment production limits were suspended effective December 1, 2020 and curtailment orders will only be issued in 2021 if deemed necessary by the Government of Alberta.
Crude oil sales contracts in the North America segment are typically based on WTI benchmark pricing. WTI averaged US$39.40 per bbl for 2020, a decrease of 31% from US$57.04 per bbl for 2019 (2018 – US$64.78 per bbl).
Crude oil sales contracts for the Company’s North Sea and Offshore Africa segments are typically based on Brent pricing, which is representative of international markets and overall world supply and demand. Brent averaged US$42.27 per bbl for 2020, a decrease of 34% from US$64.04 per bbl for 2019 (2018 – US$71.12 per bbl).
The decrease in WTI and Brent pricing for 2020 from 2019 primarily reflected significant reductions in refinery utilization due to decreased demand for refined products as a result of COVID-19, resulting in an oversupply of crude oil in the market.
The WCS Heavy Differential averaged US$12.57 per bbl for 2020, comparable with US$12.79 per bbl for 2019 (2018 – US$26.29 per bbl).
The SCO price averaged US$36.26 per bbl for 2020, a decrease of 36% from US$56.35 per bbl for 2019 (2018 – US$58.62 per bbl). The decrease in SCO pricing for 2020 from 2019 primarily reflected decreases in WTI benchmark pricing.
NYMEX natural gas prices averaged US$2.08 per MMBtu for 2020, a decrease of 21% from US$2.63 per MMBtu for 2019 (2018 – US$3.08 per MMBtu). The decrease in NYMEX natural gas prices for 2020 from 2019 primarily reflected supply exceeding North American demand due to the impact of COVID-19, and lower Liquefied Natural Gas exports.
AECO natural gas prices averaged $2.12 per GJ for 2020, an increase of 38% from $1.54 per GJ for 2019 (2018 – $1.45 per GJ). The increase in AECO natural gas prices for 2020 from 2019 primarily reflected lower production levels from the Basin.

20Canadian Natural 2020 Annual Report
Analysis of Changes in Product Sales Changes due to Changes due to
($ millions) 2018 Volumes Prices Other 2019 Volumes Prices Other 2020
North America
Crude oil and NGLs $ 7,254 $ 1,055 $ 1,375 $ (5) $ 9,679 $ 1,582 $ (3,781) $ — $ 7,480
Natural gas 1,256 (40) (76) 10 1,150 8 84 — 1,242
Other (1) — — — 6 6 — — 35 41
8,510 1,015 1,299 11 10,835 1,590 (3,697) 35 8,763
North Sea
Crude oil and NGLs 753 114 (7) — 860 (135) (308) — 417
Natural gas 140 (34) (49) — 57 (29) (16) — 12
Other (1) — — — 5 5 — — (2) 3
893 80 (56) 5 922 (164) (324) (2) 432
Offshore Africa
Crude oil and NGLs 628 72 (56) (12) 632 (116) (198) — 318
Natural gas 70 (5) 1 1 67 (27) 2 — 42
Other (1) — — — 8 8 — — 10 18
698 67 (55) (3) 707 (143) (196) 10 378
Oil Sands Mining and Upgrading
Crude oil and NGLs 11,521 (710) 560 (31) 11,340 470 (4,421) — 7,389
Other (1) — — — 6 6 — — 133 139
11,521 (710) 560 (25) 11,346 470 (4,421) 133 7,528
Midstream and Refining
Midstream activities 102 — — (14) 88 — — (5) 83
Refined products and other (1) — — — — — — — 202 202
102 — — (14) 88 — — 197 285
Intersegment eliminations and other (2)
Product sales 558 — — (62) 496 — — (422) 74
Other (1) — — — — — — — 31 31
558 — — (62) 496 — — (391) 105
Total $ 22,282 $ 452 $ 1,748 $ (88) $ 24,394 $ 1,753 $ (8,638) $ (18) $ 17,491
(1) Includes the sale of diesel and other refined products and other income, including government grants and recoveries associated with the joint operations partners' share of the costs of lease contracts.
(2) Eliminates internal transportation and electricity charges and includes production, processing and other purchasing and selling activities that are not included in the above segments.
Product sales decreased 28% to $17,491 million for 2020 from $24,394 million for 2019 (2018 – $22,282 million). The decrease in product sales was primarily a result of lower WTI benchmark pricing due to decreased demand for refined products as a result of COVID-19. The decrease in realized pricing was partially offset by the impact of increased crude oil and NGLs sales volumes following the acquisition of Jackfish assets, increased thermal oil production at Kirby North, and high utilization rates and operational enhancements in the Oil Sands Mining and Upgrading segment. Crude oil and NGLs and natural gas pricing are discussed in detail in the "Business Environment", "Exploration and Production" and the "Oil Sands Mining and Upgrading" sections of this MD&A. Crude oil and NGLs and natural gas production volumes are discussed in detail in the "Daily Production" section of this MD&A.
For 2020, 5% of the Company’s crude oil and NGLs and natural gas product sales were generated outside of North America (2019 – 7%; 2018 – 7%). North Sea accounted for 3% of crude oil and NGLs and natural gas product sales for 2020 (2019 – 4%; 2018 – 4%), and Offshore Africa accounted for 2% of crude oil and NGLs and natural gas product sales for 2020 (2019 – 3%; 2018 – 3%).

Canadian Natural 2020 Annual Report 21
Daily ProductionDAILY PRODUCTION, BEFORE ROYALTIES
2020 2019 2018
Crude oil and NGLs (bbl/d)
North America – Exploration and Production 460,443 405,970 350,961
North America – Oil Sands Mining and Upgrading (1) 417,351 395,133 426,190
North Sea 23,142 27,919 23,965
Offshore Africa 17,022 21,371 19,662
917,958 850,393 820,778
Natural gas (MMcf/d)
North America 1,450 1,443 1,490
North Sea 12 24 32
Offshore Africa 15 24 26
1,477 1,491 1,548
Total barrels of oil equivalent (BOE/d) 1,164,136 1,098,957 1,078,813
Product mix
Light and medium crude oil and NGLs 11% 13% 13%
Pelican Lake heavy crude oil 5% 5% 6%
Primary heavy crude oil 6% 8% 8%
Bitumen (thermal oil) 21% 15% 10%
Synthetic crude oil (1) 36% 36% 39%
Natural gas 21% 23% 24%
Percentage of gross revenue (1) (2)
(excluding Midstream and Refining revenue)
Crude oil and NGLs 91% 94% 93%
Natural gas 9% 6% 7%
(1) SCO production before royalties excludes SCO consumed internally as diesel.(2) Net of blending costs and excluding risk management activities.
DAILY PRODUCTION, NET OF ROYALTIES
2020 2019 2018
Crude oil and NGLs (bbl/d)
North America – Exploration and Production 420,906 356,794 303,956
North America – Oil Sands Mining and Upgrading 413,363 375,048 405,731
North Sea 23,086 27,866 23,902
Offshore Africa 16,306 20,078 18,450
873,661 779,786 752,039
Natural gas (MMcf/d)
North America 1,406 1,400 1,432
North Sea 12 24 32
Offshore Africa 14 22 23
1,432 1,446 1,487
Total barrels of oil equivalent (BOE/d) 1,112,364 1,020,749 999,857
The Company’s business approach is to maintain large project inventories and production diversification among each of the commodities it produces; namely light and medium crude oil and NGLs, primary heavy crude oil, Pelican Lake heavy crude oil, bitumen (thermal oil), SCO and natural gas.
Total 2020 production before royalties averaged 1,164,136 BOE/d, an increase of 6% from 1,098,957 BOE/d in 2019 (2018 – 1,078,813 BOE/d).
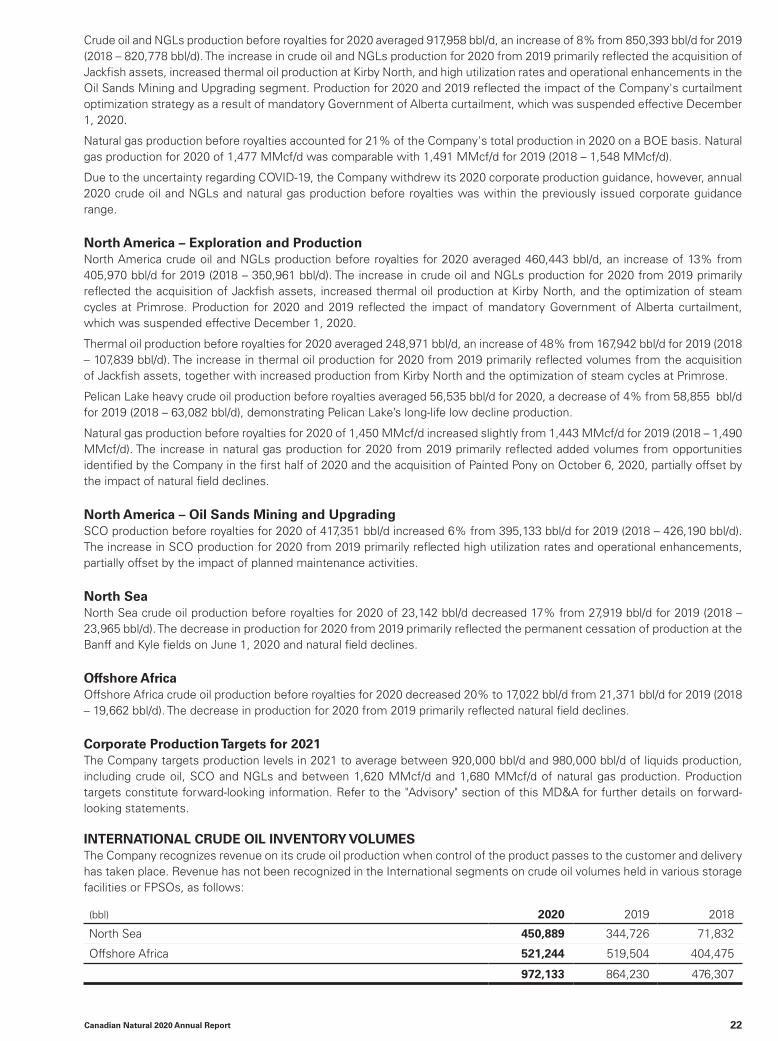
22Canadian Natural 2020 Annual Report
Crude oil and NGLs production before royalties for 2020 averaged 917,958 bbl/d, an increase of 8% from 850,393 bbl/d for 2019 (2018 – 820,778 bbl/d). The increase in crude oil and NGLs production for 2020 from 2019 primarily reflected the acquisition of Jackfish assets, increased thermal oil production at Kirby North, and high utilization rates and operational enhancements in the Oil Sands Mining and Upgrading segment. Production for 2020 and 2019 reflected the impact of the Company's curtailment optimization strategy as a result of mandatory Government of Alberta curtailment, which was suspended effective December 1, 2020.
Natural gas production before royalties accounted for 21% of the Company's total production in 2020 on a BOE basis. Natural gas production for 2020 of 1,477 MMcf/d was comparable with 1,491 MMcf/d for 2019 (2018 – 1,548 MMcf/d).
Due to the uncertainty regarding COVID-19, the Company withdrew its 2020 corporate production guidance, however, annual 2020 crude oil and NGLs and natural gas production before royalties was within the previously issued corporate guidance range.
North America – Exploration and ProductionNorth America crude oil and NGLs production before royalties for 2020 averaged 460,443 bbl/d, an increase of 13% from 405,970 bbl/d for 2019 (2018 – 350,961 bbl/d). The increase in crude oil and NGLs production for 2020 from 2019 primarily reflected the acquisition of Jackfish assets, increased thermal oil production at Kirby North, and the optimization of steam cycles at Primrose. Production for 2020 and 2019 reflected the impact of mandatory Government of Alberta curtailment, which was suspended effective December 1, 2020.
Thermal oil production before royalties for 2020 averaged 248,971 bbl/d, an increase of 48% from 167,942 bbl/d for 2019 (2018 – 107,839 bbl/d). The increase in thermal oil production for 2020 from 2019 primarily reflected volumes from the acquisition of Jackfish assets, together with increased production from Kirby North and the optimization of steam cycles at Primrose.
Pelican Lake heavy crude oil production before royalties averaged 56,535 bbl/d for 2020, a decrease of 4% from 58,855 bbl/d for 2019 (2018 – 63,082 bbl/d), demonstrating Pelican Lake’s long-life low decline production.
Natural gas production before royalties for 2020 of 1,450 MMcf/d increased slightly from 1,443 MMcf/d for 2019 (2018 – 1,490 MMcf/d). The increase in natural gas production for 2020 from 2019 primarily reflected added volumes from opportunities identified by the Company in the first half of 2020 and the acquisition of Painted Pony on October 6, 2020, partially offset by the impact of natural field declines.
North America – Oil Sands Mining and UpgradingSCO production before royalties for 2020 of 417,351 bbl/d increased 6% from 395,133 bbl/d for 2019 (2018 – 426,190 bbl/d). The increase in SCO production for 2020 from 2019 primarily reflected high utilization rates and operational enhancements, partially offset by the impact of planned maintenance activities.
North SeaNorth Sea crude oil production before royalties for 2020 of 23,142 bbl/d decreased 17% from 27,919 bbl/d for 2019 (2018 – 23,965 bbl/d). The decrease in production for 2020 from 2019 primarily reflected the permanent cessation of production at the Banff and Kyle fields on June 1, 2020 and natural field declines.
Offshore AfricaOffshore Africa crude oil production before royalties for 2020 decreased 20% to 17,022 bbl/d from 21,371 bbl/d for 2019 (2018 – 19,662 bbl/d). The decrease in production for 2020 from 2019 primarily reflected natural field declines.
Corporate Production Targets for 2021 The Company targets production levels in 2021 to average between 920,000 bbl/d and 980,000 bbl/d of liquids production, including crude oil, SCO and NGLs and between 1,620 MMcf/d and 1,680 MMcf/d of natural gas production. Production targets constitute forward-looking information. Refer to the "Advisory" section of this MD&A for further details on forward-looking statements.
INTERNATIONAL CRUDE OIL INVENTORY VOLUMESThe Company recognizes revenue on its crude oil production when control of the product passes to the customer and delivery has taken place. Revenue has not been recognized in the International segments on crude oil volumes held in various storage facilities or FPSOs, as follows:
(bbl) 2020 2019 2018
North Sea 450,889 344,726 71,832
Offshore Africa 521,244 519,504 404,475
972,133 864,230 476,307

Canadian Natural 2020 Annual Report 23
Exploration and ProductionOPERATING HIGHLIGHTS
2020 2019 2018
Crude oil and NGLs ($/bbl) (1)
Sales price (2) $ 31.90 $ 55.08 $ 46.92
Transportation (3) 3.85 3.48 3.08
Realized sales price, net of transportation 28.05 51.60 43.84
Royalties 2.59 6.08 5.08
Production expense 12.42 13.81 15.69
Netback $ 13.04 $ 31.71 $ 23.07
Natural gas ($/Mcf) (1)
Sales price $ 2.40 $ 2.34 $ 2.61
Transportation 0.43 0.42 0.47
Realized sales price, net of transportation 1.97 1.92 2.14
Royalties 0.08 0.08 0.08
Production expense 1.18 1.22 1.36
Netback $ 0.71 $ 0.62 $ 0.70
Barrels of oil equivalent ($/BOE) (1)
Sales price (2) $ 26.15 $ 40.50 $ 34.62
Transportation (3) 3.44 3.14 2.96
Realized sales price, net of transportation 22.71 37.36 31.66
Royalties 1.89 4.09 3.27
Production expense 10.67 11.49 12.71
Netback $ 10.15 $ 21.78 $ 15.68
(1) Amounts expressed on a per unit basis are based on sales volumes.(2) Net of blending costs and excluding risk management activities.(3) Excludes the impact of a $143 million provision recognized in 2020, relating to the Keystone XL pipeline project.
PRODUCT PRICES
2020 2019 2018
Crude oil and NGLs ($/bbl) (1) (2)
North America $ 30.31 $ 51.43 $ 41.82
North Sea $ 50.09 $ 86.76 $ 87.41
Offshore Africa $ 50.95 $ 83.68 $ 90.95
Average $ 31.90 $ 55.08 $ 46.92
Natural gas ($/Mcf) (1)
North America $ 2.34 $ 2.18 $ 2.33
North Sea $ 2.74 $ 6.52 $ 12.08
Offshore Africa $ 7.77 $ 7.41 $ 7.34
Average $ 2.40 $ 2.34 $ 2.61
Average ($/BOE) (1) (2) $ 26.15 $ 40.50 $ 34.62
(1) Amounts expressed on a per unit basis are based on sales volumes.(2) Net of blending costs and excluding risk management activities.
North America – Product PricesNorth America realized crude oil prices decreased 41% to average $30.31 per bbl for 2020 from $51.43 per bbl for 2019 (2018 – $41.82 per bbl), primarily due to lower WTI benchmark pricing due to decreased demand for refined products as a result of COVID-19.
North America realized natural gas prices increased 7% to average $2.34 per Mcf for 2020 from $2.18 per Mcf for 2019 (2018 – $2.33 per Mcf). The increase in realized natural gas prices for 2020 from 2019 primarily reflected lower production levels from the Basin.
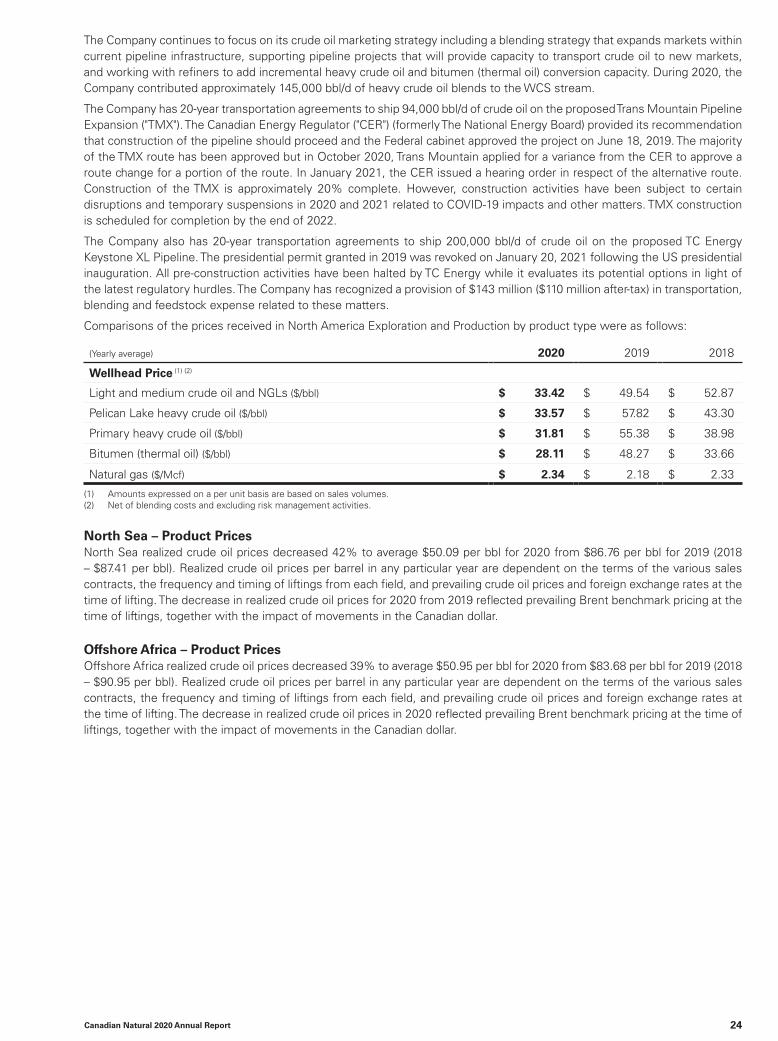
24Canadian Natural 2020 Annual Report
The Company continues to focus on its crude oil marketing strategy including a blending strategy that expands markets within current pipeline infrastructure, supporting pipeline projects that will provide capacity to transport crude oil to new markets, and working with refiners to add incremental heavy crude oil and bitumen (thermal oil) conversion capacity. During 2020, the Company contributed approximately 145,000 bbl/d of heavy crude oil blends to the WCS stream.
The Company has 20-year transportation agreements to ship 94,000 bbl/d of crude oil on the proposed Trans Mountain Pipeline Expansion ("TMX"). The Canadian Energy Regulator ("CER") (formerly The National Energy Board) provided its recommendation that construction of the pipeline should proceed and the Federal cabinet approved the project on June 18, 2019. The majority of the TMX route has been approved but in October 2020, Trans Mountain applied for a variance from the CER to approve a route change for a portion of the route. In January 2021, the CER issued a hearing order in respect of the alternative route. Construction of the TMX is approximately 20% complete. However, construction activities have been subject to certain disruptions and temporary suspensions in 2020 and 2021 related to COVID-19 impacts and other matters. TMX construction is scheduled for completion by the end of 2022.
The Company also has 20-year transportation agreements to ship 200,000 bbl/d of crude oil on the proposed TC Energy Keystone XL Pipeline. The presidential permit granted in 2019 was revoked on January 20, 2021 following the US presidential inauguration. All pre-construction activities have been halted by TC Energy while it evaluates its potential options in light of the latest regulatory hurdles. The Company has recognized a provision of $143 million ($110 million after-tax) in transportation, blending and feedstock expense related to these matters.
Comparisons of the prices received in North America Exploration and Production by product type were as follows:
(Yearly average) 2020 2019 2018
Wellhead Price (1) (2)
Light and medium crude oil and NGLs ($/bbl) $ 33.42 $ 49.54 $ 52.87
Pelican Lake heavy crude oil ($/bbl) $ 33.57 $ 57.82 $ 43.30
Primary heavy crude oil ($/bbl) $ 31.81 $ 55.38 $ 38.98
Bitumen (thermal oil) ($/bbl) $ 28.11 $ 48.27 $ 33.66
Natural gas ($/Mcf) $ 2.34 $ 2.18 $ 2.33
(1) Amounts expressed on a per unit basis are based on sales volumes.(2) Net of blending costs and excluding risk management activities.
North Sea – Product PricesNorth Sea realized crude oil prices decreased 42% to average $50.09 per bbl for 2020 from $86.76 per bbl for 2019 (2018 – $87.41 per bbl). Realized crude oil prices per barrel in any particular year are dependent on the terms of the various sales contracts, the frequency and timing of liftings from each field, and prevailing crude oil prices and foreign exchange rates at the time of lifting. The decrease in realized crude oil prices for 2020 from 2019 reflected prevailing Brent benchmark pricing at the time of liftings, together with the impact of movements in the Canadian dollar.
Offshore Africa – Product PricesOffshore Africa realized crude oil prices decreased 39% to average $50.95 per bbl for 2020 from $83.68 per bbl for 2019 (2018 – $90.95 per bbl). Realized crude oil prices per barrel in any particular year are dependent on the terms of the various sales contracts, the frequency and timing of liftings from each field, and prevailing crude oil prices and foreign exchange rates at the time of lifting. The decrease in realized crude oil prices in 2020 reflected prevailing Brent benchmark pricing at the time of liftings, together with the impact of movements in the Canadian dollar.

Canadian Natural 2020 Annual Report 25
ROYALTIES
2020 2019 2018
Crude oil and NGLs ($/bbl) (1)
North America $ 2.72 $ 6.56 $ 5.36
North Sea $ 0.12 $ 0.16 $ 0.22
Offshore Africa $ 2.17 $ 4.74 $ 6.00
Average $ 2.59 $ 6.08 $ 5.08
Natural gas ($/Mcf) (1)
North America $ 0.07 $ 0.07 $ 0.07
Offshore Africa $ 0.37 $ 0.63 $ 1.00
Average $ 0.08 $ 0.08 $ 0.08
Average ($/BOE) (1) $ 1.89 $ 4.09 $ 3.27
(1) Amounts expressed on a per unit basis are based on sales volumes.
North America – RoyaltiesGovernment royalties on a significant portion of North America crude oil and NGLs production fall under the oil sands royalty regime and are calculated on a project by project basis as a percentage of gross revenue less operating, capital and abandonment costs incurred.
North America crude oil and natural gas royalties for 2020 and the comparable periods reflected movements in benchmark commodity prices. North America crude oil royalties also reflected fluctuations in the WCS Heavy Differential and changes in the production mix between high and low royalty rate product types.
Crude oil and NGLs royalty rates averaged approximately 9% of product sales for 2020 compared with 13% of product sales for 2019 (2018 – 14%). The decrease in royalty rates for 2020 from 2019 primarily reflected lower realized crude oil prices.
Natural gas royalty rates averaged approximately 3% of product sales for 2020, comparable with 3% of product sales for 2019 (2018 – 4%).
Offshore Africa – RoyaltiesUnder the terms of the various Production Sharing Contracts, royalty rates fluctuate based on realized commodity pricing, capital expenditures and production expenses, the status of payouts, and the timing of liftings from each field.
Royalty rates as a percentage of product sales averaged approximately 4% for 2020 compared with 6% of product sales for 2019 (2018 – 7%). Royalty rates as a percentage of product sales reflected the timing of liftings and the status of payout in the various fields.
PRODUCTION EXPENSE
2020 2019 2018
Crude oil and NGLs ($/bbl) (1)
North America $ 11.21 $ 12.41 $ 13.48
North Sea $ 36.51 $ 36.39 $ 39.89
Offshore Africa $ 13.29 $ 11.21 $ 26.34
Average $ 12.42 $ 13.81 $ 15.69
Natural gas ($/Mcf) (1)
North America $ 1.14 $ 1.16 $ 1.25
North Sea $ 3.72 $ 3.40 $ 5.29
Offshore Africa $ 3.58 $ 2.60 $ 2.76
Average $ 1.18 $ 1.22 $ 1.36
Average ($/BOE) (1) $ 10.67 $ 11.49 $ 12.71
(1) Amounts expressed on a per unit basis are based on sales volumes.

26Canadian Natural 2020 Annual Report
North America – Production ExpenseNorth America crude oil and NGLs production expense for 2020 averaged $11.21 per bbl, a decrease of 10% from $12.41 per bbl for 2019 (2018 – $13.48 per bbl). The decrease in crude oil and NGLs production expense per bbl for 2020 from 2019 primarily reflected the impact of increased thermal oil volumes, together with operating cost synergies at Jackfish.
North America natural gas production expense for 2020 averaged $1.14 per Mcf, comparable with $1.16 per Mcf for 2019 (2018 – $1.25 per Mcf). Natural gas production expense per Mcf for 2020 from 2019 primarily reflected the Company's strategy to own and control its infrastructure and its continued focus on cost control.
North Sea – Production ExpenseNorth Sea crude oil production expense for 2020 averaged $36.51 per bbl, comparable with $36.39 per bbl for 2019 (2018 – $39.89 per bbl).
Offshore Africa – Production ExpenseOffshore Africa crude oil production expense for 2020 averaged $13.29 per bbl, an increase of 19% from $11.21 per bbl for 2019 (2018 – $26.34 per bbl). The increase in crude oil production expense per bbl for 2020 from 2019 was primarily due to lower volumes on a relatively fixed cost base. Offshore Africa production expense also reflected fluctuations in the Canadian dollar.
DEPLETION, DEPRECIATION AND AMORTIZATION
($ millions, except per BOE amounts) 2020 2019 2018
North America $ 3,780 $ 3,326 $ 3,132
North Sea 277 308 257
Offshore Africa 190 242 201
Expense $ 4,247 $ 3,876 $ 3,590
$/BOE (1) $ 15.45 $ 15.22 $ 15.12
(1) Amounts expressed on a per unit basis are based on sales volumes.
Depletion, depreciation and amortization expense for 2020 of $15.45 per BOE was comparable with $15.22 per BOE for 2019 (2018 – $15.12 per BOE).
ASSET RETIREMENT OBLIGATION ACCRETION
($ millions, except per BOE amounts) 2020 2019 2018
North America $ 97 $ 95 $ 87
North Sea 30 28 29
Offshore Africa 6 6 9
Expense $ 133 $ 129 $ 125
$/BOE (1) $ 0.48 $ 0.51 $ 0.53
(1) Amounts expressed on a per unit basis are based on sales volumes.
Asset retirement obligation accretion expense represents the increase in the carrying amount of the asset retirement obligation due to the passage of time.
Asset retirement obligation accretion expense for 2020 of $0.48 per BOE decreased 6% from $0.51 per BOE for 2019 (2018 – $0.53 per BOE). Fluctuations in asset retirement obligation accretion expense on a per BOE basis primarily reflect fluctuating sales volumes.

Canadian Natural 2020 Annual Report 27
Oil Sands Mining and UpgradingOPERATING HIGHLIGHTSThe Company continues to focus on safe, reliable and efficient operations and leveraging its technical expertise across the Horizon and AOSP sites. Production in 2020 averaged 417,351 bbl/d, reflecting the ramp-up of production after the completion of expansion activities at AOSP and the successful planned maintenance activities at Horizon, as well as the impact of the Company's curtailment optimization strategy, including the suspension of mandatory Government of Alberta curtailment effective December 1, 2020.
The Company incurred production costs, excluding natural gas costs, of $2,968 million for 2020, a $183 million, or 6% decrease from 2019.
PRODUCT PRICES, ROYALTIES AND TRANSPORTATION
($/bbl) (1) 2020 2019 2018
SCO realized sales price (2) $ 43.98 $ 70.18 $ 68.61
Bitumen value for royalty purposes (3) $ 25.82 $ 50.79 $ 40.02
Bitumen royalties (4) $ 0.51 $ 3.31 $ 3.09
Transportation $ 1.23 $ 1.29 $ 1.61
(1) Amounts expressed on a per unit basis are based on sales volumes.(2) Net of blending and feedstock costs.(3) Calculated as the annual average of the bitumen valuation methodology price.(4) Calculated based on bitumen royalties expensed during the year; divided by the corresponding SCO sales volumes.
The realized SCO sales price averaged $43.98 per bbl for 2020, a decrease of 37% from $70.18 per bbl for 2019 (2018 – $68.61 per bbl). The decrease in the realized SCO sales price for 2020 compared to 2019 primarily reflected the decrease in WTI benchmark pricing.
Transportation expense averaged $1.23 per bbl for 2020, comparable with $1.29 per bbl for 2019 (2018 – $1.61 per bbl).
PRODUCTION COSTSThe following tables are reconciled to the Oil Sands Mining and Upgrading production costs disclosed in note 22 to the Company’s audited consolidated financial statements.
($ millions) 2020 2019 2018
Production costs, excluding natural gas costs $ 2,968 $ 3,151 $ 3,265
Natural gas costs 146 125 102
Production costs $ 3,114 $ 3,276 $ 3,367
($/bbl) (1) 2020 2019 2018
Production costs, excluding natural gas costs $ 19.50 $ 21.70 $ 21.09
Natural gas costs 0.96 0.86 0.66
Production costs $ 20.46 $ 22.56 $ 21.75
Sales (bbl/d) 415,741 397,735 424,112
(1) Amounts expressed on a per unit basis are based on sales volumes.
Production costs for 2020 decreased by $2.10 per bbl or 9% to $20.46 per bbl from $22.56 per bbl for 2019 (2018 – $21.75 per bbl). The decrease in production costs per bbl for 2020 from 2019 primarily reflected high reliability and operational enhancements at both Horizon and AOSP. The Company continued to focus on cost control and efficiencies across the entire asset base.
DEPLETION, DEPRECIATION AND AMORTIZATION
($ millions, except per bbl amounts) 2020 2019 2018
Expense $ 1,784 $ 1,656 $ 1,557
$/bbl (1) $ 11.73 $ 11.41 $ 10.06
(1) Amounts expressed on a per unit basis are based on sales volumes.
Depletion, depreciation and amortization expense for 2020 of $11.73 per bbl was comparable with $11.41 per bbl for 2019 (2018 – $10.06 per bbl). Fluctuations in depletion, depreciation and amortization on a per barrel basis primarily reflect fluctuating sales volumes from different underlying operations.

28Canadian Natural 2020 Annual Report
ASSET RETIREMENT OBLIGATION ACCRETION
($ millions, except per bbl amounts) 2020 2019 2018
Expense $ 72 $ 61 $ 61
$/bbl (1) $ 0.47 $ 0.42 $ 0.40
(1) Amounts expressed on a per unit basis are based on sales volumes.
Asset retirement obligation accretion expense represents the increase in the carrying amount of the asset retirement obligation due to the passage of time.
Asset retirement obligation accretion expense for 2020 of $0.47 per bbl increased 12% from $0.42 per bbl for 2019 (2018 – $0.40 per bbl). Fluctuations in asset retirement obligation accretion expense on a per barrel basis primarily reflect fluctuating sales volumes.
Midstream and Refining($ millions) 2020 2019 2018
Product sales
Crude oil and NGLs, midstream activities $ 83 $ 88 $ 102
NWRP, refined product sales 202 — —
Segmented revenue 285 88 102
Less:
Production expenses
NWRP, refining toll 166 — —
Midstream 18 20 21
NWRP, transportation and feedstock costs 181 — —
Depreciation 15 14 14
Equity loss from investment in NWRP — 287 5
Segmented earnings (loss) before taxes $ (95) $ (233) $ 62
The Company's Midstream and Refining assets consist of two crude oil pipeline systems, a 50% working interest in an 84-megawatt cogeneration plant at Primrose and the Company's 50% interest in NWRP. Approximately 30% of the Company's heavy crude oil production was transported to international mainline liquid pipelines via the 100% owned and operated ECHO and Pelican Lake pipelines. The Midstream pipeline asset ownership allows the Company to control transportation costs, earn third party revenue, and manage the marketing of heavy crude oils.
NWRP operates a 50,000 bbl/d bitumen upgrader and refinery that targets to process 12,500 bbl/d of bitumen feedstock for the Company and 37,500 bbl/d of bitumen feedstock for the Alberta Petroleum Marketing Commission, an agent of the Government of Alberta, under a 30-year fee-for-service tolling agreement.
On June 1, 2020, the refinery achieved the Commercial Operation Date, pursuant to the terms of the tolling agreement. The Company is unconditionally obligated to pay its 25% pro rata share of the debt tolls over the 30-year tolling period. For the year ended December 31, 2020, production of ultra-low sulphur diesel and other refined products averaged 58,694 BOE/d (14,673 BOE/d to the Company).
NWRP has a secured $3,500 million syndicated credit facility, of which $2,000 million is revolving and matures in June 2021 and the remaining $1,500 million is fully drawn on a non-revolving basis. In 2019, NWRP extended the $1,500 million non-revolving facility, previously scheduled to mature in February 2020, to February 2021. Subsequent to December 31, 2020, NWRP extended the $1,500 million non-revolving facility to June 2021. As at December 31, 2020, NWRP had borrowings of $2,866 million under the secured syndicated credit facility.
The Company's unrecognized share of the equity loss from NWRP for 2020 was $94 million (December 31, 2019 – recognized equity loss of $287 million and unrecognized equity loss of $59 million; December 31, 2018 – recognized equity loss of $5 million). As at December 31, 2020, the cumulative unrecognized share of losses from NWRP was $153 million (December 31, 2019 – $59 million).

Canadian Natural 2020 Annual Report 29
Corporate and Other
ADMINISTRATION EXPENSE
($ millions, except per BOE amounts) 2020 2019 2018
Expense $ 391 $ 344 $ 325
$/BOE (1) $ 0.92 $ 0.86 $ 0.83
(1) Amounts expressed on a per unit basis are based on sales volumes.
Administration expense for 2020 of $0.92 per BOE increased 7% from $0.86 per BOE for 2019 (2018 – $0.83 per BOE). Administration expense per BOE increased for 2020 from 2019 primarily due to lower overhead recoveries and increased corporate and personnel costs.
SHARE-BASED COMPENSATION($ millions) 2020 2019 2018
(Recovery) expense $ (82) $ 223 $ (146)
The Company’s Stock Option Plan provides employees with the right to receive common shares or a cash payment in exchange for stock options surrendered. The PSU plan provides certain executive employees of the Company with the right to receive a cash payment, the amount of which is determined by individual employee performance and the extent to which certain other performance measures are met.
The Company recognized an $82 million share-based compensation recovery for 2020, primarily as a result of the measurement of the fair value of outstanding stock options related to the impact of normal course graded vesting of stock options granted in prior periods, the impact of vested stock options exercised or surrendered during the period, and changes in the Company’s share price. Included within the share-based compensation recovery for 2020 was an expense of $21 million related to PSUs granted to certain executive employees (2019 – $49 million expense; 2018 – $8 million expense). For 2020, the Company charged $5 million of share-based compensation costs to the Oil Sands Mining and Upgrading segment (2019 – $5 million charged, 2018 – $19 million recovered).
INTEREST AND OTHER FINANCING EXPENSE
($ millions, except per BOE amounts and interest rates) 2020 2019 2018
Expense, gross $ 780 $ 889 $ 808
Less: capitalized interest 24 53 69
Expense, net $ 756 $ 836 $ 739
$/BOE (1) $ 1.77 $ 2.09 $ 1.88
Average effective interest rate 3.5% 4.0% 3.9%
(1) Amounts expressed on a per unit basis are based on sales volumes.
Gross interest and other financing expense for 2020 decreased from 2019 primarily due to lower interest rates. Capitalized interest of $24 million for 2020 was related to residual project activities at Horizon.
Net interest and other financing expense per BOE for 2020 decreased 15% to $1.77 per BOE from $2.09 per BOE for 2019 (2018 – $1.88 per BOE). The decrease in net interest and other financing expense per BOE for 2020 from 2019 was primarily due to lower average interest rates.
The Company’s average effective interest rate for 2020 decreased from 2019 primarily due to the impact of lower benchmark interest rates on the Company's outstanding bank credit facilities and US commercial paper program.

30Canadian Natural 2020 Annual Report
RISK MANAGEMENT ACTIVITIES The Company utilizes various derivative financial instruments to manage its commodity price, interest rate and foreign currency exposures. These derivative financial instruments are not intended for trading or speculative purposes.
($ millions) 2020 2019 2018
Foreign currency contracts $ 16 $ 13 $ (77)
Natural gas financial instruments 16 (1) 5
Crude oil and NGLs financial instruments — 52 (27)
Net realized loss (gain) $ 32 $ 64 $ (99)
Foreign currency contracts $ (3) $ 15 $ (47)
Natural gas financial instruments (36) 15 (4)
Crude oil and NGLs financial instruments — (17) 16
Net unrealized (gain) loss $ (39) $ 13 $ (35)
Net (gain) loss $ (7) $ 77 $ (134)
During 2020, net realized risk management losses were related to the settlement of foreign currency contracts and natural gas financial instruments. The Company recorded a net unrealized gain of $39 million ($31 million after-tax) on its risk management activities for 2020, including the impact of natural gas financial instruments from the Painted Pony acquisition in 2020 (2019 – $13 million unrealized loss, $14 million after-tax; 2018 – $35 million unrealized gain, $36 million after-tax).
Further details related to outstanding derivative financial instruments at December 31, 2020 are disclosed in note 19 to the Company's audited consolidated financial statements.
FOREIGN EXCHANGE
($ millions) 2020 2019 2018
Net realized (gain) loss $ (159) $ (22) $ 121
Net unrealized (gain) loss (116) (548) 706
Net (gain) loss (1) $ (275) $ (570) $ 827
(1) Amounts are reported net of the hedging effect of cross currency swaps.
The net realized foreign exchange gain for 2020 was primarily due to foreign exchange rate fluctuations on settlement of working capital items denominated in US dollars or UK pounds sterling, and the settlement of the US$500 million cross currency swaps in 2020. The net unrealized foreign exchange gain for 2020 was primarily related to the impact of a stronger Canadian dollar with respect to outstanding US dollar debt. The net unrealized (gain) loss for each of the periods presented reflected the impact of the cross currency swaps, including the settlement of US$500 million in cross currency swaps in 2020 (2020 – unrealized loss of $150 million, 2019 – unrealized loss of $71 million, 2018 – unrealized gain of $118 million). The US/Canadian dollar exchange rate at December 31, 2020 was US$0.7840 (December 31, 2019 – US$0.7713, December 31, 2018 – US$0.7328).

Canadian Natural 2020 Annual Report 31
INCOME TAXES
($ millions, except income tax rates) 2020 2019 2018
North America (1) $ (245) $ 354 $ 312
North Sea (4) 112 28
Offshore Africa 17 44 54
PRT – North Sea (31) (89) (29)
Other taxes 6 13 9
Current income tax (recovery) expense (257) 434 374
Deferred corporate income tax (recovery) expense (181) (895) 540
Deferred PRT – North Sea — 1 17
Deferred income tax (recovery) expense (181) (894) 557
Income tax (recovery) expense (438) (460) 931
Income tax rate and other legislative changes — 1,618 —
$ (438) $ 1,158 $ 931
Effective income tax rate on adjusted net earnings (loss) from operations (2) 34% 25% 21%
(1) Includes North America Exploration and Production, Oil Sands Mining and Upgrading, and Midstream and Refining segments.(2) Excludes the impact of current and deferred PRT and other current income tax.
The effective income tax rate for 2020 and the comparable years included the impact of non-taxable items in North America and North Sea and the impact of differences in jurisdictional income and tax rates in the countries in which the Company operates, in relation to net earnings (loss).
The current corporate income tax and PRT in the North Sea in 2020 and the comparable years included the impact of carrybacks of abandonment expenditures related to decommissioning activities at the Company's platforms in the North Sea.
During 2019, the Government of Alberta enacted legislation that decreased the provincial corporate income tax rate from 12% to 11% effective July 1, 2019, with a further 1% rate reduction every year on January 1 until the provincial corporate income tax rate is 8% on January 1, 2022. As a result of this corporate income tax rate reduction, the Company's deferred corporate income tax liability decreased by $1,618 million for 2019. During 2020, the Government of Alberta substantively enacted legislation to accelerate this reduction, lowering the corporate tax rate from 10% to 8%, effective July 1, 2020. This acceleration did not have a significant impact on the Company's deferred corporate income tax liability for 2020.
The Company files income tax returns in the various jurisdictions in which it operates. These tax returns are subject to periodic examinations in the normal course by the applicable tax authorities. The tax returns as prepared may include filing positions that could be subject to differing interpretations of applicable tax laws and regulations, which may take several years to resolve. The Company does not believe the ultimate resolution of these matters will have a material impact upon the Company’s reported results of operations, financial position or liquidity.
During 2020, the Company filed Scientific Research and Experimental Development claims of approximately $246 million (2019 – $250 million; 2018 – $265 million) relating to qualifying research and development expenditures for Canadian income tax purposes.

32Canadian Natural 2020 Annual Report
Net Capital Expenditures (1)
($ millions) 2020 2019 2018
Exploration and Evaluation
Net property (dispositions) acquisitions (2) $ (31) $ 90 $ (74)
Net expenditures 36 74 122
Total Exploration and Evaluation 5 164 48
Property, Plant and Equipment
Net property acquisitions (2) (3) 536 3,208 98
Well drilling, completion and equipping 429 775 1,446
Production and related facilities 580 1,028 1,262
Capitalized interest and other 60 81 106
Total Property, Plant and Equipment 1,605 5,092 2,912
Total Exploration and Production 1,610 5,256 2,960
Oil Sands Mining and Upgrading
Project costs 258 436 438
Sustaining capital 839 933 665
Turnaround costs 196 118 112
Acquisitions of Exploration and Evaluation assets (4) — — 218
Capitalized interest and other 30 38 14
Total Oil Sands Mining and Upgrading 1,323 1,525 1,447
Midstream and Refining 5 10 13
Abandonments (5) 249 296 290
Head office 19 34 21
Total net capital expenditures $ 3,206 $ 7,121 $ 4,731
By segment
North America (2) (3) $ 1,389 $ 4,831 $ 2,671
North Sea 122 196 131
Offshore Africa 99 229 158
Oil Sands Mining and Upgrading (4) 1,323 1,525 1,447
Midstream and Refining 5 10 13
Abandonments (5) 249 296 290
Head office 19 34 21
Total $ 3,206 $ 7,121 $ 4,731
(1) Net capital expenditures exclude the impact of lease assets and fair value and revaluation adjustments, and include non-cash transfers of property, plant and equipment to inventory due to change in use.
(2) Includes cash consideration paid of $91 million for exploration and evaluation assets and $3,126 million for property, plant and equipment acquired from Devon in 2019.
(3) Includes cash consideration of $111 million and the settlement of long-term debt of $397 million assumed in the acquisition of Painted Pony in 2020. (4) In the third quarter of 2018, total purchase consideration for the acquisition of the Joslyn oil sands project included $222 million for exploration and evaluation
assets and $4 million for asset retirement obligations assumed. In the fourth quarter of 2018, following integration of the Joslyn oil sands project into the Horizon mine plan and determination of proved crude oil reserves, the exploration and evaluation assets were transferred to property, plant, and equipment.
(5) Abandonments represent expenditures to settle asset retirement obligations and have been reflected as capital expenditures in this table.

Canadian Natural 2020 Annual Report 33
NET CAPITAL EXPENDITURES, AS RECONCILED TO CASH FLOWS USED IN INVESTING ACTIVITIES
($ millions) 2020 2019 2018
Cash flows used in investing activities $ 2,819 $ 7,255 $ 4,814
Net change in non-cash working capital (1) (383) (430) (345)
Repayment of NWRP subordinated debt (2) 124 — —
Investment in other long-term assets — — (28)
Abandonment expenditures (3) 249 296 290
Other (4) 397 — —
Net capital expenditures $ 3,206 $ 7,121 $ 4,731
(1) Includes net working capital and other long-term assets of $195 million related to the acquisition of assets from Devon in 2019.(2) Relates to a partial repayment of the Company's subordinated debt advances to NWRP. (3) The Company excludes abandonment expenditures from "Adjusted Funds Flow, as Reconciled to Cash Flows from Operating Activities" in the "Financial
and Operational Highlights" section of this MD&A.(4) Relates to the settlement of long-term debt assumed in the acquisition of Painted Pony in 2020.
The Company’s strategy is focused on building a diversified asset base that is balanced among various products. In order to facilitate efficient operations, the Company concentrates its activities in core areas. The Company focuses on maintaining its land inventories to enable the continuous development of play types and geological trends, greatly reducing overall exploration risk. By owning associated infrastructure, the Company is able to maximize utilization of its production facilities, thereby increasing control over production expenses.
DRILLING ACTIVITY (1)
(number of net wells) 2020 2019 2018
Net successful natural gas wells 30 19 18
Net successful crude oil wells (2) 42 86 483
Dry wells — 3 9
Stratigraphic test / service wells 372 447 615
Total 444 555 1,125
Success rate (excluding stratigraphic test / service wells) 100% 97% 98%
(1) Includes drilling activity for North America and International segments. (2) Includes bitumen wells.
North AmericaDuring 2020, the Company targeted 30 net natural gas wells, 6 net primary heavy crude oil wells, 6 net bitumen (thermal oil) wells and 29 net wells targeting light crude oil.
North SeaDuring 2020, the Company completed 1 gross light crude oil well (1.0 on a net basis).

34Canadian Natural 2020 Annual Report
Liquidity and Capital Resources($ millions, except ratios) 2020 2019 2018
Working capital (1) $ 626 $ 241 $ (601)
Long-term debt (2) (3) $ 21,453 $ 20,982 $ 20,623
Less: cash and cash equivalents 184 139 101
Long-term debt, net $ 21,269 $ 20,843 $ 20,522
Share capital $ 9,606 $ 9,533 $ 9,323
Retained earnings 22,766 25,424 22,529
Accumulated other comprehensive income 8 34 122
Shareholders’ equity $ 32,380 $ 34,991 $ 31,974
Debt to book capitalization (3) (4) 40% 37% 39%
Debt to market capitalization (3) (5) 37% 30% 34%
After-tax return on average common shareholders’ equity (6) (1)% 16% 8%
After-tax return on average capital employed (3) (7) —% 11% 6%
(1) Calculated as current assets less current liabilities, excluding the current portion of long-term debt.(2) Includes the current portion of long-term debt (2020 - $1,343 million, 2019 - $2,391 million, 2018 - $1,141 million). (3) Long-term debt is stated at its carrying value, net of original issue discounts and premiums and transaction costs.(4) Calculated as net current and long-term debt; divided by the book value of common shareholders’ equity plus net current and long-term debt.(5) Calculated as net current and long-term debt; divided by the market value of common shareholders’ equity plus net current and long-term debt.(6) Calculated as net earnings (loss) for the year; as a percentage of average common shareholders’ equity for the year.(7) Calculated as net earnings (loss) plus after-tax interest and other financing expense for the year; as a percentage of average capital employed (defined as
current and long-term debt plus shareholders' equity) for the year.
As at December 31, 2020, the Company’s capital resources consisted primarily of cash flows from operating activities, available bank credit facilities and access to debt capital markets. Cash flows from operating activities and the Company’s ability to renew existing bank credit facilities and raise new debt is dependent on factors discussed in the "Business Environment" section and in the "Risks and Uncertainties" section of this MD&A. In addition, the Company’s ability to renew existing bank credit facilities and raise new debt reflects current credit ratings as determined by independent rating agencies, and market conditions. The Company continues to believe that its internally generated cash flows from operating activities supported by the implementation of its ongoing hedge policy, the flexibility of its capital expenditure programs and multi-year financial plans, its existing bank credit facilities, and its ability to raise new debt on commercially acceptable terms will provide sufficient liquidity to sustain its operations in the short, medium and long-term and support its growth strategy.
On an ongoing basis the Company continues to focus on its balance sheet strength and available liquidity by:
■ Monitoring cash flows from operating activities, which is the primary source of funds; ■ Monitoring exposure to individual customers, contractors, suppliers and joint venture partners on a regular basis and when
appropriate, ensuring parental guarantees or letters of credit are in place, and as applicable, taking other mitigating actions to minimize the impact in the event of a default;
■ Actively managing the allocation of maintenance and growth capital to ensure it is expended in a prudent and appropriate manner with flexibility to adjust to market conditions. The Company continues to exercise its capital flexibility to address commodity price volatility and its impact on operating expenditures, capital commitments and long-term debt;
■ Monitoring the Company's ability to fulfill financial obligations as they become due or the ability to monetize assets in a timely manner at a reasonable price;
■ Reviewing bank credit facilities and public debt indentures to ensure they are in compliance with applicable covenant packages; and
■ Reviewing the Company's borrowing capacity: • During 2020, the Company issued $500 million of 1.45% notes due November 2023 and $300 million of 2.50%
notes due January 2028. After issuing these securities, the Company had $2,200 million remaining on its base shelf prospectus that allows for the offer for sale from time to time of up to $3,000 million of medium-term notes in Canada, which expires in August 2021. If issued, these securities may be offered in amounts and at prices, including interest rates, to be determined based on market conditions at the time of issuance.

Canadian Natural 2020 Annual Report 35
• During 2020, the Company issued US$600 million of 2.05% notes due July 2025 and US$500 million of 2.95% notes due July 2030. After issuing these securities, the Company had US$1,900 million remaining on its base shelf prospectus that allows for the offer for sale from time to time of up to US$3,000 million of debt securities in the United States, which expires in August 2021. If issued these securities may be offered in amounts and at prices, including interest rates, to be determined based on market conditions at the time of issuance.
• During 2020, the Company repaid $900 million of 2.05% medium-term notes and repaid $1,000 million of 2.89% medium-term notes.
• Each of the Company’s $2,425 million revolving credit facilities is extendible annually at the mutual agreement of the Company and the lenders. If the facilities are not extended, the full amount of the outstanding principal is repayable on the maturity date. Borrowings under the Company's revolving term credit facilities may be made by way of pricing referenced to Canadian dollar bankers' acceptances, US dollar bankers' acceptances, LIBOR, US base rate or Canadian prime rate.
• Borrowings under the Company's non-revolving term credit facilities may be made by way of pricing referenced to Canadian dollar bankers’ acceptances, US dollar bankers’ acceptances, LIBOR, US base rate or Canadian prime rate. As at December 31, 2020, the non-revolving term credit facilities were fully drawn.
• During 2020, the $750 million non-revolving term credit facility, originally due February 2021, was extended to February 2022 and increased to $1,000 million. Subsequent to December 31, 2020, the facility was extended to February 2023.
• During 2019, the Company entered into a $3,250 million non-revolving term credit facility to finance the acquisition of assets from Devon. During 2020, the Company repaid $162.5 million related to the required annual amortization, reducing the facility balance to $3,088 million. Subsequent to December 31, 2020, the Company repaid a further $362.5 million on the faciltity, reducing the outstanding balance to $2,725 million, and satisfying the required annual amortization of $162.5 million originally due in June 2021. The facility matures in June 2022.
• The Company’s borrowings under its US commercial paper program are authorized up to a maximum of US$2,500 million. The Company reserves capacity under its revolving bank credit facilities for amounts outstanding under this program.
As at December 31, 2020, the Company had undrawn revolving bank credit facilities of $4,958 million. Including cash and cash equivalents and short-term investments, the Company had approximately $5,447 million in liquidity. Additionally, the Company had in place fully drawn term credit facilities of $6,738 million. The Company also has certain other dedicated credit facilities supporting letters of credit. At December 31, 2020, the Company had $544 million drawn under its commercial paper program, and reserves capacity under its revolving bank credit facilities for amounts outstanding under this program.
As at December 31, 2020, the Company had total US dollar denominated debt with a carrying amount of $16,746 million (US$13,129 million), before transaction costs and original issue discounts. This included $6,287 million (US$4,929 million) hedged by way of a cross currency swap (US$550 million) and foreign currency forwards (US$4,379 million). The fixed repayment amount of these hedging instruments is $6,337 million, resulting in a notional increase of the carrying amount of the Company’s US dollar denominated debt by approximately $50 million to $16,796 million as at December 31, 2020.
During 2020, the Company settled the US$500 million cross currency swaps designated as cash flow hedges of the US$500 million 3.45% US dollar debt securities due November 2021. The Company realized cash proceeds of $166 million on settlement.
Net long-term debt was $21,269 million at December 31, 2020, resulting in a debt to book capitalization ratio of 40% (December 31, 2019 – 37%, December 31, 2018 – 39%); this ratio is within the 25% to 45% internal range utilized by management. This range may be exceeded in periods when a combination of capital projects, acquisitions, or lower commodity prices occurs. The Company may be below the low end of the targeted range when cash flows from operating activities are greater than current investment activities. The Company remains committed to maintaining a strong balance sheet, adequate available liquidity and a flexible capital structure. Further details related to the Company’s long-term debt at December 31, 2020 are discussed in note 11 to the Company’s audited consolidated financial statements.
The Company is subject to a financial covenant that requires debt to book capitalization as defined in its credit facility agreements to not exceed 65%. As at December 31, 2020, the Company was in compliance with this covenant.
The Company periodically utilizes commodity derivative financial instruments under its commodity hedge policy to reduce the risk of volatility in commodity prices and to support the Company’s cash flow for its capital expenditure programs. This policy currently allows for the hedging of up to 60% of the near 12 months budgeted production and up to 40% of the following 13 to 24 months estimated production. For the purpose of this policy, the purchase of put options is in addition to the above parameters. Further details related to the Company’s commodity derivative financial instruments outstanding at December 31, 2020 are discussed in note 19 of the Company’s audited consolidated financial statements.

36Canadian Natural 2020 Annual Report
The maturity dates of long-term debt and other long-term liabilities and related interest payments were as follows:
Less than
1 year1 to less than
2 years2 to less than
5 years Thereafter
Long-term debt (1) $ 1,343 $ 4,887 $ 7,051 $ 8,279
Other long-term liabilities (2) $ 345 $ 200 $ 435 $ 942
Interest and other financing expense (3) $ 776 $ 693 $ 1,619 $ 4,452
(1) Long-term debt represents principal repayments only and does not reflect interest, original issue discounts and premiums or transaction costs.(2) Lease payments included within other long-term liabilities reflect principal payments only and are as follows: less than one year, $189 million; one to less
than two years, $162 million; two to less than five years, $397 million; and thereafter, $942 million.(3) Includes interest and other financing expense on long-term debt and other long-term liabilities. Payments were estimated based upon applicable interest
and foreign exchange rates as at December 31, 2020.
SHARE CAPITALAs at December 31, 2020, there were 1,183,866,000 common shares outstanding (December 31, 2019 – 1,186,857,000 common shares) and 48,656,000 stock options outstanding. As at March 2, 2021, the Company had 1,185,574,000 common shares outstanding and 53,829,000 stock options outstanding.
On March 3, 2021, the Board of Directors approved an increase in the quarterly dividend to $0.47 per common share, beginning with the dividend payable on April 5, 2021. On March 4, 2020, the Board of Directors approved an increase in the quarterly dividend to $0.425 per common share. On March 6, 2019, the Board of Directors approved an increase in the quarterly dividend to $0.375 per common share. On February 28, 2018, the Board of Directors approved an increase in the quarterly dividend to $0.335 per common share. The dividend policy undergoes periodic review by the Board of Directors and is subject to change.
On May 21, 2019, the Company's application was approved for a Normal Course Issuer Bid to purchase through the facilities of the TSX, alternative Canadian trading platforms, and the NYSE, up to 59,729,706 common shares, over a 12-month period commencing May 23, 2019 and ending May 22, 2020. The Company did not renew its Normal Course Issuer Bid after its expiry in May 2020.
During 2020, the Company purchased 6,970,000 common shares at a weighted average price of $38.84 per common share for a total cost of $271 million. Retained earnings were reduced by $215 million, representing the excess of the purchase price of common shares over their average carrying value.
On March 3, 2021, the Board of Directors approved a resolution authorizing the Company to file a Notice of Intention with the TSX to purchase, by way of a Normal Course Issuer Bid, up to 5.0% of its issued and outstanding common shares for the purpose of repurchasing a number of common shares approximately equal to the number of options exercised throughout the year in order to eliminate dilution for shareholders. Subject to acceptance of the Notice of Intention by the TSX, the purchases would be made through facilities of the TSX, alternative Canadian trading platforms, and the NYSE.
Commitments and ContingenciesIn the normal course of business, the Company has committed to certain payments. The following table summarizes the Company’s commitments as at December 31, 2020:
($ millions) 2021 2022 2023 2024 2025 Thereafter
Product transportation and processing (1) (2) $ 870 $ 817 $ 858 $ 841 $ 809 $ 10,370
North West Redwater Partnership service toll (3) $ 163 $ 160 $ 160 $ 156 $ 150 $ 2,694
Offshore vessels and equipment $ 64 $ 9 $ — $ — $ — $ —
Field equipment and power $ 28 $ 21 $ 21 $ 21 $ 21 $ 246
Other $ 25 $ 21 $ 21 $ 22 $ 22 $ 16
(1) Includes commitments pertaining to a 20-year product transportation agreement on the Trans Mountain Pipeline Expansion. In addition, the Company has entered into certain product transportation agreements on pipelines that have not yet received regulatory and other approvals.
(2) The acquisition of Painted Pony in 2020 included approximately $2,400 million of product transportation and processing commitments. (3) Pursuant to the processing agreements, on June 1, 2018 the Company began paying its 25% pro rata share of the debt component of the monthly cost of
service tolls. Included in the cost of service tolls is $1,169 million of interest payable over the 30-year tolling period.
In addition to the commitments disclosed above, the Company has entered into various agreements related to the engineering, procurement and construction of its various development projects. These contracts can be cancelled by the Company upon notice without penalty, subject to the costs incurred up to and in respect of the cancellation.
LEGAL PROCEEDINGS AND OTHER CONTINGENCIESThe Company is defendant and plaintiff in a number of legal actions arising in the normal course of business. In addition, the Company is subject to certain contractor construction claims. The Company believes that any liabilities that might arise pertaining to any such matters would not have a material effect on its consolidated financial position.

Canadian Natural 2020 Annual Report 37
ReservesFor the years ended December 31, 2020 and 2019, the Company retained Independent Qualified Reserves Evaluators to evaluate and review all of the Company’s total proved and total proved plus probable reserves. The evaluation and review was conducted and prepared in accordance with the standards contained in the Canadian Oil and Gas Evaluation Handbook ("COGE Handbook") and disclosed in accordance with National Instrument 51-101 – Standards of Disclosure for Oil and Gas Activities ("NI 51-101") requirements.
The following are reconciliation tables of the company gross total proved and total proved plus probable reserves using forecast prices and costs as at the effective date of December 31, 2020:
Total Proved
Light and Medium
Crude Oil
PrimaryHeavy
Crude Oil
Pelican Lake
HeavyCrude Oil
Bitumen (Thermal
Oil)SyntheticCrude Oil
Natural Gas
Natural Gas
Liquids
Barrelsof Oil
Equivalent
(MMbbl) (MMbbl) (MMbbl) (MMbbl) (MMbbl) (Bcf) (MMbbl) (MMBOE)
December 31, 2019 357 202 293 2,438 6,352 6,460 275 10,993
Discoveries — — — — — — — —
Extensions 2 — — 17 720 226 11 787
Infill Drilling 3 3 — — — 290 13 66
Improved Recovery — — — 73 — — — 73
Acquisitions 1 — — — — 2,932 31 521
Dispositions — — — — — (4) — (1)
Economic Factors (20) (10) (13) — — (197) (8) (83)
Technical Revisions 4 8 6 45 43 297 19 175
Production (31) (26) (21) (91) (153) (541) (15) (426)
December 31, 2020 (1) 315 177 265 2,483 6,962 9,465 326 12,106
Total Proved PlusProbable
Light and Medium
Crude Oil
PrimaryHeavy
Crude Oil
Pelican Lake
HeavyCrude Oil
Bitumen (Thermal
Oil)Synthetic Crude Oil
Natural Gas
Natural Gas
Liquids
Barrels
of OilEquivalent
(MMbbl) (MMbbl) (MMbbl) (MMbbl) (MMbbl) (Bcf) (MMbbl) (MMBOE)
December 31, 2019 519 293 425 4,108 6,897 9,607 408 14,252
Discoveries — — — — — — — —
Extensions 3 1 — 21 717 374 20 825
Infill Drilling 4 4 — — — 384 17 88
Improved Recovery — — — 106 — — — 106
Acquisitions 1 — — — — 6,238 62 1,102
Dispositions — — — — — (5) — (1)
Economic Factors (18) (13) (5) — — (249) (9) (86)
Technical Revisions (15) 1 (4) 13 34 113 17 65
Production (31) (26) (21) (91) (153) (541) (15) (426)
December 31, 2020 (1) 463 260 395 4,157 7,496 15,922 500 15,925
(1) Information in the reserves data tables may not add due to rounding. BOE values as presented may not calculate due to rounding.
At December 31, 2020, the total proved crude oil, bitumen (thermal oil) and NGLs reserves were 10,528 MMbbl, and total proved plus probable crude oil, bitumen (thermal oil) and NGLs reserves were 13,271 MMbbl. Total proved reserves additions and revisions replaced 282% of 2020 production. Additions to total proved reserves resulting from exploration and development activities, acquisitions, dispositions and future offset additions amounted to 872 MMbbl, and additions to total proved plus probable reserves amounted to 955 MMbbl. Net positive revisions amounted to 75 MMbbl for total proved reserves and 1 MMbbl for total proved plus probable reserves, primarily due to technical revisions.
At December 31, 2020, the total proved natural gas reserves were 9,465 Bcf, and total proved plus probable natural gas reserves were 15,922 Bcf. Total proved reserves additions and revisions replaced 656% of 2020 production. Additions to total proved reserves resulting from exploration and development activities, acquisitions, dispositions and future offset additions amounted to 3,445 Bcf, and additions to total proved plus probable reserves amounted to 6,991 Bcf. Net positive revisions amounted to 100 Bcf for total proved reserves, primarily due to technical revisions, and net negative revisions amounted to 136 Bcf for total proved plus probable reserves, primarily due to economic factors.

38Canadian Natural 2020 Annual Report
The Reserves Committee of the Company’s Board of Directors has met with and carried out independent due diligence procedures with each of the Company’s Independent Qualified Reserves Evaluators to review the qualifications of and procedures used by each evaluator in determining the estimate of the Company’s quantities and related net present value of future net revenue of the remaining reserves. Additional reserves information is annually disclosed in the AIF.
The Company annually discloses net proved reserves and the standardized measure of discounted future net cash flows using 12-month average prices and current costs in accordance with United States FASB Topic 932 "Extractive Activities - Oil and Gas" in the Company’s annual report on Form 40-F filed with the SEC and in the "Supplementary Oil and Gas Information" section of the Company’s Annual Report.
Risks and UncertaintiesThe Company is exposed to various operational risks inherent in the exploration, development, production and marketing of crude oil and NGLs and natural gas and the mining, extracting and upgrading of bitumen into SCO. These inherent risks include, but are not limited to, the following:
■ Volatility in the prevailing prices of crude oil and NGLs, natural gas and refined products; ■ The ability to find, produce and replace reserves, whether sourced from exploration, improved recovery or acquisitions, at
a reasonable cost, including the risk of reserves revisions due to economic and technical factors. Reserves revisions can have a positive or negative impact on asset valuations, ARO and depletion rates;
■ Reservoir quality and uncertainty of reserves estimates; ■ Regulatory risk related to approval for exploration and development activities, which can add to costs or cause delays in
projects; ■ Labour risk associated with securing the manpower necessary to complete capital projects in a timely and cost effective
manner; ■ Operating hazards and other difficulties inherent in the exploration for and production and sale of crude oil and natural gas
and in mining, extracting and upgrading the Company’s bitumen products; ■ Timing and success of integrating the business and operations of acquired companies and assets; ■ Credit risk related to non-payment for sales contracts or non-performance by counterparties to contracts, including
derivative financial instruments and physical sales contracts as part of a hedging program; ■ Interest rate risk associated with the Company’s ability to secure financing on commercially acceptable terms; ■ Foreign exchange risk due to the effect of fluctuating exchange rates on the Company’s US dollar denominated debt and
revenue from sales predominantly based on US dollar denominated benchmarks; ■ Environmental impact risk associated with exploration and development activities, including GHG; ■ Geopolitical risks associated with changing governments or governmental policies, social instability and other political,
economic or diplomatic developments in the regions where the Company has its operations; ■ Future legislative and regulatory developments related to environmental regulation, including GHG and carbon; ■ Potential actions of governments, regulatory authorities and other stakeholders that may result in costs or restrictions in
the jurisdictions where the Company has operations, including but not limited to restrictions on production; ■ Changing royalty regimes; ■ Business interruptions because of unexpected events such as fires or explosions whether caused by human error or
nature, severe storms and other calamitous acts of nature, blowouts, freeze-ups, mechanical or equipment failures of facilities and infrastructure and other similar events affecting the Company or other parties whose operations or assets directly or indirectly impact the Company and that may or may not be financially recoverable;
■ Epidemics or pandemics, such as COVID-19, have the potential to disrupt the Company’s operations, projects and financial condition through the disruption of the local or global supply chain and transportation services, or the loss of manpower resulting from quarantines that affect the Company’s labour pools in their local communities, workforce camps or operating sites or that are instituted by local health authorities as a precautionary measure, any of which may require the Company to temporarily reduce or shutdown its operations depending on the extent and severity of a potential outbreak and the areas or operations impacted. Depending on the severity, a large scale epidemic or pandemic could impact the international demand for commodities and have a corresponding impact on the prices realized by the Company, which could have a material adverse effect on the Company's financial condition;
■ The ability to secure adequate transportation for products, which could be affected by pipeline constraints, the construction by third parties of new or expansion of existing pipeline capacity and other factors;
■ The access to markets for the Company’s products; ■ The risk of significant interruption or failure of the Company's information technology systems and related data and control
systems or a significant breach that could adversely affect the Company's operations;

Canadian Natural 2020 Annual Report 39
■ Liquidity risk related to the Company's ability to fulfill financial obligations as they become due or ability to liquidate assets in a timely manner at a reasonable price; and
■ Other circumstances affecting revenue and expenses.
The Company uses a variety of means to seek to mitigate and/or minimize these risks. The Company maintains a comprehensive property loss and business interruption insurance program to reduce risk. Operational control is enhanced by focusing efforts on large core areas with high working interests and by assuming operatorship of key facilities. Product mix is diversified, consisting of the production of natural gas and the production of crude oil of various grades. The Company believes this diversification reduces price risk when compared with over-leverage to one commodity. Accounts receivable from the sale of crude oil and natural gas are mainly with customers in the crude oil and natural gas industry and are subject to normal industry credit risks. The Company seeks to manage these risks by monitoring exposure to individual customers, contractors, suppliers and joint venture partners on a regular basis and when appropriate, ensuring parental guarantees or letters of credit are in place, and as applicable, taking other mitigating actions to minimize the impact in the event of a default. Derivative financial instruments are periodically utilized to help ensure targets are met and to manage commodity price, foreign currency and interest rate exposures. The Company is exposed to possible losses in the event of non-performance by counterparties to derivative financial instruments; however, the Company seeks to manage this credit risk by entering into agreements with counterparties that are substantially all investment grade financial institutions. The arrangements and policies concerning the Company’s financial instruments are under constant review and may change depending upon the prevailing market conditions. Management of liquidity risk requires the Company to maintain sufficient cash and cash equivalents, along with other sources of capital, consisting primarily of cash flow from operating activities, available credit facilities, commercial paper and access to debt capital markets, to meet obligations as they become due. The Company has implemented cyber security protocols and procedures designed to reduce the risk of failure or a significant breach of the Company’s information technology systems and related data and control systems.
The Company has safety, integrity and environmental management systems to recover and process crude oil and natural gas resources safely, efficiently, and in an environmentally sustainable manner and mitigate risk.
The Company’s capital structure mix is also monitored on a continual basis to ensure that it optimizes flexibility, minimizes cost and offers the greatest opportunity for growth. This includes the determination of a reasonable level of debt and any interest rate exposure risk that may exist.
For additional details regarding the Company’s risks and uncertainties, refer to the Company’s AIF for the year ended December 31, 2020.
EnvironmentThe Company has a Corporate Statement on Environmental Management that affirms environmental stewardship as a fundamental value of the Company. The Company continues to invest in people, proven and new technologies, facilities and infrastructure to recover and process crude oil and natural gas resources efficiently and in an environmentally sustainable manner. Environmental, social, economic and health considerations are evaluated in new project designs and in operations to improve environmental performance. Processes are employed to avoid, mitigate, minimize or compensate for environmental effects. Working with local communities, the Company considers the interests and values of the people using the land in proximity to its operations, and where appropriate, adapts projects to recognize those matters.
The crude oil and natural gas industry is experiencing incremental increases in costs related to environmental regulation compliance, particularly in North America and the North Sea. Existing and expected legislation and regulations may require the Company to address and mitigate the effect of its activities on the environment. The Company believes it meets all existing environmental standards and regulations and has included appropriate amounts in its capital expenditure budget to continue to meet current environmental protection requirements. Increasingly stringent laws and regulations may have an adverse effect on the Company’s future net earnings.
The Company’s associated environmental risk management strategies incorporate working with legislators and regulators on any new or revised policies, legislation or regulations to reflect a balanced approach to sustainable development. Specific measures in response to existing or new legislation include a focus on the Company’s energy efficiency, air emissions management, water management and land management to minimize disturbance impacts. The Company’s environmental risk management strategies employ an Environmental Management Plan (the "Plan"). As part of risk management, the Company develops, assesses and implements technologies and innovative practices that will improve environmental performance, often through collaborative efforts with industry partners, governments and research institutions. Details of the Plan, along with performance results, are presented to, and reviewed by, the Board of Directors quarterly.
The Plan and the Company's operating guidelines focus on minimizing the impact of operations while meeting regulatory requirements, regional management frameworks for air quality and emissions, ground and surface water and biodiversity, industry operating standards and guidelines, and internal corporate standards. Training and due diligence for operators and contractors is key to the effectiveness of the Company’s environmental management programs and the prevention of incidents to protect the environment. The Company, as part of this Plan, has implemented proactive programs that include:

40Canadian Natural 2020 Annual Report
■ Environmental planning to assess impacts and implement avoidance and mitigation programs in order to maintain biodiversity for terrestrial and aquatic systems and high value ecosystems;
■ Continued evaluation of new technologies to reduce environmental impacts, including support for Canada’s Oil Sands Innovation Alliance ("COSIA"), Petroleum Technology Alliance Canada ("PTAC") and other research institutions;
■ Mitigation of the Company's climate change impacts through implementation of various CO2 emissions reduction and carbon capture projects including: CO2 injection for EOR, CO2 injection in tailings and the Quest carbon capture and storage facility; a methane emissions reduction program, including solution gas conservation to reduce methane venting, and an equipment retrofit program to reduce methane emissions from pneumatic equipment; and optimization of efficiencies at the Company’s facilities;
■ Water programs to improve efficiency of use and recycle rates as well as to reduce fresh water use; ■ Groundwater monitoring for all thermal in situ and mine operations; ■ Effective reclamation and decommissioning programs across the Company’s operations, returning sites to their former
state. In North America, well abandonment and progressive reclamation of large contiguous areas of land provides the foundation for the enhancement of biodiversity and functional wildlife habitats. In the Company's International operations, decommissioning activities continued at Banff, Kyle, Murchison, Ninian North and Olowi;
■ Tailings management in Oil Sands Mining to minimize fine tailings and promote reclamation; ■ Monitoring programs to assess changes to biodiversity, wildlife and fisheries in order to manage construction and operation
effects and to assess reclamation success; ■ Participation and support for the Oil Sands Monitoring Program of regional important resources; ■ An active spill prevention and management program; and ■ An internal environmental management system for compliance audit and inspection programs of operating facilities.
The Company’s asset retirement obligations are expected to be settled on an ongoing basis over a period of approximately 60 years and have been discounted using a weighted average discount rate of 3.7% (2019 – 3.8%; 2018 – 5.0%). For 2020, the Company’s capital expenditures included $249 million for abandonment expenditures (2019 – $296 million; 2018 – $290 million). The Company’s estimated discounted ARO at December 31, 2020 was as follows:
($ millions) 2020 2019
Exploration and Production
North America $ 2,899 $ 2,792
North Sea 787 816
Offshore Africa 174 161
Oil Sands Mining and Upgrading 1,999 2,000
Midstream and Refining 2 2
$ 5,861 $ 5,771
The discounted ARO was based on estimates of future costs to abandon and restore wells, production facilities, mine sites, upgrading facilities and tailings, and offshore production platforms. Factors that affect costs include number of wells drilled, well depth, facility size and the specific environmental legislation. The estimated future costs are based on engineering estimates of current costs in accordance with present legislation, industry operating practice and the expected timing of abandonment.
GREENHOUSE GAS AND OTHER EMISSIONSThe Company has a large, diversified and balanced portfolio and a risk management strategy which incorporates an integrated GHG emissions reduction strategy and investments in technology and innovation to improve its GHG performance. The Company’s integrated GHG emissions reduction strategy includes: 1) integrating emissions reduction in project planning and operations; 2) leveraging technology to create value and enhance performance; 3) investing in research and development and supporting collaboration with industry, entrepreneurs, academia and governments; 4) focusing on continuous improvement to drive long-term emissions reduction; 5) leading in carbon capture, sequestration and storage; 6) engaging in policy and regulatory development (including trading capacity and offsetting emissions); and, 7) reviewing and developing new business opportunities and trends.
The Company, through the Canadian Association of Petroleum Producers, is working with Canadian legislators and regulators as they develop and implement new GHG emission laws and regulations to support emissions reductions and properly reflect a balanced approach to sustainable development. Internally, the Company is pursuing an integrated emissions reduction strategy, to ensure that it is able to comply with existing and future emissions reduction requirements, for both GHGs and air pollutants (such as sulphur dioxide and oxides of nitrogen). The Company continues to develop strategies that will enable it to deal with the risks and opportunities associated with new GHG and air emissions policies. In addition, the Company is working with relevant parties to ensure that new policies encourage technological innovation, energy efficiency, and targeted research and development while not impacting competitiveness.
Canadian Natural 2020 Annual Report 41
Governments in jurisdictions in which the Company operates have developed or are developing GHG regulations as part of their national and international climate change commitments. The Company uses existing GHG regulations to determine the impact of compliance costs on current and future projects. The Company monitors the development of GHG regulations on an ongoing basis in the jurisdictions in which it operates to assess the impact of future regulatory developments on the Company's operations and planned projects. In Canada, the federal government has ratified the Paris climate change agreement, with a commitment to reduce GHG emissions by 30% from 2005 levels by 2030. Canada has also committed to reduce methane emissions from the upstream oil and natural gas sector by 40 - 45% by 2025, as compared to 2012 levels. In December 2020, the federal government announced its intention to surpass Canada's reduction target under the Paris agreement, to increase the carbon price to $170/tonne in 2030, and to establish additional methane reduction targets for 2030 and 2035. The federal government is also developing: (i) a comprehensive management system for air pollutants and has released regulations pertaining to certain boilers, heaters and compressor engines operated by the Company; and (ii) a Clean Fuel Standard, which may affect production and consumption of fuels in Canada. Draft regulations under the Clean Fuel Standard were released in 2020 and are planned to take effect in December 2022. Aspects of the Clean Fuel Standard could potentially increase the cost of liquid fuels consumed in the Company's operations while also providing a potential mechanism to generate offset credits.
Carbon pricing regulatory systems in all provinces are subject to annual review by the federal government to assess the adequacy of the provincial systems against the federal Greenhouse Gas Pollution Pricing Act. Such future reviews may affect the carbon price and/or the stringency of provincial systems.
Effective January 1, 2020, the GHG regulation (the Carbon Competitiveness Incentive Regulation) was replaced with the Technology Innovation and Emissions Reduction Regulation ("TIER"). The coverage of TIER has expanded to include all of the Company's assets in Alberta (as an alternative to the federal fuel charge). The carbon price in Alberta was $30/tonne for emissions above the TIER-regulated limits in 2020, and the Alberta government increased the price to $40/tonne in 2021 and has announced its intention to increase the price to $50/tonne in 2022, in alignment with the federal carbon pricing schedule. Facilities with emissions in previous years above 100,000 tonnes of CO2e/year, or that have voluntarily opted into TIER are required to comply with the regulation. The non-operated Scotford Upgrader and the North West Redwater bitumen upgrader and refinery are also subject to compliance under the regulations.
In British Columbia, carbon tax is currently being assessed at $40/tonne of CO2e on fuel consumed and gas flared and vented in the province. Further increases in the carbon tax rate are currently paused as part of the British Columbia government's COVID-19 response plan, however, it is expected that increases will resume as COVID-19 relief measures are eased. The British Columbia government has implemented a program (the CleanBC Plan) to partially mitigate the impact of the carbon tax increases on emissions intensive trade exposed (EITE) sectors.
As part of its Prairie Resilience Plan, the Saskatchewan government has a regulation ("The Management and Reduction of Greenhouse Gases (Standards and Compliance) Regulations") that applies to facilities emitting more than 25 kilotonnes of CO2e annually and required the North Tangleflags in situ heavy oil facility and the Senlac in situ heavy crude oil facility to meet reduction targets for GHG emissions in 2020. This regulation also enables facilities below the threshold to aggregate and opt into the Saskatchewan regulatory system as an alternative to the federal fuel charge.
In Manitoba, the federal output-based pricing system applies for facilities with emissions greater than or equal to 10 kilotonnes of CO2e annually, and the federal fuel charge applies for facilities with emissions of less than 10 kilotonnes of CO2e annually.
By 2025, the federal government has committed to reduce methane emissions from the oil and gas sector by 40% to 45% below 2012 levels. The federal government's methane regulation came into effect on January 1, 2020 and applies nationally unless provinces reach equivalency agreements with the federal government, under which the federal regulation would not be in effect for those jurisdictions. The provinces of British Columbia, Alberta and Saskatchewan have implemented provincial methane regulations, and have reached equivalency agreements with the federal government. Accordingly, the applicable provincial methane regulations govern in the three western provinces whereas the federal methane regulation applies to methane emissions in the province of Manitoba.
Air pollutant standards and guidelines are being developed federally and provincially and the Company is participating in these discussions. Ambient air quality and sector based reductions in air emissions are being reviewed. Through Company and industry participation with stakeholders, guidelines are being developed that adopt a structured process to emission reductions that is commensurate with technological development and operational requirements.
In the UK, GHG regulations have been in effect since 2005. In Phase 1 (2005 - 2007) of the UK National Allocation Plan, the Company operated below its CO2 allocation. In Phase 2 (2008 - 2012) the Company’s CO2 allocation was decreased below the Company’s operations emissions. In Phase 3 (2013 - 2020) the Company’s CO2 allocation was further reduced. Following the UK's withdrawal from the European Union ("EU") on January 31, 2020, the UK continued to participate in the EU ETS for the 2020 compliance year. The post 2020 regulatory framework in the UK will broadly follow EU ETS rules and apply to energy intensive industries, the power generation sector and aviation. The new UK Registry is expected to be launched in 2021. The UK has confirmed that EU allowances will not be transferable into the UK Registry. The Company continues to focus on implementing reduction programs based on efficiency audits to reduce CO2 emissions at its offshore facilities and on trading mechanisms to ensure compliance with requirements now in effect.

42Canadian Natural 2020 Annual Report
Accounting Policies and Standards
CHANGES IN ACCOUNTING POLICIESIn October 2018, the IASB issued amendments to IFRS 3 "Definition of a Business" that narrowed and clarified the definition of a business. The amendments permit a simplified assessment of whether an acquired set of activities and assets is a group of assets rather than a business. The amendments apply to business combinations after the date of adoption. The Company prospectively adopted the amendments on January 1, 2020.
In October 2018, the IASB issued amendments to IAS 1 "Presentation of Financial Statements" and IAS 8 "Accounting Policies, Changes in Accounting Estimates and Errors". The amendments make minor changes to the definition of the term "material" and align the definition across all IFRS standards. Materiality is used in making judgements related to the preparation of financial statements. The Company prospectively adopted the amendments on January 1, 2020.
CRITICAL ACCOUNTING POLICIES AND ESTIMATESThe preparation of financial statements requires the Company to make estimates, assumptions and judgements in the application of IFRS that have a significant impact on the financial results of the Company. In 2020, COVID-19 had an impact on the global economy, including the oil and gas industry. Business conditions in 2020 reflected the market uncertainty associated with COVID-19. The Company has taken into account the impacts of COVID-19 and the unique circumstances it has created in making estimates, assumptions, and judgements in the preparation of the audited consolidated financial statements, and continues to monitor the developments in the business environment and commodity market. Actual results may differ from estimated amounts, and those differences may be material. A comprehensive discussion of the Company's significant accounting estimates is contained in this MD&A and the audited consolidated financial statements for the year ended December 31, 2020.
A) Depletion, Depreciation and Amortization and ImpairmentExploration and evaluation ("E&E") costs relating to activities to explore and evaluate crude oil and natural gas properties are initially capitalized and include costs directly associated with the acquisition of licenses, technical services and studies, seismic acquisition, exploration drilling and evaluation, overhead and administration expenses, and the estimate of any asset retirement costs. E&E assets are carried forward until technical feasibility and commercial viability of extracting a mineral resource is determined. Technical feasibility and commercial viability of extracting a mineral resource is considered to be determined when an assessment of proved reserves is made. The judgements associated with the estimation of proved reserves are described below in "Crude Oil and Natural Gas Reserves".
An alternative acceptable accounting method for E&E costs under IFRS 6 "Exploration for and Evaluation of Mineral Resources" is to charge exploratory dry holes and geological and geophysical exploration costs incurred after having obtained the legal rights to explore an area against net earnings in the period incurred rather than capitalizing to E&E assets.
E&E assets are tested for impairment when facts and circumstances suggest that the carrying amount of E&E assets may exceed their recoverable amount, by comparing the relevant costs to the fair value of related Cash Generating Units ("CGUs"), aggregated at a segment level. Indications of impairment include leases approaching expiry, the existence of low benchmark commodity prices for an extended period of time, significant downward revisions in estimated probable reserves volumes, significant increases in estimated future exploration or development expenditures, or significant adverse changes in the applicable legislative or regulatory frameworks. The determination of the fair value of CGUs requires the use of assumptions and estimates including future commodity prices, expected production volumes, quantity of reserves, asset retirement obligations, future development and production costs, discount rates and income taxes. Changes in assumptions used in determining the recoverable amount could affect the carrying value of the related assets and CGUs.
Property, plant and equipment is measured at cost less accumulated depletion and depreciation and impairment provisions. Crude oil and natural gas properties in the Exploration and Production segments are depleted using the unit-of-production method over proved reserves, except for major components, which are depreciated using a straight-line method over their estimated useful lives. The unit-of-production depletion rate takes into account expenditures incurred to date, together with future estimated development expenditures required to develop proved reserves. Estimates of proved reserves have a significant impact on net earnings, as they are a key input to the calculation of depletion expense.
The Company assesses property, plant and equipment for impairment discounted at rates currently ranging from 10% to 12% whenever events or changes in circumstances indicate that the carrying value of an asset or group of assets may not be recoverable. Indications of impairment include the existence of low commodity prices for an extended period, significant downward revisions of estimated reserves volumes, significant increases in estimated future development expenditures, or significant adverse changes in the applicable legislative or regulatory frameworks. If an indication of impairment exists, the Company performs an impairment test related to the specific assets at the CGU level.

Canadian Natural 2020 Annual Report 43
B) Crude Oil and Natural Gas ReservesReserves estimates are based on engineering data, estimated future prices and production costs, expected future rates of production, and the timing and amount of future development expenditures, all of which are subject to many uncertainties, interpretations and judgements. The Company expects that, over time, its reserves estimates will be revised upward or downward based on updated information. Reserves estimates can have a significant impact on net earnings, as they are a key component in the calculation of depletion, depreciation and amortization and for determining potential asset impairment. For example, a revision to the proved reserves estimates would result in a higher or lower depletion, depreciation and amortization charge to net earnings. Downward revisions to reserves estimates may also result in an impairment of E&E and property, plant and equipment carrying amounts.
C) Asset Retirement ObligationsThe Company is required to recognize a liability for ARO associated with its property, plant and equipment. An ARO liability associated with the retirement of a tangible long-lived asset is recognized to the extent of a legal obligation resulting from an existing or enacted law, statute, ordinance or written or oral contract, or by legal construction of a contract under the doctrine of promissory estoppel. The ARO is based on estimated costs, taking into account the anticipated method and extent of restoration consistent with legal requirements, technological advances and the possible use of the site. Since these estimates are specific to the sites involved, there are many individual assumptions underlying the Company’s total ARO amount. These individual assumptions may be subject to change.
The estimated present values of ARO related to long-term assets are recognized as a liability in the period in which they are incurred. The provision for the ARO is estimated by discounting the expected future cash flows to settle the ARO at the Company’s weighted average credit-adjusted risk-free interest rate, which is currently 3.7%. Subsequent to initial measurement, the ARO is adjusted to reflect the passage of time, changes in credit adjusted interest rates, and changes in the estimated future cash flows underlying the obligation. The increase in the provision due to the passage of time is recognized as asset retirement obligation accretion expense whereas changes in discount rates or estimated future cash flows are capitalized to or derecognized from property, plant and equipment. Changes in estimates would impact accretion and depletion expense in net earnings. In addition, differences between actual and estimated costs to settle the ARO, timing of cash flows to settle the obligation and future inflation rates may result in gains or losses on the final settlement of the ARO.
D) Income TaxesThe Company follows the liability method of accounting for income taxes. Under this method, deferred income tax assets and liabilities are recognized based on the estimated income tax effects of temporary differences in the carrying amount of assets and liabilities in the consolidated financial statements and their respective tax bases, using income tax rates substantively enacted that are expected to apply when the asset or liability is recovered. Accounting for income taxes requires the Company to interpret frequently changing laws and regulations, including changing income tax rates, and make certain judgements with respect to the application of tax law, estimating the timing of temporary difference reversals, and estimating the realizability of tax assets. There are many transactions and calculations for which the ultimate tax determination is uncertain. The Company recognizes a liability for a tax filing position based on its assessment of the probability that additional taxes may ultimately be due.
E) Risk Management ActivitiesThe Company periodically uses derivative financial instruments to manage its commodity price, foreign currency and interest rate exposures. These financial instruments are entered into solely for hedging purposes and are not used for speculative purposes. All derivative financial instruments are recognized in the consolidated balance sheets at their estimated fair value. The estimated fair value of derivative financial instruments has been determined based on appropriate internal valuation methodologies and/or third party indications. Fair values determined using valuation models require the use of assumptions concerning the amount and timing of future cash flows, discount rates and credit risk. In determining these assumptions, the Company primarily relied on external, readily-observable quoted market inputs including crude oil and natural gas forward benchmark commodity prices and volatility, Canadian and United States forward interest rate yield curves, and Canadian and United States foreign exchange rates, discounted to present value as appropriate. The carrying amount of a risk management liability is adjusted for the Company’s own credit risk. The resulting fair value estimates may not necessarily be indicative of the amounts that could be realized or settled in a current market transaction and these differences may be material.

44Canadian Natural 2020 Annual Report
F) Purchase Price AllocationsPurchase prices related to business combinations are allocated to the underlying acquired assets and liabilities based on their estimated fair value at the time of acquisition. The determination of fair value requires the Company to make estimates, assumptions and judgements regarding future events. The allocation process is inherently subjective and impacts the amounts assigned to individually identifiable assets and liabilities, including the fair value of crude oil and natural gas properties, together with deferred income tax effects. As a result, the purchase price allocation impacts the Company’s reported assets and liabilities and future net earnings due to the impact on future depletion, depreciation and amortization expense and impairment tests.
The Company has made various assumptions in determining the fair values of acquired assets and liabilities. The most significant assumptions and judgements relate to the estimation of the fair value of crude oil and natural gas properties. To determine the fair value of these properties, the Company estimates crude oil and natural gas reserves. Reserves estimates are based on the work performed by the Company’s internal engineers and outside consultants. The judgements associated with these estimated reserves are described above in "Crude Oil and Natural Gas Reserves". Estimates of future prices are based on prices derived from price forecasts among industry analysts and internal assessments. The Company applies estimated future prices to the estimated reserves quantities acquired, and estimates future operating and development costs, to arrive at estimated future net revenues for the properties acquired.
G) Share-Based CompensationThe Company has made various assumptions in estimating the fair values of stock options granted including expected volatility, expected exercise timing and future forfeiture rates. At each period end, stock options outstanding are remeasured for changes in the estimated fair value of the liability.
H) LeasesPurchase, extension and termination options are included in certain of the Company's leases to provide operational flexibility. To measure the lease liability, the Company uses judgement to assess the likelihood of exercising these options. These assessments are reviewed when significant events or circumstances indicate that the likelihood of exercising these options may have changed. The Company also uses estimates to determine its incremental borrowing costs if the interest rate implicit in the lease is not readily determinable.
(I) Government Grants The Company receives or is eligible for government grants, including those introduced in response to the impact of COVID-19. Government grants are recognized when there is reasonable assurance that the Company will comply with the conditions attached to the grant and the grant will be received. Grants that are intended to compensate for expenses incurred are classified as other income.
Control Environment The Company’s management, including the President and the Chief Financial Officer and Vice-President, Finance and Principal Accounting Officer, evaluated the effectiveness of disclosure controls and procedures as at December 31, 2020, and concluded that disclosure controls and procedures are effective to ensure that information required to be disclosed by the Company in its annual filings and other reports filed with securities regulatory authorities in Canada and the United States is recorded, processed, summarized and reported within the time periods specified and such information is accumulated and communicated to the Company’s management to allow timely decisions regarding required disclosures.
The Company’s management, including the President and the Chief Financial Officer and Vice-President, Finance and Principal Accounting Officer, also evaluated the effectiveness of internal control over financial reporting as at December 31, 2020, and concluded that internal control over financial reporting is effective. Further, there were no changes in the Company’s internal control over financial reporting during 2020 that have materially affected, or are reasonably likely to materially affect, internal control over financial reporting.
While the Company’s management believes that the Company’s disclosure controls and procedures and internal control over financial reporting provide a reasonable level of assurance they are effective, they recognize that all control systems have inherent limitations. Because of its inherent limitations, the Company’s control systems may not prevent or detect misstatements. Also, projections of any evaluation of effectiveness to future periods are subject to the risk that controls may become inadequate because of changes in conditions, or that the degree of compliance with the policies or procedures may deteriorate.

Canadian Natural 2020 Annual Report 45
OutlookThe Company continues to implement its strategy of maintaining a large portfolio of varied projects, which the Company believes will enable it, over an extended period of time, to provide consistent growth in production and create shareholder value. Annual budgets are developed, scrutinized throughout the year and revised if necessary in the context of targeted financial ratios, project returns, product pricing expectations, and balance in project risk and time horizons. The Company maintains a high ownership level and operatorship level in all of its properties and can therefore control the nature, timing and extent of capital expenditures in each of its project areas.
2021 CAPITAL BUDGETOn December 9, 2020, the Company announced its 2021 capital budget targeted at approximately $3,205 million, of which $1,345 million is related to conventional and unconventional assets and $1,860 million is allocated to long-life low decline assets.
OtherSENSITIVITY ANALYSISThe following table is indicative of the annualized sensitivities of cash flows from operating activities and net earnings due to changes in certain key variables. The analysis is based on business conditions and sales volumes during the fourth quarter of 2020, excluding mark-to-market gains (losses) on risk management activities and is not necessarily indicative of future results. Each separate line item in the sensitivity analysis shows the effect of a change in that variable only with all other variables being held constant.
Cash flows from Operating
Activities ($ millions)
Cash flows from Operating
Activities(per common
share, basic)
Net
earnings(loss)
($ millions)
Netearnings
(loss)(per common
share, basic)
Price changes
Crude oil – WTI US$1.00/bbl
Excluding financial derivatives $ 315 $ 0.27 $ 315 $ 0.27
Including financial derivatives $ 315 $ 0.27 $ 315 $ 0.27
Natural gas – AECO C$0.10/Mcf (1)
Excluding financial derivatives $ 26 $ 0.02 $ 26 $ 0.02
Including financial derivatives $ 21 $ 0.02 $ 21 $ 0.02
Volume changes
Crude oil – 10,000 bbl/d $ 99 $ 0.08 $ 70 $ 0.06
Natural gas – 10 MMcf/d $ 3 $ — $ — $ —
Foreign currency rate change
$0.01 change in US$ (1)
Including financial derivatives $ 139 $ 0.12 $ 4 $ —
Interest rate change – 1% $ 53 $ 0.05 $ 53 $ 0.05
(1) For details of financial instruments in place, refer to note 19 to the Company’s audited consolidated financial statements as at December 31, 2020.

46Canadian Natural 2020 Annual Report
DAILY PRODUCTION BY SEGMENT, BEFORE ROYALTIES Q1 Q2 Q3 Q4 2020 2019 2018Crude oil and NGLs (bbl/d)
North America – Exploration and Production
456,877 413,506 494,952 475,889 460,443 405,970 350,961
North America – Oil Sands Mining and Upgrading (1) 438,101 464,318 350,633 417,089 417,351 395,133 426,190
North Sea 27,755 26,627 21,220 17,057 23,142 27,919 23,965
Offshore Africa 15,943 17,444 17,537 17,155 17,022 21,371 19,662
Total 938,676 921,895 884,342 927,190 917,958 850,393 820,778
Natural gas (MMcf/d)
North America 1,407 1,431 1,340 1,623 1,450 1,443 1,490
North Sea 23 15 5 4 12 24 32
Offshore Africa 10 16 17 17 15 24 26
Total 1,440 1,462 1,362 1,644 1,477 1,491 1,548
Barrels of oil equivalent (BOE/d) North America – Exploration and
Production691,435 651,929 718,315 746,333 702,168 646,443 599,310
North America – Oil Sands Mining and Upgrading (1) 438,101 464,318 350,633 417,089 417,351 395,133 426,190
North Sea 31,561 29,201 21,959 17,774 25,095 31,915 29,264
Offshore Africa 17,655 20,039 20,379 20,002 19,522 25,466 24,049
Total 1,178,752 1,165,487 1,111,286 1,201,198 1,164,136 1,098,957 1,078,813
(1) SCO production before royalties excludes SCO consumed internally as diesel.
PER UNIT RESULTS – EXPLORATION AND PRODUCTION Q1 Q2 Q3 Q4 2020 2019 2018
Crude oil and NGLs ($/bbl) (1)
Sales price (2) $ 25.90 $ 18.97 $ 40.14 $ 40.56 $ 31.90 $ 55.08 $ 46.92
Transportation (3) 3.87 4.20 3.60 3.81 3.85 3.48 3.08Realized sales price, net of transportation
22.03 14.77 36.54 36.75 28.05 51.60 43.84
Royalties 2.34 1.48 3.03 3.34 2.59 6.08 5.08
Production expense 13.71 12.53 11.03 12.47 12.42 13.81 15.69
Netback $ 5.98 $ 0.76 $ 22.48 $ 20.94 $ 13.04 $ 31.71 $ 23.07
Natural gas ($/Mcf) (1)
Sales price $ 2.22 $ 2.03 $ 2.31 $ 2.94 $ 2.40 $ 2.34 $ 2.61
Transportation 0.46 0.41 0.42 0.42 0.43 0.42 0.47Realized sales price, net of transportation
1.76 1.62 1.89 2.52 1.97 1.92 2.14
Royalties 0.05 0.05 0.07 0.13 0.08 0.08 0.08
Production expense 1.31 1.15 1.18 1.10 1.18 1.22 1.36
Netback $ 0.40 $ 0.42 $ 0.64 $ 1.29 $ 0.71 $ 0.62 $ 0.70
Barrels of oil equivalent ($/BOE) (1)
Sales price (2) $ 21.90 $ 16.57 $ 32.28 $ 32.61 $ 26.15 $ 40.50 $ 34.62
Transportation (3) 3.50 3.61 3.28 3.37 3.44 3.14 2.96Realized sales price, net of transportation
18.40 12.96 29.00 29.24 22.71 37.36 31.66
Royalties 1.70 1.05 2.25 2.44 1.89 4.09 3.27
Production expense 11.87 10.55 9.84 10.43 10.67 11.49 12.71
Netback $ 4.83 $ 1.36 $ 16.91 $ 16.37 $ 10.15 $ 21.78 $ 15.68
(1) Amounts expressed on a per unit basis are based on sales volumes.(2) Net of blending costs and excluding risk management activities.(3) Excludes the impact of a $143 million provision recognized in the fourth quarter of 2020, relating to the Keystone XL pipeline project.

Canadian Natural 2020 Annual Report 47
PER UNIT RESULTS – OIL SANDS MINING AND UPGRADING
Q1 Q2 Q3 Q4 2020 2019 2018
Crude oil and NGLs ($/bbl) (1)
SCO sales price (2) $ 50.88 $ 29.11 $ 48.92 $ 48.56 $ 43.98 $ 70.18 $ 68.61
Bitumen royalties (3) 0.87 0.15 0.46 0.59 0.51 3.31 3.09
Transportation 1.28 0.97 1.30 1.36 1.23 1.29 1.61
Production costs 20.76 17.74 23.81 20.20 20.46 22.56 21.75
Netback $ 27.97 $ 10.25 $ 23.35 $ 26.41 $ 21.78 $ 43.02 $ 42.16
(1) Amounts expressed on a per unit basis are based on sales volumes.(2) Net of blending and feedstock costs.(3) Calculated based on actual bitumen royalties expensed during the period; divided by the corresponding SCO sales volumes.
TRADING AND SHARE STATISTICS
Q1 Q2 Q3 Q4 2020 2019
TSX – C$
Trading volume (thousands) 462,841 588,540 358,734 456,299 1,866,414 904,013
Share Price ($/share)
High $42.57 $30.10 $28.20 $32.49 $42.57 $42.56
Low $9.80 $16.55 $21.25 $19.77 $9.80 $30.01
Close $19.25 $23.55 $21.34 $30.59 $30.59 $42.00
Market capitalization as at December 31 ($ millions) $36,214 $49,848
Shares outstanding (thousands) 1,183,866 1,186,857
NYSE – US$
Trading volume (thousands) 301,186 334,981 211,582 210,372 1,058,121 679,697
Share Price ($/share)
High $32.79 $22.50 $21.21 $25.55 $32.79 $32.56
Low $6.71 $11.77 $15.85 $14.85 $6.71 $22.58
Close $13.55 $17.43 $16.01 $24.05 $24.05 $32.35
Market capitalization as at December 31 ($ millions) $28,472 $38,395
Shares outstanding (thousands) 1,183,866 1,186,857

48Canadian Natural 2020 Annual Report
Consolidated Financial Statements
Table of Contents
Management’s Report 49
Management’s Assessment of Internal Control over Financial Reporting 50
Report of Independent Registered Public Accounting Firm 51
Consolidated Balance Sheets 54
Consolidated Statements of Earnings (Loss) 55
Consolidated Statements of Comprehensive Income (Loss) 55
Consolidated Statements of Changes in Equity 56
Consolidated Statements of Cash Flows 57
Notes to the Consolidated Financial Statements 58
1. Accounting Policies 58
2. Changes in Accounting Policies 65
3. Accounting Standards Issued But Not Yet Applied 65
4. Critical Accounting Estimates and Judgements 66
5. Inventory 67
6. Exploration and Evaluation Assets 68
7. Property, Plant and Equipment 69
8. Leases 71
9. Investments 72
10. Other Long-Term Assets 73
11. Long-Term Debt 74
12. Other Long-Term Liabilities 76
13. Income Taxes 78
14. Share Capital 81
15. Accumulated Other Comprehensive Income 82
16. Capital Disclosures 83
17. Net Earnings Per Common Share 83
18. Interest and Other Financing Expense 84
19. Financial Instruments 84
20. Commitments and Contingencies 89
21. Supplemental Disclosure of Cash Flow Information 90
22. Segmented Information 91
23. Remuneration of Directors and Senior Management 94
Canadian Natural 2020 Annual Report 49
Management’s Report
The accompanying consolidated financial statements of Canadian Natural Resources Limited (the "Company") and all other information contained elsewhere in this Annual Report are the responsibility of management. The consolidated financial statements have been prepared by management in accordance with the accounting policies described in the accompanying notes. Where necessary, management has made informed judgements and estimates in accounting for transactions that were not complete at the balance sheet date. In the opinion of management, the financial statements have been prepared in accordance with International Financial Reporting Standards as issued by the International Accounting Standards Board as appropriate in the circumstances. The financial information presented elsewhere in the Annual Report has been reviewed to ensure consistency with that in the consolidated financial statements.
Management maintains appropriate systems of internal control. Policies and procedures are designed to give reasonable assurance that transactions are appropriately authorized and recorded, assets are safeguarded from loss or unauthorized use and financial records are properly maintained to provide reliable information for preparation of financial statements.
PricewaterhouseCoopers LLP, an independent firm of Chartered Professional Accountants, has been engaged, as approved by a vote of the shareholders at the Company’s most recent Annual General Meeting, to audit and provide their independent audit opinions on the following:
■ the Company’s consolidated financial statements as at and for the year ended December 31, 2020; and
■ the effectiveness of the Company’s internal control over financial reporting as at December 31, 2020.
Their report is presented with the consolidated financial statements.
The Board of Directors (the "Board") is responsible for ensuring that management fulfills its responsibilities for financial reporting and internal controls. The Board exercises this responsibility through the Audit Committee of the Board, which is comprised entirely of independent directors. The Audit Committee meets with management and the independent auditors to satisfy itself that management responsibilities are properly discharged and to review the consolidated financial statements before they are presented to the Board for approval. The consolidated financial statements have been approved by the Board on the recommendation of the Audit Committee.
TIM S. MCKAY MARK STAINTHORPE, CFA CHRIS GRAYSTON, CAPresident Chief Financial Officer and
Senior Vice-President, FinanceVice-President, Finance and Principal Accounting Officer
Calgary, Alberta, Canada
March 3, 2021

50Canadian Natural 2020 Annual Report
Management’s Assessment of Internal Control over Financial Reporting
Management of Canadian Natural Resources Limited (the "Company") is responsible for establishing and maintaining adequate internal control over financial reporting for the Company as defined in Rules 13a-15(f) and 15d-15(f) under the United States Securities Exchange Act of 1934, as amended.
Management, including the Company’s President and the Company’s Chief Financial Officer and Senior Vice-President, Finance, performed an assessment of the Company’s internal control over financial reporting based on the criteria established in Internal Control - Integrated Framework (2013) issued by the Committee of Sponsoring Organizations of the Treadway Commission ("COSO").
Based on the assessment, management has concluded that the Company’s internal control over financial reporting is effective as at December 31, 2020. Management recognizes that all internal control systems have inherent limitations. Because of its inherent limitations, internal control over financial reporting may not prevent or detect misstatements. Also, projections of any evaluation of effectiveness to future periods are subject to the risk that controls may become inadequate because of changes in conditions, or that the degree of compliance with the policies or procedures may deteriorate.
PricewaterhouseCoopers LLP, an independent firm of Chartered Professional Accountants, has provided an opinion on the Company’s internal control over financial reporting as at December 31, 2020, as stated in their accompanying Report of Independent Registered Public Accounting Firm.
TIM S. MCKAY MARK STAINTHORPE, CFAPresident Chief Financial Officer and
Senior Vice-President, Finance
Calgary, Alberta, Canada
March 3, 2021

Canadian Natural 2020 Annual Report 51
Report of Independent Registered Public Accounting FirmTo the Shareholders and Board of Directors of Canadian Natural Resources Limited
OPINIONS ON THE CONSOLIDATED FINANCIAL STATEMENTS AND INTERNAL CONTROL OVER FINANCIAL REPORTINGWe have audited the accompanying consolidated balance sheets of Canadian Natural Resources Limited and its subsidiaries (together, the “Company”) as of December 31, 2020 and 2019, and the related consolidated statements of earnings (loss), comprehensive income (loss), changes in equity, and cash flows for each of the three years in the period ended December 31, 2020, including the related notes (collectively referred to as the “consolidated financial statements”). We also have audited the Company’s internal control over financial reporting as of December 31, 2020, based on criteria established in Internal Control – Integrated Framework (2013) issued by the Committee of Sponsoring Organizations of the Treadway Commission (“COSO”).
In our opinion, the consolidated financial statements referred to above present fairly, in all material respects, the financial position of the Company as of December 31, 2020 and 2019, and its financial performance and its cash flows for each of the three years in the period ended December 31, 2020 in conformity with International Financial Reporting Standards as issued by the International Accounting Standards Board. Also in our opinion, the Company maintained, in all material respects, effective internal control over financial reporting as of December 31, 2020, based on criteria established in Internal Control – Integrated Framework (2013) issued by the COSO.
Change in Accounting PrincipleAs discussed in Note 1 to the consolidated financial statements, the Company changed the manner in which it accounts for leases as of January 1, 2019 due to the adoption of IFRS 16, Leases.
BASIS FOR OPINIONSThe Company’s management is responsible for these consolidated financial statements, for maintaining effective internal control over financial reporting, and for its assessment of the effectiveness of internal control over financial reporting, included in the accompanying Management’s Assessment of Internal Control over Financial Reporting. Our responsibility is to express opinions on the Company’s consolidated financial statements and on the Company’s internal control over financial reporting based on our audits. We are a public accounting firm registered with the Public Company Accounting Oversight Board (United States) (“PCAOB”) and are required to be independent with respect to the Company in accordance with the U.S. federal securities laws and the applicable rules and regulations of the Securities and Exchange Commission and the PCAOB.
We conducted our audits in accordance with the standards of the PCAOB. Those standards require that we plan and perform the audits to obtain reasonable assurance about whether the consolidated financial statements are free of material misstatement, whether due to error or fraud, and whether effective internal control over financial reporting was maintained in all material respects.
Our audits of the consolidated financial statements included performing procedures to assess the risks of material misstatement of the consolidated financial statements, whether due to error or fraud, and performing procedures that respond to those risks. Such procedures included examining, on a test basis, evidence regarding the amounts and disclosures in the consolidated financial statements. Our audits also included evaluating the accounting principles used and significant estimates made by management, as well as evaluating the overall presentation of the consolidated financial statements. Our audit of internal control over financial reporting included obtaining an understanding of internal control over financial reporting, assessing the risk that a material weakness exists, and testing and evaluating the design and operating effectiveness of internal control based on the assessed risk. Our audits also included performing such other procedures as we considered necessary in the circumstances. We believe that our audits provide a reasonable basis for our opinions.

52Canadian Natural 2020 Annual Report
DEFINITION AND LIMITATIONS OF INTERNAL CONTROL OVER FINANCIAL REPORTINGA company’s internal control over financial reporting is a process designed to provide reasonable assurance regarding the reliability of financial reporting and the preparation of financial statements for external purposes in accordance with generally accepted accounting principles. A company’s internal control over financial reporting includes those policies and procedures that (i) pertain to the maintenance of records that, in reasonable detail, accurately and fairly reflect the transactions and dispositions of the assets of the company; (ii) provide reasonable assurance that transactions are recorded as necessary to permit preparation of financial statements in accordance with generally accepted accounting principles, and that receipts and expenditures of the company are being made only in accordance with authorizations of management and directors of the company; and (iii) provide reasonable assurance regarding prevention or timely detection of unauthorized acquisition, use, or disposition of the company’s assets that could have a material effect on the financial statements.
Because of its inherent limitations, internal control over financial reporting may not prevent or detect misstatements. Also, projections of any evaluation of effectiveness to future periods are subject to the risk that controls may become inadequate because of changes in conditions, or that the degree of compliance with the policies or procedures may deteriorate.
CRITICAL AUDIT MATTERS The critical audit matter communicated below is a matter arising from the current period audit of the consolidated financial statements that was communicated or required to be communicated to the audit committee and that (i) relates to accounts or disclosures that are material to the consolidated financial statements and (ii) involved our especially challenging, subjective, or complex judgments. The communication of critical audit matters does not alter in any way our opinion on the consolidated financial statements, taken as a whole, and we are not, by communicating the critical audit matter below, providing a separate opinion on the critical audit matter or on the accounts or disclosures to which it relates.
The impact of crude oil and natural gas reserves on property, plant and equipment assets in the North America Exploration and Production segmentAs described in Notes 1, 4 and 7 to the Company’s consolidated financial statements, the property, plant and equipment (“PP&E”) balances in the North America Exploration and Production segment was $24.4 billion as at December 31, 2020. Depletion, depreciation and amortization (“DD&A”) expense for the North America Exploration and Production segment was $3.7 billion for the year ended December 31, 2020. In accordance with the Company’s accounting policies, crude oil and natural gas properties in the North America Exploration and Production segment, excluding major components, are depleted using the unit-of-production method based on proved reserves. PP&E assets are grouped for recoverability assessment purposes into cash generating units (“CGU”) and a CGU’s recoverable amount is the higher of its fair value less costs of disposal and its value in use. The assessment of a CGU’s recoverability requires the use of estimates and assumptions, including information on future commodity prices, expected production volumes, quantity of crude oil and natural gas reserves, asset retirement obligations, future development and operating costs, after-tax discount rates and income taxes. Estimates of the Company’s crude oil and natural gas reserves are based on engineering data, estimated future prices and production costs, expected future rates of production and the timing and amount of future development expenditures, all of which are subject to many uncertainties, interpretations and judgments. Management utilizes third party specialists, specifically independent qualified reserve evaluators, to evaluate, review and report to the Company’s management and Board of Directors on its estimates of crude oil and natural gas reserves. These estimates are utilized for both the determination of the recoverable amounts of PP&E and the calculation of DD&A expense.
The principal considerations for our determination that performing procedures relating to the impact of crude oil and natural gas reserves on PP&E assets in the North America Exploration and Production segment is a critical audit matter are that there was a significant amount of judgment required by management, including the use of specialists, when developing the estimates, specifically related to the estimates of crude oil and natural gas reserves and the recoverable amount of the PP&E assets in the North America Exploration and Production segment. This led to a high degree of auditor judgment, effort and subjectivity in performing procedures and evaluating evidence obtained related to the significant assumptions used in developing the estimates, including estimates of expected future rates of production, future commodity pricing and future development and operating costs.

Canadian Natural 2020 Annual Report 53
Addressing the matter involved performing procedures and evaluating audit evidence in connection with forming our overall opinion on the consolidated financial statements. These procedures included testing the effectiveness of internal controls in the North America Exploration and Production segment relating to management’s estimates of the Company’s crude oil and natural gas reserves, management’s assessment of PP&E recoverability and the calculation of DD&A expense. These procedures also included, among others, testing management’s process for determining the recoverable amount of PP&E and DD&A expense for the North America Exploration and Production segment. Testing management’s process for determining these estimates included (i) evaluating the appropriateness of the methods used by management in making these estimates; (ii) testing the completeness, accuracy and relevance of underlying data used in management’s analysis in developing these estimates; (iii) evaluating the significant assumptions used in developing the underlying estimates, including assumptions of expected future rates of production, future commodity pricing and future development and operating costs; and (iv) testing the unit-of-production rates used to calculate DD&A expense. The work of management’s specialists was used in performing the procedures to evaluate the reasonableness of the estimates of crude oil and natural gas reserves used to determine DD&A expense and the recoverable amount of PP&E for the North America Exploration and Production segment. As a basis for using this work, the specialists’ qualifications were understood, and the Company’s relationship with the specialists was assessed. The procedures performed also included evaluation of the methods and assumptions used by the specialists, tests of data used by the specialists and an evaluation of the specialists’ findings. Evaluating the significant assumptions used by management’s specialists also involved evaluating whether the assumptions used were reasonable considering the past performance of the Company, consistency with industry pricing forecasts and whether they were consistent with evidence obtained in other areas of the audit.
Chartered Professional Accountants
Calgary, CanadaMarch 3, 2021
We have served as the Company’s auditor since 1973.

54Canadian Natural 2020 Annual Report
Consolidated Balance Sheets As at December 31
Note 2020 2019(millions of Canadian dollars)
ASSETS
Current assets
Cash and cash equivalents $ 184 $ 139
Accounts receivable 2,190 2,465
Current income taxes receivable 309 13
Inventory 5 1,060 1,152
Prepaids and other 231 174
Investments 9 305 490
Current portion of other long-term assets 10 82 54
4,361 4,487
Exploration and evaluation assets 6 2,436 2,579
Property, plant and equipment 7 65,752 68,043
Lease assets 8 1,645 1,789
Other long-term assets 10 1,082 1,223
$ 75,276 $ 78,121
LIABILITIES
Current liabilities
Accounts payable $ 667 $ 816
Accrued liabilities 2,346 2,611
Current portion of long-term debt 11 1,343 2,391
Current portion of other long-term liabilities 8,12 722 819
5,078 6,637
Long-term debt 11 20,110 18,591
Other long-term liabilities 8,12 7,564 7,363
Deferred income taxes 13 10,144 10,539
42,896 43,130
SHAREHOLDERS’ EQUITY
Share capital 14 9,606 9,533
Retained earnings 22,766 25,424
Accumulated other comprehensive income 15 8 34
32,380 34,991
$ 75,276 $ 78,121
Commitments and contingencies (note 20).
Approved by the Board of Directors on March 3, 2021
CATHERINE M. BEST N. MURRAY EDWARDS
Chair of the Audit Committee Executive Chairman of the Boardand Director of Directors and Director

Canadian Natural 2020 Annual Report 55
Consolidated Statements of Earnings (Loss) For the years ended December 31
(millions of Canadian dollars, except per common share amounts) Note 2020 2019 2018
Product sales 22 $ 17,491 $ 24,394 $ 22,282
Less: royalties (598) (1,523) (1,255)
Revenue 16,893 22,871 21,027
ExpensesProduction 6,280 6,277 6,464
Transportation, blending and feedstock 4,498 4,699 4,189
Depletion, depreciation and amortization 7, 8 6,046 5,546 5,161
Administration 391 344 325
Share-based compensation 12 (82) 223 (146)
Asset retirement obligation accretion 12 205 190 186
Interest and other financing expense 18 756 836 739
Risk management activities 19 (7) 77 (134)
Foreign exchange (gain) loss (275) (570) 827
Gain on acquisition, disposition and revaluation 6,7 (217) — (452)
Loss from investments 9,10 171 293 346
17,766 17,915 17,505
Earnings before taxes (873) 4,956 3,522
Current income tax (recovery) expense 13 (257) 434 374
Deferred income tax (recovery) expense 13 (181) (894) 557
Net earnings (loss) $ (435) $ 5,416 $ 2,591
Net earnings (loss) per common share
Basic 17 $ (0.37) $ 4.55 $ 2.13
Diluted 17 $ (0.37) $ 4.54 $ 2.12
Consolidated Statements of Comprehensive Income (Loss)For the years ended December 31
(millions of Canadian dollars) 2020 2019 2018
Net earnings (loss) $ (435) $ 5,416 $ 2,591
Items that may be reclassified subsequently to net earnings
Net change in derivative financial instruments designated as cash flow hedges
Unrealized income, net of taxes of $2 million (2019 – $13 million, 2018 – $nil) 13 99 5
Reclassification to net earnings (loss), net of taxes of $2 million (2019 – $5 million, 2018 – $6 million) (15) (41) (39)
(2) 58 (34)
Foreign currency translation adjustment
Translation of net investment (24) (146) 224
Other comprehensive income (loss), net of taxes (26) (88) 190
Comprehensive income (loss) $ (461) $ 5,328 $ 2,781

56Canadian Natural 2020 Annual Report
Consolidated Statements of Changes in EquityFor the years ended December 31
(millions of Canadian dollars) Note 2020 2019 2018
Share capital 14
Balance – beginning of year $ 9,533 $ 9,323 $ 9,109
Issued upon exercise of stock options 108 360 332
Previously recognized liability on stock options exercised for common shares 21 53 120
Purchase of common shares under Normal Course Issuer Bid (56) (203) (238)
Balance – end of year 9,606 9,533 9,323
Retained earnings
Balance – beginning of year 25,424 22,529 22,612
Net earnings (loss) (435) 5,416 2,591
Dividends on common shares 14 (2,008) (1,783) (1,630)
Purchase of common shares under Normal Course Issuer Bid 14 (215) (738) (1,044)
Balance – end of year 22,766 25,424 22,529
Accumulated other comprehensive income (loss) 15
Balance – beginning of year 34 122 (68)
Other comprehensive income (loss), net of taxes (26) (88) 190
Balance – end of year 8 34 122
Shareholders’ equity $ 32,380 $ 34,991 $ 31,974

Canadian Natural 2020 Annual Report 57
Consolidated Statements of Cash Flows
For the years ended December 31
(millions of Canadian dollars) Note 2020 2019 2018
Operating activities
Net earnings (loss) $ (435) $ 5,416 $ 2,591
Non-cash items
Depletion, depreciation and amortization 6,046 5,546 5,161
Share-based compensation (82) 223 (146)
Asset retirement obligation accretion 205 190 186
Unrealized risk management (gain) loss (39) 13 (35)
Unrealized foreign exchange (gain) loss (116) (548) 706
Realized foreign exchange gain on settlement of cross currency swaps (166) — —
Realized foreign exchange loss on repayment of US dollar debt securities — — 146
Gain on acquisition, disposition and revaluation (217) — (452)
Loss from investments 185 321 374
Deferred income tax (recovery) expense (181) (894) 557
Other (71) (109) (23)
Abandonment expenditures (249) (296) (290)
Net change in non-cash working capital 21 (166) (1,033) 1,346
Cash flows from operating activities 4,714 8,829 10,121
Financing activities
Issue (repayment) of bank credit facilities and commercial paper, net 11,21 338 2,025 (1,595)
Repayment of medium-term notes 11,21 (1,100) (1,000) —
Issue (repayment) of US dollar debt securities 11,21 1,481 — (1,236)
Settlement of Painted Pony long-term debt 7 (397) — —
Proceeds on settlement of cross currency swaps 166 — —
Payment of lease liabilities 8 (225) (237) —
Issue of common shares on exercise of stock options 108 360 332
Dividends on common shares (1,950) (1,743) (1,562)
Purchase of common shares under Normal Course Issuer Bid (271) (941) (1,282)
Cash flows used in financing activities (1,850) (1,536) (5,343)
Investing activities
Net expenditures on exploration and evaluation assets 6,21 (5) (73) (266)
Net expenditures on property, plant and equipment 7,22 (2,555) (3,535) (4,175)
Acquisition of Devon assets (1) — (3,412) —
Repayment of NWRP subordinated debt advances 10 124 — —
Investment in other long-term assets — — (28)
Net change in non-cash working capital 21 (383) (235) (345)
Cash flows used in investing activities (2,819) (7,255) (4,814)
Increase (decrease) in cash and cash equivalents 45 38 (36)
Cash and cash equivalents – beginning of year 139 101 137
Cash and cash equivalents – end of year $ 184 $ 139 $ 101
Interest paid on long-term debt, net $ 745 $ 865 $ 911
Income taxes (received) paid $ (29) $ 445 $ (225)
(1) The acquisition of assets from Devon Canada Corporation ("Devon") in 2019 includes net working capital and other long-term assets of $195 million (note 7).
58Canadian Natural 2020 Annual Report
Notes to the Consolidated Financial Statements(tabular amounts in millions of Canadian dollars, unless otherwise stated)
1. Accounting Policies Canadian Natural Resources Limited (the "Company") is a senior independent crude oil and natural gas exploration, development and production company. The Company’s exploration and production operations are focused in North America, largely in Western Canada; the United Kingdom ("UK") portion of the North Sea; and Côte d’Ivoire and South Africa in Offshore Africa.
The "Oil Sands Mining and Upgrading" segment produces synthetic crude oil through bitumen mining and upgrading operations at Horizon Oil Sands ("Horizon") and through the Company's direct and indirect interest in Athabasca Oil Sands Project ("AOSP").
Within Western Canada, in the "Midstream and Refining" segment, the Company maintains certain activities that include pipeline operations, an electricity co-generation system and an investment in the North West Redwater Partnership ("NWRP"), a general partnership formed to upgrade and refine bitumen in the Province of Alberta.
The Company was incorporated in Alberta, Canada. The address of its registered office is 2100, 855 - 2 Street S.W., Calgary, Alberta, Canada.
The Company’s consolidated financial statements and the related notes have been prepared in accordance with International Financial Reporting Standards ("IFRS") as issued by the International Accounting Standards Board ("IASB"). The accounting policies adopted by the Company under IFRS are set out below. The Company has consistently applied the same accounting policies throughout all periods presented, except where IFRS permits new accounting standards to be adopted prospectively. Changes in the Company's accounting policies are discussed in note 2.
(A) PRINCIPLES OF CONSOLIDATIONThe consolidated financial statements have been prepared under the historical cost basis, unless otherwise required.
The consolidated financial statements include the accounts of the Company and all of its subsidiary companies and wholly owned partnerships. Subsidiaries include all entities over which the Company has control. Subsidiaries are consolidated from the date on which the Company obtains control. They are deconsolidated from the date that control ceases.
Certain of the Company’s activities are conducted through joint arrangements in which two or more parties have joint control. Where the Company has determined that it has a direct ownership interest in jointly controlled assets and obligations for the liabilities (a "joint operation"), the assets, liabilities, revenue and expenses related to the joint operation are included in the consolidated financial statements in proportion to the Company’s interest. Where the Company has determined that it has an interest in jointly controlled entities (a "joint venture"), it uses the equity method of accounting. Under the equity method, the Company’s initial and subsequent investments are recognized at cost and subsequently adjusted for the Company’s share of the joint venture’s income or loss, less distributions received. If the Company’s share of the joint venture’s loss equals or exceeds its interest in the joint venture, the Company discontinues recognizing its share of further losses. The Company resumes recognizing profits when its share of profits exceeds the accumulated share of losses not recognized.
Joint ventures accounted for using the equity method of accounting are tested for impairment whenever objective evidence indicates that the carrying amount of the investment may not be recoverable. Indications of impairment include a history of losses, significant capital expenditure overruns, liquidity concerns, financial restructuring of the investee or significant adverse changes in the technological, economic or legal environment. The amount of the impairment is measured as the difference between the carrying amount of the investment and the higher of its fair value less costs of disposal and its value in use. Impairment losses are reversed in subsequent periods if the amount of the loss decreases and the decrease can be related objectively to an event occurring after the impairment was recognized.
(B) SEGMENTED INFORMATIONOperating segments have been determined based on the nature of the Company’s activities and the geographic locations in which the Company operates, and are consistent with the level of information regularly provided to and reviewed by the Company’s chief operating decision makers.
(C) CASH AND CASH EQUIVALENTSCash comprises cash on hand and demand deposits. Other investments (term deposits and certificates of deposit) with an original term to maturity at purchase of three months or less are reported as cash equivalents in the consolidated balance sheets.

Canadian Natural 2020 Annual Report 59
(D) INVENTORYInventory is primarily comprised of product inventory and materials and supplies and is carried at the lower of cost and net realizable value. Product inventory is comprised of crude oil held for sale, including pipeline linefill and crude oil stored in floating production, storage and offloading vessels ("FPSO"). Cost of product inventory consists of purchase costs, direct production costs, directly attributable overhead and depletion, depreciation and amortization and is determined on a first-in, first-out basis. Net realizable value for product inventory is determined by reference to forward prices. Cost for materials and supplies consists of purchase costs and is based on a first-in, first-out or an average cost basis. Net realizable value for materials and supplies is determined by reference to current market prices.
(E) EXPLORATION AND EVALUATION ASSETSExploration and evaluation ("E&E") assets consist of the Company’s crude oil and natural gas exploration projects that are pending the determination of proved reserves.
E&E costs are initially capitalized and include costs directly associated with the acquisition of licenses, technical services and studies, seismic acquisition, exploration drilling and evaluation, overhead and administration expenses, and the estimate of any asset retirement costs. E&E costs do not include general prospecting or evaluation costs incurred prior to having obtained the legal rights to explore an area. These costs are recognized in net earnings.
Once the technical feasibility and commercial viability of E&E assets are determined and a development decision is made by management, the E&E assets are tested for impairment upon reclassification to property, plant and equipment. The technical feasibility and commercial viability of extracting a mineral resource is considered to be determined when an assessment of proved reserves is made. An E&E asset is derecognized upon disposal or when no future economic benefits are expected to arise from its use. Any gain or loss arising on derecognition of the asset is recognized in net earnings within depletion, depreciation and amortization.
E&E assets are also tested for impairment when facts and circumstances suggest that the carrying amount of E&E assets may exceed their recoverable amount, by comparing the relevant costs to the fair value of the related Cash Generating Units ("CGUs"), aggregated at a segment level. Indications of impairment include leases approaching expiry, the existence of low benchmark commodity prices for an extended period of time, significant downward revisions in estimated probable reserves volumes, significant increases in estimated future exploration or development expenditures, or significant adverse changes in the applicable legislative or regulatory frameworks.
(F) PROPERTY, PLANT AND EQUIPMENTProperty, plant and equipment is measured at cost less accumulated depletion and depreciation and impairment provisions. Assets under construction are not depleted or depreciated until available for their intended use.
Exploration and ProductionThe cost of an asset comprises its acquisition costs, construction and development costs, costs directly attributable to bringing the asset into operation, the estimate of any asset retirement costs, and applicable borrowing costs. Property acquisition costs are comprised of the aggregate amount paid and the fair value of any other consideration given to acquire the asset.
When significant components of an item of property, plant and equipment, including crude oil and natural gas interests, have different useful lives, they are accounted for separately.
Crude oil and natural gas properties are depleted using the unit-of-production method over proved reserves, except for certain major components, which are depreciated using a straight-line method over their estimated useful lives. The unit-of-production depletion rate takes into account expenditures incurred to date, together with future development expenditures required to develop proved reserves.
Oil Sands Mining and UpgradingCapitalized costs for the Oil Sands Mining and Upgrading segment are reported separately from the Company’s North America Exploration and Production segment. Capitalized costs include acquisition costs, construction and development costs, costs directly attributable to bringing the asset into operation, the estimate of any asset retirement costs, and applicable borrowing costs.
Mine-related costs are depleted using the unit-of-production method based on proved reserves. Costs of the upgraders and related infrastructure located on the Horizon and AOSP sites are depreciated on the unit-of-production method based on the estimated productive capacity of the respective upgraders and related infrastructure. Other equipment is depreciated on a straight-line basis over its estimated useful life ranging from 2 to 18 years.
60Canadian Natural 2020 Annual Report
Midstream, Refining and Head OfficeThe Company capitalizes all costs that expand the capacity or extend the useful life of the midstream, refining and head office assets. Midstream and Refining assets are depreciated on a straight-line basis over their estimated useful lives ranging from 5 to 30 years. Head office assets are depreciated on a declining balance basis.
Useful livesThe depletion rates and expected useful lives of property, plant and equipment are reviewed on an annual basis, with changes in depletion rates and useful lives accounted for prospectively.
DerecognitionA property, plant and equipment asset is derecognized upon disposal or when no future economic benefits are expected to arise from the continued use of the asset. Any gain or loss arising on derecognition of the asset (calculated as the difference between the net disposal proceeds and the carrying amount of the asset) is recognized in net earnings within depletion, depreciation and amortization.
Major maintenance expendituresInspection costs associated with major maintenance turnarounds are capitalized and depreciated over the period to the next major maintenance turnaround. Maintenance costs are expensed as incurred.
ImpairmentThe Company assesses property, plant and equipment for impairment whenever events or changes in circumstances indicate that the carrying amount of an asset or group of assets may not be recoverable. Indications of impairment include the existence of low benchmark commodity prices for an extended period of time, significant downward revisions of estimated reserves volumes, significant increases in estimated future development expenditures, or significant adverse changes in the applicable legislative or regulatory frameworks. If an indication of impairment exists, the Company performs an impairment test related to the assets. Individual assets are grouped for impairment assessment purposes into CGUs, which are the lowest level at which there are identifiable cash inflows that are largely independent of the cash inflows of other groups of assets. A CGU's recoverable amount is the higher of its fair value less costs of disposal and its value in use. Where the carrying amount of a CGU exceeds its recoverable amount, the CGU is considered impaired and is written down to its recoverable amount through depletion, depreciation and amortization expense.
In subsequent periods, an assessment is made at each reporting date to determine whether there is any indication that previously recognized impairment losses may no longer exist or may have decreased. If such indication exists, the recoverable amount is re-estimated and the net carrying amount of the asset is increased to its revised recoverable amount. The revised recoverable amount cannot exceed the carrying amount that would have been determined, net of depletion, depreciation and amortization, had no impairment loss been recognized for the asset in prior periods. A reversal of impairment is recognized in net earnings. After a reversal, the depletion, depreciation and amortization charge is adjusted in future periods to allocate the asset’s revised carrying amount over its remaining useful life.
(G) BUSINESS COMBINATIONSBusiness combinations are accounted for using the acquisition method. Assets acquired and liabilities assumed in a business combination are recognized at their fair value at the date of the acquisition. Any excess of the consideration paid over the fair value of the net assets acquired is recognized as an asset. Any excess of the fair value of the net assets acquired over the consideration paid is recognized in net earnings.
(H) OVERBURDEN REMOVAL COSTS Overburden removal costs incurred during the initial development of a mine at Horizon and AOSP are capitalized to property, plant and equipment. Overburden removal costs incurred during the production of a mine are included in the cost of inventory, unless the overburden removal activity has resulted in a probable inflow of future economic benefits to the Company, in which case the costs are capitalized to property, plant and equipment. Capitalized overburden removal costs are depleted over the life of the mining reserves that directly benefit from the overburden removal activity.
(I) CAPITALIZED BORROWING COSTSBorrowing costs attributable to the acquisition, construction or production of qualifying assets are capitalized to the cost of those assets until such time as the assets are substantially available for their intended use. Qualifying assets are comprised of those significant assets that require a period greater than one year to be available for their intended use. All other borrowing costs are recognized in net earnings.

Canadian Natural 2020 Annual Report 61
(J) LEASESAt inception of a contract, the Company assesses whether a contract is, or contains a lease. A contract is, or contains a lease if the contract conveys the right to control the use of an identified asset for a period of time in exchange for consideration. To assess whether a contract conveys the right to control the use of an identified asset, the Company assesses whether: the contract involves the use of an identified asset; the Company has the right to obtain substantially all of the economic benefits from the use of the asset throughout the period of use; and, the Company has the right to direct the use of the asset.
The Company recognizes a lease asset and a lease liability at the commencement date of the lease contract, which is the date that the lease asset is available to the Company. The lease asset is initially measured at cost. The cost of a lease asset includes the amount of the initial measurement of the lease liability, lease payments made prior to the commencement date, initial direct costs and estimates of the asset retirement obligation, if any. Subsequent to initial recognition, the lease asset is depreciated using the straight-line method over the earlier of the end of the useful life of the lease asset or the lease term.
Lease liabilities are initially measured at the present value of lease payments discounted at the rate implicit in the lease, or if not readily determinable, the Company's incremental borrowing rate. Lease payments include fixed lease payments, variable lease payments based on indices or rates, residual value guarantees, and purchase options expected to be exercised. Subsequent to initial recognition, the lease liability is measured at amortized cost using the effective interest method. Lease liabilities are remeasured if there are changes in the lease term or if the Company changes its assessment of whether it is reasonably certain it will exercise a purchase, extension or termination option. Lease liabilities are also remeasured if there are changes in the estimate of the amounts payable under the lease due to changes in indices or rates, or residual value guarantees.
Lease assets are reported in a separate caption in the consolidated balance sheet. Lease liabilities are reported within other long-term liabilities in the consolidated balance sheet.
Depreciation on lease assets used in the construction of property, plant and equipment is capitalized to the cost of those assets over their period of use until such time as the property, plant and equipment is substantially available for its intended use.
Where the Company acts as the operator of a joint operation, the Company recognizes 100% of the related lease asset and lease liability. As the Company recovers its joint operation partners' share of the costs of the lease contract, these recoveries are recognized as other income in the consolidated statements of earnings.
On January 1, 2019 the Company adopted IFRS 16 "Leases" and as permitted in the transition requirements of the standard, the Company continues to account for leases for the year ended December 31, 2018 in accordance with the Company's previous accounting policy for leases as follows:
Finance leases, which transfer substantially all of the risks and rewards incidental to ownership of the leased item to the Company, are capitalized at the commencement of the lease term at the fair value of the leased property or, if lower, at the present value of the minimum lease payments. Capitalized leased assets are depreciated over the shorter of the estimated useful life of the asset or the lease term. Operating lease payments are recognized in net earnings over the lease term.
(K) ASSET RETIREMENT OBLIGATIONSThe Company provides for asset retirement obligations on all of its property, plant and equipment and certain exploration and evaluation assets based on current legislation and industry operating practices. Provisions for asset retirement obligations related to property, plant and equipment are recognized as a liability in the period in which they are incurred. Provisions are measured at the present value of management’s best estimate of expenditures required to settle the obligation as at the date of the balance sheets. Subsequent to the initial measurement, the obligation is adjusted to reflect the passage of time, changes in credit adjusted interest rates, and changes in the estimated future cash flows underlying the obligation. The increase in the provision due to the passage of time is recognized as asset retirement obligation accretion expense whereas changes due to discount rates or estimated future cash flows are capitalized to or derecognized from property, plant and equipment. Actual costs incurred upon settlement of the asset retirement obligation are charged against the provision.
(L) FOREIGN CURRENCY TRANSLATIONFunctional and presentation currencyItems included in the financial statements of the Company’s subsidiary companies and partnerships are measured using the currency of the primary economic environment in which the subsidiary operates (the "functional currency"). The consolidated financial statements are presented in Canadian dollars, which is the Company’s functional currency.
The assets and liabilities of subsidiaries that have a functional currency different from that of the Company are translated into Canadian dollars at the closing rate at the date of the balance sheets, and revenue and expenses are translated at the average rate for the period. Cumulative foreign currency translation adjustments are recognized in other comprehensive income.
When the Company disposes of its entire interest in a foreign operation, or loses control, joint control, or significant influence over a foreign operation, the foreign currency gains or losses accumulated in other comprehensive income related to the foreign operation are recognized in net earnings.

62Canadian Natural 2020 Annual Report
Transactions and balancesForeign currency transactions are translated into the functional currency of the Company and its subsidiaries and partnerships using the exchange rates prevailing at the dates of the transactions. Foreign exchange gains and losses resulting from the settlement of foreign currency transactions and from the translation at balance sheet date exchange rates of monetary assets and liabilities denominated in currencies other than the functional currency are recognized in net earnings.
(M) REVENUE RECOGNITION AND COSTS OF GOODS SOLDRevenue from the sale of crude oil and NGLs and natural gas products is recognized when performance obligations in the sales contract are satisfied and it is probable that the Company will collect the consideration to which it is entitled. Performance obligations are generally satisfied at the point in time when the product is delivered to a location specified in a contract and control passes to the customer. The Company assesses customer creditworthiness, both before entering into contracts and throughout the revenue recognition process.
Contracts for sale of the Company’s products generally have terms of less than a year, with certain contracts extending beyond one year. Contracts in North America generally specify delivery of crude oil and NGLs and natural gas throughout the term of the contract. Contracts in the North Sea and Offshore Africa generally specify delivery of crude oil at a point in time.
Sales of the Company’s crude oil and NGLs and natural gas products to customers are made pursuant to contracts based on prevailing commodity pricing at or near the time of delivery and volumes of product delivered. Revenues are typically collected in the month following delivery and accordingly, the Company has elected to apply the practical expedient to not adjust consideration for the effects of a financing component. Purchases and sales of crude oil and NGLs and natural gas with the same counterparty, made to facilitate sales to customers or potential customers, that are entered into in contemplation of one another, are combined and recorded as non-monetary exchanges and measured at the net settlement amount.
Revenue in the consolidated statement of earnings represents the Company’s share of product sales net of royalty payments to governments and other mineral interest owners. The Company discloses the disaggregation of revenues from sales of crude oil and NGLs and natural gas in the segmented information in note 22. Related costs of goods sold are comprised of production, transportation, blending and feedstock, and depletion, depreciation and amortization expenses. These amounts have been separately presented in the consolidated statements of earnings.
(N) PRODUCTION SHARING CONTRACTS Production generated from Côte d’Ivoire and Gabon in Offshore Africa is shared under the terms of various Production Sharing Contracts ("PSCs"). Product sales are divided into cost recovery oil and profit oil. Cost recovery oil allows the Company to recover its capital and production costs and the costs carried by the Company on behalf of the respective government state oil companies (the "Governments"). Profit oil is allocated to the joint venture partners in accordance with their respective equity interests, after a portion has been allocated to the Governments. The Governments’ share of profit oil attributable to the Company’s equity interest is allocated to royalty expense and current income tax expense in accordance with the terms of the respective PSCs.
(O) INCOME TAXThe Company follows the liability method of accounting for income taxes. Under this method, deferred income tax assets and liabilities are recognized based on the estimated income tax effects of temporary differences in the carrying amount of assets and liabilities in the consolidated financial statements and their respective tax bases.
Deferred income tax assets and liabilities are calculated using the substantively enacted income tax rates that are expected to apply when the asset or liability is recovered. Deferred income tax assets or liabilities are not recognized when they arise on the initial recognition of an asset or liability in a transaction (other than in a business combination) that, at the time of the transaction, affects neither accounting nor taxable profit. Deferred income tax assets or liabilities are also not recognized on possible future distributions of retained earnings of subsidiaries where the timing of the distribution can be controlled by the Company and it is probable that a distribution will not be made in the foreseeable future, or when distributions can be made without incurring income taxes.
Deferred income tax assets for deductible temporary differences and tax loss carryforwards are recognized to the extent that it is probable that future taxable profits will be available against which the temporary differences or tax loss carryforwards can be utilized. The carrying amount of deferred income tax assets is reviewed at each reporting date, and is reduced if it is no longer probable that sufficient future taxable profits will be available against which the temporary differences or tax loss carryforwards can be utilized.
Current income tax is calculated based on net earnings for the period, adjusted for items that are non-taxable or taxed in different periods, using income tax rates that are substantively enacted at each reporting date.
Income taxes are recognized in net earnings or other comprehensive income, consistent with the items to which they relate.

Canadian Natural 2020 Annual Report 63
(P) SHARE-BASED COMPENSATIONThe Company’s Stock Option Plan (the "Option Plan") provides current employees with the right to elect to receive common shares or a cash payment in exchange for stock options surrendered. The liability for awards granted to employees is initially measured based on the grant date fair value of the awards and the number of awards expected to vest. The awards are remeasured each reporting period for subsequent changes in the fair value of the liability. Fair value is determined using the Black-Scholes valuation model under a graded vesting method. Expected volatility is estimated based on historic results. When stock options are surrendered for cash, the cash settlement paid reduces the outstanding liability. When stock options are exercised for common shares under the Option Plan, consideration paid by the employee and any previously recognized liability associated with the stock options are recorded as share capital.
The Performance Share Unit ("PSU") plan provides certain executive employees of the Company with the right to receive a cash payment, the amount of which is determined by individual employee performance and the extent to which certain other performance measures are met. PSUs vest three years from original grant date. The liability for PSUs is initially measured in reference to the Company's stock price and the number of awards expected to vest and is remeasured at each reporting period for changes in the fair value of the liability.
The unamortized costs of employer contributions to the Company’s share bonus program are included in other long-term assets.
(Q) FINANCIAL INSTRUMENTSThe Company classifies its financial instruments into one of the following categories: financial assets at amortized cost; financial liabilities at amortized cost; and fair value through profit or loss. All financial instruments are measured at fair value on initial recognition. Measurement in subsequent periods is dependent on the classification of the respective financial instrument.
Fair value through profit or loss financial instruments are subsequently measured at fair value with changes in fair value recognized in net earnings. All other categories of financial instruments are measured at amortized cost using the effective interest method.
Cash and cash equivalents, accounts receivable and certain other long-term assets are classified as financial assets at amortized cost since it is the Company’s intention to hold these assets to maturity and the related cash flows are solely comprised of payments of principal and interest. Investments in publicly traded shares are classified as fair value through profit or loss. Accounts payable, accrued liabilities, certain other long-term liabilities, and long-term debt are classified as financial liabilities at amortized cost. Risk management assets and liabilities are classified as fair value through profit or loss.
Financial assets and liabilities are also categorized using a three-level hierarchy that reflects the significance of the inputs used in making fair value measurements for these assets and liabilities. The fair values of financial assets and liabilities included in Level 1 are determined by reference to quoted prices in active markets for identical assets and liabilities. Fair values of financial assets and liabilities in Level 2 are based on inputs other than Level 1 quoted prices that are observable for the asset or liability either directly (as prices) or indirectly (derived from prices). The fair values of Level 3 financial assets and liabilities are not based on observable market data. The disclosure of the fair value hierarchy excludes financial assets and liabilities where book value approximates fair value due to the liquid nature of the asset or liability.
Transaction costs in respect of financial instruments at fair value through profit or loss are recognized in net earnings. Transaction costs in respect of other financial instruments are included in the initial measurement of the financial instrument.
Impairment of financial assetsAt each reporting date, on a forward looking basis, the Company assesses the expected credit losses associated with its financial assets carried at amortized cost. Expected credit losses are measured as the difference between the cash flows that are due to the Company and the cash flows that the Company expects to receive, discounted at the effective interest rate determined at initial recognition. For trade accounts receivable, the Company applies the simplified approach permitted by IFRS 9, which requires expected lifetime credit losses to be recognized from initial recognition of the receivables. To measure expected credit losses, accounts receivable are grouped based on the number of days the receivables have been outstanding and internal credit assessments of the customers. Credit risk for longer-term receivables is assessed based on an external credit rating of the counterparty. For longer-term receivables with credit risk that has not increased significantly since the date of recognition, the Company measures the expected credit loss as the 12-month expected credit loss.
Changes in the provision for expected credit loss are recognized in net earnings.

64Canadian Natural 2020 Annual Report
(R) RISK MANAGEMENT ACTIVITIESThe Company periodically uses derivative financial instruments to manage its commodity price, foreign currency and interest rate exposures. These financial instruments are entered into solely for hedging purposes and are not used for speculative purposes. All derivative financial instruments are recognized in the consolidated balance sheets at their estimated fair value. The estimated fair value of derivative financial instruments has been determined based on appropriate internal valuation methodologies and/or third party indications. Fair values determined using valuation models require the use of assumptions concerning the amount and timing of future cash flows, discount rates and credit risk. In determining these assumptions, the Company primarily relied on external, readily-observable market inputs including quoted commodity prices and volatility, interest rate yield curves, and foreign exchange rates. The carrying amount of a risk management liability is adjusted for the Company’s own credit risk.
The Company documents all derivative financial instruments that are formally designated as hedging transactions at the inception of the hedging relationship, in accordance with the Company’s risk management policies. The effectiveness of the hedging relationship is evaluated, both at inception of the hedge and on an ongoing basis.
The Company periodically enters into commodity price contracts to manage anticipated sales and purchases of crude oil and natural gas in order to protect its cash flow for its capital expenditure programs. The effective portion of changes in the fair value of derivative commodity price contracts formally designated as cash flow hedges is initially recognized in other comprehensive income and is reclassified to risk management activities in net earnings in the same period or periods in which the commodity is sold or purchased. The ineffective portion of changes in the fair value of these designated contracts is recognized in risk management activities in net earnings. All changes in the fair value of non-designated crude oil and natural gas commodity price contracts are recognized in risk management activities in net earnings.
The Company periodically enters into interest rate swap contracts to manage its fixed to floating interest rate mix on certain long-term debt instruments. The interest rate swap contracts require the periodic exchange of payments without the exchange of the notional principal amounts on which the payments are based. Changes in the fair value of interest rate swap contracts designated as fair value hedges and corresponding changes in the fair value of the hedged long-term debt are recognized in interest expense in net earnings. Changes in the fair value of non-designated interest rate swap contracts are recognized in risk management activities in net earnings.
Upon termination of an interest rate swap designated as a fair value hedge, the interest rate swap is derecognized in the consolidated balance sheets and the related long-term debt hedged is no longer revalued for subsequent changes in fair value due to interest rates changes. The fair value adjustment due to interest rates on the long-term debt at the date of termination of the interest rate swap is amortized to interest expense over the remaining term of the long-term debt.
Cross currency swap contracts are periodically used to manage currency exposure on US dollar denominated long-term debt. The cross currency swap contracts require the periodic exchange of payments with the exchange at maturity of notional principal amounts on which the payments are based. Changes in the fair value of the foreign exchange component of cross currency swap contracts designated as cash flow hedges related to the notional principal amounts are recognized in foreign exchange gains and losses in net earnings. The effective portion of changes in the fair value of the interest rate component of cross currency swap contracts designated as cash flow hedges is initially recognized in other comprehensive income and is reclassified to interest expense when the hedged item is recognized in net earnings, with the ineffective portion recognized in risk management activities in net earnings. Changes in the fair value of non-designated cross currency swap contracts are recognized in risk management activities in net earnings.
Realized gains or losses on the termination of financial instruments that have been designated as cash flow hedges are deferred under accumulated other comprehensive income and amortized into net earnings in the periods in which the underlying hedged items are recognized. In the event a designated hedged item is sold, extinguished or matures prior to the termination of the related derivative instrument, any unrealized derivative gain or loss is recognized in net earnings. Realized gains or losses on the termination of financial instruments that have not been designated as hedges are recognized in net earnings.
Foreign currency forward contracts are periodically used to manage foreign currency cash requirements. The foreign currency forward contracts involve the purchase or sale of an agreed upon amount of US dollars at a specified future date at forward exchange rates. Changes in the fair value of foreign currency forward contracts designated as cash flow hedges are initially recorded in other comprehensive income and are reclassified to foreign exchange gains and losses when the hedged item is recognized in net earnings. Changes in the fair value of non-designated foreign currency forward contracts are recognized in risk management activities in net earnings.
Embedded derivatives are derivatives that are included in a non-derivative host contract. Embedded derivatives are recorded at fair value separately from the host contract when their economic characteristics and risks are not clearly and closely related to the host contract, except when the host contract is an asset.

Canadian Natural 2020 Annual Report 65
(S) GOVERNMENT GRANTSThe Company receives or is eligible for government grants, including those introduced in response to the impact of the novel coronavirus ("COVID-19"). Government grants are recognized when there is reasonable assurance that the Company will comply with the conditions attached to the grant and the grant will be received. Grants that are intended to compensate for expenses incurred are classified as other income.
(T) COMPREHENSIVE INCOME (LOSS)Comprehensive income (loss) is comprised of the Company’s net earnings and other comprehensive income (loss). Other comprehensive income (loss) includes the effective portion of changes in the fair value of derivative financial instruments designated as cash flow hedges and foreign currency translation gains and losses arising from the net investment in foreign operations that do not have a Canadian dollar functional currency. Other comprehensive income is shown net of related income taxes.
(U) PER COMMON SHARE AMOUNTSThe Company calculates basic earnings per common share by dividing net earnings by the weighted average number of common shares outstanding during the period. As the Company’s Option Plan allows for the settlement of stock options in either cash or shares at the option of the holder, diluted earnings per common share is calculated using the more dilutive of cash settlement or share settlement under the treasury stock method.
(V) SHARE CAPITALCommon shares are classified as equity. Costs directly attributable to the issue of new shares or options are included in equity as a deduction from proceeds, net of tax. When the Company acquires its own common shares, share capital is reduced by the average carrying value of the shares purchased. The excess of the purchase price over the average carrying value is recognized as a reduction of retained earnings. Shares are cancelled upon purchase.
(W) DIVIDENDSDividends on common shares are recognized in the Company’s financial statements in the period in which the dividends are declared by the Board of Directors.
2. Changes in Accounting PoliciesIn October 2018, the IASB issued amendments to IFRS 3 "Definition of a Business" that narrowed and clarified the definition of a business. The amendments permit a simplified assessment of whether an acquired set of activities and assets is a group of assets rather than a business. The amendments apply to business combinations after the date of adoption. The Company prospectively adopted the amendments on January 1, 2020.
In October 2018, the IASB issued amendments to IAS 1 "Presentation of Financial Statements" and IAS 8 "Accounting Policies, Changes in Accounting Estimates and Errors". The amendments make minor changes to the definition of the term "material" and align the definition across all IFRS Standards. Materiality is used in making judgements related to the preparation of financial statements. The Company prospectively adopted the amendments on January 1, 2020.
3. Accounting Standards Issued But Not Yet AppliedIn January 2020, the IASB issued amendments to IAS 1 "Presentation of Financial Statements" to clarify that liabilities are classified as either current or non-current, depending on the existence of the substantive right at the end of the reporting period for an entity to defer settlement of the liability for at least twelve months after the reporting period. The amendments are effective January 1, 2023 with early adoption permitted. The amendments are required to be adopted retrospectively. The Company is assessing the impact of these amendments on its consolidated financial statements.
In May 2020, the IASB issued amendments to IAS 16 “Property, Plant and Equipment” to require proceeds received from selling items produced while the entity is preparing the asset for its intended use to be recognized in net earnings, rather than as a reduction in the cost of the asset. The amendments are effective January 1, 2022 with early adoption permitted. The Company is assessing the impact of these amendments on its consolidated financial statements.
In August 2020, the IASB issued Interest Rate Benchmark Reform (Phase 2) in response to the Financial Stability Board’s mandated reforms to InterBank Offered Rates (“IBORs”), with financial regulators proposing that they be replaced by a number of new local currency denominated alternative benchmark rates. The amendments are effective for annual periods beginning on or after January 1, 2021 and are to be applied retrospectively, with early adoption permitted. The Company is assessing the impact of IBOR reform and the IASB amendments and does not expect that these amendments will have a significant impact on the Company's consolidated financial statements.

66Canadian Natural 2020 Annual Report
4. Critical Accounting Estimates and Judgements The Company has made estimates, assumptions and judgements regarding certain assets, liabilities, revenues and expenses in the preparation of the consolidated financial statements, primarily related to unsettled transactions and events as of the date of the consolidated financial statements. Accordingly, actual results may differ from estimated amounts. The estimates, assumptions and judgements that have a significant risk of causing a material adjustment to the carrying amounts of assets and liabilities within the next financial year are addressed below.
(A) CRUDE OIL AND NATURAL GAS RESERVES Purchase price allocations, depletion, depreciation and amortization, asset retirement obligations, and amounts used in impairment calculations are based on estimates of crude oil and natural gas reserves. Reserves estimates are based on engineering data, estimated future prices and production costs, expected future rates of production, and the timing and amount of future development expenditures, all of which are subject to many uncertainties, interpretations and judgements. The Company expects that, over time, its reserves estimates will be revised upward or downward based on updated information.
(B) ASSET RETIREMENT OBLIGATIONSThe Company provides for asset retirement obligations on its property, plant and equipment based on current legislation and operating practices. Estimated future costs include assumptions of dates of future abandonment and technological advances and estimates of future inflation rates and discount rates. Actual costs may vary from the estimated provision due to changes in environmental legislation, the impact of inflation, changes in technology, changes in operating practices, and changes in the date of abandonment due to changes in reserves life. These differences may have a material impact on the estimated provision.
(C) INCOME TAXESThe Company is subject to income taxes in numerous legal jurisdictions. Accounting for income taxes requires the Company to interpret frequently changing laws and regulations, including changing income tax rates, and make certain judgements with respect to the application of tax law, estimating the timing of temporary difference reversals, and estimating the realizability of tax assets. There are many transactions and calculations for which the ultimate tax determination is uncertain. The Company recognizes a liability for a tax filing position based on its assessment of the probability that additional taxes may ultimately be due.
(D) FAIR VALUE OF DERIVATIVES AND OTHER FINANCIAL INSTRUMENTSThe fair value of financial instruments that are not traded in an active market is determined using valuation techniques. The Company uses its judgement to select a variety of methods and make assumptions that are primarily based on market conditions existing at the end of each reporting period. The Company uses directly and indirectly observable inputs in measuring the value of financial instruments that are not traded in active markets, including quoted commodity prices and volatility, interest rate yield curves and foreign exchange rates.
(E) PURCHASE PRICE ALLOCATIONSPurchase prices related to business combinations are allocated to the underlying acquired assets and liabilities based on their estimated fair value at the time of acquisition. The determination of fair value requires the Company to make estimates, assumptions and judgements regarding future events. The allocation process is inherently subjective and impacts the amounts assigned to individually identifiable assets and liabilities, including the fair value of crude oil and natural gas properties together with deferred income tax effects. As a result, the purchase price allocation impacts the Company’s reported assets and liabilities and future net earnings due to the impact on future depletion, depreciation, and amortization expense and impairment tests.
(F) SHARE-BASED COMPENSATIONThe Company has made various assumptions in estimating the fair values of stock options granted under its Option Plan, including expected volatility, expected exercise timing and future forfeiture rates. At each period end, stock options outstanding are remeasured for changes in the estimated fair value of the liability.
(G) IDENTIFICATION OF CGUsCGUs are defined as the lowest grouping of integrated assets that generate identifiable cash inflows that are largely independent of the cash inflows of other assets or groups of assets. The classification of assets into CGUs requires significant judgement and interpretations with respect to the integration between assets, the existence of active markets, shared infrastructures, and the way in which management monitors the Company’s operations.
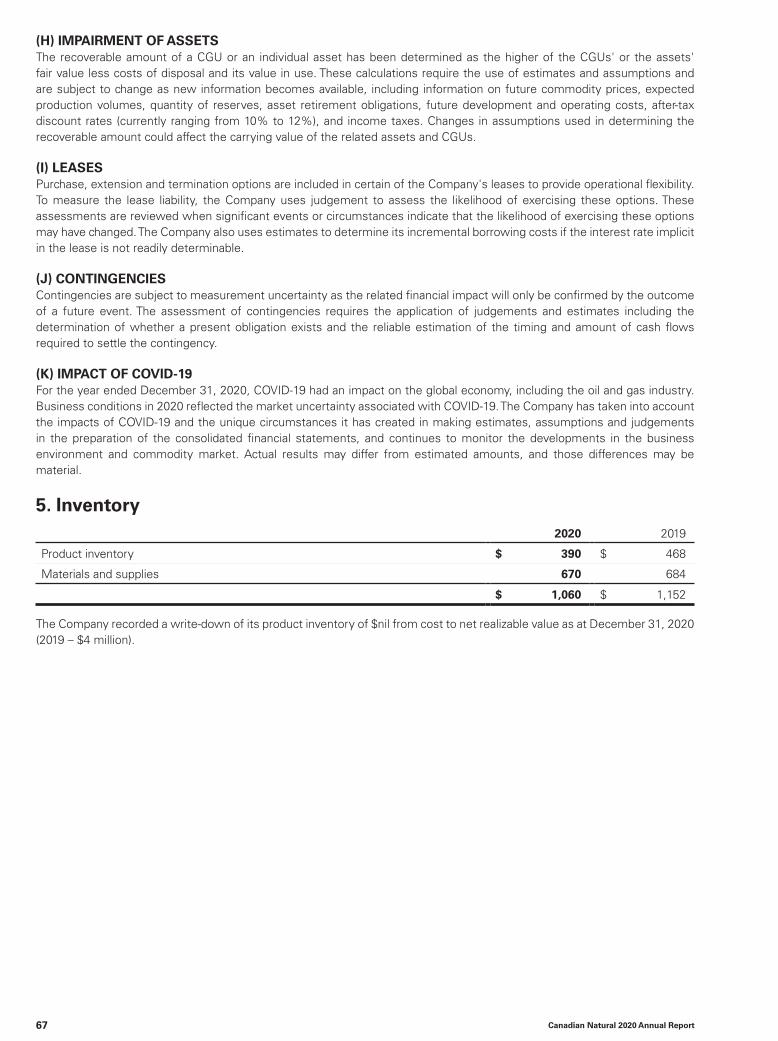
Canadian Natural 2020 Annual Report 67
(H) IMPAIRMENT OF ASSETSThe recoverable amount of a CGU or an individual asset has been determined as the higher of the CGUs' or the assets' fair value less costs of disposal and its value in use. These calculations require the use of estimates and assumptions and are subject to change as new information becomes available, including information on future commodity prices, expected production volumes, quantity of reserves, asset retirement obligations, future development and operating costs, after-tax discount rates (currently ranging from 10% to 12%), and income taxes. Changes in assumptions used in determining the recoverable amount could affect the carrying value of the related assets and CGUs.
(I) LEASESPurchase, extension and termination options are included in certain of the Company's leases to provide operational flexibility. To measure the lease liability, the Company uses judgement to assess the likelihood of exercising these options. These assessments are reviewed when significant events or circumstances indicate that the likelihood of exercising these options may have changed. The Company also uses estimates to determine its incremental borrowing costs if the interest rate implicit in the lease is not readily determinable.
(J) CONTINGENCIESContingencies are subject to measurement uncertainty as the related financial impact will only be confirmed by the outcome of a future event. The assessment of contingencies requires the application of judgements and estimates including the determination of whether a present obligation exists and the reliable estimation of the timing and amount of cash flows required to settle the contingency.
(K) IMPACT OF COVID-19For the year ended December 31, 2020, COVID-19 had an impact on the global economy, including the oil and gas industry. Business conditions in 2020 reflected the market uncertainty associated with COVID-19. The Company has taken into account the impacts of COVID-19 and the unique circumstances it has created in making estimates, assumptions and judgements in the preparation of the consolidated financial statements, and continues to monitor the developments in the business environment and commodity market. Actual results may differ from estimated amounts, and those differences may be material.
5. Inventory 2020 2019
Product inventory $ 390 $ 468
Materials and supplies 670 684
$ 1,060 $ 1,152
The Company recorded a write-down of its product inventory of $nil from cost to net realizable value as at December 31, 2020 (2019 – $4 million).

68Canadian Natural 2020 Annual Report
6. Exploration and Evaluation Assets
Exploration and Production
Oil Sands Mining and
Upgrading Total
North
America North SeaOffshore
Africa
Cost
At December 31, 2018 $ 2,348 $ — $ 37 $ 252 $ 2,637
Additions 38 — 33 — 71
Acquisition of Devon assets (note 7) 91 — — — 91
Transfers to property, plant and equipment (219) — — — (219)
Foreign exchange adjustments — — (1) — (1)
At December 31, 2019 2,258 — 69 252 2,579
Additions/Acquisitions 40 — 15 — 55
Transfers to property, plant and equipment (194) — — — (194)
Derecognitions and other (3) — — — (3)
Foreign exchange adjustments — — (1) — (1)
At December 31, 2020 $ 2,101 $ — $ 83 $ 252 $ 2,436
On October 6, 2020, the Company completed the acquisition of all of the issued and outstanding shares of Painted Pony Energy Ltd. for cash consideration of $111 million, including $15 million of exploration and evaluation assets (note 7).
During 2019, the Company completed the acquisition of substantially all of the assets of Devon including thermal in situ and heavy crude oil assets, for total cash purchase consideration of $3,412 million, including $91 million of exploration and evaluation assets (note 7).
During 2018, in the North America Exploration and Production segment, the Company acquired Laricina Energy Ltd., including exploration and evaluation assets of $118 million and property, plant and equipment of $44 million. In addition, the Company acquired cash of $24 million and deferred income tax assets of $168 million and assumed net working capital liabilities of $18 million, asset retirement obligations of $17 million, and notes payable of $48 million. Total purchase consideration was $46 million, resulting in a pre-tax gain of $225 million on the acquisition, representing the excess of the fair value of the net assets acquired compared to total purchase consideration. The Company settled the notes payable immediately following the completion of the acquisition. The transaction was accounted for using the acquisition method of accounting.
During 2018, the Company also completed two additional farm-out agreements in the Offshore Africa segment to dispose of a combined 30% interest in its exploration right in South Africa, comprised of exploration and evaluation assets of $89 million, including a recovery of $14 million of past incurred costs for net proceeds of $105 million (US$79 million), resulting in a pre-tax gain of $16 million ($12 million after tax). The Company retains a 20% working interest in the exploration right following the completion of these farm-out agreements. Under the term of the various agreements, in the event of a commercial crude oil or natural gas discovery on the exploration right and conversion to a production right, additional cash payments would be made to the Company.

Canadian Natural 2020 Annual Report 69
7. Property, Plant and Equipment
Exploration and Production
Oil Sands Mining and
Upgrading
Midstream and
RefiningHead
Office Total
North
America North SeaOffshore
Africa Cost At December 31, 2018 $ 67,007 $ 7,321 $ 5,471 $ 43,147 $ 441 $ 435 $ 123,822
Additions 2,613 349 233 2,154 10 34 5,393
Acquisition of Devon assets 3,325 — — — — — 3,325
Transfers from E&E assets 219 — — — — — 219
Derecognitions (1) (537) — (1,515) (285) — (3) (2,340)
Foreign exchange adjustments and other
— (374) (256) — — — (630)
At December 31, 2019 72,627 7,296 3,933 45,016 451 466 129,789
Additions/Acquisitions 1,789 104 94 1,328 6 19 3,340
Transfers from E&E assets 194 — — — — — 194
Derecognitions (521) (3) — (634) — — (1,158)
Disposals (92) — — — — — (92)
Foreign exchange adjustments and other
— (114) (64) — — — (178)
At December 31, 2020 $ 73,997 $ 7,283 $ 3,963 $ 45,710 $ 457 $ 485 $ 131,895
Accumulated depletion
and depreciation
At December 31, 2018 $ 43,881 $ 5,735 $ 4,203 $ 4,981 $ 138 $ 325 $ 59,263
Expense 3,215 256 214 1,564 15 23 5,287
Derecognitions (1) (537) — (1,515) (285) — (3) (2,340)
Foreign exchange adjustments and other
18 (279) (190) (13) — — (464)
At December 31, 2019 46,577 5,712 2,712 6,247 153 345 61,746
Expense 3,676 247 161 1,668 15 25 5,792
Derecognitions (521) (3) — (634) — — (1,158)
Disposals (63) — — — — — (63)
Foreign exchange adjustments and other
(28) (103) (51) 8 — — (174)
At December 31, 2020 $ 49,641 $ 5,853 $ 2,822 $ 7,289 $ 168 $ 370 $ 66,143
Net book value
- at December 31, 2020 $ 24,356 $ 1,430 $ 1,141 $ 38,421 $ 289 $ 115 $ 65,752
- at December 31, 2019 $ 26,050 $ 1,584 $ 1,221 $ 38,769 $ 298 $ 121 $ 68,043
(1) Following demobilization of the FPSO at the Olowi field, Gabon in 2019, the Company derecognized property, plant and equipment and associated accumulated depletion and depreciation of $1,515 million.
As at December 31, 2020, the Company assessed the recoverability of its property, plant and equipment and its exploration and evaluation assets, and determined the carrying amounts of all of its cash generating units to be recoverable.
The Company capitalizes construction period interest for qualifying assets based on costs incurred and the Company’s cost of borrowing. Interest capitalization to a qualifying asset ceases once the asset is substantially available for its intended use. During 2020, pre-tax interest of $24 million (2019 – $53 million; 2018 – $69 million) was capitalized to property, plant and equipment using a weighted average capitalization rate of 3.5% (2019 – 4.0%; 2018 – 3.9%).
70Canadian Natural 2020 Annual Report
As at December 31, 2020, the Company recognized certain project costs, not subject to depletion and depreciation, of $117 million in the Oil Sands Mining and Upgrading segment (2019 – $115 million in the Oil Sands Mining and Upgrading segment).
Acquisitions in the current and comparative years have been accounted for as business combinations using the acquisition method of accounting. Gains reported on the acquisitions represent the excess of the fair value of the net assets acquired compared to total purchase consideration.
ACQUISITION OF PAINTED PONY ENERGY LTD. ("PAINTED PONY")On October 6, 2020, the Company completed the acquisition of all the issued and outstanding shares of Painted Pony for total cash consideration of $111 million. Painted Pony is involved in the exploration for and development of natural gas and natural gas liquids in Northeast British Columbia.
The allocation of the purchase price was based on management's best estimates of the fair value of the assets acquired and liabilities assumed as of the acquisition date. The below amounts are estimates, and may be subject to change based on the receipt of new information.
The following provides a summary of the net assets acquired relating to the acquisition:
Property, plant and equipment $ 750
Exploration and evaluation assets 15
Other long-term assets 204
Long-term debt (397)
Asset retirement obligations (13)
Other long-term liabilities (442)
Deferred tax asset 211
Net assets acquired 328
Less: cash consideration 111
Gain on acquisition (1) $ 217
(1) Gain on acquisition of $217 million represents the excess of the fair value of the net assets acquired compared with the total purchase consideration.
In connection with the acquisition the Company assumed certain product transportation and processing commitments (note 20).
ACQUISITION OF THERMAL IN SITU AND PRIMARY HEAVY CRUDE OIL ASSETSOn June 27, 2019, the Company completed the acquisition of substantially all of the assets of Devon including thermal in situ and heavy crude oil assets, for total cash purchase consideration of $3,412 million.
In connection with the acquisition, the Company arranged a $3,250 million committed term facility (note 11) and assumed certain product transportation commitments (note 20).
The following provides a summary of the net assets acquired relating to the acquisition:
Property, plant and equipment $ 3,325
Exploration and evaluation assets 91
Inventory, prepaids and other long-term assets 195
Accrued liabilities (21)
Asset retirement obligations (178)
Net assets acquired $ 3,412
As a result of the acquisition, during the year ended December 31, 2019, revenue increased by approximately $1,540 million to $22,871 million and revenue, less production and transportation, blending and feedstock expenses increased by approximately $590 million to $11,895 million.
OTHER ACQUISITIONS AND DERECOGNITIONSDuring 2019, the Company acquired a number of producing crude oil and natural gas properties in the North America Exploration and Production segment for net cash consideration of $80 million (2018 – $170 million) and assumed associated asset retirement obligations of $20 million (2018 – $13 million). No net deferred income tax liabilities were recognized (2018 – $nil) and no pre-tax gains were recognized on these net transactions (2018 – pre-tax gain of $47 million).

Canadian Natural 2020 Annual Report 71
8. LeasesLEASE ASSETS
Product transportation
and storage
Field equipment and power
Offshore vessels and equipment
Office leases and other Total
At January 1, 2019 (1) $ 823 $ 332 $ 252 $ 132 $ 1,539
Additions 452 43 12 20 527
Depreciation (106) (54) (72) (27) (259)
Derecognitions — (6) — — (6)
Foreign exchange adjustments and other (3) 2 (10) (1) (12)
At December 31, 2019 $ 1,166 $ 317 $ 182 $ 124 $ 1,789
Additions (2) 17 121 7 3 148
Depreciation (124) (53) (51) (26) (254)
Derecognitions (20) (5) (10) — (35)
Foreign exchange adjustments and other (1) (1) — (1) (3)
At December 31, 2020 $ 1,038 $ 379 $ 128 $ 100 $ 1,645
(1) The Company adopted IFRS 16 "Leases" on January 1, 2019 using the modified retrospective approach.(2) The acquisition of Painted Pony in 2020 included lease assets of $93 million (note 7).
LEASE ASSETS, BY SEGMENTAs at December 31, 2020 and 2019, the Company had the following lease assets by segment:
2020 2019
Exploration and Production
North America $ 345 $ 300
North Sea 7 38
Offshore Africa 126 154
Oil Sands Mining and Upgrading 1,080 1,191
Head office 87 106
$ 1,645 $ 1,789
During 2018, in connection with the acquisition of the remaining interest in certain operations in the North Sea Exploration and Production segment, the Company acquired $108 million of property, plant and equipment, for net proceeds received of $73 million. The Company also acquired net working capital of $7 million, assumed associated asset retirement obligations of $41 million and recognized net deferred income tax liabilities of $27 million. The Company recognized a pre-tax gain of $120 million on the acquisition and a pre-tax revaluation gain of $19 million relating to its previously held interest.
During 2018, the Gabonese Republic agreed to cessation of production from the Company’s Olowi field, as well as the terms of termination of the Olowi Production Sharing Contract and the return of the permit area back to the Gabonese Republic, including the associated asset retirement obligations of $69 million. The transaction resulted in a pre-tax gain on disposition of property of $20 million ($14 million after-tax).

72Canadian Natural 2020 Annual Report
LEASE LIABILITIESThe Company measures its lease liabilities at the discounted value of its lease payments during the lease term. Lease liabilities at December 31, 2020 and 2019 were as follows:
2020 2019
Lease liabilities $ 1,690 $ 1,809
Less: current portion 189 233
$ 1,501 $ 1,576
In addition to the lease assets disclosed above, on an ongoing basis the Company enters into short-term leases related to its Exploration and Production and Oil Sands Mining and Upgrading activities.
Other amounts included in net earnings and cash flows during 2020 and 2019 are provided below:
2020 2019
Expenses relating to short-term leases (1) $ 409 $ 448
Interest expense on lease liabilities $ 67 $ 70
Variable lease payments not included in the measurement of lease liabilities $ 85 $ 118
Total cash outflows for leases (2) $ 983 $ 1,178
(1) During 2020, the Company capitalized $197 million (2019 - $305 million) of short-term leases as additions to property, plant and equipment.(2) Comprised of cash outflows relating to lease liabilities, short-term leases, and variable lease payments.
9. InvestmentsAs at December 31, 2020 and 2019, the Company had the following investments:
2020 2019
Investment in PrairieSky Royalty Ltd. $ 228 $ 345
Investment in Inter Pipeline Ltd. 77 145
$ 305 $ 490
INVESTMENT IN PRAIRIESKY ROYALTY LTD.The Company’s investment of 22.6 million common shares of PrairieSky Royalty Ltd. ("PrairieSky") does not constitute significant influence, and is accounted for at fair value through profit or loss, measured at each reporting date. As at December 31, 2020, the market price per common share was $10.09 (December 31, 2019 - $15.23). As at December 31, 2020, the Company’s investment in PrairieSky was classified as a current asset. PrairieSky is in the business of acquiring and managing oil and gas royalty income assets through indirect third-party oil and gas development.
The loss from the investment in PrairieSky was comprised as follows:
2020 2019 2018
Fair value loss from PrairieSky $ 117 $ 55 $ 326
Dividend income from PrairieSky (9) (17) (17)
$ 108 $ 38 $ 309
INVESTMENT IN INTER PIPELINE LTD. The Company's investment of 6.4 million common shares of Inter Pipeline Ltd. ("Inter Pipeline") does not constitute significant influence, and is accounted for at fair value through profit or loss, measured at each reporting date. As at December 31, 2020, the markety price per common share was $11.87 (December 31, 2019 - $22.54). As at December 31, 2020, the Company's investment in Inter Pipeline was classified as a current asset. Inter Pipeline is in the business of oil sands transportation, natural gas liquids processing and conventional oil pipelines in Canada and bulk liquid storage in Europe.
The loss (gain) from the investment in Inter Pipeline was comprised as follows:
2020 2019 2018
Fair value loss (gain) from Inter Pipeline $ 68 $ (21) $ 43
Dividend income from Inter Pipeline (5) (11) (11)
$ 63 $ (32) $ 32
On February 22, 2021, Brookfield Infrastructure Partners L.P. commenced a formal offer to purchase all issued and outstanding Inter Pipeline common shares for $16.50 per common share. The offer is open for acceptance until Monday, June 7, 2021.
Canadian Natural 2020 Annual Report 73
10. Other Long-Term Assets 2020 2019
North West Redwater Partnership $ 555 $ 652
Prepaid cost of service toll 162 130
Risk management (note 19) 136 290
Long-term inventory 121 121
Other (1) 190 84
1,164 1,277
Less: current portion 82 54
$ 1,082 $ 1,223
(1) The acquisition of Painted Pony in 2020 included physical sales contracts valued at $111 million (note 7).
INVESTMENT IN NORTH WEST REDWATER PARTNERSHIPThe Company has a 50% equity investment in and has made subordinated debt advances of $555 million to NWRP (2019 - $652 million), including accrued interest. The subordinated debt is repayable over 10 years commencing July 2021, and bears interest at prime plus 6%. During the year ended December 31, 2020, $124 million of the subordinated debt was repaid to the Company. NWRP operates a 50,000 barrels per day bitumen upgrader and refinery that targets to process 12,500 barrels per day of bitumen feedstock for the Company and 37,500 barrels per day of bitumen feedstock for the Alberta Petroleum Marketing Commission, an agent of the Government of Alberta, under a 30-year fee-for-service tolling agreement.
On June 1, 2020, the refinery achieved the Commercial Operation Date ("COD"), pursuant to the terms of the tolling agreement. The Company is unconditionally obligated to pay its 25% pro rata share of the debt tolls over the 30-year tolling period (note 20). Subsequent to COD, sales of diesel and refined products and associated refining tolls are recognized in the Midstream and Refining segment.
NWRP has a secured $3,500 million syndicated credit facility, of which $2,000 million is revolving and matures in June 2021 and the remaining $1,500 million is fully drawn on a non-revolving basis. In 2019, NWRP extended the $1,500 million non-revolving facility, previously scheduled to mature in February 2020, to February 2021. Subsequent to December 31, 2020, NWRP extended the $1,500 million non-revolving facility to June 2021. As at December 31, 2020, NWRP had borrowings of $2,866 million under the syndicated credit facility, which was classified as current (December 31, 2019 - $2,715 million classified as long-term).
The unrecognized share of the equity loss from NWRP for 2020 was $94 million (December 31, 2019 - recognized equity loss of $287 million and unrecognized equity loss of $59 million; December 31, 2018 - recognized equity loss of $5 million). As at December 31, 2020, the cumulative unrecognized share of equity losses from NWRP was $153 million (December 31, 2019 – $59 million).
The assets, liabilities, partners’ equity, product sales and equity loss related to NWRP and the Company’s 50% interest at December 31, 2020 and 2019 were comprised as follows:
2020 (1) 2019 (2)
NWRP
100% interestCompany
50% interestNWRP
100% interestCompany
50% interest
Current assets $ 230 $ 115 $ 248 $ 124
Non-current assets $ 11,098 $ 5,549 $ 11,328 $ 5,664
Current liabilities $ 3,146 $ 1,573 $ 384 $ 192
Non-current liabilities $ 8,488 $ 4,244 $ 11,310 $ 5,655
Partners’ equity $ (306) $ (153) $ (118) $ (59)
Revenue (3) $ 1,348 $ 674 $ 1,736 $ 868
Net loss $ 188 $ 94 $ 692 $ 346
(1) In 2020, included in the net loss is the impact of depreciation and amortization expense at 100% interest of $214 million (50% interest - $107 million) and interest and other financing expense at 100% interest of $420 million (50% interest - $210 million).
(2) In 2019, included in the net loss is the impact of depreciation and amortization expense at 100% interest of $152 million (50% interest - $76 million) and interest and other financing expense at 100% interest of $398 million (50% interest - $199 million).
(3) Included in NWRP’s revenue for the period subsequent to COD in 2020, is $174 million paid by the Company for its 25% share of the refining toll.

74Canadian Natural 2020 Annual Report
11. Long-Term Debt 2020 2019
Canadian dollar denominated debt, unsecured
Bank credit facilities $ 1,614 $ 1,688
Medium-term notes
2.05% debentures due June 1, 2020 — 900
2.89% debentures due August 14, 2020 — 1,000
3.31% debentures due February 11, 2022 1,000 1,000
1.45% debentures due November 16, 2023 500 —
3.55% debentures due June 3, 2024 500 500
3.42% debentures due December 1, 2026 600 600
2.50% debentures due January 17, 2028 300 —
4.85% debentures due May 30, 2047 300 300
4,814 5,988
US dollar denominated debt, unsecured
Bank credit facilities (December 31, 2020 – US$3,953 million; December 31, 2019 – US$3,745 million) 5,041 4,855
Commercial paper (December 31, 2020 – US$426 million; December 31, 2019 – US$254 million) 544 329
US dollar debt securities
3.45% due November 15, 2021 (US$500 million) 638 648
2.95% due January 15, 2023 (US$1,000 million) 1,276 1,296
3.80% due April 15, 2024 (US$500 million) 638 648
3.90% due February 1, 2025 (US$600 million) 765 778
2.05% due July 15, 2025 (US$600 million) 765 —
3.85% due June 1, 2027 (US$1,250 million) 1,595 1,621
2.95% due July 15, 2030 (US$500 million) 638 —
7.20% due January 15, 2032 (US$400 million) 510 519
6.45% due June 30, 2033 (US$350 million) 446 454
5.85% due February 1, 2035 (US$350 million) 446 454
6.50% due February 15, 2037 (US$450 million) 574 583
6.25% due March 15, 2038 (US$1,100 million) 1,403 1,426
6.75% due February 1, 2039 (US$400 million) 510 519
4.95% due June 1, 2047 (US$750 million) 957 972
16,746 15,102
Long-term debt before transaction costs and original issue discounts, net 21,560 21,090
Less: original issue discounts, net (1) 18 17
transaction costs (1) (2) 89 91
21,453 20,982
Less: current portion of commercial paper 544 329
current portion of other long-term debt (1) (2) 799 2,062
$ 20,110 $ 18,591
(1) The Company has included unamortized original issue discounts and premiums, and directly attributable transaction costs in the carrying amount of the outstanding debt.
(2) Transaction costs primarily represent underwriting commissions charged as a percentage of the related debt offerings, as well as legal, rating agency and other professional fees.

Canadian Natural 2020 Annual Report 75
BANK CREDIT FACILITIES AND COMMERCIAL PAPERAs at December 31, 2020, the Company had undrawn revolving bank credit facilities of $4,958 million. Additionally, the Company had in place fully drawn term credit facilities of $6,738 million. Details of these facilities are described below. The Company also has certain other dedicated credit facilities supporting letters of credit. At December 31, 2020, the Company had $544 million drawn under its commercial paper program, and reserved capacity under its revolving bank credit facilities for amounts outstanding under this program.
■ a $100 million demand credit facility; ■ a $1,000 million non-revolving term credit facility maturing February 2022; ■ a $2,425 million revolving syndicated credit facility maturing June 2022; ■ a $3,088 million non-revolving term credit facility maturing June 2022; ■ a $2,650 million non-revolving term credit facility maturing February 2023; ■ a $2,425 million revolving syndicated credit facility maturing June 2023; and ■ a £5 million demand credit facility related to the Company’s North Sea operations.
Borrowings under the Company's non-revolving term credit facilities may be made by way of pricing referenced to Canadian dollar bankers' acceptances, US dollar bankers’ acceptances, LIBOR, US base rate or Canadian prime rate. As at December 31, 2020, the non-revolving term credit facilities were fully drawn.
During 2020, the $750 million non-revolving term credit facility, originally due February 2021, was extended to February 2022 and increased to $1,000 million. Subsequent to December 31, 2020, the facility was extended to February 2023.
During 2019, the Company fully repaid and cancelled the $1,800 million non-revolving term credit facility scheduled to mature in May 2020. In addition, the $2,200 million non-revolving term credit facility, originally due October 2020, was extended to February 2023 and increased to $2,650 million.
During 2019, the Company entered into a $3,250 million non-revolving term credit facility to finance the acquisition of assets from Devon (note 7). During 2020, the Company repaid $162.5 million related to the required annual amortization, reducing the facility balance to $3,088 million. Subsequent to December 31, 2020, the Company repaid a further $362.5 million on the facility, reducing the outstanding balance to $2,725 million, and satisfying the required annual amortization of $162.5 million originally due in June 2021. The facility matures in June 2022.
During 2019, the Company extended the $2,425 million revolving syndicated credit facility, of which $330 million was originally due June 2019 and $2,095 million was originally due June 2021, to 2023. The revolving credit facilities are extendible annually at the mutual agreement of the Company and the lenders. If the facilities are not extended, the full amount of the outstanding principal would be repayable on the maturity date. Borrowings under the Company's revolving term credit facilities may be made by way of pricing referenced to Canadian dollar bankers' acceptances, US dollar bankers' acceptances, LIBOR, US base rate or Canadian prime rate.
During 2019, the Company reduced the £15 million demand credit facility related to the Company's North Sea operations, to £5 million.
The Company’s borrowings under its US commercial paper program are authorized up to a maximum US$2,500 million. The Company reserves capacity under its revolving bank credit facilities for amounts outstanding under this program.
The Company’s weighted average interest rate on bank credit facilities and commercial paper outstanding as at December 31, 2020 was 1.1% (December 31, 2019 – 2.5%), and on total long-term debt outstanding for the year ended December 31, 2020 was 3.5% (December 31, 2019 – 4.0%).
As at December 31, 2020, letters of credit and guarantees aggregating to $489 million were outstanding (December 31, 2019 - $468 million).
MEDIUM-TERM NOTESDuring 2020, the Company issued $500 million of 1.45% medium-term notes due November 2023 and $300 million of 2.50% medium-term notes due January 2028.
After issuing these securities, the Company had $2,200 million remaining on its base shelf prospectus that allows for the offer for sale from time to time of up to $3,000 million of medium-term notes in Canada, which expires August 2021. If issued, these securities may be offered in amounts and at prices, including interest rates, to be determined based on market conditions at the time of issuance.
During 2020, the Company repaid $1,000 million of 2.89% medium term notes and $900 million of 2.05% medium term notes.
During 2019, the Company repaid $500 million of 2.60% medium-term notes and $500 million of 3.05% medium-term notes.

76Canadian Natural 2020 Annual Report
US DOLLAR DEBT SECURITIESDuring 2020, the Company issued US$600 million of 2.05% notes due July 2025 and US$500 million of 2.95% notes due July 2030.
After issuing these securities, the Company had US$1,900 million remaining on its base shelf prospectus that allows for the offer for sale from time to time of up to US$3,000 million of debt securities in the United States, which expires in August 2021. If issued, these securities may be offered in amounts and at prices, including interest rates, to be determined based on market conditions at the time of issuance.
SCHEDULED DEBT REPAYMENTS
Scheduled debt repayments are as follows:
Year Repayment
2021 $ 1,343
2022 $ 4,887
2023 $ 4,383
2024 $ 1,138
2025 $ 1,530
Thereafter $ 8,279
12. Other Long-Term Liabilities 2020 2019
Asset retirement obligations $ 5,861 $ 5,771
Lease liabilities (note 8) (1) 1,690 1,809
Share-based compensation 160 297
Risk management (note 19) 160 112
Deferred purchase consideration (2) 72 95
Other (3) 343 98
8,286 8,182
Less: current portion 722 819
$ 7,564 $ 7,363
(1) The acquisition of Painted Pony in 2020 included lease liabilities of $93 million (note 7). (2) Relates to the acquisition of the Joslyn oil sands project in 2018, payable in annual installments of $25 million over the next three years.(3) The acquisition of Painted Pony in 2020 included product transportation and processing obligations valued at $268 million (note 7).
ASSET RETIREMENT OBLIGATIONSThe Company’s asset retirement obligations are expected to be settled on an ongoing basis over a period of approximately 60 years and discounted using a weighted average discount rate of 3.7% (2019 – 3.8%; 2018 – 5.0%) and inflation rates of up to 2% (December 31, 2019 – up to 2%). Reconciliations of the discounted asset retirement obligations were as follows:
2020 2019 2018
Balance – beginning of year $ 5,771 $ 3,886 $ 4,327
Liabilities incurred 5 15 19
Liabilities acquired, net 13 198 6
Liabilities settled (249) (296) (290)
Asset retirement obligation accretion 205 190 186
Revision of cost and timing estimates (134) 412 (111)
Change in discount rates 253 1,412 (334)
Foreign exchange adjustments (3) (46) 83
Balance – end of year 5,861 5,771 3,886
Less: current portion 184 208 186
$ 5,677 $ 5,563 $ 3,700

Canadian Natural 2020 Annual Report 77
Segmented Asset Retirement Obligations
2020 2019
Exploration and Production
North America $ 2,899 $ 2,792
North Sea 787 816
Offshore Africa 174 161
Oil Sands Mining and Upgrading 1,999 2,000
Midstream and Refining 2 2
$ 5,861 $ 5,771
SHARE-BASED COMPENSATIONThe liability for share-based compensation includes costs incurred under the Company’s Stock Option Plan and PSU plans. The Company’s Stock Option Plan provides current employees with the right to elect to receive common shares or a cash payment in exchange for stock options surrendered. The PSU plan provides certain executive employees of the Company with the right to receive a cash payment, the amount of which is determined by individual employee performance and the extent to which certain other performance measures are met.
The Company recognizes a liability for potential cash settlements under these plans. The current portion of the liability represents the maximum amount of the liability payable within the next twelve month period if all vested stock options and PSUs are settled in cash.
2020 2019 2018
Balance – beginning of year $ 297 $ 124 $ 414
Share-based compensation (recovery) expense (82) 223 (146)
Cash payment for stock options surrendered and PSUs vested (39) (2) (5)
Transferred to common shares (21) (53) (120)
Charged to (recovered from) Oil Sands Mining and Upgrading, net 5 5 (19)
Balance – end of year 160 297 124
Less: current portion 119 227 92
$ 41 $ 70 $ 32
Included within share-based compensation liability as at December 31, 2020 was $49 million (2019 – $62 million; 2018 – $13 million) related to PSUs granted to certain executive employees.
The fair value of stock options outstanding was estimated using the Black-Scholes valuation model with the following weighted average assumptions:
2020 2019 2018
Fair value $ 3.47 $ 7.88 $ 3.33
Share price $ 30.59 $ 42.00 $ 32.94
Expected volatility 39.8% 26.7% 27.4%
Expected dividend yield 5.6% 3.6% 4.1%
Risk free interest rate 0.3% 1.7% 1.9%
Expected forfeiture rate 4.3% 4.3% 4.2%
Expected stock option life (1) 4.3 years 4.4 years 4.4 years
(1) At original time of grant.
The intrinsic value of vested stock options at December 31, 2020 was $11 million (2019 – $75 million; 2018 – $27 million).

78Canadian Natural 2020 Annual Report
13. Income TaxesThe provision for income tax was as follows:
(Recovery) expense 2020 2019 2018
Current corporate income tax – North America $ (245) $ 354 $ 312
Current corporate income tax – North Sea (4) 112 28
Current corporate income tax – Offshore Africa 17 44 54
Current PRT (1) – North Sea (31) (89) (29)
Other taxes 6 13 9
Current income tax (257) 434 374
Deferred corporate income tax (181) (895) 540
Deferred PRT (1) – North Sea — 1 17
Deferred income tax (181) (894) 557
Income tax $ (438) $ (460) $ 931
(1) Petroleum Revenue Tax.
The provision for income tax is different from the amount computed by applying the combined statutory Canadian federal and provincial income tax rates to earnings before taxes. The reasons for the difference are as follows:
2020 2019 2018
Canadian statutory income tax rate 24.1% 26.5% 27.0%
Income tax provision at statutory rate $ (211) $ 1,313 $ 951
Effect on income taxes of:
UK PRT and other taxes (25) (76) (3)
Impact of deductible UK PRT and other taxes on corporate income tax
11 32 3
Foreign and domestic tax rate differentials (52) (48) 6
Non-taxable portion of capital (gains) losses (10) (65) 142
Stock options exercised for common shares (25) 47 (41)
Income tax rate and other legislative changes — (1,618) —
Non-taxable gain on corporate acquisitions (52) — (119)
Revisions arising from prior year tax filings (62) (41) (136)
Change in unrecognized capital loss carryforward asset (10) (65) 142
Other (2) 61 (14)
Income tax $ (438) $ (460) $ 931

Canadian Natural 2020 Annual Report 79
The following table summarizes the temporary differences that give rise to the net deferred income tax liability:
2020 2019
Deferred income tax liabilities
Property, plant and equipment and exploration and evaluation assets $ 11,922 $ 12,074
Lease assets 380 412
Unrealized risk management activities — 27
Investments 14 36
Investment in North West Redwater Partnership 767 593
Other 8 52
13,091 13,194
Deferred income tax assets
Asset retirement obligations (1,495) (1,488)
Lease liabilities (388) (416)
Share-based compensation (12) (16)
Loss carryforwards (1,032) (685)
Unrealized foreign exchange loss on long-term debt (20) (49)
Deferred PRT — (1)
(2,947) (2,655)
Net deferred income tax liability $ 10,144 $ 10,539
Movements in deferred tax assets and liabilities recognized in net earnings during the year were as follows:
2020 2019 2018
Property, plant and equipment and exploration and evaluation assets $ (158) $ (775) $ 281
Lease assets (11) 414 —
Unrealized foreign exchange loss (gain) on long-term debt 29 55 (75)
Unrealized risk management activities (8) (14) 18
Asset retirement obligations (13) (317) 175
Lease liabilities 6 (418) —
Share-based compensation 4 (11) (5)
Loss carryforwards (182) 170 (61)
Investments (22) (10) (50)
Investment in North West Redwater Partnership 174 179 162
Deferred PRT — 1 17
PRT deduction for corporate income tax — — (7)
Other — (168) 102
$ (181) $ (894) $ 557

80Canadian Natural 2020 Annual Report
The following table summarizes the movements of the net deferred income tax liability during the year:
2020 2019 2018
Balance – beginning of year $ 10,539 $ 11,451 $ 10,975
Deferred income tax (recovery) expense (181) (894) 557
Deferred income tax expense (recovery) included in other comprehensive income
— 8 (6)
Foreign exchange adjustments (3) (26) 41
Business combinations (note 6,7) (211) — (116)
Balance – end of year $ 10,144 $ 10,539 $ 11,451
Current income taxes recognized in each operating segment will vary depending upon available income tax deductions related to the nature, timing and amount of capital expenditures incurred in any particular year.
During 2019, the Government of Alberta enacted legislation that decreased the provincial corporate income tax rate from 12% to 11% effective July 2019, with a further 1% rate reduction every year on January 1 until the provincial corporate income tax rate is 8% on January 1, 2022. As a result of this corporate income tax rate reduction, the Company's deferred corporate income tax liability decreased by $1,618 million for the years ended December 31, 2019. During 2020, the Government of Alberta substantively enacted legislation to accelerate this reduction, lowering the corporate tax rate from 10% to 8%, effective July 1, 2020. This acceleration did not have a significant impact on the Company's deferred corporate income tax liability at December 31, 2020.
The Company files income tax returns in the various jurisdictions in which it operates. These tax returns are subject to periodic examinations in the normal course by the applicable tax authorities. The tax returns as prepared may include filing positions that could be subject to differing interpretations of applicable tax laws and regulations, which may take several years to resolve. The Company does not believe the ultimate resolution of these matters will have a material impact upon the Company’s reported results of operations, financial position or liquidity.
Deferred income tax assets are recognized for temporary differences to the extent that the realization of the related tax benefit through future taxable profits is probable. The Company has not recognized deferred income tax assets with respect to taxable capital loss carryforwards in excess of $1,000 million in North America, which can be carried forward indefinitely and only applied against future taxable capital gains. In addition, the Company has not recognized deferred income tax assets related to North American tax pools of approximately $750 million, which can only be claimed against income from certain oil and gas properties.
Deferred income tax liabilities have not been recognized on the unremitted net earnings of wholly controlled subsidiaries. The Company is able to control the timing and amount of distributions and no taxes are payable on distributions from these subsidiaries provided that the distributions remain within certain limits.
Canadian Natural 2020 Annual Report 81
14. Share CapitalAUTHORIZEDPreferred shares issuable in a series.
Unlimited number of common shares without par value.
2020 2019
Issued Common shares
Number of shares(thousands) Amount
Number of shares (thousands) Amount
Balance – beginning of year 1,186,857 $ 9,533 1,201,886 $ 9,323
Issued upon exercise of stock options 3,979 108 10,871 360
Previously recognized liability on stock options exercised for common shares — 21 — 53
Purchase of common shares under Normal Course Issuer Bid (6,970) (56) (25,900) (203)
Balance – end of year 1,183,866 $ 9,606 1,186,857 $ 9,533
PREFERRED SHARESPreferred shares are issuable in a series. If issued, the number of shares in each series, and the designation, rights, privileges, restrictions and conditions attached to the shares will be determined by the Board of Directors of the Company.
DIVIDEND POLICYThe Company has paid regular quarterly dividends in each year since 2001. The dividend policy undergoes periodic review by the Board of Directors and is subject to change.
On March 3, 2021, the Board of Directors declared a quarterly dividend of $0.47 per common share, an increase from the previous quarterly dividend of $0.425 per common share, beginning with the dividend payable on April 5, 2021. On March 4, 2020, the Board of Directors declared a quarterly dividend of $0.425 per common share, an increase from the previous quarterly dividend of $0.375 per common share. On March 6, 2019, the Board of Directors declared a quarterly dividend of $0.375 per common share, an increase from the previous quarterly dividend of $0.335 per common share. On February 28, 2018, the Board of Directors declared a quarterly dividend of $0.335 per common share.
NORMAL COURSE ISSUER BIDOn May 21, 2019, the Company's application was approved for a Normal Course Issuer Bid to purchase through the facilities of the Toronto Stock Exchange ("TSX"), alternative Canadian trading platforms, and the New York Stock Exchange ("NYSE"), up to 59,729,706 common shares, over a 12-month period commencing May 23, 2019 and ending May 22, 2020. The Company did not renew its Normal Course Issuer bid after its expiry in May 2020.
For the year ended December 31, 2020, the Company purchased 6,970,000 common shares at a weighted average price of $38.84 per common share for a total cost of $271 million. Retained earnings were reduced by $215 million, representing the excess of the purchase price of common shares over their average carrying value.
On March 3, 2021, the Board of Directors approved a resolution authorizing the Company to file a Notice of Intention with the TSX to purchase, by way of a Normal Course Issuer Bid, up to 5.0% of its issued and outstanding common shares for the purpose of repurchasing a number of common shares approximately equal to the number of options exercised throughout the year in order to eliminate dilution for shareholders. Subject to acceptance of the Notice of Intention by the TSX, the purchases would be made through facilities of the TSX, alternative Canadian trading platforms, and the NYSE.
SHARE-BASED COMPENSATION – STOCK OPTIONSThe Company’s Option Plan provides for the granting of stock options to employees. Stock options granted under the Option Plan have terms ranging from five to six years to expiry and vest over a five-year period. The exercise price of each stock option granted is determined at the closing market price of the common shares on the Toronto Stock Exchange on the day prior to the grant. Each stock option granted provides the holder the choice to purchase one common share of the Company at the stated exercise price or receive a cash payment equal to the difference between the stated exercise price and the market price of the Company’s common shares on the date of surrender of the stock option.
The Option Plan is a "rolling 7%" plan, whereby the aggregate number of common shares that may be reserved for issuance under the plan shall not exceed 7% of the common shares outstanding from time to time.

82Canadian Natural 2020 Annual Report
The following table summarizes information relating to stock options outstanding at December 31, 2020 and 2019:
2020 2019
Stock options
(thousands)
Weighted average
exercise priceStock options
(thousands)
Weighted average
exercise price
Outstanding – beginning of year 47,646 $ 38.04 46,685 $ 37.92
Granted 12,032 $ 32.89 16,314 $ 34.84
Exercised for common shares (3,979) $ 27.24 (10,871) $ 33.16
Surrendered for cash settlement (757) $ 29.34 (1,003) $ 34.52
Forfeited (6,286) $ 39.65 (3,479) $ 37.65
Outstanding – end of year 48,656 $ 37.53 47,646 $ 38.04
Exercisable – end of year 17,970 $ 39.59 17,057 $ 38.74
The range of exercise prices of stock options outstanding and exercisable at December 31, 2020 was as follows:
Stock options outstanding Stock options exercisable
Range of exercise prices
Stock optionsoutstanding
(thousands)
Weighted average
remaining term (years)
Weighted average
exercise price
Stock options exercisable
(thousands)
Weighted average
exercise price
$ 20.76 - $ 24.99 3,829 3.86 $ 21.12 944 $ 21.64
$ 25.00 - $ 29.99 1,975 1.81 $ 28.48 1,362 $ 28.85
$ 30.00 - $ 34.99 4,177 4.23 $ 32.37 378 $ 32.40
$ 35.00 - $ 39.99 22,495 3.44 $ 37.49 4,721 $ 37.42
$ 40.00 - $ 44.99 12,935 1.53 $ 43.57 8,884 $ 43.54
$ 45.00 - $ 46.74 3,245 2.40 $ 45.21 1,681 $ 45.18
48,656 2.90 $ 37.53 17,970 $ 39.59
15. Accumulated Other Comprehensive Income The components of accumulated other comprehensive income, net of taxes, were as follows:
2020 2019
Derivative financial instruments designated as cash flow hedges $ 69 $ 71
Foreign currency translation adjustment (61) (37)
$ 8 $ 34

Canadian Natural 2020 Annual Report 83
16. Capital DisclosuresThe Company has defined its capital to mean its long-term debt and consolidated shareholders’ equity, as determined at each reporting date.
The Company’s objectives when managing its capital structure are to maintain financial flexibility and balance to enable the Company to access capital markets to sustain its on-going operations and to support its growth strategies. The Company primarily monitors capital on the basis of an internally derived financial measure referred to as its "debt to book capitalization ratio", which is the arithmetic ratio of net current and long-term debt divided by the sum of the carrying value of shareholders’ equity plus net current and long-term debt. The Company’s internal targeted range for its debt to book capitalization ratio is 25% to 45%. This range may be exceeded in periods when a combination of capital projects, acquisitions, or lower commodity prices occurs. The Company may be below the low end of the targeted range when cash flow from operating activities is greater than current investment activities. At December 31, 2020, the ratio was within the target range at 40%.
Readers are cautioned that the debt to book capitalization ratio is not defined by IFRS and this financial measure may not be comparable to similar measures presented by other companies. Further, there are no assurances that the Company will continue to use this measure to monitor capital or will not alter the method of calculation of this measure in the future.
2020 2019
Long-term debt, net (1) $ 21,269 $ 20,843
Total shareholders’ equity $ 32,380 $ 34,991
Debt to book capitalization 40% 37%
(1) Includes the current portion of long-term debt, net of cash and cash equivalents.
The Company is subject to a financial covenant that requires debt to book capitalization as defined in its credit facility agreements to not exceed 65%. At December 31, 2020, the Company was in compliance with this covenant.
17. Net Earnings Per Common Share
2020 2019 2018
Weighted average common shares outstanding – basic (thousands of shares) 1,181,768 1,190,977 1,218,798
Effect of dilutive stock options (thousands of shares) — 2,129 4,960
Weighted average common shares outstanding – diluted (thousands of shares) 1,181,768 1,193,106 1,223,758
Net earnings (loss) $ (435) $ 5,416 $ 2,591
Net earnings per common share – basic $ (0.37) $ 4.55 $ 2.13
– diluted $ (0.37) $ 4.54 $ 2.12
In 2020, the Company excluded 44,117,000 potentially anti-dilutive stock options from the calculation of diluted earnings per common share (year ended December 31, 2019 – 36,834,000; 2018 – 23,458,000).

84Canadian Natural 2020 Annual Report
18. Interest and Other Financing Expense 2020 2019 2018
Interest and other financing expense:
Long-term debt $ 785 $ 895 $ 867
Lease liabilities (1) 67 70 —
Less: amounts capitalized on qualifying assets (24) (53) (69)
Total interest and other financing expense 828 912 798
Total interest income (72) (76) (59)
Net interest and other financing expense $ 756 $ 836 $ 739
(1) The Company adopted IFRS 16 "Leases" on January 1, 2019 using the modified retrospective approach.
19. Financial InstrumentsThe carrying amounts of the Company’s financial instruments by category were as follows:
2020
Asset (liability)
Financial assets at
amortized cost
Fair value through
profit or loss
Derivatives used for hedging
Financial liabilities at
amortized cost Total
Accounts receivable $ 2,190 $ — $ — $ — $ 2,190
Investments — 305 — — 305
Other long-term assets 555 — 136 — 691
Accounts payable — — — (667) (667)
Accrued liabilities — — — (2,346) (2,346)
Other long-term liabilities (1) — (52) (108) (1,762) (1,922)
Long-term debt (2) — — — (21,453) (21,453)
$ 2,745 $ 253 $ 28 $ (26,228) $ (23,202)
2019
Asset (liability)
Financial assets at
amortized cost
Fair value through
profit or loss
Derivatives used for hedging
Financial liabilities at
amortized cost Total
Accounts receivable $ 2,465 $ — $ — $ — $ 2,465
Investments — 490 — — 490
Other long-term assets 652 — 290 — 942
Accounts payable — — — (816) (816)
Accrued liabilities — — — (2,611) (2,611)
Other long-term liabilities (1) — (21) (91) (1,904) (2,016)
Long-term debt (2) — — — (20,982) (20,982)
$ 3,117 $ 469 $ 199 $ (26,313) $ (22,528)
(1) Includes $1,690 million of lease liabilities (December 31, 2019 – $1,809) and $72 million of deferred purchase consideration payable over the next three years (December 31, 2019 – $95 million).
(2) Includes the current portion of long-term debt.

Canadian Natural 2020 Annual Report 85
The carrying amounts of the Company’s financial instruments approximated their fair value, except for fixed rate long-term debt. The fair values of the Company’s investments, recurring other long-term assets (liabilities) and fixed rate long-term debt are outlined below:
2020
Carrying amount Fair value
Asset (liability) (1) (2) Level 1 Level 2 Level 3 (4) (5)
Investments (3) $ 305 $ 305 $ — $ —
Other long-term assets $ 691 $ — $ 136 $ 555
Other long-term liabilities $ (232) $ — $ (160) $ (72)
Fixed rate long-term debt (6) (7) $ (14,254) $ (16,598) $ — $ —
2019
Carrying amount Fair value
Asset (liability) (1) (2) Level 1 Level 2 Level 3 (4) (5)
Investments (3) $ 490 $ 490 $ — $ —
Other long-term assets $ 942 $ — $ 290 $ 652
Other long-term liabilities $ (207) $ — $ (112) $ (95)
Fixed rate long-term debt (6) (7) $ (14,110) $ (15,938) $ — $ —(1) Excludes financial assets and liabilities where the carrying amount approximates fair value due to the short-term nature of the asset or liability (cash and
cash equivalents, accounts receivable, accounts payable and accrued liabilities, and purchase consideration payable).(2) There were no transfers between Level 1, 2 and 3 financial instruments.(3) The fair values of the investments are based on quoted market prices.(4) The fair value of the deferred purchase consideration included in other long-term liabilities is based on the present value of future cash payments. (5) The fair value of NWRP subordinated debt is based on the present value of future cash receipts.(6) The fair value of fixed rate long-term debt has been determined based on quoted market prices.(7) Includes the current portion of fixed rate long-term debt.
RISK MANAGEMENTThe Company periodically uses derivative financial instruments to manage its commodity price, interest rate and foreign currency exposures. These financial instruments are entered into solely for hedging purposes and are not used for speculative purposes.
The following provides a summary of the carrying amounts of derivative financial instruments held and a reconciliation to the Company’s consolidated balance sheets.
Asset (liability) 2020 2019
Derivatives held for trading
Natural gas fixed price swaps $ (5) $ (3)
Natural gas basis swaps (40) (8)
Foreign currency forward contracts (7) (10)
Cash flow hedges
Foreign currency forward contracts (108) (91)
Cross currency swaps 136 290
$ (24) $ 178
Included within:
Current portion of other long-term assets $ 5 $ 8
Current portion of other long-term liabilities (131) (112)
Other long-term assets 131 282
Other long-term liabilities (29) —
$ (24) $ 178

86Canadian Natural 2020 Annual Report
During 2020, the Company recognized a loss of $1 million (2019 – gain of $3 million, 2018 – gain of $2 million) related to ineffectiveness arising from cash flow hedges.
The estimated fair values of derivative financial instruments in Level 2 at each measurement date have been determined based on appropriate internal valuation methodologies and/or third party indications. Level 2 fair values determined using valuation models require the use of assumptions concerning the amount and timing of future cash flows and discount rates. In determining these assumptions, the Company primarily relied on external, readily-observable quoted market inputs as applicable, including crude oil and natural gas forward benchmark commodity prices and volatility, Canadian and United States interest rate yield curves, and Canadian and United States forward foreign exchange rates, discounted to present value as appropriate. The resulting fair value estimates may not necessarily be indicative of the amounts that could be realized or settled in a current market transaction and these differences may be material.
The changes in estimated fair values of derivative financial instruments included in the risk management asset (liability) were recognized in the financial statements as follows:
Asset (liability) 2020 2019
Balance – beginning of year $ 178 $ 356
Net change in fair value of outstanding derivative financial instruments recognized in:
Risk management activities (1) (32) (13)
Foreign exchange (168) (231)
Other comprehensive income (loss) (2) 66
Balance – end of year (24) 178
Less: current portion (126) (104)
$ 102 $ 282(1) Includes the fair value movement of commodity financial instruments included in the acquisition of Painted Pony in 2020 (note 7).
Net (gain) loss from risk management activities for the years ended December 31 were as follows:
2020 2019 2018
Net realized risk management loss (gain) $ 32 $ 64 $ (99)
Net unrealized risk management (gain) loss (39) 13 (35)
$ (7) $ 77 $ (134)

Canadian Natural 2020 Annual Report 87
FINANCIAL RISK FACTORSa) Market risk Market risk is the risk that the fair value or future cash flows of a financial instrument will fluctuate because of changes in market prices. The Company’s market risk is comprised of commodity price risk, interest rate risk, and foreign currency exchange risk.
COMMODITY PRICE RISK MANAGEMENTThe Company periodically uses commodity derivative financial instruments to manage its exposure to commodity price risk associated with the sale of its future crude oil and natural gas production and with natural gas purchases.
At December 31, 2020, the Company had the following derivative financial instruments outstanding. All of these instruments were assumed in the acquisition of Painted Pony in 2020:
Remaining termWeighted
average volumeWeighted
average price Index
Natural Gas
Fixed price swap Jan 2021 - Dec 2021 37,337 GJ/d $2.03/GJ AECO
Jan 2021 - Dec 2021 31,178 MMBtu/d US$2.46/MMBtu DAWN
Jan 2021 - Dec 2021 20,808 MMBtu/d US$2.54/MMBtu NYMEX
Jan 2021 - Dec 2021 17,466 MMBtu/d US$2.70/MMBtu SUMAS
Differential swap Jan 2021 - Aug 2021 20,000 GJ/d $0.29/GJ AECO-STN 2
Basis swap Jan 2021 - Dec 2023 53,333 MMBtu/d US$1.23/MMBtu AECO
Jan 2024 - Dec 2025 20,000 MMBtu/d US$0.97/MMBtu AECO
Jan 2021 - Dec 2021 20,000 MMBtu/d US$0.09/MMBtu DAWN
The Company's outstanding commodity derivative financial instruments are expected to be settled monthly based on the applicable index pricing for the respective contract month.
INTEREST RATE RISK MANAGEMENT The Company is exposed to interest rate price risk on its fixed rate long-term debt and to interest rate cash flow risk on its floating rate long-term debt. The Company periodically enters into interest rate swap contracts to manage its fixed to floating interest rate mix on long-term debt. Interest rate swap contracts require the periodic exchange of payments without the exchange of the notional principal amounts on which the payments are based. At December 31, 2020, the Company had no interest rate swap contracts outstanding.
FOREIGN CURRENCY EXCHANGE RATE RISK MANAGEMENTThe Company is exposed to foreign currency exchange rate risk in Canada primarily related to its US dollar denominated long-term debt, commercial paper and working capital. The Company is also exposed to foreign currency exchange rate risk on transactions conducted in other currencies and in the carrying value of its foreign subsidiaries. The Company periodically enters into cross currency swap contracts and foreign currency forward contracts to manage known currency exposure on US dollar denominated long-term debt, commercial paper and working capital. The cross currency swap contracts require the periodic exchange of payments with the exchange at maturity of notional principal amounts on which the payments are based.
At December 31, 2020 the Company had the following cross currency swap contracts outstanding:
Remaining term Amount
Exchange rate (US$/C$)
Interest rate (US$)
Interestrate (C$)
Cross Currency Swaps Jan 2021 – Mar 2038 US$550 1.170 6.25% 5.76%
All cross currency swap derivative financial instruments were designated as hedges at December 31, 2020 and were classified as cash flow hedges.
In addition to the cross currency swap contracts noted above, at December 31, 2020, the Company had US$4,951 million of foreign currency forward contracts outstanding, with original terms of up to 90 days, including US$4,379 million designated as cash flow hedges.
During 2020, the Company settled the US$500 million cross currency swaps designated as cash flow hedges of the US$500 million 3.45% US dollar debt securities due November 2021. The Company realized cash proceeds of $166 million on settlement.

88Canadian Natural 2020 Annual Report
FINANCIAL INSTRUMENT SENSITIVITIESThe following table summarizes the annualized sensitivities of the Company’s 2020 net earnings (loss) and other comprehensive loss to changes in the fair value of financial instruments outstanding as at December 31, 2020, resulting from changes in the specified variable, with all other variables held constant. These sensitivities are prepared on a different basis than those sensitivities disclosed in the Company’s other continuous disclosure documents, are limited to the impact of changes in a specified variable applied to financial instruments only and do not represent the impact of a change in the variable on the operating results of the Company taken as a whole. Further, these sensitivities are theoretical, as changes in one variable may contribute to changes in another variable, which may magnify or counteract the sensitivities. In addition, changes in fair value generally cannot be extrapolated because the relationship of a change in an assumption to the change in fair value may not be linear.
2020 2019
Increase (decrease) to net earnings
Increase (decrease)
to other comprehensive
income
Increase (decrease) to net earnings
Increase (decrease)
to other comprehensive
income
Commodity price risk
Increase AECO fixed price swap $0.10/Mcf $ (1) $ — $ (1) $ —
Decrease AECO fixed price swap $0.10/Mcf $ 1 $ — $ 1 $ —
Increase natural gas fixed price swap US$0.10 MMBtu $ (2) $ — $ — $ —
Decrease natural gas fixed price swap US$0.10 MMBtu $ 2 $ — $ — $ —
Increase natural gas basis swap US$0.10 MMBtu $ (8) $ — $ (1) $ —
Decrease natural gas basis swap US$0.10 MMBtu $ 8 $ — $ 1 $ —
Interest rate risk
Increase interest rate 1% $ (53) $ (17) $ (48) $ (21)
Decrease interest rate 1% $ 53 $ 20 $ 48 $ 24
Foreign currency exchange rate risk
Weakening of the Canadian dollar by US$0.01 $ (126) $ — $ (103) $ —
Strengthening of the Canadian dollar by US$0.01 $ 123 $ — $ 100 $ —
b) Credit RiskCredit risk is the risk that a party to a financial instrument will cause a financial loss to the Company by failing to discharge an obligation.
COUNTERPARTY CREDIT RISK MANAGEMENTThe Company’s accounts receivable are mainly with customers in the crude oil and natural gas industry and are subject to normal industry credit risks. The Company manages these risks by reviewing its exposure to individual companies on a regular basis and where appropriate, ensures that parental guarantees or letters of credit are in place to minimize the impact in the event of default. At December 31, 2020, substantially all of the Company’s accounts receivable were due within normal trade terms and the average expected credit loss was approximately 1% of the Company's accounts receivable balance (December 31, 2019 – 1%).
The Company is also exposed to possible losses in the event of nonperformance by counterparties to derivative financial instruments; however, the Company manages this credit risk by entering into agreements with counterparties that are substantially all investment grade financial institutions. At December 31, 2020, the Company had net risk management assets of $129 million with specific counterparties related to derivative financial instruments (December 31, 2019 – $265 million). The carrying amount of financial assets approximates the maximum credit exposure.

Canadian Natural 2020 Annual Report 89
c) Liquidity riskLiquidity risk is the risk that the Company will encounter difficulty in meeting obligations associated with financial liabilities.
Management of liquidity risk requires the Company to maintain sufficient cash and cash equivalents, along with other sources of capital, consisting primarily of cash flow from operating activities, available credit facilities, commercial paper and access to debt capital markets, to meet obligations as they become due. The Company believes it has adequate bank credit facilities to provide liquidity to manage fluctuations in the timing of the receipt and/or disbursement of operating cash flows.
The maturity dates of the Company’s financial liabilities were as follows:
Less than
1 year1 to less than
2 years2 to less than
5 years Thereafter
Accounts payable $ 667 $ — $ — $ —
Accrued liabilities $ 2,346 $ — $ — $ —
Long-term debt (1) $ 1,343 $ 4,887 $ 7,051 $ 8,279
Other long-term liabilities (2) $ 345 $ 200 $ 435 $ 942
Interest and other financing expense (3) $ 776 $ 693 $ 1,619 $ 4,452
(1) Long-term debt represents principal repayments only and does not reflect interest, original issue discounts and premiums or transaction costs.(2) Lease payments included within other long-term liabilities reflect principal payments only and are as follows; less than one year, $189 million; one to less
than two years, $162 million; two to less than five years, $397 million; and thereafter $942 million.(3) Includes interest and other financing expense on long-term debt and other long-term liabilities. Payments were estimated based upon applicable interest
and foreign exchange rates at December 31, 2020.
20. Commitments and ContingenciesIn the normal course of business, the Company has committed to certain payments. The following table summarizes the Company’s commitments as at December 31, 2020:
2021 2022 2023 2024 2025 Thereafter
Product transportation and processing (1)(2) $ 870 $ 817 $ 858 $ 841 $ 809 $ 10,370
North West Redwater Partnership service toll (3) $ 163 $ 160 $ 160 $ 156 $ 150 $ 2,694
Offshore vessels and equipment $ 64 $ 9 $ — $ — $ — $ —
Field equipment and power $ 28 $ 21 $ 21 $ 21 $ 21 $ 246
Other $ 25 $ 21 $ 21 $ 22 $ 22 $ 16
(1) Includes commitments pertaining to a 20-year product transportation agreement on the Trans Mountain Pipeline Expansion. In addition, the Company has entered into certain product transportation agreements on pipelines that have not yet received regulatory and other approvals.
(2) The acquisition of Painted Pony in 2020 included approximately $2,400 million of product transportation and processing commitments (note 7).(3) Pursuant to the processing agreements on June 1, 2018 the Company began paying its 25% pro rata share of the debt component of the monthly cost of
service tolls. Included in the cost of service tolls is $1,169 million of interest payable over the 30-year tolling period (note 10).
In addition to the commitments disclosed above, the Company has entered into various agreements related to the engineering, procurement and construction of its various development projects. These contracts can be cancelled by the Company upon notice without penalty, subject to the costs incurred up to and in respect of the cancellation.
The Company is defendant and plaintiff in a number of legal actions arising in the normal course of business. In addition, the Company is subject to certain contractor construction claims. The Company believes that any liabilities that might arise pertaining to any such matters would not have a material effect on its consolidated financial position.

90Canadian Natural 2020 Annual Report
21. Supplemental Disclosure of Cash Flow Information 2020 2019 2018
Changes in non-cash working capital:
Accounts receivable $ 284 $ (1,310) $ 1,233
Current income tax assets (liabilities) (295) (164) 471
Inventory 98 (194) (74)
Prepaids and other (56) 2 (3)
Other long-term assets (117) 117 —
Accounts payable (147) 39 (7)
Accrued liabilities (254) 265 (268)
Other long-term liabilities (1) (62) (23) (351)
Net changes in non-cash working capital $ (549) $ (1,268) $ 1,001
Relating to:
Operating activities $ (166) $ (1,033) $ 1,346
Investing activities (383) (235) (345)
$ (549) $ (1,268) $ 1,001
2020 2019 2018
Expenditures on exploration and evaluation assets $ 36 $ 73 $ 282
Net proceeds on sale of exploration and evaluation assets (31) — (16)
Net expenditures on exploration and evaluation assets $ 5 $ 73 $ 266
(1) Included in Other long-term liabilities at December 31, 2020 is $72 million of deferred purchase consideration payable over the next three years (December 31, 2019 – $95 million; 2018 - $118 million).
The following table summarizes movements in the Company's liabilities arising from financing activities for the years' ended December 31, 2020 and 2019:
Long-term debt
Cash flow hedges on
US dollar debt securities
Lease liabilities
Liabilities from financing
activities
At January 1, 2019 (1) $ 20,623 $ (361) $ 1,539 $ 21,801
Changes from financing cash flows:
Issue of long-term debt, net (2) 1,025 — — 1,025
Payment of lease liabilities — — (237) (237)
Non-cash changes:
Lease additions — — 527 527
Changes in foreign exchange and fair value (3) (666) 162 (20) (524)
At December 31, 2019 20,982 (199) 1,809 22,592
Changes from financing cash flows:
Issue of long-term debt, net (2) 719 — — 719
Repayment of Painted Pony long-term debt (397) — — (397)
Proceeds on settlement of cross currency swaps — 166 — 166
Payment of lease liabilities — — (225) (225)
Non-cash changes:
Assumption of Painted Pony long-term debt 397 — — 397
Lease additions — — 148 148
Changes in foreign exchange and fair value (3) (248) 5 (42) (285)
At December 31, 2020 $ 21,453 $ (28) $ 1,690 $ 23,115
(1) The Company adopted IFRS 16 "Leases" on January 1, 2019 using the modified retrospective approach.(2) Includes original issue discounts and premiums, and directly attributable transaction costs.(3) Includes foreign exchange (gain) loss, changes in the fair value of cash flow hedges on US dollar debt securities, the amortization of original issue discounts
and premiums and directly attributable transaction costs, and derecognition of lease liabilities.

Canadian Natural 2020 Annual Report 91
22. Segmented InformationThe Company’s exploration and production activities are conducted in three geographic segments: North America, North Sea and Offshore Africa. These activities include the exploration, development, production and marketing of crude oil, natural gas liquids and natural gas. The Company’s Oil Sands Mining and Upgrading activities are reported in a separate segment from exploration and production activities. Midstream and Refining activities include the Company’s pipeline operations, an electricity co-generation system and NWRP.
Segmented revenue and segmented results include transactions between business segments. Sales between segments are made at prices that approximate market prices, taking into account the volumes involved. These transactions and any unrealized profits and losses are eliminated on consolidation, unless unrealized losses provide evidence of an impairment of the asset transferred. Sales to external customers are based on the location of the seller.
North America North Sea Offshore Africa
(millions of Canadian dollars) 2020 2019 2018 2020 2019 2018 2020 2019 2018Segmented product sales
Crude oil and NGLs (1) $ 7,480 $ 9,679 $ 7,254 $ 417 $ 860 $ 753 $ 318 $ 632 $ 628
Natural gas 1,242 1,150 1,256 12 57 140 42 67 70
Other income and revenue (2) 41 6 — 3 5 — 18 8 —
Total segmented product sales 8,763 10,835 8,510 432 922 893 378 707 698
Less: royalties (503) (998) (723) (1) (2) (2) (16) (42) (51)
Segmented revenue 8,260 9,837 7,787 431 920 891 362 665 647
Segmented expenses
Production 2,510 2,425 2,405 321 391 405 103 109 208Transportation, blending and
feedstock (1) (3) 3,393 2,935 2,587 15 19 22 1 2 2
Depletion, depreciation and amortization
3,780 3,326 3,132 277 308 257 190 242 201
Asset retirement obligation accretion
97 95 87 30 28 29 6 6 9
Realized risk management (commodity derivatives)
(20) 49 (10) — — — — — —
Gain on acquisition, disposition and revaluation
(217) — (277) — — (139) — — (36)
Equity loss from investments — — — — — — — — —
Total segmented expenses 9,543 8,830 7,924 643 746 574 300 359 384Segmented earnings (loss)
before the following$ (1,283) $ 1,007 $ (137) $ (212) $ 174 $ 317 $ 62 $ 306 $ 263
Non–segmented expensesAdministration
Share-based compensation
Interest and other financing expense
Risk management activities (other)
Foreign exchange (gain) loss
Loss from investmentsTotal non–segmented
expensesEarnings (loss) before taxesCurrent income tax (recovery)
expenseDeferred income tax (recovery)
expense Net earnings (loss)
(1) Includes blending and feedstock costs associated with the processing of third party bitumen and other purchased feedstock in the Oil Sands Mining and Upgrading segment.
(2) Includes the sale of diesel and other refined products and other income, including government grants and recoveries associated with the joint operations partners' share of the costs of lease contracts.
(3) Includes a provision of $143 million relating to the Keystone XL pipeline project in the North Amercia segment in 2020.

92Canadian Natural 2020 Annual Report
Inter-segment elimination and Other includes internal and corporate transportation and electricity charges. Production, processing and other purchasing and selling activities, that are not included in the preceding segments are also reported in the segmented information as Inter-segment eliminations and Other.
Operating segments are reported in a manner consistent with the internal reporting provided to the Company’s chief operating decision makers.
Oil Sands Mining and Upgrading Midstream and Refining
Inter–segmentelimination and Other Total
2020 2019 2018 2020 2019 2018 2020 2019 2018 2020 2019 2018
$ 7,389 $11,340 $11,521 $ 83 $ 88 $ 102 $ (108) $ 351 $ 410 $ 15,579 $ 22,950 $ 20,668
— — — — — — 182 145 148 1,478 1,419 1,614
139 6 — 202 — — 31 — — 434 25 —
7,528 11,346 11,521 285 88 102 105 496 558 17,491 24,394 22,282
(78) (481) (479) — — — — — — (598) (1,523) (1,255)
7,450 10,865 11,042 285 88 102 105 496 558 16,893 22,871 21,027
3,114 3,276 3,367 184 20 21 48 56 58 6,280 6,277 6,464
881 1,306 1,087 181 — — 27 437 491 4,498 4,699 4,189
1,784 1,656 1,557 15 14 14 — — — 6,046 5,546 5,161
72 61 61 — — — — — — 205 190 186
— — — — — — — — — (20) 49 (10)
— — — — — — — — — (217) — (452)
— — — — 287 5 — — — — 287 5
5,851 6,299 6,072 380 321 40 75 493 549 16,792 17,048 15,543
$ 1,599 $ 4,566 $ 4,970 $ (95) $ (233) $ 62 $ 30 $ 3 $ 9 $ 101 $ 5,823 $ 5,484
391 344 325
(82) 223 (146)
756 836 739
13 28 (124)
(275) (570) 827
171 6 341
974 867 1,962
(873) 4,956 3,522
(257) 434 374
(181) (894) 557
$ (435) $ 5,416 $ 2,591

Canadian Natural 2020 Annual Report 93
CAPITAL EXPENDITURES (1)
2020 2019
Net
expenditures
Non-cashand fair value
changes (2)
Capitalized costs
Netexpenditures
Non-cashand fair value
changes (2)
Capitalized costs
Exploration and evaluation assets
Exploration and Production
North America (3) $ (7) $ (150) $ (157) $ 129 $ (219) $ (90)
Offshore Africa 12 3 15 35 (2) 33
$ 5 $ (147) $ (142) $ 164 $ (221) $ (57)
Property, plant and equipment
Exploration and Production
North America (3)(4) $ 999 $ 371 $ 1,370 $ 4,702 $ 918 $ 5,620
North Sea 122 (21) 101 196 153 349
Offshore Africa (5) 87 7 94 194 (1,476) (1,282)
1,208 357 1,565 5,092 (405) 4,687
Oil Sands Mining and Upgrading (6) 1,323 (629) 694 1,525 344 1,869
Midstream and Refining 5 1 6 10 — 10
Head office 19 — 19 34 (3) 31
$ 2,555 $ (271) $ 2,284 $ 6,661 $ (64) $ 6,597
(1) This table provides a reconciliation of capitalized costs, reported in note 6 and note 7, to net expenditures reported in the investing activities section of the statements of cash flows. The reconciliation excludes the impact of foreign exchange adjustments.
(2) Derecognitions, asset retirement obligations, transfer of exploration and evaluation assets, and other fair value adjustments.(3) Includes cash consideration paid of $91 million for exploration and evaluation assets and $3,126 million for property, plant and equipment acquired from
Devon in 2019.(4) Includes cash consideration paid of $111 million for the acquisition of Painted Pony in 2020.(5) Includes a derecognition of property, plant and equipment of $1,515 million following the FPSO demobilization at the Olowi field, Gabon in 2019.(6) Net expenditures include capitalized interest and share-based compensation.
SEGMENTED ASSETS
2020 2019
Exploration and Production
North America $ 29,094 $ 30,963
North Sea 1,624 1,948
Offshore Africa 1,407 1,529
Other 81 30
Oil Sands Mining and Upgrading 41,567 42,006
Midstream and Refining 1,301 1,418
Head office 202 227
$ 75,276 $ 78,121

94Canadian Natural 2020 Annual Report
23. Remuneration of Directors and Senior ManagementREMUNERATION OF NON-MANAGEMENT DIRECTORS
2020 2019 2018
Fees earned $ 2 $ 2 $ 2
REMUNERATION OF SENIOR MANAGEMENT (1)
2020 2019 2018
Salary $ 2 $ 2 $ 2
Common stock option based awards 9 8 8
Annual incentive plans 4 6 4
Long-term incentive plans 14 20 15
$ 29 $ 36 $ 29
(1) Senior management identified above are consistent with the disclosure on Named Executive Officers provided in the Company’s Information Circular to shareholders for the respective years.

Canadian Natural 2020 Annual Report 95
Supplementary Oil & Gas Information for the Fiscal Year Ended December 31, 2020 (Unaudited)This supplementary crude oil and natural gas information is provided in accordance with the United States Financial Accounting Standards Board ("FASB") Topic 932 – "Extractive Activities – Oil and Gas" and where applicable, financial information is prepared in accordance with International Financial Reporting Standards ("IFRS").
For the years ended December 31, 2020, 2019, 2018 and 2017 the Company filed its reserves information under National Instrument 51-101 – "Standards of Disclosure of Oil and Gas Activities" ("NI 51-101"), which prescribes the standards for the preparation and disclosure of reserves and related information for companies listed in Canada.
There are significant differences in the type of volumes disclosed and the basis from which the volumes are economically determined under the United States Securities and Exchange Commission ("SEC") requirements and NI 51-101. The SEC requires disclosure of net reserves, after royalties, using 12-month average prices and current costs; whereas NI 51-101 requires gross reserves, before royalties, using forecast pricing and costs. Therefore the difference between the reported numbers under the two disclosure standards can be material.
For the purposes of determining proved crude oil and natural gas reserves for SEC requirements as at December 31, 2020, 2019, 2018 and 2017 the Company used the 12-month average price, defined by the SEC as the unweighted arithmetic average of the first-day-of-the-month price for each month within the 12-month period prior to the end of the reporting period. The Company has used the following 12-month average benchmark prices to determine its 2020 and 2019 reserves for SEC requirements.
Crude Oil and NGLs Natural Gas
WTI Cushing
Oklahoma WCSCanadian
Light SweetCromer
LSBNorth Sea
BrentEdmonton
C5+Henry Hub
Louisiana AECO
BC Westcoast
Station 2(US$/bbl) (C$/bbl) (C$/bbl) (C$/bbl) (US$/bbl) (C$/bbl) (US$/MMBtu) (C$/MMBtu) (C$/MMBtu)
2020:
39.77 34.84 45.02 45.55 43.43 50.41 2.16 2.17 2.10
2019:
55.73 57.29 66.77 66.85 62.54 68.71 2.54 2.02 1.13
A foreign exchange rate of US$0.7462/C$1.00 was used in the 2020 evaluation (2019 - US$0.7520/C$1.00), determined on the same basis as the 12-month average price.
Net Proved Crude Oil and Natural Gas ReservesThe Company retains Independent Qualified Reserves Evaluators to evaluate and review the Company's proved crude oil, bitumen, synthetic crude oil ("SCO"), natural gas, and natural gas liquids ("NGLs") reserves.
■ For the years ended December 31, 2020, 2019, 2018 and 2017, the reports by GLJ Ltd. covered 100% of the Company’s SCO reserves. With the inclusion of non-traditional resources within the definition of “oil and gas producing activities” in the SEC’s modernization of oil and gas reporting rules, effective January 1, 2010 these reserves volumes are included within the Company’s crude oil and natural gas reserves totals.
■ For the years ended December 31, 2020, 2019, 2018 and 2017, the reports by Sproule Associates Limited and Sproule International Limited covered 100% of the Company’s crude oil, bitumen, natural gas and NGLs reserves.
Proved crude oil and natural gas reserves, as defined within the SEC's Regulation S-X, are the estimated quantities of oil and gas that by analysis of geoscience and engineering data demonstrate with reasonable certainty to be economically producible, from a given date forward, from known reservoirs under existing economic conditions, operating methods and government regulations. Developed crude oil and natural gas reserves are reserves of any category that can be expected to be recovered from existing wells with existing equipment and operating methods or in which the cost of the required equipment is relatively minor compared to the cost of drilling a new well; and through installed extraction equipment and infrastructure operational at the time of the reserves estimate if the extraction is by means not involving a well. Undeveloped crude oil and natural gas reserves are reserves of any category that are expected to be recovered from new wells on undrilled acreage, or from existing wells where a relatively major expenditure is required for recompletion.
Estimates of crude oil and natural gas reserves are subject to uncertainty and will change as additional information regarding producing fields and technology becomes available and as future economic and operating conditions change.

96Canadian Natural 2020 Annual Report
The following tables summarize the Company's proved and proved developed crude oil and natural gas reserves, net of royalties, as at December 31, 2020, 2019, 2018 and 2017:
North America
Crude Oil and NGLs (MMbbl) (1)
SyntheticCrude Oil Bitumen(2)
Crude Oil & NGLs
NorthAmerica
TotalNorth
SeaOffshore
Africa Total
Net Proved Reserves
Reserves, December 31, 2017 4,956 1,365 594 6,915 107 69 7,091
Extensions and discoveries 744 151 17 912 — — 912
Improved recovery — 10 50 60 1 3 64
Purchases of reserves in place — 2 7 9 7 — 16
Sales of reserves in place — (4) — (4) — — (4)
Production (148) (64) (47) (259) (9) (6) (274)
Economic revisions due to prices — (45) (18) (63) 11 1 (51)
Revisions of prior estimates 109 54 1 164 (3) 4 165
Reserves, December 31, 2018 5,661 1,469 604 7,734 114 71 7,919
Extensions and discoveries 334 18 12 364 — — 364
Improved recovery — 169 12 181 — — 181
Purchases of reserves in place — 666 2 668 — — 668
Sales of reserves in place — — — — — — —
Production (137) (81) (49) (267) (10) (7) (285)
Economic revisions due to prices (3) (288) 3 — (285) (1) 1 (285)
Revisions of prior estimates (17) (27) 17 (28) 3 6 (19)
Reserves, December 31, 2019 5,554 2,216 598 8,368 105 70 8,544
Extensions and discoveries 708 8 10 726 — — 726
Improved recovery — 49 9 58 — — 58
Purchases of reserves in place — — 28 28 — — 28
Sales of reserves in place — — — — — — —
Production (151) (109) (45) (305) (8) (6) (320)
Economic revisions due to prices (4) 701 207 (94) 814 (12) 3 805
Revisions of prior estimates 36 41 20 97 3 4 103
Reserves, December 31, 2020 6,847 2,413 525 9,785 87 71 9,943
Net proved developed reserves
December 31, 2017 4,967 410 399 5,776 28 21 5,825
December 31, 2018 5,661 461 378 6,500 37 34 6,571
December 31, 2019 5,452 661 354 6,466 38 39 6,543
December 31, 2020 6,770 628 285 7,682 32 37 7,751
(1) Information in the reserves data tables may not add due to rounding.(2) Bitumen as defined by the SEC, "is petroleum in a solid or semi-solid state in natural deposits with a viscosity greater than 10,000 centipoise measured
at original temperature in the deposit and atmospheric pressure, on a gas free basis." Under this definition, all the Company's thermal and primary heavy crude oil reserves have been classified as bitumen.
(3) Reflects the impact of increased royalties at Oil Sands Mining and Upgrading (SCO) due to higher bitumen pricing resulting in higher royalties and lower net reserves.
(4) Reflects the impact of decreased royalties at Oil Sands Mining and Upgrading (SCO) and thermal Bitumen due to lower bitumen pricing resulting in lower royalties and higher net reserves.

Canadian Natural 2020 Annual Report97
2020 total proved Crude Oil and NGLs reserves increased by 1,400 MMbbl:
■ Extensions and discoveries: Increase of 726 MMbbl primarily due to the pit extension at Oil Sands Mining and Upgrading(SCO) and extension drilling/future offset additions at various Bitumen, Crude Oil and natural gas (NGLs) properties.
■ Improved recovery: Increase of 58 MMbbl primarily due to increased steamflood recovery of Bitumen at Primrose and infilldrilling/future offset additions at various Bitumen, Crude Oil and natural gas (NGLs) properties.
■ Purchases of reserves in place: Increase of 28 MMbbl primarily of NGLs from the acquisition of Painted Pony Energy Ltd.■ Production: Decrease of 320 MMbbl.■ Economic revisions due to prices: Increase of 805 MMbbl primarily at Oil Sands Mining and Upgrading (SCO) and thermal
Bitumen properties due to lower bitumen pricing resulting in lower royalties and higher net reserves, partially offset byuneconomic reserves at several North America Bitumen (primary heavy crude oil) and Crude Oil properties.
■
2019 total proved Crude Oil and NGLs reserves increased by 625 MMbbl:
■ Extensions and discoveries: Increase of 364 MMbbl primarily due to the transfer of reserves from the probable categoryat Oil Sands Mining and Upgrading (SCO) and extension drilling/future offset additions at various Bitumen, Crude Oil andnatural gas (NGLs) properties.
■ Improved recovery: Increase of 181 MMbbl primarily due to increased steamflood recovery at the Primrose thermal oil(Bitumen) project.
■ Purchases of reserves in place: Increase of 668 MMbbl primarily due to Bitumen property acquisitions from Devon Canada.■ Production: Decrease of 285 MMbbl.■ Economic revisions due to prices: Decrease of 285 MMbbl primarily at Oil Sands Mining and Upgrading (SCO) due to
higher Bitumen pricing resulting in higher royalties and lower net reserves.■ Revisions of prior estimates: Decrease of 19 MMbbl primarily due to the 50-year reserves life cutoff at the Primrose
thermal oil (Bitumen) project, increased royalties at Oil Sands Mining and Upgrading (SCO) as a result of lower operatingcosts, and the removal of future extension and infill undeveloped reserves in certain Crude Oil and Bitumen propertiesdue to revised Company development plans, offset by improved performance at the Pelican Lake (Crude Oil) project andvarious natural gas (NGLs) properties.
2018 total proved Crude Oil and NGLs reserves increased by 828 MMbbl primarily due to the following:
■ Extensions and discoveries: Increase of 912 MMbbl primarily due to the addition of the Horizon South Pit to the HorizonOil Sands Mining and Upgrading Project ("Horizon") (SCO), future thermal (Bitumen) well pad additions at Primrose andextension drilling/future offset additions at various primary heavy crude oil (Bitumen), Crude Oil and natural gas (NGLs)properties.
■ Improved recovery: Increase of 64 MMbbl primarily due to infill drilling/future offset additions at various primary heavycrude oil (Bitumen), thermal (Bitumen), Crude Oil and natural gas (NGLs) properties as well as thermal (Bitumen) improvedrecovery additions.
■ Purchases of reserves in place: Increase of 16 MMbbl primarily due to property acquisitions in North America and NorthSea core areas.
■ Sales of reserves in place: Decrease of 4 MMbbl from the primary heavy crude oil (Bitumen) area.■ Production: Decrease of 274 MMbbl.■ Economic revisions due to prices: Decrease of 51 MMbbl primarily due to increased royalties at thermal (Bitumen) and
Pelican Lake (Crude Oil) projects resulting from higher prices and uneconomic reserves at several North America naturalgas (NGLs) core areas, partially offset by improved reserve life economics at the North Sea.
■ Revisions of prior estimates: Increase of 165 MMbbl primarily due to geological model changes and improved mine/extraction/upgrading performance at the oil sands mining and upgrading projects (SCO) and improved recoveries atPrimrose (Bitumen).
98Canadian Natural 2020 Annual Report
Natural Gas (Bcf) (1)
NorthAmerica
North Sea
OffshoreAfrica Total
Net Proved Reserves
Reserves, December 31, 2017 5,199 25 16 5,240
Extensions and discoveries 90 — — 90
Improved recovery 414 — — 414
Purchases of reserves in place 67 — — 67
Sales of reserves in place (3) — — (3)
Production (523) (11) (8) (542)
Economic revisions due to prices (746) — (2) (748)
Revisions of prior estimates (192) 13 15 (164)
Reserves, December 31, 2018 4,306 27 21 4,354
Extensions and discoveries 106 — — 106
Improved recovery 202 — — 202
Purchases of reserves in place 34 — — 34
Sales of reserves in place — — — —
Production (511) (9) (8) (528)
Economic revisions due to prices 246 — 2 248
Revisions of prior estimates 346 (2) 23 367
Reserves, December 31, 2019 4,728 16 38 4,782
Extensions and discoveries 173 — — 173
Improved recovery 159 — — 159
Purchases of reserves in place 2,614 — — 2,615
Sales of reserves in place (4) — — (4)
Production (515) (4) (5) (524)
Economic revisions due to prices 97 — 4 100
Revisions of prior estimates 402 — (3) 399
Reserves, December 31, 2020 7,655 12 34 7,701
Net proved developed reserves
December 31, 2017 3,081 22 9 3,112
December 31, 2018 2,382 23 12 2,417
December 31, 2019 2,342 11 28 2,381
December 31, 2020 3,116 6 22 3,144
(1) Information in the reserves data tables may not add due to rounding.
2020 total proved Natural Gas reserves increased by 2,919 Bcf primarily due to the following:
■ Extensions and discoveries: Increase of 173 Bcf primarily due to extension drilling/future offset additions in the Montneyand other unconventional formations of northwest Alberta and northeast British Columbia.
■ Improved recovery: Increase of 159 Bcf primarily due to infill drilling/future offset additions in the Montney and otherunconventional formations of northwest Alberta and northeast British Columbia.
■ Purchases of reserves in place: Increase of 2,615 Bcf primarily due to the acquisition of Painted Pony Energy Ltd.■ Sales of reserves in place: Decrease of 4 Bcf from Natural Gas properties in North America.■ Production: Decrease of 524 Bcf.■ Economic revisions due to prices: Increase of 100 Bcf primarily due to increased Natural Gas price in North America.■ Revisions of prior estimates: Increase of 399 Bcf primarily due to overall positive revisions in several North America core
areas as a result of increased recovery and category transfers from probable to proved, partially offset by removal of futureextension and infill undeveloped reserves in North America properties due to revised Company development plans.
226762_CNRL_2020_Annual_Report_Text.indd 96 2021-03-12 8:29:56 AM
Revisions of prior estimates: Increase of 103 MMbbl primarily due to improved mine performance and mine modelchanges at Oil Sands Mining and Upgrading performance at North America, North Sea and OffshoreAfrica Crude Oil, Bitumen and various natural gas (NGLs) propertie
and improveds.
(SCO)
226762_CNRL_2020_Annual_Report_Text_094_101 | Black | 17-Mar-2115:42:33

98Canadian Natural 2020 Annual Report
Natural Gas (Bcf) (1)
North America
North Sea
Offshore Africa Total
Net Proved Reserves
Reserves, December 31, 2017 5,199 25 16 5,240
Extensions and discoveries 90 — — 90
Improved recovery 414 — — 414
Purchases of reserves in place 67 — — 67
Sales of reserves in place (3) — — (3)
Production (523) (11) (8) (542)
Economic revisions due to prices (746) — (2) (748)
Revisions of prior estimates (192) 13 15 (164)
Reserves, December 31, 2018 4,306 27 21 4,354
Extensions and discoveries 106 — — 106
Improved recovery 202 — — 202
Purchases of reserves in place 34 — — 34
Sales of reserves in place — — — —
Production (511) (9) (8) (528)
Economic revisions due to prices 246 — 2 248
Revisions of prior estimates 346 (2) 23 367
Reserves, December 31, 2019 4,728 16 38 4,782
Extensions and discoveries 173 — — 173
Improved recovery 159 — — 159
Purchases of reserves in place 2,614 — — 2,615
Sales of reserves in place (4) — — (4)
Production (515) (4) (5) (524)
Economic revisions due to prices 97 — 4 100
Revisions of prior estimates 402 — (3) 399
Reserves, December 31, 2020 7,655 12 34 7,701
Net proved developed reserves
December 31, 2017 3,081 22 9 3,112
December 31, 2018 2,382 23 12 2,417
December 31, 2019 2,342 11 28 2,381
December 31, 2020 3,116 6 22 3,144
(1) Information in the reserves data tables may not add due to rounding.
2020 total proved Natural Gas reserves increased by 2,919 Bcf primarily due to the following:
■ Extensions and discoveries: Increase of 173 Bcf primarily due to extension drilling/future offset additions in the Montney and other unconventional formations of northwest Alberta and northeast British Columbia.
■ Improved recovery: Increase of 159 Bcf primarily due to infill drilling/future offset additions in the Montney and other unconventional formations of northwest Alberta and northeast British Columbia.
■ Purchases of reserves in place: Increase of 2,615 Bcf primarily due to the acquisition of Painted Pony Energy Ltd. ■ Sales of reserves in place: Decrease of 4 Bcf from Natural Gas properties in North America. ■ Production: Decrease of 524 Bcf. ■ Economic revisions due to prices: Increase of 100 Bcf primarily due to increased Natural Gas price in North America. ■ Revisions of prior estimates: Increase of 399 Bcf primarily due to overall positive revisions in several North America core
areas as a result of increased recovery and category transfers from probable to proved, partially offset by removal of future extension and infill undeveloped reserves in North America properties due to revised Company development plans.
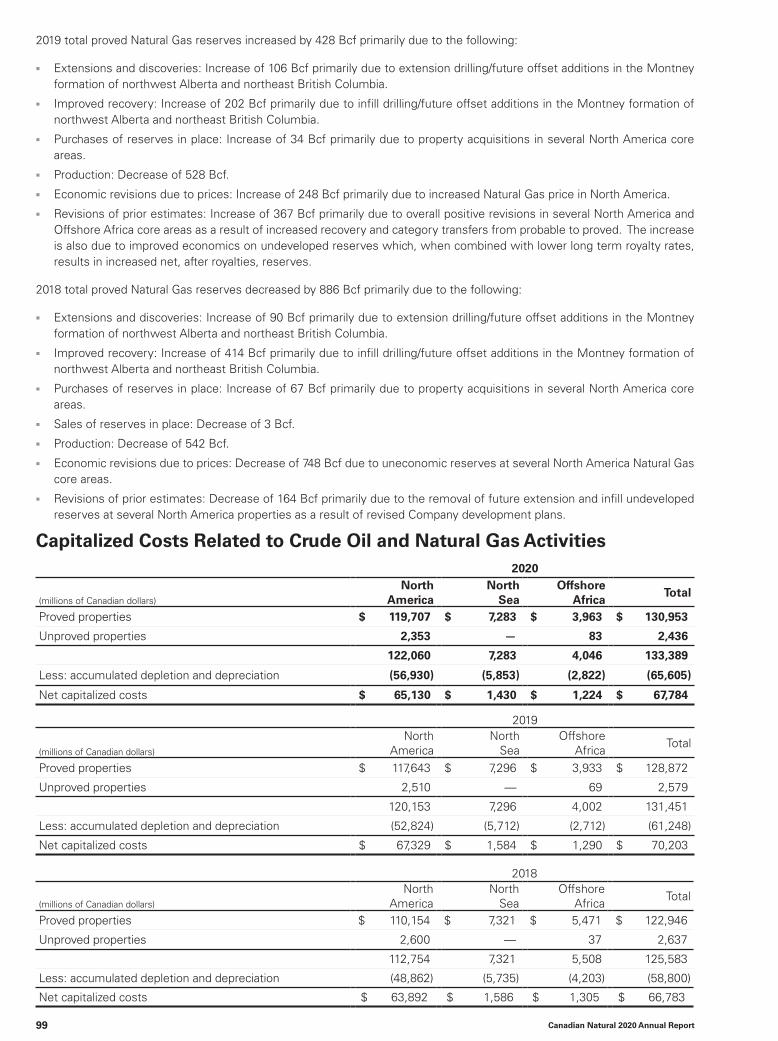
Canadian Natural 2020 Annual Report 99
2019 total proved Natural Gas reserves increased by 428 Bcf primarily due to the following:
■ Extensions and discoveries: Increase of 106 Bcf primarily due to extension drilling/future offset additions in the Montney formation of northwest Alberta and northeast British Columbia.
■ Improved recovery: Increase of 202 Bcf primarily due to infill drilling/future offset additions in the Montney formation of northwest Alberta and northeast British Columbia.
■ Purchases of reserves in place: Increase of 34 Bcf primarily due to property acquisitions in several North America core areas.
■ Production: Decrease of 528 Bcf. ■ Economic revisions due to prices: Increase of 248 Bcf primarily due to increased Natural Gas price in North America. ■ Revisions of prior estimates: Increase of 367 Bcf primarily due to overall positive revisions in several North America and
Offshore Africa core areas as a result of increased recovery and category transfers from probable to proved. The increase is also due to improved economics on undeveloped reserves which, when combined with lower long term royalty rates, results in increased net, after royalties, reserves.
2018 total proved Natural Gas reserves decreased by 886 Bcf primarily due to the following:
■ Extensions and discoveries: Increase of 90 Bcf primarily due to extension drilling/future offset additions in the Montney formation of northwest Alberta and northeast British Columbia.
■ Improved recovery: Increase of 414 Bcf primarily due to infill drilling/future offset additions in the Montney formation of northwest Alberta and northeast British Columbia.
■ Purchases of reserves in place: Increase of 67 Bcf primarily due to property acquisitions in several North America core areas.
■ Sales of reserves in place: Decrease of 3 Bcf. ■ Production: Decrease of 542 Bcf. ■ Economic revisions due to prices: Decrease of 748 Bcf due to uneconomic reserves at several North America Natural Gas
core areas. ■ Revisions of prior estimates: Decrease of 164 Bcf primarily due to the removal of future extension and infill undeveloped
reserves at several North America properties as a result of revised Company development plans.
Capitalized Costs Related to Crude Oil and Natural Gas Activities2020
(millions of Canadian dollars)
North America
North Sea
Offshore Africa
Total
Proved properties $ 119,707 $ 7,283 $ 3,963 $ 130,953
Unproved properties 2,353 — 83 2,436
122,060 7,283 4,046 133,389
Less: accumulated depletion and depreciation (56,930) (5,853) (2,822) (65,605)
Net capitalized costs $ 65,130 $ 1,430 $ 1,224 $ 67,784
2019
(millions of Canadian dollars)
North America
North Sea
Offshore Africa
Total
Proved properties $ 117,643 $ 7,296 $ 3,933 $ 128,872
Unproved properties 2,510 — 69 2,579
120,153 7,296 4,002 131,451
Less: accumulated depletion and depreciation (52,824) (5,712) (2,712) (61,248)
Net capitalized costs $ 67,329 $ 1,584 $ 1,290 $ 70,203
2018
(millions of Canadian dollars)
North America
North Sea
Offshore Africa
Total
Proved properties $ 110,154 $ 7,321 $ 5,471 $ 122,946
Unproved properties 2,600 — 37 2,637
112,754 7,321 5,508 125,583
Less: accumulated depletion and depreciation (48,862) (5,735) (4,203) (58,800)
Net capitalized costs $ 63,892 $ 1,586 $ 1,305 $ 66,783

100Canadian Natural 2020 Annual Report
Costs Incurred in Crude Oil and Natural Gas Activities
2020
(millions of Canadian dollars)
North America
North Sea
Offshore Africa Total
Property acquisitions
Proved $ 750 $ — $ — $ 750
Unproved 15 — — 15
Exploration 22 — 15 37
Development 2,338 104 94 2,536
Costs incurred $ 3,125 $ 104 $ 109 $ 3,338
2019
(millions of Canadian dollars)
North America
North Sea
Offshore Africa Total
Property acquisitions
Proved $ 3,405 $ — $ — $ 3,405
Unproved 91 — — 91
Exploration 38 — 33 71
Development 4,687 349 233 5,269
Costs incurred $ 8,221 $ 349 $ 266 $ 8,836
2018
(millions of Canadian dollars)
North America
North Sea
Offshore Africa Total
Property acquisitions
Proved $ 214 $ 127 $ — $ 341
Unproved 340 — (89) 251
Exploration 116 — 35 151
Development 3,245 110 212 3,567
Costs incurred $ 3,915 $ 237 $ 158 $ 4,310
Results of Operations from Crude Oil and Natural Gas Producing ActivitiesThe Company's results of operations from crude oil and natural gas producing activities for the years ended December 31, 2020, 2019 and 2018 are summarized in the following tables:
2020
(millions of Canadian dollars)
North America
North Sea
Offshore Africa Total
Crude oil and natural gas revenue, net of royalties, blending and feedstock costs $ 12,520 $ 432 $ 354 $ 13,306
Production (5,624) (321) (103) (6,048)
Transportation (1,258) (15) (1) (1,274)
Depletion, depreciation and amortization (5,564) (277) (190) (6,031)
Asset retirement obligation accretion (169) (30) (6) (205)
Petroleum revenue tax — 31 — 31
Income tax 23 72 (13) 82
Results of operations $ (72) $ (108) $ 41 $ (139)

Canadian Natural 2020 Annual Report 101
2019
(millions of Canadian dollars)
North America
North Sea
Offshore Africa Total
Crude oil and natural gas revenue, net of royalties, blending and feedstock costs $ 17,348 $ 920 $ 676 $ 18,944
Production (5,701) (391) (109) (6,201)
Transportation (968) (19) (2) (989)
Depletion, depreciation and amortization (4,982) (308) (242) (5,532)
Asset retirement obligation accretion (156) (28) (6) (190)
Petroleum revenue tax — 88 — 88
Income tax (1,468) (105) (79) (1,652)
Results of operations $ 4,073 $ 157 $ 238 $ 4,468
2018
(millions of Canadian dollars)
North America
North Sea
Offshore Africa Total
Crude oil and natural gas revenue, net of royalties, blending and feedstock costs $ 16,065 $ 891 $ 647 $ 17,603
Production (5,772) (405) (208) (6,385)
Transportation (929) (22) (2) (953)
Depletion, depreciation and amortization (4,689) (257) (201) (5,147)
Asset retirement obligation accretion (148) (29) (9) (186)
Petroleum revenue tax — 12 — 12
Income tax (1,223) (76) (51) (1,350)
Results of operations $ 3,304 $ 114 $ 176 $ 3,594
Standardized Measure of Discounted Future Net Cash Flows from Proved Crude Oil and Natural Gas Reserves and Changes ThereinThe following standardized measure of discounted future net cash flows from proved crude oil and natural gas reserves has been computed using the 12-month average price, defined by the SEC as the unweighted arithmetic average of the first-day-of-the-month price for each month within the 12-month period prior to the end of the reporting period, costs as at the balance sheet date and year-end statutory income tax rates. A discount factor of 10% has been applied in determining the standardized measure of discounted future net cash flows. The Company does not believe that the standardized measure of discounted future net cash flows will be representative of actual future net cash flows and should not be considered to represent the fair value of the crude oil and natural gas properties. Actual net cash flows will differ from the presented estimated future net cash flows due to several factors including:
■ Future production will include production not only from proved properties, but may also include production from probable and possible reserves;
■ Future production of crude oil and natural gas from proved properties will differ from reserves estimated; ■ Future production rates will vary from those estimated; ■ Future prices and costs rather than 12-month average prices and costs as at the balance sheet date will apply; ■ Economic factors such as interest rates, income tax rates, regulatory and fiscal environments and operating conditions
will change; ■ Future estimated income taxes do not take into account the effects of future exploration and evaluation expenditures; and ■ Future development and asset retirement obligations will differ from those estimated.
Future net revenues, development, production and asset retirement obligation costs have been based upon the estimates referred to above. The following tables summarize the Company's future net cash flows relating to proved crude oil and natural gas reserves based on the standardized measure as prescribed in FASB Topic 932 - "Extractive Activities - Oil and Gas":

102Canadian Natural 2020 Annual Report
2020
(millions of Canadian dollars)
North America
North Sea
Offshore Africa
Total
Future cash inflows $ 404,193 $ 5,873 $ 4,172 $ 414,238
Future production costs (203,599) (3,259) (1,746) (208,604)
Future development costs and asset retirement obligations (72,935) (2,130) (1,032) (76,097)
Future income taxes (27,178) (141) (217) (27,536)
Future net cash flows 100,481 343 1,177 102,001
10% annual discount for timing of future cash flows (1) (74,395) 278 (373) (74,490)
Standardized measure of future net cash flows $ 26,086 $ 621 $ 804 $ 27,511
(1) Includes the impact of abandonment expenditures timing.
2019
(millions of Canadian dollars)
North America
North Sea
Offshore Africa
Total
Future cash inflows $ 515,864 $ 10,030 $ 5,858 $ 531,752
Future production costs (194,076) (4,893) (2,081) (201,050)
Future development costs and asset retirement obligations (70,879) (2,648) (1,076) (74,603)
Future income taxes (53,759) (936) (547) (55,242)
Future net cash flows 197,150 1,553 2,154 200,857
10% annual discount for timing of future cash flows (136,616) (1) (715) (137,332)
Standardized measure of future net cash flows $ 60,534 $ 1,552 $ 1,439 $ 63,525
2018
(millions of Canadian dollars)
North America
North Sea
Offshore Africa Total
Future cash inflows $ 500,557 $ 12,002 $ 6,447 $ 519,006
Future production costs (193,387) (5,148) (2,284) (200,819)
Future development costs and asset retirement obligations (63,202) (2,909) (1,099) (67,210)
Future income taxes (60,526) (1,484) (626) (62,636)
Future net cash flows 183,442 2,461 2,438 188,341
10% annual discount for timing of future cash flows (126,699) (545) (771) (128,015)
Standardized measure of future net cash flows $ 56,743 $ 1,916 $ 1,667 $ 60,326
The principal sources of change in the standardized measure of discounted future net cash flows are summarized in the following table:
(millions of Canadian dollars) 2020 2019 2018
Sales of crude oil and natural gas produced, net of production costs $ (6,127) $ (11,807) $ (10,229)
Net changes in sales prices and production costs (46,055) (3,515) 20,386
Extensions, discoveries and improved recovery 626 5,883 2,807
Changes in estimated future development costs (153) (1,889) (698)
Purchases of proved reserves in place 947 7,418 396
Sales of proved reserves in place (1) — (55)
Revisions of previous reserve estimates 5,295 (3,384) 2,711
Accretion of discount 7,718 8,062 6,119
Changes in production timing and other (4,830) 447 (955)
Net change in income taxes 6,566 1,984 (7,061)
Net change (36,014) 3,199 13,421
Balance - beginning of year 63,525 60,326 46,905
Balance - end of year $ 27,511 $ 63,525 $ 60,326

Canadian Natural 2020 Annual Report 103
Ten-Year ReviewYears ended December 31 2020 2019 2018 2017 2016 2015 2014 2013 2012 2011
FINANCIAL INFORMATION (C$ millions, except per share amounts)
Net earnings (loss) (435) 5,416 2,591 2,397 (204) (637) 3,929 2,270 1,892 2,643Per share – basic ($/share) (0.37) 4.55 2.13 2.04 (0.19) (0.58) 3.60 2.08 1.72 2.41Per share – diluted ($/share) (0.37) 4.54 2.12 2.03 (0.19) (0.58) 3.58 2.08 1.72 2.40
Cash flows from operating activities 4,714 8,829 10,121 7,262 3,452 5,632 8,459 7,218 6,209 6,243Adjusted funds flow (1) 5,200 10,267 9,088 7,347 4,293 5,785 9,587 7,477 6,013 6,547
Per share – basic ($/share) 4.40 8.62 7.46 6.25 3.90 5.29 8.78 6.87 5.48 5.98Per share – diluted ($/share) 4.40 8.61 7.43 6.21 3.89 5.28 8.74 6.86 5.47 5.94
Cash flows used in investing activities 2,819 7,255 4,814 13,102 3,811 5,465 11,177 7,006 5,927 5,963Net capital expenditures (2) 3,206 7,121 4,731 17,129 3,794 3,853 11,744 7,274 6,308 6,414Balance sheet information (C$ millions)
Working capital surplus (deficiency) 626 241 (601) 513 1,056 1,193 (673) (1,574) (1,264) (894)Exploration and evaluation assets 2,436 2,579 2,637 2,632 2,382 2,586 3,557 2,609 2,611 2,475Property, plant and equipment, net 65,752 68,043 64,559 65,170 50,910 51,475 52,480 46,487 44,028 41,631Total assets 75,276 78,121 71,559 73,867 58,648 59,275 60,200 51,754 48,980 47,278Long-term debt 21,453 20,982 20,623 22,458 16,805 16,794 14,002 9,661 8,736 8,571Shareholders' equity 32,380 34,991 31,974 31,653 26,267 27,381 28,891 25,772 24,283 22,898SHARE INFORMATIONCommon shares outstanding (thousands) 1,183,866 1,186,857 1,201,886 1,222,769 1,110,952 1,094,668 1,091,837 1,087,322 1,092,072 1,096,460Weighted average shares outstanding
– basic (thousands) 1,181,768 1,190,977 1,218,798 1,175,094 1,100,471 1,093,862 1,091,754 1,088,682 1,097,084 1,095,582Weighted average shares outstanding
– diluted (thousands) 1,181,768 1,193,106 1,223,758 1,182,823 1,100,471 1,093,862 1,096,822 1,090,541 1,099,519 1,102,582Dividends declared ($/share) (3) 1.70 1.50 1.34 1.10 0.94 0.92 0.90 0.58 0.42 0.36Trading statisticsTSX – C$Trading volume (thousands) 1,866,414 904,013 806,254 588,422 653,727 728,033 717,580 683,003 729,700 800,044Share Price ($/share)
High 42.57 42.56 49.08 47.00 46.74 42.46 49.57 36.04 41.12 50.50Low 9.80 30.01 30.11 35.90 21.27 25.01 31.00 28.44 25.58 27.25Close 30.59 42.00 32.94 44.92 42.79 30.22 35.92 35.94 28.64 38.15NYSE – US$Trading volume (thousands) 1,058,121 679,697 796,971 608,008 892,220 951,311 812,521 645,403 844,647 937,481Share Price ($/share)
High 32.79 32.56 38.19 36.78 35.28 34.46 46.65 33.92 41.38 52.04Low 6.71 22.58 21.85 27.53 14.60 18.94 26.53 26.98 25.01 25.69Close 24.05 32.35 24.13 35.72 31.88 21.83 30.88 33.84 28.87 37.37RATIOSDebt to book capitalization (4) 40% 37% 39% 41% 39% 38% 33% 27% 26% 27%Return on average common shareholders'
equity, after tax (4) (1%) 16% 8% 8% (1%) (2%) 14% 9% 8% 12%
Daily production before royalties per ten thousand common shares (BOE/d) 9.8 9.3 9.0 7.9 7.3 7.8 7.2 6.2 6.0 5.5
Total proved plus probable reserves per common share (BOE) (5) 13.5 12.0 11.1 9.7 8.3 8.3 8.1 7.3 7.2 6.9
Net asset value ($/share) (6) 71.62 97.09 101.89 81.41 74.77 73.39 78.99 72.41 62.38 70.37
(1) Adjusted funds flow (previously referred to as funds flow from operations) is a non-GAAP measure that the Company considers key as it demonstrates the Company’s ability to generate the cash flow necessary to fund future growth through capital investment and to repay debt. The derivation of this measure is discussed in the Management’s Discussion and Analysis (“MD&A”).
(2) Net capital expenditures is a non-GAAP measure that the Company considers a key measure as it provides an understanding of the Company’s capital spending activities in comparison to the Company’s annual capital budget. For additional information and details, refer to the net capital expenditures table in the Company’s MD&A.
(3) On March 3, 2021, the Board of Directors approved a quarterly dividend of $0.47 per common share, an increase from the previous quarterly dividend of $0.425 per common share. The dividend is payable on April 5, 2021.
(4) Refer to the “Liquidity and Capital Resources” section of the MD&A for the definitions of these items.(5) Based upon company gross reserves (forecast price and costs, before royalties), using year-end common shares outstanding.
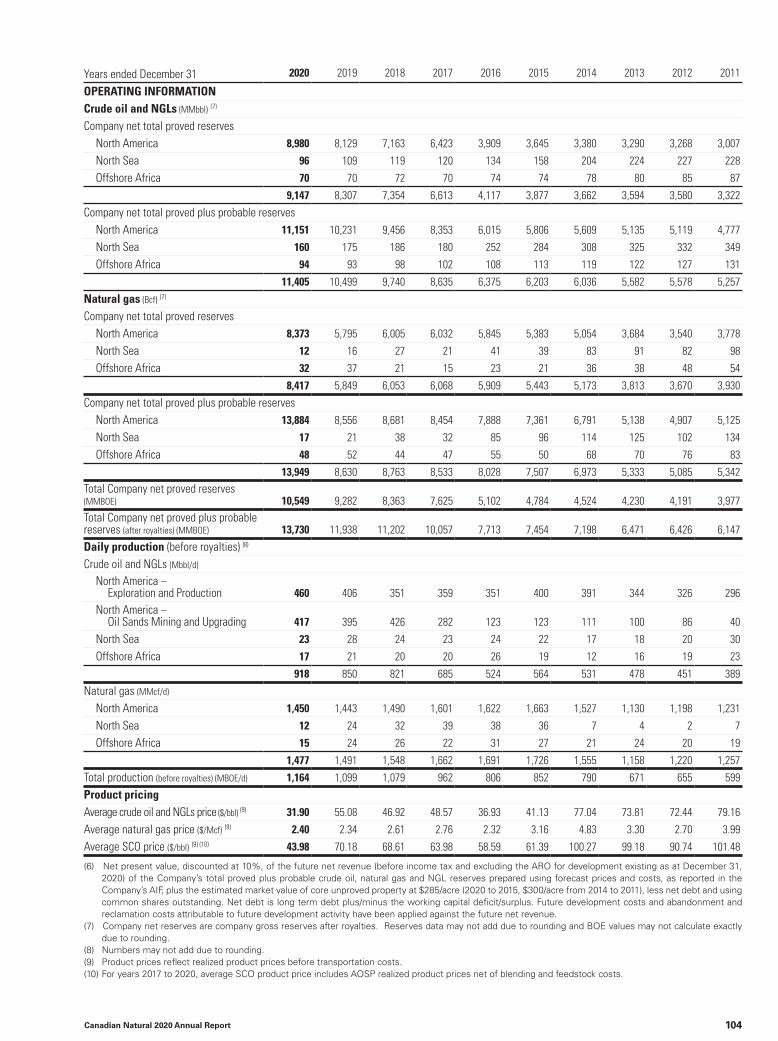
104Canadian Natural 2020 Annual Report
Years ended December 31 2020 2019 2018 2017 2016 2015 2014 2013 2012 2011
OPERATING INFORMATIONCrude oil and NGLs (MMbbl) (7)
Company net total proved reservesNorth America 8,980 8,129 7,163 6,423 3,909 3,645 3,380 3,290 3,268 3,007
North Sea 96 109 119 120 134 158 204 224 227 228
Offshore Africa 70 70 72 70 74 74 78 80 85 87
9,147 8,307 7,354 6,613 4,117 3,877 3,662 3,594 3,580 3,322
Company net total proved plus probable reservesNorth America 11,151 10,231 9,456 8,353 6,015 5,806 5,609 5,135 5,119 4,777
North Sea 160 175 186 180 252 284 308 325 332 349
Offshore Africa 94 93 98 102 108 113 119 122 127 131
11,405 10,499 9,740 8,635 6,375 6,203 6,036 5,582 5,578 5,257
Natural gas (Bcf) (7)
Company net total proved reservesNorth America 8,373 5,795 6,005 6,032 5,845 5,383 5,054 3,684 3,540 3,778
North Sea 12 16 27 21 41 39 83 91 82 98
Offshore Africa 32 37 21 15 23 21 36 38 48 54
8,417 5,849 6,053 6,068 5,909 5,443 5,173 3,813 3,670 3,930
Company net total proved plus probable reservesNorth America 13,884 8,556 8,681 8,454 7,888 7,361 6,791 5,138 4,907 5,125
North Sea 17 21 38 32 85 96 114 125 102 134
Offshore Africa 48 52 44 47 55 50 68 70 76 83
13,949 8,630 8,763 8,533 8,028 7,507 6,973 5,333 5,085 5,342Total Company net proved reserves (MMBOE) 10,549 9,282 8,363 7,625 5,102 4,784 4,524 4,230 4,191 3,977Total Company net proved plus probable reserves (after royalties) (MMBOE) 13,730 11,938 11,202 10,057 7,713 7,454 7,198 6,471 6,426 6,147
Daily production (before royalties) (8)
Crude oil and NGLs (Mbbl/d)
North America – Exploration and Production 460 406 351 359 351 400 391 344 326 296
North America – Oil Sands Mining and Upgrading 417 395 426 282 123 123 111 100 86 40
North Sea 23 28 24 23 24 22 17 18 20 30
Offshore Africa 17 21 20 20 26 19 12 16 19 23
918 850 821 685 524 564 531 478 451 389
Natural gas (MMcf/d)
North America 1,450 1,443 1,490 1,601 1,622 1,663 1,527 1,130 1,198 1,231
North Sea 12 24 32 39 38 36 7 4 2 7
Offshore Africa 15 24 26 22 31 27 21 24 20 19
1,477 1,491 1,548 1,662 1,691 1,726 1,555 1,158 1,220 1,257
Total production (before royalties) (MBOE/d) 1,164 1,099 1,079 962 806 852 790 671 655 599
Product pricingAverage crude oil and NGLs price ($/bbl) (9) 31.90 55.08 46.92 48.57 36.93 41.13 77.04 73.81 72.44 79.16
Average natural gas price ($/Mcf) (9) 2.40 2.34 2.61 2.76 2.32 3.16 4.83 3.30 2.70 3.99
Average SCO price ($/bbl) (9) (10) 43.98 70.18 68.61 63.98 58.59 61.39 100.27 99.18 90.74 101.48
(6) Net present value, discounted at 10%, of the future net revenue (before income tax and excluding the ARO for development existing as at December 31, 2020) of the Company’s total proved plus probable crude oil, natural gas and NGL reserves prepared using forecast prices and costs, as reported in the Company’s AIF, plus the estimated market value of core unproved property at $285/acre (2020 to 2015, $300/acre from 2014 to 2011), less net debt and using common shares outstanding. Net debt is long term debt plus/minus the working capital deficit/surplus. Future development costs and abandonment and reclamation costs attributable to future development activity have been applied against the future net revenue.
(7) Company net reserves are company gross reserves after royalties. Reserves data may not add due to rounding and BOE values may not calculate exactly due to rounding.
(8) Numbers may not add due to rounding.(9) Product prices reflect realized product prices before transportation costs.(10) For years 2017 to 2020, average SCO product price includes AOSP realized product prices net of blending and feedstock costs.

Canadian Natural 2020 Annual Report 105
Corporate Information
Board of Directors*Catherine M. Best, FCA, ICD.D (1)(2)
Corporate DirectorCalgary, Alberta
*M. Elizabeth Cannon, O.C.(3)(4)(5)
Past President and Professor Emeritus, University of CalgaryCalgary, Alberta
N. Murray Edwards, O.C.Corporate DirectorSt. Moritz, Switzerland
*Christopher L. Fong (3)(5)
Corporate DirectorCalgary, Alberta
*Ambassador Gordon D. Giffin (1)(4)
Partner, Dentons US LLPAtlanta, Georgia
*Wilfred A. Gobert (1)(2)(4)
Corporate DirectorCalgary, Alberta
Steve W. Laut (5)
Corporate DirectorCalgary, Alberta
Tim S. McKay (3)
President, Canadian Natural Resources LimitedCalgary, Alberta
*Honourable Frank J. McKenna, P.C., O.C., O.N.B., Q.C. (2)(4)
Deputy Chair, TD Bank GroupCap Pelé, New Brunswick
*David A. Tuer (1)(5)
Corporate DirectorCalgary, Alberta
*Annette M. Verschuren, O.C. (2)(3)
Chairman and Chief Executive Officer, NRSTOR Inc.Toronto, Ontario
(1) Audit Committee member(2) Compensation Committee member(3) Health, Safety, Asset Integrity and Environmental Committee member(4) Nominating, Governance and Risk Committee member(5) Reserves Committee member*Determined to be independent by the Nominating, Governance and Risk Committee of the Board of Directors and pursuant to the indepen-dent standards established under National Instrument 58-101 and the New York Stock Exchange Corporate Governance Listing Standards.
Senior OfficersN. Murray EdwardsExecutive Chairman
Tim S. McKayPresident
Darren M. FichterChief Operating Officer, Exploration and Production
Scott G. StauthChief Operating Officer, Oil Sands
Mark A. StainthorpeChief Financial Officer and Senior Vice-President, Finance
Troy J.P. AndersenSenior Vice-President, Canadian Conventional Field Operations
Bryan C. BradleySenior Vice-President, Marketing
Trevor J. CassidySenior Vice-President, Thermal
Allan E. FrankiwSenior Vice-President, Production
Jay E. FrocSenior Vice-President, Oil Sands Mining and Upgrading
Ron K. LaingSenior Vice-President, Corporate Development and Land
Pamela A. McIntyreSenior Vice-President, Safety, Risk Management and Innovation
Bill R. PetersonSenior Vice-President, Development Operations
Ken W. StaggSenior Vice-President, Exploration
Robin S. ZabekSenior Vice-President, Exploitation
Paul M. MendesVice-President, Legal, General Counsel and Corporate Secretary
Betty YeeVice-President, Land

106Canadian Natural 2020 Annual Report
Corporate OfficesHEAD OFFICECanadian Natural Resources Limited2100, 855 – 2 Street S. W.Calgary, Alberta T2P 4J8Telephone: (403) 517-6700Facsimile: (403) 517-7350Website: www.cnrl.com
INVESTOR RELATIONSTelephone: (403) 514-7777Email: [email protected]
INTERNATIONAL OFFICECNR International (U.K.) LimitedSt. Magnus House, Guild StreetAberdeen AB11 6NJ Scotland
REGISTRAR AND TRANSFER AGENTComputershare Trust Company of CanadaCalgary, AlbertaToronto, OntarioComputershare Investor Services LLC New York, New York
AUDITORSPricewaterhouseCoopers LLP Calgary, Alberta
INDEPENDENT QUALIFIED RESERVES EVALUATORSGLJ Ltd. Calgary, AlbertaSproule Associates Limited Calgary, AlbertaSproule International Limited Calgary, Alberta
STOCK LISTING – CNQ Toronto Stock Exchange The New York Stock Exchange
COMPANY DEFINITIONThroughout the annual report, Canadian Natural Resources Limited is referred to as “us”, “we”, “our”, “Canadian Natural”, or the “Company”.
CURRENCYAll amounts are reported in Canadian currency unless otherwise stated.
ABBREVIATIONSAbbreviations can be found on page 9.
METRIC CONVERSION CHART
To Convert To Multiply by
barrels cubic metres 0.159
thousand cubic feet cubic metres 28.174
feet metres 0.305
miles kilometres 1.609
acres hectares 0.405
tonnes tons 1.102
COMMON SHARE DIVIDENDThe Company paid its first dividend on its common shares on April 1, 2001. Since then, dividends have been paid quarterly. The following table shows the aggregate amount of the cash dividends declared per common share of the Company and accrued in each of its last three years ended December 31, 2020.
2020 2019 2018
Cash dividends declared per common share (1) $1.70 $1.50 $1.34
(1) Annualized dividend value.
NOTICE OF ANNUAL MEETINGCanadian Natural’s Annual Meeting of the Shareholders will be held in a virtual online format via live webcast on Thursday, May 6, 2021 at 1:00 p.m. Mountain Daylight Time. Please see our website, www.cnrl.com, for information updates.
Corporate GovernanceCanadian Natural’s corporate governance practices and disclosure of those practices are in compliance with National Policy 58-201 Corporate Governance Guidelines and National Instrument 58-101 Disclosure of Corporate Governance Practices. Canadian Natural, as a “foreign private issuer” in the United States, may rely on home jurisdiction listing standards for compliance with most of the New York Stock Exchange (“NYSE”) Corporate Governance Listing Standards but must disclose any significant differences between its corporate governance practices and those required for U.S. companies listed on the NYSE.
Canadian Natural follows Toronto Stock Exchange (“TSX”) rules with respect to shareholder approval of equity compensation plans and material revisions to such plans. TSX rules provide that only the creation of or material amendments to equity compensation plans which provide for new issuance of securities are subject to shareholder approval. However, the NYSE requires shareholder approval of all equity compensation plans whether they provide for the delivery of newly issued securities, or rely on securities acquired in the open market by the issuing company for the purposes of redistribution to plan beneficiaries, and material revisions to such plans. Canadian Natural has a performance share unit plan pursuant to which common shares are purchased through the TSX. This is not a new issue of securities under the performance share unit plan and under TSX rules the plan is not subject to shareholder approval.
Canadian Natural has included as exhibits to its Annual Report on Form 40-F for the 2020 fiscal year filed with the United States Securities and Exchange Commission certificates of the Chief Executive Officer and Chief Financial Officer certifying as to disclosure controls and procedures and internal control over financial reporting.

2100, 855 – 2 Street S.W.
Calgary, AB T2P 4J8
T (403) 517-6700
F (403) 517-7350
www.cnrl.com


![Performance Highlights [Company Update]](https://static.documents.pub/doc/80x56/577ca51f1a28abea748b6586/performance-highlights-company-update.jpg)


