176
2020 Annual Report QBE INSURANCE GROUP LIMITED
2020Annual Report
QBE INSURANCE GROUP LIMITED

QBE Insurance Group Limited | ABN 28 008 485 014
All amounts in this report are US dollars unless otherwise stated.
SECTION 1
Performance overviewChair’s message 22020 snapshot 4Interim Group Chief Executive Officer’s report 6
SECTION 2
Operating and financial reviewGroup Chief Financial Officer’s report 10 North America business review 22International business review 24Australia Pacific business review 26
SECTION 3
GovernanceClimate change – our approach to risks and opportunities 28Managing risk – our business 36Board of Directors 38Group Executive Committee 40Corporate governance statement 42
SECTION 4
Directors’ ReportDirectors’ Report 50Remuneration Report 54Auditor’s independence declaration 78
SECTION 5
Financial ReportFinancial Report contents 79Financial statements 80Notes to the financial statements 84Directors’ declaration 156Independent auditor’s report 157
SECTION 6
Other informationShareholder information 165Financial calendar 16810-year history 169Glossary 170
Table of contentsA N N U A L R E P O R T 2 0 2 0
Oth
er in
form
ation
6
Fin
ancial
Rep
ort
5
Perfo
rman
ce o
verv
iew
1
Op
erating an
d
finan
cial review
2
Go
vern
ance
3
Directo
rs' R
epo
rt
4
QB
E In
suran
ce Gro
up
A
nn
ual R
epo
rt 2020
1
This is an interactive PDF designed to enhance your experience. The best way to view this report is with Adobe Acrobat Reader. Click on the links on the contents pages or use the home button in the footer to navigate the report.
QBE Insurance Group Limited | ABN 28 008 485 014
All amounts in this report are US dollars unless otherwise stated.
SECTION 1
Performance overviewChair’s message 22020 snapshot 4Interim Group Chief Executive Officer’s report 6
SECTION 2
Operating and financial reviewGroup Chief Financial Officer’s report 10 North America business review 22International business review 24Australia Pacific business review 26
SECTION 3
GovernanceClimate change – our approach to risks and opportunities 28Managing risk – our business 36Board of Directors 38Group Executive Committee 40Corporate governance statement 42
SECTION 4
Directors’ ReportDirectors’ Report 50Remuneration Report 54Auditor’s independence declaration 78
SECTION 5
Financial ReportFinancial Report contents 79Financial statements 80Notes to the financial statements 84Directors’ declaration 156Independent auditor’s report 157
SECTION 6
Other informationShareholder information 165Financial calendar 16810-year history 169Glossary 170
Table of contentsA N N U A L R E P O R T 2 0 2 0
Oth
er in
form
ation
6
Fin
ancial
Rep
ort
5
Perfo
rman
ce o
verv
iew
1
Op
erating an
d
finan
cial review
2
Go
vern
ance
3
Directo
rs' R
epo
rt
4
QB
E In
suran
ce Gro
up
A
nn
ual R
epo
rt 2020
1

CHAIR’S MESSAGE
Evolving and transforming our business
The COVID-19 pandemic coupled with increased catastrophe activity and a shifting global geopolitical landscape provided a challenging backdrop in 2020. Although the lowest point of the crisis may be behind us, the effects of the pandemic are likely to reverberate for some time, creating ongoing
uncertainty for our business, our customers and society at large.
The pandemic had far-reaching consequences beyond the spread of the disease itself. Global economies face long-term repercussions with higher unemployment, equity market volatility and ongoing downward pressure on interest rates. Like most industries, the insurance industry has been impacted by the pandemic, with higher claims costs and lower investment returns. Nonetheless, QBE is well placed to benefit as economies recover in the markets in which we operate, and we are able to leverage our global diversification and a continuing strong rate environment.
Amid the pandemic, we also saw social unrest and a year of significantly higher than normal catastrophe events around the world, including an extremely active
wildfire season as well as a record number of named storms in the US, extreme bushfires and storm activity including hail damage in Australia, and typhoons in Asia.
Notwithstanding this period of volatility and unrest, QBE remained focused on delivering sound underlying performance as well as supporting the wellbeing and safety of our people, our customers, our business partners and the communities in which we operate. This focus remains relevant for the here and now as well as underpinning our plans for the future.
The strength and resilience of our business are evident in the Group’s underlying financial performance for the year ended December 2020. While your Board recognises the disappointing headline
statutory loss reported for the 2020 financial year, both our capital position and our underlying business fundamentals remain strong. Actions taken early on as the pandemic crisis unfolded stood us in good stead, ensuring we retained a strong balance sheet while maintaining underlying earnings momentum. Further details of our full year results are explored in the reports of both the Interim Group Chief Executive Officer and Group Chief Financial Officer on subsequent pages.
QBE remains focused on the key drivers of business performance and the maintenance of the underlying disciplines that are fundamental for long-term success. To this end, cell reviews and Brilliant Basics remain important, as is our ongoing operational efficiency program.
2
In light of the substantial 2020 statutory loss, the Board has elected not to declare a final dividend. In making the decision, we have been conscious of maintaining a strong balance sheet which provides us with considerable flexibility for future investment in, and growth of, our business.
Leadership
In 2020, we saw changes to the Group Executive Committee and this year we are pleased to announce the appointments of Fiona Larnach, as our new Group Chief Risk Officer, and Sue Houghton, as our new Chief Executive Officer Australia Pacific. These appointments highlight our commitment to diversity and in 2021 the Group Executive Committee will comprise 45% women.
During 2020, we also saw the departure of our Group Chief Executive Officer, Pat Regan, following an external investigation concerning workplace communications that the Board concluded did not meet the standards set out in the Group Code of Ethics and Conduct. While this was a setback, the fundamentals of the business remain strong and importantly our strategy and priorities remain unchanged. In October, we announced that Richard Pryce would assume the role of Interim Group Chief Executive Officer while a search is underway for a permanent replacement, providing important continuity as we execute on our strategic priorities.
Our business is supported by the hard work and dedication of our people. I am proud of how our teams have responded in this time of uncertainty and their ability to continue to deliver the best possible outcomes and solutions for our customers. On behalf of the Board, I extend my sincere thanks to Richard and the entire executive team as well as all our people for their demonstrated adaptability and flexibility around new ways of working and their continued commitment to meeting the needs of our customers and the communities in which we operate.
Following the departure of Pat Regan, we announced that we would undertake a review of QBE’s culture. This review will seek to build on the many strong elements of our culture while also identifying the target culture that we need for the future. We remain committed to providing a respectful and inclusive environment for all of our people and continue to build a stronger, better QBE. With this in mind, we have put in place a series of initiatives that will add to our existing QBE DNA framework. John Green, Deputy Chair and Tan Le, non-executive director, have been appointed by the Board as sponsors
to drive these initiatives. Supporting this is our global Culture Advisory Group, which will work with our external partners to help us build on our leadership capability and identify any gaps and levers to further enhance our culture.
The Board is also committed to ensuring we continue to invest in our leaders, with succession planning a key area. In 2021, we will accelerate our focus on the development of existing leaders to prepare them for their next role and invest in the development of our talent pipeline. Board renewal is also an important part of setting QBE up for the future. As such, we were pleased to welcome Tan Le and Eric Smith who both joined our Board in September 2020, supporting our digital agenda and broadening our skills in the North American insurance market respectively.
Operating sustainably
We continue to integrate sustainability across all facets of the business. In a year of major natural disasters and the COVID-19 pandemic, we have scaled up our support for our customers and communities through disaster relief and risk management education. We also became a signatory to the United Nations Global Compact and are working to advance the 10 principles related to human rights, labour, environment and anti-corruption by embedding them into our strategy, culture and day-to-day operations at QBE.
Our sustainability scorecard, outlined in our 2020 Sustainability Report, highlights progress against our key sustainability objectives. We also remain committed to advancing the United Nations Sustainable Development Goals, with a focus on our five priority goals where we can have the greatest impact.
Throughout the year, we continued to deliver against our Climate Change Action Plan. We have set metrics and targets to measure and monitor climate-related risks and opportunities as outlined in our climate change disclosures on pages 28 to 35 of this Annual Report. This includes recently joining the UN-convened Net-Zero Asset Owner Alliance and committing to transition our investment portfolios to net-zero greenhouse gas emissions by 2050. In 2020, we also developed an environmental and social (E&S) risk framework which identifies the sectors and issues that present an increased E&S risk to our business, including energy and biodiversity, and outlines our approach to managing those risks. The framework has been developed to promote informed decision making that is consistent with our commitment
to sustainable insurance and investment. The framework further supports the integration of environmental, social and governance (ESG) considerations into our core business and increased transparency with our customers.
Looking aheadWe commence the 2021 year with optimism; however, we acknowledge that challenges remain from an economic and industry perspective. While it is unclear how long it will take for economies and society more generally to fully recover from the pandemic, we remain focused on transforming our business, processes and technology to deliver better outcomes for all of our stakeholders.We will continue to work with governments and regulators to better prepare for, and to respond to, low probability, high impact events like the COVID-19 pandemic. This has prompted a broad discussion within the industry as to how we provide appropriate support to our customers during this extraordinary and challenging time. QBE remains determined to play an active and constructive role in these discussions.QBE responded decisively in 2020 to establish solid foundations for the future. I am very proud of our people who work every day to deliver outstanding outcomes for our customers. We have a hardworking and talented team, a sound balance sheet and a program of work that allow us to better serve our customers, shareholders and communities. Given the considerable uncertainty as a result of the pandemic and its impact on economies, QBE has determined not to provide results targets for the 2021 financial year, at this stage. We will continue to review this decision and will update the market accordingly.
Mike Wilkins AOIndependent Chair
QB
E In
suran
ce Gro
up
A
nn
ual R
epo
rt 2020
3
Oth
er in
form
ation
6
Fin
ancial
Rep
ort
5
Perfo
rman
ce o
verv
iew
1
Op
erating an
d
finan
cial review
2
Go
vern
ance
3
Directo
rs' R
epo
rt
4

CHAIR’S MESSAGE
Evolving and transforming our business
The COVID-19 pandemic coupled with increased catastrophe activity and a shifting global geopolitical landscape provided a challenging backdrop in 2020. Although the lowest point of the crisis may be behind us, the effects of the pandemic are likely to reverberate for some time, creating ongoing
uncertainty for our business, our customers and society at large.
The pandemic had far-reaching consequences beyond the spread of the disease itself. Global economies face long-term repercussions with higher unemployment, equity market volatility and ongoing downward pressure on interest rates. Like most industries, the insurance industry has been impacted by the pandemic, with higher claims costs and lower investment returns. Nonetheless, QBE is well placed to benefit as economies recover in the markets in which we operate, and we are able to leverage our global diversification and a continuing strong rate environment.
Amid the pandemic, we also saw social unrest and a year of significantly higher than normal catastrophe events around the world, including an extremely active
wildfire season as well as a record number of named storms in the US, extreme bushfires and storm activity including hail damage in Australia, and typhoons in Asia.
Notwithstanding this period of volatility and unrest, QBE remained focused on delivering sound underlying performance as well as supporting the wellbeing and safety of our people, our customers, our business partners and the communities in which we operate. This focus remains relevant for the here and now as well as underpinning our plans for the future.
The strength and resilience of our business are evident in the Group’s underlying financial performance for the year ended December 2020. While your Board recognises the disappointing headline
statutory loss reported for the 2020 financial year, both our capital position and our underlying business fundamentals remain strong. Actions taken early on as the pandemic crisis unfolded stood us in good stead, ensuring we retained a strong balance sheet while maintaining underlying earnings momentum. Further details of our full year results are explored in the reports of both the Interim Group Chief Executive Officer and Group Chief Financial Officer on subsequent pages.
QBE remains focused on the key drivers of business performance and the maintenance of the underlying disciplines that are fundamental for long-term success. To this end, cell reviews and Brilliant Basics remain important, as is our ongoing operational efficiency program.
2
In light of the substantial 2020 statutory loss, the Board has elected not to declare a final dividend. In making the decision, we have been conscious of maintaining a strong balance sheet which provides us with considerable flexibility for future investment in, and growth of, our business.
Leadership
In 2020, we saw changes to the Group Executive Committee and this year we are pleased to announce the appointments of Fiona Larnach, as our new Group Chief Risk Officer, and Sue Houghton, as our new Chief Executive Officer Australia Pacific. These appointments highlight our commitment to diversity and in 2021 the Group Executive Committee will comprise 45% women.
During 2020, we also saw the departure of our Group Chief Executive Officer, Pat Regan, following an external investigation concerning workplace communications that the Board concluded did not meet the standards set out in the Group Code of Ethics and Conduct. While this was a setback, the fundamentals of the business remain strong and importantly our strategy and priorities remain unchanged. In October, we announced that Richard Pryce would assume the role of Interim Group Chief Executive Officer while a search is underway for a permanent replacement, providing important continuity as we execute on our strategic priorities.
Our business is supported by the hard work and dedication of our people. I am proud of how our teams have responded in this time of uncertainty and their ability to continue to deliver the best possible outcomes and solutions for our customers. On behalf of the Board, I extend my sincere thanks to Richard and the entire executive team as well as all our people for their demonstrated adaptability and flexibility around new ways of working and their continued commitment to meeting the needs of our customers and the communities in which we operate.
Following the departure of Pat Regan, we announced that we would undertake a review of QBE’s culture. This review will seek to build on the many strong elements of our culture while also identifying the target culture that we need for the future. We remain committed to providing a respectful and inclusive environment for all of our people and continue to build a stronger, better QBE. With this in mind, we have put in place a series of initiatives that will add to our existing QBE DNA framework. John Green, Deputy Chair and Tan Le, non-executive director, have been appointed by the Board as sponsors
to drive these initiatives. Supporting this is our global Culture Advisory Group, which will work with our external partners to help us build on our leadership capability and identify any gaps and levers to further enhance our culture.
The Board is also committed to ensuring we continue to invest in our leaders, with succession planning a key area. In 2021, we will accelerate our focus on the development of existing leaders to prepare them for their next role and invest in the development of our talent pipeline. Board renewal is also an important part of setting QBE up for the future. As such, we were pleased to welcome Tan Le and Eric Smith who both joined our Board in September 2020, supporting our digital agenda and broadening our skills in the North American insurance market respectively.
Operating sustainably
We continue to integrate sustainability across all facets of the business. In a year of major natural disasters and the COVID-19 pandemic, we have scaled up our support for our customers and communities through disaster relief and risk management education. We also became a signatory to the United Nations Global Compact and are working to advance the 10 principles related to human rights, labour, environment and anti-corruption by embedding them into our strategy, culture and day-to-day operations at QBE.
Our sustainability scorecard, outlined in our 2020 Sustainability Report, highlights progress against our key sustainability objectives. We also remain committed to advancing the United Nations Sustainable Development Goals, with a focus on our five priority goals where we can have the greatest impact.
Throughout the year, we continued to deliver against our Climate Change Action Plan. We have set metrics and targets to measure and monitor climate-related risks and opportunities as outlined in our climate change disclosures on pages 28 to 35 of this Annual Report. This includes recently joining the UN-convened Net-Zero Asset Owner Alliance and committing to transition our investment portfolios to net-zero greenhouse gas emissions by 2050. In 2020, we also developed an environmental and social (E&S) risk framework which identifies the sectors and issues that present an increased E&S risk to our business, including energy and biodiversity, and outlines our approach to managing those risks. The framework has been developed to promote informed decision making that is consistent with our commitment
to sustainable insurance and investment. The framework further supports the integration of environmental, social and governance (ESG) considerations into our core business and increased transparency with our customers.
Looking aheadWe commence the 2021 year with optimism; however, we acknowledge that challenges remain from an economic and industry perspective. While it is unclear how long it will take for economies and society more generally to fully recover from the pandemic, we remain focused on transforming our business, processes and technology to deliver better outcomes for all of our stakeholders.We will continue to work with governments and regulators to better prepare for, and to respond to, low probability, high impact events like the COVID-19 pandemic. This has prompted a broad discussion within the industry as to how we provide appropriate support to our customers during this extraordinary and challenging time. QBE remains determined to play an active and constructive role in these discussions.QBE responded decisively in 2020 to establish solid foundations for the future. I am very proud of our people who work every day to deliver outstanding outcomes for our customers. We have a hardworking and talented team, a sound balance sheet and a program of work that allow us to better serve our customers, shareholders and communities. Given the considerable uncertainty as a result of the pandemic and its impact on economies, QBE has determined not to provide results targets for the 2021 financial year, at this stage. We will continue to review this decision and will update the market accordingly.
Mike Wilkins AOIndependent Chair
QB
E In
suran
ce Gro
up
A
nn
ual R
epo
rt 2020
3O
ther
info
rmatio
n
6
Fin
ancial
Rep
ort
5
Perfo
rman
ce o
verv
iew
1
Op
erating an
d
finan
cial review
2
Go
vern
ance
3
Directo
rs' R
epo
rt
4

1 FinancialinformationinthetablesaboveisextractedorderivedfromtheGroup’sauditedfinancialstatementsincludedonpages80to164ofthisAnnualReport.TheGroupChiefFinancialOfficer’sreportsetsoutfurtheranalysisoftheresults.
2 2020adjustedcashlossreturnonaverageshareholders’equityexcludesnon-cashandmaterialnon-recurringitemssuchasrestructuringcosts,lossesondisposals,andadjustsforAdditionalTier1capital(AT1)coupons.2019adjustedcashprofitreturnonaverageshareholders’equityexcludesrestructuringcosts,lossesondisposals,theimpactoftheOgdendecisionintheUK,anddiscontinuedoperations.
Shareholder highlights
0
15
30
45
60
202020192018201720160
375
750
1,125
1,500A$M
54
26
52
50
A¢
4
Dividend payout (A$M)
Dividend per share (A¢)
Dividend payout (A$M)
59 91% from 2019
2020 snapshot 1
Earnings (loss) profit per share (US¢)
(108.5)2019 41.8
Dividend per share (A¢)
4
Adjusted cash (loss) profit return on average shareholders’ equity 2
(10.9)%
2019 8.9%
Currently
97%2019 63%
Sustainability highlights
Climate action
Building an inclusive workplace and culture
Joined the UN‑convened Net‑Zero Asset Owner Allianceour investment portfolio is targeting net-zero greenhouse gas emissions by 2050
Premiums4Good (US$B)
2025 ambition
$2.0BTotal invested
$1.1Bas at 31 December 2020
Operational renewable electricity use
Target by 2025
100%
CDP climate change disclosure score
A- from B in 2019
QBE Voice survey result: Engagement
76%
2019 70%
Insurance Business Asia: Top insurance workplace
Included as a member of the 2021 Bloomberg Gender‑Equality Index
4
3 2019figuresreflectresultsforcontinuingoperationsonly.4 ExcludesimpactofCOVID-19.5 Constantcurrencybasisandexcludingimpactof2019disposals.6 Excludestheimpactofchangesinrisk-freeratesusedtodiscountnetoutstandingclaims.7 Excludesone-offimpactoftheOgdendecisionintheUK.8 ExcludespremiumratechangesrelatingtoNorthAmericaCropand/orAustraliancompulsorythirdpartymotor(CTP).9 ExcludesCropand/orlenders’mortgageinsurance(LMI).
Other
Financial & credit
Accident & health
Marine energy & aviation
Workers' compensation
Professional indemnity
Public/product liability
Agriculture
Motor & motor casualty
Commercial & domestic property
2020 2019 % %� Commercial & domestic property 30.4 29.2
� Agriculture 14.1 13.7
� Motor & motor casualty 12. 1 14.4
� Public/product liability 11.9 11.9
� Professional indemnity 9.2 8.4
� Marine, energy & aviation 8.2 6.6
� Workers' compensation 5.8 7. 1
� Accident & health 4.8 5.3
� Financial & credit 3.2 3.3
� Other 0.3 0. 1
Other
Financial & credit
Accident & health
Workers' compensation
Marine energy & aviation
Professional indemnity
Public/product liability
Motor & motor casualty
Agriculture
Commercial & domestic property
Net earned premium (US$M)
11,708 4% from 2019 4,5
Gross written premium by class of business (US$M)
Insurance (loss) profit (US$M)
(727) 2019 708 7
Underwriting (loss) profit 6 (US$M)
(488)2019 290 7
Insurance profit and underwriting result (US$M)
2020
2019
(727
)(4
88
)
708
290
Insurance(loss) profit 4%Underwritingresult 6%
Insurance (loss) profit
Underwriting (loss) profit
Net (loss) profit after tax (US$M)
(1,517) 2019 622 7
Combined operating ratio 6
104.2%
2019 97.5% 7
Financial highlights 3
Net earned premium by type
90% direct and facultative insurance
10% inward reinsurance
Operational highlights 3
Average renewal premium rate increase 8
Group
9.8%2019 6.3%
Australia Pacific
International
North America
5.4%
12.8%
10.2%
Segment
Gross written premium growth 5
10% 4
2019 4%
Catastrophe claims 4 (US$M)
688
62% from 2019
Large individual risk claims 4 (US$M)
932
2% from 2019
Attritional claims ratio 4,9
Group
44.6%
2019 47.5%
Australia Pacific
International
North America
49.4%
40.2%
46.3%
Segment
Premium retention
82%2019 78%
14,643 10% from 2019 4,5
QB
E In
suran
ce Gro
up
A
nn
ual R
epo
rt 2020
5
Oth
er in
form
ation
6
Fin
ancial
Rep
ort
5
Perfo
rman
ce o
verv
iew
1
Op
erating an
d
finan
cial review
2
Go
vern
ance
3
Directo
rs' R
epo
rt
4

1 FinancialinformationinthetablesaboveisextractedorderivedfromtheGroup’sauditedfinancialstatementsincludedonpages80to164ofthisAnnualReport.TheGroupChiefFinancialOfficer’sreportsetsoutfurtheranalysisoftheresults.
2 2020adjustedcashlossreturnonaverageshareholders’equityexcludesnon-cashandmaterialnon-recurringitemssuchasrestructuringcosts,lossesondisposals,andadjustsforAdditionalTier1capital(AT1)coupons.2019adjustedcashprofitreturnonaverageshareholders’equityexcludesrestructuringcosts,lossesondisposals,theimpactoftheOgdendecisionintheUK,anddiscontinuedoperations.
Shareholder highlights
0
15
30
45
60
202020192018201720160
375
750
1,125
1,500A$M
54
26
52
50
A¢
4
Dividend payout (A$M)
Dividend per share (A¢)
Dividend payout (A$M)
59 91% from 2019
2020 snapshot 1
Earnings (loss) profit per share (US¢)
(108.5)2019 41.8
Dividend per share (A¢)
4
Adjusted cash (loss) profit return on average shareholders’ equity 2
(10.9)%
2019 8.9%
Currently
97%2019 63%
Sustainability highlights
Climate action
Building an inclusive workplace and culture
Joined the UN‑convened Net‑Zero Asset Owner Allianceour investment portfolio is targeting net-zero greenhouse gas emissions by 2050
Premiums4Good (US$B)
2025 ambition
$2.0BTotal invested
$1.1Bas at 31 December 2020
Operational renewable electricity use
Target by 2025
100%
CDP climate change disclosure score
A- from B in 2019
QBE Voice survey result: Engagement
76%
2019 70%
Insurance Business Asia: Top insurance workplace
Included as a member of the 2021 Bloomberg Gender‑Equality Index
4
3 2019figuresreflectresultsforcontinuingoperationsonly.4 ExcludesimpactofCOVID-19.5 Constantcurrencybasisandexcludingimpactof2019disposals.6 Excludestheimpactofchangesinrisk-freeratesusedtodiscountnetoutstandingclaims.7 Excludesone-offimpactoftheOgdendecisionintheUK.8 ExcludespremiumratechangesrelatingtoNorthAmericaCropand/orAustraliancompulsorythirdpartymotor(CTP).9 ExcludesCropand/orlenders’mortgageinsurance(LMI).
Other
Financial & credit
Accident & health
Marine energy & aviation
Workers' compensation
Professional indemnity
Public/product liability
Agriculture
Motor & motor casualty
Commercial & domestic property
2020 2019 % %� Commercial & domestic property 30.4 29.2
� Agriculture 14.1 13.7
� Motor & motor casualty 12. 1 14.4
� Public/product liability 11.9 11.9
� Professional indemnity 9.2 8.4
� Marine, energy & aviation 8.2 6.6
� Workers' compensation 5.8 7. 1
� Accident & health 4.8 5.3
� Financial & credit 3.2 3.3
� Other 0.3 0. 1
Other
Financial & credit
Accident & health
Workers' compensation
Marine energy & aviation
Professional indemnity
Public/product liability
Motor & motor casualty
Agriculture
Commercial & domestic property
Net earned premium (US$M)
11,708 4% from 2019 4,5
Gross written premium by class of business (US$M)
Insurance (loss) profit (US$M)
(727) 2019 708 7
Underwriting (loss) profit 6 (US$M)
(488)2019 290 7
Insurance profit and underwriting result (US$M)
2020
2019
(727
)(4
88
)
708
290
Insurance(loss) profit 4%Underwritingresult 6%
Insurance (loss) profit
Underwriting (loss) profit
Net (loss) profit after tax (US$M)
(1,517) 2019 622 7
Combined operating ratio 6
104.2%
2019 97.5% 7
Financial highlights 3
Net earned premium by type
90% direct and facultative insurance
10% inward reinsurance
Operational highlights 3
Average renewal premium rate increase 8
Group
9.8%2019 6.3%
Australia Pacific
International
North America
5.4%
12.8%
10.2%
Segment
Gross written premium growth 5
10% 4
2019 4%
Catastrophe claims 4 (US$M)
688
62% from 2019
Large individual risk claims 4 (US$M)
932
2% from 2019
Attritional claims ratio 4,9
Group
44.6%
2019 47.5%
Australia Pacific
International
North America
49.4%
40.2%
46.3%
Segment
Premium retention
82%2019 78%
14,643 10% from 2019 4,5
QB
E In
suran
ce Gro
up
A
nn
ual R
epo
rt 2020
5O
ther
info
rmatio
n
6
Fin
ancial
Rep
ort
5
Perfo
rman
ce o
verv
iew
1
Op
erating an
d
finan
cial review
2
Go
vern
ance
3
Directo
rs' R
epo
rt
4

Delivering value for our customers
The last 12 months have been dominated by COVID-19 and an elevated level of catastrophe activity, resulting in one of the most challenging years in recent history
for many industries and communities. QBE is no exception, and we navigated multiple challenges while continuing to support our customers, people and communities. The impact of COVID-19 has been widespread and unparalleled and, while some
economic uncertainties remain, we commence 2021 with more optimism.
Australia was also a major contributor to the global losses, with extreme bushfires burning close to 46 million acres throughout 2019 and 2020, destroying over 3,500 homes. Australia also witnessed increased storm activity in 2020 including severe hailstorms. These events are having an impact on pricing for property business with the possibility of further increases if we continue to see higher than normal catastrophe activity.
Given the acceleration of premium rate increases in many of our geographies and products in response to the generally unfavourable claims environment, QBE is well positioned to maximise the opportunity presented by improving market conditions globally. We have an excellent range of products across an extended geographical footprint,
INTERIM GROUP CHIEF EXECUTIVE OFFICER’S REPORT
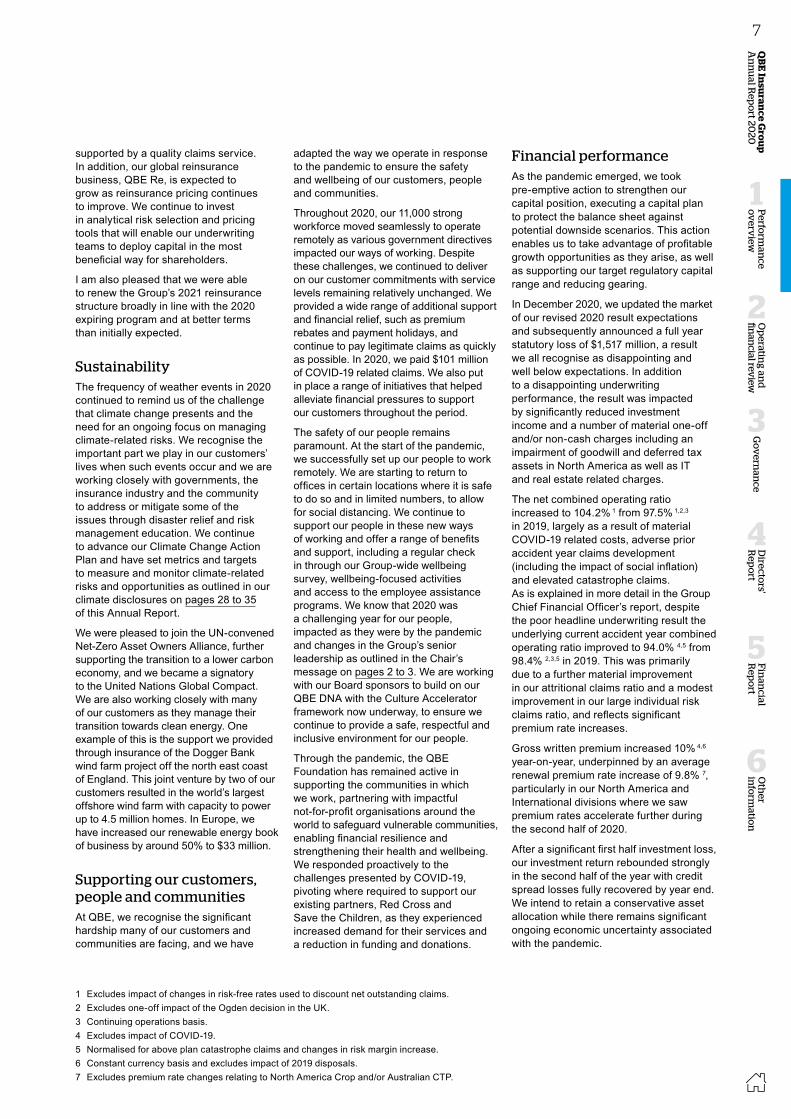
The insurance industry started 2020 managing the effects of a deep and protracted soft market which contributed to claims reserve deficiencies across the sector. This continued during the year and, combined with the ongoing effects of social inflation, is one of the reasons we are seeing meaningful premium rate increases in casualty lines, particularly in the northern hemisphere. We also witnessed an extreme sequence of adverse weather events, with an estimated global insurance industry catastrophe cost of $97 billion, making 2020 the fifth‑costliest year since 1970. More than three quarters of all insured natural catastrophe losses in 2020 occurred in the United States which saw a record 30 named storms and approximately 50,000 wildfires burning 8.5 million acres.
Customer focus
Building a culture of consistent, proactive and insightful engagement.
Building better relationships to generate sustainable growth.
6
supported by a quality claims service. In addition, our global reinsurance business, QBE Re, is expected to grow as reinsurance pricing continues to improve. We continue to invest in analytical risk selection and pricing tools that will enable our underwriting teams to deploy capital in the most beneficial way for shareholders.
I am also pleased that we were able to renew the Group’s 2021 reinsurance structure broadly in line with the 2020 expiring program and at better terms than initially expected.
SustainabilityThe frequency of weather events in 2020 continued to remind us of the challenge that climate change presents and the need for an ongoing focus on managing climate‑related risks. We recognise the important part we play in our customers’ lives when such events occur and we are working closely with governments, the insurance industry and the community to address or mitigate some of the issues through disaster relief and risk management education. We continue to advance our Climate Change Action Plan and have set metrics and targets to measure and monitor climate‑related risks and opportunities as outlined in our climate disclosures on pages 28 to 35 of this Annual Report.
We were pleased to join the UN‑convened Net‑Zero Asset Owners Alliance, further supporting the transition to a lower carbon economy, and we became a signatory to the United Nations Global Compact. We are also working closely with many of our customers as they manage their transition towards clean energy. One example of this is the support we provided through insurance of the Dogger Bank wind farm project off the north east coast of England. This joint venture by two of our customers resulted in the world’s largest offshore wind farm with capacity to power up to 4.5 million homes. In Europe, we have increased our renewable energy book of business by around 50% to $33 million.
Supporting our customers, people and communitiesAt QBE, we recognise the significant hardship many of our customers and communities are facing, and we have
adapted the way we operate in response to the pandemic to ensure the safety and wellbeing of our customers, people and communities.
Throughout 2020, our 11,000 strong workforce moved seamlessly to operate remotely as various government directives impacted our ways of working. Despite these challenges, we continued to deliver on our customer commitments with service levels remaining relatively unchanged. We provided a wide range of additional support and financial relief, such as premium rebates and payment holidays, and continue to pay legitimate claims as quickly as possible. In 2020, we paid $101 million of COVID‑19 related claims. We also put in place a range of initiatives that helped alleviate financial pressures to support our customers throughout the period.
The safety of our people remains paramount. At the start of the pandemic, we successfully set up our people to work remotely. We are starting to return to offices in certain locations where it is safe to do so and in limited numbers, to allow for social distancing. We continue to support our people in these new ways of working and offer a range of benefits and support, including a regular check in through our Group‑wide wellbeing survey, wellbeing‑focused activities and access to the employee assistance programs. We know that 2020 was a challenging year for our people, impacted as they were by the pandemic and changes in the Group’s senior leadership as outlined in the Chair’s message on pages 2 to 3. We are working with our Board sponsors to build on our QBE DNA with the Culture Accelerator framework now underway, to ensure we continue to provide a safe, respectful and inclusive environment for our people.
Through the pandemic, the QBE Foundation has remained active in supporting the communities in which we work, partnering with impactful not‑for‑profit organisations around the world to safeguard vulnerable communities, enabling financial resilience and strengthening their health and wellbeing. We responded proactively to the challenges presented by COVID‑19, pivoting where required to support our existing partners, Red Cross and Save the Children, as they experienced increased demand for their services and a reduction in funding and donations.
Financial performance As the pandemic emerged, we took pre‑emptive action to strengthen our capital position, executing a capital plan to protect the balance sheet against potential downside scenarios. This action enables us to take advantage of profitable growth opportunities as they arise, as well as supporting our target regulatory capital range and reducing gearing.
In December 2020, we updated the market of our revised 2020 result expectations and subsequently announced a full year statutory loss of $1,517 million, a result we all recognise as disappointing and well below expectations. In addition to a disappointing underwriting performance, the result was impacted by significantly reduced investment income and a number of material one‑off and/or non‑cash charges including an impairment of goodwill and deferred tax assets in North America as well as IT and real estate related charges.
The net combined operating ratio increased to 104.2% 1 from 97.5% 1,2,3
in 2019, largely as a result of material COVID‑19 related costs, adverse prior accident year claims development (including the impact of social inflation) and elevated catastrophe claims. As is explained in more detail in the Group Chief Financial Officer’s report, despite the poor headline underwriting result the underlying current accident year combined operating ratio improved to 94.0% 4,5 from 98.4% 2,3,5 in 2019. This was primarily due to a further material improvement in our attritional claims ratio and a modest improvement in our large individual risk claims ratio, and reflects significant premium rate increases.
Gross written premium increased 10% 4,6 year‑on‑year, underpinned by an average renewal premium rate increase of 9.8% 7, particularly in our North America and International divisions where we saw premium rates accelerate further during the second half of 2020.
After a significant first half investment loss, our investment return rebounded strongly in the second half of the year with credit spread losses fully recovered by year end. We intend to retain a conservative asset allocation while there remains significant ongoing economic uncertainty associated with the pandemic.
1 Excludes impact of changes in risk‑free rates used to discount net outstanding claims.2 Excludes one‑off impact of the Ogden decision in the UK.3 Continuing operations basis.4 Excludes impact of COVID‑19.5 Normalised for above plan catastrophe claims and changes in risk margin increase. 6 Constant currency basis and excludes impact of 2019 disposals.7 Excludes premium rate changes relating to North America Crop and/or Australian CTP.
QB
E In
suran
ce Gro
up
A
nn
ual R
epo
rt 2020
7
Oth
er in
form
ation
6
Fin
ancial
Rep
ort
5
Perfo
rman
ce o
verv
iew
1
Op
erating an
d
finan
cial review
2
Go
vern
ance
3
Directo
rs' R
epo
rt
4
Delivering value for our customers
The last 12 months have been dominated by COVID-19 and an elevated level of catastrophe activity, resulting in one of the most challenging years in recent history
for many industries and communities. QBE is no exception, and we navigated multiple challenges while continuing to support our customers, people and communities. The impact of COVID-19 has been widespread and unparalleled and, while some
economic uncertainties remain, we commence 2021 with more optimism.
Australia was also a major contributor to the global losses, with extreme bushfires burning close to 46 million acres throughout 2019 and 2020, destroying over 3,500 homes. Australia also witnessed increased storm activity in 2020 including severe hailstorms. These events are having an impact on pricing for property business with the possibility of further increases if we continue to see higher than normal catastrophe activity.
Given the acceleration of premium rate increases in many of our geographies and products in response to the generally unfavourable claims environment, QBE is well positioned to maximise the opportunity presented by improving market conditions globally. We have an excellent range of products across an extended geographical footprint,
INTERIM GROUP CHIEF EXECUTIVE OFFICER’S REPORT
The insurance industry started 2020 managing the effects of a deep and protracted soft market which contributed to claims reserve deficiencies across the sector. This continued during the year and, combined with the ongoing effects of social inflation, is one of the reasons we are seeing meaningful premium rate increases in casualty lines, particularly in the northern hemisphere. We also witnessed an extreme sequence of adverse weather events, with an estimated global insurance industry catastrophe cost of $97 billion, making 2020 the fifth‑costliest year since 1970. More than three quarters of all insured natural catastrophe losses in 2020 occurred in the United States which saw a record 30 named storms and approximately 50,000 wildfires burning 8.5 million acres.
Customer focus
Building a culture of consistent, proactive and insightful engagement.
Building better relationships to generate sustainable growth.
6
supported by a quality claims service. In addition, our global reinsurance business, QBE Re, is expected to grow as reinsurance pricing continues to improve. We continue to invest in analytical risk selection and pricing tools that will enable our underwriting teams to deploy capital in the most beneficial way for shareholders.
I am also pleased that we were able to renew the Group’s 2021 reinsurance structure broadly in line with the 2020 expiring program and at better terms than initially expected.
SustainabilityThe frequency of weather events in 2020 continued to remind us of the challenge that climate change presents and the need for an ongoing focus on managing climate‑related risks. We recognise the important part we play in our customers’ lives when such events occur and we are working closely with governments, the insurance industry and the community to address or mitigate some of the issues through disaster relief and risk management education. We continue to advance our Climate Change Action Plan and have set metrics and targets to measure and monitor climate‑related risks and opportunities as outlined in our climate disclosures on pages 28 to 35 of this Annual Report.
We were pleased to join the UN‑convened Net‑Zero Asset Owners Alliance, further supporting the transition to a lower carbon economy, and we became a signatory to the United Nations Global Compact. We are also working closely with many of our customers as they manage their transition towards clean energy. One example of this is the support we provided through insurance of the Dogger Bank wind farm project off the north east coast of England. This joint venture by two of our customers resulted in the world’s largest offshore wind farm with capacity to power up to 4.5 million homes. In Europe, we have increased our renewable energy book of business by around 50% to $33 million.
Supporting our customers, people and communitiesAt QBE, we recognise the significant hardship many of our customers and communities are facing, and we have
adapted the way we operate in response to the pandemic to ensure the safety and wellbeing of our customers, people and communities.
Throughout 2020, our 11,000 strong workforce moved seamlessly to operate remotely as various government directives impacted our ways of working. Despite these challenges, we continued to deliver on our customer commitments with service levels remaining relatively unchanged. We provided a wide range of additional support and financial relief, such as premium rebates and payment holidays, and continue to pay legitimate claims as quickly as possible. In 2020, we paid $101 million of COVID‑19 related claims. We also put in place a range of initiatives that helped alleviate financial pressures to support our customers throughout the period.
The safety of our people remains paramount. At the start of the pandemic, we successfully set up our people to work remotely. We are starting to return to offices in certain locations where it is safe to do so and in limited numbers, to allow for social distancing. We continue to support our people in these new ways of working and offer a range of benefits and support, including a regular check in through our Group‑wide wellbeing survey, wellbeing‑focused activities and access to the employee assistance programs. We know that 2020 was a challenging year for our people, impacted as they were by the pandemic and changes in the Group’s senior leadership as outlined in the Chair’s message on pages 2 to 3. We are working with our Board sponsors to build on our QBE DNA with the Culture Accelerator framework now underway, to ensure we continue to provide a safe, respectful and inclusive environment for our people.
Through the pandemic, the QBE Foundation has remained active in supporting the communities in which we work, partnering with impactful not‑for‑profit organisations around the world to safeguard vulnerable communities, enabling financial resilience and strengthening their health and wellbeing. We responded proactively to the challenges presented by COVID‑19, pivoting where required to support our existing partners, Red Cross and Save the Children, as they experienced increased demand for their services and a reduction in funding and donations.
Financial performance As the pandemic emerged, we took pre‑emptive action to strengthen our capital position, executing a capital plan to protect the balance sheet against potential downside scenarios. This action enables us to take advantage of profitable growth opportunities as they arise, as well as supporting our target regulatory capital range and reducing gearing.
In December 2020, we updated the market of our revised 2020 result expectations and subsequently announced a full year statutory loss of $1,517 million, a result we all recognise as disappointing and well below expectations. In addition to a disappointing underwriting performance, the result was impacted by significantly reduced investment income and a number of material one‑off and/or non‑cash charges including an impairment of goodwill and deferred tax assets in North America as well as IT and real estate related charges.
The net combined operating ratio increased to 104.2% 1 from 97.5% 1,2,3
in 2019, largely as a result of material COVID‑19 related costs, adverse prior accident year claims development (including the impact of social inflation) and elevated catastrophe claims. As is explained in more detail in the Group Chief Financial Officer’s report, despite the poor headline underwriting result the underlying current accident year combined operating ratio improved to 94.0% 4,5 from 98.4% 2,3,5 in 2019. This was primarily due to a further material improvement in our attritional claims ratio and a modest improvement in our large individual risk claims ratio, and reflects significant premium rate increases.
Gross written premium increased 10% 4,6 year‑on‑year, underpinned by an average renewal premium rate increase of 9.8% 7, particularly in our North America and International divisions where we saw premium rates accelerate further during the second half of 2020.
After a significant first half investment loss, our investment return rebounded strongly in the second half of the year with credit spread losses fully recovered by year end. We intend to retain a conservative asset allocation while there remains significant ongoing economic uncertainty associated with the pandemic.
1 Excludes impact of changes in risk‑free rates used to discount net outstanding claims.2 Excludes one‑off impact of the Ogden decision in the UK.3 Continuing operations basis.4 Excludes impact of COVID‑19.5 Normalised for above plan catastrophe claims and changes in risk margin increase. 6 Constant currency basis and excludes impact of 2019 disposals.7 Excludes premium rate changes relating to North America Crop and/or Australian CTP.
QB
E In
suran
ce Gro
up
A
nn
ual R
epo
rt 2020
7O
ther
info
rmatio
n
6
Fin
ancial
Rep
ort
5
Perfo
rman
ce o
verv
iew
1
Op
erating an
d
finan
cial review
2
Go
vern
ance
3
Directo
rs' R
epo
rt
4
Strategic focusAll of our activities throughout 2021 and the longer term are anchored around our four strategic priorities: performance, customer focus, modernisation and talent & culture, underpinned by our DNA.
Performance
In 2018, we laid the foundations for our cell review and Brilliant Basics programs, both of which are now well embedded throughout QBE. Recognising that there is still more work to be done to improve the performance of some portfolios, we are evolving and reinvigorating the cell review process with a greater focus on speedy execution and portfolio optimisation. In Brilliant Basics, we continue to invest in enhancing our capabilities in pricing, risk selection and claims management across QBE. As a key Brilliant Basics initiative, we are accelerating the completion of the remaining phases of work associated with our global property pricing project. We are focused on targeted and sustainable growth and maximising the benefits of the favourable rate environment, underpinned by strong performance discipline built through cell reviews and Brilliant Basics. We also remain committed to delivering on our climate‑related and sustainability targets.
Customer focus
Central to our overall strategy is an imperative to better understand our customers, their industries and needs, and to embed a culture of consistent, proactive and insightful customer engagement. To support this, we officially launched Customer@QBE in 2020.
Customer@QBE is our global approach to delivering value for our customers in a responsible and accountable way through a focus on three key elements: mindset (how we think about our customers), insights (the knowledge we have about our customers combined with our insurance expertise) and delivery (what and how we deliver to our customers). Our focus for 2021 is to create and embed a consistent customer mindset to support an understanding of our customers, how we can add the greatest value to them and how we can build a solid pipeline. By helping our customers manage risk well, we manage risk well.
Modernisation
In 2021, we will remain focused on creating a customer‑centric business that is more digitally enabled and supported by a modern technology infrastructure. We are streamlining and modernising our technology estate to better support the evolving needs of our customers, people and business. As we do this, we are mindful of our digital customer interactions and are further automating underwriting, distribution and claims processes, and introducing analytical tools. Internally, we are looking at digitisation and process automation to improve performance, drive efficiency and reduce risk.
Talent & culture
We will accelerate our talent and leadership strategy, developing our future cohort of leaders and preparing them for bigger and more complex roles. We are concurrently focused on deepening our talent pool, with continued succession planning to build our future talent pipeline.
We will focus on enhancing our culture and reinforcing a positive risk culture through the Culture Accelerator, building upon our existing DNA values given their strong resonance with our people. Through this, we are seeking to create an environment where people always know and feel that it is safe to speak up, and where we welcome and embrace diversity in all of its many forms.
ConclusionI am proud of the support we provided our customers, people and the communities during a difficult year. I would like to thank our teams around the world for their dedication, resilience and hard work. I would also like to thank our customers, brokers and partners for their loyalty and ongoing support of QBE.
As we saw in 2020, we are able to adapt quickly in a dynamic environment and, while our operating environment remains uncertain, we are even more committed and focused on delivering our strategic priorities; we remain confident in the strength of our business, our franchise and our people.
We are well positioned to maximise many of the opportunities created by the currently favourable trading environment. While the value of insurance in managing or transferring risk has never been more evident, we must ensure we receive an appropriate return for the risk we take.
Richard Pryce Interim Group Chief Executive Officer
8
Strategic priorities2021
Talent & Culture
Enhance the QBE culture and reinforce a positive risk culture
by building on the QBE DNA through the Culture Accelerator
Accelerate our talent and leadership strategy by developing our people
and building a diverse talent pipeline
Focus on embedding performance through ME@QBE and retaining and motivating people through
our Reward approach
Define our future ways of working
Performance
Evolve and reinvigorate cell reviews and Brilliant Basics+ to further enhance performance discipline and drive portfolio
optimisation
Targeted, sustainable, profitable growth, maximising the
favourable rate environment
Deliver against our sustainability and climate commitments
Continued focus on shareholder returns
Customer Focus
Deliver value and exceed customer expectations through
Customer@QBE
Better understanding of our customers’ industries and needs
Embed a culture of proactive, insightful customer engagement
Fully embed the use of Salesforce and related analytical tools across
the business, central to all our customer activity
Modernisation
Deliver on our program of work to accelerate our technology infrastructure
modernisation
Continued automation across underwriting, distribution and claims to support the evolving
needs of our customers and partners
Accelerate adoption of machine learning models across pricing and claims
QB
E In
suran
ce Gro
up
A
nn
ual R
epo
rt 2020
9
Oth
er in
form
ation
6
Fin
ancial
Rep
ort
5
Perfo
rman
ce o
verv
iew
1
Op
erating an
d
finan
cial review
2
Go
vern
ance
3
Directo
rs' R
epo
rt
4

Strategic focusAll of our activities throughout 2021 and the longer term are anchored around our four strategic priorities: performance, customer focus, modernisation and talent & culture, underpinned by our DNA.
Performance
In 2018, we laid the foundations for our cell review and Brilliant Basics programs, both of which are now well embedded throughout QBE. Recognising that there is still more work to be done to improve the performance of some portfolios, we are evolving and reinvigorating the cell review process with a greater focus on speedy execution and portfolio optimisation. In Brilliant Basics, we continue to invest in enhancing our capabilities in pricing, risk selection and claims management across QBE. As a key Brilliant Basics initiative, we are accelerating the completion of the remaining phases of work associated with our global property pricing project. We are focused on targeted and sustainable growth and maximising the benefits of the favourable rate environment, underpinned by strong performance discipline built through cell reviews and Brilliant Basics. We also remain committed to delivering on our climate‑related and sustainability targets.
Customer focus
Central to our overall strategy is an imperative to better understand our customers, their industries and needs, and to embed a culture of consistent, proactive and insightful customer engagement. To support this, we officially launched Customer@QBE in 2020.
Customer@QBE is our global approach to delivering value for our customers in a responsible and accountable way through a focus on three key elements: mindset (how we think about our customers), insights (the knowledge we have about our customers combined with our insurance expertise) and delivery (what and how we deliver to our customers). Our focus for 2021 is to create and embed a consistent customer mindset to support an understanding of our customers, how we can add the greatest value to them and how we can build a solid pipeline. By helping our customers manage risk well, we manage risk well.
Modernisation
In 2021, we will remain focused on creating a customer‑centric business that is more digitally enabled and supported by a modern technology infrastructure. We are streamlining and modernising our technology estate to better support the evolving needs of our customers, people and business. As we do this, we are mindful of our digital customer interactions and are further automating underwriting, distribution and claims processes, and introducing analytical tools. Internally, we are looking at digitisation and process automation to improve performance, drive efficiency and reduce risk.
Talent & culture
We will accelerate our talent and leadership strategy, developing our future cohort of leaders and preparing them for bigger and more complex roles. We are concurrently focused on deepening our talent pool, with continued succession planning to build our future talent pipeline.
We will focus on enhancing our culture and reinforcing a positive risk culture through the Culture Accelerator, building upon our existing DNA values given their strong resonance with our people. Through this, we are seeking to create an environment where people always know and feel that it is safe to speak up, and where we welcome and embrace diversity in all of its many forms.
ConclusionI am proud of the support we provided our customers, people and the communities during a difficult year. I would like to thank our teams around the world for their dedication, resilience and hard work. I would also like to thank our customers, brokers and partners for their loyalty and ongoing support of QBE.
As we saw in 2020, we are able to adapt quickly in a dynamic environment and, while our operating environment remains uncertain, we are even more committed and focused on delivering our strategic priorities; we remain confident in the strength of our business, our franchise and our people.
We are well positioned to maximise many of the opportunities created by the currently favourable trading environment. While the value of insurance in managing or transferring risk has never been more evident, we must ensure we receive an appropriate return for the risk we take.
Richard Pryce Interim Group Chief Executive Officer
8
Strategic priorities2021
Talent & Culture
Enhance the QBE culture and reinforce a positive risk culture
by building on the QBE DNA through the Culture Accelerator
Accelerate our talent and leadership strategy by developing our people
and building a diverse talent pipeline
Focus on embedding performance through ME@QBE and retaining and motivating people through
our Reward approach
Define our future ways of working
Performance
Evolve and reinvigorate cell reviews and Brilliant Basics+ to further enhance performance discipline and drive portfolio
optimisation
Targeted, sustainable, profitable growth, maximising the
favourable rate environment
Deliver against our sustainability and climate commitments
Continued focus on shareholder returns
Customer Focus
Deliver value and exceed customer expectations through
Customer@QBE
Better understanding of our customers’ industries and needs
Embed a culture of proactive, insightful customer engagement
Fully embed the use of Salesforce and related analytical tools across
the business, central to all our customer activity
Modernisation
Deliver on our program of work to accelerate our technology infrastructure
modernisation
Continued automation across underwriting, distribution and claims to support the evolving
needs of our customers and partners
Accelerate adoption of machine learning models across pricing and claims
QB
E In
suran
ce Gro
up
A
nn
ual R
epo
rt 2020
9O
ther
info
rmatio
n
6
Fin
ancial
Rep
ort
5
Perfo
rman
ce o
verv
iew
1
Op
erating an
d
finan
cial review
2
Go
vern
ance
3
Directo
rs' R
epo
rt
4

Operating and financial review
Group Chief Financial Officer’s report
2020 proved to be a very challenging year and we are disappointed with our financial result. In addition to COVID-19, the result was impacted by above average catastrophe claims and prior accident year claims development. However, we enter 2021 with confidence and are well placed to maximise opportunities in the best global insurance trading conditions in over a decade.
Financial performance
QBE reported a statutory net loss after tax of $1,517 million compared with a $550 million profit in 2019.
The disappointing result reflects a deterioration in the underwriting result coupled with a significant reduction in investment income, an impairment of goodwill and deferred tax assets in North America and write-downs related to rationalisation of legacy IT platforms and our real estate footprint.
Gross written premium increased 10% 1,2 due to strong premium rate increases, improved premium retention and new business growth, especially in North America and International.
The combined operating ratio increased to 104.2% 3 from 97.5% 3,4 in 2019, reflecting COVID-19 impacts, adverse prior accident year claims development and elevated catastrophe claims.
Normalised for above plan catastrophe experience and excluding COVID-19 and the increase in risk margins, the current accident year combined operating ratio improved to 94.0% from 98.4% in 2019.
This is a pleasing uplift in underlying profitability and is primarily due to a further 2.9% 6 improvement in the attritional claims ratio and a modest improvement in the large individual risk claims ratio.
Given market conditions, it was pleasing to renew the Group’s main reinsurance program broadly in line with the 2020 expiring program and on terms in line with or better than expectations. As noted at the time, following heightened catastrophe experience we have increased our catastrophe allowance to provide greater confidence in our 2021 earnings profile.
As discussed on page 12, our operational efficiency program is running ahead of schedule and we are now entering the next phase of our efficiency journey.
Net earned premium (US$M)
11,708 4% from 2019 1,2
Gross written premium (US$M)
14,643 10% from 2019 1,2
Combined operating ratio 3
104.2%
2019 97.5% 4
Net (loss) profit after tax (US$M)
(1,517)2019 622 4,5
1 Constant currency basis and excluding impact of 2019 disposals. 2 Excludes impact of COVID-19.3 Excludes impact of changes in risk-free rates used to discount net outstanding claims.4 Excludes one-off impact of the Ogden decision in the UK.5 Continuing operations basis.6 Excludes Crop and/or LMI.
10
Financial strength and capital managementThe onset of COVID-19 in early 2020 triggered widespread dislocation in social, economic and investment market conditions. In response, QBE executed a capital plan to raise $813 million of ordinary equity and $500 million of Additional Tier 1 capital, and reduced risk by repositioning the investment portfolio and purchasing additional reinsurance. These initiatives were executed in April and May 2020.
The Group also issued A$500 million of capital-qualifying Tier 2 subordinated debt in August to finance the redemption of A$200 million of Tier 2 subordinated debt in September and $200 million of subordinated Tier 2 debt in March 2021.
At 31 December 2020, QBE’s APRA PCA multiple was 1.72x, slightly above the midpoint of the Group’s 1.6–1.8x target range.
The PCA multiple is largely unchanged from 2019, reflecting the benefit of the capital actions largely offset by the loss for the year, balance sheet growth and dividends paid during calendar year 2020.
Allowing for subordinated debt to be redeemed in March of 2021, pro forma
gearing was 32.4%, down significantly from 38.0% at 31 December 2019 and within the Group’s benchmark range of 25–35%.
On the same basis, pro forma Group Head Office liquidity was $1.2 billion.
The probability of adequacy (PoA) of net outstanding claims increased to 92.5%, the top end of our 87.5–92.5% target range, reflecting a $344 million risk margin strengthening, including $300 million directly related to COVID-19 uncertainty.
Investment performance and strategyInvestment market volatility heavily impacted investment returns during the first half of 2020. A strong second half recovery contributed to a 2020 investment return of 0.9%, reflecting falling bond yields and the resilience of our real assets (property and infrastructure).
The portfolio remains conservatively positioned with only 7% in growth assets, comprised of real assets, coupled with a small amount of gold and private equity.
Reflecting very strong premium rate momentum, we intend to maintain a cautious asset allocation in the near term as we see better opportunities for capital deployment across the Group’s underwriting business.
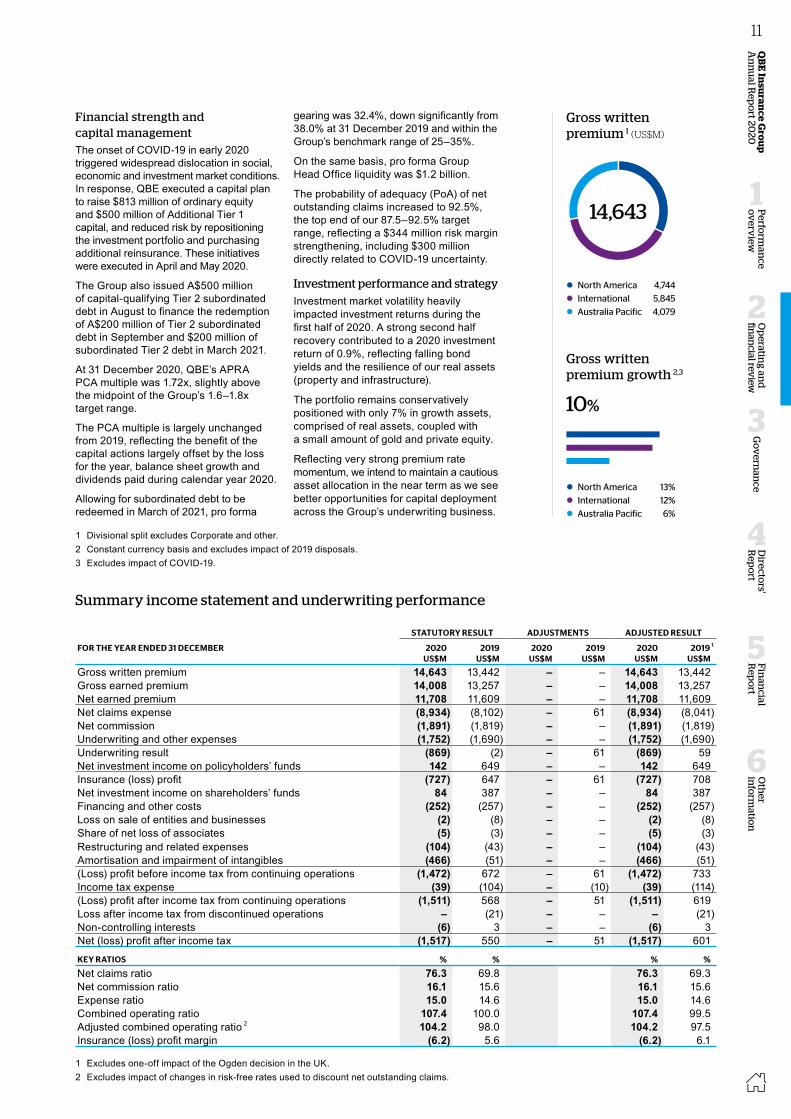
Gross written premium 1 (US$M)
Gross written premium growth 2,3
10%
Summary income statement and underwriting performance
STATUTORY RESULT ADJUSTMENTS ADJUSTED RESULT
FOR THE YEAR ENDED 31 DECEMBER 2020 2019 2020 2019 2020 2019 1
US$M US$M US$M US$M US$M US$M
Gross written premium 14,643 13,442 – – 14,643 13,442Gross earned premium 14,008 13,257 – – 14,008 13,257Net earned premium 11,708 11,609 – – 11,708 11,609Net claims expense (8,934) (8,102) – 61 (8,934) (8,041)Net commission (1,891) (1,819) – – (1,891) (1,819)Underwriting and other expenses (1,752) (1,690) – – (1,752) (1,690)Underwriting result (869) (2) – 61 (869) 59Net investment income on policyholders’ funds 142 649 – – 142 649Insurance (loss) profit (727) 647 – 61 (727) 708Net investment income on shareholders’ funds 84 387 – – 84 387Financing and other costs (252) (257) – – (252) (257)Loss on sale of entities and businesses (2) (8) – – (2) (8)Share of net loss of associates (5) (3) – – (5) (3)Restructuring and related expenses (104) (43) – – (104) (43)Amortisation and impairment of intangibles (466) (51) – – (466) (51)(Loss) profit before income tax from continuing operations (1,472) 672 – 61 (1,472) 733Income tax expense (39) (104) – (10) (39) (114)(Loss) profit after income tax from continuing operations (1,511) 568 – 51 (1,511) 619Loss after income tax from discontinued operations – (21) – – – (21)Non-controlling interests (6) 3 – – (6) 3Net (loss) profit after income tax (1,517) 550 – 51 (1,517) 601
KEY RATIOS % % % %
Net claims ratio 76.3 69.8 76.3 69.3Net commission ratio 16.1 15.6 16.1 15.6Expense ratio 15.0 14.6 15.0 14.6Combined operating ratio 107.4 100.0 107.4 99.5Adjusted combined operating ratio 2 104.2 98.0 104.2 97.5Insurance (loss) profit margin (6.2) 5.6 (6.2) 6.1
1 Excludes one-off impact of the Ogden decision in the UK. 2 Excludes impact of changes in risk-free rates used to discount net outstanding claims.
North America 13%
International 12%
Australia Pacific 6%
North America 4,744
International 5,845
Australia Pacific 4,079
14,643
1 Divisional split excludes Corporate and other.2 Constant currency basis and excludes impact of 2019 disposals.3 Excludes impact of COVID-19.
QB
E In
suran
ce Gro
up
A
nn
ual R
epo
rt 2020
11
Oth
er in
form
ation
6
Fin
ancial
Rep
ort
5
Perfo
rman
ce o
verv
iew
1
Op
erating an
d
finan
cial review
2
Go
vern
ance
3
Directo
rs' R
epo
rt
4
Operating and financial review
Group Chief Financial Officer’s report
2020 proved to be a very challenging year and we are disappointed with our financial result. In addition to COVID-19, the result was impacted by above average catastrophe claims and prior accident year claims development. However, we enter 2021 with confidence and are well placed to maximise opportunities in the best global insurance trading conditions in over a decade.
Financial performance
QBE reported a statutory net loss after tax of $1,517 million compared with a $550 million profit in 2019.
The disappointing result reflects a deterioration in the underwriting result coupled with a significant reduction in investment income, an impairment of goodwill and deferred tax assets in North America and write-downs related to rationalisation of legacy IT platforms and our real estate footprint.
Gross written premium increased 10% 1,2 due to strong premium rate increases, improved premium retention and new business growth, especially in North America and International.
The combined operating ratio increased to 104.2% 3 from 97.5% 3,4 in 2019, reflecting COVID-19 impacts, adverse prior accident year claims development and elevated catastrophe claims.
Normalised for above plan catastrophe experience and excluding COVID-19 and the increase in risk margins, the current accident year combined operating ratio improved to 94.0% from 98.4% in 2019.
This is a pleasing uplift in underlying profitability and is primarily due to a further 2.9% 6 improvement in the attritional claims ratio and a modest improvement in the large individual risk claims ratio.
Given market conditions, it was pleasing to renew the Group’s main reinsurance program broadly in line with the 2020 expiring program and on terms in line with or better than expectations. As noted at the time, following heightened catastrophe experience we have increased our catastrophe allowance to provide greater confidence in our 2021 earnings profile.
As discussed on page 12, our operational efficiency program is running ahead of schedule and we are now entering the next phase of our efficiency journey.
Net earned premium (US$M)
11,708 4% from 2019 1,2
Gross written premium (US$M)
14,643 10% from 2019 1,2
Combined operating ratio 3
104.2%
2019 97.5% 4
Net (loss) profit after tax (US$M)
(1,517)2019 622 4,5
1 Constant currency basis and excluding impact of 2019 disposals. 2 Excludes impact of COVID-19.3 Excludes impact of changes in risk-free rates used to discount net outstanding claims.4 Excludes one-off impact of the Ogden decision in the UK.5 Continuing operations basis.6 Excludes Crop and/or LMI.
10
Financial strength and capital managementThe onset of COVID-19 in early 2020 triggered widespread dislocation in social, economic and investment market conditions. In response, QBE executed a capital plan to raise $813 million of ordinary equity and $500 million of Additional Tier 1 capital, and reduced risk by repositioning the investment portfolio and purchasing additional reinsurance. These initiatives were executed in April and May 2020.
The Group also issued A$500 million of capital-qualifying Tier 2 subordinated debt in August to finance the redemption of A$200 million of Tier 2 subordinated debt in September and $200 million of subordinated Tier 2 debt in March 2021.
At 31 December 2020, QBE’s APRA PCA multiple was 1.72x, slightly above the midpoint of the Group’s 1.6–1.8x target range.
The PCA multiple is largely unchanged from 2019, reflecting the benefit of the capital actions largely offset by the loss for the year, balance sheet growth and dividends paid during calendar year 2020.
Allowing for subordinated debt to be redeemed in March of 2021, pro forma
gearing was 32.4%, down significantly from 38.0% at 31 December 2019 and within the Group’s benchmark range of 25–35%.
On the same basis, pro forma Group Head Office liquidity was $1.2 billion.
The probability of adequacy (PoA) of net outstanding claims increased to 92.5%, the top end of our 87.5–92.5% target range, reflecting a $344 million risk margin strengthening, including $300 million directly related to COVID-19 uncertainty.
Investment performance and strategyInvestment market volatility heavily impacted investment returns during the first half of 2020. A strong second half recovery contributed to a 2020 investment return of 0.9%, reflecting falling bond yields and the resilience of our real assets (property and infrastructure).
The portfolio remains conservatively positioned with only 7% in growth assets, comprised of real assets, coupled with a small amount of gold and private equity.
Reflecting very strong premium rate momentum, we intend to maintain a cautious asset allocation in the near term as we see better opportunities for capital deployment across the Group’s underwriting business.
Gross written premium 1 (US$M)
Gross written premium growth 2,3
10%
Summary income statement and underwriting performance
STATUTORY RESULT ADJUSTMENTS ADJUSTED RESULT
FOR THE YEAR ENDED 31 DECEMBER 2020 2019 2020 2019 2020 2019 1
US$M US$M US$M US$M US$M US$M
Gross written premium 14,643 13,442 – – 14,643 13,442Gross earned premium 14,008 13,257 – – 14,008 13,257Net earned premium 11,708 11,609 – – 11,708 11,609Net claims expense (8,934) (8,102) – 61 (8,934) (8,041)Net commission (1,891) (1,819) – – (1,891) (1,819)Underwriting and other expenses (1,752) (1,690) – – (1,752) (1,690)Underwriting result (869) (2) – 61 (869) 59Net investment income on policyholders’ funds 142 649 – – 142 649Insurance (loss) profit (727) 647 – 61 (727) 708Net investment income on shareholders’ funds 84 387 – – 84 387Financing and other costs (252) (257) – – (252) (257)Loss on sale of entities and businesses (2) (8) – – (2) (8)Share of net loss of associates (5) (3) – – (5) (3)Restructuring and related expenses (104) (43) – – (104) (43)Amortisation and impairment of intangibles (466) (51) – – (466) (51)(Loss) profit before income tax from continuing operations (1,472) 672 – 61 (1,472) 733Income tax expense (39) (104) – (10) (39) (114)(Loss) profit after income tax from continuing operations (1,511) 568 – 51 (1,511) 619Loss after income tax from discontinued operations – (21) – – – (21)Non-controlling interests (6) 3 – – (6) 3Net (loss) profit after income tax (1,517) 550 – 51 (1,517) 601
KEY RATIOS % % % %
Net claims ratio 76.3 69.8 76.3 69.3Net commission ratio 16.1 15.6 16.1 15.6Expense ratio 15.0 14.6 15.0 14.6Combined operating ratio 107.4 100.0 107.4 99.5Adjusted combined operating ratio 2 104.2 98.0 104.2 97.5Insurance (loss) profit margin (6.2) 5.6 (6.2) 6.1
1 Excludes one-off impact of the Ogden decision in the UK. 2 Excludes impact of changes in risk-free rates used to discount net outstanding claims.
North America 13%
International 12%
Australia Pacific 6%
North America 4,744
International 5,845
Australia Pacific 4,079
14,643
1 Divisional split excludes Corporate and other.2 Constant currency basis and excludes impact of 2019 disposals.3 Excludes impact of COVID-19.
QB
E In
suran
ce Gro
up
A
nn
ual R
epo
rt 2020
11O
ther
info
rmatio
n
6
Fin
ancial
Rep
ort
5
Perfo
rman
ce o
verv
iew
1
Op
erating an
d
finan
cial review
2
Go
vern
ance
3
Directo
rs' R
epo
rt
4

COVID-19 impact
COVID-19 underwriting result impacts
FOR THE YEAR ENDED 31 DECEMBER
2020 STATUTORY
RESULTNORTH
AMERICAINTER-
NATIONALAUSTRALIA
PACIFICCORPORATE
& OTHERCOVID-19
TOTAL
2020 ADJUSTED
EX-COVID US$M US$M US$M US$M US$M US$M US$M
Gross written premium 14,643 (31) (11) – – (42) 14,685Gross earned premium 14,008 (31) (11) – – (42) 14,050Net earned premium 11,708 (31) (46) (1) 1 (77) 11,785Net claims expense (8,934) (57) (123) (163) (217) (560) (8,374)Net commission (1,891) 6 3 – – 9 (1,900)Underwriting and other expenses (1,752) (13) 7 (17) (4) (27) (1,725)Underwriting result (869) (95) (159) (181) (220) (655) (214)
COVID-19 was declared a pandemic by the World Health Organisation in March 2020. The virus itself, and the measures to contain its spread have had a profound impact on the global economy which resulted in extreme investment market volatility and coordinated action by central banks to dramatically reduce interest rates.
In addition to materially impacting QBE’s investment returns, COVID-19 impacted the Group’s underwriting result by $655 million.
The Group estimates the ultimate net cost (including risk margin) of COVID-19 to be around $785 million pre-tax, comprising the $655 million 2020 charge coupled with an allowance for a further $130 million of potential net claims that could emerge over the next 12 to 18 months, primarily in trade credit, casualty lines and LMI.
Significant risk margins and extensive reinsurance protections, particularly for business interruption insurance, give us confidence in this estimate.
Operational efficiency
In December 2018, QBE announced a three-year operational efficiency program targeting gross cost savings of $200 million by 2021, translating into net savings of $130 million after allowing for inflation and further investment in technology, digitisation and Brilliant Basics.
From a 2018 cost base of $1.8 billion 2 and an expense ratio of 15.2% 2, we are targeting an expense ratio of “less than 14%” by 2021.
Two years into a three-year schedule of work, the program has progressed ahead of plan. Meaningful progress has been made in technology rationalisation and modernisation as we simplify our technology estate. Additional savings were realised from the disposal of the retail personal lines business in North America, operating model efficiencies across Australia, New Zealand and Asia, and further reductions in third party consulting, travel and other discretionary costs.
As a result of these initiatives, we have now achieved recurring net cost savings of around $125 million. To support the program and as previously foreshadowed, we incurred a $41 million restructuring charge that was not reported as part of the Group’s underwriting expenses.
Excluding $47 million of elevated risk and regulatory costs as well as a $61 million NSW CTP profit normalisation charge, but adjusting for well below plan variable remuneration costs and other one-off net savings, run-rate costs are estimated at $1,690 million which equates to an underlying expense ratio of 14.3%.
We have commenced the next phase of our operational efficiency program focused on IT modernisation and are targeting an expense ratio of 13% by 2023. To support the program, we will incur a restructuring charge of $150 million to be expensed over three years.
Underwriting and other expenses (US$M)
1,725 1
2% from 2019
Expense ratio
14.6% 1
Unchanged from 2019
2020 impact (US$M)
Premium 77
Acquisition costs 18
Claims 260
Risk margins 300
655
1 Excludes impact of COVID-19. 2 Continuing operations basis.
12
Segment performance
North AmericaNorth America reported a combined operating ratio of 115.7% 3, up from 105.6% 3,4 in 2019, due to COVID-19 costs, elevated catastrophe claims and adverse prior accident year claims development.
Excluding COVID-19, the current accident year combined operating ratio was unchanged at 103.7%. While the attritional claims ratio improved, significant catastrophe claims and a Crop result well below average contributed to a disappointing underwriting loss.
Premium rate momentum accelerated in 2020, with North America achieving an annual average renewal rate increase of 10.2% 4 compared with 5.7% 4,5 in 2019, which contributed to underlying gross written premium growth of 13% 6.
InternationalInternational recorded a very strong underlying result.
Despite material COVID-19 related costs and a modest amount of adverse prior accident year claims development, the combined operating ratio improved to 94.5% 3 from 96.8% 3,4,7 in 2019.
Excluding COVID-19, the current accident year combined operating ratio improved to 89.6% from 95.4% 4,7 in the prior year, largely reflecting a further significant improvement in the attritional claims ratio and favourable catastrophe experience.
Premium rate momentum accelerated across 2020, with International achieving an annual average renewal premium rate increase of 12.8% compared with 6.0% 4 in 2019, which contributed to underlying gross written premium growth of 12% 6.
Australia PacificAustralia Pacific reported a combined operating ratio of 97.8% 3, up from 90.0% 3 in 2019, largely due to COVID-19 claims costs, a reduced level of positive prior accident year claims development and adverse catastrophe experience.
Excluding COVID-19, the current accident year combined operating ratio increased marginally to 93.3% from 92.9% in the prior year. This included a further improvement in the attritional claims ratio which was more than offset by adverse catastrophe experience and an increase in the expense ratio due to heightened risk and regulatory costs, as well as a material NSW CTP profit normalisation charge.
Premium rate momentum slowed in 2020 following the decision to suspend rate increases (as a COVID-19 relief measure) in certain classes of business during 2Q20 and 3Q20. Australia Pacific achieved an annual average renewal premium rate increase of 5.4% 5 compared with 7.3%
5 in 2019, which supported underlying gross written premium growth of 6% 6.
Australia Pacific reinstated premium rate increases effective 1 October 2020.
Gross written premium by segment 1,2 (US$M)
14,685
Net earned premium by segment 1,2 (US$M)
11,785
Combined operating ratio by segment 1,3
98.6%
North America
International
Australia Pacific
GROSS WRITTEN PREMIUM
NET EARNED PREMIUM
COMBINED OPERATING RATIO
INSURANCE (LOSS) PROFIT BEFORE
INCOME TAX
FOR THE YEAR ENDED 31 DECEMBER 2020 2019 2020 2019 2020 2019 2020 2019 US$M US$M US$M US$M % % US$M US$M
North America 1,2 4,775 4,361 3,351 3,692 112.7 3 105.6 3 (488) (137)International 1,2 5,856 5,200 4,812 4,339 91.3 3 96.8 3,4 265 341 4
Australia Pacific 1 4,079 3,920 3,626 3,568 92.8 3 90.0 3 252 487Corporate and other adjustments 1 (25) (39) (4) 10 – – (101) 17Group adjusted 1 14,685 13,442 11,785 11,609 98.6 3 97.5 3,4 (72) 708 4
Risk-free rate impact – – – – 3.2 2.0 – –COVID-19 impact (42) – (77) – 5.6 – (655) –Ogden decision impact – – – – – 0.5 – (61)Group statutory 14,643 13,442 11,708 11,609 107.4 100.0 (727) 647Direct and facultative 13,226 12,263 10,508 10,641 107.2 99.7 (633) 629Inward reinsurance 1,417 1,179 1,200 968 109.1 103.7 (94) 18Group statutory 14,643 13,442 11,708 11,609 107.4 100.0 (727) 647
1 Excludes impact of COVID-19.2 The 2019 results have been restated to reflect the transfer of North America’s inward reinsurance business to QBE Re, part of International. 3 Excludes impact of changes in risk-free rates used to discount net outstanding claims.4 Excludes one-off impact of the Ogden decision in the UK.
4,775
5,856
4,079
3,351
4,812
3,626
1 Excludes impact of COVID-19.2 Divisional split excludes Corporate and other.3 Excludes impact of changes in risk-free rates used to discount net outstanding claims.4 Restated for transfer of North America’s inward reinsurance business to International.5 Excludes premium rate changes relating to North America Crop and/or Australian CTP.6 Constant currency basis and excluding impact of 2019 disposals. 7 Excludes one-off impact of the Ogden decision in the UK.
112.7%
91.3%
92.8%
QB
E In
suran
ce Gro
up
A
nn
ual R
epo
rt 2020
13
Oth
er in
form
ation
6
Fin
ancial
Rep
ort
5
Perfo
rman
ce o
verv
iew
1
Op
erating an
d
finan
cial review
2
Go
vern
ance
3
Directo
rs' R
epo
rt
4
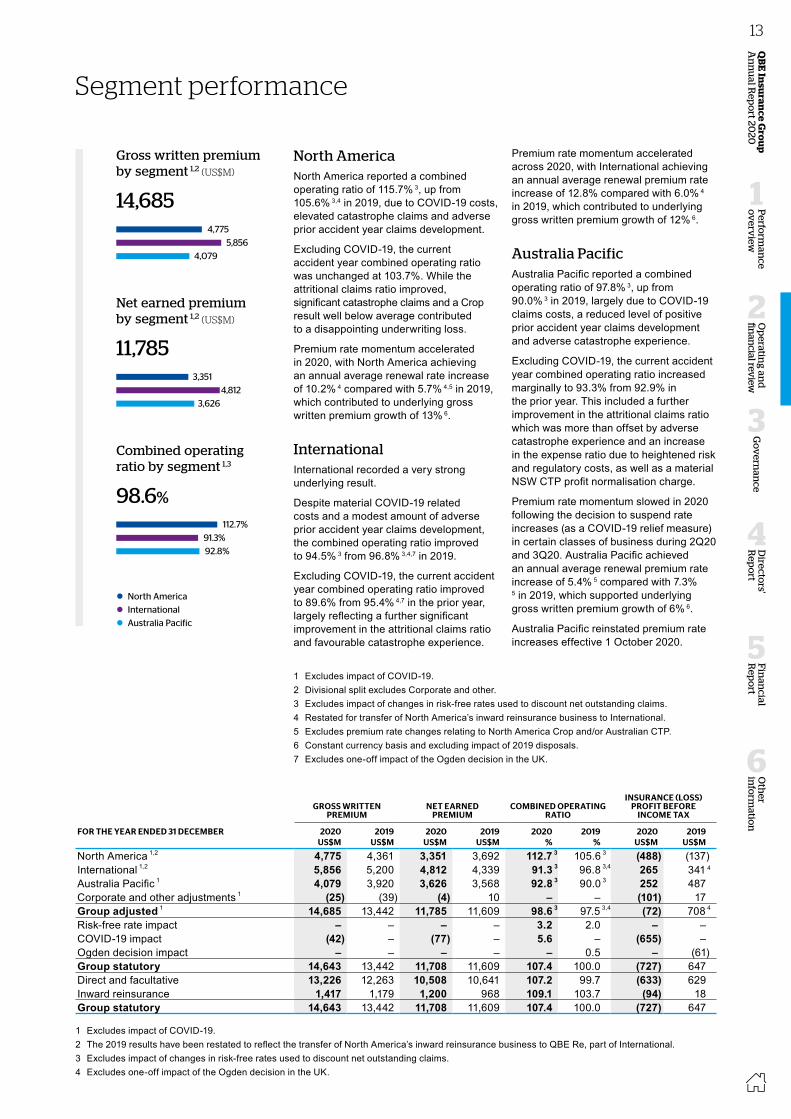
COVID-19 impact
COVID-19 underwriting result impacts
FOR THE YEAR ENDED 31 DECEMBER
2020 STATUTORY
RESULTNORTH
AMERICAINTER-
NATIONALAUSTRALIA
PACIFICCORPORATE
& OTHERCOVID-19
TOTAL
2020 ADJUSTED
EX-COVID US$M US$M US$M US$M US$M US$M US$M
Gross written premium 14,643 (31) (11) – – (42) 14,685Gross earned premium 14,008 (31) (11) – – (42) 14,050Net earned premium 11,708 (31) (46) (1) 1 (77) 11,785Net claims expense (8,934) (57) (123) (163) (217) (560) (8,374)Net commission (1,891) 6 3 – – 9 (1,900)Underwriting and other expenses (1,752) (13) 7 (17) (4) (27) (1,725)Underwriting result (869) (95) (159) (181) (220) (655) (214)
COVID-19 was declared a pandemic by the World Health Organisation in March 2020. The virus itself, and the measures to contain its spread have had a profound impact on the global economy which resulted in extreme investment market volatility and coordinated action by central banks to dramatically reduce interest rates.
In addition to materially impacting QBE’s investment returns, COVID-19 impacted the Group’s underwriting result by $655 million.
The Group estimates the ultimate net cost (including risk margin) of COVID-19 to be around $785 million pre-tax, comprising the $655 million 2020 charge coupled with an allowance for a further $130 million of potential net claims that could emerge over the next 12 to 18 months, primarily in trade credit, casualty lines and LMI.
Significant risk margins and extensive reinsurance protections, particularly for business interruption insurance, give us confidence in this estimate.
Operational efficiency
In December 2018, QBE announced a three-year operational efficiency program targeting gross cost savings of $200 million by 2021, translating into net savings of $130 million after allowing for inflation and further investment in technology, digitisation and Brilliant Basics.
From a 2018 cost base of $1.8 billion 2 and an expense ratio of 15.2% 2, we are targeting an expense ratio of “less than 14%” by 2021.
Two years into a three-year schedule of work, the program has progressed ahead of plan. Meaningful progress has been made in technology rationalisation and modernisation as we simplify our technology estate. Additional savings were realised from the disposal of the retail personal lines business in North America, operating model efficiencies across Australia, New Zealand and Asia, and further reductions in third party consulting, travel and other discretionary costs.
As a result of these initiatives, we have now achieved recurring net cost savings of around $125 million. To support the program and as previously foreshadowed, we incurred a $41 million restructuring charge that was not reported as part of the Group’s underwriting expenses.
Excluding $47 million of elevated risk and regulatory costs as well as a $61 million NSW CTP profit normalisation charge, but adjusting for well below plan variable remuneration costs and other one-off net savings, run-rate costs are estimated at $1,690 million which equates to an underlying expense ratio of 14.3%.
We have commenced the next phase of our operational efficiency program focused on IT modernisation and are targeting an expense ratio of 13% by 2023. To support the program, we will incur a restructuring charge of $150 million to be expensed over three years.
Underwriting and other expenses (US$M)
1,725 1
2% from 2019
Expense ratio
14.6% 1
Unchanged from 2019
2020 impact (US$M)
Premium 77
Acquisition costs 18
Claims 260
Risk margins 300
655
1 Excludes impact of COVID-19. 2 Continuing operations basis.
12
Segment performance
North AmericaNorth America reported a combined operating ratio of 115.7% 3, up from 105.6% 3,4 in 2019, due to COVID-19 costs, elevated catastrophe claims and adverse prior accident year claims development.
Excluding COVID-19, the current accident year combined operating ratio was unchanged at 103.7%. While the attritional claims ratio improved, significant catastrophe claims and a Crop result well below average contributed to a disappointing underwriting loss.
Premium rate momentum accelerated in 2020, with North America achieving an annual average renewal rate increase of 10.2% 4 compared with 5.7% 4,5 in 2019, which contributed to underlying gross written premium growth of 13% 6.
InternationalInternational recorded a very strong underlying result.
Despite material COVID-19 related costs and a modest amount of adverse prior accident year claims development, the combined operating ratio improved to 94.5% 3 from 96.8% 3,4,7 in 2019.
Excluding COVID-19, the current accident year combined operating ratio improved to 89.6% from 95.4% 4,7 in the prior year, largely reflecting a further significant improvement in the attritional claims ratio and favourable catastrophe experience.
Premium rate momentum accelerated across 2020, with International achieving an annual average renewal premium rate increase of 12.8% compared with 6.0% 4 in 2019, which contributed to underlying gross written premium growth of 12% 6.
Australia PacificAustralia Pacific reported a combined operating ratio of 97.8% 3, up from 90.0% 3 in 2019, largely due to COVID-19 claims costs, a reduced level of positive prior accident year claims development and adverse catastrophe experience.
Excluding COVID-19, the current accident year combined operating ratio increased marginally to 93.3% from 92.9% in the prior year. This included a further improvement in the attritional claims ratio which was more than offset by adverse catastrophe experience and an increase in the expense ratio due to heightened risk and regulatory costs, as well as a material NSW CTP profit normalisation charge.
Premium rate momentum slowed in 2020 following the decision to suspend rate increases (as a COVID-19 relief measure) in certain classes of business during 2Q20 and 3Q20. Australia Pacific achieved an annual average renewal premium rate increase of 5.4% 5 compared with 7.3%
5 in 2019, which supported underlying gross written premium growth of 6% 6.
Australia Pacific reinstated premium rate increases effective 1 October 2020.
Gross written premium by segment 1,2 (US$M)
14,685
Net earned premium by segment 1,2 (US$M)
11,785
Combined operating ratio by segment 1,3
98.6%
North America
International
Australia Pacific
GROSS WRITTEN PREMIUM
NET EARNED PREMIUM
COMBINED OPERATING RATIO
INSURANCE (LOSS) PROFIT BEFORE
INCOME TAX
FOR THE YEAR ENDED 31 DECEMBER 2020 2019 2020 2019 2020 2019 2020 2019 US$M US$M US$M US$M % % US$M US$M
North America 1,2 4,775 4,361 3,351 3,692 112.7 3 105.6 3 (488) (137)International 1,2 5,856 5,200 4,812 4,339 91.3 3 96.8 3,4 265 341 4
Australia Pacific 1 4,079 3,920 3,626 3,568 92.8 3 90.0 3 252 487Corporate and other adjustments 1 (25) (39) (4) 10 – – (101) 17Group adjusted 1 14,685 13,442 11,785 11,609 98.6 3 97.5 3,4 (72) 708 4
Risk-free rate impact – – – – 3.2 2.0 – –COVID-19 impact (42) – (77) – 5.6 – (655) –Ogden decision impact – – – – – 0.5 – (61)Group statutory 14,643 13,442 11,708 11,609 107.4 100.0 (727) 647Direct and facultative 13,226 12,263 10,508 10,641 107.2 99.7 (633) 629Inward reinsurance 1,417 1,179 1,200 968 109.1 103.7 (94) 18Group statutory 14,643 13,442 11,708 11,609 107.4 100.0 (727) 647
1 Excludes impact of COVID-19.2 The 2019 results have been restated to reflect the transfer of North America’s inward reinsurance business to QBE Re, part of International. 3 Excludes impact of changes in risk-free rates used to discount net outstanding claims.4 Excludes one-off impact of the Ogden decision in the UK.
4,775
5,856
4,079
3,351
4,812
3,626
1 Excludes impact of COVID-19.2 Divisional split excludes Corporate and other.3 Excludes impact of changes in risk-free rates used to discount net outstanding claims.4 Restated for transfer of North America’s inward reinsurance business to International.5 Excludes premium rate changes relating to North America Crop and/or Australian CTP.6 Constant currency basis and excluding impact of 2019 disposals. 7 Excludes one-off impact of the Ogden decision in the UK.
112.7%
91.3%
92.8%
QB
E In
suran
ce Gro
up
A
nn
ual R
epo
rt 2020
13O
ther
info
rmatio
n
6
Fin
ancial
Rep
ort
5
Perfo
rman
ce o
verv
iew
1
Op
erating an
d
finan
cial review
2
Go
vern
ance
3
Directo
rs' R
epo
rt
4

Cash profit and dividends
Reconciliation of cash profit
FOR THE YEAR ENDED 31 DECEMBER 2020US$M
2019US$M
Net (loss) profit after tax (1,517) 550Amortisation and impairment of intangibles after tax 1 455 71Write-off of deferred tax assets 120 –Write-off of capitalised IT assets 27 –Reclassification of foreign currency translation reserve after tax 2 – 16Net cash (loss) profit after tax (915) 637Restructuring and related expenses after tax 75 32 Net loss on disposals after tax 2 8Additional Tier 1 capital coupon accrual 3 (25) –Ogden decision after tax – 51Loss from discontinued operations after tax (excluding reclassification of FCTR) – 5Adjusted net cash (loss) profit after tax (863) 733
Return on average shareholders’ equity – adjusted cash basis (%) (10.9) 8.9 Basic (loss) earnings per share – cash basis (US cents) (64.1) 48.4Dividend payout ratio (percentage of adjusted cash profit) 4 N/A 65%
1 $50 million of pre-tax amortisation expense is included in underwriting expenses (2019 $43 million).2 The sale of certain operations gave rise to a foreign currency translation reserve (FCTR) reclassification charge which was a non-cash item
and did not impact shareholders’ equity or QBE’s regulatory or rating agency capital base.3 Additional Tier 1 capital pays distributions out of after tax profits and thus impacts adjusted cash profit for the purposes of assessing ordinary
dividend capacity.4 Dividend payout ratio is calculated as the total AUD dividend divided by adjusted cash profit converted to AUD at the period average rate of exchange.
In order to more directly compare Group and divisional underwriting results with the prior year, the Group’s underwriting results are tabled on page 12 including and excluding the estimated impact of COVID-19.
Similarly, the underwriting results in the standalone divisional result commentaries are disclosed on the same basis.
While QBE has separately identified obvious COVID-19 underwriting revenue and expense impacts, there will be other less significant impacts, both positive and negative, that are not readily identifiable or quantifiable.
The 2019 adjusted result in the summary income statement on page 11 excludes a $61 million increase in the Group’s net central estimate of outstanding claims
reflecting the reduction in statutory discount rates applicable to UK personal injury liabilities (the Ogden decision) with an associated $10 million tax impact.
Unless otherwise stated, the commentary following refers to the Group’s result on an ex-COVID-19 and adjusted basis as described above.
DividendsOur dividend policy is designed to ensure that we reward shareholders relative to adjusted cash profit and maintain sufficient capital for future investment and growth of the business.
In light of the substantial 2020 statutory loss, the Board has elected not to declare a final dividend.
The combined 2020 interim and final dividend of 4 Australian cents per share is down substantially from 52 Australian cents per share in 2019.
Subject to global economic conditions not deteriorating materially, the Board expects to resume dividend payments – up to 65% of adjusted cash profit – in conjunction with the 2021 interim result.
Dividends per share (A¢)
4.0
Statutory result versus management result
Dividend payout (A$M)
59
42020
522019
502018
262017
542016
14
North America North America reported a 9% increase in gross written premium, underpinned by an average renewal premium rate increase of 10.2% 2 compared with 5.7% 2,3 in 2019.
Adjusting for the disposal of the personal lines business in 2019, underlying growth was 13%, reflecting premium rate increases coupled with strong growth in Crop, property programs and Accident & Health (A&H).
International International reported a 12% 1 uplift in gross written premium, underpinned by an average renewal premium rate increase of 12.8% compared with 6.0% 3 in 2019.
European operations achieved gross written premium growth of 14% 1 reflecting accelerating pricing momentum and emerging new business opportunities, particularly in International Markets, QBE Re and Continental European insurance.
Growth in European operations was partly offset by a 7% 1 contraction in Asia, primarily due to COVID-19 impacts, particularly in travel insurance, trade credit and marine cargo insurance.
Australia PacificAustralia Pacific reported a 6% 1 increase in gross written premium reflecting an average renewal premium rate increase of 5.4% 2 compared with 7.3% 2 in 2019.
Rate-driven growth was offset by moderation in CTP, the 2019 sale of the travel insurance business and the impact of the economic slowdown on the Pacific Islands business. Excluding CTP and travel insurance, underlying growth was around 8% reflecting growth in strata, LMI, householders and New Zealand.
Reinsurance expenseReinsurance expense increased 40% to $2,300 million from $1,648 million in 2019.
Additional Crop quota share reinsurance, and significantly reduced MPCI recoveries relative to the especially poor Crop result in 2019, increased reinsurance expense by $438 million relative to 2019.
Reinsurance expense was also impacted by the North America peak zone catastrophe buydown announced in April 2020 as well as growth in portfolios protected by quota share reinsurance, including Equator Re, and additional facultative and retrocession purchases, particularly in International.
Premium income
Gross written premium (US$M)
14,685 10% from 2019 1
Net earned premium (US$M)
11,785 4% from 2019 1
Average renewal premium rate increase 2
Group
+9.8%
North America +10.2%
International +12.8%
Australia Pacific +5.4%
Underwriting expenses, commission and tax
Net commission ratio
16.1%
2019 15.6%
Expense ratio
14.6%
2019 14.6%
Tax rate
(3)%
2019 16%
Underwriting and other expensesThe Group’s expense ratio was stable at 14.6%.
Improvement in International was offset by deterioration in North America and Australia Pacific, the latter reflecting a material NSW CTP profit normalisation charge. While North America reduced costs in absolute terms, the expense ratio was impacted by a greater reduction in net earned premium due to the sale of the retail personal lines business and material de-risking (reinsurance) initiatives.
As discussed on page 12, run-rate costs are $1,690 million which equates to an underlying expense ratio of 14.3%.
Net commissionThe commission ratio increased to 16.1% from 15.6% in 2019, in part due to relative growth in International where commission
rates are higher due to the specialised nature of the business. At the same time, International’s commission ratio increased due to strong growth in higher commission London Market Specialty business where rate increases were especially strong.
Income tax expenseThe effective statutory tax rate of negative 3% compares with 16% in the prior year and is distorted by a $120 million write-off of deferred tax assets and impairment of goodwill in North America of which only a portion was tax effected. The tax rate otherwise reflects the mix of corporate tax rates in the countries where we operate, with limitations on recognition of losses in North America and Bermuda.
The dividend franking account balance stood at A$71 million as at 31 December 2020, enabling the Group to fully frank A$165 million of dividends.
1 Constant currency basis and excludes impact of 2019 disposals.2 Excludes premium rate changes relating to North America Crop and/or Australian CTP. 3 Restated for transfer of North America’s inward reinsurance business to International.
QB
E In
suran
ce Gro
up
A
nn
ual R
epo
rt 2020
15
Oth
er in
form
ation
6
Fin
ancial
Rep
ort
5
Perfo
rman
ce o
verv
iew
1
Op
erating an
d
finan
cial review
2
Go
vern
ance
3
Directo
rs' R
epo
rt
4

Cash profit and dividends
Reconciliation of cash profit
FOR THE YEAR ENDED 31 DECEMBER 2020US$M
2019US$M
Net (loss) profit after tax (1,517) 550Amortisation and impairment of intangibles after tax 1 455 71Write-off of deferred tax assets 120 –Write-off of capitalised IT assets 27 –Reclassification of foreign currency translation reserve after tax 2 – 16Net cash (loss) profit after tax (915) 637Restructuring and related expenses after tax 75 32 Net loss on disposals after tax 2 8Additional Tier 1 capital coupon accrual 3 (25) –Ogden decision after tax – 51Loss from discontinued operations after tax (excluding reclassification of FCTR) – 5Adjusted net cash (loss) profit after tax (863) 733
Return on average shareholders’ equity – adjusted cash basis (%) (10.9) 8.9 Basic (loss) earnings per share – cash basis (US cents) (64.1) 48.4Dividend payout ratio (percentage of adjusted cash profit) 4 N/A 65%
1 $50 million of pre-tax amortisation expense is included in underwriting expenses (2019 $43 million).2 The sale of certain operations gave rise to a foreign currency translation reserve (FCTR) reclassification charge which was a non-cash item
and did not impact shareholders’ equity or QBE’s regulatory or rating agency capital base.3 Additional Tier 1 capital pays distributions out of after tax profits and thus impacts adjusted cash profit for the purposes of assessing ordinary
dividend capacity.4 Dividend payout ratio is calculated as the total AUD dividend divided by adjusted cash profit converted to AUD at the period average rate of exchange.
In order to more directly compare Group and divisional underwriting results with the prior year, the Group’s underwriting results are tabled on page 12 including and excluding the estimated impact of COVID-19.
Similarly, the underwriting results in the standalone divisional result commentaries are disclosed on the same basis.
While QBE has separately identified obvious COVID-19 underwriting revenue and expense impacts, there will be other less significant impacts, both positive and negative, that are not readily identifiable or quantifiable.
The 2019 adjusted result in the summary income statement on page 11 excludes a $61 million increase in the Group’s net central estimate of outstanding claims
reflecting the reduction in statutory discount rates applicable to UK personal injury liabilities (the Ogden decision) with an associated $10 million tax impact.
Unless otherwise stated, the commentary following refers to the Group’s result on an ex-COVID-19 and adjusted basis as described above.
DividendsOur dividend policy is designed to ensure that we reward shareholders relative to adjusted cash profit and maintain sufficient capital for future investment and growth of the business.
In light of the substantial 2020 statutory loss, the Board has elected not to declare a final dividend.
The combined 2020 interim and final dividend of 4 Australian cents per share is down substantially from 52 Australian cents per share in 2019.
Subject to global economic conditions not deteriorating materially, the Board expects to resume dividend payments – up to 65% of adjusted cash profit – in conjunction with the 2021 interim result.
Dividends per share (A¢)
4.0
Statutory result versus management result
Dividend payout (A$M)
59
42020
522019
502018
262017
542016
14
North America North America reported a 9% increase in gross written premium, underpinned by an average renewal premium rate increase of 10.2% 2 compared with 5.7% 2,3 in 2019.
Adjusting for the disposal of the personal lines business in 2019, underlying growth was 13%, reflecting premium rate increases coupled with strong growth in Crop, property programs and Accident & Health (A&H).
International International reported a 12% 1 uplift in gross written premium, underpinned by an average renewal premium rate increase of 12.8% compared with 6.0% 3 in 2019.
European operations achieved gross written premium growth of 14% 1 reflecting accelerating pricing momentum and emerging new business opportunities, particularly in International Markets, QBE Re and Continental European insurance.
Growth in European operations was partly offset by a 7% 1 contraction in Asia, primarily due to COVID-19 impacts, particularly in travel insurance, trade credit and marine cargo insurance.
Australia PacificAustralia Pacific reported a 6% 1 increase in gross written premium reflecting an average renewal premium rate increase of 5.4% 2 compared with 7.3% 2 in 2019.
Rate-driven growth was offset by moderation in CTP, the 2019 sale of the travel insurance business and the impact of the economic slowdown on the Pacific Islands business. Excluding CTP and travel insurance, underlying growth was around 8% reflecting growth in strata, LMI, householders and New Zealand.
Reinsurance expenseReinsurance expense increased 40% to $2,300 million from $1,648 million in 2019.
Additional Crop quota share reinsurance, and significantly reduced MPCI recoveries relative to the especially poor Crop result in 2019, increased reinsurance expense by $438 million relative to 2019.
Reinsurance expense was also impacted by the North America peak zone catastrophe buydown announced in April 2020 as well as growth in portfolios protected by quota share reinsurance, including Equator Re, and additional facultative and retrocession purchases, particularly in International.
Premium income
Gross written premium (US$M)
14,685 10% from 2019 1
Net earned premium (US$M)
11,785 4% from 2019 1
Average renewal premium rate increase 2
Group
+9.8%
North America +10.2%
International +12.8%
Australia Pacific +5.4%
Underwriting expenses, commission and tax
Net commission ratio
16.1%
2019 15.6%
Expense ratio
14.6%
2019 14.6%
Tax rate
(3)%
2019 16%
Underwriting and other expensesThe Group’s expense ratio was stable at 14.6%.
Improvement in International was offset by deterioration in North America and Australia Pacific, the latter reflecting a material NSW CTP profit normalisation charge. While North America reduced costs in absolute terms, the expense ratio was impacted by a greater reduction in net earned premium due to the sale of the retail personal lines business and material de-risking (reinsurance) initiatives.
As discussed on page 12, run-rate costs are $1,690 million which equates to an underlying expense ratio of 14.3%.
Net commissionThe commission ratio increased to 16.1% from 15.6% in 2019, in part due to relative growth in International where commission
rates are higher due to the specialised nature of the business. At the same time, International’s commission ratio increased due to strong growth in higher commission London Market Specialty business where rate increases were especially strong.
Income tax expenseThe effective statutory tax rate of negative 3% compares with 16% in the prior year and is distorted by a $120 million write-off of deferred tax assets and impairment of goodwill in North America of which only a portion was tax effected. The tax rate otherwise reflects the mix of corporate tax rates in the countries where we operate, with limitations on recognition of losses in North America and Bermuda.
The dividend franking account balance stood at A$71 million as at 31 December 2020, enabling the Group to fully frank A$165 million of dividends.
1 Constant currency basis and excludes impact of 2019 disposals.2 Excludes premium rate changes relating to North America Crop and/or Australian CTP. 3 Restated for transfer of North America’s inward reinsurance business to International.
QB
E In
suran
ce Gro
up
A
nn
ual R
epo
rt 2020
15O
ther
info
rmatio
n
6
Fin
ancial
Rep
ort
5
Perfo
rman
ce o
verv
iew
1
Op
erating an
d
finan
cial review
2
Go
vern
ance
3
Directo
rs' R
epo
rt
4

Claims
Net incurred claims
FOR THE YEAR ENDED 31 DECEMBER 2020 2019
STATUTORY EX-COVID STATUTORY ADJUSTED 1
% % % %
Attritional claims 47.8 47.6 52.5 52.5Large individual risk and catastrophe claims 16.0 13.7 11.9 11.9Claims settlement costs 3.5 3.5 3.3 3.3Claims discount (0.3) (0.3) (1.4) (1.4)Net incurred central estimate claims ratio (current accident year) 67.0 64.5 66.3 66.3Changes in undiscounted prior accident year central estimate 3.1 2.9 (0.8) (0.8)Impact of Ogden decision – – 0.5 –Impact of changes in risk-free rates 3.3 3.2 2.0 2.0Movement in risk margins 2.9 0.4 (0.2) (0.2)Other (including unwind of prior year discount) – 0.1 2.0 2.0Net claims ratio 76.3 71.1 69.8 69.3
1 Excludes one-off impact of the Ogden decision in the UK.
Attritional claims ratio
FOR THE YEAR ENDED 31 DECEMBER 2020 2019
NEP ATTRITIONAL NEP ATTRITIONAL US$M % US$M %
Rest of portfolio 10,760 44.6 10,251 47.5Crop insurance 876 86.8 1,197 97.7LMI 149 32.9 161 34.8QBE Group adjusted 11,785 47.6 11,609 52.5
Incurred claimsThe Group’s net claims ratio increased to 71.1% from 69.3% 2 in 2019, largely reflecting a further material reduction in risk-free rates used to discount net outstanding claims liabilities.
Risk-free rate movements aside, a further significant improvement in the attritional claims ratio and a modest reduction in the large individual risk claims ratio were more than offset by a material increase in catastrophe claims coupled with adverse prior accident year claims development.
The additional Crop quota share and North American catastrophe reinsurance adversely impacted the net claims ratio (especially the large individual risk and catastrophe claims ratios) relative to the prior year by reducing net earned premium by $325 million.
The major components of the net claims ratio are summarised in the table below.
Attritional claims ratioExcluding Crop and LMI, the attritional claims ratio improved a further 2.9% to 44.6% from 47.5% in the prior year, reflecting improvement across all divisions but especially International.
Excluding Crop, North America’s attritional claims ratio improved 2.4% relative to the prior year. The benefit of earned rate increases, as well as the sale of the retail (independent agency) personal lines business, were partly offset by the adoption of more prudent current accident year actuarial assumptions, increased reinsurance spend to reduce North America peak zone catastrophe exposure and strong growth in A&H, which operates on a materially higher attritional claims ratio than the portfolio average.
International’s attritional claims ratio improved 4.0% relative to the prior year, reflecting an increasingly favourable pricing landscape.
Excluding LMI, Australia Pacific’s attritional claims ratio reduced by a further 1.7%, with improvement observed across most portfolios except for householders which was impacted by adverse weather.
Attritional claims ratio 1
44.6%
Large individual risk claims ratio
7.9%
Catastrophe claims ratio
5.8%
46.3%
40.2%
49.4%
8.3%
10.9%
3.5%
7.1%
4.3%
6.7%
North America
International
Australia Pacific
1 Excludes Crop and/or LMI.2 Excludes one-off impact of the Ogden decision in the UK.
16
Total large individual risk claims (US$M)
9327.9% of NEP
2019 955
Total catastrophe claims (US$M)
6885.8% of NEP
2019 426
Total large individual risk and catastrophe claims (US$M)
1,62013.7% of NEP
2019 1,381
Large individual risk and catastrophe claimsThe net cost of catastrophe claims increased to $688 million or 5.8% of net earned premium compared with 3.7% in 2019. This was $134 million or 1.1% above our allowance reflecting particularly adverse experience in Australia due to widespread bushfires and significant Australian east coast hail and storm claims, coupled with a record number of Atlantic hurricanes. Catastrophe experience was better than expected in International, albeit worse than the especially benign prior year.
The net cost of large individual risk claims reduced to $932 million or 7.9% of net earned premium from 8.2% in the prior year. This is a pleasing outcome with significant improvement in International partly offset by higher than expected claims severity in North America aviation and NSW CTP.
The 2021 catastrophe allowance is $685 million, up from $554 million in 2020, reflecting a small increase in aggregate due to growth, the impact of changes to our reinsurance structure and our prudent response to the elevated level of catastrophe claims in more recent years.
Weighted average risk‑free ratesAs summarised in the table below, the currency weighted average risk-free rate used to discount net outstanding claims liabilities decreased to 0.30% at 31 December 2020 from 1.05% at 31 December 2019.
Risk-free rates decreased appreciably across all currencies resulting in a $381 million underwriting charge that increased the net claims ratio by 3.2% compared with a $231 million charge in 2019 that increased the net claims ratio by 2.0%.
The $381 million adverse risk-free rate impact on the underwriting result was more than offset by a $481 million benefit in investment income due to the maintenance of a surplus duration position for the first half of 2020.
Prior accident year claims developmentExcluding $20 million of positive prior accident year claims development pertaining to North America Crop insurance that is matched by additional premium cessions under the MPCI scheme, adverse prior accident year claims development was $366 million or 3.1% of net earned premium, compared with $22 million or 0.2% in the prior year.
Disappointingly, North America reported $305 million of adverse development spanning the closed excess and surplus lines (E&S) portfolio, aviation, industry-wide development on Hurricane Irma and an additional explicit allowance to address systemic risks including social inflation and higher severity trends in casualty lines.
International reported $80 million of adverse development, primarily reflecting development on the North America inward reinsurance business (now part of QBE Re), 2019 Japanese typhoons and higher than anticipated claims inflation in European financial lines.
Australia Pacific reported $18 million of positive prior accident year claims development. Favourable development in NSW CTP, commercial property and workers’ compensation was partly offset by modest development in householders, liability classes and in New Zealand.
Weighted average risk‑free rates
CURRENCY 31 DECEMBER 30 JUNE 31 DECEMBER 2020 2020 2019
Australian dollar % 0.41 0.50 1.11US dollar % 0.82 0.69 1.95Sterling % 0.07 0.16 0.80Euro % (0.59) (0.34) (0.08)Group weighted % 0.30 0.31 1.05Estimated risk-free rate charge US$M (381) (335) (231)
Prior accident year claims development (US$M)
(366)(366)2020
(22)2019
922018
172017
3662016
QB
E In
suran
ce Gro
up
A
nn
ual R
epo
rt 2020
17
Oth
er in
form
ation
6
Fin
ancial
Rep
ort
5
Perfo
rman
ce o
verv
iew
1
Op
erating an
d
finan
cial review
2
Go
vern
ance
3
Directo
rs' R
epo
rt
4
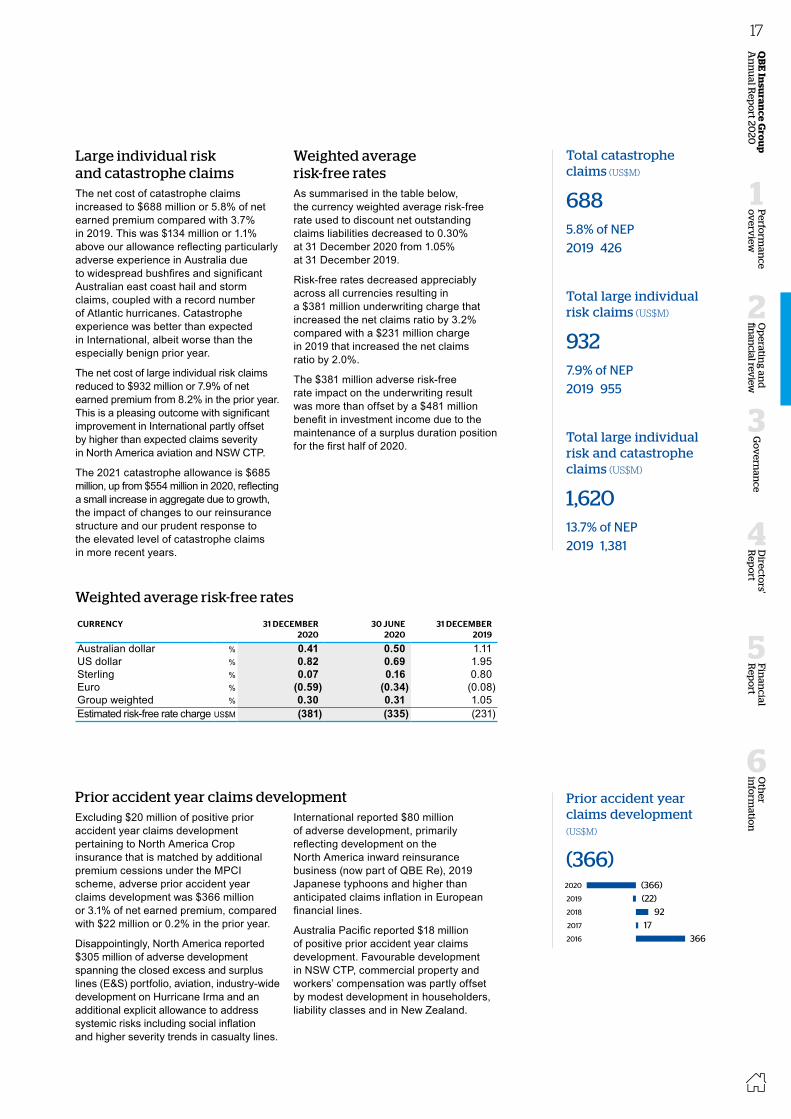
Claims
Net incurred claims
FOR THE YEAR ENDED 31 DECEMBER 2020 2019
STATUTORY EX-COVID STATUTORY ADJUSTED 1
% % % %
Attritional claims 47.8 47.6 52.5 52.5Large individual risk and catastrophe claims 16.0 13.7 11.9 11.9Claims settlement costs 3.5 3.5 3.3 3.3Claims discount (0.3) (0.3) (1.4) (1.4)Net incurred central estimate claims ratio (current accident year) 67.0 64.5 66.3 66.3Changes in undiscounted prior accident year central estimate 3.1 2.9 (0.8) (0.8)Impact of Ogden decision – – 0.5 –Impact of changes in risk-free rates 3.3 3.2 2.0 2.0Movement in risk margins 2.9 0.4 (0.2) (0.2)Other (including unwind of prior year discount) – 0.1 2.0 2.0Net claims ratio 76.3 71.1 69.8 69.3
1 Excludes one-off impact of the Ogden decision in the UK.
Attritional claims ratio
FOR THE YEAR ENDED 31 DECEMBER 2020 2019
NEP ATTRITIONAL NEP ATTRITIONAL US$M % US$M %
Rest of portfolio 10,760 44.6 10,251 47.5Crop insurance 876 86.8 1,197 97.7LMI 149 32.9 161 34.8QBE Group adjusted 11,785 47.6 11,609 52.5
Incurred claimsThe Group’s net claims ratio increased to 71.1% from 69.3% 2 in 2019, largely reflecting a further material reduction in risk-free rates used to discount net outstanding claims liabilities.
Risk-free rate movements aside, a further significant improvement in the attritional claims ratio and a modest reduction in the large individual risk claims ratio were more than offset by a material increase in catastrophe claims coupled with adverse prior accident year claims development.
The additional Crop quota share and North American catastrophe reinsurance adversely impacted the net claims ratio (especially the large individual risk and catastrophe claims ratios) relative to the prior year by reducing net earned premium by $325 million.
The major components of the net claims ratio are summarised in the table below.
Attritional claims ratioExcluding Crop and LMI, the attritional claims ratio improved a further 2.9% to 44.6% from 47.5% in the prior year, reflecting improvement across all divisions but especially International.
Excluding Crop, North America’s attritional claims ratio improved 2.4% relative to the prior year. The benefit of earned rate increases, as well as the sale of the retail (independent agency) personal lines business, were partly offset by the adoption of more prudent current accident year actuarial assumptions, increased reinsurance spend to reduce North America peak zone catastrophe exposure and strong growth in A&H, which operates on a materially higher attritional claims ratio than the portfolio average.
International’s attritional claims ratio improved 4.0% relative to the prior year, reflecting an increasingly favourable pricing landscape.
Excluding LMI, Australia Pacific’s attritional claims ratio reduced by a further 1.7%, with improvement observed across most portfolios except for householders which was impacted by adverse weather.
Attritional claims ratio 1
44.6%
Large individual risk claims ratio
7.9%
Catastrophe claims ratio
5.8%
46.3%
40.2%
49.4%
8.3%
10.9%
3.5%
7.1%
4.3%
6.7%
North America
International
Australia Pacific
1 Excludes Crop and/or LMI.2 Excludes one-off impact of the Ogden decision in the UK.
16
Total large individual risk claims (US$M)
9327.9% of NEP
2019 955
Total catastrophe claims (US$M)
6885.8% of NEP
2019 426
Total large individual risk and catastrophe claims (US$M)
1,62013.7% of NEP
2019 1,381
Large individual risk and catastrophe claimsThe net cost of catastrophe claims increased to $688 million or 5.8% of net earned premium compared with 3.7% in 2019. This was $134 million or 1.1% above our allowance reflecting particularly adverse experience in Australia due to widespread bushfires and significant Australian east coast hail and storm claims, coupled with a record number of Atlantic hurricanes. Catastrophe experience was better than expected in International, albeit worse than the especially benign prior year.
The net cost of large individual risk claims reduced to $932 million or 7.9% of net earned premium from 8.2% in the prior year. This is a pleasing outcome with significant improvement in International partly offset by higher than expected claims severity in North America aviation and NSW CTP.
The 2021 catastrophe allowance is $685 million, up from $554 million in 2020, reflecting a small increase in aggregate due to growth, the impact of changes to our reinsurance structure and our prudent response to the elevated level of catastrophe claims in more recent years.
Weighted average risk‑free ratesAs summarised in the table below, the currency weighted average risk-free rate used to discount net outstanding claims liabilities decreased to 0.30% at 31 December 2020 from 1.05% at 31 December 2019.
Risk-free rates decreased appreciably across all currencies resulting in a $381 million underwriting charge that increased the net claims ratio by 3.2% compared with a $231 million charge in 2019 that increased the net claims ratio by 2.0%.
The $381 million adverse risk-free rate impact on the underwriting result was more than offset by a $481 million benefit in investment income due to the maintenance of a surplus duration position for the first half of 2020.
Prior accident year claims developmentExcluding $20 million of positive prior accident year claims development pertaining to North America Crop insurance that is matched by additional premium cessions under the MPCI scheme, adverse prior accident year claims development was $366 million or 3.1% of net earned premium, compared with $22 million or 0.2% in the prior year.
Disappointingly, North America reported $305 million of adverse development spanning the closed excess and surplus lines (E&S) portfolio, aviation, industry-wide development on Hurricane Irma and an additional explicit allowance to address systemic risks including social inflation and higher severity trends in casualty lines.
International reported $80 million of adverse development, primarily reflecting development on the North America inward reinsurance business (now part of QBE Re), 2019 Japanese typhoons and higher than anticipated claims inflation in European financial lines.
Australia Pacific reported $18 million of positive prior accident year claims development. Favourable development in NSW CTP, commercial property and workers’ compensation was partly offset by modest development in householders, liability classes and in New Zealand.
Weighted average risk‑free rates
CURRENCY 31 DECEMBER 30 JUNE 31 DECEMBER 2020 2020 2019
Australian dollar % 0.41 0.50 1.11US dollar % 0.82 0.69 1.95Sterling % 0.07 0.16 0.80Euro % (0.59) (0.34) (0.08)Group weighted % 0.30 0.31 1.05Estimated risk-free rate charge US$M (381) (335) (231)
Prior accident year claims development (US$M)
(366)(366)2020
(22)2019
922018
172017
3662016
QB
E In
suran
ce Gro
up
A
nn
ual R
epo
rt 2020
17O
ther
info
rmatio
n
6
Fin
ancial
Rep
ort
5
Perfo
rman
ce o
verv
iew
1
Op
erating an
d
finan
cial review
2
Go
vern
ance
3
Directo
rs' R
epo
rt
4

Balance sheet and capital management
Capitalisation and capital metrics
AS AT 31 DECEMBER BENCHMARK 2020 2019
Net assets US$M 8,492 8,153Less: intangible assets US$M (2,534) (2,791)Net tangible assets US$M 5,958 5,362Add: borrowings US$M 2,955 3,095Total tangible capitalisation US$M 8,913 8,457
Debt to equity 1 % 25–35 32.4 38.0Debt to tangible equity 1 % 46.2 57.7Premium solvency 2 % 50.6 46.2
QBE's regulatory capital base US$M 9,348 8,502APRA's PCA US$M 5,436 4,966PCA multiple 3 1.6–1.8x 1.72x 1.71x
1 Pro forma adjusting for $200 million pre-funded debt repayment to be completed in March 2021.2 The ratio of net tangible assets to adjusted net earned premium. 3 Indicative APRA PCA calculation at 31 December 2020.
Capital managementDuring 2020, QBE undertook significant capital management initiatives including:
• a $750 million equity raising via an institutional placement at A$8.25 per share;
• a $63 million equity raising via a Share Purchase Plan for retail investors at A$7.51 per share;
• a $500 million AT1 securities issuance; and
• net A$300 million of Tier 2 subordinated debt issuance.
In May 2020, QBE issued $500 million of perpetual fixed rate resetting capital notes that are AT1 qualifying under APRA’s capital adequacy framework.
The notes are classified as equity, pay franked after tax distributions and do not impact the weighted average number of shares for earnings per share calculations (since the notes are written off in whole or in part if APRA determines QBE is, or would become, non-viable).
Together with the reclassified 2017 perpetual fixed rate capital notes, the annual after tax distribution on QBE’s AT1 capital will be $50 million, while the reclassification of the 2017 notes will result in annual financing and other costs reducing by $21 million.
Allowing for subordinated debt to be repaid in March 2021, pro forma gearing was 32.4%, down significantly from 38.0% at 31 December 2019 and within the Group’s internal benchmark range of 25–35%.
Prescribed capital amountThe PCA multiple increased marginally to 1.72x at 31 December 2020 from 1.71x at 31 December 2019, reflecting:
• execution of the capital actions announced on 14 April 2020;
• a reduced insurance concentration risk charge (ICRC) mainly due to the purchase of additional catastrophe reinsurance protection for the North America region; largely offset by
• the full year cash operating loss and payment of the 2019 final and 2020 interim dividends;
• a higher insurance risk charge due to an increase in outstanding claims and premium liabilities as a result of lower risk-free rates, prior accident year claims development and an allowance for significant COVID-19 claims within outstanding claims and premium liabilities; and
• a higher asset risk charge reflecting the material increase in investment assets which more than offset the benefit of de-risking initiatives.
The $200 million subordinated debt redemption to be completed in March 2021, does not materially impact the PCA multiple as only $37 million was regulatory capital qualifying at the balance date.
Target PCA multiple
1.6–1.8x
PCA multiple
1.72x
2019 1.71x
Debt to equity
32.4% 1
2019 38.0%
Target debt to equity
25–35%
1 Pro forma adjusting for $200 million pre-funded debt repayment to be completed in March 2021.
18
Net outstanding claimsNet outstanding claims liabilities are discounted using sovereign bond rates as a proxy for risk-free interest rates and not the actual earning rate on our investments.
At 31 December 2020, risk margins in net outstanding claims were $1,537 million or 9.7% of the net central estimate of outstanding claims compared with $1,136 million or 8.3% of the net central estimate at 31 December 2019. Excluding foreign exchange movements, risk margins increased $344 million in 2020 compared with a $23 million decrease in 2019.
The PoA of net outstanding claims increased to 92.5% from 90.0% at 31 December 2019, primarily due to a $300 million uplift in risk margins reflecting heightened reserve uncertainty arising from COVID-19, particularly with respect to business interruption claims.
AS AT 31 DECEMBER 2020 2019
Net central estimate US$M 15,797 13,675Risk margin US$M 1,537 1,136Net outstanding claims US$M 17,334 14,811PoA % 92.5 90.0Risk margins to central estimate % 9.7 8.3
BorrowingsAs at 31 December 2020, total borrowings were $2,955 million, down $140 million from $3,095 million at 31 December 2019.
In July 2020, the Group reclassified $400 million of perpetual fixed rate capital notes out of borrowings into equity following a successful consent solicitation to amend the terms of the capital notes.
In August 2020, the Group issued A$500 million of subordinated notes to pre-fund the redemption of A$200 million of subordinated notes in September 2020 and $200 million of subordinated notes in March 2021.
Gross interest expense on long-term borrowings for the year was $185 million, down from $195 million in the prior year. The average annualised cash cost of borrowings at 31 December 2020 was 6.1%, down slightly from 6.3% as at 31 December 2019.
As at 31 December 2020, all but $169 million of the Group’s borrowings continued to count towards regulatory capital.
Total borrowings (US$M)
Borrowings profile
Goodwill (US$M)
Less than one year 200
One to five years 1,848
More than five years 907
Senior debt 2 –
Subordinated debt 100%
North America 358
International 546
Australia Pacific 1,203
Identifiable intangibles and goodwillThe carrying value of identifiable intangibles and goodwill at 31 December 2020 was $2,534 million, down from $2,791 million at 31 December 2019.
During the year, the carrying value of intangibles reduced by $257 million due to amortisation and impairment expense of $512 million, which more than offset a $188 million foreign exchange impact and net additions in the period, being mainly the capitalisation of software in relation to various information technology projects.
As at 31 December 2020, QBE recognised a North America goodwill impairment charge of $390 million reflecting a combination of factors including:
• lower investment return expectations that reflect market conditions, including lower long-term return assumptions and an updated strategic asset allocation that was determined as part of our annual planning process;
• an increase in the 10-year average Crop combined ratio that resulted from the deterioration in performance of the business in the second half of the year, principally due to the impact of the California wildfires; and
• an increase in North America’s catastrophe allowance as a result of elevated catastrophe experience in the second half of the year.
1 Based on first call date. 2 Senior debt outstanding at 31 December 2020 is $6 million.
2,955 1
2,955
2,107
QB
E In
suran
ce Gro
up
A
nn
ual R
epo
rt 2020
19
Oth
er in
form
ation
6
Fin
ancial
Rep
ort
5
Perfo
rman
ce o
verv
iew
1
Op
erating an
d
finan
cial review
2
Go
vern
ance
3
Directo
rs' R
epo
rt
4

Balance sheet and capital management
Capitalisation and capital metrics
AS AT 31 DECEMBER BENCHMARK 2020 2019
Net assets US$M 8,492 8,153Less: intangible assets US$M (2,534) (2,791)Net tangible assets US$M 5,958 5,362Add: borrowings US$M 2,955 3,095Total tangible capitalisation US$M 8,913 8,457
Debt to equity 1 % 25–35 32.4 38.0Debt to tangible equity 1 % 46.2 57.7Premium solvency 2 % 50.6 46.2
QBE's regulatory capital base US$M 9,348 8,502APRA's PCA US$M 5,436 4,966PCA multiple 3 1.6–1.8x 1.72x 1.71x
1 Pro forma adjusting for $200 million pre-funded debt repayment to be completed in March 2021.2 The ratio of net tangible assets to adjusted net earned premium. 3 Indicative APRA PCA calculation at 31 December 2020.
Capital managementDuring 2020, QBE undertook significant capital management initiatives including:
• a $750 million equity raising via an institutional placement at A$8.25 per share;
• a $63 million equity raising via a Share Purchase Plan for retail investors at A$7.51 per share;
• a $500 million AT1 securities issuance; and
• net A$300 million of Tier 2 subordinated debt issuance.
In May 2020, QBE issued $500 million of perpetual fixed rate resetting capital notes that are AT1 qualifying under APRA’s capital adequacy framework.
The notes are classified as equity, pay franked after tax distributions and do not impact the weighted average number of shares for earnings per share calculations (since the notes are written off in whole or in part if APRA determines QBE is, or would become, non-viable).
Together with the reclassified 2017 perpetual fixed rate capital notes, the annual after tax distribution on QBE’s AT1 capital will be $50 million, while the reclassification of the 2017 notes will result in annual financing and other costs reducing by $21 million.
Allowing for subordinated debt to be repaid in March 2021, pro forma gearing was 32.4%, down significantly from 38.0% at 31 December 2019 and within the Group’s internal benchmark range of 25–35%.
Prescribed capital amountThe PCA multiple increased marginally to 1.72x at 31 December 2020 from 1.71x at 31 December 2019, reflecting:
• execution of the capital actions announced on 14 April 2020;
• a reduced insurance concentration risk charge (ICRC) mainly due to the purchase of additional catastrophe reinsurance protection for the North America region; largely offset by
• the full year cash operating loss and payment of the 2019 final and 2020 interim dividends;
• a higher insurance risk charge due to an increase in outstanding claims and premium liabilities as a result of lower risk-free rates, prior accident year claims development and an allowance for significant COVID-19 claims within outstanding claims and premium liabilities; and
• a higher asset risk charge reflecting the material increase in investment assets which more than offset the benefit of de-risking initiatives.
The $200 million subordinated debt redemption to be completed in March 2021, does not materially impact the PCA multiple as only $37 million was regulatory capital qualifying at the balance date.
Target PCA multiple
1.6–1.8x
PCA multiple
1.72x
2019 1.71x
Debt to equity
32.4% 1
2019 38.0%
Target debt to equity
25–35%
1 Pro forma adjusting for $200 million pre-funded debt repayment to be completed in March 2021.
18
Net outstanding claimsNet outstanding claims liabilities are discounted using sovereign bond rates as a proxy for risk-free interest rates and not the actual earning rate on our investments.
At 31 December 2020, risk margins in net outstanding claims were $1,537 million or 9.7% of the net central estimate of outstanding claims compared with $1,136 million or 8.3% of the net central estimate at 31 December 2019. Excluding foreign exchange movements, risk margins increased $344 million in 2020 compared with a $23 million decrease in 2019.
The PoA of net outstanding claims increased to 92.5% from 90.0% at 31 December 2019, primarily due to a $300 million uplift in risk margins reflecting heightened reserve uncertainty arising from COVID-19, particularly with respect to business interruption claims.
AS AT 31 DECEMBER 2020 2019
Net central estimate US$M 15,797 13,675Risk margin US$M 1,537 1,136Net outstanding claims US$M 17,334 14,811PoA % 92.5 90.0Risk margins to central estimate % 9.7 8.3
BorrowingsAs at 31 December 2020, total borrowings were $2,955 million, down $140 million from $3,095 million at 31 December 2019.
In July 2020, the Group reclassified $400 million of perpetual fixed rate capital notes out of borrowings into equity following a successful consent solicitation to amend the terms of the capital notes.
In August 2020, the Group issued A$500 million of subordinated notes to pre-fund the redemption of A$200 million of subordinated notes in September 2020 and $200 million of subordinated notes in March 2021.
Gross interest expense on long-term borrowings for the year was $185 million, down from $195 million in the prior year. The average annualised cash cost of borrowings at 31 December 2020 was 6.1%, down slightly from 6.3% as at 31 December 2019.
As at 31 December 2020, all but $169 million of the Group’s borrowings continued to count towards regulatory capital.
Total borrowings (US$M)
Borrowings profile
Goodwill (US$M)
Less than one year 200
One to five years 1,848
More than five years 907
Senior debt 2 –
Subordinated debt 100%
North America 358
International 546
Australia Pacific 1,203
Identifiable intangibles and goodwillThe carrying value of identifiable intangibles and goodwill at 31 December 2020 was $2,534 million, down from $2,791 million at 31 December 2019.
During the year, the carrying value of intangibles reduced by $257 million due to amortisation and impairment expense of $512 million, which more than offset a $188 million foreign exchange impact and net additions in the period, being mainly the capitalisation of software in relation to various information technology projects.
As at 31 December 2020, QBE recognised a North America goodwill impairment charge of $390 million reflecting a combination of factors including:
• lower investment return expectations that reflect market conditions, including lower long-term return assumptions and an updated strategic asset allocation that was determined as part of our annual planning process;
• an increase in the 10-year average Crop combined ratio that resulted from the deterioration in performance of the business in the second half of the year, principally due to the impact of the California wildfires; and
• an increase in North America’s catastrophe allowance as a result of elevated catastrophe experience in the second half of the year.
1 Based on first call date. 2 Senior debt outstanding at 31 December 2020 is $6 million.
2,955 1
2,955
2,107
QB
E In
suran
ce Gro
up
A
nn
ual R
epo
rt 2020
19O
ther
info
rmatio
n
6
Fin
ancial
Rep
ort
5
Perfo
rman
ce o
verv
iew
1
Op
erating an
d
finan
cial review
2
Go
vern
ance
3
Directo
rs' R
epo
rt
4

Fixed income
Growth assets
Investment performance and strategy
Having been heavily impacted by market volatility in March 2020, the investment portfolio subsequently experienced strong gains as substantial and coordinated monetary and fiscal policy stimuli helped bolster risk sentiment. The net investment return for 2020 was 0.9%, down materially from 4.4% in the prior year.
Our fixed income portfolio returned 1.9% compared with 3.7% in 2019, as sovereign bond yields fell to and remained anchored at historic lows. After initially widening substantially, credit spreads eventually retraced back toward or in some cases beyond their pre-COVID-19 levels.
Despite a challenging environment for corporate credit, our portfolio has remained resilient with no downgrades into high yield and a broadly lower incidence of downgrades relative to the wider market.
Growth assets returned a loss of 4.8% compared with income of 11.8% in 2019, largely reflecting the equity market sell-off in March 2020. Unlisted assets remained resilient over the course of 2020; unlisted property experienced only modest weakness, infrastructure assets just managed a positive return and private equity enjoyed strong gains as momentum gathered in the second half.
At 31 December 2020, total cash and investments was $27,735 million, up significantly from the prior year, reflecting strong operating cash flow coupled with depreciation of the US dollar against our other major currencies such as GBP, AUD and Euro.
The portfolio remains conservatively positioned with around 7% invested in growth assets, comprised of real estate, coupled with a small amount of gold and private equity.
With sovereign bond yields anchored near historical lows, we intend to broadly match the interest rate sensitivity of our fixed income assets with our net outstanding claims liabilities, implying an asset duration of, or modestly above, 2.2 years.
Fixed income
1.9%
2019 3.7%
Growth assets
(4.8)%
2019 11.8%
Vs
Net investment income (US$M)
226 78% from 2019
Funds under management (US$M)
Total cash and investments (US$M)
Interest bearing financial assets – S&P security grading
AS AT 31 DECEMBER 2020 %
2019 %
RatingAAA 12 13AA 38 38A 36 34<A 14 15
Currency mix of investments
AS AT 31 DECEMBER 2020 %
2019 %
US dollar 33 34Australian dollar 27 27Sterling 17 17Euro 14 12Other 9 10
5,6
00
15,9
58
372
Developedmarket equity
Unlisted property
trusts
Totalinvestments
Infrastructure assets
Privateequity
Alternatives Investment properties
25,670Fixed income
2,065Growth assets
766
2,9
74
750
89
4
262
34100
25
Short-termmoney
Cash andequivalent
Governmentbonds
Corporatebonds
Infrastructuredebt
27,735
Net investment return
0.9%
2019 4.4%
25,67022,058
2,0652,316
20202019
20202019
20
Closing remarks
Performance improvement in 2021We have set clear operational and financial priorities for 2021 and are now focused on executing against the following ambitions:
• deliver our 2021 business plan built around maximising the market opportunity to achieve targeted growth and margin improvement;
• execute on profit improvement plans in North America, recognising that not enough progress has been made to establish a sustainable base of underwriting earnings;
• evolve and reinvigorate the cell review process with a greater focus on speed of execution, portfolio optimisation and enhancing risk-adjusted returns; and
• continue to improve operational efficiency through the next phase of our program which is centred around migrating our technology infrastructure to the cloud and investing in digitisation to simplify and improve our processes.
The current premium rate momentum is in excess of claims inflation and we expect this, coupled with the ongoing benefit of expense efficiencies, to translate into margin expansion in 2021.
Normalised for catastrophe costs and excluding COVID-19 and the increase in risk margins, the 2020 current accident year underlying combined operating ratio improved to 94.0% from 98.4% 1 in 2019. Adjusting for the increase in the Group’s reinsurance costs and catastrophe allowance in 2021 but assuming a normal Crop result indicates an ‘exit’ combined operating ratio of ~95%. QBE expects margin expansion in 2021 from this base.
Inder SinghGroup Chief Financial Officer
2021 focus
Maximise the market opportunity to achieve targeted growth and margin expansion.
1 Excludes one-off impact of the Ogden decision in the UK.
While there remains significant lingering (COVID-19 related) global economic uncertainty, we have taken reasonable steps to de‑risk the business and pricing conditions remain favourable. Given underlying business momentum, we are confident of delivering an improvement in our financial performance in 2021.
QB
E In
suran
ce Gro
up
A
nn
ual R
epo
rt 2020
21
Oth
er in
form
ation
6
Fin
ancial
Rep
ort
5
Perfo
rman
ce o
verv
iew
1
Op
erating an
d
finan
cial review
2
Go
vern
ance
3
Directo
rs' R
epo
rt
4

Fixed income
Growth assets
Investment performance and strategy
Having been heavily impacted by market volatility in March 2020, the investment portfolio subsequently experienced strong gains as substantial and coordinated monetary and fiscal policy stimuli helped bolster risk sentiment. The net investment return for 2020 was 0.9%, down materially from 4.4% in the prior year.
Our fixed income portfolio returned 1.9% compared with 3.7% in 2019, as sovereign bond yields fell to and remained anchored at historic lows. After initially widening substantially, credit spreads eventually retraced back toward or in some cases beyond their pre-COVID-19 levels.
Despite a challenging environment for corporate credit, our portfolio has remained resilient with no downgrades into high yield and a broadly lower incidence of downgrades relative to the wider market.
Growth assets returned a loss of 4.8% compared with income of 11.8% in 2019, largely reflecting the equity market sell-off in March 2020. Unlisted assets remained resilient over the course of 2020; unlisted property experienced only modest weakness, infrastructure assets just managed a positive return and private equity enjoyed strong gains as momentum gathered in the second half.
At 31 December 2020, total cash and investments was $27,735 million, up significantly from the prior year, reflecting strong operating cash flow coupled with depreciation of the US dollar against our other major currencies such as GBP, AUD and Euro.
The portfolio remains conservatively positioned with around 7% invested in growth assets, comprised of real estate, coupled with a small amount of gold and private equity.
With sovereign bond yields anchored near historical lows, we intend to broadly match the interest rate sensitivity of our fixed income assets with our net outstanding claims liabilities, implying an asset duration of, or modestly above, 2.2 years.
Fixed income
1.9%
2019 3.7%
Growth assets
(4.8)%
2019 11.8%
Vs
Net investment income (US$M)
226 78% from 2019
Funds under management (US$M)
Total cash and investments (US$M)
Interest bearing financial assets – S&P security grading
AS AT 31 DECEMBER 2020 %
2019 %
RatingAAA 12 13AA 38 38A 36 34<A 14 15
Currency mix of investments
AS AT 31 DECEMBER 2020 %
2019 %
US dollar 33 34Australian dollar 27 27Sterling 17 17Euro 14 12Other 9 10
5,6
00
15,9
58
372
Developedmarket equity
Unlisted property
trusts
Totalinvestments
Infrastructure assets
Privateequity
Alternatives Investment properties
25,670Fixed income
2,065Growth assets
766
2,9
74
750
89
4
262
34100
25
Short-termmoney
Cash andequivalent
Governmentbonds
Corporatebonds
Infrastructuredebt
27,735
Net investment return
0.9%
2019 4.4%
25,67022,058
2,0652,316
20202019
20202019
20
Closing remarks
Performance improvement in 2021We have set clear operational and financial priorities for 2021 and are now focused on executing against the following ambitions:
• deliver our 2021 business plan built around maximising the market opportunity to achieve targeted growth and margin improvement;
• execute on profit improvement plans in North America, recognising that not enough progress has been made to establish a sustainable base of underwriting earnings;
• evolve and reinvigorate the cell review process with a greater focus on speed of execution, portfolio optimisation and enhancing risk-adjusted returns; and
• continue to improve operational efficiency through the next phase of our program which is centred around migrating our technology infrastructure to the cloud and investing in digitisation to simplify and improve our processes.
The current premium rate momentum is in excess of claims inflation and we expect this, coupled with the ongoing benefit of expense efficiencies, to translate into margin expansion in 2021.
Normalised for catastrophe costs and excluding COVID-19 and the increase in risk margins, the 2020 current accident year underlying combined operating ratio improved to 94.0% from 98.4% 1 in 2019. Adjusting for the increase in the Group’s reinsurance costs and catastrophe allowance in 2021 but assuming a normal Crop result indicates an ‘exit’ combined operating ratio of ~95%. QBE expects margin expansion in 2021 from this base.
Inder SinghGroup Chief Financial Officer
2021 focus
Maximise the market opportunity to achieve targeted growth and margin expansion.
1 Excludes one-off impact of the Ogden decision in the UK.
While there remains significant lingering (COVID-19 related) global economic uncertainty, we have taken reasonable steps to de‑risk the business and pricing conditions remain favourable. Given underlying business momentum, we are confident of delivering an improvement in our financial performance in 2021.
QB
E In
suran
ce Gro
up
A
nn
ual R
epo
rt 2020
21O
ther
info
rmatio
n
6
Fin
ancial
Rep
ort
5
Perfo
rman
ce o
verv
iew
1
Op
erating an
d
finan
cial review
2
Go
vern
ance
3
Directo
rs' R
epo
rt
4

North America business review 1
North America’s result was severely impacted by COVID-19, a record Atlantic hurricane season and prior accident year claims development,
most notably in run-off portfolios and to address systemic risks. Despite this, an encouraging underlying performance and the strong
premium rate environment bode well for 2021.
Todd Jones • Chief Executive Officer • North America
2020 overview Market conditions continued to improve in 2020, as the industry strives to achieve premium rate adequacy despite the challenges of COVID-19.
Pricing accelerated across most lines resulting in an average renewal rate increase of 10.2% compared with 5.7% in 2019, underpinned by 20% in professional and financial lines, 18% in aviation, 17% in property programs and 11% in A&H. Brilliant Basics continues to underpin a disciplined approach to selecting and pricing risk.
2020 included meaningful catastrophe claims as a result of the most active Atlantic hurricane season on record. Weather also impacted the Crop business, notably the California wildfires and related smoke taint to Napa Valley vineyards, as well as the Iowa derecho. Following heightened Crop hail claims in recent years, we purchased additional quota share reinsurance which minimised exposure to hail events.
Unless otherwise stated, the profit and loss commentary following refers to the result excluding the impacts of COVID-19.
Operating and financial performance
Underwriting performance
North America reported a combined operating ratio of 112.7% 4, up from 105.6% 4 in 2019.
The underwriting result was heavily impacted by prior accident year claims development which increased the combined operating ratio by 9.0% compared with 1.9% in the prior year.
The current accident year combined operating ratio was unchanged at 103.7% . An improved Crop result and a further reduction in the attritional claims ratio were offset by increased large individual risk and catastrophe claims, primarily due to record hurricane activity.
Crop recorded a combined operating ratio of 98%. Although well above the historical average due to the Iowa derecho and the impact of wildfires in the Napa Valley, it was a material improvement from 107.5% in the prior year which was impacted by a very high level of prevented planting claims.
Gross written premium (US$M)
4,775 2
13% from 2019 3
Net earned premium (US$M)
3,351 2
5% from 2019 3
Underwriting result 4 (US$M)
(425) 2
216 from 2019
Insurance (loss) profit margin
(14.6)% 2
2019 (3.7)%
Combined operating ratio 4
112.7% 2
2019 105.6%
Underwriting result
FOR THE YEAR ENDED 31 DECEMBER 20202020
EX‑COVID 2019 2018 2017 5
Gross written premium US$M 4,744 4,775 4,361 4,450 4,287 Gross earned premium US$M 4,520 4,551 4,375 4,348 4,347 Net earned premium US$M 3,320 3,351 3,692 3,557 3,581 Net incurred claims US$M 2,974 2,917 2,929 2,397 2,838 Net commission US$M 480 486 536 535 559 Expenses US$M 482 469 488 528 529 Underwriting result US$M (616) (521) (261) 97 (345)Net claims ratio % 89.6 87.0 79.3 67.4 79.2Net commission ratio % 14.5 14.5 14.5 15.1 15.6Expense ratio % 14.5 14.0 13.2 14.8 14.8Combined operating ratio % 118.6 115.5 107.0 97.3 109.6Adjusted combined operating ratio 3 % 115.7 112.7 105.6 98.1 109.9Insurance (loss) profit margin % (17.6) (14.6) (3.7) N/A N/A1 The 2019 and prior results of North America have been restated to reflect the transfer of North America’s
inward reinsurance business to QBE Re, part of International.2 Excludes impact of COVID-19.3 Excludes impact of 2019 disposals.4 Excludes impact of changes in risk-free rates used to discount net outstanding claims.5 Excludes transactions to reinsure liabilities.
22
Premium income
Strong premium growth was achieved through improved retention and new business in lines where we have market leading positions including Crop, A&H and property programs.
Gross written premium increased 9% to $4,775 million. Adjusting for the sale of the retail personal lines business in 2019, underlying growth was 13% reflecting premium rate increases, focused new business initiatives and improved retention, especially in retail commercial.
Specialty & Commercial grew 11% due to new business and premium rate-driven growth, principally in A&H and middle market commercial lines, as well as strong rate increases in aviation and professional lines. Growth in these areas more than offset the targeted run-off of E&S.
Crop gross written premium increased 14% due to growth in policy count, which more than offset lower commodity prices and reduced volatility factors.
Alternative Markets’ gross written premium increased 13%. Premium growth in programs, particularly from rate and improved retention in property and specialty, was partly offset by premium contraction in the affiliated home insurance portfolio due to reduced new business levels.
Net earned premium fell 9% to $3,351 million from $3,692 million in 2019, primarily due to the sale of the retail personal lines business and the purchase of additional catastrophe and crop hail reinsurance. Adjusting for these items, underlying net earned premium growth was around 4%.
Claims expense The attritional claims ratio (excluding Crop) improved by 2.4% to 46.3% from 48.7% in the prior year.
The net cost of large individual risk claims increased to 8.3% of net earned premium from 6.0% in 2019, largely due to increased severity in general aviation coupled with a strengthening of current accident year claims ratios on short-tail lines, notably in commercial property.
The net cost of catastrophe claims increased to 7.1% of net earned premium from 2.7% in 2019, primarily due to the record number of Atlantic hurricanes.
The result included adverse prior accident year claims development of $305 million or 9.0% of net earned premium compared with $71 million or 1.9% in 2019.
Prior accident year claims development included $71 million pertaining to the E&S run-off portfolio, $60 million in aviation, primarily driven by a single large claim, and $33 million on Hurricane Irma, consistent with industry experience.
The result also included a second half reserve strengthening of around $100 million. This strengthening was largely to address a combination of systemic risk factors, notably social inflation and the potential for higher severity loss trends in casualty lines, including general liability, umbrella and professional lines, rather than in response to specific underlying development observed during 2020.
Commission and expenses
The net commission ratio was unchanged at 14.5%. Growth in the relatively high commission paying program business was offset by additional commission income following increased Crop hail quota share reinsurance.
Although cost reduction initiatives drove a 4% reduction in underwriting expenses, the expense ratio increased to 14.0% from 13.2% in 2019, reflecting the reduction in net earned premium due to de-risking (reinsurance) initiatives and the sale of retail personal lines.
Gross written premium by class of business Gross earned premium by class of business
2020 %� Agriculture 37.7
� Commercial & domestic property 23.3
� Professional indemnity 11.5
� Accident & health 9.1
� Workers' compensation 6.2
� Public/product liability 5.8
� Marine, energy & aviation 2.8
� Motor & motor casualty 2.2
� Financial & credit 1.3
� Other 0.1
Average renewal premium rate increase
10.2%
4.5% from 2019
Combined commission and expense ratio
28.5%
0.8% from 2019
COVID-19 impact
The 2020 ex-COVID-19 result in the table on the preceding page excludes impacts directly attributable to the COVID-19 pandemic. These impacts include: an estimated $31 million wage audit related workers’ compensation premium refund,
partly offset by reduced exposure and lower commissions; $57 million of claims, primarily impacting workers’ compensation, aviation and trade credit; and a $13 million expense impact, primarily reflecting anticipated bad debts.
2017
2018
2019
2020 10.2%
5.7%
3.8%
0.7%
2017
2018
2019
2020 28.5%
27.7%
29.9%
30.4%
QB
E In
suran
ce Gro
up
A
nn
ual R
epo
rt 2020
23
Oth
er in
form
ation
6
Fin
ancial
Rep
ort
5
Perfo
rman
ce o
verv
iew
1
Op
erating an
d
finan
cial review
2
Go
vern
ance
3
Directo
rs' R
epo
rt
4

North America business review 1
North America’s result was severely impacted by COVID-19, a record Atlantic hurricane season and prior accident year claims development,
most notably in run-off portfolios and to address systemic risks. Despite this, an encouraging underlying performance and the strong
premium rate environment bode well for 2021.
Todd Jones • Chief Executive Officer • North America
2020 overview Market conditions continued to improve in 2020, as the industry strives to achieve premium rate adequacy despite the challenges of COVID-19.
Pricing accelerated across most lines resulting in an average renewal rate increase of 10.2% compared with 5.7% in 2019, underpinned by 20% in professional and financial lines, 18% in aviation, 17% in property programs and 11% in A&H. Brilliant Basics continues to underpin a disciplined approach to selecting and pricing risk.
2020 included meaningful catastrophe claims as a result of the most active Atlantic hurricane season on record. Weather also impacted the Crop business, notably the California wildfires and related smoke taint to Napa Valley vineyards, as well as the Iowa derecho. Following heightened Crop hail claims in recent years, we purchased additional quota share reinsurance which minimised exposure to hail events.
Unless otherwise stated, the profit and loss commentary following refers to the result excluding the impacts of COVID-19.
Operating and financial performance
Underwriting performance
North America reported a combined operating ratio of 112.7% 4, up from 105.6% 4 in 2019.
The underwriting result was heavily impacted by prior accident year claims development which increased the combined operating ratio by 9.0% compared with 1.9% in the prior year.
The current accident year combined operating ratio was unchanged at 103.7% . An improved Crop result and a further reduction in the attritional claims ratio were offset by increased large individual risk and catastrophe claims, primarily due to record hurricane activity.
Crop recorded a combined operating ratio of 98%. Although well above the historical average due to the Iowa derecho and the impact of wildfires in the Napa Valley, it was a material improvement from 107.5% in the prior year which was impacted by a very high level of prevented planting claims.
Gross written premium (US$M)
4,775 2
13% from 2019 3
Net earned premium (US$M)
3,351 2
5% from 2019 3
Underwriting result 4 (US$M)
(425) 2
216 from 2019
Insurance (loss) profit margin
(14.6)% 2
2019 (3.7)%
Combined operating ratio 4
112.7% 2
2019 105.6%
Underwriting result
FOR THE YEAR ENDED 31 DECEMBER 20202020
EX‑COVID 2019 2018 2017 5
Gross written premium US$M 4,744 4,775 4,361 4,450 4,287 Gross earned premium US$M 4,520 4,551 4,375 4,348 4,347 Net earned premium US$M 3,320 3,351 3,692 3,557 3,581 Net incurred claims US$M 2,974 2,917 2,929 2,397 2,838 Net commission US$M 480 486 536 535 559 Expenses US$M 482 469 488 528 529 Underwriting result US$M (616) (521) (261) 97 (345)Net claims ratio % 89.6 87.0 79.3 67.4 79.2Net commission ratio % 14.5 14.5 14.5 15.1 15.6Expense ratio % 14.5 14.0 13.2 14.8 14.8Combined operating ratio % 118.6 115.5 107.0 97.3 109.6Adjusted combined operating ratio 3 % 115.7 112.7 105.6 98.1 109.9Insurance (loss) profit margin % (17.6) (14.6) (3.7) N/A N/A1 The 2019 and prior results of North America have been restated to reflect the transfer of North America’s
inward reinsurance business to QBE Re, part of International.2 Excludes impact of COVID-19.3 Excludes impact of 2019 disposals.4 Excludes impact of changes in risk-free rates used to discount net outstanding claims.5 Excludes transactions to reinsure liabilities.
22
Premium income
Strong premium growth was achieved through improved retention and new business in lines where we have market leading positions including Crop, A&H and property programs.
Gross written premium increased 9% to $4,775 million. Adjusting for the sale of the retail personal lines business in 2019, underlying growth was 13% reflecting premium rate increases, focused new business initiatives and improved retention, especially in retail commercial.
Specialty & Commercial grew 11% due to new business and premium rate-driven growth, principally in A&H and middle market commercial lines, as well as strong rate increases in aviation and professional lines. Growth in these areas more than offset the targeted run-off of E&S.
Crop gross written premium increased 14% due to growth in policy count, which more than offset lower commodity prices and reduced volatility factors.
Alternative Markets’ gross written premium increased 13%. Premium growth in programs, particularly from rate and improved retention in property and specialty, was partly offset by premium contraction in the affiliated home insurance portfolio due to reduced new business levels.
Net earned premium fell 9% to $3,351 million from $3,692 million in 2019, primarily due to the sale of the retail personal lines business and the purchase of additional catastrophe and crop hail reinsurance. Adjusting for these items, underlying net earned premium growth was around 4%.
Claims expense The attritional claims ratio (excluding Crop) improved by 2.4% to 46.3% from 48.7% in the prior year.
The net cost of large individual risk claims increased to 8.3% of net earned premium from 6.0% in 2019, largely due to increased severity in general aviation coupled with a strengthening of current accident year claims ratios on short-tail lines, notably in commercial property.
The net cost of catastrophe claims increased to 7.1% of net earned premium from 2.7% in 2019, primarily due to the record number of Atlantic hurricanes.
The result included adverse prior accident year claims development of $305 million or 9.0% of net earned premium compared with $71 million or 1.9% in 2019.
Prior accident year claims development included $71 million pertaining to the E&S run-off portfolio, $60 million in aviation, primarily driven by a single large claim, and $33 million on Hurricane Irma, consistent with industry experience.
The result also included a second half reserve strengthening of around $100 million. This strengthening was largely to address a combination of systemic risk factors, notably social inflation and the potential for higher severity loss trends in casualty lines, including general liability, umbrella and professional lines, rather than in response to specific underlying development observed during 2020.
Commission and expenses
The net commission ratio was unchanged at 14.5%. Growth in the relatively high commission paying program business was offset by additional commission income following increased Crop hail quota share reinsurance.
Although cost reduction initiatives drove a 4% reduction in underwriting expenses, the expense ratio increased to 14.0% from 13.2% in 2019, reflecting the reduction in net earned premium due to de-risking (reinsurance) initiatives and the sale of retail personal lines.
Gross written premium by class of business Gross earned premium by class of business
2020 %� Agriculture 37.7
� Commercial & domestic property 23.3
� Professional indemnity 11.5
� Accident & health 9.1
� Workers' compensation 6.2
� Public/product liability 5.8
� Marine, energy & aviation 2.8
� Motor & motor casualty 2.2
� Financial & credit 1.3
� Other 0.1
Average renewal premium rate increase
10.2%
4.5% from 2019
Combined commission and expense ratio
28.5%
0.8% from 2019
COVID-19 impact
The 2020 ex-COVID-19 result in the table on the preceding page excludes impacts directly attributable to the COVID-19 pandemic. These impacts include: an estimated $31 million wage audit related workers’ compensation premium refund,
partly offset by reduced exposure and lower commissions; $57 million of claims, primarily impacting workers’ compensation, aviation and trade credit; and a $13 million expense impact, primarily reflecting anticipated bad debts.
2017
2018
2019
2020 10.2%
5.7%
3.8%
0.7%
2017
2018
2019
2020 28.5%
27.7%
29.9%
30.4%
QB
E In
suran
ce Gro
up
A
nn
ual R
epo
rt 2020
23O
ther
info
rmatio
n
6
Fin
ancial
Rep
ort
5
Perfo
rman
ce o
verv
iew
1
Op
erating an
d
finan
cial review
2
Go
vern
ance
3
Directo
rs' R
epo
rt
4

International business review 1
A relentless focus on disciplined underwriting and technical pricing led to a significant improvement in International’s performance. The business fully leveraged the improved trading environment
to record a materially improved combined operating ratio of 91.3% 2,3.
Jason Harris • Chief Executive Officer • International
2020 overview Market conditions improved across all lines as premium rates gravitated towards technically adequate levels. Pricing momentum accelerated across the year and has continued into the important January 2021 renewal period.
Following relatively benign experience in 2019, catastrophe claims increased significantly in 2020, with our international energy and reinsurance businesses particularly impacted by the record Atlantic hurricane season.
Following a surprising ruling in the FCA’s business interruption test case that departed from previously well-established case law, the Group established significant claims provisions and remains committed to supporting customers and settling valid claims as soon as possible.
Unless otherwise stated, the commentary following refers to the result excluding the impacts of COVID-19.
Operating and financial performance
Underwriting performanceInternational reported a combined operating ratio of 91.3% 2 compared with 96.8% 2,5 in 2019.
Significant premium rate increases and an improved attritional claims ratio were partly offset by adverse prior accident year claims development and increased catastrophe claims.
The current accident year combined operating ratio was 89.6%, a significant improvement compared with 95.4% 5 in the prior year.
The combined operating ratio of the European insurance business improved to 88.6% 2 from 95.5% 2,5 in 2019, while QBE Re’s combined operating ratio improved 1.0% to 96.4% 2.
Asia recorded a combined operating ratio of 100.8% 2 compared with 101.5% 2 in 2019. An improved attritional claims ratio was partly offset by the impact of lower premium on the expense ratio and a modest amount of prior accident year claims development.
Gross written premium (US$M)
5,856 3
12% from 2019 4
Underwriting result 2 (US$M)
419 3
280 from 2019 5
Insurance profit margin
5.5% 3
2019 7.9% 5
Combined operating ratio 2
91.3% 3
2019 96.8% 5
Underwriting result
FOR THE YEAR ENDED 31 DECEMBER 20202020
EX‑COVID 2019 5 2018 6 2017 5
Gross written premium US$M 5,845 5,856 5,200 5,137 4,940 Gross earned premium US$M 5,531 5,542 5,010 5,153 4,933 Net earned premium US$M 4,766 4,812 4,339 4,463 4,213 Net incurred claims US$M 3,229 3,106 2,918 2,811 2,826 Net commission US$M 874 877 752 840 801 Expenses US$M 648 655 652 657 674 Underwriting result US$M 15 174 17 155 (88)Net claims ratio % 67.8 64.5 67.3 63.1 67.1Net commission ratio % 18.3 18.3 17.3 18.8 19.0Expense ratio % 13.6 13.6 15.0 14.7 16.0Combined operating ratio % 99.7 96.4 99.6 96.6 102.1Adjusted combined operating ratio 2 % 94.5 91.3 96.8 96.7 103.5Insurance profit margin % 2.2 5.5 7.9 N/A N/A1 The 2019 and prior results of International have been restated to reflect the transfer of North America’s inward
reinsurance business to QBE Re, part of International.2 Excludes impact of changes in risk-free rates used to discount net outstanding claims.3 Excludes impact of COVID-19. 4 Constant currency basis and excludes impact of 2019 disposals.5 Excludes one-off impact of the Ogden decision in the UK.6 Excludes transaction to reinsure Hong Kong construction workers’ compensation liabilities.
Net earned premium (US$M)
4,812 3
10% from 2019 4
24
Gross written premium by class of business (US$M)
Gross earned premium by class of business
2020 %� Commercial & domestic property 29.7
� Public/product liability 20.3
� Marine, energy & aviation 15.8
� Motor & motor casualty 11.7
� Professional indemnity 10.8
� Workers' compensation 4.7
� Accident & health 3.3
� Financial & credit 2. 1
� Other 1.6
Average renewal premium rate increase
12.8%
6.8% from 2019
Premium income
Gross written premium increased 12% 1 to $5,856 million, primarily reflecting the strengthening premium rate environment across the London Market and European insurance businesses.
International achieved an average renewal premium rate increase of 12.8% compared with 6.0% in the prior year. This included a 19.2% increase in International Markets and 14.4% in the UK regional business, up from 9.8% and 7.1% respectively in 2019, with especially strong increases in classes affected by inflation such as financial lines and international liability, as well as catastrophe exposed lines.
Significant premium growth has allowed the business to reduce our exposure to portfolios such as financial lines where further price correction is warranted.
In reinsurance markets where the premium rating environment remains subdued, notably motor and Europe, the priority remains margin protection. Conversely, in major hubs where pricing is supportive of margin expansion such as New York, London and Bermuda, we have grown our portfolio.
While we continue to build out our Asian capabilities, growth in the region was subdued as we maintain our commitment to sustainable underwriting. The rating environment in the region is improving, though it has not yet corrected to the extent of other markets. Renewal premium rate increases averaged 7.0% compared with 3.5% in the prior year.
Claims expense The net claims ratio improved to 59.4% 2 from 64.5% 2,3 in 2019. Improvements in the attritional and large individual risk claims ratios were partly offset by adverse prior accident year claims development and an increase in catastrophe claims, albeit from especially benign experience in 2019.
The attritional claims ratio improved 4.0% to 40.2%, reflecting targeted underwriting actions and the strong rate environment.
Large individual risk claims improved to $527 million or 10.9% of net earned premium from 13.9% in 2019, reflecting improved market conditions, our focus on underwriting discipline and ongoing portfolio de-risking.
Net catastrophe costs increased to $206 million or 4.3% of net earned premium compared with 3.1% in the prior year, reflecting a record Atlantic hurricane season and the Iowa derecho.
The result included adverse prior accident year claims development of $80 million or 1.7% of net earned premium compared with $54 3 million or 1.3% 3 of adverse development in 2019. This included adverse development on transferred North America reinsurance treaties, 2019 typhoon reinsurance claims and the strengthening of provisions for European financial lines in recognition of higher than anticipated claims inflation.
Commission and expenses
The net commission ratio increased to 18.3% from 17.3% in 2019, reflecting strong premium rate driven growth in high commission paying London Market Specialty business.
The expense ratio improved to 13.6% from 15.0% in 2019, reflecting operating leverage coupled with disciplined cost management which limited the increase in underwriting expenses to $3 million.
COVID-19 impact
The 2020 ex-COVID-19 result in the table on the preceding page excludes impacts directly attributable to the COVID-19 pandemic. These impacts include: a $46 million reduction in net earned premium, reflecting premium rebates to commercial
motor customers, additional reinsurance reinstatement premiums and Hong Kong travel; and $123 million of additional claims net of the benefit of reduced claims frequency in some classes of business during lockdown periods across Europe.
1 Constant currency basis and excludes impact of 2019 disposals.2 Excludes impact of changes in risk-free rates used to discount net outstanding claims.3 Excludes one-off impact of the Ogden decision in the UK.4 Excludes transaction to reinsure Hong Kong construction workers’ compensation liabilities.
Combined commission and expense ratio
31.9%
0.4% from 2019
2017
2018
2019
2020 12.8%
6.0%
4.1%
(0.2)%
2017
2018
2019
2020 31.9%32.3%
33.5% 4
35.0%
QB
E In
suran
ce Gro
up
A
nn
ual R
epo
rt 2020
25
Oth
er in
form
ation
6
Fin
ancial
Rep
ort
5
Perfo
rman
ce o
verv
iew
1
Op
erating an
d
finan
cial review
2
Go
vern
ance
3
Directo
rs' R
epo
rt
4
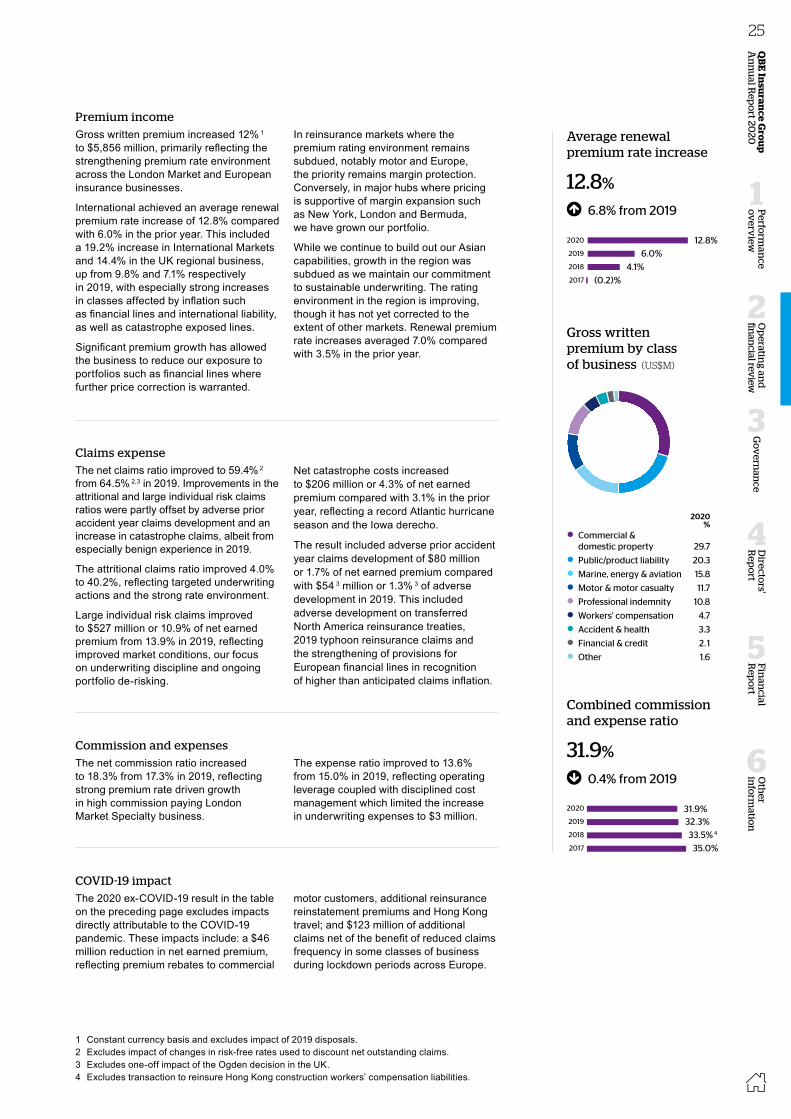
International business review 1
A relentless focus on disciplined underwriting and technical pricing led to a significant improvement in International’s performance. The business fully leveraged the improved trading environment
to record a materially improved combined operating ratio of 91.3% 2,3.
Jason Harris • Chief Executive Officer • International
2020 overview Market conditions improved across all lines as premium rates gravitated towards technically adequate levels. Pricing momentum accelerated across the year and has continued into the important January 2021 renewal period.
Following relatively benign experience in 2019, catastrophe claims increased significantly in 2020, with our international energy and reinsurance businesses particularly impacted by the record Atlantic hurricane season.
Following a surprising ruling in the FCA’s business interruption test case that departed from previously well-established case law, the Group established significant claims provisions and remains committed to supporting customers and settling valid claims as soon as possible.
Unless otherwise stated, the commentary following refers to the result excluding the impacts of COVID-19.
Operating and financial performance
Underwriting performanceInternational reported a combined operating ratio of 91.3% 2 compared with 96.8% 2,5 in 2019.
Significant premium rate increases and an improved attritional claims ratio were partly offset by adverse prior accident year claims development and increased catastrophe claims.
The current accident year combined operating ratio was 89.6%, a significant improvement compared with 95.4% 5 in the prior year.
The combined operating ratio of the European insurance business improved to 88.6% 2 from 95.5% 2,5 in 2019, while QBE Re’s combined operating ratio improved 1.0% to 96.4% 2.
Asia recorded a combined operating ratio of 100.8% 2 compared with 101.5% 2 in 2019. An improved attritional claims ratio was partly offset by the impact of lower premium on the expense ratio and a modest amount of prior accident year claims development.
Gross written premium (US$M)
5,856 3
12% from 2019 4
Underwriting result 2 (US$M)
419 3
280 from 2019 5
Insurance profit margin
5.5% 3
2019 7.9% 5
Combined operating ratio 2
91.3% 3
2019 96.8% 5
Underwriting result
FOR THE YEAR ENDED 31 DECEMBER 20202020
EX‑COVID 2019 5 2018 6 2017 5
Gross written premium US$M 5,845 5,856 5,200 5,137 4,940 Gross earned premium US$M 5,531 5,542 5,010 5,153 4,933 Net earned premium US$M 4,766 4,812 4,339 4,463 4,213 Net incurred claims US$M 3,229 3,106 2,918 2,811 2,826 Net commission US$M 874 877 752 840 801 Expenses US$M 648 655 652 657 674 Underwriting result US$M 15 174 17 155 (88)Net claims ratio % 67.8 64.5 67.3 63.1 67.1Net commission ratio % 18.3 18.3 17.3 18.8 19.0Expense ratio % 13.6 13.6 15.0 14.7 16.0Combined operating ratio % 99.7 96.4 99.6 96.6 102.1Adjusted combined operating ratio 2 % 94.5 91.3 96.8 96.7 103.5Insurance profit margin % 2.2 5.5 7.9 N/A N/A1 The 2019 and prior results of International have been restated to reflect the transfer of North America’s inward
reinsurance business to QBE Re, part of International.2 Excludes impact of changes in risk-free rates used to discount net outstanding claims.3 Excludes impact of COVID-19. 4 Constant currency basis and excludes impact of 2019 disposals.5 Excludes one-off impact of the Ogden decision in the UK.6 Excludes transaction to reinsure Hong Kong construction workers’ compensation liabilities.
Net earned premium (US$M)
4,812 3
10% from 2019 4
24
Gross written premium by class of business (US$M)
Gross earned premium by class of business
2020 %� Commercial & domestic property 29.7
� Public/product liability 20.3
� Marine, energy & aviation 15.8
� Motor & motor casualty 11.7
� Professional indemnity 10.8
� Workers' compensation 4.7
� Accident & health 3.3
� Financial & credit 2. 1
� Other 1.6
Average renewal premium rate increase
12.8%
6.8% from 2019
Premium income
Gross written premium increased 12% 1 to $5,856 million, primarily reflecting the strengthening premium rate environment across the London Market and European insurance businesses.
International achieved an average renewal premium rate increase of 12.8% compared with 6.0% in the prior year. This included a 19.2% increase in International Markets and 14.4% in the UK regional business, up from 9.8% and 7.1% respectively in 2019, with especially strong increases in classes affected by inflation such as financial lines and international liability, as well as catastrophe exposed lines.
Significant premium growth has allowed the business to reduce our exposure to portfolios such as financial lines where further price correction is warranted.
In reinsurance markets where the premium rating environment remains subdued, notably motor and Europe, the priority remains margin protection. Conversely, in major hubs where pricing is supportive of margin expansion such as New York, London and Bermuda, we have grown our portfolio.
While we continue to build out our Asian capabilities, growth in the region was subdued as we maintain our commitment to sustainable underwriting. The rating environment in the region is improving, though it has not yet corrected to the extent of other markets. Renewal premium rate increases averaged 7.0% compared with 3.5% in the prior year.
Claims expense The net claims ratio improved to 59.4% 2 from 64.5% 2,3 in 2019. Improvements in the attritional and large individual risk claims ratios were partly offset by adverse prior accident year claims development and an increase in catastrophe claims, albeit from especially benign experience in 2019.
The attritional claims ratio improved 4.0% to 40.2%, reflecting targeted underwriting actions and the strong rate environment.
Large individual risk claims improved to $527 million or 10.9% of net earned premium from 13.9% in 2019, reflecting improved market conditions, our focus on underwriting discipline and ongoing portfolio de-risking.
Net catastrophe costs increased to $206 million or 4.3% of net earned premium compared with 3.1% in the prior year, reflecting a record Atlantic hurricane season and the Iowa derecho.
The result included adverse prior accident year claims development of $80 million or 1.7% of net earned premium compared with $54 3 million or 1.3% 3 of adverse development in 2019. This included adverse development on transferred North America reinsurance treaties, 2019 typhoon reinsurance claims and the strengthening of provisions for European financial lines in recognition of higher than anticipated claims inflation.
Commission and expenses
The net commission ratio increased to 18.3% from 17.3% in 2019, reflecting strong premium rate driven growth in high commission paying London Market Specialty business.
The expense ratio improved to 13.6% from 15.0% in 2019, reflecting operating leverage coupled with disciplined cost management which limited the increase in underwriting expenses to $3 million.
COVID-19 impact
The 2020 ex-COVID-19 result in the table on the preceding page excludes impacts directly attributable to the COVID-19 pandemic. These impacts include: a $46 million reduction in net earned premium, reflecting premium rebates to commercial
motor customers, additional reinsurance reinstatement premiums and Hong Kong travel; and $123 million of additional claims net of the benefit of reduced claims frequency in some classes of business during lockdown periods across Europe.
1 Constant currency basis and excludes impact of 2019 disposals.2 Excludes impact of changes in risk-free rates used to discount net outstanding claims.3 Excludes one-off impact of the Ogden decision in the UK.4 Excludes transaction to reinsure Hong Kong construction workers’ compensation liabilities.
Combined commission and expense ratio
31.9%
0.4% from 2019
2017
2018
2019
2020 12.8%
6.0%
4.1%
(0.2)%
2017
2018
2019
2020 31.9%32.3%
33.5% 4
35.0%
QB
E In
suran
ce Gro
up
A
nn
ual R
epo
rt 2020
25O
ther
info
rmatio
n
6
Fin
ancial
Rep
ort
5
Perfo
rman
ce o
verv
iew
1
Op
erating an
d
finan
cial review
2
Go
vern
ance
3
Directo
rs' R
epo
rt
4

26
Australia Pacific business review
Australia Pacific recorded a strong combined operating ratio of 92.8% 1,2 despite the impacts of significantly elevated catastrophe activity in Australia. Industry-wide pricing momentum coupled with benefits from our cell review and Brilliant Basics programs
led to a further 1.7% 2,3 improvement in our attritional claims ratio.
Frank Costigan • Interim Managing Director • Australia
2020 overview The year began with extreme bushfires across much of eastern Australia followed by higher than normal levels of storm activity. As the first quarter drew to a close, COVID-19 took hold and became the pervasive issue of 2020.
COVID-19 significantly impacted our customers, communities and financial results. For the insurance industry, pandemic discussions focused on business interruption policy wording. The industry view is clear: pandemic exclusions apply to infectious disease and prevention of access wordings, and the Insurance Council of Australia (ICA) test case was undertaken to clarify the issue. While the court ruled against the ICA, the industry has now sought leave to appeal the decision. Due to the complex and wide-ranging nature of the issue, COVID-19 related business interruption claims will likely take time to be fully resolved.
Unless otherwise stated, the commentary following refers to the result excluding the impacts of COVID-19.
Operating and financial performance
Underwriting performance
Australia Pacific reported a combined operating ratio of 92.8% 1 compared with 90.0% 1 in 2019.
The underwriting result was impacted by increased catastrophe costs in Australia, coupled with a reduced level of positive prior accident year claims development partly offset by a further improvement in both the attritional and large individual risk claims ratios.
The combined operating ratio of our LMI business increased to 62.3% 1 from 58.3% 1 in 2019. While underlying arrears are broadly stable, more cautious economic assumptions have been incorporated into reserving assumptions through additional risk margin.
The LMI result also included a $60 million provision for COVID-19 which allows for peak unemployment of 8% and average house price declines of 5%.
Gross written premium (US$M)
4,079 6% from 2019 4
Underwriting result 1 (US$M)
260 2
98 from 2019
Insurance profit margin
6.9% 2
2019 13.6%
Combined operating ratio 1
92.8% 2
2019 90.0%
Underwriting result
FOR THE YEAR ENDED 31 DECEMBER 20202020
EX‑COVID 2019 2018 2017
Gross written premium US$M 4,079 4,079 3,920 4,104 4,139Gross earned premium US$M 3,985 3,985 3,885 4,103 4,252Net earned premium US$M 3,625 3,626 3,568 3,758 3,895Net incurred claims US$M 2,479 2,316 2,223 2,310 2,444Net commission US$M 534 534 526 561 548Expenses US$M 572 555 519 542 532Underwriting result US$M 40 221 300 345 371Net claims ratio % 68.4 63.9 62.3 61.5 62.7Net commission ratio % 14.7 14.7 14.8 14.9 14.1Expense ratio % 15.8 15.3 14.5 14.4 13.7Combined operating ratio % 98.9 93.9 91.6 90.8 90.5Adjusted combined operating ratio 1 % 97.8 92.8 90.0 90.3 90.5Insurance profit margin % 2.0 6.9 13.6 13.3 13.81 Excludes impact of changes in risk-free rates used to discount net outstanding claims. 2 Excludes impact of COVID-19.3 Excludes LMI.4 Constant currency basis and excludes impact of 2019 disposals.
Net earned premium (US$M)
3,626 2
3% from 2019 4
QB
E In
suran
ce Gro
up
A
nn
ual R
epo
rt 2020
27
Oth
er in
form
ation
6
Fin
ancial
Rep
ort
5
Perfo
rman
ce o
verv
iew
1
Op
erating an
d
finan
cial review
2
Go
vern
ance
3
Directo
rs' R
epo
rt
4
Premium income
Gross written premium increased 6% 1 to $4,079 million. This was despite a moderation in pricing and a deterioration in economic conditions, which led to reduced income on lines of business where premiums adjust to turnover and/or payroll.
Renewal premium rate increases averaged 5.4% 2, down from 7.3% 2 in 2019, due to the temporary suspension of premium rate increases to certain small to medium-sized and personal lines customers in response to COVID-19. Premium rate increases recovered to 6.4% 2 in the final quarter of the year as COVID-19 relief initiatives ceased.
Improved retention, coupled with growth in strata, LMI, home and New Zealand, was offset by a reduction in workers’ compensation and CTP, the sale of the travel insurance business and the impact of the economic slowdown on our Pacific Islands business.
In 2020, we launched new home and motor products and re-built our digital front end. Results have surpassed expectations with digital motor and home sales up more than 50% and (nearly) 100% respectively.
Net earned premium increased marginally to $3,626 million, up 3% on a constant currency basis and excluding disposals.
COVID-19 impact
The 2020 ex-COVID-19 result in the table on the preceding page excludes impacts directly attributable to the COVID-19 pandemic. These impacts include $163 million of net claims spanning business interruption, LMI, trade credit and other classes, partly offset by a $70 million
benefit due to a reduction in claims costs across motor, workers’ compensation, aviation and commercial packages. Expenses of $17 million included gift cards which were provided to customers due to reduced motor claims frequency during lockdown.
Claims expense The net claims ratio increased to 62.8% 3 from 60.7% 3 in 2019. A further reduction in the attritional claims ratio was more than offset by an increase in catastrophe claims and a reduced level of positive prior accident year claims development.
The attritional claims ratio improved a further 1.7% to 49.4% 4 as a result of ongoing and targeted pricing increases, coupled with enhanced risk selection and claims management initiatives.
The large individual risk claims ratio improved marginally to 3.5% of net earned premium from 3.7% in 2019, as risk selection and claims management enhancements offset unusual claims severity in CTP.
Net catastrophe costs increased $49 million to 6.7% of net earned premium from 5.4% in 2019, reflecting bushfire, storm and cyclone activity in Australia and flooding in New Zealand.
The underwriting result included $18 million of positive prior accident year claims development or 0.5% of net earned premium compared with $104 million or 2.9% in the prior year. Favourable development, primarily in NSW CTP, commercial property and workers’ compensation, was largely offset by modest strengthening in liability lines and minor adverse development in short-tail classes and New Zealand.
Commission and expenses The net commission ratio reduced slightly to 14.7% from 14.8% in 2019. Growth in strata, which attracts a relatively high commission ratio, was more than offset by lower profit commissions payable as a result of reduced profitability due to higher catastrophe activity.
The expense ratio increased to 15.3% from 14.5% in the prior year. A reduction in staff, project, marketing and travel and entertainment costs was more than offset by higher risk and regulatory costs and a strong performance in NSW CTP, which gave rise to a $61 million profit normalisation charge (transitional excess profits and losses or TEPL).
Gross written premium by class of business Gross earned premium by class of business
2020 %� Commercial & domestic property 39.4
� Motor & motor casualty 25.1
� Public/product liability 8.8
� Financial & credit 6.8
� Agriculture 6.6
� Workers' compensation 5.5
� Marine, energy & aviation 3.3
� Professional indemnity 2.6
� Accident & health 1.8
� Other 0.1
Average renewal premium rate increase 2
5.4%
1.9% from 2019
1 Constant currency basis and excludes impact of 2019 disposals.2 Excludes premium rate changes relating to CTP.3 Excludes impact of changes in risk-free rates used to discount net outstanding claims.4 Excludes LMI.
Combined commission and expense ratio
30.0%
0.7% from 2019
2017
2018
2019
2020 5.4%
7.3%
7.1%
5.9%
2017
2018
2019
2020 30.0%
29.3%
29.3%
27.8%

26
Australia Pacific business review
Australia Pacific recorded a strong combined operating ratio of 92.8% 1,2 despite the impacts of significantly elevated catastrophe activity in Australia. Industry-wide pricing momentum coupled with benefits from our cell review and Brilliant Basics programs
led to a further 1.7% 2,3 improvement in our attritional claims ratio.
Frank Costigan • Interim Managing Director • Australia
2020 overview The year began with extreme bushfires across much of eastern Australia followed by higher than normal levels of storm activity. As the first quarter drew to a close, COVID-19 took hold and became the pervasive issue of 2020.
COVID-19 significantly impacted our customers, communities and financial results. For the insurance industry, pandemic discussions focused on business interruption policy wording. The industry view is clear: pandemic exclusions apply to infectious disease and prevention of access wordings, and the Insurance Council of Australia (ICA) test case was undertaken to clarify the issue. While the court ruled against the ICA, the industry has now sought leave to appeal the decision. Due to the complex and wide-ranging nature of the issue, COVID-19 related business interruption claims will likely take time to be fully resolved.
Unless otherwise stated, the commentary following refers to the result excluding the impacts of COVID-19.
Operating and financial performance
Underwriting performance
Australia Pacific reported a combined operating ratio of 92.8% 1 compared with 90.0% 1 in 2019.
The underwriting result was impacted by increased catastrophe costs in Australia, coupled with a reduced level of positive prior accident year claims development partly offset by a further improvement in both the attritional and large individual risk claims ratios.
The combined operating ratio of our LMI business increased to 62.3% 1 from 58.3% 1 in 2019. While underlying arrears are broadly stable, more cautious economic assumptions have been incorporated into reserving assumptions through additional risk margin.
The LMI result also included a $60 million provision for COVID-19 which allows for peak unemployment of 8% and average house price declines of 5%.
Gross written premium (US$M)
4,079 6% from 2019 4
Underwriting result 1 (US$M)
260 2
98 from 2019
Insurance profit margin
6.9% 2
2019 13.6%
Combined operating ratio 1
92.8% 2
2019 90.0%
Underwriting result
FOR THE YEAR ENDED 31 DECEMBER 20202020
EX‑COVID 2019 2018 2017
Gross written premium US$M 4,079 4,079 3,920 4,104 4,139Gross earned premium US$M 3,985 3,985 3,885 4,103 4,252Net earned premium US$M 3,625 3,626 3,568 3,758 3,895Net incurred claims US$M 2,479 2,316 2,223 2,310 2,444Net commission US$M 534 534 526 561 548Expenses US$M 572 555 519 542 532Underwriting result US$M 40 221 300 345 371Net claims ratio % 68.4 63.9 62.3 61.5 62.7Net commission ratio % 14.7 14.7 14.8 14.9 14.1Expense ratio % 15.8 15.3 14.5 14.4 13.7Combined operating ratio % 98.9 93.9 91.6 90.8 90.5Adjusted combined operating ratio 1 % 97.8 92.8 90.0 90.3 90.5Insurance profit margin % 2.0 6.9 13.6 13.3 13.81 Excludes impact of changes in risk-free rates used to discount net outstanding claims. 2 Excludes impact of COVID-19.3 Excludes LMI.4 Constant currency basis and excludes impact of 2019 disposals.
Net earned premium (US$M)
3,626 2
3% from 2019 4
QB
E In
suran
ce Gro
up
A
nn
ual R
epo
rt 2020
27O
ther
info
rmatio
n
6
Fin
ancial
Rep
ort
5
Perfo
rman
ce o
verv
iew
1
Op
erating an
d
finan
cial review
2
Go
vern
ance
3
Directo
rs' R
epo
rt
4
Premium income
Gross written premium increased 6% 1 to $4,079 million. This was despite a moderation in pricing and a deterioration in economic conditions, which led to reduced income on lines of business where premiums adjust to turnover and/or payroll.
Renewal premium rate increases averaged 5.4% 2, down from 7.3% 2 in 2019, due to the temporary suspension of premium rate increases to certain small to medium-sized and personal lines customers in response to COVID-19. Premium rate increases recovered to 6.4% 2 in the final quarter of the year as COVID-19 relief initiatives ceased.
Improved retention, coupled with growth in strata, LMI, home and New Zealand, was offset by a reduction in workers’ compensation and CTP, the sale of the travel insurance business and the impact of the economic slowdown on our Pacific Islands business.
In 2020, we launched new home and motor products and re-built our digital front end. Results have surpassed expectations with digital motor and home sales up more than 50% and (nearly) 100% respectively.
Net earned premium increased marginally to $3,626 million, up 3% on a constant currency basis and excluding disposals.
COVID-19 impact
The 2020 ex-COVID-19 result in the table on the preceding page excludes impacts directly attributable to the COVID-19 pandemic. These impacts include $163 million of net claims spanning business interruption, LMI, trade credit and other classes, partly offset by a $70 million
benefit due to a reduction in claims costs across motor, workers’ compensation, aviation and commercial packages. Expenses of $17 million included gift cards which were provided to customers due to reduced motor claims frequency during lockdown.
Claims expense The net claims ratio increased to 62.8% 3 from 60.7% 3 in 2019. A further reduction in the attritional claims ratio was more than offset by an increase in catastrophe claims and a reduced level of positive prior accident year claims development.
The attritional claims ratio improved a further 1.7% to 49.4% 4 as a result of ongoing and targeted pricing increases, coupled with enhanced risk selection and claims management initiatives.
The large individual risk claims ratio improved marginally to 3.5% of net earned premium from 3.7% in 2019, as risk selection and claims management enhancements offset unusual claims severity in CTP.
Net catastrophe costs increased $49 million to 6.7% of net earned premium from 5.4% in 2019, reflecting bushfire, storm and cyclone activity in Australia and flooding in New Zealand.
The underwriting result included $18 million of positive prior accident year claims development or 0.5% of net earned premium compared with $104 million or 2.9% in the prior year. Favourable development, primarily in NSW CTP, commercial property and workers’ compensation, was largely offset by modest strengthening in liability lines and minor adverse development in short-tail classes and New Zealand.
Commission and expenses The net commission ratio reduced slightly to 14.7% from 14.8% in 2019. Growth in strata, which attracts a relatively high commission ratio, was more than offset by lower profit commissions payable as a result of reduced profitability due to higher catastrophe activity.
The expense ratio increased to 15.3% from 14.5% in the prior year. A reduction in staff, project, marketing and travel and entertainment costs was more than offset by higher risk and regulatory costs and a strong performance in NSW CTP, which gave rise to a $61 million profit normalisation charge (transitional excess profits and losses or TEPL).
Gross written premium by class of business Gross earned premium by class of business
2020 %� Commercial & domestic property 39.4
� Motor & motor casualty 25.1
� Public/product liability 8.8
� Financial & credit 6.8
� Agriculture 6.6
� Workers' compensation 5.5
� Marine, energy & aviation 3.3
� Professional indemnity 2.6
� Accident & health 1.8
� Other 0.1
Average renewal premium rate increase 2
5.4%
1.9% from 2019
1 Constant currency basis and excludes impact of 2019 disposals.2 Excludes premium rate changes relating to CTP.3 Excludes impact of changes in risk-free rates used to discount net outstanding claims.4 Excludes LMI.
Combined commission and expense ratio
30.0%
0.7% from 2019
2017
2018
2019
2020 5.4%
7.3%
7.1%
5.9%
2017
2018
2019
2020 30.0%
29.3%
29.3%
27.8%
We continue to support the objectives of the Paris Agreement and the Task Force on Climate-related Financial Disclosures (TCFD) recommendations. This report details our approach to managing climate-related risks and opportunities, including our progress and performance against our Climate Change Action Plan. We will continue to enhance our disclosures in line with the TCFD recommendations over time.
Throughout 2020, we have expanded our analysis across physical, transition and liability risks and opportunities to understand where we could have material exposure and have started to develop appropriate responses. We have also used the analysis to highlight the drivers of the key risks we face.
GovernanceOur climate governance framework clearly defines the roles and responsibilities for effective oversight and management of climate-related risks and opportunities at the Board and senior management levels.
The Board Risk & Capital Committee and the Executive Non-Financial Risk Committee received quarterly reports on environment, social and governance (ESG) issues, including climate change. We have three working groups under the Climate Change Steering Committee to focus our work in the key areas of physical, transition and liability risk. These cross functional groups comprise representatives from our underwriting, finance, investment, risk, sustainability, strategy, reinsurance and product development teams.
Climate change and remunerationA component of our Group Executive Committee’s incentive outcome is determined with reference to the achievement against QBE’s strategic priorities. Priorities are set each year and, in 2020, 35% of the incentive outcome for all members of the Group Executive Committee is determined with reference to performance against these.
Delivery of key sustainability and climate commitments forms part of QBE’s strategic priorities and directly impacts remuneration outcomes.
QBE’s Head of ESG Risk is responsible for identifying and integrating climate-related risks into our risk framework, while QBE’s Head of Environment is responsible for developing and implementing the strategy to address the environmental impacts of our operations. Incentives for both of these roles are significantly impacted by the achievement of relevant performance objectives.
Climate change – our approach to risks
and opportunities
In fulfilling our role to financially protect people and assets, we recognise the material risk climate change poses to our business and are committed to embedding climate-related
risks and opportunities in our decision making.
28
Board
Risk & CapitalClimate-related risk
management
AuditClimate-related
financial reporting
InvestmentClimate-related
investment risks and opportunities
Operations & TechnologyClimate-related
operational risks and opportunities
Group Executive Committee
Accountable for implementation of climate change strategy
Receive and review progress reports
Group Chief Risk Officer
Accountable for embedding
climate-related risk into the Group’s risk
management framework
Group Chief Financial Officer
Accountable for reviewing climate-related
disclosures including TCFD
Group Chief Underwriting Officer
Accountable for embedding
climate-related risks and opportunities within
underwriting decisions
Group Executive, Corporate Affairs
and SustainabilityAccountable for
embedding climate strategy into Company
brand, narrative and engagement
Executive Non-Financial Risk CommitteeAccountable for overseeing the integration of ESG risk into business processes
Head of ESG RiskIntegration of
climate-related risks and opportunities into risk
framework
Group Chief Investment Officer
Integration of climate-related
risks and opportunities into investment strategy
Group Head of Sustainability
Alignment of climate-related
strategy with overall sustainability strategy
External reporting and stakeholder engagement
Head of EnvironmentImplementation of the strategy to minimise the
climate-related impact of our business
operations
ESG Risk CommitteeReviews ESG business policies and strategies, including climate-related policy positions, and provides
recommendations to the Executive Non-Financial Risk Committee for approval
Climate Change Steering CommitteeOversees the identification and management of climate-related risks and opportunities,
reporting and working group activities
Climate governance framework
QB
E In
suran
ce Gro
up
A
nn
ual R
epo
rt 2020
29
Oth
er in
form
ation
6
Fin
ancial
Rep
ort
5
Perfo
rman
ce o
verv
iew
1
Op
erating an
d
finan
cial review
2
Go
vern
ance
3
Directo
rs' R
epo
rt
4
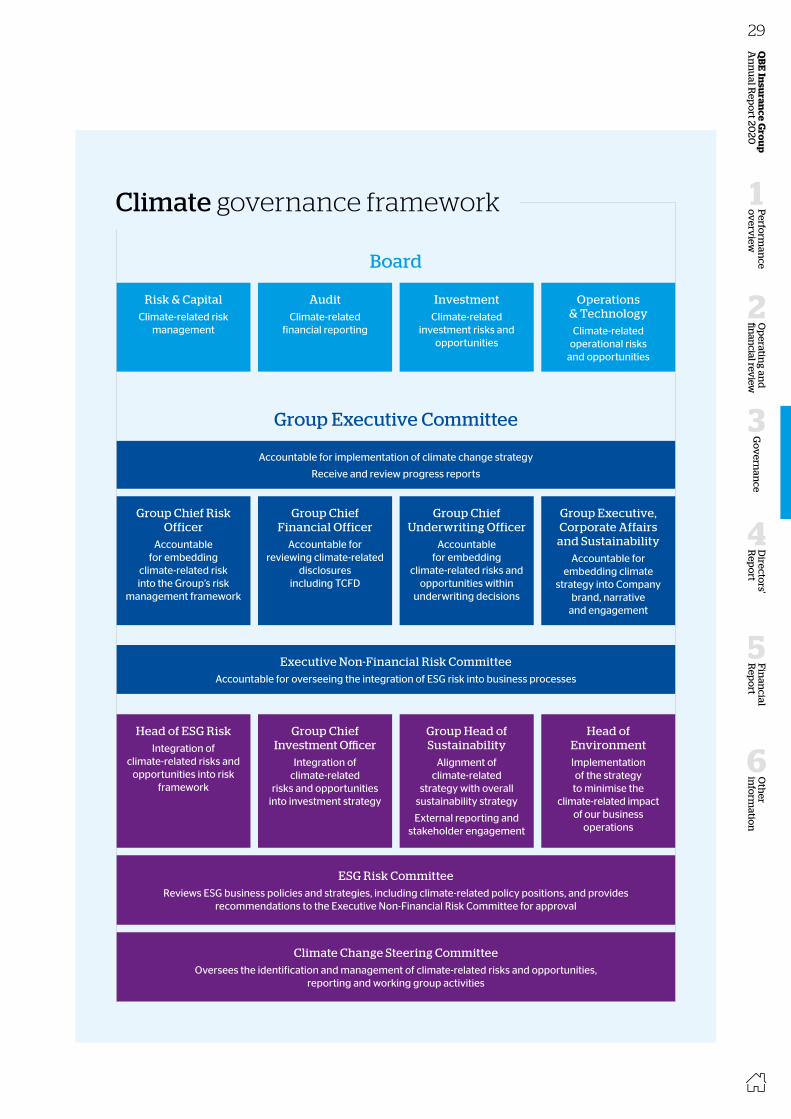
We continue to support the objectives of the Paris Agreement and the Task Force on Climate-related Financial Disclosures (TCFD) recommendations. This report details our approach to managing climate-related risks and opportunities, including our progress and performance against our Climate Change Action Plan. We will continue to enhance our disclosures in line with the TCFD recommendations over time.
Throughout 2020, we have expanded our analysis across physical, transition and liability risks and opportunities to understand where we could have material exposure and have started to develop appropriate responses. We have also used the analysis to highlight the drivers of the key risks we face.
GovernanceOur climate governance framework clearly defines the roles and responsibilities for effective oversight and management of climate-related risks and opportunities at the Board and senior management levels.
The Board Risk & Capital Committee and the Executive Non-Financial Risk Committee received quarterly reports on environment, social and governance (ESG) issues, including climate change. We have three working groups under the Climate Change Steering Committee to focus our work in the key areas of physical, transition and liability risk. These cross functional groups comprise representatives from our underwriting, finance, investment, risk, sustainability, strategy, reinsurance and product development teams.
Climate change and remunerationA component of our Group Executive Committee’s incentive outcome is determined with reference to the achievement against QBE’s strategic priorities. Priorities are set each year and, in 2020, 35% of the incentive outcome for all members of the Group Executive Committee is determined with reference to performance against these.
Delivery of key sustainability and climate commitments forms part of QBE’s strategic priorities and directly impacts remuneration outcomes.
QBE’s Head of ESG Risk is responsible for identifying and integrating climate-related risks into our risk framework, while QBE’s Head of Environment is responsible for developing and implementing the strategy to address the environmental impacts of our operations. Incentives for both of these roles are significantly impacted by the achievement of relevant performance objectives.
Climate change – our approach to risks
and opportunities
In fulfilling our role to financially protect people and assets, we recognise the material risk climate change poses to our business and are committed to embedding climate-related
risks and opportunities in our decision making.
28
Board
Risk & CapitalClimate-related risk
management
AuditClimate-related
financial reporting
InvestmentClimate-related
investment risks and opportunities
Operations & TechnologyClimate-related
operational risks and opportunities
Group Executive Committee
Accountable for implementation of climate change strategy
Receive and review progress reports
Group Chief Risk Officer
Accountable for embedding
climate-related risk into the Group’s risk
management framework
Group Chief Financial Officer
Accountable for reviewing climate-related
disclosures including TCFD
Group Chief Underwriting Officer
Accountable for embedding
climate-related risks and opportunities within
underwriting decisions
Group Executive, Corporate Affairs
and SustainabilityAccountable for
embedding climate strategy into Company
brand, narrative and engagement
Executive Non-Financial Risk CommitteeAccountable for overseeing the integration of ESG risk into business processes
Head of ESG RiskIntegration of
climate-related risks and opportunities into risk
framework
Group Chief Investment Officer
Integration of climate-related
risks and opportunities into investment strategy
Group Head of Sustainability
Alignment of climate-related
strategy with overall sustainability strategy
External reporting and stakeholder engagement
Head of EnvironmentImplementation of the strategy to minimise the
climate-related impact of our business
operations
ESG Risk CommitteeReviews ESG business policies and strategies, including climate-related policy positions, and provides
recommendations to the Executive Non-Financial Risk Committee for approval
Climate Change Steering CommitteeOversees the identification and management of climate-related risks and opportunities,
reporting and working group activities
Climate governance framework
QB
E In
suran
ce Gro
up
A
nn
ual R
epo
rt 2020
29O
ther
info
rmatio
n
6
Fin
ancial
Rep
ort
5
Perfo
rman
ce o
verv
iew
1
Op
erating an
d
finan
cial review
2
Go
vern
ance
3
Directo
rs' R
epo
rt
4
StrategyClimate change is a material financial risk in and of itself, and it can also act as a risk multiplier. For example, prolonged droughts combined with stronger winds are making bushfires in Australia and wildfires in California, and elsewhere, more intense. Coastal windstorms, together with increasing sea levels, may multiply the scale and intensity of damage within a coastal region. Equally, the past may no longer be a good guide to the future; risk models based on historic experience need to be adjusted to allow for the impact of climate change over time.
This represents a challenge where we provide cover for physical loss or damage to assets. It also increases the potential for third party injury and/or damage. Given this, we have spent considerable time over the past two years analysing what the potential impacts of climate change may be from a physical, liability and transition risk perspective and using this analysis to assess the resilience of our strategic responses, improve our underwriting, pricing and business planning, and to set our risk appetite.
Going forward, we will focus our climate-related activities in the following areas:• building resilience for our customers
and communities;• investing towards a net-zero economy;• strategically integrating climate change
risks and opportunities; • aligning our business operations and
people to reduce our footprint and support climate action; and
• being transparent about our governance and performance.
Physical analysisQBE helps customers protect insured assets against threats caused by extreme weather. Consequently, QBE is exposed to risks associated with extreme weather events including the risk of increasing frequency and severity of weather events as the climate continues to change.
The physical impact of climate change is a material risk for QBE. Over the long term, we anticipate that the increased frequency and/or severity of extreme weather events, even under scenarios consistent with the achievement of the Paris Agreement, has the potential to result in increased damage to our customers’ assets and increased claims costs. If these scenarios do eventuate and cause an increase in claims cost, it is likely that insurance premiums may also increase, especially for customers in higher risk areas.
Extreme weather risk has a quantifiable impact on QBE’s financial performance each year. QBE’s incurred net claims for all catastrophe events, including weather-related events, were $688 million, $426 million and $523 million in 2020, 2019 and 2018 respectively.
QBE management devotes significant resources to assessing and managing the extreme weather risk we assume while protecting customers’ assets. We use sophisticated computer simulations to quantify potential natural catastrophe claims, factoring in the current climate and weather (inclusive of the change in climate we have experienced since the start of the industrial revolution).
Claims experience and catastrophe modelling allow us to better understand the risks we are facing and to accurately price each property we insure. A significant portion of our extreme weather risk stems
from perils including cyclones, convective storms, hail, windstorm and floods. While our customers have assets spread across the world, Australia, the United States and Western Europe account for the majority of our weather risk.
To better understand how our extreme weather risk may evolve as the climate continues to change over the next 30+ years, we have partnered with catastrophe modelling vendors Risk Management Solutions, Inc. and AIR Worldwide, and with Aon to enhance our catastrophe models.
Our methodologyWith the help of our partners, we analysed the scientific literature related to the potential impact of climate change on specific perils and regions.
For Australia, we have used scenarios developed by Australia’s leading climate scientists at CSIRO and the Bureau of Meteorology through the Climate Measurement Standard Initiative (CMSI).
Further information on CMSI can be found in Partnerships and Initiatives on page 35.
We have concentrated our analysis on the perils and regions representing over 80% of QBE’s extreme weather exposure as measured by annual average losses.
The perils and regions we have analysed are:• cyclone – Australia, North America• convective storm/hail – Australia,
North America• windstorm – Europe• flood – Australia, Europe.Our analysis has considered risks at 2030, 2050 and 2090.
Our analysis considered two potential scenarios of a temperature increase by 2100 relative to pre-industrial times of:• less than 2°C, low emissions consistent
with Representative Concentration Pathway (RCP) 2.6
• greater than 2°C (3.2°C to 5.4°C), high emissions consistent with RCP 8.5
QBE is committed to supporting the objectives of the Paris Agreement; however, we recognise that the greater risk for our business is under a high emissions scenario and we want to understand the potential impacts of this pathway.
We recalibrated our catastrophe models to reflect the potential change indicated by scientific literature in order to estimate annual average losses under each scenario. These scenarios do not represent forecasts of the impact of climate change, and instead are indicative of the potential outcomes assuming the scenario occurs. Our analysis assumes no changes to our portfolio of risks over time, no change in vulnerability of assets through improvements in resilience and no changes in cover provided.
What did we find?The impact of climate change will differ across specific perils/regions Our analysis showed that the impact of climate change will differ significantly across the catastrophe perils and the regions we studied. From the perils/regions studied so far, flood claims in Europe potentially could be the most impacted, while cyclones and convective storms may take a little longer (mid-century) before the impact of climate change becomes more significant.
30
There is a significant level of uncertainty regarding the localised impact of climate changeWe found during our review of scientific literature that most of the climate change research and modelling are of a global nature and subject to significant uncertainty associated with: whether or not concerted global efforts are taken to achieve the scenario; the range of possible temperature outcomes under each scenario; the behaviour of perils in each region under each scenario; the year-on-year natural variability of each peril; and the estimation of claims costs under each scenario given the inherent approximation of each model. Further, there is additional uncertainty in resolving the impact of perils at a local address level for underwriting and pricing risks. To understand the impact on our claims cost, we need to understand the local impact of climate change on specific perils. Given those limitations, predictions of the local impact of climate change is subject to much more uncertainty than predictions of the global impact.
The greenhouse gas concentration pathway will impact future catastrophe claimsHigher greenhouse gas emissions will result in significant increases in annual average losses expected in 2050 and 2090, with less impact on costs in 2030.
In the short term, the overall impact of climate change may be difficult to discern from the normal volatility of catastrophe eventsOur analysis generally indicates that changes in claims related to climate change over the next 10 years will be less than the expected annual variability in natural catastrophe losses. There are minimal impacts to most of the perils and
regions we studied, through to 2030, with the exception of flood in Europe and Australia which could potentially see up to a 25% increase in annual average losses under a high emissions scenario.
Factors such as distance between our accumulations of insured properties and the locations of severe weather events, and the wide variation of intensity and footprints of such events, result in a large range of potential catastrophe claims even under stable climate assumptions. This will make assessing the impact of climate from observing claims information more difficult. It is likely to take 10 to 30 years before our actual claims experience confirms our climate change analysis. This lag gives us time to adapt our products and services, but also makes it very important to continue to refine our analysis to better anticipate future fluctuations of claims.
In the medium term, greater divergence starts to show between the high and low emissions scenarios across all perils and regions
By 2050, the impact of climate change under a high emissions scenario starts to rise more noticeably across all perils/regions. Flood continues to be the biggest driver of claims, followed by cyclone in North America.
In the long term, there is potential for climate change to impact certain perils/regions very significantlyDue to climate change, some of our product offerings may have to be adjusted to continue to be commercially viable while still meeting the evolving needs of our customers. Our analysis illustrated the potential for large increases in claims in specific perils and
regions by 2090. The impact under a low emissions scenario is not much greater in 2090 than in 2030. However, under a high emissions scenario the impact is considerable with the most affected perils/regions being flood in Europe and Australia, and cyclone in North America.
Importantly, we will continue to monitor the evolving scientific literature to maintain the best possible understanding of the potential impact of climate change on our products and our customers and to use this information to evolve our product offerings to better serve our customers, our shareholders, and the communities in which we operate.
How are we responding?Following the conclusion of the analysis, we integrated the results into our catastrophe accumulation management process to enable us to consider the impact of climate change on other areas related to catastrophe risk.
In the short term, QBE will manage natural catastrophe claim volatility by considering a wide range of event frequency and severity scenarios in our capital planning, and by purchasing a comprehensive Group catastrophe reinsurance program.
Over the longer term, we will continue to engage with external stakeholders, including governments, to encourage adaptation including the adoption of resilience measures against weather-related events.
In 2021, we intend exploring bushfire scenario analysis, particularly for Australia and the United States. We will further utilise the scenario analysis results in our strategic business planning and portfolio monitoring.
Helping American farmersIn 2020, working with the Federal Crop Insurance Corporation, we launched the first ever Enhanced Coverage Option (ECO) for crop insurance, to help American farmers with crop damage or poor farming conditions as a result of extreme weather conditions. The ECO is an area-based coverage which can reduce a farmer’s loss retention from 15% to 5% or 10% of expected crop value. The ECO is expected to be available on over 30 crops beginning in 2021, with more to follow in 2022 and beyond.
QB
E In
suran
ce Gro
up
A
nn
ual R
epo
rt 2020
31
Oth
er in
form
ation
6
Fin
ancial
Rep
ort
5
Perfo
rman
ce o
verv
iew
1
Op
erating an
d
finan
cial review
2
Go
vern
ance
3
Directo
rs' R
epo
rt
4

StrategyClimate change is a material financial risk in and of itself, and it can also act as a risk multiplier. For example, prolonged droughts combined with stronger winds are making bushfires in Australia and wildfires in California, and elsewhere, more intense. Coastal windstorms, together with increasing sea levels, may multiply the scale and intensity of damage within a coastal region. Equally, the past may no longer be a good guide to the future; risk models based on historic experience need to be adjusted to allow for the impact of climate change over time.
This represents a challenge where we provide cover for physical loss or damage to assets. It also increases the potential for third party injury and/or damage. Given this, we have spent considerable time over the past two years analysing what the potential impacts of climate change may be from a physical, liability and transition risk perspective and using this analysis to assess the resilience of our strategic responses, improve our underwriting, pricing and business planning, and to set our risk appetite.
Going forward, we will focus our climate-related activities in the following areas:• building resilience for our customers
and communities;• investing towards a net-zero economy;• strategically integrating climate change
risks and opportunities; • aligning our business operations and
people to reduce our footprint and support climate action; and
• being transparent about our governance and performance.
Physical analysisQBE helps customers protect insured assets against threats caused by extreme weather. Consequently, QBE is exposed to risks associated with extreme weather events including the risk of increasing frequency and severity of weather events as the climate continues to change.
The physical impact of climate change is a material risk for QBE. Over the long term, we anticipate that the increased frequency and/or severity of extreme weather events, even under scenarios consistent with the achievement of the Paris Agreement, has the potential to result in increased damage to our customers’ assets and increased claims costs. If these scenarios do eventuate and cause an increase in claims cost, it is likely that insurance premiums may also increase, especially for customers in higher risk areas.
Extreme weather risk has a quantifiable impact on QBE’s financial performance each year. QBE’s incurred net claims for all catastrophe events, including weather-related events, were $688 million, $426 million and $523 million in 2020, 2019 and 2018 respectively.
QBE management devotes significant resources to assessing and managing the extreme weather risk we assume while protecting customers’ assets. We use sophisticated computer simulations to quantify potential natural catastrophe claims, factoring in the current climate and weather (inclusive of the change in climate we have experienced since the start of the industrial revolution).
Claims experience and catastrophe modelling allow us to better understand the risks we are facing and to accurately price each property we insure. A significant portion of our extreme weather risk stems
from perils including cyclones, convective storms, hail, windstorm and floods. While our customers have assets spread across the world, Australia, the United States and Western Europe account for the majority of our weather risk.
To better understand how our extreme weather risk may evolve as the climate continues to change over the next 30+ years, we have partnered with catastrophe modelling vendors Risk Management Solutions, Inc. and AIR Worldwide, and with Aon to enhance our catastrophe models.
Our methodologyWith the help of our partners, we analysed the scientific literature related to the potential impact of climate change on specific perils and regions.
For Australia, we have used scenarios developed by Australia’s leading climate scientists at CSIRO and the Bureau of Meteorology through the Climate Measurement Standard Initiative (CMSI).
Further information on CMSI can be found in Partnerships and Initiatives on page 35.
We have concentrated our analysis on the perils and regions representing over 80% of QBE’s extreme weather exposure as measured by annual average losses.
The perils and regions we have analysed are:• cyclone – Australia, North America• convective storm/hail – Australia,
North America• windstorm – Europe• flood – Australia, Europe.Our analysis has considered risks at 2030, 2050 and 2090.
Our analysis considered two potential scenarios of a temperature increase by 2100 relative to pre-industrial times of:• less than 2°C, low emissions consistent
with Representative Concentration Pathway (RCP) 2.6
• greater than 2°C (3.2°C to 5.4°C), high emissions consistent with RCP 8.5
QBE is committed to supporting the objectives of the Paris Agreement; however, we recognise that the greater risk for our business is under a high emissions scenario and we want to understand the potential impacts of this pathway.
We recalibrated our catastrophe models to reflect the potential change indicated by scientific literature in order to estimate annual average losses under each scenario. These scenarios do not represent forecasts of the impact of climate change, and instead are indicative of the potential outcomes assuming the scenario occurs. Our analysis assumes no changes to our portfolio of risks over time, no change in vulnerability of assets through improvements in resilience and no changes in cover provided.
What did we find?The impact of climate change will differ across specific perils/regions Our analysis showed that the impact of climate change will differ significantly across the catastrophe perils and the regions we studied. From the perils/regions studied so far, flood claims in Europe potentially could be the most impacted, while cyclones and convective storms may take a little longer (mid-century) before the impact of climate change becomes more significant.
30
There is a significant level of uncertainty regarding the localised impact of climate changeWe found during our review of scientific literature that most of the climate change research and modelling are of a global nature and subject to significant uncertainty associated with: whether or not concerted global efforts are taken to achieve the scenario; the range of possible temperature outcomes under each scenario; the behaviour of perils in each region under each scenario; the year-on-year natural variability of each peril; and the estimation of claims costs under each scenario given the inherent approximation of each model. Further, there is additional uncertainty in resolving the impact of perils at a local address level for underwriting and pricing risks. To understand the impact on our claims cost, we need to understand the local impact of climate change on specific perils. Given those limitations, predictions of the local impact of climate change is subject to much more uncertainty than predictions of the global impact.
The greenhouse gas concentration pathway will impact future catastrophe claimsHigher greenhouse gas emissions will result in significant increases in annual average losses expected in 2050 and 2090, with less impact on costs in 2030.
In the short term, the overall impact of climate change may be difficult to discern from the normal volatility of catastrophe eventsOur analysis generally indicates that changes in claims related to climate change over the next 10 years will be less than the expected annual variability in natural catastrophe losses. There are minimal impacts to most of the perils and
regions we studied, through to 2030, with the exception of flood in Europe and Australia which could potentially see up to a 25% increase in annual average losses under a high emissions scenario.
Factors such as distance between our accumulations of insured properties and the locations of severe weather events, and the wide variation of intensity and footprints of such events, result in a large range of potential catastrophe claims even under stable climate assumptions. This will make assessing the impact of climate from observing claims information more difficult. It is likely to take 10 to 30 years before our actual claims experience confirms our climate change analysis. This lag gives us time to adapt our products and services, but also makes it very important to continue to refine our analysis to better anticipate future fluctuations of claims.
In the medium term, greater divergence starts to show between the high and low emissions scenarios across all perils and regions
By 2050, the impact of climate change under a high emissions scenario starts to rise more noticeably across all perils/regions. Flood continues to be the biggest driver of claims, followed by cyclone in North America.
In the long term, there is potential for climate change to impact certain perils/regions very significantlyDue to climate change, some of our product offerings may have to be adjusted to continue to be commercially viable while still meeting the evolving needs of our customers. Our analysis illustrated the potential for large increases in claims in specific perils and
regions by 2090. The impact under a low emissions scenario is not much greater in 2090 than in 2030. However, under a high emissions scenario the impact is considerable with the most affected perils/regions being flood in Europe and Australia, and cyclone in North America.
Importantly, we will continue to monitor the evolving scientific literature to maintain the best possible understanding of the potential impact of climate change on our products and our customers and to use this information to evolve our product offerings to better serve our customers, our shareholders, and the communities in which we operate.
How are we responding?Following the conclusion of the analysis, we integrated the results into our catastrophe accumulation management process to enable us to consider the impact of climate change on other areas related to catastrophe risk.
In the short term, QBE will manage natural catastrophe claim volatility by considering a wide range of event frequency and severity scenarios in our capital planning, and by purchasing a comprehensive Group catastrophe reinsurance program.
Over the longer term, we will continue to engage with external stakeholders, including governments, to encourage adaptation including the adoption of resilience measures against weather-related events.
In 2021, we intend exploring bushfire scenario analysis, particularly for Australia and the United States. We will further utilise the scenario analysis results in our strategic business planning and portfolio monitoring.
Helping American farmersIn 2020, working with the Federal Crop Insurance Corporation, we launched the first ever Enhanced Coverage Option (ECO) for crop insurance, to help American farmers with crop damage or poor farming conditions as a result of extreme weather conditions. The ECO is an area-based coverage which can reduce a farmer’s loss retention from 15% to 5% or 10% of expected crop value. The ECO is expected to be available on over 30 crops beginning in 2021, with more to follow in 2022 and beyond.
QB
E In
suran
ce Gro
up
A
nn
ual R
epo
rt 2020
31O
ther
info
rmatio
n
6
Fin
ancial
Rep
ort
5
Perfo
rman
ce o
verv
iew
1
Op
erating an
d
finan
cial review
2
Go
vern
ance
3
Directo
rs' R
epo
rt
4
Transition analysis
Scenario analysisDuring 2020, we have undertaken scenario analysis to understand the impact of the transition to a low carbon economy on our business. We worked with Planetrics, a Vivid Economics company, to understand sectoral trends to 2030 and 2050, which we can use to inform our strategic positioning over the coming years. The analysis is based on the Network for Greening the Financial System Orderly and Disorderly scenarios (REMIND model) and the Inevitable Policy Response Forecast Policy Scenario. All three scenarios are consistent with keeping the increase in global temperatures to below 2°C. The scenarios are expressed relative to a baseline of current policies (3–4°C).
The sectors most impacted by 2030 and 2050 by the transition to a low carbon economy include fossil fuel production and transport. As the economy decarbonises, demand for oil and gas, and internal combustion engine vehicles declines, and transport service providers face rising carbon costs on their emissions. The utilities sector experiences a high variation in impact, with low carbon utilities benefiting from rising demand for low carbon electricity and high carbon utilities facing rising carbon costs. Within the transport sector, air transportation is most affected, with passenger road and rail transportation least affected due to the relative availability of low cost electric alternatives.
Significant growth is expected in demand for green products and inputs such as electric vehicles, copper, battery materials and renewable energy equipment.
For each scenario, we have focused on the impact (by profit) on the most material sectors for our underwriting and investment portfolios. The results show that transition risk is low for the majority of our business. Our exposure to high transition risk sectors is low. For some of the more affected sectors, we have started to respond through progressing our policy positions, engaging with our customers and undertaking due diligence.
UnderwritingThe top three sectors that our underwriting business is exposed to (by gross written premium) are construction, real estate and professional services. Across all three scenarios, by 2030, the impact of the climate transition to these sectors is expected to be modest (up to -1%), although individual corporates in these sectors could be more materially affected on both the upside and downside.
InvestmentThe top three sectors we are exposed to (by investment value) through our corporate credit portfolio are financial services, health and pharmaceuticals, and communications. Across all three scenarios, by 2030, the impact of the climate transition to these sectors is expected to be modest.
Paris Agreement Capital Transition Assessment In 2020, we again completed transition analysis for our corporate credit portfolio at both the divisional and Group level using the Paris Agreement Capital Transition Assessment (PACTA) tool.
We used the Sustainable Development Scenario, which is an economic transition scenario consistent with limiting global warming to 2°C above pre-industrial levels. The PACTA tool analysis focuses on the fossil fuel, power and automotive sectors. Currently, less than 3% of the Group’s corporate credit portfolio is exposed to activities across these three sectors and this includes exposure to both high carbon (e.g. fossil fuels) and low carbon (e.g. renewables, electric vehicles) activities. We currently have no exposure to fossil fuel production.
Transition stress test In 2020, as part of an independent review of the strategic asset allocation of our investment portfolio, we undertook a climate transition stress test. Two scenarios were considered – one consistent with a 2°C pathway and one consistent with a 4°C pathway. The results found that the investment portfolio, over a five year timeframe, is likely to perform slightly better (less than 1%) under a 2°C pathway, and likely to experience minor negative returns (less than 1%) under a 4°C pathway, relative to the baseline. Overall, the portfolio is well positioned for climate transition.
Supporting the transition to a low carbon economy
Renewable energy underwritingQBE has a longstanding role in the energy business, insuring customers that support global energy markets from a diverse number of sources. In 2020, we are proud to have supported the insurance of the Dogger Bank Project, a joint-venture project by two of our customers, Equinor and SSE. Dogger Bank wind farm is an offshore wind farm being developed in three phases and is located off the north east coast of England. Collectively, it will become the world’s largest offshore wind farm and will have an installed capacity of up to 3.6GW and will be capable of powering up to 4.5 million homes. Overall, in 2020, we have increased gross written premium from renewable energy by around 50% to $33 million.
Investing in Australia’s first climate, equity-linked green bond QBE collaborated with BNP Paribas, the Clean Energy Finance Corporation and Aware Super to invest in Australia’s first climate equity‑linked bond. The eight-year BNP Equity-Linked Green Bond has a fixed coupon component and a variable component to the return. The variable portion is linked to a forward-looking climate index called the Australian Climate Transition Index, meaning that QBE is aligning capital and returns towards companies expected to perform better in the transition to a low carbon economy.
Premiums4GoodIn 2020, QBE extended the ambition to grow impact investments to $2 billion by 2025. Premiums4Good has grown to 68 securities and $1.1 billion in portfolio value as at 31 December 2020. Consistent with our commitment to positive opportunities in relation to climate risk, more than $641 million is invested in environmental impact areas.
32
Investment managementQBE manages a multi-asset, multi-currency investment portfolio. Our fixed income portfolio, of which the majority is corporate credit, represents 93% of our total investment assets at 31 December 2020 and is mostly managed directly using in-house portfolio managers and analysts. Growth assets comprise the remaining 7% of our investment assets, and we mostly use external investment managers and passive index vehicles to access a variety of asset classes.
Carbon footprint of corporate credit portfolioCarbon footprinting reflects our exposure to carbon intensive issuers. As at 31 December 2020, the weighted average carbon intensity of the corporate credit portfolio was 18 tCO2-e/$M sales. This is considered to be in MSCI’s low carbon risk category and our intent is to maintain a low level. The MSCI World Index is shown below as a relative comparison to the QBE corporate credit portfolio.
18 tCO
2-e/$M
sales
QBE corporate credit portfolio as at 31 December 2020
162 tCO
2-e/$M
sales
MSCI World Index as at 30 April 2020
Unlisted property funds – physical risk exposureOver the past year, we leveraged our catastrophe models to analyse the exposure of our investments in unlisted property funds to physical climate risks. Our initial analysis considered our top 157 properties across the funds (by property value) located in the United States, Europe and Australia, as these are the regions for which we have future climate scenario analysis embedded in our models. The findings showed that there are no significant aggregations of properties in the portfolio, which reduces the likelihood of large catastrophe claims. Over the next 10 years, climate change is not expected to meaningfully influence the value of the properties assessed. By 2050, exposure to windstorm, severe convective storm and flood perils is expected to increase more noticeably (for all RCP scenarios).
QBE investment portfolio commits to net zero emissions by 2050In 2020, we committed to achieving net zero emissions by 2050 in our investment portfolio and became the first Australian-headquartered insurance business to join the UN-convened Net-Zero Asset Owner Alliance. Joining the Alliance means QBE will take into account the best available scientific knowledge and collaborate with other global institutional investors on developing standard industry frameworks.
Over the coming years, we will explore strategies and approaches to align our investment portfolio with the objective of the Paris Agreement to be net zero emissions by 2050, including setting and communicating our interim targets.
Liability analysisIn 2020, we undertook a detailed analysis of climate change litigation including considering climate liability risk from two different perspectives: we analysed US-based climate-related litigation cases to better understand our potential exposure, and we commenced analysis of specific liability scenarios in relation to our liabilities.
We completed a detailed analysis of all climate-related litigation cases in the United States (from 1986 to 2020), with a particular focus on industry, defendant, jurisdiction and damages sought. Based on these criteria, the analysis helped to identify our potential exposure, how our policies may respond and how we might mitigate this exposure to prospective future litigation. In 2021, we plan to complete analysis for non-US litigation and we will continue to monitor new cases and types of coverage we offer.
The litigation landscape continues to evolve as plaintiffs find new and innovative ways to bring climate-related litigation cases to the courts. This analysis will therefore be an ongoing consideration, with interpretation varying by policy wordings in place.
During 2020, we also engaged an external modelling consultant, Arium, which has developed a casualty analytics platform. This platform contains a large database of casualty scenarios which is being used to specify scenarios to quantify our exposures to remote yet plausible climate scenarios. To support this analysis, QBE has grouped liability exposures, for example by industry sector and by product, and a working group has been formed to identify and develop these scenarios for testing to increase our understanding of liability-related climate risks.
QB
E In
suran
ce Gro
up
A
nn
ual R
epo
rt 2020
33
Oth
er in
form
ation
6
Fin
ancial
Rep
ort
5
Perfo
rman
ce o
verv
iew
1
Op
erating an
d
finan
cial review
2
Go
vern
ance
3
Directo
rs' R
epo
rt
4
Transition analysis
Scenario analysisDuring 2020, we have undertaken scenario analysis to understand the impact of the transition to a low carbon economy on our business. We worked with Planetrics, a Vivid Economics company, to understand sectoral trends to 2030 and 2050, which we can use to inform our strategic positioning over the coming years. The analysis is based on the Network for Greening the Financial System Orderly and Disorderly scenarios (REMIND model) and the Inevitable Policy Response Forecast Policy Scenario. All three scenarios are consistent with keeping the increase in global temperatures to below 2°C. The scenarios are expressed relative to a baseline of current policies (3–4°C).
The sectors most impacted by 2030 and 2050 by the transition to a low carbon economy include fossil fuel production and transport. As the economy decarbonises, demand for oil and gas, and internal combustion engine vehicles declines, and transport service providers face rising carbon costs on their emissions. The utilities sector experiences a high variation in impact, with low carbon utilities benefiting from rising demand for low carbon electricity and high carbon utilities facing rising carbon costs. Within the transport sector, air transportation is most affected, with passenger road and rail transportation least affected due to the relative availability of low cost electric alternatives.
Significant growth is expected in demand for green products and inputs such as electric vehicles, copper, battery materials and renewable energy equipment.
For each scenario, we have focused on the impact (by profit) on the most material sectors for our underwriting and investment portfolios. The results show that transition risk is low for the majority of our business. Our exposure to high transition risk sectors is low. For some of the more affected sectors, we have started to respond through progressing our policy positions, engaging with our customers and undertaking due diligence.
UnderwritingThe top three sectors that our underwriting business is exposed to (by gross written premium) are construction, real estate and professional services. Across all three scenarios, by 2030, the impact of the climate transition to these sectors is expected to be modest (up to -1%), although individual corporates in these sectors could be more materially affected on both the upside and downside.
InvestmentThe top three sectors we are exposed to (by investment value) through our corporate credit portfolio are financial services, health and pharmaceuticals, and communications. Across all three scenarios, by 2030, the impact of the climate transition to these sectors is expected to be modest.
Paris Agreement Capital Transition Assessment In 2020, we again completed transition analysis for our corporate credit portfolio at both the divisional and Group level using the Paris Agreement Capital Transition Assessment (PACTA) tool.
We used the Sustainable Development Scenario, which is an economic transition scenario consistent with limiting global warming to 2°C above pre-industrial levels. The PACTA tool analysis focuses on the fossil fuel, power and automotive sectors. Currently, less than 3% of the Group’s corporate credit portfolio is exposed to activities across these three sectors and this includes exposure to both high carbon (e.g. fossil fuels) and low carbon (e.g. renewables, electric vehicles) activities. We currently have no exposure to fossil fuel production.
Transition stress test In 2020, as part of an independent review of the strategic asset allocation of our investment portfolio, we undertook a climate transition stress test. Two scenarios were considered – one consistent with a 2°C pathway and one consistent with a 4°C pathway. The results found that the investment portfolio, over a five year timeframe, is likely to perform slightly better (less than 1%) under a 2°C pathway, and likely to experience minor negative returns (less than 1%) under a 4°C pathway, relative to the baseline. Overall, the portfolio is well positioned for climate transition.
Supporting the transition to a low carbon economy
Renewable energy underwritingQBE has a longstanding role in the energy business, insuring customers that support global energy markets from a diverse number of sources. In 2020, we are proud to have supported the insurance of the Dogger Bank Project, a joint-venture project by two of our customers, Equinor and SSE. Dogger Bank wind farm is an offshore wind farm being developed in three phases and is located off the north east coast of England. Collectively, it will become the world’s largest offshore wind farm and will have an installed capacity of up to 3.6GW and will be capable of powering up to 4.5 million homes. Overall, in 2020, we have increased gross written premium from renewable energy by around 50% to $33 million.
Investing in Australia’s first climate, equity-linked green bond QBE collaborated with BNP Paribas, the Clean Energy Finance Corporation and Aware Super to invest in Australia’s first climate equity‑linked bond. The eight-year BNP Equity-Linked Green Bond has a fixed coupon component and a variable component to the return. The variable portion is linked to a forward-looking climate index called the Australian Climate Transition Index, meaning that QBE is aligning capital and returns towards companies expected to perform better in the transition to a low carbon economy.
Premiums4GoodIn 2020, QBE extended the ambition to grow impact investments to $2 billion by 2025. Premiums4Good has grown to 68 securities and $1.1 billion in portfolio value as at 31 December 2020. Consistent with our commitment to positive opportunities in relation to climate risk, more than $641 million is invested in environmental impact areas.
32
Investment managementQBE manages a multi-asset, multi-currency investment portfolio. Our fixed income portfolio, of which the majority is corporate credit, represents 93% of our total investment assets at 31 December 2020 and is mostly managed directly using in-house portfolio managers and analysts. Growth assets comprise the remaining 7% of our investment assets, and we mostly use external investment managers and passive index vehicles to access a variety of asset classes.
Carbon footprint of corporate credit portfolioCarbon footprinting reflects our exposure to carbon intensive issuers. As at 31 December 2020, the weighted average carbon intensity of the corporate credit portfolio was 18 tCO2-e/$M sales. This is considered to be in MSCI’s low carbon risk category and our intent is to maintain a low level. The MSCI World Index is shown below as a relative comparison to the QBE corporate credit portfolio.
18 tCO
2-e/$M
sales
QBE corporate credit portfolio as at 31 December 2020
162 tCO
2-e/$M
sales
MSCI World Index as at 30 April 2020
Unlisted property funds – physical risk exposureOver the past year, we leveraged our catastrophe models to analyse the exposure of our investments in unlisted property funds to physical climate risks. Our initial analysis considered our top 157 properties across the funds (by property value) located in the United States, Europe and Australia, as these are the regions for which we have future climate scenario analysis embedded in our models. The findings showed that there are no significant aggregations of properties in the portfolio, which reduces the likelihood of large catastrophe claims. Over the next 10 years, climate change is not expected to meaningfully influence the value of the properties assessed. By 2050, exposure to windstorm, severe convective storm and flood perils is expected to increase more noticeably (for all RCP scenarios).
QBE investment portfolio commits to net zero emissions by 2050In 2020, we committed to achieving net zero emissions by 2050 in our investment portfolio and became the first Australian-headquartered insurance business to join the UN-convened Net-Zero Asset Owner Alliance. Joining the Alliance means QBE will take into account the best available scientific knowledge and collaborate with other global institutional investors on developing standard industry frameworks.
Over the coming years, we will explore strategies and approaches to align our investment portfolio with the objective of the Paris Agreement to be net zero emissions by 2050, including setting and communicating our interim targets.
Liability analysisIn 2020, we undertook a detailed analysis of climate change litigation including considering climate liability risk from two different perspectives: we analysed US-based climate-related litigation cases to better understand our potential exposure, and we commenced analysis of specific liability scenarios in relation to our liabilities.
We completed a detailed analysis of all climate-related litigation cases in the United States (from 1986 to 2020), with a particular focus on industry, defendant, jurisdiction and damages sought. Based on these criteria, the analysis helped to identify our potential exposure, how our policies may respond and how we might mitigate this exposure to prospective future litigation. In 2021, we plan to complete analysis for non-US litigation and we will continue to monitor new cases and types of coverage we offer.
The litigation landscape continues to evolve as plaintiffs find new and innovative ways to bring climate-related litigation cases to the courts. This analysis will therefore be an ongoing consideration, with interpretation varying by policy wordings in place.
During 2020, we also engaged an external modelling consultant, Arium, which has developed a casualty analytics platform. This platform contains a large database of casualty scenarios which is being used to specify scenarios to quantify our exposures to remote yet plausible climate scenarios. To support this analysis, QBE has grouped liability exposures, for example by industry sector and by product, and a working group has been formed to identify and develop these scenarios for testing to increase our understanding of liability-related climate risks.
QB
E In
suran
ce Gro
up
A
nn
ual R
epo
rt 2020
33O
ther
info
rmatio
n
6
Fin
ancial
Rep
ort
5
Perfo
rman
ce o
verv
iew
1
Op
erating an
d
finan
cial review
2
Go
vern
ance
3
Directo
rs' R
epo
rt
4

Risk managementClimate-related risk is a type of strategic risk which we identify, assess and manage using our enterprise risk management framework and ESG business practices. Climate-related risk is also implicitly considered within the insurance, credit, market, liquidity and operational risk classes.
For further detail on how sustainability, including climate change, is integrated into risk management, refer to the Sustainable Insurance section of QBE’s 2020 Sustainability Report at www.qbe.com/sustainability.
Environmental and social risk frameworkIn 2020, we developed an environmental and social (E&S) risk framework to help us identify and mitigate risks to our underwriting and investment portfolios. The following issues and sectors are included in the E&S risk framework:• biodiversity and protected areas• forestry• fishing• defence
– controversial weapons– firearms
• energy– coal– oil sands and Arctic drilling– oil and gas
• mining; and• large-scale hydropower dams.
The E&S risk framework, which will be fully implemented by 1 January 2022, was developed to promote informed decision making that is consistent with our commitment to sustainable insurance and investment. In line with our United Nations Environment Programme Finance Initiative (UNEP FI) Principles for Sustainable Insurance (PSI) and Principles for Responsible Investment (PRI) commitments, the E&S risk framework further supports the integration of ESG considerations into our underwriting and investment and increases transparency with customers.
The E&S risk framework is available here: www.qbe.com/investor-relations/corporate-governance/global-policies.
Regulatory oversight of climate change riskFollowing the release of the United Kingdom’s Prudential Regulation Authority (PRA) Supervisory Statement SS3/19 in 2019, QBE developed a roadmap for meeting its requirements which has been approved by the board of our European operations and submitted to the PRA. In QBE’s European operations, the Chief Risk Officer is approved by the PRA as the accountable senior executive under the Senior Managers Regime. A European climate risk working group has also been established to support the Chief Risk Officer with meeting our roadmap commitments. Reporting on roadmap implementation progress to the European Risk and Capital Committee takes place on a quarterly basis.
To raise awareness and support delivery of the roadmap, a townhall meeting was held in 2020 attended by over 100 underwriting staff in Europe. The session provided appropriate context regarding the UK PRA SS3/19 requirements and QBE’s roadmap, and guidance on how to identify potential exposures and develop underwriting strategies in response.
QBE remains on track to fulfil all of its regulatory climate risk obligations. We anticipate that over time these requirements will become increasingly prevalent in a growing number of jurisdictions.
Metrics and targetsWe continue to evolve our climate-related metrics and targets. Our aim is to establish metrics and targets that are relevant and reliable, and that will drive performance and transparency against our climate-related goals. During 2020, we have maintained our carbon neutrality and achieved our energy use, air travel and science-based emission reduction targets ahead of time. While COVID-19 had a substantial impact on our business operations and target performance, we expect to achieve our 2021 targets when we return to a more normal operating environment in 2021.
In 2020 we committed to achieving net zero emissions by 2050 in our investment portfolio. Over the coming years we will set interim targets and progress against these targets will be included as part of our annual reporting.
Our climate-related metrics and targets are presented below:
MEASURE TARGET 2019 2020 STATUS
Energy use (GJ) 15% reduction by 2021 (from 2018 levels)
153,296 (-14%) 122,115 (-32%) Achieved
Scope 1 & 2 emissions (1.5°C trajectory aligned science-based target) (tCO2-e)
30% reduction by 2025 (from 2018 levels)
12,772 (-57%) 5,881 (-80%) Achieved
Renewable electricity use (MWh) 100% by 2025 18,876 (63%) 22,529 (97%) On track
Air travel (tCO2-e) 20% reduction by 2021 (from 2017 levels)
12,160 (-31%) 2,717 (-85%) Achieved
Impact investing ambition $2 billion by 2025 $663 million $1.1 billion On track
Investment portfolio emissions Net zero emissions in investment portfolio by 2050
N/A N/A Ongoing
34
Partnerships and initiatives
We are actively involved in a range of initiatives including:• Actuaries Institute Climate Change Working Group• Australian Sustainable Finance Initiative• CDP• ClimateWise• Investor Group on Climate Change
• RE100• UN-convened Net-Zero Asset Owners Alliance • UNEP FI PRI• UNEP FI PSI
For further detail on our collaboration on climate change, sustainable finance and resilience, refer to QBE’s 2020 Sustainability Report at www.qbe.com/sustainability.
UNEP FI insurance pilotQBE, along with 22 other global reinsurers and insurers, has been part of the UNEP FI’s PSI Initiative to pilot the TCFD recommendations for insurance portfolios. The aim of the initiative is to contribute to the development of consistent and transparent analytical approaches that can be used to identify, assess and disclose climate change-related risks and opportunities. The initiative has covered physical, transition and liability risks and opportunities. QBE has been a member of the working group looking at transition risk in the property sector in Australia, which developed a model to assess the risk which we aim to pilot in 2021. We have also been a member of the litigation working group, which complemented our internal analysis on climate-related liability risk.
The report is available here: www.unepfi.org/psi/wp-content/uploads/2021/01/PSI-TCFD-final-report.pdf.
DISCLOSURE INSIGHT ACTION
CDPOur climate-related progress has been externally recognised, with our CDP score moving from a ‘B’ to ‘A-’ in 2020, putting us in the Leadership band. Areas of highest performance include governance, business strategy and planning, risk management processes, scope 1 and 2 emissions, and value chain engagement. CDP runs a global disclosure system accessed by 515 investors with $106 trillion in assets under management that assesses our awareness of climate change issues, management methods and progress towards action taken on climate change.
Climate Measurement Standards InitiativeQBE, in collaboration with banks, insurers and asset owners, has been actively involved in the CMSI, which has developed standards for assessing climate physical risk projections of damage to property in Australia. The CMSI has delivered two reports with recommendations on:• disclosure – guidance to the financial services industry on disclosing scenario analyses
under the recommendations of the TCFD; and • science – scenario specifications for physical risk for Australia. These specifications are
based on the latest scientific research on the impact of climate change on tropical cyclones, floods, storms, bushfires and other extreme events.
The reports are available here: www.cmsi.org.au/reports.
Insurance Council of Australia – Climate Change Action CommitteeQBE is a member of the Insurance Council of Australia’s Climate Change Action Committee (CCAC). In 2020, the CCAC initiated a number of projects to address the challenges of climate change in Australia, including:• partnering with the Green Building Council of Australia on their Future Homes project
to develop standards for healthy, resilient and energy efficient homes in Australia;• providing our data to assist in the assessment of the vulnerability of residential buildings
to floods and cyclones in Australia, that can be used to improve building standards; and• understanding the impact of climate change on sea levels and actions of the sea and
developing future options to improve the resilience of communities exposed to ongoing sea level rise.
Further information is available here: www.climaterisk.insure.
QB
E In
suran
ce Gro
up
A
nn
ual R
epo
rt 2020
35
Oth
er in
form
ation
6
Fin
ancial
Rep
ort
5
Perfo
rman
ce o
verv
iew
1
Op
erating an
d
finan
cial review
2
Go
vern
ance
3
Directo
rs' R
epo
rt
4

Risk managementClimate-related risk is a type of strategic risk which we identify, assess and manage using our enterprise risk management framework and ESG business practices. Climate-related risk is also implicitly considered within the insurance, credit, market, liquidity and operational risk classes.
For further detail on how sustainability, including climate change, is integrated into risk management, refer to the Sustainable Insurance section of QBE’s 2020 Sustainability Report at www.qbe.com/sustainability.
Environmental and social risk frameworkIn 2020, we developed an environmental and social (E&S) risk framework to help us identify and mitigate risks to our underwriting and investment portfolios. The following issues and sectors are included in the E&S risk framework:• biodiversity and protected areas• forestry• fishing• defence
– controversial weapons– firearms
• energy– coal– oil sands and Arctic drilling– oil and gas
• mining; and• large-scale hydropower dams.
The E&S risk framework, which will be fully implemented by 1 January 2022, was developed to promote informed decision making that is consistent with our commitment to sustainable insurance and investment. In line with our United Nations Environment Programme Finance Initiative (UNEP FI) Principles for Sustainable Insurance (PSI) and Principles for Responsible Investment (PRI) commitments, the E&S risk framework further supports the integration of ESG considerations into our underwriting and investment and increases transparency with customers.
The E&S risk framework is available here: www.qbe.com/investor-relations/corporate-governance/global-policies.
Regulatory oversight of climate change riskFollowing the release of the United Kingdom’s Prudential Regulation Authority (PRA) Supervisory Statement SS3/19 in 2019, QBE developed a roadmap for meeting its requirements which has been approved by the board of our European operations and submitted to the PRA. In QBE’s European operations, the Chief Risk Officer is approved by the PRA as the accountable senior executive under the Senior Managers Regime. A European climate risk working group has also been established to support the Chief Risk Officer with meeting our roadmap commitments. Reporting on roadmap implementation progress to the European Risk and Capital Committee takes place on a quarterly basis.
To raise awareness and support delivery of the roadmap, a townhall meeting was held in 2020 attended by over 100 underwriting staff in Europe. The session provided appropriate context regarding the UK PRA SS3/19 requirements and QBE’s roadmap, and guidance on how to identify potential exposures and develop underwriting strategies in response.
QBE remains on track to fulfil all of its regulatory climate risk obligations. We anticipate that over time these requirements will become increasingly prevalent in a growing number of jurisdictions.
Metrics and targetsWe continue to evolve our climate-related metrics and targets. Our aim is to establish metrics and targets that are relevant and reliable, and that will drive performance and transparency against our climate-related goals. During 2020, we have maintained our carbon neutrality and achieved our energy use, air travel and science-based emission reduction targets ahead of time. While COVID-19 had a substantial impact on our business operations and target performance, we expect to achieve our 2021 targets when we return to a more normal operating environment in 2021.
In 2020 we committed to achieving net zero emissions by 2050 in our investment portfolio. Over the coming years we will set interim targets and progress against these targets will be included as part of our annual reporting.
Our climate-related metrics and targets are presented below:
MEASURE TARGET 2019 2020 STATUS
Energy use (GJ) 15% reduction by 2021 (from 2018 levels)
153,296 (-14%) 122,115 (-32%) Achieved
Scope 1 & 2 emissions (1.5°C trajectory aligned science-based target) (tCO2-e)
30% reduction by 2025 (from 2018 levels)
12,772 (-57%) 5,881 (-80%) Achieved
Renewable electricity use (MWh) 100% by 2025 18,876 (63%) 22,529 (97%) On track
Air travel (tCO2-e) 20% reduction by 2021 (from 2017 levels)
12,160 (-31%) 2,717 (-85%) Achieved
Impact investing ambition $2 billion by 2025 $663 million $1.1 billion On track
Investment portfolio emissions Net zero emissions in investment portfolio by 2050
N/A N/A Ongoing
34
Partnerships and initiatives
We are actively involved in a range of initiatives including:• Actuaries Institute Climate Change Working Group• Australian Sustainable Finance Initiative• CDP• ClimateWise• Investor Group on Climate Change
• RE100• UN-convened Net-Zero Asset Owners Alliance • UNEP FI PRI• UNEP FI PSI
For further detail on our collaboration on climate change, sustainable finance and resilience, refer to QBE’s 2020 Sustainability Report at www.qbe.com/sustainability.
UNEP FI insurance pilotQBE, along with 22 other global reinsurers and insurers, has been part of the UNEP FI’s PSI Initiative to pilot the TCFD recommendations for insurance portfolios. The aim of the initiative is to contribute to the development of consistent and transparent analytical approaches that can be used to identify, assess and disclose climate change-related risks and opportunities. The initiative has covered physical, transition and liability risks and opportunities. QBE has been a member of the working group looking at transition risk in the property sector in Australia, which developed a model to assess the risk which we aim to pilot in 2021. We have also been a member of the litigation working group, which complemented our internal analysis on climate-related liability risk.
The report is available here: www.unepfi.org/psi/wp-content/uploads/2021/01/PSI-TCFD-final-report.pdf.
DISCLOSURE INSIGHT ACTION
CDPOur climate-related progress has been externally recognised, with our CDP score moving from a ‘B’ to ‘A-’ in 2020, putting us in the Leadership band. Areas of highest performance include governance, business strategy and planning, risk management processes, scope 1 and 2 emissions, and value chain engagement. CDP runs a global disclosure system accessed by 515 investors with $106 trillion in assets under management that assesses our awareness of climate change issues, management methods and progress towards action taken on climate change.
Climate Measurement Standards InitiativeQBE, in collaboration with banks, insurers and asset owners, has been actively involved in the CMSI, which has developed standards for assessing climate physical risk projections of damage to property in Australia. The CMSI has delivered two reports with recommendations on:• disclosure – guidance to the financial services industry on disclosing scenario analyses
under the recommendations of the TCFD; and • science – scenario specifications for physical risk for Australia. These specifications are
based on the latest scientific research on the impact of climate change on tropical cyclones, floods, storms, bushfires and other extreme events.
The reports are available here: www.cmsi.org.au/reports.
Insurance Council of Australia – Climate Change Action CommitteeQBE is a member of the Insurance Council of Australia’s Climate Change Action Committee (CCAC). In 2020, the CCAC initiated a number of projects to address the challenges of climate change in Australia, including:• partnering with the Green Building Council of Australia on their Future Homes project
to develop standards for healthy, resilient and energy efficient homes in Australia;• providing our data to assist in the assessment of the vulnerability of residential buildings
to floods and cyclones in Australia, that can be used to improve building standards; and• understanding the impact of climate change on sea levels and actions of the sea and
developing future options to improve the resilience of communities exposed to ongoing sea level rise.
Further information is available here: www.climaterisk.insure.
QB
E In
suran
ce Gro
up
A
nn
ual R
epo
rt 2020
35O
ther
info
rmatio
n
6
Fin
ancial
Rep
ort
5
Perfo
rman
ce o
verv
iew
1
Op
erating an
d
finan
cial review
2
Go
vern
ance
3
Directo
rs' R
epo
rt
4

Managing risk is a key focus for QBE. While navigating the impacts of COVID-19 and increasing regulatory and community expectations,
we have enhanced our risk management practices and accelerated the transition of those practices into business as usual.
Non-financial risksThe Group’s frameworks for modelling non-financial risks allowed QBE to aggregate exposures and identify mitigation strategies for the Group.COVID-19 has impacted a wide number of areas across our business, including productivity, wellbeing and mental health, collaboration, ability to innovate, ability to effect significant change, nearshoring and offshoring and the broader impact on culture. The Group undertook an assessment of non-financial risks across each of these elements, with a common set of risk scenarios developed and assessed in each division. The outcomes of the non-financial risk scenario modelling and associated management action plans were presented to the Board for challenge and approval. With the ongoing COVID-19 environment, these scenarios will be reassessed in a targeted manner with a key focus area on physical and mental health, reputational impacts, and the effect on our claims supply chain.
Risk cultureRisk management plays an important role in establishing the framework for risk culture and monitoring cultural indicators through a risk lens.In 2020, QBE focused on developing risk culture frameworks and processes, including the pilot of a culture dashboard supporting triangulation of cultural insights from diverse data sources. People risks, including wellbeing and other measures, were monitored closely as QBE transitioned to a remote workforce for an extended period.
Consistent with APRA’s lead, QBE is increasingly focused toward its governance, accountability and remuneration practices and their reinforcing influence on a sound risk culture.
Launched in January 2021, our Culture Accelerator is a forward-looking program of work, designed to support our strategic priorities into the future: customer, performance, talent & culture, and modernisation. A key area of focus is ‘psychological safety’, which will support greater transparency and collaboration around risks.
The key focus areas for 2020 for our regulators were predominantly: • capital management and liquidity;• operational resilience (business
continuity), including people; and• adaptability of our strategy to the
changing environment.
In April, the Group took pre-emptive and decisive action, both by de-risking our investment portfolio and with the execution of a comprehensive capital plan, raising over $1.3 billion of equity through an underwritten institutional placement and share purchase plan for retail shareholders. This positioned QBE with demonstrable capital strength to navigate a range of severe economic scenarios as well as enabling QBE to continue to support our regulated entities.
The Group also refined its modelling of insurance and investment exposure scenarios. These actions substantially uplifted our scenario and capital planning capabilities and provided clarity regarding the range of potential financial and non-financial impacts of COVID-19. This has allowed us to better understand and manage the uncertainties in relation to potential exposures such as business interruption and policy interpretation.
COVID-19 has also added complexity in terms of QBE’s business operations. In March 2020, we stood up our head office and divisional crisis management teams to respond to both immediate challenges as well as consider future scenarios. In many ways, COVID-19 has been the ultimate stress test of QBE’s risk management processes. Our business continuity and crisis management processes responded well to this unprecedented environment. QBE has proven to be operationally resilient through the pandemic, and our ability to transition the entire organisation to work from home and the resilience of our technology systems should be called out as two key successes of 2020, demonstrating our effectiveness in managing risk.
COVID-19 responseCOVID-19 is the most significant global crisis the insurance industry has experienced since the Global Financial Crisis, creating unprecedented economic and investment market uncertainty.
QBE’s approach to managing the impacts of COVID-19 on our customers, employees and communities has been informed by the relevant government authorities, with robust plans, protocols and resources put in place to reduce risk to these key stakeholders. Managing the risks to the safety and wellbeing of our people has been a top priority. Feedback from QBE staff indicated that they supported QBE’s approach to the pandemic and were appreciative of the priority given to supporting our people and equipping them to work from home.
Board and executive oversight of COVID-19 was extensive. Regular and comprehensive Board reporting was put in place, led by the risk management function, to ensure that the Board was fully apprised across all aspects of COVID-19’s impact and QBE’s response. This enabled QBE to understand the actual and potential risks that COVID-19 posed and to undertake strategic risk management actions to manage the more immediate impacts and prepare the organisation for a post-pandemic future.
With the unprecedented challenge for the insurance industry and the economy more broadly, the year has seen a significant shift by our regulators from normal supervisory activities to prioritising oversight of our COVID-19 response.
Our Group-wide Supervisor, the Australian Prudential Regulation Authority, alongside other prudential regulators, examined how the timing of regulatory initiatives and activities might be adjusted to allow financial institutions to concentrate on their businesses and assist their customers as they adjusted to the impacts of COVID-19. This resulted in the pausing and reprioritisation of some regulator activities.
Managing risk –our business
36
Risk
Management
Climatechange
Cybercrime
COVID-19
Naturaldisasters
Geopoliticale�ects
Disruptive digitaltechnologies
Economic instability
Mental healthand wellness
Climate changeWe are aware of the physical, transition and liability risks and opportunities associated with climate change, which is a material risk for our business.
Throughout 2020, we have expanded our scenario analysis across physical, transition and liability risks and opportunities to understand where we could have material exposure. We have started to embed the results into our business processes, and we continue development of appropriate responses. We have also used the analysis to highlight the drivers of the key risks we face and develop metrics and targets to help us regularly assess these. Further detail of the work done is provided in our climate disclosures on pages 28 to 35 of this Annual Report.
QBE, along with 21 other global insurers and reinsurers, has been part of the UNEP FI’s PSI Initiative to pilot the TCFD recommendations. We have been part of the working groups on climate litigation and transition risk in the property sector in Australia.
Emerging risksWe have continued to embed our emerging risks standard across the Group.
We have collaborated with key industry governance forums on emerging risks, including the refresh of the CRO Forum’s emerging risk radar and also contributed to a deep dive on demographics.
For further detail on our collaboration, refer to www.thecroforum.org/2020/06/30/emerging-risk-initiativemajor-trends-and-emerging-risk-radar-2020-update/ and www.thecroforum.org/2020/12/17/imagine-all-the-people-demographics-and-social-change-from-an-insurance-perspective.
Across our business, our emerging risk forums considered a variety of emerging risks in each division, including: future regulatory changes, value chain disruption, unexpected climate impacts, changing consumer preferences, new cyber security risks, disruptive technologies, new pandemics and regulation of nanotechnology. For each emerging risk, we have developed and begun to implement actions to mitigate the resulting risks to our business.
Investing in risk capabilitiesInvesting in uplift in our risk management capabilities remains an ongoing priority for our organisation.
In line with the increasing community and regulatory expectations on how organisations should operate, QBE has enhanced a number of aspects of our enterprise risk management (ERM) framework, with refreshed standards covering conflicts of interest, gifts and entertainment, obligations management and incidents and issues. Enhancing standards supports a greater understanding of risk management within QBE and also reflects a significant uplift in the maturity of the design of our ERM framework.
One of the key processes we use to manage risk is the Risk & Control Self-Assessment (RCSA) process. A refresh of the RCSA process is driving greater consistency and quality in the identification, measurement
and mitigation of risk across QBE. By better understanding our risk exposures and proactively improving our control environment, it allows us to better manage risk and drive continuous improvement across the Group.
In addition, we continue to enhance our risk management capabilities with additional modules deployed in our governance, risk and compliance system, Insight. This system provides a central global platform to support QBE’s ERM framework, empowering more informed decision making to better enable a more consistent approach in the management of risk and compliance processes across the Group. This centralised global platform will help us build a stronger and more resilient QBE.
2020 risk landscape
QB
E In
suran
ce Gro
up
A
nn
ual R
epo
rt 2020
37
Oth
er in
form
ation
6
Fin
ancial
Rep
ort
5
Perfo
rman
ce o
verv
iew
1
Op
erating an
d
finan
cial review
2
Go
vern
ance
3
Directo
rs' R
epo
rt
4

Managing risk is a key focus for QBE. While navigating the impacts of COVID-19 and increasing regulatory and community expectations,
we have enhanced our risk management practices and accelerated the transition of those practices into business as usual.
Non-financial risksThe Group’s frameworks for modelling non-financial risks allowed QBE to aggregate exposures and identify mitigation strategies for the Group.COVID-19 has impacted a wide number of areas across our business, including productivity, wellbeing and mental health, collaboration, ability to innovate, ability to effect significant change, nearshoring and offshoring and the broader impact on culture. The Group undertook an assessment of non-financial risks across each of these elements, with a common set of risk scenarios developed and assessed in each division. The outcomes of the non-financial risk scenario modelling and associated management action plans were presented to the Board for challenge and approval. With the ongoing COVID-19 environment, these scenarios will be reassessed in a targeted manner with a key focus area on physical and mental health, reputational impacts, and the effect on our claims supply chain.
Risk cultureRisk management plays an important role in establishing the framework for risk culture and monitoring cultural indicators through a risk lens.In 2020, QBE focused on developing risk culture frameworks and processes, including the pilot of a culture dashboard supporting triangulation of cultural insights from diverse data sources. People risks, including wellbeing and other measures, were monitored closely as QBE transitioned to a remote workforce for an extended period.
Consistent with APRA’s lead, QBE is increasingly focused toward its governance, accountability and remuneration practices and their reinforcing influence on a sound risk culture.
Launched in January 2021, our Culture Accelerator is a forward-looking program of work, designed to support our strategic priorities into the future: customer, performance, talent & culture, and modernisation. A key area of focus is ‘psychological safety’, which will support greater transparency and collaboration around risks.
The key focus areas for 2020 for our regulators were predominantly: • capital management and liquidity;• operational resilience (business
continuity), including people; and• adaptability of our strategy to the
changing environment.
In April, the Group took pre-emptive and decisive action, both by de-risking our investment portfolio and with the execution of a comprehensive capital plan, raising over $1.3 billion of equity through an underwritten institutional placement and share purchase plan for retail shareholders. This positioned QBE with demonstrable capital strength to navigate a range of severe economic scenarios as well as enabling QBE to continue to support our regulated entities.
The Group also refined its modelling of insurance and investment exposure scenarios. These actions substantially uplifted our scenario and capital planning capabilities and provided clarity regarding the range of potential financial and non-financial impacts of COVID-19. This has allowed us to better understand and manage the uncertainties in relation to potential exposures such as business interruption and policy interpretation.
COVID-19 has also added complexity in terms of QBE’s business operations. In March 2020, we stood up our head office and divisional crisis management teams to respond to both immediate challenges as well as consider future scenarios. In many ways, COVID-19 has been the ultimate stress test of QBE’s risk management processes. Our business continuity and crisis management processes responded well to this unprecedented environment. QBE has proven to be operationally resilient through the pandemic, and our ability to transition the entire organisation to work from home and the resilience of our technology systems should be called out as two key successes of 2020, demonstrating our effectiveness in managing risk.
COVID-19 responseCOVID-19 is the most significant global crisis the insurance industry has experienced since the Global Financial Crisis, creating unprecedented economic and investment market uncertainty.
QBE’s approach to managing the impacts of COVID-19 on our customers, employees and communities has been informed by the relevant government authorities, with robust plans, protocols and resources put in place to reduce risk to these key stakeholders. Managing the risks to the safety and wellbeing of our people has been a top priority. Feedback from QBE staff indicated that they supported QBE’s approach to the pandemic and were appreciative of the priority given to supporting our people and equipping them to work from home.
Board and executive oversight of COVID-19 was extensive. Regular and comprehensive Board reporting was put in place, led by the risk management function, to ensure that the Board was fully apprised across all aspects of COVID-19’s impact and QBE’s response. This enabled QBE to understand the actual and potential risks that COVID-19 posed and to undertake strategic risk management actions to manage the more immediate impacts and prepare the organisation for a post-pandemic future.
With the unprecedented challenge for the insurance industry and the economy more broadly, the year has seen a significant shift by our regulators from normal supervisory activities to prioritising oversight of our COVID-19 response.
Our Group-wide Supervisor, the Australian Prudential Regulation Authority, alongside other prudential regulators, examined how the timing of regulatory initiatives and activities might be adjusted to allow financial institutions to concentrate on their businesses and assist their customers as they adjusted to the impacts of COVID-19. This resulted in the pausing and reprioritisation of some regulator activities.
Managing risk –our business
36
Risk
Management
Climatechange
Cybercrime
COVID-19
Naturaldisasters
Geopoliticale�ects
Disruptive digitaltechnologies
Economic instability
Mental healthand wellness
Climate changeWe are aware of the physical, transition and liability risks and opportunities associated with climate change, which is a material risk for our business.
Throughout 2020, we have expanded our scenario analysis across physical, transition and liability risks and opportunities to understand where we could have material exposure. We have started to embed the results into our business processes, and we continue development of appropriate responses. We have also used the analysis to highlight the drivers of the key risks we face and develop metrics and targets to help us regularly assess these. Further detail of the work done is provided in our climate disclosures on pages 28 to 35 of this Annual Report.
QBE, along with 21 other global insurers and reinsurers, has been part of the UNEP FI’s PSI Initiative to pilot the TCFD recommendations. We have been part of the working groups on climate litigation and transition risk in the property sector in Australia.
Emerging risksWe have continued to embed our emerging risks standard across the Group.
We have collaborated with key industry governance forums on emerging risks, including the refresh of the CRO Forum’s emerging risk radar and also contributed to a deep dive on demographics.
For further detail on our collaboration, refer to www.thecroforum.org/2020/06/30/emerging-risk-initiativemajor-trends-and-emerging-risk-radar-2020-update/ and www.thecroforum.org/2020/12/17/imagine-all-the-people-demographics-and-social-change-from-an-insurance-perspective.
Across our business, our emerging risk forums considered a variety of emerging risks in each division, including: future regulatory changes, value chain disruption, unexpected climate impacts, changing consumer preferences, new cyber security risks, disruptive technologies, new pandemics and regulation of nanotechnology. For each emerging risk, we have developed and begun to implement actions to mitigate the resulting risks to our business.
Investing in risk capabilitiesInvesting in uplift in our risk management capabilities remains an ongoing priority for our organisation.
In line with the increasing community and regulatory expectations on how organisations should operate, QBE has enhanced a number of aspects of our enterprise risk management (ERM) framework, with refreshed standards covering conflicts of interest, gifts and entertainment, obligations management and incidents and issues. Enhancing standards supports a greater understanding of risk management within QBE and also reflects a significant uplift in the maturity of the design of our ERM framework.
One of the key processes we use to manage risk is the Risk & Control Self-Assessment (RCSA) process. A refresh of the RCSA process is driving greater consistency and quality in the identification, measurement
and mitigation of risk across QBE. By better understanding our risk exposures and proactively improving our control environment, it allows us to better manage risk and drive continuous improvement across the Group.
In addition, we continue to enhance our risk management capabilities with additional modules deployed in our governance, risk and compliance system, Insight. This system provides a central global platform to support QBE’s ERM framework, empowering more informed decision making to better enable a more consistent approach in the management of risk and compliance processes across the Group. This centralised global platform will help us build a stronger and more resilient QBE.
2020 risk landscape
QB
E In
suran
ce Gro
up
A
nn
ual R
epo
rt 2020
37O
ther
info
rmatio
n
6
Fin
ancial
Rep
ort
5
Perfo
rman
ce o
verv
iew
1
Op
erating an
d
finan
cial review
2
Go
vern
ance
3
Directo
rs' R
epo
rt
4

Michael (Mike) Wilkins AO BCom, MBA, FCA, FAICD Independent Chair
Mike became a non-executive director of QBE in 2016 and was appointed Chair in March 2020. He is Chair of the Governance & Nomination Committee and a member of the People & Remuneration, Audit, Investment, Risk & Capital, Operations & Technology Committees. Mike has more than 30 years’ experience in financial services. He was the Managing Director and CEO of Insurance Australia Group Limited until November 2015 and previously served as Managing Director and CEO of Promina Group Limited and Managing Director of Tyndall Australia Limited. He is currently Chair of Medibank Private Limited and a non-executive director of Scentre Group Limited. He previously served as a non-executive director of AMP Limited, Alinta Limited, Maple-Brown Abbott Limited, The Geneva Association and the Australian Business and Community Network. Mike was the founding member of the Australian Business Roundtable for Disaster Resilience & Safer Communities from 2013 until his retirement in 2015.
Stephen Fitzgerald AO BEc Independent Director
Stephen became a non-executive director of QBE in 2014. He is Chair of the Investment Committee, Deputy Chair of the People & Remuneration Committee, and a member of the Risk & Capital and Governance & Nomination Committees. Stephen joined Goldman Sachs in 1992 and held a number of leadership roles in London, Tokyo, Hong Kong and Australia. He was Chair of Goldman Sachs, Australia and New Zealand when he retired in 2012. Stephen is currently the Managing Partner of Affirmative Investment Management and sits on the board of Great Barrier Reef Foundation and Champions of Change Coalition, and is a member of the Investment Committee of the British Museum. He is also on the board of Lombard Odier Investment Management. Stephen was previously a member of the Board of Guardians of the Future Fund (Australia’s Sovereign Wealth Fund).
John M Green BJURIS/LLB, FAICD, SF FIN Independent Deputy Chair
John became a non-executive director of QBE in 2010. He is Deputy Chair of the Board, Chair of the People & Remuneration Committee and Deputy Chair of the Investment, Operations & Technology and Governance & Nomination Committees. He is also a member of the Risk & Capital and Audit Committees. John was previously a director of Worley Limited, an executive director at Macquarie Group leading its financial institutions group, and a partner at two major law firms. John is a non-executive director of the Cyber Security Cooperative Research Centre and Challenger Limited. He is also a novelist and co-founder of independent book publisher Pantera Press.
Tan Le BCom (Hons), LLB (Hons) Independent Director
Tan became a non-executive director of QBE in September 2020. She is a member of the Audit, Operations & Technology and Governance & Nomination Committees. Tan is the founder and CEO of EMOTIV, a neuroinformatics company advancing understanding of the human brain. She was previously co-founder and President of SASme, a wireless technology company. Tan has been a contributor at the World Economic Forum (WEF) and previously served on the WEF Global Future Council and on the WEF Board of Stewards on Shaping the Future of Information & Entertainment.
Kathryn (Kathy) Lisson BSc (Hons) Independent Director
Kathy became a non-executive director of QBE in 2016. She is Chair of the Operations & Technology Committee and a member of the Audit and Governance & Nomination Committees. Kathy has over 30 years’ experience across insurance and banking in technology, operations and management. She was previously Chief Operating Officer for two insurance companies (QBE Europe (a QBE regulated entity) and Brit Insurance) and Operational Transformation Director at Barclays Bank, which included delivering global solutions in digital technology, cyber security and IT risk. Kathy also held executive positions at Bank of Montreal, including as President of its Mortgage Corporation and EVP Technology Strategy and Delivery. Kathy was a senior partner at Ernst & Young and Price Waterhouse in Canada, leading their insurance and banking advisory practices. Kathy has also held non-executive director roles in the United Kingdom and in Canada.
Board of Directors
38
Sir Brian Pomeroy MA, FCA Independent Director
Sir Brian became a non-executive director of QBE in 2014. He is Deputy Chair of the Audit Committee and a member of the Investment, Risk & Capital and Governance & Nomination Committees. He has extensive insurance industry experience, including in his previous role as a Nominated Member of the Council of Lloyd’s and as Chair of the Independent Commission on Equitable Life Payments. He was formerly a non-executive member of the Board of the Financial Conduct Authority in the United Kingdom and a non-executive director on QBE’s European regulated boards. Sir Brian also chaired the United Kingdom Treasury’s Financial Inclusion Taskforce, the Payments Council and the Gambling Commission. He was the Senior Partner of Deloitte Consulting in the United Kingdom until 1999.
Jann Skinner BCom, FCA, FAICD Independent Director
Jann became a non-executive director of QBE in 2014. She is Chair of the Audit Committee, Deputy Chair of the Risk & Capital Committee and a member of the People & Remuneration and Governance & Nomination Committees. Jann has over 30 years’ professional experience in audit and accounting with a focus on financial services, particularly the insurance industry. She was an audit partner for 17 years with PricewaterhouseCoopers before retiring in 2004. Jann is a non-executive director of Telix Pharmaceuticals Limited, HSBC Bank Australia Limited and Create Foundation Limited. Previously, Jann was a non-executive director of Enstar Australia Group and the Tasmanian Public Finance Corporation. Jann was also a non-executive director on QBE’s Australian regulated boards.
Eric Smith MBA, BSc Independent Director
Eric became a non-executive director of QBE in September 2020. He is a member of the Risk & Capital, Operations & Technology and Governance & Nominations Committees. Eric has more than 40 years’ experience in insurance and financial services, and was most recently President and Chief Executive Officer of Swiss Re Americas from 2011 to 2020. Eric has held a number of executive roles in his career including President of USAA Life Insurance Co and President of Allstate Financial Services, Allstate’s business unit that distributes life insurance, annuities and other financial products. He has also held various roles in property and casualty insurance with Country Financial over a 20-year period.
Rolf Tolle Dipl.-Pol Independent Director
Rolf became a non-executive director of QBE in 2016. He is Chair of the Risk & Capital Committee and a member of the Audit, People & Remuneration and Governance & Nomination Committees. He has significant experience in specialist insurance and reinsurance businesses, having held senior positions in a number of global companies. He was the first ever Franchise Performance Director at Lloyd’s, for which he was awarded the Silver Medal for Services at Lloyd’s, an honour bestowed to only a few individuals since its creation in 1917. Rolf is a director of Marco Insurance PCC Limited and is also on the advisory board of Wrisk Ltd. Rolf was previously a director of Beazley plc and Beazley Furlonge Ltd.
Patrick (Pat) Regan BSc, FCA Former Group Chief Executive Officer
Pat joined QBE in 2014 and was appointed Group Chief Executive Officer in 2018. Pat ceased employment with QBE in September 2020.
QB
E In
suran
ce Gro
up
A
nn
ual R
epo
rt 2020
39
Oth
er in
form
ation
6
Fin
ancial
Rep
ort
5
Perfo
rman
ce o
verv
iew
1
Op
erating an
d
finan
cial review
2
Go
vern
ance
3
Directo
rs' R
epo
rt
4

Michael (Mike) Wilkins AO BCom, MBA, FCA, FAICD Independent Chair
Mike became a non-executive director of QBE in 2016 and was appointed Chair in March 2020. He is Chair of the Governance & Nomination Committee and a member of the People & Remuneration, Audit, Investment, Risk & Capital, Operations & Technology Committees. Mike has more than 30 years’ experience in financial services. He was the Managing Director and CEO of Insurance Australia Group Limited until November 2015 and previously served as Managing Director and CEO of Promina Group Limited and Managing Director of Tyndall Australia Limited. He is currently Chair of Medibank Private Limited and a non-executive director of Scentre Group Limited. He previously served as a non-executive director of AMP Limited, Alinta Limited, Maple-Brown Abbott Limited, The Geneva Association and the Australian Business and Community Network. Mike was the founding member of the Australian Business Roundtable for Disaster Resilience & Safer Communities from 2013 until his retirement in 2015.
Stephen Fitzgerald AO BEc Independent Director
Stephen became a non-executive director of QBE in 2014. He is Chair of the Investment Committee, Deputy Chair of the People & Remuneration Committee, and a member of the Risk & Capital and Governance & Nomination Committees. Stephen joined Goldman Sachs in 1992 and held a number of leadership roles in London, Tokyo, Hong Kong and Australia. He was Chair of Goldman Sachs, Australia and New Zealand when he retired in 2012. Stephen is currently the Managing Partner of Affirmative Investment Management and sits on the board of Great Barrier Reef Foundation and Champions of Change Coalition, and is a member of the Investment Committee of the British Museum. He is also on the board of Lombard Odier Investment Management. Stephen was previously a member of the Board of Guardians of the Future Fund (Australia’s Sovereign Wealth Fund).
John M Green BJURIS/LLB, FAICD, SF FIN Independent Deputy Chair
John became a non-executive director of QBE in 2010. He is Deputy Chair of the Board, Chair of the People & Remuneration Committee and Deputy Chair of the Investment, Operations & Technology and Governance & Nomination Committees. He is also a member of the Risk & Capital and Audit Committees. John was previously a director of Worley Limited, an executive director at Macquarie Group leading its financial institutions group, and a partner at two major law firms. John is a non-executive director of the Cyber Security Cooperative Research Centre and Challenger Limited. He is also a novelist and co-founder of independent book publisher Pantera Press.
Tan Le BCom (Hons), LLB (Hons) Independent Director
Tan became a non-executive director of QBE in September 2020. She is a member of the Audit, Operations & Technology and Governance & Nomination Committees. Tan is the founder and CEO of EMOTIV, a neuroinformatics company advancing understanding of the human brain. She was previously co-founder and President of SASme, a wireless technology company. Tan has been a contributor at the World Economic Forum (WEF) and previously served on the WEF Global Future Council and on the WEF Board of Stewards on Shaping the Future of Information & Entertainment.
Kathryn (Kathy) Lisson BSc (Hons) Independent Director
Kathy became a non-executive director of QBE in 2016. She is Chair of the Operations & Technology Committee and a member of the Audit and Governance & Nomination Committees. Kathy has over 30 years’ experience across insurance and banking in technology, operations and management. She was previously Chief Operating Officer for two insurance companies (QBE Europe (a QBE regulated entity) and Brit Insurance) and Operational Transformation Director at Barclays Bank, which included delivering global solutions in digital technology, cyber security and IT risk. Kathy also held executive positions at Bank of Montreal, including as President of its Mortgage Corporation and EVP Technology Strategy and Delivery. Kathy was a senior partner at Ernst & Young and Price Waterhouse in Canada, leading their insurance and banking advisory practices. Kathy has also held non-executive director roles in the United Kingdom and in Canada.
Board of Directors
38
Sir Brian Pomeroy MA, FCA Independent Director
Sir Brian became a non-executive director of QBE in 2014. He is Deputy Chair of the Audit Committee and a member of the Investment, Risk & Capital and Governance & Nomination Committees. He has extensive insurance industry experience, including in his previous role as a Nominated Member of the Council of Lloyd’s and as Chair of the Independent Commission on Equitable Life Payments. He was formerly a non-executive member of the Board of the Financial Conduct Authority in the United Kingdom and a non-executive director on QBE’s European regulated boards. Sir Brian also chaired the United Kingdom Treasury’s Financial Inclusion Taskforce, the Payments Council and the Gambling Commission. He was the Senior Partner of Deloitte Consulting in the United Kingdom until 1999.
Jann Skinner BCom, FCA, FAICD Independent Director
Jann became a non-executive director of QBE in 2014. She is Chair of the Audit Committee, Deputy Chair of the Risk & Capital Committee and a member of the People & Remuneration and Governance & Nomination Committees. Jann has over 30 years’ professional experience in audit and accounting with a focus on financial services, particularly the insurance industry. She was an audit partner for 17 years with PricewaterhouseCoopers before retiring in 2004. Jann is a non-executive director of Telix Pharmaceuticals Limited, HSBC Bank Australia Limited and Create Foundation Limited. Previously, Jann was a non-executive director of Enstar Australia Group and the Tasmanian Public Finance Corporation. Jann was also a non-executive director on QBE’s Australian regulated boards.
Eric Smith MBA, BSc Independent Director
Eric became a non-executive director of QBE in September 2020. He is a member of the Risk & Capital, Operations & Technology and Governance & Nominations Committees. Eric has more than 40 years’ experience in insurance and financial services, and was most recently President and Chief Executive Officer of Swiss Re Americas from 2011 to 2020. Eric has held a number of executive roles in his career including President of USAA Life Insurance Co and President of Allstate Financial Services, Allstate’s business unit that distributes life insurance, annuities and other financial products. He has also held various roles in property and casualty insurance with Country Financial over a 20-year period.
Rolf Tolle Dipl.-Pol Independent Director
Rolf became a non-executive director of QBE in 2016. He is Chair of the Risk & Capital Committee and a member of the Audit, People & Remuneration and Governance & Nomination Committees. He has significant experience in specialist insurance and reinsurance businesses, having held senior positions in a number of global companies. He was the first ever Franchise Performance Director at Lloyd’s, for which he was awarded the Silver Medal for Services at Lloyd’s, an honour bestowed to only a few individuals since its creation in 1917. Rolf is a director of Marco Insurance PCC Limited and is also on the advisory board of Wrisk Ltd. Rolf was previously a director of Beazley plc and Beazley Furlonge Ltd.
Patrick (Pat) Regan BSc, FCA Former Group Chief Executive Officer
Pat joined QBE in 2014 and was appointed Group Chief Executive Officer in 2018. Pat ceased employment with QBE in September 2020.
QB
E In
suran
ce Gro
up
A
nn
ual R
epo
rt 2020
39O
ther
info
rmatio
n
6
Fin
ancial
Rep
ort
5
Perfo
rman
ce o
verv
iew
1
Op
erating an
d
finan
cial review
2
Go
vern
ance
3
Directo
rs' R
epo
rt
4

Richard Pryce BHis (Hons) Interim Group Chief Executive Officer
Richard was appointed Interim Group Chief Executive Officer in October 2020. Having joined QBE in 2012, he became Chief Executive Officer, European Operations in 2013, and in 2019 he became Chief Executive Officer, International Operations. Richard began his insurance career with R.W. Sturge syndicate at Lloyd’s where he was Claims Director. In 1996, he joined Ockham as Professional Lines Class Underwriter for Syndicate 204. Richard went on to run ACE’s financial lines business in London before becoming President of ACE Global Markets in 2003 and ACE United Kingdom in 2007. He has worked in the London insurance market for over 35 years.
Inder Singh BCom Group Chief Financial Officer
Inder joined QBE in 2015 and was appointed Group Chief Financial Officer in 2018. His previous roles at QBE include Chief Financial Officer for Australian & New Zealand Operations and Group Head of Corporate Development and Financial Planning & Analysis. Inder has more than 20 years’ experience in financial services spanning property & casualty, life insurance and banking. He started his career at Arthur Andersen before working in investment banking in Sydney and London with Deutsche Bank and UBS. Prior to joining QBE, he was Group M&A Director at Aviva plc in London where he led a number of transformational transactions.
Vivienne (Viv) Bower BA Organisational Communication Group Executive, Corporate Affairs and Sustainability
Viv joined QBE in 2017 and was appointed Group Executive, Corporate Affairs and Sustainability in 2019. She has previously held a number of senior investor relations and corporate affairs roles, including Group Head of Corporate Affairs and Investor Relations at Lendlease, Head of Group Internal Communications at Westpac and Group General Manager of Communications at Multiplex Group.
Jason Brown BEc, ACA Group Chief Underwriting Officer
Jason joined QBE in 2002 and was appointed Group Chief Underwriting Officer in 2019. His previous roles at QBE include Chief Executive Officer, Asia Pacific; Executive General Manager, Technical & Operations for Australian and New Zealand Operations; Chief Risk Officer for Australian & New Zealand Operations; and Group Chief Risk Officer. Jason has more than 30 years’ experience in the financial services industry, having spent 13 years at Ernst & Young in the Financial Services Group in both assurance and consulting roles in Australia and the United Kingdom.
Jason Harris BSc (Hons) Geology Chief Executive Officer, International
Jason joined QBE as Chief Executive Officer, International in October 2020. Prior to joining QBE, Jason held a number of global and international leadership roles at XL Group including most recently as Chief Executive, Global Property and Casualty and previously as Chief Executive, International Property and Casualty. He previously worked at AIG/Chartis in several senior roles including Executive Director, Commercial Lines. He is an underwriter by background and started his career in offshore energy. He has worked in insurance for over 25 years.
Group Executive Committee
40
Todd Jones BSc, MBA Chief Executive Officer, North America
Todd joined QBE in 2019 as Chief Executive Officer, North America. Prior to joining QBE, Todd held a number of senior roles at Willis Towers Watson, including most recently as Head of Global Corporate Risk and Broking, and previously as CEO for Willis North America. Todd began his career as a technical broker in directors’ and officers and management liability insurance, serving large complex and middle market clients. Todd has over 25 years’ insurance and financial services industry experience.
Matt Mansour MBA Group Chief Information Officer
Matt joined QBE in 2018 as Group Chief Information Officer and was appointed to the Group Executive Committee in 2019. Prior to joining QBE, he held senior global roles in Barclays Bank and GE Capital. Matt has over 27 years’ experience in technology, operations and digital business leadership roles.
Margaret Murphy BA (Hons) Business Group Executive, People & Change
Margaret joined QBE in 2016. Prior to joining QBE, she held various executive human resources and transformation roles in Barclays, including within the retail bank, corporate bank and global functions, leading large-scale organisational change. Margaret has over 30 years’ experience, having previously worked at London Underground, Inchcape, British American Tobacco and J Sainsbury plc.
Carolyn Scobie BA, LLB, MA, AGIA, GAICD Group General Counsel and Company Secretary
Carolyn joined QBE in 2016 as Group General Counsel and Company Secretary. Prior to joining QBE, Carolyn was Group General Counsel at Goodman Group for 17 years, where she ran a multi-disciplinary legal team. Carolyn has extensive experience in corporate law, compliance, regulatory matters, litigation and managing the complexity of multiple jurisdictions.
Patrick (Pat) Regan BSc, FCA Former Group Chief Executive Officer
Pat joined QBE in 2014 and was appointed Group Chief Executive Officer in 2018. Pat ceased employment with QBE in September 2020.
Vivek Bhatia BEng, MBA, CFA Former Chief Executive Officer, Australia Pacific
Vivek joined QBE in 2018 as Chief Executive Officer, Australia Pacific. Vivek ceased employment with QBE in August 2020.
Since August 2020, Frank Costigan (Interim Managing Director Australia) and Declan Moore (CEO and Chief Customer Officer New Zealand & Pacific) have assumed interim responsibility for Australia Pacific.
Peter Grewal BA (Hons), CMIIA Former Group Chief Risk Officer
Peter joined QBE in July 2018 as Group Chief Risk Officer. Peter ceased employment with QBE in December 2020.
Since December 2020, Jonathan Groves has been Acting Group Chief Risk Officer.
QB
E In
suran
ce Gro
up
A
nn
ual R
epo
rt 2020
41
Oth
er in
form
ation
6
Fin
ancial
Rep
ort
5
Perfo
rman
ce o
verv
iew
1
Op
erating an
d
finan
cial review
2
Go
vern
ance
3
Directo
rs' R
epo
rt
4

Richard Pryce BHis (Hons) Interim Group Chief Executive Officer
Richard was appointed Interim Group Chief Executive Officer in October 2020. Having joined QBE in 2012, he became Chief Executive Officer, European Operations in 2013, and in 2019 he became Chief Executive Officer, International Operations. Richard began his insurance career with R.W. Sturge syndicate at Lloyd’s where he was Claims Director. In 1996, he joined Ockham as Professional Lines Class Underwriter for Syndicate 204. Richard went on to run ACE’s financial lines business in London before becoming President of ACE Global Markets in 2003 and ACE United Kingdom in 2007. He has worked in the London insurance market for over 35 years.
Inder Singh BCom Group Chief Financial Officer
Inder joined QBE in 2015 and was appointed Group Chief Financial Officer in 2018. His previous roles at QBE include Chief Financial Officer for Australian & New Zealand Operations and Group Head of Corporate Development and Financial Planning & Analysis. Inder has more than 20 years’ experience in financial services spanning property & casualty, life insurance and banking. He started his career at Arthur Andersen before working in investment banking in Sydney and London with Deutsche Bank and UBS. Prior to joining QBE, he was Group M&A Director at Aviva plc in London where he led a number of transformational transactions.
Vivienne (Viv) Bower BA Organisational Communication Group Executive, Corporate Affairs and Sustainability
Viv joined QBE in 2017 and was appointed Group Executive, Corporate Affairs and Sustainability in 2019. She has previously held a number of senior investor relations and corporate affairs roles, including Group Head of Corporate Affairs and Investor Relations at Lendlease, Head of Group Internal Communications at Westpac and Group General Manager of Communications at Multiplex Group.
Jason Brown BEc, ACA Group Chief Underwriting Officer
Jason joined QBE in 2002 and was appointed Group Chief Underwriting Officer in 2019. His previous roles at QBE include Chief Executive Officer, Asia Pacific; Executive General Manager, Technical & Operations for Australian and New Zealand Operations; Chief Risk Officer for Australian & New Zealand Operations; and Group Chief Risk Officer. Jason has more than 30 years’ experience in the financial services industry, having spent 13 years at Ernst & Young in the Financial Services Group in both assurance and consulting roles in Australia and the United Kingdom.
Jason Harris BSc (Hons) Geology Chief Executive Officer, International
Jason joined QBE as Chief Executive Officer, International in October 2020. Prior to joining QBE, Jason held a number of global and international leadership roles at XL Group including most recently as Chief Executive, Global Property and Casualty and previously as Chief Executive, International Property and Casualty. He previously worked at AIG/Chartis in several senior roles including Executive Director, Commercial Lines. He is an underwriter by background and started his career in offshore energy. He has worked in insurance for over 25 years.
Group Executive Committee
40
Todd Jones BSc, MBA Chief Executive Officer, North America
Todd joined QBE in 2019 as Chief Executive Officer, North America. Prior to joining QBE, Todd held a number of senior roles at Willis Towers Watson, including most recently as Head of Global Corporate Risk and Broking, and previously as CEO for Willis North America. Todd began his career as a technical broker in directors’ and officers and management liability insurance, serving large complex and middle market clients. Todd has over 25 years’ insurance and financial services industry experience.
Matt Mansour MBA Group Chief Information Officer
Matt joined QBE in 2018 as Group Chief Information Officer and was appointed to the Group Executive Committee in 2019. Prior to joining QBE, he held senior global roles in Barclays Bank and GE Capital. Matt has over 27 years’ experience in technology, operations and digital business leadership roles.
Margaret Murphy BA (Hons) Business Group Executive, People & Change
Margaret joined QBE in 2016. Prior to joining QBE, she held various executive human resources and transformation roles in Barclays, including within the retail bank, corporate bank and global functions, leading large-scale organisational change. Margaret has over 30 years’ experience, having previously worked at London Underground, Inchcape, British American Tobacco and J Sainsbury plc.
Carolyn Scobie BA, LLB, MA, AGIA, GAICD Group General Counsel and Company Secretary
Carolyn joined QBE in 2016 as Group General Counsel and Company Secretary. Prior to joining QBE, Carolyn was Group General Counsel at Goodman Group for 17 years, where she ran a multi-disciplinary legal team. Carolyn has extensive experience in corporate law, compliance, regulatory matters, litigation and managing the complexity of multiple jurisdictions.
Patrick (Pat) Regan BSc, FCA Former Group Chief Executive Officer
Pat joined QBE in 2014 and was appointed Group Chief Executive Officer in 2018. Pat ceased employment with QBE in September 2020.
Vivek Bhatia BEng, MBA, CFA Former Chief Executive Officer, Australia Pacific
Vivek joined QBE in 2018 as Chief Executive Officer, Australia Pacific. Vivek ceased employment with QBE in August 2020.
Since August 2020, Frank Costigan (Interim Managing Director Australia) and Declan Moore (CEO and Chief Customer Officer New Zealand & Pacific) have assumed interim responsibility for Australia Pacific.
Peter Grewal BA (Hons), CMIIA Former Group Chief Risk Officer
Peter joined QBE in July 2018 as Group Chief Risk Officer. Peter ceased employment with QBE in December 2020.
Since December 2020, Jonathan Groves has been Acting Group Chief Risk Officer.
QB
E In
suran
ce Gro
up
A
nn
ual R
epo
rt 2020
41O
ther
info
rmatio
n
6
Fin
ancial
Rep
ort
5
Perfo
rman
ce o
verv
iew
1
Op
erating an
d
finan
cial review
2
Go
vern
ance
3
Directo
rs' R
epo
rt
4

Corporate governance statement
QBE is committed to the highest standards of corporate governance. The QBE DNA consists of seven interwoven elements that are fundamental to QBE and how QBE needs to operate in the future to succeed, recognising its customers, people, shareholders and communities. QBE believes that a culture that rewards transparency, integrity and performance will promote its long‑term sustainability and the ongoing success of its business.
Board and management
Board functionsThe Board charter sets out the role and responsibilities of the Board, including matters expressly reserved for the Board and those delegated to its Committees and management. The role of the Board is to represent and serve the interests of shareholders by providing guidance and oversight of QBE’s strategies, policies and performance. This includes demonstrating leadership, setting the strategic direction for QBE, approving the values of QBE that underpin the desired culture, monitoring the performance of management in the delivery of strategy, and instilling the values and desired culture of QBE. The Board’s principal objective is to maintain and increase shareholder value while ensuring that the activities of QBE are properly managed.
The Board reviews strategy on an ongoing basis. To help the Board maintain its understanding of the business and to effectively assess management, directors receive regular presentations from the divisional chief executive officers and other senior managers of the various divisions on relevant topics, including budgets, three-year business plans and operating performance. The Board receives updated forecasts during the year. The non-executive directors also have contact with senior executives in various forums throughout the year.
Visits by non-executive directors to QBE’s offices in key locations are encouraged. The Board meets regularly in Australia and, due to QBE’s substantial overseas operations, usually spends time in the United Kingdom and the United States each year; however, in 2020, due to COVID-19, the majority of Board and Committee meetings, strategy sessions and other meetings were held virtually.
Each formal Board meeting normally considers reports from the Group Chief Executive Officer and the Group Chief Financial Officer together with other relevant reports. The non-executive directors regularly meet in the absence of management. The Chair and Group Chief Executive Officer in particular, and directors in general, including those on the divisional boards, have substantial contact outside Board and Committee meetings.
Details of the number of Board meetings held during the 2020 financial year and attendance by directors are set out in the Directors’ Report. Directors are expected to attend all Board meetings.
Senior management functionsManagement’s responsibilities are to:• develop a draft strategy, make recommendations to the Board and implement the Board approved strategy, subject to market conditions;• instill and reinforce QBE’s values and desired culture;• prepare annual budgets and three-year business plans;• carry on day-to-day operations within the Board approved annual budget and three-year business plans, subject to market conditions;• design and maintain internal controls;• set-up and keep under review an effective risk management and compliance management system, and monitor and manage
all material risks consistent with the strategic objectives, risk appetite statements and policies approved by the Board;• provide the Board with accurate, timely and clear information on the Group’s operations, including on compliance with material
legal and regulatory requirements and any conduct materially inconsistent with the Group Code of Ethics and Conduct;• inform the Board of material matters and keep the Board and market fully informed about material continuous disclosure; and• monitor that succession plans exist for all Group executive positions other than the Group Chief Executive Officer. The succession plans
for the Group Chief Executive Officer are managed by Governance & Nomination Committee, and are discussed in more detail below.
The Board delegates responsibility to the Group Chief Executive Officer for the day-to-day management of the business.
QBE has operated under an extensive written system of delegated authorities for many years. In particular, a written delegated authority with specified limits is approved by the Board each year to enable the Group Chief Executive Officer to conduct QBE’s business in accordance with detailed budgets and business plans. This delegated authority deals with topics such as underwriting, reinsurance protection, claims, investments, acquisitions and expenses. The Group Chief Executive Officer delegates authority to management throughout the Group on a selective basis, taking into account expertise and past performance. Compliance with delegated authorities is monitored by management and adjusted as required for actual performance, market conditions and other factors. Management and the Group’s internal audit teams review compliance with delegated authorities and any breach can lead to disciplinary procedures, including dismissal.
ChairThe independent Chair of the Board is Mike Wilkins AO, who was appointed to that role in March 2020. The Chair is responsible for ensuring that the Board functions as an effective and cohesive group. The Chair works closely with the Group Chief Executive Officer to determine the strategic direction for QBE and to establish high standards of governance and leadership. Mike Wilkins was appointed to the role of Executive Chair from 1 September to 23 October 2020. During this time, John M Green, the independent Deputy Chair, fulfilled the role of independent Chair when Mr Wilkins was conflicted.
42
CommitteesThe Board is supported by several Committees which meet regularly to consider audit, risk management, investments, remuneration, technology, operations and other matters. The main Committees of the Board are the Audit, Governance & Nomination, Investment, Operations & Technology, People & Remuneration and Risk & Capital Committees. Further sub-committees of the Board may be convened to confer on particular issues from time to time. Any non-executive director may attend a Committee meeting. The Committees have free and unfettered access to QBE’s senior managers and may consult external advisers at QBE’s cost, including requiring their attendance at Committee meetings, with the consent of the Committee Chair. A report on each Committee’s last meeting is provided at the next Board meeting.
Each Committee comprises at least three independent directors and each Committee Chair is an independent director who is not the Chair of the Board (excluding the Governance & Nomination Committee, the Chair of which is Mike Wilkins). Mr Wilkins was appointed Executive Chair for a short period (1 September to 23 October 2020), however the overall composition of Committees still complied with the requirements of the ASX Corporate Governance Council’s Corporate Governance Principles and Recommendations. The only exception to this is the Governance & Nomination Committee, of which Mike Wilkins chaired one meeting in his capacity as Executive Chair. Each Committee operates under a written charter approved by the Board. These charters are available at www.qbe.com/investor-relations/corporate-governance/qbe-charters-and-constitution. The membership of each Committee is provided at www.qbe.com/about-qbe/group-board-of-directors and details of the number of Committee meetings held during the 2020 financial year and attendance by Committee members at Committee meetings is set out in the Directors’ Report.
Further information regarding the Committees can be found throughout this Corporate governance statement.
Company SecretaryThe Company Secretary acts as secretary to the Board and all of the Committees and is accountable directly to the Board, through the Chair, on all matters to do with the proper functioning of the Board. All directors have direct access to the Company Secretary.
The Company Secretary’s role is described in the Board charter and includes communication with regulatory bodies and the Australian Securities Exchange (ASX), all statutory and other filings and assisting with good information flows within the Board and its Committees and between non-executive directors and senior management, as well as facilitating induction and professional development as required. The Company Secretary may also provide guidance to directors in relation to governance matters.
Board skills and experienceDirectors are selected to provide to QBE a broad range of skills, experience and expertise complementary to QBE’s insurance activities. The Board comprised nine directors at 31 December 2020, being an independent Chair and eight other independent directors.
The Board has a skills matrix covering the range of competencies and experience of each director. When the need for a new director is identified, the required experience and competencies of the new director are considered in the context of this matrix and any gaps that may exist.
A summary of the Board’s skills matrix is below:SKILLS INDUSTRY
Financial literacy Commercial expertise Digital technology General insurance Private equityLegal Risk management Cyber security Reinsurance Financial servicesGovernance Government relations IT risks Investment banking AccountingStrategy Executive leadership Data analytics
Details of individual directors, including their qualifications and experience, independence status and period of office serving on the Board, are set out in the Board of Directors’ section of the Annual Report and can also be found on the QBE website at www.qbe.com/about-qbe/group-board-of-directors.
Independence of the BoardDuring the 2020 year, the majority of the directors on the Board were independent directors, applying the ’independence’ definition of the ASX Corporate Governance Council. The Board currently comprises only independent directors. When applying this definition, the Board has determined that an independent director’s relationship with QBE as a professional adviser, consultant, supplier, customer or otherwise is not material unless amounts paid under that relationship exceed 0.1% of QBE’s revenue. The roles of the Chair and Group Chief Executive Officer are generally also not exercised by the same individual. In 2020, following the departure of Patrick Regan as Group Chief Executive Officer, Mr Wilkins was appointed Executive Chair for a short period (1 September to 23 October 2020) until Richard Pryce was appointed as Interim Group Chief Executive Officer.
Directors are required to advise the Board on an ongoing basis of any interest they have that they believe could conflict with QBE’s interests. If a potential conflict does arise, either the director concerned may choose not to, or the Board may decide that he or she should not, receive documents or take part in Board discussions while the matter is being considered. Conflicts of interest, including related party transactions, are a standing agenda item and are considered by the Board at each Board meeting.
TenureThe mere fact that a director has served on the Board for a lengthy period of time does not, of itself, suggest a lack of independence; however, the Board has agreed that an non-executive director’s term should be approximately 10 years. Under the Company’s Constitution, there is no maximum fixed term or retirement age for non-executive directors. The Board considers that a mandatory limit on tenure would deprive the Group of valuable and relevant corporate experience in the complex world of international general insurance and reinsurance. John M Green has been a non-executive director since 2010 and Deputy Chair since 2015. He was re-elected as a director at the 2019 Annual General Meeting (AGM). QBE’s other directors believe that Mr Green continues to exercise independent judgement and, through his QBE experience, makes an important contribution. The tenure of each director is set out in the Board of Directors section of the Annual Report and can also be found on the QBE website at www.qbe.com/about-qbe/group-board-of-directors.
The Constitution provides that no director, except the Group Chief Executive Officer, shall hold office for a continuous period in excess of three years or past the third AGM following a director’s appointment, whichever is the longer, without submission for individual re-election.
QB
E In
suran
ce Gro
up
A
nn
ual R
epo
rt 2020
43
Oth
er in
form
ation
6
Fin
ancial
Rep
ort
5
Perfo
rman
ce o
verv
iew
1
Op
erating an
d
finan
cial review
2
Go
vern
ance
3
Directo
rs' R
epo
rt
4
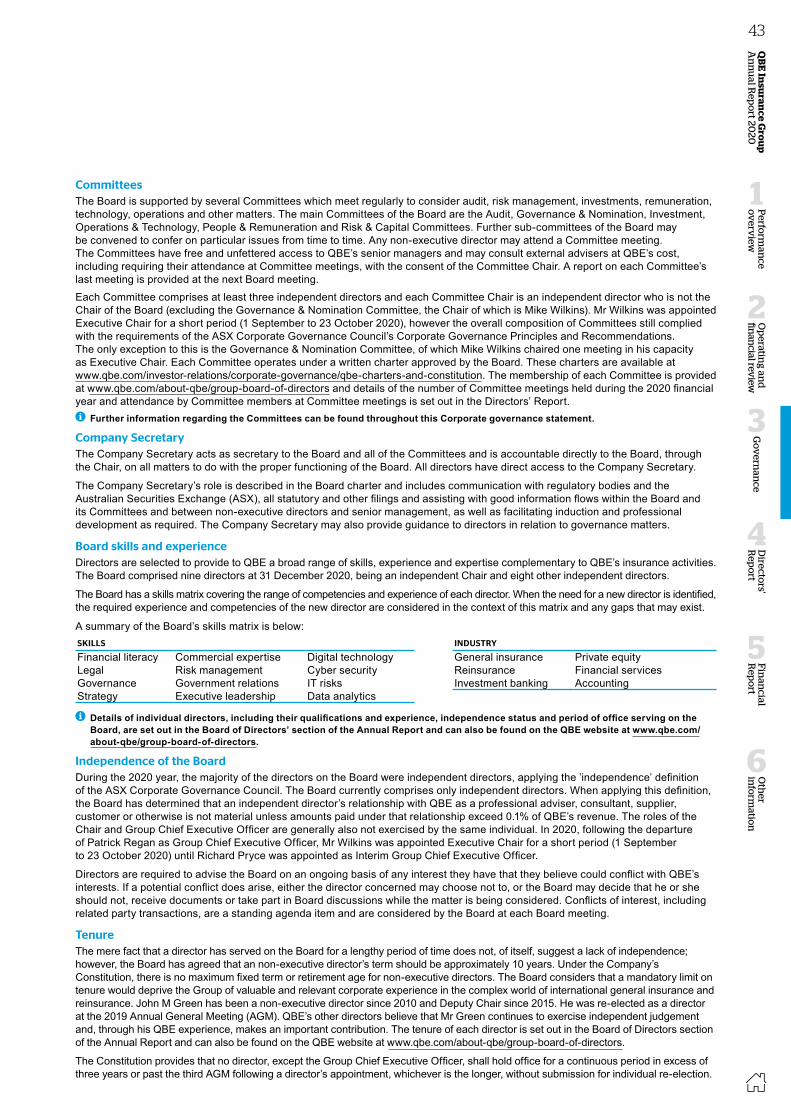
Corporate governance statement
QBE is committed to the highest standards of corporate governance. The QBE DNA consists of seven interwoven elements that are fundamental to QBE and how QBE needs to operate in the future to succeed, recognising its customers, people, shareholders and communities. QBE believes that a culture that rewards transparency, integrity and performance will promote its long‑term sustainability and the ongoing success of its business.
Board and management
Board functionsThe Board charter sets out the role and responsibilities of the Board, including matters expressly reserved for the Board and those delegated to its Committees and management. The role of the Board is to represent and serve the interests of shareholders by providing guidance and oversight of QBE’s strategies, policies and performance. This includes demonstrating leadership, setting the strategic direction for QBE, approving the values of QBE that underpin the desired culture, monitoring the performance of management in the delivery of strategy, and instilling the values and desired culture of QBE. The Board’s principal objective is to maintain and increase shareholder value while ensuring that the activities of QBE are properly managed.
The Board reviews strategy on an ongoing basis. To help the Board maintain its understanding of the business and to effectively assess management, directors receive regular presentations from the divisional chief executive officers and other senior managers of the various divisions on relevant topics, including budgets, three-year business plans and operating performance. The Board receives updated forecasts during the year. The non-executive directors also have contact with senior executives in various forums throughout the year.
Visits by non-executive directors to QBE’s offices in key locations are encouraged. The Board meets regularly in Australia and, due to QBE’s substantial overseas operations, usually spends time in the United Kingdom and the United States each year; however, in 2020, due to COVID-19, the majority of Board and Committee meetings, strategy sessions and other meetings were held virtually.
Each formal Board meeting normally considers reports from the Group Chief Executive Officer and the Group Chief Financial Officer together with other relevant reports. The non-executive directors regularly meet in the absence of management. The Chair and Group Chief Executive Officer in particular, and directors in general, including those on the divisional boards, have substantial contact outside Board and Committee meetings.
Details of the number of Board meetings held during the 2020 financial year and attendance by directors are set out in the Directors’ Report. Directors are expected to attend all Board meetings.
Senior management functionsManagement’s responsibilities are to:• develop a draft strategy, make recommendations to the Board and implement the Board approved strategy, subject to market conditions;• instill and reinforce QBE’s values and desired culture;• prepare annual budgets and three-year business plans;• carry on day-to-day operations within the Board approved annual budget and three-year business plans, subject to market conditions;• design and maintain internal controls;• set-up and keep under review an effective risk management and compliance management system, and monitor and manage
all material risks consistent with the strategic objectives, risk appetite statements and policies approved by the Board;• provide the Board with accurate, timely and clear information on the Group’s operations, including on compliance with material
legal and regulatory requirements and any conduct materially inconsistent with the Group Code of Ethics and Conduct;• inform the Board of material matters and keep the Board and market fully informed about material continuous disclosure; and• monitor that succession plans exist for all Group executive positions other than the Group Chief Executive Officer. The succession plans
for the Group Chief Executive Officer are managed by Governance & Nomination Committee, and are discussed in more detail below.
The Board delegates responsibility to the Group Chief Executive Officer for the day-to-day management of the business.
QBE has operated under an extensive written system of delegated authorities for many years. In particular, a written delegated authority with specified limits is approved by the Board each year to enable the Group Chief Executive Officer to conduct QBE’s business in accordance with detailed budgets and business plans. This delegated authority deals with topics such as underwriting, reinsurance protection, claims, investments, acquisitions and expenses. The Group Chief Executive Officer delegates authority to management throughout the Group on a selective basis, taking into account expertise and past performance. Compliance with delegated authorities is monitored by management and adjusted as required for actual performance, market conditions and other factors. Management and the Group’s internal audit teams review compliance with delegated authorities and any breach can lead to disciplinary procedures, including dismissal.
ChairThe independent Chair of the Board is Mike Wilkins AO, who was appointed to that role in March 2020. The Chair is responsible for ensuring that the Board functions as an effective and cohesive group. The Chair works closely with the Group Chief Executive Officer to determine the strategic direction for QBE and to establish high standards of governance and leadership. Mike Wilkins was appointed to the role of Executive Chair from 1 September to 23 October 2020. During this time, John M Green, the independent Deputy Chair, fulfilled the role of independent Chair when Mr Wilkins was conflicted.
42
CommitteesThe Board is supported by several Committees which meet regularly to consider audit, risk management, investments, remuneration, technology, operations and other matters. The main Committees of the Board are the Audit, Governance & Nomination, Investment, Operations & Technology, People & Remuneration and Risk & Capital Committees. Further sub-committees of the Board may be convened to confer on particular issues from time to time. Any non-executive director may attend a Committee meeting. The Committees have free and unfettered access to QBE’s senior managers and may consult external advisers at QBE’s cost, including requiring their attendance at Committee meetings, with the consent of the Committee Chair. A report on each Committee’s last meeting is provided at the next Board meeting.
Each Committee comprises at least three independent directors and each Committee Chair is an independent director who is not the Chair of the Board (excluding the Governance & Nomination Committee, the Chair of which is Mike Wilkins). Mr Wilkins was appointed Executive Chair for a short period (1 September to 23 October 2020), however the overall composition of Committees still complied with the requirements of the ASX Corporate Governance Council’s Corporate Governance Principles and Recommendations. The only exception to this is the Governance & Nomination Committee, of which Mike Wilkins chaired one meeting in his capacity as Executive Chair. Each Committee operates under a written charter approved by the Board. These charters are available at www.qbe.com/investor-relations/corporate-governance/qbe-charters-and-constitution. The membership of each Committee is provided at www.qbe.com/about-qbe/group-board-of-directors and details of the number of Committee meetings held during the 2020 financial year and attendance by Committee members at Committee meetings is set out in the Directors’ Report.
Further information regarding the Committees can be found throughout this Corporate governance statement.
Company SecretaryThe Company Secretary acts as secretary to the Board and all of the Committees and is accountable directly to the Board, through the Chair, on all matters to do with the proper functioning of the Board. All directors have direct access to the Company Secretary.
The Company Secretary’s role is described in the Board charter and includes communication with regulatory bodies and the Australian Securities Exchange (ASX), all statutory and other filings and assisting with good information flows within the Board and its Committees and between non-executive directors and senior management, as well as facilitating induction and professional development as required. The Company Secretary may also provide guidance to directors in relation to governance matters.
Board skills and experienceDirectors are selected to provide to QBE a broad range of skills, experience and expertise complementary to QBE’s insurance activities. The Board comprised nine directors at 31 December 2020, being an independent Chair and eight other independent directors.
The Board has a skills matrix covering the range of competencies and experience of each director. When the need for a new director is identified, the required experience and competencies of the new director are considered in the context of this matrix and any gaps that may exist.
A summary of the Board’s skills matrix is below:SKILLS INDUSTRY
Financial literacy Commercial expertise Digital technology General insurance Private equityLegal Risk management Cyber security Reinsurance Financial servicesGovernance Government relations IT risks Investment banking AccountingStrategy Executive leadership Data analytics
Details of individual directors, including their qualifications and experience, independence status and period of office serving on the Board, are set out in the Board of Directors’ section of the Annual Report and can also be found on the QBE website at www.qbe.com/about-qbe/group-board-of-directors.
Independence of the BoardDuring the 2020 year, the majority of the directors on the Board were independent directors, applying the ’independence’ definition of the ASX Corporate Governance Council. The Board currently comprises only independent directors. When applying this definition, the Board has determined that an independent director’s relationship with QBE as a professional adviser, consultant, supplier, customer or otherwise is not material unless amounts paid under that relationship exceed 0.1% of QBE’s revenue. The roles of the Chair and Group Chief Executive Officer are generally also not exercised by the same individual. In 2020, following the departure of Patrick Regan as Group Chief Executive Officer, Mr Wilkins was appointed Executive Chair for a short period (1 September to 23 October 2020) until Richard Pryce was appointed as Interim Group Chief Executive Officer.
Directors are required to advise the Board on an ongoing basis of any interest they have that they believe could conflict with QBE’s interests. If a potential conflict does arise, either the director concerned may choose not to, or the Board may decide that he or she should not, receive documents or take part in Board discussions while the matter is being considered. Conflicts of interest, including related party transactions, are a standing agenda item and are considered by the Board at each Board meeting.
TenureThe mere fact that a director has served on the Board for a lengthy period of time does not, of itself, suggest a lack of independence; however, the Board has agreed that an non-executive director’s term should be approximately 10 years. Under the Company’s Constitution, there is no maximum fixed term or retirement age for non-executive directors. The Board considers that a mandatory limit on tenure would deprive the Group of valuable and relevant corporate experience in the complex world of international general insurance and reinsurance. John M Green has been a non-executive director since 2010 and Deputy Chair since 2015. He was re-elected as a director at the 2019 Annual General Meeting (AGM). QBE’s other directors believe that Mr Green continues to exercise independent judgement and, through his QBE experience, makes an important contribution. The tenure of each director is set out in the Board of Directors section of the Annual Report and can also be found on the QBE website at www.qbe.com/about-qbe/group-board-of-directors.
The Constitution provides that no director, except the Group Chief Executive Officer, shall hold office for a continuous period in excess of three years or past the third AGM following a director’s appointment, whichever is the longer, without submission for individual re-election.
QB
E In
suran
ce Gro
up
A
nn
ual R
epo
rt 2020
43O
ther
info
rmatio
n
6
Fin
ancial
Rep
ort
5
Perfo
rman
ce o
verv
iew
1
Op
erating an
d
finan
cial review
2
Go
vern
ance
3
Directo
rs' R
epo
rt
4

Corporate governance statement continued
Board and senior executive selection processThe Board has a Governance & Nomination Committee which meets regularly during the year around the time of the Board meetings. The Committee assists the Board in appointing directors so that the Board as a whole has the necessary range of skills, knowledge and experience to be effective. The Committee also assists the Board in managing the succession plans for the Group Chief Executive Officer and reviewing succession plans for members of the Group Executive Committee. The Governance & Nomination Committee is comprised of all the non-executive directors of the Board and is chaired by Mike Wilkins.
A formal process for the selection and appointment of directors or senior executives is undertaken by the Governance & Nomination Committee and Board. Appropriate background checks are undertaken before the Board appoints a new director or senior executive or puts forward a candidate for election. External consultants may be employed, where necessary, to search for prospective directors. Candidates are assessed against the required skills and on their qualifications, background and personal qualities.
For Board appointments, candidates must also have the required time to commit to the position. The Board regularly reviews the mix of skills that is required to operate effectively. Under the Constitution, the size of the Board is limited to 12 directors. The Board considers that a maximum of 12 directors reflects the largest realistic size of the Board that is consistent with:• maintaining the Board’s efficiency and cohesion in carrying out its governance duties on behalf of shareholders;• reducing the risk of a director being insufficiently involved and informed in the business of QBE; and• providing individual directors with greater potential to contribute and participate.
QBE also provides shareholders with all material information in its possession that is relevant to a decision on whether or not to elect or re-elect a director through a number of channels, such as the notice of meeting, director biographies and other information contained in the Annual Report.
Upon appointment, each non-executive director and senior executive is provided with a written agreement which sets out the terms of their appointment.
The Board believes that orderly succession and renewal contribute to strong corporate governance and are achieved by careful planning and continual review. As an ongoing evaluation, the Board regularly discusses its composition in relation to the mix of skills, diversity and geographic location of directors to meet the needs of QBE.
Director induction and trainingUpon appointment, directors attend induction sessions where they are briefed on QBE’s history, DNA, strategy, financials, and risk management and governance frameworks.
The Board obtains the information it requires to be effective including, where necessary, independent professional advice.
A non-executive director may seek such advice at QBE’s cost with the consent of the Chair. Directors are also provided with ongoing professional development and training programs to enable them to develop and maintain their skills and knowledge at QBE’s cost, with the consent of the Chair. Non-executive directors are required to complete continuing professional development each year, including on insurance, customer and regulatory matters.
Performance evaluation and remunerationPerformance evaluation – Board and directorsThe Chair oversees the performance of the Board, its Committees and each director. The Board regularly reviews its performance through internal and external assessments, and recommendations for either improvement or increased focus are agreed and promptly implemented.
A Board performance evaluation was conducted in 2020 for the 2019 year. The review covered the performance of boards and committees at both the Group and divisional levels.
People & Remuneration CommitteeThe Board has a People & Remuneration Committee which meets at least quarterly to assist it in, amongst other things, overseeing major remuneration practices of QBE. The People & Remuneration Committee is comprised of independent directors and is chaired by John M Green.
Performance evaluation – senior executivesThe People & Remuneration Committee oversees the performance of senior executives. In addition, the Board continually monitors the performance of senior executives through regular review and reporting.
In 2020, QBE used a balanced scorecard of an individual’s achievement against specific strategic priorities. Other than as set out in the Remuneration Report, senior executives have 35% of their short-term incentive plan outcome determined with reference to individual objectives.
The scorecard is aligned to QBE’s business plans and measures objectives which supported QBE’s strategic objectives in 2020. The Remuneration Report sets out a summary of the key objectives and outcomes against these for the executive key management personnel.
The Interim Group Chief Executive Officer’s scorecard was formulated initially through a discussion between the Interim Group Chief Executive Officer and the Chair and was approved by the Board. Consistent with the Interim Group Chief Executive Officer’s scorecard, the scorecards for the rest of senior executives align with QBE’s business plans and support the strategic priorities. The approval and assessment process for the senior executives scorecards is completed by the People & Remuneration Committee.
A senior executives performance evaluation was conducted for the 2020 year. The 2020 objectives for senior executives were used to measure their performance for the year.
44
Remuneration policies and practicesDetails of QBE’s policies and practices regarding the remuneration of executives and non-executive directors (being Key Management Personnel) are set out in the Remuneration Report.
Other than meeting statutory superannuation requirements, QBE does not have in place any retirement benefit schemes for non-executive directors.
QBE’s Securities Trading Policy outlines QBE’s approach to derivatives or otherwise limiting the economic risk of participating in an equity-based remuneration scheme, available at www.qbe.com/investor-relations/corporate-governance/global-policies.
Group governanceGovernance frameworksQBE has a Board-approved Group governance framework that sets out five overarching governance principles that support best practice governance across QBE and is designed to encourage collective accountability across Group Head Office and the divisions.
The framework defines the roles, responsibilities and composition of the Group and divisional boards and committees to facilitate the governance surrounding appropriate guidance and oversight over the business. The framework also strengthens the relationship and information flows between these governance bodies, so they can work together to achieve the best possible outcomes for QBE.
The executive governance framework governs the mechanisms supporting the exercise of Group functions by executives, with a focus on information flows between the Group Executive Committees, the Board and divisions.
QBE DNAEverything we do at QBE is underpinned by our QBE DNA, which consists of seven interwoven elements. These elements describe who we are and what we stand for, and outline the standards and behaviours we expect from our employees to achieve our goals and fulfil our purpose.
At QBE, when we show-up for our customers, shareholders, communities and each other:• We are customer-centred• We are technical experts• We are diverse• We are fast-paced• We are courageous• We are accountable• We are a team.
The QBE DNA is set and approved by the Board, with the Group Executive Committee responsible for bringing the elements to life throughout the organisation through our day-to-day interactions as well through our recruitment, onboarding, performance, reward, leadership, feedback, learning and communication practices.
Employees’ demonstration of the QBE DNA is integral to how strategic performance objectives are measured. At the end of the performance year, employees are assessed in terms of both what they have achieved and how they have achieved it – whether their behaviours have aligned to the QBE DNA. This in turn links to reward outcomes and is applicable for all employees, including senior executives.
The Group Code of Ethics and Conduct addresses the responsibilities employees have to the Group, to each other and to customers, suppliers, communities and governments. It provides clear guidance to help employees apply good judgement and make considered decisions that exemplify the QBE DNA.
Group policiesQBE has a global policy framework which is designed to facilitate an understanding of the Group’s compliance and conduct expectations. QBE’s approach in key compliance areas recognises that employees (including contractors, directors and agents) are key to maintaining a compliant and ethical approach to QBE’s business practices. Most global policies are supported by Group standards and procedures that provide additional information and guidance to support employees.
The Group Code of Ethics and Conduct applies to all employees as well as directors, agents and contractors. The Group Code of Ethics and Conduct is complemented by the Group Whistleblowing Policy which was updated on 1 January 2020. The Board oversees the Group Code of Ethics and Conduct and receives reports on compliance with the Group Code of Ethics and Conduct. The Group Conflicts of Interest Policy was updated in August 2020 and operates together with the Group Gift and Entertainment Policy to create a system to identify and report actual or potential conflicts of interest. In recognition of the importance of protecting employee and customer data across QBE, a privacy framework has been reviewed, updated and launched in June 2020 to reflect developments in privacy laws across the global footprint.
QBE’s policy framework also addresses sanctions, outsourcing, modern slavery, anti-bribery and corruption, health, safety and wellbeing, continuous disclosure, diversity and inclusion, securities trading, flexible working, supplier sustainability, and environment and energy. Policy summaries are available at www.qbe.com/investor-relations/corporate-governance/global-policies. Material breaches and incidents relating to the policies within the policy framework, including the Group Code of Ethics and Conduct and the Group Whistleblowing Policy, are required to be recorded and cascaded through to Board reporting.
Global policies are also in place to address prudential requirements of APRA, including risk management, cyber, business continuity management, reinsurance management, fitness and propriety and material outsourcing.
In Australia, QBE complies with the General Insurance Code of Practice, a self-regulated code relating to the provision of products and services to customers of the general insurance industry in Australia. The Code Governance Committee (CGC) is the independent body that monitors and enforces insurers’ compliance with the Code. QBE’s Australian business is also a member of the Australian Financial Complaints Authority (AFCA), the external dispute resolution scheme that deals with complaints from consumers in the financial system.
QB
E In
suran
ce Gro
up
A
nn
ual R
epo
rt 2020
45
Oth
er in
form
ation
6
Fin
ancial
Rep
ort
5
Perfo
rman
ce o
verv
iew
1
Op
erating an
d
finan
cial review
2
Go
vern
ance
3
Directo
rs' R
epo
rt
4
Corporate governance statement continued
Board and senior executive selection processThe Board has a Governance & Nomination Committee which meets regularly during the year around the time of the Board meetings. The Committee assists the Board in appointing directors so that the Board as a whole has the necessary range of skills, knowledge and experience to be effective. The Committee also assists the Board in managing the succession plans for the Group Chief Executive Officer and reviewing succession plans for members of the Group Executive Committee. The Governance & Nomination Committee is comprised of all the non-executive directors of the Board and is chaired by Mike Wilkins.
A formal process for the selection and appointment of directors or senior executives is undertaken by the Governance & Nomination Committee and Board. Appropriate background checks are undertaken before the Board appoints a new director or senior executive or puts forward a candidate for election. External consultants may be employed, where necessary, to search for prospective directors. Candidates are assessed against the required skills and on their qualifications, background and personal qualities.
For Board appointments, candidates must also have the required time to commit to the position. The Board regularly reviews the mix of skills that is required to operate effectively. Under the Constitution, the size of the Board is limited to 12 directors. The Board considers that a maximum of 12 directors reflects the largest realistic size of the Board that is consistent with:• maintaining the Board’s efficiency and cohesion in carrying out its governance duties on behalf of shareholders;• reducing the risk of a director being insufficiently involved and informed in the business of QBE; and• providing individual directors with greater potential to contribute and participate.
QBE also provides shareholders with all material information in its possession that is relevant to a decision on whether or not to elect or re-elect a director through a number of channels, such as the notice of meeting, director biographies and other information contained in the Annual Report.
Upon appointment, each non-executive director and senior executive is provided with a written agreement which sets out the terms of their appointment.
The Board believes that orderly succession and renewal contribute to strong corporate governance and are achieved by careful planning and continual review. As an ongoing evaluation, the Board regularly discusses its composition in relation to the mix of skills, diversity and geographic location of directors to meet the needs of QBE.
Director induction and trainingUpon appointment, directors attend induction sessions where they are briefed on QBE’s history, DNA, strategy, financials, and risk management and governance frameworks.
The Board obtains the information it requires to be effective including, where necessary, independent professional advice.
A non-executive director may seek such advice at QBE’s cost with the consent of the Chair. Directors are also provided with ongoing professional development and training programs to enable them to develop and maintain their skills and knowledge at QBE’s cost, with the consent of the Chair. Non-executive directors are required to complete continuing professional development each year, including on insurance, customer and regulatory matters.
Performance evaluation and remunerationPerformance evaluation – Board and directorsThe Chair oversees the performance of the Board, its Committees and each director. The Board regularly reviews its performance through internal and external assessments, and recommendations for either improvement or increased focus are agreed and promptly implemented.
A Board performance evaluation was conducted in 2020 for the 2019 year. The review covered the performance of boards and committees at both the Group and divisional levels.
People & Remuneration CommitteeThe Board has a People & Remuneration Committee which meets at least quarterly to assist it in, amongst other things, overseeing major remuneration practices of QBE. The People & Remuneration Committee is comprised of independent directors and is chaired by John M Green.
Performance evaluation – senior executivesThe People & Remuneration Committee oversees the performance of senior executives. In addition, the Board continually monitors the performance of senior executives through regular review and reporting.
In 2020, QBE used a balanced scorecard of an individual’s achievement against specific strategic priorities. Other than as set out in the Remuneration Report, senior executives have 35% of their short-term incentive plan outcome determined with reference to individual objectives.
The scorecard is aligned to QBE’s business plans and measures objectives which supported QBE’s strategic objectives in 2020. The Remuneration Report sets out a summary of the key objectives and outcomes against these for the executive key management personnel.
The Interim Group Chief Executive Officer’s scorecard was formulated initially through a discussion between the Interim Group Chief Executive Officer and the Chair and was approved by the Board. Consistent with the Interim Group Chief Executive Officer’s scorecard, the scorecards for the rest of senior executives align with QBE’s business plans and support the strategic priorities. The approval and assessment process for the senior executives scorecards is completed by the People & Remuneration Committee.
A senior executives performance evaluation was conducted for the 2020 year. The 2020 objectives for senior executives were used to measure their performance for the year.
44
Remuneration policies and practicesDetails of QBE’s policies and practices regarding the remuneration of executives and non-executive directors (being Key Management Personnel) are set out in the Remuneration Report.
Other than meeting statutory superannuation requirements, QBE does not have in place any retirement benefit schemes for non-executive directors.
QBE’s Securities Trading Policy outlines QBE’s approach to derivatives or otherwise limiting the economic risk of participating in an equity-based remuneration scheme, available at www.qbe.com/investor-relations/corporate-governance/global-policies.
Group governanceGovernance frameworksQBE has a Board-approved Group governance framework that sets out five overarching governance principles that support best practice governance across QBE and is designed to encourage collective accountability across Group Head Office and the divisions.
The framework defines the roles, responsibilities and composition of the Group and divisional boards and committees to facilitate the governance surrounding appropriate guidance and oversight over the business. The framework also strengthens the relationship and information flows between these governance bodies, so they can work together to achieve the best possible outcomes for QBE.
The executive governance framework governs the mechanisms supporting the exercise of Group functions by executives, with a focus on information flows between the Group Executive Committees, the Board and divisions.
QBE DNAEverything we do at QBE is underpinned by our QBE DNA, which consists of seven interwoven elements. These elements describe who we are and what we stand for, and outline the standards and behaviours we expect from our employees to achieve our goals and fulfil our purpose.
At QBE, when we show-up for our customers, shareholders, communities and each other:• We are customer-centred• We are technical experts• We are diverse• We are fast-paced• We are courageous• We are accountable• We are a team.
The QBE DNA is set and approved by the Board, with the Group Executive Committee responsible for bringing the elements to life throughout the organisation through our day-to-day interactions as well through our recruitment, onboarding, performance, reward, leadership, feedback, learning and communication practices.
Employees’ demonstration of the QBE DNA is integral to how strategic performance objectives are measured. At the end of the performance year, employees are assessed in terms of both what they have achieved and how they have achieved it – whether their behaviours have aligned to the QBE DNA. This in turn links to reward outcomes and is applicable for all employees, including senior executives.
The Group Code of Ethics and Conduct addresses the responsibilities employees have to the Group, to each other and to customers, suppliers, communities and governments. It provides clear guidance to help employees apply good judgement and make considered decisions that exemplify the QBE DNA.
Group policiesQBE has a global policy framework which is designed to facilitate an understanding of the Group’s compliance and conduct expectations. QBE’s approach in key compliance areas recognises that employees (including contractors, directors and agents) are key to maintaining a compliant and ethical approach to QBE’s business practices. Most global policies are supported by Group standards and procedures that provide additional information and guidance to support employees.
The Group Code of Ethics and Conduct applies to all employees as well as directors, agents and contractors. The Group Code of Ethics and Conduct is complemented by the Group Whistleblowing Policy which was updated on 1 January 2020. The Board oversees the Group Code of Ethics and Conduct and receives reports on compliance with the Group Code of Ethics and Conduct. The Group Conflicts of Interest Policy was updated in August 2020 and operates together with the Group Gift and Entertainment Policy to create a system to identify and report actual or potential conflicts of interest. In recognition of the importance of protecting employee and customer data across QBE, a privacy framework has been reviewed, updated and launched in June 2020 to reflect developments in privacy laws across the global footprint.
QBE’s policy framework also addresses sanctions, outsourcing, modern slavery, anti-bribery and corruption, health, safety and wellbeing, continuous disclosure, diversity and inclusion, securities trading, flexible working, supplier sustainability, and environment and energy. Policy summaries are available at www.qbe.com/investor-relations/corporate-governance/global-policies. Material breaches and incidents relating to the policies within the policy framework, including the Group Code of Ethics and Conduct and the Group Whistleblowing Policy, are required to be recorded and cascaded through to Board reporting.
Global policies are also in place to address prudential requirements of APRA, including risk management, cyber, business continuity management, reinsurance management, fitness and propriety and material outsourcing.
In Australia, QBE complies with the General Insurance Code of Practice, a self-regulated code relating to the provision of products and services to customers of the general insurance industry in Australia. The Code Governance Committee (CGC) is the independent body that monitors and enforces insurers’ compliance with the Code. QBE’s Australian business is also a member of the Australian Financial Complaints Authority (AFCA), the external dispute resolution scheme that deals with complaints from consumers in the financial system.
QB
E In
suran
ce Gro
up
A
nn
ual R
epo
rt 2020
45O
ther
info
rmatio
n
6
Fin
ancial
Rep
ort
5
Perfo
rman
ce o
verv
iew
1
Op
erating an
d
finan
cial review
2
Go
vern
ance
3
Directo
rs' R
epo
rt
4

Corporate governance statement continued
Diversity and inclusionQBE is committed to diversity and to offering a workplace culture that values and leverages the ideas, capabilities and experiences of our global workforce. The Global Diversity and Inclusion Policy aims, through its implementation, that QBE is:• attracting and hiring diverse teams that enhance the approach to problem solving and innovation;• supporting productivity and engagement by offering an inclusive, flexible and modern workplace;• leveraging diverse skills to enhance the customer experience and organisational growth; and• supporting our local communities and strengthening our brand reputation.
To achieve this, the Group Executive Committee, which constitutes the Global Diversity & Inclusion Council, has set the following objectives which are implemented and overseen by the Council and assessed and reviewed annually by the People & Remuneration Committee of the Board:
AREA OF FOCUS ACHIEVEMENTS IN 2020
Inclusive leadership – look to support the set-up of collaborative/inclusive teams and normalise flexibility to increase productivity and retention
• To enable our leaders to help their teams navigate a year unlike any other, we deployed a range of resources and programs. We designed, delivered and embedded a targeted and contemporary global leadership development initiative focused on building the core mindset and skills needed for future leadership at QBE.
• Our Flex@QBE Principles outline our approach to workplace flexibility, supporting our Global Diversity and Inclusion Policy. We believe the office will continue to be critical to connection, innovation and collaboration, however, we also recognise the benefits of a more flexible workforce. Our aim is to drive a common culture through shared principles. Our forward looking business strategy speaks to greater trust and empowerment with purpose led, agile teams. We have continued to see benefits made by our teams in flexible working – a valuable building block to enable us to move forward toward a more agile business.
• Continued commitment from our senior-level leadership to external pledges which require visible sponsorship and accountability – including Male Champions of Change in Australia, the HM Treasury Women in Finance Charter in the United Kingdom and France’s L’Autre Cercle charter on LGBT+ inclusion. This is in addition to being a signatory to the Statement of Support for the Women’s Empowerment Principles.
Diversity in leadership representation – progressively inclusive, gender balanced leadership teams at senior management
• Across the Group, women in leadership (the Group Executive Committee and our top three levels of management) reached 34.8% at the end of 2020, with 39% of all hires and 46% of promotions being women, demonstrating a continued focus on gender diversity in leadership representation. We continue to identify pain points and develop targeted initiatives to address hiring, promotion and retention challenges related to gender and in 2020 developed a target of having 40% of women in leadership by 2025.
• QBE continues to see gender balance in our hiring across all employee levels, with 50% of all hires being women. We have also continued to build our pipeline of female talent, with 58% of promotions across QBE being women.
Strong pipeline of diverse talent – progressively implement equitable policies and practices to govern QBE’s attraction, retention and optimisation of all talent
• Under our performance management approach, ME@QBE, our leaders are taking increased personal responsibility for mentoring, sponsoring and driving career conversations. We continue to enhance ME@QBE and in 2020 allowed snapshot feedback to be gathered in real time.
• In Australia Pacific, we re-launched the ‘Your Development@QBE’ portal with the aim of providing our employees with the right development programs and resources to support their continuous development.
Fair remuneration – seek to reward our employees fairly and support gender pay equity through regular analysis, monitoring and transparent communication
• In 2020, as part of the global annual salary review process, we again performed an analysis of our workforce to assess pay equity. We continue to advance our methodology to measure gender pay equity using multivariate regression analysis in our major markets of Australia, the United Kingdom, the United States and the Philippines (covering approximately 90% of our workforce). This allowed us to assess gender pay equity based on the key drivers of pay in our organisation, including the role, location and performance of the employee.
• As an average across these markets, our gender pay equity gap is sufficiently small for QBE to be confident that we pay men and women equally in like-for-like roles. However, we recognise that at an individual level, some pay gaps still exist and we will continue to work to address any identified gaps through our ongoing salary review processes and other initiatives.
Customer satisfaction and retention – progressively review our products, policies and practices to enhance equitable access to our diverse customer base
• QBE continues to offer Premiums4Good to our customers, which invites them to join with us to make a real difference. By choosing QBE, a portion of customer’s premium is directed towards investments and select customers can ask us to direct a further 25% of their insurance premium in impact investments – investments in securities with an additional environmental or social objective. This social objective includes social inclusion, diversity and gender.
46
Gender balance at Board and senior management levelsIn 2015, we set ourselves the goal of achieving 35% women in leadership across QBE by 2020. Across the Group, we came close to achieving our goal with an increase over the last year from 33.7% to 34.8%. In 2020, we developed a new target of 40% women in leadership by 2025 and are developing a clear strategy and actions to reach this target.
In 2015, we also set ourselves the goal of achieving 30% women on our Board by 2020. During 2020, the percentage of women on our Board increased from 22% to 33%. Succession planning for the Board will continue to include actions to progress the diversity of our Board, and we have set a new target of 40% women on our Board by 2025.
Details of gender representation across our workforce and management levels together with targets are set out below:
FEMALE REPRESENTATIONGENDER
TARGET BY 2020
ACTUAL 31 DECEMBER
2020
ACTUAL 31 DECEMBER
2019
ACTUAL 31 DECEMBER
2018
ACTUAL 31 DECEMBER
2017
ACTUAL 31 DECEMBER
2016
BASELINE 31 DECEMBER
2015
Board 30% 33% 22% 22% 22% 27% 22%Group Executive Committee (GEC) 30% 27% 27% 11% 11% 10%Level 1 28% 20% 23% 22% 22% 20%Level 2 29% 29% 26% 22% 22% 21%Level 3 36% 35% 34% 32% 30% 29%Women in senior management (total % of GEC and Levels 1–3) 35% 35% 34% 32% 30% 28% 27%Women in workforce 40% to 60% 52% 52% 53% 53% 53% 53%
QBE’s gender target of 40% to 60% for women in the workforce reflects our aim to maintain a gender balance across the organisation, while providing a flexible approach which supports our commitment to achieving our targets for gender diversity in the composition of our Board and senior management.
In addition to gender equality, QBE’s commitment extends to other areas of diversity including:• actively promoting inclusion for lesbian, gay, bisexual, transgender, intersex and queer plus (LGBTIQ+) employees with a global
QBE Pride employee network;• ongoing commitment to supporting Indigenous communities in Australia and launching our third Reconciliation Action Plan (RAP),
which is now at the Innovate stage of the RAP framework, in September 2020; • looking to embed accessibility in the workplace and enhance our ability to employ people with a disability, with our recruitment team
now embedding questions around workplace adjustments into every stage of the recruitment process; and• actively promoting racial equity with a global guide and glossary with advice on how to engage in conversation around race relations,
inequality and injustice.
For further details on our approach and progress, refer to QBE’s 2020 Sustainability Report. QBE also makes an annual filing to comply with the Workplace Gender Equality Act 2012 (Cth) (WGEA) in Australia disclosing our performance against the ‘Gender Equality Indicators’. The report can be found at www.qbe.com/investor-relations/corporate-governance/global-policies.
Communications with shareholdersShareholder engagementQBE is committed to regularly communicating with its shareholders and other stakeholders in a timely and accessible manner, and encouraging shareholder participation at its general meetings. Detailed information about QBE can be found on the website at www.qbe.com including:• its history;• the Board and management;• its Constitution, Board charter and the charters of each of its Committees;• corporate governance and policies;• periodic disclosures, including Annual Report, Half Year Report and Sustainability Report;• ASX announcements;• shareholder calendar;• notices of meeting and any accompanying documents;• presentation materials provided at investor and analyst briefings; and• webcasts of meetings of shareholders and investor and analyst briefings.
The QBE website includes a dedicated investor relations section where shareholders can access relevant information regarding their shares. There is also a direct link where shareholders can access their shareholding online through QBE’s share registry, Computershare. They can update their personal information and provide their email address and elect to receive communications electronically. Shareholders can discuss their shareholding with either QBE’s shareholder services department by email to [email protected] or by contacting QBE’s share registry, Computershare by email to [email protected] or by phone at +61 3 9415 4840. Shareholders may request to receive a hard copy of the Annual Report by updating their communication preferences by logging into their shareholding at www.investorcentre.com/au.
QBE has a comprehensive investor relations program that facilitates effective communication with its investors. The Group Chief Executive Officer, Group Chief Financial Officer, Group Chief Risk Officer, Group General Counsel and Company Secretary, Global Head of Investor Relations, Group Executive Corporate Affairs and Sustainability, Group Treasurer and divisional chief executives generally deal with analysts, investors, media, rating agencies and others, taking account of regulatory guidelines including those issued by the ASX on continuous disclosure. The presentations on the 30 June and 31 December period results and other major presentations are sent to the ASX before the presentations commence and are available promptly at www.qbe.com/investor-relations/reports-presentations. The 30 June and 31 December period results presentations are also webcast live and subsequently archived at www.qbe.com/investor-relations/reports-presentations.
QB
E In
suran
ce Gro
up
A
nn
ual R
epo
rt 2020
47
Oth
er in
form
ation
6
Fin
ancial
Rep
ort
5
Perfo
rman
ce o
verv
iew
1
Op
erating an
d
finan
cial review
2
Go
vern
ance
3
Directo
rs' R
epo
rt
4
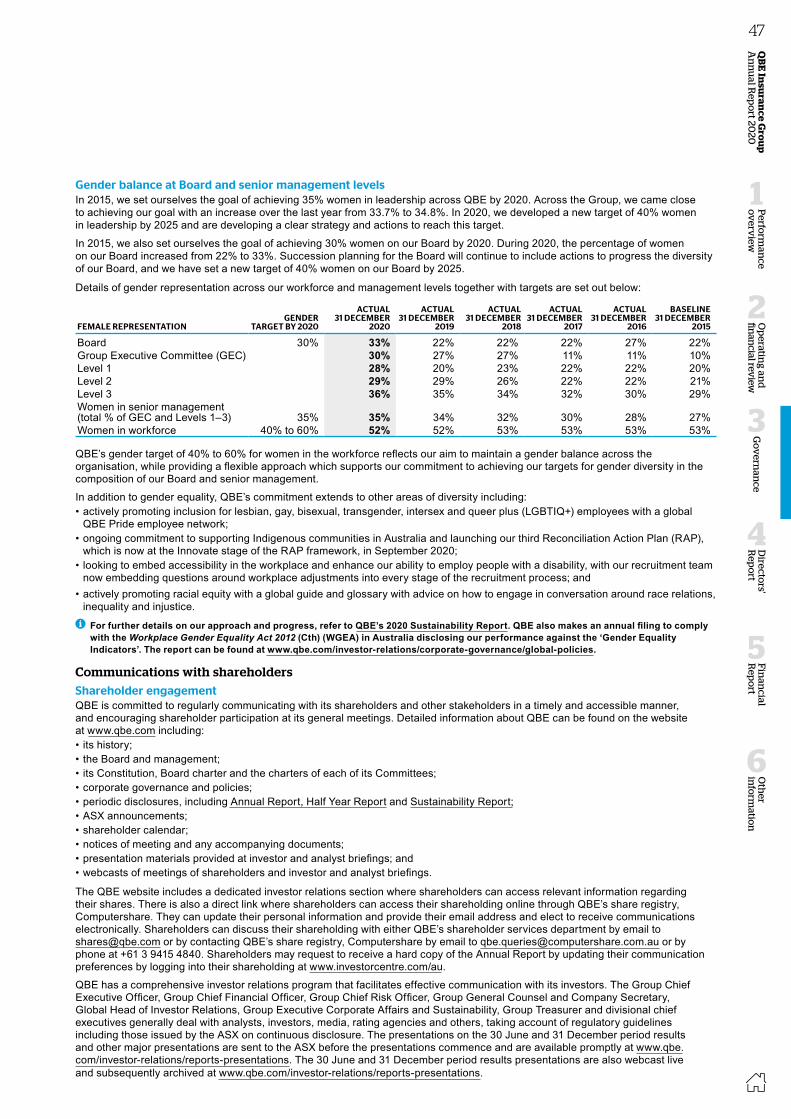
Corporate governance statement continued
Diversity and inclusionQBE is committed to diversity and to offering a workplace culture that values and leverages the ideas, capabilities and experiences of our global workforce. The Global Diversity and Inclusion Policy aims, through its implementation, that QBE is:• attracting and hiring diverse teams that enhance the approach to problem solving and innovation;• supporting productivity and engagement by offering an inclusive, flexible and modern workplace;• leveraging diverse skills to enhance the customer experience and organisational growth; and• supporting our local communities and strengthening our brand reputation.
To achieve this, the Group Executive Committee, which constitutes the Global Diversity & Inclusion Council, has set the following objectives which are implemented and overseen by the Council and assessed and reviewed annually by the People & Remuneration Committee of the Board:
AREA OF FOCUS ACHIEVEMENTS IN 2020
Inclusive leadership – look to support the set-up of collaborative/inclusive teams and normalise flexibility to increase productivity and retention
• To enable our leaders to help their teams navigate a year unlike any other, we deployed a range of resources and programs. We designed, delivered and embedded a targeted and contemporary global leadership development initiative focused on building the core mindset and skills needed for future leadership at QBE.
• Our Flex@QBE Principles outline our approach to workplace flexibility, supporting our Global Diversity and Inclusion Policy. We believe the office will continue to be critical to connection, innovation and collaboration, however, we also recognise the benefits of a more flexible workforce. Our aim is to drive a common culture through shared principles. Our forward looking business strategy speaks to greater trust and empowerment with purpose led, agile teams. We have continued to see benefits made by our teams in flexible working – a valuable building block to enable us to move forward toward a more agile business.
• Continued commitment from our senior-level leadership to external pledges which require visible sponsorship and accountability – including Male Champions of Change in Australia, the HM Treasury Women in Finance Charter in the United Kingdom and France’s L’Autre Cercle charter on LGBT+ inclusion. This is in addition to being a signatory to the Statement of Support for the Women’s Empowerment Principles.
Diversity in leadership representation – progressively inclusive, gender balanced leadership teams at senior management
• Across the Group, women in leadership (the Group Executive Committee and our top three levels of management) reached 34.8% at the end of 2020, with 39% of all hires and 46% of promotions being women, demonstrating a continued focus on gender diversity in leadership representation. We continue to identify pain points and develop targeted initiatives to address hiring, promotion and retention challenges related to gender and in 2020 developed a target of having 40% of women in leadership by 2025.
• QBE continues to see gender balance in our hiring across all employee levels, with 50% of all hires being women. We have also continued to build our pipeline of female talent, with 58% of promotions across QBE being women.
Strong pipeline of diverse talent – progressively implement equitable policies and practices to govern QBE’s attraction, retention and optimisation of all talent
• Under our performance management approach, ME@QBE, our leaders are taking increased personal responsibility for mentoring, sponsoring and driving career conversations. We continue to enhance ME@QBE and in 2020 allowed snapshot feedback to be gathered in real time.
• In Australia Pacific, we re-launched the ‘Your Development@QBE’ portal with the aim of providing our employees with the right development programs and resources to support their continuous development.
Fair remuneration – seek to reward our employees fairly and support gender pay equity through regular analysis, monitoring and transparent communication
• In 2020, as part of the global annual salary review process, we again performed an analysis of our workforce to assess pay equity. We continue to advance our methodology to measure gender pay equity using multivariate regression analysis in our major markets of Australia, the United Kingdom, the United States and the Philippines (covering approximately 90% of our workforce). This allowed us to assess gender pay equity based on the key drivers of pay in our organisation, including the role, location and performance of the employee.
• As an average across these markets, our gender pay equity gap is sufficiently small for QBE to be confident that we pay men and women equally in like-for-like roles. However, we recognise that at an individual level, some pay gaps still exist and we will continue to work to address any identified gaps through our ongoing salary review processes and other initiatives.
Customer satisfaction and retention – progressively review our products, policies and practices to enhance equitable access to our diverse customer base
• QBE continues to offer Premiums4Good to our customers, which invites them to join with us to make a real difference. By choosing QBE, a portion of customer’s premium is directed towards investments and select customers can ask us to direct a further 25% of their insurance premium in impact investments – investments in securities with an additional environmental or social objective. This social objective includes social inclusion, diversity and gender.
46
Gender balance at Board and senior management levelsIn 2015, we set ourselves the goal of achieving 35% women in leadership across QBE by 2020. Across the Group, we came close to achieving our goal with an increase over the last year from 33.7% to 34.8%. In 2020, we developed a new target of 40% women in leadership by 2025 and are developing a clear strategy and actions to reach this target.
In 2015, we also set ourselves the goal of achieving 30% women on our Board by 2020. During 2020, the percentage of women on our Board increased from 22% to 33%. Succession planning for the Board will continue to include actions to progress the diversity of our Board, and we have set a new target of 40% women on our Board by 2025.
Details of gender representation across our workforce and management levels together with targets are set out below:
FEMALE REPRESENTATIONGENDER
TARGET BY 2020
ACTUAL 31 DECEMBER
2020
ACTUAL 31 DECEMBER
2019
ACTUAL 31 DECEMBER
2018
ACTUAL 31 DECEMBER
2017
ACTUAL 31 DECEMBER
2016
BASELINE 31 DECEMBER
2015
Board 30% 33% 22% 22% 22% 27% 22%Group Executive Committee (GEC) 30% 27% 27% 11% 11% 10%Level 1 28% 20% 23% 22% 22% 20%Level 2 29% 29% 26% 22% 22% 21%Level 3 36% 35% 34% 32% 30% 29%Women in senior management (total % of GEC and Levels 1–3) 35% 35% 34% 32% 30% 28% 27%Women in workforce 40% to 60% 52% 52% 53% 53% 53% 53%
QBE’s gender target of 40% to 60% for women in the workforce reflects our aim to maintain a gender balance across the organisation, while providing a flexible approach which supports our commitment to achieving our targets for gender diversity in the composition of our Board and senior management.
In addition to gender equality, QBE’s commitment extends to other areas of diversity including:• actively promoting inclusion for lesbian, gay, bisexual, transgender, intersex and queer plus (LGBTIQ+) employees with a global
QBE Pride employee network;• ongoing commitment to supporting Indigenous communities in Australia and launching our third Reconciliation Action Plan (RAP),
which is now at the Innovate stage of the RAP framework, in September 2020; • looking to embed accessibility in the workplace and enhance our ability to employ people with a disability, with our recruitment team
now embedding questions around workplace adjustments into every stage of the recruitment process; and• actively promoting racial equity with a global guide and glossary with advice on how to engage in conversation around race relations,
inequality and injustice.
For further details on our approach and progress, refer to QBE’s 2020 Sustainability Report. QBE also makes an annual filing to comply with the Workplace Gender Equality Act 2012 (Cth) (WGEA) in Australia disclosing our performance against the ‘Gender Equality Indicators’. The report can be found at www.qbe.com/investor-relations/corporate-governance/global-policies.
Communications with shareholdersShareholder engagementQBE is committed to regularly communicating with its shareholders and other stakeholders in a timely and accessible manner, and encouraging shareholder participation at its general meetings. Detailed information about QBE can be found on the website at www.qbe.com including:• its history;• the Board and management;• its Constitution, Board charter and the charters of each of its Committees;• corporate governance and policies;• periodic disclosures, including Annual Report, Half Year Report and Sustainability Report;• ASX announcements;• shareholder calendar;• notices of meeting and any accompanying documents;• presentation materials provided at investor and analyst briefings; and• webcasts of meetings of shareholders and investor and analyst briefings.
The QBE website includes a dedicated investor relations section where shareholders can access relevant information regarding their shares. There is also a direct link where shareholders can access their shareholding online through QBE’s share registry, Computershare. They can update their personal information and provide their email address and elect to receive communications electronically. Shareholders can discuss their shareholding with either QBE’s shareholder services department by email to [email protected] or by contacting QBE’s share registry, Computershare by email to [email protected] or by phone at +61 3 9415 4840. Shareholders may request to receive a hard copy of the Annual Report by updating their communication preferences by logging into their shareholding at www.investorcentre.com/au.
QBE has a comprehensive investor relations program that facilitates effective communication with its investors. The Group Chief Executive Officer, Group Chief Financial Officer, Group Chief Risk Officer, Group General Counsel and Company Secretary, Global Head of Investor Relations, Group Executive Corporate Affairs and Sustainability, Group Treasurer and divisional chief executives generally deal with analysts, investors, media, rating agencies and others, taking account of regulatory guidelines including those issued by the ASX on continuous disclosure. The presentations on the 30 June and 31 December period results and other major presentations are sent to the ASX before the presentations commence and are available promptly at www.qbe.com/investor-relations/reports-presentations. The 30 June and 31 December period results presentations are also webcast live and subsequently archived at www.qbe.com/investor-relations/reports-presentations.
QB
E In
suran
ce Gro
up
A
nn
ual R
epo
rt 2020
47O
ther
info
rmatio
n
6
Fin
ancial
Rep
ort
5
Perfo
rman
ce o
verv
iew
1
Op
erating an
d
finan
cial review
2
Go
vern
ance
3
Directo
rs' R
epo
rt
4

Corporate governance statement continued
Annual General MeetingsQBE welcomes and encourages shareholder participation at its AGM, in person, online or by proxy. The AGM is held in Sydney each year. In response to the COVID-19 pandemic, QBE held the 2020 Annual General Meeting virtually. Shareholders were able to:• participate by watching online or dialling in to the teleconference;• ask questions online and on the telephone once they were verified; and • vote by appointing a proxy, direct voting prior to the AGM and direct voting online during the AGM.
Within the required statutory period before each AGM, QBE distributes to shareholders a notice of meeting and proxy form in accordance with the requirements of the Corporations Act 2001, the ASX Listing Rules and the Company’s Constitution. To encourage effective participation at AGMs, QBE:• issues notices of meeting that are honest, accurate and not misleading;• includes explanatory notes for all resolutions included in the notice;• provides a proxy appointment form which clearly indicates how a shareholder may appoint a proxy, direct their proxy how to vote
on a particular resolution if they so choose and, if they appoint the Chair of the meeting as their proxy, how the Chair intends to vote undirected proxies;
• only combines or ‘bundles’ resolutions in notices of meeting in limited circumstances; and• provides shareholders with the opportunity to lodge proxies electronically.
Shareholders are encouraged to provide questions or comments ahead of the AGM so that these can be addressed at the meeting. QBE will make directors, members of the management team and the external auditor available to shareholders at the AGM to respond to questions regarding the items of business, including about the conduct of the audit and the preparation and content of the auditor’s report.
Votes at the AGM are by way of a poll, one vote for each fully paid ordinary share.
Continuous disclosureQBE takes its continuous disclosure obligations seriously and issues market releases during the year to satisfy those obligations. Significant developments affecting QBE may be the subject of an announcement to the ASX. All ASX announcements are placed on QBE’s website at www.qbe.com/investor-relations/asx-announcements as soon as practicable after release. The Board and relevant management also receive copies of all material market announcements promptly after they have been made. QBE’s Continuous Disclosure Policy is available at www.qbe.com/investor-relations/corporate-governance/global-policies.
Verification of periodic corporate reportsQBE prepares periodic corporate reports for the benefit of investors such as Annual Reports, Half Year Reports and Sustainability Reports. Where a corporate report is not subject to audit or review by an external auditor, QBE follows a robust process for satisfying itself that the report is materially accurate and balanced, and that it provides investors with appropriate information to make investment decisions.
Periodic corporate reports are drafted by staff with direct responsibility for, or expertise in, the subject matter and are supported by evidence, including by documenting the various sources of information and consultation undertaken within QBE or with external parties. The information is then reviewed by senior management who have the knowledge and skills to verify the accuracy and completeness of the information provided. For the annual Sustainability Report, QBE uses an independent assurance engagement to confirm that certain data sets have been prepared and presented appropriately in all material aspects.
The Board and its Committees review and approve statutory and other significant corporate reports prior to release to the market. All other periodic corporate reports are submitted for approval to the Disclosure Committee, a committee comprised of senior executives including the Group Chief Executive Officer and Group Chief Financial Officer.
Financial and other reportingAudit CommitteeThe Board has an Audit Committee which meets at least quarterly to support the Board in overseeing the effectiveness of the Group’s financial reporting and risk management framework. In particular, the Audit Committee oversees and monitors the integrity of the Group’s financial reporting, including climate-related financial disclosures. The Audit Committee is also responsible for the oversight of management of tax risks. The Audit Committee is comprised of independent directors, all of which have financial expertise, and is chaired by Jann Skinner.
Interim Group Chief Executive Officer and Group Chief Financial Officer declarationPrior to the Audit Committee’s review and the Board’s approval of the 2020 Annual Report, the Interim Group Chief Executive Officer and Group Chief Financial Officer provided a declaration to the Board that, in their opinion, the financial records were properly maintained, that the financial statements complied with the appropriate accounting standards and that they gave a true and fair view of the financial position and performance of QBE. The declaration also provides that the opinion of the Interim Group Chief Executive Officer and Group Chief Financial Officer was based on a sound system of risk management and internal control which is operating effectively.
External auditor independenceQBE firmly believes that the external auditor must be, and must be seen to be, independent. The external auditor confirms its independence and the Audit Committee verifies this by separate enquiry. The Audit Committee regularly meets with the external auditor in the absence of management. The external auditor attends the AGM and a representative is available to answer questions from shareholders relevant to the audit.
48
The Audit Committee has free and unfettered access to the external auditor. The external auditor has free and unfettered access to the Audit Committee.
QBE has issued an internal policy on external auditor independence. Under this policy, the external auditor is not allowed to provide the excluded services of preparing accounting records, financial reports or asset or liability valuations. Furthermore, it cannot act in a management capacity, as an advocate, as a custodian of assets or as a share registry.
The Board believes some non-audit services are appropriate given the external auditor’s knowledge of the QBE Group. QBE may engage the external auditor for some non-audit services, subject to the general principle that fees for non-audit services excluding audit-related and assurance services should not exceed 50% of all fees paid to the external auditor in any one financial year. External tax services are generally provided by an accounting firm other than the external auditor.
The Audit Committee approves the audit plan each year and receives information on the external auditor’s fees. QBE also considers the terms of engagement of the external auditor every few years. The Corporations Act 2001 and Australian professional auditing standards require rotation of the lead engagement partner after five years. The lead engagement partner of the external auditor was last rotated in 2019.
The Audit Committee regularly reviews the need to rotate external auditors and if the Audit Committee thought it appropriate to change the firm undertaking QBE’s external audit, it would conduct a competitive tender process.
Actuarial reviewThe central estimate of QBE’s insurance liabilities, comprising outstanding claims and premium liabilities, is determined by experienced internal actuarial staff. Actuarial staff form an independent view of both the central estimate and the probability of adequacy of outstanding claims and premium liabilities. At 31 December 2020, close to 100% of QBE’s outstanding claims central estimate was also reviewed by external actuaries.
Internal auditA global internal audit function is a core part of QBE’s three lines of defence approach to effective risk management. QBE’s Group Internal Audit team is an independent global function that operates on an integrated basis and is managed by the Group Head of Internal Audit. Group Internal Audit is formally accountable to the Chair of the Audit Committee and has an operational reporting line to the Group Chief Financial Officer. Group Internal Audit operates under an Audit Committee-approved internal audit charter that provides Group Internal Audit with free and unrestricted access to the Audit Committee, and all management, records and properties. Group Internal Audit’s primary purpose is to assist the Audit Committee and senior management to discharge their responsibility for sound and prudent management of risk at QBE. Group Internal Audit does this by performing audits, reviews, and investigations to provide independent assurance that the design and operation of controls across QBE’s international operations are effective. Group Internal Audit develops and delivers an annual risk-based internal audit plan that is aligned to QBE’s risk management framework, and includes audits to address relevant regulatory requirements. The annual Group Internal Audit plan is designed so that higher materiality risk processes are reviewed more frequently. Audit findings and related themes are reported to management, local audit committees and the Audit Committee.
Risk managementQBE is in the business of managing risk. The Board and management are fully committed to adopting a disciplined approach to how we manage risk, to deliver leading practice and to maintaining robust and independent risk management processes and systems. QBE’s risk management framework supports its businesses across all divisions and provides a sound foundation for reducing uncertainty and volatility in business performance.
Further details of how QBE manages risk are set out in the risk section of the Annual Report on pages 36 to 37. An overview of QBE’s risk management framework, including QBE’s material economic risks and how these are mitigated, is also set out in note 4 to the financial statements.
Risk & Capital CommitteeThe Board monitors QBE’s performance and, as such, plays a significant role in monitoring that an effective risk management strategy is established and maintained. The Board has a Risk & Capital Committee which meets at least quarterly to support the Board in overseeing the effectiveness of QBE’s risk and capital management frameworks. The proper oversight of these frameworks supports strategic objectives, informs business plans and enables current and future risks to be identified, assessed and monitored in line with risk appetite. Under its charter, the Risk & Capital Committee is required to review the risk management framework periodically to confirm it continues to be sound. This review was undertaken during 2020 as part of the annual refresh of the Risk Management Strategy. The Risk & Capital Committee is also responsible for overseeing QBE’s environmental, social and governance (ESG) responsibilities and performance, and external reporting relating to this.
The Risk & Capital Committee is comprised of independent directors and is chaired by Rolf Tolle. The Risk & Capital Committee has free and unfettered access to the Group Chief Risk Officer and other relevant senior management.
Environmental, social, governance and economic riskInformation about how QBE approaches sustainability and the management of ESG issues can be found in the climate disclosures section on pages 28 to 35 of the Annual Report and in the 2020 Sustainability Report available at www.qbe.com/sustainability.
Refer to QBE’s 2020 Sustainability Report at www.qbe.com/sustainability.
QB
E In
suran
ce Gro
up
A
nn
ual R
epo
rt 2020
49
Oth
er in
form
ation
6
Fin
ancial
Rep
ort
5
Perfo
rman
ce o
verv
iew
1
Op
erating an
d
finan
cial review
2
Go
vern
ance
3
Directo
rs' R
epo
rt
4

Corporate governance statement continued
Annual General MeetingsQBE welcomes and encourages shareholder participation at its AGM, in person, online or by proxy. The AGM is held in Sydney each year. In response to the COVID-19 pandemic, QBE held the 2020 Annual General Meeting virtually. Shareholders were able to:• participate by watching online or dialling in to the teleconference;• ask questions online and on the telephone once they were verified; and • vote by appointing a proxy, direct voting prior to the AGM and direct voting online during the AGM.
Within the required statutory period before each AGM, QBE distributes to shareholders a notice of meeting and proxy form in accordance with the requirements of the Corporations Act 2001, the ASX Listing Rules and the Company’s Constitution. To encourage effective participation at AGMs, QBE:• issues notices of meeting that are honest, accurate and not misleading;• includes explanatory notes for all resolutions included in the notice;• provides a proxy appointment form which clearly indicates how a shareholder may appoint a proxy, direct their proxy how to vote
on a particular resolution if they so choose and, if they appoint the Chair of the meeting as their proxy, how the Chair intends to vote undirected proxies;
• only combines or ‘bundles’ resolutions in notices of meeting in limited circumstances; and• provides shareholders with the opportunity to lodge proxies electronically.
Shareholders are encouraged to provide questions or comments ahead of the AGM so that these can be addressed at the meeting. QBE will make directors, members of the management team and the external auditor available to shareholders at the AGM to respond to questions regarding the items of business, including about the conduct of the audit and the preparation and content of the auditor’s report.
Votes at the AGM are by way of a poll, one vote for each fully paid ordinary share.
Continuous disclosureQBE takes its continuous disclosure obligations seriously and issues market releases during the year to satisfy those obligations. Significant developments affecting QBE may be the subject of an announcement to the ASX. All ASX announcements are placed on QBE’s website at www.qbe.com/investor-relations/asx-announcements as soon as practicable after release. The Board and relevant management also receive copies of all material market announcements promptly after they have been made. QBE’s Continuous Disclosure Policy is available at www.qbe.com/investor-relations/corporate-governance/global-policies.
Verification of periodic corporate reportsQBE prepares periodic corporate reports for the benefit of investors such as Annual Reports, Half Year Reports and Sustainability Reports. Where a corporate report is not subject to audit or review by an external auditor, QBE follows a robust process for satisfying itself that the report is materially accurate and balanced, and that it provides investors with appropriate information to make investment decisions.
Periodic corporate reports are drafted by staff with direct responsibility for, or expertise in, the subject matter and are supported by evidence, including by documenting the various sources of information and consultation undertaken within QBE or with external parties. The information is then reviewed by senior management who have the knowledge and skills to verify the accuracy and completeness of the information provided. For the annual Sustainability Report, QBE uses an independent assurance engagement to confirm that certain data sets have been prepared and presented appropriately in all material aspects.
The Board and its Committees review and approve statutory and other significant corporate reports prior to release to the market. All other periodic corporate reports are submitted for approval to the Disclosure Committee, a committee comprised of senior executives including the Group Chief Executive Officer and Group Chief Financial Officer.
Financial and other reportingAudit CommitteeThe Board has an Audit Committee which meets at least quarterly to support the Board in overseeing the effectiveness of the Group’s financial reporting and risk management framework. In particular, the Audit Committee oversees and monitors the integrity of the Group’s financial reporting, including climate-related financial disclosures. The Audit Committee is also responsible for the oversight of management of tax risks. The Audit Committee is comprised of independent directors, all of which have financial expertise, and is chaired by Jann Skinner.
Interim Group Chief Executive Officer and Group Chief Financial Officer declarationPrior to the Audit Committee’s review and the Board’s approval of the 2020 Annual Report, the Interim Group Chief Executive Officer and Group Chief Financial Officer provided a declaration to the Board that, in their opinion, the financial records were properly maintained, that the financial statements complied with the appropriate accounting standards and that they gave a true and fair view of the financial position and performance of QBE. The declaration also provides that the opinion of the Interim Group Chief Executive Officer and Group Chief Financial Officer was based on a sound system of risk management and internal control which is operating effectively.
External auditor independenceQBE firmly believes that the external auditor must be, and must be seen to be, independent. The external auditor confirms its independence and the Audit Committee verifies this by separate enquiry. The Audit Committee regularly meets with the external auditor in the absence of management. The external auditor attends the AGM and a representative is available to answer questions from shareholders relevant to the audit.
48
The Audit Committee has free and unfettered access to the external auditor. The external auditor has free and unfettered access to the Audit Committee.
QBE has issued an internal policy on external auditor independence. Under this policy, the external auditor is not allowed to provide the excluded services of preparing accounting records, financial reports or asset or liability valuations. Furthermore, it cannot act in a management capacity, as an advocate, as a custodian of assets or as a share registry.
The Board believes some non-audit services are appropriate given the external auditor’s knowledge of the QBE Group. QBE may engage the external auditor for some non-audit services, subject to the general principle that fees for non-audit services excluding audit-related and assurance services should not exceed 50% of all fees paid to the external auditor in any one financial year. External tax services are generally provided by an accounting firm other than the external auditor.
The Audit Committee approves the audit plan each year and receives information on the external auditor’s fees. QBE also considers the terms of engagement of the external auditor every few years. The Corporations Act 2001 and Australian professional auditing standards require rotation of the lead engagement partner after five years. The lead engagement partner of the external auditor was last rotated in 2019.
The Audit Committee regularly reviews the need to rotate external auditors and if the Audit Committee thought it appropriate to change the firm undertaking QBE’s external audit, it would conduct a competitive tender process.
Actuarial reviewThe central estimate of QBE’s insurance liabilities, comprising outstanding claims and premium liabilities, is determined by experienced internal actuarial staff. Actuarial staff form an independent view of both the central estimate and the probability of adequacy of outstanding claims and premium liabilities. At 31 December 2020, close to 100% of QBE’s outstanding claims central estimate was also reviewed by external actuaries.
Internal auditA global internal audit function is a core part of QBE’s three lines of defence approach to effective risk management. QBE’s Group Internal Audit team is an independent global function that operates on an integrated basis and is managed by the Group Head of Internal Audit. Group Internal Audit is formally accountable to the Chair of the Audit Committee and has an operational reporting line to the Group Chief Financial Officer. Group Internal Audit operates under an Audit Committee-approved internal audit charter that provides Group Internal Audit with free and unrestricted access to the Audit Committee, and all management, records and properties. Group Internal Audit’s primary purpose is to assist the Audit Committee and senior management to discharge their responsibility for sound and prudent management of risk at QBE. Group Internal Audit does this by performing audits, reviews, and investigations to provide independent assurance that the design and operation of controls across QBE’s international operations are effective. Group Internal Audit develops and delivers an annual risk-based internal audit plan that is aligned to QBE’s risk management framework, and includes audits to address relevant regulatory requirements. The annual Group Internal Audit plan is designed so that higher materiality risk processes are reviewed more frequently. Audit findings and related themes are reported to management, local audit committees and the Audit Committee.
Risk managementQBE is in the business of managing risk. The Board and management are fully committed to adopting a disciplined approach to how we manage risk, to deliver leading practice and to maintaining robust and independent risk management processes and systems. QBE’s risk management framework supports its businesses across all divisions and provides a sound foundation for reducing uncertainty and volatility in business performance.
Further details of how QBE manages risk are set out in the risk section of the Annual Report on pages 36 to 37. An overview of QBE’s risk management framework, including QBE’s material economic risks and how these are mitigated, is also set out in note 4 to the financial statements.
Risk & Capital CommitteeThe Board monitors QBE’s performance and, as such, plays a significant role in monitoring that an effective risk management strategy is established and maintained. The Board has a Risk & Capital Committee which meets at least quarterly to support the Board in overseeing the effectiveness of QBE’s risk and capital management frameworks. The proper oversight of these frameworks supports strategic objectives, informs business plans and enables current and future risks to be identified, assessed and monitored in line with risk appetite. Under its charter, the Risk & Capital Committee is required to review the risk management framework periodically to confirm it continues to be sound. This review was undertaken during 2020 as part of the annual refresh of the Risk Management Strategy. The Risk & Capital Committee is also responsible for overseeing QBE’s environmental, social and governance (ESG) responsibilities and performance, and external reporting relating to this.
The Risk & Capital Committee is comprised of independent directors and is chaired by Rolf Tolle. The Risk & Capital Committee has free and unfettered access to the Group Chief Risk Officer and other relevant senior management.
Environmental, social, governance and economic riskInformation about how QBE approaches sustainability and the management of ESG issues can be found in the climate disclosures section on pages 28 to 35 of the Annual Report and in the 2020 Sustainability Report available at www.qbe.com/sustainability.
Refer to QBE’s 2020 Sustainability Report at www.qbe.com/sustainability.
QB
E In
suran
ce Gro
up
A
nn
ual R
epo
rt 2020
49O
ther
info
rmatio
n
6
Fin
ancial
Rep
ort
5
Perfo
rman
ce o
verv
iew
1
Op
erating an
d
finan
cial review
2
Go
vern
ance
3
Directo
rs' R
epo
rt
4
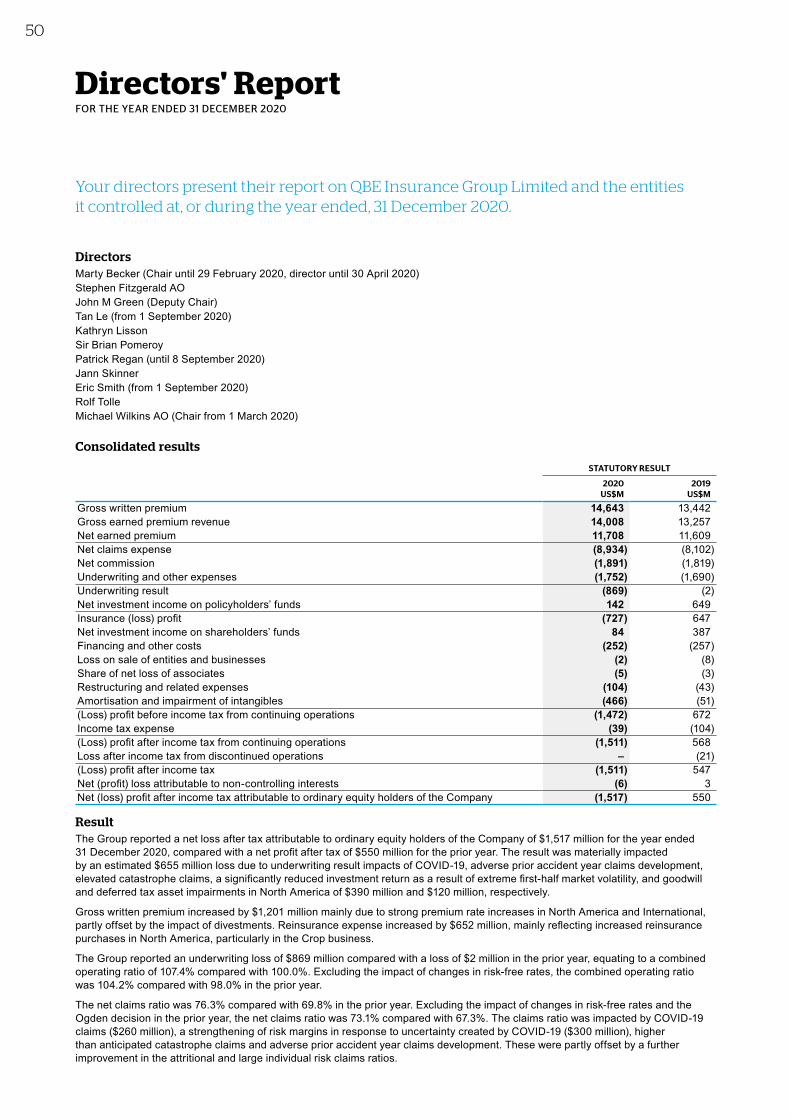
Directors' ReportFOR THE YEAR ENDED 31 DECEMBER 2020
Your directors present their report on QBE Insurance Group Limited and the entities it controlled at, or during the year ended, 31 December 2020.
DirectorsMarty Becker (Chair until 29 February 2020, director until 30 April 2020)Stephen Fitzgerald AOJohn M Green (Deputy Chair)Tan Le (from 1 September 2020)Kathryn LissonSir Brian PomeroyPatrick Regan (until 8 September 2020)Jann SkinnerEric Smith (from 1 September 2020)Rolf TolleMichael Wilkins AO (Chair from 1 March 2020)
Consolidated results
STATUTORY RESULT
2020 2019US$M US$M
Gross written premium 14,643 13,442Gross earned premium revenue 14,008 13,257Net earned premium 11,708 11,609Net claims expense (8,934) (8,102)Net commission (1,891) (1,819)Underwriting and other expenses (1,752) (1,690)Underwriting result (869) (2)Net investment income on policyholders’ funds 142 649Insurance (loss) profit (727) 647Net investment income on shareholders’ funds 84 387Financing and other costs (252) (257)Loss on sale of entities and businesses (2) (8)Share of net loss of associates (5) (3)Restructuring and related expenses (104) (43)Amortisation and impairment of intangibles (466) (51)(Loss) profit before income tax from continuing operations (1,472) 672Income tax expense (39) (104)(Loss) profit after income tax from continuing operations (1,511) 568Loss after income tax from discontinued operations – (21)(Loss) profit after income tax (1,511) 547Net (profit) loss attributable to non-controlling interests (6) 3Net (loss) profit after income tax attributable to ordinary equity holders of the Company (1,517) 550
ResultThe Group reported a net loss after tax attributable to ordinary equity holders of the Company of $1,517 million for the year ended 31 December 2020, compared with a net profit after tax of $550 million for the prior year. The result was materially impacted by an estimated $655 million loss due to underwriting result impacts of COVID-19, adverse prior accident year claims development, elevated catastrophe claims, a significantly reduced investment return as a result of extreme first-half market volatility, and goodwill and deferred tax asset impairments in North America of $390 million and $120 million, respectively.
Gross written premium increased by $1,201 million mainly due to strong premium rate increases in North America and International, partly offset by the impact of divestments. Reinsurance expense increased by $652 million, mainly reflecting increased reinsurance purchases in North America, particularly in the Crop business.
The Group reported an underwriting loss of $869 million compared with a loss of $2 million in the prior year, equating to a combined operating ratio of 107.4% compared with 100.0%. Excluding the impact of changes in risk-free rates, the combined operating ratio was 104.2% compared with 98.0% in the prior year.
The net claims ratio was 76.3% compared with 69.8% in the prior year. Excluding the impact of changes in risk-free rates and the Ogden decision in the prior year, the net claims ratio was 73.1% compared with 67.3%. The claims ratio was impacted by COVID-19 claims ($260 million), a strengthening of risk margins in response to uncertainty created by COVID-19 ($300 million), higher than anticipated catastrophe claims and adverse prior accident year claims development. These were partly offset by a further improvement in the attritional and large individual risk claims ratios.
50
The combined commission and expense ratio increased slightly to 31.1% from 30.2% in the prior year. The net commission expense ratio increased to 16.1% from 15.6% in the prior year, mainly reflecting premium growth and changes in business mix in International. The Group’s expense ratio increased to 15.0% from 14.6% in the prior year, with cost savings more than offset by elevated risk and regulatory costs and a NSW CTP profit normalisation charge.
Net investment and other income was $226 million compared with $1,036 million in the prior year. The investment portfolio was severely impacted by COVID-19 market volatility, particularly in the first half of the year. While fixed income assets benefited from falling sovereign bond yields, realised losses on emerging market and high yield debt assets negatively impacted fixed income returns. Growth assets were substantially impacted by market volatility. The Group now has minimal exposure to listed equities and sold all high yield and emerging market debt instruments to de-risk the investment portfolio in the first half of the year.
The Group’s effective tax rate was negative 3% compared with 15% in the prior period reflecting the mix of corporate tax rates in the jurisdictions in which QBE operates, current period taxable losses in the North American tax group where an already substantial deferred tax asset limited recognition of further tax losses, non-deductible goodwill impairment, and the write-down of the deferred tax asset in the North American tax group following a reassessment of expected future taxable profits.
DividendsOur dividend policy is designed to reward shareholders relative to cash profit while maintaining sufficient capital for future investment and growth of the business. In light of the substantial reported loss, the directors have elected not to declare a final dividend.
In the prior year, the directors announced a final dividend of 27 Australian cents per share, franked at 30%.
The 2020 full year dividend payout is A$59 million compared with A$681 million for 2019. Further details of dividends paid during the year are set out in note 5.4 to the financial statements.
ActivitiesThe principal activities of QBE during the year were underwriting general insurance and reinsurance risks, management of Lloyd’s syndicates and investment management.
Presentation currencyThe Group has presented the Financial Report in US dollars because a significant proportion of its underwriting activity is denominated in US dollars. The US dollar is also the currency that is widely understood by the global insurance industry, international investors and analysts.
Operating and financial reviewA review of the Group’s operations during the year and the results of those operations is set on pages 4 to 27 of this Annual Report. These pages also deal with the Group’s operations, financial position, business strategies and prospects for future financial years.
Outstanding claims liability The net central estimate of outstanding claims is determined by the Group Chief Actuary after consultation with internal and external actuaries. The assessment takes into account the statistical analysis of past claims, allowance for claims incurred but not reported, reinsurance and other recoveries and future interest and inflation factors.
As in previous years, the directors consider that substantial risk margins are required over the actuarial net central estimate to mitigate the inherent uncertainty in the net central estimate. The probability of adequacy of the outstanding claims liability at 31 December 2020 was 92.5% compared with 90.0% last year. The Australian Prudential Regulation Authority (APRA) prudential standards provide a capital credit for outstanding claims in excess of a probability of adequacy of 75%.
Group indemnitiesRule 78 of the Company’s Constitution provides that the Company indemnifies past and present directors, secretaries or other officers against any liability incurred by that person as a director, secretary or other officer of the Company or its subsidiaries. The indemnity does not apply to any liability (excluding legal costs):• owed to the Company or a related body corporate (e.g. breach of directors’ duties);• for a pecuniary penalty under section 1317G or a compensation order under sections 1317H or 1317HA of the Corporations Act
2001 (Cth) (or a similar provision of the corresponding legislation in another jurisdiction); or• that is owed to someone other than the Company or a related body corporate and which did not arise out of conduct in good faith.
The indemnity extends to legal costs other than where:• in civil proceedings, one or more of the above exclusions apply;• in criminal proceedings, the person is found guilty;• the person is liable in proceedings brought by the Australian Securities and Investments Commission (ASIC), a corresponding
regulator in another jurisdiction or a liquidator (unless as part of the investigation before proceedings are commenced); or• the court does not grant relief after an application under the Corporations Act 2001 or corresponding legislation in another jurisdiction.
In addition, a deed exists between the Company and each director which includes an indemnity in similar terms to rule 78 of the Company’s constitution.
QB
E In
suran
ce Gro
up
A
nn
ual R
epo
rt 2020
51
Oth
er in
form
ation
6
Fin
ancial
Rep
ort
5
Perfo
rman
ce o
verv
iew
1
Op
erating an
d
finan
cial review
2
Go
vern
ance
3
Directo
rs' R
epo
rt
4

Directors' ReportFOR THE YEAR ENDED 31 DECEMBER 2020
Your directors present their report on QBE Insurance Group Limited and the entities it controlled at, or during the year ended, 31 December 2020.
DirectorsMarty Becker (Chair until 29 February 2020, director until 30 April 2020)Stephen Fitzgerald AOJohn M Green (Deputy Chair)Tan Le (from 1 September 2020)Kathryn LissonSir Brian PomeroyPatrick Regan (until 8 September 2020)Jann SkinnerEric Smith (from 1 September 2020)Rolf TolleMichael Wilkins AO (Chair from 1 March 2020)
Consolidated results
STATUTORY RESULT
2020 2019US$M US$M
Gross written premium 14,643 13,442Gross earned premium revenue 14,008 13,257Net earned premium 11,708 11,609Net claims expense (8,934) (8,102)Net commission (1,891) (1,819)Underwriting and other expenses (1,752) (1,690)Underwriting result (869) (2)Net investment income on policyholders’ funds 142 649Insurance (loss) profit (727) 647Net investment income on shareholders’ funds 84 387Financing and other costs (252) (257)Loss on sale of entities and businesses (2) (8)Share of net loss of associates (5) (3)Restructuring and related expenses (104) (43)Amortisation and impairment of intangibles (466) (51)(Loss) profit before income tax from continuing operations (1,472) 672Income tax expense (39) (104)(Loss) profit after income tax from continuing operations (1,511) 568Loss after income tax from discontinued operations – (21)(Loss) profit after income tax (1,511) 547Net (profit) loss attributable to non-controlling interests (6) 3Net (loss) profit after income tax attributable to ordinary equity holders of the Company (1,517) 550
ResultThe Group reported a net loss after tax attributable to ordinary equity holders of the Company of $1,517 million for the year ended 31 December 2020, compared with a net profit after tax of $550 million for the prior year. The result was materially impacted by an estimated $655 million loss due to underwriting result impacts of COVID-19, adverse prior accident year claims development, elevated catastrophe claims, a significantly reduced investment return as a result of extreme first-half market volatility, and goodwill and deferred tax asset impairments in North America of $390 million and $120 million, respectively.
Gross written premium increased by $1,201 million mainly due to strong premium rate increases in North America and International, partly offset by the impact of divestments. Reinsurance expense increased by $652 million, mainly reflecting increased reinsurance purchases in North America, particularly in the Crop business.
The Group reported an underwriting loss of $869 million compared with a loss of $2 million in the prior year, equating to a combined operating ratio of 107.4% compared with 100.0%. Excluding the impact of changes in risk-free rates, the combined operating ratio was 104.2% compared with 98.0% in the prior year.
The net claims ratio was 76.3% compared with 69.8% in the prior year. Excluding the impact of changes in risk-free rates and the Ogden decision in the prior year, the net claims ratio was 73.1% compared with 67.3%. The claims ratio was impacted by COVID-19 claims ($260 million), a strengthening of risk margins in response to uncertainty created by COVID-19 ($300 million), higher than anticipated catastrophe claims and adverse prior accident year claims development. These were partly offset by a further improvement in the attritional and large individual risk claims ratios.
50
The combined commission and expense ratio increased slightly to 31.1% from 30.2% in the prior year. The net commission expense ratio increased to 16.1% from 15.6% in the prior year, mainly reflecting premium growth and changes in business mix in International. The Group’s expense ratio increased to 15.0% from 14.6% in the prior year, with cost savings more than offset by elevated risk and regulatory costs and a NSW CTP profit normalisation charge.
Net investment and other income was $226 million compared with $1,036 million in the prior year. The investment portfolio was severely impacted by COVID-19 market volatility, particularly in the first half of the year. While fixed income assets benefited from falling sovereign bond yields, realised losses on emerging market and high yield debt assets negatively impacted fixed income returns. Growth assets were substantially impacted by market volatility. The Group now has minimal exposure to listed equities and sold all high yield and emerging market debt instruments to de-risk the investment portfolio in the first half of the year.
The Group’s effective tax rate was negative 3% compared with 15% in the prior period reflecting the mix of corporate tax rates in the jurisdictions in which QBE operates, current period taxable losses in the North American tax group where an already substantial deferred tax asset limited recognition of further tax losses, non-deductible goodwill impairment, and the write-down of the deferred tax asset in the North American tax group following a reassessment of expected future taxable profits.
DividendsOur dividend policy is designed to reward shareholders relative to cash profit while maintaining sufficient capital for future investment and growth of the business. In light of the substantial reported loss, the directors have elected not to declare a final dividend.
In the prior year, the directors announced a final dividend of 27 Australian cents per share, franked at 30%.
The 2020 full year dividend payout is A$59 million compared with A$681 million for 2019. Further details of dividends paid during the year are set out in note 5.4 to the financial statements.
ActivitiesThe principal activities of QBE during the year were underwriting general insurance and reinsurance risks, management of Lloyd’s syndicates and investment management.
Presentation currencyThe Group has presented the Financial Report in US dollars because a significant proportion of its underwriting activity is denominated in US dollars. The US dollar is also the currency that is widely understood by the global insurance industry, international investors and analysts.
Operating and financial reviewA review of the Group’s operations during the year and the results of those operations is set on pages 4 to 27 of this Annual Report. These pages also deal with the Group’s operations, financial position, business strategies and prospects for future financial years.
Outstanding claims liability The net central estimate of outstanding claims is determined by the Group Chief Actuary after consultation with internal and external actuaries. The assessment takes into account the statistical analysis of past claims, allowance for claims incurred but not reported, reinsurance and other recoveries and future interest and inflation factors.
As in previous years, the directors consider that substantial risk margins are required over the actuarial net central estimate to mitigate the inherent uncertainty in the net central estimate. The probability of adequacy of the outstanding claims liability at 31 December 2020 was 92.5% compared with 90.0% last year. The Australian Prudential Regulation Authority (APRA) prudential standards provide a capital credit for outstanding claims in excess of a probability of adequacy of 75%.
Group indemnitiesRule 78 of the Company’s Constitution provides that the Company indemnifies past and present directors, secretaries or other officers against any liability incurred by that person as a director, secretary or other officer of the Company or its subsidiaries. The indemnity does not apply to any liability (excluding legal costs):• owed to the Company or a related body corporate (e.g. breach of directors’ duties);• for a pecuniary penalty under section 1317G or a compensation order under sections 1317H or 1317HA of the Corporations Act
2001 (Cth) (or a similar provision of the corresponding legislation in another jurisdiction); or• that is owed to someone other than the Company or a related body corporate and which did not arise out of conduct in good faith.
The indemnity extends to legal costs other than where:• in civil proceedings, one or more of the above exclusions apply;• in criminal proceedings, the person is found guilty;• the person is liable in proceedings brought by the Australian Securities and Investments Commission (ASIC), a corresponding
regulator in another jurisdiction or a liquidator (unless as part of the investigation before proceedings are commenced); or• the court does not grant relief after an application under the Corporations Act 2001 or corresponding legislation in another jurisdiction.
In addition, a deed exists between the Company and each director which includes an indemnity in similar terms to rule 78 of the Company’s constitution.
QB
E In
suran
ce Gro
up
A
nn
ual R
epo
rt 2020
51O
ther
info
rmatio
n
6
Fin
ancial
Rep
ort
5
Perfo
rman
ce o
verv
iew
1
Op
erating an
d
finan
cial review
2
Go
vern
ance
3
Directo
rs' R
epo
rt
4

Directors' Report continued
FOR THE YEAR ENDED 31 DECEMBER 2020
Directors’ and officers’ insuranceQBE pays a premium each year in respect of a contract insuring directors, secretaries, senior managers and employees of the Group together with any natural person who is either a trustee or a member of a policy committee for a superannuation plan established for the benefit of the Group’s employees against liabilities past, present or future. The officers of the Group covered by the insurance contract include the directors listed on pages 38 and 39 of this Annual Report, the Group Company Secretary, Carolyn Scobie, and Deputy Company Secretary, Peter Smiles.
In accordance with normal commercial practice, disclosure of the amount of premium payable under, and the nature of liabilities covered by, the insurance contract is prohibited by a confidentiality clause in the contract.
No such insurance cover has been provided for the benefit of any external auditor of the Group.
Significant changesThere were no significant changes in the Group’s state of affairs during the financial year other than as disclosed in this Annual Report.
Likely developments and expected results of operationsLikely developments in the Group’s operations in future financial years and the expected results of those operations have been included in the review of operations on pages 4 to 27 of this Annual Report.
Events after balance dateNo matter or circumstance has arisen since 31 December 2020 that, in the opinion of the directors, has significantly affected or may significantly affect the Group’s operations, the results of those operations or the Group’s state of affairs in future financial periods.
Material business risksAs a global insurance and reinsurance business, QBE is subject to a substantial variety of business risks. The Board believes that effective management of these risks is critical to delivering value for QBE’s stakeholders. It is QBE’s policy to adopt a rigorous approach to managing risk throughout the Group. Risk management is a continuous process and an integral part of QBE’s governance structure, QBE’s broader business processes and, most importantly, QBE’s culture.
Some of the material business risks that QBE faces include strategic, insurance, credit, market, liquidity, operational, compliance and group risks. Explanations of these risks and their mitigations are set out in detail in note 4 to the financial statements which we recommend you read. Further details of how QBE manages risk are set out in the risk section on pages 36 to 37, the climate disclosures on pages 28 to 35 and the risk management section of the Corporate Governance Statement on pages 42 to 49 of this Annual Report.
The Group makes judgements and estimates in respect of the reported amounts of certain assets and liabilities, the most significant of which are in relation to the determination of the net outstanding claims liability, the application of the liability adequacy test and the valuation of deferred tax assets and impairment testing of goodwill in North America. Details of these, and information on how QBE has responded to uncertainties created by COVID-19, are included in the notes to the financial statements.
Meetings of directors
FULL MEETINGS OF DIRECTORS 1
MEETINGS OF
INDEPENDENTDIRECTORS
MEETINGS OF COMMITTEES
AUDIT
GOVERNANCE &
NOMINATION INVESTMENTOPERATIONS & TECHNOLOGY
PEOPLE & REMUNERA-
TIONRISK &
CAPITALSUB-
COMMITTEES 2
H A H A H A H A H A H A H A H A H A
Marty Becker 5 5 1 1 1 1 1 1 1 1 1 1 1 1 1 1 – –Stephen Fitzgerald 14 13 10 10 – – 5 5 4 4 – – 4 4 6 6 – –John M Green 14 14 10 10 5 5 5 5 4 4 4 4 4 4 6 6 29 29Tan Le 5 5 3 3 2 2 2 2 – – 2 2 – – – – – –Kathryn Lisson 14 14 10 10 5 5 5 5 – – 4 4 – – – – 2 2Sir Brian Pomeroy 14 14 10 10 5 5 5 5 4 4 – – – – 6 6 1 –Patrick Regan 9 9 – – – – – – – – – – – – – – 6 6Jann Skinner 14 14 10 10 5 5 5 5 – – – – 4 4 6 6 27 27Eric Smith 5 4 3 3 – – 2 2 – – 2 2 – – 2 2 – –Rolf Tolle 14 14 10 10 5 5 5 5 – – – – 4 4 6 6 5 5Michael Wilkins 14 14 10 10 5 5 5 5 2 2 4 4 4 4 3 3 29 29
H Number of meetings held while a Board or Committee member.A Number of meetings attended while a Board or Committee member.1 All directors attended all scheduled Board meetings. Some of the 2020 Board meetings were unscheduled and called at short notice,
resulting in some directors being unable to attend.2 Ad hoc committees of the Board were convened during the year in relation to the financial results and other reporting matters.
Further meetings occurred during the year, including meetings of the Chair, Group Chief Executive Officer and Interim Group Chief Executive Officer, and meetings of the directors with management. Often directors attend meetings of committees of which they are not currently members.
52
Directorships of listed companies held by the members of the Board From 1 January 2018 to 19 February 2021, the directors also served as directors of the following listed entities:
DIRECTOR POSITION DATE APPOINTED DATE CEASED
John M GreenChallenger Limited Director 6 December 2017 –Michael WilkinsAMP Limited Director 12 September 2016 14 February 2020Medibank Private Limited Director 25 May 2017 –Scentre Group Limited Director 8 April 2020 –Jann SkinnerTelix Pharmaceuticals Limited Director 19 June 2018 –
Qualifications and experience of directorsThe qualifications and experience of each director are set out on pages 38 to 39 of this Annual Report.
Qualifications and experience of company secretariesCarolyn Scobie, BA, LLB, MA, AGIA, GAICD Carolyn joined QBE in 2016 as Group General Counsel and Company Secretary. Prior to joining QBE, Carolyn was Group General Counsel at Goodman Group for 17 years, where she ran a multi-disciplinary legal team. Carolyn has extensive experience in corporate law, compliance, regulatory matters, litigation and managing the complexity of multiple jurisdictions.
Peter Smiles, LLB, MBA, FGIA, FCIS, GAICD Peter is Deputy Company Secretary of QBE Insurance Group Limited and a company secretary of various QBE subsidiaries in Australia. He has 30 years of insurance experience, which includes 24 years as a corporate lawyer. In addition to his current company secretarial duties, he acts as a corporate lawyer advising Group head office departments.
Directors’ interests and benefits
Ordinary share capitalDirectors’ relevant interests, including those of their personal related parties, in the ordinary share capital of the Company at the date of this report are as follows:
DIRECTORNUMBER OF
SHARES HELD
Stephen Fitzgerald 65,286John M Green 41,253Tan Le 783Kathryn Lisson 40,442Sir Brian Pomeroy 33,757Jann Skinner 63,995Eric Smith 783Rolf Tolle 63,336Michael Wilkins 63,172
Options and conditional rightsNo executives hold options at the date of this report. Details of the schemes under which options and conditional rights are granted are provided in the Remuneration Report and in note 8.5 to the financial statements.
The names of all persons who currently hold options granted under the Employee Share and Option Plan and conditional rights to ordinary shares of the Company are entered in the registers kept by the Company pursuant to section 168 of the Corporations Act 2001.
Environmental regulationWhile the Group is not currently required to report under any significant environmental regulations under Commonwealth, State or Territory legislation, climate disclosures are provided on pages 28 to 35 of this Annual Report and operational greenhouse gas emissions and other environmental data is disclosed in the 2020 Sustainability Report.
QB
E In
suran
ce Gro
up
A
nn
ual R
epo
rt 2020
53
Oth
er in
form
ation
6
Fin
ancial
Rep
ort
5
Perfo
rman
ce o
verv
iew
1
Op
erating an
d
finan
cial review
2
Go
vern
ance
3
Directo
rs' R
epo
rt
4
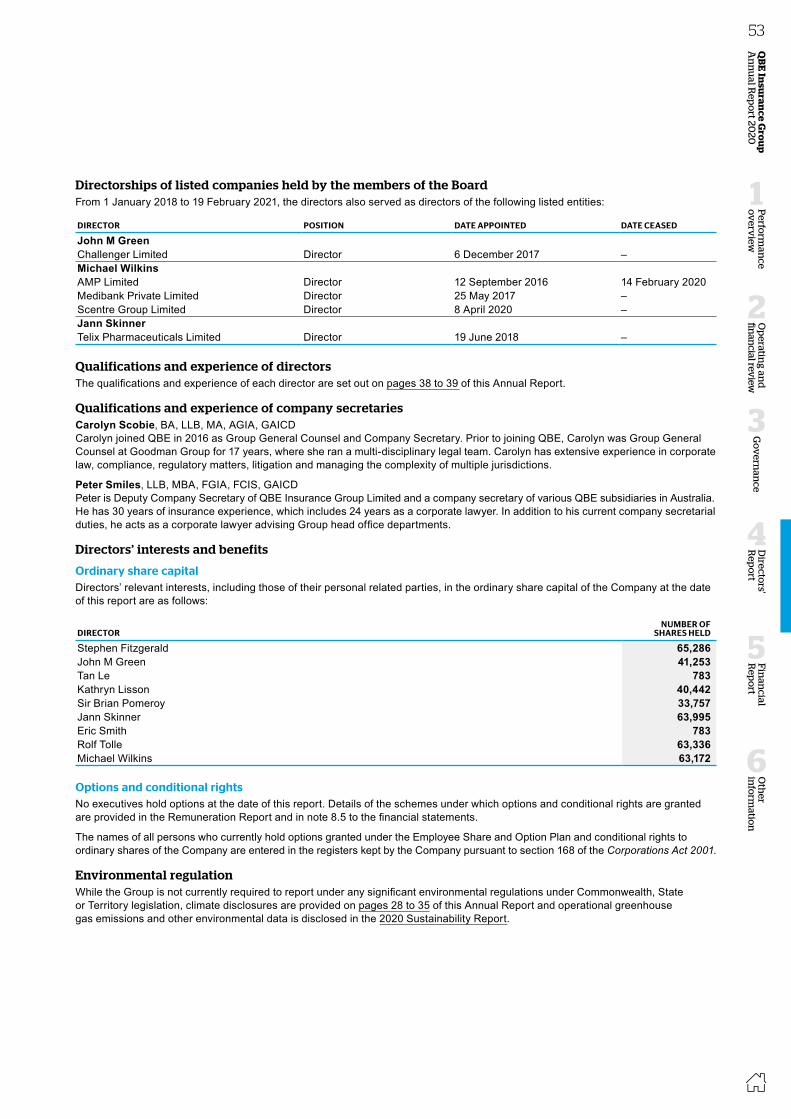
Directors' Report continued
FOR THE YEAR ENDED 31 DECEMBER 2020
Directors’ and officers’ insuranceQBE pays a premium each year in respect of a contract insuring directors, secretaries, senior managers and employees of the Group together with any natural person who is either a trustee or a member of a policy committee for a superannuation plan established for the benefit of the Group’s employees against liabilities past, present or future. The officers of the Group covered by the insurance contract include the directors listed on pages 38 and 39 of this Annual Report, the Group Company Secretary, Carolyn Scobie, and Deputy Company Secretary, Peter Smiles.
In accordance with normal commercial practice, disclosure of the amount of premium payable under, and the nature of liabilities covered by, the insurance contract is prohibited by a confidentiality clause in the contract.
No such insurance cover has been provided for the benefit of any external auditor of the Group.
Significant changesThere were no significant changes in the Group’s state of affairs during the financial year other than as disclosed in this Annual Report.
Likely developments and expected results of operationsLikely developments in the Group’s operations in future financial years and the expected results of those operations have been included in the review of operations on pages 4 to 27 of this Annual Report.
Events after balance dateNo matter or circumstance has arisen since 31 December 2020 that, in the opinion of the directors, has significantly affected or may significantly affect the Group’s operations, the results of those operations or the Group’s state of affairs in future financial periods.
Material business risksAs a global insurance and reinsurance business, QBE is subject to a substantial variety of business risks. The Board believes that effective management of these risks is critical to delivering value for QBE’s stakeholders. It is QBE’s policy to adopt a rigorous approach to managing risk throughout the Group. Risk management is a continuous process and an integral part of QBE’s governance structure, QBE’s broader business processes and, most importantly, QBE’s culture.
Some of the material business risks that QBE faces include strategic, insurance, credit, market, liquidity, operational, compliance and group risks. Explanations of these risks and their mitigations are set out in detail in note 4 to the financial statements which we recommend you read. Further details of how QBE manages risk are set out in the risk section on pages 36 to 37, the climate disclosures on pages 28 to 35 and the risk management section of the Corporate Governance Statement on pages 42 to 49 of this Annual Report.
The Group makes judgements and estimates in respect of the reported amounts of certain assets and liabilities, the most significant of which are in relation to the determination of the net outstanding claims liability, the application of the liability adequacy test and the valuation of deferred tax assets and impairment testing of goodwill in North America. Details of these, and information on how QBE has responded to uncertainties created by COVID-19, are included in the notes to the financial statements.
Meetings of directors
FULL MEETINGS OF DIRECTORS 1
MEETINGS OF
INDEPENDENTDIRECTORS
MEETINGS OF COMMITTEES
AUDIT
GOVERNANCE &
NOMINATION INVESTMENTOPERATIONS & TECHNOLOGY
PEOPLE & REMUNERA-
TIONRISK &
CAPITALSUB-
COMMITTEES 2
H A H A H A H A H A H A H A H A H A
Marty Becker 5 5 1 1 1 1 1 1 1 1 1 1 1 1 1 1 – –Stephen Fitzgerald 14 13 10 10 – – 5 5 4 4 – – 4 4 6 6 – –John M Green 14 14 10 10 5 5 5 5 4 4 4 4 4 4 6 6 29 29Tan Le 5 5 3 3 2 2 2 2 – – 2 2 – – – – – –Kathryn Lisson 14 14 10 10 5 5 5 5 – – 4 4 – – – – 2 2Sir Brian Pomeroy 14 14 10 10 5 5 5 5 4 4 – – – – 6 6 1 –Patrick Regan 9 9 – – – – – – – – – – – – – – 6 6Jann Skinner 14 14 10 10 5 5 5 5 – – – – 4 4 6 6 27 27Eric Smith 5 4 3 3 – – 2 2 – – 2 2 – – 2 2 – –Rolf Tolle 14 14 10 10 5 5 5 5 – – – – 4 4 6 6 5 5Michael Wilkins 14 14 10 10 5 5 5 5 2 2 4 4 4 4 3 3 29 29
H Number of meetings held while a Board or Committee member.A Number of meetings attended while a Board or Committee member.1 All directors attended all scheduled Board meetings. Some of the 2020 Board meetings were unscheduled and called at short notice,
resulting in some directors being unable to attend.2 Ad hoc committees of the Board were convened during the year in relation to the financial results and other reporting matters.
Further meetings occurred during the year, including meetings of the Chair, Group Chief Executive Officer and Interim Group Chief Executive Officer, and meetings of the directors with management. Often directors attend meetings of committees of which they are not currently members.
52
Directorships of listed companies held by the members of the Board From 1 January 2018 to 19 February 2021, the directors also served as directors of the following listed entities:
DIRECTOR POSITION DATE APPOINTED DATE CEASED
John M GreenChallenger Limited Director 6 December 2017 –Michael WilkinsAMP Limited Director 12 September 2016 14 February 2020Medibank Private Limited Director 25 May 2017 –Scentre Group Limited Director 8 April 2020 –Jann SkinnerTelix Pharmaceuticals Limited Director 19 June 2018 –
Qualifications and experience of directorsThe qualifications and experience of each director are set out on pages 38 to 39 of this Annual Report.
Qualifications and experience of company secretariesCarolyn Scobie, BA, LLB, MA, AGIA, GAICD Carolyn joined QBE in 2016 as Group General Counsel and Company Secretary. Prior to joining QBE, Carolyn was Group General Counsel at Goodman Group for 17 years, where she ran a multi-disciplinary legal team. Carolyn has extensive experience in corporate law, compliance, regulatory matters, litigation and managing the complexity of multiple jurisdictions.
Peter Smiles, LLB, MBA, FGIA, FCIS, GAICD Peter is Deputy Company Secretary of QBE Insurance Group Limited and a company secretary of various QBE subsidiaries in Australia. He has 30 years of insurance experience, which includes 24 years as a corporate lawyer. In addition to his current company secretarial duties, he acts as a corporate lawyer advising Group head office departments.
Directors’ interests and benefits
Ordinary share capitalDirectors’ relevant interests, including those of their personal related parties, in the ordinary share capital of the Company at the date of this report are as follows:
DIRECTORNUMBER OF
SHARES HELD
Stephen Fitzgerald 65,286John M Green 41,253Tan Le 783Kathryn Lisson 40,442Sir Brian Pomeroy 33,757Jann Skinner 63,995Eric Smith 783Rolf Tolle 63,336Michael Wilkins 63,172
Options and conditional rightsNo executives hold options at the date of this report. Details of the schemes under which options and conditional rights are granted are provided in the Remuneration Report and in note 8.5 to the financial statements.
The names of all persons who currently hold options granted under the Employee Share and Option Plan and conditional rights to ordinary shares of the Company are entered in the registers kept by the Company pursuant to section 168 of the Corporations Act 2001.
Environmental regulationWhile the Group is not currently required to report under any significant environmental regulations under Commonwealth, State or Territory legislation, climate disclosures are provided on pages 28 to 35 of this Annual Report and operational greenhouse gas emissions and other environmental data is disclosed in the 2020 Sustainability Report.
QB
E In
suran
ce Gro
up
A
nn
ual R
epo
rt 2020
53O
ther
info
rmatio
n
6
Fin
ancial
Rep
ort
5
Perfo
rman
ce o
verv
iew
1
Op
erating an
d
finan
cial review
2
Go
vern
ance
3
Directo
rs' R
epo
rt
4

Remuneration Report
Remuneration Report contents
Our remuneration framework at a glance 56
How we performed: Financial performance 57 2020 priorities 58
1. Executive KMP performance snapshots 60
2. Remuneration governance 63
3. Executive KMP remuneration in detail 66
4. Executive KMP remuneration tables 71
5. Non-executive director remuneration 75
This Remuneration Report sets out QBE’s remuneration framework and provides detail of remuneration outcomes for key management personnel (KMP) for 2020 and how this aligns with QBE’s performance.Accounting standards define KMP as those executives and non-executive directors with the authority and responsibility for planning, directing and controlling the activities of the Group, either directly or indirectly.The 2020 Remuneration Report has been prepared and audited in accordance with the disclosure requirements of the Corporations Act 2001.
To our shareholdersOn behalf of the Board, I present QBE’s Remuneration Report for 2020.
Our response to COVID-19The economic and social disruption caused by the COVID-19 pandemic is widespread and continues to be felt right across the world.
For QBE, this impacted our business performance and investment income in 2020 and continues to impact our people and our customers. Combined with elevated catastrophe experience and adverse prior accident year claims development, we delivered a Group financial result that, disappointingly, was well below our target. However, despite the significant volatility during 2020, QBE made solid progress on a number of key priorities and demonstrated considerable adaptability and resilience. For that, and their sustained commitment, we thank our people around the globe.
COVID-19 led to a transformational shift in how our people work and connect with each other. We rapidly mobilised resources and technology to support people working remotely, while also prioritising our customers. In line with our QBE DNA and culture, the safety and wellbeing of our people was central throughout QBE’s response to the pandemic. We focused on the physical and mental wellbeing of our people in this sustained work-from-home environment, offered additional support for more vulnerable employees and continue to be mindful of the challenges that remain for the year ahead.
Board and executive changesWe announced the departure of the former Group Chief Executive Officer (CEO), Pat Regan, in September 2020. This followed decisive action by the Board after an external investigation concerning workplace communications. Our commitment to a respectful and inclusive environment at QBE continues, and is being expanded through our Culture Accelerator program mentioned below. Group Chair, Mike Wilkins, took on the role of Executive Chair during September and October. In October, we appointed Richard Pryce, CEO, International, as Interim Group CEO. The Board is grateful to Mr Pryce for delaying his planned retirement to take on the interim role while we search for a new Group CEO.
Mr Pryce’s skills and operational discipline are being positively received across the business. His interim remuneration arrangements, structured to account for the temporary nature of his role, vary to some extent from the prior Group CEO’s.
For more information, refer to page 56.
Along with two new Board members, Tan Le and Eric Smith, Jason Harris the new CEO, International, joined QBE in 2020. Our new Group Chief Risk Officer, Fiona Larnach, will commence in March 2021 and our new CEO, Australia Pacific, Sue Houghton, is expected to commence in Q3 2021. We are pleased that we continue to attract executives of this calibre and build our executive bench strength, whilst improving our gender balance. From Q3 2021, 45% of the Group Executive team will be female.
People, culture, diversity and inclusionWe have been strengthening our focus on culture, succession and talent. We continue to embed the QBE DNA and in late 2020, we commenced our Culture Accelerator to refine and enhance our DNA and support our journey towards making QBE more future-fit.
Fostering an environment where our employees feel engaged, supported and equipped to do their best is essential to our success, helping to drive business performance with positive customer, employee and partner outcomes. QBE wants our people to feel safe and encouraged to speak up, to raise ideas, to call out issues without fear and to embrace diversity.
Our annual employee engagement survey achieved a strong response with an overall engagement score of 76%, up from 70% in 2019, and an enablement score of 76%, up from 71% in 2019. There were also strong increases in some other key focus areas. These were pleasing results in a very challenging environment.
In addition to the activity highlighted above, our women in leadership and gender balance levels improved across the Group, QBE Australia was named JobAccess Best Workplace Diversity and Inclusion Program at the 2020 Australian HR Awards, recognising our ‘Share the Care’ flexible parental leave policy. QBE was also voted #10 in the 2020 Top 20 Australian Workplaces for New Dads (by HBF Direct Advice for Dads). Our continued commitment to creating meaningful relationships and promoting opportunities to empower Aboriginal and Torres Strait Islander communities, organisations and businesses is reflected in our recently launched Reconciliation Action Plan 2020–2022.
For more information, refer to QBE’s Sustainability Report at www.qbe.com/sustainability.
54
Performance during 2020 The Group’s 2020 financial result was disappointing and reflects the difficult operating environment which was heavily impacted by the pandemic. Despite COVID-19 related costs, the International division delivered pleasing margin improvement and encouraging growth as a result of strong pricing conditions and ongoing discipline in risk selection. In addition to material COVID-19 impacts, our North America and Australia Pacific divisions’ results were heavily impacted by catastrophe claims that were significantly above allowances. North America also experienced material adverse prior accident year claims development.
Though QBE made significant progress on a number of important deliverables, the Group’s adjusted combined operating ratio (COR) and the Group’s cash return on equity (ROE) were well below our expectations at 103.8% and (16.2)% respectively. As a result, the financial component of the short-term incentive (STI) resulted in a zero outcome for most of the executive KMP. However, in assessing the non-financial component of STI for the executive KMP, the ME@QBE component, the Board gave careful consideration to the unprecedented challenges that the management team responded to in 2020 and the perseverance, commitment and resilience each of them demonstrated throughout the year. While COVID-19 presented many challenges, other significant issues culminated in 2020 being one of the most challenging years in the Company’s recent history. Collectively and individually the executives led QBE through a very turbulent year and the Board believes that, despite the poor financial outcomes for the Group, their significant work in that respect should be recognised.
Accordingly, the Board has determined to award the executive KMP for the 35% non-financial component of their STI. However, it has exercised its discretion to make those awards as deferred equity (conditional rights), vesting over two years (2022 and 2023) with no cash component. This creates greater alignment with shareholders through increased share ownership. It reflects the Board’s determination to motivate, retain and stabilise the executive team in a manner that is in the best interests of shareholders and the long-term performance of the Company.
The 2020 STI outcome for the Interim Group CEO reflects that for the majority of the year he was in his prior role as CEO, International, the strong performance of the International division and his achievement against ME@QBE objectives. Based on this, he will receive 90.4% of his target opportunity (60.3% of his maximum opportunity). For the remaining executive KMP, the average STI outcome is 31.7% of their maximum opportunity.
For more information, refer to pages 57 to 62.
Looking aheadWe will be making some minor revisions to remuneration arrangements for 2021 as we proactively respond to the upcoming regulatory requirements in Australia. These include revised malus and new clawback rules for our incentive plans.
STI financial measures will continue to include COR and cash ROE, and will retain their weighting for 65% of the outcomes, the remaining 35% being weighted on performance against our strategic priorities. For 2021, we will utilise a blended COR from the divisional outcomes rather than the Group COR to improve the line of sight and enhance the impact of these measures across the Group.
The continued impact of COVID-19 creates a greater than usual challenge for setting the incentive targets for 2021. This is particularly relevant for the 2021 long-term incentive (LTI) performance measures.
For the 2021 LTI award, average cash ROE and relative total shareholder return (TSR) will continue to be the two key performance conditions measured over a three-year performance period and the catastrophe collar will remain. However, for the 2021 average cash ROE measure, we will vary the approach for calculating the target. Rather than setting a three-year target at this time, we will, at the end of the performance period, combine the three individual annual performance ranges that we will set over the three individual years. The outcomes for the 2021 performance year will be disclosed in next year’s Remuneration Report.
For more information, refer to page 70.
A broader review of remuneration will occur during 2021 to address the future regulatory requirements for expanded non-financial metrics and longer incentive deferral mechanisms. The remuneration principles detailed on the next page will underpin any changes to our arrangements.
We intend to engage key stakeholders as these are developed and next year’s report will contain further detail.
As always, we look forward to shareholder feedback.
John M GreenDeputy ChairChair, People & Remuneration Committee
QB
E In
suran
ce Gro
up
A
nn
ual R
epo
rt 2020
55
Oth
er in
form
ation
6
Fin
ancial
Rep
ort
5
Perfo
rman
ce o
verv
iew
1
Op
erating an
d
finan
cial review
2
Go
vern
ance
3
Directo
rs' R
epo
rt
4
Remuneration Report
Remuneration Report contents
Our remuneration framework at a glance 56
How we performed: Financial performance 57 2020 priorities 58
1. Executive KMP performance snapshots 60
2. Remuneration governance 63
3. Executive KMP remuneration in detail 66
4. Executive KMP remuneration tables 71
5. Non-executive director remuneration 75
This Remuneration Report sets out QBE’s remuneration framework and provides detail of remuneration outcomes for key management personnel (KMP) for 2020 and how this aligns with QBE’s performance.Accounting standards define KMP as those executives and non-executive directors with the authority and responsibility for planning, directing and controlling the activities of the Group, either directly or indirectly.The 2020 Remuneration Report has been prepared and audited in accordance with the disclosure requirements of the Corporations Act 2001.
To our shareholdersOn behalf of the Board, I present QBE’s Remuneration Report for 2020.
Our response to COVID-19The economic and social disruption caused by the COVID-19 pandemic is widespread and continues to be felt right across the world.
For QBE, this impacted our business performance and investment income in 2020 and continues to impact our people and our customers. Combined with elevated catastrophe experience and adverse prior accident year claims development, we delivered a Group financial result that, disappointingly, was well below our target. However, despite the significant volatility during 2020, QBE made solid progress on a number of key priorities and demonstrated considerable adaptability and resilience. For that, and their sustained commitment, we thank our people around the globe.
COVID-19 led to a transformational shift in how our people work and connect with each other. We rapidly mobilised resources and technology to support people working remotely, while also prioritising our customers. In line with our QBE DNA and culture, the safety and wellbeing of our people was central throughout QBE’s response to the pandemic. We focused on the physical and mental wellbeing of our people in this sustained work-from-home environment, offered additional support for more vulnerable employees and continue to be mindful of the challenges that remain for the year ahead.
Board and executive changesWe announced the departure of the former Group Chief Executive Officer (CEO), Pat Regan, in September 2020. This followed decisive action by the Board after an external investigation concerning workplace communications. Our commitment to a respectful and inclusive environment at QBE continues, and is being expanded through our Culture Accelerator program mentioned below. Group Chair, Mike Wilkins, took on the role of Executive Chair during September and October. In October, we appointed Richard Pryce, CEO, International, as Interim Group CEO. The Board is grateful to Mr Pryce for delaying his planned retirement to take on the interim role while we search for a new Group CEO.
Mr Pryce’s skills and operational discipline are being positively received across the business. His interim remuneration arrangements, structured to account for the temporary nature of his role, vary to some extent from the prior Group CEO’s.
For more information, refer to page 56.
Along with two new Board members, Tan Le and Eric Smith, Jason Harris the new CEO, International, joined QBE in 2020. Our new Group Chief Risk Officer, Fiona Larnach, will commence in March 2021 and our new CEO, Australia Pacific, Sue Houghton, is expected to commence in Q3 2021. We are pleased that we continue to attract executives of this calibre and build our executive bench strength, whilst improving our gender balance. From Q3 2021, 45% of the Group Executive team will be female.
People, culture, diversity and inclusionWe have been strengthening our focus on culture, succession and talent. We continue to embed the QBE DNA and in late 2020, we commenced our Culture Accelerator to refine and enhance our DNA and support our journey towards making QBE more future-fit.
Fostering an environment where our employees feel engaged, supported and equipped to do their best is essential to our success, helping to drive business performance with positive customer, employee and partner outcomes. QBE wants our people to feel safe and encouraged to speak up, to raise ideas, to call out issues without fear and to embrace diversity.
Our annual employee engagement survey achieved a strong response with an overall engagement score of 76%, up from 70% in 2019, and an enablement score of 76%, up from 71% in 2019. There were also strong increases in some other key focus areas. These were pleasing results in a very challenging environment.
In addition to the activity highlighted above, our women in leadership and gender balance levels improved across the Group, QBE Australia was named JobAccess Best Workplace Diversity and Inclusion Program at the 2020 Australian HR Awards, recognising our ‘Share the Care’ flexible parental leave policy. QBE was also voted #10 in the 2020 Top 20 Australian Workplaces for New Dads (by HBF Direct Advice for Dads). Our continued commitment to creating meaningful relationships and promoting opportunities to empower Aboriginal and Torres Strait Islander communities, organisations and businesses is reflected in our recently launched Reconciliation Action Plan 2020–2022.
For more information, refer to QBE’s Sustainability Report at www.qbe.com/sustainability.
54
Performance during 2020 The Group’s 2020 financial result was disappointing and reflects the difficult operating environment which was heavily impacted by the pandemic. Despite COVID-19 related costs, the International division delivered pleasing margin improvement and encouraging growth as a result of strong pricing conditions and ongoing discipline in risk selection. In addition to material COVID-19 impacts, our North America and Australia Pacific divisions’ results were heavily impacted by catastrophe claims that were significantly above allowances. North America also experienced material adverse prior accident year claims development.
Though QBE made significant progress on a number of important deliverables, the Group’s adjusted combined operating ratio (COR) and the Group’s cash return on equity (ROE) were well below our expectations at 103.8% and (16.2)% respectively. As a result, the financial component of the short-term incentive (STI) resulted in a zero outcome for most of the executive KMP. However, in assessing the non-financial component of STI for the executive KMP, the ME@QBE component, the Board gave careful consideration to the unprecedented challenges that the management team responded to in 2020 and the perseverance, commitment and resilience each of them demonstrated throughout the year. While COVID-19 presented many challenges, other significant issues culminated in 2020 being one of the most challenging years in the Company’s recent history. Collectively and individually the executives led QBE through a very turbulent year and the Board believes that, despite the poor financial outcomes for the Group, their significant work in that respect should be recognised.
Accordingly, the Board has determined to award the executive KMP for the 35% non-financial component of their STI. However, it has exercised its discretion to make those awards as deferred equity (conditional rights), vesting over two years (2022 and 2023) with no cash component. This creates greater alignment with shareholders through increased share ownership. It reflects the Board’s determination to motivate, retain and stabilise the executive team in a manner that is in the best interests of shareholders and the long-term performance of the Company.
The 2020 STI outcome for the Interim Group CEO reflects that for the majority of the year he was in his prior role as CEO, International, the strong performance of the International division and his achievement against ME@QBE objectives. Based on this, he will receive 90.4% of his target opportunity (60.3% of his maximum opportunity). For the remaining executive KMP, the average STI outcome is 31.7% of their maximum opportunity.
For more information, refer to pages 57 to 62.
Looking aheadWe will be making some minor revisions to remuneration arrangements for 2021 as we proactively respond to the upcoming regulatory requirements in Australia. These include revised malus and new clawback rules for our incentive plans.
STI financial measures will continue to include COR and cash ROE, and will retain their weighting for 65% of the outcomes, the remaining 35% being weighted on performance against our strategic priorities. For 2021, we will utilise a blended COR from the divisional outcomes rather than the Group COR to improve the line of sight and enhance the impact of these measures across the Group.
The continued impact of COVID-19 creates a greater than usual challenge for setting the incentive targets for 2021. This is particularly relevant for the 2021 long-term incentive (LTI) performance measures.
For the 2021 LTI award, average cash ROE and relative total shareholder return (TSR) will continue to be the two key performance conditions measured over a three-year performance period and the catastrophe collar will remain. However, for the 2021 average cash ROE measure, we will vary the approach for calculating the target. Rather than setting a three-year target at this time, we will, at the end of the performance period, combine the three individual annual performance ranges that we will set over the three individual years. The outcomes for the 2021 performance year will be disclosed in next year’s Remuneration Report.
For more information, refer to page 70.
A broader review of remuneration will occur during 2021 to address the future regulatory requirements for expanded non-financial metrics and longer incentive deferral mechanisms. The remuneration principles detailed on the next page will underpin any changes to our arrangements.
We intend to engage key stakeholders as these are developed and next year’s report will contain further detail.
As always, we look forward to shareholder feedback.
John M GreenDeputy ChairChair, People & Remuneration Committee
QB
E In
suran
ce Gro
up
A
nn
ual R
epo
rt 2020
55O
ther
info
rmatio
n
6
Fin
ancial
Rep
ort
5
Perfo
rman
ce o
verv
iew
1
Op
erating an
d
finan
cial review
2
Go
vern
ance
3
Directo
rs' R
epo
rt
4

2020 incentive plan key features for the Group CEOFeature STI LTI
Remuneration components
STI cash (50%) and STI deferred equity (50%) Board discretion applied for 2020 to deliver 100% of any STI award as STI deferred equity
Equity (100%)
Target incentive opportunity
Former Group CEO – 133% target (200% maximum)Interim Group CEO – 150% target (225% maximum)
Former Group CEO – 200% (face-value)Interim Group CEO – 88% (face-value)
Performance period
One year Former Group CEO – three yearsInterim Group CEO – time in role
Equity deferral period
One to two years from end of performance period Three to five years from start of performance period
Performance measures1
Group cash ROE (25%)Group COR (40%) Strategic performance objectives (35%)
Former Group CEO – Group average cash ROE (50%) and relative TSR (50%)Interim Group CEO – special equity grant
Malus Subject to malus during the vesting periodExecutive minimum shareholding
The minimum shareholding requirement (MSR) is three times fixed remuneration for the Group CEO (to be achieved within five years), the Interim Group CEO is aligned to other executive KMP, refer to page 63.
Risk and behaviours
Performance assessments of each executive KMP include a formal assessment of risk and behaviours using input from the Group Chief Risk Officer (CRO), the Chair of the People & Remuneration Committee, the Chair of the Risk & Capital Committee and the Chairs of divisional boards where relevant.
1 The 2020 STI performance measures and outcomes for the Interim Group CEO are provided as part of the executive KMP performance snapshots on page 60. The LTI provided is subject to specific interim deliverables refer to page 69.
Our remuneration framework at a glance
Our purpose and remuneration principles Our purpose: We give people the confidence to achieve their ambitions
QBE’s remuneration strategy is designed to attract, motivate and retain QBE’s executives by providing market competitive remuneration aligned with the creation of sustained shareholder value.
Motivating Aligned to shareholders
Globally consistent and locally competitive
Linked to strategy
Simple and clear
How the remuneration framework supports the strategy Simple and clear
A simple and clear view of how delivery of our strategy impacts incentive outcomes for our executives.
Adaptable to changes in our strategy and external environment
Performance targets aimed at delivering our long-term objectives will evolve with our strategy, changes to business cycles and the external operating environment.
Measures that are correlated with performance
Measures that focus on profitability, management of the balance sheet and our longer-term strategic priorities enable remuneration outcomes to reflect a holistic view of performance.
Encourages our executives to think and act like business owners
A significant portion of incentives is paid in equity which focuses executives on creating shareholder value, managing risk and being accountable for the long-term success of QBE.
Aligning remuneration to culture and managing riskThe remuneration structure is designed to align remuneration with prudent risk-taking, underpinned by clear messaging
of our QBE DNA which describes who we are, what we stand for and how we need to operate to be successful. The way that each executive manages risk and conduct is a key consideration of the Board in determining incentive outcomes.
56
Group cash ROE1
Award
0.0%
Group COR2
Award
0.0%
International COR2,5
Award
138.3%
North America COR5
Award
0.0%
Australia Pacific COR2
Award
0.0%
Superior91.5%
Outcome103.8%
Target94.5%
Threshold97.5%
Superior95.0%
Target98.0%
Threshold101.0%
Outcome116.0%
Superior92.1%
Threshold98.1%
Outcome92.8%
Target95.1%
Superior87.2%
Target90.2%
Threshold93.2%
Outcome97.3%
Performance outcomes for the Group were significantly impacted in 2020 by catastrophe claims in excess of allowances in both Australia Pacific and North America and adverse prior accident year claims in North America. This was in contrast to a strong result in International.
As a result of the above, the Group adjusted cash ROE of (16.2)%1 was below the threshold for incentives to be awarded for this measure. The Group adjusted COR of 103.8%2 was also below the threshold for incentives to be awarded for this measure.
The impact of the financial performance on the incentive payouts for executive KMP is provided on pages 60 to 62.
Financial performance – five-year summary
2020 2019 2018 2017 2016
Statutory COR 3 (%) 107.4 100.0 95.9 104.8 94.0Net (loss) profit after tax 3 (US$M) (1,517) 571 567 (1,249) 844Return on average shareholders' equity (%) (18.2) 6.7 4.5 (13.0) 8.1Group cash ROE for incentive purposes 1 (%) (16.2) 8.9 8.0 (9.2) 8.4Group COR for incentive purposes 2 (%) 103.8 97.5 95.7 104.1 N/A
Return to shareholders – five-year summary
2020 2019 2018 2017 2016
Share price at 31 December (A$/share) 8.53 12.88 10.10 10.68 12.42Dividend per share (Australian cents) 4 52 50 26 54TSR (%) (24.0) 29.2 (0.9) (8.9) 5.3
Group CEO outcomes – five-year summary 4
2020 2019 2018 2017 2016
STI or Executive Incentive Plan (EIP) (from 2017 to 2018) as % of target 90.4 68.5 98.6 15.6 75.3LTI vested (% of grant) – 0 0 0 0
Tracking of unvested LTI awards
LTI AWARD PERFORMANCE MEASURES VESTING DATES TRACKING
2019 Average cash ROE and relative TSR
March 2022/23/24 Unlikely to vest in full
2020 Same as above March 2023/24/25 On track
1 For incentive purposes, the adjusted cash ROE of (10.9)% provided on page 14 is adjusted by (5.3)% for goodwill and impairment of intangibles. For 2018 and prior years, cash ROE was adjusted for 50% of the impact of unbudgeted movements in discount rates. This adjustment no longer applies.
2 For incentive purposes, the 2020 COR of 104.2%, excluding the impact of changes in risk-free rates, is adjusted by (0.4)% to exclude elevated risk and regulatory costs. The reconciliation of the statutory to adjusted COR is included on page 11.
3 From 2018, the results reflect continuing operations only. For 2017 and prior years, the results reflect consolidated Group performance including discontinued operations.
4 For 2020, the results reflect the pro-rated STI outcome for Mr Pryce for the period in both the Interim Group CEO and CEO, International roles. There were no LTI grants due to vest in 2020.
5 Excludes transfer of certain North American inward reinsurance business to International.
How we performed:Financial performance
Superior12.0%
Outcome(16.2)%
Target9.8%
Threshold8.0%
QB
E In
suran
ce Gro
up
A
nn
ual R
epo
rt 2020
57
Oth
er in
form
ation
6
Fin
ancial
Rep
ort
5
Perfo
rman
ce o
verv
iew
1
Op
erating an
d
finan
cial review
2
Go
vern
ance
3
Directo
rs' R
epo
rt
4
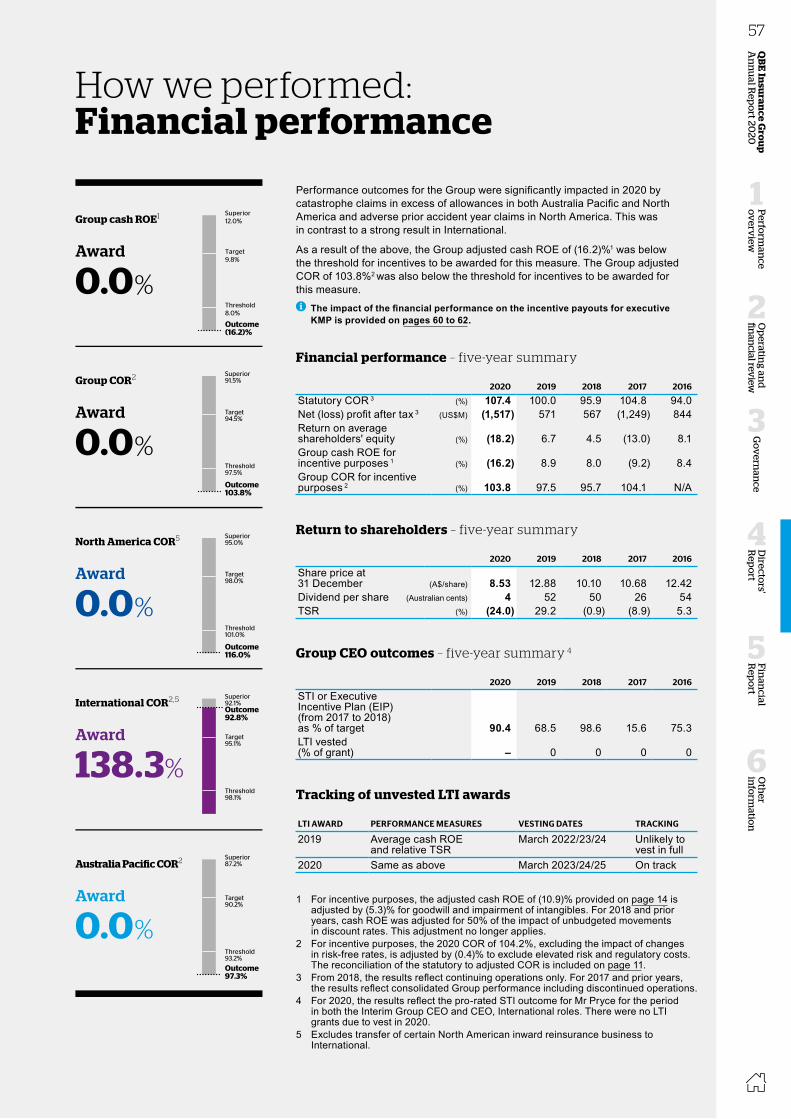
2020 incentive plan key features for the Group CEOFeature STI LTI
Remuneration components
STI cash (50%) and STI deferred equity (50%) Board discretion applied for 2020 to deliver 100% of any STI award as STI deferred equity
Equity (100%)
Target incentive opportunity
Former Group CEO – 133% target (200% maximum)Interim Group CEO – 150% target (225% maximum)
Former Group CEO – 200% (face-value)Interim Group CEO – 88% (face-value)
Performance period
One year Former Group CEO – three yearsInterim Group CEO – time in role
Equity deferral period
One to two years from end of performance period Three to five years from start of performance period
Performance measures1
Group cash ROE (25%)Group COR (40%) Strategic performance objectives (35%)
Former Group CEO – Group average cash ROE (50%) and relative TSR (50%)Interim Group CEO – special equity grant
Malus Subject to malus during the vesting periodExecutive minimum shareholding
The minimum shareholding requirement (MSR) is three times fixed remuneration for the Group CEO (to be achieved within five years), the Interim Group CEO is aligned to other executive KMP, refer to page 63.
Risk and behaviours
Performance assessments of each executive KMP include a formal assessment of risk and behaviours using input from the Group Chief Risk Officer (CRO), the Chair of the People & Remuneration Committee, the Chair of the Risk & Capital Committee and the Chairs of divisional boards where relevant.
1 The 2020 STI performance measures and outcomes for the Interim Group CEO are provided as part of the executive KMP performance snapshots on page 60. The LTI provided is subject to specific interim deliverables refer to page 69.
Our remuneration framework at a glance
Our purpose and remuneration principles Our purpose: We give people the confidence to achieve their ambitions
QBE’s remuneration strategy is designed to attract, motivate and retain QBE’s executives by providing market competitive remuneration aligned with the creation of sustained shareholder value.
Motivating Aligned to shareholders
Globally consistent and locally competitive
Linked to strategy
Simple and clear
How the remuneration framework supports the strategy Simple and clear
A simple and clear view of how delivery of our strategy impacts incentive outcomes for our executives.
Adaptable to changes in our strategy and external environment
Performance targets aimed at delivering our long-term objectives will evolve with our strategy, changes to business cycles and the external operating environment.
Measures that are correlated with performance
Measures that focus on profitability, management of the balance sheet and our longer-term strategic priorities enable remuneration outcomes to reflect a holistic view of performance.
Encourages our executives to think and act like business owners
A significant portion of incentives is paid in equity which focuses executives on creating shareholder value, managing risk and being accountable for the long-term success of QBE.
Aligning remuneration to culture and managing riskThe remuneration structure is designed to align remuneration with prudent risk-taking, underpinned by clear messaging
of our QBE DNA which describes who we are, what we stand for and how we need to operate to be successful. The way that each executive manages risk and conduct is a key consideration of the Board in determining incentive outcomes.
56
Group cash ROE1
Award
0.0%
Group COR2
Award
0.0%
International COR2,5
Award
138.3%
North America COR5
Award
0.0%
Australia Pacific COR2
Award
0.0%
Superior91.5%
Outcome103.8%
Target94.5%
Threshold97.5%
Superior95.0%
Target98.0%
Threshold101.0%
Outcome116.0%
Superior92.1%
Threshold98.1%
Outcome92.8%
Target95.1%
Superior87.2%
Target90.2%
Threshold93.2%
Outcome97.3%
Performance outcomes for the Group were significantly impacted in 2020 by catastrophe claims in excess of allowances in both Australia Pacific and North America and adverse prior accident year claims in North America. This was in contrast to a strong result in International.
As a result of the above, the Group adjusted cash ROE of (16.2)%1 was below the threshold for incentives to be awarded for this measure. The Group adjusted COR of 103.8%2 was also below the threshold for incentives to be awarded for this measure.
The impact of the financial performance on the incentive payouts for executive KMP is provided on pages 60 to 62.
Financial performance – five-year summary
2020 2019 2018 2017 2016
Statutory COR 3 (%) 107.4 100.0 95.9 104.8 94.0Net (loss) profit after tax 3 (US$M) (1,517) 571 567 (1,249) 844Return on average shareholders' equity (%) (18.2) 6.7 4.5 (13.0) 8.1Group cash ROE for incentive purposes 1 (%) (16.2) 8.9 8.0 (9.2) 8.4Group COR for incentive purposes 2 (%) 103.8 97.5 95.7 104.1 N/A
Return to shareholders – five-year summary
2020 2019 2018 2017 2016
Share price at 31 December (A$/share) 8.53 12.88 10.10 10.68 12.42Dividend per share (Australian cents) 4 52 50 26 54TSR (%) (24.0) 29.2 (0.9) (8.9) 5.3
Group CEO outcomes – five-year summary 4
2020 2019 2018 2017 2016
STI or Executive Incentive Plan (EIP) (from 2017 to 2018) as % of target 90.4 68.5 98.6 15.6 75.3LTI vested (% of grant) – 0 0 0 0
Tracking of unvested LTI awards
LTI AWARD PERFORMANCE MEASURES VESTING DATES TRACKING
2019 Average cash ROE and relative TSR
March 2022/23/24 Unlikely to vest in full
2020 Same as above March 2023/24/25 On track
1 For incentive purposes, the adjusted cash ROE of (10.9)% provided on page 14 is adjusted by (5.3)% for goodwill and impairment of intangibles. For 2018 and prior years, cash ROE was adjusted for 50% of the impact of unbudgeted movements in discount rates. This adjustment no longer applies.
2 For incentive purposes, the 2020 COR of 104.2%, excluding the impact of changes in risk-free rates, is adjusted by (0.4)% to exclude elevated risk and regulatory costs. The reconciliation of the statutory to adjusted COR is included on page 11.
3 From 2018, the results reflect continuing operations only. For 2017 and prior years, the results reflect consolidated Group performance including discontinued operations.
4 For 2020, the results reflect the pro-rated STI outcome for Mr Pryce for the period in both the Interim Group CEO and CEO, International roles. There were no LTI grants due to vest in 2020.
5 Excludes transfer of certain North American inward reinsurance business to International.
How we performed:Financial performance
Superior12.0%
Outcome(16.2)%
Target9.8%
Threshold8.0%
QB
E In
suran
ce Gro
up
A
nn
ual R
epo
rt 2020
57O
ther
info
rmatio
n
6
Fin
ancial
Rep
ort
5
Perfo
rman
ce o
verv
iew
1
Op
erating an
d
finan
cial review
2
Go
vern
ance
3
Directo
rs' R
epo
rt
4

In addition to financial results, focus on our progress against our strategic priorities through 2020 underpinned the determination of incentive outcomes for the year.
Continue to mature our cell review process to deliver our target COR. Deliver against key sustainability and climate commitments. Turn our focus to organic growth opportunities.
f Continued focusWe remained focused on the rigour of cell reviews and took steps to enhance and improve those processes through the use of additional financial and capital metrics as part of the reviews. In response to the emergent COVID-19 threat globally, we moved quickly to protect the balance sheet and took prudent steps to de-risk our investment portfolio.
f Sustainability focusWe continued to deliver against our climate and sustainability commitments and were the first Australian insurer to join the UN-convened Net-Zero Asset Owner Alliance, pledging to transition our investment portfolio to net-zero greenhouse gas emissions by 2050. We used 97% of renewable electricity across our global operations and maintained our carbon neutrality. We developed an environment and social risk framework to support integration of ESG considerations into our Group Underwriting Standards.
f Supporting our customersOur customer service levels remained relatively unchanged despite our people working remotely. We also provided our customers with a wide range of additional support including premium rebates and other financial relief measures.
Execute the next phase of Brilliant Basics with a sharper focus on delivering for our customers. Leverage best in class AI, data, and digital capabilities to embed everyday brilliance in underwriting and pricing and in particular, throughout our customer claims experience.
f Core capability buildOur Brilliant Basics discipline has enabled us to further enhance our core capabilities of pricing, risk selection and claims management. This is evident in the improvement in our attritional claims ratio which has continued to improve since the introduction of Brilliant Basics, as well as an increase in the sophistication of our pricing capabilities. We provided support to our customers through COVID-19, for example pricing relief in Australia, whilst also ensuring strict underwriting discipline to de-risk our portfolios more exposed to economic risk such as Trade Credit and LMI. This provided QBE the balance to be able to navigate through a challenging year.
f Claims focusAs part of Brilliant Basics claims, we delivered significant uplift in operational capabilities across all major claims lines. Through modernisation we created a simpler, more efficient claims function for a better customer experience, as well as improved financial performance. Examples include the introduction of digital claims lodgement platform and pursuing straight-through processing and no-touch claims.
In 2020, executive KMP had 35% of their STI outcome determined with reference to strategic performance objectives aligned to QBE’s strategic priorities.
The information on the right provides a summary of the priorities and the outcomes achieved during 2020.
The executive KMP objectives are aligned with these and their actual STI outcomes are provided in the following pages.
Our 2020 achievements
How we performed: 2020 priorities
Performance Brilliant Basics +
58
Enhance our digital and data capability, update our IT platforms and accelerate the transition to the cloud. Through innovative partnerships and QBE Ventures, cultivate skills and capabilities for the future and create an environment that nurtures innovation and continuous improvement.
f Strengthened foundationsWe showcased the importance of the investments we have made in strengthening our technology foundations by shifting the entire employee base to work from home with cloud-enabled tools and minimal disruption to our customers. We have also continued to advance our program of work to streamline and modernise our technology estate with the decommissioning of over 60 applications and continued improvements in platform stability whilst reducing the volume of critical incidents by over 80% in the past three years. Preparations are well advanced to exit our data centre in Australia in favour of a cloud first and co-location strategy. At the same time, we delivered upgrades to a number of core insurance platforms to address technology debt. We continue to enhance our digital offerings and capabilities including the launch of a digital marketing cloud in North America and new and expanded digital sales platforms in Australia and Asia.
f VenturesWe reset QBE Ventures during the year, recruiting key talent and enhancing scope to better identify and invest in partnerships aligned to long-term growth. We also launched Mitti, a new digital venture built in partnership with SafetyCulture. This merges risk management and insurance to deliver a more customer -centred value proposition to small and medium-sized enterprises.
Accelerate our talent and leadership strategy, building on our DNA to empower our people to thrive, now and in the future. Continue to enhance our performance management system, ME@QBE, supporting our people and leaders in managing career and talent development.
f Supported our peopleOur people have been provided with significant support through the extraordinary circumstances that 2020 has presented.
f Health and wellbeingWe bolstered our focus across our geographies and introduced new more frequent pulse surveys to understand current sentiment and how best to support our employees and deliver for our customers. This enabled us to address and respond to feedback and boost employee wellbeing. An improvement in the Group’s overall employee engagement and enablement scores (to 76%) was testament to this focus, especially given the challenging environment.
f Leadership capability upliftOur focus has been on enabling our people to be their best. We have reset our talent acquisition program and evolved our flexible working principles. Our future women in leadership targets continue to drive inclusivity across the organisation with improvements in our gender balance across the executive team during the year (increasing from 33.7% to 34.8%).
f Diversity focusWe remain committed to being a diverse and inclusive employer and have been recognised as one of Australia’s top LGBTIQ+ inclusion employers, for the second year in a row, being awarded Gold Employer status through the Australian Workplace Equality Index.
Expand the breadth and depth of our customer focus by embedding our Customer@QBE framework, leveraging customer research to build deeper industry expertise and customer insights. Implement leading digital technologies to create seamless end-to-end experiences for our customers.
f Customer@QBE launchDuring the year we formally launched Customer@QBE, encapsulating a range of initiatives across the Group to deliver on our customer focus imperative. Driven by our divisions, the intent is to unify our focus on better understanding our customers in order to deliver exceptional customer experience. The program targets three key elements of customer focus – mindset, insights and delivery.
We continued to sharpen our customer focus through improving claims experiences, execution of Brilliant Basics initiatives and strong attention on key trading relationships, leveraging advanced analytics, data and digital capabilities.
f Global sales approachAs an enabler of the above, this initiative has unified our people around customer-focused sales and relationship management to generate strategic and profitable growth and is aligned tightly with the embedding of sales enablement tools which have allowed QBE to integrate internal and external data and provide actionable data insights.
Innovation & Technology
Talent & Culture
Customer Focus
QB
E In
suran
ce Gro
up
A
nn
ual R
epo
rt 2020
59
Oth
er in
form
ation
6
Fin
ancial
Rep
ort
5
Perfo
rman
ce o
verv
iew
1
Op
erating an
d
finan
cial review
2
Go
vern
ance
3
Directo
rs' R
epo
rt
4
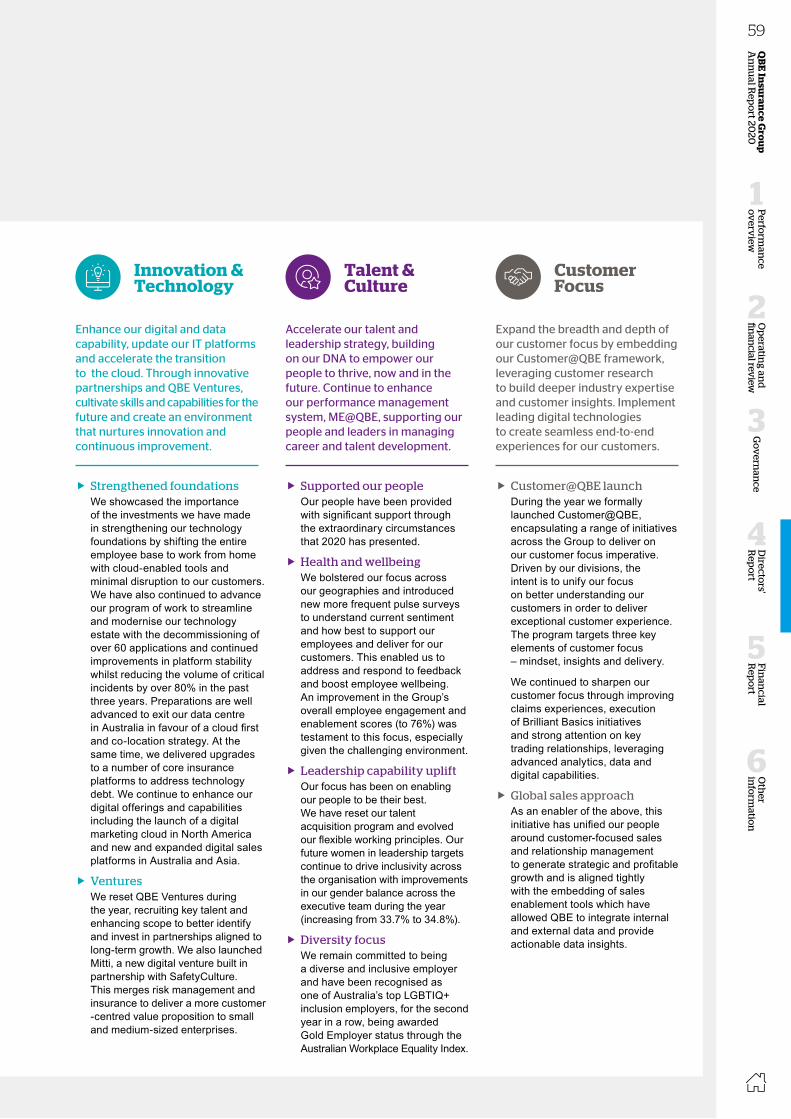
In addition to financial results, focus on our progress against our strategic priorities through 2020 underpinned the determination of incentive outcomes for the year.
Continue to mature our cell review process to deliver our target COR. Deliver against key sustainability and climate commitments. Turn our focus to organic growth opportunities.
f Continued focusWe remained focused on the rigour of cell reviews and took steps to enhance and improve those processes through the use of additional financial and capital metrics as part of the reviews. In response to the emergent COVID-19 threat globally, we moved quickly to protect the balance sheet and took prudent steps to de-risk our investment portfolio.
f Sustainability focusWe continued to deliver against our climate and sustainability commitments and were the first Australian insurer to join the UN-convened Net-Zero Asset Owner Alliance, pledging to transition our investment portfolio to net-zero greenhouse gas emissions by 2050. We used 97% of renewable electricity across our global operations and maintained our carbon neutrality. We developed an environment and social risk framework to support integration of ESG considerations into our Group Underwriting Standards.
f Supporting our customersOur customer service levels remained relatively unchanged despite our people working remotely. We also provided our customers with a wide range of additional support including premium rebates and other financial relief measures.
Execute the next phase of Brilliant Basics with a sharper focus on delivering for our customers. Leverage best in class AI, data, and digital capabilities to embed everyday brilliance in underwriting and pricing and in particular, throughout our customer claims experience.
f Core capability buildOur Brilliant Basics discipline has enabled us to further enhance our core capabilities of pricing, risk selection and claims management. This is evident in the improvement in our attritional claims ratio which has continued to improve since the introduction of Brilliant Basics, as well as an increase in the sophistication of our pricing capabilities. We provided support to our customers through COVID-19, for example pricing relief in Australia, whilst also ensuring strict underwriting discipline to de-risk our portfolios more exposed to economic risk such as Trade Credit and LMI. This provided QBE the balance to be able to navigate through a challenging year.
f Claims focusAs part of Brilliant Basics claims, we delivered significant uplift in operational capabilities across all major claims lines. Through modernisation we created a simpler, more efficient claims function for a better customer experience, as well as improved financial performance. Examples include the introduction of digital claims lodgement platform and pursuing straight-through processing and no-touch claims.
In 2020, executive KMP had 35% of their STI outcome determined with reference to strategic performance objectives aligned to QBE’s strategic priorities.
The information on the right provides a summary of the priorities and the outcomes achieved during 2020.
The executive KMP objectives are aligned with these and their actual STI outcomes are provided in the following pages.
Our 2020 achievements
How we performed: 2020 priorities
Performance Brilliant Basics +
58
Enhance our digital and data capability, update our IT platforms and accelerate the transition to the cloud. Through innovative partnerships and QBE Ventures, cultivate skills and capabilities for the future and create an environment that nurtures innovation and continuous improvement.
f Strengthened foundationsWe showcased the importance of the investments we have made in strengthening our technology foundations by shifting the entire employee base to work from home with cloud-enabled tools and minimal disruption to our customers. We have also continued to advance our program of work to streamline and modernise our technology estate with the decommissioning of over 60 applications and continued improvements in platform stability whilst reducing the volume of critical incidents by over 80% in the past three years. Preparations are well advanced to exit our data centre in Australia in favour of a cloud first and co-location strategy. At the same time, we delivered upgrades to a number of core insurance platforms to address technology debt. We continue to enhance our digital offerings and capabilities including the launch of a digital marketing cloud in North America and new and expanded digital sales platforms in Australia and Asia.
f VenturesWe reset QBE Ventures during the year, recruiting key talent and enhancing scope to better identify and invest in partnerships aligned to long-term growth. We also launched Mitti, a new digital venture built in partnership with SafetyCulture. This merges risk management and insurance to deliver a more customer -centred value proposition to small and medium-sized enterprises.
Accelerate our talent and leadership strategy, building on our DNA to empower our people to thrive, now and in the future. Continue to enhance our performance management system, ME@QBE, supporting our people and leaders in managing career and talent development.
f Supported our peopleOur people have been provided with significant support through the extraordinary circumstances that 2020 has presented.
f Health and wellbeingWe bolstered our focus across our geographies and introduced new more frequent pulse surveys to understand current sentiment and how best to support our employees and deliver for our customers. This enabled us to address and respond to feedback and boost employee wellbeing. An improvement in the Group’s overall employee engagement and enablement scores (to 76%) was testament to this focus, especially given the challenging environment.
f Leadership capability upliftOur focus has been on enabling our people to be their best. We have reset our talent acquisition program and evolved our flexible working principles. Our future women in leadership targets continue to drive inclusivity across the organisation with improvements in our gender balance across the executive team during the year (increasing from 33.7% to 34.8%).
f Diversity focusWe remain committed to being a diverse and inclusive employer and have been recognised as one of Australia’s top LGBTIQ+ inclusion employers, for the second year in a row, being awarded Gold Employer status through the Australian Workplace Equality Index.
Expand the breadth and depth of our customer focus by embedding our Customer@QBE framework, leveraging customer research to build deeper industry expertise and customer insights. Implement leading digital technologies to create seamless end-to-end experiences for our customers.
f Customer@QBE launchDuring the year we formally launched Customer@QBE, encapsulating a range of initiatives across the Group to deliver on our customer focus imperative. Driven by our divisions, the intent is to unify our focus on better understanding our customers in order to deliver exceptional customer experience. The program targets three key elements of customer focus – mindset, insights and delivery.
We continued to sharpen our customer focus through improving claims experiences, execution of Brilliant Basics initiatives and strong attention on key trading relationships, leveraging advanced analytics, data and digital capabilities.
f Global sales approachAs an enabler of the above, this initiative has unified our people around customer-focused sales and relationship management to generate strategic and profitable growth and is aligned tightly with the embedding of sales enablement tools which have allowed QBE to integrate internal and external data and provide actionable data insights.
Innovation & Technology
Talent & Culture
Customer Focus
QB
E In
suran
ce Gro
up
A
nn
ual R
epo
rt 2020
59O
ther
info
rmatio
n
6
Fin
ancial
Rep
ort
5
Perfo
rman
ce o
verv
iew
1
Op
erating an
d
finan
cial review
2
Go
vern
ance
3
Directo
rs' R
epo
rt
4

Remuneration Report continued
1. EXECUTIVE KMP PERFORMANCE SNAPSHOTS
QBE discloses actual remuneration outcomes in the financial period under review.
The realised 2020 remuneration figures below include the accrued STI cash award for the 2020 financial year, the value of any conditional rights granted in prior years that vested during 2020 and executive shareholdings against the MSR.
For the 2020 STI, the Board has applied discretion to deliver the outcomes as deferred equity (conditional rights), vesting in 2022 and 2023. No STI cash will be provided.
The value of vested conditional rights awards has been calculated using the share price on the vesting date. These figures are different from those shown in the statutory table on page 71. For example, the statutory table includes an apportioned accounting value for all unvested conditional rights held during the year, which remain subject to performance and service conditions and consequently may or may not ultimately vest.
Interim Group CEO
Richard Pryce Interim Group CEO
Term as KMP in 2020Full year
Country of residenceUnited Kingdom
Total value of shareholdings against the MSR (times fixed remuneration) 2.6
Target remuneration mix
30% 22% 22% 26%
2020 STI outcome (US$000) 90.4% of target
$1,421STI (deferred)
$0STI (cash) measured on...11.5% Group cash ROE (achieved 0.0%)18.5% Group COR (achieved 0.0%)35.0% Divisional COR (achieved 138.3%)35.0% Strategic performance objectives (achieved 120.0%)
2020 realised remuneration 1 (US$000) $2,080 Total
$1,089 $814 $177
Divisional executive KMP
Jason Harris Chief Executive Officer, International
Term as KMP in 2020Commenced 4 December 2020
Country of residenceUnited Kingdom
Total value of shareholdings against the MSR (times fixed remuneration) 0.5
Target remuneration mix
32% 25% 12% 31%
2020 STI outcome (US$000) 83.4% of target
$64STI (deferred)
$0STI (cash) measured on...11.5% Group cash ROE (achieved 0.0%)18.5% Group COR (achieved 0.0%)35.0% Divisional COR (achieved 138.3%)35.0% Strategic performance objectives (achieved 100.0%)
2020 realised remuneration 2 (US$000) $907 Total
$60 $847
Key: Fixed remuneration STI (cash) STI (deferred) LTI face-value Value of vested rights Other
1 Richard Pryce commenced in the Interim Group CEO role on 26 October 2020; his prior role was as CEO, International. The 2020 STI outcome, realised remuneration and STI cash/deferred split shown is pro-rated for the period in both executive KMP roles.
2 Other for Jason Harris includes a cash payment of GBP660,000 on commencement of employment with QBE, payable in March 2021.
60
Todd Jones Chief Executive Officer, North America
Term as KMP in 2020Full year
Country of residenceUnited States
Total value of shareholdings against the MSR (times fixed remuneration) 2.3
Target remuneration mix
27% 22% 11% 40%
2020 STI outcome (US$000) 35.0% of target
$430STI (deferred)
$0STI (cash) measured on...11.5% Group cash ROE (achieved 0.0%)18.5% Group COR (achieved 0.0%)35.0% Divisional COR (achieved 0.0%)35.0% Strategic performance objectives (achieved 100.0%)
2020 realised remuneration (US$000) $2,584 Total
$1,023 $1,455 $106
Group Head Office executive KMP
Jason Brown Group Chief Underwriting Officer
Term as KMP in 2020Full year
Country of residenceUnited Kingdom
Total value of shareholdings against the MSR (times fixed remuneration) 2.7
Target remuneration mix
32% 25% 12% 31%
2020 STI outcome (US$000) 35.0% of target
$296STI (deferred)
$0STI (cash) measured on...25.0% Group cash ROE (achieved 0.0%)40.0% Group COR (achieved 0.0%)35.0% Strategic performance objectives (achieved 100.0%)
2020 realised remuneration (US$000) $940 Total
$641 $202 $97
Peter Grewal Group Chief Risk Officer
Term as KMP in 2020Full year
Country of residenceUnited Kingdom
Total value of shareholdings against the MSR (times fixed remuneration) 0.7
Target remuneration mix
34% 22% 11% 33%
2020 STI outcome (US$000)
Peter Grewal ceased employment from 31 December 2020 and is not eligible for a 2020 STI award.
2020 realised remuneration (US$000) $1,098 Total
$535 $479 $84
Key: Fixed remuneration STI (cash) STI (deferred) LTI face-value Value of vested rights Other
QB
E In
suran
ce Gro
up
A
nn
ual R
epo
rt 2020
61
Oth
er in
form
ation
6
Fin
ancial
Rep
ort
5
Perfo
rman
ce o
verv
iew
1
Op
erating an
d
finan
cial review
2
Go
vern
ance
3
Directo
rs' R
epo
rt
4

Remuneration Report continued
1. EXECUTIVE KMP PERFORMANCE SNAPSHOTS
QBE discloses actual remuneration outcomes in the financial period under review.
The realised 2020 remuneration figures below include the accrued STI cash award for the 2020 financial year, the value of any conditional rights granted in prior years that vested during 2020 and executive shareholdings against the MSR.
For the 2020 STI, the Board has applied discretion to deliver the outcomes as deferred equity (conditional rights), vesting in 2022 and 2023. No STI cash will be provided.
The value of vested conditional rights awards has been calculated using the share price on the vesting date. These figures are different from those shown in the statutory table on page 71. For example, the statutory table includes an apportioned accounting value for all unvested conditional rights held during the year, which remain subject to performance and service conditions and consequently may or may not ultimately vest.
Interim Group CEO
Richard Pryce Interim Group CEO
Term as KMP in 2020Full year
Country of residenceUnited Kingdom
Total value of shareholdings against the MSR (times fixed remuneration) 2.6
Target remuneration mix
30% 22% 22% 26%
2020 STI outcome (US$000) 90.4% of target
$1,421STI (deferred)
$0STI (cash) measured on...11.5% Group cash ROE (achieved 0.0%)18.5% Group COR (achieved 0.0%)35.0% Divisional COR (achieved 138.3%)35.0% Strategic performance objectives (achieved 120.0%)
2020 realised remuneration 1 (US$000) $2,080 Total
$1,089 $814 $177
Divisional executive KMP
Jason Harris Chief Executive Officer, International
Term as KMP in 2020Commenced 4 December 2020
Country of residenceUnited Kingdom
Total value of shareholdings against the MSR (times fixed remuneration) 0.5
Target remuneration mix
32% 25% 12% 31%
2020 STI outcome (US$000) 83.4% of target
$64STI (deferred)
$0STI (cash) measured on...11.5% Group cash ROE (achieved 0.0%)18.5% Group COR (achieved 0.0%)35.0% Divisional COR (achieved 138.3%)35.0% Strategic performance objectives (achieved 100.0%)
2020 realised remuneration 2 (US$000) $907 Total
$60 $847
Key: Fixed remuneration STI (cash) STI (deferred) LTI face-value Value of vested rights Other
1 Richard Pryce commenced in the Interim Group CEO role on 26 October 2020; his prior role was as CEO, International. The 2020 STI outcome, realised remuneration and STI cash/deferred split shown is pro-rated for the period in both executive KMP roles.
2 Other for Jason Harris includes a cash payment of GBP660,000 on commencement of employment with QBE, payable in March 2021.
60
Todd Jones Chief Executive Officer, North America
Term as KMP in 2020Full year
Country of residenceUnited States
Total value of shareholdings against the MSR (times fixed remuneration) 2.3
Target remuneration mix
27% 22% 11% 40%
2020 STI outcome (US$000) 35.0% of target
$430STI (deferred)
$0STI (cash) measured on...11.5% Group cash ROE (achieved 0.0%)18.5% Group COR (achieved 0.0%)35.0% Divisional COR (achieved 0.0%)35.0% Strategic performance objectives (achieved 100.0%)
2020 realised remuneration (US$000) $2,584 Total
$1,023 $1,455 $106
Group Head Office executive KMP
Jason Brown Group Chief Underwriting Officer
Term as KMP in 2020Full year
Country of residenceUnited Kingdom
Total value of shareholdings against the MSR (times fixed remuneration) 2.7
Target remuneration mix
32% 25% 12% 31%
2020 STI outcome (US$000) 35.0% of target
$296STI (deferred)
$0STI (cash) measured on...25.0% Group cash ROE (achieved 0.0%)40.0% Group COR (achieved 0.0%)35.0% Strategic performance objectives (achieved 100.0%)
2020 realised remuneration (US$000) $940 Total
$641 $202 $97
Peter Grewal Group Chief Risk Officer
Term as KMP in 2020Full year
Country of residenceUnited Kingdom
Total value of shareholdings against the MSR (times fixed remuneration) 0.7
Target remuneration mix
34% 22% 11% 33%
2020 STI outcome (US$000)
Peter Grewal ceased employment from 31 December 2020 and is not eligible for a 2020 STI award.
2020 realised remuneration (US$000) $1,098 Total
$535 $479 $84
Key: Fixed remuneration STI (cash) STI (deferred) LTI face-value Value of vested rights Other
QB
E In
suran
ce Gro
up
A
nn
ual R
epo
rt 2020
61O
ther
info
rmatio
n
6
Fin
ancial
Rep
ort
5
Perfo
rman
ce o
verv
iew
1
Op
erating an
d
finan
cial review
2
Go
vern
ance
3
Directo
rs' R
epo
rt
4
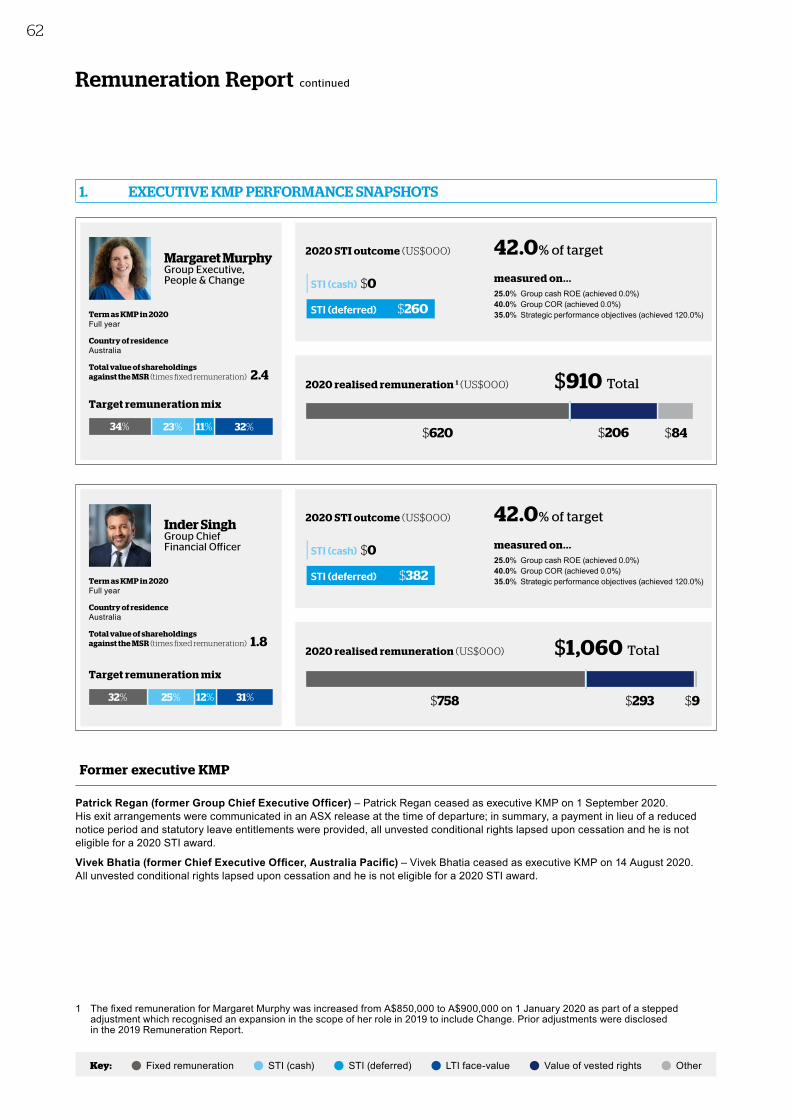
Remuneration Report continued
Margaret Murphy Group Executive, People & Change
Term as KMP in 2020Full year
Country of residenceAustralia
Total value of shareholdings against the MSR (times fixed remuneration) 2.4
Target remuneration mix
34% 23% 11% 32%
2020 STI outcome (US$000) 42.0% of target
$260STI (deferred)
$0STI (cash) measured on...25.0% Group cash ROE (achieved 0.0%)40.0% Group COR (achieved 0.0%)35.0% Strategic performance objectives (achieved 120.0%)
2020 realised remuneration 1 (US$000) $910 Total
$620 $206 $84
Inder Singh Group Chief Financial Officer
Term as KMP in 2020Full year
Country of residenceAustralia
Total value of shareholdings against the MSR (times fixed remuneration) 1.8
Target remuneration mix
32% 25% 12% 31%
2020 STI outcome (US$000) 42.0% of target
$382STI (deferred)
$0STI (cash) measured on...25.0% Group cash ROE (achieved 0.0%)40.0% Group COR (achieved 0.0%)35.0% Strategic performance objectives (achieved 120.0%)
2020 realised remuneration (US$000) $1,060 Total
$758 $293 $9
Former executive KMP
Patrick Regan (former Group Chief Executive Officer) – Patrick Regan ceased as executive KMP on 1 September 2020. His exit arrangements were communicated in an ASX release at the time of departure; in summary, a payment in lieu of a reduced notice period and statutory leave entitlements were provided, all unvested conditional rights lapsed upon cessation and he is not eligible for a 2020 STI award.
Vivek Bhatia (former Chief Executive Officer, Australia Pacific) – Vivek Bhatia ceased as executive KMP on 14 August 2020. All unvested conditional rights lapsed upon cessation and he is not eligible for a 2020 STI award.
1. EXECUTIVE KMP PERFORMANCE SNAPSHOTS
Key: Fixed remuneration STI (cash) STI (deferred) LTI face-value Value of vested rights Other
1 The fixed remuneration for Margaret Murphy was increased from A$850,000 to A$900,000 on 1 January 2020 as part of a stepped adjustment which recognised an expansion in the scope of her role in 2019 to include Change. Prior adjustments were disclosed in the 2019 Remuneration Report.
62
2. REMUNERATION GOVERNANCE
QBE has a robust remuneration governance framework overseen by the QBE Board. This ensures that the remuneration arrangements are appropriately managed and that the agreed frameworks and policies are applied across QBE.
QBE BoardHas overall responsibility for the remuneration strategy and outcomes
for executives and non-executive directors.
People & Remuneration CommitteeIs the main governing body for key people and remuneration items across the Group.
Further details on the role and scope of the People & Remuneration Committee are set out in the QBE People & Remuneration Committee charter (available from www.qbe.com/investor-relations/corporate-governance/qbe-charters-and-constitution).
External advisorsGroup CEO Divisional people and remuneration committees
Use of external advisors
Remuneration consultants provide guidance on remuneration for executives, facilitate discussion, review remuneration and at-risk reward benchmarking within industry peer groups and provide guidance on current trends in executive remuneration practices. Any advice provided by remuneration consultants is used as a guide and is not a substitute for consideration of all the issues by each non-executive director on the People & Remuneration Committee.
Australian-based firm Ernst & Young (EY) currently acts as the independent remuneration advisor to the People & Remuneration Committee. The People & Remuneration Committee and the Board are satisfied that the advice provided by EY during 2020 was free from undue influence. The cost of advice and assistance provided by EY in 2020 was $65,000 (in 2019 this was $18,000).
During 2020, management requested reports on market practice from PricewaterhouseCoopers, Willis Towers Watson and other sources. No recommendations in relation to the remuneration of KMP were provided as part of these engagements.
Treatment of conditional rights on a change in control of QBE
In accordance with the rules of each of QBE’s incentive plans, a change in control is defined as either a scheme of arrangement that has been approved by QBE’s shareholders or the acquisition by a bidder of at least 50% of the issued and to be issued QBE shares under an unconditional takeover offer made in accordance with the Corporations Act 2001.
Should a change in organisational control occur, the People & Remuneration Committee has discretion to determine how unvested conditional rights should be treated, having regard to factors such as the length of time elapsed in the performance period, the level of performance to date and the circumstances of the change of control.
Minimum shareholding requirement
The MSR ensures executives build their shareholding to have significant exposure to QBE’s share price. Under the MSR, a minimum of three times fixed remuneration for the Group CEO (one and a half times for other executive KMP including the Interim Group CEO) is to be maintained as long as the executive KMP remains at QBE. The value of shareholdings as at 31 December 2020 for each executive KMP is shown on pages 60 to 62. New executive KMP are required to build their shareholdings over a five-year period after becoming an executive KMP.
QB
E In
suran
ce Gro
up
A
nn
ual R
epo
rt 2020
63
Oth
er in
form
ation
6
Fin
ancial
Rep
ort
5
Perfo
rman
ce o
verv
iew
1
Op
erating an
d
finan
cial review
2
Go
vern
ance
3
Directo
rs' R
epo
rt
4

Remuneration Report continued
Margaret Murphy Group Executive, People & Change
Term as KMP in 2020Full year
Country of residenceAustralia
Total value of shareholdings against the MSR (times fixed remuneration) 2.4
Target remuneration mix
34% 23% 11% 32%
2020 STI outcome (US$000) 42.0% of target
$260STI (deferred)
$0STI (cash) measured on...25.0% Group cash ROE (achieved 0.0%)40.0% Group COR (achieved 0.0%)35.0% Strategic performance objectives (achieved 120.0%)
2020 realised remuneration 1 (US$000) $910 Total
$620 $206 $84
Inder Singh Group Chief Financial Officer
Term as KMP in 2020Full year
Country of residenceAustralia
Total value of shareholdings against the MSR (times fixed remuneration) 1.8
Target remuneration mix
32% 25% 12% 31%
2020 STI outcome (US$000) 42.0% of target
$382STI (deferred)
$0STI (cash) measured on...25.0% Group cash ROE (achieved 0.0%)40.0% Group COR (achieved 0.0%)35.0% Strategic performance objectives (achieved 120.0%)
2020 realised remuneration (US$000) $1,060 Total
$758 $293 $9
Former executive KMP
Patrick Regan (former Group Chief Executive Officer) – Patrick Regan ceased as executive KMP on 1 September 2020. His exit arrangements were communicated in an ASX release at the time of departure; in summary, a payment in lieu of a reduced notice period and statutory leave entitlements were provided, all unvested conditional rights lapsed upon cessation and he is not eligible for a 2020 STI award.
Vivek Bhatia (former Chief Executive Officer, Australia Pacific) – Vivek Bhatia ceased as executive KMP on 14 August 2020. All unvested conditional rights lapsed upon cessation and he is not eligible for a 2020 STI award.
1. EXECUTIVE KMP PERFORMANCE SNAPSHOTS
Key: Fixed remuneration STI (cash) STI (deferred) LTI face-value Value of vested rights Other
1 The fixed remuneration for Margaret Murphy was increased from A$850,000 to A$900,000 on 1 January 2020 as part of a stepped adjustment which recognised an expansion in the scope of her role in 2019 to include Change. Prior adjustments were disclosed in the 2019 Remuneration Report.
62
2. REMUNERATION GOVERNANCE
QBE has a robust remuneration governance framework overseen by the QBE Board. This ensures that the remuneration arrangements are appropriately managed and that the agreed frameworks and policies are applied across QBE.
QBE BoardHas overall responsibility for the remuneration strategy and outcomes
for executives and non-executive directors.
People & Remuneration CommitteeIs the main governing body for key people and remuneration items across the Group.
Further details on the role and scope of the People & Remuneration Committee are set out in the QBE People & Remuneration Committee charter (available from www.qbe.com/investor-relations/corporate-governance/qbe-charters-and-constitution).
External advisorsGroup CEO Divisional people and remuneration committees
Use of external advisors
Remuneration consultants provide guidance on remuneration for executives, facilitate discussion, review remuneration and at-risk reward benchmarking within industry peer groups and provide guidance on current trends in executive remuneration practices. Any advice provided by remuneration consultants is used as a guide and is not a substitute for consideration of all the issues by each non-executive director on the People & Remuneration Committee.
Australian-based firm Ernst & Young (EY) currently acts as the independent remuneration advisor to the People & Remuneration Committee. The People & Remuneration Committee and the Board are satisfied that the advice provided by EY during 2020 was free from undue influence. The cost of advice and assistance provided by EY in 2020 was $65,000 (in 2019 this was $18,000).
During 2020, management requested reports on market practice from PricewaterhouseCoopers, Willis Towers Watson and other sources. No recommendations in relation to the remuneration of KMP were provided as part of these engagements.
Treatment of conditional rights on a change in control of QBE
In accordance with the rules of each of QBE’s incentive plans, a change in control is defined as either a scheme of arrangement that has been approved by QBE’s shareholders or the acquisition by a bidder of at least 50% of the issued and to be issued QBE shares under an unconditional takeover offer made in accordance with the Corporations Act 2001.
Should a change in organisational control occur, the People & Remuneration Committee has discretion to determine how unvested conditional rights should be treated, having regard to factors such as the length of time elapsed in the performance period, the level of performance to date and the circumstances of the change of control.
Minimum shareholding requirement
The MSR ensures executives build their shareholding to have significant exposure to QBE’s share price. Under the MSR, a minimum of three times fixed remuneration for the Group CEO (one and a half times for other executive KMP including the Interim Group CEO) is to be maintained as long as the executive KMP remains at QBE. The value of shareholdings as at 31 December 2020 for each executive KMP is shown on pages 60 to 62. New executive KMP are required to build their shareholdings over a five-year period after becoming an executive KMP.
QB
E In
suran
ce Gro
up
A
nn
ual R
epo
rt 2020
63O
ther
info
rmatio
n
6
Fin
ancial
Rep
ort
5
Perfo
rman
ce o
verv
iew
1
Op
erating an
d
finan
cial review
2
Go
vern
ance
3
Directo
rs' R
epo
rt
4
Remuneration Report continued
Trading policy
Trading in QBE ordinary shares is generally permitted outside of designated closed periods. The QBE Insurance Group Securities Trading Policy states that non-executive directors and other designated employees must notify any intended share transaction to nominated people within the Group. The policy prohibits the hedging of QBE securities at all times. The purpose of this prohibition is to ensure that there is an alignment between the interests of executives and shareholders.
A copy of QBE’s trading policy for dealing in securities is available from www.qbe.com/investor-relations/corporate-governance/global-policies.
Dilution limits for share plans
Shares awarded under QBE’s employee share plans may be purchased on-market or issued subject to Board discretion and the requirements of the Corporations Act 2001 and the ASX Listing Rules. At 31 December 2020, the proportion of shares and unvested conditional rights and options held in the QBE Employee Share Plan is 1.17%. This is significantly less than the maximum of 10% over a 10-year period allowed under the plan rules.
Managing risk
The continued focus and investment in managing our risk provide for a stronger and resilient QBE.
Executive KMP are required to adhere to a range of Group-wide policies to ensure risks are well managed, strong governance structures are in place and high ethical standards are maintained. The Group Board approves a comprehensive delegated authority for the Group CEO, which is an integral part of QBE’s risk management process.
The People & Remuneration Committee works with Group Risk and Human Resources to ensure that any risk associated with remuneration arrangements is managed within the Group’s risk management framework. The Chair of the People & Remuneration Committee is a member of the Risk & Capital Committee and vice versa.
The remuneration governance framework incorporates risk oversight policies, so that executives cannot unduly influence a decision that could materially impact their own incentive outcome. The attendance of the full Board at the People & Remuneration Committee meetings and close working relationship with the Risk & Capital Committee strengthen remuneration governance across QBE.
The performance-based components of remuneration established in QBE’s incentive plans are designed to encourage behaviour that supports the Group’s long-term financial soundness.
Specifically, the QBE incentive plans:• recognise adherence to QBE’s risk management processes and support the QBE risk culture in a robust and globally consistent
manner through a minimum set of corporate standards that apply to all employees across the performance year;• balance both short and long-term performance through STI and LTI based on performance against a range of financial metrics
that measure progress against longer-term strategy;• incorporate individual objectives through the STI that measure demonstrable proactive sound risk management, including the
setting of a clear and consistent tone about the importance of managing risk throughout the organisation; • set financial targets in the context of business plans that have been appropriately stress-tested by the Group CRO;• defer a significant portion of the STI award in equity (which vests over an extended timeframe);• have plan rules which provide the Board with discretion to take other factors into account when determining the appropriate
award outcome;• include a malus provision (see below);• enable the build-up of meaningful shareholding through STI deferred equity and LTI underpinned by a MSR for executive KMP
(refer to page 63); and• result in a target remuneration mix that is appropriately balanced between fixed/variable remuneration and short and long-term.
The Group CRO attends the People & Remuneration Committee periodically to report on executive risk behaviours.
As part of the year end process, an individual assessment of risk for senior executives has been completed using input from the CRO. Across the Group in 2020, over 100 assessments were carried out including for executive KMP and divisional executive teams.
This process recognises positive and negative risk culture and risk management through upward or downward adjustment of performance ranges, incentive payouts and consequences that can include executives leaving the organisation. Based on the assessments in 2020, there were adjustments applied both upwards and downwards.
2. REMUNERATION GOVERNANCE
64
Malus provision
The malus provision gives the People & Remuneration Committee discretion to reduce the amount of an unvested award (including to zero) in certain circumstances during the retention period including in the case of:• serious misconduct; or• circumstances that materially undermine the reputation or performance of QBE,and on the basis that, in each case, the conduct or circumstances were not foreseen at the time of granting the award.
This provision reflects QBE’s obligations under APRA’s Prudential Standard CPS 510 Governance to incorporate terms allowing for the adjustment of incentive awards to protect QBE’s financial soundness and ability to respond to unforeseen significant issues. A review against the malus provision was completed as part of the year end process. There was no requirement to apply the provision in 2020.
In response to the release of the revised draft of the APRA Prudential Standard CPS 511 Remuneration in late 2020, an update to the malus provision will be introduced for the 2021 performance year. This update will be in addition to the introduction of clawback provisions across the Group and will be in advance of the formal requirement to implement.
QB
E In
suran
ce Gro
up
A
nn
ual R
epo
rt 2020
65
Oth
er in
form
ation
6
Fin
ancial
Rep
ort
5
Perfo
rman
ce o
verv
iew
1
Op
erating an
d
finan
cial review
2
Go
vern
ance
3
Directo
rs' R
epo
rt
4
Remuneration Report continued
Trading policy
Trading in QBE ordinary shares is generally permitted outside of designated closed periods. The QBE Insurance Group Securities Trading Policy states that non-executive directors and other designated employees must notify any intended share transaction to nominated people within the Group. The policy prohibits the hedging of QBE securities at all times. The purpose of this prohibition is to ensure that there is an alignment between the interests of executives and shareholders.
A copy of QBE’s trading policy for dealing in securities is available from www.qbe.com/investor-relations/corporate-governance/global-policies.
Dilution limits for share plans
Shares awarded under QBE’s employee share plans may be purchased on-market or issued subject to Board discretion and the requirements of the Corporations Act 2001 and the ASX Listing Rules. At 31 December 2020, the proportion of shares and unvested conditional rights and options held in the QBE Employee Share Plan is 1.17%. This is significantly less than the maximum of 10% over a 10-year period allowed under the plan rules.
Managing risk
The continued focus and investment in managing our risk provide for a stronger and resilient QBE.
Executive KMP are required to adhere to a range of Group-wide policies to ensure risks are well managed, strong governance structures are in place and high ethical standards are maintained. The Group Board approves a comprehensive delegated authority for the Group CEO, which is an integral part of QBE’s risk management process.
The People & Remuneration Committee works with Group Risk and Human Resources to ensure that any risk associated with remuneration arrangements is managed within the Group’s risk management framework. The Chair of the People & Remuneration Committee is a member of the Risk & Capital Committee and vice versa.
The remuneration governance framework incorporates risk oversight policies, so that executives cannot unduly influence a decision that could materially impact their own incentive outcome. The attendance of the full Board at the People & Remuneration Committee meetings and close working relationship with the Risk & Capital Committee strengthen remuneration governance across QBE.
The performance-based components of remuneration established in QBE’s incentive plans are designed to encourage behaviour that supports the Group’s long-term financial soundness.
Specifically, the QBE incentive plans:• recognise adherence to QBE’s risk management processes and support the QBE risk culture in a robust and globally consistent
manner through a minimum set of corporate standards that apply to all employees across the performance year;• balance both short and long-term performance through STI and LTI based on performance against a range of financial metrics
that measure progress against longer-term strategy;• incorporate individual objectives through the STI that measure demonstrable proactive sound risk management, including the
setting of a clear and consistent tone about the importance of managing risk throughout the organisation; • set financial targets in the context of business plans that have been appropriately stress-tested by the Group CRO;• defer a significant portion of the STI award in equity (which vests over an extended timeframe);• have plan rules which provide the Board with discretion to take other factors into account when determining the appropriate
award outcome;• include a malus provision (see below);• enable the build-up of meaningful shareholding through STI deferred equity and LTI underpinned by a MSR for executive KMP
(refer to page 63); and• result in a target remuneration mix that is appropriately balanced between fixed/variable remuneration and short and long-term.
The Group CRO attends the People & Remuneration Committee periodically to report on executive risk behaviours.
As part of the year end process, an individual assessment of risk for senior executives has been completed using input from the CRO. Across the Group in 2020, over 100 assessments were carried out including for executive KMP and divisional executive teams.
This process recognises positive and negative risk culture and risk management through upward or downward adjustment of performance ranges, incentive payouts and consequences that can include executives leaving the organisation. Based on the assessments in 2020, there were adjustments applied both upwards and downwards.
2. REMUNERATION GOVERNANCE
64
Malus provision
The malus provision gives the People & Remuneration Committee discretion to reduce the amount of an unvested award (including to zero) in certain circumstances during the retention period including in the case of:• serious misconduct; or• circumstances that materially undermine the reputation or performance of QBE,and on the basis that, in each case, the conduct or circumstances were not foreseen at the time of granting the award.
This provision reflects QBE’s obligations under APRA’s Prudential Standard CPS 510 Governance to incorporate terms allowing for the adjustment of incentive awards to protect QBE’s financial soundness and ability to respond to unforeseen significant issues. A review against the malus provision was completed as part of the year end process. There was no requirement to apply the provision in 2020.
In response to the release of the revised draft of the APRA Prudential Standard CPS 511 Remuneration in late 2020, an update to the malus provision will be introduced for the 2021 performance year. This update will be in addition to the introduction of clawback provisions across the Group and will be in advance of the formal requirement to implement.
QB
E In
suran
ce Gro
up
A
nn
ual R
epo
rt 2020
65O
ther
info
rmatio
n
6
Fin
ancial
Rep
ort
5
Perfo
rman
ce o
verv
iew
1
Op
erating an
d
finan
cial review
2
Go
vern
ance
3
Directo
rs' R
epo
rt
4
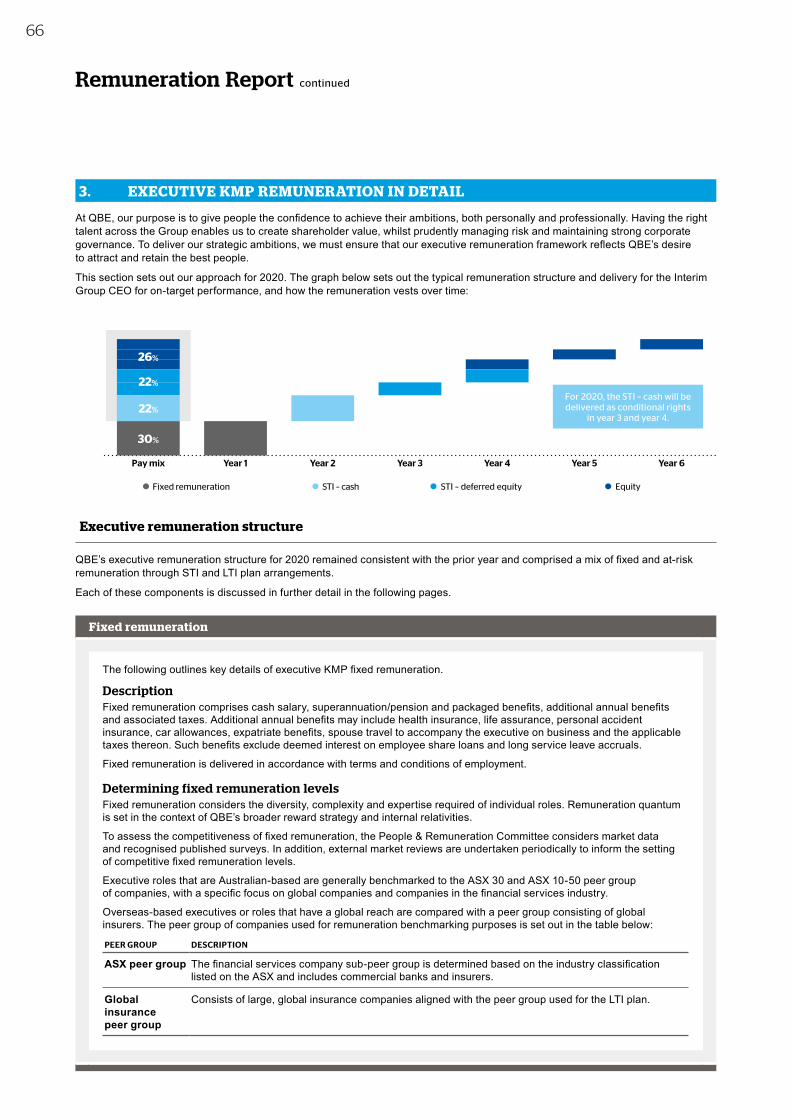
Remuneration Report continued
3. EXECUTIVE KMP REMUNERATION IN DETAIL
At QBE, our purpose is to give people the confidence to achieve their ambitions, both personally and professionally. Having the right talent across the Group enables us to create shareholder value, whilst prudently managing risk and maintaining strong corporate governance. To deliver our strategic ambitions, we must ensure that our executive remuneration framework reflects QBE’s desire to attract and retain the best people.
This section sets out our approach for 2020. The graph below sets out the typical remuneration structure and delivery for the Interim Group CEO for on-target performance, and how the remuneration vests over time:
Year 6Year 5Year 4Year 3Year 2Year 1Pay mix
26%
22%
22%
30%
STI – cash Equity Fixed remuneration STI – deferred equity
Executive remuneration structure
QBE’s executive remuneration structure for 2020 remained consistent with the prior year and comprised a mix of fixed and at-risk remuneration through STI and LTI plan arrangements.
Each of these components is discussed in further detail in the following pages.
Fixed remuneration
The following outlines key details of executive KMP fixed remuneration.
DescriptionFixed remuneration comprises cash salary, superannuation/pension and packaged benefits, additional annual benefits and associated taxes. Additional annual benefits may include health insurance, life assurance, personal accident insurance, car allowances, expatriate benefits, spouse travel to accompany the executive on business and the applicable taxes thereon. Such benefits exclude deemed interest on employee share loans and long service leave accruals.
Fixed remuneration is delivered in accordance with terms and conditions of employment.
Determining fixed remuneration levelsFixed remuneration considers the diversity, complexity and expertise required of individual roles. Remuneration quantum is set in the context of QBE’s broader reward strategy and internal relativities.
To assess the competitiveness of fixed remuneration, the People & Remuneration Committee considers market data and recognised published surveys. In addition, external market reviews are undertaken periodically to inform the setting of competitive fixed remuneration levels.
Executive roles that are Australian-based are generally benchmarked to the ASX 30 and ASX 10-50 peer group of companies, with a specific focus on global companies and companies in the financial services industry.
Overseas-based executives or roles that have a global reach are compared with a peer group consisting of global insurers. The peer group of companies used for remuneration benchmarking purposes is set out in the table below:
PEER GROUP DESCRIPTION
ASX peer group The financial services company sub-peer group is determined based on the industry classification listed on the ASX and includes commercial banks and insurers.
Global insurance peer group
Consists of large, global insurance companies aligned with the peer group used for the LTI plan.
For 2020, the STI – cash will be delivered as conditional rights
in year 3 and year 4.
66
STI
The following outlines the key details of the STI plan.
DescriptionThe STI is a performance-based incentive delivered in the form of an annual cash payment and deferred award in the form of conditional rights to QBE shares. Performance is measured over a 12-month period.
Performance measures and rationaleSTI outcomes are based on performance against Group cash ROE and COR and divisional COR targets in the case of divisional executives, as well as individual strategic performance objectives reflecting QBE's strategic priorities as they apply to each executive's role. An explanation of the financial measures and their rationale is provided below:GROUP CASH ROE COR
Definition: A measure of how effectively we are managing shareholders’ investment in QBE. For the STI, this measure will generally be measured on the same basis as that used to determine shareholder dividends. As a principle, losses due to unbudgeted amortisation/impairment of intangibles will, other than in exceptional circumstances, be included in cash ROE so that executives remain accountable for the management of intangible assets.
Definition: Net claims, commissions and expenses as a percentage of net earned premium. Consistent with how we report COR to the market, this is measured excluding the impact of changes in risk-free rates used to discount net outstanding claims.
Rationale: Cash ROE is a measure of how effectively we manage shareholder funds.
Rationale: COR is the most relevant measure of the profitability of our insurance operations. The measure excludes risk-free rates because it is the basis on which we report and the market assesses the performance of QBE.
Adjustments: Any other items (such as material acquisitions or divestments) not included in the business plan and deemed appropriate by the People & Remuneration Committee.
Strategic performance objectives: The strategic performance objectives are linked to our longer-term strategic priorities. Executive KMP performance against the strategic performance objectives is evaluated annually by the Group CEO, and by the Chair in respect of the Group CEO, through formal business review assessments which include management of risk.
A summary of the achievements against the strategic performance objectives for 2020 is provided on pages 58 to 59.
Vesting scheduleThe indicative STI vesting schedule is outlined below: THRESHOLD TARGET SUPERIOR
% of STI opportunity achieved 30% 100% 150%
The STI rules provide suitable discretion to the People & Remuneration Committee to adjust any formulaic outcome to ensure STI awards appropriately reflect performance.
Instrument and deferral mechanics67% of any STI award is delivered in cash (50% in the case of the Interim Group CEO) and 33% of any STI award is deferred as conditional rights to QBE shares (50% in the case of the Interim Group CEO). For 2020, the Board exercised its discretion to deliver the entire award as conditional rights.Deferred STI vests in two equal tranches – half on the first anniversary of the award and the remainder on the second anniversary of the award. Vesting is subject to service conditions and malus provisions during the deferral period. To calculate the number of conditional rights to be granted, the award value is divided by the volume weighted average sale price of QBE shares over the five trading days prior to the grant date. Notional dividends accrue during the deferral period.
Leaver provisionsOn voluntary termination, dismissal or termination due to poor performance, all awards are forfeited.‘Good leaver’ provisions (e.g. retirement, redundancy, ill health, injury, mutually agreed separation (in some cases)) will apply such that:• STI opportunity is reduced to a pro-rata amount to reflect the proportion of the performance year in service; and• deferred awards remain in the plan subject to the original vesting conditions.
Malus provisionsSTI deferral is subject to malus, enabling awards to be either forfeited or reduced at the discretion of the People & Remuneration Committee.
STI awards made for the 2020 performance year are detailed on pages 60 to 62.
QB
E In
suran
ce Gro
up
A
nn
ual R
epo
rt 2020
67
Oth
er in
form
ation
6
Fin
ancial
Rep
ort
5
Perfo
rman
ce o
verv
iew
1
Op
erating an
d
finan
cial review
2
Go
vern
ance
3
Directo
rs' R
epo
rt
4

Remuneration Report continued
3. EXECUTIVE KMP REMUNERATION IN DETAIL
At QBE, our purpose is to give people the confidence to achieve their ambitions, both personally and professionally. Having the right talent across the Group enables us to create shareholder value, whilst prudently managing risk and maintaining strong corporate governance. To deliver our strategic ambitions, we must ensure that our executive remuneration framework reflects QBE’s desire to attract and retain the best people.
This section sets out our approach for 2020. The graph below sets out the typical remuneration structure and delivery for the Interim Group CEO for on-target performance, and how the remuneration vests over time:
Year 6Year 5Year 4Year 3Year 2Year 1Pay mix
26%
22%
22%
30%
STI – cash Equity Fixed remuneration STI – deferred equity
Executive remuneration structure
QBE’s executive remuneration structure for 2020 remained consistent with the prior year and comprised a mix of fixed and at-risk remuneration through STI and LTI plan arrangements.
Each of these components is discussed in further detail in the following pages.
Fixed remuneration
The following outlines key details of executive KMP fixed remuneration.
DescriptionFixed remuneration comprises cash salary, superannuation/pension and packaged benefits, additional annual benefits and associated taxes. Additional annual benefits may include health insurance, life assurance, personal accident insurance, car allowances, expatriate benefits, spouse travel to accompany the executive on business and the applicable taxes thereon. Such benefits exclude deemed interest on employee share loans and long service leave accruals.
Fixed remuneration is delivered in accordance with terms and conditions of employment.
Determining fixed remuneration levelsFixed remuneration considers the diversity, complexity and expertise required of individual roles. Remuneration quantum is set in the context of QBE’s broader reward strategy and internal relativities.
To assess the competitiveness of fixed remuneration, the People & Remuneration Committee considers market data and recognised published surveys. In addition, external market reviews are undertaken periodically to inform the setting of competitive fixed remuneration levels.
Executive roles that are Australian-based are generally benchmarked to the ASX 30 and ASX 10-50 peer group of companies, with a specific focus on global companies and companies in the financial services industry.
Overseas-based executives or roles that have a global reach are compared with a peer group consisting of global insurers. The peer group of companies used for remuneration benchmarking purposes is set out in the table below:
PEER GROUP DESCRIPTION
ASX peer group The financial services company sub-peer group is determined based on the industry classification listed on the ASX and includes commercial banks and insurers.
Global insurance peer group
Consists of large, global insurance companies aligned with the peer group used for the LTI plan.
For 2020, the STI – cash will be delivered as conditional rights
in year 3 and year 4.
66
STI
The following outlines the key details of the STI plan.
DescriptionThe STI is a performance-based incentive delivered in the form of an annual cash payment and deferred award in the form of conditional rights to QBE shares. Performance is measured over a 12-month period.
Performance measures and rationaleSTI outcomes are based on performance against Group cash ROE and COR and divisional COR targets in the case of divisional executives, as well as individual strategic performance objectives reflecting QBE's strategic priorities as they apply to each executive's role. An explanation of the financial measures and their rationale is provided below:GROUP CASH ROE COR
Definition: A measure of how effectively we are managing shareholders’ investment in QBE. For the STI, this measure will generally be measured on the same basis as that used to determine shareholder dividends. As a principle, losses due to unbudgeted amortisation/impairment of intangibles will, other than in exceptional circumstances, be included in cash ROE so that executives remain accountable for the management of intangible assets.
Definition: Net claims, commissions and expenses as a percentage of net earned premium. Consistent with how we report COR to the market, this is measured excluding the impact of changes in risk-free rates used to discount net outstanding claims.
Rationale: Cash ROE is a measure of how effectively we manage shareholder funds.
Rationale: COR is the most relevant measure of the profitability of our insurance operations. The measure excludes risk-free rates because it is the basis on which we report and the market assesses the performance of QBE.
Adjustments: Any other items (such as material acquisitions or divestments) not included in the business plan and deemed appropriate by the People & Remuneration Committee.
Strategic performance objectives: The strategic performance objectives are linked to our longer-term strategic priorities. Executive KMP performance against the strategic performance objectives is evaluated annually by the Group CEO, and by the Chair in respect of the Group CEO, through formal business review assessments which include management of risk.
A summary of the achievements against the strategic performance objectives for 2020 is provided on pages 58 to 59.
Vesting scheduleThe indicative STI vesting schedule is outlined below: THRESHOLD TARGET SUPERIOR
% of STI opportunity achieved 30% 100% 150%
The STI rules provide suitable discretion to the People & Remuneration Committee to adjust any formulaic outcome to ensure STI awards appropriately reflect performance.
Instrument and deferral mechanics67% of any STI award is delivered in cash (50% in the case of the Interim Group CEO) and 33% of any STI award is deferred as conditional rights to QBE shares (50% in the case of the Interim Group CEO). For 2020, the Board exercised its discretion to deliver the entire award as conditional rights.Deferred STI vests in two equal tranches – half on the first anniversary of the award and the remainder on the second anniversary of the award. Vesting is subject to service conditions and malus provisions during the deferral period. To calculate the number of conditional rights to be granted, the award value is divided by the volume weighted average sale price of QBE shares over the five trading days prior to the grant date. Notional dividends accrue during the deferral period.
Leaver provisionsOn voluntary termination, dismissal or termination due to poor performance, all awards are forfeited.‘Good leaver’ provisions (e.g. retirement, redundancy, ill health, injury, mutually agreed separation (in some cases)) will apply such that:• STI opportunity is reduced to a pro-rata amount to reflect the proportion of the performance year in service; and• deferred awards remain in the plan subject to the original vesting conditions.
Malus provisionsSTI deferral is subject to malus, enabling awards to be either forfeited or reduced at the discretion of the People & Remuneration Committee.
STI awards made for the 2020 performance year are detailed on pages 60 to 62.
QB
E In
suran
ce Gro
up
A
nn
ual R
epo
rt 2020
67O
ther
info
rmatio
n
6
Fin
ancial
Rep
ort
5
Perfo
rman
ce o
verv
iew
1
Op
erating an
d
finan
cial review
2
Go
vern
ance
3
Directo
rs' R
epo
rt
4

Remuneration Report continued
LTI
The following outlines the key details of the LTI plan.
DescriptionThe LTI plan consists of an award of conditional rights to QBE shares. Conditional rights are awarded at no cost to the executive KMP.
Performance measuresVesting is subject to two equally weighted performance conditions measured over a three-year performance period:AVERAGE CASH ROE RELATIVE TSR
Definition: The arithmetic average of the three annual cash ROEs for the three-year performance period. To reduce the impact of extreme catastrophe events or equally very benign periods, we have a catastrophe adjustment which effectively provides a ceiling and floor on catastrophe claims when determining LTI outcomes. See below.
Definition: TSR is the change in percentage value of an entity’s share price plus the value of reinvested dividends and any capital returns measured over the three-year performance period. TSR of QBE is measured against two independent peer groups:1. ASX 50 peer group (for 50% of the TSR component); and2. global insurance peer group (for 50% of the TSR component).
Rationale: Cash ROE is the primary financial measure of success for QBE and is most tangible for long-term decision-making.
Rationale: The use of two independent peer groups (shown below) provides strong alignment to our shareholder base.
Adjustments: Managing catastrophe risk is a core part of our business, with natural flow through consequences for STI awards across the organisation; however, because the LTI performance period extends over three years, extreme or benign catastrophe periods can have a material effect across multiple LTI awards. A levelling mechanism, which effectively puts a ceiling and a floor on aggregate catastrophe claims when determining LTI outcomes, was built into the plan in 2019. This levelling mechanism uses a range of +/- 1.5% of net earned premium either side of the budgeted catastrophe allowance for which LTI participants are exposed to catastrophe risk.
For 2020, the range of $375 million to $725 million is applied. This means where actual aggregate catastrophe claims (after allowing for reinsurance recoveries) exceed $725 million, aggregate catastrophe claims are capped at this amount for calculating cash ROE. Conversely, in a very benign period, the lower limit of the collar ($375 million) provides a floor on aggregate catastrophe claims for calculating cash ROE. The cost of catastrophe claims for 2020 was $163 million (after tax) in excess of the range and consequently an adjusted cash ROE of (14.2)% will be used for the 2020 performance period.
Any other items (such as material acquisitions or divestments) not included in the business plan and deemed appropriate by the People & Remuneration Committee may be adjusted.
TSR peer group 1 – ASX 50 peer group (excludes any organisations domiciled overseas)
AGL Energy Limited Computershare Limited Newcrest Mining Limited Suncorp Group LimitedAPA Group CSL Limited Orica Limited Sydney AirportAristocrat Leisure Limited Dexus Origin Energy Limited Tabcorp Holdings LimitedASX Limited Fortescue Metals Group Ltd Qantas Airways Limited Telstra Corporation LimitedAurizon Holdings Limited Goodman Group QBE Insurance Group Limited Transurban GroupAustralia and New Zealand Banking Group Limited
GPT Group Ramsay Health Care Limited Treasury Wine Estates Limited
BHP Group Limited Insurance Australia Group Limited REA Group Ltd Vicinity CentresBrambles Limited Lendlease Group Rio Tinto Limited Wesfarmers LimitedAmpol Limited (formerly trading as Caltex Australia Limited)
Macquarie Group Limited Santos Limited Westpac Banking Corporation
CIMIC Group Limited Magellan Financial Group Limited Scentre Group Woodside Petroleum LtdCochlear Limited Medibank Private Limited Sonic Healthcare Limited Woolworths Group LimitedColes Group Limited Mirvac Group South32 LimitedCommonwealth Bank of Australia National Australia Bank Limited Stockland
TSR peer group 2 – Global insurance peer group
Allianz SE Beazley PLC Insurance Australia Group Limited Hartford Financial Services Group, Inc.
American International Group Chubb Ltd QBE Insurance Group Limited The Travelers Companies, Inc.Aviva plc CNA Financial Corp RSA Insurance Group plc Zurich Insurance Group AGAXA SA Hiscox Ltd Suncorp Group Limited
3. EXECUTIVE KMP REMUNERATION IN DETAIL
68
LTI allocationTo calculate the number of conditional rights to be granted, the award value is divided by the volume weighted average price of QBE shares over the five trading days prior to the grant date.
Vesting schedulesThe indicative Group average cash ROE vesting schedule for 2020 awards is outlined below:
QBE'S AVERAGE GROUP ROE PERFORMANCE% OF LTI CONDITIONAL RIGHTS SUBJECT TO THE GROUP CASH ROE COMPONENT WHICH MAY VEST
Below 8.0% 0%At 8.0% 30%Between 8.0% and 12.0% Straight line vesting between 30% and 100%At or above 12.0% 100%
The indicative relative TSR vesting schedule for 2020 awards is outlined below:
QBE'S TSR PERFORMANCE RELATIVE TO THE PEER GROUPS% OF LTI CONDITIONAL RIGHTS SUBJECT TO THE TSR COMPONENT WHICH MAY VEST
Less than 50th percentile 0%At the 50th percentile 50%Between 50th and 75th percentile 50% plus 2% for each percentile above the 50th percentile75th percentile or greater 100%
The LTI rules provide suitable discretion to the People & Remuneration Committee to adjust any formulaic outcome to ensure LTI awards appropriately reflect performance.
Vesting periodsFollowing assessment of performance measures at the end of the three-year performance period, conditional rights will vest in three tranches as set out in the table below, subject to service conditions and malus provisions:
TRANCHE VESTING DATE PERFORMANCE PERIODPROPORTION OF ELIGIBLE 2020 LTI CONDITIONAL RIGHTS TO VEST
1 23 February 2023 End of the three-year performance period 33%2 23 February 2024 First anniversary of the end of the performance period 33%3 23 February 2025 Second anniversary of the end of the performance period 34%
Notional dividends accrue during the vesting period.
Leaver provisions‘Good leaver’ provisions (e.g. retirement, redundancy, ill health, injury, mutually agreed separation (in some cases)) will apply such that a pro-rata amount (applied over the three-year performance period) of LTI conditional rights remain subject to the original performance and vesting conditions.
Malus provisionsLTI is subject to malus provisions, enabling awards to be either forfeited or reduced at the discretion of the People & Remuneration Committee.
Special LTI awardsThe LTI award made to Richard Pryce in early 2020 includes performance criteria that align to specific deliverables as he transitions to retirement. Aside from tailored performance criteria, the terms and conditions of the LTI award to Mr Pryce are consistent with those of other executive KMP.
A further tailored LTI award was made to Mr Pryce in October 2020 at the time of his appointment as Interim Group CEO. The amount of the grant was GBP1,100,000 with the effective date of the grant being the date of appointment, 26 October 2020. Vesting is subject to two performance conditions measured by the Board over the
period as Interim Group CEO. The performance measures for the grant have been set with a focus on the delivery of a number of important priorities. These include a blend of individual and strategic measures to both reward for the stability provided as Interim Group CEO through 2021, setting QBE up for future success and the creation of alignment with shareholder interests: • individual component (40%) – the Board will apply its
discretion to determine outcomes against this component having considered achievement of agreed deliverables relating to executive team transition and development, building talent succession and depth, and effective engagement with regulators and shareholders; and
• strategic component (60%) – this component will be measured against the delivery of a number of objectives including Customer@QBE, reinsurance strategy, IT modernisation strategy and cultural change.
Subject to performance against the above, consideration of appropriate financial outcomes, risk behaviours during the vesting period and malus provisions, the conditional rights will vest in three tranches in March 2024 (33%), 2025 (33%) and 2026 (34%).
For further details of all LTI awards made in 2020, refer to pages 72 to 73. The 2020 LTI award for the former Group CEO was approved by shareholders at the 2020 Annual General Meeting (AGM).
QB
E In
suran
ce Gro
up
A
nn
ual R
epo
rt 2020
69
Oth
er in
form
ation
6
Fin
ancial
Rep
ort
5
Perfo
rman
ce o
verv
iew
1
Op
erating an
d
finan
cial review
2
Go
vern
ance
3
Directo
rs' R
epo
rt
4

Remuneration Report continued
LTI
The following outlines the key details of the LTI plan.
DescriptionThe LTI plan consists of an award of conditional rights to QBE shares. Conditional rights are awarded at no cost to the executive KMP.
Performance measuresVesting is subject to two equally weighted performance conditions measured over a three-year performance period:AVERAGE CASH ROE RELATIVE TSR
Definition: The arithmetic average of the three annual cash ROEs for the three-year performance period. To reduce the impact of extreme catastrophe events or equally very benign periods, we have a catastrophe adjustment which effectively provides a ceiling and floor on catastrophe claims when determining LTI outcomes. See below.
Definition: TSR is the change in percentage value of an entity’s share price plus the value of reinvested dividends and any capital returns measured over the three-year performance period. TSR of QBE is measured against two independent peer groups:1. ASX 50 peer group (for 50% of the TSR component); and2. global insurance peer group (for 50% of the TSR component).
Rationale: Cash ROE is the primary financial measure of success for QBE and is most tangible for long-term decision-making.
Rationale: The use of two independent peer groups (shown below) provides strong alignment to our shareholder base.
Adjustments: Managing catastrophe risk is a core part of our business, with natural flow through consequences for STI awards across the organisation; however, because the LTI performance period extends over three years, extreme or benign catastrophe periods can have a material effect across multiple LTI awards. A levelling mechanism, which effectively puts a ceiling and a floor on aggregate catastrophe claims when determining LTI outcomes, was built into the plan in 2019. This levelling mechanism uses a range of +/- 1.5% of net earned premium either side of the budgeted catastrophe allowance for which LTI participants are exposed to catastrophe risk.
For 2020, the range of $375 million to $725 million is applied. This means where actual aggregate catastrophe claims (after allowing for reinsurance recoveries) exceed $725 million, aggregate catastrophe claims are capped at this amount for calculating cash ROE. Conversely, in a very benign period, the lower limit of the collar ($375 million) provides a floor on aggregate catastrophe claims for calculating cash ROE. The cost of catastrophe claims for 2020 was $163 million (after tax) in excess of the range and consequently an adjusted cash ROE of (14.2)% will be used for the 2020 performance period.
Any other items (such as material acquisitions or divestments) not included in the business plan and deemed appropriate by the People & Remuneration Committee may be adjusted.
TSR peer group 1 – ASX 50 peer group (excludes any organisations domiciled overseas)
AGL Energy Limited Computershare Limited Newcrest Mining Limited Suncorp Group LimitedAPA Group CSL Limited Orica Limited Sydney AirportAristocrat Leisure Limited Dexus Origin Energy Limited Tabcorp Holdings LimitedASX Limited Fortescue Metals Group Ltd Qantas Airways Limited Telstra Corporation LimitedAurizon Holdings Limited Goodman Group QBE Insurance Group Limited Transurban GroupAustralia and New Zealand Banking Group Limited
GPT Group Ramsay Health Care Limited Treasury Wine Estates Limited
BHP Group Limited Insurance Australia Group Limited REA Group Ltd Vicinity CentresBrambles Limited Lendlease Group Rio Tinto Limited Wesfarmers LimitedAmpol Limited (formerly trading as Caltex Australia Limited)
Macquarie Group Limited Santos Limited Westpac Banking Corporation
CIMIC Group Limited Magellan Financial Group Limited Scentre Group Woodside Petroleum LtdCochlear Limited Medibank Private Limited Sonic Healthcare Limited Woolworths Group LimitedColes Group Limited Mirvac Group South32 LimitedCommonwealth Bank of Australia National Australia Bank Limited Stockland
TSR peer group 2 – Global insurance peer group
Allianz SE Beazley PLC Insurance Australia Group Limited Hartford Financial Services Group, Inc.
American International Group Chubb Ltd QBE Insurance Group Limited The Travelers Companies, Inc.Aviva plc CNA Financial Corp RSA Insurance Group plc Zurich Insurance Group AGAXA SA Hiscox Ltd Suncorp Group Limited
3. EXECUTIVE KMP REMUNERATION IN DETAIL
68
LTI allocationTo calculate the number of conditional rights to be granted, the award value is divided by the volume weighted average price of QBE shares over the five trading days prior to the grant date.
Vesting schedulesThe indicative Group average cash ROE vesting schedule for 2020 awards is outlined below:
QBE'S AVERAGE GROUP ROE PERFORMANCE% OF LTI CONDITIONAL RIGHTS SUBJECT TO THE GROUP CASH ROE COMPONENT WHICH MAY VEST
Below 8.0% 0%At 8.0% 30%Between 8.0% and 12.0% Straight line vesting between 30% and 100%At or above 12.0% 100%
The indicative relative TSR vesting schedule for 2020 awards is outlined below:
QBE'S TSR PERFORMANCE RELATIVE TO THE PEER GROUPS% OF LTI CONDITIONAL RIGHTS SUBJECT TO THE TSR COMPONENT WHICH MAY VEST
Less than 50th percentile 0%At the 50th percentile 50%Between 50th and 75th percentile 50% plus 2% for each percentile above the 50th percentile75th percentile or greater 100%
The LTI rules provide suitable discretion to the People & Remuneration Committee to adjust any formulaic outcome to ensure LTI awards appropriately reflect performance.
Vesting periodsFollowing assessment of performance measures at the end of the three-year performance period, conditional rights will vest in three tranches as set out in the table below, subject to service conditions and malus provisions:
TRANCHE VESTING DATE PERFORMANCE PERIODPROPORTION OF ELIGIBLE 2020 LTI CONDITIONAL RIGHTS TO VEST
1 23 February 2023 End of the three-year performance period 33%2 23 February 2024 First anniversary of the end of the performance period 33%3 23 February 2025 Second anniversary of the end of the performance period 34%
Notional dividends accrue during the vesting period.
Leaver provisions‘Good leaver’ provisions (e.g. retirement, redundancy, ill health, injury, mutually agreed separation (in some cases)) will apply such that a pro-rata amount (applied over the three-year performance period) of LTI conditional rights remain subject to the original performance and vesting conditions.
Malus provisionsLTI is subject to malus provisions, enabling awards to be either forfeited or reduced at the discretion of the People & Remuneration Committee.
Special LTI awardsThe LTI award made to Richard Pryce in early 2020 includes performance criteria that align to specific deliverables as he transitions to retirement. Aside from tailored performance criteria, the terms and conditions of the LTI award to Mr Pryce are consistent with those of other executive KMP.
A further tailored LTI award was made to Mr Pryce in October 2020 at the time of his appointment as Interim Group CEO. The amount of the grant was GBP1,100,000 with the effective date of the grant being the date of appointment, 26 October 2020. Vesting is subject to two performance conditions measured by the Board over the
period as Interim Group CEO. The performance measures for the grant have been set with a focus on the delivery of a number of important priorities. These include a blend of individual and strategic measures to both reward for the stability provided as Interim Group CEO through 2021, setting QBE up for future success and the creation of alignment with shareholder interests: • individual component (40%) – the Board will apply its
discretion to determine outcomes against this component having considered achievement of agreed deliverables relating to executive team transition and development, building talent succession and depth, and effective engagement with regulators and shareholders; and
• strategic component (60%) – this component will be measured against the delivery of a number of objectives including Customer@QBE, reinsurance strategy, IT modernisation strategy and cultural change.
Subject to performance against the above, consideration of appropriate financial outcomes, risk behaviours during the vesting period and malus provisions, the conditional rights will vest in three tranches in March 2024 (33%), 2025 (33%) and 2026 (34%).
For further details of all LTI awards made in 2020, refer to pages 72 to 73. The 2020 LTI award for the former Group CEO was approved by shareholders at the 2020 Annual General Meeting (AGM).
QB
E In
suran
ce Gro
up
A
nn
ual R
epo
rt 2020
69O
ther
info
rmatio
n
6
Fin
ancial
Rep
ort
5
Perfo
rman
ce o
verv
iew
1
Op
erating an
d
finan
cial review
2
Go
vern
ance
3
Directo
rs' R
epo
rt
4

Remuneration Report continued
Changes to incentives for 2021
2020 was an unprecedented year and that uncertainty has factored into how we plan to adapt incentives for 2021. In response to the imminent regulatory changes through the Financial Accountability Regime and the APRA Prudential Standard CPS 511 Remuneration, the introduction of revised malus and new clawback rules will apply for the 2021 STI performance period and LTI awards granted in 2021.
In addition, in order to improve line of sight and enhance the impact of the divisional COR outcomes across the Group, the use of Group COR in the STI will be replaced with a blend of divisional COR outcomes. For example, where Group COR was utilised as a performance measure with a weighting of 40%, an equal blend of the COR outcomes for Australia Pacific (1/3), International (1/3) and North America (1/3) will be used.
For the 2021 LTI, the Group cash ROE component will use the average of the three individual annual performance ranges set over the three individual years, being 2021, 2022 and 2023 to determine vesting outcomes. This is versus setting a three-year average cash ROE target and recognises the difficulty with long range forecasting at this time due to the economic volatility. All other components of the existing LTI remain consistent with the current arrangements, that is, the use of relative TSR, the three-year performance period and vesting of any awards can occur from years three through five.
For both STI and LTI plans, the People & Remuneration Committee will continue to have the ability to apply adjustments to ensure the formulaic outcomes appropriately reflect performance.
Employment agreements
The table below summarises the material terms for the current executive KMP which are subject to applicable laws. The terms and conditions of employment of each executive KMP reflect market conditions at the time of their contract negotiation on appointment and thereafter.
CONTRACTUAL TERM GROUP CEO 1 OTHER EXECUTIVE KMP
Duration Permanent full-time employment contract until notice given by either party.
Notice period (by executive KMP or QBE)
12 months: QBE may elect to make a payment in lieu of notice.
Six months: QBE may elect to make a payment in lieu of notice.
For Todd Jones, notice required by QBE is 12 months, reducing to six months after 18 months of service.
Treatment of incentives – involuntary termination
On termination with cause or for poor performance: All unvested incentives are forfeited.
On termination without cause: For STI in the year of termination, the executive remains eligible to be considered for an award on a pro-rata basis, with any award to be determined following the end of the performance year and subject to the standard deferral arrangements. Unvested deferred Executive Incentive Plan and STI conditional rights remain in the plan subject to the original vesting dates and malus provisions. A pro-rata number of LTI conditional rights, reflecting the portion of the three-year performance period the executive KMP was in service, remain in the plan subject to the original performance and vesting conditions. Legacy LTI awards generally remain in the plan subject to the original performance and vesting conditions; however, the People & Remuneration Committee has discretion to vest these awards.
Treatment of incentives – voluntary termination All unvested incentives are forfeited.
Post-employment restraints
12 months non-compete and non-solicitation. Six months non-compete and non-solicitation.
1 The terms for the Interim Group CEO have not been aligned with the former Group CEO due to the interim nature of the role.
3. EXECUTIVE KMP REMUNERATION IN DETAIL
70
4. EXECUTIVE KMP REMUNERATION TABLES
4.1 Statutory remuneration disclosures
The following table provides details of the remuneration of QBE’s executive KMP as determined by reference to applicable Australian Accounting Standards (AASB) for the financial year ended 31 December 2020. Remuneration has been converted to US dollars using the average rate of exchange for the relevant year.
SHORT-TERM EMPLOYMENT BENEFITS
POST-EMPLOYMENT BENEFITS
OTHER LONG-TERM
EMPLOYEE BENEFITS
SHARE-BASED PAYMENTS
BASE SALARY OTHER1
STI CASH 2 SUPERANNUATION
LEAVE ACCRUALS 3
CONDITIONAL RIGHTS4
TERMINATION BENEFITS 5 TOTAL
YEAR US$000 US$000 US$000 US$000 US$000 US$000 US$000 US$000
Richard Pryce6 2020 1,089 177 – – – 2,003 – 3,2692019 1,008 173 1,051 – – 1,344 – 3,576
Jason Brown 2020 641 97 – – – 472 – 1,2102019 685 199 406 6 – 449 – 1,745
Peter Grewal7 2020 523 84 – 12 – (223) – 3962019 507 173 395 14 9 511 – 1,609
Jason Harris8 2020 60 847 – – – 39 – 9462019 – – – – – – – –
Todd Jones9 2020 1,000 106 – 23 – 2,160 – 3,2892019 246 731 156 13 – 1,165 – 2,311
Margaret Murphy 2020 605 84 – 15 15 582 – 1,3012019 553 44 327 14 6 557 – 1,501
Inder Singh 2020 743 9 – 15 23 568 – 1,3582019 750 3 496 14 3 554 – 1,820
Former executive KMPVivek Bhatia10 2020 513 19 – 11 – (586) 143 100
2019 820 14 614 14 56 777 – 2,295Patrick Regan11 2020 1,025 295 – – – (2,222) 479 (423)
2019 1,459 137 665 – 48 2,119 – 4,428Total 2020 6,199 1,718 – 76 38 2,793 622 11,446
201912 6,028 1,474 4,110 75 122 7,476 – 19,285
1 Other includes provision of motor vehicles, health insurance, spouse travel, accommodation costs, staff insurance discount benefits received during the year, life assurance and personal accident insurance and the applicable taxes thereon. It also includes the deemed value of interest-free share loans, tax accruals in respect of employment benefits and other one-off expenses. For Jason Harris, this includes a cash payment of GBP660,000 on commencement to compensate for incentives forfeited in ceasing his previous employment to join QBE, payable in March 2021.
2 No STI cash is payable for performance in 2020. The Board exercised its discretion to deliver STI for the performance year as conditional rights with vesting to occur in 2022 and 2023.
3 Includes the movement in annual leave and long service leave provisions during the year.4 The fair value at grant date of conditional rights is determined using appropriate models including Monte Carlo simulations, depending
on the vesting conditions. The fair value of each conditional right is recognised evenly over the service period ending at vesting date. Where an award will no longer vest, the related accounting charge for any non-market component is reversed in full and the reversal is included in the table above. For Jason Harris, this includes GBP300,000 of conditional rights granted as compensation for incentives forfeited on ceasing his previous employment to join QBE in addition to a pro-rata grant of conditional rights for the 2020 LTI. Details of grants of conditional rights are provided on pages 72 to 73.
5 Termination benefits includes apportioned fixed remuneration, and related benefits if applicable, paid for the balance of the notice period to the termination date, STI cash awards from the date of ceasing to be executive KMP to the date of termination, the accelerated accounting charge or reversal of equity vesting or cancellation and other termination payments.
6 Richard Pryce changed roles during the year, commencing as Interim Group CEO from 26 October 2020.7 Peter Grewal was an executive KMP through to 31 December 2020 having ceased employment with QBE. He is ineligible for 2020 STI. 8 Jason Harris was an executive KMP from 4 December 2020.9 Todd Jones was an executive KMP for part of the year during 2019.10 Vivek Bhatia was an executive KMP through to 14 August 2020 having ceased employment with QBE. In accordance with contractual
terms, termination benefits include statutory leave entitlements ($143,000).11 Patrick Regan was an executive KMP through to 1 September 2020 having ceased employment with QBE. In accordance with contractual
terms, termination benefits include a payment in lieu of a reduced notice period ($213,500) and statutory leave entitlements ($265,500).12 The 2019 totals above are not the same as those disclosed in the 2019 Remuneration Report because of changes in executive KMP.
QB
E In
suran
ce Gro
up
A
nn
ual R
epo
rt 2020
71
Oth
er in
form
ation
6
Fin
ancial
Rep
ort
5
Perfo
rman
ce o
verv
iew
1
Op
erating an
d
finan
cial review
2
Go
vern
ance
3
Directo
rs' R
epo
rt
4

Remuneration Report continued
Changes to incentives for 2021
2020 was an unprecedented year and that uncertainty has factored into how we plan to adapt incentives for 2021. In response to the imminent regulatory changes through the Financial Accountability Regime and the APRA Prudential Standard CPS 511 Remuneration, the introduction of revised malus and new clawback rules will apply for the 2021 STI performance period and LTI awards granted in 2021.
In addition, in order to improve line of sight and enhance the impact of the divisional COR outcomes across the Group, the use of Group COR in the STI will be replaced with a blend of divisional COR outcomes. For example, where Group COR was utilised as a performance measure with a weighting of 40%, an equal blend of the COR outcomes for Australia Pacific (1/3), International (1/3) and North America (1/3) will be used.
For the 2021 LTI, the Group cash ROE component will use the average of the three individual annual performance ranges set over the three individual years, being 2021, 2022 and 2023 to determine vesting outcomes. This is versus setting a three-year average cash ROE target and recognises the difficulty with long range forecasting at this time due to the economic volatility. All other components of the existing LTI remain consistent with the current arrangements, that is, the use of relative TSR, the three-year performance period and vesting of any awards can occur from years three through five.
For both STI and LTI plans, the People & Remuneration Committee will continue to have the ability to apply adjustments to ensure the formulaic outcomes appropriately reflect performance.
Employment agreements
The table below summarises the material terms for the current executive KMP which are subject to applicable laws. The terms and conditions of employment of each executive KMP reflect market conditions at the time of their contract negotiation on appointment and thereafter.
CONTRACTUAL TERM GROUP CEO 1 OTHER EXECUTIVE KMP
Duration Permanent full-time employment contract until notice given by either party.
Notice period (by executive KMP or QBE)
12 months: QBE may elect to make a payment in lieu of notice.
Six months: QBE may elect to make a payment in lieu of notice.
For Todd Jones, notice required by QBE is 12 months, reducing to six months after 18 months of service.
Treatment of incentives – involuntary termination
On termination with cause or for poor performance: All unvested incentives are forfeited.
On termination without cause: For STI in the year of termination, the executive remains eligible to be considered for an award on a pro-rata basis, with any award to be determined following the end of the performance year and subject to the standard deferral arrangements. Unvested deferred Executive Incentive Plan and STI conditional rights remain in the plan subject to the original vesting dates and malus provisions. A pro-rata number of LTI conditional rights, reflecting the portion of the three-year performance period the executive KMP was in service, remain in the plan subject to the original performance and vesting conditions. Legacy LTI awards generally remain in the plan subject to the original performance and vesting conditions; however, the People & Remuneration Committee has discretion to vest these awards.
Treatment of incentives – voluntary termination All unvested incentives are forfeited.
Post-employment restraints
12 months non-compete and non-solicitation. Six months non-compete and non-solicitation.
1 The terms for the Interim Group CEO have not been aligned with the former Group CEO due to the interim nature of the role.
3. EXECUTIVE KMP REMUNERATION IN DETAIL
70
4. EXECUTIVE KMP REMUNERATION TABLES
4.1 Statutory remuneration disclosures
The following table provides details of the remuneration of QBE’s executive KMP as determined by reference to applicable Australian Accounting Standards (AASB) for the financial year ended 31 December 2020. Remuneration has been converted to US dollars using the average rate of exchange for the relevant year.
SHORT-TERM EMPLOYMENT BENEFITS
POST-EMPLOYMENT BENEFITS
OTHER LONG-TERM
EMPLOYEE BENEFITS
SHARE-BASED PAYMENTS
BASE SALARY OTHER1
STI CASH 2 SUPERANNUATION
LEAVE ACCRUALS 3
CONDITIONAL RIGHTS4
TERMINATION BENEFITS 5 TOTAL
YEAR US$000 US$000 US$000 US$000 US$000 US$000 US$000 US$000
Richard Pryce6 2020 1,089 177 – – – 2,003 – 3,2692019 1,008 173 1,051 – – 1,344 – 3,576
Jason Brown 2020 641 97 – – – 472 – 1,2102019 685 199 406 6 – 449 – 1,745
Peter Grewal7 2020 523 84 – 12 – (223) – 3962019 507 173 395 14 9 511 – 1,609
Jason Harris8 2020 60 847 – – – 39 – 9462019 – – – – – – – –
Todd Jones9 2020 1,000 106 – 23 – 2,160 – 3,2892019 246 731 156 13 – 1,165 – 2,311
Margaret Murphy 2020 605 84 – 15 15 582 – 1,3012019 553 44 327 14 6 557 – 1,501
Inder Singh 2020 743 9 – 15 23 568 – 1,3582019 750 3 496 14 3 554 – 1,820
Former executive KMPVivek Bhatia10 2020 513 19 – 11 – (586) 143 100
2019 820 14 614 14 56 777 – 2,295Patrick Regan11 2020 1,025 295 – – – (2,222) 479 (423)
2019 1,459 137 665 – 48 2,119 – 4,428Total 2020 6,199 1,718 – 76 38 2,793 622 11,446
201912 6,028 1,474 4,110 75 122 7,476 – 19,285
1 Other includes provision of motor vehicles, health insurance, spouse travel, accommodation costs, staff insurance discount benefits received during the year, life assurance and personal accident insurance and the applicable taxes thereon. It also includes the deemed value of interest-free share loans, tax accruals in respect of employment benefits and other one-off expenses. For Jason Harris, this includes a cash payment of GBP660,000 on commencement to compensate for incentives forfeited in ceasing his previous employment to join QBE, payable in March 2021.
2 No STI cash is payable for performance in 2020. The Board exercised its discretion to deliver STI for the performance year as conditional rights with vesting to occur in 2022 and 2023.
3 Includes the movement in annual leave and long service leave provisions during the year.4 The fair value at grant date of conditional rights is determined using appropriate models including Monte Carlo simulations, depending
on the vesting conditions. The fair value of each conditional right is recognised evenly over the service period ending at vesting date. Where an award will no longer vest, the related accounting charge for any non-market component is reversed in full and the reversal is included in the table above. For Jason Harris, this includes GBP300,000 of conditional rights granted as compensation for incentives forfeited on ceasing his previous employment to join QBE in addition to a pro-rata grant of conditional rights for the 2020 LTI. Details of grants of conditional rights are provided on pages 72 to 73.
5 Termination benefits includes apportioned fixed remuneration, and related benefits if applicable, paid for the balance of the notice period to the termination date, STI cash awards from the date of ceasing to be executive KMP to the date of termination, the accelerated accounting charge or reversal of equity vesting or cancellation and other termination payments.
6 Richard Pryce changed roles during the year, commencing as Interim Group CEO from 26 October 2020.7 Peter Grewal was an executive KMP through to 31 December 2020 having ceased employment with QBE. He is ineligible for 2020 STI. 8 Jason Harris was an executive KMP from 4 December 2020.9 Todd Jones was an executive KMP for part of the year during 2019.10 Vivek Bhatia was an executive KMP through to 14 August 2020 having ceased employment with QBE. In accordance with contractual
terms, termination benefits include statutory leave entitlements ($143,000).11 Patrick Regan was an executive KMP through to 1 September 2020 having ceased employment with QBE. In accordance with contractual
terms, termination benefits include a payment in lieu of a reduced notice period ($213,500) and statutory leave entitlements ($265,500).12 The 2019 totals above are not the same as those disclosed in the 2019 Remuneration Report because of changes in executive KMP.
QB
E In
suran
ce Gro
up
A
nn
ual R
epo
rt 2020
71O
ther
info
rmatio
n
6
Fin
ancial
Rep
ort
5
Perfo
rman
ce o
verv
iew
1
Op
erating an
d
finan
cial review
2
Go
vern
ance
3
Directo
rs' R
epo
rt
4

Remuneration Report continued
4.2 Conditional rights movements
Equity awards at QBE are granted in the form of conditional rights. A conditional right is a promise by QBE to acquire or issue one fully paid ordinary QBE Insurance Group Limited share where certain conditions are met.
The table below details conditional rights provided under the terms of both current and legacy plans, details of which can be found at pages 67 to 69 and 74, and contractual arrangements. LTI conditional rights are subject to future performance hurdles as detailed on pages 68 to 69.
Conditional rights under the STI for the 2020 performance year will be granted in the first quarter of 2021.
2020
BALANCE AT 1 JANUARY
2020 NUMBER
GRANTED NUMBER1
VALUE AT GRANT DATE
US$0002
VESTED AND EXERCISED
NUMBER
VALUE AT VESTING DATE
US$000
FORFEITED / LAPSED
NUMBER 3
NOTIONAL DIVIDENDS
ATTACHING IN THE YEAR
NUMBER
BALANCE AT 31 DECEMBER
2020 NUMBER
Richard Pryce 481,298 412,259 3,279 (89,791) 814 – 20,406 824,172Jason Brown 167,493 92,705 846 (22,265) 202 – 8,439 246,372Peter Grewal 138,061 77,780 712 (51,458) 479 (170,203) 5,820 – Jason Harris – 162,533 802 – – – – 162,533Todd Jones 467,668 162,968 1,446 (158,711) 1,455 – 16,721 488,646Margaret Murphy 230,093 75,923 691 (22,597) 206 – 10,051 293,470Inder Singh 213,100 97,380 892 (32,229) 293 – 9,860 288,111Former executive KMPVivek Bhatia 262,815 109,692 1,008 (73,018) 677 (308,853) 9,364 – Patrick Regan 773,138 359,310 1,725 (111,485) 1,014 (1,052,869) 31,906 –
1 On commencement of employment, Jason Harris was granted conditional rights as compensation for incentives forfeited on ceasing his previous employment to join QBE. The awards comprise a grant of conditional rights, with vesting on 1 March 2022 subject to service conditions, and a pro-rata LTI grant subject to the performance conditions detailed on pages 68 to 69. The special LTI grants of conditional rights to Richard Pryce in 2020 have performance conditions as detailed on page 69.
2 The value at grant date is calculated in accordance with AASB 2 Share-based Payment.3 For Peter Grewal, Vivek Bhatia and Patrick Regan, this represents the conditional rights which lapsed on ceasing to be an executive
KMP from 31 December 2020, 14 August 2020 and 1 September 2020 respectively. Peter Grewal was executive KMP for the full year.
4. EXECUTIVE KMP REMUNERATION TABLES
72
4.3 Valuation of conditional rights outstanding at 31 December 2020
The table below details the conditional rights issued affecting remuneration of executives in the previous, current or future reporting periods:
2020 GRANT GRANT DATE
PERFORMANCE PERIOD START
DATEEXERCISE
DATE
CONDITIONAL RIGHTS AT
31 DECEMBER 2020
NUMBER1
MAXIMUM VALUE OF
AWARD TO VEST
FAIR VALUE PER CONDITIONAL RIGHT
A$ 2
GROUP ROE TSR TIME
Richard Pryce3 2017 EIP 5-Mar-18 1-Jan-17 2021-2022 78,275 807,015 10.31 2018 EIP 4-Mar-19 1-Jan-18 2021-2023 161,512 1,965,601 12.17 2019 Special LTI 4-Mar-19 1-Jan-19 2022-2024 165,594 2,015,279 12.17 2019 STI 24-Feb-20 1-Jan-19 2021-2022 55,142 822,167 14.91 2020 Special LTI 24-Feb-20 1-Jan-20 2023-2025 135,772 2,024,361 14.91 2021 Special LTI 26-Oct-20 26-Oct-20 2024-2026 227,877 2,014,433 8.84
Jason Brown 2017 EIP 5-Mar-18 1-Jan-17 2021-2022 14,722 151,784 10.31 2018 EIP 4-Mar-19 1-Jan-18 2021-2023 47,084 573,012 12.17 2019 LTI 4-Mar-19 1-Jan-19 2022-2024 88,573 918,947 12.17 8.58 2019 STI 24-Feb-20 1-Jan-19 2021-2022 21,316 317,822 14.91 2020 LTI 24-Feb-20 1-Jan-20 2023-2025 74,677 954,552 14.91 10.66
Peter Grewal4 2018 EIP 4-Mar-19 1-Jan-18 2021-2023 23,123 281,407 12.17 2019 LTI 4-Mar-19 1-Jan-19 2022-2024 66,546 690,433 12.17 8.58 2019 STI 24-Feb-20 1-Jan-19 2021-2022 19,437 289,806 14.91 2020 LTI 24-Feb-20 1-Jan-20 2023-2025 61,097 780,975 14.91 10.66
Jason Harris Special 1-Oct-20 1-Oct-20 1-Mar-22 61,917 538,678 8.70 2020 LTI 1-Oct-20 1-Jan-20 2023-2025 100,616 626,083 8.70 3.75
Todd Jones Special 1-Oct-19 1-Oct-19 3-Mar-21 164,335 2,070,621 12.60 2019 LTI 1-Oct-19 1-Jan-19 2022-2024 155,569 1,587,983 12.60 7.82 2019 STI 24-Feb-20 1-Jan-19 2021-2022 8,079 120,458 14.91 2020 LTI 24-Feb-20 1-Jan-20 2023-2025 160,663 2,053,673 14.91 10.66
Margaret Murphy 2017 EIP 5-Mar-18 1-Jan-17 2021-2022 13,620 140,422 10.31 Special 5-Mar-18 5-Mar-18 4-Mar-21 80,478 829,728 10.31 2018 EIP 4-Mar-19 1-Jan-18 2021-2023 49,767 605,664 12.17 2019 LTI 4-Mar-19 1-Jan-19 2022-2024 70,990 736,518 12.17 8.58 2019 STI 24-Feb-20 1-Jan-19 2021-2022 16,104 240,111 14.91 2020 LTI 24-Feb-20 1-Jan-20 2023-2025 62,511 799,045 14.91 10.66
Inder Singh 2017 EIP 5-Mar-18 1-Jan-17 2021-2022 20,888 215,355 10.31 2018 EIP 4-Mar-19 1-Jan-18 2021-2023 68,784 837,101 12.17 2019 LTI 4-Mar-19 1-Jan-19 2022-2024 97,613 1,012,722 12.17 8.58 2019 STI 24-Feb-20 1-Jan-19 2021-2022 24,429 364,236 14.91 2020 LTI 24-Feb-20 1-Jan-20 2023-2025 76,397 976,547 14.91 10.66
Former executive KMPVivek Bhatia4 2018 EIP 4-Mar-19 1-Jan-18 2021-2023 89,680 1,091,406 12.17
2019 LTI 4-Mar-19 1-Jan-19 2022-2024 106,051 1,100,285 12.17 8.58 2019 STI 24-Feb-20 1-Jan-19 2021-2022 30,109 448,925 14.91 2020 LTI 24-Feb-20 1-Jan-20 2023-2025 83,013 1,061,107 14.91 10.66
Patrick Regan4 2017 EIP 5-Mar-18 1-Jan-17 2021-2022 67,509 696,018 10.31 2018 EIP 4-Mar-19 1-Jan-18 2021-2023 243,647 3,140,610 12.89 2019 LTI 4-Mar-19 1-Jan-19 2022-2024 371,173 4,093,120 12.89 9.17 2019 STI 24-Feb-20 1-Jan-19 2021-2022 66,169 986,580 14.91 2020 LTI 24-Feb-20 1-Jan-20 2023-2025 304,371 1,597,945 7.93 2.57
1 Includes original grant of conditional rights and notional dividends. 2 The fair value of conditional rights at grant date is determined using appropriate models including Monte Carlo simulations, depending
on the vesting conditions. The fair value of each conditional right is recognised evenly over the service period ending at vesting date. For the LTI allocations, the TSR fair value shown above was averaged over the two peer groups.
3 TheSpecialLTIawardsforRichardPryceincludespecificperformancemeasuresasdetailedonpage69.4 For Peter Grewal, Vivek Bhatia and Patrick Regan, this represents the number of conditional rights at 31 December 2020, 14 August 2020
and 1 September 2020 respectively, immediately prior to ceasing to be an executive KMP. All rights were subsequently lapsed.
QB
E In
suran
ce Gro
up
A
nn
ual R
epo
rt 2020
73
Oth
er in
form
ation
6
Fin
ancial
Rep
ort
5
Perfo
rman
ce o
verv
iew
1
Op
erating an
d
finan
cial review
2
Go
vern
ance
3
Directo
rs' R
epo
rt
4

Remuneration Report continued
4.2 Conditional rights movements
Equity awards at QBE are granted in the form of conditional rights. A conditional right is a promise by QBE to acquire or issue one fully paid ordinary QBE Insurance Group Limited share where certain conditions are met.
The table below details conditional rights provided under the terms of both current and legacy plans, details of which can be found at pages 67 to 69 and 74, and contractual arrangements. LTI conditional rights are subject to future performance hurdles as detailed on pages 68 to 69.
Conditional rights under the STI for the 2020 performance year will be granted in the first quarter of 2021.
2020
BALANCE AT 1 JANUARY
2020 NUMBER
GRANTED NUMBER1
VALUE AT GRANT DATE
US$0002
VESTED AND EXERCISED
NUMBER
VALUE AT VESTING DATE
US$000
FORFEITED / LAPSED
NUMBER 3
NOTIONAL DIVIDENDS
ATTACHING IN THE YEAR
NUMBER
BALANCE AT 31 DECEMBER
2020 NUMBER
Richard Pryce 481,298 412,259 3,279 (89,791) 814 – 20,406 824,172Jason Brown 167,493 92,705 846 (22,265) 202 – 8,439 246,372Peter Grewal 138,061 77,780 712 (51,458) 479 (170,203) 5,820 – Jason Harris – 162,533 802 – – – – 162,533Todd Jones 467,668 162,968 1,446 (158,711) 1,455 – 16,721 488,646Margaret Murphy 230,093 75,923 691 (22,597) 206 – 10,051 293,470Inder Singh 213,100 97,380 892 (32,229) 293 – 9,860 288,111Former executive KMPVivek Bhatia 262,815 109,692 1,008 (73,018) 677 (308,853) 9,364 – Patrick Regan 773,138 359,310 1,725 (111,485) 1,014 (1,052,869) 31,906 –
1 On commencement of employment, Jason Harris was granted conditional rights as compensation for incentives forfeited on ceasing his previous employment to join QBE. The awards comprise a grant of conditional rights, with vesting on 1 March 2022 subject to service conditions, and a pro-rata LTI grant subject to the performance conditions detailed on pages 68 to 69. The special LTI grants of conditional rights to Richard Pryce in 2020 have performance conditions as detailed on page 69.
2 The value at grant date is calculated in accordance with AASB 2 Share-based Payment.3 For Peter Grewal, Vivek Bhatia and Patrick Regan, this represents the conditional rights which lapsed on ceasing to be an executive
KMP from 31 December 2020, 14 August 2020 and 1 September 2020 respectively. Peter Grewal was executive KMP for the full year.
4. EXECUTIVE KMP REMUNERATION TABLES
72
4.3 Valuation of conditional rights outstanding at 31 December 2020
The table below details the conditional rights issued affecting remuneration of executives in the previous, current or future reporting periods:
2020 GRANT GRANT DATE
PERFORMANCE PERIOD START
DATEEXERCISE
DATE
CONDITIONAL RIGHTS AT
31 DECEMBER 2020
NUMBER1
MAXIMUM VALUE OF
AWARD TO VEST
FAIR VALUE PER CONDITIONAL RIGHT
A$ 2
GROUP ROE TSR TIME
Richard Pryce3 2017 EIP 5-Mar-18 1-Jan-17 2021-2022 78,275 807,015 10.31 2018 EIP 4-Mar-19 1-Jan-18 2021-2023 161,512 1,965,601 12.17 2019 Special LTI 4-Mar-19 1-Jan-19 2022-2024 165,594 2,015,279 12.17 2019 STI 24-Feb-20 1-Jan-19 2021-2022 55,142 822,167 14.91 2020 Special LTI 24-Feb-20 1-Jan-20 2023-2025 135,772 2,024,361 14.91 2021 Special LTI 26-Oct-20 26-Oct-20 2024-2026 227,877 2,014,433 8.84
Jason Brown 2017 EIP 5-Mar-18 1-Jan-17 2021-2022 14,722 151,784 10.31 2018 EIP 4-Mar-19 1-Jan-18 2021-2023 47,084 573,012 12.17 2019 LTI 4-Mar-19 1-Jan-19 2022-2024 88,573 918,947 12.17 8.58 2019 STI 24-Feb-20 1-Jan-19 2021-2022 21,316 317,822 14.91 2020 LTI 24-Feb-20 1-Jan-20 2023-2025 74,677 954,552 14.91 10.66
Peter Grewal4 2018 EIP 4-Mar-19 1-Jan-18 2021-2023 23,123 281,407 12.17 2019 LTI 4-Mar-19 1-Jan-19 2022-2024 66,546 690,433 12.17 8.58 2019 STI 24-Feb-20 1-Jan-19 2021-2022 19,437 289,806 14.91 2020 LTI 24-Feb-20 1-Jan-20 2023-2025 61,097 780,975 14.91 10.66
Jason Harris Special 1-Oct-20 1-Oct-20 1-Mar-22 61,917 538,678 8.70 2020 LTI 1-Oct-20 1-Jan-20 2023-2025 100,616 626,083 8.70 3.75
Todd Jones Special 1-Oct-19 1-Oct-19 3-Mar-21 164,335 2,070,621 12.60 2019 LTI 1-Oct-19 1-Jan-19 2022-2024 155,569 1,587,983 12.60 7.82 2019 STI 24-Feb-20 1-Jan-19 2021-2022 8,079 120,458 14.91 2020 LTI 24-Feb-20 1-Jan-20 2023-2025 160,663 2,053,673 14.91 10.66
Margaret Murphy 2017 EIP 5-Mar-18 1-Jan-17 2021-2022 13,620 140,422 10.31 Special 5-Mar-18 5-Mar-18 4-Mar-21 80,478 829,728 10.31 2018 EIP 4-Mar-19 1-Jan-18 2021-2023 49,767 605,664 12.17 2019 LTI 4-Mar-19 1-Jan-19 2022-2024 70,990 736,518 12.17 8.58 2019 STI 24-Feb-20 1-Jan-19 2021-2022 16,104 240,111 14.91 2020 LTI 24-Feb-20 1-Jan-20 2023-2025 62,511 799,045 14.91 10.66
Inder Singh 2017 EIP 5-Mar-18 1-Jan-17 2021-2022 20,888 215,355 10.31 2018 EIP 4-Mar-19 1-Jan-18 2021-2023 68,784 837,101 12.17 2019 LTI 4-Mar-19 1-Jan-19 2022-2024 97,613 1,012,722 12.17 8.58 2019 STI 24-Feb-20 1-Jan-19 2021-2022 24,429 364,236 14.91 2020 LTI 24-Feb-20 1-Jan-20 2023-2025 76,397 976,547 14.91 10.66
Former executive KMPVivek Bhatia4 2018 EIP 4-Mar-19 1-Jan-18 2021-2023 89,680 1,091,406 12.17
2019 LTI 4-Mar-19 1-Jan-19 2022-2024 106,051 1,100,285 12.17 8.58 2019 STI 24-Feb-20 1-Jan-19 2021-2022 30,109 448,925 14.91 2020 LTI 24-Feb-20 1-Jan-20 2023-2025 83,013 1,061,107 14.91 10.66
Patrick Regan4 2017 EIP 5-Mar-18 1-Jan-17 2021-2022 67,509 696,018 10.31 2018 EIP 4-Mar-19 1-Jan-18 2021-2023 243,647 3,140,610 12.89 2019 LTI 4-Mar-19 1-Jan-19 2022-2024 371,173 4,093,120 12.89 9.17 2019 STI 24-Feb-20 1-Jan-19 2021-2022 66,169 986,580 14.91 2020 LTI 24-Feb-20 1-Jan-20 2023-2025 304,371 1,597,945 7.93 2.57
1 Includes original grant of conditional rights and notional dividends. 2 The fair value of conditional rights at grant date is determined using appropriate models including Monte Carlo simulations, depending
on the vesting conditions. The fair value of each conditional right is recognised evenly over the service period ending at vesting date. For the LTI allocations, the TSR fair value shown above was averaged over the two peer groups.
3 TheSpecialLTIawardsforRichardPryceincludespecificperformancemeasuresasdetailedonpage69.4 For Peter Grewal, Vivek Bhatia and Patrick Regan, this represents the number of conditional rights at 31 December 2020, 14 August 2020
and 1 September 2020 respectively, immediately prior to ceasing to be an executive KMP. All rights were subsequently lapsed.
QB
E In
suran
ce Gro
up
A
nn
ual R
epo
rt 2020
73O
ther
info
rmatio
n
6
Fin
ancial
Rep
ort
5
Perfo
rman
ce o
verv
iew
1
Op
erating an
d
finan
cial review
2
Go
vern
ance
3
Directo
rs' R
epo
rt
4
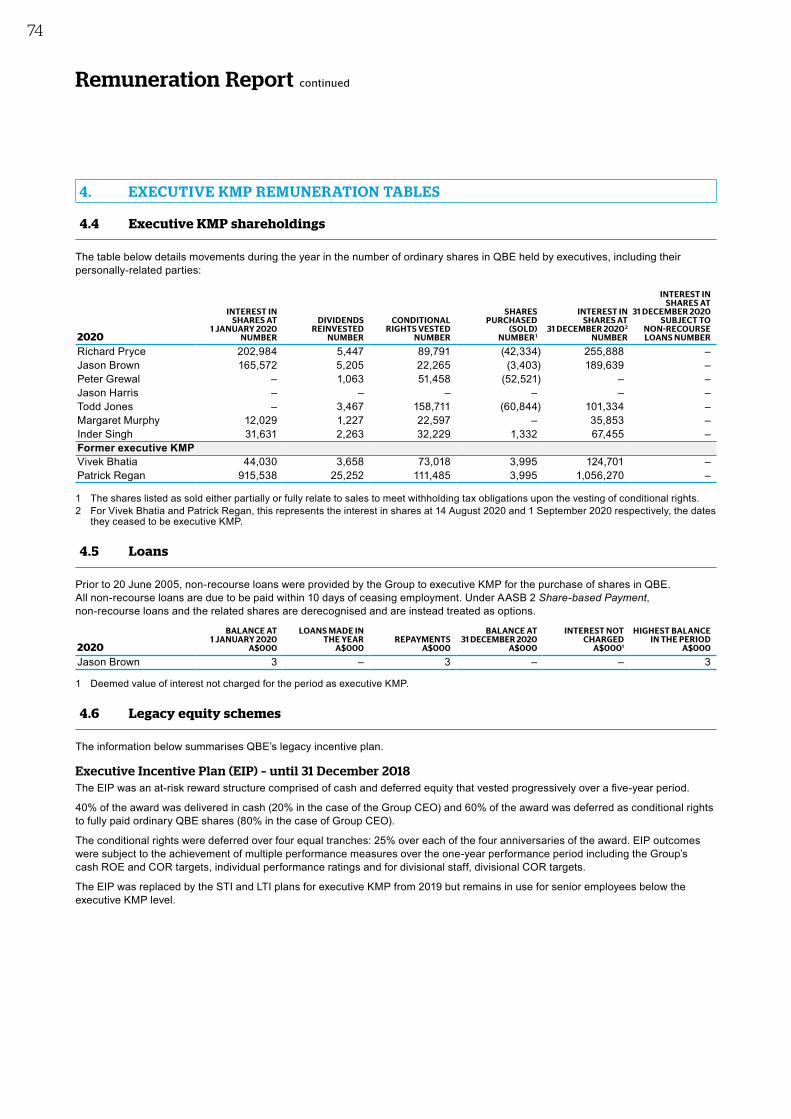
Remuneration Report continued
4.4 Executive KMP shareholdings
The table below details movements during the year in the number of ordinary shares in QBE held by executives, including their personally-related parties:
2020
INTEREST IN SHARES AT
1 JANUARY 2020 NUMBER
DIVIDENDS REINVESTED
NUMBER
CONDITIONAL RIGHTS VESTED
NUMBER
SHARES PURCHASED
(SOLD) NUMBER1
INTEREST IN SHARES AT
31 DECEMBER 20202 NUMBER
INTEREST IN SHARES AT
31 DECEMBER 2020 SUBJECT TO
NON-RECOURSE LOANS NUMBER
Richard Pryce 202,984 5,447 89,791 (42,334) 255,888 – Jason Brown 165,572 5,205 22,265 (3,403) 189,639 – Peter Grewal – 1,063 51,458 (52,521) – – Jason Harris – – – – – – Todd Jones – 3,467 158,711 (60,844) 101,334 – Margaret Murphy 12,029 1,227 22,597 – 35,853 – Inder Singh 31,631 2,263 32,229 1,332 67,455 – Former executive KMPVivek Bhatia 44,030 3,658 73,018 3,995 124,701 – Patrick Regan 915,538 25,252 111,485 3,995 1,056,270 –
1 The shares listed as sold either partially or fully relate to sales to meet withholding tax obligations upon the vesting of conditional rights. 2 For Vivek Bhatia and Patrick Regan, this represents the interest in shares at 14 August 2020 and 1 September 2020 respectively, the dates
they ceased to be executive KMP.
4.5 Loans
Prior to 20 June 2005, non-recourse loans were provided by the Group to executive KMP for the purchase of shares in QBE. All non-recourse loans are due to be paid within 10 days of ceasing employment. Under AASB 2 Share-based Payment, non-recourse loans and the related shares are derecognised and are instead treated as options.
2020
BALANCE AT 1 JANUARY 2020
A$000
LOANS MADE IN THE YEAR
A$000REPAYMENTS
A$000
BALANCE AT 31 DECEMBER 2020
A$000
INTEREST NOT CHARGED
A$0001
HIGHEST BALANCE IN THE PERIOD
A$000
Jason Brown 3 – 3 – – 3
1 Deemed value of interest not charged for the period as executive KMP.
4.6 Legacy equity schemes
The information below summarises QBE’s legacy incentive plan.
Executive Incentive Plan (EIP) – until 31 December 2018TheEIPwasanat-riskrewardstructurecomprisedofcashanddeferredequitythatvestedprogressivelyoverafive-yearperiod.
40% of the award was delivered in cash (20% in the case of the Group CEO) and 60% of the award was deferred as conditional rights to fully paid ordinary QBE shares (80% in the case of Group CEO).
The conditional rights were deferred over four equal tranches: 25% over each of the four anniversaries of the award. EIP outcomes were subject to the achievement of multiple performance measures over the one-year performance period including the Group’s cash ROE and COR targets, individual performance ratings and for divisional staff, divisional COR targets.
The EIP was replaced by the STI and LTI plans for executive KMP from 2019 but remains in use for senior employees below the executive KMP level.
4. EXECUTIVE KMP REMUNERATION TABLES
74
5. NON-EXECUTIVE DIRECTOR REMUNERATION
Thefollowingsectioncontainsinformationontheapproachtonon-executivedirectorremuneration,thefees,otherbenefitsand shareholdings.
Remuneration philosophy
Non-executivedirectorremunerationreflectsQBE’sdesiretoattract,motivateandretainexperiencedindependentdirectorsandto ensure their active participation in the Group’s affairs for the purpose of corporate governance, regulatory compliance and other matters. QBE aims to provide a level of remuneration for non-executive directors comparable with that of its peers, which include multi-nationalfinancialinstitutions.TheBoardreviewssurveyspublishedbyindependentremunerationconsultantsandotherpublicinformation to ensure that fee levels are appropriate. The remuneration arrangements of non-executive directors are distinct and separate from those of the executive KMP.
Fee structure and components
The aggregate amount approved by shareholders at the 2017 AGM was A$4,000,000 per annum.
The total amount paid to non-executive directors in 2020 was A$3,237,700 (2019 A$3,851,000).
Under the current fee framework, non-executive directors receive a base fee expressed in Australian dollars. In addition, a non-executive director (other than the Chair) may receive further fees for chairing or membership of a board committee.
No changes were made to non-executive director remuneration during 2020 and none are proposed for 2021.
The non-executive director fee structure in place since 2017 is shown in the table below:
ROLE CHAIR FEE DEPUTY CHAIR FEE MEMBER FEE
Board A$663,000 A$229,000 A$208,000Committee A$50,000 – A$27,000
Other benefits
Non-executive directors do not receive any performance-based remuneration such as cash incentives or equity awards. Under QBE’s Constitution, non-executive directors are entitled to be reimbursed for all travel and related expenses properly incurred in connection with the business of QBE. All non-executive directors receive an annual cash travel allowance of A$42,750 (A$64,000 for the Chair), in addition to fees for the time involved in travelling to Board meetings and other Board commitments.
Due to the impacts of COVID-19, the travel allowance was temporarily ceased for the non-executive directors from 1 April 2020 to 31 December 2020.
SuperannuationQBE pays superannuation to Australian-based non-executive directors in accordance with Australian superannuation guarantee (SG) legislation. Overseas-based non-executive directors receive the cash equivalent amount in addition to their fees. From 1 January 2020, Australian-based directors may elect to opt out of superannuation contributions as long as they are still receiving contributions from at least one employer. In such cases, a superannuation allowance will be paid in lieu of actual contributions.
Minimum shareholding requirement
With effect from 1 April 2014, a non-executive director MSR was introduced for the Board. Under this requirement, non-executive directorshavefiveyearstobuildaminimumshareholdingequalto100%ofannualbasefees.
To assist current and new non-executive directors in meeting the requirement, a Director Share Acquisition Plan (DSAP) was establishedwitheffectfrom1June2014.TheDSAPallowsnon-executivedirectorstosacrificeaportionoftheirdirectorpre-taxfees to acquire QBE shares.
WheretheMSRhasnotbeenmet,non-executivedirectorsarerequiredtosacrificeamandatoryminimumamountof20%ofpre-taxfees into the DSAP until the MSR is achieved. Shares acquired in this way are not subject to performance targets, as they are acquired in place of cash payments. Directors’ shareholdings are shown overleaf. All non-executive directors have met the MSR asat31December2020,orarewithinthefive-yearperiodtoachievetheMSR.
QB
E In
suran
ce Gro
up
A
nn
ual R
epo
rt 2020
75
Oth
er in
form
ation
6
Fin
ancial
Rep
ort
5
Perfo
rman
ce o
verv
iew
1
Op
erating an
d
finan
cial review
2
Go
vern
ance
3
Directo
rs' R
epo
rt
4

Remuneration Report continued
4.4 Executive KMP shareholdings
The table below details movements during the year in the number of ordinary shares in QBE held by executives, including their personally-related parties:
2020
INTEREST IN SHARES AT
1 JANUARY 2020 NUMBER
DIVIDENDS REINVESTED
NUMBER
CONDITIONAL RIGHTS VESTED
NUMBER
SHARES PURCHASED
(SOLD) NUMBER1
INTEREST IN SHARES AT
31 DECEMBER 20202 NUMBER
INTEREST IN SHARES AT
31 DECEMBER 2020 SUBJECT TO
NON-RECOURSE LOANS NUMBER
Richard Pryce 202,984 5,447 89,791 (42,334) 255,888 – Jason Brown 165,572 5,205 22,265 (3,403) 189,639 – Peter Grewal – 1,063 51,458 (52,521) – – Jason Harris – – – – – – Todd Jones – 3,467 158,711 (60,844) 101,334 – Margaret Murphy 12,029 1,227 22,597 – 35,853 – Inder Singh 31,631 2,263 32,229 1,332 67,455 – Former executive KMPVivek Bhatia 44,030 3,658 73,018 3,995 124,701 – Patrick Regan 915,538 25,252 111,485 3,995 1,056,270 –
1 The shares listed as sold either partially or fully relate to sales to meet withholding tax obligations upon the vesting of conditional rights. 2 For Vivek Bhatia and Patrick Regan, this represents the interest in shares at 14 August 2020 and 1 September 2020 respectively, the dates
they ceased to be executive KMP.
4.5 Loans
Prior to 20 June 2005, non-recourse loans were provided by the Group to executive KMP for the purchase of shares in QBE. All non-recourse loans are due to be paid within 10 days of ceasing employment. Under AASB 2 Share-based Payment, non-recourse loans and the related shares are derecognised and are instead treated as options.
2020
BALANCE AT 1 JANUARY 2020
A$000
LOANS MADE IN THE YEAR
A$000REPAYMENTS
A$000
BALANCE AT 31 DECEMBER 2020
A$000
INTEREST NOT CHARGED
A$0001
HIGHEST BALANCE IN THE PERIOD
A$000
Jason Brown 3 – 3 – – 3
1 Deemed value of interest not charged for the period as executive KMP.
4.6 Legacy equity schemes
The information below summarises QBE’s legacy incentive plan.
Executive Incentive Plan (EIP) – until 31 December 2018TheEIPwasanat-riskrewardstructurecomprisedofcashanddeferredequitythatvestedprogressivelyoverafive-yearperiod.
40% of the award was delivered in cash (20% in the case of the Group CEO) and 60% of the award was deferred as conditional rights to fully paid ordinary QBE shares (80% in the case of Group CEO).
The conditional rights were deferred over four equal tranches: 25% over each of the four anniversaries of the award. EIP outcomes were subject to the achievement of multiple performance measures over the one-year performance period including the Group’s cash ROE and COR targets, individual performance ratings and for divisional staff, divisional COR targets.
The EIP was replaced by the STI and LTI plans for executive KMP from 2019 but remains in use for senior employees below the executive KMP level.
4. EXECUTIVE KMP REMUNERATION TABLES
74
5. NON-EXECUTIVE DIRECTOR REMUNERATION
Thefollowingsectioncontainsinformationontheapproachtonon-executivedirectorremuneration,thefees,otherbenefitsand shareholdings.
Remuneration philosophy
Non-executivedirectorremunerationreflectsQBE’sdesiretoattract,motivateandretainexperiencedindependentdirectorsandto ensure their active participation in the Group’s affairs for the purpose of corporate governance, regulatory compliance and other matters. QBE aims to provide a level of remuneration for non-executive directors comparable with that of its peers, which include multi-nationalfinancialinstitutions.TheBoardreviewssurveyspublishedbyindependentremunerationconsultantsandotherpublicinformation to ensure that fee levels are appropriate. The remuneration arrangements of non-executive directors are distinct and separate from those of the executive KMP.
Fee structure and components
The aggregate amount approved by shareholders at the 2017 AGM was A$4,000,000 per annum.
The total amount paid to non-executive directors in 2020 was A$3,237,700 (2019 A$3,851,000).
Under the current fee framework, non-executive directors receive a base fee expressed in Australian dollars. In addition, a non-executive director (other than the Chair) may receive further fees for chairing or membership of a board committee.
No changes were made to non-executive director remuneration during 2020 and none are proposed for 2021.
The non-executive director fee structure in place since 2017 is shown in the table below:
ROLE CHAIR FEE DEPUTY CHAIR FEE MEMBER FEE
Board A$663,000 A$229,000 A$208,000Committee A$50,000 – A$27,000
Other benefits
Non-executive directors do not receive any performance-based remuneration such as cash incentives or equity awards. Under QBE’s Constitution, non-executive directors are entitled to be reimbursed for all travel and related expenses properly incurred in connection with the business of QBE. All non-executive directors receive an annual cash travel allowance of A$42,750 (A$64,000 for the Chair), in addition to fees for the time involved in travelling to Board meetings and other Board commitments.
Due to the impacts of COVID-19, the travel allowance was temporarily ceased for the non-executive directors from 1 April 2020 to 31 December 2020.
SuperannuationQBE pays superannuation to Australian-based non-executive directors in accordance with Australian superannuation guarantee (SG) legislation. Overseas-based non-executive directors receive the cash equivalent amount in addition to their fees. From 1 January 2020, Australian-based directors may elect to opt out of superannuation contributions as long as they are still receiving contributions from at least one employer. In such cases, a superannuation allowance will be paid in lieu of actual contributions.
Minimum shareholding requirement
With effect from 1 April 2014, a non-executive director MSR was introduced for the Board. Under this requirement, non-executive directorshavefiveyearstobuildaminimumshareholdingequalto100%ofannualbasefees.
To assist current and new non-executive directors in meeting the requirement, a Director Share Acquisition Plan (DSAP) was establishedwitheffectfrom1June2014.TheDSAPallowsnon-executivedirectorstosacrificeaportionoftheirdirectorpre-taxfees to acquire QBE shares.
WheretheMSRhasnotbeenmet,non-executivedirectorsarerequiredtosacrificeamandatoryminimumamountof20%ofpre-taxfees into the DSAP until the MSR is achieved. Shares acquired in this way are not subject to performance targets, as they are acquired in place of cash payments. Directors’ shareholdings are shown overleaf. All non-executive directors have met the MSR asat31December2020,orarewithinthefive-yearperiodtoachievetheMSR.
QB
E In
suran
ce Gro
up
A
nn
ual R
epo
rt 2020
75O
ther
info
rmatio
n
6
Fin
ancial
Rep
ort
5
Perfo
rman
ce o
verv
iew
1
Op
erating an
d
finan
cial review
2
Go
vern
ance
3
Directo
rs' R
epo
rt
4
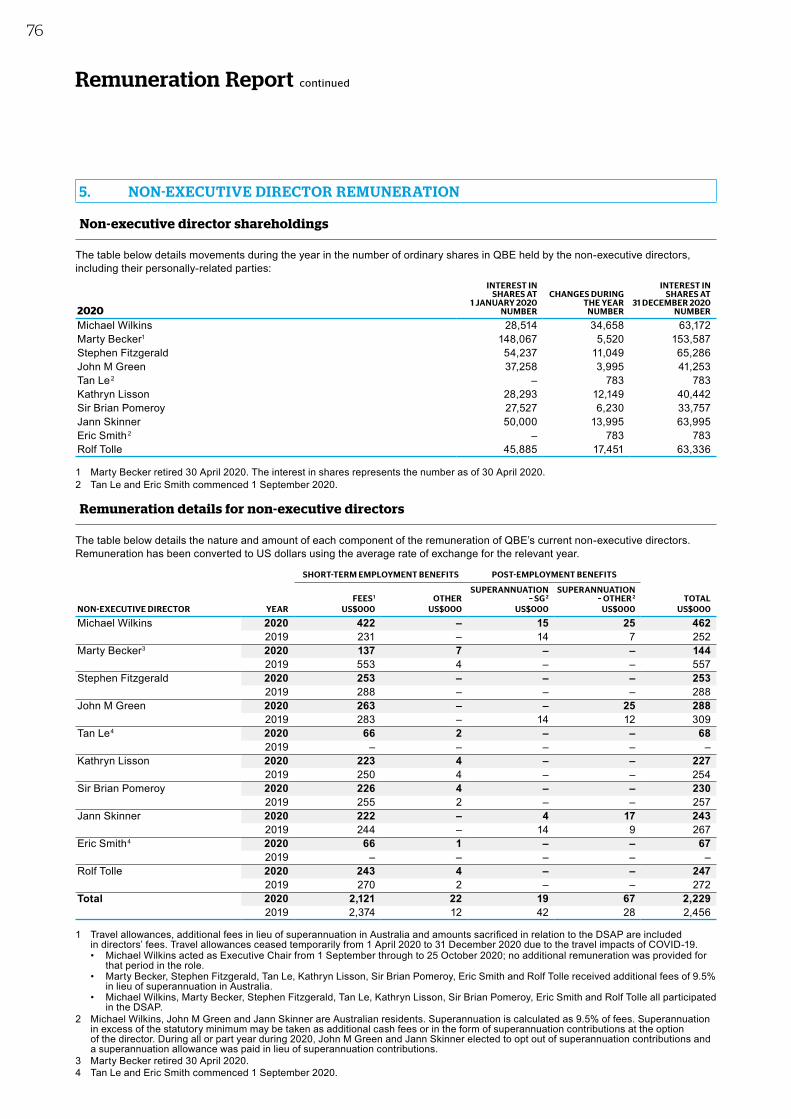
Remuneration Report continued
Non-executive director shareholdings
The table below details movements during the year in the number of ordinary shares in QBE held by the non-executive directors, including their personally-related parties:
2020
INTEREST IN SHARES AT
1 JANUARY 2020 NUMBER
CHANGES DURING THE YEAR
NUMBER
INTEREST IN SHARES AT
31 DECEMBER 2020 NUMBER
Michael Wilkins 28,514 34,658 63,172Marty Becker1 148,067 5,520 153,587Stephen Fitzgerald 54,237 11,049 65,286John M Green 37,258 3,995 41,253Tan Le2 – 783 783Kathryn Lisson 28,293 12,149 40,442Sir Brian Pomeroy 27,527 6,230 33,757Jann Skinner 50,000 13,995 63,995Eric Smith2 – 783 783Rolf Tolle 45,885 17,451 63,336
1 Marty Becker retired 30 April 2020. The interest in shares represents the number as of 30 April 2020.2 Tan Le and Eric Smith commenced 1 September 2020.
Remuneration details for non-executive directors
The table below details the nature and amount of each component of the remuneration of QBE’s current non-executive directors. Remuneration has been converted to US dollars using the average rate of exchange for the relevant year.
SHORT-TERM EMPLOYMENT BENEFITS POST-EMPLOYMENT BENEFITS
NON-EXECUTIVE DIRECTORFEES1 OTHER
SUPERANNUATION – SG 2
SUPERANNUATION – OTHER 2 TOTAL
YEAR US$000 US$000 US$000 US$000 US$000
Michael Wilkins 2020 422 – 15 25 4622019 231 – 14 7 252
Marty Becker3 2020 137 7 – – 1442019 553 4 – – 557
Stephen Fitzgerald 2020 253 – – – 2532019 288 – – – 288
John M Green 2020 263 – – 25 2882019 283 – 14 12 309
Tan Le4 2020 66 2 – – 682019 – – – – –
Kathryn Lisson 2020 223 4 – – 2272019 250 4 – – 254
Sir Brian Pomeroy 2020 226 4 – – 2302019 255 2 – – 257
Jann Skinner 2020 222 – 4 17 2432019 244 – 14 9 267
Eric Smith4 2020 66 1 – – 672019 – – – – –
Rolf Tolle 2020 243 4 – – 2472019 270 2 – – 272
Total 2020 2,121 22 19 67 2,2292019 2,374 12 42 28 2,456
1 Travelallowances,additionalfeesinlieuofsuperannuationinAustraliaandamountssacrificedinrelationtotheDSAPareincludedin directors’ fees. Travel allowances ceased temporarily from 1 April 2020 to 31 December 2020 due to the travel impacts of COVID-19.• Michael Wilkins acted as Executive Chair from 1 September through to 25 October 2020; no additional remuneration was provided for
that period in the role.• Marty Becker, Stephen Fitzgerald, Tan Le, Kathryn Lisson, Sir Brian Pomeroy, Eric Smith and Rolf Tolle received additional fees of 9.5%
in lieu of superannuation in Australia. • Michael Wilkins, Marty Becker, Stephen Fitzgerald, Tan Le, Kathryn Lisson, Sir Brian Pomeroy, Eric Smith and Rolf Tolle all participated
in the DSAP. 2 Michael Wilkins, John M Green and Jann Skinner are Australian residents. Superannuation is calculated as 9.5% of fees. Superannuation
in excess of the statutory minimum may be taken as additional cash fees or in the form of superannuation contributions at the option of the director. During all or part year during 2020, John M Green and Jann Skinner elected to opt out of superannuation contributions and a superannuation allowance was paid in lieu of superannuation contributions.
3 Marty Becker retired 30 April 2020.4 Tan Le and Eric Smith commenced 1 September 2020.
5. NON-EXECUTIVE DIRECTOR REMUNERATION
76
Directors' ReportFOR THE YEAR ENDED 31 DECEMBER 2020
AuditorPricewaterhouseCoopers, Chartered Accountants, continues in office in accordance with section 327B of the Corporations Act 2001.
Non-audit services During the year, PricewaterhouseCoopers performed certain other services in addition to statutory duties.
The Board, on the advice of the Audit Committee, has considered the position and is satisfied that the provision of non-audit services is compatible with the general standard of independence for auditors imposed by the Corporations Act 2001. The directors are also satisfied that the provision of non-audit services by the auditor, as set out in note 8.8 to the financial statements, did not compromise the auditor independence requirements of the Corporations Act 2001.
A copy of the auditor’s independence declaration required under section 307C of the Corporations Act 2001 is set out on page 78.
Details of amounts paid or payable to PricewaterhouseCoopers for audit and non-audit services are provided in note 8.8 to the financial statements.
Rounding of amountsThe Company is of a kind referred to in the ASIC Corporations (Rounding in Financial/Directors’ Reports) Instrument 2016/191. Amounts have been rounded off in the Directors’ Report to the nearest million dollars or, in certain cases, to the nearest thousand dollars in accordance with that instrument.
Signed in SYDNEY this 19th day of February 2021 in accordance with a resolution of the directors.
Michael Wilkins AO John M Green Director Director
QB
E In
suran
ce Gro
up
A
nn
ual R
epo
rt 2020
77
Oth
er in
form
ation
6
Fin
ancial
Rep
ort
5
Perfo
rman
ce o
verv
iew
1
Op
erating an
d
finan
cial review
2
Go
vern
ance
3
Directo
rs' R
epo
rt
4
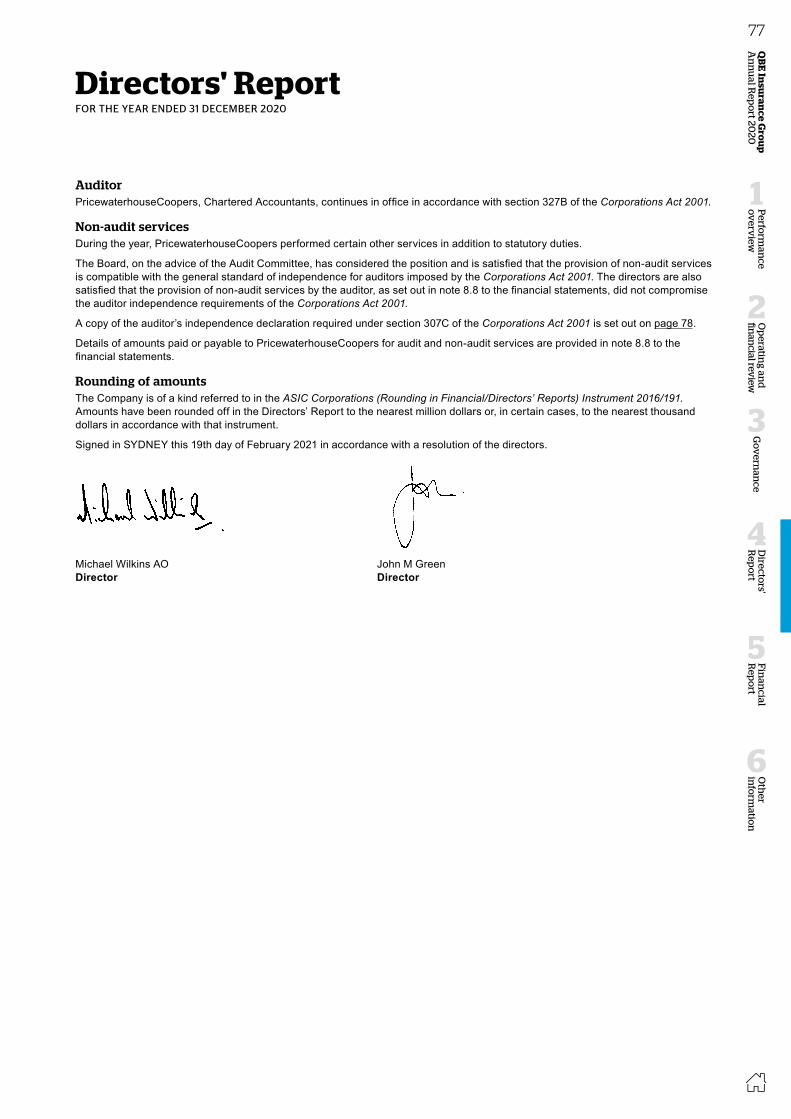
Remuneration Report continued
Non-executive director shareholdings
The table below details movements during the year in the number of ordinary shares in QBE held by the non-executive directors, including their personally-related parties:
2020
INTEREST IN SHARES AT
1 JANUARY 2020 NUMBER
CHANGES DURING THE YEAR
NUMBER
INTEREST IN SHARES AT
31 DECEMBER 2020 NUMBER
Michael Wilkins 28,514 34,658 63,172Marty Becker1 148,067 5,520 153,587Stephen Fitzgerald 54,237 11,049 65,286John M Green 37,258 3,995 41,253Tan Le2 – 783 783Kathryn Lisson 28,293 12,149 40,442Sir Brian Pomeroy 27,527 6,230 33,757Jann Skinner 50,000 13,995 63,995Eric Smith2 – 783 783Rolf Tolle 45,885 17,451 63,336
1 Marty Becker retired 30 April 2020. The interest in shares represents the number as of 30 April 2020.2 Tan Le and Eric Smith commenced 1 September 2020.
Remuneration details for non-executive directors
The table below details the nature and amount of each component of the remuneration of QBE’s current non-executive directors. Remuneration has been converted to US dollars using the average rate of exchange for the relevant year.
SHORT-TERM EMPLOYMENT BENEFITS POST-EMPLOYMENT BENEFITS
NON-EXECUTIVE DIRECTORFEES1 OTHER
SUPERANNUATION – SG 2
SUPERANNUATION – OTHER 2 TOTAL
YEAR US$000 US$000 US$000 US$000 US$000
Michael Wilkins 2020 422 – 15 25 4622019 231 – 14 7 252
Marty Becker3 2020 137 7 – – 1442019 553 4 – – 557
Stephen Fitzgerald 2020 253 – – – 2532019 288 – – – 288
John M Green 2020 263 – – 25 2882019 283 – 14 12 309
Tan Le4 2020 66 2 – – 682019 – – – – –
Kathryn Lisson 2020 223 4 – – 2272019 250 4 – – 254
Sir Brian Pomeroy 2020 226 4 – – 2302019 255 2 – – 257
Jann Skinner 2020 222 – 4 17 2432019 244 – 14 9 267
Eric Smith4 2020 66 1 – – 672019 – – – – –
Rolf Tolle 2020 243 4 – – 2472019 270 2 – – 272
Total 2020 2,121 22 19 67 2,2292019 2,374 12 42 28 2,456
1 Travelallowances,additionalfeesinlieuofsuperannuationinAustraliaandamountssacrificedinrelationtotheDSAPareincludedin directors’ fees. Travel allowances ceased temporarily from 1 April 2020 to 31 December 2020 due to the travel impacts of COVID-19.• Michael Wilkins acted as Executive Chair from 1 September through to 25 October 2020; no additional remuneration was provided for
that period in the role.• Marty Becker, Stephen Fitzgerald, Tan Le, Kathryn Lisson, Sir Brian Pomeroy, Eric Smith and Rolf Tolle received additional fees of 9.5%
in lieu of superannuation in Australia. • Michael Wilkins, Marty Becker, Stephen Fitzgerald, Tan Le, Kathryn Lisson, Sir Brian Pomeroy, Eric Smith and Rolf Tolle all participated
in the DSAP. 2 Michael Wilkins, John M Green and Jann Skinner are Australian residents. Superannuation is calculated as 9.5% of fees. Superannuation
in excess of the statutory minimum may be taken as additional cash fees or in the form of superannuation contributions at the option of the director. During all or part year during 2020, John M Green and Jann Skinner elected to opt out of superannuation contributions and a superannuation allowance was paid in lieu of superannuation contributions.
3 Marty Becker retired 30 April 2020.4 Tan Le and Eric Smith commenced 1 September 2020.
5. NON-EXECUTIVE DIRECTOR REMUNERATION
76
Directors' ReportFOR THE YEAR ENDED 31 DECEMBER 2020
AuditorPricewaterhouseCoopers, Chartered Accountants, continues in office in accordance with section 327B of the Corporations Act 2001.
Non-audit services During the year, PricewaterhouseCoopers performed certain other services in addition to statutory duties.
The Board, on the advice of the Audit Committee, has considered the position and is satisfied that the provision of non-audit services is compatible with the general standard of independence for auditors imposed by the Corporations Act 2001. The directors are also satisfied that the provision of non-audit services by the auditor, as set out in note 8.8 to the financial statements, did not compromise the auditor independence requirements of the Corporations Act 2001.
A copy of the auditor’s independence declaration required under section 307C of the Corporations Act 2001 is set out on page 78.
Details of amounts paid or payable to PricewaterhouseCoopers for audit and non-audit services are provided in note 8.8 to the financial statements.
Rounding of amountsThe Company is of a kind referred to in the ASIC Corporations (Rounding in Financial/Directors’ Reports) Instrument 2016/191. Amounts have been rounded off in the Directors’ Report to the nearest million dollars or, in certain cases, to the nearest thousand dollars in accordance with that instrument.
Signed in SYDNEY this 19th day of February 2021 in accordance with a resolution of the directors.
Michael Wilkins AO John M Green Director Director
QB
E In
suran
ce Gro
up
A
nn
ual R
epo
rt 2020
77O
ther
info
rmatio
n
6
Fin
ancial
Rep
ort
5
Perfo
rman
ce o
verv
iew
1
Op
erating an
d
finan
cial review
2
Go
vern
ance
3
Directo
rs' R
epo
rt
4
Directors' Report continued
FOR THE YEAR ENDED 31 DECEMBER 2020
Auditor’s independence declarationAs lead auditor for the audit of QBE Insurance Group Limited for the year ended 31 December 2020, I declare that, to the best of my knowledge and belief, there have been:(a) no contraventions of the auditor independence requirements of the Corporations Act 2001 in relation to the audit; and(b) no contraventions of any applicable code of professional conduct in relation to the audit.
This declaration is in respect of QBE Insurance Group Limited and the entities it controlled during the period.
Voula Papageorgiou Partner, PricewaterhouseCoopers
Sydney 19 February 2021
PricewaterhouseCoopers, ABN 52 780 433 757One International Towers Sydney, Watermans Quay, Barangaroo, GPO BOX 2650, SYDNEY NSW 2001T: +61 2 8266 0000, F: +61 2 8266 9999, www.pwc.com.au
Level 11, 1PSQ, 169 Macquarie Street, Parramatta NSW 2150, PO Box 1155 Parramatta NSW 2124T: +61 2 9659 2476, F: +61 2 8266 9999, www.pwc.com.au
Liability limited by a scheme approved under Professional Standards Legislation.
78
This Annual Report includes the consolidated financial statements for QBE Insurance Group Limited (the ultimate parent entity or the Company) and its controlled entities (QBE or the Group). All amounts in this Financial Report are presented in US dollars unless otherwise stated. QBE Insurance Group Limited is a company limited by its shares and incorporated and domiciled in Australia. Its registered office is located at:Level 27, 8 Chifley Square Sydney NSW 2000 Australia.
A description of the nature of the Group’s operations and its principal activities is included on pages 4 to 27, none of which is part of this Financial Report. The Financial Report was authorised for issue by the directors on 19 February 2021. The directors have the power to amend and reissue the financial statements.
Through the use of the internet, we have ensured that our corporate reporting is timely, complete and available globally at minimum cost to the Company. All material press releases, this Financial Report and other information are available at our QBE investor centre at our website: www.qbe.com.
FINANCIAL STATEMENTSConsolidated statement of comprehensive income 80Consolidated balance sheet 81Consolidated statement of changes in equity 82Consolidated statement of cash flows 83
NOTE S TO THE FINANCIAL STATEMENTS
1. OVERVIEW 841.1 About QBE 841.2 About this report 851.3 Segment information 88
2. UNDERWRITING ACTIVITIE S 912.1 Revenue 912.2 Net claims expense 922.3 Net outstanding claims liability 922.4 Claims development – net undiscounted central estimate 992.5 Unearned premium and deferred insurance costs 1012.6 Trade and other receivables 1042.7 Trade and other payables 105
3. INVE STMENT ACTIVITIE S 1063.1 Investment income 1063.2 Investment assets 107
4. RISK MANAGEMENT 1104.1 Strategic risk 1114.2 Insurance risk 1124.3 Credit risk 1144.4 Market risk 1164.5 Liquidity risk 1204.6 Operational risk 1214.7 Compliance risk 1224.8 Group risk 122
5. CAPITAL STRUCTURE 1235.1 Borrowings 1235.2 Cash and cash equivalents 1255.3 Contributed equity and reserves 1265.4 Dividends 1285.5 Earnings per share 1295.6 Derivatives 130
6. TAX 1336.1 Reconciliation of prima facie tax to income tax expense or credit 1336.2 Deferred income tax 134
7. GROUP STRUCTURE 1377.1 Disposals and assets held for sale 1377.2 Intangible assets 1397.3 Controlled entities 144
8. OTHER 1478.1 Other accounting policies 1478.2 Contingent liabilities 1488.3 Offsetting financial assets and liabilities 1498.4 Reconciliation of profit or loss after income tax to net cash flows
from operating activities 1498.5 Share‑based payments 1508.6 Key management personnel 1528.7 Defined benefit plans 1538.8 Remuneration of auditors 1548.9 Ultimate parent entity information 155
DIRECTORS' DECLARATION 156
INDEPENDENT AUDITOR’S REPORT 157
Financial Report contents
QB
E In
suran
ce Gro
up
A
nn
ual R
epo
rt 2020
79
Oth
er in
form
ation
6
Fin
ancial
Rep
ort
5
Perfo
rman
ce o
verv
iew
1
Op
erating an
d
finan
cial review
2
Go
vern
ance
3
Directo
rs' R
epo
rt
4

Directors' Report continued
FOR THE YEAR ENDED 31 DECEMBER 2020
Auditor’s independence declarationAs lead auditor for the audit of QBE Insurance Group Limited for the year ended 31 December 2020, I declare that, to the best of my knowledge and belief, there have been:(a) no contraventions of the auditor independence requirements of the Corporations Act 2001 in relation to the audit; and(b) no contraventions of any applicable code of professional conduct in relation to the audit.
This declaration is in respect of QBE Insurance Group Limited and the entities it controlled during the period.
Voula Papageorgiou Partner, PricewaterhouseCoopers
Sydney 19 February 2021
PricewaterhouseCoopers, ABN 52 780 433 757One International Towers Sydney, Watermans Quay, Barangaroo, GPO BOX 2650, SYDNEY NSW 2001T: +61 2 8266 0000, F: +61 2 8266 9999, www.pwc.com.au
Level 11, 1PSQ, 169 Macquarie Street, Parramatta NSW 2150, PO Box 1155 Parramatta NSW 2124T: +61 2 9659 2476, F: +61 2 8266 9999, www.pwc.com.au
Liability limited by a scheme approved under Professional Standards Legislation.
78
This Annual Report includes the consolidated financial statements for QBE Insurance Group Limited (the ultimate parent entity or the Company) and its controlled entities (QBE or the Group). All amounts in this Financial Report are presented in US dollars unless otherwise stated. QBE Insurance Group Limited is a company limited by its shares and incorporated and domiciled in Australia. Its registered office is located at:Level 27, 8 Chifley Square Sydney NSW 2000 Australia.
A description of the nature of the Group’s operations and its principal activities is included on pages 4 to 27, none of which is part of this Financial Report. The Financial Report was authorised for issue by the directors on 19 February 2021. The directors have the power to amend and reissue the financial statements.
Through the use of the internet, we have ensured that our corporate reporting is timely, complete and available globally at minimum cost to the Company. All material press releases, this Financial Report and other information are available at our QBE investor centre at our website: www.qbe.com.
FINANCIAL STATEMENTSConsolidated statement of comprehensive income 80Consolidated balance sheet 81Consolidated statement of changes in equity 82Consolidated statement of cash flows 83
NOTE S TO THE FINANCIAL STATEMENTS
1. OVERVIEW 841.1 About QBE 841.2 About this report 851.3 Segment information 88
2. UNDERWRITING ACTIVITIE S 912.1 Revenue 912.2 Net claims expense 922.3 Net outstanding claims liability 922.4 Claims development – net undiscounted central estimate 992.5 Unearned premium and deferred insurance costs 1012.6 Trade and other receivables 1042.7 Trade and other payables 105
3. INVE STMENT ACTIVITIE S 1063.1 Investment income 1063.2 Investment assets 107
4. RISK MANAGEMENT 1104.1 Strategic risk 1114.2 Insurance risk 1124.3 Credit risk 1144.4 Market risk 1164.5 Liquidity risk 1204.6 Operational risk 1214.7 Compliance risk 1224.8 Group risk 122
5. CAPITAL STRUCTURE 1235.1 Borrowings 1235.2 Cash and cash equivalents 1255.3 Contributed equity and reserves 1265.4 Dividends 1285.5 Earnings per share 1295.6 Derivatives 130
6. TAX 1336.1 Reconciliation of prima facie tax to income tax expense or credit 1336.2 Deferred income tax 134
7. GROUP STRUCTURE 1377.1 Disposals and assets held for sale 1377.2 Intangible assets 1397.3 Controlled entities 144
8. OTHER 1478.1 Other accounting policies 1478.2 Contingent liabilities 1488.3 Offsetting financial assets and liabilities 1498.4 Reconciliation of profit or loss after income tax to net cash flows
from operating activities 1498.5 Share‑based payments 1508.6 Key management personnel 1528.7 Defined benefit plans 1538.8 Remuneration of auditors 1548.9 Ultimate parent entity information 155
DIRECTORS' DECLARATION 156
INDEPENDENT AUDITOR’S REPORT 157
Financial Report contents
QB
E In
suran
ce Gro
up
A
nn
ual R
epo
rt 2020
79O
ther
info
rmatio
n
6
Fin
ancial
Rep
ort
5
Perfo
rman
ce o
verv
iew
1
Op
erating an
d
finan
cial review
2
Go
vern
ance
3
Directo
rs' R
epo
rt
4

Consolidated statement of comprehensive incomeFOR THE YEAR ENDED 31 DECEMBER 2020
2020 2019NOTE US$M US$M
Gross written premium 14,643 13,442Unearned premium movement (635) (185)Gross earned premium revenue 2.1 14,008 13,257Outward reinsurance premium (2,462) (1,825)Deferred reinsurance premium movement 162 177Outward reinsurance premium expense (2,300) (1,648)Net earned premium (a) 11,708 11,609Gross claims expense 2.2 (12,300) (9,676)Reinsurance and other recoveries revenue 2.2 3,366 1,574Net claims expense (b) 2.2 (8,934) (8,102)Gross commission expense (2,331) (2,178)Reinsurance commission revenue 2.1 440 359Net commission (c) (1,891) (1,819)Underwriting and other expenses (d) (1,752) (1,690)Underwriting result (a)+(b)+(c)+(d) (869) (2)Investment income – policyholders’ funds 3.1 153 660Investment expenses – policyholders’ funds 3.1 (11) (11)Insurance (loss) profit (727) 647Investment income – shareholders’ funds 3.1 90 393Investment expenses – shareholders’ funds 3.1 (6) (6)Financing and other costs 5.1.2 (252) (257)Loss on sale of entities and businesses 7.1.1 (2) (8)Share of net loss of associates (5) (3)Restructuring and related expenses (104) (43)Amortisation and impairment of intangibles 7.2 (466) (51)(Loss) profit before income tax from continuing operations (1,472) 672Income tax expense 6.1 (39) (104)(Loss) profit after income tax from continuing operations (1,511) 568Loss after income tax from discontinued operations 7.1.2 – (21)(Loss) profit after income tax (1,511) 547Other comprehensive incomeItems that may be reclassified to profit or lossNet movement in foreign currency translation reserve 5.3.2 375 28Net movement in cash flow hedge and cost of hedging reserves 5.3.2 (24) (7)Income tax relating to these components of other comprehensive income 7 2Other comprehensive income from discontinued operations after income tax – 10Items that will not be reclassified to profit or lossRemeasurement of defined benefit plans 38 (9)Income tax relating to this component of other comprehensive income (10) 2Other comprehensive income after income tax 386 26Total comprehensive (loss) income after income tax (1,125) 573(Loss) profit after income tax from continuing operations attributable to:Ordinary equity holders of the Company (1,517) 571Non-controlling interests 6 (3)
(1,511) 568(Loss) profit after income tax attributable to:Ordinary equity holders of the Company (1,517) 550Non-controlling interests 6 (3)
(1,511) 547Total comprehensive (loss) income after income tax attributable to:Ordinary equity holders of the Company (1,131) 576Non-controlling interests 6 (3)
(1,125) 573
(LOSS) EARNINGS PER SHARE FOR (LOSS) PROFIT AFTER INCOME TAX ATTRIBUTABLE TO ORDINARY EQUITY HOLDERS OF THE COMPANY
2020 2019NOTE US CENTS US CENTS
For (loss) profit after income tax from continuing operationsBasic (loss) earnings per share 5.5 (108.5) 43.4Diluted (loss) earnings per share 5.5 (108.5) 43.1For (loss) profit after income taxBasic (loss) earnings per share 5.5 (108.5) 41.8Diluted (loss) earnings per share 5.5 (108.5) 41.5
The consolidated statement of comprehensive income should be read in conjunction with the accompanying notes.
80
Consolidated balance sheetAS AT 31 DECEMBER 2020
2020 2019NOTE US$M US$M
Assets Cash and cash equivalents 5.2 766 547Investments 3.2 26,935 23,790Derivative financial instruments 5.6 520 195Trade and other receivables 2.6 5,760 4,748Current tax assets 60 36Deferred insurance costs 2.5 2,282 1,907Reinsurance and other recoveries on outstanding claims 2.3 6,527 5,104Other assets 19 13Defined benefit plan surpluses 8.7 64 45Right-of-use lease assets 383 275Property, plant and equipment 167 170Deferred tax assets 6.2 546 479Investment properties 34 37Investments in associates 27 25Intangible assets 7.2 2,534 2,791Total assets 46,624 40,162Liabilities Derivative financial instruments 5.6 845 202Trade and other payables 2.7 2,338 1,802Current tax liabilities 15 43Unearned premium 2.5 7,466 6,460Gross outstanding claims 2.3 23,861 19,915Lease liabilities 431 299Provisions 149 136Defined benefit plan deficits 8.7 21 42Deferred tax liabilities 6.2 51 15Borrowings 5.1 2,955 3,095Total liabilities 38,132 32,009Net assets 8,492 8,153EquityContributed equity 5.3.1 10,273 7,594Treasury shares held in trust (1) (1)Reserves 5.3.2 (1,898) (1,335)Retained profits 117 1,895Shareholders’ equity 8,491 8,153Non-controlling interests 1 – Total equity 8,492 8,153
The consolidated balance sheet should be read in conjunction with the accompanying notes.
QB
E In
suran
ce Gro
up
A
nn
ual R
epo
rt 2020
81
Oth
er in
form
ation
6
Fin
ancial
Rep
ort
5
Perfo
rman
ce o
verv
iew
1
Op
erating an
d
finan
cial review
2
Go
vern
ance
3
Directo
rs' R
epo
rt
4
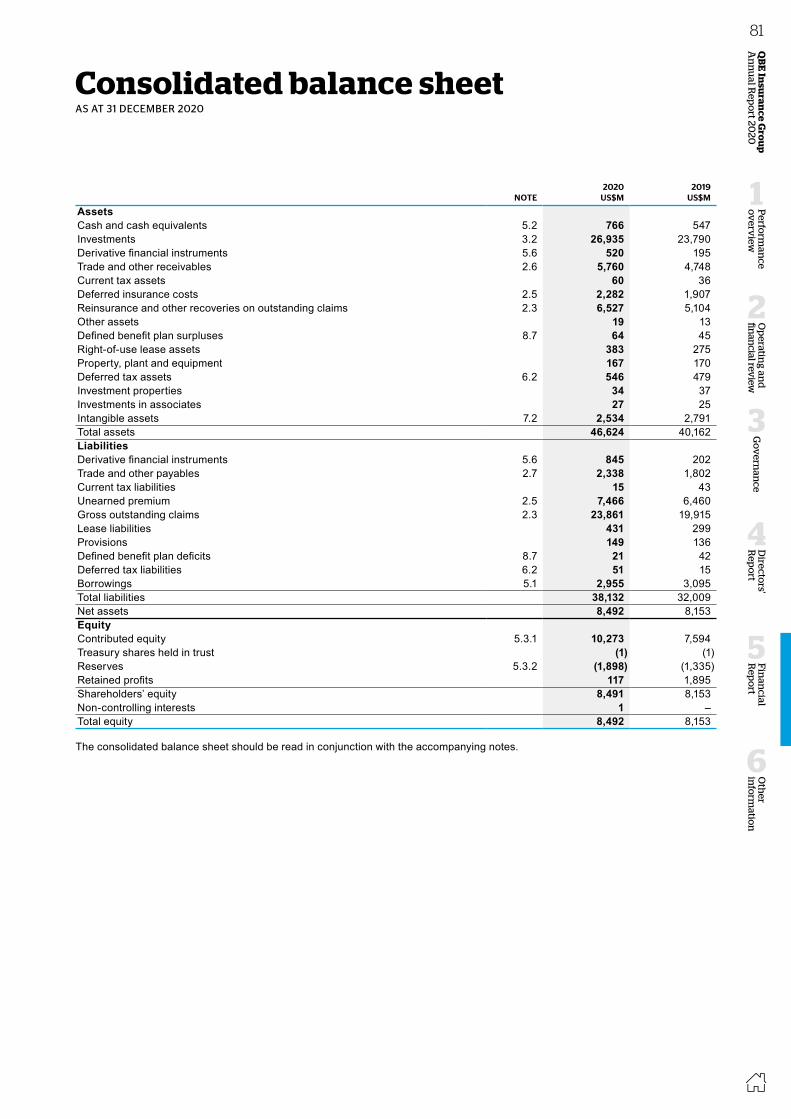
Consolidated statement of comprehensive incomeFOR THE YEAR ENDED 31 DECEMBER 2020
2020 2019NOTE US$M US$M
Gross written premium 14,643 13,442Unearned premium movement (635) (185)Gross earned premium revenue 2.1 14,008 13,257Outward reinsurance premium (2,462) (1,825)Deferred reinsurance premium movement 162 177Outward reinsurance premium expense (2,300) (1,648)Net earned premium (a) 11,708 11,609Gross claims expense 2.2 (12,300) (9,676)Reinsurance and other recoveries revenue 2.2 3,366 1,574Net claims expense (b) 2.2 (8,934) (8,102)Gross commission expense (2,331) (2,178)Reinsurance commission revenue 2.1 440 359Net commission (c) (1,891) (1,819)Underwriting and other expenses (d) (1,752) (1,690)Underwriting result (a)+(b)+(c)+(d) (869) (2)Investment income – policyholders’ funds 3.1 153 660Investment expenses – policyholders’ funds 3.1 (11) (11)Insurance (loss) profit (727) 647Investment income – shareholders’ funds 3.1 90 393Investment expenses – shareholders’ funds 3.1 (6) (6)Financing and other costs 5.1.2 (252) (257)Loss on sale of entities and businesses 7.1.1 (2) (8)Share of net loss of associates (5) (3)Restructuring and related expenses (104) (43)Amortisation and impairment of intangibles 7.2 (466) (51)(Loss) profit before income tax from continuing operations (1,472) 672Income tax expense 6.1 (39) (104)(Loss) profit after income tax from continuing operations (1,511) 568Loss after income tax from discontinued operations 7.1.2 – (21)(Loss) profit after income tax (1,511) 547Other comprehensive incomeItems that may be reclassified to profit or lossNet movement in foreign currency translation reserve 5.3.2 375 28Net movement in cash flow hedge and cost of hedging reserves 5.3.2 (24) (7)Income tax relating to these components of other comprehensive income 7 2Other comprehensive income from discontinued operations after income tax – 10Items that will not be reclassified to profit or lossRemeasurement of defined benefit plans 38 (9)Income tax relating to this component of other comprehensive income (10) 2Other comprehensive income after income tax 386 26Total comprehensive (loss) income after income tax (1,125) 573(Loss) profit after income tax from continuing operations attributable to:Ordinary equity holders of the Company (1,517) 571Non-controlling interests 6 (3)
(1,511) 568(Loss) profit after income tax attributable to:Ordinary equity holders of the Company (1,517) 550Non-controlling interests 6 (3)
(1,511) 547Total comprehensive (loss) income after income tax attributable to:Ordinary equity holders of the Company (1,131) 576Non-controlling interests 6 (3)
(1,125) 573
(LOSS) EARNINGS PER SHARE FOR (LOSS) PROFIT AFTER INCOME TAX ATTRIBUTABLE TO ORDINARY EQUITY HOLDERS OF THE COMPANY
2020 2019NOTE US CENTS US CENTS
For (loss) profit after income tax from continuing operationsBasic (loss) earnings per share 5.5 (108.5) 43.4Diluted (loss) earnings per share 5.5 (108.5) 43.1For (loss) profit after income taxBasic (loss) earnings per share 5.5 (108.5) 41.8Diluted (loss) earnings per share 5.5 (108.5) 41.5
The consolidated statement of comprehensive income should be read in conjunction with the accompanying notes.
80
Consolidated balance sheetAS AT 31 DECEMBER 2020
2020 2019NOTE US$M US$M
Assets Cash and cash equivalents 5.2 766 547Investments 3.2 26,935 23,790Derivative financial instruments 5.6 520 195Trade and other receivables 2.6 5,760 4,748Current tax assets 60 36Deferred insurance costs 2.5 2,282 1,907Reinsurance and other recoveries on outstanding claims 2.3 6,527 5,104Other assets 19 13Defined benefit plan surpluses 8.7 64 45Right-of-use lease assets 383 275Property, plant and equipment 167 170Deferred tax assets 6.2 546 479Investment properties 34 37Investments in associates 27 25Intangible assets 7.2 2,534 2,791Total assets 46,624 40,162Liabilities Derivative financial instruments 5.6 845 202Trade and other payables 2.7 2,338 1,802Current tax liabilities 15 43Unearned premium 2.5 7,466 6,460Gross outstanding claims 2.3 23,861 19,915Lease liabilities 431 299Provisions 149 136Defined benefit plan deficits 8.7 21 42Deferred tax liabilities 6.2 51 15Borrowings 5.1 2,955 3,095Total liabilities 38,132 32,009Net assets 8,492 8,153EquityContributed equity 5.3.1 10,273 7,594Treasury shares held in trust (1) (1)Reserves 5.3.2 (1,898) (1,335)Retained profits 117 1,895Shareholders’ equity 8,491 8,153Non-controlling interests 1 – Total equity 8,492 8,153
The consolidated balance sheet should be read in conjunction with the accompanying notes.
QB
E In
suran
ce Gro
up
A
nn
ual R
epo
rt 2020
81O
ther
info
rmatio
n
6
Fin
ancial
Rep
ort
5
Perfo
rman
ce o
verv
iew
1
Op
erating an
d
finan
cial review
2
Go
vern
ance
3
Directo
rs' R
epo
rt
4

Consolidated statement of changes in equityFOR THE YEAR ENDED 31 DECEMBER 2020
CONTRIBUTED EQUITY
US$M
TREASURY SHARES HELD
IN TRUST US$M
RESERVES US$M
RETAINED PROFITS
US$M
SHARE-HOLDERS’
EQUITY US$M
NON-CONTROLLING
INTERESTS US$M
TOTAL EQUITY US$M
As at 1 January 2020 7,594 (1) (1,335) 1,895 8,153 – 8,153 Loss after income tax – – – (1,517) (1,517) 6 (1,511)Other comprehensive income – – 358 28 386 – 386 Total comprehensive income (loss) – – 358 (1,489) (1,131) 6 (1,125)Transactions with owners in their capacity as ownersShares issued under Employee Share and Option Plan and held in trust 26 (28) – – (2) – (2)Share-based payment expense – – 20 – 20 – 20 Shares vested and/or released – 28 (28) – – – – Contributions of equity, net of transaction costs 1,699 – – – 1,699 – 1,699 Reclassification on disposal of controlled entities – – 2 (2) – – – Dividends paid on ordinary shares – – – (265) (265) (5) (270)Dividend Reinvestment Plan and Bonus Share Plan 27 – – 3 30 – 30 Distribution on capital notes – – – (25) (25) – (25)Foreign exchange 927 – (915) – 12 – 12 As at 31 December 2020 10,273 (1) (1,898) 117 8,491 1 8,492
CONTRIBUTED EQUITY
US$M
TREASURY SHARES HELD
IN TRUST US$M
RESERVES US$M
RETAINED PROFITS
US$M
SHARE-HOLDERS’
EQUITY US$M
NON-CONTROLLING
INTERESTS US$M
TOTAL EQUITY
US$M
As at 1 January 2019 7,830 (7) (1,363) 1,838 8,298 19 8,317Profit (loss) after income tax – – – 550 550 (3) 547Other comprehensive income (loss) – – 33 (7) 26 – 26Total comprehensive income (loss) – – 33 543 576 (3) 573Transactions with owners in their capacity as ownersShares bought back on-market and cancelled (205) – – – (205) – (205)Shares acquired and held in trust – (63) – – (63) – (63)Share-based payment expense – – 38 – 38 – 38Shares vested and/or released – 69 (41) – 28 – 28Contributions of equity, net of transaction costs and tax 1 – – – 1 – 1Net changes in non-controlling interests – – (4) – (4) (12) (16)Reclassification on disposal of owner occupied property – – 3 (3) – – – Dividends paid on ordinary shares – – – (488) (488) (4) (492)Dividend reinvestment under Bonus Share Plan – – – 5 5 – 5Foreign exchange (32) – (1) – (33) – (33)As at 31 December 2019 7,594 (1) (1,335) 1,895 8,153 – 8,153
The consolidated statement of changes in equity should be read in conjunction with the accompanying notes.
82
Consolidated statement of cash flowsFOR THE YEAR ENDED 31 DECEMBER 2020
2020 2019NOTE US$M US$M
Operating activitiesPremium received 14,471 13,705Reinsurance and other recoveries received 2,080 2,373Outward reinsurance premium paid (2,054) (1,815)Claims paid (9,429) (8,899)Acquisition and other underwriting costs paid (3,793) (3,729)Interest received 426 473Dividends received 77 127Other operating payments (174) (154)Interest paid (257) (250)Income taxes paid (113) (52)Net cash flows from operating activities 8.4 1,234 1,779Investing activitiesNet proceeds on sale of growth assets 42 489Net payments for purchase of interest-bearing financial assets (2,387) (1,506)Net proceeds from (payments for) foreign exchange transactions 277 (64)Payments for purchase of intangible assets (71) (84)Proceeds on sale of property, plant and equipment – 1Payments for purchase of property, plant and equipment (40) (30)Payments on acquisition of non-controlling interests – (13)Proceeds on disposal of entities and businesses (net of cash disposed) 17 131Net cash flows from investing activities (2,162) (1,076)Financing activitiesNet proceeds from issue of equity instruments 1,300 – Payments for shares bought back on-market and cancelled – (205)Purchase of treasury shares – (63)Proceeds from settlement of staff share loans 1 1Payments relating to principal element of lease liabilities (61) (59)Proceeds from borrowings 358 – Repayment of borrowings (140) (199)Dividends paid (265) (459)Net cash flows from financing activities 1,193 (984)Net movement in cash and cash equivalents 265 (281)Cash and cash equivalents at the beginning of the year 547 863Effect of exchange rate changes (46) (37)Net cash flows attributable to entities held for sale – 2Cash and cash equivalents at the end of the year 5.2 766 547
The consolidated statement of cash flows should be read in conjunction with the accompanying notes.
QB
E In
suran
ce Gro
up
A
nn
ual R
epo
rt 2020
83
Oth
er in
form
ation
6
Fin
ancial
Rep
ort
5
Perfo
rman
ce o
verv
iew
1
Op
erating an
d
finan
cial review
2
Go
vern
ance
3
Directo
rs' R
epo
rt
4

Consolidated statement of changes in equityFOR THE YEAR ENDED 31 DECEMBER 2020
CONTRIBUTED EQUITY
US$M
TREASURY SHARES HELD
IN TRUST US$M
RESERVES US$M
RETAINED PROFITS
US$M
SHARE-HOLDERS’
EQUITY US$M
NON-CONTROLLING
INTERESTS US$M
TOTAL EQUITY US$M
As at 1 January 2020 7,594 (1) (1,335) 1,895 8,153 – 8,153 Loss after income tax – – – (1,517) (1,517) 6 (1,511)Other comprehensive income – – 358 28 386 – 386 Total comprehensive income (loss) – – 358 (1,489) (1,131) 6 (1,125)Transactions with owners in their capacity as ownersShares issued under Employee Share and Option Plan and held in trust 26 (28) – – (2) – (2)Share-based payment expense – – 20 – 20 – 20 Shares vested and/or released – 28 (28) – – – – Contributions of equity, net of transaction costs 1,699 – – – 1,699 – 1,699 Reclassification on disposal of controlled entities – – 2 (2) – – – Dividends paid on ordinary shares – – – (265) (265) (5) (270)Dividend Reinvestment Plan and Bonus Share Plan 27 – – 3 30 – 30 Distribution on capital notes – – – (25) (25) – (25)Foreign exchange 927 – (915) – 12 – 12 As at 31 December 2020 10,273 (1) (1,898) 117 8,491 1 8,492
CONTRIBUTED EQUITY
US$M
TREASURY SHARES HELD
IN TRUST US$M
RESERVES US$M
RETAINED PROFITS
US$M
SHARE-HOLDERS’
EQUITY US$M
NON-CONTROLLING
INTERESTS US$M
TOTAL EQUITY
US$M
As at 1 January 2019 7,830 (7) (1,363) 1,838 8,298 19 8,317Profit (loss) after income tax – – – 550 550 (3) 547Other comprehensive income (loss) – – 33 (7) 26 – 26Total comprehensive income (loss) – – 33 543 576 (3) 573Transactions with owners in their capacity as ownersShares bought back on-market and cancelled (205) – – – (205) – (205)Shares acquired and held in trust – (63) – – (63) – (63)Share-based payment expense – – 38 – 38 – 38Shares vested and/or released – 69 (41) – 28 – 28Contributions of equity, net of transaction costs and tax 1 – – – 1 – 1Net changes in non-controlling interests – – (4) – (4) (12) (16)Reclassification on disposal of owner occupied property – – 3 (3) – – – Dividends paid on ordinary shares – – – (488) (488) (4) (492)Dividend reinvestment under Bonus Share Plan – – – 5 5 – 5Foreign exchange (32) – (1) – (33) – (33)As at 31 December 2019 7,594 (1) (1,335) 1,895 8,153 – 8,153
The consolidated statement of changes in equity should be read in conjunction with the accompanying notes.
82
Consolidated statement of cash flowsFOR THE YEAR ENDED 31 DECEMBER 2020
2020 2019NOTE US$M US$M
Operating activitiesPremium received 14,471 13,705Reinsurance and other recoveries received 2,080 2,373Outward reinsurance premium paid (2,054) (1,815)Claims paid (9,429) (8,899)Acquisition and other underwriting costs paid (3,793) (3,729)Interest received 426 473Dividends received 77 127Other operating payments (174) (154)Interest paid (257) (250)Income taxes paid (113) (52)Net cash flows from operating activities 8.4 1,234 1,779Investing activitiesNet proceeds on sale of growth assets 42 489Net payments for purchase of interest-bearing financial assets (2,387) (1,506)Net proceeds from (payments for) foreign exchange transactions 277 (64)Payments for purchase of intangible assets (71) (84)Proceeds on sale of property, plant and equipment – 1Payments for purchase of property, plant and equipment (40) (30)Payments on acquisition of non-controlling interests – (13)Proceeds on disposal of entities and businesses (net of cash disposed) 17 131Net cash flows from investing activities (2,162) (1,076)Financing activitiesNet proceeds from issue of equity instruments 1,300 – Payments for shares bought back on-market and cancelled – (205)Purchase of treasury shares – (63)Proceeds from settlement of staff share loans 1 1Payments relating to principal element of lease liabilities (61) (59)Proceeds from borrowings 358 – Repayment of borrowings (140) (199)Dividends paid (265) (459)Net cash flows from financing activities 1,193 (984)Net movement in cash and cash equivalents 265 (281)Cash and cash equivalents at the beginning of the year 547 863Effect of exchange rate changes (46) (37)Net cash flows attributable to entities held for sale – 2Cash and cash equivalents at the end of the year 5.2 766 547
The consolidated statement of cash flows should be read in conjunction with the accompanying notes.
QB
E In
suran
ce Gro
up
A
nn
ual R
epo
rt 2020
83O
ther
info
rmatio
n
6
Fin
ancial
Rep
ort
5
Perfo
rman
ce o
verv
iew
1
Op
erating an
d
finan
cial review
2
Go
vern
ance
3
Directo
rs' R
epo
rt
4
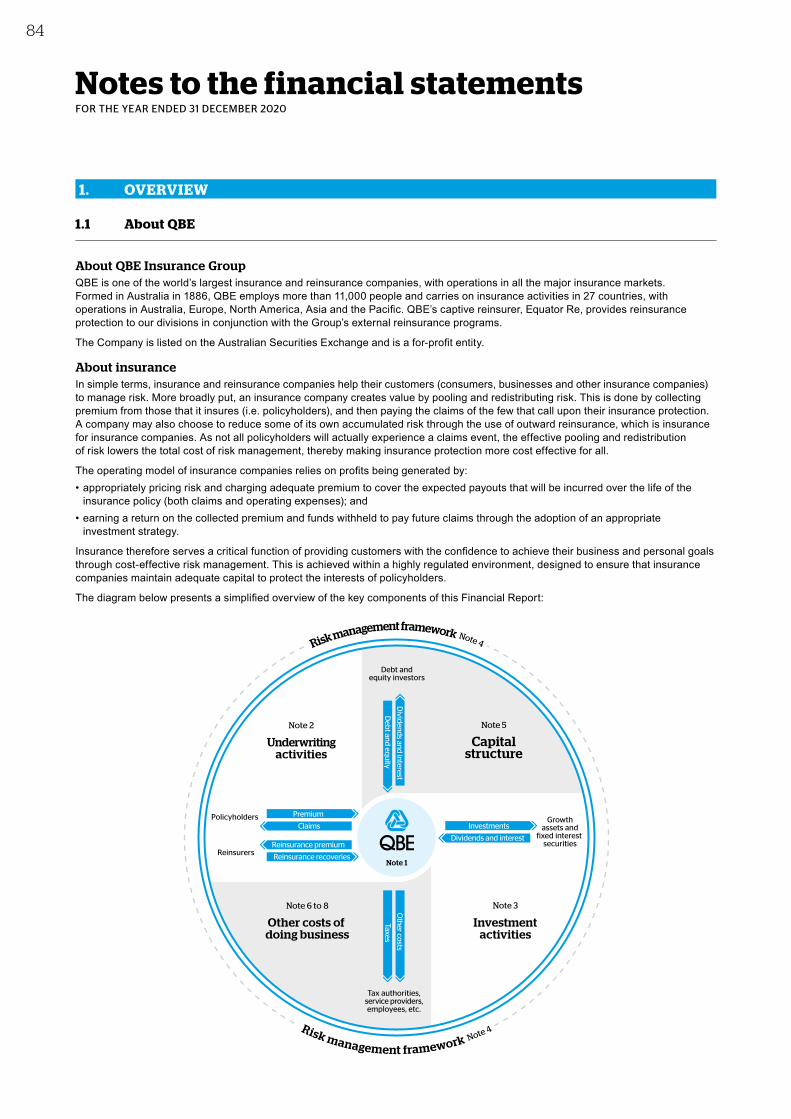
Notes to the financial statementsFOR THE YEAR ENDED 31 DECEMBER 2020
1. OVERVIEW
1.1 About QBE
About QBE Insurance GroupQBE is one of the world’s largest insurance and reinsurance companies, with operations in all the major insurance markets. Formed in Australia in 1886, QBE employs more than 11,000 people and carries on insurance activities in 27 countries, with operations in Australia, Europe, North America, Asia and the Pacific. QBE’s captive reinsurer, Equator Re, provides reinsurance protection to our divisions in conjunction with the Group’s external reinsurance programs.
The Company is listed on the Australian Securities Exchange and is a for-profit entity.
About insuranceIn simple terms, insurance and reinsurance companies help their customers (consumers, businesses and other insurance companies) to manage risk. More broadly put, an insurance company creates value by pooling and redistributing risk. This is done by collecting premium from those that it insures (i.e. policyholders), and then paying the claims of the few that call upon their insurance protection. A company may also choose to reduce some of its own accumulated risk through the use of outward reinsurance, which is insurance for insurance companies. As not all policyholders will actually experience a claims event, the effective pooling and redistribution of risk lowers the total cost of risk management, thereby making insurance protection more cost effective for all.
The operating model of insurance companies relies on profits being generated by: • appropriately pricing risk and charging adequate premium to cover the expected payouts that will be incurred over the life of the
insurance policy (both claims and operating expenses); and • earning a return on the collected premium and funds withheld to pay future claims through the adoption of an appropriate
investment strategy.
Insurance therefore serves a critical function of providing customers with the confidence to achieve their business and personal goals through cost-effective risk management. This is achieved within a highly regulated environment, designed to ensure that insurance companies maintain adequate capital to protect the interests of policyholders.
The diagram below presents a simplified overview of the key components of this Financial Report:
Capitalstructure
Debt andequity investors
Note 5
Growthassets and
fixed interest securities
Investmentactivities
Note 3
Other costs of doing business
Tax authorities,service providers,employees, etc.
Note 6 to 8
Underwritingactivities
Note 2
Reinsurers
Policyholders Premium
Reinsurance recoveries
Reinsurance premium
Claims
Debt and equity
Dividends and interest
Taxes
Other costs
Investments
Dividends and interest
Note 1
RRiisskk MMaannaaggeemmeenntt FFrraammeewwoorrkk NNoottee 44
RRiisskk MMaannaaggeemmeenntt FFrraammeewwoorrkk NNoottee 44
Risk management framework Note 4
Risk management framework Note 4
84
1.2 About this report
This Financial Report includes the consolidated financial statements of QBE Insurance Group Limited (the ultimate parent entity or the Company) and its controlled entities (QBE or the Group).
The Financial Report includes the four primary statements, namely the statement of comprehensive income (which comprises profit or loss and other comprehensive income or loss), balance sheet, statement of changes in equity and statement of cash flows as well as associated notes as required by Australian Accounting Standards. Disclosures have been grouped into the following categories in order to assist users in their understanding of the financial statements: 1. Overview contains information that impacts the Financial Report as a whole as well as segment reporting disclosures.2. Underwriting activities brings together results and balance sheet disclosures relevant to the Group’s insurance activities.3. Investment activities includes results and balance sheet disclosures relevant to the Group’s investments.4. Risk management provides commentary on the Group’s exposure to various financial and capital risks, explaining the potential
impact on the results and balance sheet and how the Group manages these risks.5. Capital structure provides information about the debt and equity components of the Group’s capital.6. Tax includes disclosures relating to the Group’s tax expense and balances.7. Group structure provides a summary of the Group’s controlled entities and includes disclosures in relation to transactions
impacting the Group structure.8. Other includes additional disclosures required to comply with Australian Accounting Standards.
Where applicable within each note, disclosures are further analysed as follows:• Overview provides some context to assist users in understanding the disclosures.• Disclosures (both numbers and commentary) provide analysis of balances as required by Australian Accounting Standards. • How we account for the numbers summarises the accounting policies relevant to an understanding of the numbers.• Critical accounting judgements and estimates explains the key estimates and judgements applied by QBE in determining
the numbers.
The notes include information which the directors believe is required to understand the financial statements and is material and relevant to the operations, balance sheet and results of the Group. Information is considered material and relevant if:• the amount in question is significant because of its size or nature;• it is important to assist in understanding the results of the Group;• it helps to explain the impact of significant changes in the Group’s business – for example, significant acquisitions or disposals; or• it relates to an aspect of the Group’s operations that is important to its future performance.
1.2.1 Basis of preparationThis Financial Report is a general purpose financial report which:• has been prepared in accordance with Australian Accounting standards and the Corporations Act 2001;• complies with International Financial Reporting Standards (IFRS) as issued by the International Accounting Standards Board (IASB)
and Interpretations as issued by the IFRS Interpretations Committee (IFRIC);• has been prepared on a historical cost basis as modified by certain exceptions, the most significant of which are the measurement
of investments and derivatives at fair value and the measurement of the net outstanding claims liability at present value;• is presented in US dollars; and• is presented with values rounded to the nearest million dollars or, in certain cases, to the nearest thousand dollars in accordance
with ASIC Corporations (Rounding in Financial/Directors’ Reports) Instrument 2016/191.
New and amended Accounting Standards and Interpretations issued by the AASB that are now effective are detailed in note 8.1.1.
The Group has not adopted any Accounting Standards and Interpretations that have been issued or amended but are not yet effective as listed in note 8.1.2.
The consolidated financial statements incorporate the assets and liabilities of all entities controlled by the Company as at 31 December 2020 and the results for the financial year then ended. In preparing the consolidated financial statements, all transactions between controlled entities are eliminated in full. Where control of an entity commences or ceases during a financial year, the results are included for that part of the year during which control existed. A list of entities controlled by the Company at year end is contained in note 7.3.
Lloyd’s syndicates are accounted for on a proportional basis. The nature of Lloyd’s syndicates is such that, even when one party provides the majority of capital, the syndicate as a whole is not controlled for accounting purposes.
Where necessary, comparative information has been restated to conform to the current year’s disclosures.
QB
E In
suran
ce Gro
up
A
nn
ual R
epo
rt 2020
85
Oth
er in
form
ation
6
Fin
ancial
Rep
ort
5
Perfo
rman
ce o
verv
iew
1
Op
erating an
d
finan
cial review
2
Go
vern
ance
3
Directo
rs' R
epo
rt
4

Notes to the financial statementsFOR THE YEAR ENDED 31 DECEMBER 2020
1. OVERVIEW
1.1 About QBE
About QBE Insurance GroupQBE is one of the world’s largest insurance and reinsurance companies, with operations in all the major insurance markets. Formed in Australia in 1886, QBE employs more than 11,000 people and carries on insurance activities in 27 countries, with operations in Australia, Europe, North America, Asia and the Pacific. QBE’s captive reinsurer, Equator Re, provides reinsurance protection to our divisions in conjunction with the Group’s external reinsurance programs.
The Company is listed on the Australian Securities Exchange and is a for-profit entity.
About insuranceIn simple terms, insurance and reinsurance companies help their customers (consumers, businesses and other insurance companies) to manage risk. More broadly put, an insurance company creates value by pooling and redistributing risk. This is done by collecting premium from those that it insures (i.e. policyholders), and then paying the claims of the few that call upon their insurance protection. A company may also choose to reduce some of its own accumulated risk through the use of outward reinsurance, which is insurance for insurance companies. As not all policyholders will actually experience a claims event, the effective pooling and redistribution of risk lowers the total cost of risk management, thereby making insurance protection more cost effective for all.
The operating model of insurance companies relies on profits being generated by: • appropriately pricing risk and charging adequate premium to cover the expected payouts that will be incurred over the life of the
insurance policy (both claims and operating expenses); and • earning a return on the collected premium and funds withheld to pay future claims through the adoption of an appropriate
investment strategy.
Insurance therefore serves a critical function of providing customers with the confidence to achieve their business and personal goals through cost-effective risk management. This is achieved within a highly regulated environment, designed to ensure that insurance companies maintain adequate capital to protect the interests of policyholders.
The diagram below presents a simplified overview of the key components of this Financial Report:
Capitalstructure
Debt andequity investors
Note 5
Growthassets and
fixed interest securities
Investmentactivities
Note 3
Other costs of doing business
Tax authorities,service providers,employees, etc.
Note 6 to 8
Underwritingactivities
Note 2
Reinsurers
Policyholders Premium
Reinsurance recoveries
Reinsurance premium
Claims
Debt and equity
Dividends and interest
Taxes
Other costs
Investments
Dividends and interest
Note 1
RRiisskk MMaannaaggeemmeenntt FFrraammeewwoorrkk NNoottee 44
RRiisskk MMaannaaggeemmeenntt FFrraammeewwoorrkk NNoottee 44
Risk management framework Note 4
Risk management framework Note 4
84
1.2 About this report
This Financial Report includes the consolidated financial statements of QBE Insurance Group Limited (the ultimate parent entity or the Company) and its controlled entities (QBE or the Group).
The Financial Report includes the four primary statements, namely the statement of comprehensive income (which comprises profit or loss and other comprehensive income or loss), balance sheet, statement of changes in equity and statement of cash flows as well as associated notes as required by Australian Accounting Standards. Disclosures have been grouped into the following categories in order to assist users in their understanding of the financial statements: 1. Overview contains information that impacts the Financial Report as a whole as well as segment reporting disclosures.2. Underwriting activities brings together results and balance sheet disclosures relevant to the Group’s insurance activities.3. Investment activities includes results and balance sheet disclosures relevant to the Group’s investments.4. Risk management provides commentary on the Group’s exposure to various financial and capital risks, explaining the potential
impact on the results and balance sheet and how the Group manages these risks.5. Capital structure provides information about the debt and equity components of the Group’s capital.6. Tax includes disclosures relating to the Group’s tax expense and balances.7. Group structure provides a summary of the Group’s controlled entities and includes disclosures in relation to transactions
impacting the Group structure.8. Other includes additional disclosures required to comply with Australian Accounting Standards.
Where applicable within each note, disclosures are further analysed as follows:• Overview provides some context to assist users in understanding the disclosures.• Disclosures (both numbers and commentary) provide analysis of balances as required by Australian Accounting Standards. • How we account for the numbers summarises the accounting policies relevant to an understanding of the numbers.• Critical accounting judgements and estimates explains the key estimates and judgements applied by QBE in determining
the numbers.
The notes include information which the directors believe is required to understand the financial statements and is material and relevant to the operations, balance sheet and results of the Group. Information is considered material and relevant if:• the amount in question is significant because of its size or nature;• it is important to assist in understanding the results of the Group;• it helps to explain the impact of significant changes in the Group’s business – for example, significant acquisitions or disposals; or• it relates to an aspect of the Group’s operations that is important to its future performance.
1.2.1 Basis of preparationThis Financial Report is a general purpose financial report which:• has been prepared in accordance with Australian Accounting standards and the Corporations Act 2001;• complies with International Financial Reporting Standards (IFRS) as issued by the International Accounting Standards Board (IASB)
and Interpretations as issued by the IFRS Interpretations Committee (IFRIC);• has been prepared on a historical cost basis as modified by certain exceptions, the most significant of which are the measurement
of investments and derivatives at fair value and the measurement of the net outstanding claims liability at present value;• is presented in US dollars; and• is presented with values rounded to the nearest million dollars or, in certain cases, to the nearest thousand dollars in accordance
with ASIC Corporations (Rounding in Financial/Directors’ Reports) Instrument 2016/191.
New and amended Accounting Standards and Interpretations issued by the AASB that are now effective are detailed in note 8.1.1.
The Group has not adopted any Accounting Standards and Interpretations that have been issued or amended but are not yet effective as listed in note 8.1.2.
The consolidated financial statements incorporate the assets and liabilities of all entities controlled by the Company as at 31 December 2020 and the results for the financial year then ended. In preparing the consolidated financial statements, all transactions between controlled entities are eliminated in full. Where control of an entity commences or ceases during a financial year, the results are included for that part of the year during which control existed. A list of entities controlled by the Company at year end is contained in note 7.3.
Lloyd’s syndicates are accounted for on a proportional basis. The nature of Lloyd’s syndicates is such that, even when one party provides the majority of capital, the syndicate as a whole is not controlled for accounting purposes.
Where necessary, comparative information has been restated to conform to the current year’s disclosures.
QB
E In
suran
ce Gro
up
A
nn
ual R
epo
rt 2020
85O
ther
info
rmatio
n
6
Fin
ancial
Rep
ort
5
Perfo
rman
ce o
verv
iew
1
Op
erating an
d
finan
cial review
2
Go
vern
ance
3
Directo
rs' R
epo
rt
4
Notes to the financial statements continued
FOR THE YEAR ENDED 31 DECEMBER 2020
1.2.2 Critical accounting judgements and estimatesThe preparation of the Group’s consolidated financial statements requires management to make judgements and estimates that affect reported amounts. The diversity and complexity of the Group are evidenced by its international operations and the broad product range as shown in the class of business analysis in note 4.2.
In view of its geographic and product diversity, the Group has developed a centralised risk management and policy framework designed to ensure consistency of approach across a number of operational activities, subject to the specific requirements of local markets, legislation and regulation. Such operational activities include underwriting, claims management, actuarial assessment of the outstanding claims liability and investment management.
Given the centralised approach to many activities and the diversity of products and geographies, sensitivity analyses in respect of critical accounting estimates and judgements are presented at the consolidated Group level in order to provide information and analysis which is meaningful, relevant, reliable and comparable year-on-year. Sensitivity disclosure at business segment or product level would not provide a meaningful overview given the complex interrelationships between the variables underpinning the Group’s operations.
The key areas in which critical estimates and judgements are applied are as follows:• net outstanding claims liability (note 2.3);• liability adequacy test (note 2.5.1);• recoverability of deferred tax assets (note 6.2.1); and• impairment testing of intangible assets (note 7.2.1).
The impacts of COVID-19 on these areas are discussed in note 1.2.3 and in individual notes where appropriate.
1.2.3 COVID-19COVID-19 was declared a pandemic by the World Health Organisation in March 2020. The virus itself, as well as measures to slow its spread, have had a profound impact on the global economy. QBE has considered a broad range of factors to inform an assessment of the impact of the resulting uncertainty and general market volatility on the consolidated financial statements.
While the critical accounting judgements and estimates did not materially change, the impact of COVID-19 resulted in the application of further judgement within those identified areas. Given the evolving and uncertain impact of COVID-19, we anticipate that there are likely to be changes in market conditions in the future and that the impact of these changes will be accounted for in future reporting periods as they arise and/or are able to be reasonably predicted.
Areas which are most significantly impacted by COVID-19 are as follows:• Net discounted central estimate (note 2.3): QBE has recorded net incurred claims (excluding risk margin) of $260 million
resulting from COVID-19 in the year to 31 December 2020. While this estimate has been based on a detailed review of the Group’s exposures, scenario analysis under a variety of macroeconomic and legislative outcomes, consideration of the Group’s reinsurance protections and early indicators from claim payments to date, significant uncertainty remains around potential claims emergence from property business interruption claims, credit exposed classes (i.e. lenders’ mortgage, trade credit, surety and landlords’ insurance) and from certain long-tail classes that may experience heightened claims activity due to increased risk from recessionary and other factors (i.e. casualty, financial lines and workers’ compensation). QBE will continue to closely monitor emerging claims experience, legislative outcomes and wider market developments to ensure that the net discounted central estimate is reflective of the Group’s best estimate of expected future claims.
• Risk margin (note 2.3.3): The Group aims to maintain a probability of adequacy in the range of 87.5% to 92.5% reflecting the level of uncertainty in the net discounted central estimate. In response to the significantly heightened level of uncertainty created by COVID-19 claims as described above, particularly business interruption claims, QBE has increased the risk margin by $300 million which, when combined with the impacts of movements in risk-free rates and foreign exchange rates, resulted in a probability of adequacy at the balance date of 92.5% (2019 90.0%).
• Liability adequacy test (note 2.5.1): This assessment is informed by the Group’s expectation of future net claims including a risk margin and is therefore subject to the same uncertainties summarised above. Future claims assumptions used in the liability adequacy test have been prepared on a basis that is consistent with the COVID-19 assumptions informing the determination of the net discounted central estimate.
• Goodwill impairment testing (note 7.2.1): A detailed impairment test has been completed in respect of the carrying value of QBE’s cash-generating units, which included consideration of the impact of COVID-19. To address the current heightened levels of uncertainty with respect to the future cash flows, the following changes have been reflected in the impairment test: (i) cash flows have been adjusted with reference to scenario-based modelling, taking into account possible impacts of COVID-19 on short to medium-term cash flows; (ii) the pre-tax discount rate includes a temporary risk premium adjustment in the cost of equity assumption; (iii) the terminal value growth assumption has been revised down from 2.5% to 2.3% to reflect QBE’s current view of long-term growth in the United States which is consistent with external benchmarks; and (iv) forecast investment returns have been reassessed to align with current market expectations. Note 7.2.1 details factors impacting the impairment of North American goodwill.
• North American tax group deferred tax asset recoverability (note 6.2.1): QBE’s reassessment of the recoverability of this asset included consideration of the potential impacts of COVID-19. The recoverability assessment has been updated, consistent with the impairment testing completed for the North American cash-generating unit and other entities where relevant.
The Group’s COVID-19 financial impact assessment was not limited to the areas identified above. All material components of the balance sheet were considered in detail, as was the effectiveness of QBE’s risk management framework in responding to both financial and non-financial risks, with no material issues identified.
1. OVERVIEW
86
1.2.4 Foreign currency
Translation of foreign currency transactions and balancesTransactions included in the financial statements of controlled entities are measured using the currency of the primary economic environment in which the entity operates (the functional currency). Foreign currency transactions are translated into functional currencies at the spot rates of exchange applicable at the dates of the transactions. At the balance date, monetary assets and liabilities denominated in foreign currencies are retranslated at the rates of exchange prevailing at that date. Resulting exchange gains and losses are included in profit or loss.
Translation of foreign operationsThe results and balance sheets of all foreign operations that have a functional currency different from the Group’s presentation currency of US dollars are translated into US dollars as follows:• income, expenses and other current period movements in comprehensive income are translated at average rates of exchange; and • balance sheet items are translated at the closing balance date rates of exchange.
On consolidation, exchange differences arising from the translation of the net investment in foreign operations are taken to shareholders’ equity and recognised in other comprehensive income. When a foreign operation is sold in whole or part and capital is repatriated, exchange differences on translation from the entity’s functional currency to the ultimate parent entity’s functional currency of Australian dollars are reclassified out of other comprehensive income and recognised in profit or loss as part of the gain or loss on sale.
Hedging of foreign exchange riskThe Group manages its foreign exchange exposures as part of its foreign currency risk management processes, further information on which is provided in note 4.4.
QBE uses borrowings to mitigate currency risk on translation of net investments in foreign operations to the ultimate parent's functional currency of Australian dollars. QBE does not ordinarily use derivatives to mitigate such risks; however, in periods of extraordinary volatility that are expected to persist for an extended period of time, QBE may elect to utilise derivatives to mitigate currency translation risk to preserve capital.
QBE also uses derivatives to mitigate risk associated with foreign currency transactions and balances.
The Group designates hedge relationships which meet the specified criteria in AASB 9 Financial Instruments as either cash flow hedges or hedges of a net investment in a foreign operation. Further information on the accounting for derivatives and for designated hedge relationships is provided in note 5.6.
Exchange ratesThe principal exchange rates used in the preparation of the financial statements were:
2020 2019
PROFIT OR LOSS BALANCE SHEET PROFIT OR LOSS BALANCE SHEET
A$/US$ 0.688 0.771 0.695 0.702£/US$ 1.283 1.368 1.276 1.325€/US$ 1.140 1.222 1.119 1.122
QB
E In
suran
ce Gro
up
A
nn
ual R
epo
rt 2020
87
Oth
er in
form
ation
6
Fin
ancial
Rep
ort
5
Perfo
rman
ce o
verv
iew
1
Op
erating an
d
finan
cial review
2
Go
vern
ance
3
Directo
rs' R
epo
rt
4
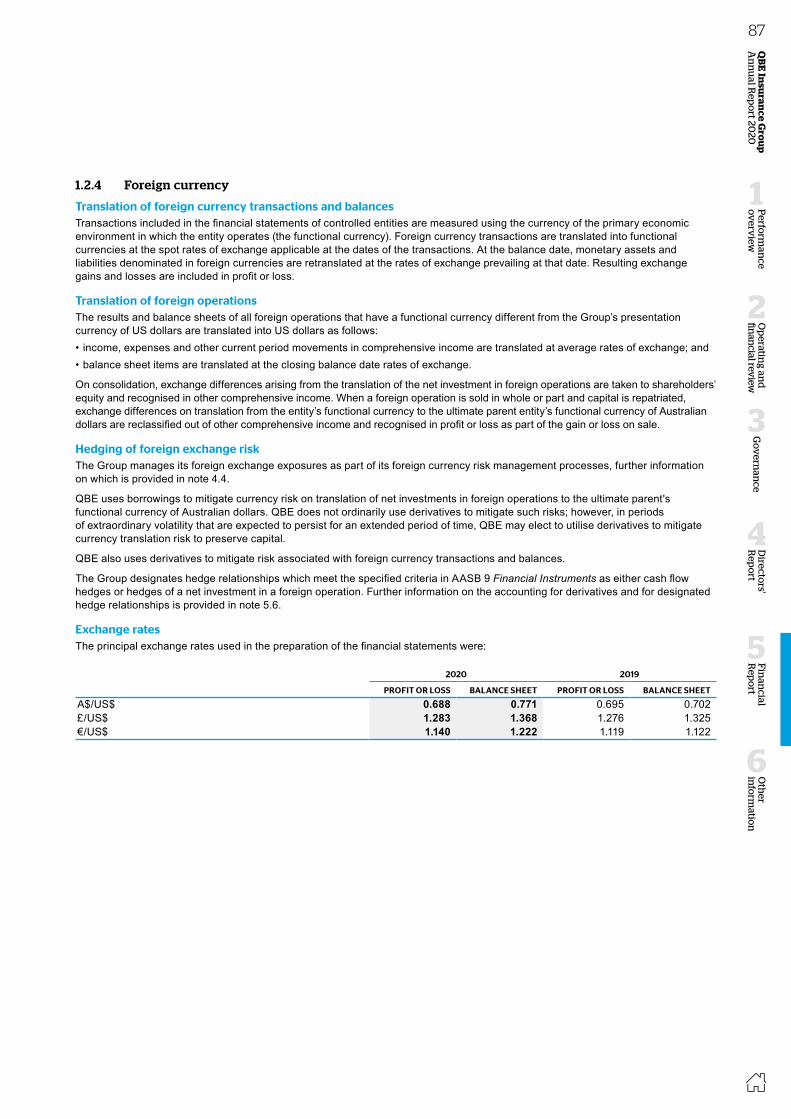
Notes to the financial statements continued
FOR THE YEAR ENDED 31 DECEMBER 2020
1.2.2 Critical accounting judgements and estimatesThe preparation of the Group’s consolidated financial statements requires management to make judgements and estimates that affect reported amounts. The diversity and complexity of the Group are evidenced by its international operations and the broad product range as shown in the class of business analysis in note 4.2.
In view of its geographic and product diversity, the Group has developed a centralised risk management and policy framework designed to ensure consistency of approach across a number of operational activities, subject to the specific requirements of local markets, legislation and regulation. Such operational activities include underwriting, claims management, actuarial assessment of the outstanding claims liability and investment management.
Given the centralised approach to many activities and the diversity of products and geographies, sensitivity analyses in respect of critical accounting estimates and judgements are presented at the consolidated Group level in order to provide information and analysis which is meaningful, relevant, reliable and comparable year-on-year. Sensitivity disclosure at business segment or product level would not provide a meaningful overview given the complex interrelationships between the variables underpinning the Group’s operations.
The key areas in which critical estimates and judgements are applied are as follows:• net outstanding claims liability (note 2.3);• liability adequacy test (note 2.5.1);• recoverability of deferred tax assets (note 6.2.1); and• impairment testing of intangible assets (note 7.2.1).
The impacts of COVID-19 on these areas are discussed in note 1.2.3 and in individual notes where appropriate.
1.2.3 COVID-19COVID-19 was declared a pandemic by the World Health Organisation in March 2020. The virus itself, as well as measures to slow its spread, have had a profound impact on the global economy. QBE has considered a broad range of factors to inform an assessment of the impact of the resulting uncertainty and general market volatility on the consolidated financial statements.
While the critical accounting judgements and estimates did not materially change, the impact of COVID-19 resulted in the application of further judgement within those identified areas. Given the evolving and uncertain impact of COVID-19, we anticipate that there are likely to be changes in market conditions in the future and that the impact of these changes will be accounted for in future reporting periods as they arise and/or are able to be reasonably predicted.
Areas which are most significantly impacted by COVID-19 are as follows:• Net discounted central estimate (note 2.3): QBE has recorded net incurred claims (excluding risk margin) of $260 million
resulting from COVID-19 in the year to 31 December 2020. While this estimate has been based on a detailed review of the Group’s exposures, scenario analysis under a variety of macroeconomic and legislative outcomes, consideration of the Group’s reinsurance protections and early indicators from claim payments to date, significant uncertainty remains around potential claims emergence from property business interruption claims, credit exposed classes (i.e. lenders’ mortgage, trade credit, surety and landlords’ insurance) and from certain long-tail classes that may experience heightened claims activity due to increased risk from recessionary and other factors (i.e. casualty, financial lines and workers’ compensation). QBE will continue to closely monitor emerging claims experience, legislative outcomes and wider market developments to ensure that the net discounted central estimate is reflective of the Group’s best estimate of expected future claims.
• Risk margin (note 2.3.3): The Group aims to maintain a probability of adequacy in the range of 87.5% to 92.5% reflecting the level of uncertainty in the net discounted central estimate. In response to the significantly heightened level of uncertainty created by COVID-19 claims as described above, particularly business interruption claims, QBE has increased the risk margin by $300 million which, when combined with the impacts of movements in risk-free rates and foreign exchange rates, resulted in a probability of adequacy at the balance date of 92.5% (2019 90.0%).
• Liability adequacy test (note 2.5.1): This assessment is informed by the Group’s expectation of future net claims including a risk margin and is therefore subject to the same uncertainties summarised above. Future claims assumptions used in the liability adequacy test have been prepared on a basis that is consistent with the COVID-19 assumptions informing the determination of the net discounted central estimate.
• Goodwill impairment testing (note 7.2.1): A detailed impairment test has been completed in respect of the carrying value of QBE’s cash-generating units, which included consideration of the impact of COVID-19. To address the current heightened levels of uncertainty with respect to the future cash flows, the following changes have been reflected in the impairment test: (i) cash flows have been adjusted with reference to scenario-based modelling, taking into account possible impacts of COVID-19 on short to medium-term cash flows; (ii) the pre-tax discount rate includes a temporary risk premium adjustment in the cost of equity assumption; (iii) the terminal value growth assumption has been revised down from 2.5% to 2.3% to reflect QBE’s current view of long-term growth in the United States which is consistent with external benchmarks; and (iv) forecast investment returns have been reassessed to align with current market expectations. Note 7.2.1 details factors impacting the impairment of North American goodwill.
• North American tax group deferred tax asset recoverability (note 6.2.1): QBE’s reassessment of the recoverability of this asset included consideration of the potential impacts of COVID-19. The recoverability assessment has been updated, consistent with the impairment testing completed for the North American cash-generating unit and other entities where relevant.
The Group’s COVID-19 financial impact assessment was not limited to the areas identified above. All material components of the balance sheet were considered in detail, as was the effectiveness of QBE’s risk management framework in responding to both financial and non-financial risks, with no material issues identified.
1. OVERVIEW
86
1.2.4 Foreign currency
Translation of foreign currency transactions and balancesTransactions included in the financial statements of controlled entities are measured using the currency of the primary economic environment in which the entity operates (the functional currency). Foreign currency transactions are translated into functional currencies at the spot rates of exchange applicable at the dates of the transactions. At the balance date, monetary assets and liabilities denominated in foreign currencies are retranslated at the rates of exchange prevailing at that date. Resulting exchange gains and losses are included in profit or loss.
Translation of foreign operationsThe results and balance sheets of all foreign operations that have a functional currency different from the Group’s presentation currency of US dollars are translated into US dollars as follows:• income, expenses and other current period movements in comprehensive income are translated at average rates of exchange; and • balance sheet items are translated at the closing balance date rates of exchange.
On consolidation, exchange differences arising from the translation of the net investment in foreign operations are taken to shareholders’ equity and recognised in other comprehensive income. When a foreign operation is sold in whole or part and capital is repatriated, exchange differences on translation from the entity’s functional currency to the ultimate parent entity’s functional currency of Australian dollars are reclassified out of other comprehensive income and recognised in profit or loss as part of the gain or loss on sale.
Hedging of foreign exchange riskThe Group manages its foreign exchange exposures as part of its foreign currency risk management processes, further information on which is provided in note 4.4.
QBE uses borrowings to mitigate currency risk on translation of net investments in foreign operations to the ultimate parent's functional currency of Australian dollars. QBE does not ordinarily use derivatives to mitigate such risks; however, in periods of extraordinary volatility that are expected to persist for an extended period of time, QBE may elect to utilise derivatives to mitigate currency translation risk to preserve capital.
QBE also uses derivatives to mitigate risk associated with foreign currency transactions and balances.
The Group designates hedge relationships which meet the specified criteria in AASB 9 Financial Instruments as either cash flow hedges or hedges of a net investment in a foreign operation. Further information on the accounting for derivatives and for designated hedge relationships is provided in note 5.6.
Exchange ratesThe principal exchange rates used in the preparation of the financial statements were:
2020 2019
PROFIT OR LOSS BALANCE SHEET PROFIT OR LOSS BALANCE SHEET
A$/US$ 0.688 0.771 0.695 0.702£/US$ 1.283 1.368 1.276 1.325€/US$ 1.140 1.222 1.119 1.122
QB
E In
suran
ce Gro
up
A
nn
ual R
epo
rt 2020
87O
ther
info
rmatio
n
6
Fin
ancial
Rep
ort
5
Perfo
rman
ce o
verv
iew
1
Op
erating an
d
finan
cial review
2
Go
vern
ance
3
Directo
rs' R
epo
rt
4
Notes to the financial statements continued
FOR THE YEAR ENDED 31 DECEMBER 2020
1.3 Segment information
OverviewInformation is provided by operating segment to assist the understanding of the Group’s performance. The operating segments are consistent with the basis on which information is provided to the Group Executive Committee for measuring performance and determining the allocation of capital, being the basis upon which the Group’s underwriting products and services are managed within the various markets in which QBE operates.
This note presents the results of continuing operations only. The results of discontinued operations are presented in note 7.1.2.
Operating segmentsThe Group’s operating segments are as follows:• North America writes general insurance, reinsurance and Crop business in the United States.• International writes general insurance business in the United Kingdom, Europe and Canada. It also writes general
insurance and reinsurance business through Lloyd’s; worldwide reinsurance business through offices in the United Kingdom, United States, Ireland, Bermuda and mainland Europe; and provides personal and commercial insurance covers in Hong Kong, Singapore, Malaysia and Vietnam.
• Australia Pacific primarily underwrites general insurance risks throughout Australia, New Zealand and the Pacific region, providing all major lines of insurance for personal and commercial risks.
Consistent with information provided to the Group Executive Committee for the current period, certain inward reinsurance business written by North America but managed by International is now reflected in the results of the International segment to drive better end-to-end underwriting, pricing, reserving and performance management discipline. Where material, comparative information in the notes to the financial statements have been restated consistently.
Corporate & Other includes non-operating holding companies that do not form part of the Group’s insurance operations; gains or losses on disposals except those relating to discontinued operations (refer to note 7.1.2); and financing costs and amortisation of any intangibles which are not allocated to a specific operating segment. It also includes consolidation adjustments and internal reinsurance eliminations. Intersegment transactions are priced on an arm’s length basis and are eliminated on consolidation.
1. OVERVIEW
88
2020NORTH AMERICA
US$MINTERNATIONAL
US$M
AUSTRALIA PACIFIC
US$M
TOTAL REPORTABLE
SEGMENTS US$M
CORPORATE & OTHER
US$MTOTAL
US$M
Gross written premium 4,744 5,845 4,079 14,668 (25) 14,643Gross earned premium revenue – external 4,519 5,513 3,984 14,016 (8) 14,008Gross earned premium revenue – internal 1 18 1 20 (20) – Outward reinsurance premium expense (1,200) (765) (360) (2,325) 25 (2,300)Net earned premium 3,320 4,766 3,625 11,711 (3) 11,708Net claims expense (2,974) (3,229) (2,479) (8,682) (252) (8,934)Net commission (480) (874) (534) (1,888) (3) (1,891)Underwriting and other expenses (482) (648) (572) (1,702) (50) (1,752)Underwriting result (616) 15 40 (561) (308) (869)Net investment income (loss) – policyholders’ funds 33 91 31 155 (13) 142Insurance (loss) profit (583) 106 71 (406) (321) (727)Net investment income – shareholders’ funds 33 27 7 67 17 84Financing and other costs (2) (2) (5) (9) (243) (252)Loss on sale of entities and businesses – – – – (2) (2)Share of net loss of associates – – – – (5) (5)Restructuring and related expenses (22) (8) (37) (67) (37) (104)Amortisation and impairment of intangibles – (5) (16) (21) (445) (466)(Loss) profit before income tax from continuing operations (574) 118 20 (436) (1,036) (1,472)Income tax credit (expense) 121 (25) (6) 90 (129) (39)(Loss) profit after income tax from continuing operations (453) 93 14 (346) (1,165) (1,511)Net profit from continuing operations attributable to non-controlling interests – – – – (6) (6)Net (loss) profit after income tax from continuing operations attributable to ordinary equity holders of the Company (453) 93 14 (346) (1,171) (1,517)
QB
E In
suran
ce Gro
up
A
nn
ual R
epo
rt 2020
89
Oth
er in
form
ation
6
Fin
ancial
Rep
ort
5
Perfo
rman
ce o
verv
iew
1
Op
erating an
d
finan
cial review
2
Go
vern
ance
3
Directo
rs' R
epo
rt
4

Notes to the financial statements continued
FOR THE YEAR ENDED 31 DECEMBER 2020
1.3 Segment information
OverviewInformation is provided by operating segment to assist the understanding of the Group’s performance. The operating segments are consistent with the basis on which information is provided to the Group Executive Committee for measuring performance and determining the allocation of capital, being the basis upon which the Group’s underwriting products and services are managed within the various markets in which QBE operates.
This note presents the results of continuing operations only. The results of discontinued operations are presented in note 7.1.2.
Operating segmentsThe Group’s operating segments are as follows:• North America writes general insurance, reinsurance and Crop business in the United States.• International writes general insurance business in the United Kingdom, Europe and Canada. It also writes general
insurance and reinsurance business through Lloyd’s; worldwide reinsurance business through offices in the United Kingdom, United States, Ireland, Bermuda and mainland Europe; and provides personal and commercial insurance covers in Hong Kong, Singapore, Malaysia and Vietnam.
• Australia Pacific primarily underwrites general insurance risks throughout Australia, New Zealand and the Pacific region, providing all major lines of insurance for personal and commercial risks.
Consistent with information provided to the Group Executive Committee for the current period, certain inward reinsurance business written by North America but managed by International is now reflected in the results of the International segment to drive better end-to-end underwriting, pricing, reserving and performance management discipline. Where material, comparative information in the notes to the financial statements have been restated consistently.
Corporate & Other includes non-operating holding companies that do not form part of the Group’s insurance operations; gains or losses on disposals except those relating to discontinued operations (refer to note 7.1.2); and financing costs and amortisation of any intangibles which are not allocated to a specific operating segment. It also includes consolidation adjustments and internal reinsurance eliminations. Intersegment transactions are priced on an arm’s length basis and are eliminated on consolidation.
1. OVERVIEW
88
2020NORTH AMERICA
US$MINTERNATIONAL
US$M
AUSTRALIA PACIFIC
US$M
TOTAL REPORTABLE
SEGMENTS US$M
CORPORATE & OTHER
US$MTOTAL
US$M
Gross written premium 4,744 5,845 4,079 14,668 (25) 14,643Gross earned premium revenue – external 4,519 5,513 3,984 14,016 (8) 14,008Gross earned premium revenue – internal 1 18 1 20 (20) – Outward reinsurance premium expense (1,200) (765) (360) (2,325) 25 (2,300)Net earned premium 3,320 4,766 3,625 11,711 (3) 11,708Net claims expense (2,974) (3,229) (2,479) (8,682) (252) (8,934)Net commission (480) (874) (534) (1,888) (3) (1,891)Underwriting and other expenses (482) (648) (572) (1,702) (50) (1,752)Underwriting result (616) 15 40 (561) (308) (869)Net investment income (loss) – policyholders’ funds 33 91 31 155 (13) 142Insurance (loss) profit (583) 106 71 (406) (321) (727)Net investment income – shareholders’ funds 33 27 7 67 17 84Financing and other costs (2) (2) (5) (9) (243) (252)Loss on sale of entities and businesses – – – – (2) (2)Share of net loss of associates – – – – (5) (5)Restructuring and related expenses (22) (8) (37) (67) (37) (104)Amortisation and impairment of intangibles – (5) (16) (21) (445) (466)(Loss) profit before income tax from continuing operations (574) 118 20 (436) (1,036) (1,472)Income tax credit (expense) 121 (25) (6) 90 (129) (39)(Loss) profit after income tax from continuing operations (453) 93 14 (346) (1,165) (1,511)Net profit from continuing operations attributable to non-controlling interests – – – – (6) (6)Net (loss) profit after income tax from continuing operations attributable to ordinary equity holders of the Company (453) 93 14 (346) (1,171) (1,517)
QB
E In
suran
ce Gro
up
A
nn
ual R
epo
rt 2020
89O
ther
info
rmatio
n
6
Fin
ancial
Rep
ort
5
Perfo
rman
ce o
verv
iew
1
Op
erating an
d
finan
cial review
2
Go
vern
ance
3
Directo
rs' R
epo
rt
4

Notes to the financial statements continued
FOR THE YEAR ENDED 31 DECEMBER 2020
2019NORTH AMERICA
US$MINTERNATIONAL
US$M
AUSTRALIA PACIFIC
US$M
TOTAL REPORTABLE
SEGMENTS US$M
CORPORATE & OTHER
US$MTOTAL
US$M
Gross written premium 4,361 5,200 3,920 13,481 (39) 13,442Gross earned premium revenue – external 4,375 4,999 3,883 13,257 – 13,257Gross earned premium revenue – internal – 11 2 13 (13) – Outward reinsurance premium expense (683) (671) (317) (1,671) 23 (1,648)Net earned premium 3,692 4,339 3,568 11,599 10 11,609Net claims expense (2,929) (2,979) (2,223) (8,131) 29 (8,102)Net commission (536) (752) (526) (1,814) (5) (1,819)Underwriting and other expenses (488) (652) (519) (1,659) (31) (1,690)Underwriting result (261) (44) 300 (5) 3 (2)Net investment income – policyholders’ funds 124 324 187 635 14 649Insurance (loss) profit (137) 280 487 630 17 647Net investment income – shareholders’ funds 149 137 109 395 (8) 387Financing and other costs (3) (2) (5) (10) (247) (257)Loss on sale of entities and businesses – – – – (8) (8)Share of net loss of associates – – – – (3) (3)Restructuring and related expenses (4) (6) (30) (40) (3) (43)Amortisation and impairment of intangibles – – (31) (31) (20) (51)Profit (loss) before income tax from continuing operations 5 409 530 944 (272) 672Income tax (expense) credit (1) (86) (164) (251) 147 (104)Net profit (loss) after income tax from continuing operations 4 323 366 693 (125) 568Net loss from continuing operations attributable to non-controlling interests – – – – 3 3Net profit (loss) after income tax from continuing operations attributable to ordinary equity holders of the Company 4 323 366 693 (122) 571
Geographical analysisNorth America is defined by reference to its geographical location and, as such, satisfies the requirements of a geographical analysis as well as an operating segment analysis.
Gross earned premium revenue – external for Australia, the ultimate parent entity’s country of domicile, was $3,573 million (2019 $3,487 million). No other country within International or Australia Pacific is individually material in this respect.
Product analysisQBE does not collect group-wide revenue information by product and the cost to develop this information would be excessive. Gross earned premium revenue by class of business is disclosed in note 4.2.
1. OVERVIEW
90
2. UNDERWRITING ACTIVITIES
OverviewThis section provides analysis and commentary on the Group’s underwriting activities. Underwriting, in simple terms, is the agreement by the insurer to assume insurance risk in return for a premium paid by the insured. The underwriter assesses the quality of the risk and prices it accordingly.
2.1 Revenue
OverviewRevenue mainly comprises premiums charged for providing insurance coverage. Premiums are classified as:• direct, being those paid by the policyholder to the insurer;• facultative, being reinsurance of an individual (usually significant) risk by a ceding insurer or reinsurer; or• inward reinsurance, being coverage provided to an insurer or reinsurer in relation to a specified grouping of policies
or risks.
Other sources of revenue include amounts recovered from reinsurers under the terms of reinsurance contracts, commission income from reinsurers and salvage or third-party recoveries.
2020 2019NOTE US$M US$M
Gross earned premium revenueDirect and facultative 12,634 12,146Inward reinsurance 1,374 1,111
14,008 13,257Other revenueReinsurance and other recoveries revenue 2.2 3,366 1,574Reinsurance commission revenue 440 359
17,814 15,190
How we account for the numbers
Premium revenuePremium written comprises amounts charged to policyholders, excluding taxes collected on behalf of third parties. Premium is recognised as revenue in profit or loss based on the incidence of the pattern of risk associated with the insurance policy. The earned portion of premium on unclosed business, being business that is written at the balance date but for which detailed policy information is not yet booked, is also included in premium revenue.
Reinsurance and other recoveriesReinsurance and other recoveries on paid claims, reported claims not yet paid, claims incurred but not reported (IBNR) and claims incurred but not enough reported (IBNER) are recognised as revenue. Recoveries are measured as the present value of the expected future receipts.
QB
E In
suran
ce Gro
up
A
nn
ual R
epo
rt 2020
91
Oth
er in
form
ation
6
Fin
ancial
Rep
ort
5
Perfo
rman
ce o
verv
iew
1
Op
erating an
d
finan
cial review
2
Go
vern
ance
3
Directo
rs' R
epo
rt
4
Notes to the financial statements continued
FOR THE YEAR ENDED 31 DECEMBER 2020
2019NORTH AMERICA
US$MINTERNATIONAL
US$M
AUSTRALIA PACIFIC
US$M
TOTAL REPORTABLE
SEGMENTS US$M
CORPORATE & OTHER
US$MTOTAL
US$M
Gross written premium 4,361 5,200 3,920 13,481 (39) 13,442Gross earned premium revenue – external 4,375 4,999 3,883 13,257 – 13,257Gross earned premium revenue – internal – 11 2 13 (13) – Outward reinsurance premium expense (683) (671) (317) (1,671) 23 (1,648)Net earned premium 3,692 4,339 3,568 11,599 10 11,609Net claims expense (2,929) (2,979) (2,223) (8,131) 29 (8,102)Net commission (536) (752) (526) (1,814) (5) (1,819)Underwriting and other expenses (488) (652) (519) (1,659) (31) (1,690)Underwriting result (261) (44) 300 (5) 3 (2)Net investment income – policyholders’ funds 124 324 187 635 14 649Insurance (loss) profit (137) 280 487 630 17 647Net investment income – shareholders’ funds 149 137 109 395 (8) 387Financing and other costs (3) (2) (5) (10) (247) (257)Loss on sale of entities and businesses – – – – (8) (8)Share of net loss of associates – – – – (3) (3)Restructuring and related expenses (4) (6) (30) (40) (3) (43)Amortisation and impairment of intangibles – – (31) (31) (20) (51)Profit (loss) before income tax from continuing operations 5 409 530 944 (272) 672Income tax (expense) credit (1) (86) (164) (251) 147 (104)Net profit (loss) after income tax from continuing operations 4 323 366 693 (125) 568Net loss from continuing operations attributable to non-controlling interests – – – – 3 3Net profit (loss) after income tax from continuing operations attributable to ordinary equity holders of the Company 4 323 366 693 (122) 571
Geographical analysisNorth America is defined by reference to its geographical location and, as such, satisfies the requirements of a geographical analysis as well as an operating segment analysis.
Gross earned premium revenue – external for Australia, the ultimate parent entity’s country of domicile, was $3,573 million (2019 $3,487 million). No other country within International or Australia Pacific is individually material in this respect.
Product analysisQBE does not collect group-wide revenue information by product and the cost to develop this information would be excessive. Gross earned premium revenue by class of business is disclosed in note 4.2.
1. OVERVIEW
90
2. UNDERWRITING ACTIVITIES
OverviewThis section provides analysis and commentary on the Group’s underwriting activities. Underwriting, in simple terms, is the agreement by the insurer to assume insurance risk in return for a premium paid by the insured. The underwriter assesses the quality of the risk and prices it accordingly.
2.1 Revenue
OverviewRevenue mainly comprises premiums charged for providing insurance coverage. Premiums are classified as:• direct, being those paid by the policyholder to the insurer;• facultative, being reinsurance of an individual (usually significant) risk by a ceding insurer or reinsurer; or• inward reinsurance, being coverage provided to an insurer or reinsurer in relation to a specified grouping of policies
or risks.
Other sources of revenue include amounts recovered from reinsurers under the terms of reinsurance contracts, commission income from reinsurers and salvage or third-party recoveries.
2020 2019NOTE US$M US$M
Gross earned premium revenueDirect and facultative 12,634 12,146Inward reinsurance 1,374 1,111
14,008 13,257Other revenueReinsurance and other recoveries revenue 2.2 3,366 1,574Reinsurance commission revenue 440 359
17,814 15,190
How we account for the numbers
Premium revenuePremium written comprises amounts charged to policyholders, excluding taxes collected on behalf of third parties. Premium is recognised as revenue in profit or loss based on the incidence of the pattern of risk associated with the insurance policy. The earned portion of premium on unclosed business, being business that is written at the balance date but for which detailed policy information is not yet booked, is also included in premium revenue.
Reinsurance and other recoveriesReinsurance and other recoveries on paid claims, reported claims not yet paid, claims incurred but not reported (IBNR) and claims incurred but not enough reported (IBNER) are recognised as revenue. Recoveries are measured as the present value of the expected future receipts.
QB
E In
suran
ce Gro
up
A
nn
ual R
epo
rt 2020
91O
ther
info
rmatio
n
6
Fin
ancial
Rep
ort
5
Perfo
rman
ce o
verv
iew
1
Op
erating an
d
finan
cial review
2
Go
vern
ance
3
Directo
rs' R
epo
rt
4

Notes to the financial statements continued
FOR THE YEAR ENDED 31 DECEMBER 2020
2.2 Net claims expense
OverviewThe largest expense for an insurance company is net claims expense, which is the difference between the net outstanding claims liability (as described in note 2.3) at the beginning and the end of the financial year plus any claims payments made net of reinsurance and other recoveries received during the financial year.
2020 2019NOTE US$M US$M
Gross claims expenseDirect and facultative 11,144 8,881Inward reinsurance 1,156 795
12,300 9,676Reinsurance and other recoveries revenueDirect and facultative 3,217 1,517Inward reinsurance 149 57
2.1 3,366 1,574Net claims expense 8,934 8,102Analysed as follows:Movement in net discounted central estimate 2.4.2 8,590 8,125Movement in risk margin 2.3.3 344 (23)Net claims expense 8,934 8,102
2.3 Net outstanding claims liability
OverviewThe net outstanding claims liability comprises the elements described below: • the gross central estimate (note 2.3.1). This is the provision for expected future claims payments and includes
claims reported but not yet paid, IBNR, IBNER and estimated claims handling costs; less • reinsurance and other recoveries on outstanding claims (note 2.3.2). Insurance companies may elect to purchase
reinsurance cover to manage their exposure to any one claim or series of claims. When an insurance company incurs a claim as a result of an insured loss, it may be able to recover some of that claim from reinsurance. An insurer may also be entitled to non-reinsurance recoveries under the insurance contract such as salvage, subrogation and sharing arrangements with other insurers; less
• an amount to reflect the discount to present value using risk‑free rates of return. The net central estimate is discounted to present value recognising that the claim and/or recovery may not be settled for some time. The weighted average risk-free rate for each operating segment and for the consolidated Group are summarised in note 2.3.4; plus
• a risk margin (note 2.3.3). A risk margin is added to reflect the inherent uncertainty in the net discounted central estimate of outstanding claims.
2020 2019NOTE US$M US$M
Gross discounted central estimate 2.3.1 22,324 18,779Risk margin 2.3.3 1,537 1,136Gross outstanding claims 23,861 19,915Reinsurance and other recoveries on outstanding claims 2.3.2 (6,527) (5,104)Net outstanding claims 17,334 14,811
2. UNDERWRITING ACTIVITIES
92
The table below analyses the movement in the net outstanding claims liability, showing separately the movement in the gross liability and the impact of reinsurance:
2020 2019
GROSS REINSURANCE NET GROSS REINSURANCE NETNOTE US$M US$M US$M US$M US$M US$M
At 1 January 19,915 (5,104) 14,811 19,579 (5,551) 14,028Claims expense – current accident year 2.4.2 10,947 (3,099) 7,848 8,698 (973) 7,725Claims expense – prior accident years 2.4.2 1,009 (267) 742 1,001 (601) 400Movement in risk margin 2.3.3 344 – 344 (23) – (23)Incurred claims recognised in profit or loss from continuing operations 2.2 12,300 (3,366) 8,934 9,676 (1,574) 8,102Claims payments (9,254) 2,079 (7,175) (9,290) 1,824 (7,466)Foreign exchange 900 (136) 764 (50) 197 147At 31 December 23,861 (6,527) 17,334 19,915 (5,104) 14,811
2.3.1 Gross discounted central estimate
2020 2019NOTE US$M US$M
Gross undiscounted central estimate excluding claims settlement costs 22,169 19,202Claims settlement costs 447 369Gross undiscounted central estimate 22,616 19,571Discount to present value (292) (792)Gross discounted central estimate 2.3 22,324 18,779Payable within 12 months 7,777 6,609Payable in greater than 12 months 14,547 12,170Gross discounted central estimate 2.3 22,324 18,779
How we account for the numbersThe gross discounted central estimate is the present value of the expected future payments for claims incurred and includes reported but unpaid claims, IBNR, IBNER and claims handling costs. The central estimate is determined by the Group Chief Actuary, supported by a team of actuaries in each of the Group’s divisions. The valuation process is performed quarterly and, on at least a semi-annual basis, includes extensive consultation with claims and underwriting staff as well as senior management. The central estimate of outstanding claims is also subject to annual comprehensive independent actuarial review. The risk management procedures related to the actuarial function are explained in note 4.2.
QB
E In
suran
ce Gro
up
A
nn
ual R
epo
rt 2020
93
Oth
er in
form
ation
6
Fin
ancial
Rep
ort
5
Perfo
rman
ce o
verv
iew
1
Op
erating an
d
finan
cial review
2
Go
vern
ance
3
Directo
rs' R
epo
rt
4
Notes to the financial statements continued
FOR THE YEAR ENDED 31 DECEMBER 2020
2.2 Net claims expense
OverviewThe largest expense for an insurance company is net claims expense, which is the difference between the net outstanding claims liability (as described in note 2.3) at the beginning and the end of the financial year plus any claims payments made net of reinsurance and other recoveries received during the financial year.
2020 2019NOTE US$M US$M
Gross claims expenseDirect and facultative 11,144 8,881Inward reinsurance 1,156 795
12,300 9,676Reinsurance and other recoveries revenueDirect and facultative 3,217 1,517Inward reinsurance 149 57
2.1 3,366 1,574Net claims expense 8,934 8,102Analysed as follows:Movement in net discounted central estimate 2.4.2 8,590 8,125Movement in risk margin 2.3.3 344 (23)Net claims expense 8,934 8,102
2.3 Net outstanding claims liability
OverviewThe net outstanding claims liability comprises the elements described below: • the gross central estimate (note 2.3.1). This is the provision for expected future claims payments and includes
claims reported but not yet paid, IBNR, IBNER and estimated claims handling costs; less • reinsurance and other recoveries on outstanding claims (note 2.3.2). Insurance companies may elect to purchase
reinsurance cover to manage their exposure to any one claim or series of claims. When an insurance company incurs a claim as a result of an insured loss, it may be able to recover some of that claim from reinsurance. An insurer may also be entitled to non-reinsurance recoveries under the insurance contract such as salvage, subrogation and sharing arrangements with other insurers; less
• an amount to reflect the discount to present value using risk‑free rates of return. The net central estimate is discounted to present value recognising that the claim and/or recovery may not be settled for some time. The weighted average risk-free rate for each operating segment and for the consolidated Group are summarised in note 2.3.4; plus
• a risk margin (note 2.3.3). A risk margin is added to reflect the inherent uncertainty in the net discounted central estimate of outstanding claims.
2020 2019NOTE US$M US$M
Gross discounted central estimate 2.3.1 22,324 18,779Risk margin 2.3.3 1,537 1,136Gross outstanding claims 23,861 19,915Reinsurance and other recoveries on outstanding claims 2.3.2 (6,527) (5,104)Net outstanding claims 17,334 14,811
2. UNDERWRITING ACTIVITIES
92
The table below analyses the movement in the net outstanding claims liability, showing separately the movement in the gross liability and the impact of reinsurance:
2020 2019
GROSS REINSURANCE NET GROSS REINSURANCE NETNOTE US$M US$M US$M US$M US$M US$M
At 1 January 19,915 (5,104) 14,811 19,579 (5,551) 14,028Claims expense – current accident year 2.4.2 10,947 (3,099) 7,848 8,698 (973) 7,725Claims expense – prior accident years 2.4.2 1,009 (267) 742 1,001 (601) 400Movement in risk margin 2.3.3 344 – 344 (23) – (23)Incurred claims recognised in profit or loss from continuing operations 2.2 12,300 (3,366) 8,934 9,676 (1,574) 8,102Claims payments (9,254) 2,079 (7,175) (9,290) 1,824 (7,466)Foreign exchange 900 (136) 764 (50) 197 147At 31 December 23,861 (6,527) 17,334 19,915 (5,104) 14,811
2.3.1 Gross discounted central estimate
2020 2019NOTE US$M US$M
Gross undiscounted central estimate excluding claims settlement costs 22,169 19,202Claims settlement costs 447 369Gross undiscounted central estimate 22,616 19,571Discount to present value (292) (792)Gross discounted central estimate 2.3 22,324 18,779Payable within 12 months 7,777 6,609Payable in greater than 12 months 14,547 12,170Gross discounted central estimate 2.3 22,324 18,779
How we account for the numbersThe gross discounted central estimate is the present value of the expected future payments for claims incurred and includes reported but unpaid claims, IBNR, IBNER and claims handling costs. The central estimate is determined by the Group Chief Actuary, supported by a team of actuaries in each of the Group’s divisions. The valuation process is performed quarterly and, on at least a semi-annual basis, includes extensive consultation with claims and underwriting staff as well as senior management. The central estimate of outstanding claims is also subject to annual comprehensive independent actuarial review. The risk management procedures related to the actuarial function are explained in note 4.2.
QB
E In
suran
ce Gro
up
A
nn
ual R
epo
rt 2020
93O
ther
info
rmatio
n
6
Fin
ancial
Rep
ort
5
Perfo
rman
ce o
verv
iew
1
Op
erating an
d
finan
cial review
2
Go
vern
ance
3
Directo
rs' R
epo
rt
4
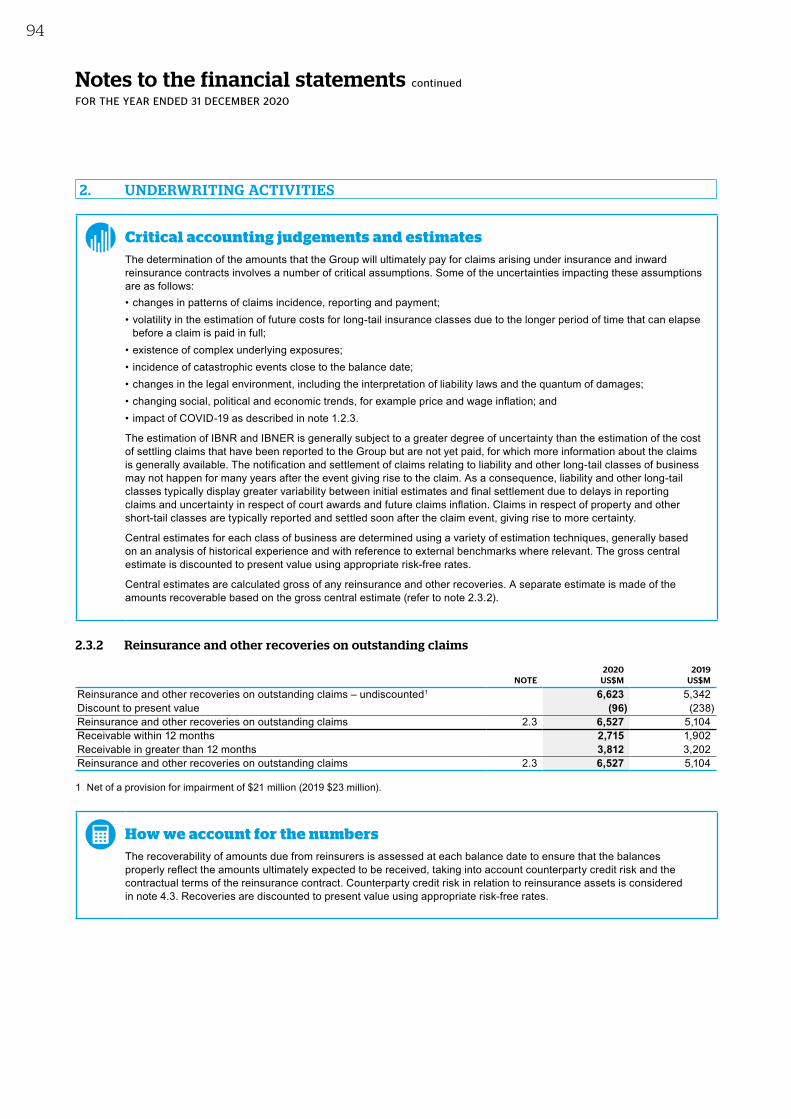
Notes to the financial statements continued
FOR THE YEAR ENDED 31 DECEMBER 2020
Critical accounting judgements and estimatesThe determination of the amounts that the Group will ultimately pay for claims arising under insurance and inward reinsurance contracts involves a number of critical assumptions. Some of the uncertainties impacting these assumptions are as follows:• changes in patterns of claims incidence, reporting and payment;• volatility in the estimation of future costs for long-tail insurance classes due to the longer period of time that can elapse
before a claim is paid in full;• existence of complex underlying exposures;• incidence of catastrophic events close to the balance date;• changes in the legal environment, including the interpretation of liability laws and the quantum of damages; • changing social, political and economic trends, for example price and wage inflation; and• impact of COVID-19 as described in note 1.2.3.
The estimation of IBNR and IBNER is generally subject to a greater degree of uncertainty than the estimation of the cost of settling claims that have been reported to the Group but are not yet paid, for which more information about the claims is generally available. The notification and settlement of claims relating to liability and other long-tail classes of business may not happen for many years after the event giving rise to the claim. As a consequence, liability and other long-tail classes typically display greater variability between initial estimates and final settlement due to delays in reporting claims and uncertainty in respect of court awards and future claims inflation. Claims in respect of property and other short-tail classes are typically reported and settled soon after the claim event, giving rise to more certainty.
Central estimates for each class of business are determined using a variety of estimation techniques, generally based on an analysis of historical experience and with reference to external benchmarks where relevant. The gross central estimate is discounted to present value using appropriate risk-free rates.
Central estimates are calculated gross of any reinsurance and other recoveries. A separate estimate is made of the amounts recoverable based on the gross central estimate (refer to note 2.3.2).
2.3.2 Reinsurance and other recoveries on outstanding claims
2020 2019NOTE US$M US$M
Reinsurance and other recoveries on outstanding claims – undiscounted1 6,623 5,342Discount to present value (96) (238)Reinsurance and other recoveries on outstanding claims 2.3 6,527 5,104Receivable within 12 months 2,715 1,902Receivable in greater than 12 months 3,812 3,202Reinsurance and other recoveries on outstanding claims 2.3 6,527 5,104
1 Net of a provision for impairment of $21 million (2019 $23 million).
How we account for the numbersThe recoverability of amounts due from reinsurers is assessed at each balance date to ensure that the balances properly reflect the amounts ultimately expected to be received, taking into account counterparty credit risk and the contractual terms of the reinsurance contract. Counterparty credit risk in relation to reinsurance assets is considered in note 4.3. Recoveries are discounted to present value using appropriate risk-free rates.
2. UNDERWRITING ACTIVITIES
94
2.3.3 Risk margin
OverviewA risk margin is determined by the Board to reflect the inherent uncertainty in the net discounted central estimate.
The risk margin and the net discounted central estimate are key inputs in the determination of the probability of adequacy, which is a statistical measure of the relative adequacy of the outstanding claims liability to ultimately be able to pay claims. For example, a 90% probability of adequacy indicates that the outstanding claims liability is expected to be adequate nine years in 10.
2020 2019
Risk margin US$M 1,537 1,136 Risk margin as a percentage of the net discounted central estimate % 9.7 8.3 Probability of adequacy % 92.5 90.0
Excluding the impact of foreign exchange which increased the risk margin by $57 million (2019 $1 million), the net movement in profit or loss was a charge of $344 million (2019 $23 million release). The resulting probability of adequacy was 92.5% (2019 90.0%). Net loss after tax would have reduced by $125 million, at the Group’s prima facie income tax rate of 30%, if the probability of adequacy was maintained at 90.0%.
The increase in risk margin was mainly in response to the uncertainty created by COVID-19. Refer to note 1.2.3.
How we account for the numbersAASB 1023 General Insurance Contracts requires an entity to adopt an appropriate risk margin. The resulting probability of adequacy is not of itself an accounting policy as defined by AASB 108 Accounting Policies, Changes in Accounting Estimates and Errors.
QBE reviews a number of factors when determining the appropriate risk margin, including any changes in the level of uncertainty in the net discounted central estimate, the resulting probability of adequacy and the risk margin as a percentage of the net discounted central estimate. The Group aims to maintain a probability of adequacy in the range of 87.5% to 92.5%.
Critical accounting judgements and estimatesThe risk margin is determined by the Board and is held to mitigate the potential for uncertainty in the net discounted central estimate. The determination of the appropriate level of risk margin takes into account similar factors to those used to determine the central estimate, such as: • mix of business, in particular the mix of short-tail and long-tail business and the overall weighted average term
to settlement; and • the level of uncertainty in the central estimate due to estimation error, data quality, variability of key inflation
assumptions and possible economic and legislative changes.
The variability by class of business is measured using techniques that determine a range of possible outcomes of ultimate payments and assign a likelihood to outcomes at different levels. These techniques generally use standard statistical distributions, and the measure of variability is referred to as the coefficient of variation.
The appropriate risk margin for two or more classes of business or for two or more geographic locations combined is likely to be less than the sum of the risk margins for the individual classes, reflecting the benefit of diversification in general insurance, but is not determined by reference to a fixed probability of adequacy. The statistical measure used to determine diversification is called the correlation; the higher the correlation between two classes of business, the more likely it is that a negative outcome in one class will correspond to a negative outcome in the other class. For example, higher correlation exists between classes of business affected by court cases involving bodily injury claims such as motor third-party liability, workers’ compensation and public liability, particularly in the same jurisdiction.
The probability of adequacy for the Group is determined by analysing the variability of each class of business and the correlation between classes of business and divisions. Correlations are determined for aggregations of classes of business, where appropriate, at the divisional level. The correlations adopted by the Group are generally derived from industry analysis, the Group’s historical experience and the judgement of experienced and qualified actuaries.
QB
E In
suran
ce Gro
up
A
nn
ual R
epo
rt 2020
95
Oth
er in
form
ation
6
Fin
ancial
Rep
ort
5
Perfo
rman
ce o
verv
iew
1
Op
erating an
d
finan
cial review
2
Go
vern
ance
3
Directo
rs' R
epo
rt
4
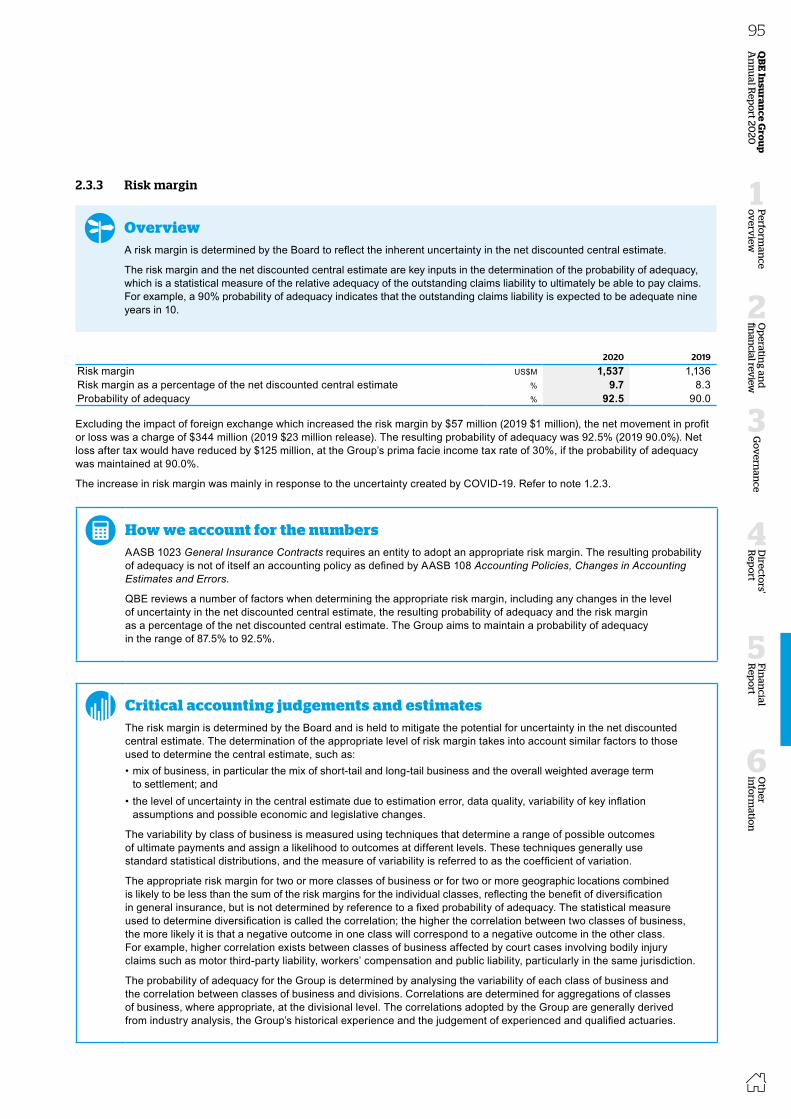
Notes to the financial statements continued
FOR THE YEAR ENDED 31 DECEMBER 2020
Critical accounting judgements and estimatesThe determination of the amounts that the Group will ultimately pay for claims arising under insurance and inward reinsurance contracts involves a number of critical assumptions. Some of the uncertainties impacting these assumptions are as follows:• changes in patterns of claims incidence, reporting and payment;• volatility in the estimation of future costs for long-tail insurance classes due to the longer period of time that can elapse
before a claim is paid in full;• existence of complex underlying exposures;• incidence of catastrophic events close to the balance date;• changes in the legal environment, including the interpretation of liability laws and the quantum of damages; • changing social, political and economic trends, for example price and wage inflation; and• impact of COVID-19 as described in note 1.2.3.
The estimation of IBNR and IBNER is generally subject to a greater degree of uncertainty than the estimation of the cost of settling claims that have been reported to the Group but are not yet paid, for which more information about the claims is generally available. The notification and settlement of claims relating to liability and other long-tail classes of business may not happen for many years after the event giving rise to the claim. As a consequence, liability and other long-tail classes typically display greater variability between initial estimates and final settlement due to delays in reporting claims and uncertainty in respect of court awards and future claims inflation. Claims in respect of property and other short-tail classes are typically reported and settled soon after the claim event, giving rise to more certainty.
Central estimates for each class of business are determined using a variety of estimation techniques, generally based on an analysis of historical experience and with reference to external benchmarks where relevant. The gross central estimate is discounted to present value using appropriate risk-free rates.
Central estimates are calculated gross of any reinsurance and other recoveries. A separate estimate is made of the amounts recoverable based on the gross central estimate (refer to note 2.3.2).
2.3.2 Reinsurance and other recoveries on outstanding claims
2020 2019NOTE US$M US$M
Reinsurance and other recoveries on outstanding claims – undiscounted1 6,623 5,342Discount to present value (96) (238)Reinsurance and other recoveries on outstanding claims 2.3 6,527 5,104Receivable within 12 months 2,715 1,902Receivable in greater than 12 months 3,812 3,202Reinsurance and other recoveries on outstanding claims 2.3 6,527 5,104
1 Net of a provision for impairment of $21 million (2019 $23 million).
How we account for the numbersThe recoverability of amounts due from reinsurers is assessed at each balance date to ensure that the balances properly reflect the amounts ultimately expected to be received, taking into account counterparty credit risk and the contractual terms of the reinsurance contract. Counterparty credit risk in relation to reinsurance assets is considered in note 4.3. Recoveries are discounted to present value using appropriate risk-free rates.
2. UNDERWRITING ACTIVITIES
94
2.3.3 Risk margin
OverviewA risk margin is determined by the Board to reflect the inherent uncertainty in the net discounted central estimate.
The risk margin and the net discounted central estimate are key inputs in the determination of the probability of adequacy, which is a statistical measure of the relative adequacy of the outstanding claims liability to ultimately be able to pay claims. For example, a 90% probability of adequacy indicates that the outstanding claims liability is expected to be adequate nine years in 10.
2020 2019
Risk margin US$M 1,537 1,136 Risk margin as a percentage of the net discounted central estimate % 9.7 8.3 Probability of adequacy % 92.5 90.0
Excluding the impact of foreign exchange which increased the risk margin by $57 million (2019 $1 million), the net movement in profit or loss was a charge of $344 million (2019 $23 million release). The resulting probability of adequacy was 92.5% (2019 90.0%). Net loss after tax would have reduced by $125 million, at the Group’s prima facie income tax rate of 30%, if the probability of adequacy was maintained at 90.0%.
The increase in risk margin was mainly in response to the uncertainty created by COVID-19. Refer to note 1.2.3.
How we account for the numbersAASB 1023 General Insurance Contracts requires an entity to adopt an appropriate risk margin. The resulting probability of adequacy is not of itself an accounting policy as defined by AASB 108 Accounting Policies, Changes in Accounting Estimates and Errors.
QBE reviews a number of factors when determining the appropriate risk margin, including any changes in the level of uncertainty in the net discounted central estimate, the resulting probability of adequacy and the risk margin as a percentage of the net discounted central estimate. The Group aims to maintain a probability of adequacy in the range of 87.5% to 92.5%.
Critical accounting judgements and estimatesThe risk margin is determined by the Board and is held to mitigate the potential for uncertainty in the net discounted central estimate. The determination of the appropriate level of risk margin takes into account similar factors to those used to determine the central estimate, such as: • mix of business, in particular the mix of short-tail and long-tail business and the overall weighted average term
to settlement; and • the level of uncertainty in the central estimate due to estimation error, data quality, variability of key inflation
assumptions and possible economic and legislative changes.
The variability by class of business is measured using techniques that determine a range of possible outcomes of ultimate payments and assign a likelihood to outcomes at different levels. These techniques generally use standard statistical distributions, and the measure of variability is referred to as the coefficient of variation.
The appropriate risk margin for two or more classes of business or for two or more geographic locations combined is likely to be less than the sum of the risk margins for the individual classes, reflecting the benefit of diversification in general insurance, but is not determined by reference to a fixed probability of adequacy. The statistical measure used to determine diversification is called the correlation; the higher the correlation between two classes of business, the more likely it is that a negative outcome in one class will correspond to a negative outcome in the other class. For example, higher correlation exists between classes of business affected by court cases involving bodily injury claims such as motor third-party liability, workers’ compensation and public liability, particularly in the same jurisdiction.
The probability of adequacy for the Group is determined by analysing the variability of each class of business and the correlation between classes of business and divisions. Correlations are determined for aggregations of classes of business, where appropriate, at the divisional level. The correlations adopted by the Group are generally derived from industry analysis, the Group’s historical experience and the judgement of experienced and qualified actuaries.
QB
E In
suran
ce Gro
up
A
nn
ual R
epo
rt 2020
95O
ther
info
rmatio
n
6
Fin
ancial
Rep
ort
5
Perfo
rman
ce o
verv
iew
1
Op
erating an
d
finan
cial review
2
Go
vern
ance
3
Directo
rs' R
epo
rt
4
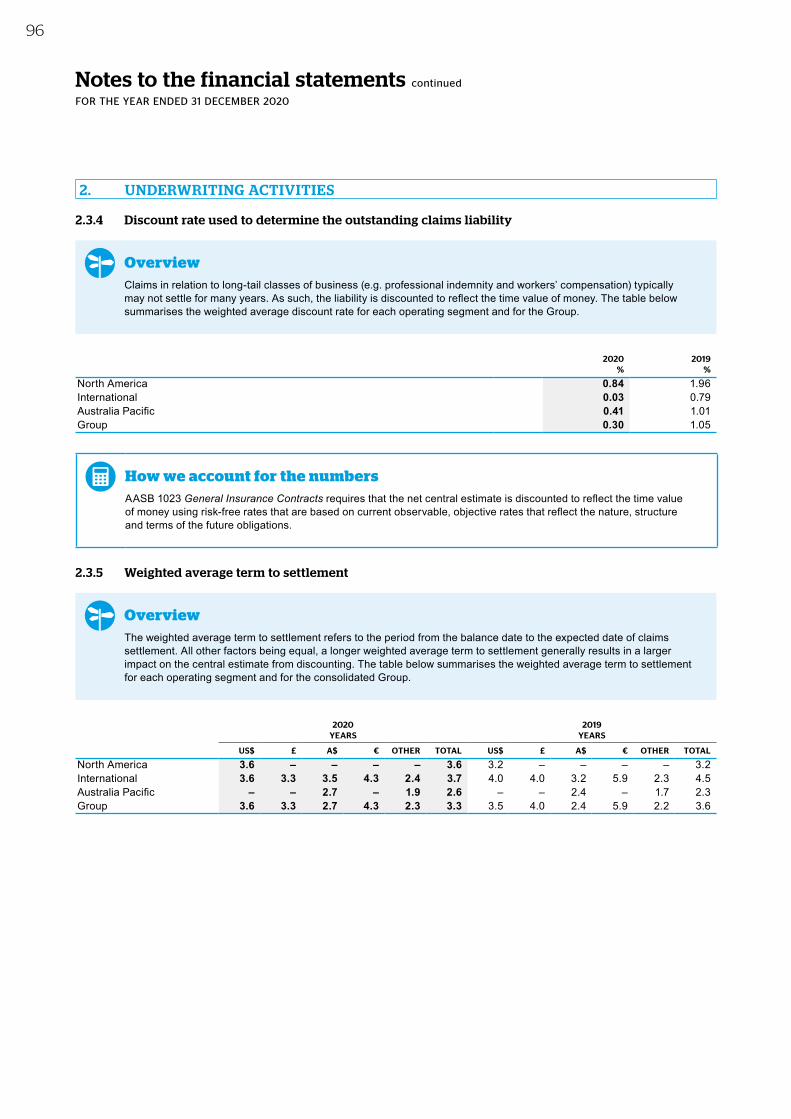
Notes to the financial statements continued
FOR THE YEAR ENDED 31 DECEMBER 2020
2.3.4 Discount rate used to determine the outstanding claims liability
OverviewClaims in relation to long-tail classes of business (e.g. professional indemnity and workers’ compensation) typically may not settle for many years. As such, the liability is discounted to reflect the time value of money. The table below summarises the weighted average discount rate for each operating segment and for the Group.
2020 2019% %
North America 0.84 1.96International 0.03 0.79Australia Pacific 0.41 1.01Group 0.30 1.05
How we account for the numbersAASB 1023 General Insurance Contracts requires that the net central estimate is discounted to reflect the time value of money using risk-free rates that are based on current observable, objective rates that reflect the nature, structure and terms of the future obligations.
2.3.5 Weighted average term to settlement
OverviewThe weighted average term to settlement refers to the period from the balance date to the expected date of claims settlement. All other factors being equal, a longer weighted average term to settlement generally results in a larger impact on the central estimate from discounting. The table below summarises the weighted average term to settlement for each operating segment and for the consolidated Group.
2020 2019YEARS YEARS
US$ £ A$ € OTHER TOTAL US$ £ A$ € OTHER TOTAL
North America 3.6 – – – – 3.6 3.2 – – – – 3.2International 3.6 3.3 3.5 4.3 2.4 3.7 4.0 4.0 3.2 5.9 2.3 4.5Australia Pacific – – 2.7 – 1.9 2.6 – – 2.4 – 1.7 2.3Group 3.6 3.3 2.7 4.3 2.3 3.3 3.5 4.0 2.4 5.9 2.2 3.6
2. UNDERWRITING ACTIVITIES
96
2.3.6 Net discounted central estimate maturity profile
OverviewThe maturity profile is the Group’s expectation of the period over which the net central estimate will be settled. The Group uses this information to ensure that it has adequate liquidity to pay claims as they are due to be settled and to inform the Group’s investment strategy. The table below summarises the expected maturity profile of the Group’s net discounted central estimate for each operating segment.
2020
LESS THAN 1 YEAR
US$M
13 TO 24 MONTHS
US$M
25 TO 36 MONTHS
US$M
37 TO 48 MONTHS
US$M
49 TO 60 MONTHS
US$M
OVER 5 YEARS
US$MTOTAL
US$M
North America 1,241 571 417 289 195 684 3,397International 2,581 1,192 1,201 897 665 1,992 8,528Australia Pacific 1,240 831 596 454 268 483 3,872
5,062 2,594 2,214 1,640 1,128 3,159 15,797
2019
LESS THAN 1 YEAR
US$M
13 TO 24 MONTHS
US$M
25 TO 36 MONTHS
US$M
37 TO 48 MONTHS
US$M
49 TO 60 MONTHS
US$M
OVER 5 YEARS
US$MTOTAL
US$M
North America 1,296 388 285 209 145 499 2,822International 2,165 1,161 959 767 562 2,035 7,649Australia Pacific 1,246 684 466 314 181 313 3,204
4,707 2,233 1,710 1,290 888 2,847 13,675
QB
E In
suran
ce Gro
up
A
nn
ual R
epo
rt 2020
97
Oth
er in
form
ation
6
Fin
ancial
Rep
ort
5
Perfo
rman
ce o
verv
iew
1
Op
erating an
d
finan
cial review
2
Go
vern
ance
3
Directo
rs' R
epo
rt
4

Notes to the financial statements continued
FOR THE YEAR ENDED 31 DECEMBER 2020
2.3.4 Discount rate used to determine the outstanding claims liability
OverviewClaims in relation to long-tail classes of business (e.g. professional indemnity and workers’ compensation) typically may not settle for many years. As such, the liability is discounted to reflect the time value of money. The table below summarises the weighted average discount rate for each operating segment and for the Group.
2020 2019% %
North America 0.84 1.96International 0.03 0.79Australia Pacific 0.41 1.01Group 0.30 1.05
How we account for the numbersAASB 1023 General Insurance Contracts requires that the net central estimate is discounted to reflect the time value of money using risk-free rates that are based on current observable, objective rates that reflect the nature, structure and terms of the future obligations.
2.3.5 Weighted average term to settlement
OverviewThe weighted average term to settlement refers to the period from the balance date to the expected date of claims settlement. All other factors being equal, a longer weighted average term to settlement generally results in a larger impact on the central estimate from discounting. The table below summarises the weighted average term to settlement for each operating segment and for the consolidated Group.
2020 2019YEARS YEARS
US$ £ A$ € OTHER TOTAL US$ £ A$ € OTHER TOTAL
North America 3.6 – – – – 3.6 3.2 – – – – 3.2International 3.6 3.3 3.5 4.3 2.4 3.7 4.0 4.0 3.2 5.9 2.3 4.5Australia Pacific – – 2.7 – 1.9 2.6 – – 2.4 – 1.7 2.3Group 3.6 3.3 2.7 4.3 2.3 3.3 3.5 4.0 2.4 5.9 2.2 3.6
2. UNDERWRITING ACTIVITIES
96
2.3.6 Net discounted central estimate maturity profile
OverviewThe maturity profile is the Group’s expectation of the period over which the net central estimate will be settled. The Group uses this information to ensure that it has adequate liquidity to pay claims as they are due to be settled and to inform the Group’s investment strategy. The table below summarises the expected maturity profile of the Group’s net discounted central estimate for each operating segment.
2020
LESS THAN 1 YEAR
US$M
13 TO 24 MONTHS
US$M
25 TO 36 MONTHS
US$M
37 TO 48 MONTHS
US$M
49 TO 60 MONTHS
US$M
OVER 5 YEARS
US$MTOTAL
US$M
North America 1,241 571 417 289 195 684 3,397International 2,581 1,192 1,201 897 665 1,992 8,528Australia Pacific 1,240 831 596 454 268 483 3,872
5,062 2,594 2,214 1,640 1,128 3,159 15,797
2019
LESS THAN 1 YEAR
US$M
13 TO 24 MONTHS
US$M
25 TO 36 MONTHS
US$M
37 TO 48 MONTHS
US$M
49 TO 60 MONTHS
US$M
OVER 5 YEARS
US$MTOTAL
US$M
North America 1,296 388 285 209 145 499 2,822International 2,165 1,161 959 767 562 2,035 7,649Australia Pacific 1,246 684 466 314 181 313 3,204
4,707 2,233 1,710 1,290 888 2,847 13,675
QB
E In
suran
ce Gro
up
A
nn
ual R
epo
rt 2020
97O
ther
info
rmatio
n
6
Fin
ancial
Rep
ort
5
Perfo
rman
ce o
verv
iew
1
Op
erating an
d
finan
cial review
2
Go
vern
ance
3
Directo
rs' R
epo
rt
4
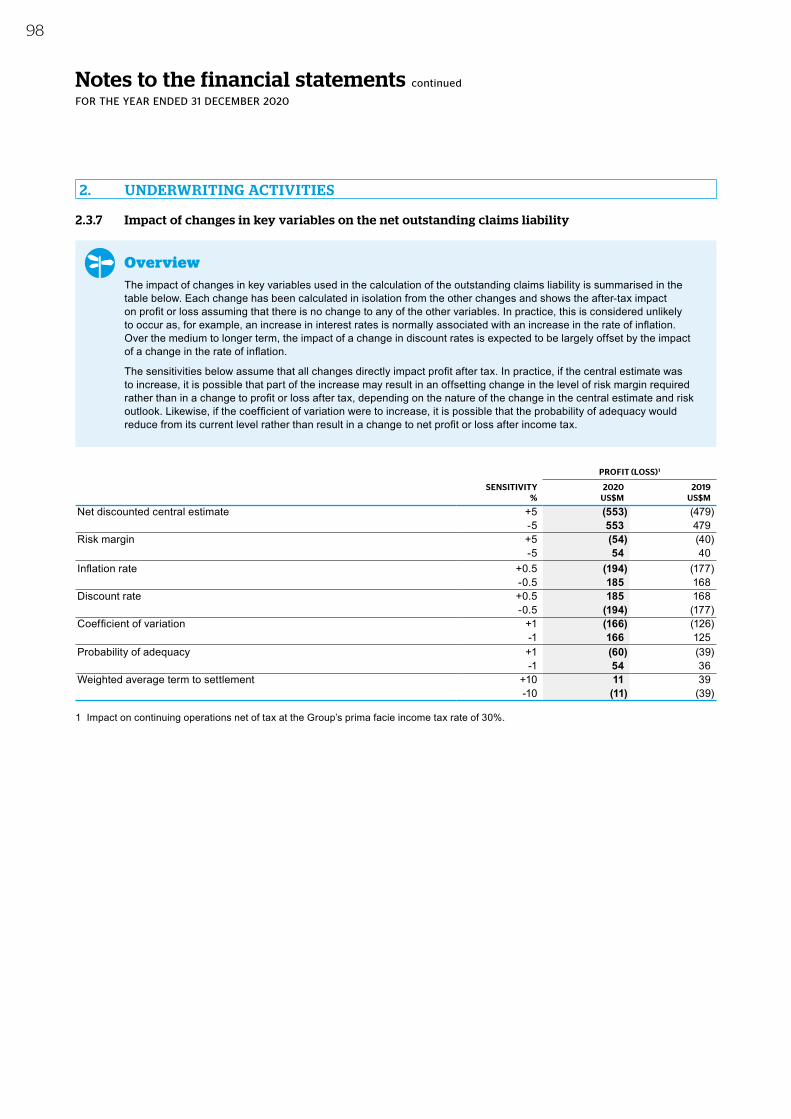
Notes to the financial statements continued
FOR THE YEAR ENDED 31 DECEMBER 2020
2.3.7 Impact of changes in key variables on the net outstanding claims liability
OverviewThe impact of changes in key variables used in the calculation of the outstanding claims liability is summarised in the table below. Each change has been calculated in isolation from the other changes and shows the after-tax impact on profit or loss assuming that there is no change to any of the other variables. In practice, this is considered unlikely to occur as, for example, an increase in interest rates is normally associated with an increase in the rate of inflation. Over the medium to longer term, the impact of a change in discount rates is expected to be largely offset by the impact of a change in the rate of inflation.
The sensitivities below assume that all changes directly impact profit after tax. In practice, if the central estimate was to increase, it is possible that part of the increase may result in an offsetting change in the level of risk margin required rather than in a change to profit or loss after tax, depending on the nature of the change in the central estimate and risk outlook. Likewise, if the coefficient of variation were to increase, it is possible that the probability of adequacy would reduce from its current level rather than result in a change to net profit or loss after income tax.
PROFIT (LOSS)1
SENSITIVITY 2020 2019% US$M US$M
Net discounted central estimate +5 (553) (479)-5 553 479
Risk margin +5 (54) (40)-5 54 40
Inflation rate +0.5 (194) (177)-0.5 185 168
Discount rate +0.5 185 168-0.5 (194) (177)
Coefficient of variation +1 (166) (126)-1 166 125
Probability of adequacy +1 (60) (39)-1 54 36
Weighted average term to settlement +10 11 39-10 (11) (39)
1 Impact on continuing operations net of tax at the Group’s prima facie income tax rate of 30%.
2. UNDERWRITING ACTIVITIES
98
2.4 Claims development – net undiscounted central estimate
OverviewThe claims development table demonstrates the extent to which the original estimate of net ultimate claims payments in any one accident year (item (a) in the table below) has subsequently developed favourably (i.e. claims cost estimates have reduced) or unfavourably (i.e. further claims expense has been recognised in subsequent years). This table therefore illustrates the variability and inherent uncertainty in estimating the central estimate each year. The ultimate claims cost for any particular accident year is not known until all claims payments have been made which, for some long-tail classes of business, could be many years into the future. The estimate of net ultimate claims payments at the end of each subsequent accident year demonstrates how the original estimate has been revised over time (b).
Cumulative net claims payments (d) are deducted from the estimate of net ultimate claims payments in each accident year (c) at the current balance date, resulting in the undiscounted central estimate at a fixed rate of exchange (e). This is revalued to the balance date rate of exchange (f) to report the net undiscounted central estimate (g), which is reconciled to the discounted net outstanding claims liability (h). The treatment of foreign exchange in the claims development table is explained on the following page.
The net increase (decrease) in estimated net ultimate claims payments (i) reflects the estimated ultimate net claims payments at the end of the current financial year (c) less the equivalent at the end of the previous financial year (b). This is further summarised in note 2.4.1.
The claims development table is presented net of reinsurance. With insurance operations in 27 countries, hundreds of products, various reinsurance arrangements and with the Group’s risk tolerance managed on a consolidated basis, it is considered neither meaningful nor practicable to provide this information other than on a consolidated Group basis.
2010 & PRIOR 2011 2012 2013 2014 2015 2016 2017 2018 2019 2020 TOTALUS$M US$M US$M US$M US$M US$M US$M US$M US$M US$M US$M US$M
Net ultimate claims payments1
(a) Original estimate of net ultimate claims payments 8,511 7,519 7,105 6,932 6,207 6,624 7,931 7,024 7,489 7,469
(b) One year later 8,719 7,574 7,023 6,938 6,226 6,413 7,987 7,187 7,726 Two years later 8,750 7,469 6,974 6,790 6,007 6,284 7,944 7,196 Three years later 8,596 7,465 6,954 6,698 5,980 6,276 8,135 Four years later 8,585 7,458 6,873 6,673 5,892 6,366 Five years later 8,534 7,412 6,973 6,683 5,875 Six years later 8,508 7,344 6,936 6,643 Seven years later 8,422 7,311 6,924 Eight years later 8,391 7,319 Nine years later 8,360
(c) Current estimate of net ultimate claims payments 8,360 7,319 6,924 6,643 5,875 6,366 8,135 7,196 7,726 7,469 72,013
(d) Cumulative net payments to date (8,235) (7,231) (6,739) (6,440) (5,313) (5,531) (6,633) (5,189) (4,403) (2,126) (57,840)
(e) Net undiscounted central estimate at fixed rate of exchange2 783 125 88 185 203 562 835 1,502 2,007 3,323 5,343 14,956
(f) Foreign exchange impact 569Provision for impairment 21
(g) Net undiscounted central estimate at 31 December 2020 15,546Discount to present value (196)Claims settlement costs 447Risk margin 1,537
(h) Net outstanding claims liability at 31 December 2020 (note 2.3) 17,334
(i) Movement in estimated net ultimate claims payments (note 2.4.1) (72) (31) 8 (12) (40) (17) 90 191 9 237 7,469 7,832
1 Excludes discontinued operations, consistent with other profit or loss disclosures.2 Excludes claims settlement costs.
QB
E In
suran
ce Gro
up
A
nn
ual R
epo
rt 2020
99
Oth
er in
form
ation
6
Fin
ancial
Rep
ort
5
Perfo
rman
ce o
verv
iew
1
Op
erating an
d
finan
cial review
2
Go
vern
ance
3
Directo
rs' R
epo
rt
4
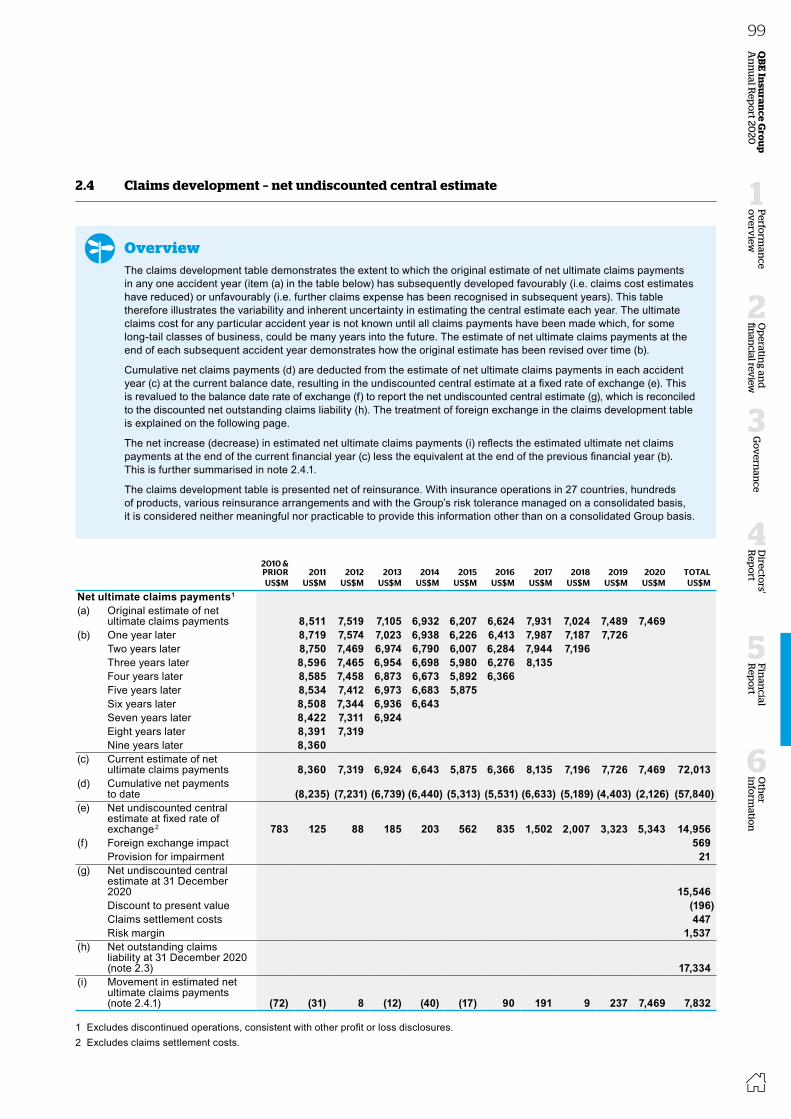
Notes to the financial statements continued
FOR THE YEAR ENDED 31 DECEMBER 2020
2.3.7 Impact of changes in key variables on the net outstanding claims liability
OverviewThe impact of changes in key variables used in the calculation of the outstanding claims liability is summarised in the table below. Each change has been calculated in isolation from the other changes and shows the after-tax impact on profit or loss assuming that there is no change to any of the other variables. In practice, this is considered unlikely to occur as, for example, an increase in interest rates is normally associated with an increase in the rate of inflation. Over the medium to longer term, the impact of a change in discount rates is expected to be largely offset by the impact of a change in the rate of inflation.
The sensitivities below assume that all changes directly impact profit after tax. In practice, if the central estimate was to increase, it is possible that part of the increase may result in an offsetting change in the level of risk margin required rather than in a change to profit or loss after tax, depending on the nature of the change in the central estimate and risk outlook. Likewise, if the coefficient of variation were to increase, it is possible that the probability of adequacy would reduce from its current level rather than result in a change to net profit or loss after income tax.
PROFIT (LOSS)1
SENSITIVITY 2020 2019% US$M US$M
Net discounted central estimate +5 (553) (479)-5 553 479
Risk margin +5 (54) (40)-5 54 40
Inflation rate +0.5 (194) (177)-0.5 185 168
Discount rate +0.5 185 168-0.5 (194) (177)
Coefficient of variation +1 (166) (126)-1 166 125
Probability of adequacy +1 (60) (39)-1 54 36
Weighted average term to settlement +10 11 39-10 (11) (39)
1 Impact on continuing operations net of tax at the Group’s prima facie income tax rate of 30%.
2. UNDERWRITING ACTIVITIES
98
2.4 Claims development – net undiscounted central estimate
OverviewThe claims development table demonstrates the extent to which the original estimate of net ultimate claims payments in any one accident year (item (a) in the table below) has subsequently developed favourably (i.e. claims cost estimates have reduced) or unfavourably (i.e. further claims expense has been recognised in subsequent years). This table therefore illustrates the variability and inherent uncertainty in estimating the central estimate each year. The ultimate claims cost for any particular accident year is not known until all claims payments have been made which, for some long-tail classes of business, could be many years into the future. The estimate of net ultimate claims payments at the end of each subsequent accident year demonstrates how the original estimate has been revised over time (b).
Cumulative net claims payments (d) are deducted from the estimate of net ultimate claims payments in each accident year (c) at the current balance date, resulting in the undiscounted central estimate at a fixed rate of exchange (e). This is revalued to the balance date rate of exchange (f) to report the net undiscounted central estimate (g), which is reconciled to the discounted net outstanding claims liability (h). The treatment of foreign exchange in the claims development table is explained on the following page.
The net increase (decrease) in estimated net ultimate claims payments (i) reflects the estimated ultimate net claims payments at the end of the current financial year (c) less the equivalent at the end of the previous financial year (b). This is further summarised in note 2.4.1.
The claims development table is presented net of reinsurance. With insurance operations in 27 countries, hundreds of products, various reinsurance arrangements and with the Group’s risk tolerance managed on a consolidated basis, it is considered neither meaningful nor practicable to provide this information other than on a consolidated Group basis.
2010 & PRIOR 2011 2012 2013 2014 2015 2016 2017 2018 2019 2020 TOTALUS$M US$M US$M US$M US$M US$M US$M US$M US$M US$M US$M US$M
Net ultimate claims payments1
(a) Original estimate of net ultimate claims payments 8,511 7,519 7,105 6,932 6,207 6,624 7,931 7,024 7,489 7,469
(b) One year later 8,719 7,574 7,023 6,938 6,226 6,413 7,987 7,187 7,726 Two years later 8,750 7,469 6,974 6,790 6,007 6,284 7,944 7,196 Three years later 8,596 7,465 6,954 6,698 5,980 6,276 8,135 Four years later 8,585 7,458 6,873 6,673 5,892 6,366 Five years later 8,534 7,412 6,973 6,683 5,875 Six years later 8,508 7,344 6,936 6,643 Seven years later 8,422 7,311 6,924 Eight years later 8,391 7,319 Nine years later 8,360
(c) Current estimate of net ultimate claims payments 8,360 7,319 6,924 6,643 5,875 6,366 8,135 7,196 7,726 7,469 72,013
(d) Cumulative net payments to date (8,235) (7,231) (6,739) (6,440) (5,313) (5,531) (6,633) (5,189) (4,403) (2,126) (57,840)
(e) Net undiscounted central estimate at fixed rate of exchange2 783 125 88 185 203 562 835 1,502 2,007 3,323 5,343 14,956
(f) Foreign exchange impact 569Provision for impairment 21
(g) Net undiscounted central estimate at 31 December 2020 15,546Discount to present value (196)Claims settlement costs 447Risk margin 1,537
(h) Net outstanding claims liability at 31 December 2020 (note 2.3) 17,334
(i) Movement in estimated net ultimate claims payments (note 2.4.1) (72) (31) 8 (12) (40) (17) 90 191 9 237 7,469 7,832
1 Excludes discontinued operations, consistent with other profit or loss disclosures.2 Excludes claims settlement costs.
QB
E In
suran
ce Gro
up
A
nn
ual R
epo
rt 2020
99O
ther
info
rmatio
n
6
Fin
ancial
Rep
ort
5
Perfo
rman
ce o
verv
iew
1
Op
erating an
d
finan
cial review
2
Go
vern
ance
3
Directo
rs' R
epo
rt
4

Notes to the financial statements continued
FOR THE YEAR ENDED 31 DECEMBER 2020
How we account for the numbersThe estimate of net ultimate claims payments attributable to business acquired is generally included in the claims development table in the accident year in which the acquisition was made. The exception is increased participation in Lloyd’s syndicates where the estimate of net ultimate claims payments is allocated to the original accident year(s) in which the underlying claim was incurred.
The Group writes business in many currencies. The translation of estimated net ultimate claims payments denominated in foreign currencies gives rise to foreign exchange movements which have no direct bearing on the development of the underlying claims. To eliminate this distortion, estimated net ultimate claims payments have been translated to the functional currencies of our controlled entities at constant rates of exchange. All estimates of ultimate claims payments for the 10 most recent accident years reported in functional currencies other than US dollars have been translated to US dollars using the 2020 average rates of exchange.
2.4.1 Reconciliation of claims development table to profit or loss
OverviewThe table below reconciles the net increase or decrease in estimated net ultimate claims payments in the current financial year from the claims development table (item (i) in note 2.4) to the analysis of current and prior accident year net central estimate development recognised in profit or loss (refer to note 2.4.2).
2020 2019
CURRENT ACCIDENT
YEAR
PRIOR ACCIDENT
YEARS TOTAL
CURRENT ACCIDENT
YEAR
PRIOR ACCIDENT
YEARS TOTALUS$M US$M US$M US$M US$M US$M
Movement in estimated net ultimate claims payments (note 2.4)1, 2,3 7,469 363 7,832 7,487 (40) 7,447Movement in claims settlement costs 413 (1) 412 386 (5) 381Movement in discount (39) 387 348 (143) 452 309Other movements 5 (7) (2) (5) (7) (12)Movement in net discounted central estimate (note 2.4.2) 7,848 742 8,590 7,725 400 8,125
1 Excludes claims settlement costs.2 The movement in prior accident year claims in 2020 mainly reflects adverse development in North America and, to a lesser
extent, International, partly offset by positive development in Australia Pacific.3 The movement in prior accident year claims in 2019 includes an undiscounted $56 million adverse impact as a result of the Ogden
rate change in the United Kingdom. Excluding this, the underlying prior accident year release of $96 million from continuing operations comprised positive development in Australia Pacific and International, partly offset by adverse development in North America.
2. UNDERWRITING ACTIVITIES
100
2.4.2 Net central estimate development
OverviewThe table below further analyses the current and prior accident year movement in the net discounted central estimate, separately identifying the gross and reinsurance components. Prior accident year claims are those claims that occurred in a previous year but for which a reassessment of the claims cost has impacted the result in the current period.
2020 2019
CURRENT ACCIDENT YEAR
PRIOR ACCIDENT
YEARS TOTALCURRENT
ACCIDENT YEAR
PRIOR ACCIDENT
YEARS TOTALUS$M US$M US$M US$M US$M US$M
Gross central estimate development Undiscounted 10,994 476 11,470 8,878 377 9,255Discount (47) 533 486 (180) 624 444
10,947 1,009 11,956 8,698 1,001 9,699Reinsurance and other recoveriesUndiscounted (3,107) (121) (3,228) 1,010 429 1,439Discount 8 (146) (138) (37) 172 135
(3,099) (267) (3,366) 973 601 1,574Net central estimate developmentUndiscounted 7,887 355 8,242 7,868 (52) 7,816Discount (39) 387 348 (143) 452 309Net discounted central estimate development (note 2.4.1) 7,848 742 8,590 7,725 400 8,125
2.5 Unearned premium and deferred insurance costs
Overview
Unearned premiumGross written premium is earned in profit or loss in accordance with the pattern of incidence of risk of the related business. The unearned premium liability is that portion of gross written premium that QBE has not yet earned in profit or loss as it represents insurance coverage to be provided by QBE after the balance date.
Deferred insurance costsPremium ceded to reinsurers by QBE in exchange for reinsurance protection is expensed in profit or loss in accordance with the reinsurance contract’s expected pattern of incidence of risk. The deferred reinsurance premium asset is that portion of the reinsurance premium that QBE has not yet expensed in profit or loss as it represents reinsurance coverage to be received by QBE after the balance date.
Acquisition costs are the costs associated with obtaining and recording insurance business. Acquisition costs are similarly capitalised and amortised, consistent with the earning of the related premium for that business. Commissions are a type of acquisition cost and are disclosed separately.
QB
E In
suran
ce Gro
up
A
nn
ual R
epo
rt 2020
101
Oth
er in
form
ation
6
Fin
ancial
Rep
ort
5
Perfo
rman
ce o
verv
iew
1
Op
erating an
d
finan
cial review
2
Go
vern
ance
3
Directo
rs' R
epo
rt
4
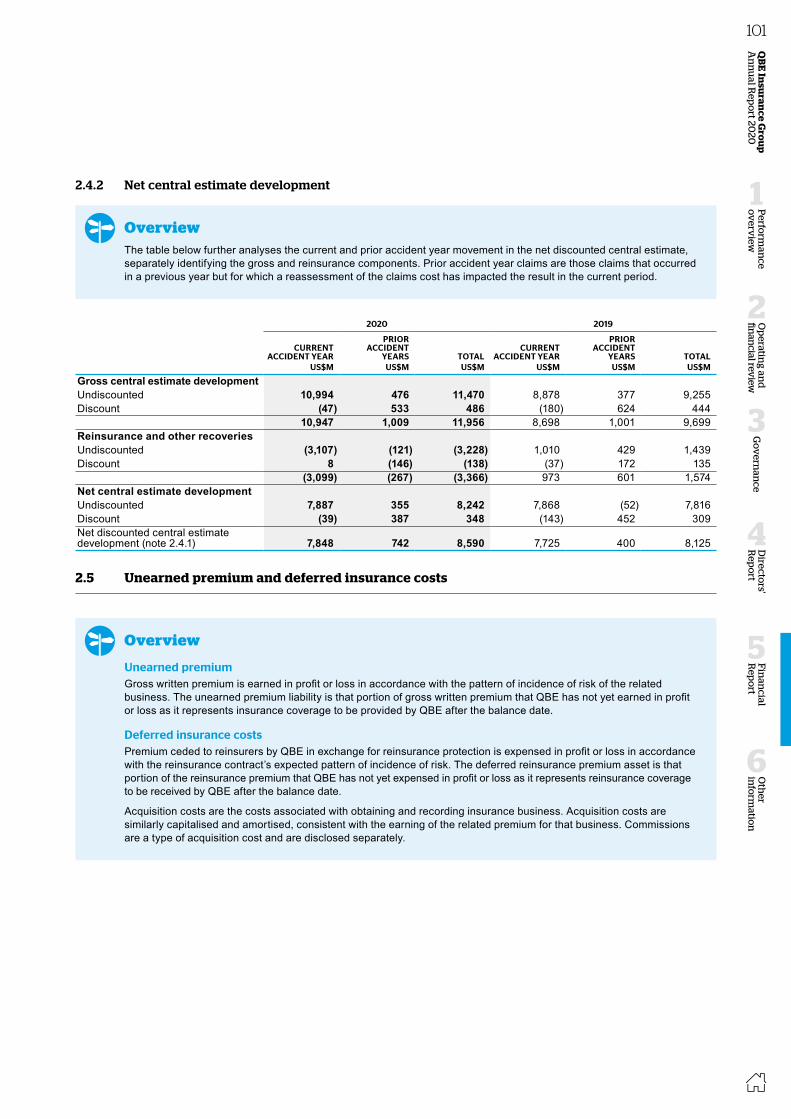
Notes to the financial statements continued
FOR THE YEAR ENDED 31 DECEMBER 2020
How we account for the numbersThe estimate of net ultimate claims payments attributable to business acquired is generally included in the claims development table in the accident year in which the acquisition was made. The exception is increased participation in Lloyd’s syndicates where the estimate of net ultimate claims payments is allocated to the original accident year(s) in which the underlying claim was incurred.
The Group writes business in many currencies. The translation of estimated net ultimate claims payments denominated in foreign currencies gives rise to foreign exchange movements which have no direct bearing on the development of the underlying claims. To eliminate this distortion, estimated net ultimate claims payments have been translated to the functional currencies of our controlled entities at constant rates of exchange. All estimates of ultimate claims payments for the 10 most recent accident years reported in functional currencies other than US dollars have been translated to US dollars using the 2020 average rates of exchange.
2.4.1 Reconciliation of claims development table to profit or loss
OverviewThe table below reconciles the net increase or decrease in estimated net ultimate claims payments in the current financial year from the claims development table (item (i) in note 2.4) to the analysis of current and prior accident year net central estimate development recognised in profit or loss (refer to note 2.4.2).
2020 2019
CURRENT ACCIDENT
YEAR
PRIOR ACCIDENT
YEARS TOTAL
CURRENT ACCIDENT
YEAR
PRIOR ACCIDENT
YEARS TOTALUS$M US$M US$M US$M US$M US$M
Movement in estimated net ultimate claims payments (note 2.4)1, 2,3 7,469 363 7,832 7,487 (40) 7,447Movement in claims settlement costs 413 (1) 412 386 (5) 381Movement in discount (39) 387 348 (143) 452 309Other movements 5 (7) (2) (5) (7) (12)Movement in net discounted central estimate (note 2.4.2) 7,848 742 8,590 7,725 400 8,125
1 Excludes claims settlement costs.2 The movement in prior accident year claims in 2020 mainly reflects adverse development in North America and, to a lesser
extent, International, partly offset by positive development in Australia Pacific.3 The movement in prior accident year claims in 2019 includes an undiscounted $56 million adverse impact as a result of the Ogden
rate change in the United Kingdom. Excluding this, the underlying prior accident year release of $96 million from continuing operations comprised positive development in Australia Pacific and International, partly offset by adverse development in North America.
2. UNDERWRITING ACTIVITIES
100
2.4.2 Net central estimate development
OverviewThe table below further analyses the current and prior accident year movement in the net discounted central estimate, separately identifying the gross and reinsurance components. Prior accident year claims are those claims that occurred in a previous year but for which a reassessment of the claims cost has impacted the result in the current period.
2020 2019
CURRENT ACCIDENT YEAR
PRIOR ACCIDENT
YEARS TOTALCURRENT
ACCIDENT YEAR
PRIOR ACCIDENT
YEARS TOTALUS$M US$M US$M US$M US$M US$M
Gross central estimate development Undiscounted 10,994 476 11,470 8,878 377 9,255Discount (47) 533 486 (180) 624 444
10,947 1,009 11,956 8,698 1,001 9,699Reinsurance and other recoveriesUndiscounted (3,107) (121) (3,228) 1,010 429 1,439Discount 8 (146) (138) (37) 172 135
(3,099) (267) (3,366) 973 601 1,574Net central estimate developmentUndiscounted 7,887 355 8,242 7,868 (52) 7,816Discount (39) 387 348 (143) 452 309Net discounted central estimate development (note 2.4.1) 7,848 742 8,590 7,725 400 8,125
2.5 Unearned premium and deferred insurance costs
Overview
Unearned premiumGross written premium is earned in profit or loss in accordance with the pattern of incidence of risk of the related business. The unearned premium liability is that portion of gross written premium that QBE has not yet earned in profit or loss as it represents insurance coverage to be provided by QBE after the balance date.
Deferred insurance costsPremium ceded to reinsurers by QBE in exchange for reinsurance protection is expensed in profit or loss in accordance with the reinsurance contract’s expected pattern of incidence of risk. The deferred reinsurance premium asset is that portion of the reinsurance premium that QBE has not yet expensed in profit or loss as it represents reinsurance coverage to be received by QBE after the balance date.
Acquisition costs are the costs associated with obtaining and recording insurance business. Acquisition costs are similarly capitalised and amortised, consistent with the earning of the related premium for that business. Commissions are a type of acquisition cost and are disclosed separately.
QB
E In
suran
ce Gro
up
A
nn
ual R
epo
rt 2020
101O
ther
info
rmatio
n
6
Fin
ancial
Rep
ort
5
Perfo
rman
ce o
verv
iew
1
Op
erating an
d
finan
cial review
2
Go
vern
ance
3
Directo
rs' R
epo
rt
4
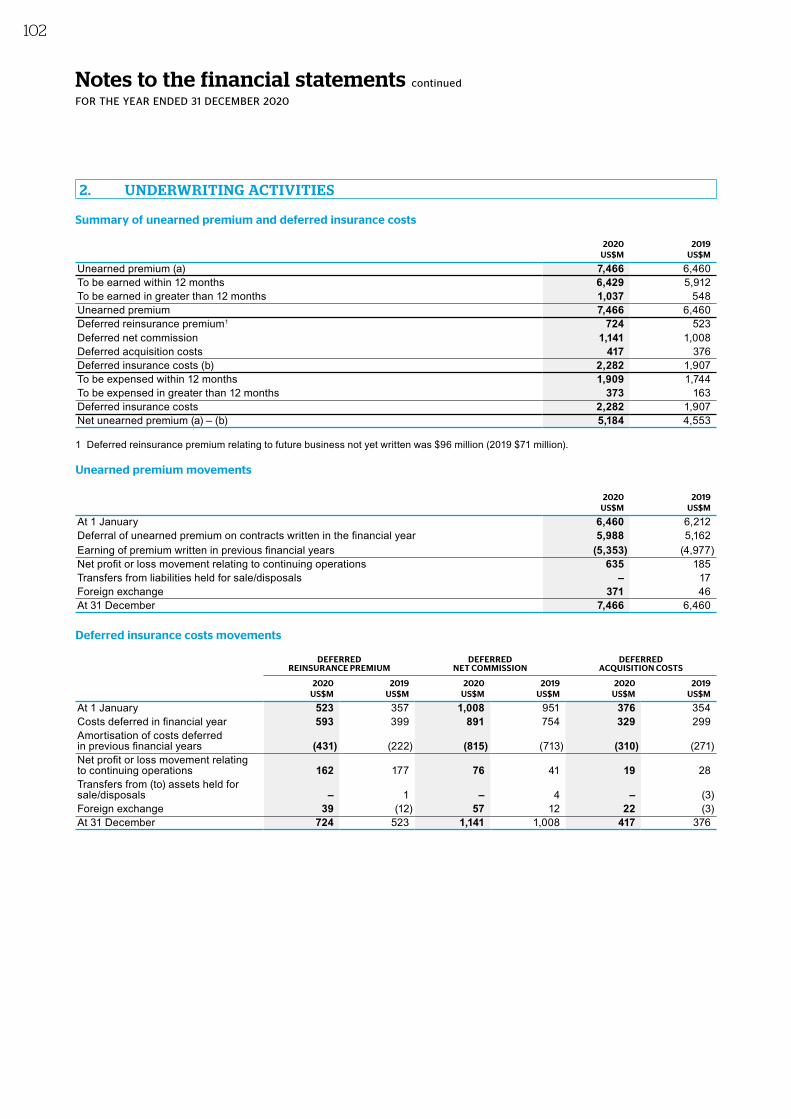
Notes to the financial statements continued
FOR THE YEAR ENDED 31 DECEMBER 2020
Summary of unearned premium and deferred insurance costs
2020 2019US$M US$M
Unearned premium (a) 7,466 6,460To be earned within 12 months 6,429 5,912To be earned in greater than 12 months 1,037 548Unearned premium 7,466 6,460Deferred reinsurance premium1 724 523Deferred net commission 1,141 1,008Deferred acquisition costs 417 376Deferred insurance costs (b) 2,282 1,907To be expensed within 12 months 1,909 1,744To be expensed in greater than 12 months 373 163Deferred insurance costs 2,282 1,907Net unearned premium (a) – (b) 5,184 4,553
1 Deferred reinsurance premium relating to future business not yet written was $96 million (2019 $71 million).
Unearned premium movements
2020 2019US$M US$M
At 1 January 6,460 6,212Deferral of unearned premium on contracts written in the financial year 5,988 5,162Earning of premium written in previous financial years (5,353) (4,977)Net profit or loss movement relating to continuing operations 635 185Transfers from liabilities held for sale/disposals – 17Foreign exchange 371 46At 31 December 7,466 6,460
Deferred insurance costs movements
DEFERRED REINSURANCE PREMIUM
DEFERRED NET COMMISSION
DEFERRED ACQUISITION COSTS
2020 2019 2020 2019 2020 2019US$M US$M US$M US$M US$M US$M
At 1 January 523 357 1,008 951 376 354Costs deferred in financial year 593 399 891 754 329 299Amortisation of costs deferred in previous financial years (431) (222) (815) (713) (310) (271)Net profit or loss movement relating to continuing operations 162 177 76 41 19 28Transfers from (to) assets held for sale/disposals – 1 – 4 – (3)Foreign exchange 39 (12) 57 12 22 (3)At 31 December 724 523 1,141 1,008 417 376
2. UNDERWRITING ACTIVITIES
102
How we account for the numbers
Unearned premiumUnearned premium is calculated based on the coverage period of the insurance or reinsurance contract and in accordance with the expected pattern of the incidence of risk, using either the daily pro-rata method or the 24ths method, adjusted where appropriate to reflect different risk patterns.
Deferred insurance costsDeferred reinsurance premium is calculated based on the period of indemnity provided to QBE by the reinsurance contract and in accordance with the related pattern of the incidence of risk.
Acquisition costs are capitalised when they relate to new business or the renewal of existing business and are amortised on the same basis as the earning pattern for that business. At the balance date, deferred acquisition costs represent the capitalised acquisition costs that relate to unearned premium and are carried forward to a subsequent accounting period in recognition of their future benefit. The carrying value of deferred acquisition costs is subject to impairment testing in the form of the liability adequacy test (refer to note 2.5.1). Deferred net commission is a type of deferred acquisition cost and is disclosed separately.
2.5.1 Liability adequacy test
OverviewAt each balance date, the Group is required to assess net unearned premium to determine whether the amount provided is sufficient to pay future claims net of reinsurance recoveries attributable to the net unearned premium.
If the present value of expected future net claims including a risk margin exceeds the net unearned premium, adjusted for deferred reinsurance premium relating to future business not yet written, the net unearned premium is deemed deficient. This deficiency is immediately recognised in profit or loss. In recognising the deficiency, an insurer must first write down related intangible assets and then deferred acquisition costs before recognising an unexpired risk liability.
Expected present value of future cash flows for future claims including risk margin
2020 2019US$M US$M
Undiscounted net central estimate 4,676 4,227 Discount to present value (23) (104)
4,653 4,123 Risk margin at the 75th percentile of insurance liabilities 181 169 Expected present value of future cash flows for future claims including risk margin 4,834 4,292
The application of liability adequacy at 31 December 2020 did not identify a deficiency (2019 nil).
How we account for the numbersAt each balance date, the adequacy of net unearned premium is assessed on a net of reinsurance basis against the present value of the expected future claims cash flows in respect of the relevant insurance contracts, plus an additional risk margin to reflect the inherent uncertainty of the central estimate. The assessment is carried out at the operating segment level other than Europe, Asia, and the Group’s captive reinsurer, Equator Re, which are assessed separately, each being a portfolio of contracts subject to broadly similar risks and which are managed together as a single portfolio.
QB
E In
suran
ce Gro
up
A
nn
ual R
epo
rt 2020
103
Oth
er in
form
ation
6
Fin
ancial
Rep
ort
5
Perfo
rman
ce o
verv
iew
1
Op
erating an
d
finan
cial review
2
Go
vern
ance
3
Directo
rs' R
epo
rt
4
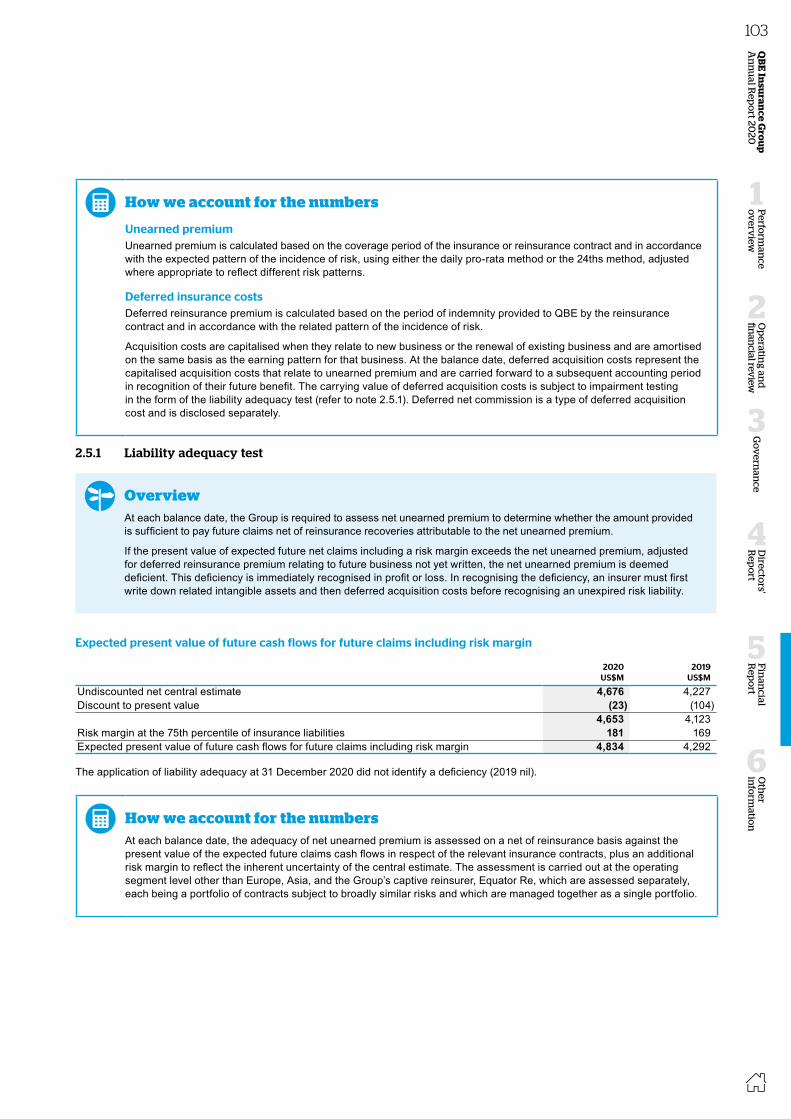
Notes to the financial statements continued
FOR THE YEAR ENDED 31 DECEMBER 2020
Summary of unearned premium and deferred insurance costs
2020 2019US$M US$M
Unearned premium (a) 7,466 6,460To be earned within 12 months 6,429 5,912To be earned in greater than 12 months 1,037 548Unearned premium 7,466 6,460Deferred reinsurance premium1 724 523Deferred net commission 1,141 1,008Deferred acquisition costs 417 376Deferred insurance costs (b) 2,282 1,907To be expensed within 12 months 1,909 1,744To be expensed in greater than 12 months 373 163Deferred insurance costs 2,282 1,907Net unearned premium (a) – (b) 5,184 4,553
1 Deferred reinsurance premium relating to future business not yet written was $96 million (2019 $71 million).
Unearned premium movements
2020 2019US$M US$M
At 1 January 6,460 6,212Deferral of unearned premium on contracts written in the financial year 5,988 5,162Earning of premium written in previous financial years (5,353) (4,977)Net profit or loss movement relating to continuing operations 635 185Transfers from liabilities held for sale/disposals – 17Foreign exchange 371 46At 31 December 7,466 6,460
Deferred insurance costs movements
DEFERRED REINSURANCE PREMIUM
DEFERRED NET COMMISSION
DEFERRED ACQUISITION COSTS
2020 2019 2020 2019 2020 2019US$M US$M US$M US$M US$M US$M
At 1 January 523 357 1,008 951 376 354Costs deferred in financial year 593 399 891 754 329 299Amortisation of costs deferred in previous financial years (431) (222) (815) (713) (310) (271)Net profit or loss movement relating to continuing operations 162 177 76 41 19 28Transfers from (to) assets held for sale/disposals – 1 – 4 – (3)Foreign exchange 39 (12) 57 12 22 (3)At 31 December 724 523 1,141 1,008 417 376
2. UNDERWRITING ACTIVITIES
102
How we account for the numbers
Unearned premiumUnearned premium is calculated based on the coverage period of the insurance or reinsurance contract and in accordance with the expected pattern of the incidence of risk, using either the daily pro-rata method or the 24ths method, adjusted where appropriate to reflect different risk patterns.
Deferred insurance costsDeferred reinsurance premium is calculated based on the period of indemnity provided to QBE by the reinsurance contract and in accordance with the related pattern of the incidence of risk.
Acquisition costs are capitalised when they relate to new business or the renewal of existing business and are amortised on the same basis as the earning pattern for that business. At the balance date, deferred acquisition costs represent the capitalised acquisition costs that relate to unearned premium and are carried forward to a subsequent accounting period in recognition of their future benefit. The carrying value of deferred acquisition costs is subject to impairment testing in the form of the liability adequacy test (refer to note 2.5.1). Deferred net commission is a type of deferred acquisition cost and is disclosed separately.
2.5.1 Liability adequacy test
OverviewAt each balance date, the Group is required to assess net unearned premium to determine whether the amount provided is sufficient to pay future claims net of reinsurance recoveries attributable to the net unearned premium.
If the present value of expected future net claims including a risk margin exceeds the net unearned premium, adjusted for deferred reinsurance premium relating to future business not yet written, the net unearned premium is deemed deficient. This deficiency is immediately recognised in profit or loss. In recognising the deficiency, an insurer must first write down related intangible assets and then deferred acquisition costs before recognising an unexpired risk liability.
Expected present value of future cash flows for future claims including risk margin
2020 2019US$M US$M
Undiscounted net central estimate 4,676 4,227 Discount to present value (23) (104)
4,653 4,123 Risk margin at the 75th percentile of insurance liabilities 181 169 Expected present value of future cash flows for future claims including risk margin 4,834 4,292
The application of liability adequacy at 31 December 2020 did not identify a deficiency (2019 nil).
How we account for the numbersAt each balance date, the adequacy of net unearned premium is assessed on a net of reinsurance basis against the present value of the expected future claims cash flows in respect of the relevant insurance contracts, plus an additional risk margin to reflect the inherent uncertainty of the central estimate. The assessment is carried out at the operating segment level other than Europe, Asia, and the Group’s captive reinsurer, Equator Re, which are assessed separately, each being a portfolio of contracts subject to broadly similar risks and which are managed together as a single portfolio.
QB
E In
suran
ce Gro
up
A
nn
ual R
epo
rt 2020
103O
ther
info
rmatio
n
6
Fin
ancial
Rep
ort
5
Perfo
rman
ce o
verv
iew
1
Op
erating an
d
finan
cial review
2
Go
vern
ance
3
Directo
rs' R
epo
rt
4
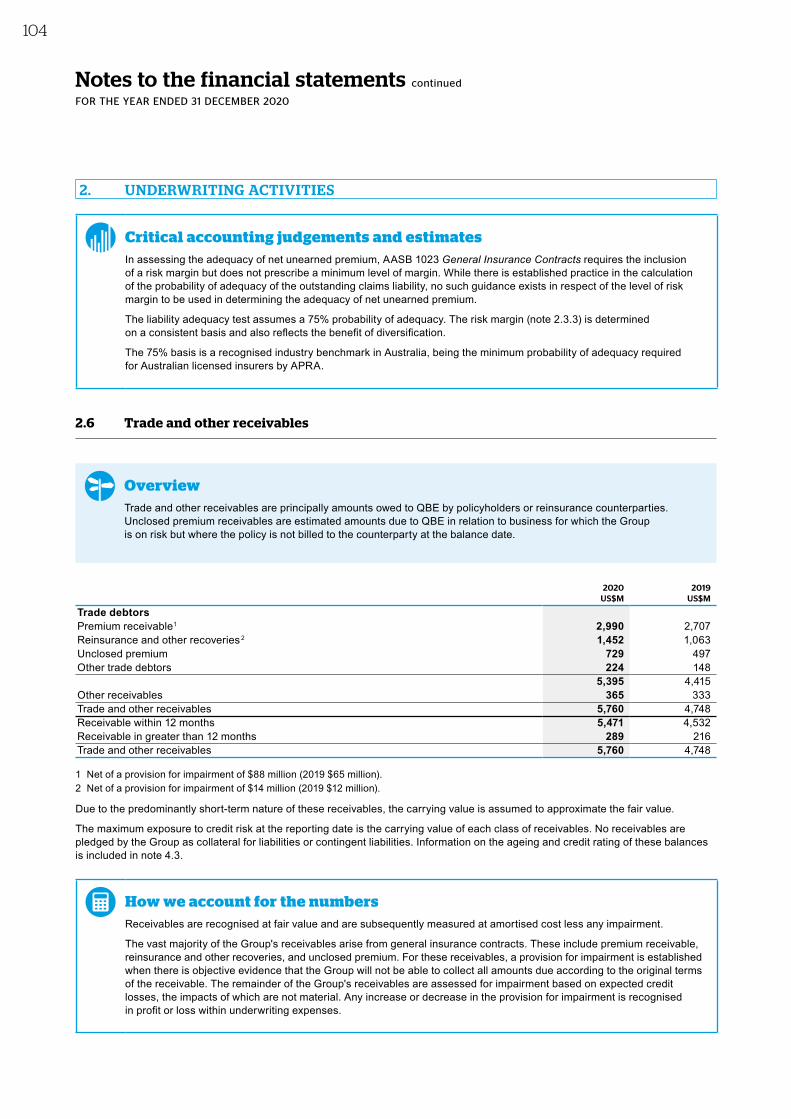
Notes to the financial statements continued
FOR THE YEAR ENDED 31 DECEMBER 2020
Critical accounting judgements and estimatesIn assessing the adequacy of net unearned premium, AASB 1023 General Insurance Contracts requires the inclusion of a risk margin but does not prescribe a minimum level of margin. While there is established practice in the calculation of the probability of adequacy of the outstanding claims liability, no such guidance exists in respect of the level of risk margin to be used in determining the adequacy of net unearned premium.
The liability adequacy test assumes a 75% probability of adequacy. The risk margin (note 2.3.3) is determined on a consistent basis and also reflects the benefit of diversification.
The 75% basis is a recognised industry benchmark in Australia, being the minimum probability of adequacy required for Australian licensed insurers by APRA.
2.6 Trade and other receivables
OverviewTrade and other receivables are principally amounts owed to QBE by policyholders or reinsurance counterparties. Unclosed premium receivables are estimated amounts due to QBE in relation to business for which the Group is on risk but where the policy is not billed to the counterparty at the balance date.
2020 2019US$M US$M
Trade debtorsPremium receivable1 2,990 2,707 Reinsurance and other recoveries2 1,452 1,063 Unclosed premium 729 497 Other trade debtors 224 148
5,395 4,415 Other receivables 365 333 Trade and other receivables 5,760 4,748 Receivable within 12 months 5,471 4,532 Receivable in greater than 12 months 289 216 Trade and other receivables 5,760 4,748
1 Net of a provision for impairment of $88 million (2019 $65 million).2 Net of a provision for impairment of $14 million (2019 $12 million).
Due to the predominantly short-term nature of these receivables, the carrying value is assumed to approximate the fair value.
The maximum exposure to credit risk at the reporting date is the carrying value of each class of receivables. No receivables are pledged by the Group as collateral for liabilities or contingent liabilities. Information on the ageing and credit rating of these balances is included in note 4.3.
How we account for the numbersReceivables are recognised at fair value and are subsequently measured at amortised cost less any impairment.
The vast majority of the Group's receivables arise from general insurance contracts. These include premium receivable, reinsurance and other recoveries, and unclosed premium. For these receivables, a provision for impairment is established when there is objective evidence that the Group will not be able to collect all amounts due according to the original terms of the receivable. The remainder of the Group's receivables are assessed for impairment based on expected credit losses, the impacts of which are not material. Any increase or decrease in the provision for impairment is recognised in profit or loss within underwriting expenses.
2. UNDERWRITING ACTIVITIES
104
2.7 Trade and other payables
OverviewTrade payables primarily comprise amounts owed to reinsurance counterparties and cedants. Treasury and investment payables are amounts due to counterparties in settlement of treasury and investment transactions.
2020 2019US$M US$M
Trade payables 1,604 1,020 Other payables and accrued expenses 714 591 Treasury payables 16 21 Investment payables 4 170 Trade and other payables 2,338 1,802 Payable within 12 months 2,174 1,627 Payable in greater than 12 months 164 175 Trade and other payables 2,338 1,802
Due to the predominantly short-term nature of these payables, the carrying value is assumed to approximate the fair value.
How we account for the numbersTrade payables are recognised initially at their fair value and are subsequently measured at amortised cost using the effective interest method.
QB
E In
suran
ce Gro
up
A
nn
ual R
epo
rt 2020
105
Oth
er in
form
ation
6
Fin
ancial
Rep
ort
5
Perfo
rman
ce o
verv
iew
1
Op
erating an
d
finan
cial review
2
Go
vern
ance
3
Directo
rs' R
epo
rt
4
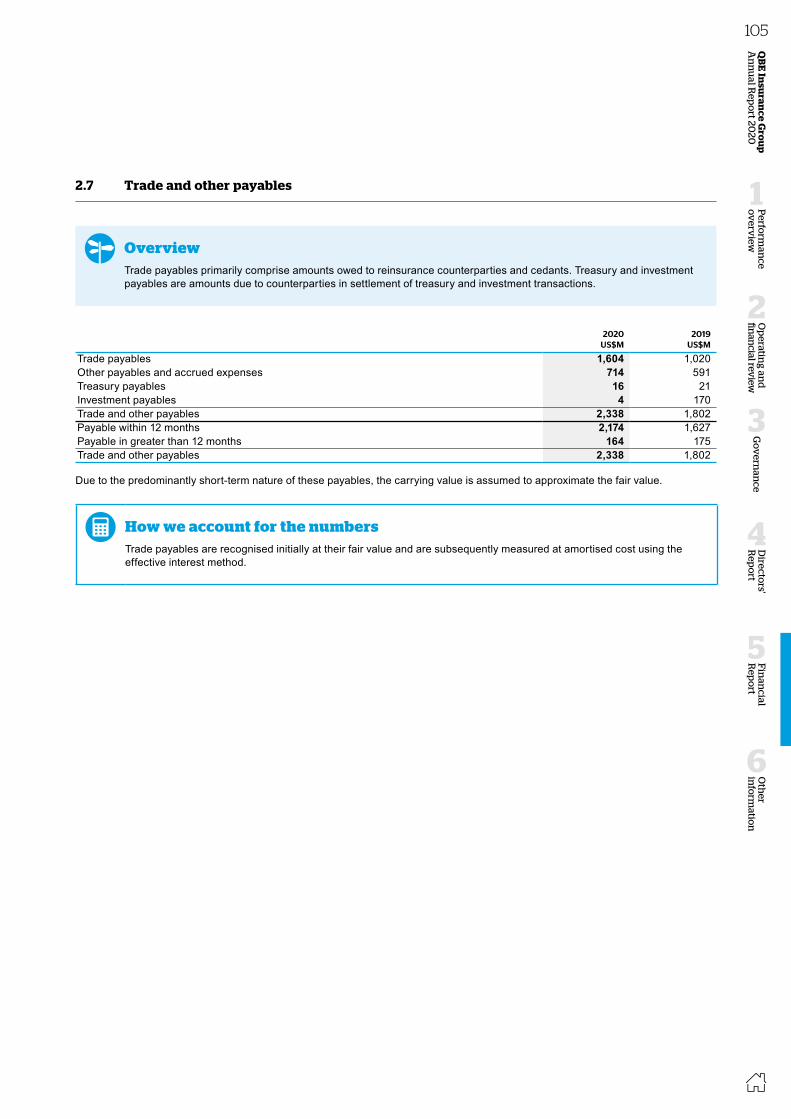
Notes to the financial statements continued
FOR THE YEAR ENDED 31 DECEMBER 2020
Critical accounting judgements and estimatesIn assessing the adequacy of net unearned premium, AASB 1023 General Insurance Contracts requires the inclusion of a risk margin but does not prescribe a minimum level of margin. While there is established practice in the calculation of the probability of adequacy of the outstanding claims liability, no such guidance exists in respect of the level of risk margin to be used in determining the adequacy of net unearned premium.
The liability adequacy test assumes a 75% probability of adequacy. The risk margin (note 2.3.3) is determined on a consistent basis and also reflects the benefit of diversification.
The 75% basis is a recognised industry benchmark in Australia, being the minimum probability of adequacy required for Australian licensed insurers by APRA.
2.6 Trade and other receivables
OverviewTrade and other receivables are principally amounts owed to QBE by policyholders or reinsurance counterparties. Unclosed premium receivables are estimated amounts due to QBE in relation to business for which the Group is on risk but where the policy is not billed to the counterparty at the balance date.
2020 2019US$M US$M
Trade debtorsPremium receivable1 2,990 2,707 Reinsurance and other recoveries2 1,452 1,063 Unclosed premium 729 497 Other trade debtors 224 148
5,395 4,415 Other receivables 365 333 Trade and other receivables 5,760 4,748 Receivable within 12 months 5,471 4,532 Receivable in greater than 12 months 289 216 Trade and other receivables 5,760 4,748
1 Net of a provision for impairment of $88 million (2019 $65 million).2 Net of a provision for impairment of $14 million (2019 $12 million).
Due to the predominantly short-term nature of these receivables, the carrying value is assumed to approximate the fair value.
The maximum exposure to credit risk at the reporting date is the carrying value of each class of receivables. No receivables are pledged by the Group as collateral for liabilities or contingent liabilities. Information on the ageing and credit rating of these balances is included in note 4.3.
How we account for the numbersReceivables are recognised at fair value and are subsequently measured at amortised cost less any impairment.
The vast majority of the Group's receivables arise from general insurance contracts. These include premium receivable, reinsurance and other recoveries, and unclosed premium. For these receivables, a provision for impairment is established when there is objective evidence that the Group will not be able to collect all amounts due according to the original terms of the receivable. The remainder of the Group's receivables are assessed for impairment based on expected credit losses, the impacts of which are not material. Any increase or decrease in the provision for impairment is recognised in profit or loss within underwriting expenses.
2. UNDERWRITING ACTIVITIES
104
2.7 Trade and other payables
OverviewTrade payables primarily comprise amounts owed to reinsurance counterparties and cedants. Treasury and investment payables are amounts due to counterparties in settlement of treasury and investment transactions.
2020 2019US$M US$M
Trade payables 1,604 1,020 Other payables and accrued expenses 714 591 Treasury payables 16 21 Investment payables 4 170 Trade and other payables 2,338 1,802 Payable within 12 months 2,174 1,627 Payable in greater than 12 months 164 175 Trade and other payables 2,338 1,802
Due to the predominantly short-term nature of these payables, the carrying value is assumed to approximate the fair value.
How we account for the numbersTrade payables are recognised initially at their fair value and are subsequently measured at amortised cost using the effective interest method.
QB
E In
suran
ce Gro
up
A
nn
ual R
epo
rt 2020
105O
ther
info
rmatio
n
6
Fin
ancial
Rep
ort
5
Perfo
rman
ce o
verv
iew
1
Op
erating an
d
finan
cial review
2
Go
vern
ance
3
Directo
rs' R
epo
rt
4
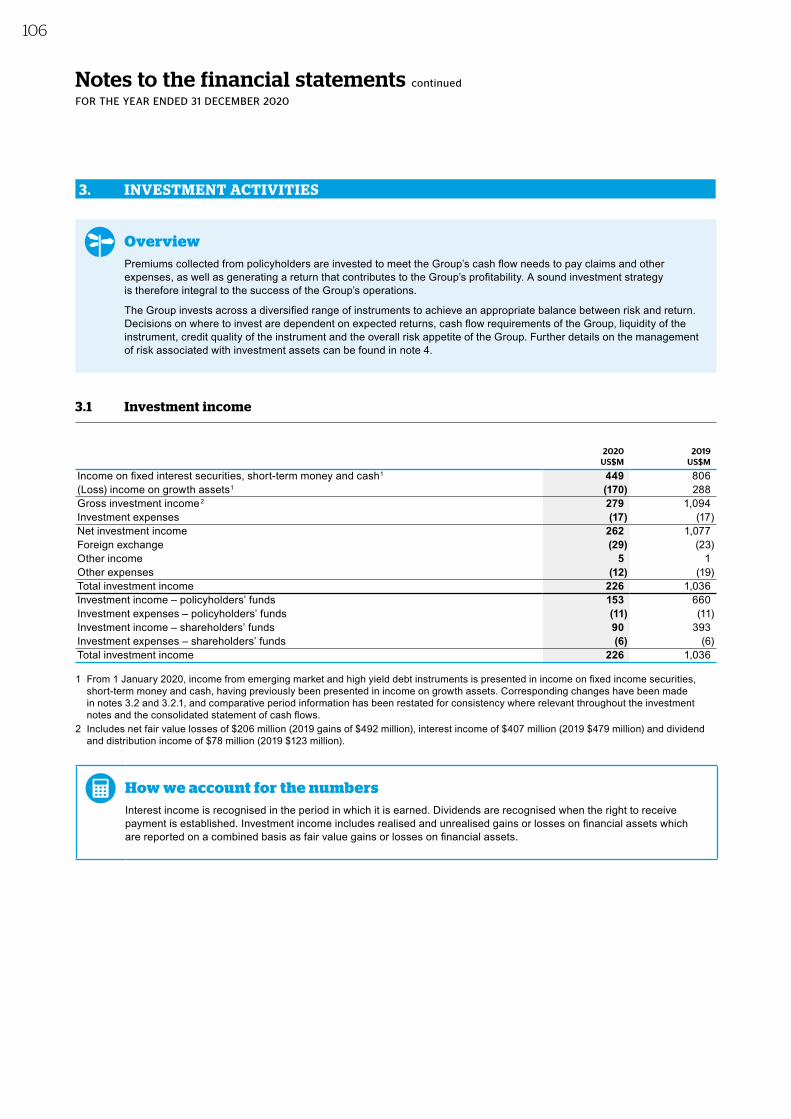
Notes to the financial statements continued
FOR THE YEAR ENDED 31 DECEMBER 2020
3. INVESTMENT ACTIVITIES
OverviewPremiums collected from policyholders are invested to meet the Group’s cash flow needs to pay claims and other expenses, as well as generating a return that contributes to the Group’s profitability. A sound investment strategy is therefore integral to the success of the Group’s operations.
The Group invests across a diversified range of instruments to achieve an appropriate balance between risk and return. Decisions on where to invest are dependent on expected returns, cash flow requirements of the Group, liquidity of the instrument, credit quality of the instrument and the overall risk appetite of the Group. Further details on the management of risk associated with investment assets can be found in note 4.
3.1 Investment income
2020 2019US$M US$M
Income on fixed interest securities, short-term money and cash1 449 806 (Loss) income on growth assets1 (170) 288 Gross investment income2 279 1,094 Investment expenses (17) (17)Net investment income 262 1,077 Foreign exchange (29) (23)Other income 5 1 Other expenses (12) (19)Total investment income 226 1,036 Investment income – policyholders’ funds 153 660 Investment expenses – policyholders’ funds (11) (11)Investment income – shareholders’ funds 90 393 Investment expenses – shareholders’ funds (6) (6)Total investment income 226 1,036
1 From 1 January 2020, income from emerging market and high yield debt instruments is presented in income on fixed income securities, short-term money and cash, having previously been presented in income on growth assets. Corresponding changes have been made in notes 3.2 and 3.2.1, and comparative period information has been restated for consistency where relevant throughout the investment notes and the consolidated statement of cash flows.
2 Includes net fair value losses of $206 million (2019 gains of $492 million), interest income of $407 million (2019 $479 million) and dividend and distribution income of $78 million (2019 $123 million).
How we account for the numbersInterest income is recognised in the period in which it is earned. Dividends are recognised when the right to receive payment is established. Investment income includes realised and unrealised gains or losses on financial assets which are reported on a combined basis as fair value gains or losses on financial assets.
106
3.2 Investment assets
2020 2019US$M US$M
Fixed income assetsShort-term money 2,974 1,066 Government bonds 5,600 5,813 Corporate bonds 15,958 13,268 Infrastructure debt 372 386 Emerging market debt – 554 High yield debt – 401
24,904 21,488 Growth assetsDeveloped market equity 25 281 Emerging market equity – 108 Unlisted property trusts 750 716 Infrastructure assets 894 903 Private equity 262 203 Alternatives 100 91
2,031 2,302 Total investments 26,935 23,790 Amounts maturing within 12 months 6,679 4,794 Amounts maturing in greater than 12 months 20,256 18,996 Total investments 26,935 23,790
At 31 December 2020, QBE had undrawn commitments to externally managed investment vehicles of $156 million (2019 $169 million).
How we account for the numbersThe Group's investments are required to be measured at fair value through profit or loss, with all investments managed and assessed on a fair value basis to maximise returns within risk appetites and investment strategy parameters and limits. They are therefore initially re-recognised at fair value, determined as the cost of acquisition excluding transaction costs, and are remeasured to fair value through profit or loss at each reporting date. The fair value hierarchy and the Group’s approach to measuring the fair value of each category of investment instrument are disclosed in note 3.2.1.
All purchases and sales of investments that require delivery of the asset within the time frame established by regulation or market convention are recognised at trade date, being the date on which the Group commits to buy or sell the asset. Investments are de-recognised when the right to receive future cash flows from the asset has expired or has been transferred and the Group has transferred substantially all the risks and rewards of ownership.
QB
E In
suran
ce Gro
up
A
nn
ual R
epo
rt 2020
107
Oth
er in
form
ation
6
Fin
ancial
Rep
ort
5
Perfo
rman
ce o
verv
iew
1
Op
erating an
d
finan
cial review
2
Go
vern
ance
3
Directo
rs' R
epo
rt
4

Notes to the financial statements continued
FOR THE YEAR ENDED 31 DECEMBER 2020
3. INVESTMENT ACTIVITIES
OverviewPremiums collected from policyholders are invested to meet the Group’s cash flow needs to pay claims and other expenses, as well as generating a return that contributes to the Group’s profitability. A sound investment strategy is therefore integral to the success of the Group’s operations.
The Group invests across a diversified range of instruments to achieve an appropriate balance between risk and return. Decisions on where to invest are dependent on expected returns, cash flow requirements of the Group, liquidity of the instrument, credit quality of the instrument and the overall risk appetite of the Group. Further details on the management of risk associated with investment assets can be found in note 4.
3.1 Investment income
2020 2019US$M US$M
Income on fixed interest securities, short-term money and cash1 449 806 (Loss) income on growth assets1 (170) 288 Gross investment income2 279 1,094 Investment expenses (17) (17)Net investment income 262 1,077 Foreign exchange (29) (23)Other income 5 1 Other expenses (12) (19)Total investment income 226 1,036 Investment income – policyholders’ funds 153 660 Investment expenses – policyholders’ funds (11) (11)Investment income – shareholders’ funds 90 393 Investment expenses – shareholders’ funds (6) (6)Total investment income 226 1,036
1 From 1 January 2020, income from emerging market and high yield debt instruments is presented in income on fixed income securities, short-term money and cash, having previously been presented in income on growth assets. Corresponding changes have been made in notes 3.2 and 3.2.1, and comparative period information has been restated for consistency where relevant throughout the investment notes and the consolidated statement of cash flows.
2 Includes net fair value losses of $206 million (2019 gains of $492 million), interest income of $407 million (2019 $479 million) and dividend and distribution income of $78 million (2019 $123 million).
How we account for the numbersInterest income is recognised in the period in which it is earned. Dividends are recognised when the right to receive payment is established. Investment income includes realised and unrealised gains or losses on financial assets which are reported on a combined basis as fair value gains or losses on financial assets.
106
3.2 Investment assets
2020 2019US$M US$M
Fixed income assetsShort-term money 2,974 1,066 Government bonds 5,600 5,813 Corporate bonds 15,958 13,268 Infrastructure debt 372 386 Emerging market debt – 554 High yield debt – 401
24,904 21,488 Growth assetsDeveloped market equity 25 281 Emerging market equity – 108 Unlisted property trusts 750 716 Infrastructure assets 894 903 Private equity 262 203 Alternatives 100 91
2,031 2,302 Total investments 26,935 23,790 Amounts maturing within 12 months 6,679 4,794 Amounts maturing in greater than 12 months 20,256 18,996 Total investments 26,935 23,790
At 31 December 2020, QBE had undrawn commitments to externally managed investment vehicles of $156 million (2019 $169 million).
How we account for the numbersThe Group's investments are required to be measured at fair value through profit or loss, with all investments managed and assessed on a fair value basis to maximise returns within risk appetites and investment strategy parameters and limits. They are therefore initially re-recognised at fair value, determined as the cost of acquisition excluding transaction costs, and are remeasured to fair value through profit or loss at each reporting date. The fair value hierarchy and the Group’s approach to measuring the fair value of each category of investment instrument are disclosed in note 3.2.1.
All purchases and sales of investments that require delivery of the asset within the time frame established by regulation or market convention are recognised at trade date, being the date on which the Group commits to buy or sell the asset. Investments are de-recognised when the right to receive future cash flows from the asset has expired or has been transferred and the Group has transferred substantially all the risks and rewards of ownership.
QB
E In
suran
ce Gro
up
A
nn
ual R
epo
rt 2020
107O
ther
info
rmatio
n
6
Fin
ancial
Rep
ort
5
Perfo
rman
ce o
verv
iew
1
Op
erating an
d
finan
cial review
2
Go
vern
ance
3
Directo
rs' R
epo
rt
4
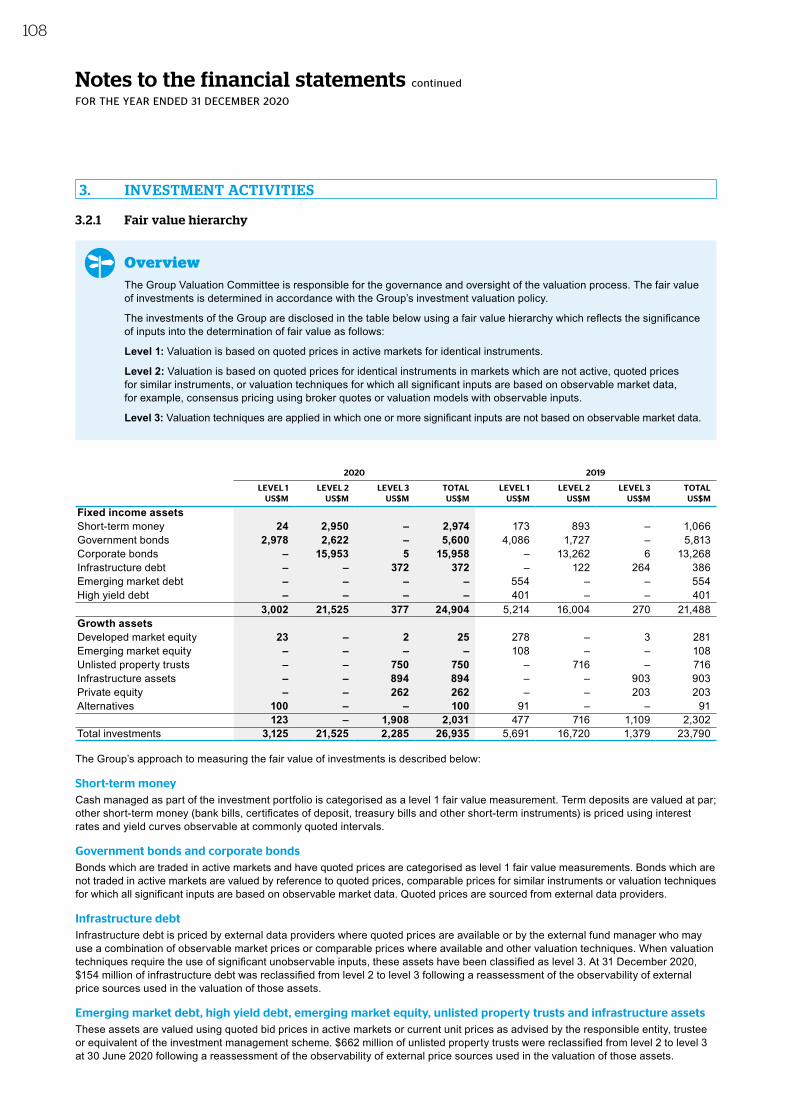
Notes to the financial statements continued
FOR THE YEAR ENDED 31 DECEMBER 2020
3.2.1 Fair value hierarchy
OverviewThe Group Valuation Committee is responsible for the governance and oversight of the valuation process. The fair value of investments is determined in accordance with the Group’s investment valuation policy.
The investments of the Group are disclosed in the table below using a fair value hierarchy which reflects the significance of inputs into the determination of fair value as follows:
Level 1: Valuation is based on quoted prices in active markets for identical instruments.
Level 2: Valuation is based on quoted prices for identical instruments in markets which are not active, quoted prices for similar instruments, or valuation techniques for which all significant inputs are based on observable market data, for example, consensus pricing using broker quotes or valuation models with observable inputs.
Level 3: Valuation techniques are applied in which one or more significant inputs are not based on observable market data.
2020 2019
LEVEL 1 LEVEL 2 LEVEL 3 TOTAL LEVEL 1 LEVEL 2 LEVEL 3 TOTALUS$M US$M US$M US$M US$M US$M US$M US$M
Fixed income assetsShort-term money 24 2,950 – 2,974 173 893 – 1,066Government bonds 2,978 2,622 – 5,600 4,086 1,727 – 5,813Corporate bonds – 15,953 5 15,958 – 13,262 6 13,268Infrastructure debt – – 372 372 – 122 264 386Emerging market debt – – – – 554 – – 554High yield debt – – – – 401 – – 401
3,002 21,525 377 24,904 5,214 16,004 270 21,488Growth assetsDeveloped market equity 23 – 2 25 278 – 3 281Emerging market equity – – – – 108 – – 108Unlisted property trusts – – 750 750 – 716 – 716Infrastructure assets – – 894 894 – – 903 903Private equity – – 262 262 – – 203 203Alternatives 100 – – 100 91 – – 91
123 – 1,908 2,031 477 716 1,109 2,302Total investments 3,125 21,525 2,285 26,935 5,691 16,720 1,379 23,790
The Group’s approach to measuring the fair value of investments is described below:
Short‑term moneyCash managed as part of the investment portfolio is categorised as a level 1 fair value measurement. Term deposits are valued at par; other short-term money (bank bills, certificates of deposit, treasury bills and other short-term instruments) is priced using interest rates and yield curves observable at commonly quoted intervals.
Government bonds and corporate bondsBonds which are traded in active markets and have quoted prices are categorised as level 1 fair value measurements. Bonds which are not traded in active markets are valued by reference to quoted prices, comparable prices for similar instruments or valuation techniques for which all significant inputs are based on observable market data. Quoted prices are sourced from external data providers.
Infrastructure debtInfrastructure debt is priced by external data providers where quoted prices are available or by the external fund manager who may use a combination of observable market prices or comparable prices where available and other valuation techniques. When valuation techniques require the use of significant unobservable inputs, these assets have been classified as level 3. At 31 December 2020, $154 million of infrastructure debt was reclassified from level 2 to level 3 following a reassessment of the observability of external price sources used in the valuation of those assets.
Emerging market debt, high yield debt, emerging market equity, unlisted property trusts and infrastructure assetsThese assets are valued using quoted bid prices in active markets or current unit prices as advised by the responsible entity, trustee or equivalent of the investment management scheme. $662 million of unlisted property trusts were reclassified from level 2 to level 3 at 30 June 2020 following a reassessment of the observability of external price sources used in the valuation of those assets.
3. INVESTMENT ACTIVITIES
108
Developed market equityListed equities traded in active markets are valued by reference to quoted bid prices. Unlisted equities are priced using QBE’s share of the net assets of the entity.
Private equityThese assets comprise limited partnerships and fund of funds vehicles. Fair value is based on the net asset value of the vehicle, and the responsibility for the valuation of the underlying securities lies with the external fund manager. In most cases, an independent administrator will be utilised by the external fund manager for pricing and valuation. When the most up to date information is not available at the balance date, management may consider a combination of other valuation techniques in the determination of fair value.
AlternativesThese assets comprise investments in exchange-traded commodity products. They are listed, traded in active markets and valued by reference to quoted bid prices.
Movements in level 3 investmentsThe following table provides an analysis of investments valued with reference to level 3 inputs:
2020 2019LEVEL 3 US$M US$M
At 1 January 1,379 1,374 Purchases 121 151 Disposals (146) (194)Reclassifications from level 2 816 – Fair value movement recognised in profit or loss 17 46 Foreign exchange 98 2 At 31 December 2,285 1,379
3.2.2 Charges over investments and restrictions on useA controlled entity has given fixed and floating charges over certain of its investments and other assets in order to secure the obligations of the Group’s corporate members at Lloyd’s as described in note 8.2.
Included in investments are amounts totalling $3,071 million (2019 $2,900 million) which are held in Lloyd’s syndicate trust funds. In order to conduct underwriting business within some territories, Lloyd’s syndicates are required to lodge assets in locally regulated trust funds. Under Lloyd’s bylaws, these amounts can only be used to pay claims and allowable expenses of the syndicate and cannot be withdrawn from the trust funds until they become distributable as profit once annual solvency requirements are met. Included in this amount is $164 million (2019 $31 million) of short-term money.
3.2.3 Derivatives over investment assetsIn accordance with our investment management policies and procedures, derivatives may be used in the investment portfolio as both a hedging tool and to alter the risk profile of the portfolio. All long positions must be cash backed, all short positions must be covered by an underlying physical asset and no net short exposure to an asset class is permitted. Risk management policies over the use of derivatives are set out in note 4.
QBE may also have exposure to derivatives through investments in underlying pooled funds in accordance with the fund mandate. Those derivative exposures are not included in the table below.
The Group’s notional exposure to investment derivatives at the balance date is set out in the table below:
2020 2019NOTIONAL EXPOSURE US$M US$M
Bond futuresUS 5 year note future (403) –
How we account for the numbersDerivatives over investment assets are required to be measured at fair value through profit or loss. They are therefore initially recognised at fair value, determined as the cost of acquisition excluding transaction costs, and are remeasured to fair value through profit or loss at each reporting date. For derivatives traded in an active market, the fair value of derivatives is determined by reference to quoted market prices. The mark-to-market value of futures positions is cash settled on a daily basis resulting in a fair value of nil at the balance date.
QB
E In
suran
ce Gro
up
A
nn
ual R
epo
rt 2020
109
Oth
er in
form
ation
6
Fin
ancial
Rep
ort
5
Perfo
rman
ce o
verv
iew
1
Op
erating an
d
finan
cial review
2
Go
vern
ance
3
Directo
rs' R
epo
rt
4

Notes to the financial statements continued
FOR THE YEAR ENDED 31 DECEMBER 2020
3.2.1 Fair value hierarchy
OverviewThe Group Valuation Committee is responsible for the governance and oversight of the valuation process. The fair value of investments is determined in accordance with the Group’s investment valuation policy.
The investments of the Group are disclosed in the table below using a fair value hierarchy which reflects the significance of inputs into the determination of fair value as follows:
Level 1: Valuation is based on quoted prices in active markets for identical instruments.
Level 2: Valuation is based on quoted prices for identical instruments in markets which are not active, quoted prices for similar instruments, or valuation techniques for which all significant inputs are based on observable market data, for example, consensus pricing using broker quotes or valuation models with observable inputs.
Level 3: Valuation techniques are applied in which one or more significant inputs are not based on observable market data.
2020 2019
LEVEL 1 LEVEL 2 LEVEL 3 TOTAL LEVEL 1 LEVEL 2 LEVEL 3 TOTALUS$M US$M US$M US$M US$M US$M US$M US$M
Fixed income assetsShort-term money 24 2,950 – 2,974 173 893 – 1,066Government bonds 2,978 2,622 – 5,600 4,086 1,727 – 5,813Corporate bonds – 15,953 5 15,958 – 13,262 6 13,268Infrastructure debt – – 372 372 – 122 264 386Emerging market debt – – – – 554 – – 554High yield debt – – – – 401 – – 401
3,002 21,525 377 24,904 5,214 16,004 270 21,488Growth assetsDeveloped market equity 23 – 2 25 278 – 3 281Emerging market equity – – – – 108 – – 108Unlisted property trusts – – 750 750 – 716 – 716Infrastructure assets – – 894 894 – – 903 903Private equity – – 262 262 – – 203 203Alternatives 100 – – 100 91 – – 91
123 – 1,908 2,031 477 716 1,109 2,302Total investments 3,125 21,525 2,285 26,935 5,691 16,720 1,379 23,790
The Group’s approach to measuring the fair value of investments is described below:
Short‑term moneyCash managed as part of the investment portfolio is categorised as a level 1 fair value measurement. Term deposits are valued at par; other short-term money (bank bills, certificates of deposit, treasury bills and other short-term instruments) is priced using interest rates and yield curves observable at commonly quoted intervals.
Government bonds and corporate bondsBonds which are traded in active markets and have quoted prices are categorised as level 1 fair value measurements. Bonds which are not traded in active markets are valued by reference to quoted prices, comparable prices for similar instruments or valuation techniques for which all significant inputs are based on observable market data. Quoted prices are sourced from external data providers.
Infrastructure debtInfrastructure debt is priced by external data providers where quoted prices are available or by the external fund manager who may use a combination of observable market prices or comparable prices where available and other valuation techniques. When valuation techniques require the use of significant unobservable inputs, these assets have been classified as level 3. At 31 December 2020, $154 million of infrastructure debt was reclassified from level 2 to level 3 following a reassessment of the observability of external price sources used in the valuation of those assets.
Emerging market debt, high yield debt, emerging market equity, unlisted property trusts and infrastructure assetsThese assets are valued using quoted bid prices in active markets or current unit prices as advised by the responsible entity, trustee or equivalent of the investment management scheme. $662 million of unlisted property trusts were reclassified from level 2 to level 3 at 30 June 2020 following a reassessment of the observability of external price sources used in the valuation of those assets.
3. INVESTMENT ACTIVITIES
108
Developed market equityListed equities traded in active markets are valued by reference to quoted bid prices. Unlisted equities are priced using QBE’s share of the net assets of the entity.
Private equityThese assets comprise limited partnerships and fund of funds vehicles. Fair value is based on the net asset value of the vehicle, and the responsibility for the valuation of the underlying securities lies with the external fund manager. In most cases, an independent administrator will be utilised by the external fund manager for pricing and valuation. When the most up to date information is not available at the balance date, management may consider a combination of other valuation techniques in the determination of fair value.
AlternativesThese assets comprise investments in exchange-traded commodity products. They are listed, traded in active markets and valued by reference to quoted bid prices.
Movements in level 3 investmentsThe following table provides an analysis of investments valued with reference to level 3 inputs:
2020 2019LEVEL 3 US$M US$M
At 1 January 1,379 1,374 Purchases 121 151 Disposals (146) (194)Reclassifications from level 2 816 – Fair value movement recognised in profit or loss 17 46 Foreign exchange 98 2 At 31 December 2,285 1,379
3.2.2 Charges over investments and restrictions on useA controlled entity has given fixed and floating charges over certain of its investments and other assets in order to secure the obligations of the Group’s corporate members at Lloyd’s as described in note 8.2.
Included in investments are amounts totalling $3,071 million (2019 $2,900 million) which are held in Lloyd’s syndicate trust funds. In order to conduct underwriting business within some territories, Lloyd’s syndicates are required to lodge assets in locally regulated trust funds. Under Lloyd’s bylaws, these amounts can only be used to pay claims and allowable expenses of the syndicate and cannot be withdrawn from the trust funds until they become distributable as profit once annual solvency requirements are met. Included in this amount is $164 million (2019 $31 million) of short-term money.
3.2.3 Derivatives over investment assetsIn accordance with our investment management policies and procedures, derivatives may be used in the investment portfolio as both a hedging tool and to alter the risk profile of the portfolio. All long positions must be cash backed, all short positions must be covered by an underlying physical asset and no net short exposure to an asset class is permitted. Risk management policies over the use of derivatives are set out in note 4.
QBE may also have exposure to derivatives through investments in underlying pooled funds in accordance with the fund mandate. Those derivative exposures are not included in the table below.
The Group’s notional exposure to investment derivatives at the balance date is set out in the table below:
2020 2019NOTIONAL EXPOSURE US$M US$M
Bond futuresUS 5 year note future (403) –
How we account for the numbersDerivatives over investment assets are required to be measured at fair value through profit or loss. They are therefore initially recognised at fair value, determined as the cost of acquisition excluding transaction costs, and are remeasured to fair value through profit or loss at each reporting date. For derivatives traded in an active market, the fair value of derivatives is determined by reference to quoted market prices. The mark-to-market value of futures positions is cash settled on a daily basis resulting in a fair value of nil at the balance date.
QB
E In
suran
ce Gro
up
A
nn
ual R
epo
rt 2020
109O
ther
info
rmatio
n
6
Fin
ancial
Rep
ort
5
Perfo
rman
ce o
verv
iew
1
Op
erating an
d
finan
cial review
2
Go
vern
ance
3
Directo
rs' R
epo
rt
4
Notes to the financial statements continued
FOR THE YEAR ENDED 31 DECEMBER 2020
4. RISK MANAGEMENT
OverviewQBE is in the business of managing risk. The Group’s ability to satisfy customers’ risk management needs is central to what we do. QBE aims to generate wealth and maximise returns for its shareholders by pursuing opportunities that involve risk. Our people are responsible for ensuring that QBE’s risks are managed and controlled on a day-to-day basis. QBE aims to use its ability to properly manage risk to provide more certainty and improved outcomes for all stakeholders.
QBE applies a consistent and integrated approach to enterprise risk management (ERM). QBE’s framework for managing risk sets out the approach to managing risk effectively to meet strategic objectives while taking into account the creation of value for our shareholders. QBE’s ERM framework is articulated in the Group Risk Management Strategy (RMS) and Reinsurance Management Strategy (REMS), both of which are approved annually by the Group Board and lodged with APRA.
The ERM framework consists of complementary elements that are embedded throughout the business management cycle and culture of the organisation. Key aspects include risk appetite, governance, reporting, risk identification and measurement, modelling and stress testing, risk systems, and risk culture.
Risk management is a continuous process and an integral part of robust business management. QBE’s approach is to integrate risk management into the broader management processes of the organisation. It is QBE’s philosophy to ensure that risk management remains embedded in the business and that the risk makers or risk takers are themselves the risk managers. Specifically, the management of risk must occur at each point in the business management cycle.
QBE Group’s strategy for managing risk is to:• achieve competitive advantage by better understanding the risk environments in which we operate; • give confidence to the business to make objective, risk-based decisions to optimise returns; and• avoid unwelcome surprises to the achievement of business objectives by reducing uncertainty and volatility through the
identification and management of risks.
The framework is supported by a suite of policies that detail QBE’s approach to the key risk categories used by QBE to classify risk as follows: • strategic risk (note 4.1);• insurance risk (note 4.2);• credit risk (note 4.3);• market risk (note 4.4);• liquidity risk (note 4.5);• operational risk (note 4.6);• compliance risk (note 4.7); and• group risk (note 4.8).
110
4.1 Strategic risk
OverviewStrategic risk is the current and prospective impact on earnings and/or capital arising from strategic business decisions and responsiveness to external change. QBE classifies strategic risk into six subcategories, as follows:• Performance risk: QBE is not able to achieve its performance objectives.• Capital risk: QBE’s structure and availability of capital does not meet regulatory requirements and/or support
strategic initiatives.• Reputational risk: QBE’s stakeholders have a negative perception of QBE’s brand which may damage QBE’s
reputation and threaten overall performance.• Environmental, social and governance (ESG) risk: Negative impact on QBE’s strategic priorities or objectives from
environmental, social or governance issues.• Emerging risk: New or future risks which are difficult to assess but may have a significant impact to QBE or the
markets in which it operates.• Risk culture: The norms of behaviour within QBE that determine the organisation’s ability to understand, discuss and
act on current and future risks.
QBE’s approach to managing strategic risk is underpinned by the Group strategic risk appetite statement as set by the Group Board and is summarised below.
Performance riskFailure to deliver acceptable performance can result in shareholders losing confidence in QBE, impacting our reputation in the market and ultimately impacting our ability to deliver our strategic objectives.
QBE monitors performance risk by assessing changing levels of risk in the business plan, and taking action accordingly prior to signing-off the plan and making market commitments.
Capital riskThe Internal Capital Adequacy Assessment Process (ICAAP) outlines QBE’s approach for ensuring adequate Group capital is maintained over time and for monitoring compliance with regulatory capital requirements and targets. The ICAAP includes:• specific capital targets set in the context of QBE’s risk profile, the Board’s risk appetite and regulatory capital requirements;• plans for how target levels of capital are to be met; and• potential sources of additional capital, if required.
The ICAAP also sets out QBE’s actions and procedures for monitoring compliance with its regulatory capital requirements and capital targets. These include:• the setting of triggers to alert management to potential breaches of these requirements; and• actions to avert and rectify potential breaches of these requirements.
Achieving capital targets is dependent on an appropriate level and mix of capital, and effective capital management to yield adequate returns. Oversight of the Group's capital management framework is performed by senior management, the Executive Financial Risk & Capital Committee and the Board Risk & Capital Committee.
Management has a particular focus on the following performance indicators:• The Group actively manages the components of capital in order to maintain a level of eligible regulatory capital that exceeds APRA
requirements. Having determined that the current risk appetite remains appropriate, the Board has set the target level of regulatory capital for 2020 at 1.6–1.8 times (2019 1.6–1.8 times) the Group’s Prescribed Capital Amount (PCA).
• All regulated controlled entities are required to maintain a minimum level of capital to meet obligations to policyholders. It is the Group’s policy that each regulated entity maintains a capital base appropriate to its size, business mix, complexity and risk profile which fully complies with and meets or exceeds local regulatory requirements.
• The Group aims to maintain the ratio of borrowings to shareholders’ equity at 25%–35% (2019 25%–35%). At the balance date, the ratio of borrowings to shareholders’ equity was 34.8% (2019 38.0%) reflecting the benefits of active liability management activity.
• Insurer financial strength ratings are provided by the major rating agencies which indicate the Group’s financial strength and claims paying ability.
QB
E In
suran
ce Gro
up
A
nn
ual R
epo
rt 2020
111
Oth
er in
form
ation
6
Fin
ancial
Rep
ort
5
Perfo
rman
ce o
verv
iew
1
Op
erating an
d
finan
cial review
2
Go
vern
ance
3
Directo
rs' R
epo
rt
4
Notes to the financial statements continued
FOR THE YEAR ENDED 31 DECEMBER 2020
4. RISK MANAGEMENT
OverviewQBE is in the business of managing risk. The Group’s ability to satisfy customers’ risk management needs is central to what we do. QBE aims to generate wealth and maximise returns for its shareholders by pursuing opportunities that involve risk. Our people are responsible for ensuring that QBE’s risks are managed and controlled on a day-to-day basis. QBE aims to use its ability to properly manage risk to provide more certainty and improved outcomes for all stakeholders.
QBE applies a consistent and integrated approach to enterprise risk management (ERM). QBE’s framework for managing risk sets out the approach to managing risk effectively to meet strategic objectives while taking into account the creation of value for our shareholders. QBE’s ERM framework is articulated in the Group Risk Management Strategy (RMS) and Reinsurance Management Strategy (REMS), both of which are approved annually by the Group Board and lodged with APRA.
The ERM framework consists of complementary elements that are embedded throughout the business management cycle and culture of the organisation. Key aspects include risk appetite, governance, reporting, risk identification and measurement, modelling and stress testing, risk systems, and risk culture.
Risk management is a continuous process and an integral part of robust business management. QBE’s approach is to integrate risk management into the broader management processes of the organisation. It is QBE’s philosophy to ensure that risk management remains embedded in the business and that the risk makers or risk takers are themselves the risk managers. Specifically, the management of risk must occur at each point in the business management cycle.
QBE Group’s strategy for managing risk is to:• achieve competitive advantage by better understanding the risk environments in which we operate; • give confidence to the business to make objective, risk-based decisions to optimise returns; and• avoid unwelcome surprises to the achievement of business objectives by reducing uncertainty and volatility through the
identification and management of risks.
The framework is supported by a suite of policies that detail QBE’s approach to the key risk categories used by QBE to classify risk as follows: • strategic risk (note 4.1);• insurance risk (note 4.2);• credit risk (note 4.3);• market risk (note 4.4);• liquidity risk (note 4.5);• operational risk (note 4.6);• compliance risk (note 4.7); and• group risk (note 4.8).
110
4.1 Strategic risk
OverviewStrategic risk is the current and prospective impact on earnings and/or capital arising from strategic business decisions and responsiveness to external change. QBE classifies strategic risk into six subcategories, as follows:• Performance risk: QBE is not able to achieve its performance objectives.• Capital risk: QBE’s structure and availability of capital does not meet regulatory requirements and/or support
strategic initiatives.• Reputational risk: QBE’s stakeholders have a negative perception of QBE’s brand which may damage QBE’s
reputation and threaten overall performance.• Environmental, social and governance (ESG) risk: Negative impact on QBE’s strategic priorities or objectives from
environmental, social or governance issues.• Emerging risk: New or future risks which are difficult to assess but may have a significant impact to QBE or the
markets in which it operates.• Risk culture: The norms of behaviour within QBE that determine the organisation’s ability to understand, discuss and
act on current and future risks.
QBE’s approach to managing strategic risk is underpinned by the Group strategic risk appetite statement as set by the Group Board and is summarised below.
Performance riskFailure to deliver acceptable performance can result in shareholders losing confidence in QBE, impacting our reputation in the market and ultimately impacting our ability to deliver our strategic objectives.
QBE monitors performance risk by assessing changing levels of risk in the business plan, and taking action accordingly prior to signing-off the plan and making market commitments.
Capital riskThe Internal Capital Adequacy Assessment Process (ICAAP) outlines QBE’s approach for ensuring adequate Group capital is maintained over time and for monitoring compliance with regulatory capital requirements and targets. The ICAAP includes:• specific capital targets set in the context of QBE’s risk profile, the Board’s risk appetite and regulatory capital requirements;• plans for how target levels of capital are to be met; and• potential sources of additional capital, if required.
The ICAAP also sets out QBE’s actions and procedures for monitoring compliance with its regulatory capital requirements and capital targets. These include:• the setting of triggers to alert management to potential breaches of these requirements; and• actions to avert and rectify potential breaches of these requirements.
Achieving capital targets is dependent on an appropriate level and mix of capital, and effective capital management to yield adequate returns. Oversight of the Group's capital management framework is performed by senior management, the Executive Financial Risk & Capital Committee and the Board Risk & Capital Committee.
Management has a particular focus on the following performance indicators:• The Group actively manages the components of capital in order to maintain a level of eligible regulatory capital that exceeds APRA
requirements. Having determined that the current risk appetite remains appropriate, the Board has set the target level of regulatory capital for 2020 at 1.6–1.8 times (2019 1.6–1.8 times) the Group’s Prescribed Capital Amount (PCA).
• All regulated controlled entities are required to maintain a minimum level of capital to meet obligations to policyholders. It is the Group’s policy that each regulated entity maintains a capital base appropriate to its size, business mix, complexity and risk profile which fully complies with and meets or exceeds local regulatory requirements.
• The Group aims to maintain the ratio of borrowings to shareholders’ equity at 25%–35% (2019 25%–35%). At the balance date, the ratio of borrowings to shareholders’ equity was 34.8% (2019 38.0%) reflecting the benefits of active liability management activity.
• Insurer financial strength ratings are provided by the major rating agencies which indicate the Group’s financial strength and claims paying ability.
QB
E In
suran
ce Gro
up
A
nn
ual R
epo
rt 2020
111O
ther
info
rmatio
n
6
Fin
ancial
Rep
ort
5
Perfo
rman
ce o
verv
iew
1
Op
erating an
d
finan
cial review
2
Go
vern
ance
3
Directo
rs' R
epo
rt
4

Notes to the financial statements continued
FOR THE YEAR ENDED 31 DECEMBER 2020
Reputational riskQBE assesses reputational risk through the quality of the relationships with key stakeholders, including shareholders, regulators, customers, government, communities, employees, and third-party partners including distributors and suppliers. Each of these relationships is managed through divisional and group teams, including corporate affairs, human resources, regulatory, compliance and distribution teams.
ESG and emerging risksQBE’s ESG risk and emerging risk standards operationalise QBE’s approach to managing ESG and emerging risks respectively, including climate change. Biannual horizon scans are performed on ESG and emerging risks, including assessment of potential financial and reputational impacts to the Group. Risk treatment plans are developed for material risks, which include development of underwriting and investment policy, monitoring frameworks and stress and scenario analysis. ESG and emerging risks are regularly reported to the Executive Non-Financial Risk Committee and the Board Risk & Capital Committee.
Climate change is a material business risk for QBE, potentially impacting our business and customers in the medium to long term. We have considered potential short-term scenarios that could affect our insurance business written to date and our current investments, and we expect no material impact on the amounts recognised or disclosed in the financial statements. Further detail on QBE’s approach to climate change, is included in our climate change disclosures on pages 28 to 35 of this Annual Report.
Risk cultureRisk culture forms part of QBE’s risk management strategy and is a key component of the ERM framework, which outlines how risk culture applies to QBE’s people and how it is operationalised across QBE.
QBE is committed to, and supports, a strong risk culture. It recognises the importance of risk awareness and culture as being instrumental in the effectiveness of the ERM framework. Further information on risk culture is provided on page 36 of this Annual Report.
4.2 Insurance risk
OverviewInsurance risk is the risk of fluctuations in the timing, frequency and severity of insured events and claims settlements, relative to expectations.
QBE classifies insurance risk into three subcategories, as follows:• underwriting/pricing risk;• insurance concentration risk; and• reserving risk.
QBE’s approach to managing insurance risk is underpinned by the Group’s insurance risk appetite statement which is set by the Board and is summarised below.
4. RISK MANAGEMENT
112
Underwriting/pricing riskQBE manages underwriting/pricing risk by appropriately setting and adjusting underwriting strategy, risk selection and pricing practices throughout the underwriting cycle.
QBE’s underwriting strategy aims to diversify and limit the type of insurance risks accepted and reduce the variability of the expected outcome. The underwriting strategy is implemented through QBE’s annual business planning process, supported by minimum underwriting standards and delegated authorities. These authorities reflect the level of risk that the Group is prepared to take with respect to each permitted insurance class.
Pricing of risks is controlled by the use of in-house pricing models relevant to specific portfolios and the markets in which QBE operates. Underwriters and actuaries maintain pricing and claims analysis for each portfolio, combined with a knowledge of current developments in the respective markets and classes of business.
Insurance concentration riskQBE’s exposure to concentrations of insurance risk is mitigated by maintaining a business portfolio that is diversified across countries and classes of business. Product diversification is pursued through a strategy of developing strong underwriting skills in a wide variety of classes of business.
The table below demonstrates the diversity of QBE’s operations:
2020 2019GROSS EARNED PREMIUM REVENUE US$M US$M
Commercial and domestic property 4,194 3,900 Motor and motor casualty 1,750 1,953 Agriculture 1,957 1,807 Public/product liability 1,647 1,505 Professional indemnity 1,263 1,105 Marine, energy & aviation 1,098 880 Workers’ compensation 847 885 Accident and health 727 716 Financial and credit 465 475 Other 60 31
14,008 13,257
Insurance concentration risk includes the risks from natural or man-made events that have the potential to produce claims from many of the Group’s policyholders at the same time (e.g. catastrophes). QBE currently uses a variety of methodologies to monitor aggregates and manage catastrophe risk. These include the use of catastrophe models from third-party vendors such as RMS and AIR, the Lloyd’s realistic disaster scenarios and group aggregate methodology. QBE sets the risk appetite relating to catastrophe risk with reference to the insurance concentration risk charge (ICRC). QBE’s maximum risk tolerance for an individual natural catastrophe, measured using the ICRC methodology, is determined annually and is linked to a maximum net aggregate allowance of catastrophe and large individual risk claims.
Reserving riskReserving risk is managed through the quarterly actuarial valuation of insurance liabilities and monitoring of the probability of adequacy of the net discounted central estimate. The valuation of the net discounted central estimate is performed by qualified and experienced actuaries, with reference to historical data and reasoned expectations of future experience and events. The net discounted central estimate of outstanding claims is subject to a comprehensive independent review at least annually.
QB
E In
suran
ce Gro
up
A
nn
ual R
epo
rt 2020
113
Oth
er in
form
ation
6
Fin
ancial
Rep
ort
5
Perfo
rman
ce o
verv
iew
1
Op
erating an
d
finan
cial review
2
Go
vern
ance
3
Directo
rs' R
epo
rt
4
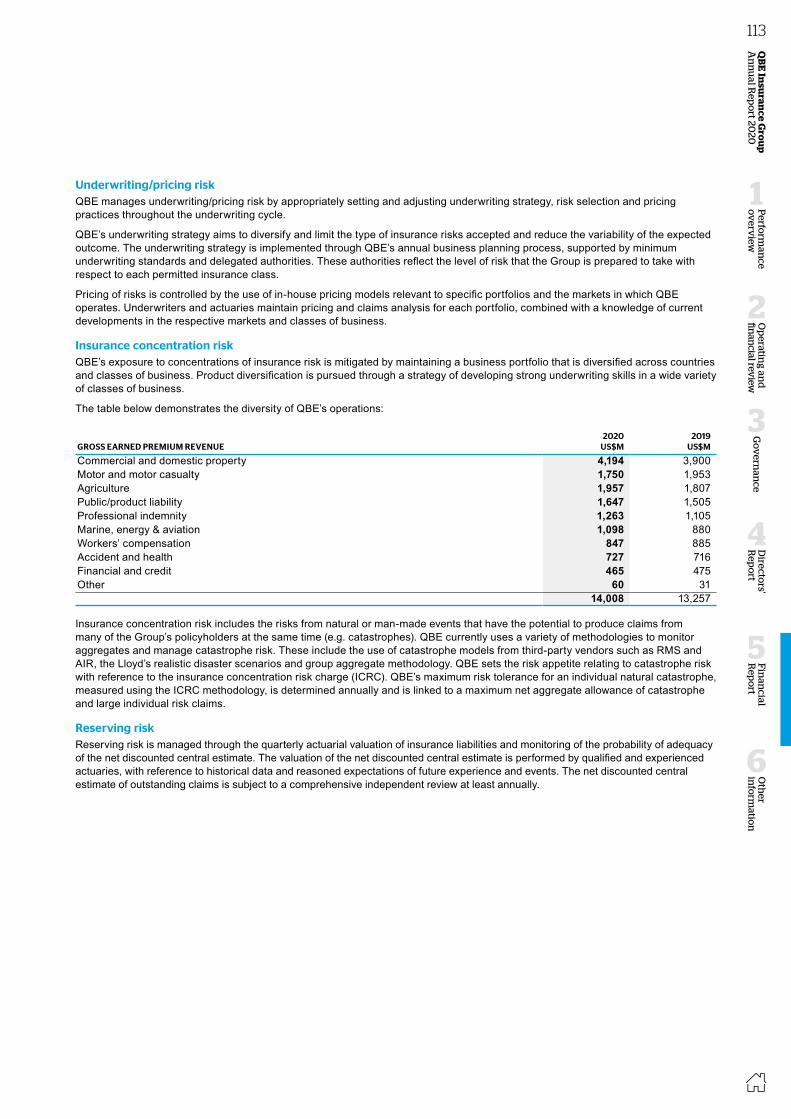
Notes to the financial statements continued
FOR THE YEAR ENDED 31 DECEMBER 2020
Reputational riskQBE assesses reputational risk through the quality of the relationships with key stakeholders, including shareholders, regulators, customers, government, communities, employees, and third-party partners including distributors and suppliers. Each of these relationships is managed through divisional and group teams, including corporate affairs, human resources, regulatory, compliance and distribution teams.
ESG and emerging risksQBE’s ESG risk and emerging risk standards operationalise QBE’s approach to managing ESG and emerging risks respectively, including climate change. Biannual horizon scans are performed on ESG and emerging risks, including assessment of potential financial and reputational impacts to the Group. Risk treatment plans are developed for material risks, which include development of underwriting and investment policy, monitoring frameworks and stress and scenario analysis. ESG and emerging risks are regularly reported to the Executive Non-Financial Risk Committee and the Board Risk & Capital Committee.
Climate change is a material business risk for QBE, potentially impacting our business and customers in the medium to long term. We have considered potential short-term scenarios that could affect our insurance business written to date and our current investments, and we expect no material impact on the amounts recognised or disclosed in the financial statements. Further detail on QBE’s approach to climate change, is included in our climate change disclosures on pages 28 to 35 of this Annual Report.
Risk cultureRisk culture forms part of QBE’s risk management strategy and is a key component of the ERM framework, which outlines how risk culture applies to QBE’s people and how it is operationalised across QBE.
QBE is committed to, and supports, a strong risk culture. It recognises the importance of risk awareness and culture as being instrumental in the effectiveness of the ERM framework. Further information on risk culture is provided on page 36 of this Annual Report.
4.2 Insurance risk
OverviewInsurance risk is the risk of fluctuations in the timing, frequency and severity of insured events and claims settlements, relative to expectations.
QBE classifies insurance risk into three subcategories, as follows:• underwriting/pricing risk;• insurance concentration risk; and• reserving risk.
QBE’s approach to managing insurance risk is underpinned by the Group’s insurance risk appetite statement which is set by the Board and is summarised below.
4. RISK MANAGEMENT
112
Underwriting/pricing riskQBE manages underwriting/pricing risk by appropriately setting and adjusting underwriting strategy, risk selection and pricing practices throughout the underwriting cycle.
QBE’s underwriting strategy aims to diversify and limit the type of insurance risks accepted and reduce the variability of the expected outcome. The underwriting strategy is implemented through QBE’s annual business planning process, supported by minimum underwriting standards and delegated authorities. These authorities reflect the level of risk that the Group is prepared to take with respect to each permitted insurance class.
Pricing of risks is controlled by the use of in-house pricing models relevant to specific portfolios and the markets in which QBE operates. Underwriters and actuaries maintain pricing and claims analysis for each portfolio, combined with a knowledge of current developments in the respective markets and classes of business.
Insurance concentration riskQBE’s exposure to concentrations of insurance risk is mitigated by maintaining a business portfolio that is diversified across countries and classes of business. Product diversification is pursued through a strategy of developing strong underwriting skills in a wide variety of classes of business.
The table below demonstrates the diversity of QBE’s operations:
2020 2019GROSS EARNED PREMIUM REVENUE US$M US$M
Commercial and domestic property 4,194 3,900 Motor and motor casualty 1,750 1,953 Agriculture 1,957 1,807 Public/product liability 1,647 1,505 Professional indemnity 1,263 1,105 Marine, energy & aviation 1,098 880 Workers’ compensation 847 885 Accident and health 727 716 Financial and credit 465 475 Other 60 31
14,008 13,257
Insurance concentration risk includes the risks from natural or man-made events that have the potential to produce claims from many of the Group’s policyholders at the same time (e.g. catastrophes). QBE currently uses a variety of methodologies to monitor aggregates and manage catastrophe risk. These include the use of catastrophe models from third-party vendors such as RMS and AIR, the Lloyd’s realistic disaster scenarios and group aggregate methodology. QBE sets the risk appetite relating to catastrophe risk with reference to the insurance concentration risk charge (ICRC). QBE’s maximum risk tolerance for an individual natural catastrophe, measured using the ICRC methodology, is determined annually and is linked to a maximum net aggregate allowance of catastrophe and large individual risk claims.
Reserving riskReserving risk is managed through the quarterly actuarial valuation of insurance liabilities and monitoring of the probability of adequacy of the net discounted central estimate. The valuation of the net discounted central estimate is performed by qualified and experienced actuaries, with reference to historical data and reasoned expectations of future experience and events. The net discounted central estimate of outstanding claims is subject to a comprehensive independent review at least annually.
QB
E In
suran
ce Gro
up
A
nn
ual R
epo
rt 2020
113O
ther
info
rmatio
n
6
Fin
ancial
Rep
ort
5
Perfo
rman
ce o
verv
iew
1
Op
erating an
d
finan
cial review
2
Go
vern
ance
3
Directo
rs' R
epo
rt
4
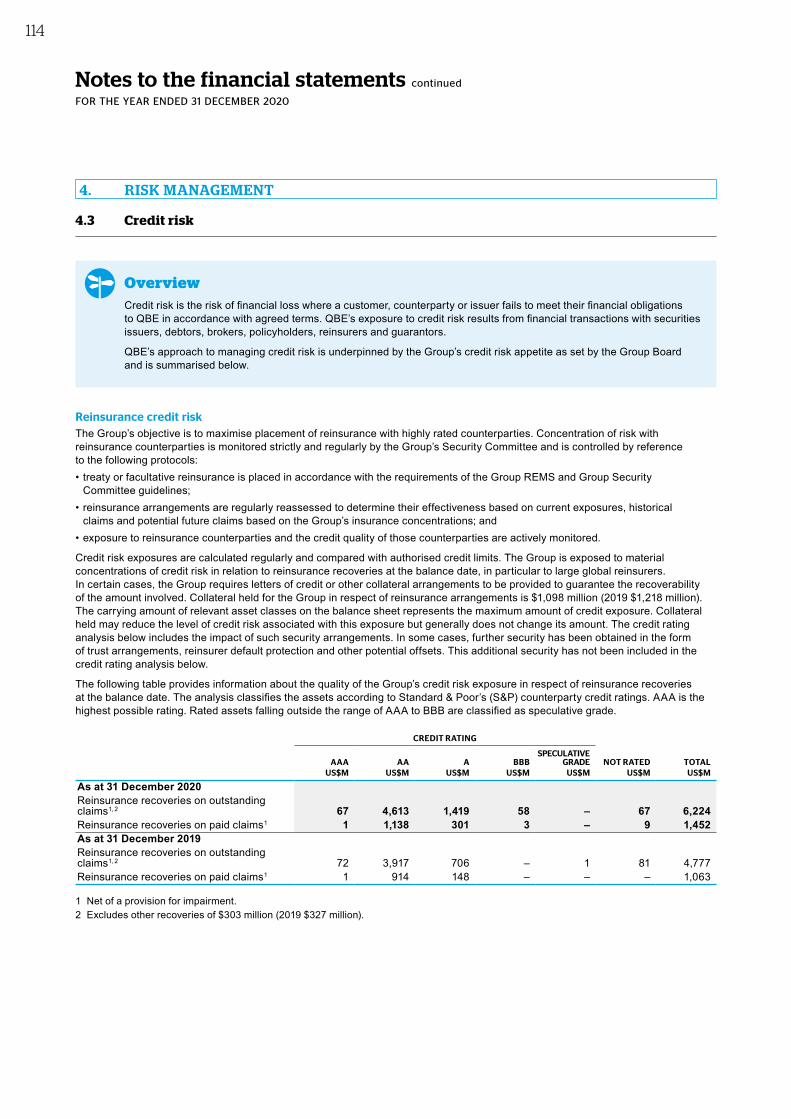
Notes to the financial statements continued
FOR THE YEAR ENDED 31 DECEMBER 2020
4.3 Credit risk
OverviewCredit risk is the risk of financial loss where a customer, counterparty or issuer fails to meet their financial obligations to QBE in accordance with agreed terms. QBE’s exposure to credit risk results from financial transactions with securities issuers, debtors, brokers, policyholders, reinsurers and guarantors.
QBE’s approach to managing credit risk is underpinned by the Group’s credit risk appetite as set by the Group Board and is summarised below.
Reinsurance credit riskThe Group’s objective is to maximise placement of reinsurance with highly rated counterparties. Concentration of risk with reinsurance counterparties is monitored strictly and regularly by the Group’s Security Committee and is controlled by reference to the following protocols:• treaty or facultative reinsurance is placed in accordance with the requirements of the Group REMS and Group Security
Committee guidelines;• reinsurance arrangements are regularly reassessed to determine their effectiveness based on current exposures, historical
claims and potential future claims based on the Group’s insurance concentrations; and• exposure to reinsurance counterparties and the credit quality of those counterparties are actively monitored.
Credit risk exposures are calculated regularly and compared with authorised credit limits. The Group is exposed to material concentrations of credit risk in relation to reinsurance recoveries at the balance date, in particular to large global reinsurers. In certain cases, the Group requires letters of credit or other collateral arrangements to be provided to guarantee the recoverability of the amount involved. Collateral held for the Group in respect of reinsurance arrangements is $1,098 million (2019 $1,218 million). The carrying amount of relevant asset classes on the balance sheet represents the maximum amount of credit exposure. Collateral held may reduce the level of credit risk associated with this exposure but generally does not change its amount. The credit rating analysis below includes the impact of such security arrangements. In some cases, further security has been obtained in the form of trust arrangements, reinsurer default protection and other potential offsets. This additional security has not been included in the credit rating analysis below.
The following table provides information about the quality of the Group’s credit risk exposure in respect of reinsurance recoveries at the balance date. The analysis classifies the assets according to Standard & Poor’s (S&P) counterparty credit ratings. AAA is the highest possible rating. Rated assets falling outside the range of AAA to BBB are classified as speculative grade.
CREDIT RATING
AAA AA A BBBSPECULATIVE
GRADE NOT RATED TOTALUS$M US$M US$M US$M US$M US$M US$M
As at 31 December 2020Reinsurance recoveries on outstanding claims1, 2 67 4,613 1,419 58 – 67 6,224Reinsurance recoveries on paid claims1 1 1,138 301 3 – 9 1,452As at 31 December 2019Reinsurance recoveries on outstanding claims1, 2 72 3,917 706 – 1 81 4,777Reinsurance recoveries on paid claims1 1 914 148 – – – 1,063
1 Net of a provision for impairment.2 Excludes other recoveries of $303 million (2019 $327 million).
4. RISK MANAGEMENT
114
The following table provides further information regarding the ageing of reinsurance recoveries on paid claims at the balance date:
PAST DUE BUT NOT IMPAIRED
NEITHER PAST
DUE NOR IMPAIRED
0 TO 3 MONTHS
4 TO 6 MONTHS
7 MONTHS TO 1 YEAR
GREATER THAN
1 YEAR TOTALYEAR US$M US$M US$M US$M US$M US$M
Reinsurance recoveries on paid claims1 2020 1,014 304 76 31 27 1,4522019 844 153 – 48 18 1,063
1 Net of a provision for impairment.
Investment and treasury credit riskThe Group only transacts with investment counterparties within the limits outlined in the delegated authorities. Investment counterparty exposure limits are applied to individual counterparty exposures and to multiple exposures within a group of related companies in relation to investments, cash deposits and forward foreign exchange exposures. Counterparty exposure limit compliance is monitored daily.
The following table provides information regarding the Group’s aggregate credit risk exposure at the balance date in respect of the major classes of financial assets. Trade and other receivables are excluded from this analysis on the basis that they comprise smaller credit risk items which generally cannot be rated and are not individually material. The analysis classifies the assets according to S&P counterparty credit ratings. AAA is the highest possible rating. Rated assets falling outside the range of AAA to BBB are classified as speculative grade.
CREDIT RATING
AAA AA A BBBSPECULATIVE
GRADE NOT RATED TOTALUS$M US$M US$M US$M US$M US$M US$M
As at 31 December 2020Cash and cash equivalents 38 238 275 155 – 60 766Interest-bearing investments 2,947 9,509 8,982 3,427 – 39 24,904Derivative financial instruments – 217 115 186 – 1 520As at 31 December 2019Cash and cash equivalents – 125 218 157 1 46 547Interest-bearing investments 2,726 7,933 6,925 2,897 12 995 21,488Derivative financial instruments – 93 65 36 – 1 195
The carrying amount of the relevant asset classes on the balance sheet represents the maximum amount of credit exposure at the balance date. The fair value of derivatives shown on the balance sheet represents the current risk exposure but not the maximum risk exposure that could arise in the future as a result of changing values.
Insurance and other credit risk The Group transacts with brokers that are reputable, suitable and approved in accordance with local broker policies. The continuous due diligence over brokers involves an assessment of the broker’s reputation, regulatory standing and financial strength.
QBE regularly reviews the collectability of receivables and the adequacy of associated provisions for impairment. Concentration risk for large brokers is also monitored. Balances are monitored on the basis of uncollected debt and debt outstanding in excess of six months. Brokers are also subject to regular due diligence to ensure adherence to local broker policies and associated requirements.
The following table provides information regarding the ageing of the Group’s financial assets that are past due but not impaired and which are largely unrated at the balance date:
PAST DUE BUT NOT IMPAIRED
NEITHER PAST DUE NOR
IMPAIRED0 TO 3
MONTHS4 TO 6
MONTHS7 MONTHS TO 1 YEAR
GREATER THAN 1 YEAR TOTAL
US$M US$M US$M US$M US$M US$M
As at 31 December 2020Premium receivable1 2,425 334 159 50 22 2,990Other trade debtors 212 1 2 3 6 224Other receivables 353 4 1 1 6 365As at 31 December 2019Premium receivable1 2,107 372 119 70 39 2,707Other trade debtors 120 11 3 5 9 148Other receivables 322 7 1 2 1 333
1 Net of a provision for impairment.
QB
E In
suran
ce Gro
up
A
nn
ual R
epo
rt 2020
115
Oth
er in
form
ation
6
Fin
ancial
Rep
ort
5
Perfo
rman
ce o
verv
iew
1
Op
erating an
d
finan
cial review
2
Go
vern
ance
3
Directo
rs' R
epo
rt
4

Notes to the financial statements continued
FOR THE YEAR ENDED 31 DECEMBER 2020
4.3 Credit risk
OverviewCredit risk is the risk of financial loss where a customer, counterparty or issuer fails to meet their financial obligations to QBE in accordance with agreed terms. QBE’s exposure to credit risk results from financial transactions with securities issuers, debtors, brokers, policyholders, reinsurers and guarantors.
QBE’s approach to managing credit risk is underpinned by the Group’s credit risk appetite as set by the Group Board and is summarised below.
Reinsurance credit riskThe Group’s objective is to maximise placement of reinsurance with highly rated counterparties. Concentration of risk with reinsurance counterparties is monitored strictly and regularly by the Group’s Security Committee and is controlled by reference to the following protocols:• treaty or facultative reinsurance is placed in accordance with the requirements of the Group REMS and Group Security
Committee guidelines;• reinsurance arrangements are regularly reassessed to determine their effectiveness based on current exposures, historical
claims and potential future claims based on the Group’s insurance concentrations; and• exposure to reinsurance counterparties and the credit quality of those counterparties are actively monitored.
Credit risk exposures are calculated regularly and compared with authorised credit limits. The Group is exposed to material concentrations of credit risk in relation to reinsurance recoveries at the balance date, in particular to large global reinsurers. In certain cases, the Group requires letters of credit or other collateral arrangements to be provided to guarantee the recoverability of the amount involved. Collateral held for the Group in respect of reinsurance arrangements is $1,098 million (2019 $1,218 million). The carrying amount of relevant asset classes on the balance sheet represents the maximum amount of credit exposure. Collateral held may reduce the level of credit risk associated with this exposure but generally does not change its amount. The credit rating analysis below includes the impact of such security arrangements. In some cases, further security has been obtained in the form of trust arrangements, reinsurer default protection and other potential offsets. This additional security has not been included in the credit rating analysis below.
The following table provides information about the quality of the Group’s credit risk exposure in respect of reinsurance recoveries at the balance date. The analysis classifies the assets according to Standard & Poor’s (S&P) counterparty credit ratings. AAA is the highest possible rating. Rated assets falling outside the range of AAA to BBB are classified as speculative grade.
CREDIT RATING
AAA AA A BBBSPECULATIVE
GRADE NOT RATED TOTALUS$M US$M US$M US$M US$M US$M US$M
As at 31 December 2020Reinsurance recoveries on outstanding claims1, 2 67 4,613 1,419 58 – 67 6,224Reinsurance recoveries on paid claims1 1 1,138 301 3 – 9 1,452As at 31 December 2019Reinsurance recoveries on outstanding claims1, 2 72 3,917 706 – 1 81 4,777Reinsurance recoveries on paid claims1 1 914 148 – – – 1,063
1 Net of a provision for impairment.2 Excludes other recoveries of $303 million (2019 $327 million).
4. RISK MANAGEMENT
114
The following table provides further information regarding the ageing of reinsurance recoveries on paid claims at the balance date:
PAST DUE BUT NOT IMPAIRED
NEITHER PAST
DUE NOR IMPAIRED
0 TO 3 MONTHS
4 TO 6 MONTHS
7 MONTHS TO 1 YEAR
GREATER THAN
1 YEAR TOTALYEAR US$M US$M US$M US$M US$M US$M
Reinsurance recoveries on paid claims1 2020 1,014 304 76 31 27 1,4522019 844 153 – 48 18 1,063
1 Net of a provision for impairment.
Investment and treasury credit riskThe Group only transacts with investment counterparties within the limits outlined in the delegated authorities. Investment counterparty exposure limits are applied to individual counterparty exposures and to multiple exposures within a group of related companies in relation to investments, cash deposits and forward foreign exchange exposures. Counterparty exposure limit compliance is monitored daily.
The following table provides information regarding the Group’s aggregate credit risk exposure at the balance date in respect of the major classes of financial assets. Trade and other receivables are excluded from this analysis on the basis that they comprise smaller credit risk items which generally cannot be rated and are not individually material. The analysis classifies the assets according to S&P counterparty credit ratings. AAA is the highest possible rating. Rated assets falling outside the range of AAA to BBB are classified as speculative grade.
CREDIT RATING
AAA AA A BBBSPECULATIVE
GRADE NOT RATED TOTALUS$M US$M US$M US$M US$M US$M US$M
As at 31 December 2020Cash and cash equivalents 38 238 275 155 – 60 766Interest-bearing investments 2,947 9,509 8,982 3,427 – 39 24,904Derivative financial instruments – 217 115 186 – 1 520As at 31 December 2019Cash and cash equivalents – 125 218 157 1 46 547Interest-bearing investments 2,726 7,933 6,925 2,897 12 995 21,488Derivative financial instruments – 93 65 36 – 1 195
The carrying amount of the relevant asset classes on the balance sheet represents the maximum amount of credit exposure at the balance date. The fair value of derivatives shown on the balance sheet represents the current risk exposure but not the maximum risk exposure that could arise in the future as a result of changing values.
Insurance and other credit risk The Group transacts with brokers that are reputable, suitable and approved in accordance with local broker policies. The continuous due diligence over brokers involves an assessment of the broker’s reputation, regulatory standing and financial strength.
QBE regularly reviews the collectability of receivables and the adequacy of associated provisions for impairment. Concentration risk for large brokers is also monitored. Balances are monitored on the basis of uncollected debt and debt outstanding in excess of six months. Brokers are also subject to regular due diligence to ensure adherence to local broker policies and associated requirements.
The following table provides information regarding the ageing of the Group’s financial assets that are past due but not impaired and which are largely unrated at the balance date:
PAST DUE BUT NOT IMPAIRED
NEITHER PAST DUE NOR
IMPAIRED0 TO 3
MONTHS4 TO 6
MONTHS7 MONTHS TO 1 YEAR
GREATER THAN 1 YEAR TOTAL
US$M US$M US$M US$M US$M US$M
As at 31 December 2020Premium receivable1 2,425 334 159 50 22 2,990Other trade debtors 212 1 2 3 6 224Other receivables 353 4 1 1 6 365As at 31 December 2019Premium receivable1 2,107 372 119 70 39 2,707Other trade debtors 120 11 3 5 9 148Other receivables 322 7 1 2 1 333
1 Net of a provision for impairment.
QB
E In
suran
ce Gro
up
A
nn
ual R
epo
rt 2020
115O
ther
info
rmatio
n
6
Fin
ancial
Rep
ort
5
Perfo
rman
ce o
verv
iew
1
Op
erating an
d
finan
cial review
2
Go
vern
ance
3
Directo
rs' R
epo
rt
4
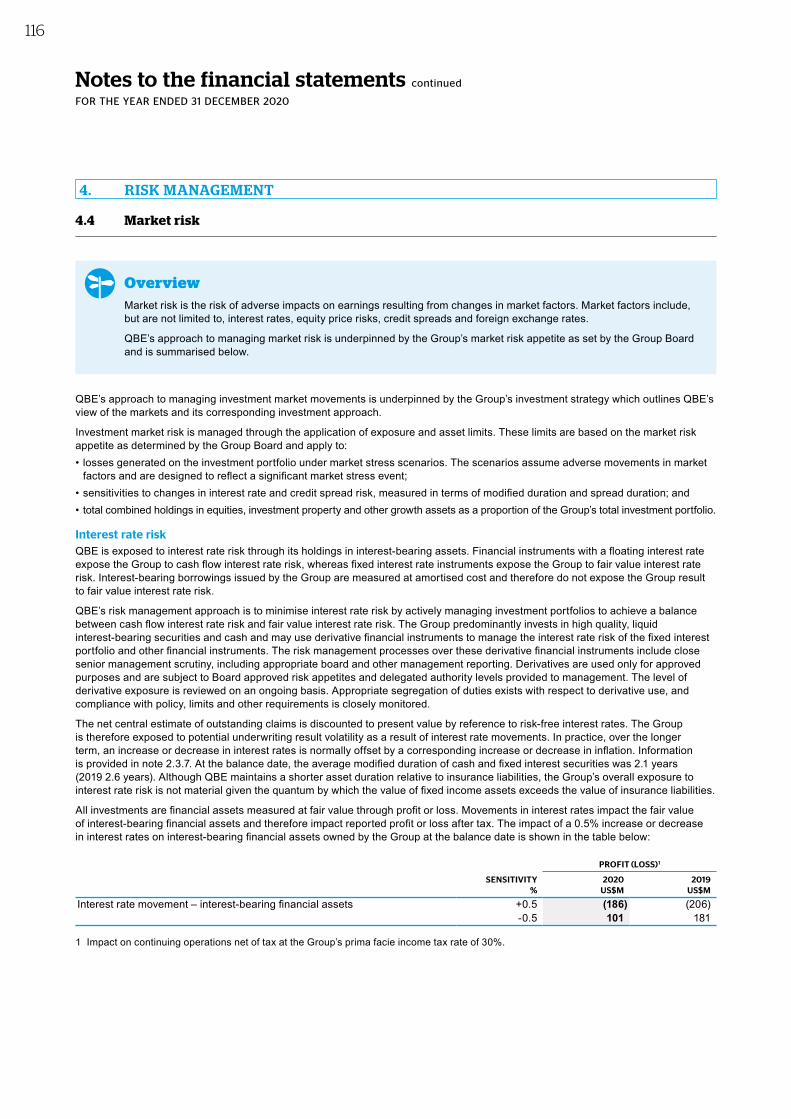
Notes to the financial statements continued
FOR THE YEAR ENDED 31 DECEMBER 2020
4.4 Market risk
OverviewMarket risk is the risk of adverse impacts on earnings resulting from changes in market factors. Market factors include, but are not limited to, interest rates, equity price risks, credit spreads and foreign exchange rates.
QBE’s approach to managing market risk is underpinned by the Group’s market risk appetite as set by the Group Board and is summarised below.
QBE’s approach to managing investment market movements is underpinned by the Group’s investment strategy which outlines QBE’s view of the markets and its corresponding investment approach.
Investment market risk is managed through the application of exposure and asset limits. These limits are based on the market risk appetite as determined by the Group Board and apply to:• losses generated on the investment portfolio under market stress scenarios. The scenarios assume adverse movements in market
factors and are designed to reflect a significant market stress event;• sensitivities to changes in interest rate and credit spread risk, measured in terms of modified duration and spread duration; and• total combined holdings in equities, investment property and other growth assets as a proportion of the Group’s total investment portfolio.
Interest rate riskQBE is exposed to interest rate risk through its holdings in interest-bearing assets. Financial instruments with a floating interest rate expose the Group to cash flow interest rate risk, whereas fixed interest rate instruments expose the Group to fair value interest rate risk. Interest-bearing borrowings issued by the Group are measured at amortised cost and therefore do not expose the Group result to fair value interest rate risk.
QBE’s risk management approach is to minimise interest rate risk by actively managing investment portfolios to achieve a balance between cash flow interest rate risk and fair value interest rate risk. The Group predominantly invests in high quality, liquid interest-bearing securities and cash and may use derivative financial instruments to manage the interest rate risk of the fixed interest portfolio and other financial instruments. The risk management processes over these derivative financial instruments include close senior management scrutiny, including appropriate board and other management reporting. Derivatives are used only for approved purposes and are subject to Board approved risk appetites and delegated authority levels provided to management. The level of derivative exposure is reviewed on an ongoing basis. Appropriate segregation of duties exists with respect to derivative use, and compliance with policy, limits and other requirements is closely monitored.
The net central estimate of outstanding claims is discounted to present value by reference to risk-free interest rates. The Group is therefore exposed to potential underwriting result volatility as a result of interest rate movements. In practice, over the longer term, an increase or decrease in interest rates is normally offset by a corresponding increase or decrease in inflation. Information is provided in note 2.3.7. At the balance date, the average modified duration of cash and fixed interest securities was 2.1 years (2019 2.6 years). Although QBE maintains a shorter asset duration relative to insurance liabilities, the Group’s overall exposure to interest rate risk is not material given the quantum by which the value of fixed income assets exceeds the value of insurance liabilities.
All investments are financial assets measured at fair value through profit or loss. Movements in interest rates impact the fair value of interest-bearing financial assets and therefore impact reported profit or loss after tax. The impact of a 0.5% increase or decrease in interest rates on interest-bearing financial assets owned by the Group at the balance date is shown in the table below:
PROFIT (LOSS)1
SENSITIVITY 2020 2019% US$M US$M
Interest rate movement – interest-bearing financial assets +0.5 (186) (206)-0.5 101 181
1 Impact on continuing operations net of tax at the Group’s prima facie income tax rate of 30%.
4. RISK MANAGEMENT
116
Equity price riskEquity price risk is the risk that the fair value of future cash flows of a financial instrument will fluctuate because of changes in market prices (other than those arising from interest rate or currency risk), whether those changes are caused by factors specific to the individual financial instrument or its issuer, or factors affecting all similar financial instruments traded on the market.
QBE is exposed to equity price risk on its investment in growth assets and may use derivative financial instruments to manage this exposure. The risk management processes over these derivative financial instruments are the same as those already explained in respect of interest rate derivative financial instruments. Exposure is also managed by diversification across international markets and currencies.
Growth assets are measured at fair value through profit or loss. The impact of a 20% increase or decrease in the value of investments owned by the Group at the balance date on profit after tax from continuing operations is shown in the table below:
PROFIT (LOSS)1
SENSITIVITY 2020 2019% US$M US$M
ASX 200 +20 2 21-20 (2) (21)
FTSE 100 +20 – 7-20 – (7)
EURO STOXX +20 – 3-20 – (3)
S&P 500 +20 – 6-20 – (6)
MSCI Emerging Markets Index +20 – 15-20 – (15)
Unlisted property trusts +20 105 100-20 (105) (100)
Infrastructure assets +20 125 126-20 (125) (126)
Private equity +20 37 28-20 (37) (28)
Alternatives +20 14 12-20 (14) (12)
1 Impact on continuing operations net of tax at the Group’s prima facie income tax rate of 30%.
QBE is also exposed to price risk on its fixed interest securities as discussed above in relation to interest rate risk, and below in relation to credit spread risk. All securities are measured at fair value through profit or loss.
Credit spread riskMovements in credit spreads impact the value of corporate interest-bearing securities and emerging market and high yield debt, and therefore impact reported profit or loss after tax. This risk is managed by investing in high quality, liquid interest-bearing securities and by managing the credit spread duration of the corporate securities portfolio.
The impact of a 0.5% increase or decrease in credit spreads on interest-bearing financial assets held by the Group at the balance date on profit or loss after tax from continuing operations is shown in the table below:
PROFIT (LOSS)1
SENSITIVITY 2020 2019% US$M US$M
Credit spread movement – corporate interest-bearing financial assets 2 +0.5 (143) (112)-0.5 111 89
Credit spread movement – emerging market and high yield debt +0.5 – (20)-0.5 – 20
1 Impact on continuing operations net of tax at the Group’s prima facie income tax rate of 30%.2 Includes infrastructure debt and other investments in non-government bonds.
Foreign exchange riskQBE’s approach to foreign exchange management is underpinned by the Group’s foreign currency strategy. The Group’s foreign exchange exposure generally arises as a result of either the translation of foreign currency amounts to the functional currency of a controlled entity (operational currency risk) or due to the translation of the Group’s net investment in foreign operations to the functional currency of the ultimate parent entity of Australian dollars and to QBE’s presentation currency of US dollars (currency translation risk).
QB
E In
suran
ce Gro
up
A
nn
ual R
epo
rt 2020
117
Oth
er in
form
ation
6
Fin
ancial
Rep
ort
5
Perfo
rman
ce o
verv
iew
1
Op
erating an
d
finan
cial review
2
Go
vern
ance
3
Directo
rs' R
epo
rt
4

Notes to the financial statements continued
FOR THE YEAR ENDED 31 DECEMBER 2020
4.4 Market risk
OverviewMarket risk is the risk of adverse impacts on earnings resulting from changes in market factors. Market factors include, but are not limited to, interest rates, equity price risks, credit spreads and foreign exchange rates.
QBE’s approach to managing market risk is underpinned by the Group’s market risk appetite as set by the Group Board and is summarised below.
QBE’s approach to managing investment market movements is underpinned by the Group’s investment strategy which outlines QBE’s view of the markets and its corresponding investment approach.
Investment market risk is managed through the application of exposure and asset limits. These limits are based on the market risk appetite as determined by the Group Board and apply to:• losses generated on the investment portfolio under market stress scenarios. The scenarios assume adverse movements in market
factors and are designed to reflect a significant market stress event;• sensitivities to changes in interest rate and credit spread risk, measured in terms of modified duration and spread duration; and• total combined holdings in equities, investment property and other growth assets as a proportion of the Group’s total investment portfolio.
Interest rate riskQBE is exposed to interest rate risk through its holdings in interest-bearing assets. Financial instruments with a floating interest rate expose the Group to cash flow interest rate risk, whereas fixed interest rate instruments expose the Group to fair value interest rate risk. Interest-bearing borrowings issued by the Group are measured at amortised cost and therefore do not expose the Group result to fair value interest rate risk.
QBE’s risk management approach is to minimise interest rate risk by actively managing investment portfolios to achieve a balance between cash flow interest rate risk and fair value interest rate risk. The Group predominantly invests in high quality, liquid interest-bearing securities and cash and may use derivative financial instruments to manage the interest rate risk of the fixed interest portfolio and other financial instruments. The risk management processes over these derivative financial instruments include close senior management scrutiny, including appropriate board and other management reporting. Derivatives are used only for approved purposes and are subject to Board approved risk appetites and delegated authority levels provided to management. The level of derivative exposure is reviewed on an ongoing basis. Appropriate segregation of duties exists with respect to derivative use, and compliance with policy, limits and other requirements is closely monitored.
The net central estimate of outstanding claims is discounted to present value by reference to risk-free interest rates. The Group is therefore exposed to potential underwriting result volatility as a result of interest rate movements. In practice, over the longer term, an increase or decrease in interest rates is normally offset by a corresponding increase or decrease in inflation. Information is provided in note 2.3.7. At the balance date, the average modified duration of cash and fixed interest securities was 2.1 years (2019 2.6 years). Although QBE maintains a shorter asset duration relative to insurance liabilities, the Group’s overall exposure to interest rate risk is not material given the quantum by which the value of fixed income assets exceeds the value of insurance liabilities.
All investments are financial assets measured at fair value through profit or loss. Movements in interest rates impact the fair value of interest-bearing financial assets and therefore impact reported profit or loss after tax. The impact of a 0.5% increase or decrease in interest rates on interest-bearing financial assets owned by the Group at the balance date is shown in the table below:
PROFIT (LOSS)1
SENSITIVITY 2020 2019% US$M US$M
Interest rate movement – interest-bearing financial assets +0.5 (186) (206)-0.5 101 181
1 Impact on continuing operations net of tax at the Group’s prima facie income tax rate of 30%.
4. RISK MANAGEMENT
116
Equity price riskEquity price risk is the risk that the fair value of future cash flows of a financial instrument will fluctuate because of changes in market prices (other than those arising from interest rate or currency risk), whether those changes are caused by factors specific to the individual financial instrument or its issuer, or factors affecting all similar financial instruments traded on the market.
QBE is exposed to equity price risk on its investment in growth assets and may use derivative financial instruments to manage this exposure. The risk management processes over these derivative financial instruments are the same as those already explained in respect of interest rate derivative financial instruments. Exposure is also managed by diversification across international markets and currencies.
Growth assets are measured at fair value through profit or loss. The impact of a 20% increase or decrease in the value of investments owned by the Group at the balance date on profit after tax from continuing operations is shown in the table below:
PROFIT (LOSS)1
SENSITIVITY 2020 2019% US$M US$M
ASX 200 +20 2 21-20 (2) (21)
FTSE 100 +20 – 7-20 – (7)
EURO STOXX +20 – 3-20 – (3)
S&P 500 +20 – 6-20 – (6)
MSCI Emerging Markets Index +20 – 15-20 – (15)
Unlisted property trusts +20 105 100-20 (105) (100)
Infrastructure assets +20 125 126-20 (125) (126)
Private equity +20 37 28-20 (37) (28)
Alternatives +20 14 12-20 (14) (12)
1 Impact on continuing operations net of tax at the Group’s prima facie income tax rate of 30%.
QBE is also exposed to price risk on its fixed interest securities as discussed above in relation to interest rate risk, and below in relation to credit spread risk. All securities are measured at fair value through profit or loss.
Credit spread riskMovements in credit spreads impact the value of corporate interest-bearing securities and emerging market and high yield debt, and therefore impact reported profit or loss after tax. This risk is managed by investing in high quality, liquid interest-bearing securities and by managing the credit spread duration of the corporate securities portfolio.
The impact of a 0.5% increase or decrease in credit spreads on interest-bearing financial assets held by the Group at the balance date on profit or loss after tax from continuing operations is shown in the table below:
PROFIT (LOSS)1
SENSITIVITY 2020 2019% US$M US$M
Credit spread movement – corporate interest-bearing financial assets 2 +0.5 (143) (112)-0.5 111 89
Credit spread movement – emerging market and high yield debt +0.5 – (20)-0.5 – 20
1 Impact on continuing operations net of tax at the Group’s prima facie income tax rate of 30%.2 Includes infrastructure debt and other investments in non-government bonds.
Foreign exchange riskQBE’s approach to foreign exchange management is underpinned by the Group’s foreign currency strategy. The Group’s foreign exchange exposure generally arises as a result of either the translation of foreign currency amounts to the functional currency of a controlled entity (operational currency risk) or due to the translation of the Group’s net investment in foreign operations to the functional currency of the ultimate parent entity of Australian dollars and to QBE’s presentation currency of US dollars (currency translation risk).
QB
E In
suran
ce Gro
up
A
nn
ual R
epo
rt 2020
117O
ther
info
rmatio
n
6
Fin
ancial
Rep
ort
5
Perfo
rman
ce o
verv
iew
1
Op
erating an
d
finan
cial review
2
Go
vern
ance
3
Directo
rs' R
epo
rt
4

Notes to the financial statements continued
FOR THE YEAR ENDED 31 DECEMBER 2020
Operational currency riskOperational currency risk is managed as follows:• Each controlled entity manages the volatility arising from changes in foreign exchange rates by matching liabilities with assets
of the same currency, as far as is practicable, thus ensuring that any exposures to foreign currencies are minimised. The Group's aim is to mitigate, where possible, its operational foreign currency exposures at a controlled entity level.
• Forward foreign exchange contracts are used where possible to protect any residual currency positions. Where appropriate, forward foreign exchange contracts may also be used in relation to the Group's borrowings. In either case, these may be designated as hedge relationships for accounting purposes. Further information on forward foreign exchange contracts used to manage operational currency risk is provided in note 5.6.
The risk management process relating to the use of forward foreign exchange contracts involves close senior management scrutiny. All forward foreign exchange contracts are subject to delegated authority levels provided to management and the levels of exposure are reviewed on an ongoing basis.
The analysis below demonstrates the impact on profit or loss after income tax of a 10% strengthening or weakening of the major currencies against the functional currencies of the underlying QBE entities for which the Group has a material exposure at the balance date. The exposures below reflect the aggregation of operational currency exposures of multiple entities with different functional currencies. The sensitivity is measured with reference to the Group’s residual (or unmatched) operational foreign currency exposures at the balance date. Operational foreign exchange gains or losses are recognised in profit or loss in accordance with the policy set out in note 1.2.4. The sensitivities provided demonstrate the impact of a change in one key variable in isolation while other assumptions remain unchanged.
The sensitivities shown in the table below are relevant only at the balance sheet date, as any unmatched exposures are actively monitored by management and the exposure subsequently matched.
2020 2019
RESIDUAL EXPOSURE SENSITIVITY PROFIT(LOSS)1
RESIDUAL EXPOSURE SENSITIVITY PROFIT (LOSS)1
EXPOSURE CURRENCY US$M % US$M US$M % US$M
US dollar 258 +10 18 (23) +10 (2) ‑10 (18) -10 2
Australian dollar (55) +10 (4) (90) +10 (6) ‑10 4 -10 6
Sterling 6 +10 – 19 +10 1 ‑10 – -10 (1)
1 Impact on continuing operations net of tax at the Group’s prima facie income tax rate of 30%.
4. RISK MANAGEMENT
118
Currency risk in relation to translation of net investments in foreign operationsQBE is exposed to currency risk in relation to the translation of:• the ultimate parent entity’s net investments in foreign operations to its functional currency of Australian dollars; and• all non-US dollar functional currency operations to the Group's presentation currency of US dollars.
Currency translation risk in relation to QBE’s investment in foreign operations is monitored on an ongoing basis and may be mitigated by designation of foreign currency borrowings as a hedge of this risk. Any debt security that qualifies as a hedging instrument may be designated as a hedge of the Australian dollar ultimate parent entity’s net investment in foreign operations and any residual exposure to foreign operations in tradeable currencies may be hedged up to the limit specified in the Group risk appetite statement. The extent of hedging this exposure is carefully managed to ensure an appropriate balance between currency risk and associated risks such as liquidity risk and stability of capital adequacy levels.
QBE does not ordinarily seek to use derivatives to mitigate currency translation risk on translation to the ultimate parent entity functional currency of Australian dollars for the following reasons:• currency translation gains and losses generally have no cash flow;• currency translation gains and losses are accounted for in the foreign currency translation reserve (a component of equity) and
therefore do not impact profit or loss unless the related foreign operation is disposed of; and• management of translation risk needs to be balanced against the impact on capital requirements and liquidity risk.
In periods of extraordinary volatility that are expected to persist for an extended period of time, QBE may elect to utilise derivatives to mitigate currency translation risk to preserve capital.
Currency management processes are actively monitored by the Group Treasurer and involve close senior management scrutiny. All hedge transactions are subject to delegated authority levels provided to management, and the levels of exposure are reviewed on an ongoing basis. All instruments that are designated as hedges are tested for effectiveness in accordance with AASB 9.
At the balance date, derivatives with a net exposure of $648 million (2019 $101 million) and borrowings of $536 million (2019 $547 million) were designated as hedges of net investments in foreign operations, further information on which is provided in note 5.6.1.
Foreign exchange gains or losses arising on translation of the Group’s foreign operations from the ultimate parent entity’s functional currency of Australian dollars to the Group’s US dollar presentation currency are recognised directly in equity in accordance with the policy set out in note 1.2.4. The Group cannot hedge this exposure.
The analysis below demonstrates the impact on equity of a 10% strengthening or weakening against the US dollar of the major currencies to which QBE is exposed through its net investment in foreign operations. The basis for the sensitivity calculation is the Group’s actual residual exposure at the balance date.
2020 2019
RESIDUAL EXPOSURE SENSITIVITY
EQUITY INCREASE (DECREASE)
RESIDUAL EXPOSURE SENSITIVITY
EQUITY INCREASE (DECREASE)1
EXPOSURE CURRENCY US$M % US$M US$M % US$M
Australian dollar 2,962 +10 296 2,554 +10 255 ‑10 (296) -10 (255)
Sterling 150 +10 15 1,134 +10 113 ‑10 (15) -10 (113)
Euro 1,632 +10 163 814 +10 81 ‑10 (163) -10 (81)
Hong Kong dollar 36 +10 4 176 +10 18 ‑10 (4) -10 (18)
New Zealand dollar 222 +10 22 183 +10 18 ‑10 (22) -10 (18)
Singapore dollar 120 +10 12 132 +10 13 ‑10 (12) -10 (13)
1 The impact on equity is disclosed, including both continuing and discontinued operations.
QB
E In
suran
ce Gro
up
A
nn
ual R
epo
rt 2020
119
Oth
er in
form
ation
6
Fin
ancial
Rep
ort
5
Perfo
rman
ce o
verv
iew
1
Op
erating an
d
finan
cial review
2
Go
vern
ance
3
Directo
rs' R
epo
rt
4

Notes to the financial statements continued
FOR THE YEAR ENDED 31 DECEMBER 2020
Operational currency riskOperational currency risk is managed as follows:• Each controlled entity manages the volatility arising from changes in foreign exchange rates by matching liabilities with assets
of the same currency, as far as is practicable, thus ensuring that any exposures to foreign currencies are minimised. The Group's aim is to mitigate, where possible, its operational foreign currency exposures at a controlled entity level.
• Forward foreign exchange contracts are used where possible to protect any residual currency positions. Where appropriate, forward foreign exchange contracts may also be used in relation to the Group's borrowings. In either case, these may be designated as hedge relationships for accounting purposes. Further information on forward foreign exchange contracts used to manage operational currency risk is provided in note 5.6.
The risk management process relating to the use of forward foreign exchange contracts involves close senior management scrutiny. All forward foreign exchange contracts are subject to delegated authority levels provided to management and the levels of exposure are reviewed on an ongoing basis.
The analysis below demonstrates the impact on profit or loss after income tax of a 10% strengthening or weakening of the major currencies against the functional currencies of the underlying QBE entities for which the Group has a material exposure at the balance date. The exposures below reflect the aggregation of operational currency exposures of multiple entities with different functional currencies. The sensitivity is measured with reference to the Group’s residual (or unmatched) operational foreign currency exposures at the balance date. Operational foreign exchange gains or losses are recognised in profit or loss in accordance with the policy set out in note 1.2.4. The sensitivities provided demonstrate the impact of a change in one key variable in isolation while other assumptions remain unchanged.
The sensitivities shown in the table below are relevant only at the balance sheet date, as any unmatched exposures are actively monitored by management and the exposure subsequently matched.
2020 2019
RESIDUAL EXPOSURE SENSITIVITY PROFIT(LOSS)1
RESIDUAL EXPOSURE SENSITIVITY PROFIT (LOSS)1
EXPOSURE CURRENCY US$M % US$M US$M % US$M
US dollar 258 +10 18 (23) +10 (2) ‑10 (18) -10 2
Australian dollar (55) +10 (4) (90) +10 (6) ‑10 4 -10 6
Sterling 6 +10 – 19 +10 1 ‑10 – -10 (1)
1 Impact on continuing operations net of tax at the Group’s prima facie income tax rate of 30%.
4. RISK MANAGEMENT
118
Currency risk in relation to translation of net investments in foreign operationsQBE is exposed to currency risk in relation to the translation of:• the ultimate parent entity’s net investments in foreign operations to its functional currency of Australian dollars; and• all non-US dollar functional currency operations to the Group's presentation currency of US dollars.
Currency translation risk in relation to QBE’s investment in foreign operations is monitored on an ongoing basis and may be mitigated by designation of foreign currency borrowings as a hedge of this risk. Any debt security that qualifies as a hedging instrument may be designated as a hedge of the Australian dollar ultimate parent entity’s net investment in foreign operations and any residual exposure to foreign operations in tradeable currencies may be hedged up to the limit specified in the Group risk appetite statement. The extent of hedging this exposure is carefully managed to ensure an appropriate balance between currency risk and associated risks such as liquidity risk and stability of capital adequacy levels.
QBE does not ordinarily seek to use derivatives to mitigate currency translation risk on translation to the ultimate parent entity functional currency of Australian dollars for the following reasons:• currency translation gains and losses generally have no cash flow;• currency translation gains and losses are accounted for in the foreign currency translation reserve (a component of equity) and
therefore do not impact profit or loss unless the related foreign operation is disposed of; and• management of translation risk needs to be balanced against the impact on capital requirements and liquidity risk.
In periods of extraordinary volatility that are expected to persist for an extended period of time, QBE may elect to utilise derivatives to mitigate currency translation risk to preserve capital.
Currency management processes are actively monitored by the Group Treasurer and involve close senior management scrutiny. All hedge transactions are subject to delegated authority levels provided to management, and the levels of exposure are reviewed on an ongoing basis. All instruments that are designated as hedges are tested for effectiveness in accordance with AASB 9.
At the balance date, derivatives with a net exposure of $648 million (2019 $101 million) and borrowings of $536 million (2019 $547 million) were designated as hedges of net investments in foreign operations, further information on which is provided in note 5.6.1.
Foreign exchange gains or losses arising on translation of the Group’s foreign operations from the ultimate parent entity’s functional currency of Australian dollars to the Group’s US dollar presentation currency are recognised directly in equity in accordance with the policy set out in note 1.2.4. The Group cannot hedge this exposure.
The analysis below demonstrates the impact on equity of a 10% strengthening or weakening against the US dollar of the major currencies to which QBE is exposed through its net investment in foreign operations. The basis for the sensitivity calculation is the Group’s actual residual exposure at the balance date.
2020 2019
RESIDUAL EXPOSURE SENSITIVITY
EQUITY INCREASE (DECREASE)
RESIDUAL EXPOSURE SENSITIVITY
EQUITY INCREASE (DECREASE)1
EXPOSURE CURRENCY US$M % US$M US$M % US$M
Australian dollar 2,962 +10 296 2,554 +10 255 ‑10 (296) -10 (255)
Sterling 150 +10 15 1,134 +10 113 ‑10 (15) -10 (113)
Euro 1,632 +10 163 814 +10 81 ‑10 (163) -10 (81)
Hong Kong dollar 36 +10 4 176 +10 18 ‑10 (4) -10 (18)
New Zealand dollar 222 +10 22 183 +10 18 ‑10 (22) -10 (18)
Singapore dollar 120 +10 12 132 +10 13 ‑10 (12) -10 (13)
1 The impact on equity is disclosed, including both continuing and discontinued operations.
QB
E In
suran
ce Gro
up
A
nn
ual R
epo
rt 2020
119O
ther
info
rmatio
n
6
Fin
ancial
Rep
ort
5
Perfo
rman
ce o
verv
iew
1
Op
erating an
d
finan
cial review
2
Go
vern
ance
3
Directo
rs' R
epo
rt
4

Notes to the financial statements continued
FOR THE YEAR ENDED 31 DECEMBER 2020
4.5 Liquidity risk
OverviewLiquidity risk is the risk of having insufficient liquid assets to meet liabilities as they fall due to policyholders and creditors or only being able to access liquidity at excessive cost.
QBE’s approach to managing liquidity risk is underpinned by the Group’s liquidity risk appetite which is set by the Board and is summarised below.
QBE manages liquidity risk using a number of tools, as follows:• cash flow targeting;• maintenance of a minimum level of liquid assets relative to the Group's liabilities;• cash flow forecasting; and• stress testing and contingency planning.
Liquidity is managed across the Group using a number of cash flow forecasting and targeting tools and techniques. Cash flow forecasting and targeting are conducted at a legal entity level and involve actively managing operational cash flow requirements.
To supplement the cash flow targeting and to ensure that there are sufficient liquid funds available to meet insurance and investment obligations, a minimum percentage of QBE’s liabilities is held, at all times, in cash and liquid securities. QBE also maintains a defined proportion of the funds under management in liquid assets.
QBE actively forecasts cash flow requirements to identify future cash surpluses and shortages to optimise invested cash balances and limit unexpected calls from the investment pool. The Group limits the risk of liquidity shortfalls resulting from mismatches in the timing of claims payments and receipts of claims recoveries by negotiating cash call clauses in reinsurance contracts and seeking accelerated settlements for large reinsurance recoveries.
The following table summarises the maturity profile of the Group’s financial liabilities based on the remaining contractual obligations. Borrowings and contractual undiscounted interest payments are disclosed by reference to the first call date of the borrowings, details of which are included in note 5.1.
LESS THAN 1 YEAR
13 TO 36 MONTHS
37 TO 60 MONTHS
OVER 5 YEARS
NO FIXED TERM TOTAL
US$M US$M US$M US$M US$M US$M
As at 31 December 2020Forward foreign exchange contracts 316 231 298 – – 845Trade payables 1,475 122 3 – 4 1,604Other payables and accrued expenses 679 26 3 – 6 714Treasury payables 16 – – – – 16Investment payables 4 – – – – 4Lease liabilities 68 103 84 176 – 431Borrowings1 200 854 1,000 909 – 2,963Contractual undiscounted interest payments 191 326 194 23 – 734As at 31 December 2019Forward foreign exchange contracts 169 – 33 – – 202Trade payables 877 84 5 13 41 1,020Other payables and accrued expenses 559 29 2 – 1 591Treasury payables 21 – – – – 21Investment payables 170 – – – – 170Lease liabilities 60 102 57 80 – 299Borrowings1 140 632 1,106 824 400 3,102Contractual undiscounted interest payments 194 337 262 70 – 863
1 Excludes capitalised finance costs of $8 million (2019 $7 million).
The maturity profile of the Group’s net discounted central estimate is analysed in note 2.3.6.
4. RISK MANAGEMENT
120
The maturity of the Group’s directly held interest-bearing financial assets is shown in the table below.
INTEREST-BEARING FINANCIAL ASSETS MATURING IN:
LESS THAN 1 YEAR
13 TO 24 MONTHS
25 TO 36 MONTHS
37 TO 48 MONTHS
49 TO 60 MONTHS
OVER 5 YEARS TOTAL
As at 31 December 2020Fixed rate US$M 5,867 4,095 3,677 2,314 2,030 3,374 21,357Weighted average interest rate % p.a. 0.4 0.2 0.3 0.4 0.4 0.6 0.4Floating rate US$M 1,578 630 610 297 341 857 4,313Weighted average interest rate % p.a. 0.1 0.3 0.4 1.0 0.8 1.2 0.5As at 31 December 2019Fixed rate US$M 3,986 2,865 2,741 2,436 1,622 3,600 17,250Weighted average interest rate % p.a. 1.7 1.5 1.2 1.5 1.3 1.5 1.5Floating rate US$M 2,309 745 520 100 183 928 4,785Weighted average interest rate % p.a. 2.3 1.4 1.5 1.0 2.0 1.8 1.4
4.6 Operational risk
OverviewOperational risk is the risk of financial loss resulting from inadequate or failed internal processes, people and systems or from external events.
Operational risk can materialise in a number of forms including fraud perpetrated by employees or by external parties (e.g. claims fraud or cyber attacks), employment practices (e.g. losses arising from breaches of employment, health or safety laws), improper business practices (e.g. failure to meet professional obligations or issues with the nature or design of an insurance product), business disruption and system failures, or business and transaction processing failures.
QBE manages operational risk through setting policy, minimum standards, and process and system controls, including effective segregation of duties, access controls, authorisations and reconciliation procedures, business continuity management, fraud management, information security and physical security.
QBE identifies, assesses and manages operational risk through the: • risk and control self-assessment process, which identifies and assesses the key risks to achieving business objectives and
is conducted at the business unit level; • total risk assessment process, which creates a single, divisional-level view of risk across all QBE risk categories; • operational risk appetite statement, which sets out the nature and level of risk that the Board and Group Executive Committee
are willing to take in pursuit of the organisation’s objectives. The operational risk appetite statement is measured through an assessment of the control environment, key risk indicators, issues and incidents;
• emerging risks process, which identifies and assesses new risks, which are characterised by incomplete but developing knowledge or existing risks that develop in new or surprising ways; and
• scenario analysis process, which assesses the impact of potentially extreme scenarios and the appropriateness of our contingency planning.
Key residual risks from the above processes are monitored by the Executive Non-Financial Risk Committee.
QB
E In
suran
ce Gro
up
A
nn
ual R
epo
rt 2020
121
Oth
er in
form
ation
6
Fin
ancial
Rep
ort
5
Perfo
rman
ce o
verv
iew
1
Op
erating an
d
finan
cial review
2
Go
vern
ance
3
Directo
rs' R
epo
rt
4
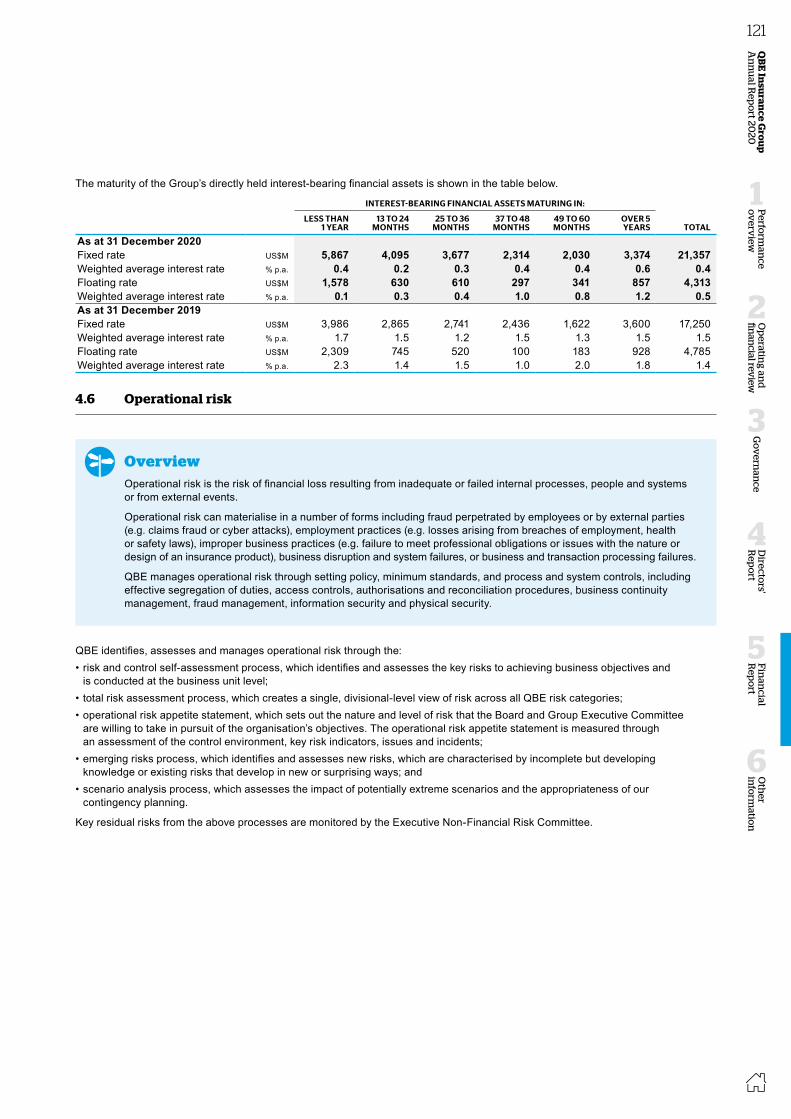
Notes to the financial statements continued
FOR THE YEAR ENDED 31 DECEMBER 2020
4.5 Liquidity risk
OverviewLiquidity risk is the risk of having insufficient liquid assets to meet liabilities as they fall due to policyholders and creditors or only being able to access liquidity at excessive cost.
QBE’s approach to managing liquidity risk is underpinned by the Group’s liquidity risk appetite which is set by the Board and is summarised below.
QBE manages liquidity risk using a number of tools, as follows:• cash flow targeting;• maintenance of a minimum level of liquid assets relative to the Group's liabilities;• cash flow forecasting; and• stress testing and contingency planning.
Liquidity is managed across the Group using a number of cash flow forecasting and targeting tools and techniques. Cash flow forecasting and targeting are conducted at a legal entity level and involve actively managing operational cash flow requirements.
To supplement the cash flow targeting and to ensure that there are sufficient liquid funds available to meet insurance and investment obligations, a minimum percentage of QBE’s liabilities is held, at all times, in cash and liquid securities. QBE also maintains a defined proportion of the funds under management in liquid assets.
QBE actively forecasts cash flow requirements to identify future cash surpluses and shortages to optimise invested cash balances and limit unexpected calls from the investment pool. The Group limits the risk of liquidity shortfalls resulting from mismatches in the timing of claims payments and receipts of claims recoveries by negotiating cash call clauses in reinsurance contracts and seeking accelerated settlements for large reinsurance recoveries.
The following table summarises the maturity profile of the Group’s financial liabilities based on the remaining contractual obligations. Borrowings and contractual undiscounted interest payments are disclosed by reference to the first call date of the borrowings, details of which are included in note 5.1.
LESS THAN 1 YEAR
13 TO 36 MONTHS
37 TO 60 MONTHS
OVER 5 YEARS
NO FIXED TERM TOTAL
US$M US$M US$M US$M US$M US$M
As at 31 December 2020Forward foreign exchange contracts 316 231 298 – – 845Trade payables 1,475 122 3 – 4 1,604Other payables and accrued expenses 679 26 3 – 6 714Treasury payables 16 – – – – 16Investment payables 4 – – – – 4Lease liabilities 68 103 84 176 – 431Borrowings1 200 854 1,000 909 – 2,963Contractual undiscounted interest payments 191 326 194 23 – 734As at 31 December 2019Forward foreign exchange contracts 169 – 33 – – 202Trade payables 877 84 5 13 41 1,020Other payables and accrued expenses 559 29 2 – 1 591Treasury payables 21 – – – – 21Investment payables 170 – – – – 170Lease liabilities 60 102 57 80 – 299Borrowings1 140 632 1,106 824 400 3,102Contractual undiscounted interest payments 194 337 262 70 – 863
1 Excludes capitalised finance costs of $8 million (2019 $7 million).
The maturity profile of the Group’s net discounted central estimate is analysed in note 2.3.6.
4. RISK MANAGEMENT
120
The maturity of the Group’s directly held interest-bearing financial assets is shown in the table below.
INTEREST-BEARING FINANCIAL ASSETS MATURING IN:
LESS THAN 1 YEAR
13 TO 24 MONTHS
25 TO 36 MONTHS
37 TO 48 MONTHS
49 TO 60 MONTHS
OVER 5 YEARS TOTAL
As at 31 December 2020Fixed rate US$M 5,867 4,095 3,677 2,314 2,030 3,374 21,357Weighted average interest rate % p.a. 0.4 0.2 0.3 0.4 0.4 0.6 0.4Floating rate US$M 1,578 630 610 297 341 857 4,313Weighted average interest rate % p.a. 0.1 0.3 0.4 1.0 0.8 1.2 0.5As at 31 December 2019Fixed rate US$M 3,986 2,865 2,741 2,436 1,622 3,600 17,250Weighted average interest rate % p.a. 1.7 1.5 1.2 1.5 1.3 1.5 1.5Floating rate US$M 2,309 745 520 100 183 928 4,785Weighted average interest rate % p.a. 2.3 1.4 1.5 1.0 2.0 1.8 1.4
4.6 Operational risk
OverviewOperational risk is the risk of financial loss resulting from inadequate or failed internal processes, people and systems or from external events.
Operational risk can materialise in a number of forms including fraud perpetrated by employees or by external parties (e.g. claims fraud or cyber attacks), employment practices (e.g. losses arising from breaches of employment, health or safety laws), improper business practices (e.g. failure to meet professional obligations or issues with the nature or design of an insurance product), business disruption and system failures, or business and transaction processing failures.
QBE manages operational risk through setting policy, minimum standards, and process and system controls, including effective segregation of duties, access controls, authorisations and reconciliation procedures, business continuity management, fraud management, information security and physical security.
QBE identifies, assesses and manages operational risk through the: • risk and control self-assessment process, which identifies and assesses the key risks to achieving business objectives and
is conducted at the business unit level; • total risk assessment process, which creates a single, divisional-level view of risk across all QBE risk categories; • operational risk appetite statement, which sets out the nature and level of risk that the Board and Group Executive Committee
are willing to take in pursuit of the organisation’s objectives. The operational risk appetite statement is measured through an assessment of the control environment, key risk indicators, issues and incidents;
• emerging risks process, which identifies and assesses new risks, which are characterised by incomplete but developing knowledge or existing risks that develop in new or surprising ways; and
• scenario analysis process, which assesses the impact of potentially extreme scenarios and the appropriateness of our contingency planning.
Key residual risks from the above processes are monitored by the Executive Non-Financial Risk Committee.
QB
E In
suran
ce Gro
up
A
nn
ual R
epo
rt 2020
121O
ther
info
rmatio
n
6
Fin
ancial
Rep
ort
5
Perfo
rman
ce o
verv
iew
1
Op
erating an
d
finan
cial review
2
Go
vern
ance
3
Directo
rs' R
epo
rt
4
Notes to the financial statements continued
FOR THE YEAR ENDED 31 DECEMBER 2020
4.7 Compliance risk
OverviewCompliance risk is the risk of legal or regulatory penalties, financial loss or impacts and non-financial loss or impacts (including reputational damage) resulting from a breach of obligations. Obligations refers to those in legislation, regulation, industry codes and standards, internal policies and ethical and business standards.
QBE’s approach to managing compliance risk is underpinned by the Group risk appetite as set by the Board and is summarised below.
QBE manages compliance risk through its governance, culture, stakeholder management and strategy approach. There are six components for managing compliance risk:• identify compliance obligations and controls;• embed compliance obligations across systems and processes;• communicate and train staff on compliance requirements;• monitor obligations and controls;• identify and rectify issues, incidents and breaches; and• report on and assess the state of compliance.
Compliance management is subject to continuous improvement, recognising changes in the regulatory and legal environment and industry, customer and community expectations.
4.8 Group risk
OverviewGroup risk is the risk to a division arising specifically from being part of the wider Group, including financial impact and loss of support from the Company.
QBE’s approach to managing Group risk is underpinned by the Group risk appetite which is set by the Board and is summarised below.
Sources of Group risk may include:• shared global reinsurance program;• intercompany loans and shared use of centralised Group functions (e.g. Group IT); • contagion reputational risk;• credit agency dependency;• use of Group functions where there is a global operating model in place;• use of QBE’s internal asset management function – Group Investments;• Group initiatives or decisions with a material impact on one or more division; and• liquidity and central foreign exchange management.
QBE manages Group risk through various systems, controls and processes, including the management of reinsurance arrangements, use of intercompany transactions and balances accounting guidance, transfer pricing guidelines, investment management agreements, capital planning and assessments of the use of Group functions, Group initiatives and contagion reputational events.
4. RISK MANAGEMENT
122
5. CAPITAL STRUCTURE
OverviewQBE’s objective in managing capital is to maintain an optimal balance between debt and equity in order to reduce the overall cost of capital while satisfying the capital adequacy requirements of regulators and rating agencies, providing financial security for our policyholders and continuing to provide an adequate return to shareholders.
The Company is listed on the Australian Securities Exchange and its share capital is denominated in Australian dollars. The Group also accesses international debt markets to diversify its funding base and maintain an appropriate amount of leverage. Debt is diversified across currencies and tenure.
Details of the Group’s approach to capital risk management are disclosed in note 4.1.
5.1 Borrowings
2020 2019FINAL MATURITY DATE ISSUE DATE PRINCIPAL AMOUNT US$M US$M
Senior debt25 May 2023 21 September 2017 $6 million 6 6
6 6Subordinated debt25 August 2036 19 August 2020 A$500 million (2019 nil)1 385 – 29 September 2040 29 September 2015 Nil (2019 A$200 million) – 14024 May 2041 24 May 2011 $167 million 167 16724 May 2041 24 May 2011 £24 million 33 3224 May 2042 19 May 2016 £327 million 445 43324 November 2043 17 November 2016 $400 million/A$689 million1 400 4002 December 2044 2 December 2014 $700 million/A$1,169 million1 697 69612 November 2045 12 November 2015 $300 million 300 30017 June 2046 17 June 2016 $524 million 522 522
2,949 2,690Additional Tier 1 instrumentsNo fixed date 16 November 2017 Nil (2019 $400 million) 2 – 399Total borrowings3 2,955 3,095Amounts maturing within 12 months 200 – Amounts maturing in greater than 12 months 2,755 3,095Total borrowings 2,955 3,095
1 Details of related hedging activity are included in note 5.6.1.2 In July 2020, the terms of these instruments were amended, resulting in their classification as equity. Further information is disclosed
in note 5.3.1.3 $2 million of finance costs (2019 nil) were capitalised during the year.
QB
E In
suran
ce Gro
up
A
nn
ual R
epo
rt 2020
123
Oth
er in
form
ation
6
Fin
ancial
Rep
ort
5
Perfo
rman
ce o
verv
iew
1
Op
erating an
d
finan
cial review
2
Go
vern
ance
3
Directo
rs' R
epo
rt
4
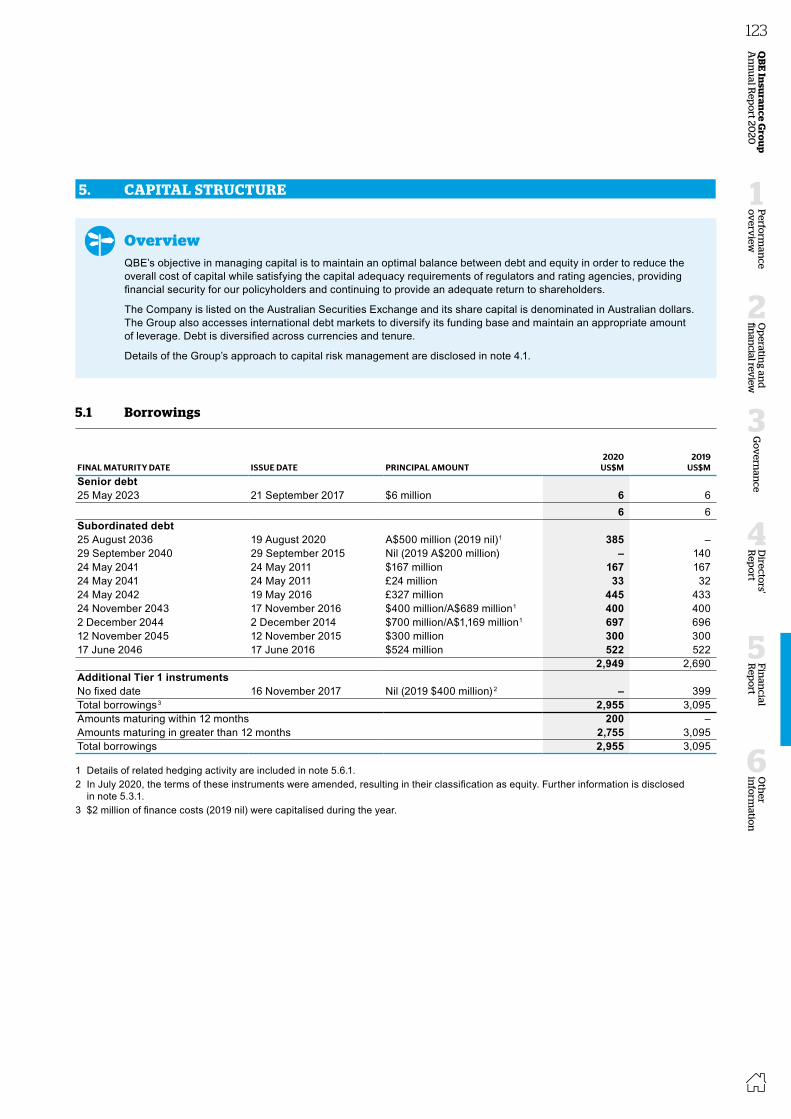
Notes to the financial statements continued
FOR THE YEAR ENDED 31 DECEMBER 2020
4.7 Compliance risk
OverviewCompliance risk is the risk of legal or regulatory penalties, financial loss or impacts and non-financial loss or impacts (including reputational damage) resulting from a breach of obligations. Obligations refers to those in legislation, regulation, industry codes and standards, internal policies and ethical and business standards.
QBE’s approach to managing compliance risk is underpinned by the Group risk appetite as set by the Board and is summarised below.
QBE manages compliance risk through its governance, culture, stakeholder management and strategy approach. There are six components for managing compliance risk:• identify compliance obligations and controls;• embed compliance obligations across systems and processes;• communicate and train staff on compliance requirements;• monitor obligations and controls;• identify and rectify issues, incidents and breaches; and• report on and assess the state of compliance.
Compliance management is subject to continuous improvement, recognising changes in the regulatory and legal environment and industry, customer and community expectations.
4.8 Group risk
OverviewGroup risk is the risk to a division arising specifically from being part of the wider Group, including financial impact and loss of support from the Company.
QBE’s approach to managing Group risk is underpinned by the Group risk appetite which is set by the Board and is summarised below.
Sources of Group risk may include:• shared global reinsurance program;• intercompany loans and shared use of centralised Group functions (e.g. Group IT); • contagion reputational risk;• credit agency dependency;• use of Group functions where there is a global operating model in place;• use of QBE’s internal asset management function – Group Investments;• Group initiatives or decisions with a material impact on one or more division; and• liquidity and central foreign exchange management.
QBE manages Group risk through various systems, controls and processes, including the management of reinsurance arrangements, use of intercompany transactions and balances accounting guidance, transfer pricing guidelines, investment management agreements, capital planning and assessments of the use of Group functions, Group initiatives and contagion reputational events.
4. RISK MANAGEMENT
122
5. CAPITAL STRUCTURE
OverviewQBE’s objective in managing capital is to maintain an optimal balance between debt and equity in order to reduce the overall cost of capital while satisfying the capital adequacy requirements of regulators and rating agencies, providing financial security for our policyholders and continuing to provide an adequate return to shareholders.
The Company is listed on the Australian Securities Exchange and its share capital is denominated in Australian dollars. The Group also accesses international debt markets to diversify its funding base and maintain an appropriate amount of leverage. Debt is diversified across currencies and tenure.
Details of the Group’s approach to capital risk management are disclosed in note 4.1.
5.1 Borrowings
2020 2019FINAL MATURITY DATE ISSUE DATE PRINCIPAL AMOUNT US$M US$M
Senior debt25 May 2023 21 September 2017 $6 million 6 6
6 6Subordinated debt25 August 2036 19 August 2020 A$500 million (2019 nil)1 385 – 29 September 2040 29 September 2015 Nil (2019 A$200 million) – 14024 May 2041 24 May 2011 $167 million 167 16724 May 2041 24 May 2011 £24 million 33 3224 May 2042 19 May 2016 £327 million 445 43324 November 2043 17 November 2016 $400 million/A$689 million1 400 4002 December 2044 2 December 2014 $700 million/A$1,169 million1 697 69612 November 2045 12 November 2015 $300 million 300 30017 June 2046 17 June 2016 $524 million 522 522
2,949 2,690Additional Tier 1 instrumentsNo fixed date 16 November 2017 Nil (2019 $400 million) 2 – 399Total borrowings3 2,955 3,095Amounts maturing within 12 months 200 – Amounts maturing in greater than 12 months 2,755 3,095Total borrowings 2,955 3,095
1 Details of related hedging activity are included in note 5.6.1.2 In July 2020, the terms of these instruments were amended, resulting in their classification as equity. Further information is disclosed
in note 5.3.1.3 $2 million of finance costs (2019 nil) were capitalised during the year.
QB
E In
suran
ce Gro
up
A
nn
ual R
epo
rt 2020
123O
ther
info
rmatio
n
6
Fin
ancial
Rep
ort
5
Perfo
rman
ce o
verv
iew
1
Op
erating an
d
finan
cial review
2
Go
vern
ance
3
Directo
rs' R
epo
rt
4

Notes to the financial statements continued
FOR THE YEAR ENDED 31 DECEMBER 2020
Subordinated debt key terms
Subordinated debt due 2036Interest is payable quarterly in arrears at a rate equal to the three-month BBSW rate plus a margin of 2.75% per annum.
Subordinated debt due 2040Interest is payable quarterly in arrears at a rate equal to the 90-day average mid-rate bank bill rate plus a margin of 4.0% per annum.
The securities were redeemed with APRA approval on 29 September 2020.
Subordinated debt due 2041Interest is payable semi-annually in arrears at a fixed rate of 7.25% per annum on the US dollar denominated debt and 7.5% per annum on the sterling debt.
Early redemption notices were issued after the balance date. Redemption is expected in early March 2021.
Subordinated debt due 2042Interest is payable semi-annually in arrears at a fixed rate of 6.115% per annum until 24 May 2022. The rate will reset in 2022, 2027, 2032 and 2037 to a rate calculated by reference to the then five-year mid-market swap rate plus a margin of 5.0% per annum.
Subordinated debt due 2043Interest is payable semi-annually in arrears at a fixed rate of 7.50% per annum until 24 November 2023. The rate will reset in 2023 and 2033 to a rate calculated by reference to the then 10-year US dollar swap rate plus a margin of 6.03% per annum.
QBE has an option to defer payment of interest in certain circumstances and such deferral will not constitute an event of default.
Subordinated debt due 2044Interest is payable semi-annually in arrears at a fixed rate of 6.75% per annum until 2 December 2024, at which time the rate will reset to a 10-year mid-market swap rate plus a margin of 4.3% per annum. The rate will reset again, on the same basis, on 2 December 2034.
Subordinated debt due 2045Interest is payable semi-annually in arrears at a fixed rate of 6.1% per annum until 12 November 2025, at which time the rate will reset to a 10-year mid-market swap rate plus a margin of 3.993% per annum. The rate will reset again, on the same basis, on 12 November 2035.
Subordinated debt due 2046Interest is payable semi-annually in arrears at a fixed rate of 5.875% per annum until 17 June 2026. The rate will reset in 2026 and 2036 to a rate calculated by reference to the then 10-year mid-market swap rate plus a margin of 4.395% per annum.
Redemption terms The securities are redeemable at the option of QBE, with the prior written approval of APRA on 25 August 2026 and each interest payment date thereafter for securities due 2036; on each interest reset date for securities due 2042, 2043, 2044, 2045 and 2046; or at any time in the event of certain tax and regulatory events.
Conversion terms The securities due 2036, 2042, 2043, 2044, 2045 and 2046 must be converted into a variable number of QBE ordinary shares, or written off, if APRA determines QBE to be non-viable. The conversion rate is subject to a price floor of 20% of the VWAP of the shares in the five trading days before the date of issue of the securities.
Security arrangementsThe claims of bondholders pursuant to the subordinated debt will be subordinated in right of payment to the claims of all senior creditors.
How we account for the numbersBorrowings are initially measured at fair value net of transaction costs directly attributable to the transaction and are subsequently measured at amortised cost. Any difference between the proceeds and the redemption amount is recognised through profit or loss over the period of the financial liability using the effective interest method.
5. CAPITAL STRUCTURE
124
5.1.1 Fair value of borrowings
2020 2019US$M US$M
Senior debt 6 6Subordinated debt 3,220 2,958Additional Tier 1 instruments – 412Total fair value of borrowings 3,226 3,376
Consistent with other financial instruments, QBE is required to disclose the basis of valuation with reference to the fair value hierarchy which is explained in detail in note 3.2.1. The fair value of the Group’s borrowings is categorised as level 2 fair value measurements. Fixed and floating rate securities are priced using broker quotes and comparable prices for similar instruments in active markets. Where no active market exists, floating rate resettable notes are priced using par plus accrued interest.
5.1.2 Financing and other costs
2020 2019US$M US$M
Interest expense on borrowings 188 200Other costs 64 57Total financing and other costs 252 257
5.1.3 Movement in borrowings
2020 2019US$M US$M
At 1 January 3,095 3,188Net changes from financing cash flows 218 (199)Reclassification of AT1 instrument (399) –Other non-cash changes (1) 84 Foreign exchange 42 22 At 31 December 2,955 3,095
5.2 Cash and cash equivalents
2020 2019US$M US$M
Fixed interest rate 13 13Floating interest rate 753 534
766 547
Restrictions on useIncluded in cash and cash equivalents are amounts totalling $73 million (2019 $30 million) which are held in Lloyd’s syndicate trust funds. In order to conduct underwriting business within some territories, Lloyd’s syndicates are required to lodge assets in locally regulated trust funds. Under Lloyd’s bylaws, these amounts can only be used to pay claims and allowable expenses of the syndicates and cannot be withdrawn from the trust funds until allowed to be distributed as profit once annual solvency requirements are met.
Also included in cash and cash equivalents is $110 million (2019 $103 million) relating to policyholder trust accounts in the United Kingdom which can only be accessed by QBE in certain circumstances, such as when QBE is owed a deductible by the policyholder on a claim. The Group recognises a corresponding payable in relation to these until such an event occurs.
QBE has operations in many countries which have foreign exchange controls and regulations. These controls and regulations can vary from simple reporting requirements to outright prohibition of movement of funds without explicit prior central bank or regulator approval. The impact of these controls and regulations may restrict the Group’s capacity to repatriate capital and/or profits.
How we account for the numbersCash and cash equivalents include cash at bank and on hand and deposits at call which are readily convertible to cash on hand and which are used for operational cash requirements. Amounts in cash and cash equivalents are the same as those included in the statement of cash flows.
The reconciliation of profit or loss after income tax to net cash flows from operating activities is included in note 8.4.
QB
E In
suran
ce Gro
up
A
nn
ual R
epo
rt 2020
125
Oth
er in
form
ation
6
Fin
ancial
Rep
ort
5
Perfo
rman
ce o
verv
iew
1
Op
erating an
d
finan
cial review
2
Go
vern
ance
3
Directo
rs' R
epo
rt
4
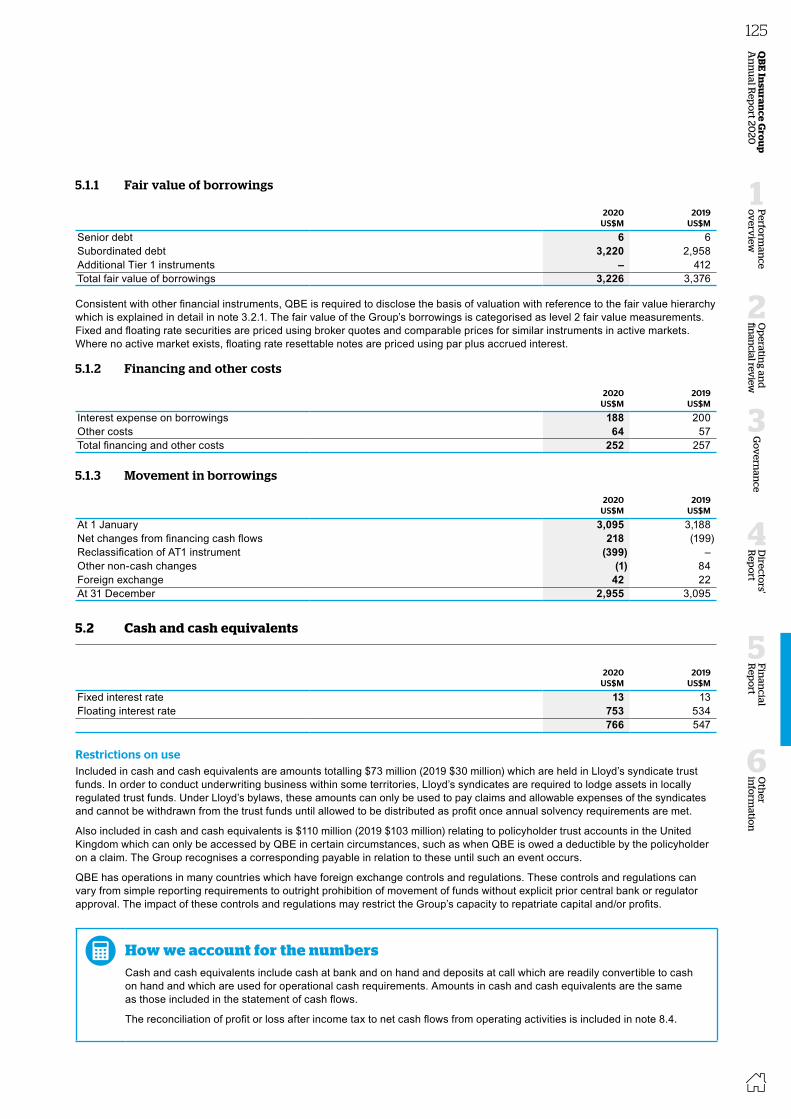
Notes to the financial statements continued
FOR THE YEAR ENDED 31 DECEMBER 2020
Subordinated debt key terms
Subordinated debt due 2036Interest is payable quarterly in arrears at a rate equal to the three-month BBSW rate plus a margin of 2.75% per annum.
Subordinated debt due 2040Interest is payable quarterly in arrears at a rate equal to the 90-day average mid-rate bank bill rate plus a margin of 4.0% per annum.
The securities were redeemed with APRA approval on 29 September 2020.
Subordinated debt due 2041Interest is payable semi-annually in arrears at a fixed rate of 7.25% per annum on the US dollar denominated debt and 7.5% per annum on the sterling debt.
Early redemption notices were issued after the balance date. Redemption is expected in early March 2021.
Subordinated debt due 2042Interest is payable semi-annually in arrears at a fixed rate of 6.115% per annum until 24 May 2022. The rate will reset in 2022, 2027, 2032 and 2037 to a rate calculated by reference to the then five-year mid-market swap rate plus a margin of 5.0% per annum.
Subordinated debt due 2043Interest is payable semi-annually in arrears at a fixed rate of 7.50% per annum until 24 November 2023. The rate will reset in 2023 and 2033 to a rate calculated by reference to the then 10-year US dollar swap rate plus a margin of 6.03% per annum.
QBE has an option to defer payment of interest in certain circumstances and such deferral will not constitute an event of default.
Subordinated debt due 2044Interest is payable semi-annually in arrears at a fixed rate of 6.75% per annum until 2 December 2024, at which time the rate will reset to a 10-year mid-market swap rate plus a margin of 4.3% per annum. The rate will reset again, on the same basis, on 2 December 2034.
Subordinated debt due 2045Interest is payable semi-annually in arrears at a fixed rate of 6.1% per annum until 12 November 2025, at which time the rate will reset to a 10-year mid-market swap rate plus a margin of 3.993% per annum. The rate will reset again, on the same basis, on 12 November 2035.
Subordinated debt due 2046Interest is payable semi-annually in arrears at a fixed rate of 5.875% per annum until 17 June 2026. The rate will reset in 2026 and 2036 to a rate calculated by reference to the then 10-year mid-market swap rate plus a margin of 4.395% per annum.
Redemption terms The securities are redeemable at the option of QBE, with the prior written approval of APRA on 25 August 2026 and each interest payment date thereafter for securities due 2036; on each interest reset date for securities due 2042, 2043, 2044, 2045 and 2046; or at any time in the event of certain tax and regulatory events.
Conversion terms The securities due 2036, 2042, 2043, 2044, 2045 and 2046 must be converted into a variable number of QBE ordinary shares, or written off, if APRA determines QBE to be non-viable. The conversion rate is subject to a price floor of 20% of the VWAP of the shares in the five trading days before the date of issue of the securities.
Security arrangementsThe claims of bondholders pursuant to the subordinated debt will be subordinated in right of payment to the claims of all senior creditors.
How we account for the numbersBorrowings are initially measured at fair value net of transaction costs directly attributable to the transaction and are subsequently measured at amortised cost. Any difference between the proceeds and the redemption amount is recognised through profit or loss over the period of the financial liability using the effective interest method.
5. CAPITAL STRUCTURE
124
5.1.1 Fair value of borrowings
2020 2019US$M US$M
Senior debt 6 6Subordinated debt 3,220 2,958Additional Tier 1 instruments – 412Total fair value of borrowings 3,226 3,376
Consistent with other financial instruments, QBE is required to disclose the basis of valuation with reference to the fair value hierarchy which is explained in detail in note 3.2.1. The fair value of the Group’s borrowings is categorised as level 2 fair value measurements. Fixed and floating rate securities are priced using broker quotes and comparable prices for similar instruments in active markets. Where no active market exists, floating rate resettable notes are priced using par plus accrued interest.
5.1.2 Financing and other costs
2020 2019US$M US$M
Interest expense on borrowings 188 200Other costs 64 57Total financing and other costs 252 257
5.1.3 Movement in borrowings
2020 2019US$M US$M
At 1 January 3,095 3,188Net changes from financing cash flows 218 (199)Reclassification of AT1 instrument (399) –Other non-cash changes (1) 84 Foreign exchange 42 22 At 31 December 2,955 3,095
5.2 Cash and cash equivalents
2020 2019US$M US$M
Fixed interest rate 13 13Floating interest rate 753 534
766 547
Restrictions on useIncluded in cash and cash equivalents are amounts totalling $73 million (2019 $30 million) which are held in Lloyd’s syndicate trust funds. In order to conduct underwriting business within some territories, Lloyd’s syndicates are required to lodge assets in locally regulated trust funds. Under Lloyd’s bylaws, these amounts can only be used to pay claims and allowable expenses of the syndicates and cannot be withdrawn from the trust funds until allowed to be distributed as profit once annual solvency requirements are met.
Also included in cash and cash equivalents is $110 million (2019 $103 million) relating to policyholder trust accounts in the United Kingdom which can only be accessed by QBE in certain circumstances, such as when QBE is owed a deductible by the policyholder on a claim. The Group recognises a corresponding payable in relation to these until such an event occurs.
QBE has operations in many countries which have foreign exchange controls and regulations. These controls and regulations can vary from simple reporting requirements to outright prohibition of movement of funds without explicit prior central bank or regulator approval. The impact of these controls and regulations may restrict the Group’s capacity to repatriate capital and/or profits.
How we account for the numbersCash and cash equivalents include cash at bank and on hand and deposits at call which are readily convertible to cash on hand and which are used for operational cash requirements. Amounts in cash and cash equivalents are the same as those included in the statement of cash flows.
The reconciliation of profit or loss after income tax to net cash flows from operating activities is included in note 8.4.
QB
E In
suran
ce Gro
up
A
nn
ual R
epo
rt 2020
125O
ther
info
rmatio
n
6
Fin
ancial
Rep
ort
5
Perfo
rman
ce o
verv
iew
1
Op
erating an
d
finan
cial review
2
Go
vern
ance
3
Directo
rs' R
epo
rt
4
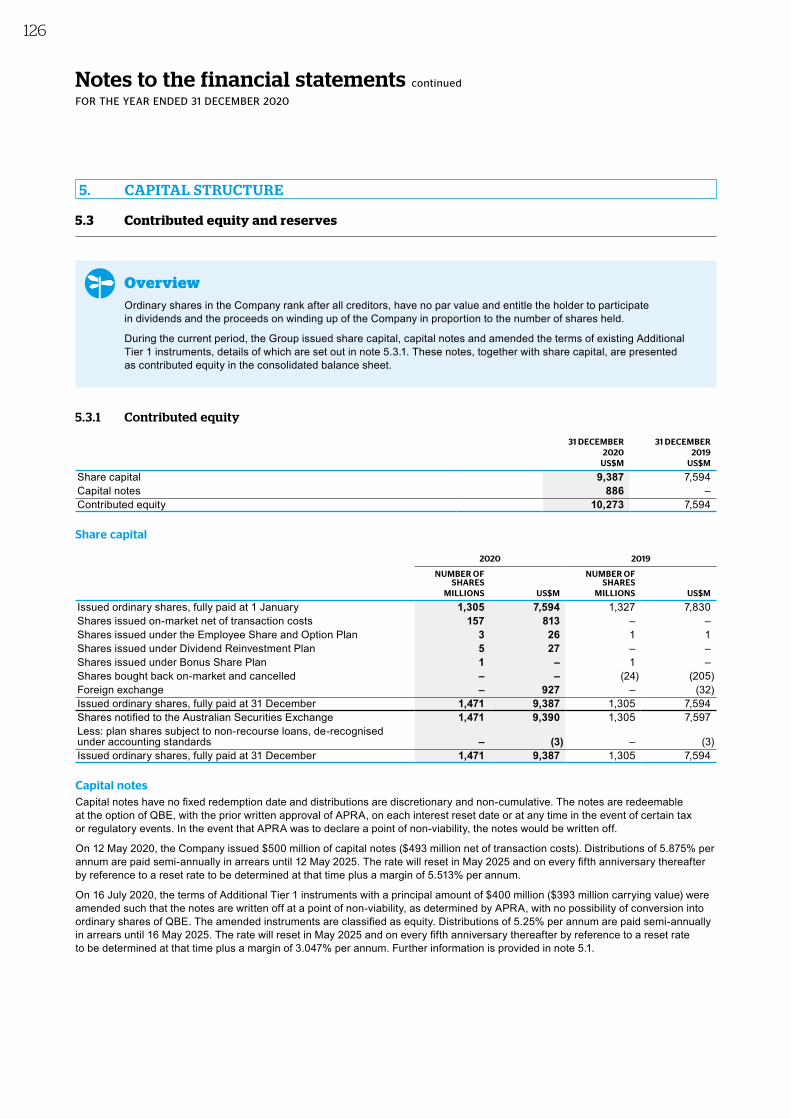
Notes to the financial statements continued
FOR THE YEAR ENDED 31 DECEMBER 2020
5.3 Contributed equity and reserves
OverviewOrdinary shares in the Company rank after all creditors, have no par value and entitle the holder to participate in dividends and the proceeds on winding up of the Company in proportion to the number of shares held.
During the current period, the Group issued share capital, capital notes and amended the terms of existing Additional Tier 1 instruments, details of which are set out in note 5.3.1. These notes, together with share capital, are presented as contributed equity in the consolidated balance sheet.
5.3.1 Contributed equity
31 DECEMBER 31 DECEMBER2020 2019
US$M US$M
Share capital 9,387 7,594Capital notes 886 – Contributed equity 10,273 7,594
Share capital
2020 2019
NUMBER OF SHARES
NUMBER OF SHARES
MILLIONS US$M MILLIONS US$M
Issued ordinary shares, fully paid at 1 January 1,305 7,594 1,327 7,830Shares issued on-market net of transaction costs 157 813 – – Shares issued under the Employee Share and Option Plan 3 26 1 1Shares issued under Dividend Reinvestment Plan 5 27 – – Shares issued under Bonus Share Plan 1 – 1 – Shares bought back on-market and cancelled – – (24) (205)Foreign exchange – 927 – (32)Issued ordinary shares, fully paid at 31 December 1,471 9,387 1,305 7,594Shares notified to the Australian Securities Exchange 1,471 9,390 1,305 7,597Less: plan shares subject to non-recourse loans, de-recognised under accounting standards – (3) – (3)Issued ordinary shares, fully paid at 31 December 1,471 9,387 1,305 7,594
Capital notesCapital notes have no fixed redemption date and distributions are discretionary and non-cumulative. The notes are redeemable at the option of QBE, with the prior written approval of APRA, on each interest reset date or at any time in the event of certain tax or regulatory events. In the event that APRA was to declare a point of non-viability, the notes would be written off.
On 12 May 2020, the Company issued $500 million of capital notes ($493 million net of transaction costs). Distributions of 5.875% per annum are paid semi-annually in arrears until 12 May 2025. The rate will reset in May 2025 and on every fifth anniversary thereafter by reference to a reset rate to be determined at that time plus a margin of 5.513% per annum.
On 16 July 2020, the terms of Additional Tier 1 instruments with a principal amount of $400 million ($393 million carrying value) were amended such that the notes are written off at a point of non-viability, as determined by APRA, with no possibility of conversion into ordinary shares of QBE. The amended instruments are classified as equity. Distributions of 5.25% per annum are paid semi-annually in arrears until 16 May 2025. The rate will reset in May 2025 and on every fifth anniversary thereafter by reference to a reset rate to be determined at that time plus a margin of 3.047% per annum. Further information is provided in note 5.1.
5. CAPITAL STRUCTURE
126
5.3.2 Reserves
2020 2019US$M US$M
Owner occupied property revaluation reserve1
At 1 January 1 4Reclassification on disposal of owner occupied property – (3)At 31 December 1 1Cash flow hedge reserve2
At 1 January (4) (1)Hedging amounts recognised in other comprehensive income (157) (16)Hedging amounts reclassified to profit or loss 127 12Taxation 9 1At 31 December (25) (4)Cost of hedging reserve3
At 1 January (2) – Amounts recognised in other comprehensive income 11 (1)Amounts reclassified to profit or loss (5) (2)Taxation (2) 1At 31 December 2 (2)Foreign currency translation reserve4
At 1 January (1,479) (1,517)Net movement on translation (525) 8Net movement on hedging transactions (27) 20Net movement relating to continuing operations (552) 28Net movement relating to discontinued operations – 10At 31 December (2,031) (1,479)Share‑based payment reserve5
At 1 January 164 167Options and conditional rights expense 20 38Transfers from reserve on vesting of options and conditional rights (28) (41)Foreign exchange 12 – At 31 December 168 164Premium on purchase of non‑controlling interests6
At 1 January (15) (16)Net changes in non-controlling interests – (5)Reclassification to retained profits on disposal 2 6At 31 December (13) (15)Total reserves at 31 December (1,898) (1,335)
Each of the above reserves relates to the following:1 Fair value movements in the carrying value of owner occupied property.2 Cash flow hedges of foreign exchange risk, the accounting policies for which are disclosed in note 5.6.1. 3 Cost of hedging elections as described in note 5.6.1.4 Exchange gains and losses arising on translation of foreign controlled entities and related hedging instruments, the accounting policies
for which are disclosed in note 5.6.1.5 Equity-settled share-based payment awards.6 Movements in ownership interests in subsidiaries that do not result in a loss of control and represent the difference between the amount
by which the non-controlling interest is adjusted and the fair value of the consideration paid or received.
QB
E In
suran
ce Gro
up
A
nn
ual R
epo
rt 2020
127
Oth
er in
form
ation
6
Fin
ancial
Rep
ort
5
Perfo
rman
ce o
verv
iew
1
Op
erating an
d
finan
cial review
2
Go
vern
ance
3
Directo
rs' R
epo
rt
4

Notes to the financial statements continued
FOR THE YEAR ENDED 31 DECEMBER 2020
5.3 Contributed equity and reserves
OverviewOrdinary shares in the Company rank after all creditors, have no par value and entitle the holder to participate in dividends and the proceeds on winding up of the Company in proportion to the number of shares held.
During the current period, the Group issued share capital, capital notes and amended the terms of existing Additional Tier 1 instruments, details of which are set out in note 5.3.1. These notes, together with share capital, are presented as contributed equity in the consolidated balance sheet.
5.3.1 Contributed equity
31 DECEMBER 31 DECEMBER2020 2019
US$M US$M
Share capital 9,387 7,594Capital notes 886 – Contributed equity 10,273 7,594
Share capital
2020 2019
NUMBER OF SHARES
NUMBER OF SHARES
MILLIONS US$M MILLIONS US$M
Issued ordinary shares, fully paid at 1 January 1,305 7,594 1,327 7,830Shares issued on-market net of transaction costs 157 813 – – Shares issued under the Employee Share and Option Plan 3 26 1 1Shares issued under Dividend Reinvestment Plan 5 27 – – Shares issued under Bonus Share Plan 1 – 1 – Shares bought back on-market and cancelled – – (24) (205)Foreign exchange – 927 – (32)Issued ordinary shares, fully paid at 31 December 1,471 9,387 1,305 7,594Shares notified to the Australian Securities Exchange 1,471 9,390 1,305 7,597Less: plan shares subject to non-recourse loans, de-recognised under accounting standards – (3) – (3)Issued ordinary shares, fully paid at 31 December 1,471 9,387 1,305 7,594
Capital notesCapital notes have no fixed redemption date and distributions are discretionary and non-cumulative. The notes are redeemable at the option of QBE, with the prior written approval of APRA, on each interest reset date or at any time in the event of certain tax or regulatory events. In the event that APRA was to declare a point of non-viability, the notes would be written off.
On 12 May 2020, the Company issued $500 million of capital notes ($493 million net of transaction costs). Distributions of 5.875% per annum are paid semi-annually in arrears until 12 May 2025. The rate will reset in May 2025 and on every fifth anniversary thereafter by reference to a reset rate to be determined at that time plus a margin of 5.513% per annum.
On 16 July 2020, the terms of Additional Tier 1 instruments with a principal amount of $400 million ($393 million carrying value) were amended such that the notes are written off at a point of non-viability, as determined by APRA, with no possibility of conversion into ordinary shares of QBE. The amended instruments are classified as equity. Distributions of 5.25% per annum are paid semi-annually in arrears until 16 May 2025. The rate will reset in May 2025 and on every fifth anniversary thereafter by reference to a reset rate to be determined at that time plus a margin of 3.047% per annum. Further information is provided in note 5.1.
5. CAPITAL STRUCTURE
126
5.3.2 Reserves
2020 2019US$M US$M
Owner occupied property revaluation reserve1
At 1 January 1 4Reclassification on disposal of owner occupied property – (3)At 31 December 1 1Cash flow hedge reserve2
At 1 January (4) (1)Hedging amounts recognised in other comprehensive income (157) (16)Hedging amounts reclassified to profit or loss 127 12Taxation 9 1At 31 December (25) (4)Cost of hedging reserve3
At 1 January (2) – Amounts recognised in other comprehensive income 11 (1)Amounts reclassified to profit or loss (5) (2)Taxation (2) 1At 31 December 2 (2)Foreign currency translation reserve4
At 1 January (1,479) (1,517)Net movement on translation (525) 8Net movement on hedging transactions (27) 20Net movement relating to continuing operations (552) 28Net movement relating to discontinued operations – 10At 31 December (2,031) (1,479)Share‑based payment reserve5
At 1 January 164 167Options and conditional rights expense 20 38Transfers from reserve on vesting of options and conditional rights (28) (41)Foreign exchange 12 – At 31 December 168 164Premium on purchase of non‑controlling interests6
At 1 January (15) (16)Net changes in non-controlling interests – (5)Reclassification to retained profits on disposal 2 6At 31 December (13) (15)Total reserves at 31 December (1,898) (1,335)
Each of the above reserves relates to the following:1 Fair value movements in the carrying value of owner occupied property.2 Cash flow hedges of foreign exchange risk, the accounting policies for which are disclosed in note 5.6.1. 3 Cost of hedging elections as described in note 5.6.1.4 Exchange gains and losses arising on translation of foreign controlled entities and related hedging instruments, the accounting policies
for which are disclosed in note 5.6.1.5 Equity-settled share-based payment awards.6 Movements in ownership interests in subsidiaries that do not result in a loss of control and represent the difference between the amount
by which the non-controlling interest is adjusted and the fair value of the consideration paid or received.
QB
E In
suran
ce Gro
up
A
nn
ual R
epo
rt 2020
127O
ther
info
rmatio
n
6
Fin
ancial
Rep
ort
5
Perfo
rman
ce o
verv
iew
1
Op
erating an
d
finan
cial review
2
Go
vern
ance
3
Directo
rs' R
epo
rt
4

Notes to the financial statements continued
FOR THE YEAR ENDED 31 DECEMBER 2020
5.4 Dividends
OverviewOur dividend policy is designed to ensure that we reward shareholders relative to cash profit and maintain sufficient capital for future investment and growth of the business.
2020 2019
INTERIM FINAL INTERIM
Dividend per share (Australian cents) 4 27 25 Franking percentage 10% 30% 60%Franked amount per share (Australian cents) 0.4 8.1 15.0Dividend payout (A$M) 59 352 329Payment date 25 September 2020 9 April 2020 4 October 2019
The Board has elected not to declare a final dividend for 2020.
.
2020 2019US$M US$M
Previous year final dividend on ordinary shares – 30% franked (2018 60% franked) 224 266 Interim dividend on ordinary shares – 10% franked (2019 60% franked) 41 222 Bonus Share Plan dividend forgone (3) (5)Total dividend paid 262 483
Dividend Reinvestment and Bonus Share PlansThe Company operates a Dividend Reinvestment Plan (DRP) and a Bonus Share Plan (BSP) which allow equity holders to receive their dividend entitlement in the form of QBE ordinary shares.
Bonus Share Plan dividend forgoneThe amount paid in dividends during the year has been reduced as a result of certain eligible shareholders participating in the BSP and forgoing all or part of their right to dividends. These shareholders were issued ordinary shares under the BSP. During the year, 523,532 (2019 613,874) ordinary shares were issued under the BSP.
Franking creditsThe franking account balance on a tax paid basis at 31 December 2020 was a surplus of A$71 million (2019 A$87 million).
The unfranked part of the dividend is declared to be conduit foreign income. For shareholders not resident in Australia, the dividend will not be subject to Australian withholding tax.
5. CAPITAL STRUCTURE
128
5.5 Earnings per share
OverviewEarnings per share (EPS) is the amount of profit or loss after income tax attributable to each share. Diluted EPS adjusts the EPS for the impact of shares that are not yet issued but which may be in the future, such as shares potentially issuable from convertible notes, options and employee share-based payments plans.
2020 2019US CENTS US CENTS
For (loss) profit after income tax from continuing operationsBasic (loss) earnings per share (108.5) 43.4 Diluted (loss) earnings per share (108.5) 43.1 For (loss) profit after income taxBasic (loss) earnings per share (108.5) 41.8 Diluted (loss) earnings per share (108.5) 41.5
5.5.1 Reconciliation of earnings used for earnings per share measuresEarnings per share is based on profit or loss after income tax attributable to ordinary equity holders of the Company, as follows:
2020 2019US$M US$M
(Loss) profit after income tax from continuing operations attributable to ordinary equity holders of the Company (1,517) 571 Less: distributions paid on capital notes classified as equity (note 5.3.1) (25) – (Loss) profit used in calculating basic and diluted earnings per share from continuing operations (1,542) 571 (Loss) profit used in calculating basic and diluted earnings per share from discontinued operations – (21)(Loss) profit used in calculating basic and diluted earnings per share (1,542) 550
5.5.2 Reconciliation of weighted average number of ordinary shares used for earnings per share measures
2020 2019NUMBER OF
SHARESNUMBER OF
SHARESMILLIONS MILLIONS
Weighted average number of ordinary shares on issue 1,421 1,318 Weighted average number of non-recourse loan shares issued under the Employee Share and Option Plan (the Plan) – (1)Weighted average number of ordinary shares used as the denominator in calculating basic earnings per share 1,421 1,317 Weighted average number of dilutive potential ordinary shares issued under the Plan1 – 9 Weighted average number of ordinary shares used as the denominator in calculating diluted earnings per share 1,421 1,326
1 8 million (2019 nil) potential ordinary shares issued were excluded from the calculation because they are anti-dilutive.
The basic and diluted average numbers of ordinary shares shown above are used for calculating all earnings per share measures including those for profit or loss after income tax, profit or loss after income tax from continuing operations and loss after income tax from discontinued operations (refer to note 7.1.2).
How we account for the numbersBasic (loss) earnings per share is calculated by dividing profit or loss after income tax attributable to members of the Company, adjusted for the cost of servicing capital notes classified as equity, by the weighted average number of ordinary shares outstanding during the financial year, adjusted for bonus elements in ordinary shares issued during the year.
Diluted (loss) earnings per share adjusts the weighted average number of shares to include dilutive potential ordinary shares and instruments with mandatory conversion features. As there are no impacts on interest and other financing costs from such instruments, diluted (loss) earnings per share utilises the same (loss) earnings figure used in the determination of basic (loss) earnings per share.
QB
E In
suran
ce Gro
up
A
nn
ual R
epo
rt 2020
129
Oth
er in
form
ation
6
Fin
ancial
Rep
ort
5
Perfo
rman
ce o
verv
iew
1
Op
erating an
d
finan
cial review
2
Go
vern
ance
3
Directo
rs' R
epo
rt
4

Notes to the financial statements continued
FOR THE YEAR ENDED 31 DECEMBER 2020
5.4 Dividends
OverviewOur dividend policy is designed to ensure that we reward shareholders relative to cash profit and maintain sufficient capital for future investment and growth of the business.
2020 2019
INTERIM FINAL INTERIM
Dividend per share (Australian cents) 4 27 25 Franking percentage 10% 30% 60%Franked amount per share (Australian cents) 0.4 8.1 15.0Dividend payout (A$M) 59 352 329Payment date 25 September 2020 9 April 2020 4 October 2019
The Board has elected not to declare a final dividend for 2020.
.
2020 2019US$M US$M
Previous year final dividend on ordinary shares – 30% franked (2018 60% franked) 224 266 Interim dividend on ordinary shares – 10% franked (2019 60% franked) 41 222 Bonus Share Plan dividend forgone (3) (5)Total dividend paid 262 483
Dividend Reinvestment and Bonus Share PlansThe Company operates a Dividend Reinvestment Plan (DRP) and a Bonus Share Plan (BSP) which allow equity holders to receive their dividend entitlement in the form of QBE ordinary shares.
Bonus Share Plan dividend forgoneThe amount paid in dividends during the year has been reduced as a result of certain eligible shareholders participating in the BSP and forgoing all or part of their right to dividends. These shareholders were issued ordinary shares under the BSP. During the year, 523,532 (2019 613,874) ordinary shares were issued under the BSP.
Franking creditsThe franking account balance on a tax paid basis at 31 December 2020 was a surplus of A$71 million (2019 A$87 million).
The unfranked part of the dividend is declared to be conduit foreign income. For shareholders not resident in Australia, the dividend will not be subject to Australian withholding tax.
5. CAPITAL STRUCTURE
128
5.5 Earnings per share
OverviewEarnings per share (EPS) is the amount of profit or loss after income tax attributable to each share. Diluted EPS adjusts the EPS for the impact of shares that are not yet issued but which may be in the future, such as shares potentially issuable from convertible notes, options and employee share-based payments plans.
2020 2019US CENTS US CENTS
For (loss) profit after income tax from continuing operationsBasic (loss) earnings per share (108.5) 43.4 Diluted (loss) earnings per share (108.5) 43.1 For (loss) profit after income taxBasic (loss) earnings per share (108.5) 41.8 Diluted (loss) earnings per share (108.5) 41.5
5.5.1 Reconciliation of earnings used for earnings per share measuresEarnings per share is based on profit or loss after income tax attributable to ordinary equity holders of the Company, as follows:
2020 2019US$M US$M
(Loss) profit after income tax from continuing operations attributable to ordinary equity holders of the Company (1,517) 571 Less: distributions paid on capital notes classified as equity (note 5.3.1) (25) – (Loss) profit used in calculating basic and diluted earnings per share from continuing operations (1,542) 571 (Loss) profit used in calculating basic and diluted earnings per share from discontinued operations – (21)(Loss) profit used in calculating basic and diluted earnings per share (1,542) 550
5.5.2 Reconciliation of weighted average number of ordinary shares used for earnings per share measures
2020 2019NUMBER OF
SHARESNUMBER OF
SHARESMILLIONS MILLIONS
Weighted average number of ordinary shares on issue 1,421 1,318 Weighted average number of non-recourse loan shares issued under the Employee Share and Option Plan (the Plan) – (1)Weighted average number of ordinary shares used as the denominator in calculating basic earnings per share 1,421 1,317 Weighted average number of dilutive potential ordinary shares issued under the Plan1 – 9 Weighted average number of ordinary shares used as the denominator in calculating diluted earnings per share 1,421 1,326
1 8 million (2019 nil) potential ordinary shares issued were excluded from the calculation because they are anti-dilutive.
The basic and diluted average numbers of ordinary shares shown above are used for calculating all earnings per share measures including those for profit or loss after income tax, profit or loss after income tax from continuing operations and loss after income tax from discontinued operations (refer to note 7.1.2).
How we account for the numbersBasic (loss) earnings per share is calculated by dividing profit or loss after income tax attributable to members of the Company, adjusted for the cost of servicing capital notes classified as equity, by the weighted average number of ordinary shares outstanding during the financial year, adjusted for bonus elements in ordinary shares issued during the year.
Diluted (loss) earnings per share adjusts the weighted average number of shares to include dilutive potential ordinary shares and instruments with mandatory conversion features. As there are no impacts on interest and other financing costs from such instruments, diluted (loss) earnings per share utilises the same (loss) earnings figure used in the determination of basic (loss) earnings per share.
QB
E In
suran
ce Gro
up
A
nn
ual R
epo
rt 2020
129O
ther
info
rmatio
n
6
Fin
ancial
Rep
ort
5
Perfo
rman
ce o
verv
iew
1
Op
erating an
d
finan
cial review
2
Go
vern
ance
3
Directo
rs' R
epo
rt
4

Notes to the financial statements continued
FOR THE YEAR ENDED 31 DECEMBER 2020
5.6 Derivatives
OverviewDerivatives may be used as a tool to hedge the Group’s foreign exchange exposures. Each controlled entity manages operational foreign exchange volatility by matching liabilities with assets of the same currency, as far as practicable. Forward foreign exchange contracts are used to hedge residual currency exposures, with both the foreign exchange gains or losses on translation of the exposure and the mark-to-market of related derivatives reported through profit or loss. Forward foreign exchange contracts and purchased currency options may also be utilised in cash flow hedging of foreign currency borrowings and/or exposure to net investments in foreign operations (NIFO).
Interest rate swaps and swaptions are used to hedge exposure to interest rate movements on the Group’s borrowings.
Refer to note 4.4 for additional information relating to QBE’s approach to managing interest rate risk and currency risk.
The Group’s exposure to treasury derivatives at the balance date determined by reference to the functional currency of the relevant controlled entity is set out in the table below:
2020 2019
EXPOSUREFAIR VALUE
ASSETFAIR VALUE
LIABILITY EXPOSUREFAIR VALUE
ASSETFAIR VALUE
LIABILITYUS$M US$M US$M US$M US$M US$M
Forward foreign exchange contracts 2,603 505 394 1,865 181 164Forward foreign exchange contracts used in cash flow hedges (1,796) – 419 (1,451) 13 33Forward foreign exchange contracts used in NIFO hedges (345) 13 32 (101) 1 3Interest rate swaps – – – 140 – 2Interest rate swaptions 385 2 – – – –
520 845 195 202
The fair value of forward foreign exchange contracts, interest rate swaps and interest rate swaptions are categorised as level 2 in the fair value hierarchy. They are fair valued using present value techniques utilising observable market data, broker quotes and/or comparable prices for similar instruments in active markets.
How we account for the numbersDerivatives are initially recognised at fair value, determined as the cost of acquisition excluding transaction costs, and remeasured to fair value at each reporting date. Remeasurements are recognised in profit or loss at each reporting date, unless the derivative is designated as part of a qualifying hedge relationship (refer to note 5.6.1).
5.6.1 Designated hedgesThe Group's material designated hedge relationships are analysed below by risk category and are accounted for using the accounting policies set out at the end of this note. Hedging ratios, being the relationship between the quantity of the hedging instrument and the quantity of the hedged item, are 1:1 as the nominal values of hedging instruments match those of the hedged items. Any ineffectiveness arising from factors such as credit risk is not expected to be material. Amounts recognised in equity or reclassified to profit or loss are disclosed in note 5.3.2.
Cash flow hedges of borrowingsAt the balance date, forward foreign exchange contracts were used to hedge foreign currency risk associated with highly probable forecast transactions in relation to $400 million of subordinated notes maturing in 2043 and $700 million of subordinated notes maturing in 2044. Foreign currency risk on future coupons and principal amounts are hedged up to and including the first call dates of the notes, being 2023 and 2024 respectively. Similarly, an interest rate swaption was put in place to hedge interest rate risk in relation to coupons on A$500 million of subordinated notes maturing in 2036. The swaption is exercisable in August 2023 and hedges coupon payments from that date to the first call date in August 2026. These hedges were put in place to more effectively manage currency exposures and costs of funding.
5. CAPITAL STRUCTURE
130
Only the spot components of the forward foreign exchange contracts and the intrinsic value of the interest rate swaptions are designated in hedge relationships. For forward foreign exchange contracts, reclassifications of hedging gains and losses to profit or loss are included in foreign exchange in note 3.1, consistent with the currency movement of the hedged borrowings. For the interest rate swaption, reclassifications of any cumulative hedging gains or losses to profit or loss will occur as related coupon payments are made during the period from August 2023 to August 2026. A 'cost of hedging' election was made in respect of these hedges, as described below, and amortisation of the forward and currency basis components is included in financing costs in note 5.1.2, consistent with the hedged interest and principal payments.
The interest rate swaption does not generate any cash flows until August 2023, when the potential settlement would occur if the swaption is in-the-money at that point in time. The timing of cash flows relating to the forward foreign exchange contracts and corresponding average forward rates are provided in the following table:
2020
MATURING IN:
LESS THAN 1 YEAR
13 TO 24 MONTHS
25 TO 36 MONTHS
37 TO 48 MONTHS
49 TO 60 MONTHS OVER 5 YEARS
Nominal amountsBuy US$M/ Sell A$M 77/129 77/130 477/819 747/1,251 – –
Average forward rate US$/A$ 0.60 0.60 0.58 0.60 – –
2019
MATURING IN:
LESS THAN 1 YEAR
13 TO 24 MONTHS
25 TO 36 MONTHS
37 TO 48 MONTHS
49 TO 60 MONTHS OVER 5 YEARS
Nominal amountsBuy US$M/ Sell A$M 77/105 77/105 77/105 477/682 747/1,073 –
Average forward rate US$/A$ 0.74 0.74 0.74 0.70 0.70 –
Hedges of currency risk relating to translation of net investments in foreign operationsAt the balance date, forward foreign exchange contracts and borrowings were designated as hedges of net investments in foreign operations. Only the spot components of the forward foreign exchange contracts are designated as being in hedge relationships. The forward and currency basis components are measured at fair value through profit or loss and included in foreign exchange in note 3.1. Cumulative hedging gains or losses recognised in equity are recycled to profit or loss only on disposal of the foreign operation.
The timing of cash flows relating to the hedging instruments and corresponding average forward rates, if applicable, are provided in the following table, with borrowings being disclosed by reference to their first call dates (refer to note 5.1):
2020
MATURING IN:
LESS THAN 1 YEAR
13 TO 24 MONTHS
25 TO 36 MONTHS
37 TO 48 MONTHS
49 TO 60 MONTHS OVER 5 YEARS
Debt instruments hedging US dollar net investment in foreign operationsSubordinated debt US$M – – – – – 49Senior debt US$M – – 6 – – – Forward foreign exchange contracts hedging sterling net investment in foreign operations
Nominal amountsBuy A$M/
Sell £M 657/367 – – – – – Average forward rate A$/£ 0.56 – – – – – Debt instruments hedging sterling net investment in foreign operationsSubordinated debt £M 25 327 – – – – Forward foreign exchange contracts hedging Hong Kong dollar net investment in foreign operations
Nominal amountsBuy A$M/
Sell HKDM 177/970 – – – – – Average forward rate A$/HKD 5.48 – – – – – Forward foreign exchange contracts hedging Indian Rupees net investment in foreign operations
Nominal amountsBuy A$M/ Sell INRM 27/1,484 – – – –
Average forward rate A$/INR 54.89 – – – – –
2019
MATURING IN:
LESS THAN 1 YEAR
13 TO 24 MONTHS
25 TO 36 MONTHS
37 TO 48 MONTHS
49 TO 60 MONTHS OVER 5 YEARS
Debt instruments hedging US dollar net investment in foreign operations
Subordinated debtBuy US$M/
Sell A$M – 1 – – – 73Senior debt US$/A$ – – – 6 – – Forward foreign exchange contracts hedging sterling net investment in foreign operations
Nominal amountsBuy A$M/
Sell £M 145/76 – – – – – Average forward rate A$/£ 0.53 – – – – – Debt instruments hedging sterling net investment in foreign operationsSubordinated debt £M – 25 327 – – –
QB
E In
suran
ce Gro
up
A
nn
ual R
epo
rt 2020
131
Oth
er in
form
ation
6
Fin
ancial
Rep
ort
5
Perfo
rman
ce o
verv
iew
1
Op
erating an
d
finan
cial review
2
Go
vern
ance
3
Directo
rs' R
epo
rt
4

Notes to the financial statements continued
FOR THE YEAR ENDED 31 DECEMBER 2020
5.6 Derivatives
OverviewDerivatives may be used as a tool to hedge the Group’s foreign exchange exposures. Each controlled entity manages operational foreign exchange volatility by matching liabilities with assets of the same currency, as far as practicable. Forward foreign exchange contracts are used to hedge residual currency exposures, with both the foreign exchange gains or losses on translation of the exposure and the mark-to-market of related derivatives reported through profit or loss. Forward foreign exchange contracts and purchased currency options may also be utilised in cash flow hedging of foreign currency borrowings and/or exposure to net investments in foreign operations (NIFO).
Interest rate swaps and swaptions are used to hedge exposure to interest rate movements on the Group’s borrowings.
Refer to note 4.4 for additional information relating to QBE’s approach to managing interest rate risk and currency risk.
The Group’s exposure to treasury derivatives at the balance date determined by reference to the functional currency of the relevant controlled entity is set out in the table below:
2020 2019
EXPOSUREFAIR VALUE
ASSETFAIR VALUE
LIABILITY EXPOSUREFAIR VALUE
ASSETFAIR VALUE
LIABILITYUS$M US$M US$M US$M US$M US$M
Forward foreign exchange contracts 2,603 505 394 1,865 181 164Forward foreign exchange contracts used in cash flow hedges (1,796) – 419 (1,451) 13 33Forward foreign exchange contracts used in NIFO hedges (345) 13 32 (101) 1 3Interest rate swaps – – – 140 – 2Interest rate swaptions 385 2 – – – –
520 845 195 202
The fair value of forward foreign exchange contracts, interest rate swaps and interest rate swaptions are categorised as level 2 in the fair value hierarchy. They are fair valued using present value techniques utilising observable market data, broker quotes and/or comparable prices for similar instruments in active markets.
How we account for the numbersDerivatives are initially recognised at fair value, determined as the cost of acquisition excluding transaction costs, and remeasured to fair value at each reporting date. Remeasurements are recognised in profit or loss at each reporting date, unless the derivative is designated as part of a qualifying hedge relationship (refer to note 5.6.1).
5.6.1 Designated hedgesThe Group's material designated hedge relationships are analysed below by risk category and are accounted for using the accounting policies set out at the end of this note. Hedging ratios, being the relationship between the quantity of the hedging instrument and the quantity of the hedged item, are 1:1 as the nominal values of hedging instruments match those of the hedged items. Any ineffectiveness arising from factors such as credit risk is not expected to be material. Amounts recognised in equity or reclassified to profit or loss are disclosed in note 5.3.2.
Cash flow hedges of borrowingsAt the balance date, forward foreign exchange contracts were used to hedge foreign currency risk associated with highly probable forecast transactions in relation to $400 million of subordinated notes maturing in 2043 and $700 million of subordinated notes maturing in 2044. Foreign currency risk on future coupons and principal amounts are hedged up to and including the first call dates of the notes, being 2023 and 2024 respectively. Similarly, an interest rate swaption was put in place to hedge interest rate risk in relation to coupons on A$500 million of subordinated notes maturing in 2036. The swaption is exercisable in August 2023 and hedges coupon payments from that date to the first call date in August 2026. These hedges were put in place to more effectively manage currency exposures and costs of funding.
5. CAPITAL STRUCTURE
130
Only the spot components of the forward foreign exchange contracts and the intrinsic value of the interest rate swaptions are designated in hedge relationships. For forward foreign exchange contracts, reclassifications of hedging gains and losses to profit or loss are included in foreign exchange in note 3.1, consistent with the currency movement of the hedged borrowings. For the interest rate swaption, reclassifications of any cumulative hedging gains or losses to profit or loss will occur as related coupon payments are made during the period from August 2023 to August 2026. A 'cost of hedging' election was made in respect of these hedges, as described below, and amortisation of the forward and currency basis components is included in financing costs in note 5.1.2, consistent with the hedged interest and principal payments.
The interest rate swaption does not generate any cash flows until August 2023, when the potential settlement would occur if the swaption is in-the-money at that point in time. The timing of cash flows relating to the forward foreign exchange contracts and corresponding average forward rates are provided in the following table:
2020
MATURING IN:
LESS THAN 1 YEAR
13 TO 24 MONTHS
25 TO 36 MONTHS
37 TO 48 MONTHS
49 TO 60 MONTHS OVER 5 YEARS
Nominal amountsBuy US$M/ Sell A$M 77/129 77/130 477/819 747/1,251 – –
Average forward rate US$/A$ 0.60 0.60 0.58 0.60 – –
2019
MATURING IN:
LESS THAN 1 YEAR
13 TO 24 MONTHS
25 TO 36 MONTHS
37 TO 48 MONTHS
49 TO 60 MONTHS OVER 5 YEARS
Nominal amountsBuy US$M/ Sell A$M 77/105 77/105 77/105 477/682 747/1,073 –
Average forward rate US$/A$ 0.74 0.74 0.74 0.70 0.70 –
Hedges of currency risk relating to translation of net investments in foreign operationsAt the balance date, forward foreign exchange contracts and borrowings were designated as hedges of net investments in foreign operations. Only the spot components of the forward foreign exchange contracts are designated as being in hedge relationships. The forward and currency basis components are measured at fair value through profit or loss and included in foreign exchange in note 3.1. Cumulative hedging gains or losses recognised in equity are recycled to profit or loss only on disposal of the foreign operation.
The timing of cash flows relating to the hedging instruments and corresponding average forward rates, if applicable, are provided in the following table, with borrowings being disclosed by reference to their first call dates (refer to note 5.1):
2020
MATURING IN:
LESS THAN 1 YEAR
13 TO 24 MONTHS
25 TO 36 MONTHS
37 TO 48 MONTHS
49 TO 60 MONTHS OVER 5 YEARS
Debt instruments hedging US dollar net investment in foreign operationsSubordinated debt US$M – – – – – 49Senior debt US$M – – 6 – – – Forward foreign exchange contracts hedging sterling net investment in foreign operations
Nominal amountsBuy A$M/
Sell £M 657/367 – – – – – Average forward rate A$/£ 0.56 – – – – – Debt instruments hedging sterling net investment in foreign operationsSubordinated debt £M 25 327 – – – – Forward foreign exchange contracts hedging Hong Kong dollar net investment in foreign operations
Nominal amountsBuy A$M/
Sell HKDM 177/970 – – – – – Average forward rate A$/HKD 5.48 – – – – – Forward foreign exchange contracts hedging Indian Rupees net investment in foreign operations
Nominal amountsBuy A$M/ Sell INRM 27/1,484 – – – –
Average forward rate A$/INR 54.89 – – – – –
2019
MATURING IN:
LESS THAN 1 YEAR
13 TO 24 MONTHS
25 TO 36 MONTHS
37 TO 48 MONTHS
49 TO 60 MONTHS OVER 5 YEARS
Debt instruments hedging US dollar net investment in foreign operations
Subordinated debtBuy US$M/
Sell A$M – 1 – – – 73Senior debt US$/A$ – – – 6 – – Forward foreign exchange contracts hedging sterling net investment in foreign operations
Nominal amountsBuy A$M/
Sell £M 145/76 – – – – – Average forward rate A$/£ 0.53 – – – – – Debt instruments hedging sterling net investment in foreign operationsSubordinated debt £M – 25 327 – – –
QB
E In
suran
ce Gro
up
A
nn
ual R
epo
rt 2020
131O
ther
info
rmatio
n
6
Fin
ancial
Rep
ort
5
Perfo
rman
ce o
verv
iew
1
Op
erating an
d
finan
cial review
2
Go
vern
ance
3
Directo
rs' R
epo
rt
4
Notes to the financial statements continued
FOR THE YEAR ENDED 31 DECEMBER 2020
How we account for the numbersWhen a derivative or other financial instrument is designated in a qualifying hedge relationship, the relevant controlled entity formally documents the relationship between the hedging instrument and hedged item, as well as its risk management objectives and its strategy for undertaking hedging transactions. The relevant entity also documents its assessment, both at hedge inception and on an ongoing basis, of whether the hedge effectiveness requirements are met, including the relevant economic relationship, the effect of credit risk and the hedge ratio.
For qualifying cash flow hedges and hedges of net investments in foreign operations, the gain or loss on the hedging instrument associated with the effective portion of the hedge is accumulated in equity through other comprehensive income and is subsequently reclassified to profit or loss when the hedged item also affects profit or loss. For cash flow hedges, this is reflected in the cash flow hedge reserve; for hedges of net investments in foreign operations, this is reflected in the foreign currency translation reserve (refer to note 5.3.2). The gain or loss on any ineffective portion of the hedging instrument is recognised in profit or loss immediately.
Where the forward and currency basis components of a designated derivative do not form part of the designated hedge relationship, these components are accounted for at fair value through profit or loss unless a 'cost of hedging' election is made. Under this election, the fair value of these components at inception of the hedge are amortised through profit or loss over time periods relevant to the hedge, with other changes in their fair values after inception recognised in equity through other comprehensive income. This election can be made on a hedge-by-hedge basis and is reflected in the cost of hedging reserve (refer to note 5.3.2).
Hedge accounting is discontinued when the qualifying hedge no longer meets the criteria for hedge accounting, including when the risk management objective is no longer met or is no longer relevant; the hedging instrument expires or is sold, terminated or exercised; the hedged item matures, is sold or repaid; or a hedged forecast transaction is no longer considered highly probable. When a cash flow hedge is discontinued, any cumulative hedging gain or loss in equity at that time remains in equity and is reclassified to profit or loss when the hedged item affects profit or loss. If the hedged item is a forecast transaction that is no longer considered highly probable, the cumulative gain or loss is immediately reclassified to profit or loss. When a hedge of a net investment in a foreign operation is discontinued, any cumulative hedging gain or loss at that time remains in equity and is only recycled to profit or loss on disposal of the foreign operation, forming part of the resulting gain or loss.
5. CAPITAL STRUCTURE
132
6. TAX
OverviewIncome tax expense or credit is the accounting tax outcome for the period and is calculated as the tax payable on the current period taxable income based on the applicable income tax rate for each jurisdiction, adjusted for changes in deferred tax assets and liabilities attributable to temporary differences and unused tax losses. The relationship between accounting profit or loss and income tax expense or credit is provided in the reconciliation of prima facie tax to income tax expense or credit (refer to note 6.1). Income tax expense does not equate to the amount of tax actually paid to tax authorities around the world, as it is based upon the accrual accounting concept.
Accounting income and expenses do not always have the same recognition pattern as taxable income and expenses, creating a timing difference as to when a tax expense or benefit can be recognised. These differences usually reverse over time but, until they do, a deferred tax asset or liability is recognised on the balance sheet. Note 6.2 details the composition and movements in deferred tax balances and the key management assumptions applied in recognising tax losses.
Details of franking credits available to shareholders are disclosed in note 5.4.
6.1 Reconciliation of prima facie tax to income tax expense or credit
2020 2019NOTE US$M US$M
(Loss) profit before income tax from continuing operations (1,472) 672Prima facie tax (credit) expense at 30% (442) 202Tax effect of non-temporary differences:Untaxed dividends (1) (8)Differences in tax rates 109 (13)Other, including non-allowable expenses and non-taxable income 75 18Prima facie tax adjusted for non-temporary differences (259) 199Deferred tax assets de-recognised (re-recognised) 278 (64)Underprovision (overprovision) in prior years 20 (31)Income tax expense 39 104Analysed as follows:Current tax 59 133Deferred tax (20) (29)
39 104Deferred tax (credit) expense comprises: Deferred tax assets recognised in profit or loss relating to continuing operations 6.2.1 (125) (58)Deferred tax liabilities recognised in profit or loss relating to continuing operations 6.2.2 105 29
(20) (29)
How we account for the numbersThe current income tax credit or expense is calculated on the basis of the tax laws enacted or substantively enacted at the end of the reporting period in the countries in which controlled entities operate and generate taxable income. Management periodically evaluates positions taken in tax returns with respect to situations in which applicable tax regulation is subject to interpretation and establishes provisions where appropriate on the basis of amounts expected to be paid to the tax authorities.
Current tax assets and tax liabilities are offset where the entity has a legally enforceable right to offset and intends to either settle on a net basis or to realise the asset and settle the liability simultaneously. Current and deferred tax is recognised in profit or loss, except to the extent that it relates to items recognised in other comprehensive income or directly in equity. In this case, the tax is also recognised in other comprehensive income or directly in equity, as appropriate.
QB
E In
suran
ce Gro
up
A
nn
ual R
epo
rt 2020
133
Oth
er in
form
ation
6
Fin
ancial
Rep
ort
5
Perfo
rman
ce o
verv
iew
1
Op
erating an
d
finan
cial review
2
Go
vern
ance
3
Directo
rs' R
epo
rt
4

Notes to the financial statements continued
FOR THE YEAR ENDED 31 DECEMBER 2020
How we account for the numbersWhen a derivative or other financial instrument is designated in a qualifying hedge relationship, the relevant controlled entity formally documents the relationship between the hedging instrument and hedged item, as well as its risk management objectives and its strategy for undertaking hedging transactions. The relevant entity also documents its assessment, both at hedge inception and on an ongoing basis, of whether the hedge effectiveness requirements are met, including the relevant economic relationship, the effect of credit risk and the hedge ratio.
For qualifying cash flow hedges and hedges of net investments in foreign operations, the gain or loss on the hedging instrument associated with the effective portion of the hedge is accumulated in equity through other comprehensive income and is subsequently reclassified to profit or loss when the hedged item also affects profit or loss. For cash flow hedges, this is reflected in the cash flow hedge reserve; for hedges of net investments in foreign operations, this is reflected in the foreign currency translation reserve (refer to note 5.3.2). The gain or loss on any ineffective portion of the hedging instrument is recognised in profit or loss immediately.
Where the forward and currency basis components of a designated derivative do not form part of the designated hedge relationship, these components are accounted for at fair value through profit or loss unless a 'cost of hedging' election is made. Under this election, the fair value of these components at inception of the hedge are amortised through profit or loss over time periods relevant to the hedge, with other changes in their fair values after inception recognised in equity through other comprehensive income. This election can be made on a hedge-by-hedge basis and is reflected in the cost of hedging reserve (refer to note 5.3.2).
Hedge accounting is discontinued when the qualifying hedge no longer meets the criteria for hedge accounting, including when the risk management objective is no longer met or is no longer relevant; the hedging instrument expires or is sold, terminated or exercised; the hedged item matures, is sold or repaid; or a hedged forecast transaction is no longer considered highly probable. When a cash flow hedge is discontinued, any cumulative hedging gain or loss in equity at that time remains in equity and is reclassified to profit or loss when the hedged item affects profit or loss. If the hedged item is a forecast transaction that is no longer considered highly probable, the cumulative gain or loss is immediately reclassified to profit or loss. When a hedge of a net investment in a foreign operation is discontinued, any cumulative hedging gain or loss at that time remains in equity and is only recycled to profit or loss on disposal of the foreign operation, forming part of the resulting gain or loss.
5. CAPITAL STRUCTURE
132
6. TAX
OverviewIncome tax expense or credit is the accounting tax outcome for the period and is calculated as the tax payable on the current period taxable income based on the applicable income tax rate for each jurisdiction, adjusted for changes in deferred tax assets and liabilities attributable to temporary differences and unused tax losses. The relationship between accounting profit or loss and income tax expense or credit is provided in the reconciliation of prima facie tax to income tax expense or credit (refer to note 6.1). Income tax expense does not equate to the amount of tax actually paid to tax authorities around the world, as it is based upon the accrual accounting concept.
Accounting income and expenses do not always have the same recognition pattern as taxable income and expenses, creating a timing difference as to when a tax expense or benefit can be recognised. These differences usually reverse over time but, until they do, a deferred tax asset or liability is recognised on the balance sheet. Note 6.2 details the composition and movements in deferred tax balances and the key management assumptions applied in recognising tax losses.
Details of franking credits available to shareholders are disclosed in note 5.4.
6.1 Reconciliation of prima facie tax to income tax expense or credit
2020 2019NOTE US$M US$M
(Loss) profit before income tax from continuing operations (1,472) 672Prima facie tax (credit) expense at 30% (442) 202Tax effect of non-temporary differences:Untaxed dividends (1) (8)Differences in tax rates 109 (13)Other, including non-allowable expenses and non-taxable income 75 18Prima facie tax adjusted for non-temporary differences (259) 199Deferred tax assets de-recognised (re-recognised) 278 (64)Underprovision (overprovision) in prior years 20 (31)Income tax expense 39 104Analysed as follows:Current tax 59 133Deferred tax (20) (29)
39 104Deferred tax (credit) expense comprises: Deferred tax assets recognised in profit or loss relating to continuing operations 6.2.1 (125) (58)Deferred tax liabilities recognised in profit or loss relating to continuing operations 6.2.2 105 29
(20) (29)
How we account for the numbersThe current income tax credit or expense is calculated on the basis of the tax laws enacted or substantively enacted at the end of the reporting period in the countries in which controlled entities operate and generate taxable income. Management periodically evaluates positions taken in tax returns with respect to situations in which applicable tax regulation is subject to interpretation and establishes provisions where appropriate on the basis of amounts expected to be paid to the tax authorities.
Current tax assets and tax liabilities are offset where the entity has a legally enforceable right to offset and intends to either settle on a net basis or to realise the asset and settle the liability simultaneously. Current and deferred tax is recognised in profit or loss, except to the extent that it relates to items recognised in other comprehensive income or directly in equity. In this case, the tax is also recognised in other comprehensive income or directly in equity, as appropriate.
QB
E In
suran
ce Gro
up
A
nn
ual R
epo
rt 2020
133O
ther
info
rmatio
n
6
Fin
ancial
Rep
ort
5
Perfo
rman
ce o
verv
iew
1
Op
erating an
d
finan
cial review
2
Go
vern
ance
3
Directo
rs' R
epo
rt
4
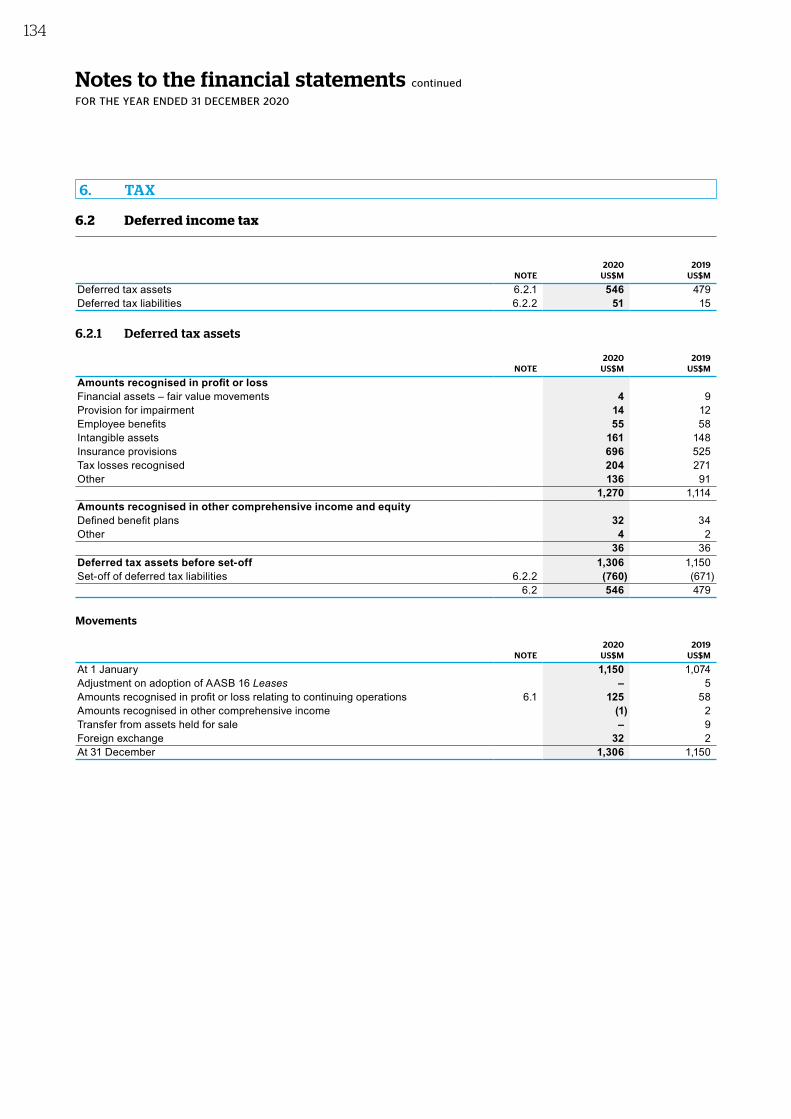
Notes to the financial statements continued
FOR THE YEAR ENDED 31 DECEMBER 2020
6.2 Deferred income tax
2020 2019NOTE US$M US$M
Deferred tax assets 6.2.1 546 479 Deferred tax liabilities 6.2.2 51 15
6.2.1 Deferred tax assets
2020 2019NOTE US$M US$M
Amounts recognised in profit or lossFinancial assets – fair value movements 4 9Provision for impairment 14 12Employee benefits 55 58Intangible assets 161 148Insurance provisions 696 525Tax losses recognised 204 271Other 136 91
1,270 1,114Amounts recognised in other comprehensive income and equityDefined benefit plans 32 34Other 4 2
36 36Deferred tax assets before set‑off 1,306 1,150Set-off of deferred tax liabilities 6.2.2 (760) (671)
6.2 546 479
Movements
2020 2019NOTE US$M US$M
At 1 January 1,150 1,074Adjustment on adoption of AASB 16 Leases – 5Amounts recognised in profit or loss relating to continuing operations 6.1 125 58Amounts recognised in other comprehensive income (1) 2Transfer from assets held for sale – 9Foreign exchange 32 2At 31 December 1,306 1,150
6. TAX
134
Critical accounting judgements and estimates
Recoverability of deferred tax assetsQBE assesses the recoverability of deferred tax assets at each balance date. In making this assessment, QBE considers in particular each controlled entity’s future business plans, history of generating taxable profits, whether the unused tax losses resulted from identifiable causes which are unlikely to recur and if any tax planning opportunities exist in the period in which the taxable losses can be utilised.
The recoverability assessment resulted in the de-recognition of North America tax group deferred tax assets of $120 million, reflecting updated estimates of future taxable profits consistent with QBE’s reassessment of estimated future cash flows used for impairment testing of North American goodwill as discussed in note 7.2.1. The recognised deferred tax asset relating to the North America tax group of $295 million (2019 $415 million) comprises $117 million (2019 $254 million) of carry forward tax losses and $178 million (2019 $161 million) of deductible temporary differences, net of applicable offsetting deferred tax liabilities, as a result of insurance technical reserves and the tax deductibility of goodwill and other intangibles.
Uncertainty continues to exist in relation to the utilisation of this asset, which is subject to there being continued future taxable profits over the period of time in which the losses can be utilised. QBE has made a judgement that the North America tax group will be able to generate sufficient taxable profits over the foreseeable future, based upon its future business plans. Key assumptions include an expectation of future taxable profit driven by no material deterioration in the prior accident year central estimate, a sustained return to underwriting profitability, benefits flowing from initiatives to reduce the cost base of the division and future increases in investment yields. Losses expire over the next 20 years, with the majority expiring between 2031 and 2040. The uncertainty around the recognition of the deferred tax asset will be resolved in future years if taxable profits are generated. Recovery of the asset continues to be sensitive to changes in the combined operating ratio, premium growth and investment yield assumptions as these items are the key drivers of future taxable profits.
6.2.2 Deferred tax liabilities
2020 2019NOTE US$M US$M
Amounts recognised in profit or lossIntangible assets 143 142Insurance provisions 531 441Financial assets – fair value movements 7 13Other provisions 27 12Other 92 74
800 682Amounts recognised in other comprehensive income and equityDefined benefit plans 11 4
11 4Deferred tax liabilities before set‑off 811 686Set-off of deferred tax assets 6.2.1 (760) (671) 6.2 51 15
Movements
2020 2019NOTE US$M US$M
At 1 January 686 653Amounts recognised in profit or loss relating to continuing operations 6.1 105 29Amounts recognised in other comprehensive income 6 2Foreign exchange 14 2At 31 December 811 686
QB
E In
suran
ce Gro
up
A
nn
ual R
epo
rt 2020
135
Oth
er in
form
ation
6
Fin
ancial
Rep
ort
5
Perfo
rman
ce o
verv
iew
1
Op
erating an
d
finan
cial review
2
Go
vern
ance
3
Directo
rs' R
epo
rt
4

Notes to the financial statements continued
FOR THE YEAR ENDED 31 DECEMBER 2020
6.2 Deferred income tax
2020 2019NOTE US$M US$M
Deferred tax assets 6.2.1 546 479 Deferred tax liabilities 6.2.2 51 15
6.2.1 Deferred tax assets
2020 2019NOTE US$M US$M
Amounts recognised in profit or lossFinancial assets – fair value movements 4 9Provision for impairment 14 12Employee benefits 55 58Intangible assets 161 148Insurance provisions 696 525Tax losses recognised 204 271Other 136 91
1,270 1,114Amounts recognised in other comprehensive income and equityDefined benefit plans 32 34Other 4 2
36 36Deferred tax assets before set‑off 1,306 1,150Set-off of deferred tax liabilities 6.2.2 (760) (671)
6.2 546 479
Movements
2020 2019NOTE US$M US$M
At 1 January 1,150 1,074Adjustment on adoption of AASB 16 Leases – 5Amounts recognised in profit or loss relating to continuing operations 6.1 125 58Amounts recognised in other comprehensive income (1) 2Transfer from assets held for sale – 9Foreign exchange 32 2At 31 December 1,306 1,150
6. TAX
134
Critical accounting judgements and estimates
Recoverability of deferred tax assetsQBE assesses the recoverability of deferred tax assets at each balance date. In making this assessment, QBE considers in particular each controlled entity’s future business plans, history of generating taxable profits, whether the unused tax losses resulted from identifiable causes which are unlikely to recur and if any tax planning opportunities exist in the period in which the taxable losses can be utilised.
The recoverability assessment resulted in the de-recognition of North America tax group deferred tax assets of $120 million, reflecting updated estimates of future taxable profits consistent with QBE’s reassessment of estimated future cash flows used for impairment testing of North American goodwill as discussed in note 7.2.1. The recognised deferred tax asset relating to the North America tax group of $295 million (2019 $415 million) comprises $117 million (2019 $254 million) of carry forward tax losses and $178 million (2019 $161 million) of deductible temporary differences, net of applicable offsetting deferred tax liabilities, as a result of insurance technical reserves and the tax deductibility of goodwill and other intangibles.
Uncertainty continues to exist in relation to the utilisation of this asset, which is subject to there being continued future taxable profits over the period of time in which the losses can be utilised. QBE has made a judgement that the North America tax group will be able to generate sufficient taxable profits over the foreseeable future, based upon its future business plans. Key assumptions include an expectation of future taxable profit driven by no material deterioration in the prior accident year central estimate, a sustained return to underwriting profitability, benefits flowing from initiatives to reduce the cost base of the division and future increases in investment yields. Losses expire over the next 20 years, with the majority expiring between 2031 and 2040. The uncertainty around the recognition of the deferred tax asset will be resolved in future years if taxable profits are generated. Recovery of the asset continues to be sensitive to changes in the combined operating ratio, premium growth and investment yield assumptions as these items are the key drivers of future taxable profits.
6.2.2 Deferred tax liabilities
2020 2019NOTE US$M US$M
Amounts recognised in profit or lossIntangible assets 143 142Insurance provisions 531 441Financial assets – fair value movements 7 13Other provisions 27 12Other 92 74
800 682Amounts recognised in other comprehensive income and equityDefined benefit plans 11 4
11 4Deferred tax liabilities before set‑off 811 686Set-off of deferred tax assets 6.2.1 (760) (671) 6.2 51 15
Movements
2020 2019NOTE US$M US$M
At 1 January 686 653Amounts recognised in profit or loss relating to continuing operations 6.1 105 29Amounts recognised in other comprehensive income 6 2Foreign exchange 14 2At 31 December 811 686
QB
E In
suran
ce Gro
up
A
nn
ual R
epo
rt 2020
135O
ther
info
rmatio
n
6
Fin
ancial
Rep
ort
5
Perfo
rman
ce o
verv
iew
1
Op
erating an
d
finan
cial review
2
Go
vern
ance
3
Directo
rs' R
epo
rt
4

Notes to the financial statements continued
FOR THE YEAR ENDED 31 DECEMBER 2020
How we account for the numbersDeferred income tax is provided in full using the liability method on temporary differences arising between the tax bases of assets and liabilities and their carrying amounts in the consolidated financial statements. Deferred tax liabilities are not recognised if they arise from the initial recognition of goodwill or if they arise from the initial recognition of an asset or liability in a transaction other than a business combination that at the time of the transaction affects neither accounting nor taxable profit or loss. Deferred income tax is determined using tax rates (and laws) that have been enacted or substantively enacted by the end of the reporting period and are expected to apply when the related deferred income tax asset is realised or the deferred income tax liability is settled.
Deferred tax assets are recognised for deductible temporary differences and unused tax losses only if it is probable that future taxable amounts will be available to utilise those temporary differences and losses.
Deferred tax assets and liabilities are not recognised for temporary differences between the carrying amount and tax bases of investments in foreign operations where the Controlled entity is able to control the timing of the reversal of the temporary differences and it is probable that the differences will not reverse in the foreseeable future.
Deferred tax assets and liabilities are offset in the consolidated financial statements when there is a legally enforceable right to offset current tax assets and liabilities and when the deferred tax balances relate to the same taxation authority.
6.2.3 Tax lossesThe Group has not brought to account $414 million (2019 $149 million) of tax losses, which includes the benefit arising from tax losses in overseas countries. $66 million of tax losses not brought to account have an indefinite life and the remaining $348 million expire in two to 20 years. The benefits of unused tax losses will only be brought to account when it is probable that they will be realised.
This benefit of tax losses will only be obtained if:• the Group derives future assessable income of a nature and an amount sufficient to enable the benefit from the deductions for the
losses to be realised;• the Group continues to comply with the conditions for deductibility imposed by tax legislation; and• no changes in tax legislation adversely affect the Group in realising the benefit from the deductions for the losses.
6.2.4 Tax consolidation legislationOn adoption of the tax consolidation legislation, the Company and its wholly-owned Australian controlled entities entered into a tax sharing and tax funding agreement that requires the Australian entities to fully compensate the Company for current tax liabilities and to be fully compensated by the Company for any current tax or deferred tax assets in respect of tax losses arising from external transactions occurring after the date of implementation of the tax consolidation legislation. The contributions are allocated by reference to the notional taxable income of each Australian entity. The head entity is QBE Insurance Group Limited.
6. TAX
136
7. GROUP STRUCTURE
OverviewThis section provides information to help users understand the QBE Group structure, including the impact of changes in the financial year. This includes acquisitions and disposals of businesses, intangible assets acquired or developed and the results of impairment reviews.
7.1 Disposals and assets held for sale
7.1.1 Disposals – continuing operations
2020 During the year, QBE disposed of Southern Fire & Casualty Company and Unigard Insurance Company, resulting in a gain of $2 million.
A post-closing adjustment of $4 million loss was recognised in the current period in respect of prior period disposals, mainly in relation to North America’s personal lines business.
2019 During 2019, the Group disposed of its insurance operations in Indonesia and the Philippines, the travel insurance and wool and livestock in transit insurance business in Australia, the Unigard Indemnity entity and remaining personal lines business in North America. These disposals resulted in an aggregate pre-tax loss of $8 million.
7.1.2 Discontinued operationsIn 2019, operations in Latin America were classified as a discontinued operation and were disposed of prior to 2020. Summarised information relating to the 2019 results and cash flows from discontinued operations is disclosed below:
Loss from discontinued operations
2019US$M
Gain before income tax from discontinued operations 2Income tax expense – Gain after income tax from discontinued operations 2Loss on disposal (23)Loss after income tax from discontinued operations attributable to ordinary equity holders of the Company (21)
LOSS PER SHARE FROM DISCONTINUED OPERATIONS ATTRIBUTABLE TO ORDINARY EQUITY HOLDERS OF THE COMPANY
2019US CENTS
Basic loss per share (1.6)Diluted loss per share (1.6)
QB
E In
suran
ce Gro
up
A
nn
ual R
epo
rt 2020
137
Oth
er in
form
ation
6
Fin
ancial
Rep
ort
5
Perfo
rman
ce o
verv
iew
1
Op
erating an
d
finan
cial review
2
Go
vern
ance
3
Directo
rs' R
epo
rt
4
Notes to the financial statements continued
FOR THE YEAR ENDED 31 DECEMBER 2020
How we account for the numbersDeferred income tax is provided in full using the liability method on temporary differences arising between the tax bases of assets and liabilities and their carrying amounts in the consolidated financial statements. Deferred tax liabilities are not recognised if they arise from the initial recognition of goodwill or if they arise from the initial recognition of an asset or liability in a transaction other than a business combination that at the time of the transaction affects neither accounting nor taxable profit or loss. Deferred income tax is determined using tax rates (and laws) that have been enacted or substantively enacted by the end of the reporting period and are expected to apply when the related deferred income tax asset is realised or the deferred income tax liability is settled.
Deferred tax assets are recognised for deductible temporary differences and unused tax losses only if it is probable that future taxable amounts will be available to utilise those temporary differences and losses.
Deferred tax assets and liabilities are not recognised for temporary differences between the carrying amount and tax bases of investments in foreign operations where the Controlled entity is able to control the timing of the reversal of the temporary differences and it is probable that the differences will not reverse in the foreseeable future.
Deferred tax assets and liabilities are offset in the consolidated financial statements when there is a legally enforceable right to offset current tax assets and liabilities and when the deferred tax balances relate to the same taxation authority.
6.2.3 Tax lossesThe Group has not brought to account $414 million (2019 $149 million) of tax losses, which includes the benefit arising from tax losses in overseas countries. $66 million of tax losses not brought to account have an indefinite life and the remaining $348 million expire in two to 20 years. The benefits of unused tax losses will only be brought to account when it is probable that they will be realised.
This benefit of tax losses will only be obtained if:• the Group derives future assessable income of a nature and an amount sufficient to enable the benefit from the deductions for the
losses to be realised;• the Group continues to comply with the conditions for deductibility imposed by tax legislation; and• no changes in tax legislation adversely affect the Group in realising the benefit from the deductions for the losses.
6.2.4 Tax consolidation legislationOn adoption of the tax consolidation legislation, the Company and its wholly-owned Australian controlled entities entered into a tax sharing and tax funding agreement that requires the Australian entities to fully compensate the Company for current tax liabilities and to be fully compensated by the Company for any current tax or deferred tax assets in respect of tax losses arising from external transactions occurring after the date of implementation of the tax consolidation legislation. The contributions are allocated by reference to the notional taxable income of each Australian entity. The head entity is QBE Insurance Group Limited.
6. TAX
136
7. GROUP STRUCTURE
OverviewThis section provides information to help users understand the QBE Group structure, including the impact of changes in the financial year. This includes acquisitions and disposals of businesses, intangible assets acquired or developed and the results of impairment reviews.
7.1 Disposals and assets held for sale
7.1.1 Disposals – continuing operations
2020 During the year, QBE disposed of Southern Fire & Casualty Company and Unigard Insurance Company, resulting in a gain of $2 million.
A post-closing adjustment of $4 million loss was recognised in the current period in respect of prior period disposals, mainly in relation to North America’s personal lines business.
2019 During 2019, the Group disposed of its insurance operations in Indonesia and the Philippines, the travel insurance and wool and livestock in transit insurance business in Australia, the Unigard Indemnity entity and remaining personal lines business in North America. These disposals resulted in an aggregate pre-tax loss of $8 million.
7.1.2 Discontinued operationsIn 2019, operations in Latin America were classified as a discontinued operation and were disposed of prior to 2020. Summarised information relating to the 2019 results and cash flows from discontinued operations is disclosed below:
Loss from discontinued operations
2019US$M
Gain before income tax from discontinued operations 2Income tax expense – Gain after income tax from discontinued operations 2Loss on disposal (23)Loss after income tax from discontinued operations attributable to ordinary equity holders of the Company (21)
LOSS PER SHARE FROM DISCONTINUED OPERATIONS ATTRIBUTABLE TO ORDINARY EQUITY HOLDERS OF THE COMPANY
2019US CENTS
Basic loss per share (1.6)Diluted loss per share (1.6)
QB
E In
suran
ce Gro
up
A
nn
ual R
epo
rt 2020
137O
ther
info
rmatio
n
6
Fin
ancial
Rep
ort
5
Perfo
rman
ce o
verv
iew
1
Op
erating an
d
finan
cial review
2
Go
vern
ance
3
Directo
rs' R
epo
rt
4
Notes to the financial statements continued
FOR THE YEAR ENDED 31 DECEMBER 2020
During the prior period, the Group disposed of its remaining discontinued Latin American operations in Colombia and Puerto Rico, information on which is set out in the table below:
2019US$M
Assets Cash, investments and other financial assets 169Insurance assets 187Current and deferred tax assets 17Property, plant and equipment 4Total assets 377LiabilitiesInsurance liabilities 304Current and deferred tax liabilities 1Other liabilities 5Total liabilities 310Net assets at the dates of disposal 67Proceeds received on disposal 54Net loss on disposal before reclassification of foreign currency translation reserve (13)Reclassification of foreign currency translation reserve (10)Net loss on disposal after reclassification of foreign currency translation reserve included in the results of discontinued operations (23)
Net cash flows from discontinued operations
2019US$M
Net movement in cash and cash equivalents from discontinued operations (13)
7. GROUP STRUCTURE
138
7.2 Intangible assets
Overview Intangible assets are assets with no physical substance. The most significant classes of intangible assets are detailed below:
Lloyd’s syndicate capacityThe Lloyd’s syndicate capacity intangible asset relates to the syndicate capacity acquired as part of the acquisition of QBE Underwriting Limited (formerly trading as Limit) in 2000 and costs incurred as a result of increasing capacity since that date. Syndicate capacity is the aggregate of the premium limits of each member of that syndicate at a point in time. An existing capital provider has the first right to participate on the next year of account, giving the indefinite right to participate on all future years of account. The Group has demonstrated a long-term commitment to developing its operations at Lloyd’s. The value of this asset is in the access it gives to future underwriting profits at Lloyd’s. For these reasons, Lloyd’s syndicate capacity is deemed to have an indefinite useful life.
Customer relationshipsCustomer relationships comprise the capitalisation of future profits relating to insurance contracts acquired and the expected renewal of those contracts. It also includes the value of distribution networks and agency relationships. Customer relationships are amortised over remaining lives of up to five years depending on the classes of business to which the assets relate.
Brand namesThese assets reflect the revenue generating ability of acquired brands. In some circumstances, brand names are considered to have an indefinite useful life due to the long-term nature of the asset.
Insurance licencesThese assets give the Group the right to operate in certain geographic locations and to write certain classes of business with a potential to generate additional revenue. In some cases, these are considered to have an indefinite useful life due to their long-term nature; however, where there is a finite useful life, assets are amortised over the remaining period, up to 16 years.
SoftwareThis includes both acquired and internally developed software which is not integral or closely related to an item of hardware such as an underwriting system. Capitalised software is amortised over periods of up to 10 years, reflecting the period during which the Group is expected to benefit from the use of the software.
GoodwillGoodwill represents the excess of the cost of an acquisition over the fair value of the Group’s share of the net identifiable assets acquired. Goodwill has an indefinite useful life and therefore is not subject to amortisation but is tested for impairment annually, or more often if there is an indication of impairment.
QB
E In
suran
ce Gro
up
A
nn
ual R
epo
rt 2020
139
Oth
er in
form
ation
6
Fin
ancial
Rep
ort
5
Perfo
rman
ce o
verv
iew
1
Op
erating an
d
finan
cial review
2
Go
vern
ance
3
Directo
rs' R
epo
rt
4

Notes to the financial statements continued
FOR THE YEAR ENDED 31 DECEMBER 2020
During the prior period, the Group disposed of its remaining discontinued Latin American operations in Colombia and Puerto Rico, information on which is set out in the table below:
2019US$M
Assets Cash, investments and other financial assets 169Insurance assets 187Current and deferred tax assets 17Property, plant and equipment 4Total assets 377LiabilitiesInsurance liabilities 304Current and deferred tax liabilities 1Other liabilities 5Total liabilities 310Net assets at the dates of disposal 67Proceeds received on disposal 54Net loss on disposal before reclassification of foreign currency translation reserve (13)Reclassification of foreign currency translation reserve (10)Net loss on disposal after reclassification of foreign currency translation reserve included in the results of discontinued operations (23)
Net cash flows from discontinued operations
2019US$M
Net movement in cash and cash equivalents from discontinued operations (13)
7. GROUP STRUCTURE
138
7.2 Intangible assets
Overview Intangible assets are assets with no physical substance. The most significant classes of intangible assets are detailed below:
Lloyd’s syndicate capacityThe Lloyd’s syndicate capacity intangible asset relates to the syndicate capacity acquired as part of the acquisition of QBE Underwriting Limited (formerly trading as Limit) in 2000 and costs incurred as a result of increasing capacity since that date. Syndicate capacity is the aggregate of the premium limits of each member of that syndicate at a point in time. An existing capital provider has the first right to participate on the next year of account, giving the indefinite right to participate on all future years of account. The Group has demonstrated a long-term commitment to developing its operations at Lloyd’s. The value of this asset is in the access it gives to future underwriting profits at Lloyd’s. For these reasons, Lloyd’s syndicate capacity is deemed to have an indefinite useful life.
Customer relationshipsCustomer relationships comprise the capitalisation of future profits relating to insurance contracts acquired and the expected renewal of those contracts. It also includes the value of distribution networks and agency relationships. Customer relationships are amortised over remaining lives of up to five years depending on the classes of business to which the assets relate.
Brand namesThese assets reflect the revenue generating ability of acquired brands. In some circumstances, brand names are considered to have an indefinite useful life due to the long-term nature of the asset.
Insurance licencesThese assets give the Group the right to operate in certain geographic locations and to write certain classes of business with a potential to generate additional revenue. In some cases, these are considered to have an indefinite useful life due to their long-term nature; however, where there is a finite useful life, assets are amortised over the remaining period, up to 16 years.
SoftwareThis includes both acquired and internally developed software which is not integral or closely related to an item of hardware such as an underwriting system. Capitalised software is amortised over periods of up to 10 years, reflecting the period during which the Group is expected to benefit from the use of the software.
GoodwillGoodwill represents the excess of the cost of an acquisition over the fair value of the Group’s share of the net identifiable assets acquired. Goodwill has an indefinite useful life and therefore is not subject to amortisation but is tested for impairment annually, or more often if there is an indication of impairment.
QB
E In
suran
ce Gro
up
A
nn
ual R
epo
rt 2020
139O
ther
info
rmatio
n
6
Fin
ancial
Rep
ort
5
Perfo
rman
ce o
verv
iew
1
Op
erating an
d
finan
cial review
2
Go
vern
ance
3
Directo
rs' R
epo
rt
4

Notes to the financial statements continued
FOR THE YEAR ENDED 31 DECEMBER 2020
IDENTIFIABLE INTANGIBLES GOODWILL TOTAL
2020
LLOYD’S SYNDICATE
CAPACITY US$M
CUSTOMER RELATION-
SHIPS US$M
BRAND NAMES
US$M
INSURANCE LICENCES
US$MSOFTWARE
US$MOTHER
US$M
US$M
US$M
CostAt 1 January 84 454 26 152 378 19 2,330 3,443Additions/reclassifications – – – – 71 – – 71Impairment – continuing operations – (3) – (11) (34) – (390) (438)Disposals/transfers to assets held for sale – – – (3) (1) – – (4)Foreign exchange 3 4 1 10 28 – 167 213At 31 December 87 455 27 148 442 19 2,107 3,285 AmortisationAt 1 January – (388) (21) (70) (155) (18) – (652)Amortisation – continuing operations1 – (21) – (2) (50) (1) – (74)Foreign exchange – (3) (1) (7) (14) – – (25)At 31 December – (412) (22) (79) (219) (19) – (751)Carrying amountAt 31 December 87 43 5 69 223 – 2,107 2,534
1 Amortisation of $46 million is included in underwriting expenses as it relates to intangible assets integral to the Group’s underwriting activities.
IDENTIFIABLE INTANGIBLES GOODWILL TOTAL
2019
LLOYD’S SYNDICATE
CAPACITY US$M
CUSTOMER RELATION-
SHIPS US$M
BRAND NAMES
US$M
INSURANCE LICENSES
US$MSOFTWARE
US$MOTHER
US$M
US$M
US$M
CostAt 1 January 81 564 26 41 292 16 2,333 3,353Additions/reclassifications – (111) – 111 83 1 – 84Impairment reversal – continuing operations – – – – 6 – – 6Impairment – continuing operations – – – – (2) – – (2)Disposals/transfer to assets held for sale – – – (2) (4) – (2) (8)Foreign exchange 3 1 – 2 3 2 (1) 10At 31 December 84 454 26 152 378 19 2,330 3,443 AmortisationAt 1 January – (403) (19) – (115) (16) – (553)Reclassifications – 72 – (72) – – – – Amortisation – continuing operations1 – (53) – – (43) (2) – (98)Disposals/transfers to assets held for sale – – – 3 3 – – 6Foreign exchange – (4) (2) (1) – – – (7)At 31 December – (388) (21) (70) (155) (18) – (652)Carrying amountAt 31 December 84 66 5 82 223 1 2,330 2,791
1 Amortisation of $43 million is included in underwriting expenses as it relates to intangible assets integral to the Group's underwriting activities.
7. GROUP STRUCTURE
140
How we account for the numbersIntangible assets are measured at cost less accumulated amortisation and impairment. Those with a finite useful life are amortised over their estimated useful life in accordance with the pattern of expected consumption of economic benefits, with amortisation expense reported in underwriting and other expenses or in amortisation and impairment of intangibles depending on the use of the asset. Intangible assets with an indefinite useful life are not subject to amortisation but are tested for impairment annually or more frequently if there are indicators of impairment. Intangible assets with a finite useful life are reviewed for impairment whenever events or changes in circumstances indicate that the carrying amount may not be recoverable.
7.2.1 Impairment testing of intangible assets
OverviewAn intangible asset’s recoverable value is the greater of its value in use and its fair value less cost to sell.
For intangible assets with a finite life, if there are indicators that the intangible asset’s recoverable value has fallen below its carrying value (e.g. due to changing market conditions), an impairment test is performed and a loss is recognised for the amount by which the carrying value exceeds the asset’s recoverable value.
Intangible assets that have an indefinite useful life, such as goodwill, are tested annually for impairment or more frequently where there is an indication that the carrying amount may not be recoverable.
Goodwill is allocated to cash-generating units, or groups of units, expected to benefit from synergies arising from the acquisition giving rise to the goodwill. Cash-generating units or groups of cash-generating units reflect the level at which goodwill is monitored for impairment by management. As the Group acquires or disposes of operations or reorganises the way that operations are managed, reporting structures may change, giving rise to a reassessment of cash-generating units and the allocation of goodwill to those cash-generating units.
The changes to the Group’s operating segments described in note 1.3 have resulted in changes to the composition of the cash-generating units to which goodwill is allocated.
The goodwill relating to certain acquisitions is denominated in currencies other than the US dollar and so is subject to foreign exchange movements.
Goodwill is analysed by groups of cash-generating units as follows:
2020 2019US$M US$M
North America 358 832International 546 417Australia Pacific 1,203 1,081
2,107 2,330
Impairment lossesDuring 2020, $390 million of goodwill relating to North America was impaired. Further detail is provided below.
During 2020, capitalised software assets of $34 million were impaired following management’s review for indicators of impairment in light of planned strategic changes to modernise the Group’s technology state. Insurance licences and customer relationship assets were also impaired by $14 million in aggregate following a review of their recoverability in light of recent business performance.
During 2019, capitalised software assets of $2 million were impaired and $6 million of previous impairment was reversed.
QB
E In
suran
ce Gro
up
A
nn
ual R
epo
rt 2020
141
Oth
er in
form
ation
6
Fin
ancial
Rep
ort
5
Perfo
rman
ce o
verv
iew
1
Op
erating an
d
finan
cial review
2
Go
vern
ance
3
Directo
rs' R
epo
rt
4

Notes to the financial statements continued
FOR THE YEAR ENDED 31 DECEMBER 2020
IDENTIFIABLE INTANGIBLES GOODWILL TOTAL
2020
LLOYD’S SYNDICATE
CAPACITY US$M
CUSTOMER RELATION-
SHIPS US$M
BRAND NAMES
US$M
INSURANCE LICENCES
US$MSOFTWARE
US$MOTHER
US$M
US$M
US$M
CostAt 1 January 84 454 26 152 378 19 2,330 3,443Additions/reclassifications – – – – 71 – – 71Impairment – continuing operations – (3) – (11) (34) – (390) (438)Disposals/transfers to assets held for sale – – – (3) (1) – – (4)Foreign exchange 3 4 1 10 28 – 167 213At 31 December 87 455 27 148 442 19 2,107 3,285 AmortisationAt 1 January – (388) (21) (70) (155) (18) – (652)Amortisation – continuing operations1 – (21) – (2) (50) (1) – (74)Foreign exchange – (3) (1) (7) (14) – – (25)At 31 December – (412) (22) (79) (219) (19) – (751)Carrying amountAt 31 December 87 43 5 69 223 – 2,107 2,534
1 Amortisation of $46 million is included in underwriting expenses as it relates to intangible assets integral to the Group’s underwriting activities.
IDENTIFIABLE INTANGIBLES GOODWILL TOTAL
2019
LLOYD’S SYNDICATE
CAPACITY US$M
CUSTOMER RELATION-
SHIPS US$M
BRAND NAMES
US$M
INSURANCE LICENSES
US$MSOFTWARE
US$MOTHER
US$M
US$M
US$M
CostAt 1 January 81 564 26 41 292 16 2,333 3,353Additions/reclassifications – (111) – 111 83 1 – 84Impairment reversal – continuing operations – – – – 6 – – 6Impairment – continuing operations – – – – (2) – – (2)Disposals/transfer to assets held for sale – – – (2) (4) – (2) (8)Foreign exchange 3 1 – 2 3 2 (1) 10At 31 December 84 454 26 152 378 19 2,330 3,443 AmortisationAt 1 January – (403) (19) – (115) (16) – (553)Reclassifications – 72 – (72) – – – – Amortisation – continuing operations1 – (53) – – (43) (2) – (98)Disposals/transfers to assets held for sale – – – 3 3 – – 6Foreign exchange – (4) (2) (1) – – – (7)At 31 December – (388) (21) (70) (155) (18) – (652)Carrying amountAt 31 December 84 66 5 82 223 1 2,330 2,791
1 Amortisation of $43 million is included in underwriting expenses as it relates to intangible assets integral to the Group's underwriting activities.
7. GROUP STRUCTURE
140
How we account for the numbersIntangible assets are measured at cost less accumulated amortisation and impairment. Those with a finite useful life are amortised over their estimated useful life in accordance with the pattern of expected consumption of economic benefits, with amortisation expense reported in underwriting and other expenses or in amortisation and impairment of intangibles depending on the use of the asset. Intangible assets with an indefinite useful life are not subject to amortisation but are tested for impairment annually or more frequently if there are indicators of impairment. Intangible assets with a finite useful life are reviewed for impairment whenever events or changes in circumstances indicate that the carrying amount may not be recoverable.
7.2.1 Impairment testing of intangible assets
OverviewAn intangible asset’s recoverable value is the greater of its value in use and its fair value less cost to sell.
For intangible assets with a finite life, if there are indicators that the intangible asset’s recoverable value has fallen below its carrying value (e.g. due to changing market conditions), an impairment test is performed and a loss is recognised for the amount by which the carrying value exceeds the asset’s recoverable value.
Intangible assets that have an indefinite useful life, such as goodwill, are tested annually for impairment or more frequently where there is an indication that the carrying amount may not be recoverable.
Goodwill is allocated to cash-generating units, or groups of units, expected to benefit from synergies arising from the acquisition giving rise to the goodwill. Cash-generating units or groups of cash-generating units reflect the level at which goodwill is monitored for impairment by management. As the Group acquires or disposes of operations or reorganises the way that operations are managed, reporting structures may change, giving rise to a reassessment of cash-generating units and the allocation of goodwill to those cash-generating units.
The changes to the Group’s operating segments described in note 1.3 have resulted in changes to the composition of the cash-generating units to which goodwill is allocated.
The goodwill relating to certain acquisitions is denominated in currencies other than the US dollar and so is subject to foreign exchange movements.
Goodwill is analysed by groups of cash-generating units as follows:
2020 2019US$M US$M
North America 358 832International 546 417Australia Pacific 1,203 1,081
2,107 2,330
Impairment lossesDuring 2020, $390 million of goodwill relating to North America was impaired. Further detail is provided below.
During 2020, capitalised software assets of $34 million were impaired following management’s review for indicators of impairment in light of planned strategic changes to modernise the Group’s technology state. Insurance licences and customer relationship assets were also impaired by $14 million in aggregate following a review of their recoverability in light of recent business performance.
During 2019, capitalised software assets of $2 million were impaired and $6 million of previous impairment was reversed.
QB
E In
suran
ce Gro
up
A
nn
ual R
epo
rt 2020
141O
ther
info
rmatio
n
6
Fin
ancial
Rep
ort
5
Perfo
rman
ce o
verv
iew
1
Op
erating an
d
finan
cial review
2
Go
vern
ance
3
Directo
rs' R
epo
rt
4
Notes to the financial statements continued
FOR THE YEAR ENDED 31 DECEMBER 2020
How we account for the numbers
Impairment testing of identifiable intangible assetsThe recoverable amount of each intangible asset with an indefinite useful life has been determined by reference to a value in use calculation based on the following key assumptions and estimates:• Cash flow forecasts relevant to the initial valuation of the identifiable intangible asset are reviewed and updated
(if appropriate) by management. Cash flow forecasts are based on a combination of actual performance to date and management’s expectations of future performance based on prevailing and anticipated market factors.
• Discount rates that include a beta and a market risk premium sourced from observable market information and a specific risk premium appropriate to reflect the nature of the risk associated with the intangible asset or the cash-generating unit to which the asset is allocated.
Impairment testing of goodwillThe recoverable amount of each cash-generating unit or group of cash-generating units has been determined by reference to a value in use calculation based on the following key assumptions and estimates:• Cash flow forecasts reflecting combined operating ratio and investment return assumptions that build from the latest
three-year business plan. These forecasts cover a period of five years, with the final two years determined with reference to the terminal growth rates discussed below. The cash flow forecasts are based on a combination of historical performance and management’s expectations of future performance based on prevailing and anticipated market factors and the benefit of committed cost saving measures.
• Terminal value is calculated using a perpetuity growth formula from the end of the cash flow forecast period. Growth rates reflect the long-term average growth rates of the countries relevant to the cash-generating unit or group of cash-generating units and are based on observable market information. The terminal growth rates used in management’s impairment testing are: North America 2.3% (2019 2.5%), Australia Pacific 2.5% (2019 2.5%) and International 2.0% (2019 2.0%).
• Discount rates that reflect a beta and a market risk premium sourced from observable market information and a specific risk premium appropriate to reflect the nature of the business of each cash-generating unit or group of cash-generating units. The pre-tax discount rates used were: North America 9.8% (2019 10.9%), Australia Pacific 12.5% (2019 12.4%) and International 9.0% (2019 8.9%). The post-tax discount rates used were: North America 7.8% (2019 8.9%), Australia Pacific 9.1% (2019 8.8%) and International 7.3% (2019 7.4%).
7. GROUP STRUCTURE
142
Critical accounting judgements and estimatesThe impairment test completed in respect of goodwill relating to North America resulted in an impairment of $390 million at the current balance date. QBE has reassessed the business plan and terminal value combined operating ratio assumption used in the impairment test, and has explicitly considered the impacts of COVID-19, as well as elevated catastrophe activity and crop losses that occurred in the second half of the year. The reassessment resulted in an increase to the terminal value combined operating ratio assumption (broadly aligned with the historical underlying financial performance of the business), and a reduction in the specific risk premium in the discount rate to account for the execution risk that is directly reflected in the updated combined operating ratio assumption. The updated assumptions are set out below.
After recognising the impairment, both the recoverable amount and carrying value of the North American cash-generating unit are $2,450 million, resulting in nil headroom (being the excess of recoverable value over carrying value) at the current balance date compared with headroom of $596 million at 31 December 2019. The valuation continues to be highly sensitive to a range of assumptions, in particular the forecast combined operating ratio used in the terminal value calculation, discount rate and long-term investment return. The impact of changes in these key assumptions is shown in the table below and each change has been calculated in isolation from other changes. In practice, this is considered unlikely to occur due to interrelationships between assumptions.
As previously noted, the structural and reporting changes associated with changes to the Group’s operating segments have resulted in changes to the composition of cash-generating units to which North American goodwill is allocated. Excluding this change, impairment of goodwill relating to North America would have been $415 million.
KEY ASSUMPTIONASSUMPTION
%SENSITIVITY
%
IMPACT OF SENSITIVITY ON CARRYING VALUE OF GOODWILL
Terminal value combined operating ratio 98.5 +1 Impairment of $358 million(2019 95.8) -1 Headroom of $491 million
Long-term investment return 3.75 +1 Headroom of $714 million(2019 4.17) -1 Impairment of $358 million
Post-tax discount rate 7.8 +1 Impairment of $358 million(2019 8.9) -1 Headroom of $654 million
QB
E In
suran
ce Gro
up
A
nn
ual R
epo
rt 2020
143
Oth
er in
form
ation
6
Fin
ancial
Rep
ort
5
Perfo
rman
ce o
verv
iew
1
Op
erating an
d
finan
cial review
2
Go
vern
ance
3
Directo
rs' R
epo
rt
4

Notes to the financial statements continued
FOR THE YEAR ENDED 31 DECEMBER 2020
How we account for the numbers
Impairment testing of identifiable intangible assetsThe recoverable amount of each intangible asset with an indefinite useful life has been determined by reference to a value in use calculation based on the following key assumptions and estimates:• Cash flow forecasts relevant to the initial valuation of the identifiable intangible asset are reviewed and updated
(if appropriate) by management. Cash flow forecasts are based on a combination of actual performance to date and management’s expectations of future performance based on prevailing and anticipated market factors.
• Discount rates that include a beta and a market risk premium sourced from observable market information and a specific risk premium appropriate to reflect the nature of the risk associated with the intangible asset or the cash-generating unit to which the asset is allocated.
Impairment testing of goodwillThe recoverable amount of each cash-generating unit or group of cash-generating units has been determined by reference to a value in use calculation based on the following key assumptions and estimates:• Cash flow forecasts reflecting combined operating ratio and investment return assumptions that build from the latest
three-year business plan. These forecasts cover a period of five years, with the final two years determined with reference to the terminal growth rates discussed below. The cash flow forecasts are based on a combination of historical performance and management’s expectations of future performance based on prevailing and anticipated market factors and the benefit of committed cost saving measures.
• Terminal value is calculated using a perpetuity growth formula from the end of the cash flow forecast period. Growth rates reflect the long-term average growth rates of the countries relevant to the cash-generating unit or group of cash-generating units and are based on observable market information. The terminal growth rates used in management’s impairment testing are: North America 2.3% (2019 2.5%), Australia Pacific 2.5% (2019 2.5%) and International 2.0% (2019 2.0%).
• Discount rates that reflect a beta and a market risk premium sourced from observable market information and a specific risk premium appropriate to reflect the nature of the business of each cash-generating unit or group of cash-generating units. The pre-tax discount rates used were: North America 9.8% (2019 10.9%), Australia Pacific 12.5% (2019 12.4%) and International 9.0% (2019 8.9%). The post-tax discount rates used were: North America 7.8% (2019 8.9%), Australia Pacific 9.1% (2019 8.8%) and International 7.3% (2019 7.4%).
7. GROUP STRUCTURE
142
Critical accounting judgements and estimatesThe impairment test completed in respect of goodwill relating to North America resulted in an impairment of $390 million at the current balance date. QBE has reassessed the business plan and terminal value combined operating ratio assumption used in the impairment test, and has explicitly considered the impacts of COVID-19, as well as elevated catastrophe activity and crop losses that occurred in the second half of the year. The reassessment resulted in an increase to the terminal value combined operating ratio assumption (broadly aligned with the historical underlying financial performance of the business), and a reduction in the specific risk premium in the discount rate to account for the execution risk that is directly reflected in the updated combined operating ratio assumption. The updated assumptions are set out below.
After recognising the impairment, both the recoverable amount and carrying value of the North American cash-generating unit are $2,450 million, resulting in nil headroom (being the excess of recoverable value over carrying value) at the current balance date compared with headroom of $596 million at 31 December 2019. The valuation continues to be highly sensitive to a range of assumptions, in particular the forecast combined operating ratio used in the terminal value calculation, discount rate and long-term investment return. The impact of changes in these key assumptions is shown in the table below and each change has been calculated in isolation from other changes. In practice, this is considered unlikely to occur due to interrelationships between assumptions.
As previously noted, the structural and reporting changes associated with changes to the Group’s operating segments have resulted in changes to the composition of cash-generating units to which North American goodwill is allocated. Excluding this change, impairment of goodwill relating to North America would have been $415 million.
KEY ASSUMPTIONASSUMPTION
%SENSITIVITY
%
IMPACT OF SENSITIVITY ON CARRYING VALUE OF GOODWILL
Terminal value combined operating ratio 98.5 +1 Impairment of $358 million(2019 95.8) -1 Headroom of $491 million
Long-term investment return 3.75 +1 Headroom of $714 million(2019 4.17) -1 Impairment of $358 million
Post-tax discount rate 7.8 +1 Impairment of $358 million(2019 8.9) -1 Headroom of $654 million
QB
E In
suran
ce Gro
up
A
nn
ual R
epo
rt 2020
143O
ther
info
rmatio
n
6
Fin
ancial
Rep
ort
5
Perfo
rman
ce o
verv
iew
1
Op
erating an
d
finan
cial review
2
Go
vern
ance
3
Directo
rs' R
epo
rt
4
Notes to the financial statements continued
FOR THE YEAR ENDED 31 DECEMBER 2020
7.3 Controlled entities
OverviewThis section lists the Group’s controlled entities. The consolidated financial statements incorporate the assets and liabilities of all entities controlled by the Company at 31 December 2020 and the results for the financial year then ended, or for the period during which control existed if the entity was acquired or disposed of during the financial year.
7.3.1 Controlled entities
COUNTRY OFINCORPORATION/FORMATION
EQUITY HOLDING
2020%
2019%
Ultimate parent entityQBE Insurance Group Limited AustraliaControlled entities Anex Jenni & Partner SA (in the process of deregistration) Switzerland 100.00 100.00Austral Mercantile Collections Pty Limited Australia 100.00 100.00Australian Aviation Underwriting Pool Pty Limited Australia 100.00 100.00Burnett & Company, Inc. United States 100.00 100.00Elders Insurance (Underwriting Agency) Pty Limited Australia 80.00 80.00Equator Reinsurances Limited Bermuda 100.00 100.00General Casualty Company of Wisconsin United States 100.00 100.00General Casualty Insurance Company United States 100.00 100.00Greenhill BAIA Underwriting GmbH Germany 100.00 100.00Greenhill International Insurance Holdings Limited United Kingdom 100.00 100.00Greenhill Sturge Underwriting Limited United Kingdom 100.00 100.00Greenhill Underwriting Espana Limited United Kingdom 100.00 100.00Hoosier Insurance Company (merged with General Casualty Company of Wisconsin on 1 October 2020) United States – 100.00Insurance Box Holdings Pty Limited (in the process of deregistration) Australia 100.00 100.00Insurance Box Pty Limited (in the process of deregistration) Australia 100.00 100.00Lifeco s.r.o. Czech Republic 100.00 100.00NAU Country Insurance Company United States 100.00 100.00North Pointe Insurance Company United States 100.00 100.00Praetorian Insurance Company United States 100.00 100.00QBE (PNG) Limited PNG 100.00 100.00QBE Administration Services, Inc. United States 100.00 100.00QBE Americas, Inc. United States 100.00 100.00QBE Asia Pacific Holdings Limited Hong Kong 100.00 100.00QBE Blue Ocean Re Limited Bermuda 100.00 100.00QBE Capital Funding III Limited Jersey 100.00 100.00QBE Capital Funding IV Limited Jersey 100.00 100.00QBE Corporate Limited United Kingdom 100.00 100.00QBE Emerging Markets Holdings Pty Limited Australia 100.00 100.00QBE Employee Share Trust 1 Australia – –QBE Europe Intermediary Services SAS France 100.00 100.00QBE Europe SA/NV Belgium 100.00 100.00QBE European Operations plc United Kingdom 100.00 100.00QBE European Services Limited United Kingdom 100.00 100.00QBE European Underwriting Services (Australia) Pty Limited Australia 100.00 100.00QBE Finance Holdings (EO) Limited United Kingdom 100.00 100.00
7. GROUP STRUCTURE
144
COUNTRY OFINCORPORATION/FORMATION
EQUITY HOLDING
2020%
2019%
QBE FIRST Enterprises, LLC United States 100.00 100.00QBE FIRST Property Tax Solutions, LLC United States 100.00 100.00QBE General Insurance (Hong Kong) Limited Hong Kong 100.00 100.00QBE Group Services Pty Ltd Australia 100.00 100.00QBE Group Shared Services Limited United Kingdom 100.00 100.00QBE Holdings (AAP) Pty Limited Australia 100.00 100.00QBE Holdings (EO) Limited United Kingdom 100.00 100.00QBE Holdings, Inc. United States 100.00 100.00QBE Hongkong & Shanghai Insurance Limited Hong Kong 100.00 100.00QBE Insurance (Australia) Limited Australia 100.00 100.00QBE Insurance (Fiji) Limited Fiji 100.00 100.00QBE Insurance (International) Pty Limited Australia 100.00 100.00QBE Insurance (Malaysia) Berhad Malaysia 100.00 100.00QBE Insurance (PNG) Limited PNG 100.00 100.00QBE Insurance (Singapore) Pte Ltd Singapore 100.00 100.00QBE Insurance (Vanuatu) Limited Vanuatu 100.00 100.00QBE Insurance (Vietnam) Company Limited Vietnam 100.00 100.00QBE Insurance Corporation United States 100.00 100.00QBE Insurance Holdings Pty Limited Australia 100.00 100.00QBE International Markets Pte Ltd Singapore 100.00 100.00QBE Investments (Australia) Pty Limited Australia 100.00 100.00QBE Investments (North America), Inc. United States 100.00 100.00QBE Irish Share Incentive Plan 1 Ireland – –QBE Latin America Insurance Holdings Pty Ltd Australia 100.00 100.00QBE Lenders’ Mortgage Insurance Limited Australia 100.00 100.00QBE Management (Ireland) Limited Ireland 100.00 100.00QBE Management, Inc. United States 100.00 100.00QBE Management Services (Philippines) Pty Limited Australia 100.00 100.00QBE Management Services (UK) Limited United Kingdom 100.00 100.00QBE Management Services Pty Limited Australia 100.00 100.00QBE Mortgage Insurance (Asia) Limited Hong Kong 100.00 100.00QBE Partner Services (Europe) LLP United Kingdom 100.00 100.00QBE Regional Companies (N.A.), Inc. United States 100.00 100.00QBE Reinsurance Corporation United States 100.00 100.00QBE Reinsurance Services (Bermuda) Limited Bermuda 100.00 100.00QBE Services Inc Canada 100.00 100.00QBE SK s.r.o. (in the process of liquidation) Slovakia 100.00 100.00QBE Specialty Insurance Company United States 100.00 100.00QBE s.r.o. Czech Republic 100.00 100.00QBE Stonington Insurance Holdings Inc United States 100.00 100.00QBE Strategic Capital (Europe) Limited United Kingdom 100.00 100.00QBE Strategic Capital (International) Limited (incorporated 6 April 2020) United Kingdom 100.00 –QBE Strategic Capital Company Pty Limited Australia 100.00 100.00QBE UK Finance IV Limited United Kingdom 100.00 100.00QBE UK Limited United Kingdom 100.00 100.00QBE UK Share Incentive Plan 1 United Kingdom – –QBE Underwriting Limited United Kingdom 100.00 100.00QBE Underwriting Services (Ireland) Limited Ireland 100.00 100.00QBE Underwriting Services (UK) Limited United Kingdom 100.00 100.00QBE Ventures Pty Limited (incorporated 22 October 2020) Australia 100.00 –QBE Workers Compensation (NSW) Limited (dormant) Australia 100.00 100.00QBE Workers Compensation (VIC) Pty Limited (dormant) Australia 100.00 100.00Queensland Insurance (Investments) Pte Limited (previously Queensland Insurance (Investments) Limited) Fiji 100.00 100.00
QB
E In
suran
ce Gro
up
A
nn
ual R
epo
rt 2020
145
Oth
er in
form
ation
6
Fin
ancial
Rep
ort
5
Perfo
rman
ce o
verv
iew
1
Op
erating an
d
finan
cial review
2
Go
vern
ance
3
Directo
rs' R
epo
rt
4

Notes to the financial statements continued
FOR THE YEAR ENDED 31 DECEMBER 2020
7.3 Controlled entities
OverviewThis section lists the Group’s controlled entities. The consolidated financial statements incorporate the assets and liabilities of all entities controlled by the Company at 31 December 2020 and the results for the financial year then ended, or for the period during which control existed if the entity was acquired or disposed of during the financial year.
7.3.1 Controlled entities
COUNTRY OFINCORPORATION/FORMATION
EQUITY HOLDING
2020%
2019%
Ultimate parent entityQBE Insurance Group Limited AustraliaControlled entities Anex Jenni & Partner SA (in the process of deregistration) Switzerland 100.00 100.00Austral Mercantile Collections Pty Limited Australia 100.00 100.00Australian Aviation Underwriting Pool Pty Limited Australia 100.00 100.00Burnett & Company, Inc. United States 100.00 100.00Elders Insurance (Underwriting Agency) Pty Limited Australia 80.00 80.00Equator Reinsurances Limited Bermuda 100.00 100.00General Casualty Company of Wisconsin United States 100.00 100.00General Casualty Insurance Company United States 100.00 100.00Greenhill BAIA Underwriting GmbH Germany 100.00 100.00Greenhill International Insurance Holdings Limited United Kingdom 100.00 100.00Greenhill Sturge Underwriting Limited United Kingdom 100.00 100.00Greenhill Underwriting Espana Limited United Kingdom 100.00 100.00Hoosier Insurance Company (merged with General Casualty Company of Wisconsin on 1 October 2020) United States – 100.00Insurance Box Holdings Pty Limited (in the process of deregistration) Australia 100.00 100.00Insurance Box Pty Limited (in the process of deregistration) Australia 100.00 100.00Lifeco s.r.o. Czech Republic 100.00 100.00NAU Country Insurance Company United States 100.00 100.00North Pointe Insurance Company United States 100.00 100.00Praetorian Insurance Company United States 100.00 100.00QBE (PNG) Limited PNG 100.00 100.00QBE Administration Services, Inc. United States 100.00 100.00QBE Americas, Inc. United States 100.00 100.00QBE Asia Pacific Holdings Limited Hong Kong 100.00 100.00QBE Blue Ocean Re Limited Bermuda 100.00 100.00QBE Capital Funding III Limited Jersey 100.00 100.00QBE Capital Funding IV Limited Jersey 100.00 100.00QBE Corporate Limited United Kingdom 100.00 100.00QBE Emerging Markets Holdings Pty Limited Australia 100.00 100.00QBE Employee Share Trust 1 Australia – –QBE Europe Intermediary Services SAS France 100.00 100.00QBE Europe SA/NV Belgium 100.00 100.00QBE European Operations plc United Kingdom 100.00 100.00QBE European Services Limited United Kingdom 100.00 100.00QBE European Underwriting Services (Australia) Pty Limited Australia 100.00 100.00QBE Finance Holdings (EO) Limited United Kingdom 100.00 100.00
7. GROUP STRUCTURE
144
COUNTRY OFINCORPORATION/FORMATION
EQUITY HOLDING
2020%
2019%
QBE FIRST Enterprises, LLC United States 100.00 100.00QBE FIRST Property Tax Solutions, LLC United States 100.00 100.00QBE General Insurance (Hong Kong) Limited Hong Kong 100.00 100.00QBE Group Services Pty Ltd Australia 100.00 100.00QBE Group Shared Services Limited United Kingdom 100.00 100.00QBE Holdings (AAP) Pty Limited Australia 100.00 100.00QBE Holdings (EO) Limited United Kingdom 100.00 100.00QBE Holdings, Inc. United States 100.00 100.00QBE Hongkong & Shanghai Insurance Limited Hong Kong 100.00 100.00QBE Insurance (Australia) Limited Australia 100.00 100.00QBE Insurance (Fiji) Limited Fiji 100.00 100.00QBE Insurance (International) Pty Limited Australia 100.00 100.00QBE Insurance (Malaysia) Berhad Malaysia 100.00 100.00QBE Insurance (PNG) Limited PNG 100.00 100.00QBE Insurance (Singapore) Pte Ltd Singapore 100.00 100.00QBE Insurance (Vanuatu) Limited Vanuatu 100.00 100.00QBE Insurance (Vietnam) Company Limited Vietnam 100.00 100.00QBE Insurance Corporation United States 100.00 100.00QBE Insurance Holdings Pty Limited Australia 100.00 100.00QBE International Markets Pte Ltd Singapore 100.00 100.00QBE Investments (Australia) Pty Limited Australia 100.00 100.00QBE Investments (North America), Inc. United States 100.00 100.00QBE Irish Share Incentive Plan 1 Ireland – –QBE Latin America Insurance Holdings Pty Ltd Australia 100.00 100.00QBE Lenders’ Mortgage Insurance Limited Australia 100.00 100.00QBE Management (Ireland) Limited Ireland 100.00 100.00QBE Management, Inc. United States 100.00 100.00QBE Management Services (Philippines) Pty Limited Australia 100.00 100.00QBE Management Services (UK) Limited United Kingdom 100.00 100.00QBE Management Services Pty Limited Australia 100.00 100.00QBE Mortgage Insurance (Asia) Limited Hong Kong 100.00 100.00QBE Partner Services (Europe) LLP United Kingdom 100.00 100.00QBE Regional Companies (N.A.), Inc. United States 100.00 100.00QBE Reinsurance Corporation United States 100.00 100.00QBE Reinsurance Services (Bermuda) Limited Bermuda 100.00 100.00QBE Services Inc Canada 100.00 100.00QBE SK s.r.o. (in the process of liquidation) Slovakia 100.00 100.00QBE Specialty Insurance Company United States 100.00 100.00QBE s.r.o. Czech Republic 100.00 100.00QBE Stonington Insurance Holdings Inc United States 100.00 100.00QBE Strategic Capital (Europe) Limited United Kingdom 100.00 100.00QBE Strategic Capital (International) Limited (incorporated 6 April 2020) United Kingdom 100.00 –QBE Strategic Capital Company Pty Limited Australia 100.00 100.00QBE UK Finance IV Limited United Kingdom 100.00 100.00QBE UK Limited United Kingdom 100.00 100.00QBE UK Share Incentive Plan 1 United Kingdom – –QBE Underwriting Limited United Kingdom 100.00 100.00QBE Underwriting Services (Ireland) Limited Ireland 100.00 100.00QBE Underwriting Services (UK) Limited United Kingdom 100.00 100.00QBE Ventures Pty Limited (incorporated 22 October 2020) Australia 100.00 –QBE Workers Compensation (NSW) Limited (dormant) Australia 100.00 100.00QBE Workers Compensation (VIC) Pty Limited (dormant) Australia 100.00 100.00Queensland Insurance (Investments) Pte Limited (previously Queensland Insurance (Investments) Limited) Fiji 100.00 100.00
QB
E In
suran
ce Gro
up
A
nn
ual R
epo
rt 2020
145O
ther
info
rmatio
n
6
Fin
ancial
Rep
ort
5
Perfo
rman
ce o
verv
iew
1
Op
erating an
d
finan
cial review
2
Go
vern
ance
3
Directo
rs' R
epo
rt
4

Notes to the financial statements continued
FOR THE YEAR ENDED 31 DECEMBER 2020
COUNTRY OFINCORPORATION/FORMATION
EQUITY HOLDING
2020%
2019%
Regent Insurance Company United States 100.00 100.00Ridgwell Fox & Partners (Underwriting Management) Limited (in the process of liquidation) United Kingdom 100.00 100.00Sinkaonamahasarn Company Limited 2 Thailand 49.00 49.00Southern Fire & Casualty Company (sold effective 1 November 2020) United States – 100.00Southern National Risk Management Corporation United States 100.00 100.00Southern Pilot Insurance Company United States 100.00 100.00Standfast Corporate Underwriters Limited United Kingdom 100.00 100.00Stonington Insurance Company United States 100.00 100.00Trade Credit Collections Pty Limited Australia 100.00 100.00Trade Credit Underwriting Agency NZ Limited NZ 100.00 100.00Trade Credit Underwriting Agency Pty Limited Australia 100.00 100.00Unigard Insurance Company (sold effective 1 November 2020) United States – 100.00Westwood Insurance Agency United States 100.00 100.00
1 QBE Employee Share Trust, QBE Irish Share Incentive Plan and QBE United Kingdom Share Incentive Plan have been included in the consolidated financial statements as these entities are special purpose entities that exist for the benefit of the Group.
2 Although QBE has less than a 50% equity interest in Sinkaonamahasarn Company Limited, controlled entities have the right to acquire the remaining share capital.
All equity in controlled entities is held in the form of shares or through contractual arrangements.
How we account for the numbers
Controlled entitiesControl exists when the Group is exposed, or has rights, to variable returns from its involvement with an entity and has the ability to affect those returns through its power over it. All transactions between and with controlled entities are eliminated in full. Non-controlling interests in the results and equity of controlled entities are shown separately in the consolidated statement of comprehensive income, balance sheet and statement of changes in equity.
Where control of an entity commences during a financial year, its results are included in the consolidated statement of comprehensive income from the date on which control is obtained. Where control of an entity ceases during a financial year, its results are included for that part of the year during which the control existed.
A change in ownership of a controlled entity without the gain or loss of control is accounted for as an equity transaction.
7. GROUP STRUCTURE
146
8. OTHER
OverviewThis section includes other information that must be disclosed to comply with the Australian Accounting Standards or the Corporations Act 2001.
8.1 Other accounting policies
8.1.1 New accounting standards and amendments adopted by the GroupThe Group adopted the following new or amended accounting standards from 1 January 2020:
TITLE
Revised Conceptual Framework for Financial ReportingAASB 2019-5 Amendments to Australian Accounting Standards – Disclosure of the Effect of New IFRS Standards Not Yet Issued in AustraliaAASB 2018-6 Amendments to Australian Accounting Standards – Definition of a BusinessAASB 2018-7 Amendments to Australian Accounting Standards – Definition of MaterialAASB 2019-1 Amendments to Australian Accounting Standards – References to the Conceptual FrameworkAASB 2019-3 Amendments to Australian Accounting Standards – Interest Rate Benchmark Reform
The adoption of these new or amended standards did not significantly impact the Group's accounting policies or financial statements.
8.1.2 New accounting standards and amendments issued but not yet effective
TITLE OPERATIVE DATE
AASB 2020-8 Amendments to Australian Accounting Standards – Interest Rate Benchmark Reform – Phase 2 1 January 2021AASB 2014-10 Amendments to Australian Accounting Standards – Sale or Contribution of Assets between an Investor
and its Associate or Joint Venture1 January 2022
AASB 2020-1 Amendments to Australian Accounting Standards – Classification of Liabilities as Current or Non-current 1 January 2022AASB 2020-3 Amendments to Australian Accounting Standards – Annual Improvements 2018–2020
and Other Amendments1 January 2022
AASB 2020-4 Amendments to Australian Accounting Standards – COVID-19-Related Rent Concessions 1 January 2022AASB 17 Insurance Contracts 1 January 2023
The Australian Accounting Standards and amendments detailed in the table above are not mandatory for the Group until the operative dates stated; however, early adoption is often permitted.
The Group currently plans to adopt the standards and amendments detailed above in the reporting periods beginning on their respective operative dates. An assessment of the financial impact of the standards and amendments has been undertaken and they are not expected to have a material impact on the Group’s financial statements, except where noted below:
AASB 17 Insurance ContractsAASB 17, a new accounting standard for insurance contracts, was adopted by the AASB in July 2017. In June 2020, the IASB issued Amendments to IFRS 17 which deferred the effective date from 1 January 2021 to 1 January 2023 and made significant amendments to the standard in response to feedback from, and implementation issues raised by, stakeholders. These amendments were adopted by the AASB in July 2020.
Given the broad scope of the recent amendments, complexity of the new requirements and lack of general consensus on the interpretation of key components of the standard, the impact of AASB 17 on the Group’s financial statements is still being determined; however, significant presentation and disclosure changes and some impact on reported profit or loss are expected.
The standard introduces a new ‘general model’ for the recognition and measurement of insurance contracts, but permits the use of a simplified approach (which is similar to the current basis on which general insurance is brought to account under AASB 1023) if the liability for remaining coverage under the simplified approach is not expected to materially differ from the general model. QBE has completed a gap assessment and has determined that the simplified approach is expected to apply to more than 95% of the Group’s business, based on the current business mix.
QB
E In
suran
ce Gro
up
A
nn
ual R
epo
rt 2020
147
Oth
er in
form
ation
6
Fin
ancial
Rep
ort
5
Perfo
rman
ce o
verv
iew
1
Op
erating an
d
finan
cial review
2
Go
vern
ance
3
Directo
rs' R
epo
rt
4

Notes to the financial statements continued
FOR THE YEAR ENDED 31 DECEMBER 2020
COUNTRY OFINCORPORATION/FORMATION
EQUITY HOLDING
2020%
2019%
Regent Insurance Company United States 100.00 100.00Ridgwell Fox & Partners (Underwriting Management) Limited (in the process of liquidation) United Kingdom 100.00 100.00Sinkaonamahasarn Company Limited 2 Thailand 49.00 49.00Southern Fire & Casualty Company (sold effective 1 November 2020) United States – 100.00Southern National Risk Management Corporation United States 100.00 100.00Southern Pilot Insurance Company United States 100.00 100.00Standfast Corporate Underwriters Limited United Kingdom 100.00 100.00Stonington Insurance Company United States 100.00 100.00Trade Credit Collections Pty Limited Australia 100.00 100.00Trade Credit Underwriting Agency NZ Limited NZ 100.00 100.00Trade Credit Underwriting Agency Pty Limited Australia 100.00 100.00Unigard Insurance Company (sold effective 1 November 2020) United States – 100.00Westwood Insurance Agency United States 100.00 100.00
1 QBE Employee Share Trust, QBE Irish Share Incentive Plan and QBE United Kingdom Share Incentive Plan have been included in the consolidated financial statements as these entities are special purpose entities that exist for the benefit of the Group.
2 Although QBE has less than a 50% equity interest in Sinkaonamahasarn Company Limited, controlled entities have the right to acquire the remaining share capital.
All equity in controlled entities is held in the form of shares or through contractual arrangements.
How we account for the numbers
Controlled entitiesControl exists when the Group is exposed, or has rights, to variable returns from its involvement with an entity and has the ability to affect those returns through its power over it. All transactions between and with controlled entities are eliminated in full. Non-controlling interests in the results and equity of controlled entities are shown separately in the consolidated statement of comprehensive income, balance sheet and statement of changes in equity.
Where control of an entity commences during a financial year, its results are included in the consolidated statement of comprehensive income from the date on which control is obtained. Where control of an entity ceases during a financial year, its results are included for that part of the year during which the control existed.
A change in ownership of a controlled entity without the gain or loss of control is accounted for as an equity transaction.
7. GROUP STRUCTURE
146
8. OTHER
OverviewThis section includes other information that must be disclosed to comply with the Australian Accounting Standards or the Corporations Act 2001.
8.1 Other accounting policies
8.1.1 New accounting standards and amendments adopted by the GroupThe Group adopted the following new or amended accounting standards from 1 January 2020:
TITLE
Revised Conceptual Framework for Financial ReportingAASB 2019-5 Amendments to Australian Accounting Standards – Disclosure of the Effect of New IFRS Standards Not Yet Issued in AustraliaAASB 2018-6 Amendments to Australian Accounting Standards – Definition of a BusinessAASB 2018-7 Amendments to Australian Accounting Standards – Definition of MaterialAASB 2019-1 Amendments to Australian Accounting Standards – References to the Conceptual FrameworkAASB 2019-3 Amendments to Australian Accounting Standards – Interest Rate Benchmark Reform
The adoption of these new or amended standards did not significantly impact the Group's accounting policies or financial statements.
8.1.2 New accounting standards and amendments issued but not yet effective
TITLE OPERATIVE DATE
AASB 2020-8 Amendments to Australian Accounting Standards – Interest Rate Benchmark Reform – Phase 2 1 January 2021AASB 2014-10 Amendments to Australian Accounting Standards – Sale or Contribution of Assets between an Investor
and its Associate or Joint Venture1 January 2022
AASB 2020-1 Amendments to Australian Accounting Standards – Classification of Liabilities as Current or Non-current 1 January 2022AASB 2020-3 Amendments to Australian Accounting Standards – Annual Improvements 2018–2020
and Other Amendments1 January 2022
AASB 2020-4 Amendments to Australian Accounting Standards – COVID-19-Related Rent Concessions 1 January 2022AASB 17 Insurance Contracts 1 January 2023
The Australian Accounting Standards and amendments detailed in the table above are not mandatory for the Group until the operative dates stated; however, early adoption is often permitted.
The Group currently plans to adopt the standards and amendments detailed above in the reporting periods beginning on their respective operative dates. An assessment of the financial impact of the standards and amendments has been undertaken and they are not expected to have a material impact on the Group’s financial statements, except where noted below:
AASB 17 Insurance ContractsAASB 17, a new accounting standard for insurance contracts, was adopted by the AASB in July 2017. In June 2020, the IASB issued Amendments to IFRS 17 which deferred the effective date from 1 January 2021 to 1 January 2023 and made significant amendments to the standard in response to feedback from, and implementation issues raised by, stakeholders. These amendments were adopted by the AASB in July 2020.
Given the broad scope of the recent amendments, complexity of the new requirements and lack of general consensus on the interpretation of key components of the standard, the impact of AASB 17 on the Group’s financial statements is still being determined; however, significant presentation and disclosure changes and some impact on reported profit or loss are expected.
The standard introduces a new ‘general model’ for the recognition and measurement of insurance contracts, but permits the use of a simplified approach (which is similar to the current basis on which general insurance is brought to account under AASB 1023) if the liability for remaining coverage under the simplified approach is not expected to materially differ from the general model. QBE has completed a gap assessment and has determined that the simplified approach is expected to apply to more than 95% of the Group’s business, based on the current business mix.
QB
E In
suran
ce Gro
up
A
nn
ual R
epo
rt 2020
147O
ther
info
rmatio
n
6
Fin
ancial
Rep
ort
5
Perfo
rman
ce o
verv
iew
1
Op
erating an
d
finan
cial review
2
Go
vern
ance
3
Directo
rs' R
epo
rt
4

Notes to the financial statements continued
FOR THE YEAR ENDED 31 DECEMBER 2020
QBE has considered the key areas of expected impact and plans to apply the following accounting policy choices permitted by AASB 17:• Acquisition costs: For groups of contracts that apply the simplified approach and have a coverage period of one year or less,
AASB 17 provides an option to recognise any insurance acquisition costs as expenses when incurred. QBE does not plan to apply this option and expects to amortise acquisition costs over the coverage period of the related insurance contracts.
• Effect of previous interim reporting: AASB 17 provides an option to change the treatment of accounting estimates made in previous interim financial statements when applying AASB 17 in the annual financial statements (i.e. a ‘year-to-date basis’). QBE expects to apply this option and will measure accounting estimates on a year-to-date basis which is consistent with existing practice.
The areas of judgement applicable to measuring insurance contract liabilities under AASB 17 are expected to be broadly similar to those applicable when applying AASB 1023 and include the following, noting that there are differences in the way they are to be measured:• Discount rates: AASB 1023 requires the net outstanding claims liability to be discounted using risk-free rates as described in note
2.3.4. Under AASB 17, QBE expects to apply a ‘bottom-up approach’ to determining discount rates used to discount insurance contract liabilities, which uses risk-free rates adjusted to reflect the liquidity characteristics of the insurance contracts.
• Risk adjustment: The risk adjustment under AASB 17 is conceptually similar to the risk margin under AASB 1023. Similar to AASB 1023, AASB 17 requires the disclosure of the confidence level that corresponds to the risk adjustment used in the measurement of insurance contract liabilities.
• Onerous contracts: AASB 17 requires the identification of ‘groups’ of onerous contracts which are expected to be determined at a more granular level of aggregation than the level at which the liability adequacy test is performed under AASB 1023.
• Attribution of expenses: The measurement of insurance contract liabilities under AASB 17 will include all cash flows that directly relate to the fulfilment of insurance contracts, including acquisition, claims settlement, policy administration and maintenance costs. It also includes other costs such as overheads which are currently recognised in ‘Trade and other payables’ on the balance sheet.
On transition to AASB 17, QBE expects to apply the new standard retrospectively to all insurance contracts except for certain contracts acquired in the past (e.g. as part of a business combination) that, at the time of acquisition, were considered past expiry and were in their claims settlement period. For these contracts, QBE expects to apply a modified retrospective approach under AASB 17 whereby the related liabilities are classified as liabilities for incurred claims, on the basis that it would be impracticable to treat these liabilities as related to unexpired coverage.
The requirements of AASB 17 are complex and the expectations noted above are subject to change as the project progresses and as the Group continues to analyse the impacts of the standard and recent amendments. Group-wide accounting guidance and application methodologies are being developed, and a global project team has been mobilised to progress the detailed design and implementation of required changes to financial reporting systems. Market developments also continue to be monitored in order to assess the impact of evolving interpretations and other changes.
8.2 Contingent liabilities
OverviewContingent liabilities are disclosed when the possibility of a future settlement of economic benefits is considered to be less than probable but more likely than remote. If the expected settlement of the liability becomes probable, a provision is recognised.
QBE is required to support the underwriting activities of the Group’s controlled entities including corporate members at Lloyd’s. Funds at Lloyd’s are those funds of the Group which are subject to the terms of the Lloyd’s Deposit Trust Deed and are required to support underwriting for the following year and the open years of account, determined by a formula prescribed by Lloyd’s each year. At the balance date, letters of credit and similar forms of support of $2,085 million (2019 $1,848 million) were in place in respect of the Group’s participation in Lloyd’s, along with cash and investments of $250 million (2019 $37 million). In addition, a controlled entity has entered into various trust and security deeds with Lloyd’s in respect of assets lodged to support its underwriting activities. These deeds contain covenants that require the entity to meet financial obligations should they arise in relation to cash calls from syndicate participations. A cash call would be made first on the assets held in syndicate trust funds and would only call on funds at Lloyd’s after syndicate resources were exhausted. Only if the level of these trust funds was not sufficient would a cash call result in a draw down on the letters of credit and other assets lodged with Lloyd’s.
In the normal course of business, the Group is also exposed to contingent liabilities in relation to claims litigation and regulatory examinations arising out of its insurance and reinsurance activities. The Group may also be exposed to the possibility of contingent liabilities in relation to insurance and non-insurance litigation including but not limited to regulatory test cases and class actions, taxation and compliance matters, which may result in legal or regulatory penalties and financial or non-financial losses and other impacts. Entities in the Group may also provide guarantees to support representations in commercial transactions.
8. OTHER
148
8.3 Offsetting financial assets and liabilities
The Group has $261 million receivable from and payable to (2019 nil) a single counterparty which are fully set off in the balance sheet in accordance with Australian Accounting Standards, on the basis that the Group intends to settle these on a net basis and has a legally enforceable right to do so.
8.4 Reconciliation of profit or loss after income tax to net cash flows from operating activities
OverviewAASB 1054 Australian Additional Disclosures requires a reconciliation of profit or loss after income tax to net cash flows from operating activities.
2020 2019US$M US$M
(Loss) profit after income tax from continuing operations (1,511) 568Loss after income tax from discontinued operations – (21)(Loss) profit after income tax (1,511) 547Adjustments for:
Depreciation and impairment of property, plant and equipment 40 37Amortisation of right-of-use lease assets 68 66Amortisation/impairment of intangibles 512 94Loss on sale of entities and businesses 2 8Share of net loss of associates 5 3Net foreign exchange losses 29 23Fair value losses (gains) on financial assets 206 (492)Share-based payments expense 20 38
Balance sheet movements:(Increase) decrease in trade debtors (433) 616Increase in net operating assets (142) (119)Increase in trade payables 378 299Increase in gross outstanding claims liability 1,760 637Increase in unearned premium 635 185Increase in deferred insurance costs (262) (245)Increase in net defined benefit obligation 1 9(Increase) decrease in net tax assets (74) 73
Net cash flows from operating activities 1,234 1,779
QB
E In
suran
ce Gro
up
A
nn
ual R
epo
rt 2020
149
Oth
er in
form
ation
6
Fin
ancial
Rep
ort
5
Perfo
rman
ce o
verv
iew
1
Op
erating an
d
finan
cial review
2
Go
vern
ance
3
Directo
rs' R
epo
rt
4
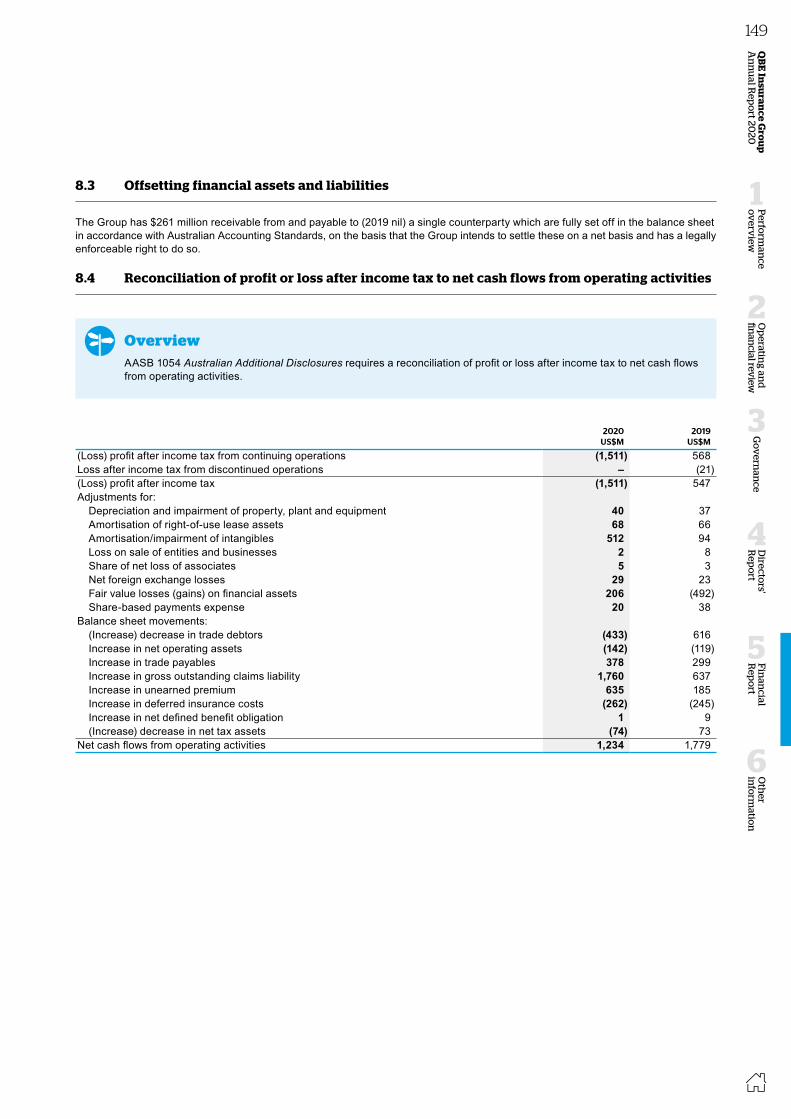
Notes to the financial statements continued
FOR THE YEAR ENDED 31 DECEMBER 2020
QBE has considered the key areas of expected impact and plans to apply the following accounting policy choices permitted by AASB 17:• Acquisition costs: For groups of contracts that apply the simplified approach and have a coverage period of one year or less,
AASB 17 provides an option to recognise any insurance acquisition costs as expenses when incurred. QBE does not plan to apply this option and expects to amortise acquisition costs over the coverage period of the related insurance contracts.
• Effect of previous interim reporting: AASB 17 provides an option to change the treatment of accounting estimates made in previous interim financial statements when applying AASB 17 in the annual financial statements (i.e. a ‘year-to-date basis’). QBE expects to apply this option and will measure accounting estimates on a year-to-date basis which is consistent with existing practice.
The areas of judgement applicable to measuring insurance contract liabilities under AASB 17 are expected to be broadly similar to those applicable when applying AASB 1023 and include the following, noting that there are differences in the way they are to be measured:• Discount rates: AASB 1023 requires the net outstanding claims liability to be discounted using risk-free rates as described in note
2.3.4. Under AASB 17, QBE expects to apply a ‘bottom-up approach’ to determining discount rates used to discount insurance contract liabilities, which uses risk-free rates adjusted to reflect the liquidity characteristics of the insurance contracts.
• Risk adjustment: The risk adjustment under AASB 17 is conceptually similar to the risk margin under AASB 1023. Similar to AASB 1023, AASB 17 requires the disclosure of the confidence level that corresponds to the risk adjustment used in the measurement of insurance contract liabilities.
• Onerous contracts: AASB 17 requires the identification of ‘groups’ of onerous contracts which are expected to be determined at a more granular level of aggregation than the level at which the liability adequacy test is performed under AASB 1023.
• Attribution of expenses: The measurement of insurance contract liabilities under AASB 17 will include all cash flows that directly relate to the fulfilment of insurance contracts, including acquisition, claims settlement, policy administration and maintenance costs. It also includes other costs such as overheads which are currently recognised in ‘Trade and other payables’ on the balance sheet.
On transition to AASB 17, QBE expects to apply the new standard retrospectively to all insurance contracts except for certain contracts acquired in the past (e.g. as part of a business combination) that, at the time of acquisition, were considered past expiry and were in their claims settlement period. For these contracts, QBE expects to apply a modified retrospective approach under AASB 17 whereby the related liabilities are classified as liabilities for incurred claims, on the basis that it would be impracticable to treat these liabilities as related to unexpired coverage.
The requirements of AASB 17 are complex and the expectations noted above are subject to change as the project progresses and as the Group continues to analyse the impacts of the standard and recent amendments. Group-wide accounting guidance and application methodologies are being developed, and a global project team has been mobilised to progress the detailed design and implementation of required changes to financial reporting systems. Market developments also continue to be monitored in order to assess the impact of evolving interpretations and other changes.
8.2 Contingent liabilities
OverviewContingent liabilities are disclosed when the possibility of a future settlement of economic benefits is considered to be less than probable but more likely than remote. If the expected settlement of the liability becomes probable, a provision is recognised.
QBE is required to support the underwriting activities of the Group’s controlled entities including corporate members at Lloyd’s. Funds at Lloyd’s are those funds of the Group which are subject to the terms of the Lloyd’s Deposit Trust Deed and are required to support underwriting for the following year and the open years of account, determined by a formula prescribed by Lloyd’s each year. At the balance date, letters of credit and similar forms of support of $2,085 million (2019 $1,848 million) were in place in respect of the Group’s participation in Lloyd’s, along with cash and investments of $250 million (2019 $37 million). In addition, a controlled entity has entered into various trust and security deeds with Lloyd’s in respect of assets lodged to support its underwriting activities. These deeds contain covenants that require the entity to meet financial obligations should they arise in relation to cash calls from syndicate participations. A cash call would be made first on the assets held in syndicate trust funds and would only call on funds at Lloyd’s after syndicate resources were exhausted. Only if the level of these trust funds was not sufficient would a cash call result in a draw down on the letters of credit and other assets lodged with Lloyd’s.
In the normal course of business, the Group is also exposed to contingent liabilities in relation to claims litigation and regulatory examinations arising out of its insurance and reinsurance activities. The Group may also be exposed to the possibility of contingent liabilities in relation to insurance and non-insurance litigation including but not limited to regulatory test cases and class actions, taxation and compliance matters, which may result in legal or regulatory penalties and financial or non-financial losses and other impacts. Entities in the Group may also provide guarantees to support representations in commercial transactions.
8. OTHER
148
8.3 Offsetting financial assets and liabilities
The Group has $261 million receivable from and payable to (2019 nil) a single counterparty which are fully set off in the balance sheet in accordance with Australian Accounting Standards, on the basis that the Group intends to settle these on a net basis and has a legally enforceable right to do so.
8.4 Reconciliation of profit or loss after income tax to net cash flows from operating activities
OverviewAASB 1054 Australian Additional Disclosures requires a reconciliation of profit or loss after income tax to net cash flows from operating activities.
2020 2019US$M US$M
(Loss) profit after income tax from continuing operations (1,511) 568Loss after income tax from discontinued operations – (21)(Loss) profit after income tax (1,511) 547Adjustments for:
Depreciation and impairment of property, plant and equipment 40 37Amortisation of right-of-use lease assets 68 66Amortisation/impairment of intangibles 512 94Loss on sale of entities and businesses 2 8Share of net loss of associates 5 3Net foreign exchange losses 29 23Fair value losses (gains) on financial assets 206 (492)Share-based payments expense 20 38
Balance sheet movements:(Increase) decrease in trade debtors (433) 616Increase in net operating assets (142) (119)Increase in trade payables 378 299Increase in gross outstanding claims liability 1,760 637Increase in unearned premium 635 185Increase in deferred insurance costs (262) (245)Increase in net defined benefit obligation 1 9(Increase) decrease in net tax assets (74) 73
Net cash flows from operating activities 1,234 1,779
QB
E In
suran
ce Gro
up
A
nn
ual R
epo
rt 2020
149O
ther
info
rmatio
n
6
Fin
ancial
Rep
ort
5
Perfo
rman
ce o
verv
iew
1
Op
erating an
d
finan
cial review
2
Go
vern
ance
3
Directo
rs' R
epo
rt
4

Notes to the financial statements continued
FOR THE YEAR ENDED 31 DECEMBER 2020
8.5 Share‑based payments
OverviewShare-based payments are equity-based compensation schemes provided to employees and executives. The Company issues shares from time to time under an Employee Share and Option Plan (the Plan). Any full-time or part-time employee of the Group or any equally-owned joint venture who is offered shares or options is eligible to participate in the Plan.
8.5.1 Share schemesA summary of deferred equity award plans is set out below:
PLAN AVAILABLE TO: NATURE OF AWARD VESTING CONDITIONS
Executive Incentive Plan (EIP) (2017–2020)
Executives (before 1 Jan 2019) and other key senior employees
• 40%-50% delivered in cash (20% in the case of the Group CEO).
• 50%-60% deferred as conditional rights1 to fully paid ordinary QBE shares (80% in the case of the Group CEO).
The conditional rights are deferred in four equal tranches, such that 25% vests on each of the first, second, third and fourth anniversaries of the award.
EIP outcomes are subject to the achievement of:• Group COR and cash ROE targets;• divisional COR targets in the case of divisional employees; and• individual performance objectives reflecting QBE’s strategic priorities.
Short‑term Incentive (STI) (2014–2020)
Executives and other key senior employees
• 67% delivered in cash (50% in the case of the Group CEO).
• 33% deferred as conditional rights to fully paid ordinary QBE shares (50% in the case of the Group CEO).
The conditional rights are deferred in two equal tranches such that 50% vests on the first anniversary of the award and 50% vests on the second anniversary of the award.
STI outcomes are subject to the achievement of:• Group COR and cash ROE targets;• divisional COR targets2 in the case of divisional employees; and• individual performance objectives reflecting QBE’s strategic priorities.
Long‑term incentive (LTI) (2019–2020)
Executives • Conditional rights to fully paid ordinary QBE shares.
On achievement of the performance measures at the end of a three-year performance period, conditional rights vest in three tranches as follows:• 33% at the end of the three-year performance period;• 33% on the first anniversary of the end of the performance period; and• 34% on the second anniversary of the end of the performance period.
Vesting is subject to performance conditions as follows:• 50% of each tranche is subject to the achievement against a three-year
average Group ROE performance target; and• 50% of each tranche is subject to the performance of the Group’s
relative total shareholder return, compared against two independent peer groups, over a three-year performance period.
1 For participants outside of Australia, the deferred component may be delivered in equal shares of conditional rights and cash.2 Divisional return on allocated capital targets until 31 December 2016.
Additionally:• plan rules provide suitable discretion for the People & Remuneration Committee to adjust any formulaic outcome to ensure that
awards made under the EIP, STI and LTI appropriately reflect performance;• during the period from the grant date to the vesting date, further conditional rights are issued under the Bonus Share Plan to reflect
dividends paid on ordinary shares of the Company. These conditional rights are subject to the same vesting conditions as the original grant of conditional rights;
• recipients must remain in the Group’s service throughout the service period in order for the awards to vest, except in cases where good leaver provisions apply. Vesting is also subject to malus provisions;
8. OTHER
150
• under good leaver provisions (e.g. retirement, redundancy, ill health, injury or mutually agreed separation), a pro-rata amount of conditional rights remains subject to the performance and vesting conditions; and
• once vested, conditional rights can be exercised for no consideration.
8.5.2 Conditional rightsDetails of the number of employee entitlements to conditional rights to ordinary shares granted, vested and transferred to employees during the year are as follows:
2020 2019NUMBER OF
RIGHTSNUMBER OF
RIGHTS
At 1 January 13,484,807 12,630,099Granted 3,999,178 7,220,150Dividends attaching 357,956 408,101Vested and transferred to employees (2,827,980) (4,994,517)Forfeited (1,766,721) (1,779,026)At 31 December 13,247,240 13,484,807Weighted average share price at date of vesting of conditional rights during the year A$13.10 A$12.45Weighted average fair value of conditional rights granted during the year A$12.35 A$11.93
8.5.3 Fair value of conditional rightsThe fair value of conditional rights granted during the year was determined using the following significant assumptions:
2020 2019
Five-day volume weighted average price of instrument at grant date A$ 7.49–14.91 11.88–12.77Expected volatility % 21–24 21–22Risk-free rate % 0.18–0.68 0.67–1.79Expected life of instrument Years 0.1–5.0 0.1–5.0
The fair value is determined using appropriate models including Monte Carlo simulations, depending on the vesting conditions. Some of the assumptions used may be based on historical data which is not necessarily indicative of future trends. Reasonable changes in these assumptions would not have a material impact on the Group's financial statements.
8.5.4 Employee optionsThe market value of all shares underlying the options at the balance date is A$0.1 million (2019 A$0.2 million). During 2020, no options were cancelled or forfeited. At 31 December 2020, 17,000 remained (excluding notional dividends). The options were issued to employees in 2004 in lieu of shares under the Plan. The options vested immediately and are exercisable until March 2024.
8.5.5 Share-based payment expenseTotal expenses arising from share-based payment awards under the Plan amounted to $20 million (2019 $38 million). These amounts are included in underwriting and other expenses.
8.5.6 Shares purchased on-marketThe Group may purchase shares on-market to satisfy entitlements under employee share schemes. The Group acquired 0.2 million (2019 four million) such shares during the period at an average price of A$13.18 (2019 A$12.14).
How we account for the numbersThe fair value of the employee services received in exchange for the grant of equity-settled instruments is recognised as an expense. The total amount to be expensed over the vesting period is determined by reference to the fair value of the instruments granted, excluding the impact of any non-market vesting conditions. The impacts of non-market vesting conditions are included in assumptions about the number of instruments that are expected to become exercisable.
The fair value of each instrument is recognised evenly over the service period ending at the vesting date; however, at each balance date, the Group revises its estimates of the number of instruments that are expected to become exercisable due to the achievement of non-market vesting conditions. The Group recognises the impact of the revision of original estimates, if any, in profit or loss with a corresponding adjustment to equity.
QB
E In
suran
ce Gro
up
A
nn
ual R
epo
rt 2020
151
Oth
er in
form
ation
6
Fin
ancial
Rep
ort
5
Perfo
rman
ce o
verv
iew
1
Op
erating an
d
finan
cial review
2
Go
vern
ance
3
Directo
rs' R
epo
rt
4

Notes to the financial statements continued
FOR THE YEAR ENDED 31 DECEMBER 2020
8.5 Share‑based payments
OverviewShare-based payments are equity-based compensation schemes provided to employees and executives. The Company issues shares from time to time under an Employee Share and Option Plan (the Plan). Any full-time or part-time employee of the Group or any equally-owned joint venture who is offered shares or options is eligible to participate in the Plan.
8.5.1 Share schemesA summary of deferred equity award plans is set out below:
PLAN AVAILABLE TO: NATURE OF AWARD VESTING CONDITIONS
Executive Incentive Plan (EIP) (2017–2020)
Executives (before 1 Jan 2019) and other key senior employees
• 40%-50% delivered in cash (20% in the case of the Group CEO).
• 50%-60% deferred as conditional rights1 to fully paid ordinary QBE shares (80% in the case of the Group CEO).
The conditional rights are deferred in four equal tranches, such that 25% vests on each of the first, second, third and fourth anniversaries of the award.
EIP outcomes are subject to the achievement of:• Group COR and cash ROE targets;• divisional COR targets in the case of divisional employees; and• individual performance objectives reflecting QBE’s strategic priorities.
Short‑term Incentive (STI) (2014–2020)
Executives and other key senior employees
• 67% delivered in cash (50% in the case of the Group CEO).
• 33% deferred as conditional rights to fully paid ordinary QBE shares (50% in the case of the Group CEO).
The conditional rights are deferred in two equal tranches such that 50% vests on the first anniversary of the award and 50% vests on the second anniversary of the award.
STI outcomes are subject to the achievement of:• Group COR and cash ROE targets;• divisional COR targets2 in the case of divisional employees; and• individual performance objectives reflecting QBE’s strategic priorities.
Long‑term incentive (LTI) (2019–2020)
Executives • Conditional rights to fully paid ordinary QBE shares.
On achievement of the performance measures at the end of a three-year performance period, conditional rights vest in three tranches as follows:• 33% at the end of the three-year performance period;• 33% on the first anniversary of the end of the performance period; and• 34% on the second anniversary of the end of the performance period.
Vesting is subject to performance conditions as follows:• 50% of each tranche is subject to the achievement against a three-year
average Group ROE performance target; and• 50% of each tranche is subject to the performance of the Group’s
relative total shareholder return, compared against two independent peer groups, over a three-year performance period.
1 For participants outside of Australia, the deferred component may be delivered in equal shares of conditional rights and cash.2 Divisional return on allocated capital targets until 31 December 2016.
Additionally:• plan rules provide suitable discretion for the People & Remuneration Committee to adjust any formulaic outcome to ensure that
awards made under the EIP, STI and LTI appropriately reflect performance;• during the period from the grant date to the vesting date, further conditional rights are issued under the Bonus Share Plan to reflect
dividends paid on ordinary shares of the Company. These conditional rights are subject to the same vesting conditions as the original grant of conditional rights;
• recipients must remain in the Group’s service throughout the service period in order for the awards to vest, except in cases where good leaver provisions apply. Vesting is also subject to malus provisions;
8. OTHER
150
• under good leaver provisions (e.g. retirement, redundancy, ill health, injury or mutually agreed separation), a pro-rata amount of conditional rights remains subject to the performance and vesting conditions; and
• once vested, conditional rights can be exercised for no consideration.
8.5.2 Conditional rightsDetails of the number of employee entitlements to conditional rights to ordinary shares granted, vested and transferred to employees during the year are as follows:
2020 2019NUMBER OF
RIGHTSNUMBER OF
RIGHTS
At 1 January 13,484,807 12,630,099Granted 3,999,178 7,220,150Dividends attaching 357,956 408,101Vested and transferred to employees (2,827,980) (4,994,517)Forfeited (1,766,721) (1,779,026)At 31 December 13,247,240 13,484,807Weighted average share price at date of vesting of conditional rights during the year A$13.10 A$12.45Weighted average fair value of conditional rights granted during the year A$12.35 A$11.93
8.5.3 Fair value of conditional rightsThe fair value of conditional rights granted during the year was determined using the following significant assumptions:
2020 2019
Five-day volume weighted average price of instrument at grant date A$ 7.49–14.91 11.88–12.77Expected volatility % 21–24 21–22Risk-free rate % 0.18–0.68 0.67–1.79Expected life of instrument Years 0.1–5.0 0.1–5.0
The fair value is determined using appropriate models including Monte Carlo simulations, depending on the vesting conditions. Some of the assumptions used may be based on historical data which is not necessarily indicative of future trends. Reasonable changes in these assumptions would not have a material impact on the Group's financial statements.
8.5.4 Employee optionsThe market value of all shares underlying the options at the balance date is A$0.1 million (2019 A$0.2 million). During 2020, no options were cancelled or forfeited. At 31 December 2020, 17,000 remained (excluding notional dividends). The options were issued to employees in 2004 in lieu of shares under the Plan. The options vested immediately and are exercisable until March 2024.
8.5.5 Share-based payment expenseTotal expenses arising from share-based payment awards under the Plan amounted to $20 million (2019 $38 million). These amounts are included in underwriting and other expenses.
8.5.6 Shares purchased on-marketThe Group may purchase shares on-market to satisfy entitlements under employee share schemes. The Group acquired 0.2 million (2019 four million) such shares during the period at an average price of A$13.18 (2019 A$12.14).
How we account for the numbersThe fair value of the employee services received in exchange for the grant of equity-settled instruments is recognised as an expense. The total amount to be expensed over the vesting period is determined by reference to the fair value of the instruments granted, excluding the impact of any non-market vesting conditions. The impacts of non-market vesting conditions are included in assumptions about the number of instruments that are expected to become exercisable.
The fair value of each instrument is recognised evenly over the service period ending at the vesting date; however, at each balance date, the Group revises its estimates of the number of instruments that are expected to become exercisable due to the achievement of non-market vesting conditions. The Group recognises the impact of the revision of original estimates, if any, in profit or loss with a corresponding adjustment to equity.
QB
E In
suran
ce Gro
up
A
nn
ual R
epo
rt 2020
151O
ther
info
rmatio
n
6
Fin
ancial
Rep
ort
5
Perfo
rman
ce o
verv
iew
1
Op
erating an
d
finan
cial review
2
Go
vern
ance
3
Directo
rs' R
epo
rt
4
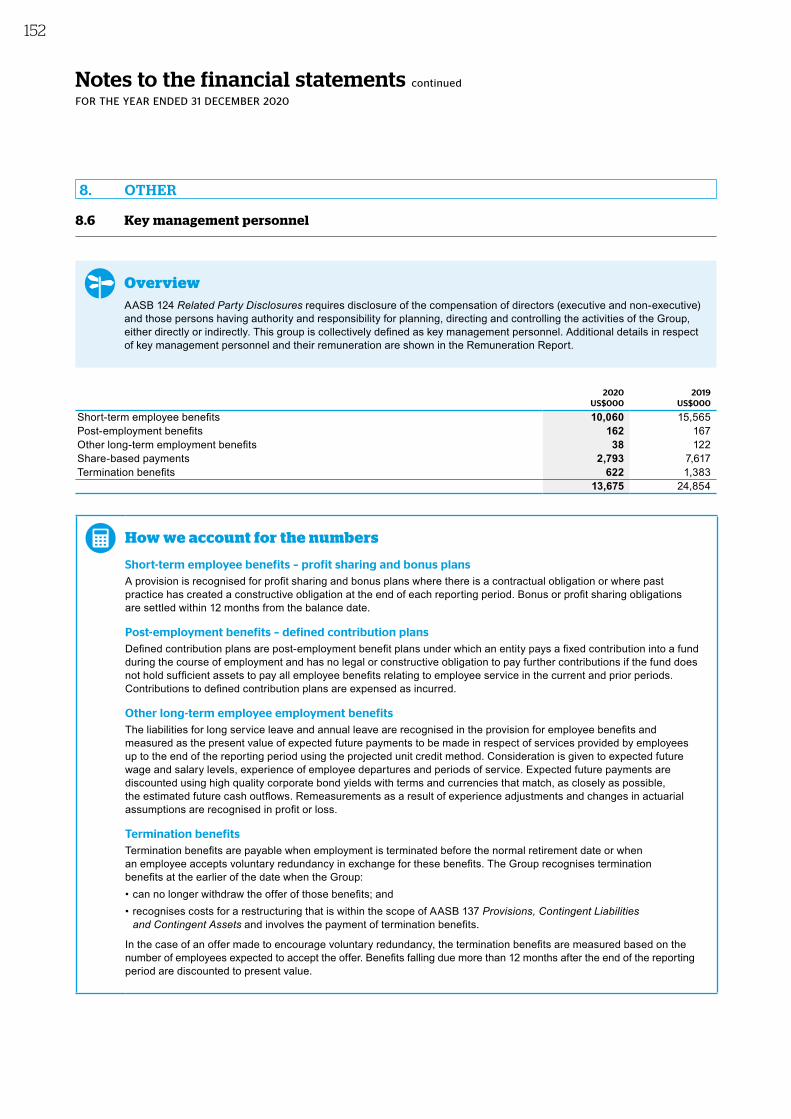
Notes to the financial statements continued
FOR THE YEAR ENDED 31 DECEMBER 2020
8.6 Key management personnel
OverviewAASB 124 Related Party Disclosures requires disclosure of the compensation of directors (executive and non-executive) and those persons having authority and responsibility for planning, directing and controlling the activities of the Group, either directly or indirectly. This group is collectively defined as key management personnel. Additional details in respect of key management personnel and their remuneration are shown in the Remuneration Report.
2020 2019US$000 US$000
Short-term employee benefits 10,060 15,565Post-employment benefits 162 167Other long-term employment benefits 38 122Share-based payments 2,793 7,617Termination benefits 622 1,383
13,675 24,854
How we account for the numbers
Short‑term employee benefits – profit sharing and bonus plansA provision is recognised for profit sharing and bonus plans where there is a contractual obligation or where past practice has created a constructive obligation at the end of each reporting period. Bonus or profit sharing obligations are settled within 12 months from the balance date.
Post‑employment benefits – defined contribution plansDefined contribution plans are post-employment benefit plans under which an entity pays a fixed contribution into a fund during the course of employment and has no legal or constructive obligation to pay further contributions if the fund does not hold sufficient assets to pay all employee benefits relating to employee service in the current and prior periods. Contributions to defined contribution plans are expensed as incurred.
Other long‑term employee employment benefitsThe liabilities for long service leave and annual leave are recognised in the provision for employee benefits and measured as the present value of expected future payments to be made in respect of services provided by employees up to the end of the reporting period using the projected unit credit method. Consideration is given to expected future wage and salary levels, experience of employee departures and periods of service. Expected future payments are discounted using high quality corporate bond yields with terms and currencies that match, as closely as possible, the estimated future cash outflows. Remeasurements as a result of experience adjustments and changes in actuarial assumptions are recognised in profit or loss.
Termination benefitsTermination benefits are payable when employment is terminated before the normal retirement date or when an employee accepts voluntary redundancy in exchange for these benefits. The Group recognises termination benefits at the earlier of the date when the Group:• can no longer withdraw the offer of those benefits; and• recognises costs for a restructuring that is within the scope of AASB 137 Provisions, Contingent Liabilities
and Contingent Assets and involves the payment of termination benefits.
In the case of an offer made to encourage voluntary redundancy, the termination benefits are measured based on the number of employees expected to accept the offer. Benefits falling due more than 12 months after the end of the reporting period are discounted to present value.
8. OTHER
152
8.7 Defined benefit plans
OverviewDefined benefit plans are post-employment plans which provide benefits to employees on retirement, disability or death. The benefits are based on years of service and an average salary calculation. Contributions are made to cover the current cash outflows from the plans and a liability is recorded to recognise the estimated accrued but not yet funded obligations.
FAIR VALUE OF PLAN ASSETSPRESENT VALUE OF PLAN OBLIGATIONS
NET RECOGNISED SURPLUSES (DEFICITS)
DATE OF LAST ACTUARIAL
ASSESSMENT2020
US$M2019
US$M2020
US$M2019
US$M2020
US$M2019
US$M
Defined benefit plan surplusesIron Trades Insurance staff trust 31 Dec 2020 363 330 (299) (285) 64 45 Defined benefit plan deficitsJanson Green final salary superannuation scheme1 31 Dec 2020 209 186 (208) (202) 1 (16)QBE the Americas plan1 31 Dec 2020 258 248 (259) (255) (1) (7)Other plans2 31 Dec 2020 44 41 (65) (60) (21) (19)
511 475 (532) (517) (21) (42)
1 Defined benefit plan obligations are funded.2 Other plans includes $12 million (2019 $12 million) of defined benefit post-employment plan obligations that are not funded.
The measurement of assets and liabilities in defined benefit plans makes it necessary to use assumptions about discount rates, expected future salary increases, investment returns, inflation and life expectancy. If actual outcomes differ materially from actuarial assumptions, this could result in a significant change in employee benefit expense recognised in profit or loss or in actuarial remeasurements recognised in other comprehensive income, together with the defined benefit assets and liabilities recognised in the balance sheet.
The Group does not control the investment strategies of defined benefit plans; they are managed by independent trustees. Nonetheless, the Group has agreed, as part of ongoing funding arrangements, that the trustees should manage their strategic asset allocation in order to minimise the risk of material adverse impact. In particular, the Group has agreed with the trustees to reduce the level of investment risk by investing in assets that match, where possible, the profile of the liabilities. This involves holding a mixture of government and corporate bonds. The Group believes that due to the long-term nature of the plan liabilities, a level of continuing equity investment is also appropriate.
The charge recognised in profit or loss in the year of $3 million (2019 $2 million) is included in underwriting expenses. Total employer contributions expected to be paid to the various plans in 2021 amount to $1 million.
How we account for the numbersThe surplus or deficit recognised in the balance sheet in respect of defined benefit plans is the present value of the defined benefit obligation at the balance date less the fair value of plan assets. The defined benefit obligation is calculated annually by independent actuaries using the projected unit credit method. The present value of the defined benefit obligation is determined by discounting the estimated future cash outflows using interest rates of high quality corporate or government bonds that are denominated in the currency in which the benefits will be paid, and that have a term to maturity approximating the term of the related superannuation liability. Remeasurement gains and losses arising from experience adjustments and changes in actuarial assumptions are recognised in the period in which they occur, and are recognised in other comprehensive income. Past service costs are recognised immediately in profit or loss.
QB
E In
suran
ce Gro
up
A
nn
ual R
epo
rt 2020
153
Oth
er in
form
ation
6
Fin
ancial
Rep
ort
5
Perfo
rman
ce o
verv
iew
1
Op
erating an
d
finan
cial review
2
Go
vern
ance
3
Directo
rs' R
epo
rt
4

Notes to the financial statements continued
FOR THE YEAR ENDED 31 DECEMBER 2020
8.6 Key management personnel
OverviewAASB 124 Related Party Disclosures requires disclosure of the compensation of directors (executive and non-executive) and those persons having authority and responsibility for planning, directing and controlling the activities of the Group, either directly or indirectly. This group is collectively defined as key management personnel. Additional details in respect of key management personnel and their remuneration are shown in the Remuneration Report.
2020 2019US$000 US$000
Short-term employee benefits 10,060 15,565Post-employment benefits 162 167Other long-term employment benefits 38 122Share-based payments 2,793 7,617Termination benefits 622 1,383
13,675 24,854
How we account for the numbers
Short‑term employee benefits – profit sharing and bonus plansA provision is recognised for profit sharing and bonus plans where there is a contractual obligation or where past practice has created a constructive obligation at the end of each reporting period. Bonus or profit sharing obligations are settled within 12 months from the balance date.
Post‑employment benefits – defined contribution plansDefined contribution plans are post-employment benefit plans under which an entity pays a fixed contribution into a fund during the course of employment and has no legal or constructive obligation to pay further contributions if the fund does not hold sufficient assets to pay all employee benefits relating to employee service in the current and prior periods. Contributions to defined contribution plans are expensed as incurred.
Other long‑term employee employment benefitsThe liabilities for long service leave and annual leave are recognised in the provision for employee benefits and measured as the present value of expected future payments to be made in respect of services provided by employees up to the end of the reporting period using the projected unit credit method. Consideration is given to expected future wage and salary levels, experience of employee departures and periods of service. Expected future payments are discounted using high quality corporate bond yields with terms and currencies that match, as closely as possible, the estimated future cash outflows. Remeasurements as a result of experience adjustments and changes in actuarial assumptions are recognised in profit or loss.
Termination benefitsTermination benefits are payable when employment is terminated before the normal retirement date or when an employee accepts voluntary redundancy in exchange for these benefits. The Group recognises termination benefits at the earlier of the date when the Group:• can no longer withdraw the offer of those benefits; and• recognises costs for a restructuring that is within the scope of AASB 137 Provisions, Contingent Liabilities
and Contingent Assets and involves the payment of termination benefits.
In the case of an offer made to encourage voluntary redundancy, the termination benefits are measured based on the number of employees expected to accept the offer. Benefits falling due more than 12 months after the end of the reporting period are discounted to present value.
8. OTHER
152
8.7 Defined benefit plans
OverviewDefined benefit plans are post-employment plans which provide benefits to employees on retirement, disability or death. The benefits are based on years of service and an average salary calculation. Contributions are made to cover the current cash outflows from the plans and a liability is recorded to recognise the estimated accrued but not yet funded obligations.
FAIR VALUE OF PLAN ASSETSPRESENT VALUE OF PLAN OBLIGATIONS
NET RECOGNISED SURPLUSES (DEFICITS)
DATE OF LAST ACTUARIAL
ASSESSMENT2020
US$M2019
US$M2020
US$M2019
US$M2020
US$M2019
US$M
Defined benefit plan surplusesIron Trades Insurance staff trust 31 Dec 2020 363 330 (299) (285) 64 45 Defined benefit plan deficitsJanson Green final salary superannuation scheme1 31 Dec 2020 209 186 (208) (202) 1 (16)QBE the Americas plan1 31 Dec 2020 258 248 (259) (255) (1) (7)Other plans2 31 Dec 2020 44 41 (65) (60) (21) (19)
511 475 (532) (517) (21) (42)
1 Defined benefit plan obligations are funded.2 Other plans includes $12 million (2019 $12 million) of defined benefit post-employment plan obligations that are not funded.
The measurement of assets and liabilities in defined benefit plans makes it necessary to use assumptions about discount rates, expected future salary increases, investment returns, inflation and life expectancy. If actual outcomes differ materially from actuarial assumptions, this could result in a significant change in employee benefit expense recognised in profit or loss or in actuarial remeasurements recognised in other comprehensive income, together with the defined benefit assets and liabilities recognised in the balance sheet.
The Group does not control the investment strategies of defined benefit plans; they are managed by independent trustees. Nonetheless, the Group has agreed, as part of ongoing funding arrangements, that the trustees should manage their strategic asset allocation in order to minimise the risk of material adverse impact. In particular, the Group has agreed with the trustees to reduce the level of investment risk by investing in assets that match, where possible, the profile of the liabilities. This involves holding a mixture of government and corporate bonds. The Group believes that due to the long-term nature of the plan liabilities, a level of continuing equity investment is also appropriate.
The charge recognised in profit or loss in the year of $3 million (2019 $2 million) is included in underwriting expenses. Total employer contributions expected to be paid to the various plans in 2021 amount to $1 million.
How we account for the numbersThe surplus or deficit recognised in the balance sheet in respect of defined benefit plans is the present value of the defined benefit obligation at the balance date less the fair value of plan assets. The defined benefit obligation is calculated annually by independent actuaries using the projected unit credit method. The present value of the defined benefit obligation is determined by discounting the estimated future cash outflows using interest rates of high quality corporate or government bonds that are denominated in the currency in which the benefits will be paid, and that have a term to maturity approximating the term of the related superannuation liability. Remeasurement gains and losses arising from experience adjustments and changes in actuarial assumptions are recognised in the period in which they occur, and are recognised in other comprehensive income. Past service costs are recognised immediately in profit or loss.
QB
E In
suran
ce Gro
up
A
nn
ual R
epo
rt 2020
153O
ther
info
rmatio
n
6
Fin
ancial
Rep
ort
5
Perfo
rman
ce o
verv
iew
1
Op
erating an
d
finan
cial review
2
Go
vern
ance
3
Directo
rs' R
epo
rt
4

Notes to the financial statements continued
FOR THE YEAR ENDED 31 DECEMBER 2020
8.8 Remuneration of auditors
OverviewQBE may engage the external auditor for non-audit services other than excluded services subject to the general principle that fees for non-audit services should not exceed 50% of all fees paid to the external auditor in any one financial year. The Board believes some non-audit services are appropriate given the external auditor’s knowledge of the Group. External tax services are generally provided by an accounting firm other than the external auditor. Consistent with prior periods, the external auditor cannot provide the excluded services of preparing accounting records or financial reports or acting in a management capacity.
2020 2019US$000 US$000
PricewaterhouseCoopers (PwC) Australian firmAudit or review of financial reports of the ultimate parent entity 1,868 1,694Audit of financial reports of controlled entities 1,805 1,895Audit of statutory returns 483 533Other assurance services 920 194Taxation services 32 39Advisory services 505 214
5,613 4,569Related practices of PwC Australian firm (including overseas PwC firms)Audit of financial reports of controlled entities 9,654 8,831Audit of statutory returns 2,824 2,747Other assurance services 130 72Taxation services 74 240Advisory services 102 839
12,784 12,72918,397 17,298
Audit and assurance services 17,684 15,966Other services 713 1,332
18,397 17,298Other auditorsAudit of financial reports of controlled entities 15 44
8. OTHER
154
8.9 Ultimate parent entity information
OverviewThe Corporations Act 2001 requires the disclosure of summarised financial information relating to the ultimate parent entity, QBE Insurance Group Limited.
8.9.1 Summarised financial data of QBE Insurance Group Limited (the Company)
2020 2019US$M US$M
(Loss) profit after income tax (78) 343Other comprehensive loss (1,011) (13)Total comprehensive income (loss) (1,089) 330Assets due within 12 months1 1,366 700Shares in controlled entities 14,860 12,993Total assets 16,226 13,693Liabilities payable within 12 months2 504 714Borrowings 3,016 2,897Total liabilities 3,520 3,611Net assets 12,706 10,082Share capital 10,273 7,594Treasury shares held in trust (1) (1)Foreign currency translation reserve 116 113Other reserves 315 6Retained profits 2,003 2,370Total equity 12,706 10,082
1 Includes amounts due from QBE companies of $977 million (2019 $306 million).2 Includes amounts due to QBE companies of $255 million (2019 $676 million).
8.9.2 Guarantees and contingent liabilities
2020 2019US$M US$M
Support of the Group’s participation in Lloyd’s 2,085 1,848Support of other insurance operations of controlled entities 2,187 2,491Guarantees to investors in subordinated debt1 1,443 1,429
1 Excludes subordinated debt owned by the ultimate parent entity.
8.9.3 Tax consolidation legislationThe accounting in relation to the legislation is set out in note 6.2.4. On adoption of the tax consolidation legislation, the directors of the Company and its wholly-owned Australian controlled entities entered into a tax sharing and tax funding agreement that requires the Australian entities to fully compensate the Company for current tax liabilities and to be fully compensated by the Company for any current tax or deferred tax assets in respect of tax losses arising from external transactions occurring after the date of implementation of the tax consolidation legislation. The contributions are allocated by reference to the notional taxable income of each Australian entity.
Details of franking credits available to shareholders are shown in note 5.4.
How we account for the numbersThe financial information of the ultimate parent entity of the Group has been prepared on the same basis as the consolidated financial report except for shares in controlled entities, which are recorded at cost less any provision for impairment.
QB
E In
suran
ce Gro
up
A
nn
ual R
epo
rt 2020
155
Oth
er in
form
ation
6
Fin
ancial
Rep
ort
5
Perfo
rman
ce o
verv
iew
1
Op
erating an
d
finan
cial review
2
Go
vern
ance
3
Directo
rs' R
epo
rt
4
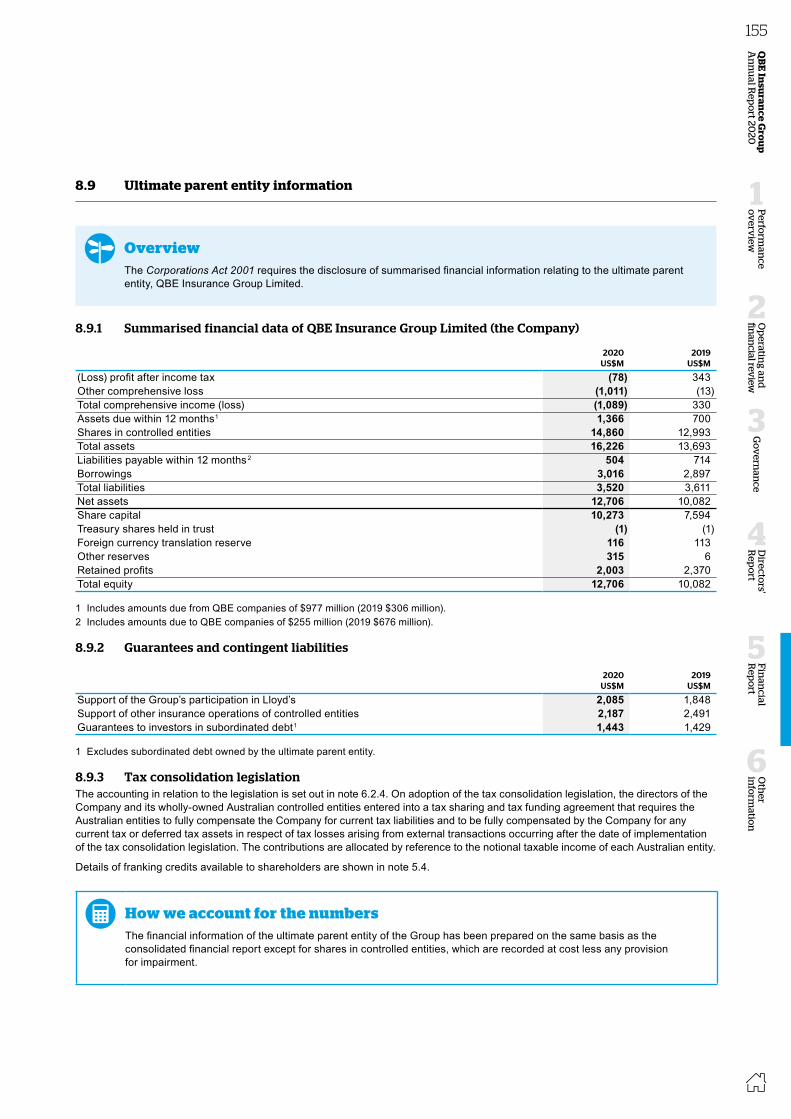
Notes to the financial statements continued
FOR THE YEAR ENDED 31 DECEMBER 2020
8.8 Remuneration of auditors
OverviewQBE may engage the external auditor for non-audit services other than excluded services subject to the general principle that fees for non-audit services should not exceed 50% of all fees paid to the external auditor in any one financial year. The Board believes some non-audit services are appropriate given the external auditor’s knowledge of the Group. External tax services are generally provided by an accounting firm other than the external auditor. Consistent with prior periods, the external auditor cannot provide the excluded services of preparing accounting records or financial reports or acting in a management capacity.
2020 2019US$000 US$000
PricewaterhouseCoopers (PwC) Australian firmAudit or review of financial reports of the ultimate parent entity 1,868 1,694Audit of financial reports of controlled entities 1,805 1,895Audit of statutory returns 483 533Other assurance services 920 194Taxation services 32 39Advisory services 505 214
5,613 4,569Related practices of PwC Australian firm (including overseas PwC firms)Audit of financial reports of controlled entities 9,654 8,831Audit of statutory returns 2,824 2,747Other assurance services 130 72Taxation services 74 240Advisory services 102 839
12,784 12,72918,397 17,298
Audit and assurance services 17,684 15,966Other services 713 1,332
18,397 17,298Other auditorsAudit of financial reports of controlled entities 15 44
8. OTHER
154
8.9 Ultimate parent entity information
OverviewThe Corporations Act 2001 requires the disclosure of summarised financial information relating to the ultimate parent entity, QBE Insurance Group Limited.
8.9.1 Summarised financial data of QBE Insurance Group Limited (the Company)
2020 2019US$M US$M
(Loss) profit after income tax (78) 343Other comprehensive loss (1,011) (13)Total comprehensive income (loss) (1,089) 330Assets due within 12 months1 1,366 700Shares in controlled entities 14,860 12,993Total assets 16,226 13,693Liabilities payable within 12 months2 504 714Borrowings 3,016 2,897Total liabilities 3,520 3,611Net assets 12,706 10,082Share capital 10,273 7,594Treasury shares held in trust (1) (1)Foreign currency translation reserve 116 113Other reserves 315 6Retained profits 2,003 2,370Total equity 12,706 10,082
1 Includes amounts due from QBE companies of $977 million (2019 $306 million).2 Includes amounts due to QBE companies of $255 million (2019 $676 million).
8.9.2 Guarantees and contingent liabilities
2020 2019US$M US$M
Support of the Group’s participation in Lloyd’s 2,085 1,848Support of other insurance operations of controlled entities 2,187 2,491Guarantees to investors in subordinated debt1 1,443 1,429
1 Excludes subordinated debt owned by the ultimate parent entity.
8.9.3 Tax consolidation legislationThe accounting in relation to the legislation is set out in note 6.2.4. On adoption of the tax consolidation legislation, the directors of the Company and its wholly-owned Australian controlled entities entered into a tax sharing and tax funding agreement that requires the Australian entities to fully compensate the Company for current tax liabilities and to be fully compensated by the Company for any current tax or deferred tax assets in respect of tax losses arising from external transactions occurring after the date of implementation of the tax consolidation legislation. The contributions are allocated by reference to the notional taxable income of each Australian entity.
Details of franking credits available to shareholders are shown in note 5.4.
How we account for the numbersThe financial information of the ultimate parent entity of the Group has been prepared on the same basis as the consolidated financial report except for shares in controlled entities, which are recorded at cost less any provision for impairment.
QB
E In
suran
ce Gro
up
A
nn
ual R
epo
rt 2020
155O
ther
info
rmatio
n
6
Fin
ancial
Rep
ort
5
Perfo
rman
ce o
verv
iew
1
Op
erating an
d
finan
cial review
2
Go
vern
ance
3
Directo
rs' R
epo
rt
4
Directors' declarationFOR THE YEAR ENDED 31 DECEMBER 2020
In the directors’ opinion:
(a) the financial statements and notes set out on pages 80 to 155 are in accordance with the Corporations Act 2001, including:(i) complying with accounting standards, the Corporations Regulations 2001 and other mandatory professional reporting
requirements; and (ii) giving a true and fair view of the Group’s financial position as at 31 December 2020 and of its performance for the financial
year ended on that date; and(b) there are reasonable grounds to believe that the Company will be able to pay its debts as and when they become due and payable.
Note 1.2.1 confirms that the financial statements comply with International Financial Reporting Standards as issued by the International Accounting Standards Board.
The directors have been given the declarations by the Interim Group Chief Executive Officer and Group Chief Financial Officer required by section 295A of the Corporations Act 2001 and as recommended under the ASX Corporate Governance Council’s Corporate Governance Principles and Recommendations.
Signed in Sydney this 19th day of February 2021 in accordance with a resolution of the directors.
Michael Wilkins AO Director
John M Green Director
156
Independent auditor's reportTO THE MEMBERS OF QBE INSURANCE GROUP LIMITED
Report on the audit of the Financial Report
Our opinionIn our opinion:
The accompanying Financial Report of QBE Insurance Group Limited (the Company) and its controlled entities (together the Group) is in accordance with the Corporations Act 2001, including:• giving a true and fair view of the Group’s financial position as at 31 December 2020 and of its financial performance for the year
then ended • complying with Australian Accounting Standards and the Corporations Regulations 2001.
What we have auditedThe Group Financial Report comprises:• the consolidated balance sheet as at 31 December 2020• the consolidated statement of comprehensive income for the year then ended• the consolidated statement of changes in equity for the year then ended• the consolidated statement of cash flows for the year then ended• the notes to the financial statements, which include significant accounting policies and other explanatory information• the directors’ declaration.
Basis for opinionWe conducted our audit in accordance with Australian Auditing Standards. Our responsibilities under those standards are further described in the Auditor’s responsibilities for the audit of the Financial Report section of our report.
We believe that the audit evidence we have obtained is sufficient and appropriate to provide a basis for our opinion.
IndependenceWe are independent of the Group in accordance with the auditor independence requirements of the Corporations Act 2001 and the ethical requirements of the Accounting Professional & Ethical Standards Board’s APES 110 Code of Ethics for Professional Accountants (including Independence Standards) (the Code) that are relevant to our audit of the Financial Report in Australia. We have also fulfilled our other ethical responsibilities in accordance with the Code.
PricewaterhouseCoopers, ABN 52 780 433 757One International Towers Sydney, Watermans Quay, Barangaroo, GPO BOX 2650, SYDNEY NSW 2001T: +61 2 8266 0000, F: +61 2 8266 9999, www.pwc.com.au
Level 11, 1PSQ, 169 Macquarie Street, Parramatta NSW 2150, PO Box 1155 Parramatta NSW 2124T: +61 2 9659 2476, F: +61 2 8266 9999, www.pwc.com.au
Liability limited by a scheme approved under Professional Standards Legislation.
QB
E In
suran
ce Gro
up
A
nn
ual R
epo
rt 2020
157
Oth
er in
form
ation
6
Fin
ancial
Rep
ort
5
Perfo
rman
ce o
verv
iew
1
Op
erating an
d
finan
cial review
2
Go
vern
ance
3
Directo
rs' R
epo
rt
4

Directors' declarationFOR THE YEAR ENDED 31 DECEMBER 2020
In the directors’ opinion:
(a) the financial statements and notes set out on pages 80 to 155 are in accordance with the Corporations Act 2001, including:(i) complying with accounting standards, the Corporations Regulations 2001 and other mandatory professional reporting
requirements; and (ii) giving a true and fair view of the Group’s financial position as at 31 December 2020 and of its performance for the financial
year ended on that date; and(b) there are reasonable grounds to believe that the Company will be able to pay its debts as and when they become due and payable.
Note 1.2.1 confirms that the financial statements comply with International Financial Reporting Standards as issued by the International Accounting Standards Board.
The directors have been given the declarations by the Interim Group Chief Executive Officer and Group Chief Financial Officer required by section 295A of the Corporations Act 2001 and as recommended under the ASX Corporate Governance Council’s Corporate Governance Principles and Recommendations.
Signed in Sydney this 19th day of February 2021 in accordance with a resolution of the directors.
Michael Wilkins AO Director
John M Green Director
156
Independent auditor's reportTO THE MEMBERS OF QBE INSURANCE GROUP LIMITED
Report on the audit of the Financial Report
Our opinionIn our opinion:
The accompanying Financial Report of QBE Insurance Group Limited (the Company) and its controlled entities (together the Group) is in accordance with the Corporations Act 2001, including:• giving a true and fair view of the Group’s financial position as at 31 December 2020 and of its financial performance for the year
then ended • complying with Australian Accounting Standards and the Corporations Regulations 2001.
What we have auditedThe Group Financial Report comprises:• the consolidated balance sheet as at 31 December 2020• the consolidated statement of comprehensive income for the year then ended• the consolidated statement of changes in equity for the year then ended• the consolidated statement of cash flows for the year then ended• the notes to the financial statements, which include significant accounting policies and other explanatory information• the directors’ declaration.
Basis for opinionWe conducted our audit in accordance with Australian Auditing Standards. Our responsibilities under those standards are further described in the Auditor’s responsibilities for the audit of the Financial Report section of our report.
We believe that the audit evidence we have obtained is sufficient and appropriate to provide a basis for our opinion.
IndependenceWe are independent of the Group in accordance with the auditor independence requirements of the Corporations Act 2001 and the ethical requirements of the Accounting Professional & Ethical Standards Board’s APES 110 Code of Ethics for Professional Accountants (including Independence Standards) (the Code) that are relevant to our audit of the Financial Report in Australia. We have also fulfilled our other ethical responsibilities in accordance with the Code.
PricewaterhouseCoopers, ABN 52 780 433 757One International Towers Sydney, Watermans Quay, Barangaroo, GPO BOX 2650, SYDNEY NSW 2001T: +61 2 8266 0000, F: +61 2 8266 9999, www.pwc.com.au
Level 11, 1PSQ, 169 Macquarie Street, Parramatta NSW 2150, PO Box 1155 Parramatta NSW 2124T: +61 2 9659 2476, F: +61 2 8266 9999, www.pwc.com.au
Liability limited by a scheme approved under Professional Standards Legislation.
QB
E In
suran
ce Gro
up
A
nn
ual R
epo
rt 2020
157O
ther
info
rmatio
n
6
Fin
ancial
Rep
ort
5
Perfo
rman
ce o
verv
iew
1
Op
erating an
d
finan
cial review
2
Go
vern
ance
3
Directo
rs' R
epo
rt
4

Independent auditor's reportTO THE MEMBERS OF QBE INSURANCE GROUP LIMITED
Our audit approachAn audit is designed to provide reasonable assurance about whether the Financial Report is free from material misstatement. Misstatements may arise due to fraud or error. They are considered material if, individually or in aggregate, they could reasonably be expected to influence the economic decisions of users taken on the basis of the Financial Report.
We tailored the scope of our audit to ensure that we performed enough work to be able to give an opinion on the Financial Report as a whole, taking into account the geographic and management structure of the Group, its accounting processes and controls and the industry in which it operates.
AUDITSCOPE
MATERIALITY KEY AUDITMATTERS
Materiality• For the purpose of our audit we used overall Group materiality of US$57.8 million, which represents approximately 0.5% of the
Group’s net earned premium.• We applied this threshold, together with qualitative considerations, to determine the scope of our audit and the nature, timing
and extent of our audit procedures and to evaluate the effect of misstatements on the Financial Report as a whole.• We chose Group net earned premium because, in our view, it is a key financial statement metric used in assessing
the performance of the Group and is not as volatile as other profit or loss measures.• We utilised a 0.5% threshold based on our professional judgement, noting it is within the range of commonly acceptable thresholds.
Audit scope• Our audit focused on where the Group made subjective judgements; for example, significant accounting estimates involving
assumptions and inherently uncertain future events.• We conducted an audit of the most financially significant components, being the Australia Pacific, International and North America
divisions. In addition, we performed specified risk focused audit procedures in relation to the captive reinsurer, Equator Re, and other head office entities. Further audit procedures were performed over the consolidation process.
• We determined the level of involvement we needed to have in the audit work performed by component auditors to be satisfied that sufficient audit evidence had been obtained for the purposes of our opinion.
• We kept in regular communication with component auditors throughout the year with conference calls and written instructions.• We also ensured that our team, including the component auditors across the Group, possessed the appropriate skills and
competencies needed for the audit of a complex global insurer. This included industry expertise as well as specialists and experts in IT, actuarial, tax and valuations.
158
Key audit mattersKey audit matters are those matters that, in our professional judgement, were of most significance in our audit of the Financial Report for the current period. The key audit matters were addressed in the context of our audit of the Financial Report as a whole, and in forming our opinion thereon, and we do not provide a separate opinion on these matters. Further, any commentary on the outcomes of a particular audit procedure is made in that context. We communicated the key audit matters to the Audit Committee.
Key audit matter How our audit addressed the key audit matter
Valuation of net outstanding claims liability(Refer to note 2.3) US$17,334 million
The liability for outstanding claims relates to claims incurred during the year or prior periods, net of any reinsurance recoveries.
The liability for outstanding claims is estimated by the Group as a central estimate but, as is the case with any accounting estimate, there is a risk that the ultimate claims paid will differ from the initial estimate. A risk margin is therefore applied by the Group to reflect the uncertainty in the estimate. The central estimate and risk margin combined, which are estimated based on judgements and actuarial expertise, are intended to achieve a probability of adequacy within the Group’s desired range of 87.5% - 92.5%, being the estimated overall sufficiency of reserves to pay future claims.
We considered the valuation of net outstanding claims liability a key audit matter due to:• The significant judgement required by the Group and
the inherent uncertainty in estimating the expected future payments for claims incurred, including those not yet reported.
• The uncertainty related to catastrophe events, particularly those occurring closer to year end, and in relation to classes of business where there is a greater length of time between the initial claim event and settlement, because of the inherent difficulty in assessing amounts until further evidence is available.
• The uncertainty created by the COVID-19 pandemic on particular classes of business including property business interruption, credit exposed lines and certain long-tail classes that may experience heightened claims activity due to increased risk from economic impacts and other factors.
• Models used to calculate the net outstanding claims liability across the Group are complex and judgement is applied in determining the appropriate construct of the models.
• The higher degree of auditor subjectivity and effort in performing procedures and evaluating audit evidence related to significant assumptions, particularly patterns of claims incidence, reporting and payment.
• The audit effort required the use of experts with specialised skills and knowledge.
Together with PwC actuarial experts, our procedures included:Gross discounted central estimate• Evaluating the design of the Group’s relevant controls over
the claims reserving process and assessing whether a sample of these controls operated effectively throughout the year.
• Evaluating whether the Group’s actuarial methodologies were consistent with recognised practices and with prior periods.
• Evaluating the appropriateness and reliability of data used to derive the central estimate, including testing a sample of case estimates and settlements by agreeing to underlying documentation.
• Assessing the reasonableness of significant actuarial assumptions such as patterns of claims incidence, reporting and payment, focusing on those classes of business which present a higher risk and in particular those impacted by the COVID-19 pandemic. We assessed these assumptions by comparing them with our expectations based on the Group’s experience, current trends and benchmarks, and our own industry knowledge.
• Testing the discount assumptions applied through evaluating the yield curves and claims payment patterns. This included comparing the rates applied to external market data and the payment patterns to historical information.
Reinsurance and recoveries• Evaluating a sample of reinsurance recoveries held by
divisions and the Group against underlying contracts to assess the existence of cover and appropriateness of their recognition, including inspecting relevant legal advice obtained by the Group.
• Assessing the recoverability of the reinsurance recoveries by considering the payment history and credit worthiness of reinsurer counterparties for a sample of reinsurance recoveries.
QB
E In
suran
ce Gro
up
A
nn
ual R
epo
rt 2020
159
Oth
er in
form
ation
6
Fin
ancial
Rep
ort
5
Perfo
rman
ce o
verv
iew
1
Op
erating an
d
finan
cial review
2
Go
vern
ance
3
Directo
rs' R
epo
rt
4

Independent auditor's reportTO THE MEMBERS OF QBE INSURANCE GROUP LIMITED
Our audit approachAn audit is designed to provide reasonable assurance about whether the Financial Report is free from material misstatement. Misstatements may arise due to fraud or error. They are considered material if, individually or in aggregate, they could reasonably be expected to influence the economic decisions of users taken on the basis of the Financial Report.
We tailored the scope of our audit to ensure that we performed enough work to be able to give an opinion on the Financial Report as a whole, taking into account the geographic and management structure of the Group, its accounting processes and controls and the industry in which it operates.
AUDITSCOPE
MATERIALITY KEY AUDITMATTERS
Materiality• For the purpose of our audit we used overall Group materiality of US$57.8 million, which represents approximately 0.5% of the
Group’s net earned premium.• We applied this threshold, together with qualitative considerations, to determine the scope of our audit and the nature, timing
and extent of our audit procedures and to evaluate the effect of misstatements on the Financial Report as a whole.• We chose Group net earned premium because, in our view, it is a key financial statement metric used in assessing
the performance of the Group and is not as volatile as other profit or loss measures.• We utilised a 0.5% threshold based on our professional judgement, noting it is within the range of commonly acceptable thresholds.
Audit scope• Our audit focused on where the Group made subjective judgements; for example, significant accounting estimates involving
assumptions and inherently uncertain future events.• We conducted an audit of the most financially significant components, being the Australia Pacific, International and North America
divisions. In addition, we performed specified risk focused audit procedures in relation to the captive reinsurer, Equator Re, and other head office entities. Further audit procedures were performed over the consolidation process.
• We determined the level of involvement we needed to have in the audit work performed by component auditors to be satisfied that sufficient audit evidence had been obtained for the purposes of our opinion.
• We kept in regular communication with component auditors throughout the year with conference calls and written instructions.• We also ensured that our team, including the component auditors across the Group, possessed the appropriate skills and
competencies needed for the audit of a complex global insurer. This included industry expertise as well as specialists and experts in IT, actuarial, tax and valuations.
158
Key audit mattersKey audit matters are those matters that, in our professional judgement, were of most significance in our audit of the Financial Report for the current period. The key audit matters were addressed in the context of our audit of the Financial Report as a whole, and in forming our opinion thereon, and we do not provide a separate opinion on these matters. Further, any commentary on the outcomes of a particular audit procedure is made in that context. We communicated the key audit matters to the Audit Committee.
Key audit matter How our audit addressed the key audit matter
Valuation of net outstanding claims liability(Refer to note 2.3) US$17,334 million
The liability for outstanding claims relates to claims incurred during the year or prior periods, net of any reinsurance recoveries.
The liability for outstanding claims is estimated by the Group as a central estimate but, as is the case with any accounting estimate, there is a risk that the ultimate claims paid will differ from the initial estimate. A risk margin is therefore applied by the Group to reflect the uncertainty in the estimate. The central estimate and risk margin combined, which are estimated based on judgements and actuarial expertise, are intended to achieve a probability of adequacy within the Group’s desired range of 87.5% - 92.5%, being the estimated overall sufficiency of reserves to pay future claims.
We considered the valuation of net outstanding claims liability a key audit matter due to:• The significant judgement required by the Group and
the inherent uncertainty in estimating the expected future payments for claims incurred, including those not yet reported.
• The uncertainty related to catastrophe events, particularly those occurring closer to year end, and in relation to classes of business where there is a greater length of time between the initial claim event and settlement, because of the inherent difficulty in assessing amounts until further evidence is available.
• The uncertainty created by the COVID-19 pandemic on particular classes of business including property business interruption, credit exposed lines and certain long-tail classes that may experience heightened claims activity due to increased risk from economic impacts and other factors.
• Models used to calculate the net outstanding claims liability across the Group are complex and judgement is applied in determining the appropriate construct of the models.
• The higher degree of auditor subjectivity and effort in performing procedures and evaluating audit evidence related to significant assumptions, particularly patterns of claims incidence, reporting and payment.
• The audit effort required the use of experts with specialised skills and knowledge.
Together with PwC actuarial experts, our procedures included:Gross discounted central estimate• Evaluating the design of the Group’s relevant controls over
the claims reserving process and assessing whether a sample of these controls operated effectively throughout the year.
• Evaluating whether the Group’s actuarial methodologies were consistent with recognised practices and with prior periods.
• Evaluating the appropriateness and reliability of data used to derive the central estimate, including testing a sample of case estimates and settlements by agreeing to underlying documentation.
• Assessing the reasonableness of significant actuarial assumptions such as patterns of claims incidence, reporting and payment, focusing on those classes of business which present a higher risk and in particular those impacted by the COVID-19 pandemic. We assessed these assumptions by comparing them with our expectations based on the Group’s experience, current trends and benchmarks, and our own industry knowledge.
• Testing the discount assumptions applied through evaluating the yield curves and claims payment patterns. This included comparing the rates applied to external market data and the payment patterns to historical information.
Reinsurance and recoveries• Evaluating a sample of reinsurance recoveries held by
divisions and the Group against underlying contracts to assess the existence of cover and appropriateness of their recognition, including inspecting relevant legal advice obtained by the Group.
• Assessing the recoverability of the reinsurance recoveries by considering the payment history and credit worthiness of reinsurer counterparties for a sample of reinsurance recoveries.
QB
E In
suran
ce Gro
up
A
nn
ual R
epo
rt 2020
159O
ther
info
rmatio
n
6
Fin
ancial
Rep
ort
5
Perfo
rman
ce o
verv
iew
1
Op
erating an
d
finan
cial review
2
Go
vern
ance
3
Directo
rs' R
epo
rt
4

Independent auditor's reportTO THE MEMBERS OF QBE INSURANCE GROUP LIMITED
Key audit matter How our audit addressed the key audit matter
Risk margin and probability of adequacy• Assessing the Group’s approach to setting the risk margin
in accordance with the requirements of Australian Accounting Standards, with a focus on the assessed level of uncertainty in the net central estimate leading to a change in the margin year on year.
• Considering the Group’s key judgements about the variability of each class of business underwritten and the extent of correlation within each division based on the Group’s experience and prior periods.
• Evaluating the Group’s actuarial calculation of the probability of adequacy for reasonableness and consistency with previous valuations. This included developing an understanding of and testing the actuarial techniques applied by the Group and comparing the results with industry approach.
We also considered the reasonableness of the Group’s disclosures against the requirements of Australian Accounting Standards.
Carrying value of goodwill(Refer to note 7.2.1) US$2,107 million
An impairment assessment is performed annually by the Group, or more frequently if events or circumstances indicate that the carrying value of goodwill may be impaired.
Potential impairment is identified by comparing the value-in-use of a cash-generating unit (CGU) to its carrying value, including goodwill. The value-in-use for each of the CGUs is estimated by the Group using a discounted cash flow model which includes significant judgements and assumptions relating to cash flow projections, investment returns, terminal growth rates, and discount rates. The impairment test for the North America CGU resulted in an impairment charge of US$390 million for the Group.
We considered the carrying value of goodwill a key audit matter due to:• The inherent estimation uncertainty and subjectivity in
judgements in a number of assumptions, including cash flow projections, investment returns, terminal growth rates and discount rates.
• Models used to calculate value-in-use are complex and judgement is applied in determining the appropriate construct of the models.
• The higher degree of auditor subjectivity and effort in performing procedures and evaluating audit evidence related to significant assumptions, particularly cash flow projections.
• The audit effort required the use of experts with specialised skills and knowledge.
Our procedures included:• Evaluating the determination and composition of the CGUs
to which goodwill is allocated.• Evaluating the appropriateness of the value-in-use
methodology based on the requirements of Australian Accounting Standards.
• Developing an understanding of the process by which the cash flow projections were developed and comparing the cash flows included in the impairment assessment with the three year business plan presented to the Board.
• Evaluating the reasonableness of significant assumptions used to derive the cash flow projections, with a particular focus on the impact of the COVID-19 pandemic, by comparing to external market and industry data where available, and current and past performance of the CGUs.
• Together with PwC valuation experts, we: – Assessed the consistency of the terminal growth rates and investment returns with available external information.
– Reperformed the calculation of the discount rates applied to cash flow projections, comparing key inputs (including risk-free-rate, market premium and unlevered beta) to industry or other benchmarks.
• Testing the mathematical accuracy of the models which were used to determine the value-in-use of the CGUs.
We also considered the reasonableness of the Group’s disclosures against the requirements of Australian Accounting Standards.
160
Key audit matter How our audit addressed the key audit matter
Recoverability of deferred tax assets in the North America tax group(Refer to note 6.2.1) US$295 million
The Group holds deferred tax assets comprised of carry forward tax losses and deductible temporary differences related to the North America tax group.
The Group performs a recoverability assessment at each balance date in order to evaluate the expected utilisation of the deferred tax assets. The assessment is largely dependent upon the future profitability of the North America CGU, as well as the period over which tax losses will be available for recovery, and the execution of any future tax planning strategies. The recoverability assessment resulted in a write down of the deferred tax assets of US$120 million for the Group.
We considered the recoverability of the deferred tax assets in the North America tax group a key audit matter due to:• The inherent estimation uncertainty and subjectivity in
judgements in a number of assumptions, including cash flow projections, investment returns, and terminal growth rates.
• The higher degree of auditor subjectivity and effort in performing procedures and evaluating audit evidence related to significant assumptions, particularly cash flow projections.
Our procedures included:• Evaluating the reasonableness of the deferred tax assets
recoverability assessment based on the requirements of Australian Accounting Standards with consideration of the “convincing other evidence” test under AASB 112 Income Taxes.
• Evaluating the reasonableness of significant assumptions used to derive the cash flow projections, with a particular focus on the impact of the COVID-19 pandemic, by comparing with external market and industry data where available, and current and past performance of the North America CGU.
• Comparing cash flow projections and other assumptions used in the deferred tax assets recoverability assessment to those used for the goodwill impairment assessment for the North America CGU.
• Testing the mathematical accuracy of the model which was used to determine the recoverability of the deferred tax assets.
We also considered the reasonableness of the Group’s disclosures against the requirements of Australian Accounting Standards.
QB
E In
suran
ce Gro
up
A
nn
ual R
epo
rt 2020
161
Oth
er in
form
ation
6
Fin
ancial
Rep
ort
5
Perfo
rman
ce o
verv
iew
1
Op
erating an
d
finan
cial review
2
Go
vern
ance
3
Directo
rs' R
epo
rt
4

Independent auditor's reportTO THE MEMBERS OF QBE INSURANCE GROUP LIMITED
Key audit matter How our audit addressed the key audit matter
Risk margin and probability of adequacy• Assessing the Group’s approach to setting the risk margin
in accordance with the requirements of Australian Accounting Standards, with a focus on the assessed level of uncertainty in the net central estimate leading to a change in the margin year on year.
• Considering the Group’s key judgements about the variability of each class of business underwritten and the extent of correlation within each division based on the Group’s experience and prior periods.
• Evaluating the Group’s actuarial calculation of the probability of adequacy for reasonableness and consistency with previous valuations. This included developing an understanding of and testing the actuarial techniques applied by the Group and comparing the results with industry approach.
We also considered the reasonableness of the Group’s disclosures against the requirements of Australian Accounting Standards.
Carrying value of goodwill(Refer to note 7.2.1) US$2,107 million
An impairment assessment is performed annually by the Group, or more frequently if events or circumstances indicate that the carrying value of goodwill may be impaired.
Potential impairment is identified by comparing the value-in-use of a cash-generating unit (CGU) to its carrying value, including goodwill. The value-in-use for each of the CGUs is estimated by the Group using a discounted cash flow model which includes significant judgements and assumptions relating to cash flow projections, investment returns, terminal growth rates, and discount rates. The impairment test for the North America CGU resulted in an impairment charge of US$390 million for the Group.
We considered the carrying value of goodwill a key audit matter due to:• The inherent estimation uncertainty and subjectivity in
judgements in a number of assumptions, including cash flow projections, investment returns, terminal growth rates and discount rates.
• Models used to calculate value-in-use are complex and judgement is applied in determining the appropriate construct of the models.
• The higher degree of auditor subjectivity and effort in performing procedures and evaluating audit evidence related to significant assumptions, particularly cash flow projections.
• The audit effort required the use of experts with specialised skills and knowledge.
Our procedures included:• Evaluating the determination and composition of the CGUs
to which goodwill is allocated.• Evaluating the appropriateness of the value-in-use
methodology based on the requirements of Australian Accounting Standards.
• Developing an understanding of the process by which the cash flow projections were developed and comparing the cash flows included in the impairment assessment with the three year business plan presented to the Board.
• Evaluating the reasonableness of significant assumptions used to derive the cash flow projections, with a particular focus on the impact of the COVID-19 pandemic, by comparing to external market and industry data where available, and current and past performance of the CGUs.
• Together with PwC valuation experts, we: – Assessed the consistency of the terminal growth rates and investment returns with available external information.
– Reperformed the calculation of the discount rates applied to cash flow projections, comparing key inputs (including risk-free-rate, market premium and unlevered beta) to industry or other benchmarks.
• Testing the mathematical accuracy of the models which were used to determine the value-in-use of the CGUs.
We also considered the reasonableness of the Group’s disclosures against the requirements of Australian Accounting Standards.
160
Key audit matter How our audit addressed the key audit matter
Recoverability of deferred tax assets in the North America tax group(Refer to note 6.2.1) US$295 million
The Group holds deferred tax assets comprised of carry forward tax losses and deductible temporary differences related to the North America tax group.
The Group performs a recoverability assessment at each balance date in order to evaluate the expected utilisation of the deferred tax assets. The assessment is largely dependent upon the future profitability of the North America CGU, as well as the period over which tax losses will be available for recovery, and the execution of any future tax planning strategies. The recoverability assessment resulted in a write down of the deferred tax assets of US$120 million for the Group.
We considered the recoverability of the deferred tax assets in the North America tax group a key audit matter due to:• The inherent estimation uncertainty and subjectivity in
judgements in a number of assumptions, including cash flow projections, investment returns, and terminal growth rates.
• The higher degree of auditor subjectivity and effort in performing procedures and evaluating audit evidence related to significant assumptions, particularly cash flow projections.
Our procedures included:• Evaluating the reasonableness of the deferred tax assets
recoverability assessment based on the requirements of Australian Accounting Standards with consideration of the “convincing other evidence” test under AASB 112 Income Taxes.
• Evaluating the reasonableness of significant assumptions used to derive the cash flow projections, with a particular focus on the impact of the COVID-19 pandemic, by comparing with external market and industry data where available, and current and past performance of the North America CGU.
• Comparing cash flow projections and other assumptions used in the deferred tax assets recoverability assessment to those used for the goodwill impairment assessment for the North America CGU.
• Testing the mathematical accuracy of the model which was used to determine the recoverability of the deferred tax assets.
We also considered the reasonableness of the Group’s disclosures against the requirements of Australian Accounting Standards.
QB
E In
suran
ce Gro
up
A
nn
ual R
epo
rt 2020
161O
ther
info
rmatio
n
6
Fin
ancial
Rep
ort
5
Perfo
rman
ce o
verv
iew
1
Op
erating an
d
finan
cial review
2
Go
vern
ance
3
Directo
rs' R
epo
rt
4
Independent auditor's reportTO THE MEMBERS OF QBE INSURANCE GROUP LIMITED
Key audit matter How our audit addressed the key audit matter
Valuation of level 3 investments(Refer to note 3.2.1) US$2,285 million
The Group held US$26,935 million of investments at 31 December 2020, of which US$2,285 million were classified as level 3 in accordance with AASB 13 Fair Value Measurement.
The Group exercises judgement in valuing level 3 investments as there are significant unobservable inputs as a result of market illiquidity or instrument complexity.
The level 3 investments held at fair value largely consist of infrastructure assets and debt, unlisted property trusts and private equity.
We considered the valuation of level 3 investments a key audit matter due to:• The extent of judgement involved in determining the fair
value of investments as a result of significant unobservable market inputs.
• The level of effort required in evaluating audit evidence obtained in relation to the valuation, and use of experts with specialised skills and knowledge.
Our procedures included:• Evaluating the design of the Group’s relevant controls over
the investments process and assessing whether a sample of these controls operated effectively throughout the year.
• Evaluating the appropriateness of the valuation methodologies used against the requirements of Australian Accounting Standards.
• For infrastructure debt, we compared the Group’s calculation of fair value with our own calculation. Together with PwC valuation experts, this included sourcing independent inputs from market data providers and using our own valuation models.
• For infrastructure assets and unlisted property trusts where the Group determines the fair value with reference to external information, we: – Compared the price used by the Group to the 31 December 2020 price quoted by the fund manager.
– Obtained the most recent audited financial statements of the relevant funds and evaluated the reliability and accuracy of past statements.
– Inspected the most recent reports provided by the fund manager setting out the controls in place at the fund manager, and that included an independent audit opinion over the design and operating effectiveness of those controls, where available.
• For private equity, together with PwC valuation experts, we assessed the appropriateness of the methodology and key inputs used in the valuation model with reference to external information, where available.
We also considered the reasonableness of the Group’s disclosures against the requirements of Australian Accounting Standards.
162
Key audit matter How our audit addressed the key audit matter
Operation of IT systems and controlsThe Group’s operations and financial reporting systems are heavily dependent on IT systems, including automated accounting procedures and IT dependent manual controls.
The Group’s controls over IT systems include:• The framework of governance over IT systems.• Controls over program development and changes.• Controls over access to programs, data and IT operations.• Governance over generic and privileged user accounts.
We considered this a key audit matter given the reliance on the IT systems in the financial reporting process and the impact on relevant controls we seek to rely on as part of our audit.
Our procedures included:• Evaluating the design, and testing the operating effectiveness,
of certain controls over the continued integrity of the IT systems that are relevant to financial reporting. Where we identified design and operating effectiveness issues relating to IT systems or application controls relevant to our audit, we performed alternative audit procedures.
• Assessing the operation of key applications to establish the accuracy of selected calculations, the correct generation of certain reports, and to evaluate the correct operation of selected automated controls and technology-dependent manual controls.
• Where technology services were provided by a third party, we considered assurance reports from the third party’s auditor on the design and operating effectiveness of controls.
Other informationThe directors are responsible for the other information. The other information comprises the information included in the Annual Report for the year ended 31 December 2020, but does not include the Financial Report and our auditor’s report thereon.
Our opinion on the Financial Report does not cover the other information and accordingly we do not express any form of assurance conclusion thereon.
In connection with our audit of the Financial Report, our responsibility is to read the other information and, in doing so, consider whether the other information is materially inconsistent with the Financial Report or our knowledge obtained in the audit, or otherwise appears to be materially misstated.
If, based on the work we have performed on the other information that we obtained prior to the date of this auditor’s report, we conclude that there is a material misstatement of this other information, we are required to report that fact. We have nothing to report in this regard.
Responsibilities of the directors for the Financial ReportThe directors of the Company are responsible for the preparation of the Financial Report that gives a true and fair view in accordance with Australian Accounting Standards and the Corporations Act 2001 and for such internal control as the directors determine is necessary to enable the preparation of the Financial Report that gives a true and fair view and is free from material misstatement, whether due to fraud or error.
In preparing the Financial Report, the directors are responsible for assessing the ability of the Group to continue as a going concern, disclosing, as applicable, matters related to going concern and using the going concern basis of accounting unless the directors either intend to liquidate the Group or to cease operations, or have no realistic alternative but to do so.
Auditor’s responsibilities for the audit of the Financial ReportOur objectives are to obtain reasonable assurance about whether the Financial Report as a whole is free from material misstatement, whether due to fraud or error, and to issue an auditor’s report that includes our opinion. Reasonable assurance is a high level of assurance, but is not a guarantee that an audit conducted in accordance with the Australian Auditing Standards will always detect a material misstatement when it exists. Misstatements can arise from fraud or error and are considered material if, individually or in the aggregate, they could reasonably be expected to influence the economic decisions of users taken on the basis of the Financial Report.
A further description of our responsibilities for the audit of the Financial Report is located at the Auditing and Assurance Standards Board website at: https://www.auasb.gov.au/admin/file/content102/c3/ar1_2020.pdf. This description forms part of our auditor’s report.
QB
E In
suran
ce Gro
up
A
nn
ual R
epo
rt 2020
163
Oth
er in
form
ation
6
Fin
ancial
Rep
ort
5
Perfo
rman
ce o
verv
iew
1
Op
erating an
d
finan
cial review
2
Go
vern
ance
3
Directo
rs' R
epo
rt
4
Independent auditor's reportTO THE MEMBERS OF QBE INSURANCE GROUP LIMITED
Key audit matter How our audit addressed the key audit matter
Valuation of level 3 investments(Refer to note 3.2.1) US$2,285 million
The Group held US$26,935 million of investments at 31 December 2020, of which US$2,285 million were classified as level 3 in accordance with AASB 13 Fair Value Measurement.
The Group exercises judgement in valuing level 3 investments as there are significant unobservable inputs as a result of market illiquidity or instrument complexity.
The level 3 investments held at fair value largely consist of infrastructure assets and debt, unlisted property trusts and private equity.
We considered the valuation of level 3 investments a key audit matter due to:• The extent of judgement involved in determining the fair
value of investments as a result of significant unobservable market inputs.
• The level of effort required in evaluating audit evidence obtained in relation to the valuation, and use of experts with specialised skills and knowledge.
Our procedures included:• Evaluating the design of the Group’s relevant controls over
the investments process and assessing whether a sample of these controls operated effectively throughout the year.
• Evaluating the appropriateness of the valuation methodologies used against the requirements of Australian Accounting Standards.
• For infrastructure debt, we compared the Group’s calculation of fair value with our own calculation. Together with PwC valuation experts, this included sourcing independent inputs from market data providers and using our own valuation models.
• For infrastructure assets and unlisted property trusts where the Group determines the fair value with reference to external information, we: – Compared the price used by the Group to the 31 December 2020 price quoted by the fund manager.
– Obtained the most recent audited financial statements of the relevant funds and evaluated the reliability and accuracy of past statements.
– Inspected the most recent reports provided by the fund manager setting out the controls in place at the fund manager, and that included an independent audit opinion over the design and operating effectiveness of those controls, where available.
• For private equity, together with PwC valuation experts, we assessed the appropriateness of the methodology and key inputs used in the valuation model with reference to external information, where available.
We also considered the reasonableness of the Group’s disclosures against the requirements of Australian Accounting Standards.
162
Key audit matter How our audit addressed the key audit matter
Operation of IT systems and controlsThe Group’s operations and financial reporting systems are heavily dependent on IT systems, including automated accounting procedures and IT dependent manual controls.
The Group’s controls over IT systems include:• The framework of governance over IT systems.• Controls over program development and changes.• Controls over access to programs, data and IT operations.• Governance over generic and privileged user accounts.
We considered this a key audit matter given the reliance on the IT systems in the financial reporting process and the impact on relevant controls we seek to rely on as part of our audit.
Our procedures included:• Evaluating the design, and testing the operating effectiveness,
of certain controls over the continued integrity of the IT systems that are relevant to financial reporting. Where we identified design and operating effectiveness issues relating to IT systems or application controls relevant to our audit, we performed alternative audit procedures.
• Assessing the operation of key applications to establish the accuracy of selected calculations, the correct generation of certain reports, and to evaluate the correct operation of selected automated controls and technology-dependent manual controls.
• Where technology services were provided by a third party, we considered assurance reports from the third party’s auditor on the design and operating effectiveness of controls.
Other informationThe directors are responsible for the other information. The other information comprises the information included in the Annual Report for the year ended 31 December 2020, but does not include the Financial Report and our auditor’s report thereon.
Our opinion on the Financial Report does not cover the other information and accordingly we do not express any form of assurance conclusion thereon.
In connection with our audit of the Financial Report, our responsibility is to read the other information and, in doing so, consider whether the other information is materially inconsistent with the Financial Report or our knowledge obtained in the audit, or otherwise appears to be materially misstated.
If, based on the work we have performed on the other information that we obtained prior to the date of this auditor’s report, we conclude that there is a material misstatement of this other information, we are required to report that fact. We have nothing to report in this regard.
Responsibilities of the directors for the Financial ReportThe directors of the Company are responsible for the preparation of the Financial Report that gives a true and fair view in accordance with Australian Accounting Standards and the Corporations Act 2001 and for such internal control as the directors determine is necessary to enable the preparation of the Financial Report that gives a true and fair view and is free from material misstatement, whether due to fraud or error.
In preparing the Financial Report, the directors are responsible for assessing the ability of the Group to continue as a going concern, disclosing, as applicable, matters related to going concern and using the going concern basis of accounting unless the directors either intend to liquidate the Group or to cease operations, or have no realistic alternative but to do so.
Auditor’s responsibilities for the audit of the Financial ReportOur objectives are to obtain reasonable assurance about whether the Financial Report as a whole is free from material misstatement, whether due to fraud or error, and to issue an auditor’s report that includes our opinion. Reasonable assurance is a high level of assurance, but is not a guarantee that an audit conducted in accordance with the Australian Auditing Standards will always detect a material misstatement when it exists. Misstatements can arise from fraud or error and are considered material if, individually or in the aggregate, they could reasonably be expected to influence the economic decisions of users taken on the basis of the Financial Report.
A further description of our responsibilities for the audit of the Financial Report is located at the Auditing and Assurance Standards Board website at: https://www.auasb.gov.au/admin/file/content102/c3/ar1_2020.pdf. This description forms part of our auditor’s report.
QB
E In
suran
ce Gro
up
A
nn
ual R
epo
rt 2020
163O
ther
info
rmatio
n
6
Fin
ancial
Rep
ort
5
Perfo
rman
ce o
verv
iew
1
Op
erating an
d
finan
cial review
2
Go
vern
ance
3
Directo
rs' R
epo
rt
4
Independent auditor's reportTO THE MEMBERS OF QBE INSURANCE GROUP LIMITED
Report on the Remuneration Report
Our opinion on the Remuneration ReportWe have audited the Remuneration Report included in pages 54 to 76 of the Directors’ Report for the year ended 31 December 2020.
In our opinion, the Remuneration Report of QBE Insurance Group Limited for the year ended 31 December 2020 complies with section 300A of the Corporations Act 2001.
ResponsibilitiesThe directors of the Company are responsible for the preparation and presentation of the Remuneration Report in accordance with section 300A of the Corporations Act 2001. Our responsibility is to express an opinion on the Remuneration Report, based on our audit conducted in accordance with Australian Auditing Standards.
PricewaterhouseCoopers
Voula Papageorgiou Partner
Sydney 19 February 2021
164
Shareholder information
The Company was incorporated in Australia, is listed on the Australian Securities Exchange (ASX) and trades under the code ‘QBE’.
Registered office
QBE Insurance Group LimitedLevel 27, 8 Chifley Square Sydney NSW 2000 Australia
Telephone: +61 2 9375 4444 Facsimile: +61 2 9231 6104
Website: www.qbe.com
QBE websiteQBE’s website provides investors with information about QBE including annual reports, corporate governance statements, sustainability reports, half yearly reports and announcements to the ASX. The website also offers regular QBE share price updates, a calendar of events, a history of QBE’s dividend and online access to your shareholding details via the share registry.
Shareholder information and enquiriesEnquiries and correspondence regarding shareholdings can be directed to QBE’s share registry:
Computershare Investor Services Pty Limited (Computershare)GPO Box 2975 Melbourne VIC 3001 Australia
452 Johnston Street Abbotsford VIC 3067 Australia
Telephone: 1300 723 487 (Australia) Telephone: +61 3 9415 4840 (International)
Website: www.computershare.com.au Email: [email protected]
For security purposes, you will need to quote your Securityholder Reference Number (SRN) or Holder Identification Number (HIN).
If you are broker (CHESS) sponsored, queries relating to incorrect registrations and changes to name and/or address can only be processed by your stockbroker. Please contact your stockbroker. Computershare cannot assist you with these changes.
Shareholding details onlineManage your shareholding online by visiting QBE’s share registry, Computershare. Log onto www.investorcentre.com to view your holding balance and dividend statements, to update your address (if you are registered with an SRN) or direct credit instructions, provide DRP or BSP instructions or change/add your TFN/ABN details.
You may also register to receive shareholder documentation electronically including your dividend statement, notice of meeting and proxy and annual reports.
Privacy legislationChapter 2C of the Corporations Act 2001 requires information about you as a security holder (including your name, address and details of the securities you hold) to be included in QBE’s share register. These details must continue to be included in the public register even if you cease to be a security holder. A copy of the privacy policy is available on Computershare’s website.
DividendsQBE pays cash dividends to shareholders resident in Australia and New Zealand by direct credit. Shareholders in the United Kingdom and the United States also have the option to receive their cash dividends by direct credit, although it is not mandatory. The benefit to shareholders of the direct credit facility is access to cleared funds quickly and securely, reducing the risk of cheques being lost or stolen. Shareholders in other countries will receive cheque payments in Australian dollars if they have not elected to receive their payment by direct credit. Shareholders receive a dividend statement for tax records, either by post or by email depending on the selected communications option.
Eligible shareholders can participate in QBE’s Dividend Reinvestment Plan (DRP) and Bonus Share Plan (BSP) when the plans are active. The DRP enables shareholders to subscribe for additional shares. The BSP is a bonus share plan whereby the dividend entitlement is forgone for bonus shares in lieu of the dividend. In order to participate in either the DRP or BSP, shareholders must have a minimum shareholding of 100 shares and have a registered address in Australia or New Zealand.
Participants may change their election to participate in the DRP and BSP at any time. DRP/BSP election cut-off dates and application forms are available from QBE’s website.
Tax File Number (TFN), Australian Business Number (ABN) or exemption – Australian residentsYou can confirm whether you have lodged your TFN, ABN or exemption by visiting Computershare’s Investor Centre. If you choose not to lodge these details, QBE is obliged to deduct tax at the highest marginal rate (plus the Medicare levy) from the unfranked portion of dividends paid. Australian shareholders living abroad should advise Computershare of their resident status.
QB
E In
suran
ce Gro
up
A
nn
ual R
epo
rt 2020
165
Oth
er in
form
ation
6
Fin
ancial
Rep
ort
5
Perfo
rman
ce o
verv
iew
1
Op
erating an
d
finan
cial review
2
Go
vern
ance
3
Directo
rs' R
epo
rt
4

Independent auditor's reportTO THE MEMBERS OF QBE INSURANCE GROUP LIMITED
Report on the Remuneration Report
Our opinion on the Remuneration ReportWe have audited the Remuneration Report included in pages 54 to 76 of the Directors’ Report for the year ended 31 December 2020.
In our opinion, the Remuneration Report of QBE Insurance Group Limited for the year ended 31 December 2020 complies with section 300A of the Corporations Act 2001.
ResponsibilitiesThe directors of the Company are responsible for the preparation and presentation of the Remuneration Report in accordance with section 300A of the Corporations Act 2001. Our responsibility is to express an opinion on the Remuneration Report, based on our audit conducted in accordance with Australian Auditing Standards.
PricewaterhouseCoopers
Voula Papageorgiou Partner
Sydney 19 February 2021
164
Shareholder information
The Company was incorporated in Australia, is listed on the Australian Securities Exchange (ASX) and trades under the code ‘QBE’.
Registered office
QBE Insurance Group LimitedLevel 27, 8 Chifley Square Sydney NSW 2000 Australia
Telephone: +61 2 9375 4444 Facsimile: +61 2 9231 6104
Website: www.qbe.com
QBE websiteQBE’s website provides investors with information about QBE including annual reports, corporate governance statements, sustainability reports, half yearly reports and announcements to the ASX. The website also offers regular QBE share price updates, a calendar of events, a history of QBE’s dividend and online access to your shareholding details via the share registry.
Shareholder information and enquiriesEnquiries and correspondence regarding shareholdings can be directed to QBE’s share registry:
Computershare Investor Services Pty Limited (Computershare)GPO Box 2975 Melbourne VIC 3001 Australia
452 Johnston Street Abbotsford VIC 3067 Australia
Telephone: 1300 723 487 (Australia) Telephone: +61 3 9415 4840 (International)
Website: www.computershare.com.au Email: [email protected]
For security purposes, you will need to quote your Securityholder Reference Number (SRN) or Holder Identification Number (HIN).
If you are broker (CHESS) sponsored, queries relating to incorrect registrations and changes to name and/or address can only be processed by your stockbroker. Please contact your stockbroker. Computershare cannot assist you with these changes.
Shareholding details onlineManage your shareholding online by visiting QBE’s share registry, Computershare. Log onto www.investorcentre.com to view your holding balance and dividend statements, to update your address (if you are registered with an SRN) or direct credit instructions, provide DRP or BSP instructions or change/add your TFN/ABN details.
You may also register to receive shareholder documentation electronically including your dividend statement, notice of meeting and proxy and annual reports.
Privacy legislationChapter 2C of the Corporations Act 2001 requires information about you as a security holder (including your name, address and details of the securities you hold) to be included in QBE’s share register. These details must continue to be included in the public register even if you cease to be a security holder. A copy of the privacy policy is available on Computershare’s website.
DividendsQBE pays cash dividends to shareholders resident in Australia and New Zealand by direct credit. Shareholders in the United Kingdom and the United States also have the option to receive their cash dividends by direct credit, although it is not mandatory. The benefit to shareholders of the direct credit facility is access to cleared funds quickly and securely, reducing the risk of cheques being lost or stolen. Shareholders in other countries will receive cheque payments in Australian dollars if they have not elected to receive their payment by direct credit. Shareholders receive a dividend statement for tax records, either by post or by email depending on the selected communications option.
Eligible shareholders can participate in QBE’s Dividend Reinvestment Plan (DRP) and Bonus Share Plan (BSP) when the plans are active. The DRP enables shareholders to subscribe for additional shares. The BSP is a bonus share plan whereby the dividend entitlement is forgone for bonus shares in lieu of the dividend. In order to participate in either the DRP or BSP, shareholders must have a minimum shareholding of 100 shares and have a registered address in Australia or New Zealand.
Participants may change their election to participate in the DRP and BSP at any time. DRP/BSP election cut-off dates and application forms are available from QBE’s website.
Tax File Number (TFN), Australian Business Number (ABN) or exemption – Australian residentsYou can confirm whether you have lodged your TFN, ABN or exemption by visiting Computershare’s Investor Centre. If you choose not to lodge these details, QBE is obliged to deduct tax at the highest marginal rate (plus the Medicare levy) from the unfranked portion of dividends paid. Australian shareholders living abroad should advise Computershare of their resident status.
QB
E In
suran
ce Gro
up
A
nn
ual R
epo
rt 2020
165O
ther
info
rmatio
n
6
Fin
ancial
Rep
ort
5
Perfo
rman
ce o
verv
iew
1
Op
erating an
d
finan
cial review
2
Go
vern
ance
3
Directo
rs' R
epo
rt
4

Shareholder information continued
Conduit foreign income (CFI)Shareholders will receive CFI credits in respect of the whole unfranked portion of QBE dividends. These credits exempt non-resident shareholders from Australian withholding tax.
Unpresented cheques/unclaimed moneyUnder the Unclaimed Moneys Act, unclaimed dividends six or more years old must be given to the ACT Public Trustee. It is very important that shareholders bank outstanding dividend cheques promptly and advise Computershare immediately of changes of address or bank account details.
Recent QBE dividends
DATE PAID TYPE RECORD DATE
AUSTRALIANCENTS
PER SHAREFRANKING
%
28 March 2013 Final 8 March 2013 10 10023 September 2013 Interim 2 September 2013 20 10031 March 2014 Final 13 March 2014 12 10023 September 2014 Interim 29 August 2014 15 10013 April 2015 Final 6 March 2015 22 1002 October 2015 Interim 28 August 2015 20 10014 April 2016 Final 11 March 2016 30 10028 September 2016 Interim 26 August 2016 21 5013 April 2017 Final 10 March 2017 33 5029 September 2017 Interim 25 August 2017 22 3020 April 2018 Final 9 March 2018 4 305 October 2018 Interim 24 August 2018 22 3018 April 2019 Final 8 March 2019 28 604 October 2019 Interim 23 August 2019 25 609 April 2020 Final 6 March 2020 27 3025 September 2020 Interim 21 August 2020 4 10
Annual General MeetingThe Annual General Meeting of QBE Insurance Group Limited will be held at 10.00am on Wednesday, 5 May 2021. Details of the meeting, including information about how to vote, will be contained in our notice of meeting.
Annual Report mailing listAmendments to the Corporations Act 2001 have removed the obligation for companies to mail an annual report to shareholders. To improve efficiency, save costs and reduce our impact on the environment by minimising unnecessary use of paper and printing resources, QBE’s Annual Report is published on our website at www.qbe.com.
If you wish to receive a hard copy of the Annual Report, please update your communication preferences by logging into your shareholding at www.investorcentre.com.
166
Top 20 shareholders as at 31 January 2021
NAMENUMBER
OF SHARES% OF
TOTAL
HSBC Custody Nominees (Australia) Limited 542,951,951 36.91J P Morgan Nominees Australia Pty Limited 391,112,577 26.59Citicorp Nominees Pty Limited 130,417,753 8.87National Nominees Limited 85,930,616 5.84BNP Paribas Nominees Pty Ltd (Agency Lending DRP A/C) 26,302,354 1.79BNP Paribas Noms Pty Ltd (DRP) 24,179,078 1.64HSBC Custody Nominees (Australia) Limited (NT-Comnwlth Super Corp A/C) 12,126,122 0.82Citicorp Nominees Pty Limited (Colonial First State Inv A/C) 9,632,116 0.65HSBC Custody Nominees (Australia) Limited – A/C 2 9,162,864 0.62HSBC Custody Nominees (Australia) Limited – GSCO ECA 8,503,525 0.58Argo Investments Limited 7,790,088 0.53CPU Share Plans Pty Ltd (QBE Ves Control A/C) 3,573,668 0.24Netwealth Investments Limited (Wrap Services A/C) 2,542,190 0.17AMP Life Limited 2,173,624 0.15Mutual Trust Pty Ltd 1,813,771 0.12The Senior Master Of The Supreme Court (Common Fund No 3 A/C) 1,412,939 0.10Navigator Australia Ltd (MLC Investment Sett A/C) 1,164,153 0.08Nulis Nominees (Australia) Limited (Navigator Mast Plan Sett A/C) 1,099,308 0.07BNP Paribas Nominess Pty Ltd HUB24 Custodial Serv Ltd (DRP A/C) 1,096,967 0.07National Nominees Limited (N A/C) 1,059,757 0.07
1,264,045,421 85.94
QBE substantial shareholders as at 31 January 2021
NAMENUMBER OF
SHARES % OF TOTAL DATE OF NOTICE 1
AustralianSuper Pty Ltd 93,021,577 6.33 29 September 2020Vanguard Group (The Vanguard Group, Inc and its controlled entities) 80,289,148 6.06 17 May 2019BlackRock Group (and its associated entities) 76,689,478 6.03 6 June 2019
1 Percentage of total at date of notice.
Distribution of shareholders and shareholdings as at 31 January 2021
SIZE OF HOLDINGNUMBER OF
SHAREHOLDERS %NUMBER
OF SHARES %
1 to 1,000 52,422 57.16 20,820,186 1.421,001 to 5,000 31,388 34.22 70,766,358 4.815,001 to 10,000 4,984 5.43 35,012,235 2.3810,001 to 100,000 2,817 3.07 58,099,547 3.95100,001 and over 105 0.12 1,286,165,647 87.44Total 91,716 100.00 1,470,863,973 100.00
Shareholdings of less than a marketable parcel as at 31 January 2021
SHAREHOLDERS SHARES
NUMBER % OF TOTAL NUMBER % OF TOTAL
Holdings of 63 or fewer shares 7,013 7.65 214,583 0.0146
QB
E In
suran
ce Gro
up
A
nn
ual R
epo
rt 2020
167
Oth
er in
form
ation
6
Fin
ancial
Rep
ort
5
Perfo
rman
ce o
verv
iew
1
Op
erating an
d
finan
cial review
2
Go
vern
ance
3
Directo
rs' R
epo
rt
4

Shareholder information continued
Conduit foreign income (CFI)Shareholders will receive CFI credits in respect of the whole unfranked portion of QBE dividends. These credits exempt non-resident shareholders from Australian withholding tax.
Unpresented cheques/unclaimed moneyUnder the Unclaimed Moneys Act, unclaimed dividends six or more years old must be given to the ACT Public Trustee. It is very important that shareholders bank outstanding dividend cheques promptly and advise Computershare immediately of changes of address or bank account details.
Recent QBE dividends
DATE PAID TYPE RECORD DATE
AUSTRALIANCENTS
PER SHAREFRANKING
%
28 March 2013 Final 8 March 2013 10 10023 September 2013 Interim 2 September 2013 20 10031 March 2014 Final 13 March 2014 12 10023 September 2014 Interim 29 August 2014 15 10013 April 2015 Final 6 March 2015 22 1002 October 2015 Interim 28 August 2015 20 10014 April 2016 Final 11 March 2016 30 10028 September 2016 Interim 26 August 2016 21 5013 April 2017 Final 10 March 2017 33 5029 September 2017 Interim 25 August 2017 22 3020 April 2018 Final 9 March 2018 4 305 October 2018 Interim 24 August 2018 22 3018 April 2019 Final 8 March 2019 28 604 October 2019 Interim 23 August 2019 25 609 April 2020 Final 6 March 2020 27 3025 September 2020 Interim 21 August 2020 4 10
Annual General MeetingThe Annual General Meeting of QBE Insurance Group Limited will be held at 10.00am on Wednesday, 5 May 2021. Details of the meeting, including information about how to vote, will be contained in our notice of meeting.
Annual Report mailing listAmendments to the Corporations Act 2001 have removed the obligation for companies to mail an annual report to shareholders. To improve efficiency, save costs and reduce our impact on the environment by minimising unnecessary use of paper and printing resources, QBE’s Annual Report is published on our website at www.qbe.com.
If you wish to receive a hard copy of the Annual Report, please update your communication preferences by logging into your shareholding at www.investorcentre.com.
166
Top 20 shareholders as at 31 January 2021
NAMENUMBER
OF SHARES% OF
TOTAL
HSBC Custody Nominees (Australia) Limited 542,951,951 36.91J P Morgan Nominees Australia Pty Limited 391,112,577 26.59Citicorp Nominees Pty Limited 130,417,753 8.87National Nominees Limited 85,930,616 5.84BNP Paribas Nominees Pty Ltd (Agency Lending DRP A/C) 26,302,354 1.79BNP Paribas Noms Pty Ltd (DRP) 24,179,078 1.64HSBC Custody Nominees (Australia) Limited (NT-Comnwlth Super Corp A/C) 12,126,122 0.82Citicorp Nominees Pty Limited (Colonial First State Inv A/C) 9,632,116 0.65HSBC Custody Nominees (Australia) Limited – A/C 2 9,162,864 0.62HSBC Custody Nominees (Australia) Limited – GSCO ECA 8,503,525 0.58Argo Investments Limited 7,790,088 0.53CPU Share Plans Pty Ltd (QBE Ves Control A/C) 3,573,668 0.24Netwealth Investments Limited (Wrap Services A/C) 2,542,190 0.17AMP Life Limited 2,173,624 0.15Mutual Trust Pty Ltd 1,813,771 0.12The Senior Master Of The Supreme Court (Common Fund No 3 A/C) 1,412,939 0.10Navigator Australia Ltd (MLC Investment Sett A/C) 1,164,153 0.08Nulis Nominees (Australia) Limited (Navigator Mast Plan Sett A/C) 1,099,308 0.07BNP Paribas Nominess Pty Ltd HUB24 Custodial Serv Ltd (DRP A/C) 1,096,967 0.07National Nominees Limited (N A/C) 1,059,757 0.07
1,264,045,421 85.94
QBE substantial shareholders as at 31 January 2021
NAMENUMBER OF
SHARES % OF TOTAL DATE OF NOTICE 1
AustralianSuper Pty Ltd 93,021,577 6.33 29 September 2020Vanguard Group (The Vanguard Group, Inc and its controlled entities) 80,289,148 6.06 17 May 2019BlackRock Group (and its associated entities) 76,689,478 6.03 6 June 2019
1 Percentage of total at date of notice.
Distribution of shareholders and shareholdings as at 31 January 2021
SIZE OF HOLDINGNUMBER OF
SHAREHOLDERS %NUMBER
OF SHARES %
1 to 1,000 52,422 57.16 20,820,186 1.421,001 to 5,000 31,388 34.22 70,766,358 4.815,001 to 10,000 4,984 5.43 35,012,235 2.3810,001 to 100,000 2,817 3.07 58,099,547 3.95100,001 and over 105 0.12 1,286,165,647 87.44Total 91,716 100.00 1,470,863,973 100.00
Shareholdings of less than a marketable parcel as at 31 January 2021
SHAREHOLDERS SHARES
NUMBER % OF TOTAL NUMBER % OF TOTAL
Holdings of 63 or fewer shares 7,013 7.65 214,583 0.0146
QB
E In
suran
ce Gro
up
A
nn
ual R
epo
rt 2020
167O
ther
info
rmatio
n
6
Fin
ancial
Rep
ort
5
Perfo
rman
ce o
verv
iew
1
Op
erating an
d
finan
cial review
2
Go
vern
ance
3
Directo
rs' R
epo
rt
4
Financial calendar
YEAR MONTH DAY ANNOUNCEMENT
2021 February 19 Results and dividend announcement for the full year ended 31 December 2020
May 5 2021 Annual General Meeting
June 30 Half year end
August 121 Results and dividend announcement for the half year ended 30 June 2021
191 Shares begin trading ex dividend
201 Record date for determining shareholders’ entitlement to the 2021 interim dividend
231 DRP/BSP election close date – last day to nominate participation in the Dividend Reinvestment Plan or the Bonus Share Plan
September 241 Payment date for the 2021 interim dividend
December 31 Full year end
1 Dates shown may be subject to change.
168
10‑year historyFOR THE YEAR ENDED 31 DECEMBER
2020 20191 2018 1 2017 1 2016 2015 2014 2013 2012 2011
Profit or loss informationGross written premium US$M 14,643 13,442 13,657 13,328 14,395 15,092 16,332 17,975 18,434 18,291Gross earned premium US$M 14,008 13,257 13,601 13,611 14,276 14,922 16,521 17,889 18,341 17,840Net earned premium US$M 11,708 11,609 11,640 11,351 11,066 12,314 14,084 15,396 15,798 15,359Claims ratio % 76.3 69.8 63.6 71.5 58.2 60.4 63.2 64.5 66.0 68.2Commission ratio % 16.1 15.6 16.9 17.1 18.4 17.2 16.8 16.8 16.2 14.9Expense ratio % 15.0 14.6 15.4 15.9 17.4 17.3 16.1 16.5 14.9 13.7Combined operating ratio % 107.4 100.0 95.9 104.5 94.0 94.9 96.1 97.8 97.1 96.8Investment income
before investment gains/losses US$M 432 555 690 576 641 541 676 691 723 948after investment gains/losses US$M 226 1,036 547 758 746 665 814 772 1,227 767
Insurance (loss) profit US$M (727) 647 826 (60) 1,075 1,031 1,074 841 1,262 1,085Insurance (loss) profit to net earned premium % (6.2) 5.6 7.1 (0.5) 9.7 8.4 7.6 5.5 8.0 7.1Financing and other costs US$M 252 257 305 302 294 244 297 345 324 275Operating (loss) profit
before income tax US$M (1,472) 672 627 (793) 1,072 953 931 (448) 941 868after income tax and non-controlling interests US$M (1,517) 571 567 (1,212) 844 687 742 (254) 761 704
Balance sheet and share informationNumber of ordinary shares on issue 2 millions 1,471 1,305 1,327 1,358 1,370 1,370 1,363 1,247 1,194 1,112Shareholders' equity US$M 8,492 8,153 8,381 8,859 10,284 10,505 11,030 10,356 11,358 10,386Total assets US$M 46,624 40,035 39,582 43,862 41,583 42,176 45,000 47,271 50,748 46,737Net tangible assets per share 2 US$ 4.05 4.11 4.22 4.29 4.90 5.07 5.32 4.75 4.49 3.93Borrowings to shareholders' equity % 34.8 38.0 38.0 40.8 33.8 33.6 32.5 44.1 43.4 45.8Basic (loss) earnings per share 2 US cents (108.5) 41.8 29.0 (91.5) 61.6 50.3 57.4 (22.8) 65.1 64.9Basic (loss) earnings per share – cash basis 3 US cents (64.1) 48.4 53.1 (18.9) 65.5 65.3 63.5 62.9 89.1 73.0Diluted (loss) earnings per share US cents (108.5) 41.5 28.6 (91.5) 60.8 49.8 55.8 (22.8) 61.6 61.3Return on average shareholders' equity % (18.2) 6.7 4.5 (13.0) 8.1 6.4 6.9 (2.3) 7.0 6.8
Dividend per shareAustralian
cents 4 52 50 26 54 50 37 32 50 87Dividend payout A$M 59 681 669 356 741 685 492 394 593 956Total investments and cash 4 US$M 27,735 24,374 22,887 26,141 25,235 26,708 28,583 30,619 31,525 28,024
1 Profit or loss information for 2017 to 2019 excludes the results of discontinued operations.2 Reflects shares on an accounting basis.3 Calculated with reference to cash profit, being profit after tax adjusted for amortisation and impairment of intangibles and other non-cash
items net of tax.4 Includes financial assets at fair value through profit or loss, cash and cash equivalents and investment properties; excludes any balances
held for sale.
QB
E In
suran
ce Gro
up
A
nn
ual R
epo
rt 2020
169
Oth
er in
form
ation
6
Fin
ancial
Rep
ort
5
Perfo
rman
ce o
verv
iew
1
Op
erating an
d
finan
cial review
2
Go
vern
ance
3
Directo
rs' R
epo
rt
4

Financial calendar
YEAR MONTH DAY ANNOUNCEMENT
2021 February 19 Results and dividend announcement for the full year ended 31 December 2020
May 5 2021 Annual General Meeting
June 30 Half year end
August 121 Results and dividend announcement for the half year ended 30 June 2021
191 Shares begin trading ex dividend
201 Record date for determining shareholders’ entitlement to the 2021 interim dividend
231 DRP/BSP election close date – last day to nominate participation in the Dividend Reinvestment Plan or the Bonus Share Plan
September 241 Payment date for the 2021 interim dividend
December 31 Full year end
1 Dates shown may be subject to change.
168
10‑year historyFOR THE YEAR ENDED 31 DECEMBER
2020 20191 2018 1 2017 1 2016 2015 2014 2013 2012 2011
Profit or loss informationGross written premium US$M 14,643 13,442 13,657 13,328 14,395 15,092 16,332 17,975 18,434 18,291Gross earned premium US$M 14,008 13,257 13,601 13,611 14,276 14,922 16,521 17,889 18,341 17,840Net earned premium US$M 11,708 11,609 11,640 11,351 11,066 12,314 14,084 15,396 15,798 15,359Claims ratio % 76.3 69.8 63.6 71.5 58.2 60.4 63.2 64.5 66.0 68.2Commission ratio % 16.1 15.6 16.9 17.1 18.4 17.2 16.8 16.8 16.2 14.9Expense ratio % 15.0 14.6 15.4 15.9 17.4 17.3 16.1 16.5 14.9 13.7Combined operating ratio % 107.4 100.0 95.9 104.5 94.0 94.9 96.1 97.8 97.1 96.8Investment income
before investment gains/losses US$M 432 555 690 576 641 541 676 691 723 948after investment gains/losses US$M 226 1,036 547 758 746 665 814 772 1,227 767
Insurance (loss) profit US$M (727) 647 826 (60) 1,075 1,031 1,074 841 1,262 1,085Insurance (loss) profit to net earned premium % (6.2) 5.6 7.1 (0.5) 9.7 8.4 7.6 5.5 8.0 7.1Financing and other costs US$M 252 257 305 302 294 244 297 345 324 275Operating (loss) profit
before income tax US$M (1,472) 672 627 (793) 1,072 953 931 (448) 941 868after income tax and non-controlling interests US$M (1,517) 571 567 (1,212) 844 687 742 (254) 761 704
Balance sheet and share informationNumber of ordinary shares on issue 2 millions 1,471 1,305 1,327 1,358 1,370 1,370 1,363 1,247 1,194 1,112Shareholders' equity US$M 8,492 8,153 8,381 8,859 10,284 10,505 11,030 10,356 11,358 10,386Total assets US$M 46,624 40,035 39,582 43,862 41,583 42,176 45,000 47,271 50,748 46,737Net tangible assets per share 2 US$ 4.05 4.11 4.22 4.29 4.90 5.07 5.32 4.75 4.49 3.93Borrowings to shareholders' equity % 34.8 38.0 38.0 40.8 33.8 33.6 32.5 44.1 43.4 45.8Basic (loss) earnings per share 2 US cents (108.5) 41.8 29.0 (91.5) 61.6 50.3 57.4 (22.8) 65.1 64.9Basic (loss) earnings per share – cash basis 3 US cents (64.1) 48.4 53.1 (18.9) 65.5 65.3 63.5 62.9 89.1 73.0Diluted (loss) earnings per share US cents (108.5) 41.5 28.6 (91.5) 60.8 49.8 55.8 (22.8) 61.6 61.3Return on average shareholders' equity % (18.2) 6.7 4.5 (13.0) 8.1 6.4 6.9 (2.3) 7.0 6.8
Dividend per shareAustralian
cents 4 52 50 26 54 50 37 32 50 87Dividend payout A$M 59 681 669 356 741 685 492 394 593 956Total investments and cash 4 US$M 27,735 24,374 22,887 26,141 25,235 26,708 28,583 30,619 31,525 28,024
1 Profit or loss information for 2017 to 2019 excludes the results of discontinued operations.2 Reflects shares on an accounting basis.3 Calculated with reference to cash profit, being profit after tax adjusted for amortisation and impairment of intangibles and other non-cash
items net of tax.4 Includes financial assets at fair value through profit or loss, cash and cash equivalents and investment properties; excludes any balances
held for sale.
QB
E In
suran
ce Gro
up
A
nn
ual R
epo
rt 2020
169O
ther
info
rmatio
n
6
Fin
ancial
Rep
ort
5
Perfo
rman
ce o
verv
iew
1
Op
erating an
d
finan
cial review
2
Go
vern
ance
3
Directo
rs' R
epo
rt
4

Glossary
Accident year claims The matching of all claims occurring (regardless of when reported or paid) during a given 12-month period with all premium earned over the same period.
Acquisition cost The total of net commission and operating expenses incurred in the generation of net earned premium and often expressed as a percentage of net earned premium.
Admitted insurance Insurance written by an insurance company that is admitted (or licensed) to do business in the state in the United States in which the policy was sold.
Agent One who negotiates contracts of insurance or reinsurance as an insurance company’s representative i.e. the agent’s primary responsibility is to the insurance company, not the insured party.
APRA The Australian Prudential Regulation Authority, being the Group’s primary insurance regulator.Attritional claims ratio Total of all claims with a net cost of less than $2.5 million as a percentage of net earned premium.Broker One who negotiates contracts of insurance or reinsurance on behalf of an insured party, receiving
a commission from the insurance or reinsurance company for placement and other services rendered. In contrast with an agent, the broker’s primary responsibility is to the insured party not the insurance company.
Capacity In relation to a Lloyd’s member, the maximum amount of insurance premium (gross of reinsurance but net of brokerage) which a member can accept. In relation to a syndicate, the aggregate of each member’s capacity allocated to that syndicate.
Cash profit or loss Profit or loss after tax attributable to QBE shareholders, adjusted for the post-tax effect of amortisation and impairment of intangibles and other non-cash items. This definition is used for the purpose of the Group’s dividend policy.
Casualty insurance Insurance that is primarily concerned with the claims resulting from injuries to third persons or their property (i.e. not the policyholder) and the resulting legal liability imposed on the insured. It includes, but is not limited to, general liability, employers’ liability, workers’ compensation, professional liability, public liability and motor liability insurance.
Catastrophe reinsurance A reinsurance contract (often in the form of excess of loss reinsurance) that, subject to specified limits and retention, compensates the ceding insurer for financial losses related to an accumulation of claims resulting from a catastrophe event or series of events.
Claim The amount payable under a contract of insurance or reinsurance arising from a loss relating to an insured event.
Claims incurred The aggregate of all claims paid during an accounting period adjusted for the change in the claims provision in that accounting period.
Claims provision The estimate of the most likely cost of settling present and future claims and associated claims adjustment expenses plus a risk margin to cover possible fluctuation of the liability.
Claims ratio Net claims incurred as a percentage of net earned premium.Coefficient of variation The measure of variability in the net discounted central estimate used in the determination of the
probability of adequacy.Combined operating ratio (COR)
The sum of the net claims ratio, commission ratio and expense ratio. A combined operating ratio below 100% indicates an underwriting profit. A combined operating ratio over 100% indicates an underwriting loss.
Commercial lines Refers to insurance for businesses, professionals and commercial establishments.Commission Fee paid to an agent or broker as a percentage of the policy premium. The percentage varies
widely depending on coverage, the insurer and the marketing methods.Commission ratio Net commission expense as a percentage of net earned premium.Credit spread The difference in yield between a bond and a reference yield (e.g. LIBOR, BBSW or a fixed
sovereign bond yield).Credit spread duration The weighted average term of cash flows for a corporate bond. It is used to measure the price
sensitivity of a corporate bond to changes in credit spreads.Deductible The amount or proportion of some or all losses arising under an insurance contract that the
insured must bear.Deferred acquisition costs Acquisition costs relating to the unexpired period of risk of contracts in force at the balance date
which are carried forward from one accounting period to subsequent accounting periods.Excess of loss reinsurance A form of reinsurance in which, in return for a premium, the reinsurer accepts liability for claims
settled by the original insurer in excess of an agreed amount, generally subject to an upper limit.Expense ratio Underwriting and administrative expenses as a percentage of net earned premium.Facultative reinsurance The reinsurance of individual risks through a transaction between the reinsurer and the cedant
(usually the primary insurer) involving a specified risk.General insurance Generally used to describe non-life insurance business including property and casualty insurance.
170
Gross claims incurred The amount of claims incurred during an accounting period before deducting reinsurance recoveries.Gross earned premium (GEP) The proportion of gross written premium recognised as revenue in the current accounting period,
reflecting the pattern of the incidence of risk and the expiry of that risk.Gross written premium (GWP) The total premium on insurance underwritten by an insurer or reinsurer during an accounting
period, before deduction of reinsurance premium.Incurred but not reported (IBNR)
Claims arising out of events that have occurred before the end of an accounting period but have not been reported to the insurer by that date.
Incurred but not enough reported (IBNER)
The upward adjustment to claims incurred as a result of the initial under-estimation of the ultimate cost of claims.
Insurance profit or loss The sum of the underwriting result and net investment income or loss on assets backing policyholders’ funds.
Insurance profit margin The ratio of insurance profit or loss to net earned premium.Inward reinsurance See Reinsurance.Large individual risk and catastrophe claims ratio
The aggregate of claims each with a net cost of $2.5 million or more as a percentage of net earned premium.
Lead/non‑lead underwriter A lead underwriter operates in the subscription market and sets the terms and price of an insurance or reinsurance policy. The follower or non-lead is an underwriter of a syndicate or an insurance or reinsurance company that agrees to accept a proportion of a given risk on terms set by the lead underwriter.
Lenders’ mortgage insurance (LMI)
A policy that protects the lender (e.g. a bank) against non-payment or default on the part of the borrower on a residential property loan.
Letters of credit (LoC) Written undertaking by a financial institution to provide funding if required.Lloyd’s Insurance and reinsurance market in London. It is not a company but is a society of individuals
and corporate underwriting members.Lloyd’s managing agent An underwriting agent which has permission from Lloyd’s to manage one or more syndicates and
carry on underwriting and other functions for a member.Long‑tail Classes of insurance business involving coverage for risks where notice of a claim may not
be received for many years and claims may be outstanding for more than one year before they are finally quantifiable and settled by the insurer.
Managing General Agent (MGA) A wholesale insurance agent with the authority to accept placements from (and often to appoint) retail agents on behalf of an insurer. MGAs generally provide underwriting and administrative services such as policy issuance on behalf of the insurers they represent. Some may handle claims.
Maximum event retention (MER) An estimate of the largest claim to which an insurer will be exposed (taking into account the probability of that loss event at a return period of one in 250 years) due to a concentration of risk exposures, after netting off any potential reinsurance recoveries and inward and outward reinstatement premiums.
Modified duration The weighted average term of cash flows in a bond. It is used to measure the price sensitivity of a bond to changes in interest rates.
Multi‑peril crop scheme United States federally regulated crop insurance protecting against crop yield losses by allowing participating insurers to insure a certain percentage of historical crop production.
Net claims incurred The amount of claims incurred during an accounting period after deducting reinsurance recoveries. Net claims ratio Net claims incurred as a percentage of net earned premium.Net earned premium (NEP) Net written premium adjusted by the change in net unearned premium.Net investment income or loss Gross investment income or loss including foreign exchange gains and losses and net of
investment expenses.Net written premium (NWP) The total premium on insurance underwritten by an insurer during a specified period after the
deduction of premium applicable to reinsurance.Outstanding claims liability The amount of provision established for claims and related claims expenses that have occurred
but have not been paid.Personal lines Insurance for individuals and families, such as private motor vehicle and homeowners’ insurance.Policyholders’ funds The net insurance liabilities of the Group.Premium Amount payable by the insured or reinsured in order to obtain insurance or reinsurance protection. Premium solvency ratio Ratio of net tangible assets to net earned premium. This is an important industry indicator
in assessing the ability of general insurers to settle their existing liabilities.Prescribed Capital Amount (PCA)
The sum of the capital charges for asset risk, asset concentration risk, insurance concentration risk and operational risk as required by APRA. The PCA must be disclosed at least annually.
QB
E In
suran
ce Gro
up
A
nn
ual R
epo
rt 2020
171
Oth
er in
form
ation
6
Fin
ancial
Rep
ort
5
Perfo
rman
ce o
verv
iew
1
Op
erating an
d
finan
cial review
2
Go
vern
ance
3
Directo
rs' R
epo
rt
4

Glossary
Accident year claims The matching of all claims occurring (regardless of when reported or paid) during a given 12-month period with all premium earned over the same period.
Acquisition cost The total of net commission and operating expenses incurred in the generation of net earned premium and often expressed as a percentage of net earned premium.
Admitted insurance Insurance written by an insurance company that is admitted (or licensed) to do business in the state in the United States in which the policy was sold.
Agent One who negotiates contracts of insurance or reinsurance as an insurance company’s representative i.e. the agent’s primary responsibility is to the insurance company, not the insured party.
APRA The Australian Prudential Regulation Authority, being the Group’s primary insurance regulator.Attritional claims ratio Total of all claims with a net cost of less than $2.5 million as a percentage of net earned premium.Broker One who negotiates contracts of insurance or reinsurance on behalf of an insured party, receiving
a commission from the insurance or reinsurance company for placement and other services rendered. In contrast with an agent, the broker’s primary responsibility is to the insured party not the insurance company.
Capacity In relation to a Lloyd’s member, the maximum amount of insurance premium (gross of reinsurance but net of brokerage) which a member can accept. In relation to a syndicate, the aggregate of each member’s capacity allocated to that syndicate.
Cash profit or loss Profit or loss after tax attributable to QBE shareholders, adjusted for the post-tax effect of amortisation and impairment of intangibles and other non-cash items. This definition is used for the purpose of the Group’s dividend policy.
Casualty insurance Insurance that is primarily concerned with the claims resulting from injuries to third persons or their property (i.e. not the policyholder) and the resulting legal liability imposed on the insured. It includes, but is not limited to, general liability, employers’ liability, workers’ compensation, professional liability, public liability and motor liability insurance.
Catastrophe reinsurance A reinsurance contract (often in the form of excess of loss reinsurance) that, subject to specified limits and retention, compensates the ceding insurer for financial losses related to an accumulation of claims resulting from a catastrophe event or series of events.
Claim The amount payable under a contract of insurance or reinsurance arising from a loss relating to an insured event.
Claims incurred The aggregate of all claims paid during an accounting period adjusted for the change in the claims provision in that accounting period.
Claims provision The estimate of the most likely cost of settling present and future claims and associated claims adjustment expenses plus a risk margin to cover possible fluctuation of the liability.
Claims ratio Net claims incurred as a percentage of net earned premium.Coefficient of variation The measure of variability in the net discounted central estimate used in the determination of the
probability of adequacy.Combined operating ratio (COR)
The sum of the net claims ratio, commission ratio and expense ratio. A combined operating ratio below 100% indicates an underwriting profit. A combined operating ratio over 100% indicates an underwriting loss.
Commercial lines Refers to insurance for businesses, professionals and commercial establishments.Commission Fee paid to an agent or broker as a percentage of the policy premium. The percentage varies
widely depending on coverage, the insurer and the marketing methods.Commission ratio Net commission expense as a percentage of net earned premium.Credit spread The difference in yield between a bond and a reference yield (e.g. LIBOR, BBSW or a fixed
sovereign bond yield).Credit spread duration The weighted average term of cash flows for a corporate bond. It is used to measure the price
sensitivity of a corporate bond to changes in credit spreads.Deductible The amount or proportion of some or all losses arising under an insurance contract that the
insured must bear.Deferred acquisition costs Acquisition costs relating to the unexpired period of risk of contracts in force at the balance date
which are carried forward from one accounting period to subsequent accounting periods.Excess of loss reinsurance A form of reinsurance in which, in return for a premium, the reinsurer accepts liability for claims
settled by the original insurer in excess of an agreed amount, generally subject to an upper limit.Expense ratio Underwriting and administrative expenses as a percentage of net earned premium.Facultative reinsurance The reinsurance of individual risks through a transaction between the reinsurer and the cedant
(usually the primary insurer) involving a specified risk.General insurance Generally used to describe non-life insurance business including property and casualty insurance.
170
Gross claims incurred The amount of claims incurred during an accounting period before deducting reinsurance recoveries.Gross earned premium (GEP) The proportion of gross written premium recognised as revenue in the current accounting period,
reflecting the pattern of the incidence of risk and the expiry of that risk.Gross written premium (GWP) The total premium on insurance underwritten by an insurer or reinsurer during an accounting
period, before deduction of reinsurance premium.Incurred but not reported (IBNR)
Claims arising out of events that have occurred before the end of an accounting period but have not been reported to the insurer by that date.
Incurred but not enough reported (IBNER)
The upward adjustment to claims incurred as a result of the initial under-estimation of the ultimate cost of claims.
Insurance profit or loss The sum of the underwriting result and net investment income or loss on assets backing policyholders’ funds.
Insurance profit margin The ratio of insurance profit or loss to net earned premium.Inward reinsurance See Reinsurance.Large individual risk and catastrophe claims ratio
The aggregate of claims each with a net cost of $2.5 million or more as a percentage of net earned premium.
Lead/non‑lead underwriter A lead underwriter operates in the subscription market and sets the terms and price of an insurance or reinsurance policy. The follower or non-lead is an underwriter of a syndicate or an insurance or reinsurance company that agrees to accept a proportion of a given risk on terms set by the lead underwriter.
Lenders’ mortgage insurance (LMI)
A policy that protects the lender (e.g. a bank) against non-payment or default on the part of the borrower on a residential property loan.
Letters of credit (LoC) Written undertaking by a financial institution to provide funding if required.Lloyd’s Insurance and reinsurance market in London. It is not a company but is a society of individuals
and corporate underwriting members.Lloyd’s managing agent An underwriting agent which has permission from Lloyd’s to manage one or more syndicates and
carry on underwriting and other functions for a member.Long‑tail Classes of insurance business involving coverage for risks where notice of a claim may not
be received for many years and claims may be outstanding for more than one year before they are finally quantifiable and settled by the insurer.
Managing General Agent (MGA) A wholesale insurance agent with the authority to accept placements from (and often to appoint) retail agents on behalf of an insurer. MGAs generally provide underwriting and administrative services such as policy issuance on behalf of the insurers they represent. Some may handle claims.
Maximum event retention (MER) An estimate of the largest claim to which an insurer will be exposed (taking into account the probability of that loss event at a return period of one in 250 years) due to a concentration of risk exposures, after netting off any potential reinsurance recoveries and inward and outward reinstatement premiums.
Modified duration The weighted average term of cash flows in a bond. It is used to measure the price sensitivity of a bond to changes in interest rates.
Multi‑peril crop scheme United States federally regulated crop insurance protecting against crop yield losses by allowing participating insurers to insure a certain percentage of historical crop production.
Net claims incurred The amount of claims incurred during an accounting period after deducting reinsurance recoveries. Net claims ratio Net claims incurred as a percentage of net earned premium.Net earned premium (NEP) Net written premium adjusted by the change in net unearned premium.Net investment income or loss Gross investment income or loss including foreign exchange gains and losses and net of
investment expenses.Net written premium (NWP) The total premium on insurance underwritten by an insurer during a specified period after the
deduction of premium applicable to reinsurance.Outstanding claims liability The amount of provision established for claims and related claims expenses that have occurred
but have not been paid.Personal lines Insurance for individuals and families, such as private motor vehicle and homeowners’ insurance.Policyholders’ funds The net insurance liabilities of the Group.Premium Amount payable by the insured or reinsured in order to obtain insurance or reinsurance protection. Premium solvency ratio Ratio of net tangible assets to net earned premium. This is an important industry indicator
in assessing the ability of general insurers to settle their existing liabilities.Prescribed Capital Amount (PCA)
The sum of the capital charges for asset risk, asset concentration risk, insurance concentration risk and operational risk as required by APRA. The PCA must be disclosed at least annually.
QB
E In
suran
ce Gro
up
A
nn
ual R
epo
rt 2020
171O
ther
info
rmatio
n
6
Fin
ancial
Rep
ort
5
Perfo
rman
ce o
verv
iew
1
Op
erating an
d
finan
cial review
2
Go
vern
ance
3
Directo
rs' R
epo
rt
4
Glossary continued
Probability of adequacy A statistical measure of the level of confidence that the outstanding claims liability will be sufficient to pay claims as and when they fall due.
Proportional reinsurance A type of reinsurance in which the insurer and the reinsurer share claims in the same proportion as they share premiums.
Prudential Capital Requirement (PCR)
The sum of the PCA plus any supervisory adjustment determined by APRA. The PCR may not be disclosed.
Recoveries The amount of claims recovered from reinsurance, third parties or salvage.Reinsurance An agreement to indemnify an insurer by a reinsurer in consideration of a premium with respect
to agreed risks insured by the insurer. The enterprise accepting the risk is the reinsurer and is said to accept inward reinsurance. The enterprise ceding the risks is the cedant or ceding company and is said to place outward reinsurance.
Reinsurance to close A reinsurance agreement under which members of a syndicate, for a year of account to be closed, are reinsured by members who comprise that or another syndicate for a later year of account against all liabilities arising out of insurance business written by the reinsured syndicate.
Reinsurer The insurer that assumes all or part of the insurance or reinsurance liability written by another insurer. The term includes retrocessionaires, being insurers that assume reinsurance from a reinsurer.
Retention That amount of liability for which an insurer will remain responsible after it has completed its reinsurance arrangements.
Retrocession Reinsurance of a reinsurer by another reinsurance company.Return on allocated capital (RoAC)
Divisional management-basis profit as a percentage of allocated capital as determined by the Group’s economic capital model.
Return on equity (ROE) Group statutory net profit after tax as a percentage of average shareholders’ equity.Short‑tail Classes of insurance business involving coverage for risks where claims are usually known
and settled within 12 months.Stop loss reinsurance A form of excess of loss reinsurance which provides that the reinsurer will pay some or all of the
reinsured’s claims in excess of a stated percentage of the reinsured’s premium income, subject (usually) to an overall limit of liability.
Surplus (or excess) lines insurers
In contrast to admitted insurers, every state in the United States also allows non-admitted (or surplus lines or excess lines) carriers to transact business where there is a special need that cannot or will not be met by admitted carriers. The rates and forms of non-admitted carriers generally are not regulated in that state, nor are the policies back-stopped by the state insolvency fund covering admitted insurance. Brokers must inform insurers if their insurance has been placed with a non-admitted insurer.
Survival ratio A measure of how many years it would take for dust disease claims to exhaust the current level of claims provision. It is calculated on the average level of claims payments in the last three years.
Syndicate A member or group of members underwriting insurance business at Lloyd’s through the agency of a managing agent.
Total shareholder return (TSR) A measure of performance of a company’s shares over time. It includes share price appreciation and dividend performance.
Treaty reinsurance Reinsurance of risks in which the reinsurer is obliged by agreement with the cedant to accept, within agreed limits, all risks to be underwritten by the cedant within specified classes of business in a given period of time.
Underwriting The process of reviewing applications submitted for insurance or reinsurance coverage, deciding whether to provide all or part of the coverage requested and determining the applicable premium.
Underwriting expenses The aggregate of policy acquisition costs, excluding commissions, and the portion of administrative, general and other expenses attributable to underwriting operations.
Underwriting result The amount of profit or loss from insurance activities exclusive of net investment income and capital gains or losses.
Underwriting year The year in which the contract of insurance commenced or was underwritten. Unearned premium The portion of a premium representing the unexpired portion of the contract term
as of a certain date.Volume weighted average price (VWAP)
A methodology used for determining the share price applicable to dividend and other share-related transactions.
172
Designed and produced by ArmstrongQ

Contents
QBE Insurance Group LimitedLevel 27, 8 Chifley Square, Sydney NSW 2000 Australia
telephone +61 2 9375 4444 www.qbe.com


![QBE at a glance UK · QBE Insurance Group Limited A– [negative] A– [negative] bbb [negative] QBE Insurance (Europe) Limited A– [negative] a [negative] QBE Re (Europe) Limited](https://static.documents.pub/doc/80x56/5fa8e28b58047158406a3b4f/qbe-at-a-glance-uk-qbe-insurance-group-limited-aa-negative-aa-negative-bbb.jpg)

