12
702-267-5900 cityofhenderson.com/utility-services 2020 WATER QUALITY REPORT

702-267-5900 cityofhenderson.com/utility-services
2020
WATERQUALITYREPORT

2020 Water Qual i ty Report | C i ty o f Henderson2
Why You are Receiving a Water Quality ReportThe City of Henderson’s 2020 Water Quality Report provides you with detailed information about your drinking water. Drinking water quality varies from city to city, depending on the condition of the source water from which it is drawn and the treatment it receives. Henderson residents and businesses enjoy some of the highest quality drinking water in the nation. Your drinking water not only comes from a safe and high quality source, the Colorado River, but also goes through a multiple-step treatment process and thousands of laboratory tests before ever reaching your tap. The City of Henderson is required by the Environmental Protection Agency to provide the information contained in this report to each and every Henderson resident and business, so that you may be better informed about your drinking water. You may contact the City of Henderson Department of Utility Services’ Customer Care Center at 702-267-5900 or visitcityofhenderson.com/utility-services for additional information about your drinking water.
How Your Drinking Water is Treated The City of Henderson operates a water treatment plant that supplies approximately 15 percent of the community’s drinking water. The remaining water is supplied by the Southern Nevada Water Authority, from either the Alfred Merritt Smith or River Mountains Water Treatment Facility, and is delivered to your home or business by the City of Henderson. All three facilities treat the water to meet extremely high standards using a sophisticated filtration and disinfection process. This report contains the results of water quality monitoring, sampling and analysis from all three water treatment facilities, and from Henderson’s water distribution system, for the year 2019. All regulated contaminants were within safe and allowable limits.

Ci ty o f Henderson | 2020 Water Qual i ty Report 3
Assessment of Your Water SourceThe federal Safe Drinking Water Act was amended in 1996 and requires states to develop and implement source water assessment programs to analyze existing and potential threats to the quality of public drinking water throughout the state. A summary of the City of Henderson’s susceptibility to potential sources of contamination was initially provided by the State of Nevada in 2003. The summary of this source water assessment may be accessed online at cityofhenderson.com/utility-services. Information pertaining to the findings of the source water assessment is available for viewing in person at Henderson City Hall, 240 S. Water St., Henderson, NV 89015. Please call 702-267-2500 for an appointment. Additional information about the Nevada Source Water Assessment Program may be found at ndep.nv.gov.
Information About COVID-19The virus that causes COVID-19 has not been detected in drinking water and there is no indication that transmission can occur via drinking water supplies. Conventional water treatment methods that use filtration and disinfection, such as those used by the City of Henderson and Southern Nevada Water System, have been tested and shown to remove or inactivate the virus that causes COVID-19.

2020 Water Qual i ty Report | C i ty o f Henderson4
Where your Water Comes FromAll of the water we use in the City of Henderson comes from the Colorado River. It begins as snow in the Colorado Rockies, then melts and travels down the Colorado River, through the Grand Canyon and into Lake Mead. As the water makes its journey through canyons, rivers and reservoirs, it picks up natural elements like calcium and magnesium that give our water its hardness and taste.

Ci ty o f Henderson | 2020 Water Qual i ty Report 5
NevadaUtah
Colorado
Arizona NewMexico
California
Colorad
o River
Southern Nevada Water ResourcesIn 1922 the Colorado River Compact divided the water supply of the Colorado River amongst seven adjacent states. Four upper states – Colorado (52 percent), Utah (23 percent), Wyoming (14 percent), and New Mexico (11 percent) – received 7.5 million acre-feet (maf) to share. Three lower states – California (59 percent), Arizona (37 percent), and Nevada (4 percent) – also received 7.5 maf to share. The total apportionment to all states is 15 maf.
Nevada is limited to our annual Colorado River apportionment of 0.3 maf to be drawn from Lake Mead each year.
Nearly 90 percent of all the water supplied to Southern Nevada communities comes from Lake Mead via the Colorado River. The remaining 10 percent comes from a deep groundwater aquifer beneath the Las Vegas Valley.

2020 Water Qual i ty Report | C i ty o f Henderson6
WateringGroup
WINTERNovember - February
SPRING/FALLMarch-April / September-October
SummerMay - August
A Monday Monday, Wednesday, Friday Monday - Saturday
B Tuesday Tuesday, Thursday, Saturday Monday - Saturday
C Wednesday Monday, Wednesday, Friday Monday - Saturday
D Thursday Tuesday, Thursday, Saturday Monday - Saturday
E Friday Monday, Wednesday, Friday Monday - Saturday
• Watering on Sunday is prohibited all year.
• Spray irrigation is prohibited 11am-7pm during the summer. Irrigate during the day in winter to prevent water freezing on sidewalks.
• Car washing at your home is limited to one day a week with the use of a positive shut-off nozzle.
• Draining a swimming pool or hot tub into the street is prohibited.
Text CONSERVE to 74121 for text message reminders when it’s time to change your irrigation clock. Text HELP for assistance and STOP to cancel.
Watering Schedule
Water ConservationSouthern Nevada is one of the driest communities in the country. Many years of record drought have shown us just how vulnerable our limited water resources can be. We must all work together to preserve our community’s water supply so we can meet our future water demands.
Almost 70 percent of our water supply is used outdoors to irrigate landscaping. The most effective impact you can make on water conservation is to reduce outdoor use. One way is to install desert landscaping, which requires 55 gallons less water per square foot per year than grass.
The City’s Department of Utility Services has always done its share of being “green” and set an example when it comes to conservation. The City of Henderson’s water reclamation facilities supply highly treated wastewater to golf courses throughout Henderson. By providing this reclaimed water to the golf courses, no additional water from Lake Mead has to be used.

Ci ty o f Henderson | 2020 Water Qual i ty Report 7
Lead and CopperThe City of Henderson’s public water system does not have lead pipes or service laterals. Some Henderson homes built prior to 1989 may have copper pipes with lead solder joints, after which it was banned in residential construction. Lead and copper in drinking water is mainly due to the corrosion of customer household plumbing systems that contain these metals.
Our community’s water comes from the Colorado River and it contains naturally occurring minerals that make it “hard” and less corrosive to piping materials. Additionally, a corrosion inhibitor called zinc orthophosphate is added to the water to help prevent metal that may be present in plumbing fixtures from leaching into the drinking water.
The Department of Utility Services conducts a lead and copper testing program every three years on tap water samples collected from participating residences that meet the sampling criteria. The results of this testing have remained below the limits set by the Environment Protection Agency since the test program began. The last testing period was in 2019.
While your water meets the EPA’s standard for lead, if present at elevated levels this contaminantcan cause serious health problems, especially for pregnant women and young children. Lead indrinking water is primarily from materials and components associated with service lines and homeplumbing. Your municipal water system is responsible for providing high quality drinking water, but cannot control the variety of materials used in plumbing components. When your water has been sitting for several hours, you can minimize the potential for lead exposure by flushing your tap for 30 seconds to 2 minutes before using water for drinking or cooking. If you are concerned about lead in your drinking water, you may wish to have your water tested. Information on lead in drinking water, testing methods, and steps you can take to minimize exposure is available from the Safe Drinking Water Hotline or at epa.gov/safewater/lead.

Henderson UCMR 4 Test Results: In compliance with the Unregulated Contaminant Monitoring
Rule 4 (UCMR 4), these results represent levels of monitored contaminants, based on 2018 data. 2019
monitoring was only conducted for cynotoxins, which were all non-detect. (Must report data for
five years from collection.)
DISTRIBUTION SYSTEM HENDERSON WATERTREATMENT PLANT
HENDERSON RAW WATER
UNREGULATED CONTAMINANTS UNIT
MCL (EPA
LIMIT)
MCLG (EPA
GOAL)MINIMUM MAXIMUM AVERAGE MINIMUM MAXIMUM AVERAGE MINIMUM MAXIMUM AVERAGE
POSSIBLE SOURCESOF CONTAMINATION
Bromide ppb N/A N/A N/A N/A N/A N/A N/A N/A 20 80 58 Naturally occurring ion
HAA 5 (2) ppb 60 N/A (3) 11 30 19 N/A N/A N/A N/A N/A N/A By-product of drinking-water disinfection
HAA 6 Br ppb N/A N/A 12 27 18 N/A N/A N/A N/A N/A N/A By-product of drinking-water disinfection
HAA 9 ppb N/A N/A 21 53 34 N/A N/A N/A N/A N/A N/A By-product of drinking-water disinfection
Total Organic Carbon ppb N/A N/A N/A N/A N/A N/A N/A N/A 2720 3400 3105 Amount of carbon contained in organic
compounds
Manganese ppb N/A N/A N/A N/A N/A 0.53 0.53 0.53 N/A N/A N/A Erosion of natural deposits
(1) Monitoring for each of the monitored contaminants in the UCMR 4 table was conducted to comply with the Unregulated Contaminant Monitoring Rule 4 (UCMR 4) set by the U.S. EPA Safe Drinking Water Act. Per the rule, monitoring is conducted on City of Henderson’s raw water, finished water, and distribution system water. Unregulated contaminant monitoring helps the U.S. EPA to determine where certain contaminants occur and whether the Agency should consider regulating those contaminants in the future. With the exception of HAA 5, these contaminants have no MCLs or MCLGs. (2) Results for this regulated contaminant in the UCMR 4 table are different from the results in the Water Quality Test Results table because UCMR 4 monitoring required separate locations and monitoring periods than those used for HAA 5 compliance monitoring. Monitoring for the HAA 5 compounds, in conjunction with UCMR 4 Assessment Monitoring, is required under the authority provided in Section 1445(a)(1)(A) of the SDWA. (3) No collective MCLG but there are MCLGs for some of the individual contaminants. Haloacetic Acids: dichloroacetic acid (0), trichloroacetic acid (300 ppb).
What Your Drinking Water May ContainThere is no such thing as naturally pure water. In nature, all water contains some impurities, also known as contaminants. A contaminant is any substance other than H20. Your drinking water, including bottled water, may reasonably be expected to contain at least small amounts of some contaminants.The presence of contaminants does not necessarily indicate that water poses a health risk. Sources of drinking water include rivers, lakes, streams, ponds, reservoirs, springs, and wells. As water travels over the surface of the land or through the ground, it dissolves naturally occurring minerals, and can collect substances from the presence of animals or human activity. Contaminants that may be present in source water include:
Microbial Contaminants, such as viruses and bacteria, which may come from septic systems, agricultural livestock operations, wastewater treatment plants and wildlife.
Inorganic Contaminants, such as salts and metals, which can be naturally occurring or result from urban storm water runoff, industrial or domestic wastewater discharges, oil and gas production, mining or farming.
Pesticides and Herbicides, which may come from a variety of sources such as agriculture, urban stormwater runoff, and residential uses.
Organic Chemical Contaminants, including synthetic and volatile organic chemicals, which are byproducts of industrial processes and petroleum production, and can also come from gas stations, urban stormwater runoff, and septic systems.
Radioactive Contaminants, which can be naturally occurring or be the result of oil and gas production and mining activities.

Important Health InformationPeople who have HIV/AIDS, are undergoing chemotherapy or organ transplant, take steroids, or for another reason have a weakened immune system may be more vulnerable to contaminants in their drinking water. These immunocompromised individuals should talk to their health care provider about special precautions they may need to take with their drinking water. For more information contact the Environmental Protection Agency’s Safe Drinking Water Hotline at 800-426-4791.
Cryptosporidium, a naturally occurring organism found in many source waters around the world, can cause gastrointestinal distress. The City of Henderson and the Southern Nevada Water Authority test for Cryptosporidium in both source and treated water supplies, and employ proven disinfection processes to eliminate the health threat from your drinking water. The Environmental Protection Agency and Centers for Disease Control and Prevention have jointly published guidelines on how to lessen the risk from Cryptosporidium and other microbial contaminants. This document is available online at epa.gov.
The following water quality analysis specifies what regulated contaminants were found in your drinking water; the levels at which they were found and how those levels compare to prescribed limits for those contaminants; and the likely source of each contaminant.
How We Know Your Drinking Water Is SafeTo ensure that your drinking water is safe, the Environmental Protection Agency and Nevada Division of Environmental Protection prescribe regulations which limit the levels of certain contaminants that may be present.
Your drinking water is monitored for over 90 regulated contaminants through thousands of tests conducted on water samples collected from all three water treatment facilities, and from throughout Henderson’s water distribution system. Only those regulated contaminants that were detected are included in the water quality analysis. All regulated contaminants that were detected are below the prescribed limits or their averages.
Your water is also monitored for many unregulated contaminants.
Unregulated contaminants are those that don’t yet have a drinking water standard set by the EPA. The purpose of monitoring for these contaminants is to help the EPA decide whether the contaminants should have a standard. If you would like additional information on the next round of unregulated sampling, view the American Water Works Association’s fact sheet at drinktap.org.
Henderson UCMR 4 Test Results: In compliance with the Unregulated Contaminant Monitoring
Rule 4 (UCMR 4), these results represent levels of monitored contaminants, based on 2018 data. 2019
monitoring was only conducted for cynotoxins, which were all non-detect. (Must report data for
five years from collection.)
DISTRIBUTION SYSTEM HENDERSON WATERTREATMENT PLANT
HENDERSON RAW WATER
UNREGULATED CONTAMINANTS UNIT
MCL (EPA
LIMIT)
MCLG (EPA
GOAL)MINIMUM MAXIMUM AVERAGE MINIMUM MAXIMUM AVERAGE MINIMUM MAXIMUM AVERAGE
POSSIBLE SOURCESOF CONTAMINATION
Bromide ppb N/A N/A N/A N/A N/A N/A N/A N/A 20 80 58 Naturally occurring ion
HAA 5 (2) ppb 60 N/A (3) 11 30 19 N/A N/A N/A N/A N/A N/A By-product of drinking-water disinfection
HAA 6 Br ppb N/A N/A 12 27 18 N/A N/A N/A N/A N/A N/A By-product of drinking-water disinfection
HAA 9 ppb N/A N/A 21 53 34 N/A N/A N/A N/A N/A N/A By-product of drinking-water disinfection
Total Organic Carbon ppb N/A N/A N/A N/A N/A N/A N/A N/A 2720 3400 3105 Amount of carbon contained in organic
compounds
Manganese ppb N/A N/A N/A N/A N/A 0.53 0.53 0.53 N/A N/A N/A Erosion of natural deposits

2020 Water Qual i ty Report | C i ty o f Henderson10
Water Quality Analysis
REGULATED CONTAMINANTS UNIT MCL
(EPA Limit)MCLG
(EPA Goal)CITY OF HENDERSON
DISTRIBUTION SYSTEM (1)CITY OF HENDERSON WATER
TREATMENT FACILITY (1)ALFRED MERRITT SMITH WATER
TREATMENT FACILITY (1)RIVER MOUNTAINS WATER
TREATMENT FACILITY (1) POSSIBLE SOURCES OF CONTAMINATION
MINIMUM MAXIMUM AVERAGE MINIMUM MAXIMUM AVERAGE MINIMUM MAXIMUM AVERAGE MINIMUM MAXIMUM AVERAGE
Alpha Particles pCi/L 15 0
Entry Point Monitoring Only
N/D N/D N/D N/D N/D N/D 4 4 4Erosion of natural deposits of certain minerals that are radioactive and may emit a form of radiation known as alpha radiation
Arsenic ppb 10 0 1 1 1 1 2 1 2 2 2 Erosion of natural deposits
Barium ppm 2 2 0.1 0.1 0.1 0.1 0.1 0.1 0.1 0.1 0.1 Erosion of natural deposits; discharge from metal refineries: discharge of drilling wastes
Bromate ppb 10 0 N/A N/A N/A 1 3 3(2) 3 5 5(2) By-product of drinking-water disinfection with ozone
Copper (3) ppm"1.3(4)
(Action Level)"
1.3 0.05 1.28"0.81
(90th% value)"
Distribution System Monitoring Only Corrosion of household plumbing systems; erosion of natural deposits
Fluoride ppm 4.0 4.0 0.6 0.8 0.7 0.7 0.8 0.7 0.7 0.8 0.7 0.3 0.7 0.8 Erosion of natural deposits; water additive(6)
Free Chlorine Residual ppm "4.0(6) (MRDL)"
"4.0(6) (MRDLG)" N/D 1.6 0.9(2) Distribution System Monitoring Only Water additive used to control microbes
Haloacetic Acids ppb 60 N/A(7) 11 33 LRAA(8) 26
Distribution System Monitoring Only
By-product of drinking-water disinfection
Lead (3) ppb"15(4)
(Action Level)"
0 N/D 3.7"1.6
(90th% value)"
Corrosion of household plumbing systems; erosion of natural deposits
Nitrate (as Nitrogen) ppm 10 10Entry Point Monitoring Only
0.4 0.6 0.5 0.4 0.5 0.4 0.4 0.5 0.4 Runoff from fertilizer use; leaching from septic tanks, sewage; erosion of natural deposits
Selenium ppb 50 50 2 3 2 2 2 2 2 2 2 Discharge from petroleum refineries; erosion of natural deposits; discharge from mines
Total Coliforms
percent positive
per month
5% 0 0% 0.5% 0.1%Distribution System Monitoring Only
Naturally present in the environment
Total Trihalomethanes ppb 80 N/A(7) 25 69 LRAA(8) 73 By-product of drinking-water disinfection
Turbidity NTU95% of the samples
<0.3 NTU(9)N/A Treatment Facility Monitoring Only
100% of the samples were below 0.3 NTU. The maximum NTU was 0.28
on August 11, 2019.
100% of the samples were below 0.3 NTU. The maximum NTU was 0.15
on October 11, 2019.
100% of the samples were below 0.3 NTU. The maximum NTU was 0.06
on June 5, 2019.Soil runoff
Uranium ppb 30 0 Entry Point Monitoring Only 4 4 4 4 4 4 4 4 4 Erosion of natural deposits
FOOTNOTES: (1) Some Safe Drinking Water Act (SDWA) regulations require monitoring from the distribution system, while other SDWA regulations require monitoring at the entry points to the distribution system. (Alfred Merritt Smith WTF, River Mountains WTF, and Henderson WTF).
(2) This value is the highest running annual average reported in 2019. Reports are filed quarterly.
(3) Samples are from the City of Henderson customers’ taps.
(4) Lead and copper are regulated by a Treatment Technique (TT) that requires systems to control the corrosiveness of their water. If more than 10% of tap-water samples exceed the action level, water systems must take additional steps. The action level for copper is 1.3 ppm, for lead it is 15 ppb.
(5) By state law, the Southern Nevada Water Authority (SNWA) and the City of Henderson are required to fluoridate the municipal water supply.
(6) Chlorine is regulated by MRDL, with the goal stated as a MRDLG.
(7) No collective MCLG but there are MCLGs for some of the individual contaminants. Haloacetic Acids: dichloroacetic acid (0), trichloroacetic acid (300 ppb); Trihalomethanes: bromodichloromethane (0), bromoform (0), dibromochloromethane (60 ppb).
(8) This value is the highest locational running annual average reported in 2019. Reports are filed quarterly.
(9) Turbidity is regulated by a Treatment Technique (TT) requirement - 95% of all samples taken after filtration each month must be less than 0.3 NTU. Maximum turbidity cannot exceed 1.0 NTU.
Ci ty o f Henderson | 2020 Water Qual i ty Report 11
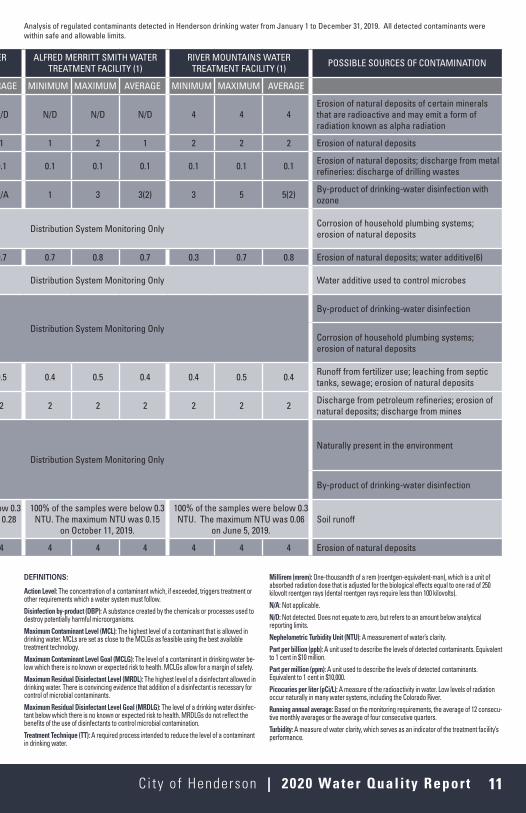
DEFINITIONS:
Action Level: The concentration of a contaminant which, if exceeded, triggers treatment or other requirements which a water system must follow.Disinfection by-product (DBP): A substance created by the chemicals or processes used to destroy potentially harmful microorganisms.Maximum Contaminant Level (MCL): The highest level of a contaminant that is allowed in drinking water. MCLs are set as close to the MCLGs as feasible using the best available treatment technology.Maximum Contaminant Level Goal (MCLG): The level of a contaminant in drinking water be-low which there is no known or expected risk to health. MCLGs allow for a margin of safety.Maximum Residual Disinfectant Level (MRDL): The highest level of a disinfectant allowed in drinking water. There is convincing evidence that addition of a disinfectant is necessary for control of microbial contaminants.Maximum Residual Disinfectant Level Goal (MRDLG): The level of a drinking water disinfec-tant below which there is no known or expected risk to health. MRDLGs do not reflect the benefits of the use of disinfectants to control microbial contamination.Treatment Technique (TT): A required process intended to reduce the level of a contaminant in drinking water.
Millirem (mrem): One-thousandth of a rem (roentgen-equivalent-man), which is a unit of absorbed radiation dose that is adjusted for the biological effects equal to one rad of 250 kilovolt roentgen rays (dental roentgen rays require less than 100 kilovolts).N/A: Not applicable.N/D: Not detected. Does not equate to zero, but refers to an amount below analytical reporting limits.Nephelometric Turbidity Unit (NTU): A measurement of water’s clarity.Part per billion (ppb): A unit used to describe the levels of detected contaminants. Equivalent to 1 cent in $10 million.Part per million (ppm): A unit used to describe the levels of detected contaminants. Equivalent to 1 cent in $10,000.Picocuries per liter (pCi/L): A measure of the radioactivity in water. Low levels of radiation occur naturally in many water systems, including the Colorado River.Running annual average: Based on the monitoring requirements, the average of 12 consecu-tive monthly averages or the average of four consecutive quarters.Turbidity: A measure of water clarity, which serves as an indicator of the treatment facility’s performance.
REGULATED CONTAMINANTS UNIT MCL
(EPA Limit)MCLG
(EPA Goal)CITY OF HENDERSON
DISTRIBUTION SYSTEM (1)CITY OF HENDERSON WATER
TREATMENT FACILITY (1)ALFRED MERRITT SMITH WATER
TREATMENT FACILITY (1)RIVER MOUNTAINS WATER
TREATMENT FACILITY (1) POSSIBLE SOURCES OF CONTAMINATION
MINIMUM MAXIMUM AVERAGE MINIMUM MAXIMUM AVERAGE MINIMUM MAXIMUM AVERAGE MINIMUM MAXIMUM AVERAGE
Alpha Particles pCi/L 15 0
Entry Point Monitoring Only
N/D N/D N/D N/D N/D N/D 4 4 4Erosion of natural deposits of certain minerals that are radioactive and may emit a form of radiation known as alpha radiation
Arsenic ppb 10 0 1 1 1 1 2 1 2 2 2 Erosion of natural deposits
Barium ppm 2 2 0.1 0.1 0.1 0.1 0.1 0.1 0.1 0.1 0.1 Erosion of natural deposits; discharge from metal refineries: discharge of drilling wastes
Bromate ppb 10 0 N/A N/A N/A 1 3 3(2) 3 5 5(2) By-product of drinking-water disinfection with ozone
Copper (3) ppm"1.3(4)
(Action Level)"
1.3 0.05 1.28"0.81
(90th% value)"
Distribution System Monitoring Only Corrosion of household plumbing systems; erosion of natural deposits
Fluoride ppm 4.0 4.0 0.6 0.8 0.7 0.7 0.8 0.7 0.7 0.8 0.7 0.3 0.7 0.8 Erosion of natural deposits; water additive(6)
Free Chlorine Residual ppm "4.0(6) (MRDL)"
"4.0(6) (MRDLG)" N/D 1.6 0.9(2) Distribution System Monitoring Only Water additive used to control microbes
Haloacetic Acids ppb 60 N/A(7) 11 33 LRAA(8) 26
Distribution System Monitoring Only
By-product of drinking-water disinfection
Lead (3) ppb"15(4)
(Action Level)"
0 N/D 3.7"1.6
(90th% value)"
Corrosion of household plumbing systems; erosion of natural deposits
Nitrate (as Nitrogen) ppm 10 10Entry Point Monitoring Only
0.4 0.6 0.5 0.4 0.5 0.4 0.4 0.5 0.4 Runoff from fertilizer use; leaching from septic tanks, sewage; erosion of natural deposits
Selenium ppb 50 50 2 3 2 2 2 2 2 2 2 Discharge from petroleum refineries; erosion of natural deposits; discharge from mines
Total Coliforms
percent positive
per month
5% 0 0% 0.5% 0.1%Distribution System Monitoring Only
Naturally present in the environment
Total Trihalomethanes ppb 80 N/A(7) 25 69 LRAA(8) 73 By-product of drinking-water disinfection
Turbidity NTU95% of the samples
<0.3 NTU(9)N/A Treatment Facility Monitoring Only
100% of the samples were below 0.3 NTU. The maximum NTU was 0.28
on August 11, 2019.
100% of the samples were below 0.3 NTU. The maximum NTU was 0.15
on October 11, 2019.
100% of the samples were below 0.3 NTU. The maximum NTU was 0.06
on June 5, 2019.Soil runoff
Uranium ppb 30 0 Entry Point Monitoring Only 4 4 4 4 4 4 4 4 4 Erosion of natural deposits
Analysis of regulated contaminants detected in Henderson drinking water from January 1 to December 31, 2019. All detected contaminants were within safe and allowable limits.

City of Henderson240 S. Water St.Henderson, NV 89015
Debra March, Mayor
CITY COUNCILMichelle RomeroDan ShawJohn F. MarzDan H. Stewart
Richard A. Derrick, City Manager Priscilla Howell, Director of Utility Services
DEPARTMENT OF UTILITY SERVICESCustomer Care Center702-267-5900cityofhenderson.com/utility-services
Este reporte contiene informacion importante sobre la calidad del agua en su comunidad, Traduzcalo o hable con alguin que lo entiende bien, Si necisita ayuda cone esto, Ilame nuestro Centro del Cuidado del cliente en 702-267-5900 para la ayuda.


