67
WORKFORCE INFORMATION REPORT 2019-20
WORKFORCE INFORMATION REPORT 2019-20

Workforce Information Report 2019-20
© 2020 Government of South Australia Public Page 2 of 67
Workforce Information Report The Workforce Information Report 2019-20 has been prepared by the Office of the Commissioner for
Public Sector Employment. For any further information:
• Email: [email protected]
• Phone: 1800 317 333
• Mailing address: GPO Box 1045, Adelaide SA 5001
• Street address: Ground Floor, State Administration Centre, 200 Victoria Square
(Tarndanyangga), Adelaide SA 5000
• Website: publicsector.sa.gov.au
© 2020 Government of South Australia. All rights reserved.
Further copies of this and past reports are available at:
https://www.publicsector.sa.gov.au/about/Our-Work/Reporting/Workforce-Information
Use of the contents of this report should acknowledge the source and where applicable provide a
page and/or paragraph reference. Changes or additions to any data or references should be clearly
acknowledged.

Workforce Information Report 2019-20
© 2020 Government of South Australia Public Page 3 of 67
Foreword I am pleased to present the official record of the size and composition of the South Australian Public
Sector workforce, as at 30 June 2020, in the Workforce Information Report 2019-20.
The report, which is collated by my Office, the Office of the Commissioner for Public Sector
Employment, presents workforce data from all South Australian Public Sector agencies as described
in Section 19 of the Public Sector Act 2009 (the Act).
The report provides evidence for effective workforce policy and strategy development across the
sector. It helps to facilitate transparent, accountable governance to demonstrate how the sector
works collaboratively as one government, promotes diversity, and supports our objectives to be an
employer of choice that positively serves the community.
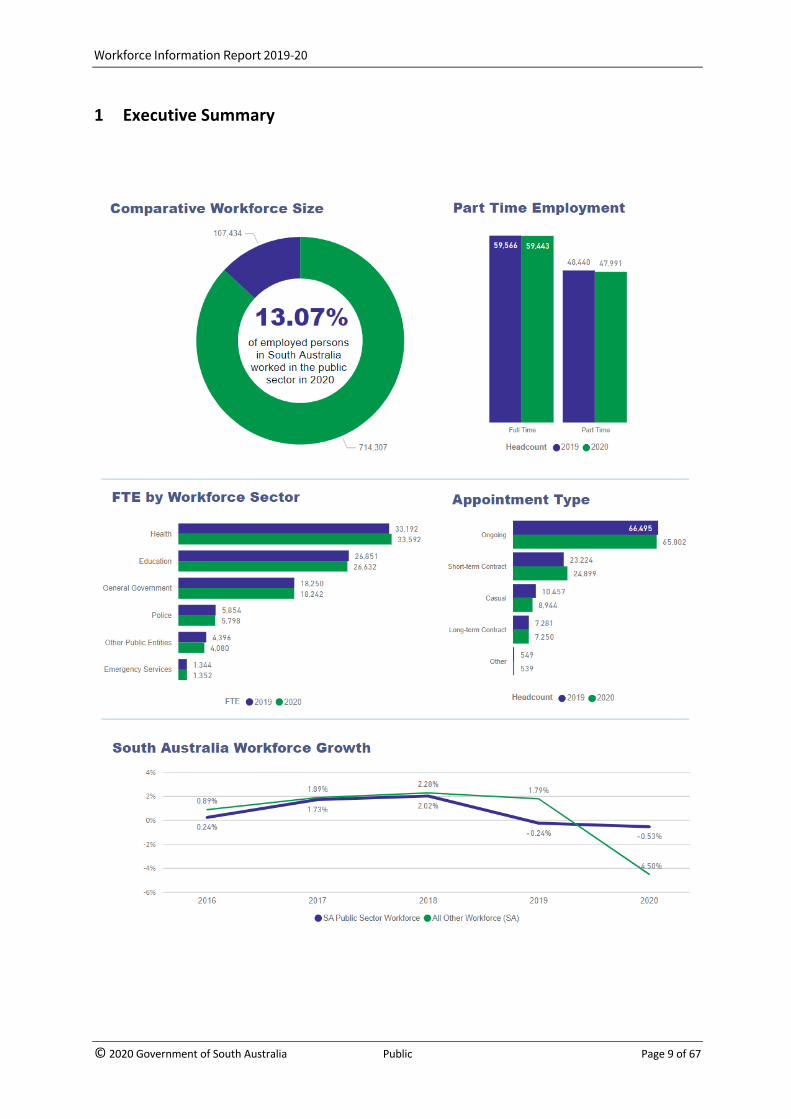
The size of the public sector workforce decreased slightly during the 2019-20 financial year. Full time
equivalent (FTE), including non-budget entities, reduced by 191 (-0.21 per cent) to 89,696 and the
number of persons reduced by 572 (-0.53 per cent) to 107,434, as at 30 June 2020.
By comparison, the number of persons in the South Australian workforce (excluding public sector)
decreased 4.91 per cent, which may be as a result of the Coronavirus Disease 2019 (COVID-19)
pandemic.
COVID-19 has significantly impacted casual public sector employees during 2019-20, with a reduction
of 14.47 per cent in their numbers, as government employers with a large casual workforce paused
or modified services to the public.
As at June 2020, public sector comprised of 61.25 per cent ongoing positions and 38.75 per cent
contract, casual or other types of employment. This represents a 1.04 per cent reduction in ongoing
employment, a 0.43 per cent reduction in long term contracts, and a 7.21 per cent increase in short
term contracts compared to June 2019.
Public sector FTE categorised as providing ‘frontline’ services increased by 1,112 (1.79 per cent) and
‘back office’ FTE decreased by 987 (-4.21 per cent) as at 30 June 2020. Workforce growth was
recorded in emergency services, medical officers and nurses. It is unclear whether this increase is
solely because of COVID-19; as a result of the pandemic, this report also reflects the effort of many
agencies to support more accurate measurements of frontline employees.
The number of executives increased by 50 (3.77 per cent) across the workforce between June 2019
and June 2020. Overall, executives comprised of 1.28 per cent of the public sector workforce1.
I am very pleased to report that the public sector has made improvements in a number of key
diversity areas. It continues to set new records in Aboriginal employment. Aboriginal employees
numbered 2,291, representing 2.13 per cent of the public sector workforce as at June 2020.
Aboriginal employment in the public sector (2.13 per cent) has continued to grow whilst the public
sector workforce has declined -0.53 per cent.
The number of employees with a declared disability, whilst still low compared to community
representation, has continued to increase, with 1,482 employees with a declared disability,
1 Executive FTE and headcount data provided in this Report complies with the South Australian Government’s standard definition for workforce reporting. Minor variances may exist between this report and Executive FTE and headcount reported by an agency. OCPSE will continue to work with agencies to review definitions to ensure standardisation across the sector.

Workforce Information Report 2019-20
© 2020 Government of South Australia Public Page 4 of 67
representing 1.38 per cent of the workforce at June 2020. This is an overall increase of 48 employees
compared to June 2019.
The number of females in executive positions has also continued to rise with 727 female executives
compared to 651 male executives. The proportion of female executives has grown from 51.20 per
cent in June 2019 to 52.76 per cent.
The workforce data is reported here on behalf of all South Australian Public Sector agencies.
Throughout the year, agencies continuously verify the accuracy and completeness of their workforce
data within the collection framework and definitions established by my office. This ensures the
accuracy and completeness of the data I publish on their behalf, within this report.
I thank all agencies for their cooperation in the preparation of this report.
My office will continue to work with agencies to ensure continuous improvement in how we collect
and report workforce data.
Additional data and alternative formats (including visual data dashboards) are available on my
office’s website.
Erma Ranieri
Commissioner for Public Sector Employment

Workforce Information Report 2019-20
© 2020 Government of South Australia Public Page 5 of 67
Table of contents 1 Executive Summary ...................................................................................................... 9
2 Full time equivalents and headcount .......................................................................... 12
2.1 Overview ............................................................................................................................................... 12
2.2 Summary ............................................................................................................................................... 12
2.3 South Australian Public Sector employment, June 2019 and June 2020 ............................................... 12
2.3.1 Total Public Sector ....................................................................................................................................... 13
2.3.2 General Government Sector ........................................................................................................................ 13
2.3.3 Non-budget Entity ........................................................................................................................................ 15
2.3.4 Public Financial Corporations Sector ........................................................................................................... 15
2.3.5 Public Non-Financial Corporations Sector ................................................................................................... 15
3 Comparative workforce size ....................................................................................... 16
3.1 Summary ............................................................................................................................................... 16
3.1.1 SA Workforce Growth .................................................................................................................................. 16
3.1.2 SA Workforce and Population Growth (Last 5 Years) .................................................................................. 16
3.2 Public sector employees and South Australia population and employment information, June 2016 to June 2020 .......................................................................................................................................................... 17
4 Age and gender .......................................................................................................... 18
4.1 Employees in the South Australian Public Sector by age and gender, June 2020 ................................. 18
4.1.1 Total Public Sector ....................................................................................................................................... 18
4.1.2 General Government Sector ........................................................................................................................ 18
4.1.3 Non-budget Entity ........................................................................................................................................ 19
4.1.4 Public Financial Corporations Sector ........................................................................................................... 19
4.1.5 Public Non-Financial Corporations Sector ................................................................................................... 19
5 Employee types .......................................................................................................... 20
5.1 Employees in the South Australian Public Sector by appointment type, June 2016 to June 2020 ....... 20
5.1.1 Total Public Sector ....................................................................................................................................... 20
5.1.2 General Government Sector ........................................................................................................................ 20
5.1.3 Non-budget Entity ........................................................................................................................................ 20
5.1.4 Public Financial Corporations Sector ........................................................................................................... 21
5.1.5 Public Non-Financial Corporations Sector ................................................................................................... 21
5.2 Frontline and back office ....................................................................................................................... 21
5.2.1 General Government sector frontline FTE by employee type, June 2019 to June 2020 .............................. 22
5.2.2 General Government sector back office FTE by employee type, June 2019 to June 2020 .......................... 22
5.2.3 Employees in the South Australian Public Sector by employee type and appointment type, June 2020 ... 23
5.3 Occupations ........................................................................................................................................... 24
5.3.1 Employees in the South Australian Public Sector by occupation, June 2020 ............................................... 24
6 Diversity and inclusion ................................................................................................ 29
6.1 Aboriginal employees in the South Australian Public Sector, June 2016 to June 2020 ......................... 29
6.1.1 Total Public Sector ....................................................................................................................................... 29
Workforce Information Report 2019-20
© 2020 Government of South Australia Public Page 6 of 67
6.1.2 General Government Sector ........................................................................................................................ 29
6.1.3 Non-budget Entity ........................................................................................................................................ 29
6.1.4 Public Financial Corporations Sector ........................................................................................................... 29
6.1.5 Public Non-Financial Corporations Sector ................................................................................................... 30
6.2 Employees with a declared disability .................................................................................................... 31
6.2.1 Employees in the South Australian Public Sector with a declared disability, June 2016 to June 2020 ........ 31
6.2.2 Percentage of the South Australian Public Sector with a declared disability, June 2016 to June 2020 ....... 31
6.3 Part time employees in the South Australian Public Sector, June 2016 to June 2020 .......................... 32
6.3.1 Total Public Sector ....................................................................................................................................... 32
6.3.2 General Government Sector ........................................................................................................................ 32
6.3.3 Non-budget Entity ........................................................................................................................................ 32
6.3.4 Public Financial Corporations Sector ........................................................................................................... 32
6.3.5 Public Non-Financial Corporations Sector ................................................................................................... 32
7 Executives .................................................................................................................. 33
7.1 Executives in the South Australian Public Sector, June 2016 to June 2020 ........................................... 33
7.1.1 Total Public Sector ....................................................................................................................................... 33
7.1.2 General Government Sector ........................................................................................................................ 33
7.1.3 Non-budget Entity ........................................................................................................................................ 33
7.1.4 Public Financial Corporations Sector ........................................................................................................... 33
7.1.5 Public Non-Financial Corporations Sector ................................................................................................... 34
8 Graduates, trainees, and apprentices ......................................................................... 34
8.1 Skilling SA Public Sector Project ............................................................................................................ 34
8.1.1 Skilling SA commencements by headcount, between 1 July 2019 and 30 June 2020 ................................. 34
9 Length of service ........................................................................................................ 35
9.1 Length of service in the public sector .................................................................................................... 35
9.1.1 Summary of the South Australian Public Sector by length of service, as at June 2020 ............................... 35
9.1.2 Employees in the South Australian Public Sector by length of service, as at June 2020 ............................. 36
9.2 Length of service in an agency .............................................................................................................. 36
9.2.1 Employees length of service at current agency, as at June 2020 ................................................................. 36
10 Salaries ....................................................................................................................... 37
10.1 Summary of employees in the South Australian Public Sector by salary and gender, June 2020 ......... 37
10.2 Employees in the South Australian Public Sector by salary and gender, June 2020 ............................. 38
10.2.1 Total Public Sector ....................................................................................................................................... 38
10.2.2 General Government Sector ........................................................................................................................ 38
10.2.3 Non-budget Entity ........................................................................................................................................ 38
10.2.4 Public Financial Corporations Sector ........................................................................................................... 38
10.2.5 Public Non-Financial Corporations Sector ................................................................................................... 39
11 Sick leave/carer’s leave .............................................................................................. 40
11.1.1 Average sick leave/carer’s leave days (paid and unpaid) per FTE, June 2019 to June 2020 ........................ 40
12 Employee movement .................................................................................................. 43
12.1 Summary ............................................................................................................................................... 43
12.1.1 Summary of all agency recruitments and separations between 1 July 2019 and 30 June 2020 .................. 43
12.2 Recruitment ........................................................................................................................................... 43

Workforce Information Report 2019-20
© 2020 Government of South Australia Public Page 7 of 67
12.2.1 Employees recruited to a South Australian Public Sector organisation between 1 July 2019 and 30 June 2020 44
12.3 Separations ............................................................................................................................................ 44
12.3.1 Summary of employee separation by type .................................................................................................. 45
12.3.2 Employees separation between 1 July 2019 and 30 June 2020 ................................................................... 46
13 Summary of key information, by agency ..................................................................... 48
14 Appendix A: Explanation of SA Public Sector agencies ................................................ 52
14.1 General Government Sector .................................................................................................................. 52
14.2 Non-budget Entities .............................................................................................................................. 55
14.3 Public Financial Corporations Sector ..................................................................................................... 55
14.4 Public Non-Financial Corporations Sector ............................................................................................. 55
15 Appendix B: Explanation of terms ............................................................................... 57
15.1 Persons included in workforce reports .................................................................................................. 57
15.2 South Australian Public Sector .............................................................................................................. 58
15.3 Full Time Equivalent (FTE) ..................................................................................................................... 58
15.4 Average FTE Over Period ....................................................................................................................... 59
15.5 Employee type ....................................................................................................................................... 59
15.5.1 Children’s Services Act ................................................................................................................................. 59
15.5.2 Disability Services Officers ........................................................................................................................... 59
15.5.3 Education Act ............................................................................................................................................... 60
15.5.4 Emergency services ...................................................................................................................................... 60
15.5.5 Executives .................................................................................................................................................... 60
15.5.6 Medical officers ........................................................................................................................................... 61
15.5.7 Nurses .......................................................................................................................................................... 61
15.5.8 Other Acts and Awards ................................................................................................................................ 61
15.5.9 Police Act ..................................................................................................................................................... 61
15.5.10 Public Sector Act .......................................................................................................................................... 61
15.5.11 Public Sector Salaried Award ....................................................................................................................... 61
15.5.12 School Services Officers ............................................................................................................................... 62
15.5.13 TAFE SA Act .................................................................................................................................................. 62
15.5.14 Trainee, Apprenticeship and Graduate Entry Programs .............................................................................. 62
15.5.15 Weekly Paid Awards .................................................................................................................................... 62
15.6 Gender Reporting .................................................................................................................................. 62
15.7 Appointment type ................................................................................................................................. 62
15.7.1 Ongoing ........................................................................................................................................................ 62
15.7.2 Term Employment ....................................................................................................................................... 62
15.7.3 Short Term Contract .................................................................................................................................... 63
15.7.4 Long Term Contract ..................................................................................................................................... 63
15.7.5 Other ............................................................................................................................................................ 63
15.7.6 Casual ........................................................................................................................................................... 63
15.8 Employment status ................................................................................................................................ 64
15.9 Aboriginal Employees ............................................................................................................................ 64
15.10 Leave types ............................................................................................................................................ 64
15.10.1 Sick Leave ..................................................................................................................................................... 64
15.10.2 Family Carer’s Leave .................................................................................................................................... 64
15.10.3 Special Leave With Pay ................................................................................................................................ 64

Workforce Information Report 2019-20
© 2020 Government of South Australia Public Page 8 of 67
15.10.4 FTE Sick Days ................................................................................................................................................ 65
15.11 Separation and Recruitment ................................................................................................................. 65
15.12 Disability Reporting ............................................................................................................................... 65
15.13 Salary ..................................................................................................................................................... 66
15.13.1 Non Executives ............................................................................................................................................. 66
15.13.2 Executives .................................................................................................................................................... 66
15.14 Length of Service to Agency .................................................................................................................. 67
15.15 Length of Service to Public Sector ......................................................................................................... 67
Workforce Information Report 2019-20
© 2020 Government of South Australia Public Page 9 of 67
1 Executive Summary

Workforce Information Report 2019-20
© 2020 Government of South Australia Public Page 10 of 67

Workforce Information Report 2019-20
© 2020 Government of South Australia Public Page 11 of 67
Workforce Information Report 2019-20
© 2020 Government of South Australia Public Page 12 of 67
2 Full time equivalents and headcount
2.1 Overview
The South Australian Public Sector provides a vast range of services across many agencies. This
section highlights the overall full time equivalents (FTE) and headcount for each agency at June 2019
and June 2020.
Data in the Workforce Information Report 2019-20 is aligned with Department of Treasury and
Finance publications to provide a consistent presentation of the public sector in South Australia,
based on each agency’s status as a budget entity.
This Report provides information for agencies based on the following definitions:
• General Government Sector agencies cover the largest portion of government services and
are predominantly funded by taxpayers.
• Public Non-Financial Corporations (PNFC) and Public Financial Corporation (PFC) agencies are
categorised separately. PNFCs generate revenue through user charges and PFCs generally
provide intermediate financial services.
• Non-budget entities are covered by public sector employment conditions, but have minimal
or no State Budget funding.
Further explanation of South Australian Public Sector agencies is available in Appendix A.
2.2 Summary
FTE, including non-budget entities, reduced by 191 (-0.21 per cent) to 89,696 and the number of
persons reduced by 572 (-0.53 per cent) to 107,434.
Within the General Government Sector, FTE grew by 125 (0.15 per cent) to 85,616 and the number of
persons reduced by 148 (-0.14 percent) to 102,800.
2.3 South Australian Public Sector employment, June 2019 and June 2020
FTE and headcount data provided in this Report complies with the South Australian Government’s
standard definition for workforce reporting. It is representative of the workforce resource availability
as at the reporting period and should not be considered a reflection of the overall workforce for the
year. FTE and headcount values that are blank indicate that the agency did not exist during the
current or previous reporting period.
Appendix A contains a detailed explanation of South Australian Public Sector entities and notes for
specific agencies that may be relevant when reading this report.
Workforce Information Report 2019-20
© 2020 Government of South Australia Public Page 13 of 67
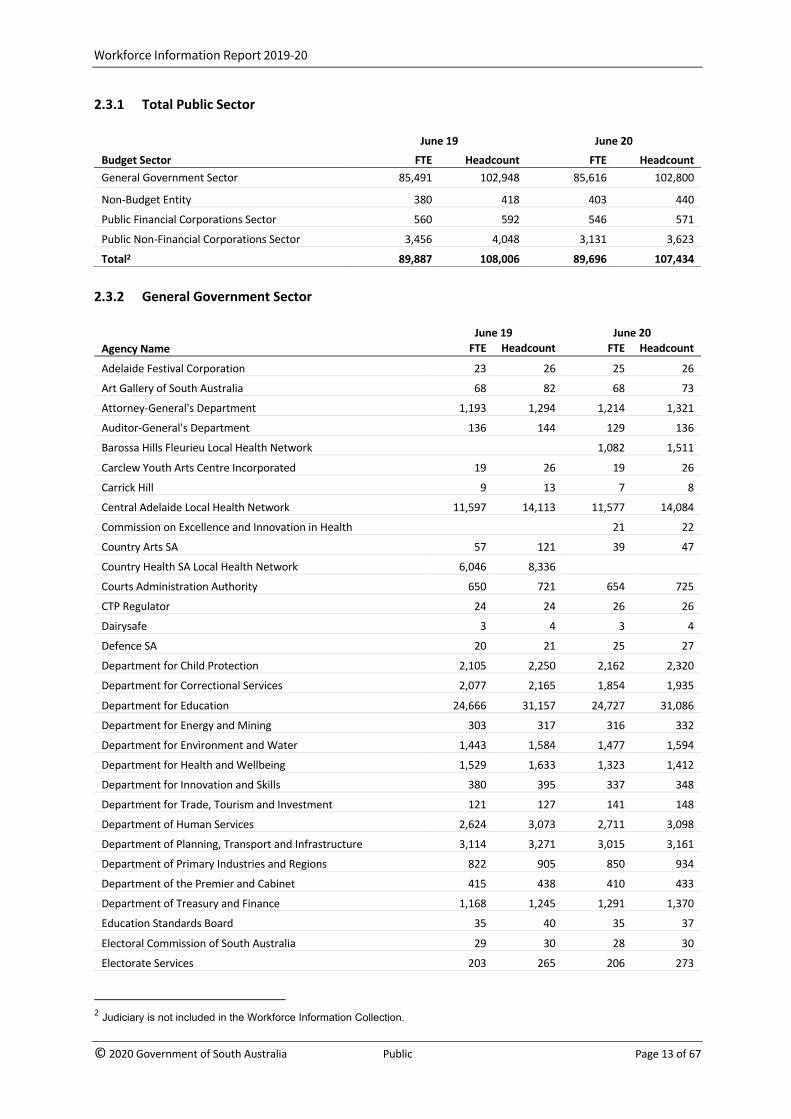
2.3.1 Total Public Sector
June 19 June 20 Budget Sector FTE Headcount FTE Headcount General Government Sector 85,491 102,948 85,616 102,800
Non-Budget Entity 380 418 403 440
Public Financial Corporations Sector 560 592 546 571
Public Non-Financial Corporations Sector 3,456 4,048 3,131 3,623
Total2 89,887 108,006 89,696 107,434
2.3.2 General Government Sector
June 19 June 20 Agency Name FTE Headcount FTE Headcount
Adelaide Festival Corporation 23 26 25 26
Art Gallery of South Australia 68 82 68 73
Attorney-General's Department 1,193 1,294 1,214 1,321
Auditor-General's Department 136 144 129 136
Barossa Hills Fleurieu Local Health Network 1,082 1,511
Carclew Youth Arts Centre Incorporated 19 26 19 26
Carrick Hill 9 13 7 8
Central Adelaide Local Health Network 11,597 14,113 11,577 14,084
Commission on Excellence and Innovation in Health 21 22
Country Arts SA 57 121 39 47
Country Health SA Local Health Network 6,046 8,336 Courts Administration Authority 650 721 654 725
CTP Regulator 24 24 26 26
Dairysafe 3 4 3 4
Defence SA 20 21 25 27
Department for Child Protection 2,105 2,250 2,162 2,320
Department for Correctional Services 2,077 2,165 1,854 1,935
Department for Education 24,666 31,157 24,727 31,086
Department for Energy and Mining 303 317 316 332
Department for Environment and Water 1,443 1,584 1,477 1,594
Department for Health and Wellbeing 1,529 1,633 1,323 1,412
Department for Innovation and Skills 380 395 337 348
Department for Trade, Tourism and Investment 121 127 141 148
Department of Human Services 2,624 3,073 2,711 3,098
Department of Planning, Transport and Infrastructure 3,114 3,271 3,015 3,161
Department of Primary Industries and Regions 822 905 850 934
Department of the Premier and Cabinet 415 438 410 433
Department of Treasury and Finance 1,168 1,245 1,291 1,370
Education Standards Board 35 40 35 37
Electoral Commission of South Australia 29 30 28 30
Electorate Services 203 265 206 273
2 Judiciary is not included in the Workforce Information Collection.

Workforce Information Report 2019-20
© 2020 Government of South Australia Public Page 14 of 67
June 19 June 20 Agency Name FTE Headcount FTE Headcount
Environment Protection Authority 194 207 195 206
Essential Services Commission of South Australia 26 29 32 33
Eyre and Far North Local Health Network 717 889
Flinders and Upper North Local Health Network 1,080 1,513
Government House 22 27 20 23
Green Industries SA 20 21 22 23
Health and Community Services Complaints Commissioner 9 9 9 9
History Trust of South Australia 48 60 47 62
Independent Commissioner Against Corruption 67 70 69 72
Infrastructure SA 4 4 9 9
Legislature (Including Members) 183 201 180 198
Limestone Coast Local Health Network 726 1,022
Northern Adelaide Local Health Network 3,942 4,807 4,096 5,056
Office for Recreation, Sport and Racing 83 94 80 86
Office of the Commissioner for Public Sector Employment 63 68 61 66
Office of the South Australian Productivity Commission 12 15 14 17
Riverland Mallee Coorong Local Health Network 1,603 2,212
SA Ambulance Service 1,589 1,740 1,644 1,811
SA Lotteries 3 4 SACE Board of South Australia 103 113 104 112
South Australia Police 5,854 6,054 5,798 5,965
South Australian Country Fire Service 159 168 167 175
South Australian Film Corporation 18 20 19 22
South Australian Fire and Emergency Services Commission 69 73 73 75
South Australian Mental Health Commission 8 8 South Australian Metropolitan Fire Service 1,052 1,263 1,044 1,259
South Australian Museum 71 85 69 80
South Australian Small Business Commissioner 10 11 South Australian State Emergency Services 64 66 68 70
South Australian Tourism Commission 121 130 114 123
Southern Adelaide Local Health Network 5,711 7,232 5,915 7,530
State Library of South Australia 113 127 120 136
State Opera of South Australia 11 13 10 11
State Theatre Company of South Australia 28 30 27 29
Study Adelaide 11 12 12 12
TAFE SA 2,186 2,694 1,906 2,219
Wellbeing SA 89 101
Women’s and Children’s Health Network 2,762 3,673 2,766 3,692
Yorke and Northern Local Health Network 944 1,335 Total 85,491 102,948 85,616 102,800

Workforce Information Report 2019-20
© 2020 Government of South Australia Public Page 15 of 67
2.3.3 Non-budget Entity
June 19 June 20 Agency Name FTE Headcount FTE Headcount
Jam Factory Contemporary Craft and Design 23 37 22 34
Legal Profession Conduct Commission 20 26 19 25
Legal Services Commission 171 181 175 184
Super SA 135 141 157 164
Teachers Registration Board 26 27 27 28
Veterinary Surgeons Board 2 2 1 1
Vinehealth Australia 4 4 4 4
Total 380 418 403 440
2.3.4 Public Financial Corporations Sector
June 19 June 20 Agency Name FTE Headcount FTE Headcount
Funds SA 46 49 50 52
HomeStart Finance 107 113 107 111
Lifetime Support Authority of South Australia 60 66 65 71
ReturnToWorkSA 243 252 243 251
South Australian Government Financing Authority 104 112 81 86
Public Financial Corporations Sector Total 560 592 546 571
2.3.5 Public Non-Financial Corporations Sector
June 19 June 20 Agency Name FTE Headcount FTE Headcount
Adelaide Cemeteries Authority 55 60 47 50
Adelaide Festival Centre Trust 258 343 106 354
Adelaide Venue Management Corporation 418 722 169 225
ForestrySA 46 47 41 41
Public Trustee 176 184 177 187
Renewal SA 123 130 128 131
SA Housing Authority 806 880 825 886
SA Water 1,474 1,531 1,554 1,610
West Beach Parks 98 151 84 139
Total 3,456 4,048 3,131 3,623

Workforce Information Report 2019-20
© 2020 Government of South Australia Public Page 16 of 67
3 Comparative workforce size
3.1 Summary
The number of persons employed in the South Australian Public Sector reduced by 0.53 per cent
between June 2019 and June 2020, and all other areas of the South Australian workforce decreased
the number of persons employed by -4.91 per cent for the same period. The public sector accounts
for about 13.07 per cent of the South Australian workforce, which is higher than reported at June
2019 (12.57 per cent).
3.1.1 SA Workforce Growth
3.1.2 SA Workforce and Population Growth (Last 5 Years)
Workforce Information Report 2019-20
© 2020 Government of South Australia Public Page 17 of 67
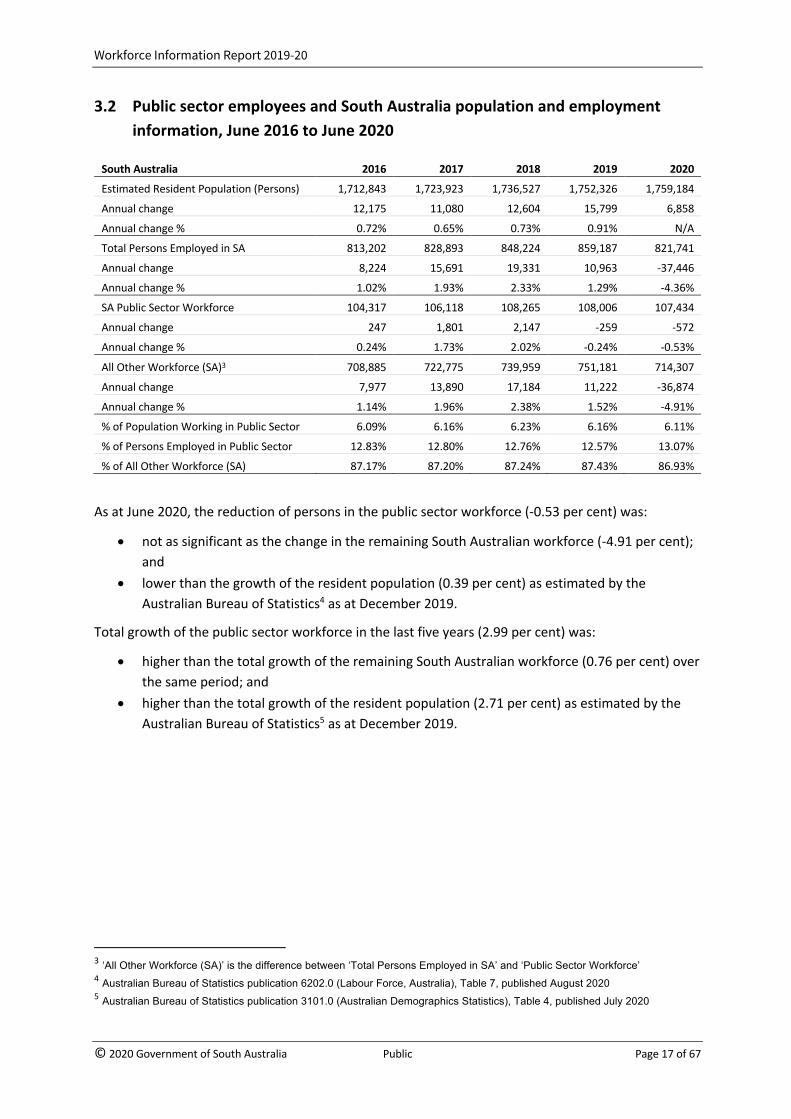
3.2 Public sector employees and South Australia population and employment information, June 2016 to June 2020
South Australia 2016 2017 2018 2019 2020
Estimated Resident Population (Persons) 1,712,843 1,723,923 1,736,527 1,752,326 1,759,184
Annual change 12,175 11,080 12,604 15,799 6,858
Annual change % 0.72% 0.65% 0.73% 0.91% N/A
Total Persons Employed in SA 813,202 828,893 848,224 859,187 821,741
Annual change 8,224 15,691 19,331 10,963 -37,446
Annual change % 1.02% 1.93% 2.33% 1.29% -4.36%
SA Public Sector Workforce 104,317 106,118 108,265 108,006 107,434
Annual change 247 1,801 2,147 -259 -572
Annual change % 0.24% 1.73% 2.02% -0.24% -0.53%
All Other Workforce (SA)3 708,885 722,775 739,959 751,181 714,307
Annual change 7,977 13,890 17,184 11,222 -36,874
Annual change % 1.14% 1.96% 2.38% 1.52% -4.91%
% of Population Working in Public Sector 6.09% 6.16% 6.23% 6.16% 6.11%
% of Persons Employed in Public Sector 12.83% 12.80% 12.76% 12.57% 13.07%
% of All Other Workforce (SA) 87.17% 87.20% 87.24% 87.43% 86.93%
As at June 2020, the reduction of persons in the public sector workforce (-0.53 per cent) was:
• not as significant as the change in the remaining South Australian workforce (-4.91 per cent);
and
• lower than the growth of the resident population (0.39 per cent) as estimated by the
Australian Bureau of Statistics4 as at December 2019.
Total growth of the public sector workforce in the last five years (2.99 per cent) was:
• higher than the total growth of the remaining South Australian workforce (0.76 per cent) over
the same period; and
• higher than the total growth of the resident population (2.71 per cent) as estimated by the
Australian Bureau of Statistics5 as at December 2019.
3 ‘All Other Workforce (SA)’ is the difference between ‘Total Persons Employed in SA’ and ‘Public Sector Workforce’ 4 Australian Bureau of Statistics publication 6202.0 (Labour Force, Australia), Table 7, published August 2020 5 Australian Bureau of Statistics publication 3101.0 (Australian Demographics Statistics), Table 4, published July 2020

Workforce Information Report 2019-20
© 2020 Government of South Australia Public Page 18 of 67
4 Age and gender
4.1 Employees in the South Australian Public Sector by age and gender, June 2020
At June 2020, employees in the South Australian Public Sector comprised of 69.17 per cent females,
30.81 per cent males, and 0.02 per cent other6. At June 2019, there were 68.95 per cent female,
31.04 per cent male, and 0.02 per cent other.
The average age of public sector employees was 45 years.
4.1.1 Total Public Sector
Age Bracket Female Male Other Total
Up to 20 225 88 0 313
20 - 24 3,696 1,119 4 4,819
25 - 29 7,481 3,034 2 10,517
30 - 34 8,030 3,863 3 11,896
35 - 39 9,002 4,058 4 13,064
40 - 44 8,914 4,035 1 12,950
45 - 49 9,317 4,241 6 13,564
50 - 54 9,191 4,083 1 13,275
55 - 59 8,725 3,963 0 12,688
60 - 64 6,853 3,111 0 9,964
65+ 2,875 1,509 0 4,384
Total 74,309 33,104 21 107,434
4.1.2 General Government Sector
Age Bracket Female Male Other Total
Up to 20 214 72 0 286
20 - 24 3,610 1,017 4 4,631
25 - 29 7,287 2,851 2 10,140
30 - 34 7,745 3,608 3 11,356
35 - 39 8,660 3,754 4 12,418
40 - 44 8,591 3,738 1 12,330
45 - 49 8,966 3,933 6 12,905
50 - 54 8,910 3,768 1 12,679
55 - 59 8,480 3,714 0 12,194
60 - 64 6,701 2,921 0 9,622
65+ 2,808 1,431 0 4,239
Total 71,972 30,807 21 102,800
6 Since 2016-17 workforce data has been captured for employees not identifying as male or female. Flexibility exists for employees to identify an alternative gender with more representative terminology (typically intersex/ indeterminate/unspecified). Collection and reporting of this data is consistent with government policy.
Workforce Information Report 2019-20
© 2020 Government of South Australia Public Page 19 of 67
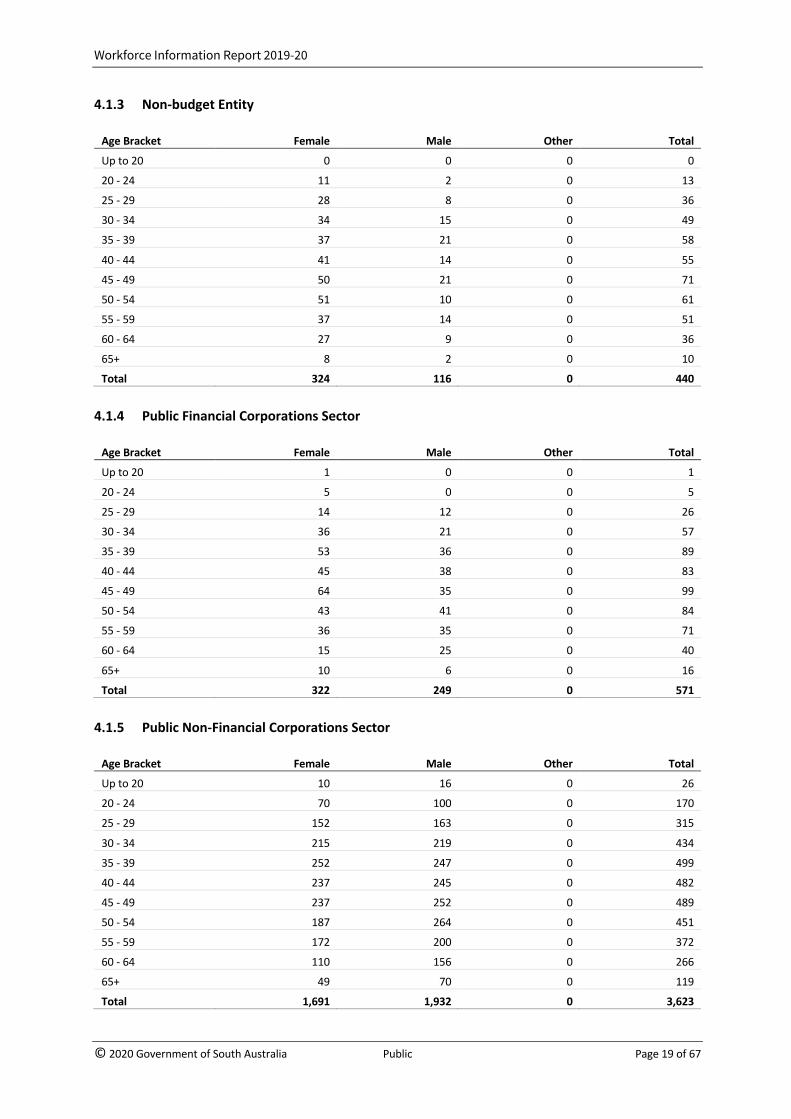
4.1.3 Non-budget Entity
Age Bracket Female Male Other Total
Up to 20 0 0 0 0
20 - 24 11 2 0 13
25 - 29 28 8 0 36
30 - 34 34 15 0 49
35 - 39 37 21 0 58
40 - 44 41 14 0 55
45 - 49 50 21 0 71
50 - 54 51 10 0 61
55 - 59 37 14 0 51
60 - 64 27 9 0 36
65+ 8 2 0 10
Total 324 116 0 440
4.1.4 Public Financial Corporations Sector
Age Bracket Female Male Other Total
Up to 20 1 0 0 1
20 - 24 5 0 0 5
25 - 29 14 12 0 26
30 - 34 36 21 0 57
35 - 39 53 36 0 89
40 - 44 45 38 0 83
45 - 49 64 35 0 99
50 - 54 43 41 0 84
55 - 59 36 35 0 71
60 - 64 15 25 0 40
65+ 10 6 0 16
Total 322 249 0 571
4.1.5 Public Non-Financial Corporations Sector
Age Bracket Female Male Other Total
Up to 20 10 16 0 26
20 - 24 70 100 0 170
25 - 29 152 163 0 315
30 - 34 215 219 0 434
35 - 39 252 247 0 499
40 - 44 237 245 0 482
45 - 49 237 252 0 489
50 - 54 187 264 0 451
55 - 59 172 200 0 372
60 - 64 110 156 0 266
65+ 49 70 0 119
Total 1,691 1,932 0 3,623

Workforce Information Report 2019-20
© 2020 Government of South Australia Public Page 20 of 67
5 Employee types
5.1 Employees in the South Australian Public Sector by appointment type, June 2016 to June 2020
At June 2020, employees in the South Australian Public Sector comprised of 61.25 per cent ongoing
positions and 38.75 per cent contracts, casual or other types of employment. This represents a 1.04
per cent reduction in ongoing employment, a 0.43 per cent reduction in long term contracts, and a
7.21 per cent increase in short term contracts compared to June 2019. There was a 14.47 per cent
reduction in casual employment for the same period.
5.1.1 Total Public Sector
Appointment Type June 16 June 17 June 18 June 19 June 20
Ongoing 68,395 67,185 67,245 66,495 65,802
Long-term Contract 6,091 7,869 7,504 7,281 7,250
Short-term Contract 18,852 21,197 22,275 23,224 24,899
Casual 10,684 9,864 10,838 10,457 8,944
Other 295 3 403 549 539
Total 104,317 106,118 108,265 108,006 107,434
5.1.2 General Government Sector
Appointment Type June 16 June 17 June 18 June 19 June 20
Ongoing 65,537 64,405 64,248 63,510 62,665
Long-term Contract 5,486 7,096 6,650 6,519 6,588
Short-term Contract 18,370 20,673 21,795 22,742 24,454
Casual 9,996 9,234 9,952 9,694 8,605
Other 295 3 368 483 488
Total 99,684 101,411 103,013 102,948 102,800
5.1.3 Non-budget Entity
Appointment Type June 16 June 17 June 18 June 19 June 20
Ongoing 298 289 286 281 311
Long-term Contract 46 47 53 49 43
Short-term Contract 66 98 101 79 77
Casual 13 17 19 8 9
Other 0 0 2 1 0
Total 423 451 461 418 440
Workforce Information Report 2019-20
© 2020 Government of South Australia Public Page 21 of 67
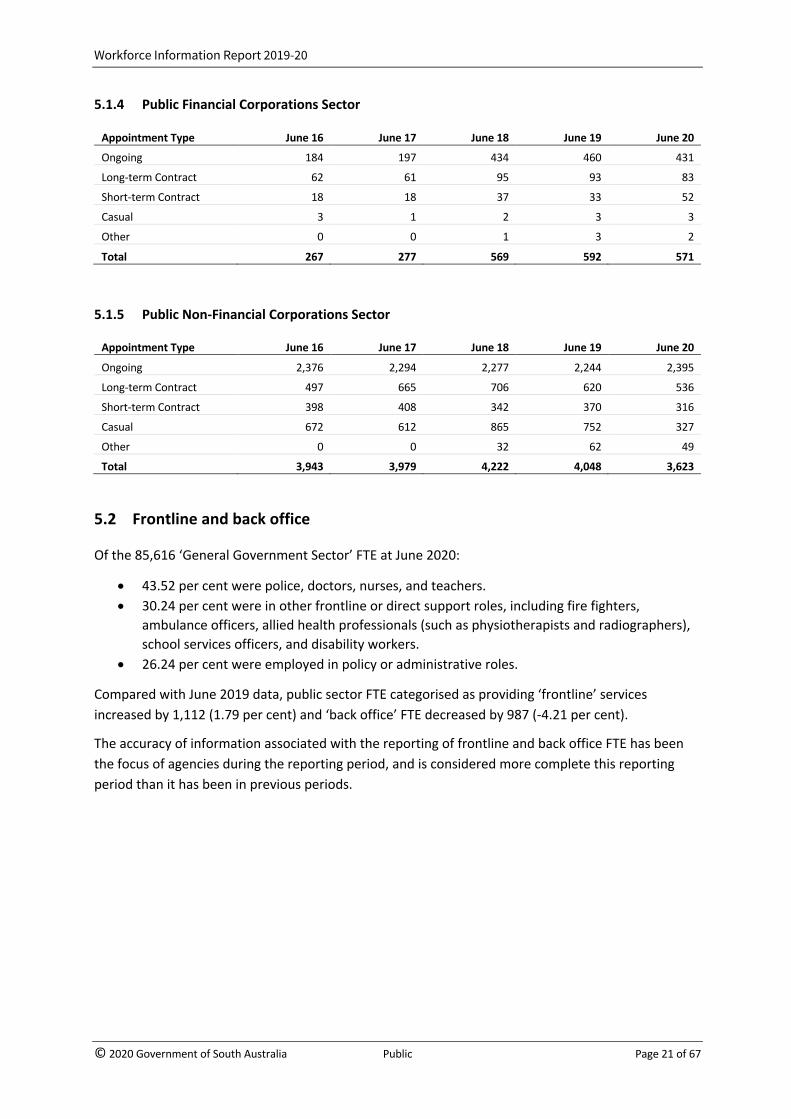
5.1.4 Public Financial Corporations Sector
Appointment Type June 16 June 17 June 18 June 19 June 20
Ongoing 184 197 434 460 431
Long-term Contract 62 61 95 93 83
Short-term Contract 18 18 37 33 52
Casual 3 1 2 3 3
Other 0 0 1 3 2
Total 267 277 569 592 571
5.1.5 Public Non-Financial Corporations Sector
Appointment Type June 16 June 17 June 18 June 19 June 20
Ongoing 2,376 2,294 2,277 2,244 2,395
Long-term Contract 497 665 706 620 536
Short-term Contract 398 408 342 370 316
Casual 672 612 865 752 327
Other 0 0 32 62 49
Total 3,943 3,979 4,222 4,048 3,623
5.2 Frontline and back office
Of the 85,616 ‘General Government Sector’ FTE at June 2020:
• 43.52 per cent were police, doctors, nurses, and teachers.
• 30.24 per cent were in other frontline or direct support roles, including fire fighters,
ambulance officers, allied health professionals (such as physiotherapists and radiographers),
school services officers, and disability workers.
• 26.24 per cent were employed in policy or administrative roles.
Compared with June 2019 data, public sector FTE categorised as providing ‘frontline’ services
increased by 1,112 (1.79 per cent) and ‘back office’ FTE decreased by 987 (-4.21 per cent).
The accuracy of information associated with the reporting of frontline and back office FTE has been
the focus of agencies during the reporting period, and is considered more complete this reporting
period than it has been in previous periods.
Workforce Information Report 2019-20
© 2020 Government of South Australia Public Page 22 of 67
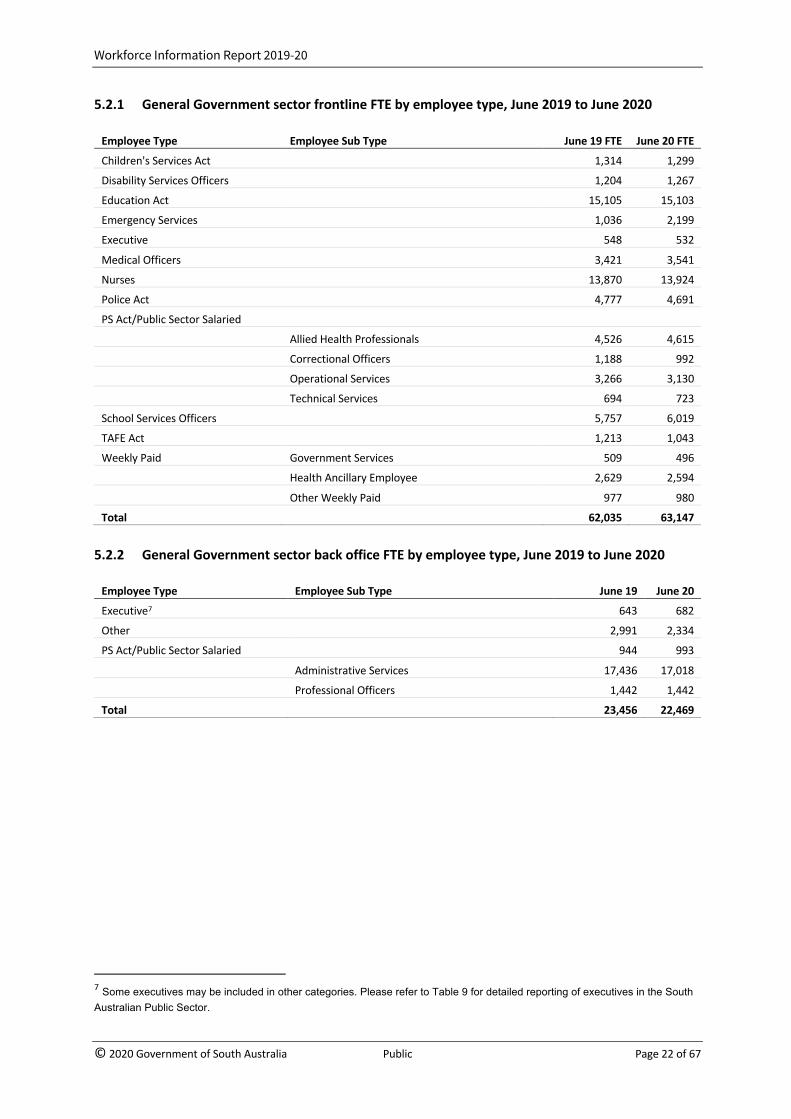
5.2.1 General Government sector frontline FTE by employee type, June 2019 to June 2020
Employee Type Employee Sub Type June 19 FTE June 20 FTE
Children's Services Act 1,314 1,299
Disability Services Officers 1,204 1,267
Education Act 15,105 15,103
Emergency Services 1,036 2,199
Executive 548 532
Medical Officers 3,421 3,541
Nurses 13,870 13,924
Police Act 4,777 4,691
PS Act/Public Sector Salaried Allied Health Professionals 4,526 4,615
Correctional Officers 1,188 992
Operational Services 3,266 3,130
Technical Services 694 723
School Services Officers 5,757 6,019
TAFE Act 1,213 1,043
Weekly Paid Government Services 509 496
Health Ancillary Employee 2,629 2,594
Other Weekly Paid 977 980
Total 62,035 63,147
5.2.2 General Government sector back office FTE by employee type, June 2019 to June 2020
Employee Type Employee Sub Type June 19 June 20
Executive7 643 682
Other 2,991 2,334
PS Act/Public Sector Salaried 944 993
Administrative Services 17,436 17,018
Professional Officers 1,442 1,442
Total 23,456 22,469
7 Some executives may be included in other categories. Please refer to Table 9 for detailed reporting of executives in the South Australian Public Sector.
Workforce Information Report 2019-20
© 2020 Government of South Australia Public Page 23 of 67
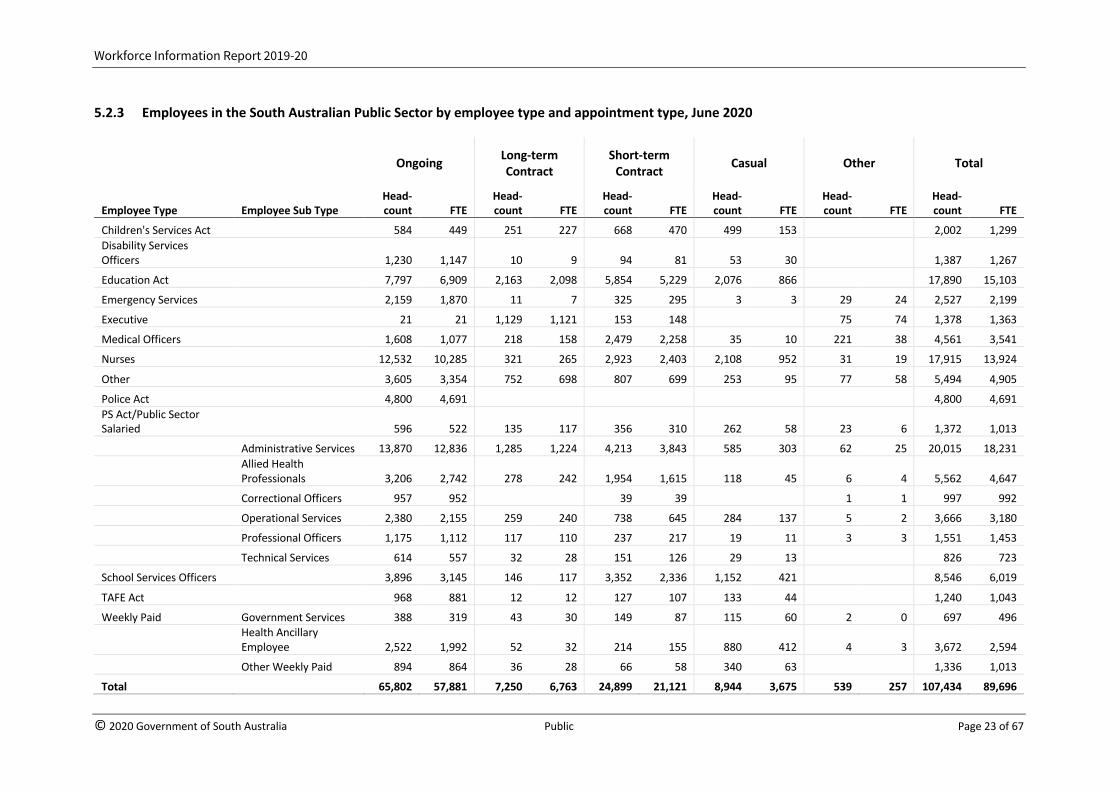
5.2.3 Employees in the South Australian Public Sector by employee type and appointment type, June 2020
Ongoing Long-term
Contract Short-term
Contract Casual Other Total
Employee Type Employee Sub Type Head-count FTE
Head-count FTE
Head-count FTE
Head-count FTE
Head-count FTE
Head-count FTE
Children's Services Act 584 449 251 227 668 470 499 153 2,002 1,299 Disability Services Officers 1,230 1,147 10 9 94 81 53 30 1,387 1,267
Education Act 7,797 6,909 2,163 2,098 5,854 5,229 2,076 866 17,890 15,103
Emergency Services 2,159 1,870 11 7 325 295 3 3 29 24 2,527 2,199
Executive 21 21 1,129 1,121 153 148 75 74 1,378 1,363
Medical Officers 1,608 1,077 218 158 2,479 2,258 35 10 221 38 4,561 3,541
Nurses 12,532 10,285 321 265 2,923 2,403 2,108 952 31 19 17,915 13,924
Other 3,605 3,354 752 698 807 699 253 95 77 58 5,494 4,905
Police Act 4,800 4,691 4,800 4,691 PS Act/Public Sector Salaried 596 522 135 117 356 310 262 58 23 6 1,372 1,013
Administrative Services 13,870 12,836 1,285 1,224 4,213 3,843 585 303 62 25 20,015 18,231
Allied Health Professionals 3,206 2,742 278 242 1,954 1,615 118 45 6 4 5,562 4,647
Correctional Officers 957 952 39 39 1 1 997 992
Operational Services 2,380 2,155 259 240 738 645 284 137 5 2 3,666 3,180
Professional Officers 1,175 1,112 117 110 237 217 19 11 3 3 1,551 1,453
Technical Services 614 557 32 28 151 126 29 13 826 723
School Services Officers 3,896 3,145 146 117 3,352 2,336 1,152 421 8,546 6,019
TAFE Act 968 881 12 12 127 107 133 44 1,240 1,043
Weekly Paid Government Services 388 319 43 30 149 87 115 60 2 0 697 496
Health Ancillary Employee 2,522 1,992 52 32 214 155 880 412 4 3 3,672 2,594
Other Weekly Paid 894 864 36 28 66 58 340 63 1,336 1,013
Total 65,802 57,881 7,250 6,763 24,899 21,121 8,944 3,675 539 257 107,434 89,696
Workforce Information Report 2019-20
© 2020 Government of South Australia Public Page 24 of 67
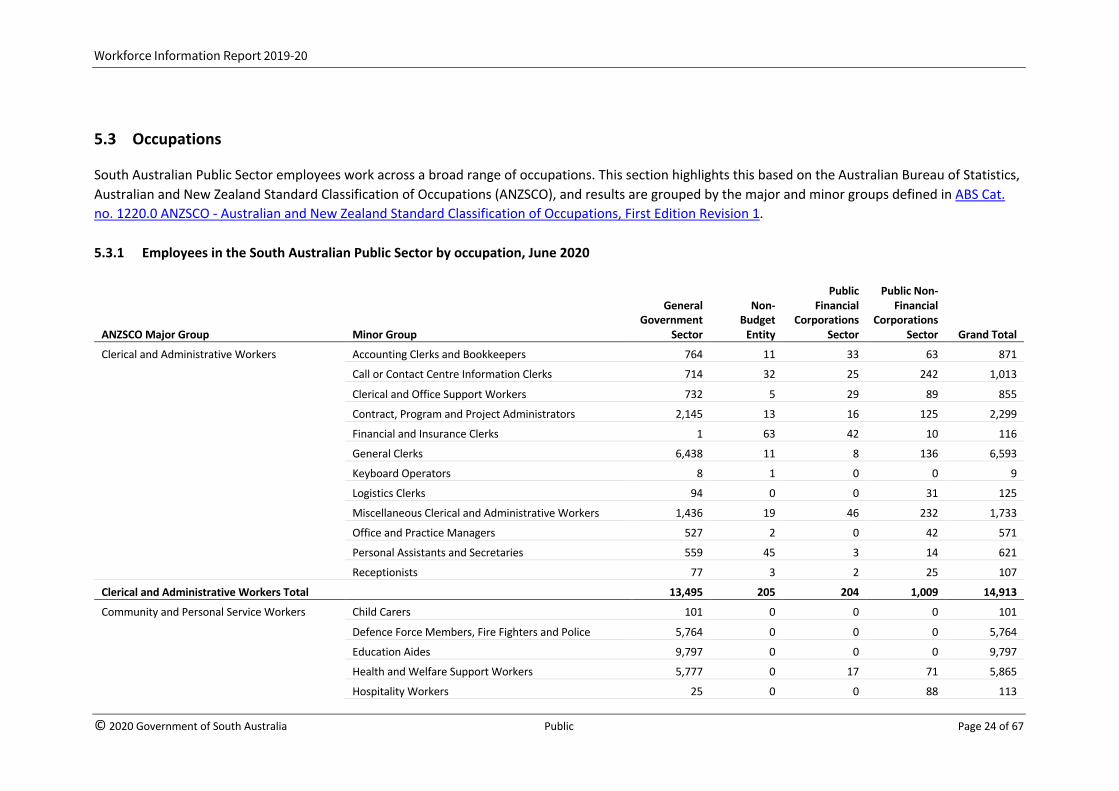
5.3 Occupations
South Australian Public Sector employees work across a broad range of occupations. This section highlights this based on the Australian Bureau of Statistics, Australian and New Zealand Standard Classification of Occupations (ANZSCO), and results are grouped by the major and minor groups defined in ABS Cat. no. 1220.0 ANZSCO - Australian and New Zealand Standard Classification of Occupations, First Edition Revision 1.
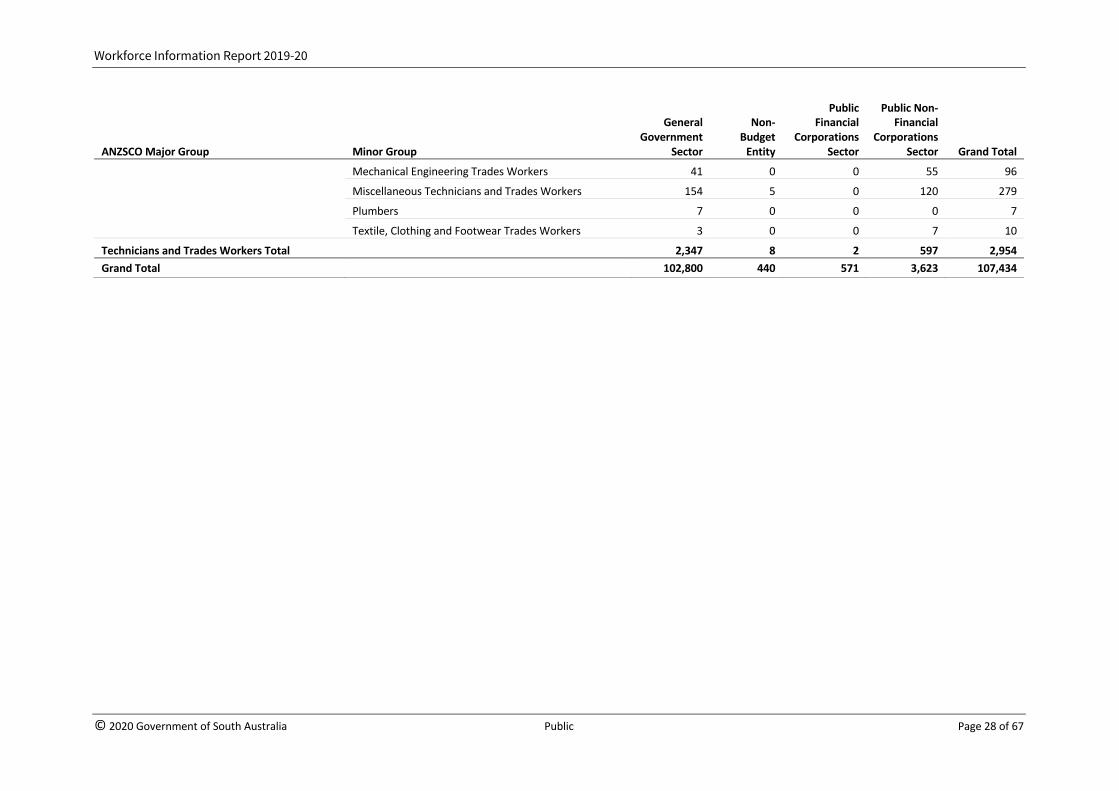
5.3.1 Employees in the South Australian Public Sector by occupation, June 2020
ANZSCO Major Group Minor Group
General Government
Sector
Non-Budget
Entity
Public Financial
Corporations Sector
Public Non-Financial
Corporations Sector Grand Total
Clerical and Administrative Workers Accounting Clerks and Bookkeepers 764 11 33 63 871
Call or Contact Centre Information Clerks 714 32 25 242 1,013
Clerical and Office Support Workers 732 5 29 89 855
Contract, Program and Project Administrators 2,145 13 16 125 2,299
Financial and Insurance Clerks 1 63 42 10 116
General Clerks 6,438 11 8 136 6,593
Keyboard Operators 8 1 0 0 9
Logistics Clerks 94 0 0 31 125
Miscellaneous Clerical and Administrative Workers 1,436 19 46 232 1,733
Office and Practice Managers 527 2 0 42 571
Personal Assistants and Secretaries 559 45 3 14 621
Receptionists 77 3 2 25 107
Clerical and Administrative Workers Total 13,495 205 204 1,009 14,913
Community and Personal Service Workers Child Carers 101 0 0 0 101
Defence Force Members, Fire Fighters and Police 5,764 0 0 0 5,764
Education Aides 9,797 0 0 0 9,797
Health and Welfare Support Workers 5,777 0 17 71 5,865
Hospitality Workers 25 0 0 88 113

Workforce Information Report 2019-20
© 2020 Government of South Australia Public Page 25 of 67
ANZSCO Major Group Minor Group
General Government
Sector
Non-Budget
Entity
Public Financial
Corporations Sector
Public Non-Financial
Corporations Sector Grand Total
Personal Carers and Assistants 4,781 0 0 3 4,784
Personal Service and Travel Workers 290 0 0 0 290
Prison and Security Officers 1,255 0 0 20 1,275
Sports and Fitness Workers 125 0 0 0 125
Community and Personal Service Workers Total 27,915 0 17 182 28,114
Labourers Cleaners and Laundry Workers 787 0 0 60 847
Construction and Mining Labourers 119 0 0 9 128
Farm, Forestry and Garden Workers 96 0 0 17 113
Food Preparation Assistants 527 0 0 2 529
Food Process Workers 1 0 0 0 1
Miscellaneous Factory Process Workers 10 0 0 0 10
Miscellaneous Labourers 753 0 1 39 793
Labourers Total 2,293 0 1 127 2,421
Machinery Operators and Drivers Automobile, Bus and Rail Drivers 470 0 0 0 470
Delivery Drivers 3 0 0 0 3
Machine Operators 38 0 0 0 38
Mobile Plant Operators 14 0 0 1 15
Stationary Plant Operators 2 0 0 254 256
Storepersons 79 0 0 4 83
Truck Drivers 5 0 0 0 5
Machinery Operators and Drivers Total 611 0 0 259 870
Managers Accommodation and Hospitality Managers 132 0 0 2 134
Advertising, Public Relations and Sales Managers 38 3 2 9 52
Business Administration Managers 717 9 21 53 800
Chief Executives, General Managers and Legislators 986 16 29 72 1,103
Construction, Distribution and Production Managers 79 8 2 27 116
Education, Health and Welfare Services Managers 3,310 0 5 23 3,338
Workforce Information Report 2019-20
© 2020 Government of South Australia Public Page 26 of 67
ANZSCO Major Group Minor Group
General Government
Sector
Non-Budget
Entity
Public Financial
Corporations Sector
Public Non-Financial
Corporations Sector Grand Total
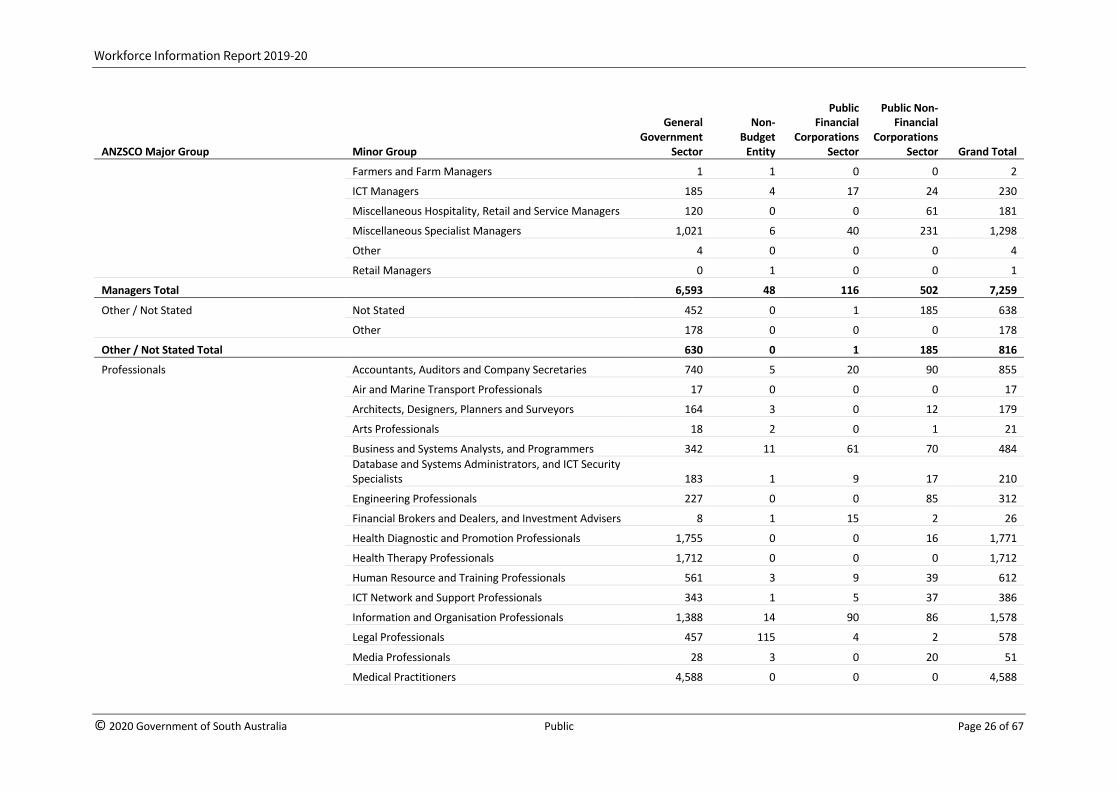
Farmers and Farm Managers 1 1 0 0 2
ICT Managers 185 4 17 24 230
Miscellaneous Hospitality, Retail and Service Managers 120 0 0 61 181
Miscellaneous Specialist Managers 1,021 6 40 231 1,298
Other 4 0 0 0 4
Retail Managers 0 1 0 0 1
Managers Total 6,593 48 116 502 7,259
Other / Not Stated Not Stated 452 0 1 185 638
Other 178 0 0 0 178
Other / Not Stated Total 630 0 1 185 816
Professionals Accountants, Auditors and Company Secretaries 740 5 20 90 855
Air and Marine Transport Professionals 17 0 0 0 17
Architects, Designers, Planners and Surveyors 164 3 0 12 179
Arts Professionals 18 2 0 1 21
Business and Systems Analysts, and Programmers 342 11 61 70 484
Database and Systems Administrators, and ICT Security Specialists 183 1 9 17 210
Engineering Professionals 227 0 0 85 312
Financial Brokers and Dealers, and Investment Advisers 8 1 15 2 26
Health Diagnostic and Promotion Professionals 1,755 0 0 16 1,771
Health Therapy Professionals 1,712 0 0 0 1,712
Human Resource and Training Professionals 561 3 9 39 612
ICT Network and Support Professionals 343 1 5 37 386
Information and Organisation Professionals 1,388 14 90 86 1,578
Legal Professionals 457 115 4 2 578
Media Professionals 28 3 0 20 51
Medical Practitioners 4,588 0 0 0 4,588

Workforce Information Report 2019-20
© 2020 Government of South Australia Public Page 27 of 67
ANZSCO Major Group Minor Group
General Government
Sector
Non-Budget
Entity
Public Financial
Corporations Sector
Public Non-Financial
Corporations Sector Grand Total
Midwifery and Nursing Professionals 14,740 0 0 1 14,741
Miscellaneous Education Professionals 285 3 0 0 288
Natural and Physical Science Professionals 1,544 0 0 65 1,609
Sales, Marketing and Public Relations Professionals 290 7 12 70 379
School Teachers 15,368 0 0 0 15,368
Social and Welfare Professionals 2,700 4 0 107 2,811
Tertiary Education Teachers 1,237 0 0 0 1,237
Professionals Total 48,695 173 225 720 49,813
Sales Workers Checkout Operators and Office Cashiers 2 0 0 0 2
Insurance Agents and Sales Representatives 7 0 4 4 15
Miscellaneous Sales Support Workers 3 0 0 2 5
Real Estate Sales Agents 61 0 1 16 78
Sales Assistants and Salespersons 148 6 0 20 174
Sales Workers Total 221 6 5 42 274
Technicians and Trades Workers Agricultural, Medical and Science Technicians 1,062 0 0 109 1,171
Animal Attendants and Trainers, and Shearers 27 0 0 0 27
Automotive Electricians and Mechanics 39 0 0 1 40
Bricklayers, and Carpenters and Joiners 13 0 0 8 21
Building and Engineering Technicians 270 0 0 61 331
Electricians 62 0 0 65 127
Electronics and Telecommunications Trades Workers 38 0 0 0 38
Fabrication Engineering Trades Workers 2 0 0 29 31
Floor Finishers and Painting Trades Workers 3 0 0 1 4
Food Trades Workers 150 0 0 42 192
Glaziers, Plasterers and Tilers 1 0 0 0 1
Horticultural Trades Workers 65 0 0 33 98
ICT and Telecommunications Technicians 410 3 2 66 481
Workforce Information Report 2019-20
© 2020 Government of South Australia Public Page 28 of 67
ANZSCO Major Group Minor Group
General Government
Sector
Non-Budget
Entity
Public Financial
Corporations Sector
Public Non-Financial
Corporations Sector Grand Total
Mechanical Engineering Trades Workers 41 0 0 55 96
Miscellaneous Technicians and Trades Workers 154 5 0 120 279
Plumbers 7 0 0 0 7
Textile, Clothing and Footwear Trades Workers 3 0 0 7 10
Technicians and Trades Workers Total 2,347 8 2 597 2,954 Grand Total 102,800 440 571 3,623 107,434

Workforce Information Report 2019-20
© 2020 Government of South Australia Public Page 29 of 67
6 Diversity and inclusion
6.1 Aboriginal employees in the South Australian Public Sector, June 2016 to June 2020
Aboriginal employees represented 2.13 per cent of the public sector workforce at June 2020.
There were 2,291 employees identified as Aboriginal at June 2020. During the reporting period, the number of Aboriginal employees increased by 2.64 per cent, compared to a -0.53 per cent reduction in the number of persons employed in the South Australian Public Sector.
This data may underrepresent the true level of Aboriginal employment due to reliance on employees self-identifying their status.
6.1.1 Total Public Sector
June 16 June 17 June 18 June 19 June 20
Identified as Aboriginal 1,844 2,007 2,154 2,232 2,291
Non Aboriginal 78,047 80,338 82,312 82,520 83,538
Unknown / Not Stated 24,426 23,773 23,799 23,254 21,605
Total 104,317 106,118 108,265 108,006 107,434
6.1.2 General Government Sector
June 16 June 17 June 18 June 19 June 20
Identified as Aboriginal 1,727 1,891 2,044 2,114 2,183
Non Aboriginal 74,665 76,814 78,386 78,639 79,886
Unknown / Not Stated 23,292 22,706 22,583 22,195 20,731
Total 99,684 101,411 103,013 102,948 102,800
6.1.3 Non-budget Entity
June 16 June 17 June 18 June 19 June 20
Identified as Aboriginal 5 5 5 5 6
Non Aboriginal 363 386 395 351 372
Unknown / Not Stated 55 60 61 62 62
Total 423 451 461 418 440
6.1.4 Public Financial Corporations Sector
June 16 June 17 June 18 June 19 June 20
Identified as Aboriginal 3 3 3 4 3
Non Aboriginal 189 202 479 513 504
Unknown / Not Stated 75 72 87 75 64
Total 267 277 569 592 571

Workforce Information Report 2019-20
© 2020 Government of South Australia Public Page 30 of 67
6.1.5 Public Non-Financial Corporations Sector
June 16 June 17 June 18 June 19 June 20
Identified as Aboriginal 109 108 102 109 99
Non Aboriginal 2,830 2,936 3,052 3,017 2,776
Unknown / Not Stated 1,004 935 1,068 922 748
Total 3,943 3,979 4,222 4,048 3,623
Workforce Information Report 2019-20
© 2020 Government of South Australia Public Page 31 of 67
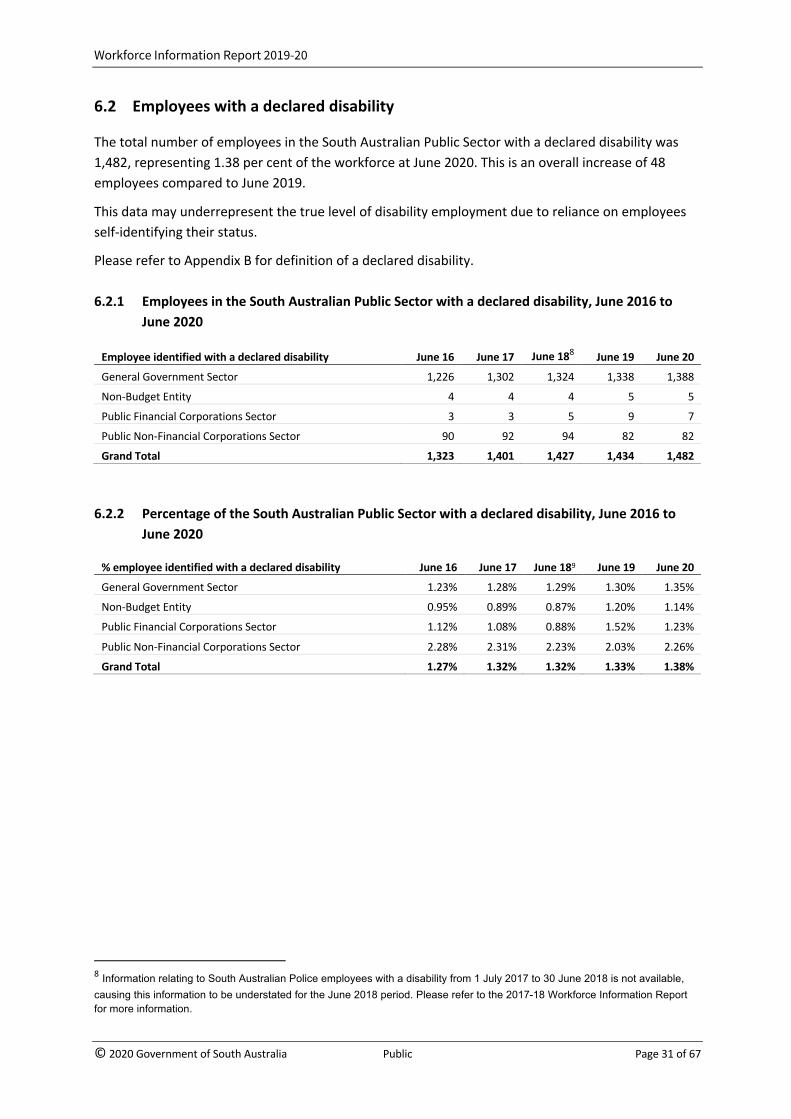
6.2 Employees with a declared disability
The total number of employees in the South Australian Public Sector with a declared disability was 1,482, representing 1.38 per cent of the workforce at June 2020. This is an overall increase of 48 employees compared to June 2019.
This data may underrepresent the true level of disability employment due to reliance on employees self-identifying their status.
Please refer to Appendix B for definition of a declared disability.
6.2.1 Employees in the South Australian Public Sector with a declared disability, June 2016 to June 2020
Employee identified with a declared disability June 16 June 17 June 188 June 19 June 20
General Government Sector 1,226 1,302 1,324 1,338 1,388
Non-Budget Entity 4 4 4 5 5
Public Financial Corporations Sector 3 3 5 9 7
Public Non-Financial Corporations Sector 90 92 94 82 82
Grand Total 1,323 1,401 1,427 1,434 1,482
6.2.2 Percentage of the South Australian Public Sector with a declared disability, June 2016 to June 2020
% employee identified with a declared disability June 16 June 17 June 189 June 19 June 20
General Government Sector 1.23% 1.28% 1.29% 1.30% 1.35%
Non-Budget Entity 0.95% 0.89% 0.87% 1.20% 1.14%
Public Financial Corporations Sector 1.12% 1.08% 0.88% 1.52% 1.23%
Public Non-Financial Corporations Sector 2.28% 2.31% 2.23% 2.03% 2.26%
Grand Total 1.27% 1.32% 1.32% 1.33% 1.38%
8 Information relating to South Australian Police employees with a disability from 1 July 2017 to 30 June 2018 is not available, causing this information to be understated for the June 2018 period. Please refer to the 2017-18 Workforce Information Report for more information.

Workforce Information Report 2019-20
© 2020 Government of South Australia Public Page 32 of 67
6.3 Part time employees in the South Australian Public Sector, June 2016 to June 2020
Part time9 employees represented 44.67 per cent of the workforce at June 2020.
Part time employment decreased 0.93 per cent to 44.67 per cent of the workforce, while full time employment decreased by 0.21 per cent to 55.33 per cent.
6.3.1 Total Public Sector
June 16 June 17 June 18 June 19 June 20
Full Time 56,100 59,249 59,124 59,566 59,443
Part Time 48,217 46,869 49,141 48,440 47,991
Total 104,317 106,118 108,265 108,006 107,434
6.3.2 General Government Sector
June 16 June 17 June 18 June 19 June 20
Full Time 52,755 55,838 55,459 55,984 55,850
Part Time 46,929 45,573 47,554 46,964 46,950
Total 99,684 101,411 103,013 102,948 102,800
6.3.3 Non-budget Entity
June 16 June 17 June 18 June 19 June 20
Full Time 302 317 319 303 329
Part Time 121 134 142 115 111
Total 423 451 461 418 440
6.3.4 Public Financial Corporations Sector
June 16 June 17 June 18 June 19 June 20
Full Time 220 226 470 480 472
Part Time 47 51 99 112 99
Total 267 277 569 592 571
6.3.5 Public Non-Financial Corporations Sector
June 16 June 17 June 18 June 19 June 20
Full Time 2,823 2,868 2,876 2,799 2,792
Part Time 1,120 1,111 1,346 1,249 831
Total 3,943 3,979 4,222 4,048 3,623
9 For reporting purposes, all employees in casual employment are recorded as part time employees.
Workforce Information Report 2019-20
© 2020 Government of South Australia Public Page 33 of 67
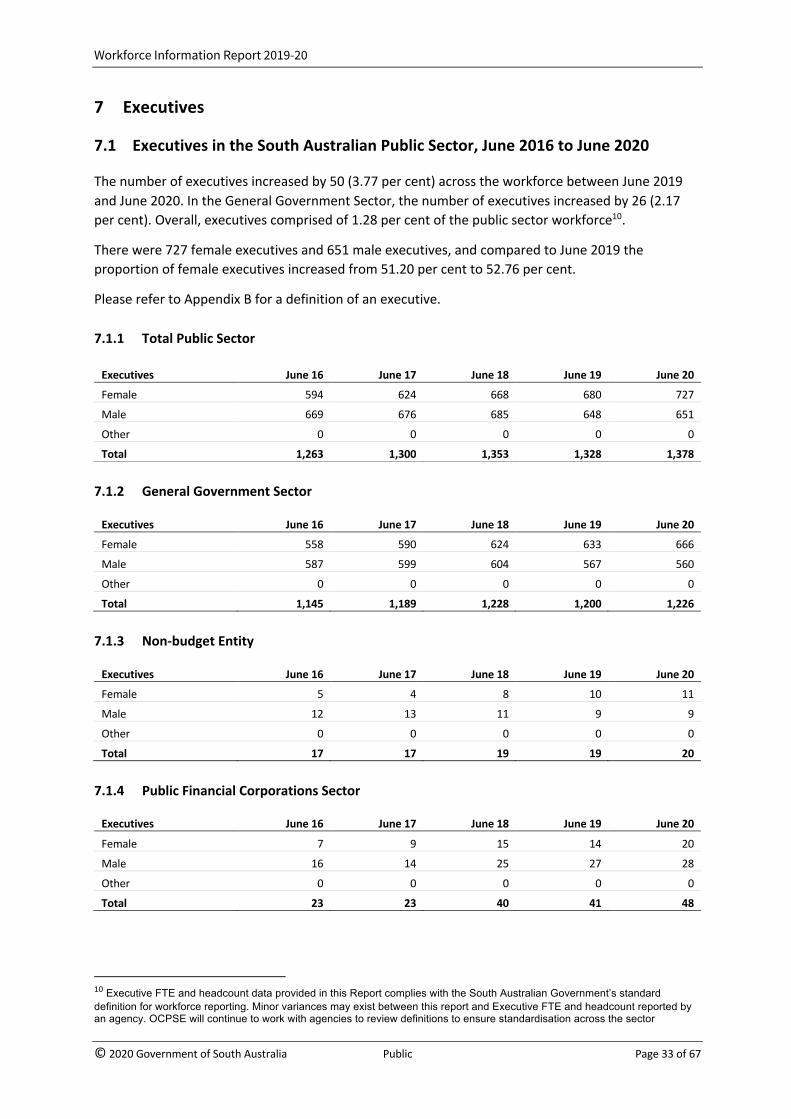
7 Executives
7.1 Executives in the South Australian Public Sector, June 2016 to June 2020
The number of executives increased by 50 (3.77 per cent) across the workforce between June 2019 and June 2020. In the General Government Sector, the number of executives increased by 26 (2.17 per cent). Overall, executives comprised of 1.28 per cent of the public sector workforce10.
There were 727 female executives and 651 male executives, and compared to June 2019 the proportion of female executives increased from 51.20 per cent to 52.76 per cent.
Please refer to Appendix B for a definition of an executive.
7.1.1 Total Public Sector
Executives June 16 June 17 June 18 June 19 June 20
Female 594 624 668 680 727
Male 669 676 685 648 651
Other 0 0 0 0 0
Total 1,263 1,300 1,353 1,328 1,378
7.1.2 General Government Sector
Executives June 16 June 17 June 18 June 19 June 20
Female 558 590 624 633 666
Male 587 599 604 567 560
Other 0 0 0 0 0
Total 1,145 1,189 1,228 1,200 1,226
7.1.3 Non-budget Entity
Executives June 16 June 17 June 18 June 19 June 20
Female 5 4 8 10 11
Male 12 13 11 9 9
Other 0 0 0 0 0
Total 17 17 19 19 20
7.1.4 Public Financial Corporations Sector
Executives June 16 June 17 June 18 June 19 June 20
Female 7 9 15 14 20
Male 16 14 25 27 28
Other 0 0 0 0 0
Total 23 23 40 41 48
10 Executive FTE and headcount data provided in this Report complies with the South Australian Government’s standard definition for workforce reporting. Minor variances may exist between this report and Executive FTE and headcount reported by an agency. OCPSE will continue to work with agencies to review definitions to ensure standardisation across the sector

Workforce Information Report 2019-20
© 2020 Government of South Australia Public Page 34 of 67
7.1.5 Public Non-Financial Corporations Sector
Executives June 16 June 17 June 18 June 19 June 20
Female 24 21 21 23 30
Male 54 50 45 45 54
Other 0 0 0 0 0
Total 78 71 66 68 84
8 Graduates, trainees, and apprentices
8.1 Skilling SA Public Sector Project
The OCPSE is driving the Skilling SA Public Sector Project to support more than 2,600 participants undertake a vocational qualification in the South Australian Public Sector over four years (up to June 2022). More information about the Skilling SA Public Sector Project can be found on the public sector website.
Through the Skilling SA Public Sector program, participants may be either:
1. employed by the South Australian Public Sector as an apprentice, trainee or graduate on a contract of training;
2. a trainee or apprentice employed by a group training organisation and hosted in a public sector agency for the work component of their traineeship; or
3. an existing public sector employee training in an area of key skill demand.
As part of the Skilling SA Public Sector Project, the public sector has set a yearly targets, with 672 commencements allocated to be achieved under the program by 30 June 2020. This was exceeded by 30 persons (702 commencements in total).
Between 1 July 2019 and 30 June 2020, there were 266 public sector employees who commenced employment in the public sector, of which 77.4 per cent were trainees, 13.5 per cent were graduates, and 9.0 per cent were apprentices.
8.1.1 Skilling SA commencements by headcount, between 1 July 2019 and 30 June 2020
Pathway Headcount Employed in public sector 266
Employed by a group training organisation 18
Upskill of existing public sector employee 418
Total 702
Workforce Information Report 2019-20
© 2020 Government of South Australia Public Page 35 of 67
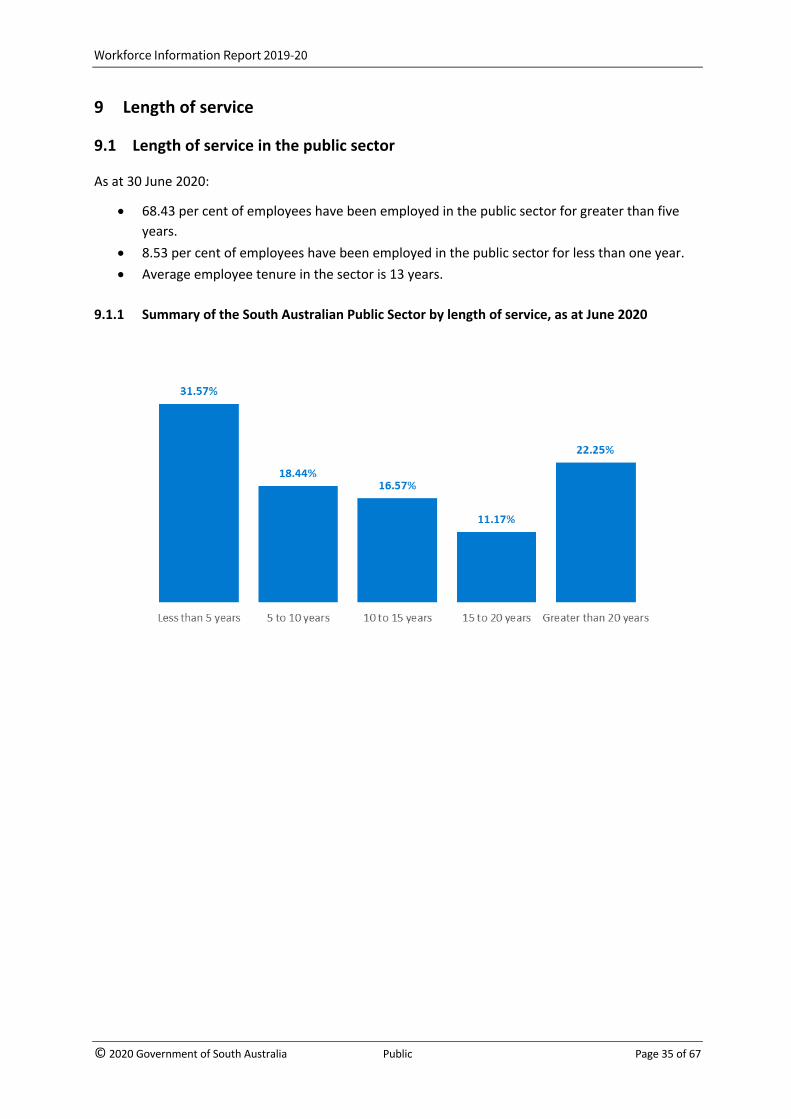
9 Length of service
9.1 Length of service in the public sector
As at 30 June 2020:
• 68.43 per cent of employees have been employed in the public sector for greater than five years.
• 8.53 per cent of employees have been employed in the public sector for less than one year. • Average employee tenure in the sector is 13 years.
9.1.1 Summary of the South Australian Public Sector by length of service, as at June 2020
Workforce Information Report 2019-20
© 2020 Government of South Australia Public Page 36 of 67
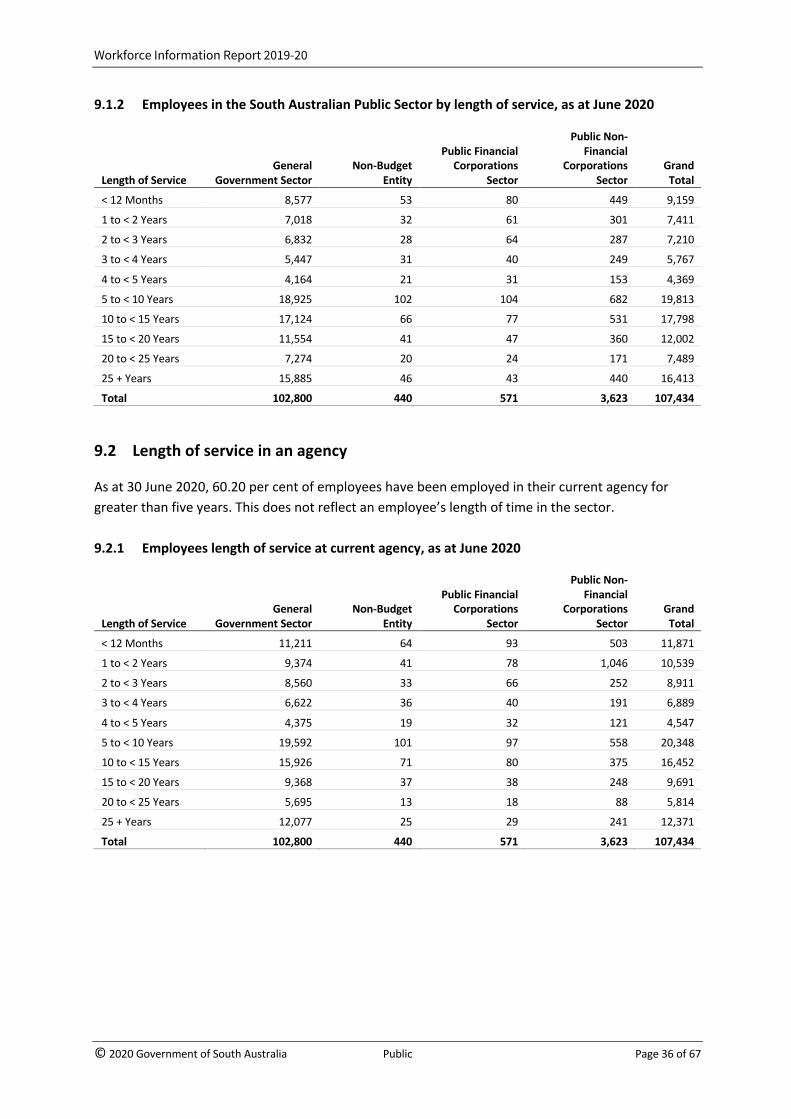
9.1.2 Employees in the South Australian Public Sector by length of service, as at June 2020
Length of Service General
Government Sector Non-Budget
Entity
Public Financial Corporations
Sector
Public Non-Financial
Corporations Sector
Grand Total
< 12 Months 8,577 53 80 449 9,159
1 to < 2 Years 7,018 32 61 301 7,411
2 to < 3 Years 6,832 28 64 287 7,210
3 to < 4 Years 5,447 31 40 249 5,767
4 to < 5 Years 4,164 21 31 153 4,369
5 to < 10 Years 18,925 102 104 682 19,813
10 to < 15 Years 17,124 66 77 531 17,798
15 to < 20 Years 11,554 41 47 360 12,002
20 to < 25 Years 7,274 20 24 171 7,489
25 + Years 15,885 46 43 440 16,413
Total 102,800 440 571 3,623 107,434
9.2 Length of service in an agency
As at 30 June 2020, 60.20 per cent of employees have been employed in their current agency for greater than five years. This does not reflect an employee’s length of time in the sector.
9.2.1 Employees length of service at current agency, as at June 2020
Length of Service General
Government Sector Non-Budget
Entity
Public Financial Corporations
Sector
Public Non-Financial
Corporations Sector
Grand Total
< 12 Months 11,211 64 93 503 11,871
1 to < 2 Years 9,374 41 78 1,046 10,539
2 to < 3 Years 8,560 33 66 252 8,911
3 to < 4 Years 6,622 36 40 191 6,889
4 to < 5 Years 4,375 19 32 121 4,547
5 to < 10 Years 19,592 101 97 558 20,348
10 to < 15 Years 15,926 71 80 375 16,452
15 to < 20 Years 9,368 37 38 248 9,691
20 to < 25 Years 5,695 13 18 88 5,814
25 + Years 12,077 25 29 241 12,371
Total 102,800 440 571 3,623 107,434

Workforce Information Report 2019-20
© 2020 Government of South Australia Public Page 37 of 67
10 Salaries
10.1 Summary of employees in the South Australian Public Sector by salary and gender, June 2020
Salary information provided in this Report is intended to highlight indicative levels of responsibility across the workforce only. The information does not reflect total employment costs over the year.
The South Australian Public Sector provides a vast range of services across many agencies and employs people across a broad range of occupations.
• 24.40 per cent of employees earn a base salary between $1 - $62,209, predominantly in entry level type roles.
• 52.55 per cent earn a base salary between $62,210 - $101,306 across frontline and middle management type roles.
• 17.10 per cent of employees earn a base salary between $101,307 - $127,875 which covers more senior managers and/or employees with technical expertise.
• 5.80 per cent of employees earn $127,876+, which includes executives or employees with significant specialist skills.
The average salary for a public sector employee in 2019-20 was $87,102 (an increase of 3.87 per cent compared to 2018-19).
0.15 per cent of employees did not report a salary (158 employees).
Workforce Information Report 2019-20
© 2020 Government of South Australia Public Page 38 of 67
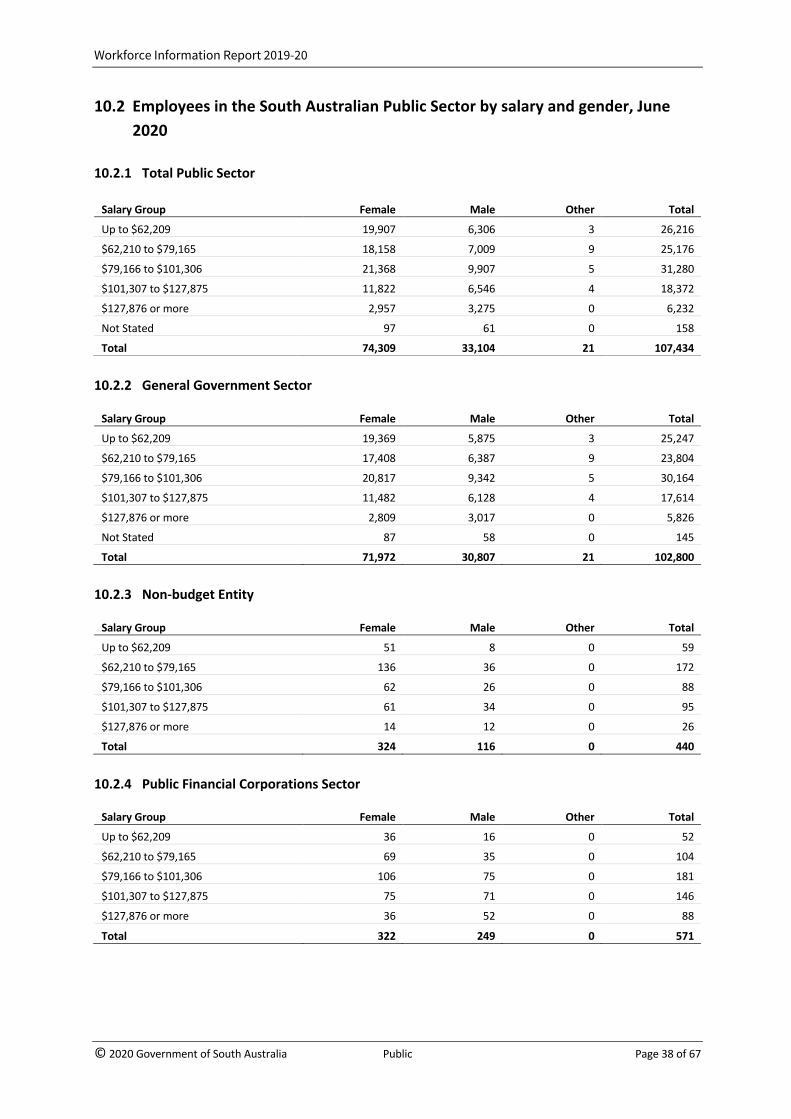
10.2 Employees in the South Australian Public Sector by salary and gender, June 2020
10.2.1 Total Public Sector
Salary Group Female Male Other Total
Up to $62,209 19,907 6,306 3 26,216
$62,210 to $79,165 18,158 7,009 9 25,176
$79,166 to $101,306 21,368 9,907 5 31,280
$101,307 to $127,875 11,822 6,546 4 18,372
$127,876 or more 2,957 3,275 0 6,232
Not Stated 97 61 0 158
Total 74,309 33,104 21 107,434
10.2.2 General Government Sector
Salary Group Female Male Other Total
Up to $62,209 19,369 5,875 3 25,247
$62,210 to $79,165 17,408 6,387 9 23,804
$79,166 to $101,306 20,817 9,342 5 30,164
$101,307 to $127,875 11,482 6,128 4 17,614
$127,876 or more 2,809 3,017 0 5,826
Not Stated 87 58 0 145
Total 71,972 30,807 21 102,800
10.2.3 Non-budget Entity
Salary Group Female Male Other Total
Up to $62,209 51 8 0 59
$62,210 to $79,165 136 36 0 172
$79,166 to $101,306 62 26 0 88
$101,307 to $127,875 61 34 0 95
$127,876 or more 14 12 0 26
Total 324 116 0 440
10.2.4 Public Financial Corporations Sector
Salary Group Female Male Other Total
Up to $62,209 36 16 0 52
$62,210 to $79,165 69 35 0 104
$79,166 to $101,306 106 75 0 181
$101,307 to $127,875 75 71 0 146
$127,876 or more 36 52 0 88
Total 322 249 0 571
Workforce Information Report 2019-20
© 2020 Government of South Australia Public Page 39 of 67
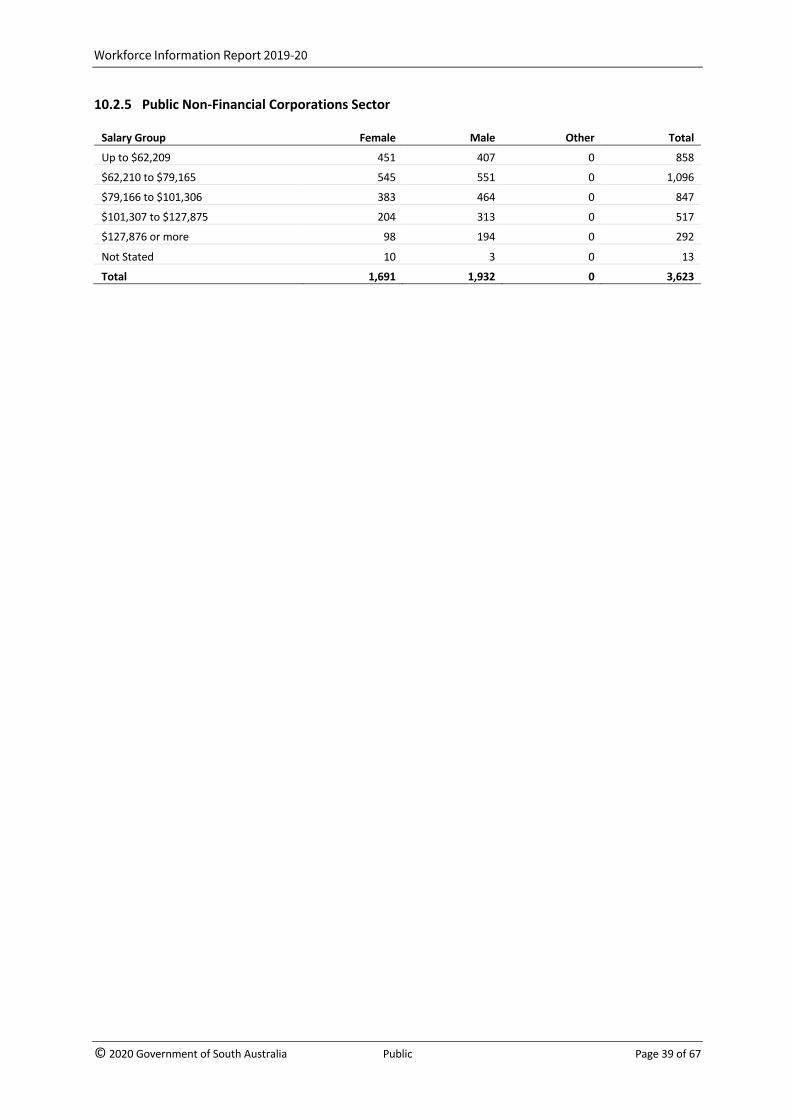
10.2.5 Public Non-Financial Corporations Sector
Salary Group Female Male Other Total
Up to $62,209 451 407 0 858
$62,210 to $79,165 545 551 0 1,096
$79,166 to $101,306 383 464 0 847
$101,307 to $127,875 204 313 0 517
$127,876 or more 98 194 0 292
Not Stated 10 3 0 13
Total 1,691 1,932 0 3,623

Workforce Information Report 2019-20
© 2020 Government of South Australia Public Page 40 of 67
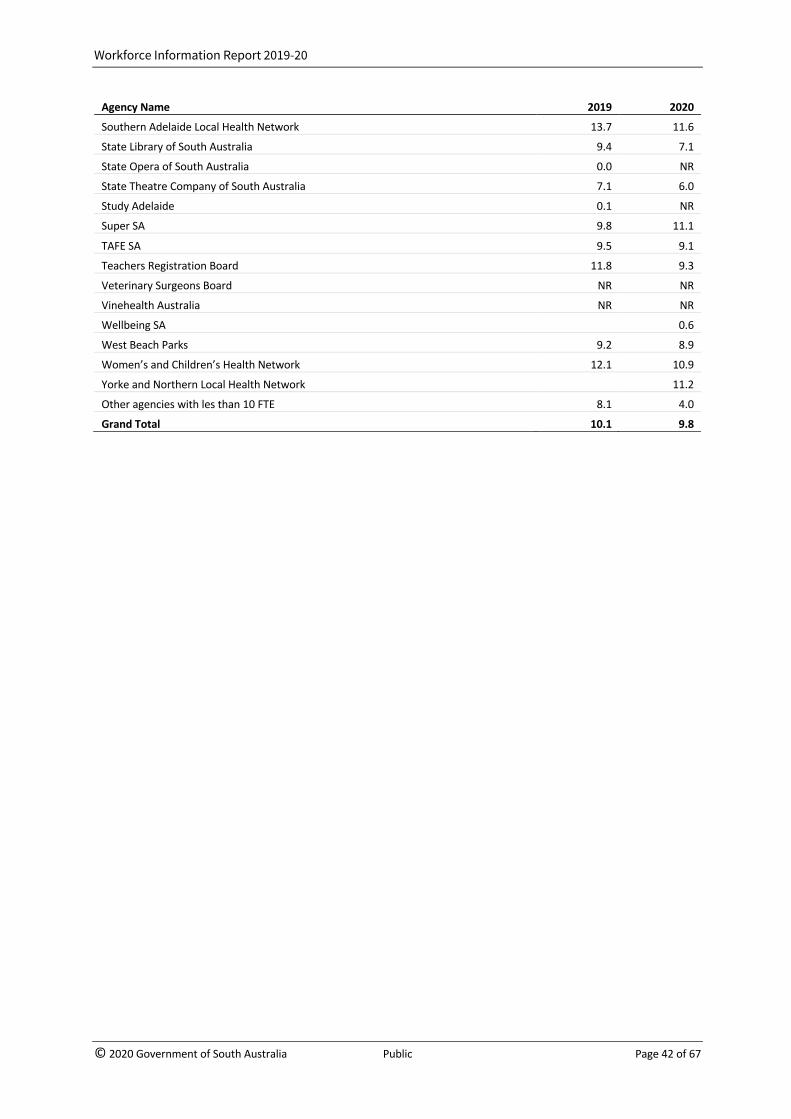
11 Sick leave/carer’s leave Total sick leave includes all absences due to illness, whether paid or unpaid, and those on account of family carer’s leave. Any public sector agency with a workforce less or equal to 10 average FTE for the 2018-19 or 2019-20 financial year is reported as ‘NR’ (‘not reported’) in the table below for one or both years and is reported under the aggregated entry ‘other agencies with less than 10 FTE’.
11.1.1 Average sick leave/carer’s leave days (paid and unpaid) per FTE, June 2019 to June 2020
Agency Name 2019 2020
Adelaide Cemeteries Authority N/A11 1.0
Adelaide Festival Centre Trust 0.0 2.5
Adelaide Festival Corporation 0.0 3.6
Adelaide Venue Management Corporation 8.7 10.5
Art Gallery of South Australia 9.4 7.9
Attorney-General's Department 7.9 7.7
Auditor-General's Department 10.3 6.1
Barossa Hills Fleurieu Local Health Network 11.6
Carclew Youth Arts Centre Incorporated 11.3 4.9
Carrick Hill NR NR
Central Adelaide Local Health Network 12.3 11.0
Commission on Excellence and Innovation in Health 0.5
Country Arts SA 6.9 9.6
Country Health SA Local Health Network12 12.4
Courts Administration Authority 11.4 10.9
CTP Regulator 7.0 4.9
Dairysafe NR NR
Defence SA NR 3.8
Department for Child Protection 13.0 9.8
Department for Correctional Services 13.8 12.8
Department for Education 7.5 7.8
Department for Energy and Mining13 8.5 7.6
Department for Environment and Water 7.9 7.2
Department for Health and Wellbeing 9.3 7.1
Department for Innovation and Skills13 9.5 5.7
Department for Trade, Tourism and Investment13 7.0 6.1
Department of Human Services 12.7 10.7
Department for Planning, Transport and Infrastructure 9.6 11.1
Department of Primary Industries and Regions 8.7 8.9
Department of the Premier and Cabinet13 11.7 5.9
Department of Treasury and Finance13 10.3 8.2
Education Standards Board 9.4 7.5
11 Information for Adelaide Cemeteries Authority sick/carer’s leave is not available to OCPSE for June 2019. 12 Country Health SA Local Network is reported as separate regional LHNs as at 30 June 2020. Please refer to Appendix A for more details. 13 The average sick leave days for agencies who were subject to Machinery of Government in 2018-19 may not be representative of actual leave taken as a result of employees moving between agencies and the way the leave data is collected.

Workforce Information Report 2019-20
© 2020 Government of South Australia Public Page 41 of 67
Agency Name 2019 2020
Electoral Commission of South Australia 5.9 4.2
Electorate Services 4.4 3.8
Environment Protection Authority 10.0 8.0
Essential Services Commission of South Australia 6.4 5.4
Eyre and Far North Local Health Network 10.4
Flinders and Upper North Local Health Network 10.9
ForestrySA 7.2 5.7
Funds SA 3.1 3.5
Government House 6.3 7.0
Green Industries SA 7.4 13.2
Health and Community Services Complaints Commissioner NR 8.8
History Trust of South Australia 5.3 6.5
HomeStart Finance 9.1 6.4
Independent Commissioner Against Corruption 5.5 5.9
Infrastructure SA NR 3.1
Jam Factory Contemporary Craft and Design 6.4 4.8
Legal Profession Conduct Commission 12.7 10.1
Legal Services Commission 10.4 7.7
Legislature (Including Members) 5.0 5.9
Lifetime Support Authority of South Australia 9.3 5.8
Limestone Coast Local Health Network 10.7
Northern Adelaide Local Health Network 13.0 11.2
Office for Recreation, Sport and Racing 3.8 6.2
Office of the Commissioner for Public Sector Employment 6.9 6.6
Office of the South Australian Productivity Commission 2.0 3.2
Public Trustee 13.7 10.8
Renewal SA 9.8 5.4
ReturnToWorkSA 11.3 9.2
Riverland Mallee Coorong Local Health Network 11.1
SA Ambulance Service 13.7 12.6
SA Housing Authority 5.8 9.0
SA Lotteries NR NR
SA Water 7.9 9.3
SACE Board of South Australia 7.3 6.5
South Australia Police 8.9 9.7
South Australian Country Fire Service 7.4 5.2
South Australian Film Corporation 8.7 10.3
South Australian Fire and Emergency Services Commission 8.4 7.9
South Australian Government Financing Authority 9.3 5.9
South Australian Mental Health Commission NR 5.4
South Australian Metropolitan Fire Service 9.2 12.5
South Australian Museum 6.8 8.3
South Australian Small Business Commissioner NR NR
South Australian State Emergency Services 6.9 4.0
South Australian Tourism Commission 3.9 4.5
Workforce Information Report 2019-20
© 2020 Government of South Australia Public Page 42 of 67
Agency Name 2019 2020
Southern Adelaide Local Health Network 13.7 11.6
State Library of South Australia 9.4 7.1
State Opera of South Australia 0.0 NR
State Theatre Company of South Australia 7.1 6.0
Study Adelaide 0.1 NR
Super SA 9.8 11.1
TAFE SA 9.5 9.1
Teachers Registration Board 11.8 9.3
Veterinary Surgeons Board NR NR
Vinehealth Australia NR NR
Wellbeing SA 0.6
West Beach Parks 9.2 8.9
Women’s and Children’s Health Network 12.1 10.9
Yorke and Northern Local Health Network 11.2
Other agencies with les than 10 FTE 8.1 4.0
Grand Total 10.1 9.8
Workforce Information Report 2019-20
© 2020 Government of South Australia Public Page 43 of 67
12 Employee movement
12.1 Summary
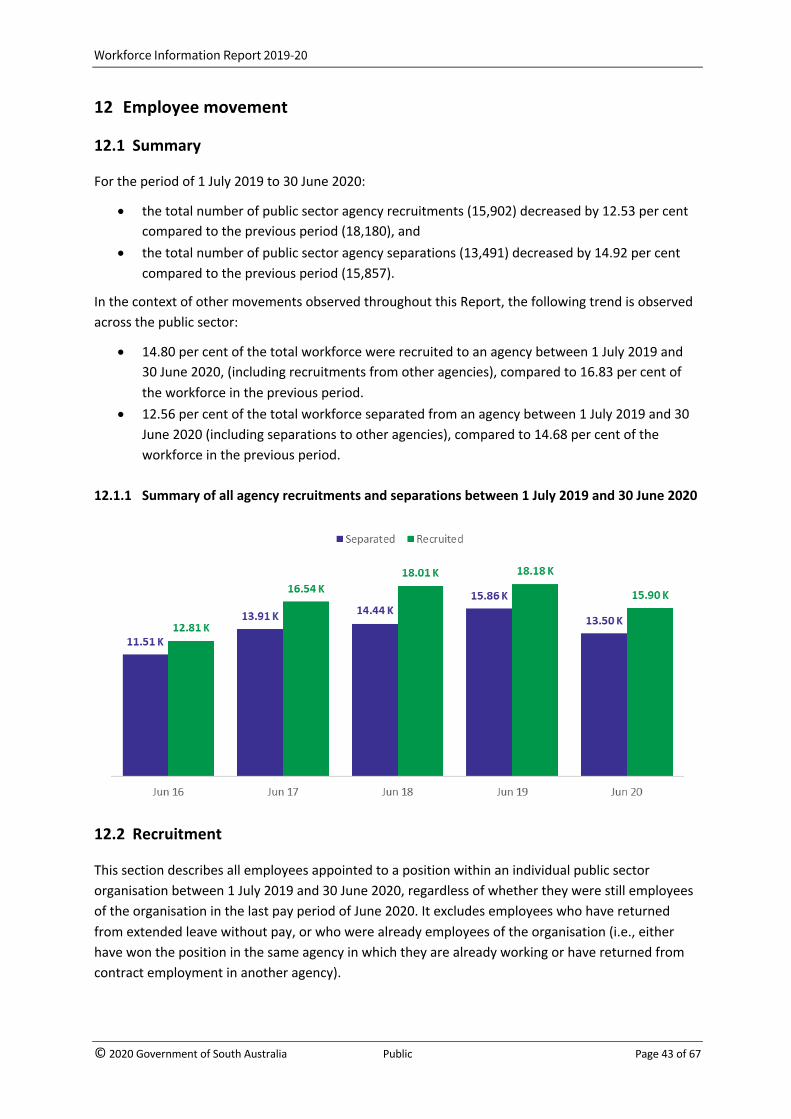
For the period of 1 July 2019 to 30 June 2020:
• the total number of public sector agency recruitments (15,902) decreased by 12.53 per cent compared to the previous period (18,180), and
• the total number of public sector agency separations (13,491) decreased by 14.92 per cent compared to the previous period (15,857).
In the context of other movements observed throughout this Report, the following trend is observed across the public sector:
• 14.80 per cent of the total workforce were recruited to an agency between 1 July 2019 and 30 June 2020, (including recruitments from other agencies), compared to 16.83 per cent of the workforce in the previous period.
• 12.56 per cent of the total workforce separated from an agency between 1 July 2019 and 30 June 2020 (including separations to other agencies), compared to 14.68 per cent of the workforce in the previous period.
12.1.1 Summary of all agency recruitments and separations between 1 July 2019 and 30 June 2020
12.2 Recruitment
This section describes all employees appointed to a position within an individual public sector organisation between 1 July 2019 and 30 June 2020, regardless of whether they were still employees of the organisation in the last pay period of June 2020. It excludes employees who have returned from extended leave without pay, or who were already employees of the organisation (i.e., either have won the position in the same agency in which they are already working or have returned from contract employment in another agency).

Workforce Information Report 2019-20
© 2020 Government of South Australia Public Page 44 of 67
This section does not specify employees recruited new to the South Australian Public Sector, only the number of employees who started in a public sector organisation between 1 July 2019 and 30 June 2020 and consequently may have originated from another South Australian Public Sector position.
12.2.1 Employees recruited to a South Australian Public Sector organisation between 1 July 2019 and 30 June 2020
Agency Name General Government
Sector
Non-Budget
Entity
Public Financial
Corporations Sector
Public Non-Financial
Corporations Sector
Grand Total
Children's Services Act 131 0 0 0 131
Disability Services Officers 191 0 0 0 191
Education Act 1,016 0 0 0 1,016
Emergency Services 151 0 0 0 151
Executive 120 1 15 12 148
Medical Officers 1,448 0 0 0 1,448
Nurses 2,552 0 0 0 2,552
Police Act 53 0 0 0 53
PS Act/Public Sector Salaried 6,075 39 35 185 6,334
School Services Officers 1,360 0 0 0 1,360
TAFE Act 175 0 0 0 175
Weekly Paid 833 0 0 43 876
Other 803 37 58 569 1,467
Total 14,908 77 108 809 15,902
12.3 Separations
This section describes employees who permanently left their individual agency between 1 July 2019 and 30 June 2020. It excludes temporary assignments to other public sector organisations, unpaid leave, or casual employees who did not work in the last pay period.
Employees who permanently left their individual agency are presented in this table by following categories:
• ‘Movement – within SA Public Sector’ includes employees that moved internally within the South Australian Public Sector. This includes employees moving to a different role within the same agency or transferring to a different agency within the South Australian Public Sector
• ‘Separation – left SA Public Sector’ includes employees that separated from the South Australian Public Sector. This includes employees resigning to a non-South Australian Public Sector role, or who left the workforce due to: a Targeted Voluntary Separation Package (TVSP); a worker’s compensation settlement; death; retirement; ill health; study; or family responsibilities.
• ‘Not Stated’ includes those employees who ended employment in a role between 1 July 2019 and 30 June 2020, but whose subsequent employment was not specified. Reasons for ending employment in a role include: dismissal, contract expiry or resignation. Agencies did not specify whether these employees subsequently moved to a different role within the South
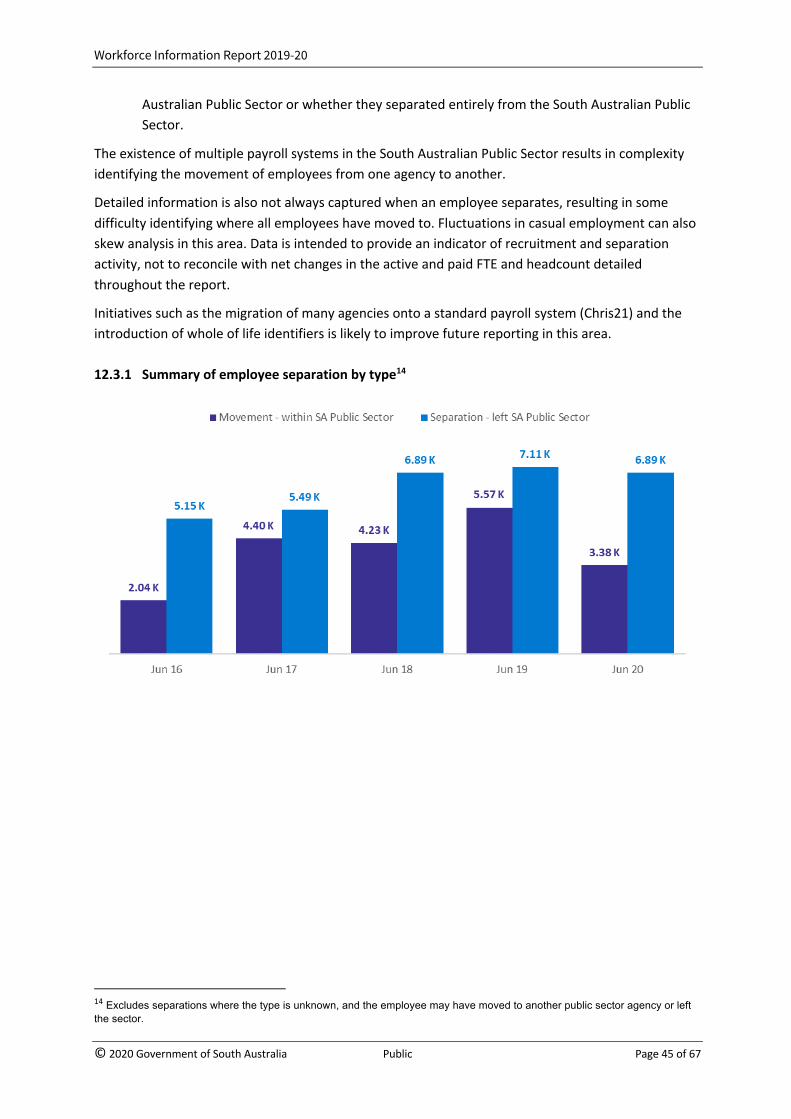
Workforce Information Report 2019-20
© 2020 Government of South Australia Public Page 45 of 67
Australian Public Sector or whether they separated entirely from the South Australian Public Sector.
The existence of multiple payroll systems in the South Australian Public Sector results in complexity identifying the movement of employees from one agency to another.
Detailed information is also not always captured when an employee separates, resulting in some difficulty identifying where all employees have moved to. Fluctuations in casual employment can also skew analysis in this area. Data is intended to provide an indicator of recruitment and separation activity, not to reconcile with net changes in the active and paid FTE and headcount detailed throughout the report.
Initiatives such as the migration of many agencies onto a standard payroll system (Chris21) and the introduction of whole of life identifiers is likely to improve future reporting in this area.
12.3.1 Summary of employee separation by type14
14 Excludes separations where the type is unknown, and the employee may have moved to another public sector agency or left the sector.

Workforce Information Report 2019-20
© 2020 Government of South Australia Public Page 46 of 67
12.3.2 Employees separation between 1 July 2019 and 30 June 2020
Agency Name Separation Type General
Government Sector
Non-Budget
Entity
Public Financial Corporations
Sector
Public Non-Financial
Corporations Sector Grand Total
Children's Services Act Movement - within SA Public Sector 0 0 0 0 0
Separation - left SA Public Sector 34 0 0 0 34
Not Stated 37 0 0 0 37 Disability Services Officers Movement - within SA Public Sector 5 0 0 0 5
Separation - left SA Public Sector 81 0 0 0 81
Not Stated 13 0 0 0 13 Education Act Movement - within SA Public Sector 6 0 0 0 6
Separation - left SA Public Sector 467 0 0 0 467
Not Stated 413 0 0 0 413 Emergency Services Movement - within SA Public Sector 2 0 0 0 2
Separation - left SA Public Sector 90 0 0 0 90
Not Stated 13 0 0 0 13 Executive Movement - within SA Public Sector 40 0 0 0 40
Separation - left SA Public Sector 76 1 4 5 86
Not Stated 23 0 3 5 31 Medical Officers Movement - within SA Public Sector 599 0 0 0 599
Separation - left SA Public Sector 297 0 0 0 297
Not Stated 384 0 0 0 384 Nurses Movement - within SA Public Sector 480 0 0 0 480
Separation - left SA Public Sector 1,168 0 0 0 1,168
Not Stated 236 0 0 0 236 Police Act Movement - within SA Public Sector 5 0 0 0 5
Separation - left SA Public Sector 108 0 0 0 108
Not Stated 24 0 0 0 24 PS Act/Public Sector Salaried Movement - within SA Public Sector 1,912 8 7 40 1,967
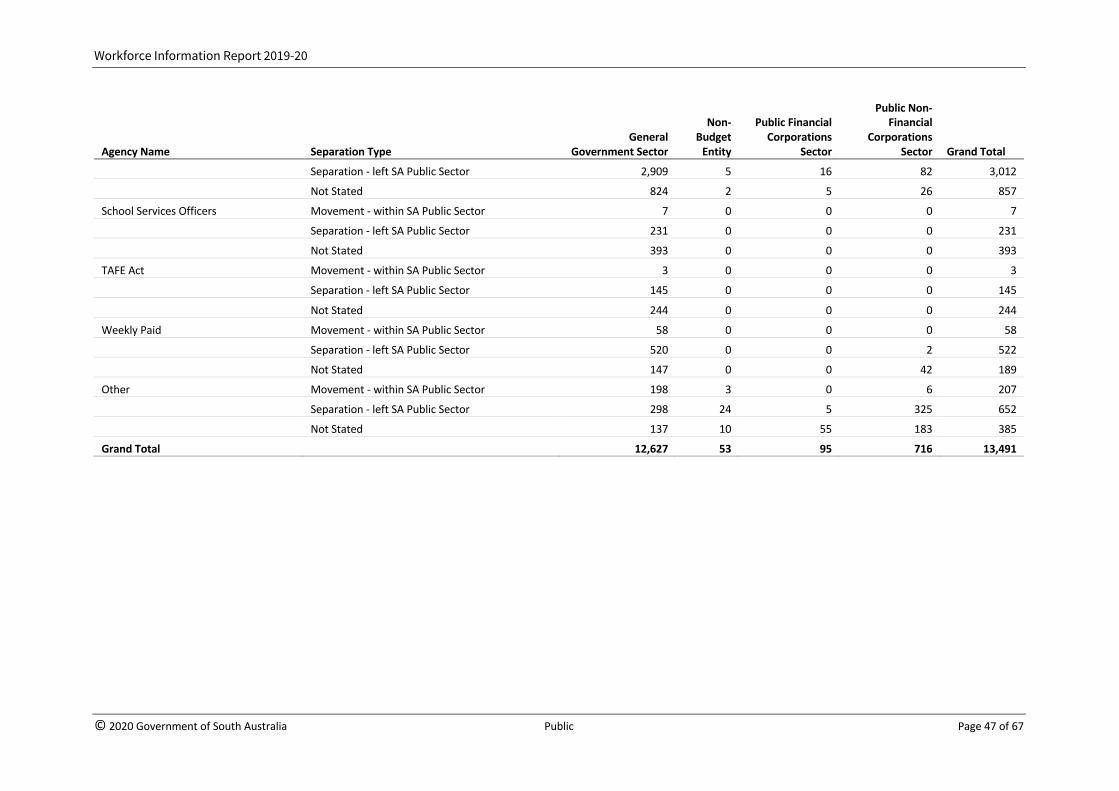
Workforce Information Report 2019-20
© 2020 Government of South Australia Public Page 47 of 67
Agency Name Separation Type General
Government Sector
Non-Budget
Entity
Public Financial Corporations
Sector
Public Non-Financial
Corporations Sector Grand Total
Separation - left SA Public Sector 2,909 5 16 82 3,012
Not Stated 824 2 5 26 857 School Services Officers Movement - within SA Public Sector 7 0 0 0 7
Separation - left SA Public Sector 231 0 0 0 231
Not Stated 393 0 0 0 393 TAFE Act Movement - within SA Public Sector 3 0 0 0 3
Separation - left SA Public Sector 145 0 0 0 145
Not Stated 244 0 0 0 244 Weekly Paid Movement - within SA Public Sector 58 0 0 0 58
Separation - left SA Public Sector 520 0 0 2 522
Not Stated 147 0 0 42 189 Other Movement - within SA Public Sector 198 3 0 6 207
Separation - left SA Public Sector 298 24 5 325 652
Not Stated 137 10 55 183 385 Grand Total 12,627 53 95 716 13,491

Workforce Information Report 2019-20
© 2020 Government of South Australia Public Page 48 of 67
13 Summary of key information, by agency The Office of the Commissioner for Public Sector Employment provides a number of resources that describe an agency’s size and composition, including a comprehensive data dashboard. This information can be accessed through publicsector.sa.gov.au
Agency Name FTE Female
Headcount Male
Headcount Other
Headcount
Female Executive
Headcount
Male Executive
Headcount
Other Executive
Headcount
Aboriginal Employee
Headcount
Employees with
Disability Headcount
Average Salary
Adelaide Cemeteries Authority 47 14 36 3 0 0 $77,812 Adelaide Festival Centre Trust 106 199 155 2 1 1 3 $71,513 Adelaide Festival Corporation 25 22 4 2 1 0 0 $94,142 Adelaide Venue Management Corporation 169 106 119 2 4 6 2 $69,611 Art Gallery of South Australia 68 50 23 1 3 0 $80,727 Attorney-General's Department 1,214 891 430 41 30 40 42 $97,951 Auditor-General's Department 129 68 68 1 6 3 1 $92,373 Barossa Hills Fleurieu Local Health Network 1,082 1,376 135 1 44 10 $68,442 Carclew Youth Arts Centre Incorporated 19 17 5 4 2 0 $79,600 Central Adelaide Local Health Network 11,577 10,542 3,539 3 16 17 108 118 $98,816 Commission on Excellence and Innovation in Health 21 12 10 2 3 0 0 $144,105 Country Arts SA 39 40 7 1 2 0 $78,997 Courts Administration Authority 654 478 247 19 10 $75,602 CTP Regulator 26 15 11 2 1 0 1 $111,746 Defence SA 25 16 11 3 7 0 1 $140,203 Department for Child Protection 2,162 1,801 519 10 3 118 38 $80,181 Department for Correctional Services 1,854 835 1,100 6 4 88 30 $73,470 Department for Education 24,727 24,069 7,011 6 363 218 737 559 $80,543 Department for Energy and Mining 316 149 183 6 16 9 8 $103,937 Department for Environment and Water 1,477 799 795 12 14 51 24 $85,717 Department for Health and Wellbeing 1,323 786 626 23 23 19 12 $97,570 Department for Innovation and Skills 337 209 139 9 10 7 6 $101,582
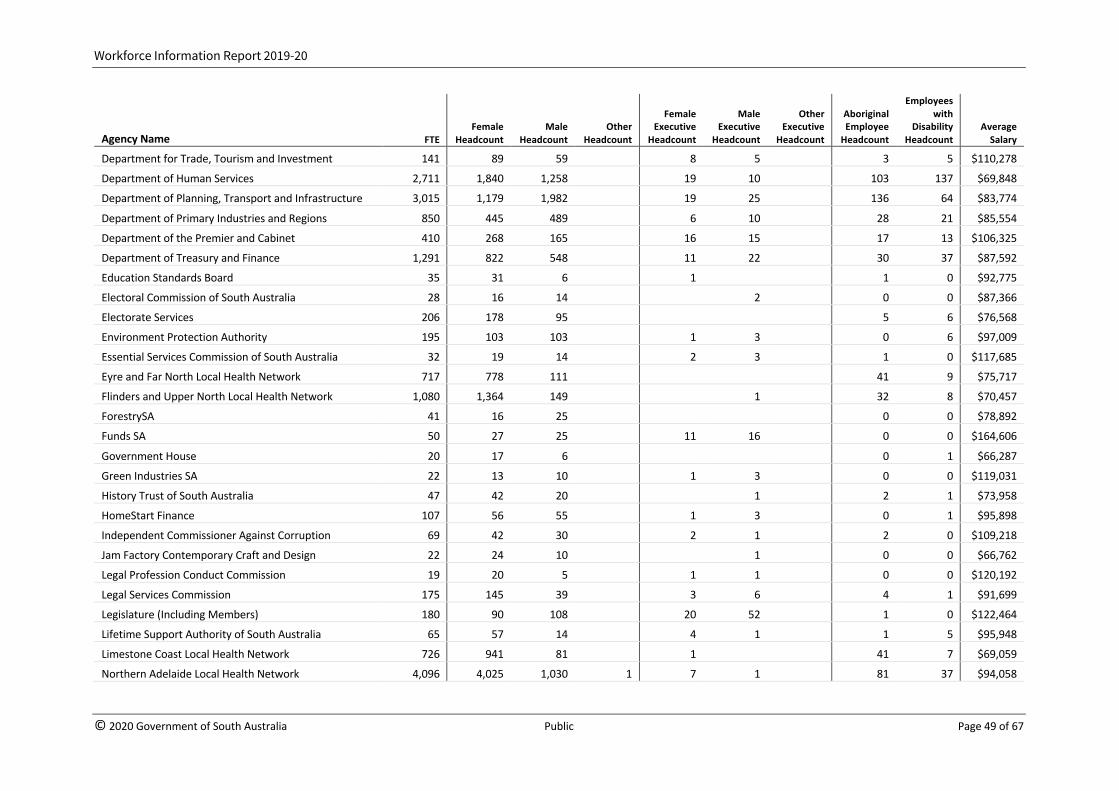
Workforce Information Report 2019-20
© 2020 Government of South Australia Public Page 49 of 67
Agency Name FTE Female
Headcount Male
Headcount Other
Headcount
Female Executive
Headcount
Male Executive
Headcount
Other Executive
Headcount
Aboriginal Employee
Headcount
Employees with
Disability Headcount
Average Salary
Department for Trade, Tourism and Investment 141 89 59 8 5 3 5 $110,278 Department of Human Services 2,711 1,840 1,258 19 10 103 137 $69,848 Department of Planning, Transport and Infrastructure 3,015 1,179 1,982 19 25 136 64 $83,774 Department of Primary Industries and Regions 850 445 489 6 10 28 21 $85,554 Department of the Premier and Cabinet 410 268 165 16 15 17 13 $106,325 Department of Treasury and Finance 1,291 822 548 11 22 30 37 $87,592 Education Standards Board 35 31 6 1 1 0 $92,775 Electoral Commission of South Australia 28 16 14 2 0 0 $87,366 Electorate Services 206 178 95 5 6 $76,568 Environment Protection Authority 195 103 103 1 3 0 6 $97,009 Essential Services Commission of South Australia 32 19 14 2 3 1 0 $117,685 Eyre and Far North Local Health Network 717 778 111 41 9 $75,717 Flinders and Upper North Local Health Network 1,080 1,364 149 1 32 8 $70,457 ForestrySA 41 16 25 0 0 $78,892 Funds SA 50 27 25 11 16 0 0 $164,606 Government House 20 17 6 0 1 $66,287 Green Industries SA 22 13 10 1 3 0 0 $119,031 History Trust of South Australia 47 42 20 1 2 1 $73,958 HomeStart Finance 107 56 55 1 3 0 1 $95,898 Independent Commissioner Against Corruption 69 42 30 2 1 2 0 $109,218 Jam Factory Contemporary Craft and Design 22 24 10 1 0 0 $66,762 Legal Profession Conduct Commission 19 20 5 1 1 0 0 $120,192 Legal Services Commission 175 145 39 3 6 4 1 $91,699 Legislature (Including Members) 180 90 108 20 52 1 0 $122,464 Lifetime Support Authority of South Australia 65 57 14 4 1 1 5 $95,948 Limestone Coast Local Health Network 726 941 81 1 41 7 $69,059 Northern Adelaide Local Health Network 4,096 4,025 1,030 1 7 1 81 37 $94,058

Workforce Information Report 2019-20
© 2020 Government of South Australia Public Page 50 of 67
Agency Name FTE Female
Headcount Male
Headcount Other
Headcount
Female Executive
Headcount
Male Executive
Headcount
Other Executive
Headcount
Aboriginal Employee
Headcount
Employees with
Disability Headcount
Average Salary
Office for Recreation, Sport and Racing 80 40 46 1 1 2 1 $87,650 Office of the Commissioner for Public Sector Employment 61 46 20 2 1 5 3 $112,131 Office of the South Australian Productivity Commission 14 8 9 1 2 1 0 $111,224 Public Trustee 177 116 71 1 2 2 9 $79,477 Renewal SA 128 69 62 5 16 1 2 $114,270 ReturnToWorkSA 243 140 111 3 4 1 0 $107,620 Riverland Mallee Coorong Local Health Network 1,603 1,926 286 2 54 23 $80,860 SA Ambulance Service 1,644 932 878 1 1 5 20 8 $83,567 SA Housing Authority 825 580 306 6 5 46 45 $82,806 SA Water 1,554 501 1,109 11 22 42 19 $93,166 SACE Board of South Australia 104 74 38 3 1 0 3 $100,855 South Australia Police 5,798 2,203 3,759 3 5 10 96 30 $92,788 South Australian Country Fire Service 167 76 99 1 2 2 9 $86,706 South Australian Film Corporation 19 16 6 1 1 1 $85,014 South Australian Fire and Emergency Services Commission 73 53 22 1 0 2 $98,040 South Australian Government Financing Authority 81 42 44 1 4 1 1 $103,867 South Australian Metropolitan Fire Service 1,044 77 1,182 2 11 3 $86,385 South Australian Museum 69 42 38 2 8 4 $87,146 South Australian State Emergency Services 68 34 36 2 2 0 $90,156 South Australian Tourism Commission 114 85 38 2 3 1 0 $96,424 Southern Adelaide Local Health Network 5,915 5,805 1,723 2 6 3 77 37 $96,690 State Library of South Australia 120 93 43 2 1 2 6 $83,687 State Opera of South Australia 10 9 2 1 0 0 $80,987 State Theatre Company of South Australia 27 18 11 2 1 0 $74,856 Study Adelaide 12 10 2 1 0 0 $98,409 Super SA 157 110 54 5 1 2 3 $86,886

Workforce Information Report 2019-20
© 2020 Government of South Australia Public Page 51 of 67
Agency Name FTE Female
Headcount Male
Headcount Other
Headcount
Female Executive
Headcount
Male Executive
Headcount
Other Executive
Headcount
Aboriginal Employee
Headcount
Employees with
Disability Headcount
Average Salary
TAFE SA 1,906 1,405 814 14 7 21 9 $88,934 Teachers Registration Board 27 21 7 1 0 1 $100,219 Wellbeing SA 89 85 16 4 3 1 $99,374 West Beach Parks 84 90 49 3 1 1 2 $51,040 Women’s and Children’s Health Network 2,766 3,222 469 1 7 2 70 24 $102,268 Yorke and Northern Local Health Network 944 1,219 116 1 32 11 $73,427 Agencies with less than 10 FTE15 33 21 14 0 1 4 0 0 1 $112,500 Total 89,696 74,309 33,104 21 727 651 2,291 1,482 $87,102
15 To protect the privacy of individuals, agencies with fewer than 10 FTE are not included in this table. These agencies are Carrick Hill, Dairysafe, Health and Community Services Complaints Commissioner, Infrastructure SA, Veterinary Surgeons Board, and Vinehealth Australia.

Workforce Information Report 2019-20
© 2020 Government of South Australia Public Page 52 of 67
14 Appendix A: Explanation of SA Public Sector agencies Data in this Report is aligned with Department of Treasury and Finance publications to provide a consistent presentation of the public sector in South Australia, based on each agency’s status as a budget entity.
This Report provides information for agencies based on the following definitions:
• General Government Sector agencies cover the largest portion of government services and are predominantly funded by taxpayers. • Public Non-Financial Corporations (PNFC) and Public Financial Corporation’ (PFC) agencies are categorised separately. PNFCs generate revenue
through user charges and PFCs generally provide intermediate financial services. • Non-budget entities are covered by public sector employment conditions, but have minimal or no State Budget funding.
Agencies may also additional be grouped into a ‘workforce sector’ which more closely align to services an agency provides to South Australia.
14.1 General Government Sector
Workforce Sector Publication Name Notes
Health Barossa Hills Fleurieu Local Health Network Formerly reported as an entity of 'Country Health SA Local Health Network'. Includes employees who are employed under SA Health Care Act 2008.
Health Central Adelaide Local Health Network Includes employees who are employed under SA Health Care Act 2008. Health Commission on Excellence and Innovation in Health This entity was created during the reporting period. Health Country Health SA Local Health Network During the reporting period, this entity was replaced by regional Local Health Networks. Health Department for Health and Wellbeing
Health Eyre and Far North Local Health Network Formerly reported as an entity of 'Country Health SA Local Health Network'. Includes employees who are employed under SA Health Care Act 2008.
Health Flinders and Upper North Local Health Network Formerly reported as an entity of 'Country Health SA Local Health Network'. Includes employees who are employed under SA Health Care Act 2008.
Health Health and Community Services Complaints Commissioner
Health Limestone Coast Local Health Network Formerly reported as an entity of 'Country Health SA Local Health Network'. Includes employees who are employed under SA Health Care Act 2008
Health Northern Adelaide Local Health Network Includes employees who are employed under SA Health Care Act 2008.
Health Riverland Mallee Coorong Local Health Network Formerly reported as an entity of 'Country Health SA Local Health Network'. Includes employees who are employed under SA Health Care Act 2008.
Health SA Ambulance Service Health South Australian Mental Health Commission Entity ceased during reporting period.

Workforce Information Report 2019-20
© 2020 Government of South Australia Public Page 53 of 67
Workforce Sector Publication Name Notes Health Southern Adelaide Local Health Network Includes employees who are employed under SA Health Care Act 2008. Health Wellbeing SA This entity was created during the reporting period. Health Women’s and Children’s Health Network Includes employees who are employed under SA Health Care Act 2008.
Health Yorke and Northern Local Health Network Formerly reported as an entity of 'Country Health SA Local Health Network'. Includes employees who are employed under SA Health Care Act 2008.
Education Department for Education
Education TAFE SA Police South Australia Police Emergency Services South Australian Country Fire Service Emergency Services South Australian Fire and Emergency Services Commission Emergency Services South Australian Metropolitan Fire Service Emergency Services South Australian State Emergency Services General Government Adelaide Festival Corporation General Government Art Gallery of South Australia
General Government Attorney-General's Department Excludes the Office of the Public Trustee of South Australia, as these entities are reported separately.
General Government Auditor-General's Department General Government Carclew Youth Arts Centre Incorporated General Government Carrick Hill General Government Country Arts SA General Government Courts Administration Authority Excludes persons employed under Special Acts and the Judicial Administration Act. General Government CTP Regulator General Government Dairysafe General Government Defence SA General Government Department for Child Protection General Government Department for Correctional Services General Government Department for Energy and Mining General Government Department for Environment and Water General Government Department for Innovation and Skills General Government Department for Trade, Tourism and Investment This agency appears in this Report as it was at 30 June 2020.
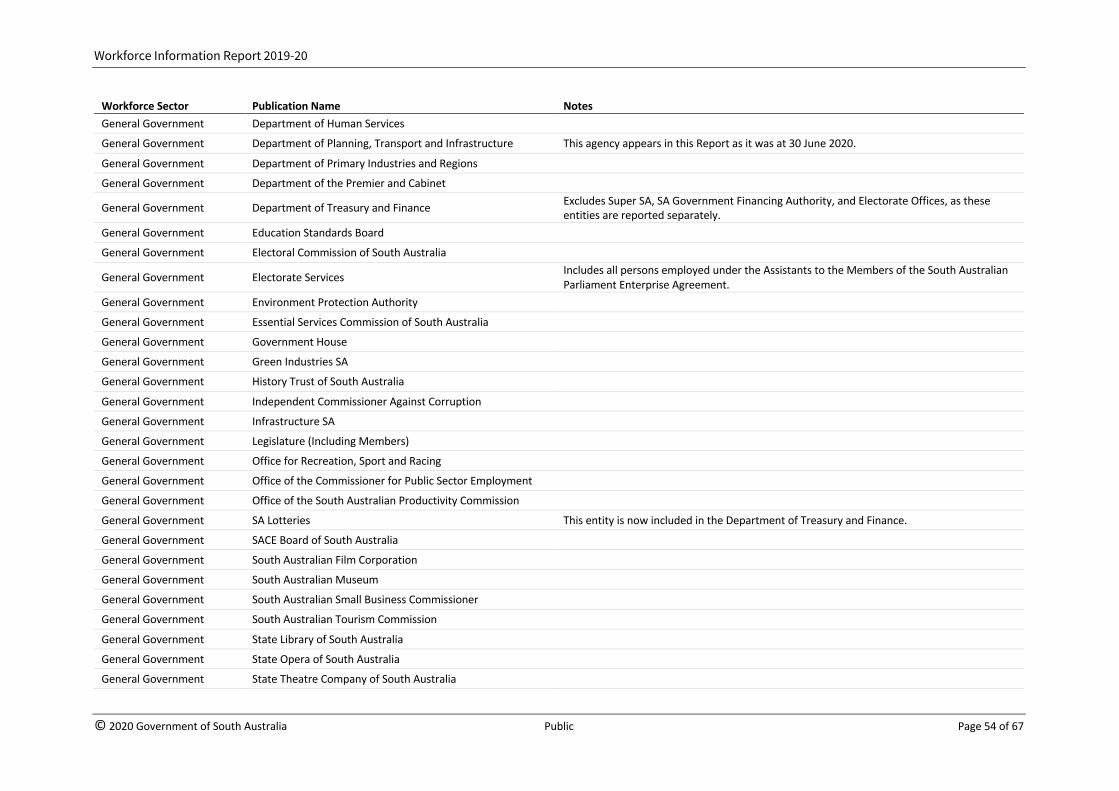
Workforce Information Report 2019-20
© 2020 Government of South Australia Public Page 54 of 67
Workforce Sector Publication Name Notes General Government Department of Human Services General Government Department of Planning, Transport and Infrastructure This agency appears in this Report as it was at 30 June 2020. General Government Department of Primary Industries and Regions General Government Department of the Premier and Cabinet
General Government Department of Treasury and Finance Excludes Super SA, SA Government Financing Authority, and Electorate Offices, as these entities are reported separately.
General Government Education Standards Board General Government Electoral Commission of South Australia
General Government Electorate Services Includes all persons employed under the Assistants to the Members of the South Australian Parliament Enterprise Agreement.
General Government Environment Protection Authority General Government Essential Services Commission of South Australia General Government Government House General Government Green Industries SA General Government History Trust of South Australia General Government Independent Commissioner Against Corruption General Government Infrastructure SA General Government Legislature (Including Members) General Government Office for Recreation, Sport and Racing General Government Office of the Commissioner for Public Sector Employment General Government Office of the South Australian Productivity Commission General Government SA Lotteries This entity is now included in the Department of Treasury and Finance. General Government SACE Board of South Australia General Government South Australian Film Corporation General Government South Australian Museum General Government South Australian Small Business Commissioner
General Government South Australian Tourism Commission General Government State Library of South Australia General Government State Opera of South Australia General Government State Theatre Company of South Australia
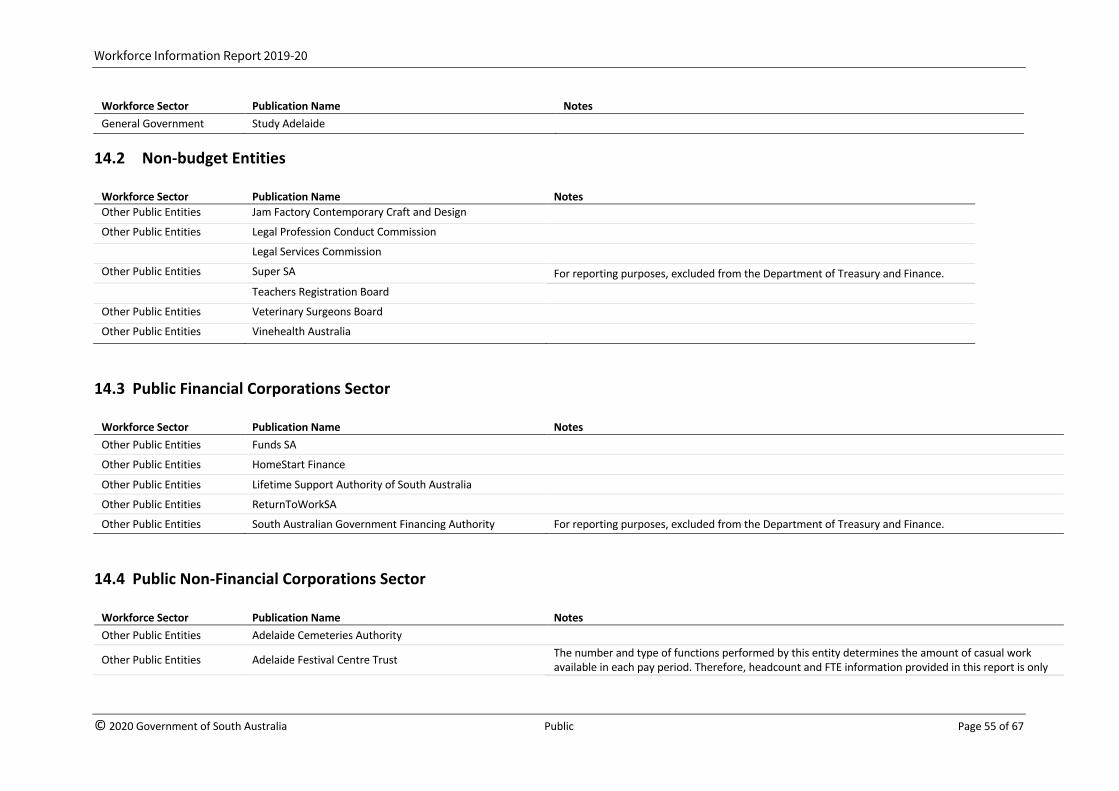
Workforce Information Report 2019-20
© 2020 Government of South Australia Public Page 55 of 67
Workforce Sector Publication Name Notes General Government Study Adelaide
14.2 Non-budget Entities
Workforce Sector Publication Name Notes Other Public Entities Jam Factory Contemporary Craft and Design Other Public Entities Legal Profession Conduct Commission
Legal Services Commission Other Public Entities Super SA For reporting purposes, excluded from the Department of Treasury and Finance.
Teachers Registration Board Other Public Entities Veterinary Surgeons Board Other Public Entities Vinehealth Australia
14.3 Public Financial Corporations Sector
Workforce Sector Publication Name Notes Other Public Entities Funds SA Other Public Entities HomeStart Finance Other Public Entities Lifetime Support Authority of South Australia Other Public Entities ReturnToWorkSA Other Public Entities South Australian Government Financing Authority For reporting purposes, excluded from the Department of Treasury and Finance.
14.4 Public Non-Financial Corporations Sector
Workforce Sector Publication Name Notes Other Public Entities Adelaide Cemeteries Authority
Other Public Entities Adelaide Festival Centre Trust The number and type of functions performed by this entity determines the amount of casual work available in each pay period. Therefore, headcount and FTE information provided in this report is only
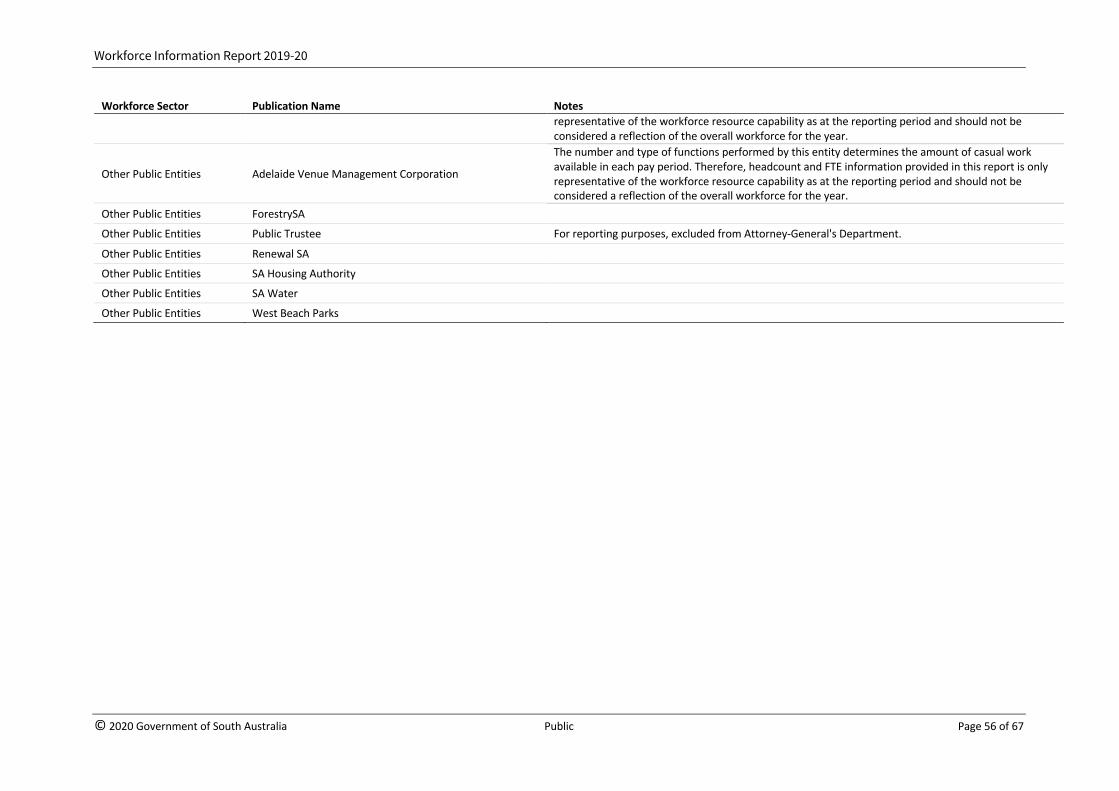
Workforce Information Report 2019-20
© 2020 Government of South Australia Public Page 56 of 67
Workforce Sector Publication Name Notes representative of the workforce resource capability as at the reporting period and should not be considered a reflection of the overall workforce for the year.
Other Public Entities Adelaide Venue Management Corporation
The number and type of functions performed by this entity determines the amount of casual work available in each pay period. Therefore, headcount and FTE information provided in this report is only representative of the workforce resource capability as at the reporting period and should not be considered a reflection of the overall workforce for the year.
Other Public Entities ForestrySA Other Public Entities Public Trustee For reporting purposes, excluded from Attorney-General's Department. Other Public Entities Renewal SA Other Public Entities SA Housing Authority Other Public Entities SA Water Other Public Entities West Beach Parks
Workforce Information Report 2019-20
© 2020 Government of South Australia Public Page 57 of 67
15 Appendix B: Explanation of terms
15.1 Persons included in workforce reports
Persons counted as employees are those paid and/or who received a salary in the last full pay period before 30 June of the relevant year. Due to differing pay period end dates this may vary across public sector organisations.
These include:
• Persons on the payroll
• Persons on leave paid in advance
• Persons receiving workers compensation payments
• Persons paid from funds administered by the organisation
• Statutory appointees, e.g. Commissioners
• Casual employees and persons paid on an hourly or sessional basis
• Relief and contract teachers employed under the Education Act 1972
• Ministerial staff and electorate office staff of a Member of Parliament.
• Vocational students
• Employees appointed on a term or contract basis
• Supernumerary employees employed under special recruitment schemes
• Persons employed and paid under the federal Government’s Australian Apprenticeships Incentive Program or Career Start SA (formerly South Australian Government Youth Training Initiative), i.e. trainees, apprentices.
• Persons employed and paid under the SA Government Graduate Register
• National Indigenous Cadetship Program (NICP) participants who are undertaking a 12-month temporary placement
• Ministers of the Crown and Members of Parliament (included under Legislature only).
Persons excluded from the calculation are:
• Persons on leave without pay • Members of part time boards and committees • Persons working on a fee for service contract and paid on a non-time basis, e.g. cleaners paid
per square metre • Persons employed on a temporary hourly basis from external employment agencies • Persons working under the Work for the Dole scheme.
Please note: Employment levels and full time equivalent (FTE) employment is subject to systematic and seasonal fluctuations which determines both the number of employees and the number of hours worked in any given pay period.

Workforce Information Report 2019-20
© 2020 Government of South Australia Public Page 58 of 67
15.2 South Australian Public Sector
The definition of the South Australian Public Sector is based on the Standard Institutional Sector Classification of Australia (SISCA) and other associated economic sector classifications. These have been developed by the Australian Bureau of Statistics (ABS) and are detailed in the ABS publication titled Standard Economic Sector Classifications of Australia, 2008 (Catalogue No. 1218.0).
Under this definition the South Australian Public Sector includes:
• Government departments formally established and maintained under the Public Sector Act 2009.
• Statutory bodies established to regulate or market commodities, industries and occupational groups.
• Subsidiary organisations of public sector organisations.
• Other bodies where a public sector organisation has complete or majority ownership of voting shares or other forms of voting capital which entitles them to control general corporate policy.
Public sector agencies are categorised in this report consistent with Department of Treasury and Finance publications, as follows:
• General Government Sector: the sector of government that includes all government agencies that provide services free of charge or at prices significantly below the cost of production or provide regulatory services.
• Public Financial Corporation (PFC): Government controlled entity that is mainly engaged in financial intermediation or the provision of auxiliary financial services.
• Public Non-Financial Corporation (PNFC): Government controlled entity that is mainly engaged in the production of market goods and/or non-financial services, which recovers a significant portion of its costs through user charges.
• Non-Budget Entity: Meets the ABS definition but has minimal or no State Budget funding.
15.3 Full Time Equivalent (FTE)
Full time equivalent (FTE) is a unit that indicates the fraction of hours worked by an employee/s working on a part-time basis, when compared with the number of hours that the same employee/s would otherwise work if they were employed on a full time basis.
To calculate a full time equivalent, each part time employee is counted as a decimal fraction by dividing the number of hours worked each week by the normal full-time hours per week for that position.
For example, in a position in which 37.5 hours each week is full time:
• 30.0 hours = 0.8 FTE
• 37.5 hours = 1.0 FTE
The FTE figure for a single employee must not be expressed as more than one full time equivalent (1.0).

Workforce Information Report 2019-20
© 2020 Government of South Australia Public Page 59 of 67
The FTE for casual employees worked in the last pay period is calculated based on hours worked as a proportion of full time hours. The figure stated is for the relevant pay period only and not an average over the course of the year. Casual employees who did not work in the last pay period are not included in this report.
FTE in this report have been displayed with zero decimals (some totals may be distorted due to rounding).
15.4 Average FTE Over Period
The average full time equivalent (FTE) of employees is the estimated average number of full time equivalent personnel over a financial year.
The number of intervals within the period will be used to calculate the average FTE figure over the period. Generally, fortnightly or monthly intervals are used.
Once this is determined, the average FTE figure is calculated as follows:
Sum of FTE at the end of each interval divided by the number of intervals, for example, to calculate the average FTE figure using monthly intervals for the period January 1 to June 30, assuming that the FTE figure for the last day of each month was 61.0 at January, 60.1 at February, 63.2 at March, 63.4 at April, 67.3 at May, 64.2 at June, the calculation would be:
Average FTE =61.0+ 60.1+ 63.2 + 63.4 + 67.3 + 64.2 divided by 6 (number of months) = 63.2.
15.5 Employee type
For the purposes of this report employees have been reported under the following broad employee type categories. These categories represent the major employee groups across the South Australian Public Sector.
15.5.1 Children’s Services Act
The Children’s Services Act workforce includes all persons engaged under the Children’s Services Act 1985. Children's Services Act employees are pre-school teaching staff (including permanent, contract and relief Children's Services Officers), seconded teachers who are employed to develop curriculum, early childhood workers (engaged under the Early Childhood Workers Award) who provide a support and assistance function to South Australian public pre-school sites, and pre-school directors who teach children and manage staff/sites in South Australian public pre-schools. Children’s Services employees are employed by the Department for Education.
15.5.2 Disability Services Officers
The Disability Services Officer workforce covers those persons employed under the Intellectual Disability Services Award. These employees provide daily living support to residents who have an intellectual disability.
Workforce Information Report 2019-20
© 2020 Government of South Australia Public Page 60 of 67
15.5.3 Education Act
The Education Act workforce encompasses all persons engaged under the Education Act 1972, excluding school services officers and Aboriginal education workers who are reported elsewhere.
Education Act employees include; teachers; seconded teachers employed to develop curriculum or provide specialist support such as training or advice; coordinators, assistant principals and deputy principals who manage a specific function, project(s) or a team of teachers (deputy principals also act in the principals’ absence); and principals who are responsible for the development and achievement of the schools’ goals and objectives, manage staff and the physical and financial resources of the school. Education Act employees also include hourly paid instructors and temporary relieving teachers who are employed on a casual or ad hoc basis to backfill teaching staff absent on leave (such as sick leave or leave without pay to a maximum of 20 continuous working days). Education Act employees are employed by the Department for Education.
15.5.4 Emergency services
The emergency services workforce comprises fire fighters from the South Australian Metropolitan Fire Service and ambulance officers from the South Australian Ambulance Service. Volunteer fire fighters from the South Australian Country Fire Service and volunteer emergency workers from the SA Fire and Emergency Services Commission are not included as public sector employees.
15.5.5 Executives
For the purposes of this report, executives are defined as employees who:
Receive a total salary equivalent to $154,678 per annum or more;
Or,
Receive a Total Remuneration Package Value (TRPV) type contract equivalent to $154,678 per annum or more. A total remuneration package includes monetary benefits such as salary and allowances, plus employer superannuation contributions and other non-monetary benefits such as a vehicle.
Or,
Are employed under the Public Sector Act in a recognised executive role i.e. with one of the following classification types: EL, EX, MLS, or SAES.
A total remuneration package may include monetary benefits such as salary and allowances, plus non-monetary benefits such as the use of a vehicle and employer superannuation contribution.
This definition does not include persons with non-executive responsibilities who are paid additional allowances for specialist skills or for the purposes of attraction and retention, which take them over the financial thresholds listed above.
This employee type includes statutory appointments, managers, chief executive officers, professional specialists, medical officers, nurses and legal services officers employed at the executive level across the administrative units and other public sector organisations.
Workforce Information Report 2019-20
© 2020 Government of South Australia Public Page 61 of 67
15.5.6 Medical officers
Medical officers are all those persons engaged under the South Australian Medical Officers Award. It includes all senior registrars, medical officers, medical practitioners, visiting medical specialists and consultants.
15.5.7 Nurses
The nursing workforce covers all persons engaged under the Nurses (South Australian Public Sector) Award. It includes all registered and enrolled nurses, nurse educators, clinical nurses and nurse managers employed within the South Australian health sector.
15.5.8 Other Acts and Awards
Includes statutory appointees (for example, Commissioners and the State Coroner, the Official and Deputy Secretaries of Government House, and the Employee Ombudsman), Ministerial appointees, electorate secretaries, parliamentary officers, Aboriginal education workers, medical and grant funded scientists, clinical academics and dental officers (dentists). This employee group also includes any other persons not categorised in the employee types listed who are employed in organisations that meet the definition of a public sector organisation.
15.5.9 Police Act
The Police Act workforce covers all persons engaged under the Police Act 1998. Police Act employees are employed by South Australia Police and include police officers, police cadets and community constables.
15.5.10 Public Sector Act
Public Sector Act employees refer to those persons who are employed under the Public Sector Act 2009 (Public Sector Act). This group of employees generally include persons employed across the five major remuneration structures of Administrative Services, Operational Services, Professional Officers, Technical Grades and Allied Health Professionals.
Public Sector Act employees are employed as ongoing, contract short term, contract long term and contract casual employees. For the purposes of public sector wide reporting, the contract casual appointment type will be reported under the other appointment type.
15.5.11 Public Sector Salaried Award
Employees covered by the SA Public Sector Salaried Employees Interim Award (SAPSSEI Award) are employed in the classifications of Administrative, Professional, Operation or Technical Services within:
• an agency where the Chief Executive, Department of Treasury and Finance is the declared employer of public employees under the Fair Work Act 1994.
• the Department of Health and Wellbeing (including incorporated hospitals and SA Ambulance Service under the Health Care Act 2008).
• one of the statutory authorities listed in Schedule 1 of the SAPSSEI Award.
Workforce Information Report 2019-20
© 2020 Government of South Australia Public Page 62 of 67
15.5.12 School Services Officers
School services officers covers all persons engaged under the School Services Officers (Government Schools) Award. These employees provide an administration and support function to South Australia’s public schools and are employed by the Department for Education.
15.5.13 TAFE SA Act
TAFE SA Act employees are lecturers and hourly paid instructors who work in the TAFE SA institutions. These employees are employed under the TAFE SA Act 2012.
15.5.14 Trainee, Apprenticeship and Graduate Entry Programs
This employee type covers a range of trainee, apprenticeship and graduate entry programs through which people can be employed in the public sector workforce. It includes young people engaged as entry level trainees through a range of graduate recruitment programs including the South Australian Public Sector Graduate Recruitment Register.
15.5.15 Weekly Paid Awards
The weekly paid workforce refers to all persons employed under weekly paid Awards. These employees are generally engaged in hourly, daily or weekly wages or piecework rates of pay and their wages are not based on an annual salary. They include health ancillary employees employed within the SA health sector and Government Service Officers across a range of departments. It excludes Education Act and TAFE SA Act Hourly Paid Instructors.
15.6 Gender Reporting
Since 2017, workforce data is captured for employees not identifying as male or female. For the purposes of this report, a new category has been titled ‘Other’, but flexibility exists for employees to identify an alternative gender with more representative terminology (typically intersex/ indeterminate/ unspecified). Collection and reporting of this data is consistent with the Australian Government Guidelines on the Recognition of Sex and Gender.
15.7 Appointment type
15.7.1 Ongoing
The employment is on an ongoing basis and does not have an end date, that is, it is considered to be ‘permanent’. This includes full time and part time employment.
15.7.2 Term Employment
The employment is on a fixed term basis and has a clear end date stated. The appointment can be on either a short term or long term basis.

Workforce Information Report 2019-20
© 2020 Government of South Australia Public Page 63 of 67
For reporting purposes, any contract appointment overrides the previous appointment type of an employee. For example, an ongoing employee who is subsequently appointed on a term basis is deemed to be contract, not ongoing.
This appointment type does not include casuals.
Persons employed on a full time and part time basis are included in this appointment type.
Some contract employees may also have a right to ongoing employment in the South Australian Public Sector at the conclusion of their current contract, and this is commonly called a tenured or substantive position.
15.7.3 Short Term Contract
The employment contract is for a period up to and including one year.
Persons who have been appointed on a number of short term contracts should be recorded as contract short term regardless of the length of time they have been with a single employer or in a single position.
For example, an employee appointed on a one year contract basis who is subsequently granted an extension or appointed on another one year contract basis is deemed to be contract short term, not contract long term or ongoing.
15.7.4 Long Term Contract
The employment contract is for a period greater than one year, and less than five years.
Persons who have been appointed on a number of long term contracts should be recorded as contract long term regardless of the length of time they have been with a single employer or in a single position. For example, an employee appointed on a three year contract basis who is subsequently granted an extension or appointed on another three year contract basis is deemed to be contract long term not ongoing. Chief executives must be recorded as contract long term employees.
15.7.5 Other
Public Sector Act and Weekly Paid casuals, Education Act relief teachers, TAFE Act hourly paid instructors, Children’s Services Act relief teachers and relief early childhood workers, and any other employees not appointed on an ongoing, short term or long term contract basis.
15.7.6 Casual
Casual employees are those who do not have regular or systematic hours of work.
For the purposes of public sector wide reporting the casual contract appointment type is reported under the appointment type “Other”.

Workforce Information Report 2019-20
© 2020 Government of South Australia Public Page 64 of 67
15.8 Employment status
The majority of public sector employees are employed on a full time basis. Employees can also be employed on a part time basis.
The definition of part time may differ between groups of employees as a full time workload can vary from 37.5 to 38.0 to 40.0 hours per week depending on the occupation and conditions of employment.
Part time employees are therefore persons who are engaged for less than the ordinary full time hours per week for that occupation or position.
For the purposes of this report, casual employees are recorded as part time employees.
15.9 Aboriginal Employees
For the purposes of this report, Aboriginal is intended to include both Aboriginal and Torres Strait Islanders employees.
Aboriginal employees are those persons who are a descendant of an Australian Aboriginal, who identify as an Aboriginal, and are recognised by members of the community in which he or she lives or has lived in.
The workforce data presented in this report is likely to under represent the true level of Aboriginal persons in public sector agencies due to the difficulties associated with:
• some agencies extracting characteristics of their workforce to this level of detail from their current information systems
• collecting data that relies on self-identification.
15.10 Leave types
15.10.1 Sick Leave
The absence, whether paid or unpaid, resulting from an employee being too ill to work, and where the illness or injury is due to a cause which does not entitle the employee to workers’ compensation.
15.10.2 Family Carer’s Leave
Absences on account of family leave (with or without pay).
15.10.3 Special Leave With Pay
Some other forms of special leave with pay may be included in employee leave balances provided by agencies for the purposes of calculating the average sick leave/carer’s leave for an agency – for example, bereavement leave.

Workforce Information Report 2019-20
© 2020 Government of South Australia Public Page 65 of 67
15.10.4 FTE Sick Days
The total number of FTE sick days over a period is calculated by converting the total number of whole and partial sick days taken over the period into hours. This calculation excludes casual employees. Once this is determined the total FTE sick days for the period can be calculated by:
• Sum the hours of sick leave taken and divide by the ordinary full time hours per day of that employee type (e.g. 6.0, 7.5 or 8.0 hour working day).
• For example, to calculate the total FTE sick days leave for 8 employees assuming that over the financial year period they took sick leave of 7.5 hours, 6.2 hours, 7.5 hours, 22.5 hours, 37.5 hours, 0.5 hours, 7.5 hours and 15.0 hours, the calculation would be:
• Sum sick leave hours (7.5 + 6.2 + 7.5 + 22.5 + 37.5 + 0.5 + 7.5 + 15.0 = 104.2) and divide by the normal full time hours per day (7.5). This will give you the total FTE sick days for the period (=13.9).
15.11 Separation and Recruitment
Separated employees include all public sector agency employees whose employment has ended during the relevant financial year. Excludes all temporary appointments/assignments to other public sector agencies and those on short or long term unpaid leave.
Note, the workforce information presented in this report only indicates the number of employees who permanently separated from a public sector position and therefore may have undertaken further employment in another South Australian Public Sector position.
Recruited employees includes employees who were appointed to a position within a public sector organisation during the relevant financial year. Recruitment does not include employees who have returned from leave without pay, or were already employees of an agency (i.e. either have won the position in the same agency they are already working, or have returned from contract employment in another agency).
The workforce information presented in this report only indicates the number of employees who have started new in a public sector organisation and therefore may have originated from another South Australian Public Sector organisation.
Data is intended to provide an indicator of recruitment and separation activity, not to reconcile with net changes in the active and paid FTE and headcount throughout the report.
15.12 Disability Reporting
For the purpose of this report, the term “disability”, in relation to a person, means:
• total or partial loss of the person's bodily or mental functions; or
• total or partial loss of a part of the body; or
• the presence in the body of organisms causing disease or illness; or
• the presence in the body of organisms capable of causing disease or illness; or
• the malfunction, malformation or disfigurement of a part of the person's body; or
• a disorder or malfunction that results in the person learning differently from a person without the disorder or malfunction; or

Workforce Information Report 2019-20
© 2020 Government of South Australia Public Page 66 of 67
• a disorder, illness or disease that affects a person's thought processes, perceptions of reality, emotions or judgment or that results in disturbed behaviour.
For the purpose of this report, the term “disability requiring adaptation”, in relation to a person, means: People with a permanent disability who, due to their disability, are considered to have an employment restriction because they:
• are restricted in the type of work they could do; or
• need modified hours of work (either a restriction in hours they could work, different time schedules, or flexible hours of attending); or
• require an employer to provide adaptive equipment, a modified work environment, or make other special work related arrangements; or
• need to be given ongoing assistance or supervision to carry out their duties safely.
The workforce data presented in this report is likely to under-represent the true level of disability employment in public sector agencies due to the difficulties associated with:
• some agencies extracting characteristics of their workforce to this level of detail from their current information system.
• collecting data that relies on self-identification.
15.13 Salary
The salary measure is intended to capture an indication of responsibility level only and should not be used to reflect total salary earnings or total employment costs over the financial year. For this reason, all part time employees’ salaries are reported as the amount the employees would receive if they worked full time.
Salary details relate to pre-tax income excluding compulsory superannuation and salary sacrificing Fringe Benefit Tax (FBT). Non-executive employees on salary sacrifice arrangements are shown as pre-sacrifice values. Executive remuneration is calculated according to a Total Remuneration Package Value (TRPV), which identified both salary (taxable income) and non-monetary benefits, which can include motor vehicle and governments’ employer superannuation contribution. Allowances are excluded for all employees.
15.13.1 Non Executives
Total base salary is reported. This is pre-tax salary excluding superannuation and Fringe Benefit Tax (FBT).
• non-executive employees on salary sacrifice arrangements are shown as pre-salary sacrifice values
• non-financial benefits and allowances are excluded from total base salary for non-executive employees
15.13.2 Executives
Total Remuneration Package Value (TRPV) is reported. This is made up of the financial benefits component plus compulsory employer superannuation contributions and any motor vehicle component.
Workforce Information Report 2019-20
© 2020 Government of South Australia Public Page 67 of 67
15.14 Length of Service to Agency
Length of service to the agency provides an indication of the stability of the workforce and the continuity of employment within agencies and contributes to workforce planning research.
The length of service of employees is calculated using an employee’s commencement date in a public sector agency, in years, from 30 June in the relevant year.
15.15 Length of Service to Public Sector
Length of service to the public sector provides an indication of the stability of the workforce and the continuity of employment across the sector and contributes to workforce planning research.
The length of service of employees is calculated using an employee’s commencement date in the public sector, in years, from 30 June in the relevant year.


