#2021-006 Macroeconomic stimulus packages and income inequality in developing countries: Lessons from the 2007‐9 Great Recession for the Covid‐19 crisis in South Africa Alexis Habiyaremye, Peter Jacobs, Olebogeng Molewa and Pelontle Lekomanyane Published 24 February 2021 Maastricht Economic and social Research institute on Innovation and Technology (UNU‐MERIT) email: [email protected]| website: http://www.merit.unu.edu
Transcript
#2021-006
Macroeconomic stimulus packages and income inequality in developing countries: Lessons from the 2007‐9 Great Recession for the Covid‐19 crisis in South Africa Alexis Habiyaremye, Peter Jacobs, Olebogeng Molewa and Pelontle Lekomanyane
Published 24 February 2021 Maastricht Economic and social Research institute on Innovation and Technology (UNU‐MERIT) email: [email protected] | website: http://www.merit.unu.edu
UNU-MERIT Working Papers ISSN 1871-9872
Maastricht Economic and social Research Institute on Innovation and Technology UNU-MERIT UNU-MERIT Working Papers intend to disseminate preliminary results of research carried out at UNU-MERIT to stimulate discussion on the issues raised.
Macroeconomic stimulus packages and income
inequality in developing countries: Lessons from
the 2007-9 Great Recession for the Covid-19
crisis in South Africa
Alexis Habiyaremye*, Peter Jacobs, Olebogeng Molewa and Pelontle Lekomanyane
February 23, 2021
Abstract
In 2020, the South African government announced that it was planning to imple-
ment an ambitious macroeconomic rescue package worth about 10% of the country’s
gross domestic product (GDP) to cushion the economy from the socioeconomic im-
pact of Covid-19 lockdown. However, it was unclear what the likely effects of the
package’s measures would be on income growth and employment in the post-crisis
recovery period. This paper uses a fiscal multiplier framework to examine the links
between such packages and patterns of growth, employment and inequality in nine
developing counties during the recovery period following the Great Recession of 2007-
2009. The findings indicate that countries which privileged larger fiscal packages
enacted through public infrastructure investments had more favourable outcomes in
terms of employment recovery and preventing the worsening of poverty. Moreover,
the implementation of deficit-financed stimulus packages did not lead to unsustain-
able debt levels or persistent inflation. As South Africa contemplates rolling out a
sizable new infrastructure stimulus package to tow the economy out of the current
crisis, insights from those experiences may provide useful lessons for building a more
equitable and more shock-resilient post-Covid-19 economy.
*Corresponding author, Human Sciences Research Council, 116-118 Buitengracht Street, 8001 CapeTown, South Africa. Email: [email protected]
1
Keywords: Monetary policy, fiscal multipliers, wage-led growth, income distribu-
tion, structural reforms
JEL Classification: E12, E24, E25, E52, E62
1 Introduction
As the Covid-19 pandemic continues to spread across the planet, lockdowns have been
imposed in most countries, significantly curtailing economic activity and forcing com-
munities around the world to brace for the impact of a severe downturn. Most reliable
estimates agree that the fallout of the Covid-19 pandemic will lead to an economic crisis
comparable to the 1930-33 Great Depression.1 Both developed and developing economies
expect to be severely affected by the shock and have adopted bold macroeconomic stim-
ulus packages to protect public health and prevent an employment haemorrhage, while
gearing for the post-pandemic economic rebound (Baldwin and Weder di Mauro, 2020;
Galı, 2020). Alongside fiscal measures to support affected businesses, colossal amounts of
liquidity were injected into their financial markets in order to bail out most large banks
and protect large corporations from an almost certain collapse (Krugman, 2009; Torres,
2011; Verick and Islam, 2010). In the absence of fiscal and monetary policy measures
commensurate with the scale of the threat, the economic fallout of the current national
lockdowns being imposed across the world could afflict the entire global economic system
and continue to reverberate long after the health crisis itself has come under control. In
South Africa, the government responded to the crisis in 2020 by announcing an ambitious
ZAR500 billion fiscal response package combined with an estimated additional ZAR300
billion in monetary policy injections by the South African Reserve Bank (South Africa
National Treasury, 2020). The proposed short-term interventions alone represented more
than 10 percent of the country’s gross domestic product (GDP), yet they are far from
enough to adequately cushion the economy from the impact of the exogenous shock pro-
duced by the pandemic and national lockdown measures or to enable the economy to
recover and become more productive after several years of underperformance (Mohamed,
1In the supplementary budget speech presented in June 2020, the South African Minister of Financeprojected a GDP contraction of 7.2 percent in 2020/21 fiscal year.
2
2009; Luiz, 2016; Kruss, 2020). What is more, only 10 percent of the proposed sum was
earmarked to provide support to vulnerable households, which raises important questions
over the potentially skewed distributional aspect of the intervention (see Table 1). The
government now plans to put infrastructure spending at the heart of the post-pandemic
stimulus for economic recovery (Creamer, 2020; Sguazzin, 2020; Larkin, 2020). Against
this background, this study poses a number of key questions to examine the benefits that
may derive from stimulus packages in situations of economic shock and how these may
be most effectively leveraged:
� What are the likely distributional effects of these stimulus packages on the dynamics
of recovery growth, employment and inequality?
� How does the structure of stimulus packages and their proposed roll-out affect the
distributional outcomes in the recovery period?
� Which lessons could be learned from the fiscal responses to past crises in terms of
fostering the economic resilience and inclusion in the post-crisis period?
Macroeconomists tend to have divergent views on which monetary and fiscal targeting
strategies are most effective for a strong recovery and a robust post-crisis growth rate
(see e.g. Goodfriend and King, 1997; Clark, 2011; Ravallion, 2009). They also highlight
important trade-offs that exist between social equity and economic efficiency, and between
risk insurance and moral hazard, as well as the intertemporal trade-off between current
and future consumption.2 Understanding the bearing mechanisms through which such
packages affect economic performance and distributional outcomes is key to analysing
the adequacy of current macroeconomic measures and avoiding the shortcomings of past
policies and their adverse effects.3 The fiscal multiplier framework provides relatively
simple, yet practical and efficient tools to estimate the likely impact of a given fiscal
policy intervention on output expansion (Spilimbergo et al., 2009). For example, it is
2Contenders of the equity vs efficiency trade-off see the provision of safety nets for the poor as beingharmful, at best neutral to economic growth; those who highlight the insurance-moral hazard trade offargue that bailouts in a crisis may encourage excessively risky behavior in the future. Intertemporaltrade-off is concerned with the choice between poverty now and poverty in the future.
3Distribution matters because achieving good rates of economic growth is not per se sufficient totranslate into poverty reduction unless the benefits of economic growth are more equitably distributed(Lee et al., 2013).
3
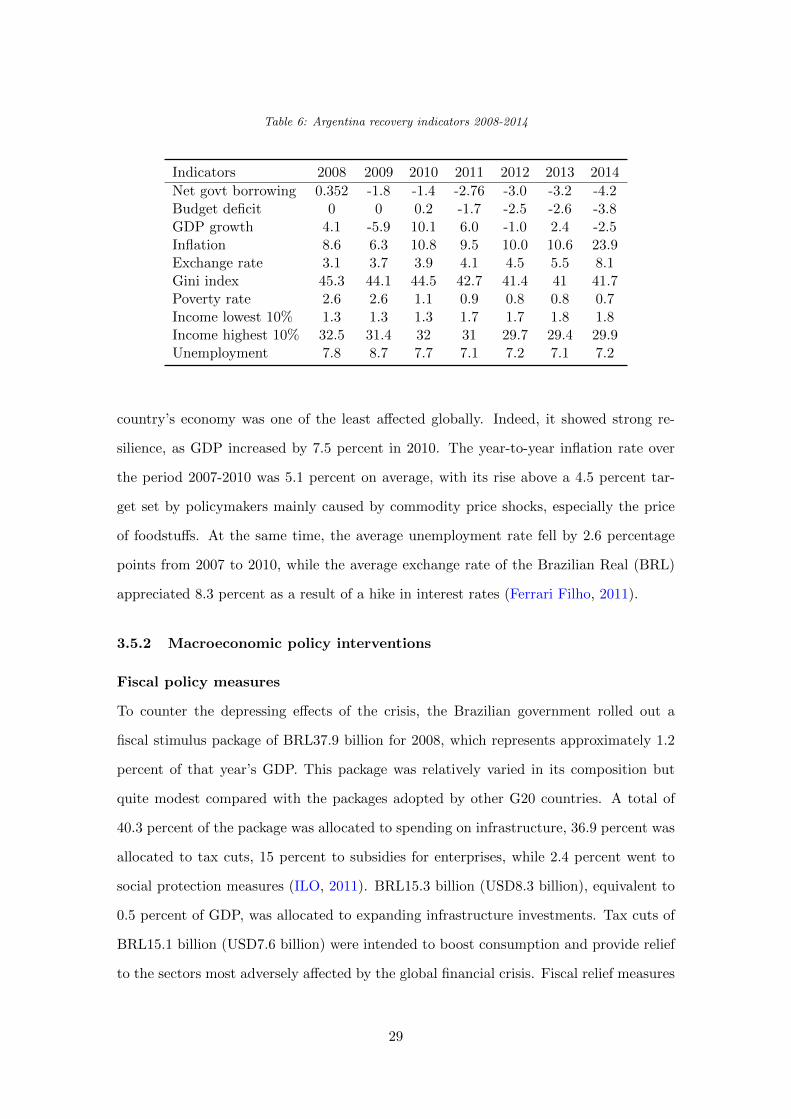
Table 1: South Africa’s COVID-19 fiscal response package
Target program Amount in R million
Credit Guarantee Scheme 200 000Job creation and support for SME 100 000Tax measures for income support 70 000Support to vulnerable households for 6 months 50 000Wage protection 40 000Health and other frontline services 20 000Support to municipalities 20 000
Total 500 000
Source: National Treasury of South Africa (2020)
generally acknowledged that public expenditure for a stronger social protection system
and measures for job creation are more effective than tax cuts in countering the impact
of a global economic downturn (Spilimbergo et al., 2009; OECD, 2009; Verick and Islam,
2010). Conversely, an insufficient fiscal response due to a narrow fiscal space that a
given government may be facing, can lead to unnecessary hardships for households if the
monetary policy decision makers are too rigid on inflation targeting and reluctant to allow
counter-cyclical spending (Vera, 2009; Baldwin and Weder di Mauro, 2020). Krugman
(2009) for instance, found that the insufficiency of the US stimulus package in response
to the 2008 Global Financial Crisis, which only amounted to 1 percent of national GDP,
made it difficult for the economy to recover quickly. He estimated that an additional 4
percent of GDP would have been necessary to achieve a quick recovery. 4
Over recent years, the new neoclassical synthesis (NNS, also called the new Key-
nesian synthesis) has become the most utilised analytical framework for the estimat-
ing the effects of monetary policy effects. This synthetic theory can accommodate real
business cycle dynamics, technological change, sticky prices and rational expectations.
Different models have been developed to formalise such a framework so that it can be
estimated as a dynamic stochastic general equilibrium (DSGE) in a steady state (Smets
and Wouters, 2007; Goodfriend and King, 1997). However, the distributional effects of
fiscal or monetary policy responses on the dynamics of poverty and income inequality
4An example of such a response is found in the 2008 crisis in Europe, where the stigma of acceptingfinancial aid under the European Stability Mechanism programme led to too little recapitalisation, whichresulted into a weaker system and an prolongation of the banking crisis that could have been avoided(Baldwin and Weder di Mauro, 2020).
4
in times of crisis are more complex and difficult to model using mathematical tools. In
this regard, disagreements among micro-economists has led to a diversity of models being
produced (Goodfriend and King, 1997); and the country-specific conditions surrounding
any macroeconomic policy interventions during crises imply that an experience-based
analysis may be the most appropriate approach to guide macroeconomic policy inter-
ventions and subsequent analysis of their impact. Next to fiscal and monetary policy
measures, the allocation of national income between investment profit earners and wage
earners also affects capacity utilisation and growth dynamics (see e.g. Bhaduri and Mar-
glin, 1990; Bhaduri, 2008; Lavoie and Stockhammer, 2013). This implies that shifts in
national income distribution may be leveraged to stimulate aggregate demand if the pre-
vailing economic regime presents credit constraints to consumers with a high marginal
propensity to consume (MPC). This study has consequently been undertaken with the
aim of providing an exploratory analysis of the effects of crisis-induced macroeconomic
stimulus packages on real income growth and inequality in developing countries, so that
some useful lessons can be drawn for South Africa as it plans its macroeconomic options
to weather the forthcoming recession.5
The study focuses on linking the recovery experiences of developing economies in
Africa (in Kenya, Mauritius and Nigeria), Asia (in China, Indonesia and Turkey) and
Latin America (in Argentina, Brazil and Chile) to the macroeconomic intervention mea-
sures that they undertook in response to the 2007-2009 Great Recession. These com-
parator countries were chosen for this study because their economic conditions present
significant degrees of similarity with those in South Africa. Mauritius in particular, even
though it is a small island economy, has striking similarities with South Africa in terms
of its connections to European financial markets and its trade links, as well as in terms
of its business cycles and investment flows. At a time when most countries affected by
the current Covid-19 pandemic are scrambling to develop and implement new macroeco-
nomic stimulus measures to shield their economies from the looming threat of recession,
it is important to learn lessons from the failures and successes of past stimulus packages.
The analysis applied the fiscal multiplier framework (Spilimbergo et al., 2009) and in-
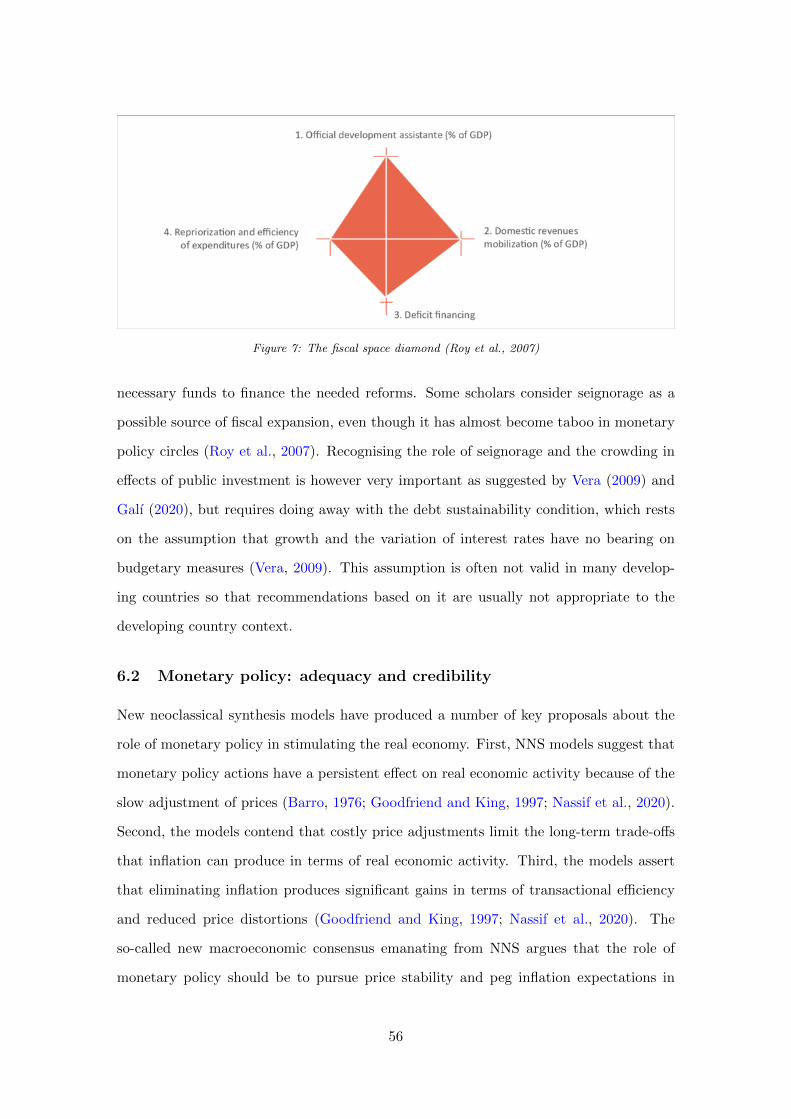
5In the context of dealing with a crisis within a narrow fiscal space, this study also uses Roy (2010)fiscal diamond framework to analyse how the country balances different financing sources to broaden itsfiscal space.
5
sights from the new neoclassical synthesis model, as well as a case study methodology
to analyse the multiplier effects of the Great Recession fiscal interventions among the
selected sample. The goal was to derive implications for the macroeconomic responses
to the COVID-19 crisis proposed by the South African government. This discussion also
takes clues from the ongoing post-Keynesian debates on wage-led versus profit-led growth
(Bhaduri and Marglin, 1990; Lavoie and Stockhammer, 2013; Palley, 2017). Overall, the
form of analysis adopted by this study has the advantage of being grounded in empirical
observation, while also taking into account each country’s specific characteristics and
how these affect its particular multipliers. The aim is to use the available characteris-
tics to synthesise a reliable frame, which can be used to produce reasonable estimates
of probable impacts on income, employment and inequality in the recovery period. This
study proceeds as follows: Section 2 presents the fiscal multiplier and the new neoclassi-
cal synthesis analytical frameworks used to link the macroeconomic policy interventions
to the expected subsequent economic performance during the recovery period. It also
gives an overview of the main insights from the profit- versus wage-led growth debate.
Thereafter, section 3 presents historical experiences of macroeconomic policy interven-
tions during the Great Recession in the nine comparator countries and South Africa.
Section 4 makes an attempt to discern the performance and distributional patterns that
connect the outcomes of the growth trajectories of these countries with the structure
and implementation of their stimulus packages. Thereafter, section 5 discusses some key
insights from the experiences of the Great Recession and the implications of these for
South Africa. Section 6 examines the potential and limitations of South Africa’s Covid-19
ZAR500 million fiscal response package in light of the main insights from sections 4 and 5.
Section 7 concludes by synthesising the main findings and reflecting on macroeconomics-
theory debates and issues of concern for South Africa in its current predicament, which
is one of structural stagnation within a narrow fiscal space.
2 Analytical frame for macroeconomic policy interventions
How does the adoption of countercyclical macroeconomic policy measures by governments
and central banks, (like fiscal stimulation and monetary expansion), actually help to
6
mitigate crises and enhance economic performance? Fiscal multipliers (Spilimbergo et al.,
2009; Sinai, 2009) are useful tools to analyse the effects of fiscal measures on the expansion
of output; whereas monetary policy theories, such as the New Neoclassical Synthesis
models with sticky prices, is most commonly used to analyse the effects of monetary
policy interventions (Smets and Wouters, 2007; Vera, 2009; Nassif et al., 2020). This
section considers these analytical tools and explores how they are used; then highlights
some of the debates about the effectiveness of their application during crises such as the
ongoing COVID-19 pandemic.
2.1 Fiscal multiplier framework
This framework is used to measure the extent to which increases in government spending
or tax cuts contribute to expanding output by stimulating aggregate demand. The fiscal
multiplier measures the ratio at which an exogenous change in the fiscal expansion mea-
sure (government spending [∆G] or tax cut [−∆T ] produces a change in output [−∆Y ]
relative to their respective baselines.
Different multipliers are used, depending on the time frame considered:
The impact multiplier: ≡ ∆Y (t)
∆G(t)
The multiplier at some time horizon T :≡ ∆Y (t+ T )
∆G(t)
The peak multiplier :≡ maxN
(∆Y (t+ T )
∆G(t)
)
The cumulative multiplier :≡∑N
j=0 ∆Y (t+ j)∑Nj=0 ∆G(t)
The impact multiplier represents the immediate effects of the fiscal stimulus measure
taken at time t on the output in the same year, while the multiplier at some horizon T
indicates the corresponding change in output in the year t+T as a response to the same
stimulus. The cumulative multiplier, as its name indicates, reflects the total effects of
7
the fiscal intervention on output over the considered period and is typically larger than
the impact or peak multipliers Spilimbergo et al. (2009). The size of the multiplier is
influenced by three main factors:
� Leakages (=saving of the stimulus money or spending it on imports);
� Monetary conditions (change in interest rate as a consequence of the fiscal expan-
sion);and
� The sustainability of the country’s fiscal position after the stimulus.
The fiscal multiplier will usually be larger if: there are limited “leakages”, i.e. the
interest rate does not change as a result of the stimulus, and the fiscal position of the
country remains sustainable after the stimulus (Table 2). To minimize the leakages the
stimulus package must have a higher government spending component, relative to tax
cuts, because direct spending produces an immediate effect on demand, while those who
benefit from tax cuts may save (part of) their additional income (see.e.g. Anos Casero
et al., 2010, for Argentina). The marginal propensity to consume must be large: the
measures should therefore be targeted at those consumers who are most constrained
by a lack of liquidity. Moreover, the consumers should be expected to anticipate large
increases in future taxes and therefore compensate by increasing their current savings
against an increase in debt.
Table 2: Estimates of fiscal multipliers for different types of fiscal measures
Type of fiscal measure Main value of multiplier
Capital expenditure 1.1Other gvt expenditure 0.65Tax cuts 0.45Source: Spilimbergo et al (2009)Government expenditure 1.1Corporate tax cuts 0.3Personal income tax cuts 0.5Indirect tax cuts 0.5Reduction in Social security contributions 0.4
Source: OECD (2009)
How should fiscal multipliers be used to produce estimates of the economic effects?
8
The size of the fiscal multiplier depends on the specific country, varies in time and is
affected by the circumstances under which the stimulus is provided. The reliability
of fiscal multiplier estimates is challenged by a number of methodological difficulties
related to how they are calculated . The main empirical challenge is posed by what
is commonly known as the “simultaneity bias”, which may occur, for example, when
the increased government spending (or tax cut) comes in response to a shock cut in
output. Four different methods can be used to calculate multipliers, depending on data
availability: model simulation (using IS/LM [Investment Savings/Liquidity preference
Money supply] modelling); a case study approach that considers identifiable episodes
of exogenous fiscal expansion; vector auto-regression (VAR); and econometric studies
of how consumers respond to fiscal shocks (Spilimbergo et al., 2009), although these
suffer from the drawback of being specific to the particular measures and surrounding
economic conditions being studied, which means that the findings cannot readily be
extrapolated and applied to a different situation. If a country has sufficiently detailed
data on government spending and output, its fiscal multipliers can be calculated by taking
account of its specific circumstances. Availability of data covering long periods makes it
possible to estimate more reliable multipliers for the country in question. According to
Spilimbergo et al. (2009), an impact multiplier will typically be between 1.5 and 1 for
government spending measures in large countries. It will range from 1 to 0.5 for medium-
sized countries; and will feature values of 0.5 or less for small open economies as a rule
of thumb. Revenue and transfers produce smaller multipliers of approximately half of
the above values; while investment spending can be expected to generate slightly larger
multipliers. However, fiscal multipliers can also be negative, especially if the stimulus
weakens the country’s fiscal sustainability or is simply perceived as such. Verick and
Islam (2010) compared the multipliers for the different component of fiscal packages
across a range studies (Table 2) and suggest that when governments prepare to enact
fiscal stimulus packages, they should allocate more resources to spending measures than
to tax cuts. Within the spending measures, policymakers are advised to focus on capital
investment, such as spending on employment-intensive infrastructure, because this is
where the largest impact on output and employment can be generated relative to the
9
amount of money spent. Using data from the United States (US), Sinai (2009) also
identified transfers as having a slower but significant multiplier effect on real GDP which
lasts through the simulation interval. The effects of capital spending on economic growth
are higher and last longer than those produced by federal government purchases, even
though they appear to have less impact on reducing unemployment.
2.2 New Neoclassical Synthesis and the effects of monetary policy
New neoclassical synthesis models have become the most commonly used econometric
tools for analysing monetary policy (Smets and Wouters, 2007). NNS grew out of neoclas-
sical synthesis and real business cycles theory to incorporate intertemporal optimisation
and rational expectations (Lucas et al., 1976; Sargent, 1978; Sargent and Wallace, 1975)
into dynamic macroeconomic models (Goodfriend and King, 1997; Smets and Wouters,
2007). The aims of NNS modelling are comparable to those of the real business cycles
models: it seeks to quantitatively model economic fluctuations (Goodfriend and King,
1997). The approach also borrows the concepts of imperfect competition and costly
price adjustment considerations from new Keynesian economics. New neoclassical syn-
thesis models are thus relatively complex, since they have to take account of the impacts
of monopolistic competition; dynamic wage setting; costly price adjustment; rational
expectations; and intertemporal optimisation, while at the same time providing for the
role of monetary policy (Barro, 1976; McCallum, 1980; Smets and Wouters, 2007). The
importance attached to price-level stickiness in the neoclassical synthesis model led to
recognition of the powerful effects of monetary policy (Barro, 1976; Goodfriend and King,
1997). With the neoclassical synthesis model, monetary policy reaction can be analysed
by empirically modelling it as an adaptive response to changes in the complex relation-
ships in the dynamics of production, consumption, investment, capital utilisation and
exogenous spending as a result of exogenous shocks (Taylor, 1993). In this regard, mon-
etary policy authorities are assumed to adjust the interest rate rt gradually in response
to the dynamics of inflation and the output gap, according to the Taylor rule. The out-
put gap is defined as the difference between actual and potential output (Taylor, 1993).6
6Potential output is the level of output that would prevail under flexible prices and wages but withoutprice and wage mark-up shocks.
10
In the dynamic stochastic general equilibrium model proposed by Smets and Wouters
(2007), the interest rate varies as a function of inflation π) and the output gap yt − ypt :
The parameter, λ is the external habit formation factor, γ is the steady-state growth
rate, while σ is the inverse of the intertemporal elasticity of substitution. Consumption is
therefore forward looking (based on expected inflation) in the absence of external habit
formation with log utility in consumption(σ = 1). As for the disturbance term εbt , it
7The corresponding long-term interest rate is determined by the short-term interest rate setting bythe central bank through the yield curve.
8In Smets and Wouters (2007), the stochastic behaviour of the system of linear rational expectationsequations is driven by seven exogenous disturbances: total factor productivity, investment-specific tech-nology, risk premium, exogenous spending, price mark-up, wage mark-up and monetary policy shocks.
11
represents the difference between the interest rate set by the central bank and the return
on assets held by the households. A positive shock to this factor increases the required
return on assets and reduces current consumption. After consumption, the rest of the
income is spent on investments i, capital-utilisation costs and exogenous spending.
On the supply side, output is produced using capital kst and labour input lt, which denotes
the number of person-hours worked.
yt = φp(αkst + (1− α)lt + εαt )
Total factor productivity εαt is assumed to follow a first-order autoregressive process:
the parameter α is the product elasticity of capital in production and the parameter φp
is one plus the share of fixed costs in production, reflecting the presence of fixed costs in
production.
As for the price dynamics, they are assumed to adjust only slowly to their target
mark-up, due to price stickiness. Profit maximisation by price-setting firms yield the
following New-Keynesian Phillips curve:
πt = π1πt−1 + π2Etπt+1 + π3µpt + εpt
where
π1 −lp
1 + βγ1−σc lp, π2 =
βγ1−σc
1 + βγ1−σc lp, and π3 =
1
1 + βγ1−σc lp
1 + βγ1−σcξp(1− ξp)ξp((φp − 1)εp + 1
Inflation πt depends positively on past and expected future inflation, negatively on the
current price mark-up and positively on a price mark-up disturbance (εpt ). The price
mark-up disturbance is assumed to follow an ARMA(1,1) process, whereby price mark-up
shocks behave as in a normal distribution, with independent and identically distributed
deviations by assumption. The speed of adjustment to the desired mark-up depends,
among other factors, on the degree of price stickiness ξp, the curvature of the Kimball
goods market aggregator εp and the steady-state mark-up.
Wage dynamics is determined in the conditions of monopolistic competition on the
labour market. In analogy to the goods market, the wage mark-up in the monopolistically
12
competitive labour market will be equal to the difference between the real wage and the
marginal rate of substitution between working and consuming. Similarly to prices in the
output market, real wages only adjust gradually to the desired wage mark-up as a result
of wage stickiness and the partial indexation of wages to inflation.
The real wage wt is therefore a function of expected and past real wages, expected,
current and past inflation, the wage mark-up and a wage-markup disturbance (εwt ).
When wages are perfectly flexible (ξw = 0), the real wage becomes a constant mark-
up over the marginal rate of substitution between consumption and leisure. In general,
the speed of adjustment to the desired wage mark-up depends on the degree of wage
stickiness (ξw) and the demand elasticity of labour, which itself is a function of the
steady-state labour market mark-up (εw − 1) and the curvature of the Kimball labour
market aggregator (εw) (Smets and Wouters, 2007). The wage-markup disturbance (εtw)
is assumed to follow an ARMA (1,1) process with an IID-Normal error term. As is the
case for the price mark-up shocks, the inclusion of an MA term makes it possible to pick
up some of the high frequency fluctuations in wages.
NNS models that are currently in use can be categorised into three distinct modelling
scales:
1) small analytical models that are tractable enough to be solved by hand, which are
used to study a range of theoretical and empirical issues;
2) medium-scale macroeconomic models analogous to those developed by real business
13
cycles researchers, used to address a wide range of positive and normative issues.9
3) the new FRB/US large-scale model of the American economy developed over the last
few years, now the principal model used for policy evaluation by the Federal Reserve. By
relying on the idea that sticky prices lead to a positive relationship between aggregate
demand and real economic activity in the short run, these models are able to offer a
sound basis for monetary policy advice (Barro, 1976; Goodfriend and King, 1997; Smets
and Wouters, 2007). The theoretical implications of NNS models are that monetary
policy can exert considerable influence on real economic activity, which puts it in prime
position to be used as a powerful instrument for economic stimulation. Or from an-
other point of view, it is nearly impossible to interpret economic fluctuations accurately
without considering monetary policy. Against this background, many central banks with
conservative doctrines, including in South Africa, have used the established consensus on
monetary policy to focus on inflation-targeting as the best way of minimising the output
gap. This approach seeks to anchor credible expectations on price levels. However, as
is shown by Nassif et al. (2020) for the case of Brazil, a fixation on inflation targeting
in a developing country with an open exchange-rate regime can, on balance, bring more
harm than benefits to its growth prospects.
2.3 Distributional effects on aggregate demand: wage-led vs profit-led
growth
Macroeconomic models relying on “money illusion” for demand stimulation do not take
account of how the redistribution of income between wages and profits can produce
significant changes in aggregate demand and capacity utilisation (i.e. actual output
as a fraction of potential output). The overarching assumption for aggregate demand
stimulation is the existence of an output gap, which is created by suboptimal capacity
utilisation and underconsumption (Palley, 2017; Bhaduri and Marglin, 1990). In a closed
economy, a shift in the distribution of income between profits and wages can change
aggregate demand through its effects on consumption and investment levels. For example,
9Bayesian NNS models of that kind, such as the type presented by Smets and Wouters (2007), com-bine a sound policy analysis structure founded on micro-economic behaviour with a good probabilisticdescription of the observed data and good forecasting performance.
14
if the marginal propensity to consume is higher for wage income than it is for profit
income, any change in income distribution that lowers real wages to increase profits will
depress total expenditure on consumption. The increased profits might, however, be
used to stimulate investment expenditure, which may (partially) offset the effect of lower
consumption on aggregate demand (Bhaduri and Marglin, 1990; Bhaduri, 2008).
Conversely, an increase in real wages will depress profits, but contribute to an increase
in output by stimulating consumption; while the depressed profits will lead to lower de-
mand for investment. The overall effect of such a redistribution on demand-led expansion
would therefore depend on which of these two effects becomes quantitatively dominant.
An economic structure dominated by larger aggregate consumption expenditure when
real wages increase is called “wage-led”, whereas an economic situation dominated by
expansion in investment because of a higher profit share and lower real wages is called
“profit-led” (Bhaduri and Marglin, 1990; Lavoie and Stockhammer, 2013).10. Proponents
of wage-led growth argue that underconsumption represents the primary force causing
economic stagnation (a so-called stagnationist regime); whereas proponents of profit-led
growth insist on the need to increase profits so that the economy can grow through in-
creased investments (an exhilarationist regime). In the model proposed by Bhaduri and
Marglin (1990), which is based on the assumption of exogenous wage setting, the sign
and elasticity of the Hicks I/S schedule are central to determining which regime is going
to prevail. When the I/S-curve is downward-sloping (in a space where the vertical axis
represents capacity utilisation as a function of profit share, which is represented on the
horizontal axis), the underconsumption argument is validated.11 A downward sloping I/S
curve will therefore imply beneficial effect of higher real wages on demand. In contrast,
if the I/S schedule is upward-sloping, then the exhilarationist profit-led regime prevails
(Bhaduri and Marglin, 1990). In an open-economy setting, the depressing effects of lower
real wages on aggregate demand may be felt in the short run without a corresponding
rise in investment, because investment levels generally adjust much more slowly to price
1010The described changes are short-term adjustments. In a dynamic setting, Lavoie and Stockhammer(2013) point to adjustments following a wage-led investment regime, which suggests that an increase inwage income as a share of total income will lead to an increase in investment expenditure to adjust tothe increase in aggregate demand. This results in a higher rate of capital accumulation in the long run.
11As pointed out by Bhaduri and Marglin (1990), capitalist investors may continue to make a largertotal profit in a stagnationist regime even when wages are increased, if the negatively sloped I/S-curve iselastic; that is, if increased sales volumes can more than offset what they lose on profit margins per unit.
15
variation than do import levels. Moreover, for a small open economy that is a price-taker
on the world market, increasing wages may drive up costs and decrease competitiveness,
leading to a profit squeeze (Lavoie and Stockhammer, 2013; Bhaduri and Marglin, 1990).
An open economy is therefore more likely to exhibit an exhilarationist regime in its at-
tempt to compete internationally on the basis of low labour costs. In this regard, the
South African labour market has historically been skewed towards profit accumulation;
and the resulting profits were not necessarily invested in expanding output because seg-
regation enabled a privileged white minority to enjoy all the desired amenities without
needing to expand and extend them to the rest of the population. Considering the long
period of sluggish growth and high levels of unemployment that have persisted since the
Great Recession (Toyana and Nqobile, 2020), South Africa is exhibiting all the charac-
teristics of a stagnationist open economy. Despite abundant cheap labour supply, the
economy displays little evidence of international competitiveness in producing goods for
the export market(see also Luiz (2016) and Kruss (2020) on South Africa’s middle-income
trap).12
3 Great Recession experiences from 9 developing countries
3.1 Mauritius
3.1.1 The impact of the crisis
Because of extensive trade liberalisation and the intricate connections of the Mauritian
economy to Europe and the global banking system, all its key sectors were affected by
the Global Financial Crisis with varying degrees of severity.13 The textile and tourism
sectors were the hardest hit (IMF, 2009). The speed with which the international cri-
sis affected the Mauritian economy and the scale of the impact indicated the downside
of global integration as experienced by small island states. As the financial position of
local banks deteriorated in September 2008, investors in Mauritius reacted by selling off
large quantities of shares, which led to fall in the share prices of companies in the bank-
12With the background of its apartheid history of dispossession and cheap migrant labour, 47 percentof salaried workers are still earning the minimum wage or below, while 54 percent of full-time workingpopulation earn incomes below the working poor poverty line (SANews, 2019).
13Most affected sectors include the textile industry, tourism, sugar production, and financial services
16
ing and financial sector. As a result, the Mauritius Stock Exchange share price index,
the SEMDEX, declined to its lowest level in more than ten years. Many textile firms
were forced to close down. As incomes fell and unemployment rose in key tourism mar-
kets, tourist arrivals dried up. Similarly, as international capital flows were redirected
in response to global crisis, foreign direct investments also fell significantly, stalling con-
struction projects and damaging the local economy even further. The effects of the crisis
were compounded by a reform of the sugar industry, which was already taking place fol-
lowing the termination of the country’s preferential access to the European Union (EU)
market through a sugar protocol that had just expired in 2006. All these factors com-
bined to produce a rise in unemployment accompanied by a decline in growth. However,
despite the slowdown in various sectors of the economy, Mauritius did not suffer from
any output contraction over the entire period of the Great Recession. A local recession
was successfully avoided as a result of decisive macroeconomic policy measures taken by
the government and the central bank.
3.1.2 Macroeconomic interventions
Fiscal stimulus measures
As the global crisis started to affect the Mauritian economy, the government announced a
fiscal stimulus package in December 2008, to be implemented from the first half of 2009.
Despite a positive projection of 5.5 percent growth for the fiscal year 2008, the govern-
ment adopted counter-cyclical, expansionary fiscal policies similar to those adopted in
most other affected countries. In order to increase economic resilience against future
shocks, an additional stimulus package of 6 billion Mauritian rupees (MUR), equivalent
to 3.8 percent of GDP, was put in place. The total package was therefore quite sub-
stantial, accounting for about 5 percent of GDP. A large proportion of this package was
financed by funds that had been amassed in the previous fiscal year in case of crisis, and
to which further contributions had been made in fiscal year 2008/09. On November 18,
2009, the government announced a range of measures which were to be pursued until
December 2010. These included actions to:
17
� Protect jobs and enterprises through direct support to SMEs and large firms facing
temporary difficulties as a result of the crisis;
� Support a work-come-training programme for retrenched workers and the unem-
ployed;
� Prioritise public infrastructure projects in the education, health, environment, and
sports sectors in order to boost construction and create jobs;
� Support the modernisation of machinery and equipment, and invest in upgrading
skills to accelerate private sector investment and improve competitiveness;
� Extend tax breaks for the sectors most affected by the crisis, such as tourism and
construction, in order to stimulate their recovery and protect jobs;
� Develop additional infrastructure and provide incentives for tourism growth on
Rodrigues Island; and
� Invigorate efforts aimed at absolute poverty eradication.
The new funds were allocated to the expansion of the airport of Port Louis and
for the establishment of reserves to help cushion the economy against potential future
large-scale, exogenous shocks.
Monetary policy measures
Once the Great Recession started to affect the domestic economy, the Bank of Mauri-
tius coordinated with the government in order to limit the negative impact. While the
government was pursuing an expansionary fiscal policy to stimulate aggregate demand
and foster productivity, the Bank of Mauritius adopted a number of policy actions to
ease the supply of money. These measures were similar to those being pursued by many
other central banks worldwide. The monetary policy committee of the bank decided to
bring the policy interest rate down by 150 basis points to 5.75 percent and to reduce the
cash reserve ratio from 6 percent to 5 percent in the last quarter of 2008. This led to
an injection of approximately MUR2.5 billion into the financial market. The aim was
to enable commercial banks to offer more loans to the private sector, thereby increasing
18
investment levels and boosting economic activity. By the end of 2009, inflationary pres-
sures remained subdued, while the textile and tourism sectors started showing signs of
recovery. At this point, the monetary policy committee felt that the bank had already
provided sufficient liquidity and that a further reduction of the policy interest rate would
be unlikely to lead to substantial increases in private lending. The repo rate was therefore
left unchanged at 5.75 percent for the beginning of 2010, with an option to change it in
response to clear evidence of real economic change.
3.1.3 Macroeconomic outcomes in the recovery period 2010-2014
The coordinated interventions of the government and the Bank of Mauritius helped avert
a worst-case scenario. Having pursued prudent macroeconomic policies before the crisis,
the country was well-placed to deploy its financial reserves to stimulate the economy with-
out exhausting its fiscal space. In the period following the crisis, Mauritius maintained
a moderate fiscal deficit, which fluctuated at around 3.2 percent of GDP. Meanwhile, as
shown in Table 3, the country’s growth rate, which stood at 5.7 percent on the eve of the
crisis, dropped to 5.4 percent in 2008 and 3.5 percent in 2009. However, it is notable that
the growth rate remained positive throughout the crisis and its aftermath, even though
it did not return to previous levels. (It was still only 3.7 percent in 2014.) At the same
time, the official unemployment rate, which stood at 7.2 percent at the beginning of the
crisis in 2009, increased slightly to 7.3 percent in 2009 and 7.8 percent in 2009; and the
country has not been successful in bringing this down. The increase in unemployment
was accompanied by a rise in the headcount poverty ratio, which reached 7.9 percent
in 2013 and 20.3 percent in 2017, according to World Bank data. (Data for the other
years are not available.) Likewise, inequality measures show a deterioration, with the
Gini index (in percentage points) increasing from its pre-crisis level of 35.7 in 2006 to
38.5 in 2012. The share of income held by the bottom 10 percent of the population also
dropped from 3.1 percent in 2008 to 2.8 percent in 2011, according to World Bank data.
To summarise, the crisis significantly slowed the country’s relatively healthy growth tra-
jectory and impeded its previously successful efforts to reduce poverty. Furthermore,
despite adopting seemingly appropriate macro-economic policy measures, the recovery
since the crisis has been slow and incomplete. A key question therefore is whether the
magnitude and nature of the measures taken were adequate to produce a strong recovery
and return the country to its earlier growth trajectory. In addition, notwithstanding
their positive effects in producing some economic resilience, the measures seem to have
produced greater unemployment and poverty.
3.2 Nigeria
3.2.1 Economic impact of the Global Financial Crisis
The Nigerian economy, which depends heavily on crude oil and natural gas exports, was
immediately affected by a drop in the prices of oil and other commodities, as demand
fell in response to the global financial crisis. Consequently, revenues contracted and
capital inflows declined, prompting a de-accumulation of foreign reserves and placing
pressure on the exchange rate, which caused a depreciation of the Nigerian naira (NGN)
(Soludo, 2009) .14 The corresponding shock produced a domino effect, with the non-
oil sector also suffering from the falling revenues. The sectoral contribution of crude
oil and natural gas to GDP dropped from 38.2 percent in 2008 to 32.3 percent in 2009,
according to data from the Nigerian Bureau of Statistics. This led to agriculture becoming
the leading contributor to GDP that year, in part as the result of a good harvest. As
14The naira’s exchange rate was allowed to adjust to reflect pressures on demand in relation to supply.It depreciated from NGN117 to NGN135 to the USD by the end of December 2008, according to datafrom the Central Bank of Nigeria.
20
economic activity declined across the economy, there were massive job losses in multiple
sectors, with the textile industry particularly hard-hit (Saget and Yao, 2011). More
than 90 percent of textile companies were forced to close, while many of the remaining
few were forced to relocate abroad. Within three years of this collapse of the Nigerian
textile industry (2007-2009), more than 1 million farmers lost their jobs. The fall in
revenues meant a reduction in the fiscal space available to the government to confront
the crisis. The financial sector was also affected as a result of a drop in finance for
foreign trade, coupled with a downturn in the capital market and shrinking foreign direct
investments. Despite the squeeze, however, GDP growth rate surprisingly increased from
6.2 percent in 2007 to an estimated 6.8 percent in 2008, according to data from the
Nigerian Bureau of Statistics. Moreover, although oil-sector revenues declined by 4.5
percent, the combined growth in the non-oil sector rose to 9.5 percent, which helped the
economy avoid deceleration.
3.2.2 Macroeconomic policy interventions
Fiscal policy measures
As in many other countries affected by the crisis, the government intervened to minimise
the negative impact of the crisis. In the context of budgetary restrictions caused by falling
oil revenues, a modest fiscal stimulus package was announced for 2009. The objective
was to sustain aggregate demand, enhance infrastructure and protect the most vulnerable
households. The package amounted to NGN250.4 billion or almost 1 percent of GDP for
that year (Saget and Yao, 2011). A large proportion of the package, 36.4 percent, was
allocated to investment in developing infrastructure. A total of 25.2 percent was allocated
to measures aimed to support the labour market and protect jobs. A total of 11.6 percent
was allocated to fund tax cuts. Meanwhile, only 1 percent of the package was to be spent
on subsidies and grants for disadvantaged households. Additional measures to boost
aggregate demand accounted for the remaining 26 percent of the stimulus budget. A
number of other interventions were also implemented to limit the negative effects of
the crisis and foster a relatively quick economic recovery. The macroeconomic stimulus
package provided for 36.4 percent of the total stimulus budget to be used for launching
21
infrastructure projects.15 A particular goal was to bridge critical infrastructural gaps
so that the costs of doing business in Nigeria could be significantly reduced. The focus
on infrastructure programmes was also expected to generate hundreds of employment
opportunities. The financing of such measures was achieved through an increase in
government spending, as a budget surplus of 3.5 percent of GDP was transformed into a
deficit of 5.2 percent of GDP in 2009 (Saget and Yao, 2011).
Monetary policy measures
The central bank reacted to the crisis by instituting expansionary monetary policy mea-
sures to increase liquidity in the financial market and stimulate aggregate demand. Mea-
sures taken at the beginning of 2009 included: The central bank has reacted to the crisis
by instituting expansionary monetary policy measures to increase liquidity in the finan-
cial market and stimulate aggregate demand. In the beginning of 2009, the following
measures were taken:
1. Reducing the repo rate from 10.25 percent to 9.75 percent
2. Reducing the cash reserve requirement ratio from 4.0 to 2.0 percent
3. Reducing the liquidity ratio from 40.0 to 30.0 percent
4. Expanding lending facilities to banks up to 360 days
5. Introducing expanded discount window facility
On January 21, 2009, the Central Bank of Nigeria also proposed to spend NGN3 trillion
(USD20 billion) of the country’s reserves to cushion the economy from the consequences
of drying up of financial inflows (Soludo, 2009). This led to a sizable draw down of foreign
reserves and put pressure on the NGN’s exchange rate.
3.2.3 Performance and distributional outcomes
One of the immediate economic consequences of the crisis in Nigeria was a sharp drop
in the GDP growth rate from 6.8 percent in 2008 to 3 percent in 2009. However, as
a result of decisive measures taken by the government in coordination with the central
15Projects to be implemented included both new infrastructure and maintenance works on existingones(respectively, 28 percent and 8 percent of the total package).
22
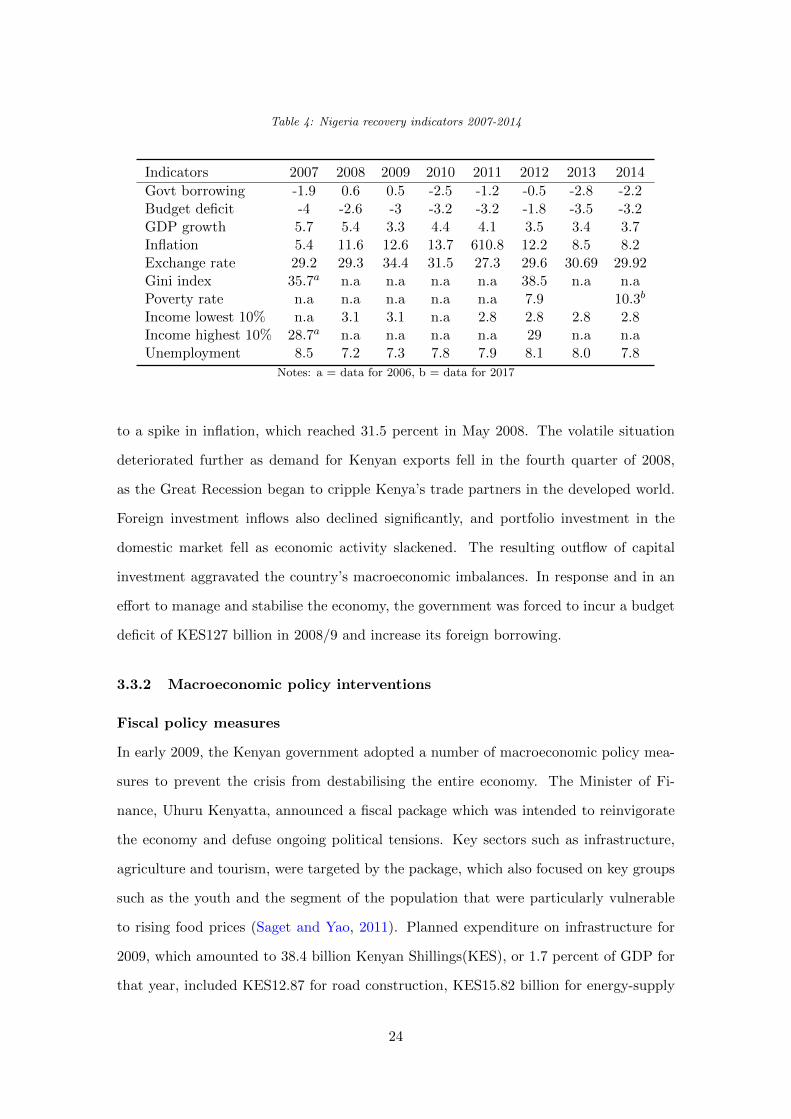
bank to contain the effects of the worldwide downturn, the growth rate rebounded to an
astonishing 8.4 percent in 2010 and remained relatively robust in subsequent years (see
Table 4).16 Notwithstanding the positive growth rates, there was a sharp jump in official
unemployment rates from 3.6 percent in 2007 to 14.9 in 2008, which was followed by a
further increase to 19.7 percent in 2010, before the level fell, fluctuating between 5 and 10
percent during the subsequent recovery years.17 Meanwhile, there was a sharp increase
in inflation from 5.4 percent in 2007 to 11.6 percent in 2008. The rate further climbed
to 13.7 percent in 2010 and stayed at double-digits level until 2012, before falling to 8.1
percent in 2014. Significant reserves enabled the government to limit budget deficits,
which remained at about 3.2 percent of GDP. Similarly, the central bank was also able to
draw on its reserves to fund the stabilisation of the currency exchange rate. The country’s
positive growth rate also helped to stabilise the exchange rate, which has fluctuated at
just below NGN30/USD. During that period, the incidence of poverty in the country
rose from 6.3 percent in 2007 to an estimated 6.8 percent in 2008.
As for the measures of inequality, which is difficult to estimate given the scarcity of
available data, it seems that the income share held by the bottom 10 percent fell slightly
from 2 percent in 2009 to 1.8 percent in 2010; while the income share of the top 10 percent
of earners increased from 28.7 percent in 2006 to 29 percent in 2012. The corresponding
Gini index rose from 35.6 percent in 2006 to 38.5 percent in 2012, which suggests that
the crisis may have exacerbated the country’s already skewed income distribution.
3.3 Kenya
3.3.1 Economic impact of the Global Financial Crisis
The crisis hit the Kenyan economy at a time when the country was reeling from the
impacts of post-election violence in the aftermath of a presidential poll in December
2007. The effects of the exogenous crisis compounded the economic damage wrought
by the internal political violence; and economic growth decelerated from a robust 6.8
percent in 2007 to a mere 0.3 percent in 2008. Meanwhile, rising commodity prices led
1615The non-oil sectors recorded a growth rate of 9.5 percent, while the oil sector shrank by 4.5 percent.17These numbers represent official unemployment statistics (World Bank) and should therefore be
regarded with caution as they are unlikely to adequately reflect underemployment and precarious em-ployment in the informal economy. .
3.7.1 Economic impact of the Global Financial Crisis
At the onset of the crisis, the Turkish government swiftly implemented monetary and
fiscal policies to stabilise the economy and help it to withstand the impacts of the shock.
Despite multiple stabilisation measures, the economy was nonetheless affected signifi-
cantly, with the GDP growth rate falling to 0.7 percent in 2008, followed by a further
decrease in the first quarter of 2009. The country also saw a 1.2 percent drop in exports,
which led to a sharp increase in unemployment, which is one of the main structural prob-
lems in the economy. Collective bargaining agreements were implemented to prevent a
further increase in unemployment. The economy was further harmed by a sudden in-
crease in the outflow of portfolio investments. The resulting decline in economic activity
was compounded by a fall in domestic demand linked to a major dip in export revenues,
which led to a trade deficit that year.
3.7.2 Macroeconomic policy interventions
Fiscal policy measures
The first comprehensive package aimed at mitigating the crisis was announced in mid-
March 2009. It was followed by the introduction of two additional packages three months
later. The packages sought to promote spending on domestic consumption, primarily by
reducing taxes and introducing measures to protect and promote employment. Tempo-
33
rary tax cuts were implemented for a 6-month period ending in September 2009. Value-
added tax (VAT) on the sale of new houses was reduced from 18 percent to 8 percent
and a temporary reduction in VAT from 6.7 percent to 0 percent was applied to sales of
electrical appliances. Vehicles with a low engine capacity also benefited from a sales tax
reduction. Meanwhile, in seeking to protect employment, the Turkish government spent
an estimated 64.8 billion Turkish lira (TL) or the equivalent of about USD45 billion,
from 2008 to 2010 on a furlough scheme, supporting workers on reduced hours.18 The
stimulus package deployed by Turkey accounted for about 6.8 percent of its GDP in 2008,
making it one of the most generous stimulus-package providers among OECD countries
at this time (Ercan et al., 2010).
Monetary policy interventions
To ease the pressure of the crisis on the financial markets, Turkey’s central bank (TCMB)
cut interest rates in 11 successive steps from November 2008 to September 2009, reducing
the borrowing rate from 16.75 to 7.25 percent. These moves were unusual for the TCMB
which has a strong history of inflation-targeting. In parallel to the rate reductions, cash
reserve requirement ratios were also relaxed in order to provide greater liquidity and en-
able banks to keep lending (Uygur, 2010). A number of measures aimed at strengthening
the capital structure of local banks were adopted; and it was decided that the central
bank should provide support to the domestic banks in order to ease the constraints on
export financing. This resulted in interest-free loans amounting to USD1.2 billion being
extended to exporter small and medium-sized enterprises (SMEs) and other manufactur-
ers. An additional USD2 billion was also made available to provide low-interest loans
to SMEs, which helped them finance their working capital requirements (Macovei et al.,
2009). In order to encourage capital inflows, the government also adopted an ”asset
peace law”, which granted a tax amnesty to holders of unrecorded financial and real
estate assets. The measures also provided a tax exemption for incomes generated from
foreigh dividends and financial transactions conducted with foreign companies as long as
that income was repatriated to Turkey before the end of May 2009.
18Additional measures introduced in mid-2008 to help protect employment included subsidies on energyexpenditures and a programme of incentives for short-time working. A youth employment support packagewas also introduced.
34
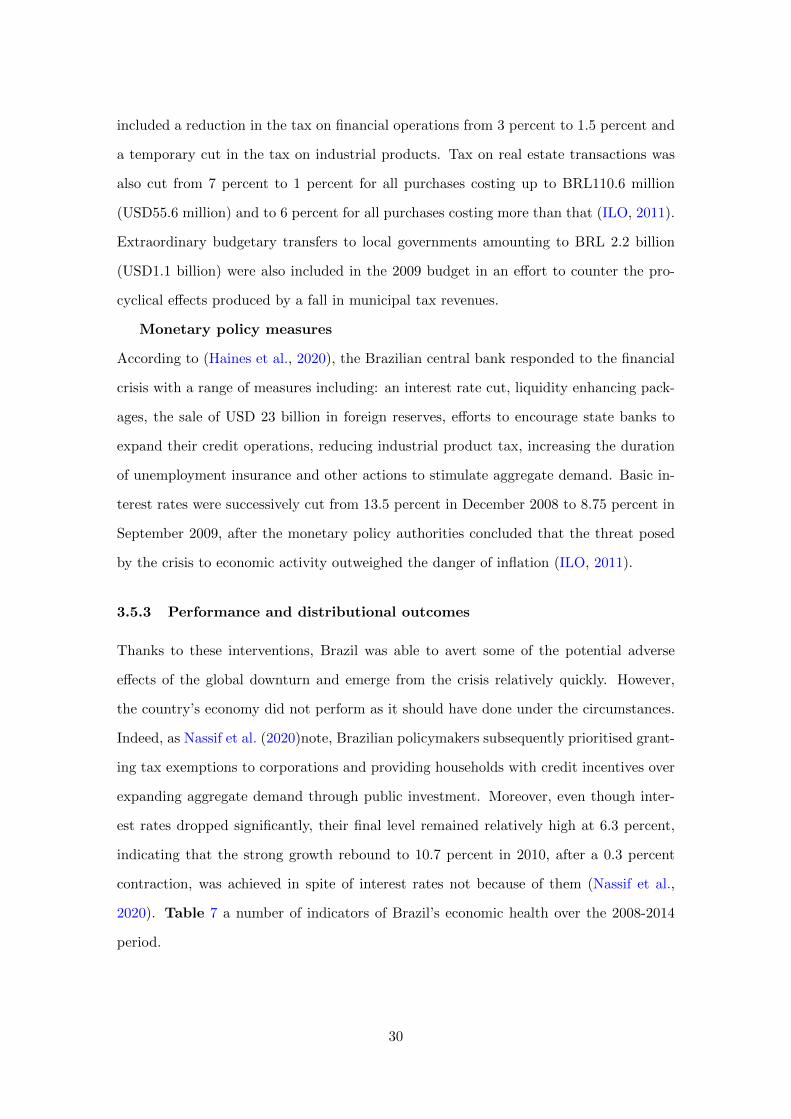
3.7.3 Performance and distributional outcomes
Thanks to the various crisis mitigation measures adopted by the government and the
country’s central bank, the Turkish economy recovered, recording a strong GDP growth
rate of 7 percent in 2010, after stumbling to negative 5.9 percent growth in 2009 ( see
Table 9). The growth rate remained positive in the recovery period, although somewhat
more subdued. At the same time, in the second half of 2008, unemployment rose rapidly,
reaching a rate of 16.1 percent by February 2009 and remaining above 10 percent for the
whole of 2010, before started to fall into single digits in 2011. The eventual drop may in
part be attributed to the effectiveness of the fiscal measure which were specifically imple-
mented to protect employment. Meanwhile, the annual inflation rate remained pegged
at single digit-levels throughout the crisis years, even as the Turkish lira’s exchange rate
deteriorated from TL1.3/USD in 2007 to TL2.2/USD in 2014. The budget deficit, which
reached a peak of 5.3 percent of GDP in 2009, was brought down to 3.5 percent in 2011
and subsequently stabilised at below 2 percent. The poverty rate as measured by the
headcount ratio of people living below the national poverty line remained stable during
the crisis and subsequently gradually fell from 17.1 percent in 2007 to 14.7 percent in
2014. The income share accruing to the poorest 10 percent remained steady at 2.2 per-
cent, while that of the richest 10 percent increased from 29.4 percent in 2007 to 31.6
percent in 2014. At the same time, the Gini coefficient indicated a slight reduction in
income inequality, declining from 43 percent to 41.2 percent over the same period. This
implies that, while overall income distribution improved during the recovery period, those
receiving the highest incomes might have derived greater benefit from the stimulus pack-
ages, while those in the bottom decile were provided with insufficient support to obtain
a greater share of the reallocated national income.
3.8 Indonesia
3.8.1 Economic impact of the crisis on Indonesian
According to Titiheruw et al. (2009), the Indonesian economy was initially quite unaf-
fected by the effects of the global financial crisis, demonstrating significant resilience in
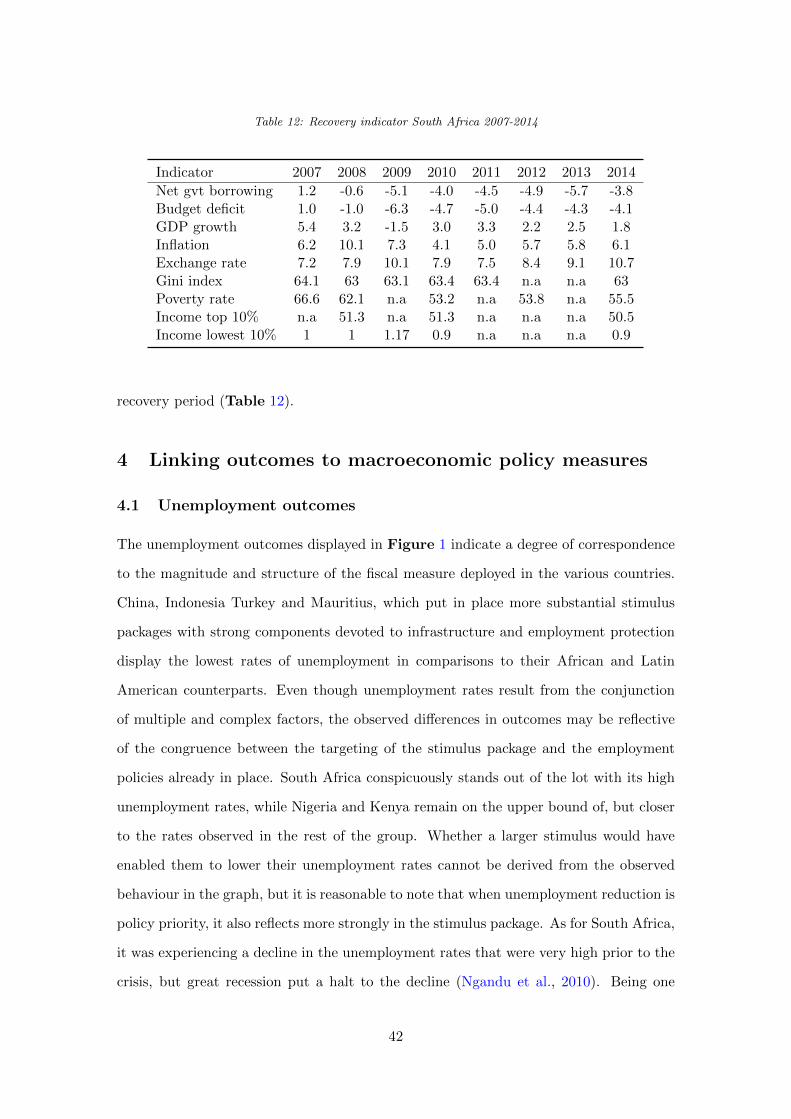
line with that experienced among most developed economies. It was not until October-
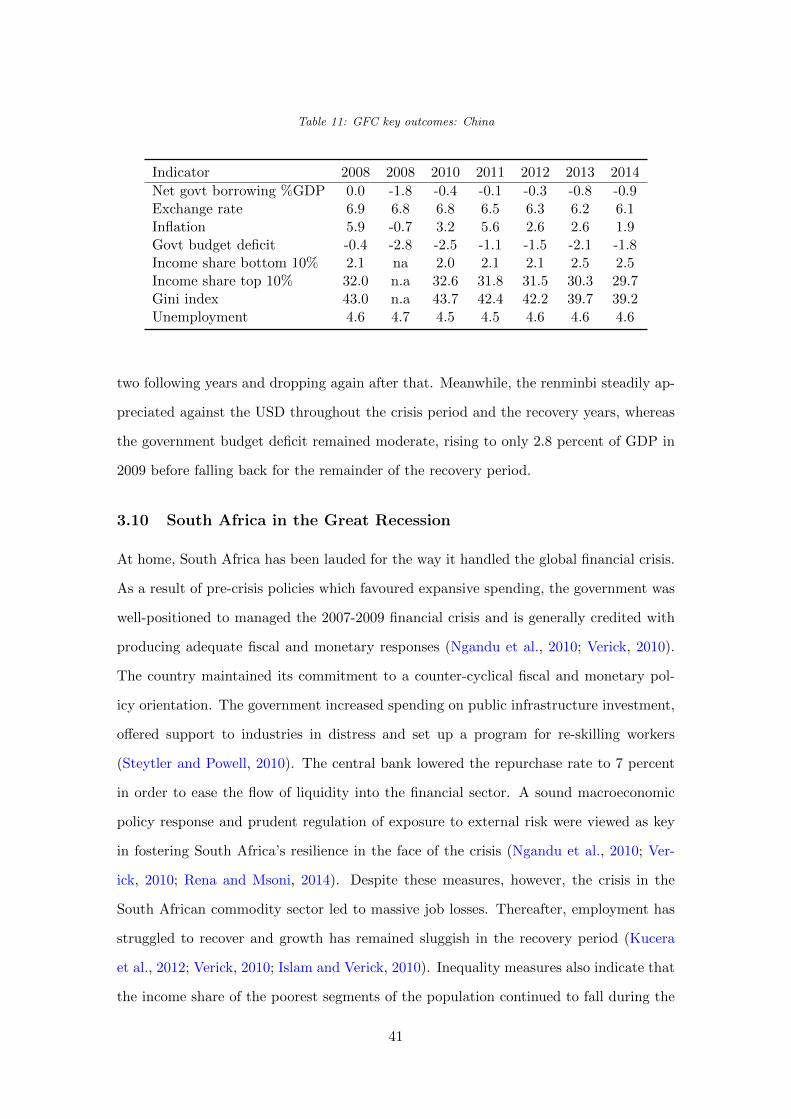
4 Linking outcomes to macroeconomic policy measures
4.1 Unemployment outcomes
The unemployment outcomes displayed in Figure 1 indicate a degree of correspondence
to the magnitude and structure of the fiscal measure deployed in the various countries.
China, Indonesia Turkey and Mauritius, which put in place more substantial stimulus
packages with strong components devoted to infrastructure and employment protection
display the lowest rates of unemployment in comparisons to their African and Latin
American counterparts. Even though unemployment rates result from the conjunction
of multiple and complex factors, the observed differences in outcomes may be reflective
of the congruence between the targeting of the stimulus package and the employment
policies already in place. South Africa conspicuously stands out of the lot with its high
unemployment rates, while Nigeria and Kenya remain on the upper bound of, but closer
to the rates observed in the rest of the group. Whether a larger stimulus would have
enabled them to lower their unemployment rates cannot be derived from the observed
behaviour in the graph, but it is reasonable to note that when unemployment reduction is
policy priority, it also reflects more strongly in the stimulus package. As for South Africa,
it was experiencing a decline in the unemployment rates that were very high prior to the
crisis, but great recession put a halt to the decline (Ngandu et al., 2010). Being one
42
0.0
5.0
10.0
15.0
20.0
25.0
30.0
2007 2008 2009 2010 2011 2012 2013 2014
Unemployment rates 2007-2014
South Africa Kenya Mauritius Nigeria Argentina
Brazil Chile China Indonesia Turkey
Figure 1: Unemployment rates 2007-2014
of the hardest hit on the African continent, South Africa shed employment by almost
900,000 from 2008 to 2009 (Verick and Islam, 2010).19 Since then, the job losses incurred
during the crisis have not been recovered; quite to the contrary, the unemployment rate
has been deteriorating over the recent period (Toyana and Nqobile, 2020).20.
4.2 Growth performance
The macroeconomic stimulus packages adopted in the sample countries were strikingly
effective in averting or reversing downturns in growth, as can be seen in Figure 2. The
graph provides a glimpse of the effects of the various stimulus packages under the socio-
economic conditions surrounding the crisis in each country. Prior to being hit by this
19Rather than a surge in official unemployment numbers, the job losses and inability to regenerate ledto rising discouragement, especially for vulnerable segments of the population, namely, uneducated, blackSouth Africans (Verick, 2010).
20On June 23, 2020, Reuters reported that South Africa had reached an official unemployment rate of30.1 percent in the last quarter of 2019, i.e. before the Covid-19 crisis reached South Africa, accordingto data from the Statistics South Africa’s quarterly labour force survey
43
crisis, most of these economies had relatively robust, positive growth rates. China, in
particular, had been enjoying double digit growth rates, buoyed by a boom in the export
manufacturing industry. The crisis brought the growth rate below 10 percent in 2008, but
massive stimulus measures ( RMB4 trillion, or 13.5 percent of the 2008 GDP) stabilised
growth at a relatively high level and even produced some gains in 2010. The longer-term
legacy of the crisis, however, seems to indicate that the peak growth rates of the early
2000s are unlikely to return in the near future. Argentina appears to have suffered the
greatest fluctuations in growth rates during the crisis and the subsequent recovery period.
After suffering an initial downturn which slashed its growth rate from a high 9 percent in
2007 to a -5.9 percent in 2009, the economy recovered and recorded a growth rate of about
10 percent in 2010, before subsiding once more. However, Argentina’s growth rates had
been oscillating between positive and negative values for quite a long time, since the 1960s.
So, it is perhaps unsurprising that the gains from the stimulus could not be sustained
for long before the economy returned to its historical oscillation between recessions and
resurgence. In contrast, Turkey stands out for having achieved some cumulative gains. It
managed to reverse a negative growth rate of -6 percent in 2009 to reach a positive rate of 7
percent in 2010, which climbed to 9.4 percent in 2011. Even though the country’s stimulus
measures alone cannot be credited for producing this impressive upturn, the government’s
approach should be hailed for helping to turn the economy around. Brazil also recorded
some significant gains as a result of its economic stabilisation measures. Growth bounced
back from a slight recession in 2009 to an impressive growth rate of 10.7 percent in 2010,
even though the rate dropped below 5 percent in subsequent years (Nassif et al., 2020).
Among African countries, Kenya and Nigeria also made substantial gains as a result of
their stimulus measures. Kenya suffered an economic deceleration in 2008 and Nigerian
growth dropped significantly in 2009, but both countries reversed their downturns and
maintained positive growth rates throughout the crisis and in its aftermath. Although
their stimulus packages were relatively modest as a percentage of their respective GDPs
(Nigeria’s represented only 1 percent of its GDP wile Kenya deployed 1.5 percent of its
GDP) both countries allocated much of the funding to infrastructure investments and
other measures that directly increased aggregate demand. For example, Nigeria used only
44
-10.0
-5.0
0.0
5.0
10.0
15.0
20.0
2007 2008 2009 2010 2011 2012 2013 2014
GDP growth rates 2007-2014
South Africa Kenya Mauritius Nigeria Argentina
Brazil Chile China Indonesia Turkey
Figure 2: GDP growth rates: crisis and recovery 2007-2014
11 percent of its package for tax cuts, but allocated 36.4 percent for infrastructure and 26
percent for other measures to boost aggregate demand and spending. For its part, Kenya
not only invested in infrastructure for job creation, but it also sought to increase wages,
thereby testing the wage-led growth hypothesis. Indeed, Kenya’s successful recovery
partly reflects the effectiveness of this measure in expanding capacity utilisation and
boosting production. Indonesia and Mauritius appear to have simply managed to stabilise
their existing momentum by avoiding any downturn, rather than producing any surge
in growth. Amid the global turmoil, South Africa suffered a downturn that saw its
growth rate drop from 5.4 percent in 2007 to a negative rate of -1.5 percent in 2009.
It subsequently registered the least gains in terms of reversing this loss, compared to
its peers in this study. Chile’s growth pattern is similar to South Africa’s, albeit with
relatively higher growth rates in the recovery period of above 5 percent between 2010
and 2012.
45
-5.0
0.0
5.0
10.0
15.0
20.0
25.0
30.0
2007 2008 2009 2010 2011 2012 2013 2014
Inflation in the wake of the Great Recession
South Africa Kenya Mauritius Nigeria Argentina
Brazil Chile China Indonesia Turkey
Figure 3: Inflation behaviour 2007-2014
4.3 Inflation behaviour
Figure 3 indicates a general increase in inflation in 2008 among the ten countries, except
for Argentina, where the rate fell in 2009 as the crisis intensified. Kenya experienced
the highest increase in inflation, in large part because of an existing crisis created by
ongoing post-electoral violence. However, it managed to reduce the headline rate to
single digit levels despite a resurgence in 2011. Nigeria’s inflation stands out as having
persistently stood above 10 percent throughout the crisis. It only started to decline in
2013. In contrast, Argentina’s inflation rate took off from 2010 and kept going upwards
throughout the entire recovery period. For all the other countries in the sample, the
inflation rate was kept within the usual bounds after increasing slightly in 2010.
46
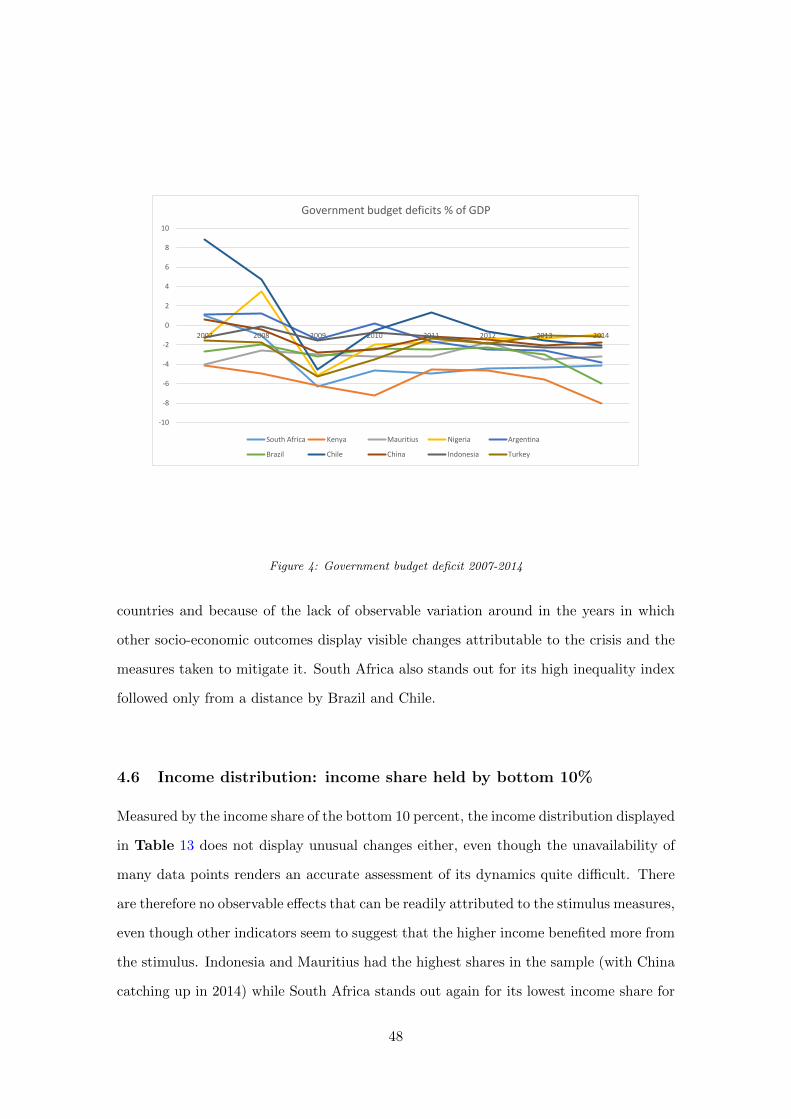
4.4 Is the fear of debt sustainability justified?
A glance at Figure 4 indicates that among all the ten countries surveyed in this study ,
budget deficits increased in 2009 in response to the crisis. In every case, however, the in-
crease was unambiguously associated with a resurgence in economic growth the following
year, as predicted by the fiscal multiplier argument. After 2009, government spending
in most countries reverted to normal levels with the result that debt financing remained
sustainable in the aftermath of the deficit increase.21 Deficit expenditure by governments
to stimulate aggregate demand is often resisted by proponents of market orthodoxy and
fiscal discipline on the grounds that it can lead to unsustainable debt burdens, while being
ineffective in increasing production because of the Ricardian equivalence (Sinai, 2009).22
When considering the Ricardian equivalence proposal, however, it is important to keep
in mind that many developing economies, which may be operating below their potential
capacity for quite long periods, have a higher likelihood to benefit from fiscal stimulation.
If the stimulus is properly targeted to activities that yield long-term benefits, the stim-
ulus can indeed be expected to generate increased capacity which will generate output
(or avoid loss) in the future.23 The debt sustainability condition must therefore take into
account the potential of government expenditure to generate additional revenue in the
future.
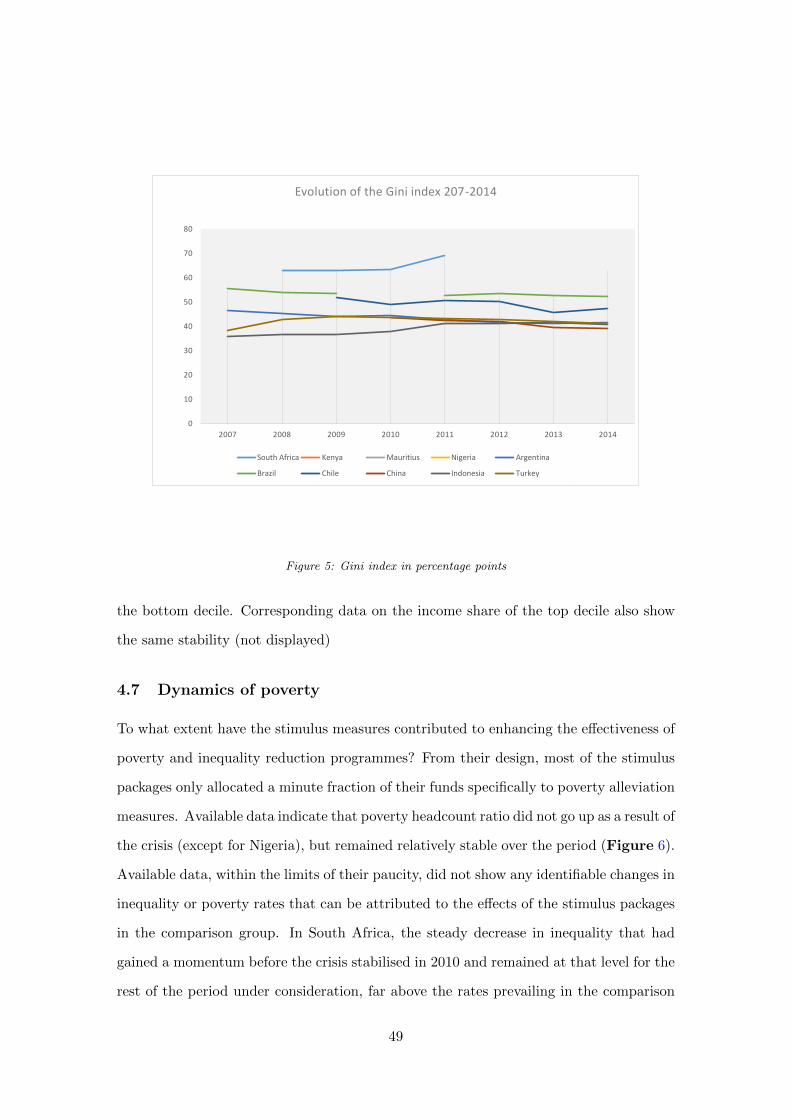
4.5 Dynamics of income inequality
The analysis of the evolution of income inequality in the relevant period does not suggest
any unusual change in its dynamics during and after the crisis, except for South Africa
where we observe a clear upward trend from 63.1 in 2009 to 69 in 2011 (Figure 5). Any
link that may exist between the macroeconomic policy stimulus and income inequal-
ity would be impossible to prove because of the paucity of data on inequality in most
21Kenya seems to be the country that struggled the most to stabilise its deficit levels over the periodin question.
22As argued by Sinai (2009), even with accommodative monetary policy, financing stimulus troughdeficits can produce side effects which will limit or even crowd out its positive effects on aggregatedemand if deficits are feared to be permanent. Expectations of future deficits and the possible futureincrease in tax to finance them with them will affect the current prices and yields on government bonds.
23For example, if the accumulation of public debt is used to finance large expenditure on developmentprojects such as public infrastructure, it can be justified provided that the expected rate of return of thedevelopment projects is higher than the cost of borrowing.
47
-10
-8
-6
-4
-2
0
2
4
6
8
10
2007 2008 2009 2010 2011 2012 2013 2014
Government budget deficits % of GDP
South Africa Kenya Mauritius Nigeria Argentina
Brazil Chile China Indonesia Turkey
Figure 4: Government budget deficit 2007-2014
countries and because of the lack of observable variation around in the years in which
other socio-economic outcomes display visible changes attributable to the crisis and the
measures taken to mitigate it. South Africa also stands out for its high inequality index
followed only from a distance by Brazil and Chile.
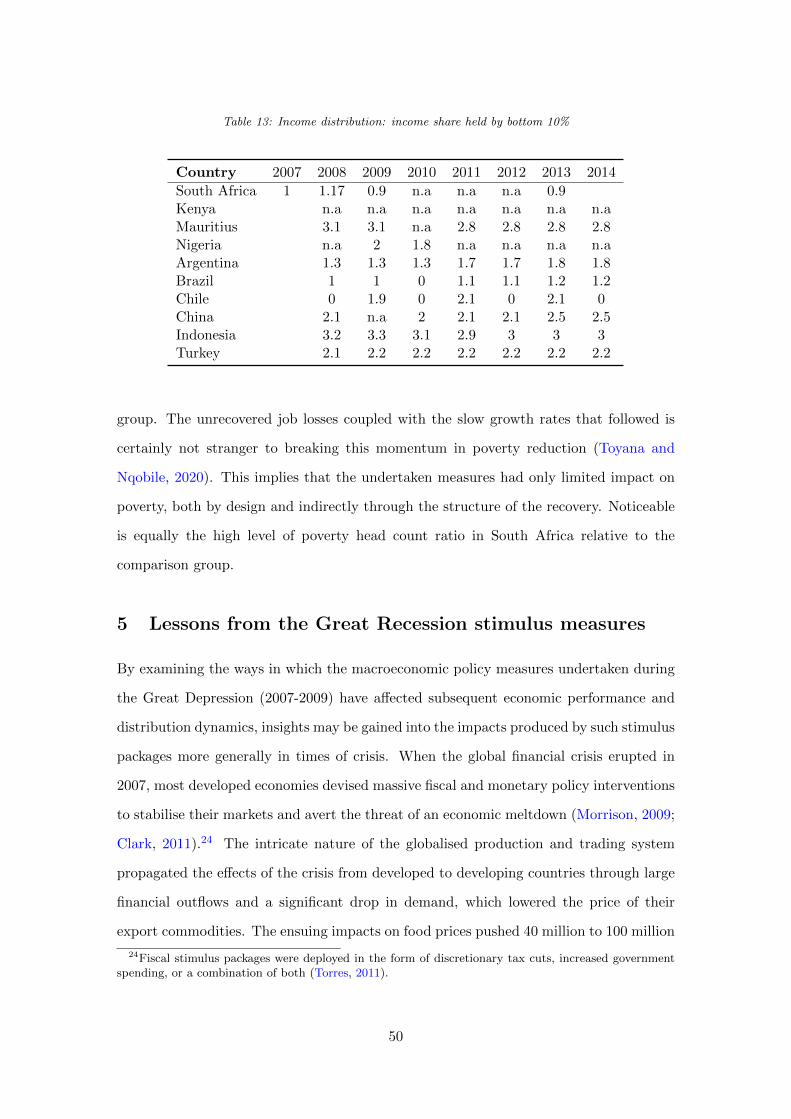
4.6 Income distribution: income share held by bottom 10%
Measured by the income share of the bottom 10 percent, the income distribution displayed
in Table 13 does not display unusual changes either, even though the unavailability of
many data points renders an accurate assessment of its dynamics quite difficult. There
are therefore no observable effects that can be readily attributed to the stimulus measures,
even though other indicators seem to suggest that the higher income benefited more from
the stimulus. Indonesia and Mauritius had the highest shares in the sample (with China
catching up in 2014) while South Africa stands out again for its lowest income share for
48
0
10
20
30
40
50
60
70
80
2007 2008 2009 2010 2011 2012 2013 2014
Evolution of the Gini index 207-2014
South Africa Kenya Mauritius Nigeria Argentina
Brazil Chile China Indonesia Turkey
Figure 5: Gini index in percentage points
the bottom decile. Corresponding data on the income share of the top decile also show
the same stability (not displayed)
4.7 Dynamics of poverty
To what extent have the stimulus measures contributed to enhancing the effectiveness of
poverty and inequality reduction programmes? From their design, most of the stimulus
packages only allocated a minute fraction of their funds specifically to poverty alleviation
measures. Available data indicate that poverty headcount ratio did not go up as a result of
the crisis (except for Nigeria), but remained relatively stable over the period (Figure 6).
Available data, within the limits of their paucity, did not show any identifiable changes in
inequality or poverty rates that can be attributed to the effects of the stimulus packages
in the comparison group. In South Africa, the steady decrease in inequality that had
gained a momentum before the crisis stabilised in 2010 and remained at that level for the
rest of the period under consideration, far above the rates prevailing in the comparison
49
Table 13: Income distribution: income share held by bottom 10%
group. The unrecovered job losses coupled with the slow growth rates that followed is
certainly not stranger to breaking this momentum in poverty reduction (Toyana and
Nqobile, 2020). This implies that the undertaken measures had only limited impact on
poverty, both by design and indirectly through the structure of the recovery. Noticeable
is equally the high level of poverty head count ratio in South Africa relative to the
comparison group.
5 Lessons from the Great Recession stimulus measures
By examining the ways in which the macroeconomic policy measures undertaken during
the Great Depression (2007-2009) have affected subsequent economic performance and
distribution dynamics, insights may be gained into the impacts produced by such stimulus
packages more generally in times of crisis. When the global financial crisis erupted in
2007, most developed economies devised massive fiscal and monetary policy interventions
to stabilise their markets and avert the threat of an economic meltdown (Morrison, 2009;
Clark, 2011).24 The intricate nature of the globalised production and trading system
propagated the effects of the crisis from developed to developing countries through large
financial outflows and a significant drop in demand, which lowered the price of their
export commodities. The ensuing impacts on food prices pushed 40 million to 100 million
24Fiscal stimulus packages were deployed in the form of discretionary tax cuts, increased governmentspending, or a combination of both (Torres, 2011).
50
0
10
20
30
40
50
60
70
80
2007 2008 2009 2010 2011 2012 2013 2014
Headcount poverty ratio at national poverty lines
South Africa Kenya Mauritius Nigeria Argentina (UPL)
Brazil Chile China Indonesia Turkey
Figure 6: Evolution of poverty head count ratios 2007-2014
people into transient poverty at various points in time, especially in non-oil-producing,
low-income countries (World Bank, 2011; Islam and Anwar, 2011; Islam and Verick, 2010).
Consequently, many developing countries were left with no choice but to enact national
monetary and fiscal policy measures to help shield their economies from the impact of
the exogenous shocks.
The stimulus measures undertaken by the countries considered in this study led to a range
of economic performance outcomes during the crisis and in the subsequent recovery period
(see section 4 above). It is generally agreed that such interventions helped build resilience
to external shocks and helped affected economies to recover more rapidly than they would
otherwise have been able to do (see Torres, 2011; Blinder and Zandi, 2015; Narayan,
2018, among others). China, for example, responded to the 2007-2009 Great Recession
by deploying an expansionary monetary policy, which entailed historically low interest
rates and a lowering of capital requirement ratios, as well as by launching a RMB4 trillion
fiscal stimulus package for 2009-2010. The package, which amounted to the equivalent
51
of 13.5 percent of GDP in 2008, aimed to buoy demand by developing public transport
infrastructure; affordable public housing; and rural infrastructure (Dullien et al., 2010;
Marinakis, 2011; Peterson Institute, 2008). This resulted in a sudden acceleration of the
growth rate from 8.8 percent in 2009 to a remarkable 10.1 percent in 2010, although
growth performance decreased in subsequent years. The recovery period also saw a
gradual decrease in inequality, whereby the Gini coefficient fell from 43 percent in 2008
to 39.2 percent in 2014.25 Likewise, Brazil invested in infrastructure to stimulate job
retention and implemented expansionary monetary policy as well as counter-cyclical fiscal
measures focused primarily on stimulating aggregate demand (for example by reducing
tax on industrial products and extending the duration of unemployment insurance). As
a result of these measures, the Brazilian economy posted a strong GDP growth rate of
7.7 percent for 2010, despite experiencing a recession in the first three quarters of 2009
(Marinakis, 2011; Torres, 2011). More widely, the stimulus measures that were adopted
skewed the benefits among different segments of the populations in many countries, most
often to the disadvantage of low-income households. For example, the use of tax cuts
as a relief measure tended to benefit workers in formal employment or business owners,
rather than informally employed workers and the poor, whose incomes were below the
taxation threshold (Chatani and Ernst, 2011). In response to external shocks produced
by the Covid-19 pandemic and the concomitant national lockdowns, many governments
are seeking to implement stimulus packages similar to those forged to manage the Great
Recession. A particular goal for government is to shield their economies from shrinking
demand. For example, workers who are unable to earn incomes because they have been
forced to stay at home run the risk of losing their healthcare insurance and purchasing
power. As emphasised by Baldwin and Weder di Mauro (2020), the looming economic
recession may be alleviated by ensuring that people have the money to keep spending
even when they are not earning. However, governments will need additional borrowing
capacity in order to fund such expenditure, which many developing countries cannot
readily source. Some scholars, such as Galı (2020) or Gourinchas (2020), have therefore
been suggesting to governments to have recourse to so-called ”helicopter money” vehicles
25The income share held by the top decile also decreased slightly from 32 to 29.7 percent over the sameperiod, according to data from the Bank of China.
52
to finance stimulus packages, given the exceptional character of the present crisis.26
6 South Africa’s Covid-19 response
6.1 Fiscal stimulus: magnitude and targeting
The current Covid-19 crisis hit South Africa at a moment when the country was already
facing grave economic and social difficulties. The economy was in recession, households
and firms were struggling with the crippling effects of incessant load shedding, while ma-
jor state-owned enterprises, (including South African Airways (SAA), energy producer
Eskom and defense & aerospace equipment producer Denel) were all in financial troubles
requiring government intervention. In the 2020 budget speech, the Minister of Finance
projected a growth rate of only 0.9 percent with little prospects for improvement in the
future as persistent electricity supply problems were expected to hold back economic
activities in the next three years. To make the matters worse, when the Covid-19 crisis
intensified, Moody’s downgraded the South African sovereign debt to below investment
grade on March 27, 2020.27 That had as implication that the country’s fiscal space
became constrained even further. Growth projections drastically changed with further
intensification of the crisis and the ensuing lockdown measures that nearly put a halt
to most economic activities for the first three weeks starting in March 26. The South
African Reserve Bank projects a 4.0 percent contraction for 2020, with little hope of a
rapid rebound in 2021. The ZAR500 billion fiscal response initially proposed for dealing
with the impact of COVID-19 pandemic includes intervention to support job retention
in SME and an increase in social protection, but is conspicuously lacking in capacity to
stimulate aggregate demand (see Table 1 supra). In terms of its composition, its most
visible characterisation is its extreme skewness towards corporations as it nearly reserves
75 percent of its planned spending (ZAR370 billion out of 500bn) for supporting business
enterprises through direct financial assistance or tax cuts (Table 1). Support to vulnera-
26According to Galı, the central could create ”helicopter money” ex nihilo by crediting the government’saccount for the amount required for the Covid-19 relief transfers. That credit would not be repayableand would not have any impact on the central bank’s profit. Alternatively the central bank can performan equivalent operation by purchasing government debt to the desired amount, followed by its immediatewriting-off, thus removing all impact on the government’s effective liabilities.
27This was the last major rating agency that had not done so earlier
53
ble households accounts only for 10 percent of the proposed package. That configuration
is at odds with the conventional pecking order of multipliers that assigns a higher stimu-
lating effect to infrastructure spending in comparison to tax cuts. Because of their state
of precariousness, vulnerable households will generally have a higher propensity to con-
sume than businesses enterprises, which may save part of the tax cut they receive (Lavoie
and Stockhammer, 2013; Bhaduri, 2008).28 By lack of reliable data on budget increases
covering enough time span for South Africa, we rely on the rule of thumb suggesting
the multiplier to lie between 0.5 and 1 for medium-sized countries (Batini et al., 2014;
Spilimbergo et al., 2009). From a comparison of fiscal multipliers pertaining to different
components of fiscal packages calculated in different studies, Verick and Islam (2010)
suggested that when governments prepare to enact fiscal stimulus packages, they should
give priority to spending measures instead of tax cuts. Governments are also advised
to focus on employment-intensive capital expenditure, such as investments in infrastruc-
ture, because they yield larger impact on output and employment gains for each dollar
spent on fiscal expansion. When these recommendations are juxtaposed to the proposed
stimulus, it is remarkable that spending on infrastructure is totally absent, but this is
not entirely surprising. Given the financial stress imposed by the lockdown restrictions,
it may be more reasonable to consider the government measures as merely intended to
avoid the distress of businesses and the potential consequences on job losses, rather than
a stimulus intended to pull the economy out of the recession it was already in. This
means that in order to put the economy on a growth trajectory once the pandemic has
been brought under control, a substantial stimulus package will be necessary to boost
aggregate demand. Given the stagnation that the country has experienced over the last
ten years however, the stimulation of aggregate demand is unlikely to produce growth in
the absence of substantive structural reforms that address not only capacity utilisation
in production but also the redistribution of the national income between labour and cap-
ital (Palley, 2017; Bhaduri, 2008; Bhaduri and Marglin, 1990). As argued by Krugman
(2009), the paucity of the stimulus package has negative implication on the speed of re-
28Considering the poverty rate in South Africa together with the rate of unemployment and the wagestructure prevailing in the country, it becomes obvious that a the country is still home to a considerablenumber of ”working poor”, i.e. people who are employed but whose income puts them blow the povertyline.
54
covery. The restrictions imposed to contain the health risk mean that the fiscal responses
were intended more as a means to prevent their collapse of the existing economic struc-
ture and not as a instrument to stimulate demand, because production could obviously
not expand while people are locked down. Consequently, as lockdown restrictions were
gradually removed to allow economic activities to resume, a real economic stimulus with
sufficient magnitude and adequate targeting became necessary to tow the economy from
its pre-crisis stagnation.
6.1.1 Financing the fiscal response
On June 18,2020, the Minister of Finance announced that he would be tabling a sup-
plementary budget imposing substantial cuts in government spending to avert a looming
debt crisis (Magubane, 2020). This is a strong warning, reflecting the dire budgetary
constraints the South African government is currently confronted with. The exiguity
of the fiscal space can impede the country’s ability to adequately respond to crises and
may thus unnecessarily prolong its harmful effects if it prevents the government from
mobilising the required resources to finance the countercyclical fiscal measures.29 For
a budget-setting body faced with a narrow fiscal space, a good tool for analysing the
available options is the fiscal space diamond (Roy et al., 2007; Roy, 2010). It is called
fiscal space diamond because of the four pillars that sustain it:
1) External funding such as aid and debt relief
2) Domestic revenue mobilisation through improved tax collection
3) Deficit financing through domestic and external borrowing
4) Reprioritisation and improvement in the efficiency of expenditures
as represented in Figure 7 Governments can expand their fiscal space by optimizing
receipts from each of these sources. The diamond does not include seignorage as a source
of additional fiscal space, because it is often considered to be an undesirable option. In
the case of South Africa grappling with the recent downgrade of its sovereign debt (which
increased the cost of borrowing in international markets), building trust with domestic
lenders who have a bigger stake in its long-run economic success is key to securing the
29Fiscal space is defined as “the availability of budgetary room that allows a government to provideresources for a desired purpose without any prejudice to the sustainability of a government’s financialposition” Heller (2005).
55
Figure 7: The fiscal space diamond (Roy et al., 2007)
necessary funds to finance the needed reforms. Some scholars consider seignorage as a
possible source of fiscal expansion, even though it has almost become taboo in monetary
policy circles (Roy et al., 2007). Recognising the role of seignorage and the crowding in
effects of public investment is however very important as suggested by Vera (2009) and
Galı (2020), but requires doing away with the debt sustainability condition, which rests
on the assumption that growth and the variation of interest rates have no bearing on
budgetary measures (Vera, 2009). This assumption is often not valid in many develop-
ing countries so that recommendations based on it are usually not appropriate to the
developing country context.
6.2 Monetary policy: adequacy and credibility
New neoclassical synthesis models have produced a number of key proposals about the
role of monetary policy in stimulating the real economy. First, NNS models suggest that
monetary policy actions have a persistent effect on real economic activity because of the
slow adjustment of prices (Barro, 1976; Goodfriend and King, 1997; Nassif et al., 2020).
Second, the models contend that costly price adjustments limit the long-term trade-offs
that inflation can produce in terms of real economic activity. Third, the models assert
that eliminating inflation produces significant gains in terms of transactional efficiency
and reduced price distortions (Goodfriend and King, 1997; Nassif et al., 2020). The
so-called new macroeconomic consensus emanating from NNS argues that the role of
monetary policy should be to pursue price stability and peg inflation expectations in
56
order to minimise the output gap and stimulate aggregate demand (Nassif et al., 2020).30
Under this argument, a key aspect of any inflation-targeting regime is to minimise any
future expectations of inflation, since economic agents are assumed to be guided by
rational expectations (Lucas, 1976). Because of the important role that credibility plays
for agents guided by rational expectations, so goes the argument, it is preferable that
monetary policy be shaped by rules, rather than discretion, and implemented through
an independent central bank (Chari et al., 1988; Ball, 1995; Goodfriend and King, 1997;
Gonzalez G and Hamann, 2011). Finally, NNS models tend to dismiss the counter-cyclical
power of expansionary fiscal policy, which was shown by the IMF (2008) to play a key
role in balancing development trajectories. This dismissal is based on the assumption of
Ricardian equivalence, although the conditions for such equivalence are generally absent
in most developing countries (Vera, 2009). Using NNS models, the consensus view is that
monetary instruments, in particular the policy interest rate, represent the main means
for forging macroeconomic policy. Under this view, fiscal policy and its efforts to steer
the economy towards reaching full employment plays only a supporting role, since fiscal
policy is bound to be aligned first and foremost with monetary policy (Nassif et al., 2020).
However, as was remarked by Keynes (1936) in his General Theory, efforts to resort
to inflation targeting in a floating exchange-rate regime will eventually constrain the
autonomy of monetary policy in the absence of policy instruments for regulating capital
flows. With money flowing in and out of the country in short-run portfolio investments
and capital flight, an inflation-targeting regime is unable to stabilise inflation or sustain
long-term growth in open, developing economies (Nassif et al., 2020; Mohanty et al.,
2008).31. As noted by (Nassif et al., 2020) and Patnaik et al. (2011), the transmission
channels between monetary policy and the real economy need to work efficiently for
inflation targeting to achieve its goal. In the absence of such efficiency, the inflation
target will only be achieved at the expense of higher real interest rates. The response
of the South African Reserve Bank to the Covid-19 crisis, whereby it pledged to lower
30By setting inflation to a target, it is argued, monetary authorities will minimise the output gap tozero through what Blanchard and Galı (2007) call ‘divine coincidence’ and stimulate aggregate demand,thereby sustain long-term growth (Nassif et al., 2020; Vera, 2009).
31Nassif et al. (2020) showed that the effectiveness of inflation targeting policy in Brazil has been verypoor because of the inadequacy of the inflation-targeting regime to fight inflation in developing economiesdependent on foreign capital flows.
57
interest rates and buy government bonds to increase liquidity in the financial market,
should be interpreted within the context of these debates. In this regard, the arguments
advanced by monetarists and neo-liberal inflationists fail to take account of the long-
term dynamic gains that may accrue to the economy from short-run capacity expansion
in developing countries, as recalled by Nassif et al. (2020) and Vera (2009).
6.3 Stimulus, inequality and structural reforms
The International Labour Organisation (ILO) considers an unemployment rate of 10 per-
cent to be socially harmful. It therefore recommends that once this level is breached,
exceptional measures should be implemented to restructure the economy (Marinakis,
2011). The persistently high levels of unemployment experienced in South Africa since
the Global Recession are more than three times higher than this benchmark, indicating
that such restructuring is a matter of great importance and urgency. In this context,
the issue of producing more equitable wages and thus reducing social polarisation should
represent a priority for government, as it seeks to close the widening income inequality
(Lavoie and Stockhammer, 2013). Such efforts would require a more judicious alignment
of industrial policy with labour-market regulations in order to foster societal structures
that can create greater inclusiveness and sustainability in new systems of production. In
considering the measures available to them, policymakers may be tempted to listen to
the proponents of strict fiscal discipline, who found justification for their arguments in
the association between persistent fiscal deficits and major balance-of-payment problems,
as well as high inflation, in developing countries in the 1980s and 1990s. During this era,
money-supply challenges led to declines in national savings and caused unsustainable debt
burdens (Vera, 2009), which, in turn, stifled investment and growth prospects, producing
a “lost decade” for many developing countries. In order to avoid choosing fiscal responses
that may unnecessarily prolong the crisis and reinforce the present high rate of unemploy-
ment, it is important that policy makers attend carefully to the implications of the fiscal
interventions, namely in terms of their multiplier effects. They should look to provide
social protections and preserve jobs, while also spending on infrastructure to create more
jobs and boost long-term productivity. At the same time, policymakers should bear in
58
mind that the alleged existence of an inverse relationship between capacity-utilisation
levels and the real wage rate, as proposed by neo-classical economists, and even Keynes
in his General Theory, is only valid in the special case of profit-led expansion (Bhaduri
and Marglin, 1990; Bhaduri, 2008). In other cases, increasing workers’ wages will tend to
foster economic expansion and produce greater utilisation of capacity, leading to a wage-
led growth economy. As is argued by Palley (2017), an increase in the workers’ share of
wage income, which shifts revenue from high-saving capitalist-managers to workers(who
generally save less of their extra income), causes aggregate savings to fall. Similarly, a
greater share of workers’ ownership in firms shifts profit income from capitalist-managers,
who save more, to workers, who generally have a higher marginal propensity to consume,
which also causes aggregate savings to fall. Such decreases in savings imply that a greater
share of national income is being allocated to consumption, which increases aggregate
demand and expands capacity utilisation (Lavoie and Stockhammer, 2013; Palley, 2017;
Bhaduri, 2008). In other words, the growth–inequality trade-off often advanced by neo-
liberal economists may be overcome by reducing the polarisation in wage distribution,
thereby increasing capacity utilisation. 32 Even more significantly, if the wage distribu-
tion is changed sufficiently, the economy can flip from being profit-led to being wage-led
(Palley, 2017; Lavoie and Stockhammer, 2013).33 Accordingly, policymakers should aim
to increase workers’ wage share. More income in workers’ hands stimulates economic ac-
tivity without reducing investment spending. In the wake of the Covid-19 health crisis,
South Africa, as the most unequal economy on the world and one which is experienc-
ing stagnation, should seek to exploit the growth potential of income redistribution as
a means of expanding capacity utilisation and creating employment opportunities. Such
an approach would also address the problem of the “working poor”, i.e. those people
who work full time, yet experience the indignity of living below the poverty line.
32This has long been the ideological tenet of social democracy push for wage increase (Bhaduri andMarglin, 1990).
33Income distribution can be modified or influenced by appropriate government policies by securinglow real interest rates or by modifying the tax code (Lavoie and Stockhammer, 2013).
59
7 Concluding discussion
In this paper, we have attempted to build an understanding of the possible repercussions
of the Covid-19 fiscal response proposed by the South African Government on growth per-
formance but also on income distribution. We have used the fiscal multiplier framework
and the Bhaduri and Marglin (1990) model of distribution-based output expansion as our
analytical lenses to dissect the 2007-2009 Great Recession fiscal responses of 9 compari-
son countries as a source of lessons for how the current fiscal response may work out on
South Africa’s recovery, poverty and inequality. Despite limitations in the availability of
reliable data, the framework we used enabled us to shed light to the positive association
between the stimulus structures that emphasised government spending known to have
larger fiscal multipliers and corresponding growth performance in the years following the
enactment of these measures. Monetary policy measures adopted during the crisis were
complementary to the fiscal measures and served primarily to stabilise business opera-
tions by facilitating access to liquidity and borrowing. On the other hand, available data
did not show any visible connection between the adoption of macroeconomic stimulus
measure and subsequent changes in rates of inequality and poverty. The absence of ob-
servable changes in the incidence of poverty and inequality is however not an evidence
that such measures do not affect poverty and income distribution. It may instead indi-
cate that existing poverty reduction programmes were able to stabilise poverty and avert
the potential deterioration as a result of the crisis. The observed relationships between
the enacted measures and changes in socio-economic outcomes provide at least three
useful lessons for confronting new crises requiring macroeconomic interventions. First,
the experience of the Great Depression point to the importance of adopting fiscal and
monetary policy measures with the highest expected fiscal multipliers, and preferably
enacting them in time to avoid economic downturns rather than having to reverse them
after they have impacted the economy. Countries such as China and Mauritius, which
timely adopted sizable stimulus packages with emphasis on spending rather than tax cuts,
were able to retain positive growth rates during the crisis and stabilise them afterwards.
Those that adopted similar measures on a reactive basis saw their growth drop signifi-
cantly before the adopted measure could yield their effects in subsequent years. Second,
60
the fear of rising inflation following the lowering of interest rates during the crisis was a
posteriori not justified as most countries considered in this study managed to keep their
inflation levels under control. The generalised surge in growth rates observed in 2009
reflect the output response to the stimulus measures as predicted by NNS models. It
therefore suggests that the Ricardian equivalence theorem of crowding out the effect of
a deficit-financed stimulus package did not hold.
Third, fiscal interventions tend to produce outcomes that are disproportionately ad-
vantageous to the already privileged segments of the population. In the absence of a fiscal
stimulus targeting more intensively the credit-constrained group with the highest MPC,
compensatory measures are necessary in the existing poverty reduction programmes to
avoid a worsening of income polarisation.34
As the government debates budgets and the South African Reserve Bank remains pinned
on inflation targeting, food insecurity and hunger are still affecting 20 percent of South
African households according to the latest data from Statistics South Africa (StatSA,
2019).35 The skewed income distribution that produces 20 percent of households expe-
riencing hunger on a daily basis in a nominally food-secure country is the outcome of
complex social and economic processes, but governments can influence it by changing
tax policy and labour market regulations (Lavoie and Stockhammer, 2013). Beyond the
immediate dangers and economic hardships of the incipient recession, this crisis is there-
fore an unexpected opportunity for policy makers to rethink the social relations and the
economic structure that must be re-engineered with the aim to shape a more industrious
and more prosperous post-Covid-19 society. Because of the extractive profit-led regime
that has underpinned its economic doctrine, the South African economy has reached
the limits of its orthodox growth possibilities and has been stagnating for more than a
34The response to Covid-19 with fiscal measures has particular context that does not fit the operationalconditions of previous crises: the enacted lockdown brought a forced halt to many economic activities onthe supply side, so that aggregate demand stimulation during lockdown does not make much sense. Theadopted macroeconomic measures should therefore be regarded primarily as a rescue package designedto stabilise the business sector and prevent a widespread bankruptcy due to lost revenue during theperiod they were not able or allowed to operate. The compromise between health protection and thereopening of the economy means that capacity utilisation will remain suboptimal until the health risk iscompletely eliminated, at which time the necessary structural reforms would need to be put in place forthe additional macroeconomic policy measures to contribute to new capacity expansion.
35The survey conducted in 2017 showed that 6.8 million South Africans (1.7 million households) werestill experiencing hunger.
61
decade (Mohamed, 2009; Mazzucato, 2018).36 Structural reform is therefore not just an
optional experimentation, but a necessity to rescue the economy from the middle-income
trap in which it is inextricably entangled (Mohamed, 2009; Luiz, 2016; Kruss, 2020). The
structural reforms to be envisaged should aim to shift the economy from stagnationist
profit-led regime that has governed the country since long towards an exhilarationist
regime combining investment-led capacity expansion with wage-led growth. Such a shift
will require forging ”upgrading coalitions” (Doner and Schneider, 2016) with shared con-
victions between government, domestic investors and trade unions. With the view to
building a fairer, greener and more resilient economy, the coalitions will play a leading
role in engineering the long-term growth dynamics aimed to bring about a post-Covid-19
economy that works for all segments of our society. Questions that need to be addressed
when designing those reforms include the following:
� Given the current stagnation, which strategic growth areas should South Africa
pursue in accordance with its dynamic comparative advantage ?
� What is the bearing of inequality on the stagnation regime and how can growth be
achieved through inequality reduction?
� Which growth regime is South African economy likely to experience and how can
the stagnation be overcome through an adaptation to a growth enhancing wage-led
regime?
� How can the required investments be financed in the context of a narrowing fiscal
space, taking long-term gains into account?
� Which role does the inflation targeting regime of the South African Reserve Bank
play in the stagnationist dynamics?
� What are the possibilities offered by the country’s fiscal diamond to finance its
long-term development?
36In The Value of Everything, Mazzucato (2018) stressed the difference between value extraction andvalue creation and the limitations of the former in the accumulation process. Robinson and Acemoglu(2012) have also argued that an economic system based of extraction rather than creation is ultimatelydoomed to reach the limits of its possibilities and fail to bring prosperity to its citizens.
62
� Should South Africa pursue pro-cyclical or counter-cyclical fiscal policy interven-
tions?
References
Anos Casero, P., D. Cerdeiro, and R. Trezzi (2010): “Estimating the fiscal mul-
tiplier in Argentina,” World Bank Policy Research Working Paper, 3.
Baldwin, R. and B. Weder di Mauro (2020): Mitigating the COVID Economic
Crisis: Act Fast and Do Whatever It Takes, CEPR Press.
Ball, L. (1995): “Disinflation with imperfect credibility,” Journal of Monetary eco-
nomics, 35, 5–23.
Barro, R. J. (1976): “Rational expectations and the role of monetary policy,” Journal
of Monetary economics, 2, 1–32.
Batini, N., L. Eyraud, and A. Weber (2014): A simple method to compute fiscal
multipliers, 14-93, International Monetary Fund.
Bhaduri, A. (2008): “On the dynamics of profit-led and wage-led growth,” Cambridge
Journal of Economics, 32, 147–160.
Bhaduri, A. and S. Marglin (1990): “Unemployment and the real wage: the economic
basis for contesting political ideologies,” Cambridge journal of Economics, 14, 375–393.
Blanchard, O. and J. Galı (2007): “Real wage rigidities and the New Keynesian
model,” Journal of money, credit and banking, 39, 35–65.
Blinder, A. and M. Zandi (2015): “The financial crisis: Lessons for the next one,”
Center on Budget and Policy Priorities.
Campbell, D. (2011): “Employment-led Growth and Growth-led Employment in the
Recovery,” The Global Crisis. Causes, responses and challenges.
Chari, V. V., P. J. Kehoe, E. C. Prescott, et al. (1988): “Time consistency and
policy,” Tech. rep., Federal Reserve Bank of Minneapolis.
63
Chatani, K. and C. Ernst (2011): “The scale stimulus package in Indonesia and its
impact on employment creation,” The global crisis: Causes, responses and challenges.
Clark, B. (2011): “Inequality and the Great Recession,” Challenge, 54, 56–79.
Contreras, D. and R. French-Davis (2012): “Policy regimes, inequality, poverty
and growth: The Chilean experience, 1973-2010,” UNU-WIDER Working Paper.
Creamer, T. (2020): “Ramaphosa says infrastructure to be placed at heart of South
The UNU‐MERIT WORKING Paper Series 2021-01 Transformation towards sustainale development goals: Role of innovation by
Michiko Iizuka and Gerald Hane 2021-02 Access to social protection for platform and other non‐standard workers: A
literature review by Tamara A. Kool, Giulio Bordon and Franziska Gassmann 2021-03 Labour‐augmenting technical change data for alternative elasticities of
substitution, growth, slowdown, and distribution dynamics by Thomas Ziesemer 2021-04 Democracy and COVID‐19 Outcomes by Gokhan Karabulut, Klaus F. Zimmermann,
Mehmet Huseyin Bilgin and Asli Cansin Doker 2021-05 Patent landscaping using 'green' technological trajectories by Önder Nomaler &
Bart Verspagen 2021-06 Macroeconomic stimulus packages and income inequality in developing countries:
Lessons from the 2007‐9 Great Recession for the Covid‐19 crisis in South Africa by Alexis Habiyaremye, Peter Jacobs, Olebogeng Molewa and Pelontle Lekomanyane