48
1 2021 Ambient Air Monitoring Network Plan Planning, Monitoring & Grants Division June 2021
1
2021 Ambient Air Monitoring
Network Plan
Planning, Monitoring & Grants Division
June 2021
SAN LUIS OBISPO COUNTY AIR POLLUTION CONTROL DISTRICT
2021 AMBIENT AIR MONITORING NETWORK PLAN
2
Contents List of Abbreviations and Symbols ................................................................................................................... 4
Introduction ........................................................................................................................................................ 5
General Information on Air Monitoring Networks ........................................................................................ 6
Air Monitoring Stations in San Luis Obispo County ....................................................................................... 7
Changes to Monitoring Network Since the Previous ANP ...................................................................... 10
Opened, Closed, and Relocated Stations .............................................................................................. 10
Ozone Monitoring Network Changes .................................................................................................... 10
Particulate Monitoring Network Changes ............................................................................................. 10
Nitrogen Dioxide Monitoring Network Changes .................................................................................. 10
Sulfur Dioxide Monitoring Network Changes ....................................................................................... 10
Infrastructure and Support Equipment Changes ................................................................................. 10
Detailed Descriptions of the Current Network ......................................................................................... 11
Ozone Monitoring Network ..................................................................................................................... 11
Nitrogen Dioxide Monitoring Network .................................................................................................. 12
Sulfur Dioxide Monitoring Network ....................................................................................................... 13
Particulate Monitoring Network ............................................................................................................. 14
Other Networks ........................................................................................................................................ 15
Proposed Network Changes and Improvements ..................................................................................... 16
New Stations and Station Closures and Relocations ........................................................................... 16
Nitrogen Dioxide Network ....................................................................................................................... 16
Sulfur Dioxide Monitoring Network ....................................................................................................... 17
Infrastructure and Support Equipment Changes ................................................................................. 17
Accessing Air Quality Data .............................................................................................................................. 18
Appendix A: Minimum Monitoring Requirements ....................................................................................... 19
Minimum Monitoring Requirements for Ozone (O3) ............................................................................... 19
Minimum Monitoring Requirements for PM2.5 SLAMS ............................................................................ 20
Minimum Monitoring Requirements for Continuous PM2.5 Monitors ................................................... 20
Minimum Monitoring Requirements for PM10 ......................................................................................... 21
Minimum Monitoring Requirements for Nitrogen Dioxide (NO2) .......................................................... 21
Minimum Monitoring Requirements for Sulfur Dioxide (SO2) ............................................................... 22

SAN LUIS OBISPO COUNTY AIR POLLUTION CONTROL DISTRICT
2021 AMBIENT AIR MONITORING NETWORK PLAN
3
Minimum Monitoring Requirements for Carbon Monoxide (CO) .......................................................... 22
Minimum Monitoring Requirements for Lead at NCore ......................................................................... 23
Source-Oriented Lead Monitoring (Including Airports) ........................................................................... 23
Near-Road NO2, PM2.5, and CO Monitors .................................................................................................. 23
Appendix B: Collocation Requirements......................................................................................................... 23
Appendix C: Detailed Site Information .......................................................................................................... 25
Appendix D: Non SLAMS Network Operations ............................................................................................. 47
SAN LUIS OBISPO COUNTY AIR POLLUTION CONTROL DISTRICT
2021 AMBIENT AIR MONITORING NETWORK PLAN
4
List of Abbreviations and Symbols
AADT Annual Average Daily Traffic count
AB Assembly Bill
ANP Annual Network Plan
AQMD Air Quality Management District
AQS Air Quality System
AQS ID Air Quality System site identification number
BAM Beta Attenuation Monitor
CARB California Air Resources Board
CBSA Core Based Statistical Area
CDF California Department of Forestry
CFR Code of Federal Regulations
CO Carbon monoxide
E-BAM Portable, non-FEM version of the BAM
EPA United States Environment Protection Agency
FAA Federal Aviation Administration
FEM Federal Equivalent Method
FRM Federal Reference Method
MSA Metropolitan Statistical Area
NAAQS National Ambient Air Quality Standard(s)
NCore National Core multipollutant monitoring station
NO Nitrogen oxide
NO2 Nitrogen dioxide
NOx Oxides of nitrogen
NRP Nipomo Regional Park
O3 Ozone
ODSVRA Oceano Dunes State Vehicular Recreation Area
PAMS Photochemical Assessment Monitoring Station
PM2.5 Particulate Matter less than 10 microns in aerodynamic diameter
PM10 Particulate Matter less than 2.5 microns in aerodynamic diameter
Pb Lead
ppb Parts per billion
PQAO Primary Quality Assurance Organization
SIP State Implementation Plan
SLAMS State or Local Air Monitoring Station
SLOCAPCD San Luis Obispo County Air Pollution Control District
SO2 Sulfur dioxide
SPM Special Purpose Monitor
ZAG Zero Air Generator
SAN LUIS OBISPO COUNTY AIR POLLUTION CONTROL DISTRICT
2021 AMBIENT AIR MONITORING NETWORK PLAN
5
Introduction
Every year the San Luis Obispo County Air Pollution Control District submits an ambient air
monitoring network plan to the United States Environmental Protection Agency; this document
comprises the ANP for 2021. It is intended to fulfill the requirements of 40 CFR 58.10 and to provide
information about local monitoring activities to the public. The focus of this ANP is the network of
regulatory monitors in the County; non-regulatory monitoring is discussed in Appendix D.
Consistent with these goals and requirements, this ANP will be made available for public review and
comment for at least 30 days prior to its submission to EPA. All comments received and any
SLOCAPCD responses to those comments will be attached as Appendices E and F, respectively, and
submitted to EPA as part of this ANP. The cover letter accompanying submission will note the
beginning and ending dates of the comment period, whether any comments were received, and
which comments were substantive. For any non-substantive comments, the cover letter will provide
a rationale for deeming them as such. If public comments prompt changes to the ANP, these
changes will be noted in the cover letter.
The ANP is a snapshot of the air monitoring network as it currently exists, and it also documents any
changes since the last ANP (published June 2020) and any modifications anticipated over the next 18
months. This review and planning process helps ensure continued consistency with federal
requirements and monitoring objectives. It also confirms and updates information in state and
federal monitoring records. Information is provided for all ambient air pollution monitoring which
occurred in the county, including sites operated by the California Air Resources Board. Data for
CARB sites were obtained from that agency and are accurate to the best of our knowledge.
Several monitoring changes are discussed in the subsequent sections: The CARB San Luis Obispo
station, which monitored Ozone, PM10, PM2.5, and meteorological parameters, was permanently
closed in 2021. The San Luis Obispo APCD assumed monitoring of PM10, and PM2.5 at the San Luis
Obispo APCD office on Roberto Ct. Finally, to fulfill requirements of California Assembly Bill 1647,
SLOCAPCD and the Phillips 66 Santa Maria Refinery are establishing a refinery-related
community/fence-line monitoring network near the refinery. The network consists of new monitors
for oxides of nitrogen, SO2, black carbon, and non-methane volatile organic compounds at the
existing Mesa2 station and a new station on the north side of the refinery. The new monitors are
funded and operated by the refinery and their data will be made publicly available in real-time. At
this time, there is no plan to formally incorporate these monitors into the local SLAMS network or
add the data to AQS. All equipment has been installed, and the refinery is in the final stages of
commissioning the new monitors.
All pollutant monitors in SLOCAPCD’s SLAMS network meet the requirements of 40 CFR 58
Appendices A, B, C, D, and E, where applicable, and SLOCAPCD-run SPM meets the requirements of
Appendices A and E.
SAN LUIS OBISPO COUNTY AIR POLLUTION CONTROL DISTRICT
2021 AMBIENT AIR MONITORING NETWORK PLAN
6
General Information on Air Monitoring Networks
Most ambient air quality monitoring stations operated by air quality agencies are classified as State
and Local Air Monitoring Station (SLAMS). SLAMS are long-term monitoring stations and are
generally considered to be permanent sites. Their primary objective is to collect data for comparison
to the NAAQS. Stations may instead be classified as Special Purpose Monitors or Prevention of
Significant Deterioration stations; these are generally short-term sites with objectives other than
NAAQS comparison.
Appendix D of 40 CFR 58 specifies design criteria for SLAMS networks and states that networks must
be designed to meet a minimum of three basic monitoring objectives: 1) Provide air pollution data to
the public in a timely manner; 2) Support compliance with the NAAQS; and 3) Support air pollution
research. A variety of site types are needed to support these basic objectives, including the six
general types identified in the Appendix:
• Highest Concentration: Sites located to determine the highest concentration expected to
occur in the area covered by the network;
• Population Exposure: Those located to determine representative concentrations in areas of
high population density;
• Source Oriented: Sites located to determine the impact on ambient pollution levels of
significant sources or source categories;
• General/Background: Those located to determine general background concentration levels;
• Regional Transport: Sites located to determine the extent of regional pollutant transport
among populated areas, and in support of secondary standards; and
• Welfare Related Impacts: Sites located to determine the welfare-related impacts in more
rural and remote areas (such as visibility impairment and effects on vegetation).
The physical siting of an air monitoring station must conform to the requirements of the Appendix,
and its location must achieve a spatial scale of representativeness that is consistent with the
monitoring objective and site type. The spatial scale results from the physical location of the site
with respect to the pollutant sources and categories. It estimates the size of the area surrounding
the monitoring site that experiences uniform pollutant concentrations. The categories of spatial
scale defined in the Appendix are:
• Microscale: An area of uniform pollutant concentrations ranging from several meters up to
100 meters;
• Middle Scale: uniform pollutant concentrations in an area of about 110 meters to 0.5
kilometer;
• Neighborhood Scale: an area with dimensions in the 0.5 to 4-kilometer range;
• Urban Scale: Citywide pollutant conditions with dimensions from 4 to 50 kilometers;
• Regional Scale: An entire rural area of the same general geography (this area ranges from
tens to hundreds of kilometers); and
• National and Global Scales.
SAN LUIS OBISPO COUNTY AIR POLLUTION CONTROL DISTRICT
2021 AMBIENT AIR MONITORING NETWORK PLAN
7
The relationship between site type and spatial scale is summarized in Table 1, below, which is
adapted from Table D-1 of the Appendix.
Table 1: Relationship between Site Type and Spatial Scale
Site Type Appropriate Spatial Scale
Highest concentration Micro, middle, neighborhood, (sometimes
urban or regional for secondary pollutants)
Population exposure Neighborhood, urban
Source oriented Micro, middle, neighborhood
General/background & regional transport Urban, regional
Welfare Related Impacts Urban, regional
Air Monitoring Stations in San Luis Obispo County
San Luis Obispo County comprises the San Luis Obispo-Paso Robles MSA. Air monitoring
responsibilities for the MSA are divided between SLOCAPCD and CARB, as allowed by Section 2(e) of
Appendix D to 40 CFR 58. SLOCAPCD acknowledges this joint responsibility and is a member of the
CARB Primary Quality Assurance Organization. The roles and responsibilities of the two agencies
with regard to fulfilling state and federal monitoring requirements are formalized in a “Roles and
Responsibilities” document, which can be viewed on the CARB website.1
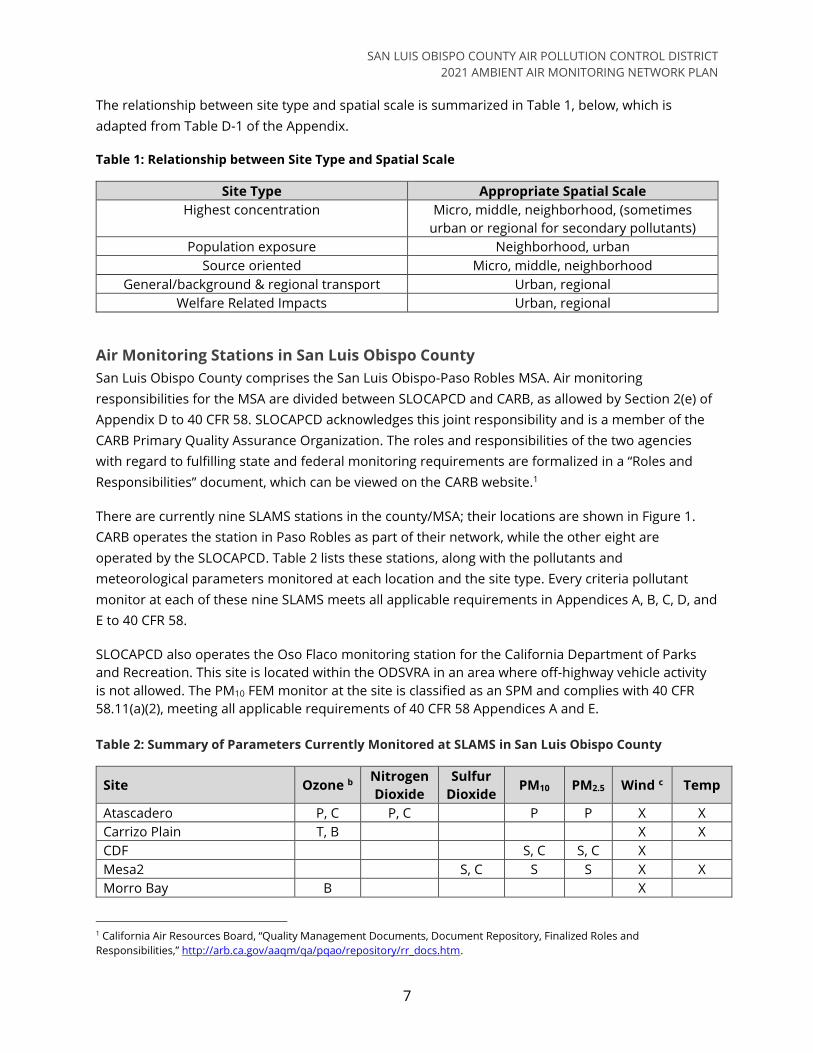
There are currently nine SLAMS stations in the county/MSA; their locations are shown in Figure 1.
CARB operates the station in Paso Robles as part of their network, while the other eight are
operated by the SLOCAPCD. Table 2 lists these stations, along with the pollutants and
meteorological parameters monitored at each location and the site type. Every criteria pollutant
monitor at each of these nine SLAMS meets all applicable requirements in Appendices A, B, C, D, and
E to 40 CFR 58.
SLOCAPCD also operates the Oso Flaco monitoring station for the California Department of Parks
and Recreation. This site is located within the ODSVRA in an area where off-highway vehicle activity
is not allowed. The PM10 FEM monitor at the site is classified as an SPM and complies with 40 CFR
58.11(a)(2), meeting all applicable requirements of 40 CFR 58 Appendices A and E.
Table 2: Summary of Parameters Currently Monitored at SLAMS in San Luis Obispo County
Site Ozone b Nitrogen
Dioxide
Sulfur
Dioxide PM10 PM2.5 Wind c Temp
Atascadero P, C P, C P P X X
Carrizo Plain T, B X X
CDF S, C S, C X
Mesa2 S, C S S X X
Morro Bay B X
1 California Air Resources Board, “Quality Management Documents, Document Repository, Finalized Roles and
Responsibilities,” http://arb.ca.gov/aaqm/qa/pqao/repository/rr_docs.htm.

SAN LUIS OBISPO COUNTY AIR POLLUTION CONTROL DISTRICT
2021 AMBIENT AIR MONITORING NETWORK PLAN
8
Site Ozone b Nitrogen
Dioxide
Sulfur
Dioxide PM10 PM2.5 Wind c Temp
Nipomo Regional Park B B B X X
Paso Robles a P P X X
San Luis Obispo-Roberto Ct. P P
Red Hills T, C X X Site Types: B = General/Background, C = Highest Concentration, P = Population Exposure, T = Regional Transport, S =
Source, X = Parameter measured at this site.
Notes: a Paso Robles is operated by CARB; all other sites are operated by SLOCAPCD. b Atascadero is typically the highest concentration site for the western county attainment area, while Red Hills is the
highest concentration site for the eastern county nonattainment area. c Wind speed, wind direction, and sigma theta.

SAN LUIS OBISPO COUNTY AIR POLLUTION CONTROL DISTRICT
2021 AMBIENT AIR MONITORING NETWORK PLAN
9
Figure 1: Locations of air monitoring stations in San Luis Obispo County as of May 2021. The thin red line
depicts the boundary of the ozone nonattainment area.

SAN LUIS OBISPO COUNTY AIR POLLUTION CONTROL DISTRICT
2021 AMBIENT AIR MONITORING NETWORK PLAN
10
Changes to Monitoring Network Since the Previous ANP
Changes to the monitoring network since the publication of the last ANP are summarized below.
Opened, Closed, and Relocated Stations
A new San Luis Obispo station at the SLOCAPCD office (06-079-2020) began collecting PM2.5 and
PM10 data on January 1, 2021 in response to the anticipated January 31, 2021 closure of CARB’s San
Luis Obispo SLAMS (06-079-2006), as proposed in last year’s ANP. The continuation of PM
monitoring in San Luis Obispo is important because this city and the surrounding areas are the
highest population centers in San Luis Obispo County. Monitoring of ozone and meteorology at the
previous station will not continue at the new San Luis Obispo station. Ozone levels at the previous
San Luis Obispo SLAMS location closely tracked those monitored 12 miles away in Morro Bay, and
thus we believe timely ozone information and accurate forecasts for San Luis Obispo and the
surrounding areas will not be compromised by the loss of the monitor. Meteorological conditions
are well-represented by the existing FAA weather station (KSBP) at the San Luis Obispo County
Regional Airport (McChesney Field), less than 2 miles away. For more details about this decision, see
the 2020 ANP.
Ozone Monitoring Network Changes
CARB operated the San Luis Obispo station (06-079-2006) which was shut down in early 2021. The
ozone monitor was shut down, and ozone AQI is now drawn from the Morro Bay monitoring site.
The closure of this station was proposed in last year’s ANP.
Particulate Monitoring Network Changes
PM2.5 and PM10 monitoring at the CARB operated San Luis Obispo station was discontinued in
January 2021. The SLOCAPCD began sampling and collecting data on January 1, 2021. No PM data
interruption has occurred. No other changes have been made to either the PM2.5 or PM10 monitoring
networks since the previous ANP.
Nitrogen Dioxide Monitoring Network Changes
No changes have been made to the nitrogen dioxide monitoring network since the previous ANP.
Sulfur Dioxide Monitoring Network Changes
No changes have been made to the sulfur dioxide monitoring network since the previous ANP.
Infrastructure and Support Equipment Changes
• In February 2020, the Teledyne API 701 ZAG at Atascadero was replaced with a Sabio 1001.
• In May 2020, the tilt-down meteorological tower at Atascadero was replaced with a crank-
down telescopic tower.
• In May 2020, the cellular modem at the Oso Flaco was upgraded.

SAN LUIS OBISPO COUNTY AIR POLLUTION CONTROL DISTRICT
2021 AMBIENT AIR MONITORING NETWORK PLAN
11
Detailed Descriptions of the Current Network
Ozone Monitoring Network
The SLAMS network features ozone monitors in Atascadero, Red Hills, Carrizo Plain, Paso Robles,
Morro Bay, and Nipomo Regional Park. The eastern portion of San Luis Obispo County is designated
as a marginal nonattainment area for the 8-hour ozone standard, and the Red Hills and Carrizo Plain
monitors are located in this area. None of the county is designated as a moderate (or more severe)
nonattainment area, therefore an Enhanced Monitoring Plan is not required (nor is one being
prepared).
San Luis Obispo – Ozone monitoring at the CARB SLAM station continued until January 31, 2021
when the site was closed.
Atascadero – SLOCAPCD has operated an ozone monitor in Atascadero since 1988. The Atascadero
station was moved in 2015 from the central business district to a nearby city property. The monitor
is classified as population-oriented and neighborhood scale. It provides ozone measurements
representative of the City of Atascadero. Ozone concentrations at this site exhibit strong diurnal
fluctuations caused by the titration or mixing of ozone with nitric oxide from nearby mobile and
residential sources. Concentrations at this site are similar to those recorded at Paso Robles and are
often the highest among the five ozone monitors in the western portion of the county that is
classified as attaining the federal ozone standard. The highest ozone concentrations at Atascadero
occur when high pressure over the interior southwest U.S. causes transport of ozone and other
pollutants into the county from the east. Under these infrequent conditions, transported ozone,
enhanced by local pollutants, can cause highly elevated concentrations. Most of the time, prevailing
winds from the west and northwest help keep ozone levels at Atascadero low.
Carrizo Plain – Operated by SLOCAPCD since January 2006, this regional scale station monitors
background levels and ozone transport from the interior areas of the state. The monitor is located in
an outbuilding at the Carrisa Plains Elementary School. The ozone concentrations recorded here are
second only to Red Hills in concentration and persistence; this site is located within the Eastern San
Luis Obispo County nonattainment area.
Morro Bay – Operated since 1975 by SLOCAPCD, this site provides regional scale and
general/background ozone monitoring. Located in downtown Morro Bay, the monitor generally
measures background levels of ozone from the predominant northwest winds blowing off the Pacific
Ocean. Under unusual meteorological conditions, the site can record elevated ozone concentrations
transported from urban areas as far south as the Los Angeles basin.
Nipomo Regional Park (NRP) – Operated by SLOCAPCD since 1998, this station provides
monitoring of background levels of ozone on a regional scale. Previously (1979 to 1996) ozone had
been monitored in Nipomo on Wilson Street, several miles away. The ozone concentrations
measured at NRP are representative of interior portions of the Nipomo Mesa and are the highest
recorded in the coastal region of San Luis Obispo County.

SAN LUIS OBISPO COUNTY AIR POLLUTION CONTROL DISTRICT
2021 AMBIENT AIR MONITORING NETWORK PLAN
12
Paso Robles – Operated by CARB since 1974, this population-oriented, neighborhood scale ozone
monitor provides a representative ozone concentration for the suburban areas of the City of Paso
Robles. The conditions under which elevated ozone levels occur and the location’s prevailing winds
are similar to Atascadero.
Red Hills – Operated by SLOCAPCD since 2000, this station is located near the summit of Red Hills at
an elevation of about 2,000 feet. It is in a very sparsely populated area near the community of
Shandon. This regional scale site is often influenced by ozone transport from distant source areas
outside of the county, and it consistently records the highest and most persistent ozone
concentrations in the network; its site type is thus regional and maximum concentration. In early
2012, the eastern portion of the county was designated as marginally nonattainment for the federal
8-hr ozone standard based on the design value from this site.
As noted in Table 2, the SLAMS site types employed by the existing ozone network are:
1. Highest Concentration – The Red Hills station typically records the highest ozone
concentrations in the county. The high ozone levels tend to occur in the interior areas of the
county during summer, either following long periods of wind stagnation, or as a result of
offshore winds which can transport pollutants from interior regions of the state from distant
sources to the northeast. Among the sites in the western portion of the county which is
classified as attaining the ozone standard, Atascadero and Paso Robles measure the highest
concentrations.
2. Population Exposure – The Paso Robles and Atascadero monitors provide good
representations of the ozone levels in the larger cities of the county.
3. Source Impact – Because ozone is a secondary pollutant, the effect of emissions from any
single source are experienced five to seven hours later and often many miles distant. As a
regional pollutant, monitoring for specific sources of ozone is not performed.
4. General/Background – The monitors at Morro Bay, Carrizo Plain, and Nipomo Regional
Park provide regional background ozone levels.
5. Regional Transport – The stations located at Carrizo Plain and Red Hills provide excellent
surveillance of regional transport of ozone into the interior part of the county Coastal
monitoring stations have provided evidence in the past of regional transport of ozone over
the Pacific Ocean from distant urban sources.
Nitrogen Dioxide Monitoring Network
The SLAMS network in San Luis Obispo County features NO2 monitors at Atascadero and Nipomo
Regional Park. NO2 levels have always been well below the state and federal standards at all
locations in our county. For this reason, NO2 monitoring is most useful as an indicator of depletion
of ambient ozone through titration or mixing with nitric oxide. Having NO2 monitors in North and
South County also serves a long-term air quality surveillance role.
Atascadero – Operated by SLOCAPCD since 1990 and relocated in 2015, this population-oriented
monitor is considered neighborhood scale. This is the only NO2 monitor in the Salinas River air
SAN LUIS OBISPO COUNTY AIR POLLUTION CONTROL DISTRICT
2021 AMBIENT AIR MONITORING NETWORK PLAN
13
basin, and it records the highest NO, NO2, and NOx levels in the county. The monitor’s downtown
location has established a strong diurnal inverse relationship between ozone and NO2 levels caused
by local mobile sources and residential and commercial combustion of natural gas.
Nipomo Regional Park – Operated by the SLOCAPCD since 1998, this monitor is regional in scale
and is representative of background concentrations on the Nipomo Mesa. The site’s location in a
large natural area away from local or mobile sources makes it ideal for regional surveillance of NO2.
The SLAMS sites in the existing NO2 network are:
1. Highest Concentration – The Atascadero monitor historically has measured the highest
NO2 concentrations in the county. NO2 levels are the result of titration or mixing of ambient
ozone by local sources of nitric oxide and as a result values are always relatively low. Levels
have never exceeded the 1-hour NO2 standard (100 ppb), with annual maximum 1-hour
concentrations typically around 50% of the standard.
2. General/Background – With no significant local sources present, the monitor at Nipomo
Regional Park provides excellent information on coastal background levels of NO2.
Regional Transport and Welfare-Related impacts of NO2 are not currently addressed by SLOCAPCD’s
SLAMS network and are not thought to be significant. The San Luis Obispo-Paso Robles MSA, does
not have, nor per Appendix D, Section 4.3 of 40 CFR 58 is it required to have, any NO2 sites for
vulnerable populations or near-road NO2 monitoring sites.
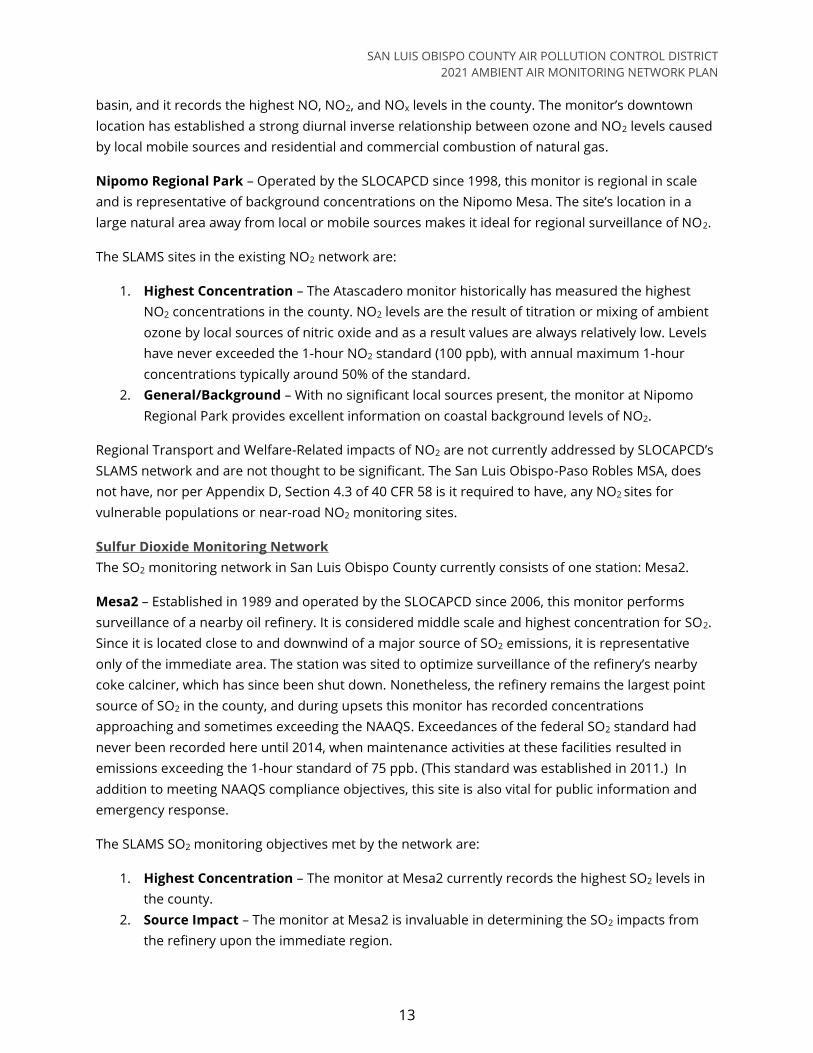
Sulfur Dioxide Monitoring Network
The SO2 monitoring network in San Luis Obispo County currently consists of one station: Mesa2.
Mesa2 – Established in 1989 and operated by the SLOCAPCD since 2006, this monitor performs
surveillance of a nearby oil refinery. It is considered middle scale and highest concentration for SO2.
Since it is located close to and downwind of a major source of SO2 emissions, it is representative
only of the immediate area. The station was sited to optimize surveillance of the refinery’s nearby
coke calciner, which has since been shut down. Nonetheless, the refinery remains the largest point
source of SO2 in the county, and during upsets this monitor has recorded concentrations
approaching and sometimes exceeding the NAAQS. Exceedances of the federal SO2 standard had
never been recorded here until 2014, when maintenance activities at these facilities resulted in
emissions exceeding the 1-hour standard of 75 ppb. (This standard was established in 2011.) In
addition to meeting NAAQS compliance objectives, this site is also vital for public information and
emergency response.
The SLAMS SO2 monitoring objectives met by the network are:
1. Highest Concentration – The monitor at Mesa2 currently records the highest SO2 levels in
the county.
2. Source Impact – The monitor at Mesa2 is invaluable in determining the SO2 impacts from
the refinery upon the immediate region.
SAN LUIS OBISPO COUNTY AIR POLLUTION CONTROL DISTRICT
2021 AMBIENT AIR MONITORING NETWORK PLAN
14
Monitoring objectives not addressed by the existing SO2 network are: General/Background,
Population Exposure, Regional Transport, and Welfare-Related. Historical SO2 monitoring performed
elsewhere in the county (at NRP from 1998-2006; Morro Bay, 1979-1995; Grover Beach, 1982-2004;
and at decommissioned stations in Arroyo Grande “Ralcoa” [06-079-1005; 1991-2002], and “Mesa1”
[06-079-3002; 1987-94]) has provided good evidence that monitoring for these objectives is not
needed. Furthermore, background levels of SO2 in the county are believed to be negligible as the
maximum hourly concentration measured here in 2020 was 2 ppb.
There are no sources within SLOCAPCD’s jurisdiction with annual SO2 emissions greater than 2000
tons; therefore, no monitoring is required to fulfill the “Data Requirements Rule” (40 CFR 51.1203).
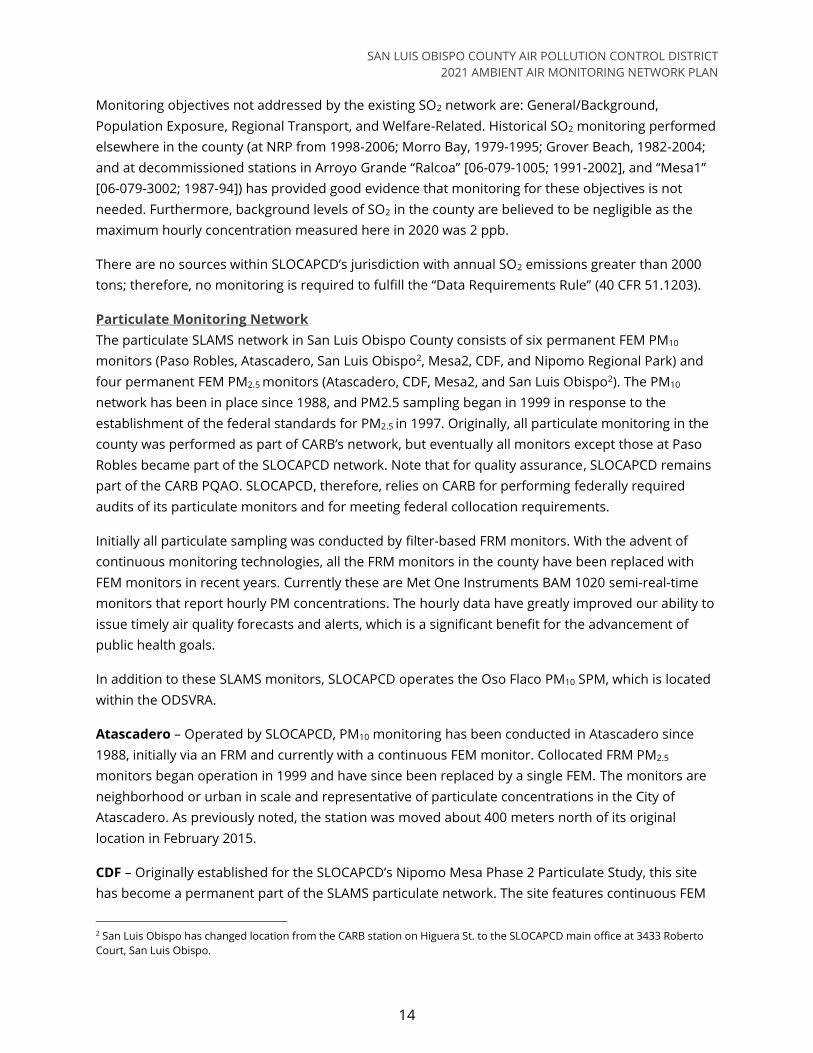
Particulate Monitoring Network
The particulate SLAMS network in San Luis Obispo County consists of six permanent FEM PM10
monitors (Paso Robles, Atascadero, San Luis Obispo2, Mesa2, CDF, and Nipomo Regional Park) and
four permanent FEM PM2.5 monitors (Atascadero, CDF, Mesa2, and San Luis Obispo2). The PM10
network has been in place since 1988, and PM2.5 sampling began in 1999 in response to the
establishment of the federal standards for PM2.5 in 1997. Originally, all particulate monitoring in the
county was performed as part of CARB’s network, but eventually all monitors except those at Paso
Robles became part of the SLOCAPCD network. Note that for quality assurance, SLOCAPCD remains
part of the CARB PQAO. SLOCAPCD, therefore, relies on CARB for performing federally required
audits of its particulate monitors and for meeting federal collocation requirements.
Initially all particulate sampling was conducted by filter-based FRM monitors. With the advent of
continuous monitoring technologies, all the FRM monitors in the county have been replaced with
FEM monitors in recent years. Currently these are Met One Instruments BAM 1020 semi-real-time
monitors that report hourly PM concentrations. The hourly data have greatly improved our ability to
issue timely air quality forecasts and alerts, which is a significant benefit for the advancement of
public health goals.
In addition to these SLAMS monitors, SLOCAPCD operates the Oso Flaco PM10 SPM, which is located
within the ODSVRA.
Atascadero – Operated by SLOCAPCD, PM10 monitoring has been conducted in Atascadero since
1988, initially via an FRM and currently with a continuous FEM monitor. Collocated FRM PM2.5
monitors began operation in 1999 and have since been replaced by a single FEM. The monitors are
neighborhood or urban in scale and representative of particulate concentrations in the City of
Atascadero. As previously noted, the station was moved about 400 meters north of its original
location in February 2015.
CDF – Originally established for the SLOCAPCD’s Nipomo Mesa Phase 2 Particulate Study, this site
has become a permanent part of the SLAMS particulate network. The site features continuous FEM
2 San Luis Obispo has changed location from the CARB station on Higuera St. to the SLOCAPCD main office at 3433 Roberto
Court, San Luis Obispo.

SAN LUIS OBISPO COUNTY AIR POLLUTION CONTROL DISTRICT
2021 AMBIENT AIR MONITORING NETWORK PLAN
15
samplers for PM10 and PM2.5, which are neighborhood in scale and measure source impacts from
the ODSVRA. These monitors record the highest particulate levels in the county and are strongly
influenced by the ODSVRA, located directly upwind. In 2012, extensive temporary monitoring on the
Nipomo Mesa confirmed that this site is located within the 1 square mile sector of the study area
that experiences the highest PM10 levels.3
Mesa2 – PM10 sampling began at this site in 1991, and the monitors have been operated by the
SLOCAPCD since 2006. This site initially featured collocated FRM PM10 samplers that were replaced
by a single continuous FEM PM10 monitor in 2009. A continuous PM2.5 FEM monitor was installed at
the same time. This site monitors source impacts from the nearby oil refinery and coastal dunes,
and the monitors are neighborhood in scale. These monitors record some of the highest particulate
levels in the county and are strongly influenced by the extensive coastal sand dunes and the
ODSVRA located upwind.
Nipomo Regional Park – Operated at this location by SLOCAPCD since 1998, it replaced a site at
Wilson Street in Nipomo that operated from 1990-96. The 1-in-6 day FRM PM10 sampler was
replaced with a continuous FEM sampler in 2010. The monitor is regional in scale and is
representative of PM10 concentrations on the Nipomo Mesa.
Oso Flaco – Operated by SLOCAPCD on behalf of the California Department of Parks and
Recreation, this PM10 monitor was established in July 2015 to fulfill a requirement of SLOCAPCD Rule
1001. It is classified as an SPM rather than a SLAMS monitor. It is located within the Oso Flaco area
of the ODSVRA; off-road vehicular activity is not permitted upwind of the monitor. It is considered
neighborhood in scale and representative of the non-riding areas of the dunes complex.
Paso Robles – Operated by CARB since 1991, this PM10 monitor is neighborhood in scale and
representative of the City of Paso Robles. The FRM sampler at this site was replaced with an FEM
PM10 sampler in August 2009.
San Luis Obispo – CARB operated a PM10 sampler in San Luis Obispo from 1988 through early 2021
and a PM2.5 sampler from 1999 through early 2021. CARB replaced their FRM samplers with
continuous FEM instruments in 2011. These population-oriented monitors were neighborhood in
scale and representative of particulate concentrations in the City of San Luis Obispo. This station
was closed early 2021. On January 1, 2020, the SLOCAPCD began operating replacement PM10 and
PM2.5 monitors at its office, approximately 2 miles from the closed CARB SLAMS site.
Other Networks
San Luis Obispo County, which comprises the San Luis Obispo-Paso Robles MSA, is not required to
have, does not currently have, and does not plan to establish any NCore, PAMS, lead, carbon
monoxide or near-road monitoring stations.
3 San Luis Obispo County Air Pollution Control District, “South County Community Monitoring Project,” January 2013. Available
online: https://www.slocleanair.org/library/air-quality-reports.php

SAN LUIS OBISPO COUNTY AIR POLLUTION CONTROL DISTRICT
2021 AMBIENT AIR MONITORING NETWORK PLAN
16
Proposed Network Changes and Improvements
The following sections list any modifications that are planned for the 18-month period after the
publication of this ANP. Note that with a population well below 500,000, the San Luis Obispo-Paso
Robles MSA/CBSA4 is not required to have any near-road NO2, carbon monoxide, or PM2.5 monitors,
and SLOCAPCD has no plans to establish any such monitors. Additionally, there are no sources in
our jurisdiction with SO2 emissions greater than 2,000 tons per year; therefore, no new SO2
monitoring is needed nor planned to comply with the SO2 Data Requirements Rule.
New Stations and Station Closures and Relocations
San Luis Obispo SLAMS – On January 1, 2021, SLOCAPCD began PM10 and PM2.5 monitor at the new
San Luis Obispo SLAMS discussed above. Necessary facility upgrades related to safe station access
will be completed in 2021 with grant funding that SLOCAPCD secured from the EPA.
Refinery-related community and fence-line monitoring – California Assembly Bill 1647, which
was signed into law in late 2017, mandates establishing both “refinery-related community air
monitoring systems” and “fence-line monitoring systems” near or at petroleum refineries by 2020.
The Phillips 66 Santa Maria Refinery is located in San Luis Obispo County and is subject to AB 1647
requirements. SLOCAPCD and Phillips 66 have been in discussion over the implementation of these
requirements for several years, and on May 5, 2020, SLOCAPCD gave its partial, conditional approval
of the monitoring plan submitted by the Refinery.
The conditionally approved plan is for a combined refinery-related community/fence-line monitoring
network which will be funded, deployed, and operated by the refinery, with SLOCAPCD retaining
oversight. The conditionally approved plan adds monitors for oxides of nitrogen, black carbon, and
non-methane volatile organic compounds to the existing Mesa2 station and establishes a new
station within the northern reaches of the refinery property with monitors for oxides of nitrogen,
sulfur dioxide, black carbon, and non-methane volatile organic compounds. While the new monitors
will be run by the refinery, SLOCAPCD will continue to operate the existing monitors at Mesa2.
SLOCAPCD plans to work closely with the refinery to make any upgrades to site infrastructure that
are necessary to accommodate the additional monitors, while minimizing any downtime for the
current monitors. The new monitors are slated to begin providing data to the public later this year.
Per the requirements of AB 1647, all data generated by the network will be made available to the
public in real-time on a website designed and maintained by the refinery. SLOCAPCD will approve
the design of the website. These monitors will not be designated as SLAMS or SPMs, nor will the data
generated be included in AQS.
Nitrogen Dioxide Network
As noted above, to complete the refinery-related community/fence-line monitoring plan, one oxides
of nitrogen monitor (which measure NO2 along with NO and NOx) was added at the Mesa 2 station,
4 San Luis Obispo County, the San Luis Obispo-Paso Robles MSA, and the San Luis Obispo-Paso Robles CBSA have identical
borders and populations.
SAN LUIS OBISPO COUNTY AIR POLLUTION CONTROL DISTRICT
2021 AMBIENT AIR MONITORING NETWORK PLAN
17
and another will be added near the CDF station. These will be operated by the refinery and will
report data to the public in real-time. They will not be formally incorporated into the county’s SLAMS
network and data will not be uploaded to AQS.
Sulfur Dioxide Monitoring Network
As noted above, to complete the refinery-related community/fence-line monitoring plan, an SO2
monitor will be added near the CDF station. This will be operated by the refinery and will report data
to the public in real-time. It will not be formally incorporated into the county’s SLAMS network and
data will not be uploaded to AQS.
Infrastructure and Support Equipment Changes
The following equipment upgrades are planned for the next 12 months:
• SLOCAPCD currently uses Met One 50.5 sonic anemometers to collect wind data at all
District-run sites. Starting this year, we will begin replacing them with RM Young 81000 sonic
anemometers. We anticipate replacing about 8 over the next year.
Statement Regarding Review of Changes to the PM2.5 Network
In the event that SLOCAPCD needs to change the location of a PM2.5 monitor that records violations
of the NAAQS, the agency will notify EPA Region 9 and CARB contact points immediately and work
closely with CARB to formulate a plan for moving the site. The public will be notified of the plan and
provided with an opportunity to comment for at least 30 days. Finally, the agency will submit formal
notification to EPA. The SLOCAPCD intends to discuss and receive CARB and EPA approval prior to
making any changes to our PM2.5 network, whether the changes affect monitors violating NAAQS or
not; however, unforeseen circumstances (i.e. unexpected loss of site access) may preclude this.
SAN LUIS OBISPO COUNTY AIR POLLUTION CONTROL DISTRICT
2021 AMBIENT AIR MONITORING NETWORK PLAN
18
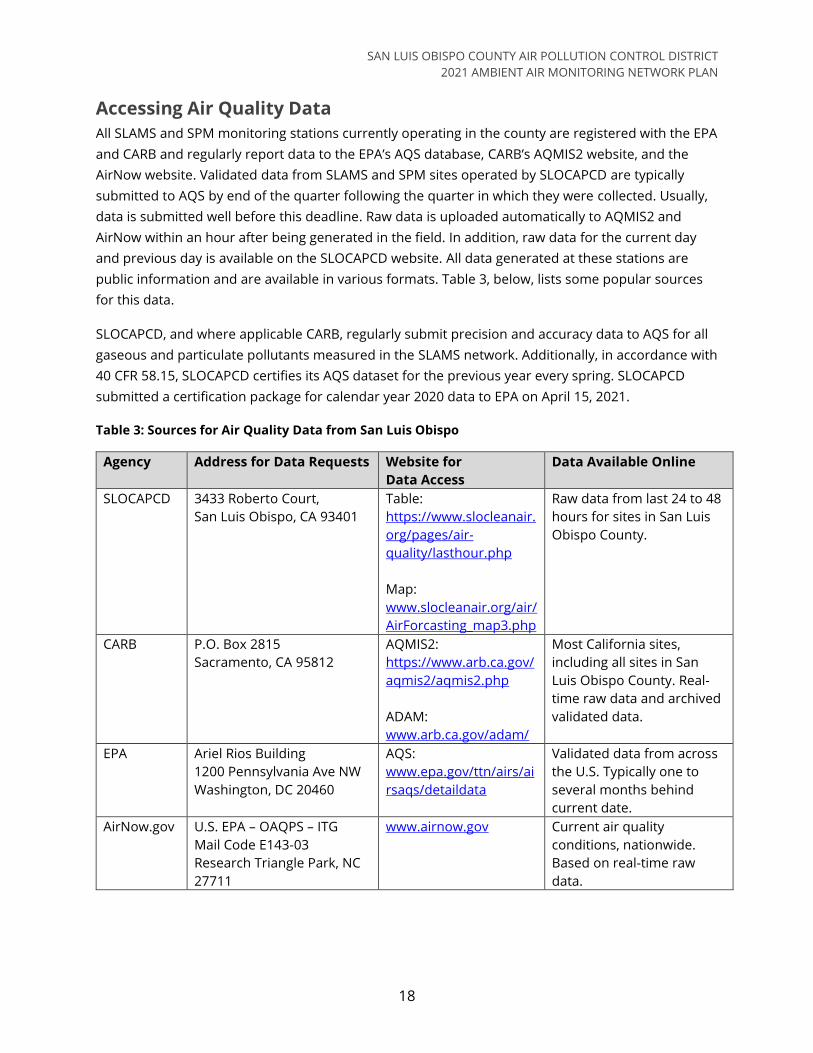
Accessing Air Quality Data
All SLAMS and SPM monitoring stations currently operating in the county are registered with the EPA
and CARB and regularly report data to the EPA’s AQS database, CARB’s AQMIS2 website, and the
AirNow website. Validated data from SLAMS and SPM sites operated by SLOCAPCD are typically
submitted to AQS by end of the quarter following the quarter in which they were collected. Usually,
data is submitted well before this deadline. Raw data is uploaded automatically to AQMIS2 and
AirNow within an hour after being generated in the field. In addition, raw data for the current day
and previous day is available on the SLOCAPCD website. All data generated at these stations are
public information and are available in various formats. Table 3, below, lists some popular sources
for this data.
SLOCAPCD, and where applicable CARB, regularly submit precision and accuracy data to AQS for all
gaseous and particulate pollutants measured in the SLAMS network. Additionally, in accordance with
40 CFR 58.15, SLOCAPCD certifies its AQS dataset for the previous year every spring. SLOCAPCD
submitted a certification package for calendar year 2020 data to EPA on April 15, 2021.
Table 3: Sources for Air Quality Data from San Luis Obispo
Agency Address for Data Requests Website for
Data Access
Data Available Online
SLOCAPCD 3433 Roberto Court,
San Luis Obispo, CA 93401
Table:
https://www.slocleanair.
org/pages/air-
quality/lasthour.php
Map:
www.slocleanair.org/air/
AirForcasting_map3.php
Raw data from last 24 to 48
hours for sites in San Luis
Obispo County.
CARB P.O. Box 2815
Sacramento, CA 95812
AQMIS2:
https://www.arb.ca.gov/
aqmis2/aqmis2.php
ADAM:
www.arb.ca.gov/adam/
Most California sites,
including all sites in San
Luis Obispo County. Real-
time raw data and archived
validated data.
EPA Ariel Rios Building
1200 Pennsylvania Ave NW
Washington, DC 20460
AQS:
www.epa.gov/ttn/airs/ai
rsaqs/detaildata
Validated data from across
the U.S. Typically one to
several months behind
current date.
AirNow.gov U.S. EPA – OAQPS – ITG
Mail Code E143-03
Research Triangle Park, NC
27711
www.airnow.gov Current air quality
conditions, nationwide.
Based on real-time raw
data.
SAN LUIS OBISPO COUNTY AIR POLLUTION CONTROL DISTRICT
2021 AMBIENT AIR MONITORING NETWORK PLAN
19
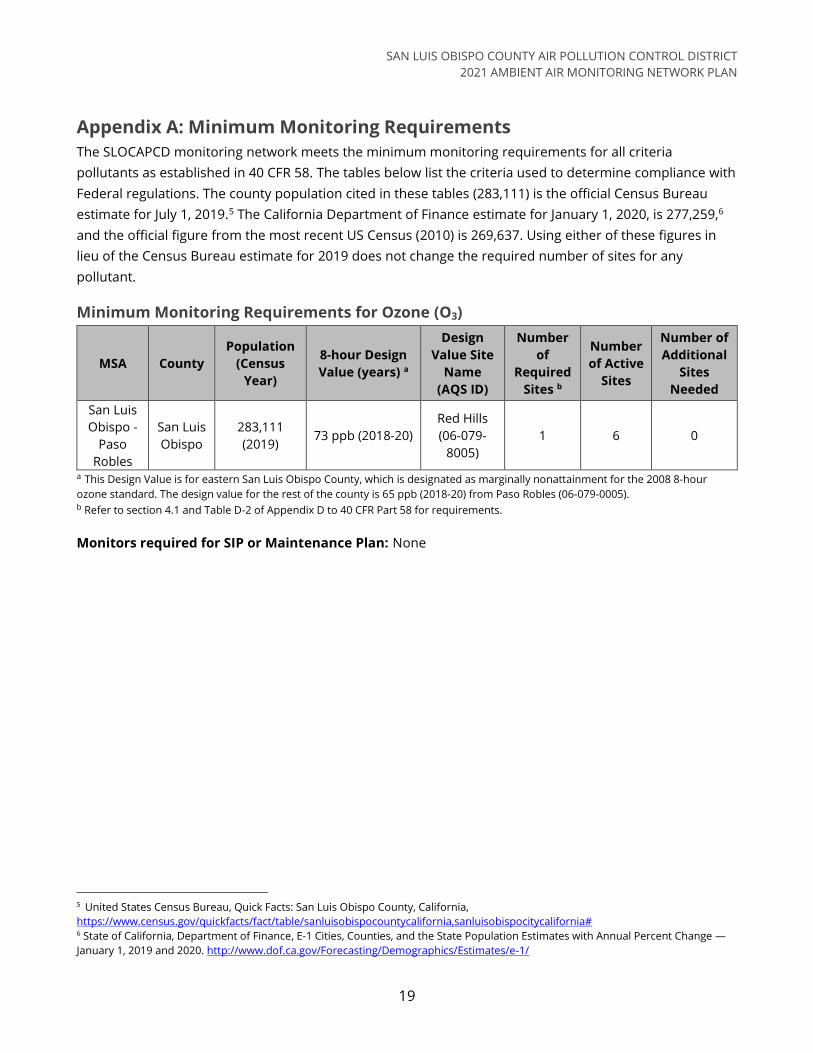
Appendix A: Minimum Monitoring Requirements
The SLOCAPCD monitoring network meets the minimum monitoring requirements for all criteria
pollutants as established in 40 CFR 58. The tables below list the criteria used to determine compliance with
Federal regulations. The county population cited in these tables (283,111) is the official Census Bureau
estimate for July 1, 2019.5 The California Department of Finance estimate for January 1, 2020, is 277,259,6
and the official figure from the most recent US Census (2010) is 269,637. Using either of these figures in
lieu of the Census Bureau estimate for 2019 does not change the required number of sites for any
pollutant.
Minimum Monitoring Requirements for Ozone (O3)
MSA County
Population
(Census
Year)
8-hour Design
Value (years) a
Design
Value Site
Name
(AQS ID)
Number
of
Required
Sites b
Number
of Active
Sites
Number of
Additional
Sites
Needed
San Luis
Obispo -
Paso
Robles
San Luis
Obispo
283,111
(2019) 73 ppb (2018-20)
Red Hills
(06-079-
8005)
1 6 0
a This Design Value is for eastern San Luis Obispo County, which is designated as marginally nonattainment for the 2008 8-hour
ozone standard. The design value for the rest of the county is 65 ppb (2018-20) from Paso Robles (06-079-0005). b Refer to section 4.1 and Table D-2 of Appendix D to 40 CFR Part 58 for requirements.
Monitors required for SIP or Maintenance Plan: None
5 United States Census Bureau, Quick Facts: San Luis Obispo County, California,
https://www.census.gov/quickfacts/fact/table/sanluisobispocountycalifornia,sanluisobispocitycalifornia# 6 State of California, Department of Finance, E-1 Cities, Counties, and the State Population Estimates with Annual Percent Change —
January 1, 2019 and 2020. http://www.dof.ca.gov/Forecasting/Demographics/Estimates/e-1/

SAN LUIS OBISPO COUNTY AIR POLLUTION CONTROL DISTRICT
2021 AMBIENT AIR MONITORING NETWORK PLAN
20
Minimum Monitoring Requirements for PM2.5 SLAMS
MSA County
Population
(Census
Year)
Annual
Design Value
(years)
Annual
Design
Value
Site
(AQS
ID)
Daily
Design
Value
(years)
Daily
Design
Value
Site
Name
(AQS
ID)
Number
of
Required
SLAMS
Sites a
Number
of
Active
SLAMS
Sites
Number
of
Additional
SLAMS
Sites
Needed
San
Luis
Obispo
- Paso
Robles
San
Luis
Obispo
283,111
(2019)
8.0 g/m3
(2018-20)
CDF*
(06-
079-
2007)
29
g/m3
(2018-
20)
CDF
(06-
079-
2007)
0 4 0
a Refer to section 4.7.1 and Table D-5 of Appendix D to 40 CFR Part 58 for requirements.
* Mesa 2 (06-079-2004) also shared the exact same design value for 2018-2020 as CDF at 8.0 g/m3
Monitors required for SIP or Maintenance Plan: None
Minimum Monitoring Requirements for Continuous PM2.5 Monitors
MSA County
Population
(Census
Year)
Annual
Design
Value
(years)
Annual
Design
Value
Site
(AQS
ID)
Daily
Design
Value
(years)
Daily
Design
Value
Site
Name
(AQS
ID)
Number of
Required
Continuous
Monitors a
Number of
Active
Continuous
Monitors
Number of
Additional
Continuous
Monitors
Needed
San
Luis
Obispo
-Paso
Robles
San
Luis
Obispo
283,111
(2019)
8.0
g/m3
(2018-
20)
CDF
(06-
079-
2007)
29
g/m3
(2018-
20)
CDF
(06-
079-
2007)
0 4 0
a Refer to section 4.7.2 and Table D-5 of Appendix D to 40 CFR Part 58 for requirements.
Monitors required for SIP or Maintenance Plan: None
SAN LUIS OBISPO COUNTY AIR POLLUTION CONTROL DISTRICT
2021 AMBIENT AIR MONITORING NETWORK PLAN
21
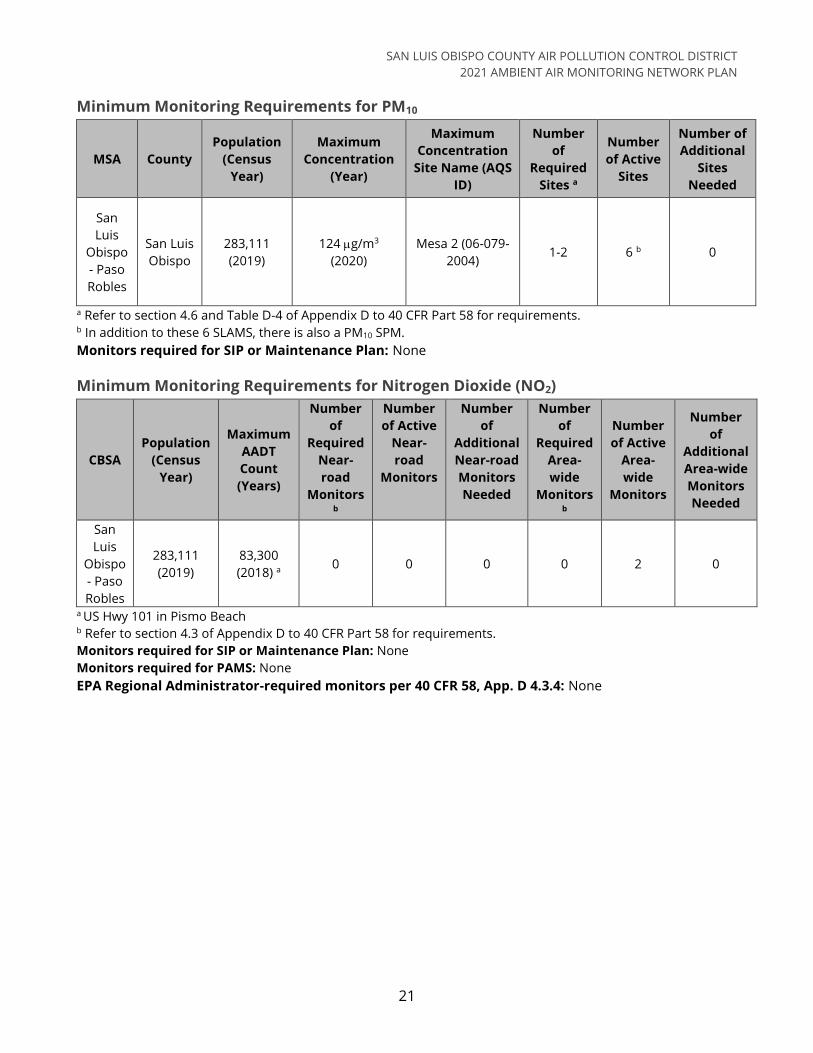
Minimum Monitoring Requirements for PM10
MSA County
Population
(Census
Year)
Maximum
Concentration
(Year)
Maximum
Concentration
Site Name (AQS
ID)
Number
of
Required
Sites a
Number
of Active
Sites
Number of
Additional
Sites
Needed
San
Luis
Obispo
- Paso
Robles
San Luis
Obispo
283,111
(2019)
124 g/m3
(2020)
Mesa 2 (06-079-
2004) 1-2 6 b 0
a Refer to section 4.6 and Table D-4 of Appendix D to 40 CFR Part 58 for requirements. b In addition to these 6 SLAMS, there is also a PM10 SPM.
Monitors required for SIP or Maintenance Plan: None
Minimum Monitoring Requirements for Nitrogen Dioxide (NO2)
CBSA
Population
(Census
Year)
Maximum
AADT
Count
(Years)
Number
of
Required
Near-
road
Monitors b
Number
of Active
Near-
road
Monitors
Number
of
Additional
Near-road
Monitors
Needed
Number
of
Required
Area-
wide
Monitors b
Number
of Active
Area-
wide
Monitors
Number
of
Additional
Area-wide
Monitors
Needed
San
Luis
Obispo
- Paso
Robles
283,111
(2019)
83,300
(2018) a 0 0 0 0 2 0
a US Hwy 101 in Pismo Beach
b Refer to section 4.3 of Appendix D to 40 CFR Part 58 for requirements.
Monitors required for SIP or Maintenance Plan: None
Monitors required for PAMS: None
EPA Regional Administrator-required monitors per 40 CFR 58, App. D 4.3.4: None
SAN LUIS OBISPO COUNTY AIR POLLUTION CONTROL DISTRICT
2021 AMBIENT AIR MONITORING NETWORK PLAN
22
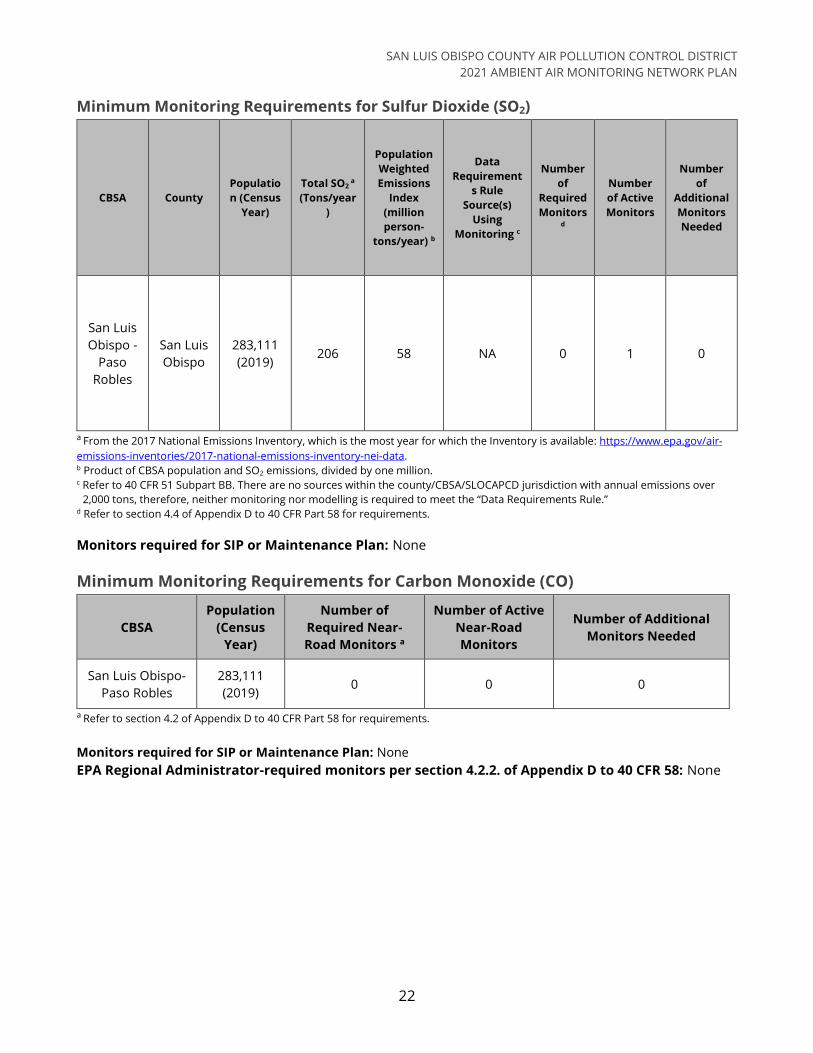
Minimum Monitoring Requirements for Sulfur Dioxide (SO2)
CBSA County
Populatio
n (Census
Year)
Total SO2 a
(Tons/year
)
Population
Weighted
Emissions
Index
(million
person-
tons/year) b
Data
Requirement
s Rule
Source(s)
Using
Monitoring c
Number
of
Required
Monitors d
Number
of Active
Monitors
Number
of
Additional
Monitors
Needed
San Luis
Obispo -
Paso
Robles
San Luis
Obispo
283,111
(2019) 206 58 NA 0 1 0
a From the 2017 National Emissions Inventory, which is the most year for which the Inventory is available: https://www.epa.gov/air-
emissions-inventories/2017-national-emissions-inventory-nei-data. b Product of CBSA population and SO2 emissions, divided by one million. c Refer to 40 CFR 51 Subpart BB. There are no sources within the county/CBSA/SLOCAPCD jurisdiction with annual emissions over
2,000 tons, therefore, neither monitoring nor modelling is required to meet the “Data Requirements Rule.” d Refer to section 4.4 of Appendix D to 40 CFR Part 58 for requirements.
Monitors required for SIP or Maintenance Plan: None
Minimum Monitoring Requirements for Carbon Monoxide (CO)
CBSA
Population
(Census
Year)
Number of
Required Near-
Road Monitors a
Number of Active
Near-Road
Monitors
Number of Additional
Monitors Needed
San Luis Obispo-
Paso Robles
283,111
(2019) 0 0 0
a Refer to section 4.2 of Appendix D to 40 CFR Part 58 for requirements.
Monitors required for SIP or Maintenance Plan: None
EPA Regional Administrator-required monitors per section 4.2.2. of Appendix D to 40 CFR 58: None

SAN LUIS OBISPO COUNTY AIR POLLUTION CONTROL DISTRICT
2021 AMBIENT AIR MONITORING NETWORK PLAN
23
Minimum Monitoring Requirements for Lead at NCore
NCore Site CBSA
Population
(Census
Year)
Number of
Required
Monitors a
Number of
Active
Monitors
Number of
Additional Monitors
Needed
none
San Luis
Obispo-Paso
Robles
283,111
(2019) 0 0 0
a Refer to section 4.5 of Appendix D to 40 CFR Part 58 for requirements.
Source-Oriented Lead Monitoring (Including Airports)
Source Address
Pb
Emissions
(Tons/yr)
Emissions
Inventory
Source Data
(Year)
Max
3-Month
Design
Value
Design
Value
Date
Number
of
Required
Monitors b
Number
of Active
Monitors
Number of
Additional
Monitors
Needed
none a n/a n/a n/a n/a n/a 0 0 0
a According to the 2014 National Emissions Inventory, total lead emissions in the county are less than 0.50 tons, therefore no single
source exceeds the 0.50 ton threshold. a Refer to section 4.5 of Appendix D to 40 CFR Part 58 for requirements.
Monitors required for SIP or Maintenance Plan: None
EPA Regional Administrator-required monitors per section 4.5(c) of Appendix D to 40 CFR 58: None
Near-Road NO2, PM2.5, and CO Monitors
CBSA
Population
(Census
Year)
Maximum
AADT
Count
(Years)
Number
of
Required
NO2
Monitors a
Number
of Active
NO2
Monitors
Number
of
Required
PM2.5
Monitors a
Number
of Active
PM2.5
Monitors
Number
of
Required
CO
Monitors a
Number
of Active
CO
Monitors
Number of
Additional
Monitors
Needed
San
Luis
Obispo
- Paso
Robles
283,111
(2019)
83,300
(2018) b 0 0 0 0 0 0 0
a Refer to 40 CFR Part 58.13 and sections 4.2, 4.3, 4.7 of Appendix D to 40 CFR Part 58 b
US Hwy 101 in Pismo Beach.
Appendix B: Collocation Requirements
Particulate monitoring (PM10, PM2.5, and lead) is subject to the collocation requirements described in
Section 3 of Appendix A to 40 CFR 58. The requirements apply at the PQAO level, and monitors are
aggregated by method when determining the required number of collocated monitors. SLOCAPCD is
part of the CARB PQAO and all particulate monitors in our network are Met One BAM 1020s, which
are continuous FEM instruments (PM10 method code: 122; PM2.5 method code: 170). While there are

SAN LUIS OBISPO COUNTY AIR POLLUTION CONTROL DISTRICT
2021 AMBIENT AIR MONITORING NETWORK PLAN
24
no collocated particulate monitors within the SLOCAPCD network, there are collocated monitors
within the CARB PQAO.
It could not be determined whether the collocation requirements for PM2.5 are being met. According
to CARB’s most recent Annual Network Plan,7 in 2020 there were 37 active PM2.5 FEM BAM 1020
monitors (method 170) in the PQAO; thus, six collocated monitors were needed: three FRM/FEM
pairs and three FEM/FEM pairs. The CARB ANP indicates there were four FEM/FEM pairs but only two
FRM/FEM pairs. On the other hand, an AQS Certification and Concurrence Report (AMP600) for the
2020 calendar year (executed in April 2021), indicates 49 monitors and 7 total collocated sites, but it
does not specify the collocation type. If the additional site included in the AMP600 report is an
FRM/FEM pair, then the PQAO meets the collocation requirements. Due to the COVID-19 pandemic
CARB has changed many of their FRM samplers to continuous FEM monitors. The AMP600 for 2020
reflects this possible change, but the CARB 2020 ANP does not address this. See Table B-1 below.
With regard to PM10 monitoring, all monitors in SLOCAPCD are continuous, and thus there are no
collocation requirements. Finally, lead monitoring is not done in the county, and therefore there is
no collocation requirement.
Table B- 1: Collocation Requirements for PM2.5, Method Code 170
Data
Source
(see text)
Number of
Primary
Monitors
Number of
Required
Collocated
Monitors
Number of Active
Collocated FRM
Monitors
Number of Active
Collocated FEM Monitors
(same method designation
as primary)
CARB 37 6 2 4
AMP600 49 7 7 total collocated monitors, type not indicated
7 California Air Resources Board, “Annual Network Plan Covering Monitoring Operations in 25 California Air Districts,” July
2020. https://ww3.arb.ca.gov/aqd/amnr/draftamnr2020.pdf.
SAN LUIS OBISPO COUNTY AIR POLLUTION CONTROL DISTRICT
2021 AMBIENT AIR MONITORING NETWORK PLAN
25
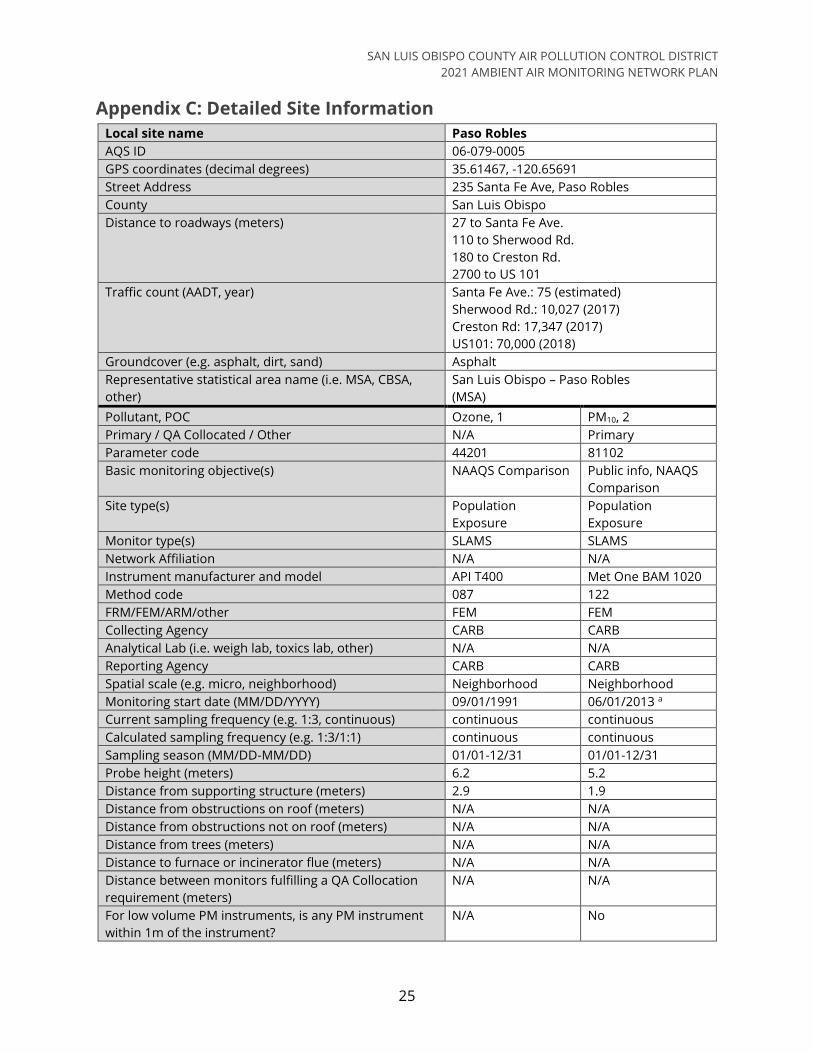
Appendix C: Detailed Site Information
Local site name Paso Robles
AQS ID 06-079-0005
GPS coordinates (decimal degrees) 35.61467, -120.65691
Street Address 235 Santa Fe Ave, Paso Robles
County San Luis Obispo
Distance to roadways (meters) 27 to Santa Fe Ave.
110 to Sherwood Rd.
180 to Creston Rd.
2700 to US 101
Traffic count (AADT, year) Santa Fe Ave.: 75 (estimated)
Sherwood Rd.: 10,027 (2017)
Creston Rd: 17,347 (2017)
US101: 70,000 (2018)
Groundcover (e.g. asphalt, dirt, sand) Asphalt
Representative statistical area name (i.e. MSA, CBSA,
other)
San Luis Obispo – Paso Robles
(MSA)
Pollutant, POC Ozone, 1 PM10, 2
Primary / QA Collocated / Other N/A Primary
Parameter code 44201 81102
Basic monitoring objective(s) NAAQS Comparison Public info, NAAQS
Comparison
Site type(s) Population
Exposure
Population
Exposure
Monitor type(s) SLAMS SLAMS
Network Affiliation N/A N/A
Instrument manufacturer and model API T400 Met One BAM 1020
Method code 087 122
FRM/FEM/ARM/other FEM FEM
Collecting Agency CARB CARB
Analytical Lab (i.e. weigh lab, toxics lab, other) N/A N/A
Reporting Agency CARB CARB
Spatial scale (e.g. micro, neighborhood) Neighborhood Neighborhood
Monitoring start date (MM/DD/YYYY) 09/01/1991 06/01/2013 a
Current sampling frequency (e.g. 1:3, continuous) continuous continuous
Calculated sampling frequency (e.g. 1:3/1:1) continuous continuous
Sampling season (MM/DD-MM/DD) 01/01-12/31 01/01-12/31
Probe height (meters) 6.2 5.2
Distance from supporting structure (meters) 2.9 1.9
Distance from obstructions on roof (meters) N/A N/A
Distance from obstructions not on roof (meters) N/A N/A
Distance from trees (meters) N/A N/A
Distance to furnace or incinerator flue (meters) N/A N/A
Distance between monitors fulfilling a QA Collocation
requirement (meters)
N/A N/A
For low volume PM instruments, is any PM instrument
within 1m of the instrument?
N/A No

SAN LUIS OBISPO COUNTY AIR POLLUTION CONTROL DISTRICT
2021 AMBIENT AIR MONITORING NETWORK PLAN
26
Local site name Paso Robles
For high volume PM instruments, is any PM instrument
within 2m of the instrument?
N/A N/A
Unrestricted airflow (degrees) 360 360
Probe material for reactive gases (e.g. Pyrex, stainless
steel, Teflon)
Teflon N/A
Residence time for reactive gases (seconds) 12.9 N/A
Will there be changes within the next 18 months? No No
Is it suitable for comparison against the annual PM2.5? N/A N/A
Frequency of flow rate verification for manual PM
samplers
N/A N/A
Frequency of flow rate verification for automated PM
analyzers
N/A monthly
Frequency of one-point QC check for gaseous
instruments
daily N/A
Date of 2020 Annual Performance Evaluation for
gaseous parameters
8/11/2020 N/A
Dates of 2020 Semi-Annual Flow Rate Audits for PM
monitors
N/A 8/11/2020
11/18/2020 a This instrument did not begin reporting PM10-standard (88102) until 06/01/2013, but it has been reporting PM10-actual
(85101) since 08/11/2009.
SAN LUIS OBISPO COUNTY AIR POLLUTION CONTROL DISTRICT
2021 AMBIENT AIR MONITORING NETWORK PLAN
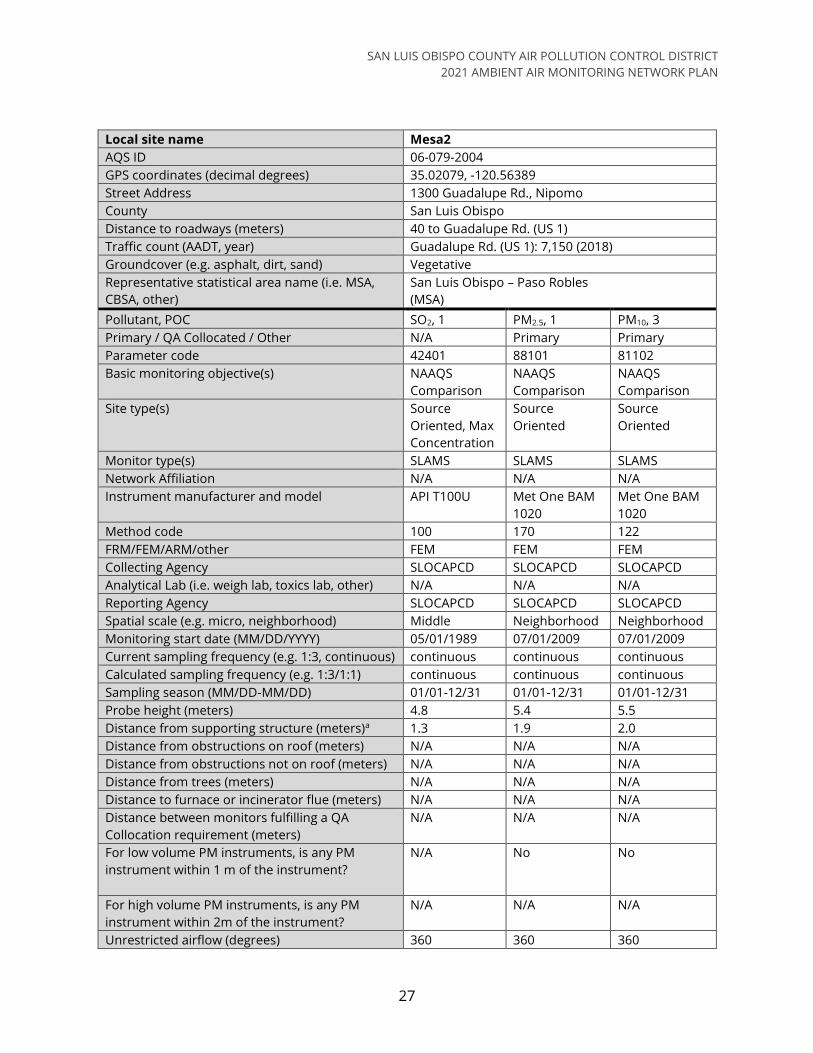
27
Local site name Mesa2
AQS ID 06-079-2004
GPS coordinates (decimal degrees) 35.02079, -120.56389
Street Address 1300 Guadalupe Rd., Nipomo
County San Luis Obispo
Distance to roadways (meters) 40 to Guadalupe Rd. (US 1)
Traffic count (AADT, year) Guadalupe Rd. (US 1): 7,150 (2018)
Groundcover (e.g. asphalt, dirt, sand) Vegetative
Representative statistical area name (i.e. MSA,
CBSA, other)
San Luis Obispo – Paso Robles
(MSA)
Pollutant, POC SO2, 1 PM2.5, 1 PM10, 3
Primary / QA Collocated / Other N/A Primary Primary
Parameter code 42401 88101 81102
Basic monitoring objective(s) NAAQS
Comparison
NAAQS
Comparison
NAAQS
Comparison
Site type(s) Source
Oriented, Max
Concentration
Source
Oriented
Source
Oriented
Monitor type(s) SLAMS SLAMS SLAMS
Network Affiliation N/A N/A N/A
Instrument manufacturer and model API T100U Met One BAM
1020
Met One BAM
1020
Method code 100 170 122
FRM/FEM/ARM/other FEM FEM FEM
Collecting Agency SLOCAPCD SLOCAPCD SLOCAPCD
Analytical Lab (i.e. weigh lab, toxics lab, other) N/A N/A N/A
Reporting Agency SLOCAPCD SLOCAPCD SLOCAPCD
Spatial scale (e.g. micro, neighborhood) Middle Neighborhood Neighborhood
Monitoring start date (MM/DD/YYYY) 05/01/1989 07/01/2009 07/01/2009
Current sampling frequency (e.g. 1:3, continuous) continuous continuous continuous
Calculated sampling frequency (e.g. 1:3/1:1) continuous continuous continuous
Sampling season (MM/DD-MM/DD) 01/01-12/31 01/01-12/31 01/01-12/31
Probe height (meters) 4.8 5.4 5.5
Distance from supporting structure (meters)a 1.3 1.9 2.0
Distance from obstructions on roof (meters) N/A N/A N/A
Distance from obstructions not on roof (meters) N/A N/A N/A
Distance from trees (meters) N/A N/A N/A
Distance to furnace or incinerator flue (meters) N/A N/A N/A
Distance between monitors fulfilling a QA
Collocation requirement (meters)
N/A N/A N/A
For low volume PM instruments, is any PM
instrument within 1 m of the instrument?
N/A No No
For high volume PM instruments, is any PM
instrument within 2m of the instrument?
N/A N/A N/A
Unrestricted airflow (degrees) 360 360 360
SAN LUIS OBISPO COUNTY AIR POLLUTION CONTROL DISTRICT
2021 AMBIENT AIR MONITORING NETWORK PLAN
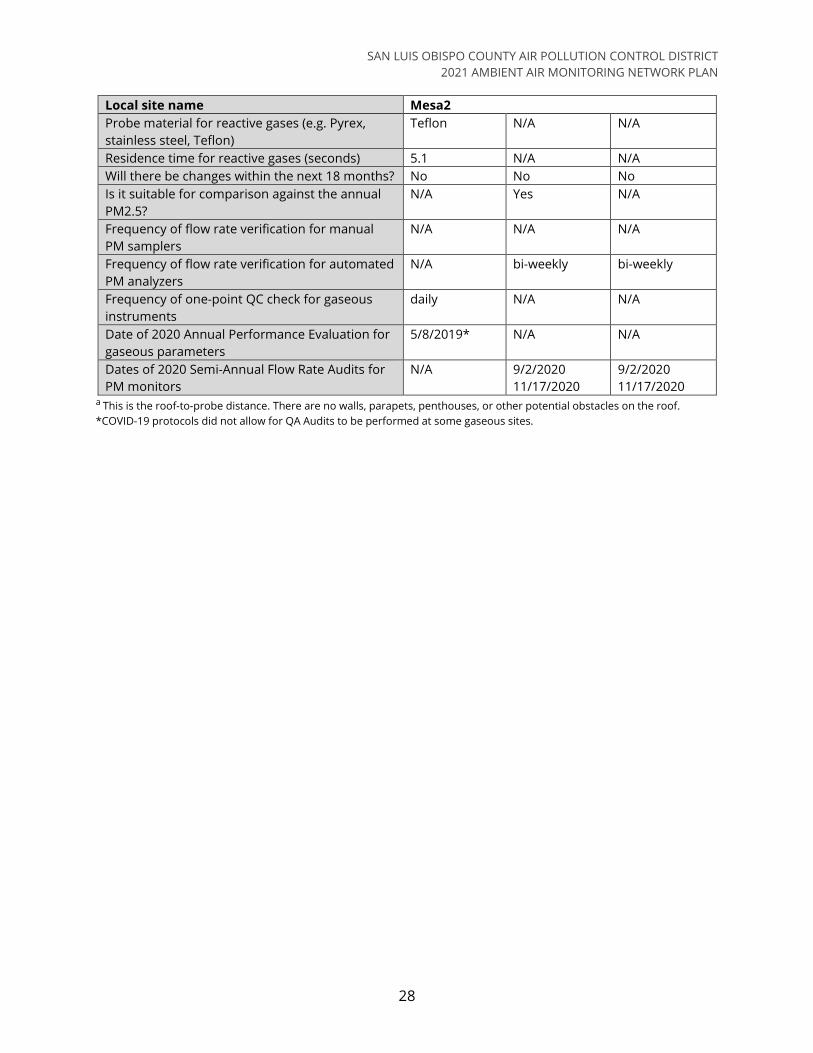
28
Local site name Mesa2
Probe material for reactive gases (e.g. Pyrex,
stainless steel, Teflon)
Teflon N/A N/A
Residence time for reactive gases (seconds) 5.1 N/A N/A
Will there be changes within the next 18 months? No No No
Is it suitable for comparison against the annual
PM2.5?
N/A Yes N/A
Frequency of flow rate verification for manual
PM samplers
N/A N/A N/A
Frequency of flow rate verification for automated
PM analyzers
N/A bi-weekly bi-weekly
Frequency of one-point QC check for gaseous
instruments
daily N/A N/A
Date of 2020 Annual Performance Evaluation for
gaseous parameters
5/8/2019* N/A N/A
Dates of 2020 Semi-Annual Flow Rate Audits for
PM monitors
N/A 9/2/2020
11/17/2020
9/2/2020
11/17/2020 a This is the roof-to-probe distance. There are no walls, parapets, penthouses, or other potential obstacles on the roof.
*COVID-19 protocols did not allow for QA Audits to be performed at some gaseous sites.

SAN LUIS OBISPO COUNTY AIR POLLUTION CONTROL DISTRICT
2021 AMBIENT AIR MONITORING NETWORK PLAN
29
Local site name San Luis Obispo (Closed 1/31/2021)
AQS ID 06-079-2006
GPS coordinates (decimal degrees) 35.25651, -120.66945
Street Address 3220 South Higuera St., San Luis Obispo
County San Luis Obispo
Distance to roadways (meters) 50 to South Higuera St.
450 to US 101
Traffic count (AADT, year) South Higuera St.: 15,731 (2016)
US 101: 65,700 (2018)
Groundcover (e.g. asphalt, dirt, sand) Vegetative (to the west and north),
Asphalt (east and south)
Representative statistical area name (i.e. MSA,
CBSA, other)
San Luis Obispo – Paso Robles
(MSA)
Pollutant, POC O3, 1 PM2.5, 3 PM10, 2
Primary / QA Collocated / Other N/A Primary Primary
Parameter code 44201 88101 81102
Basic monitoring objective(s) NAAQS
Comparison
NAAQS
Comparison
NAAQS
Comparison,
Public Info
Site type(s) Population
Exposure
Population
Exposure
Population
Exposure
Monitor type(s) SLAMS SLAMS SLAMS
Network Affiliation N/A N/A N/A
Instrument manufacturer and model API 400E Met One BAM
1020
Met One BAM
1020
Method code 087 170 122
FRM/FEM/ARM/other FEM FEM FEM
Collecting Agency CARB CARB CARB
Analytical Lab (i.e. weigh lab, toxics lab, other) N/A N/A N/A
Reporting Agency CARB CARB CARB
Spatial scale (e.g. micro, neighborhood) Neighborhood Neighborhood Neighborhood
Monitoring start date (MM/DD/YYYY) 09/21/2005 03/15/2011 06/01/2013 a
Current sampling frequency (e.g. 1:3, continuous) continuous continuous continuous
Calculated sampling frequency (e.g. 1:3/1:1) continuous continuous continuous
Sampling season (MM/DD-MM/DD) 01/01-12/31 01/01-12/31 01/01-12/31
Probe height (meters) 14.6 14.6 14.6
Distance from supporting structure (meters) 2.0 2.0 2.0
Distance from obstructions on roof (meters) N/A N/A N/A
Distance from obstructions not on roof (meters) N/A N/A N/A
Distance from trees (meters) N/A N/A N/A
Distance to furnace or incinerator flue (meters) N/A N/A N/A
Distance between monitors fulfilling a QA
Collocation requirement (meters)
N/A N/A N/A
For low volume PM instruments, is any PM
instrument within 1 m of the instrument?
N/A No No
For high volume PM instruments, is any PM
instrument within 2m of the instrument?
N/A N/A N/A
Unrestricted airflow (degrees) 360 360 360

SAN LUIS OBISPO COUNTY AIR POLLUTION CONTROL DISTRICT
2021 AMBIENT AIR MONITORING NETWORK PLAN
30
Local site name San Luis Obispo (Closed 1/31/2021)
Probe material for reactive gases (e.g. Pyrex,
stainless steel, Teflon)
Teflon N/A N/A
Residence time for reactive gases (seconds) 16 N/A N/A
Will there be changes within the next 18 months? No No No
Is it suitable for comparison against the annual
PM2.5?
N/A Yes N/A
Frequency of flow rate verification for manual
PM samplers
N/A N/A N/A
Frequency of flow rate verification for automated
PM analyzers
N/A monthly monthly
Frequency of one-point QC check for gaseous
instruments
daily N/A N/A
Date of 2020 Annual Performance Evaluation for
gaseous parameters
9/1/2020 N/A N/A
Dates of 2020 Semi-Annual Flow Rate Audits for
PM monitors
N/A 9/1/2020
11/18/2020
9/1/2020
11/18/2020 a This instrument did not begin reporting PM10-standard (88102) until 06/01/2013, but it has been reporting PM10-actual
(85101) since 03/15/2011.

SAN LUIS OBISPO COUNTY AIR POLLUTION CONTROL DISTRICT
2021 AMBIENT AIR MONITORING NETWORK PLAN
31
Local site name CDF
AQS ID 06-079-2007
GPS coordinates (decimal degrees) 35.04673, -120.58777
Street Address 2391 Willow Rd., Arroyo Grande
County San Luis Obispo
Distance to roadways (meters) 53 to Willow Rd. (US 1).
Traffic count (AADT, year) Willow Rd. (US1): 7,300 (2018)
Groundcover (e.g. asphalt, dirt, sand) Vegetative, Sand
Representative statistical area name (i.e. MSA, CBSA,
other)
San Luis Obispo – Paso Robles
(MSA)
Pollutant, POC PM2.5, 1 PM10, 2
Primary / QA Collocated / Other Primary Primary
Parameter code 88101 81102
Basic monitoring objective(s) NAAQS Comparison NAAQS Comparison
Site type(s) Max Concentration,
Source Oriented
Max Concentration,
Source Oriented
Monitor type(s) SLAMS SLAMS
Network Affiliation N/A N/A
Instrument manufacturer and model Met One BAM 1020 Met One BAM 1020
Method code 170 122
FRM/FEM/ARM/other FEM FEM
Collecting Agency SLOCAPCD SLOCAPCD
Analytical Lab (i.e. weigh lab, toxics lab, other) N/A N/A
Reporting Agency SLOCAPCD SLOCAPCD
Spatial scale (e.g. micro, neighborhood) Neighborhood Neighborhood
Monitoring start date (MM/DD/YYYY) 08/01/2010 01/01/2010
Current sampling frequency (e.g. 1:3, continuous) continuous continuous
Calculated sampling frequency (e.g. 1:3/1:1) continuous continuous
Sampling season (MM/DD-MM/DD) 01/01-12/31 01/01-12/31
Probe height (meters) 4.0 4.0
Distance from supporting structure (meters) a 1.9 1.8
Distance from obstructions on roof (meters) N/A N/A
Distance from obstructions not on roof (meters) N/A N/A
Distance from trees (meters) N/A N/A
Distance to furnace or incinerator flue (meters) N/A N/A
Distance between monitors fulfilling a QA Collocation
requirement (meters)
N/A N/A
For low volume PM instruments, is any PM instrument
within 1 m of the instrument?
No No
For high volume PM instruments, is any PM instrument
within 2m of the instrument?
N/A N/A
Unrestricted airflow (degrees) 360 360
Probe material for reactive gases (e.g. Pyrex, stainless
steel, Teflon)
N/A N/A
Residence time for reactive gases (seconds) N/A N/A
Will there be changes within the next 18 months? No No
Is it suitable for comparison against the annual PM2.5? Yes N/A
SAN LUIS OBISPO COUNTY AIR POLLUTION CONTROL DISTRICT
2021 AMBIENT AIR MONITORING NETWORK PLAN
32
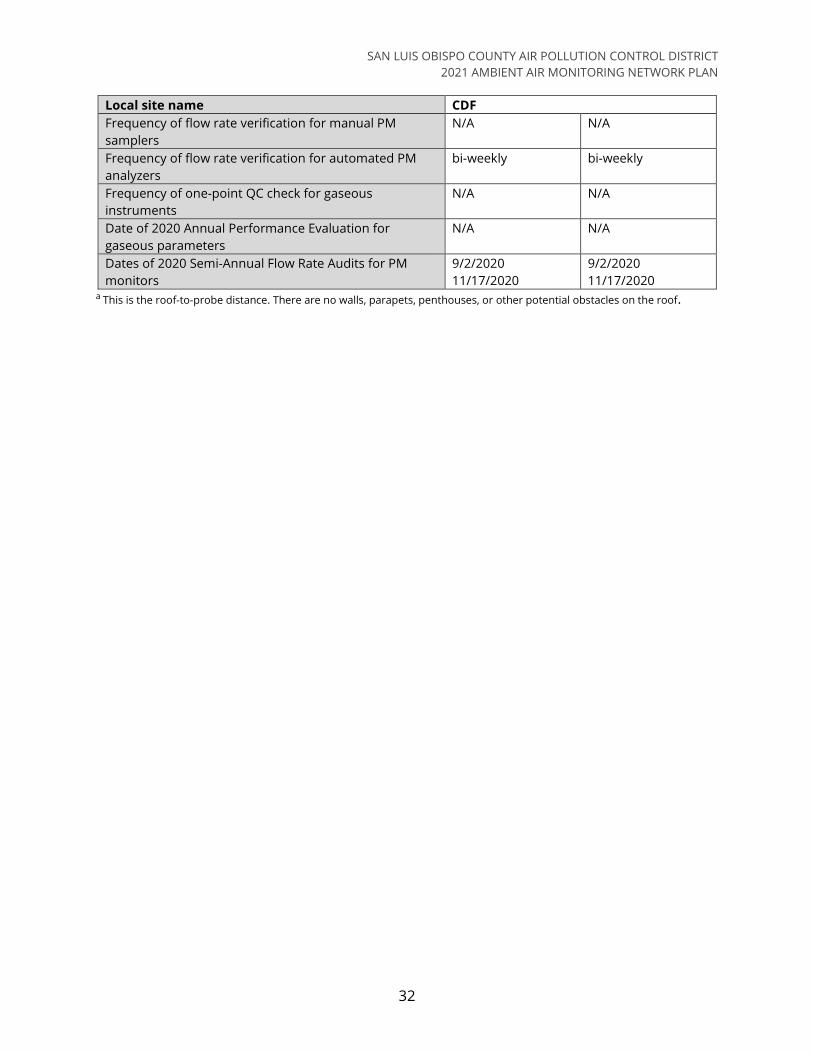
Local site name CDF
Frequency of flow rate verification for manual PM
samplers
N/A N/A
Frequency of flow rate verification for automated PM
analyzers
bi-weekly bi-weekly
Frequency of one-point QC check for gaseous
instruments
N/A N/A
Date of 2020 Annual Performance Evaluation for
gaseous parameters
N/A N/A
Dates of 2020 Semi-Annual Flow Rate Audits for PM
monitors
9/2/2020
11/17/2020
9/2/2020
11/17/2020 a This is the roof-to-probe distance. There are no walls, parapets, penthouses, or other potential obstacles on the roof.

SAN LUIS OBISPO COUNTY AIR POLLUTION CONTROL DISTRICT
2021 AMBIENT AIR MONITORING NETWORK PLAN
33
Local site name Morro Bay
AQS ID 06-079-3001
GPS coordinates (decimal degrees) 35.36640, -120.84268
Street Address 899 Morro Bay Blvd., Morro Bay
County San Luis Obispo
Distance to roadways (meters) 37 to Morro Bay Blvd.
220 to CA 1
Traffic count (AADT, year) Morro Bay Blvd.: 12,388 (2015) a
CA 1: 26,300 (2018)
Groundcover (e.g. asphalt, dirt, sand) Paved
Representative statistical area name (i.e. MSA, CBSA,
other)
San Luis Obispo – Paso Robles
(MSA)
Pollutant, POC O3, 1
Primary / QA Collocated / Other N/A
Parameter code 44201
Basic monitoring objective(s) NAAQS Comparison
Site type(s) General/Background
Monitor type(s) SLAMS
Network Affiliation N/A
Instrument manufacturer and model API T400
Method code 087
FRM/FEM/ARM/other FEM
Collecting Agency SLOCAPCD
Analytical Lab (i.e. weigh lab, toxics lab, other) N/A
Reporting Agency SLOCAPCD
Spatial scale (e.g. micro, neighborhood) Regional
Monitoring start date (MM/DD/YYYY) 01/01/1981
Monitoring end date (MM/DD/YYYY) N/A
Current sampling frequency (e.g. 1:3, continuous) continuous
Calculated sampling frequency (e.g. 1:3/1:1) continuous
Sampling season (MM/DD-MM/DD) 01/01-12/31
Probe height (meters) 4.2
Distance from supporting structure (meters) 1.1
Distance from obstructions on roof (meters) N/A
Distance from obstructions not on roof (meters) N/A
Distance from trees (meters) N/A
Distance to furnace or incinerator flue (meters) N/A
Distance between monitors fulfilling a QA Collocation
requirement (meters)
N/A
For low volume PM instruments, is any PM instrument
within 1 m of the instrument?
N/A
For high volume PM instruments, is any PM instrument
within 2m of the instrument?
N/A
Unrestricted airflow (degrees) 360
Probe material for reactive gases (e.g. Pyrex, stainless
steel, Teflon)
Teflon
Residence time for reactive gases (seconds) 12.9
Will there be changes within the next 18 months? No
SAN LUIS OBISPO COUNTY AIR POLLUTION CONTROL DISTRICT
2021 AMBIENT AIR MONITORING NETWORK PLAN
34
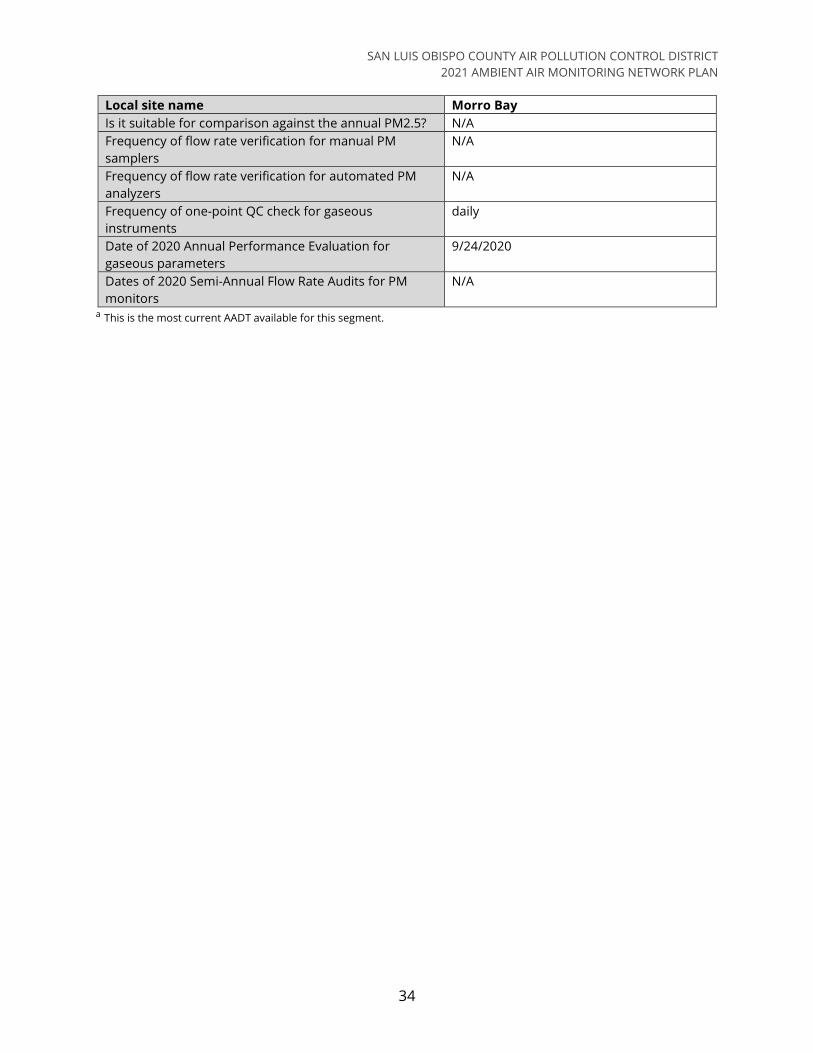
Local site name Morro Bay
Is it suitable for comparison against the annual PM2.5? N/A
Frequency of flow rate verification for manual PM
samplers
N/A
Frequency of flow rate verification for automated PM
analyzers
N/A
Frequency of one-point QC check for gaseous
instruments
daily
Date of 2020 Annual Performance Evaluation for
gaseous parameters
9/24/2020
Dates of 2020 Semi-Annual Flow Rate Audits for PM
monitors
N/A
a This is the most current AADT available for this segment.
SAN LUIS OBISPO COUNTY AIR POLLUTION CONTROL DISTRICT
2021 AMBIENT AIR MONITORING NETWORK PLAN
35
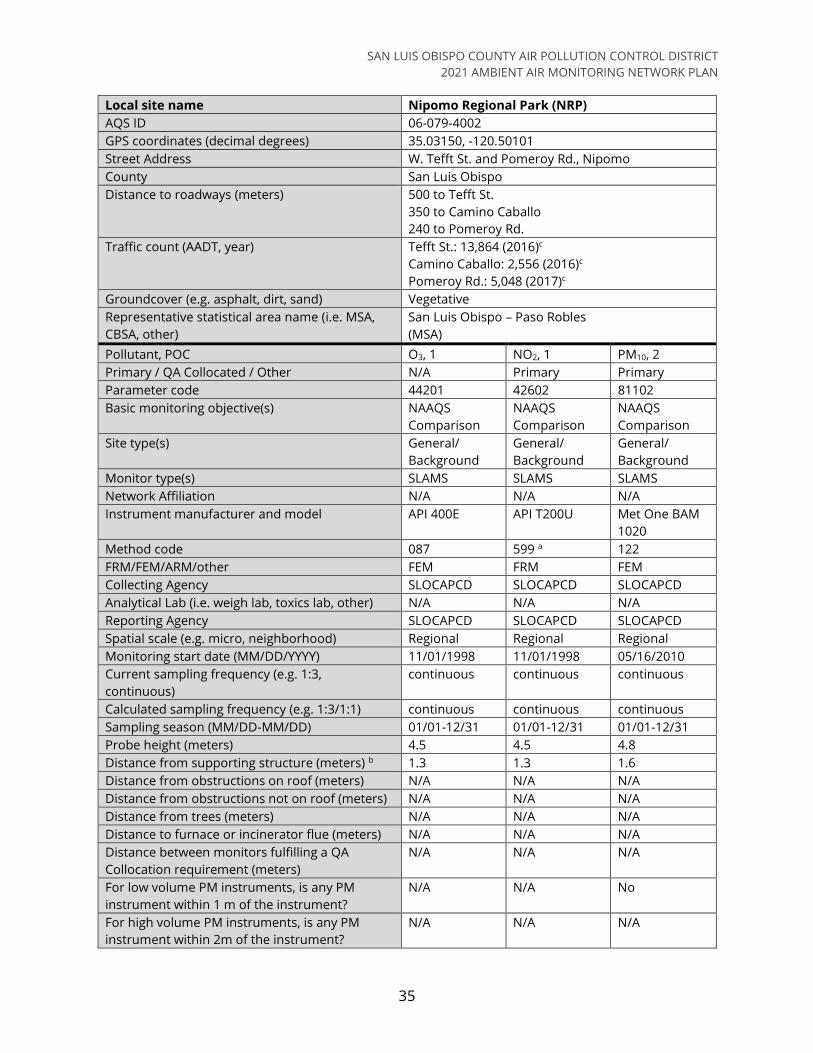
Local site name Nipomo Regional Park (NRP)
AQS ID 06-079-4002
GPS coordinates (decimal degrees) 35.03150, -120.50101
Street Address W. Tefft St. and Pomeroy Rd., Nipomo
County San Luis Obispo
Distance to roadways (meters) 500 to Tefft St.
350 to Camino Caballo
240 to Pomeroy Rd.
Traffic count (AADT, year) Tefft St.: 13,864 (2016)c
Camino Caballo: 2,556 (2016)c
Pomeroy Rd.: 5,048 (2017)c
Groundcover (e.g. asphalt, dirt, sand) Vegetative
Representative statistical area name (i.e. MSA,
CBSA, other)
San Luis Obispo – Paso Robles
(MSA)
Pollutant, POC O3, 1 NO2, 1 PM10, 2
Primary / QA Collocated / Other N/A Primary Primary
Parameter code 44201 42602 81102
Basic monitoring objective(s) NAAQS
Comparison
NAAQS
Comparison
NAAQS
Comparison
Site type(s) General/
Background
General/
Background
General/
Background
Monitor type(s) SLAMS SLAMS SLAMS
Network Affiliation N/A N/A N/A
Instrument manufacturer and model API 400E API T200U Met One BAM
1020
Method code 087 599 a 122
FRM/FEM/ARM/other FEM FRM FEM
Collecting Agency SLOCAPCD SLOCAPCD SLOCAPCD
Analytical Lab (i.e. weigh lab, toxics lab, other) N/A N/A N/A
Reporting Agency SLOCAPCD SLOCAPCD SLOCAPCD
Spatial scale (e.g. micro, neighborhood) Regional Regional Regional
Monitoring start date (MM/DD/YYYY) 11/01/1998 11/01/1998 05/16/2010
Current sampling frequency (e.g. 1:3,
continuous)
continuous continuous continuous
Calculated sampling frequency (e.g. 1:3/1:1) continuous continuous continuous
Sampling season (MM/DD-MM/DD) 01/01-12/31 01/01-12/31 01/01-12/31
Probe height (meters) 4.5 4.5 4.8
Distance from supporting structure (meters) b 1.3 1.3 1.6
Distance from obstructions on roof (meters) N/A N/A N/A
Distance from obstructions not on roof (meters) N/A N/A N/A
Distance from trees (meters) N/A N/A N/A
Distance to furnace or incinerator flue (meters) N/A N/A N/A
Distance between monitors fulfilling a QA
Collocation requirement (meters)
N/A N/A N/A
For low volume PM instruments, is any PM
instrument within 1 m of the instrument?
N/A N/A No
For high volume PM instruments, is any PM
instrument within 2m of the instrument?
N/A N/A N/A

SAN LUIS OBISPO COUNTY AIR POLLUTION CONTROL DISTRICT
2021 AMBIENT AIR MONITORING NETWORK PLAN
36
Local site name Nipomo Regional Park (NRP)
Unrestricted airflow (degrees) 360 360 360
Probe material for reactive gases (e.g. Pyrex,
stainless steel, Teflon)
Teflon Teflon N/A
Residence time for reactive gases (seconds) 14.0 12.5 N/A
Will there be changes within the next 18
months?
No No No
Is it suitable for comparison against the annual
PM2.5?
N/A N/A N/A
Frequency of flow rate verification for manual
PM samplers
N/A N/A N/A
Frequency of flow rate verification for
automated PM analyzers
N/A N/A bi-weekly
Frequency of one-point QC check for gaseous
instruments
daily daily N/A
Date of 2018 Annual Performance Evaluation for
gaseous parameters
9/2/2020 5/7/2019* N/A
Dates of 2018 Semi-Annual Flow Rate Audits for
PM monitors
N/A N/A
9/2/2020
11/17/2020 a EPA, “AQS Memo - Changes to Oxides of Nitrogen Analyzer Method Codes,” December 22, 2014.
https://www.epa.gov/aqs/aqs-memo-changes-oxides-nitrogen-analyzer-method-codes b This is the roof-to-probe distance. There are no walls, parapets, penthouses, or other potential obstacles on the roof. c This is the most current AADT available for this segment.
*COVID-19 protocols did not allow for QA Audits to be performed at some gaseous sites.
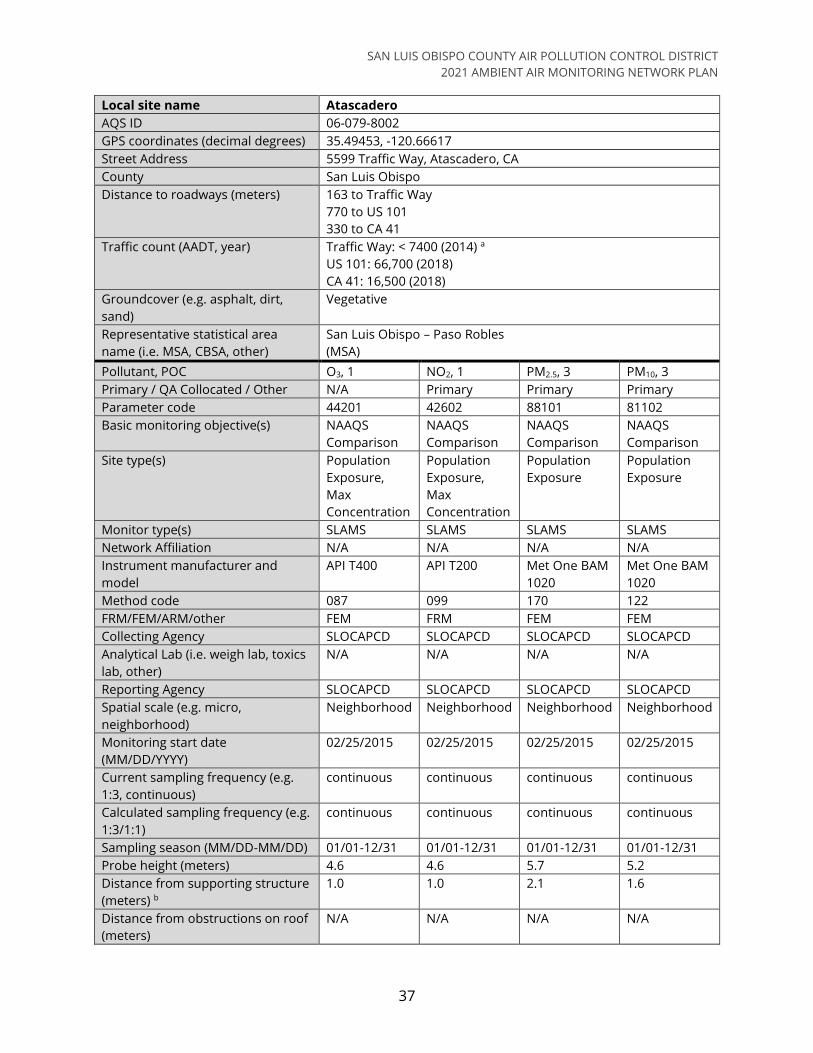
SAN LUIS OBISPO COUNTY AIR POLLUTION CONTROL DISTRICT
2021 AMBIENT AIR MONITORING NETWORK PLAN
37
Local site name Atascadero
AQS ID 06-079-8002
GPS coordinates (decimal degrees) 35.49453, -120.66617
Street Address 5599 Traffic Way, Atascadero, CA
County San Luis Obispo
Distance to roadways (meters) 163 to Traffic Way
770 to US 101
330 to CA 41
Traffic count (AADT, year) Traffic Way: < 7400 (2014) a
US 101: 66,700 (2018)
CA 41: 16,500 (2018)
Groundcover (e.g. asphalt, dirt,
sand)
Vegetative
Representative statistical area
name (i.e. MSA, CBSA, other)
San Luis Obispo – Paso Robles
(MSA)
Pollutant, POC O3, 1 NO2, 1 PM2.5, 3 PM10, 3
Primary / QA Collocated / Other N/A Primary Primary Primary
Parameter code 44201 42602 88101 81102
Basic monitoring objective(s) NAAQS
Comparison
NAAQS
Comparison
NAAQS
Comparison
NAAQS
Comparison
Site type(s) Population
Exposure,
Max
Concentration
Population
Exposure,
Max
Concentration
Population
Exposure
Population
Exposure
Monitor type(s) SLAMS SLAMS SLAMS SLAMS
Network Affiliation N/A N/A N/A N/A
Instrument manufacturer and
model
API T400 API T200 Met One BAM
1020
Met One BAM
1020
Method code 087 099 170 122
FRM/FEM/ARM/other FEM FRM FEM FEM
Collecting Agency SLOCAPCD SLOCAPCD SLOCAPCD SLOCAPCD
Analytical Lab (i.e. weigh lab, toxics
lab, other)
N/A N/A N/A N/A
Reporting Agency SLOCAPCD SLOCAPCD SLOCAPCD SLOCAPCD
Spatial scale (e.g. micro,
neighborhood)
Neighborhood Neighborhood Neighborhood Neighborhood
Monitoring start date
(MM/DD/YYYY)
02/25/2015 02/25/2015 02/25/2015 02/25/2015
Current sampling frequency (e.g.
1:3, continuous)
continuous continuous continuous continuous
Calculated sampling frequency (e.g.
1:3/1:1)
continuous continuous continuous continuous
Sampling season (MM/DD-MM/DD) 01/01-12/31 01/01-12/31 01/01-12/31 01/01-12/31
Probe height (meters) 4.6 4.6 5.7 5.2
Distance from supporting structure
(meters) b
1.0 1.0 2.1 1.6
Distance from obstructions on roof
(meters)
N/A N/A N/A N/A
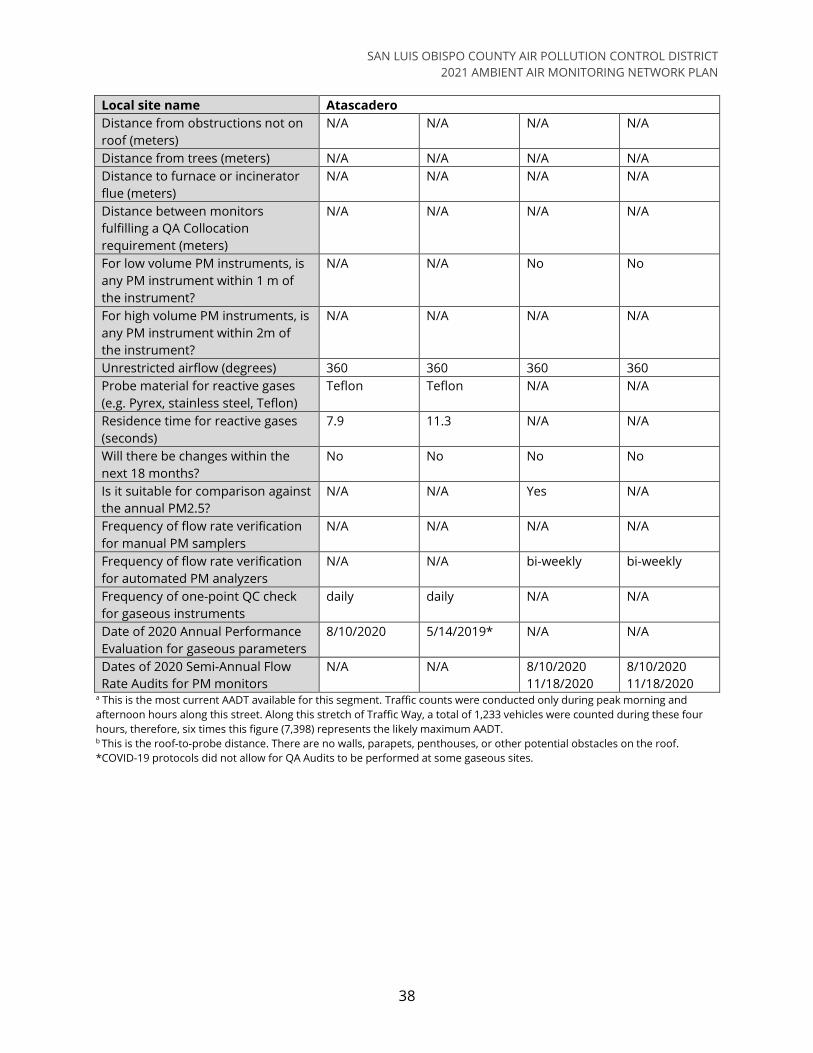
SAN LUIS OBISPO COUNTY AIR POLLUTION CONTROL DISTRICT
2021 AMBIENT AIR MONITORING NETWORK PLAN
38
Local site name Atascadero
Distance from obstructions not on
roof (meters)
N/A N/A N/A N/A
Distance from trees (meters) N/A N/A N/A N/A
Distance to furnace or incinerator
flue (meters)
N/A N/A N/A N/A
Distance between monitors
fulfilling a QA Collocation
requirement (meters)
N/A N/A N/A N/A
For low volume PM instruments, is
any PM instrument within 1 m of
the instrument?
N/A N/A No No
For high volume PM instruments, is
any PM instrument within 2m of
the instrument?
N/A N/A N/A N/A
Unrestricted airflow (degrees) 360 360 360 360
Probe material for reactive gases
(e.g. Pyrex, stainless steel, Teflon)
Teflon Teflon N/A N/A
Residence time for reactive gases
(seconds)
7.9 11.3 N/A N/A
Will there be changes within the
next 18 months?
No No No No
Is it suitable for comparison against
the annual PM2.5?
N/A N/A Yes N/A
Frequency of flow rate verification
for manual PM samplers
N/A N/A N/A N/A
Frequency of flow rate verification
for automated PM analyzers
N/A N/A bi-weekly bi-weekly
Frequency of one-point QC check
for gaseous instruments
daily daily N/A N/A
Date of 2020 Annual Performance
Evaluation for gaseous parameters
8/10/2020
5/14/2019*
N/A N/A
Dates of 2020 Semi-Annual Flow
Rate Audits for PM monitors
N/A N/A 8/10/2020
11/18/2020
8/10/2020
11/18/2020 a This is the most current AADT available for this segment. Traffic counts were conducted only during peak morning and
afternoon hours along this street. Along this stretch of Traffic Way, a total of 1,233 vehicles were counted during these four
hours, therefore, six times this figure (7,398) represents the likely maximum AADT. b This is the roof-to-probe distance. There are no walls, parapets, penthouses, or other potential obstacles on the roof.
*COVID-19 protocols did not allow for QA Audits to be performed at some gaseous sites.

SAN LUIS OBISPO COUNTY AIR POLLUTION CONTROL DISTRICT
2021 AMBIENT AIR MONITORING NETWORK PLAN
39
Local site name Red Hills
AQS ID 06-079-8005
GPS coordinates (decimal degrees) 35.64366, -120.23134
Street Address 3601 Gillis Canyon Rd., Shandon
County San Luis Obispo
Distance to roadways (meters) 100 to Gillis Canyon Rd.
1740 to Bitterwater Rd.
10,400 to CA 41/46
Traffic count (AADT, year) Gillis Canyon Rd.: 24 (2016) a
Bitterwater Rd.: 98 (2013) a
CA 41/46: 17,200 (2018)
Groundcover (e.g. asphalt, dirt, sand) Vegetative
Representative statistical area name (i.e. MSA, CBSA,
other)
San Luis Obispo – Paso Robles
(MSA)
Pollutant, POC O3, 1
Primary / QA Collocated / Other N/A
Parameter code 44201
Basic monitoring objective(s) NAAQS Comparison
Site type(s) Regional Transport, Max Concentration
Monitor type(s) SLAMS
Network Affiliation N/A
Instrument manufacturer and model API T400
Method code 087
FRM/FEM/ARM/other FEM
Collecting Agency SLOCAPCD
Analytical Lab (i.e. weigh lab, toxics lab, other) N/A
Reporting Agency SLOCAPCD
Spatial scale (e.g. micro, neighborhood) Regional
Monitoring start date (MM/DD/YYYY) 07/01/2000
Current sampling frequency (e.g. 1:3, continuous) continuous
Calculated sampling frequency (e.g. 1:3/1:1) continuous
Sampling season (MM/DD-MM/DD) 01/01-12/31
Probe height (meters) 5.3
Distance from supporting structure (meters) 1.5
Distance from obstructions on roof (meters) N/A
Distance from obstructions not on roof (meters) N/A
Distance from trees (meters) N/A
Distance to furnace or incinerator flue (meters) N/A
Distance between monitors fulfilling a QA Collocation
requirement (meters)
N/A
For low volume PM instruments, is any PM
instrument within 1 m of the instrument?
N/A
For high volume PM instruments, is any PM
instrument within 2m of the instrument?
N/A
Unrestricted airflow (degrees) 360
Probe material for reactive gases (e.g. Pyrex, stainless
steel, Teflon)
Teflon
Residence time for reactive gases (seconds) 17.5
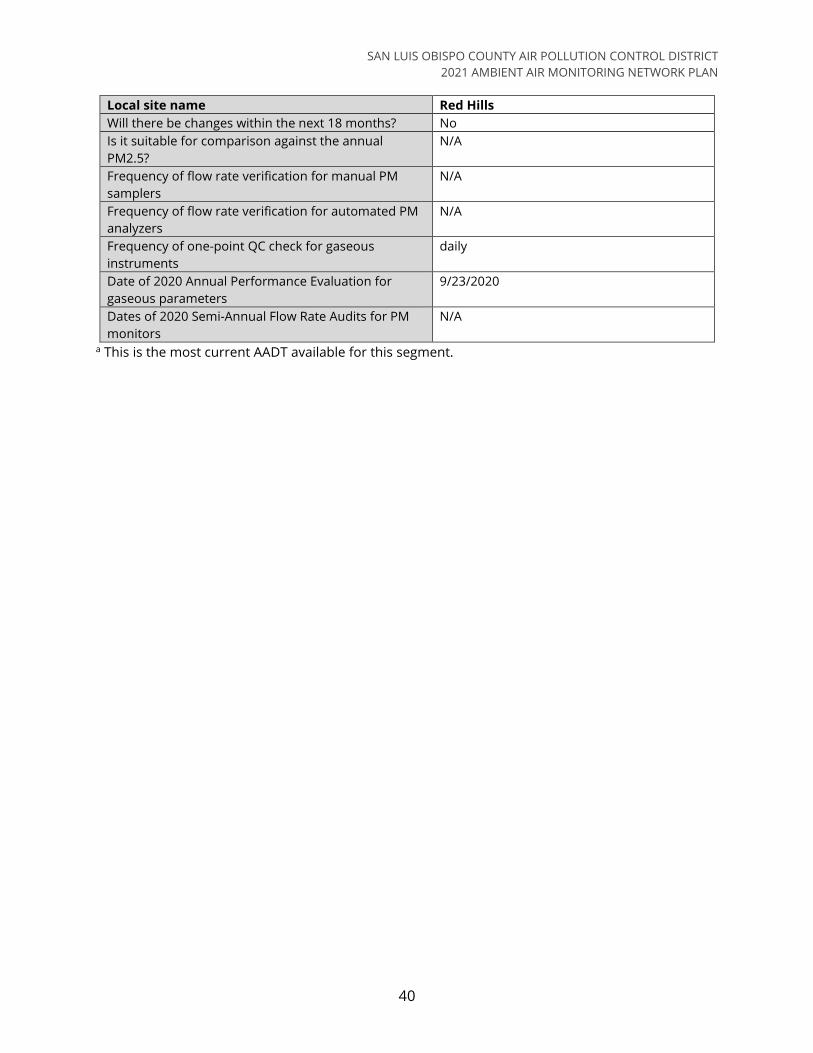
SAN LUIS OBISPO COUNTY AIR POLLUTION CONTROL DISTRICT
2021 AMBIENT AIR MONITORING NETWORK PLAN
40
Local site name Red Hills
Will there be changes within the next 18 months? No
Is it suitable for comparison against the annual
PM2.5?
N/A
Frequency of flow rate verification for manual PM
samplers
N/A
Frequency of flow rate verification for automated PM
analyzers
N/A
Frequency of one-point QC check for gaseous
instruments
daily
Date of 2020 Annual Performance Evaluation for
gaseous parameters
9/23/2020
Dates of 2020 Semi-Annual Flow Rate Audits for PM
monitors
N/A
a This is the most current AADT available for this segment.

SAN LUIS OBISPO COUNTY AIR POLLUTION CONTROL DISTRICT
2021 AMBIENT AIR MONITORING NETWORK PLAN
41
Local site name Carrizo Plain
AQS ID 06-079-8006
GPS coordinates (decimal degrees) 35.35474, -120.04013
Street Address 9640 Carrizo Highway (CA 58),
California Valley
County San Luis Obispo
Distance to roadways (meters) 38 to Carrizo Highway (CA 58)
Traffic count (AADT, year) Carrizo Highway (CA 58): 480 (2018)
Groundcover (e.g. asphalt, dirt, sand) Vegetative (to the west, north, and east)
Asphalt (south)
Representative statistical area name (i.e. MSA, CBSA,
other)
San Luis Obispo – Paso Robles
(MSA)
Pollutant, POC O3, 1
Primary / QA Collocated / Other N/A
Parameter code 44201
Basic monitoring objective(s) NAAQS Comparison
Site type(s) Regional Transport, General Background
Monitor type(s) SLAMS
Network Affiliation N/A
Instrument manufacturer and model API T400
Method code 087
FRM/FEM/ARM/other FEM
Collecting Agency SLOCAPCD
Analytical Lab (i.e. weigh lab, toxics lab, other) N/A
Reporting Agency SLOCAPCD
Spatial scale (e.g. micro, neighborhood) Regional
Monitoring start date (MM/DD/YYYY) 01/01/2006
Current sampling frequency (e.g. 1:3, continuous) continuous
Calculated sampling frequency (e.g. 1:3/1:1) continuous
Sampling season (MM/DD-MM/DD) 01/01-12/31
Probe height (meters) 4.7
Distance from supporting structure (meters) 1.1
Distance from obstructions on roof (meters) N/A
Distance from obstructions not on roof (meters) N/A
Distance from trees (meters) N/A
Distance to furnace or incinerator flue (meters) N/A
Distance between monitors fulfilling a QA Collocation
requirement (meters)
N/A
For low volume PM instruments, is any PM
instrument within 1 m of the instrument?
N/A
For high volume PM instruments, is any PM
instrument within 2m of the instrument?
N/A
Unrestricted airflow (degrees) 360
Probe material for reactive gases (e.g. Pyrex, stainless
steel, Teflon)
Teflon
Residence time for reactive gases (seconds) 14.2
Will there be changes within the next 18 months? No

SAN LUIS OBISPO COUNTY AIR POLLUTION CONTROL DISTRICT
2021 AMBIENT AIR MONITORING NETWORK PLAN
42
Local site name Carrizo Plain
Is it suitable for comparison against the annual
PM2.5?
N/A
Frequency of flow rate verification for manual PM
samplers
N/A
Frequency of flow rate verification for automated PM
analyzers
N/A
Frequency of one-point QC check for gaseous
instruments
daily
Date of 2020 Annual Performance Evaluation for
gaseous parameters
9/23/2020
Dates of 2020 Semi-Annual Flow Rate Audits for PM
monitors
N/A
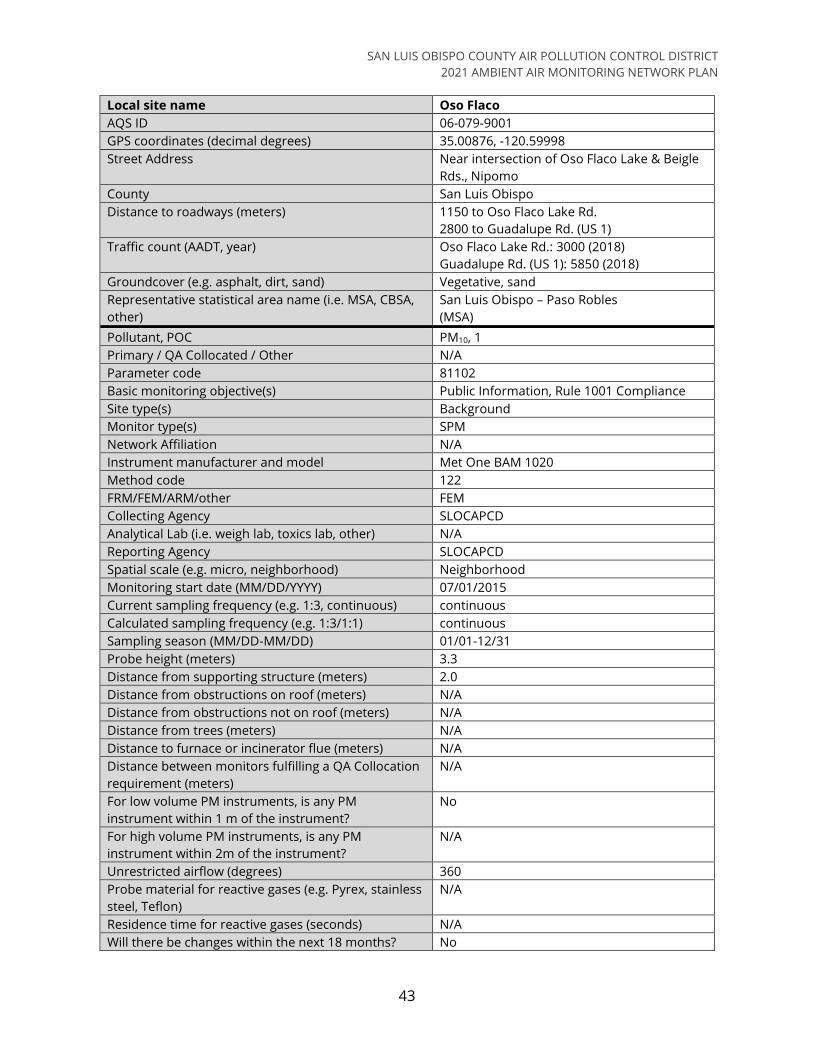
SAN LUIS OBISPO COUNTY AIR POLLUTION CONTROL DISTRICT
2021 AMBIENT AIR MONITORING NETWORK PLAN
43
Local site name Oso Flaco
AQS ID 06-079-9001
GPS coordinates (decimal degrees) 35.00876, -120.59998
Street Address Near intersection of Oso Flaco Lake & Beigle
Rds., Nipomo
County San Luis Obispo
Distance to roadways (meters) 1150 to Oso Flaco Lake Rd.
2800 to Guadalupe Rd. (US 1)
Traffic count (AADT, year) Oso Flaco Lake Rd.: 3000 (2018)
Guadalupe Rd. (US 1): 5850 (2018)
Groundcover (e.g. asphalt, dirt, sand) Vegetative, sand
Representative statistical area name (i.e. MSA, CBSA,
other)
San Luis Obispo – Paso Robles
(MSA)
Pollutant, POC PM10, 1
Primary / QA Collocated / Other N/A
Parameter code 81102
Basic monitoring objective(s) Public Information, Rule 1001 Compliance
Site type(s) Background
Monitor type(s) SPM
Network Affiliation N/A
Instrument manufacturer and model Met One BAM 1020
Method code 122
FRM/FEM/ARM/other FEM
Collecting Agency SLOCAPCD
Analytical Lab (i.e. weigh lab, toxics lab, other) N/A
Reporting Agency SLOCAPCD
Spatial scale (e.g. micro, neighborhood) Neighborhood
Monitoring start date (MM/DD/YYYY) 07/01/2015
Current sampling frequency (e.g. 1:3, continuous) continuous
Calculated sampling frequency (e.g. 1:3/1:1) continuous
Sampling season (MM/DD-MM/DD) 01/01-12/31
Probe height (meters) 3.3
Distance from supporting structure (meters) 2.0
Distance from obstructions on roof (meters) N/A
Distance from obstructions not on roof (meters) N/A
Distance from trees (meters) N/A
Distance to furnace or incinerator flue (meters) N/A
Distance between monitors fulfilling a QA Collocation
requirement (meters)
N/A
For low volume PM instruments, is any PM
instrument within 1 m of the instrument?
No
For high volume PM instruments, is any PM
instrument within 2m of the instrument?
N/A
Unrestricted airflow (degrees) 360
Probe material for reactive gases (e.g. Pyrex, stainless
steel, Teflon)
N/A
Residence time for reactive gases (seconds) N/A
Will there be changes within the next 18 months? No
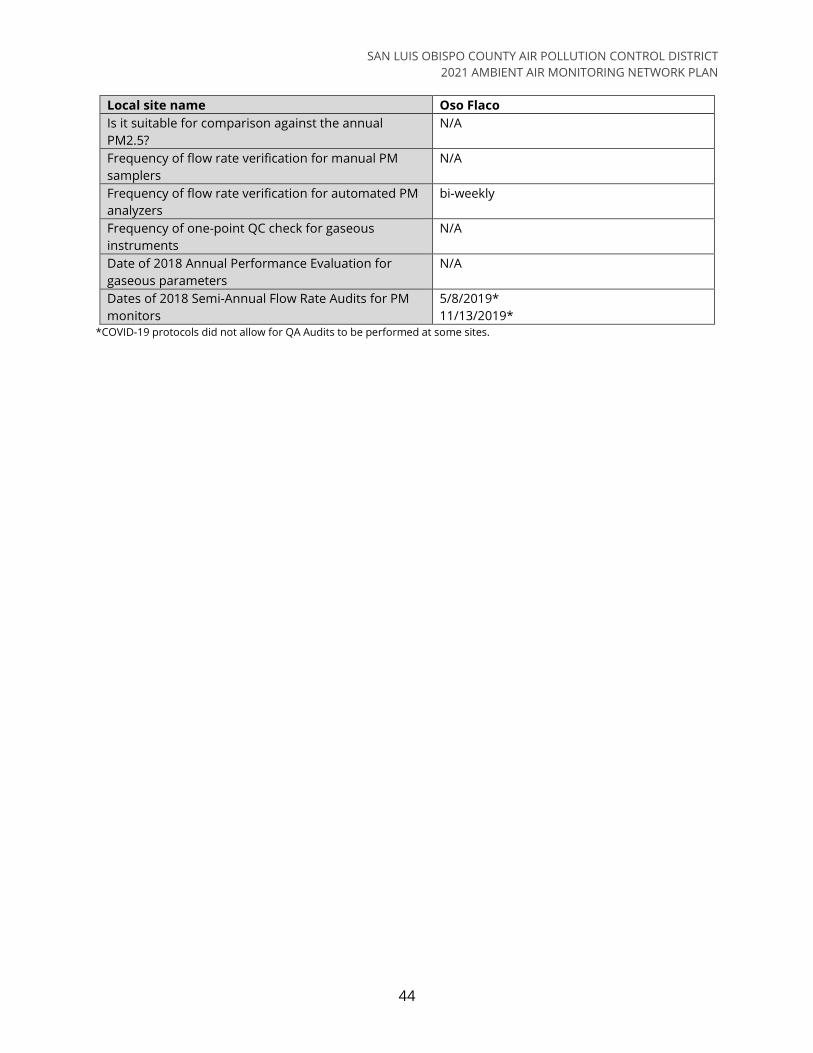
SAN LUIS OBISPO COUNTY AIR POLLUTION CONTROL DISTRICT
2021 AMBIENT AIR MONITORING NETWORK PLAN
44
Local site name Oso Flaco
Is it suitable for comparison against the annual
PM2.5?
N/A
Frequency of flow rate verification for manual PM
samplers
N/A
Frequency of flow rate verification for automated PM
analyzers
bi-weekly
Frequency of one-point QC check for gaseous
instruments
N/A
Date of 2018 Annual Performance Evaluation for
gaseous parameters
N/A
Dates of 2018 Semi-Annual Flow Rate Audits for PM
monitors
5/8/2019*
11/13/2019* *COVID-19 protocols did not allow for QA Audits to be performed at some sites.
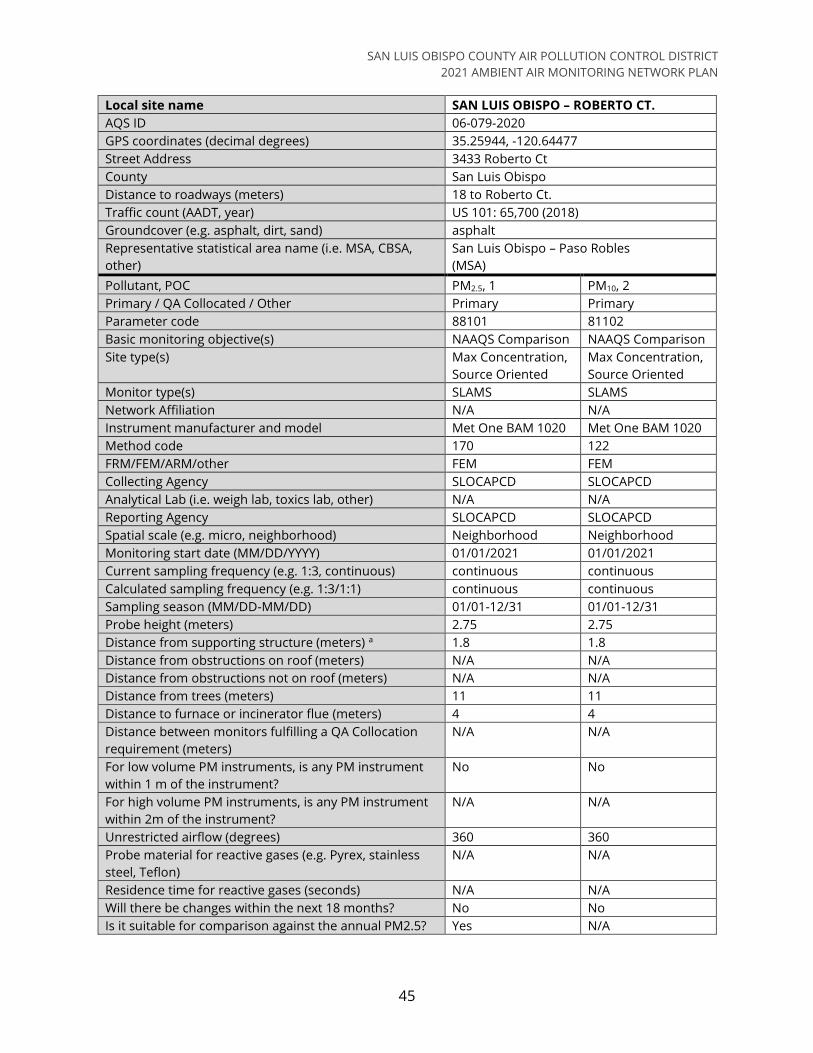
SAN LUIS OBISPO COUNTY AIR POLLUTION CONTROL DISTRICT
2021 AMBIENT AIR MONITORING NETWORK PLAN
45
Local site name SAN LUIS OBISPO – ROBERTO CT.
AQS ID 06-079-2020
GPS coordinates (decimal degrees) 35.25944, -120.64477
Street Address 3433 Roberto Ct
County San Luis Obispo
Distance to roadways (meters) 18 to Roberto Ct.
Traffic count (AADT, year) US 101: 65,700 (2018)
Groundcover (e.g. asphalt, dirt, sand) asphalt
Representative statistical area name (i.e. MSA, CBSA,
other)
San Luis Obispo – Paso Robles
(MSA)
Pollutant, POC PM2.5, 1 PM10, 2
Primary / QA Collocated / Other Primary Primary
Parameter code 88101 81102
Basic monitoring objective(s) NAAQS Comparison NAAQS Comparison
Site type(s) Max Concentration,
Source Oriented
Max Concentration,
Source Oriented
Monitor type(s) SLAMS SLAMS
Network Affiliation N/A N/A
Instrument manufacturer and model Met One BAM 1020 Met One BAM 1020
Method code 170 122
FRM/FEM/ARM/other FEM FEM
Collecting Agency SLOCAPCD SLOCAPCD
Analytical Lab (i.e. weigh lab, toxics lab, other) N/A N/A
Reporting Agency SLOCAPCD SLOCAPCD
Spatial scale (e.g. micro, neighborhood) Neighborhood Neighborhood
Monitoring start date (MM/DD/YYYY) 01/01/2021 01/01/2021
Current sampling frequency (e.g. 1:3, continuous) continuous continuous
Calculated sampling frequency (e.g. 1:3/1:1) continuous continuous
Sampling season (MM/DD-MM/DD) 01/01-12/31 01/01-12/31
Probe height (meters) 2.75 2.75
Distance from supporting structure (meters) a 1.8 1.8
Distance from obstructions on roof (meters) N/A N/A
Distance from obstructions not on roof (meters) N/A N/A
Distance from trees (meters) 11 11
Distance to furnace or incinerator flue (meters) 4 4
Distance between monitors fulfilling a QA Collocation
requirement (meters)
N/A N/A
For low volume PM instruments, is any PM instrument
within 1 m of the instrument?
No No
For high volume PM instruments, is any PM instrument
within 2m of the instrument?
N/A N/A
Unrestricted airflow (degrees) 360 360
Probe material for reactive gases (e.g. Pyrex, stainless
steel, Teflon)
N/A N/A
Residence time for reactive gases (seconds) N/A N/A
Will there be changes within the next 18 months? No No
Is it suitable for comparison against the annual PM2.5? Yes N/A

SAN LUIS OBISPO COUNTY AIR POLLUTION CONTROL DISTRICT
2021 AMBIENT AIR MONITORING NETWORK PLAN
46
Local site name SAN LUIS OBISPO – ROBERTO CT.
Frequency of flow rate verification for manual PM
samplers
N/A N/A
Frequency of flow rate verification for automated PM
analyzers
bi-weekly bi-weekly
Frequency of one-point QC check for gaseous
instruments
N/A N/A
Date of 2020 Annual Performance Evaluation for
gaseous parameters
N/A N/A
Dates of 2020 Semi-Annual Flow Rate Audits for PM
monitors
N/A N/A

SAN LUIS OBISPO COUNTY AIR POLLUTION CONTROL DISTRICT
2021 AMBIENT AIR MONITORING NETWORK PLAN
47
Appendix D: Non SLAMS Network Operations
In addition to these SLAMS and SPM stations mentioned in the main report, SLOCAPCD also
conducts temporary monitoring projects to support certain objectives. In 2016, SLOCAPCD received
an EPA multipurpose grant for the construction of a mobile particulate monitoring platform to be
used for further characterizing dust impacts downwind of the ODSVRA. The platform, which hosts
meteorological sensors and PM10 and PM2.5 FEM BAM monitors, was completed in the spring of
2017. Since then, it has been deployed to various locations on the Nipomo Mesa.
Similarly, SLOCAPCD has conducted temporary PM10 monitoring in Oceano and on the Nipomo
Mesa using funding from Assembly Bill 617 Community Air Protection Implementation Grant
Program, which was awarded to SLOCAPCD by CARB. In 2019, an FEM BAM was deployed in Oceano
for a short duration and in 2021, on the Nipomo Mesa, the SLOCAPCD is continuing operation of
temporary PM10 monitoring with non-FEM BAMs near Dorothea Lange Elementary School and North
View Avenue in Nipomo. Data collected with these temporary/mobile monitors are not uploaded to
AQS but are shown on South County Particulate Matter Air Quality Index map on the APCD’s South
County Air Quality webpage. In 2021, SLOCAPCD plans to replace the North View Avenue BAM with
an IQAir AirVisual sensor.
SLOCAPCD is also actively engaged in testing and deploying networks of non-FRM/non-FEM low-cost
sensors. In collaboration with CARB, South Coast AQMD, residents, and a variety of community
partners, we have deployed dozens of Purple Air sensors throughout the county. These are visible
on the Purple Air website.8 We have also deployed several IQAir AirVisual sensors, including four in
Oceano as part of the Assembly Bill 617 Community Air Protection Implementation Grant Program.
Purple Air sensors have been proven to be useful sensors in smoke and wildfire monitoring and
IQAir AirVisual sensors are useful for PM10 monitoring on the Nipomo Mesa/Oceano area.
Additionally, the SLOCAPCD has a data feed from the monitoring station at Sentinel Peak Resources’
Arroyo Grande Oilfield in Price Canyon, but it does not play any role in data collection or validation.
Table 3 summarizes the pollutant and meteorological parameters monitored at these non-SLAMS
stations.
Table 3: Summary of Parameters Currently Monitored at Non-SLAMS in San Luis Obispo County
Site/Station Hydrogen
Sulfide PM10 PM2.5
Relative
Humidity Wind a Temp
Oso Flaco (SPM) X X X X
Price Canyon
Oilfield X
X X X
Mobile Monitor b X X X X
Temporary PM10
(North View Ave) X
Calle Cielo X
8 Purple Air, “Map – Purple Air,” https://www.purpleair.com/map.

SAN LUIS OBISPO COUNTY AIR POLLUTION CONTROL DISTRICT
2021 AMBIENT AIR MONITORING NETWORK PLAN
48
Site/Station Hydrogen
Sulfide PM10 PM2.5
Relative
Humidity Wind a Temp
Dorothea Lange X Note: a Wind speed, wind direction, and sigma theta.
b No current plans for operation of the Mobile Monitor.
In response to wildfires in 2020, the SLOCAPCD has also decided to operate a non-FEM BAM at the
Morro Bay site for the wildfire season to deliver smoke impacts information to the local community
if there are future impacts from wildfires and may also be operated during other PM related events
such as prescribed fires, etc. In addition the SLOCAPCD will deploy collocated Purple Air sensors or
IQAir nodes at select sites to further strengthen smoke monitoring at critical sites.


