AR KAN SAS ENERGY& ENVIRONMENT June 17,2021 Mr. David F. Garcia, P.E. Director, Air and Radiation Division U.S. Environmental Protection Agency, Region 6 1201 Elm Street, Suite 500 Dallas, Texas 7 527 0-2102 RE: Arkansas 2021-2022 Annual Network Plan Dear Mr. Garcia: The final 2021-2022 Annual Network Plan (Plan) for the Ambient Air Monitoring Network for the Arkansas Department of Energy and Environment, Division of Environmental Quality (DEQ) is enclosed to fulfill requirements set forth in 40 CFR $ 58.10. The DEQ Plan was made available for public inspection from May 16,2021 through June 14, 2021. During this period, DEQ received no public comments. DEQ's 202I-2022 Plan is also publically available here: https ://www.adeq. state. ar.us/airlapn. aspx Please contact David Clark, Technical Section Supervisor, ([email protected]or 501-682- 0070) or myself ([email protected]or 501 682-0885) with any comments or questions. Sincerely, William K. Montgomery Associate Director - Office of Air Quality Division of Environmental Quality Arkansas Department of Energy and Environment 501-682-0885 montgomery@adeq. state.ar.us Division of Environmentol Quolity 53ill N';rli:s|rtfic i-ii;',/t. \:orih l-iilrc i?i',cii. ;ii.l '121 iil ::';'17 i,J{ieQ s'i{-ll':.r iti L:;
Transcript
AR KAN SASENERGY& ENVIRONMENT
June 17,2021
Mr. David F. Garcia, P.E.
Director, Air and Radiation DivisionU.S. Environmental Protection Agency, Region 6
1201 Elm Street, Suite 500
Dallas, Texas 7 527 0-2102
RE: Arkansas 2021-2022 Annual Network Plan
Dear Mr. Garcia:
The final 2021-2022 Annual Network Plan (Plan) for the Ambient Air Monitoring Network forthe Arkansas Department of Energy and Environment, Division of Environmental Quality (DEQ)
is enclosed to fulfill requirements set forth in 40 CFR $ 58.10. The DEQ Plan was made
available for public inspection from May 16,2021 through June 14, 2021. During this period,
DEQ received no public comments. DEQ's 202I-2022 Plan is also publically available here:
https ://www.adeq. state. ar.us/airlapn. aspx
Please contact David Clark, Technical Section Supervisor, ([email protected] or 501-682-
0070) or myself ([email protected] or 501 682-0885) with any comments orquestions.
Sincerely,
William K. MontgomeryAssociate Director - Office of Air QualityDivision of Environmental QualityArkansas Department of Energy and Environment
ADEQ/FISCAL DIVISION5301 NORTHSHORE DRNORTH LITTLE ROCK AR 721L8
ATTN: Sara White05/L6/2]. INVOICE #:L60a6'734 P.O. #:
3244642
REMIT TO:ARKANSAS DEMOCRAT-GAZETTE INC,P.O. BOX 2221LITTLE ROCK, AR 72203
For Billing Questions call: 501-399-3660
AD COPYSTATE OF ARKANSAS,COUNTY OF PULASKI, ss
DATE DAY LINAGE RATE
1s3.86
oFFICIAL SEAL - #1234DEANNA GRIFF!N
NOTARY PUBLIC-ARK,ANSASPULASKI COUNTY
MY COMMISSION EXPIRES: o3'3O-26
))
It Charles A McNeice .Jr, do solemnly swear that fam the Business Manager of the ArkansasDemocrat-Gazette, a daily newspaper printed andpubJ.i-shed in said County, State of Arkansas; thatI was so related to this publication at and duringthe publication of the annexed J.ega1 advertisementthe matter of:
Noticepending in the Court, in said County, andat thre dates of the several publications of saidadvertisement stated below, and that during saidperiods and at said dates, said newspaper wasprinted and had a bona fide circulation in saidCounty; that said newspaper had been regularlyprinted and published in said County' and had abona fide circulation therein for thre period ofone monthr before the date of the first publicationof said advertisementi and that said advertisementwas published in the regular daily issues of saidnewspaper as stated below.
DATE05/16
DAY LINAGE RATESun 98 L.51
TOTAL COSTBilling Ad # : '154L'7 436
P]^!n C 4,4'QSubscribed and sworn to before me on ttris I 7
"/A-a^-^n)
Signature of Notary Public
,20-1.! *
Andqasnsas ffiemccreg @ {& azeffieSTATEMENT OF LEG.AL ADYERTISING
THIS PAGE USED FORADDITTONAL AD COFY SPACE AS NEEDED.PAGE MAY BE BLANK
hr Nl€n8as Alr MonttorlngNotwolk
Pursuant to 40 CFR Part 58, ::
Suboarl B, states are loqulted tosubinit an annual alr monitorlngnetwork Dlan to the US Envlron-mental Piotection Agency (EPA).
Th€ Arkansa6 Deoartment ol En-erov and Envlronhent. Dlvision of
En-vironmental Quallty (DEo), has
oreoared lhe Arkansas AmblentAir Monitorlno Network AnnualNetwork Plan lot 2021-2022(Notr,vork Plan) lor submisslon toEPA Reoion 6: 0E0 has also Pre-Dared fdr oublic review an updateio tne zoi0 sullur Dioxide Data
Requirements Rule (S02 DRR)
onobino data reoulremonts, whlch
hai be-on includbd as Appendlx A
to the Network Plan. The Publlcrevlew oeriod ls MaY 16,2021'through June 14, 2021, at 4:30o.m. Wrltton comments recolveo
irom lhe publlc received durlngthe publlc review Perlod will be
made Dart of the record.Thli Network Plan orovides the
lramework l0r sstablishment and
maintenance ot an air qualltysurveillance system fol lhe state.
The Network Plan rePlesents theDEo's commitment to Protect thehsalth ot the citizens ol Arkansasthrouoh ambient air monitoringusinoihe latest and best tech-nolo-ov that is commerciall}lavaila.-bie and to communlcate the
data collocted to the Publlc asquickly and accurately as p0s$l-
ble. This Nstwork Plan does not
Annual
Netl/vork Plana paper copy ol thecan be obtained by
contactlno Michael DaY at theDE0. olliie ol Air ouality viatelephone (501-682-0832) or e-
1. EAI White Bluff ............................................................................................................. 19
III. Contact Information ........................................................................................................... 21
Figures Figure 1. Map of Arkansas Ambient Air Monitoring Network ...................................................... 2 Figure 2. Relative Location of Facilities Emitting Greater than or Equal to 2000 TPY SO2 ....... 15 Figure 3. 2008–2019 Pb Emissions from EAI Independence ....................................................... 19 Figure 4. 2008–2019 Pb Emissions from EAI White Bluff .......................................................... 20
Tables
Table 1. E&E Operated SLAMS Monitor Locations...................................................................... 3 Table 2. U.S. Census Bureau Population Statistics for MSAs in Arkansas .................................... 4 Table 3. E&E Operated SLAMS Methods and Operation .............................................................. 4 Table 4. Arkansas Ozone SLAMS Monitors Schedule and 2018–2020 Ozone DVs ..................... 7 Table 5. Arkansas MSA Populations and Minimum Ozone Monitors Required in SLAMS Network........................................................................................................................................... 7 Table 6. Arkansas PM2.5 SLAMS Monitors Schedule and 2018–2020 PM2.5 DVs........................ 9 Table 7. Arkansas MSA Populations and Minimum PM2.5 Monitors Required in SLAMS Network......................................................................................................................................... 10
ii
Table 8. Continuous PM2.5 AQI Monitoring Site Information...................................................... 11 Table 9. Arkansas PM10 SLAMS Monitors Schedule and 2018–2020 PM10 Three-Year Average....................................................................................................................................................... 11 Table 10. Arkansas MSA Populations and Minimum PM10 Monitors Required in SLAMS Network......................................................................................................................................... 12 Table 11. Arkansas CBSA Populations and Minimum SO2 Monitors Required in SLAMS Network......................................................................................................................................... 13 Table 12. Facilities Emitting Greater Than 2000 tpy SO2 ............................................................ 14 Table 13. Source-Oriented Pb Waiver Status by Facility ............................................................. 17
Appendices Appendix A. Entergy Arkansas, Inc. White Bluff- Ongoing Data Requirement for Annual Updated SO2 Emissions Information Appendix B. 2020 Update to May/June 2008 Memorandum of Agreement between SCHD, MDEQ and ADEQ concerning air quality monitoring requirements for the Memphis MSA
1 of 21
I. Introduction
The Arkansas Department of Energy and Environment (E&E) operates a network of air quality monitors to support state implementation plans, national air quality assessments, and policy decisions with respect to pollutants for which the United States Environmental Protection Agency (EPA) has set national ambient air quality standards (NAAQS) under the Federal Clean Air Act. These pollutants include ozone, sulfur dioxide (SO2), particulate matter (PM2.5 and PM10), nitrogen dioxide (NO2), carbon monoxide (CO), and lead (Pb). E&E is required to submit an annual air monitoring network plan to EPA’s Region 6 office in Dallas, Texas (EPA Region 6). Specifically, 40 CFR Part 58, Subpart B §58.10(a)(1) requires that:
… the State, or where applicable local, agency shall adopt and submit to the Regional Administrator an annual monitoring network plan which shall provide for the establishment and maintenance of an air quality surveillance system that consists of a network of SLAMS monitoring stations including FRM, FEM, and ARM monitors that are part of SLAMS, NCore stations, STN stations, State speciation stations, SPM stations, and/or, in serious, severe and extreme ozone nonattainment areas, PAMS stations, and SPM monitoring stations…
The Office of Air Quality (OAQ) within E&E’s Division of Environmental Quality (DEQ), in consultation with E&E’s Laboratory and Monitoring Services, has prepared this Arkansas Ambient Air Monitoring Network Annual Network Plan for 2021–2022 (Network Plan) for submission to EPA Region 6 by July 1, 2021. Consistent with federal regulations, OAQ is making this Network Plan available for public inspection for thirty days prior to submission to EPA Region 6. The Network Plan provides the framework for the establishment and maintenance of the statewide air quality surveillance (AQS) system. The Network Plan represents the E&E’s commitment to protect the health of the citizens of Arkansas through ambient air monitoring using the latest and best technology that is commercially available and to communicate the data collected to the public as quickly and accurately as possible. This Network Plan does not include any proposed modifications to Arkansas’s existing ambient air monitoring network.
II. The Arkansas Ambient Air Monitoring Network
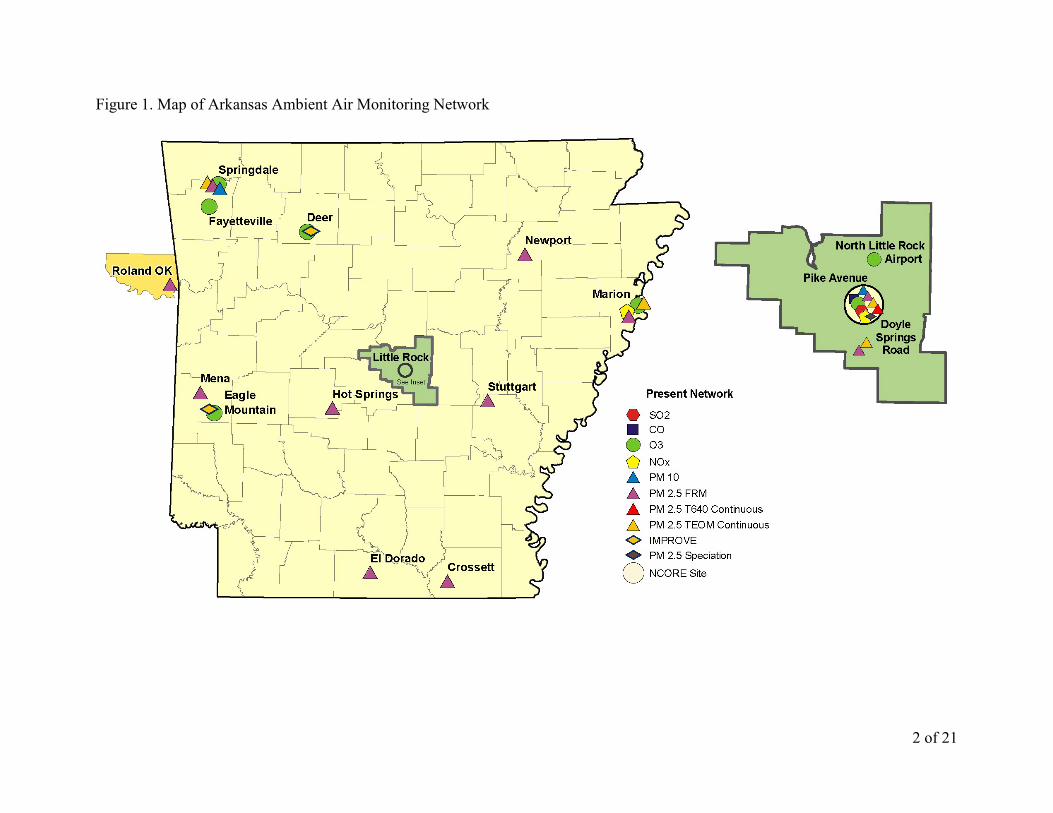
E&E operates numerous air monitors at various monitoring sites throughout the State of Arkansas as shown in Figure 1 and listed in Table 1. Each site has a unique AQS identification number. All monitors listed in Table 1 belong to the State and Local Air Monitoring System (SLAMS). E&E sites monitors according to federal requirements based on a number of factors including pollutant concentrations, population density in metropolitan statistical areas (MSAs) and core-based statistical areas (CBSAs), location of sources with significant emissions, and other factors.
2 of 21
Figure 1. Map of Arkansas Ambient Air Monitoring Network
3 of 21
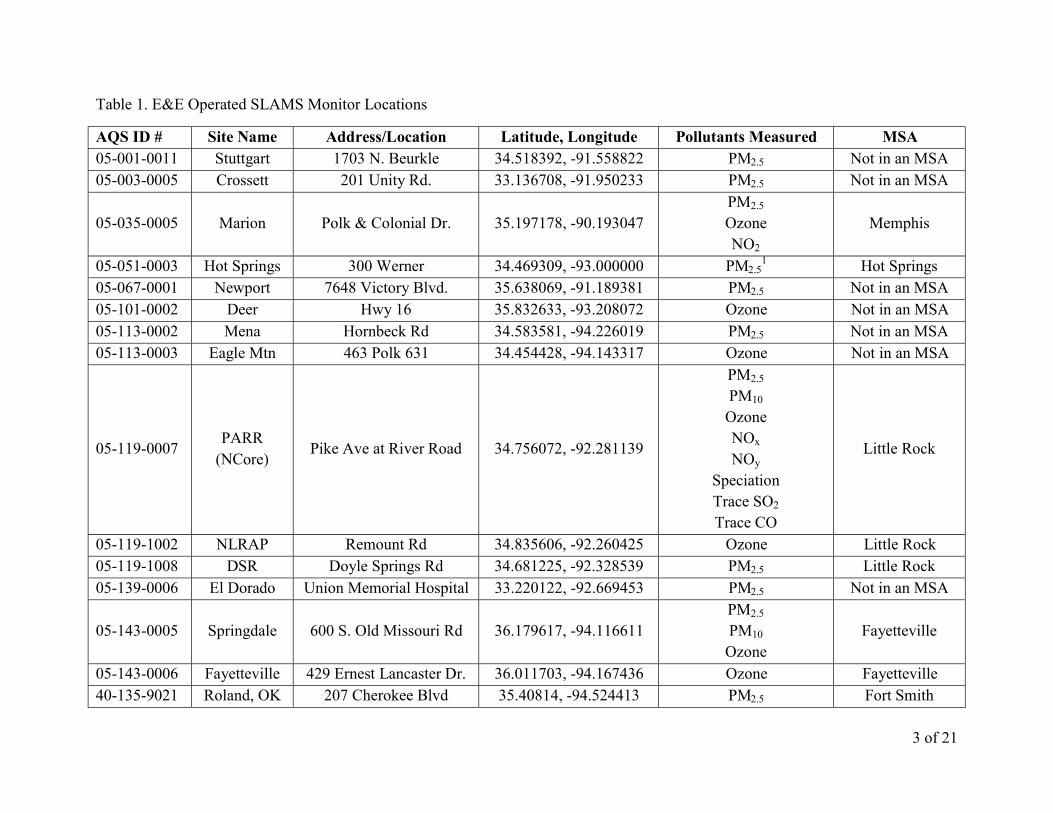
Table 1. E&E Operated SLAMS Monitor Locations
AQS ID # Site Name Address/Location Latitude, Longitude Pollutants Measured MSA 05-001-0011 Stuttgart 1703 N. Beurkle 34.518392, -91.558822 PM2.5 Not in an MSA 05-003-0005 Crossett 201 Unity Rd. 33.136708, -91.950233 PM2.5 Not in an MSA
05-035-0005 Marion Polk & Colonial Dr. 35.197178, -90.193047 PM2.5
Ozone NO2
Memphis
05-051-0003 Hot Springs 300 Werner 34.469309, -93.000000 PM2.51 Hot Springs
05-067-0001 Newport 7648 Victory Blvd. 35.638069, -91.189381 PM2.5 Not in an MSA 05-101-0002 Deer Hwy 16 35.832633, -93.208072 Ozone Not in an MSA 05-113-0002 Mena Hornbeck Rd 34.583581, -94.226019 PM2.5 Not in an MSA 05-113-0003 Eagle Mtn 463 Polk 631 34.454428, -94.143317 Ozone Not in an MSA
05-119-0007 PARR
(NCore) Pike Ave at River Road 34.756072, -92.281139
PM2.5
PM10
Ozone NOx NOy
Speciation Trace SO2 Trace CO
Little Rock
05-119-1002 NLRAP Remount Rd 34.835606, -92.260425 Ozone Little Rock 05-119-1008 DSR Doyle Springs Rd 34.681225, -92.328539 PM2.5 Little Rock 05-139-0006 El Dorado Union Memorial Hospital 33.220122, -92.669453 PM2.5 Not in an MSA
05-143-0005 Springdale 600 S. Old Missouri Rd 36.179617, -94.116611 PM2.5
PM10 Ozone
Fayetteville
05-143-0006 Fayetteville 429 Ernest Lancaster Dr. 36.011703, -94.167436 Ozone Fayetteville 40-135-9021 Roland, OK 207 Cherokee Blvd 35.40814, -94.524413 PM2.5 Fort Smith
4 of 21
Table 2. U.S. Census Bureau Population Statistics for MSAs in Arkansas MSA 2010 Census 2019 Estimates Fayetteville-Springdale-Rogers, AR-MO 440,121 536,120 Fort Smith, AR-OK 247,758 249,152 Hot Springs, AR 96,024 99,386 Jonesboro, AR 121,026 133,860 Little Rock-North Little Rock-Conway, AR 699,757 744,483 Memphis, TN-MS-AR 1,316,100 1,344,910 Pine Bluff, AR 100,258 89,437 Texarkana, TX-AR 149,198 149,308
E&E maintains its ambient air monitoring network in accordance with the quality assurance requirements of 40 CFR Part 58, App. A, designs its network in accordance with App. D, and locates its sites to meet all requirements of App. A, D, and E. The operation of each monitor meets the requirements of 40 CFR Part 58 Appendices B and C, where applicable. Laboratory and Monitoring Services operates and maintains the monitors. Laboratory and Monitoring Services enters data from these monitoring sites into the national Air Quality Systems (AQS) database. This data is made available to the public within ninety days following the end of each calendar quarter. Table 3 details the methods, operating schedule, and objectives of each SLAMS monitor.
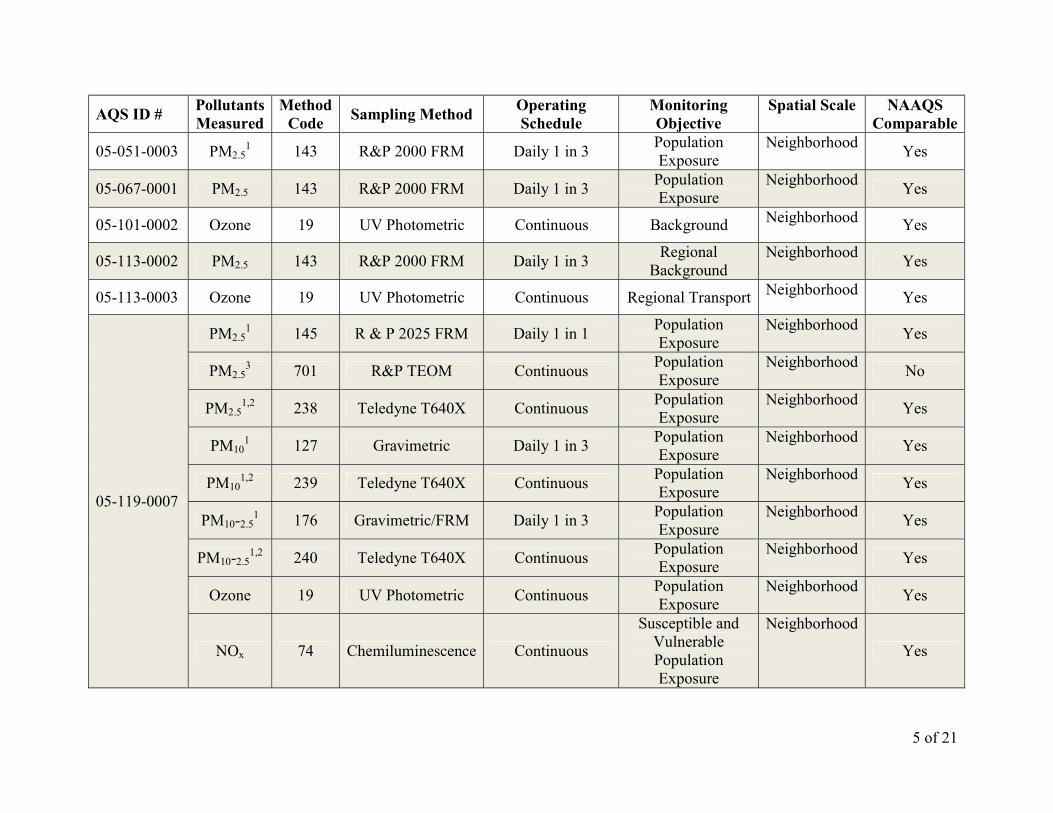
Table 3. E&E Operated SLAMS Methods and Operation
AQS ID # Pollutants Measured
Method Code
Sampling Method Operating Schedule
Monitoring Objective
Spatial Scale NAAQS Comparable
05-001-0011 PM2.5 143 R&P 2000 FRM Daily 1 in 3 Population Exposure
Neighborhood Yes
05-003-0005 PM2.5 143 R&P 2000 FRM Daily 1 in 3 Population Exposure
Neighborhood Yes
05-035-0005
PM2.5 143 R&P 2000 FRM Daily 1 in 3 Population Exposure
Neighborhood Yes
PM2.5 701 R&P TEOM Continuous Population Exposure
Neighborhood No
Ozone 19 UV Photometric Continuous Population Exposure
Neighborhood Yes
NO2 35 Chemiluminescence Continuous Population Exposure
Neighborhood Yes
5 of 21
AQS ID # Pollutants Measured
Method Code
Sampling Method Operating Schedule
Monitoring Objective
Spatial Scale NAAQS Comparable
05-051-0003 PM2.51 143 R&P 2000 FRM Daily 1 in 3
Population Exposure
Neighborhood Yes
05-067-0001 PM2.5 143 R&P 2000 FRM Daily 1 in 3 Population Exposure
05-113-0003 Ozone 19 UV Photometric Continuous Regional Transport Neighborhood Yes
05-119-0007
PM2.51 145 R & P 2025 FRM Daily 1 in 1
Population Exposure
Neighborhood Yes
PM2.53 701 R&P TEOM Continuous
Population Exposure
Neighborhood No
PM2.51,2 238 Teledyne T640X Continuous
Population Exposure
Neighborhood Yes
PM101 127 Gravimetric Daily 1 in 3
Population Exposure
Neighborhood Yes
PM101,2 239 Teledyne T640X Continuous
Population Exposure
Neighborhood Yes
PM10-2.51 176 Gravimetric/FRM Daily 1 in 3
Population Exposure
Neighborhood Yes
PM10-2.51,2 240 Teledyne T640X Continuous
Population Exposure
Neighborhood Yes
Ozone 19 UV Photometric Continuous Population Exposure
Neighborhood Yes
NOx 74 Chemiluminescence Continuous
Susceptible and Vulnerable Population Exposure
Neighborhood
Yes
6 of 21
AQS ID # Pollutants Measured
Method Code
Sampling Method Operating Schedule
Monitoring Objective
Spatial Scale NAAQS Comparable
NOy 574 Chemiluminescence Continuous Population Exposure
Neighborhood No
Speciation 810 Low Volume Daily 1 in 3 Population Exposure
Neighborhood No
Trace SO2 560 Infrared Continuous Population Exposure
Neighborhood Yes
Trace CO 554 Infrared Continuous Population Exposure
Neighborhood Yes
05-119-1002 Ozone 19 UV Photometric Continuous Population Exposure
Neighborhood Yes
05-119-1008 PM2.5 143 R&P 2025 FRM Daily 1 in 3
Population Exposure
Neighborhood Yes
PM2.5 701 R&P TEOM Continuous Population Exposure
Neighborhood No
05-139-0006 PM2.5 143 R&P 2000 FRM Daily 1 in 3 Population Exposure
Neighborhood Yes
05-143-0005
PM2.5 145 R&P 2025 FRM Continuous Population Exposure
Neighborhood No
PM2.5 701 R&P TEOM Daily 1 in 3 Population Exposure
Neighborhood Yes
PM10 127 Gravimetric Daily 1 in 6 Population Exposure
Neighborhood Yes
Ozone 19 UV Photometric Continuous Population Exposure
Neighborhood Yes
05-143-0006 Ozone 19 UV Photometric Continuous Population Exposure
Neighborhood Yes
40-135-9021 PM2.5 145 R&P 2025 FRM Daily 1 in 3 Population Exposure
Neighborhood Yes
1. Collocated Monitors 2.Teledyne T640X Began Operation at AQS 05-119-0007 on 1/1/2021 3. Discontinued operation of R&P TEOM at PARR on 3/31/21
7 of 21
A. Ozone Monitoring Network
Table D-2 of 40 CFR Part 58 Appendix D specifies the number of SLAMS ozone monitors required based on MSA population and the previous year’s design value (DV) for the area. Table 4 lists the most recent DV and sampling schedule for E&E operated monitors. DV values as a percent of an ozone NAAQS that are greater than or equal to 85% are bolded in Table 4. Table 5 lists populations the MSAs in Arkansas and the minimum number of monitors required in each MSA based on population and the most recent DV. OAQ is not proposing any changes to the ozone network in this Network Plan.
Table 5. Arkansas MSA Populations and Minimum Ozone Monitors Required in SLAMS Network
Metropolitan Statistical Area (MSA) 2019 Population
Estimates Monitors Required Fayetteville-Springdale-Rogers, AR-MO 536,120 2 Fort Smith, AR-OK 249,152 1 Hot Springs, AR 99,386 0 Jonesboro, AR 133,860 0 Little Rock-North Little Rock-Conway, AR 744,483 2
8 of 21
Metropolitan Statistical Area (MSA) 2019 Population
Estimates Monitors Required Memphis, TN-MS-AR 1,344,910 2 Pine Bluff, AR 89,437 0 Texarkana, TX-AR 149,308 0
Arkansas’s network meets or exceeds the minimum SLAMS ozone requirement for each MSA. The Little Rock MSA meets the required number and the Memphis MSA exceeds the minimum number of SLAMS monitors with five. E&E operates one of the five SLAMS ozone monitors in the Memphis MSA, with the other four operated by either Shelby County Health Department (SCHD) or Mississippi Department of Environmental Quality (MDEQ). The Fayetteville MSA has two monitors, which meets the requirement for the MSA. A monitor in Roland, OK operated by the Cherokee National satisfies ozone monitoring requirements for the Fort Smith MSA. There are two additional SLAMS ozone monitors in the rural areas of Deer and Eagle Mountain, which are used to enhance EPA’s AIRNOW ozone mapping program and to determine background and transport ozone.
In addition to the SLAMS network, EPA operates one ozone monitor (05-019-9991) as part of the Clean Air Status and Trends Network (CASTNET). This ozone monitor is compliant with the regulatory requirements in 40 CFR Parts 50, 53, and 58. Therefore, ozone measurements from this site are also used to determine if an area meets or exceeds the NAAQS. The 2018–2020 DV for this site is 0.056 ppm.
B. Particulate Matter Monitoring Network
1. Fine Particulate Matter (PM2.5) Network
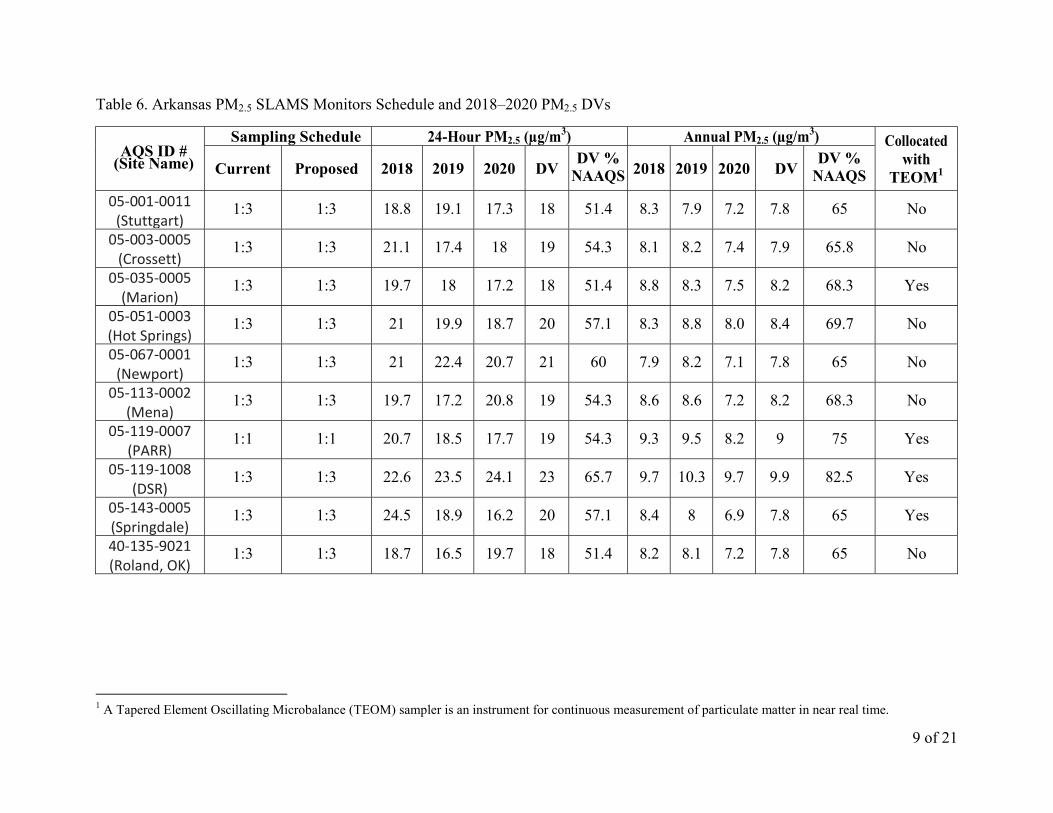
Table D-5 of 40 CFR Part 58 Appendix D specifies the number of SLAMS PM2.5 monitors required based on MSA population and the previous year’s DV. Table 6 lists the most recent area DV and sampling schedule for E&E operated monitors. There are no DV as a percent of any PM2.5 NAAQS values that are greater than or equal to 85%. Table 7 lists populations the MSAs in Arkansas and the minimum number of monitors required in each MSA based on population and the most recent DV. OAQ is not proposing any changes to the PM2.5 network in this Network Plan.
1 A Tapered Element Oscillating Microbalance (TEOM) sampler is an instrument for continuous measurement of particulate matter in near real time.
10 of 21
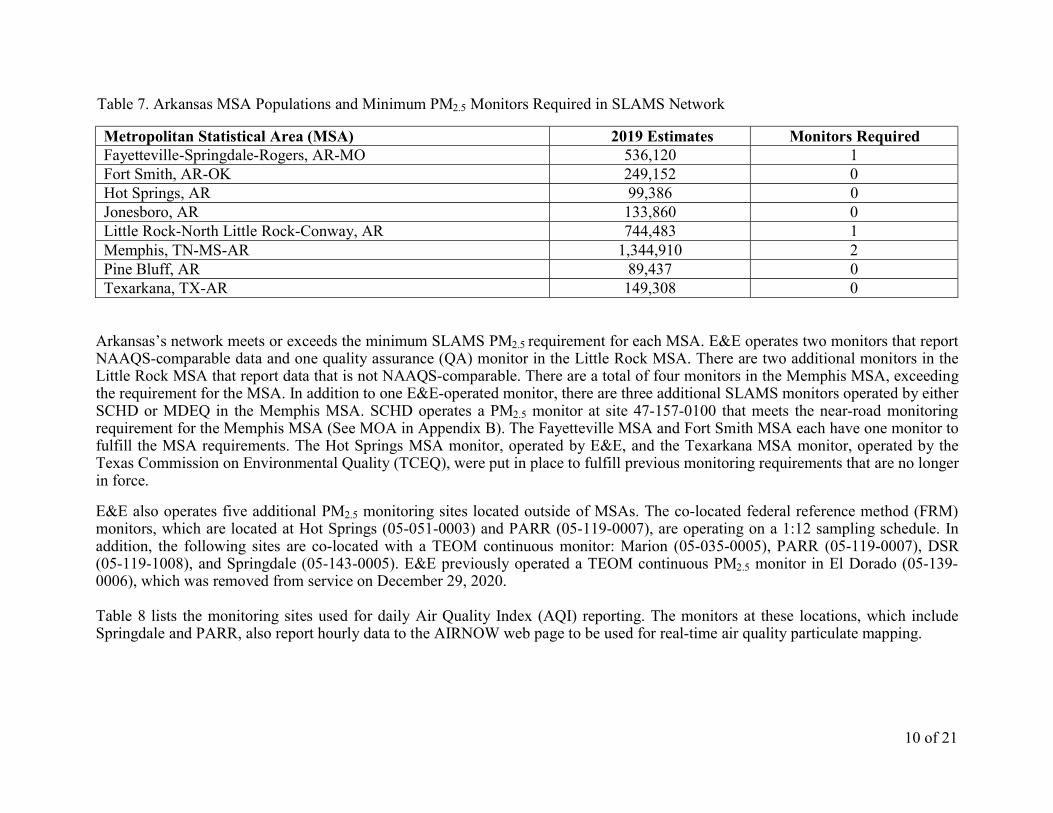
Table 7. Arkansas MSA Populations and Minimum PM2.5 Monitors Required in SLAMS Network
Metropolitan Statistical Area (MSA) 2019 Estimates Monitors Required Fayetteville-Springdale-Rogers, AR-MO 536,120 1 Fort Smith, AR-OK 249,152 0 Hot Springs, AR 99,386 0 Jonesboro, AR 133,860 0 Little Rock-North Little Rock-Conway, AR 744,483 1 Memphis, TN-MS-AR 1,344,910 2 Pine Bluff, AR 89,437 0 Texarkana, TX-AR 149,308 0
Arkansas’s network meets or exceeds the minimum SLAMS PM2.5 requirement for each MSA. E&E operates two monitors that report NAAQS-comparable data and one quality assurance (QA) monitor in the Little Rock MSA. There are two additional monitors in the Little Rock MSA that report data that is not NAAQS-comparable. There are a total of four monitors in the Memphis MSA, exceeding the requirement for the MSA. In addition to one E&E-operated monitor, there are three additional SLAMS monitors operated by either SCHD or MDEQ in the Memphis MSA. SCHD operates a PM2.5 monitor at site 47-157-0100 that meets the near-road monitoring requirement for the Memphis MSA (See MOA in Appendix B). The Fayetteville MSA and Fort Smith MSA each have one monitor to fulfill the MSA requirements. The Hot Springs MSA monitor, operated by E&E, and the Texarkana MSA monitor, operated by the Texas Commission on Environmental Quality (TCEQ), were put in place to fulfill previous monitoring requirements that are no longer in force.
E&E also operates five additional PM2.5 monitoring sites located outside of MSAs. The co-located federal reference method (FRM) monitors, which are located at Hot Springs (05-051-0003) and PARR (05-119-0007), are operating on a 1:12 sampling schedule. In addition, the following sites are co-located with a TEOM continuous monitor: Marion (05-035-0005), PARR (05-119-0007), DSR (05-119-1008), and Springdale (05-143-0005). E&E previously operated a TEOM continuous PM2.5 monitor in El Dorado (05-139-0006), which was removed from service on December 29, 2020. Table 8 lists the monitoring sites used for daily Air Quality Index (AQI) reporting. The monitors at these locations, which include Springdale and PARR, also report hourly data to the AIRNOW web page to be used for real-time air quality particulate mapping.
11 of 21
Table 8. Continuous PM2.5 AQI Monitoring Site Information
AQS ID # Site Name Sampling Frequency 05-143-0005 Springdale Hourly 05-119-0007 PARR Hourly
E&E began operation of two Teledyne T640X NAAQS-comparable continuous PM2.5 samplers at PARR (05-119-0007) on 1/1/21. EPA was notified by letter on 9/18/20. With EPA approval, E&E ceased operation of the TEOM continuous PM2.5 at PARR (05-119-0007) on 3/31/21 due to the addition of the Teledyne T640X samplers.
2. Coarse Particulate Matter (PM10) Network
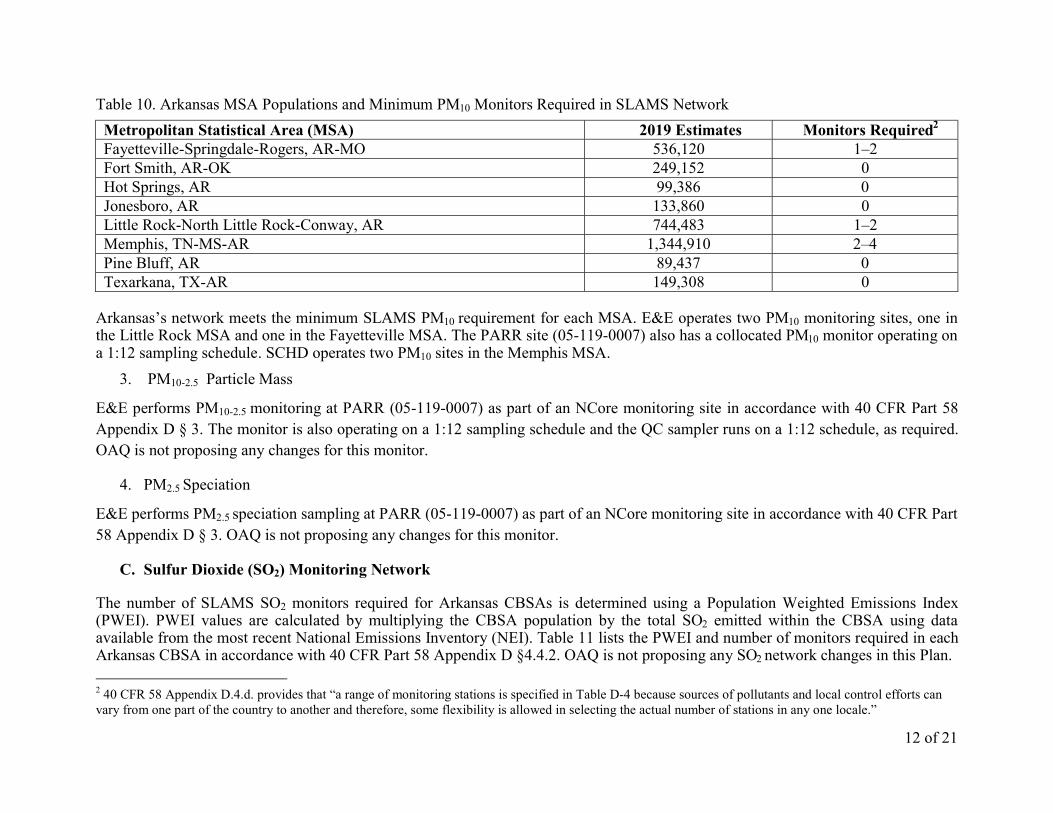
Table D-4 of 40 CFR Part 58 Appendix D specifies the number of SLAMS PM10 monitors required based on MSA population and the recent concentrations for the area. Table 9 lists the most recent three-year average and sampling schedule for E&E operated monitors. E&E’s monitors fall within the low-concentration category (ambient concentrations less than 80% of the PM10 NAAQS) based on recent three-year averages as a percentage of the NAAQS. Table 10 lists populations the MSAs in Arkansas and the minimum number of monitors required in each MSA based on population in areas with low ambient concentrations of PM10. OAQ is not proposing any changes to the PM10 network in this Network Plan. E&E replaces older equipment when software is no longer supported by the vendor.
Table 9. Arkansas PM10 SLAMS Monitors Schedule and 2018–2020 PM10 Three-Year Average
Table 10. Arkansas MSA Populations and Minimum PM10 Monitors Required in SLAMS Network
Metropolitan Statistical Area (MSA) 2019 Estimates Monitors Required2 Fayetteville-Springdale-Rogers, AR-MO 536,120 1–2 Fort Smith, AR-OK 249,152 0 Hot Springs, AR 99,386 0 Jonesboro, AR 133,860 0 Little Rock-North Little Rock-Conway, AR 744,483 1–2 Memphis, TN-MS-AR 1,344,910 2–4 Pine Bluff, AR 89,437 0 Texarkana, TX-AR 149,308 0
Arkansas’s network meets the minimum SLAMS PM10 requirement for each MSA. E&E operates two PM10 monitoring sites, one in the Little Rock MSA and one in the Fayetteville MSA. The PARR site (05-119-0007) also has a collocated PM10 monitor operating on a 1:12 sampling schedule. SCHD operates two PM10 sites in the Memphis MSA.
3. PM10-2.5 Particle Mass
E&E performs PM10-2.5 monitoring at PARR (05-119-0007) as part of an NCore monitoring site in accordance with 40 CFR Part 58 Appendix D § 3. The monitor is also operating on a 1:12 sampling schedule and the QC sampler runs on a 1:12 schedule, as required. OAQ is not proposing any changes for this monitor.
4. PM2.5 Speciation
E&E performs PM2.5 speciation sampling at PARR (05-119-0007) as part of an NCore monitoring site in accordance with 40 CFR Part 58 Appendix D § 3. OAQ is not proposing any changes for this monitor.
C. Sulfur Dioxide (SO2) Monitoring Network
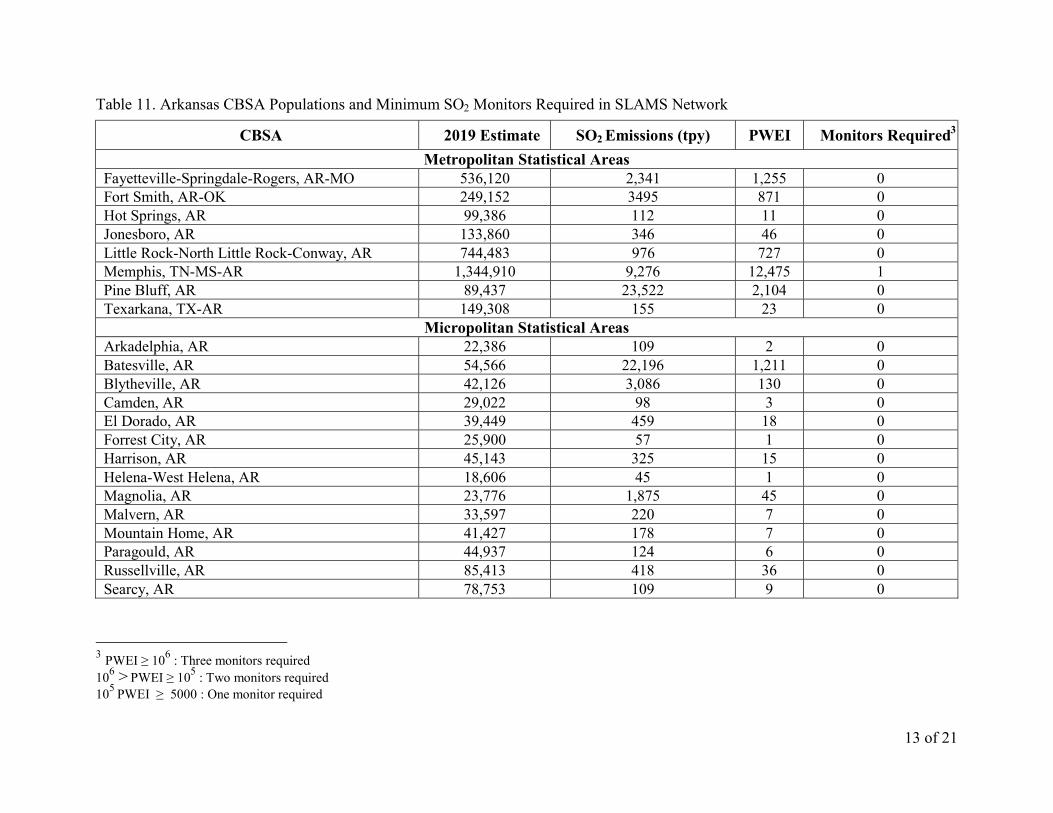
The number of SLAMS SO2 monitors required for Arkansas CBSAs is determined using a Population Weighted Emissions Index (PWEI). PWEI values are calculated by multiplying the CBSA population by the total SO2 emitted within the CBSA using data available from the most recent National Emissions Inventory (NEI). Table 11 lists the PWEI and number of monitors required in each Arkansas CBSA in accordance with 40 CFR Part 58 Appendix D §4.4.2. OAQ is not proposing any SO2 network changes in this Plan.
2 40 CFR 58 Appendix D.4.d. provides that “a range of monitoring stations is specified in Table D-4 because sources of pollutants and local control efforts can vary from one part of the country to another and therefore, some flexibility is allowed in selecting the actual number of stations in any one locale.”
13 of 21
Table 11. Arkansas CBSA Populations and Minimum SO2 Monitors Required in SLAMS Network
Metropolitan Statistical Areas Fayetteville-Springdale-Rogers, AR-MO 536,120 2,341 1,255 0 Fort Smith, AR-OK 249,152 3495 871 0 Hot Springs, AR 99,386 112 11 0 Jonesboro, AR 133,860 346 46 0 Little Rock-North Little Rock-Conway, AR 744,483 976 727 0 Memphis, TN-MS-AR 1,344,910 9,276 12,475 1 Pine Bluff, AR 89,437 23,522 2,104 0 Texarkana, TX-AR 149,308 155 23 0
Micropolitan Statistical Areas Arkadelphia, AR 22,386 109 2 0 Batesville, AR 54,566 22,196 1,211 0 Blytheville, AR 42,126 3,086 130 0 Camden, AR 29,022 98 3 0 El Dorado, AR 39,449 459 18 0 Forrest City, AR 25,900 57 1 0 Harrison, AR 45,143 325 15 0 Helena-West Helena, AR 18,606 45 1 0 Magnolia, AR 23,776 1,875 45 0 Malvern, AR 33,597 220 7 0 Mountain Home, AR 41,427 178 7 0 Paragould, AR 44,937 124 6 0 Russellville, AR 85,413 418 36 0 Searcy, AR 78,753 109 9 0
3 PWEI ≥ 106 : Three monitors required 106 > PWEI ≥ 105 : Two monitors required 105 PWEI ≥ 5000 : One monitor required
14 of 21
Arkansas’s network meets or exceeds the minimum SLAMS SO2 requirement for each CBSA. SCHD operates an SO2 monitor in the Memphis CBSA. E&E operates one trace SO2 monitor at PARR (05-119-0007) as part of an NCore monitoring site in accordance with 40 CFR Part 58 Appendix D § 3.
In addition to the population-based monitoring location, E&E also uses modeling data to characterize air quality in counties with facilities that emit greater than 2000 tons per year (tpy) SO2, in accordance with the SO2 Data Requirements Rule at 40 CFR Part 51 Subpart BB. Table 12 lists facilities emitting greater than or equal to 2000 tpy SO2 in Arkansas. Figure 2 provides the location of these facilities relative to the trace SO2 monitor located at PARR (05-119-0007).
Table 12. Facilities Emitting Greater Than 2000 tpy SO24
FIPS Code5 County Facility Name SO2 (tpy) Latitude Longitude 0506900110 Jefferson Entergy Arkansas, Inc.– White Bluff 34,222.6 34.4236 -92.1392
0506300042 Independence Entergy Arkansas, Inc. – Independence 30,028.9 35.6739 -91.4065
4 Emissions data obtained from 2017 NEI 5 Facility-specific Federal Information Processing Standards (FIPS) Code
15 of 21
Figure 2. Relative Location of Facilities Emitting Greater than or Equal to 2000 TPY SO2
None of the facilities listed in Table 12 are within the spatial scale covered by current SO2 monitor. Therefore, modeling was performed for each county with a listed facility. On April 26, 2018, E&E submitted to the EPA a refined modeling simulation and an “Unclassifiable” to “Attainment/ Unclassifiable” re-designation request for Independence County. On March 13, 2019, EPA reclassified Independence County to “Attainment/Unclassifiable” for the 2015 SO2 NAAQS. In addition, a copy of the Entergy – White Bluff Ongoing Data Requirements (40 CFR § 51.1205) Annual Emissions Update Information is attached as Appendix A.
D. Nitrogen Dioxide (NO2) Monitoring Network
40 CFR Part 58 Appendix D § 4.3 requires SLAMS networks to meet requirements for near-road NO2 monitoring, area-wide NO2 monitoring, and any additional monitoring required by the EPA Regional Administrator. Each CBSA with a population of one million
16 of 21
or more persons must have a microscale near-road NO2 monitoring station. Each CBSA with a population of one million or more persons must have an area-wide NO2 monitor. In addition, Regional Administrators may require NO2 monitors above and beyond minimum network requirements.
E&E operates NO2 monitors at two sites in Arkansas: PARR (05-119-007) and Marion (05-035-0005). The Marion monitor (05-035-0005) serves as an area-wide NO2 monitor for the Memphis CBSA, which is the only CBSA located partially in Arkansas with more than a million people. SCHD operates a near-road NO2 monitor (47-157-0100) in the Memphis CBSA required under 40 CFR Part 58, Appendix D § 4.3.2. The PARR site serves as one of the minimum of forty additional NO2 monitoring stations nationwide required by Regional Administrators for areas with susceptible and vulnerable populations under 40 CFR Part 58, Appendix D § 4.3.4.
E&E performs NO/NO2 monitoring at PARR (05-119-0007) as part of an NCore monitoring site in accordance with 40 CFR Part 58 Appendix D § 3. These measurements produce conservative estimates for NO2 consistent with the requirements of 40 CFR Part 58, Appendix D § 4.3.6.
OAQ is not proposing any changes for the NO2 monitoring network.
E. Carbon Monoxide (CO) Monitoring Network
40 CFR Part 58 Appendix D § 4.2 requires a minimum of one CO monitor co-located with a near-road NO2 monitor in CBSAs have a population of 1,000,000 or more persons. The Regional Administrator may require additional monitoring.
SCHD operates a CO monitor collocated with near-road NO2 monitor (47-157-0100) in the Memphis CBSA, which is the only CBSA located partially in Arkansas with more than a million people. This monitor satisfies the minimum required CO monitors.
E&E operates a Trace CO monitor at PARR (05-119-0007) as part of an NCore monitoring site in accordance with 40 CFR Part 58 Appendix D § 3. OAQ is not proposing any changes for the NO2 monitoring network.
F. Lead (Pb) Network
40 CFR Part 58 Appendix D § 4.5 requires source-oriented monitoring near Pb sources that are expected to or have been shown to contribute to a maximum lead concentration in ambient air in excess of the NAAQS. Specifically, there must be a source-oriented SLAMS site located to measure the maximum Pb concentration in ambient air resulting from each non-airport Pb source that emits 0.5
17 of 21
tpy or more and from each airport that emits 1.0 tpy based on the most recent NEI or other scientifically justifiable methods and data. EPA may waive source-oriented monitoring requirements if the State can demonstrate that the source will not contribute to a maximum Pb concentration in ambient air in excess of 50% of the NAAQS. These waivers must be renewed once every five years in accordance with 40 CFR Part 58.10(d).
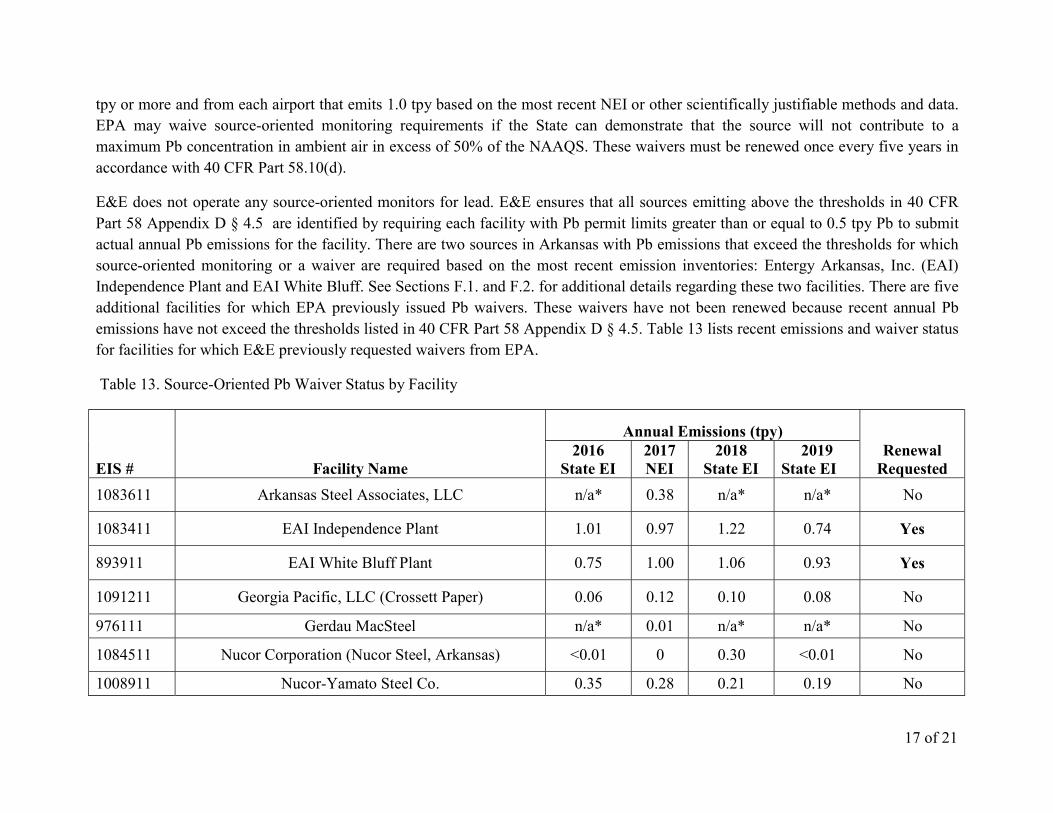
E&E does not operate any source-oriented monitors for lead. E&E ensures that all sources emitting above the thresholds in 40 CFR Part 58 Appendix D § 4.5 are identified by requiring each facility with Pb permit limits greater than or equal to 0.5 tpy Pb to submit actual annual Pb emissions for the facility. There are two sources in Arkansas with Pb emissions that exceed the thresholds for which source-oriented monitoring or a waiver are required based on the most recent emission inventories: Entergy Arkansas, Inc. (EAI) Independence Plant and EAI White Bluff. See Sections F.1. and F.2. for additional details regarding these two facilities. There are five additional facilities for which EPA previously issued Pb waivers. These waivers have not been renewed because recent annual Pb emissions have not exceed the thresholds listed in 40 CFR Part 58 Appendix D § 4.5. Table 13 lists recent emissions and waiver status for facilities for which E&E previously requested waivers from EPA.
Table 13. Source-Oriented Pb Waiver Status by Facility
EIS # Facility Name
Annual Emissions (tpy) Renewal
Requested 2016
State EI 2017 NEI
2018 State EI
2019 State EI
1083611 Arkansas Steel Associates, LLC n/a* 0.38 n/a* n/a* No
1008911 Nucor-Yamato Steel Co. 0.35 0.28 0.21 0.19 No
18 of 21
E&E previously operated a Pb sampler at PARR (05-119-0007) as part of an NCore monitoring site. However, E&E discontinued Pb monitoring after meeting the three-year data collection requirements and obtaining EPA approval in 2016 consistent with revised network design criteria for non-source oriented lead monitoring (81 FR 17247).
1. EAI Independence Plant
EPA approved a lead waiver for EAI Independence on January 20, 2011. This approval was based on AERMOD modeling results that indicated that Independence’s 2008 emissions of 1.42 tpy would result in a maximum three-month average concentration level of 0.03 micrograms per cubic meter (µg/m3), which is 20% of the Pb NAAQS. Pb emissions from Independence have decreased since the 2008 emissions used in the modeling. See Figure 3. Therefore, E&E requested renewal of the waiver in 2015 and again in 2020 as part of E&E’s Five Year Network Assessments submitted to EPA. EPA granted the 2015 renewal request in a letter dated November 16, 2015. As of the writing of this Network Plan, EPA has not yet acted upon E&E’s 2020 request to renew the waiver for Independence.
19 of 21
Figure 3. 2008–2019 Pb Emissions from EAI Independence6
1. EAI White Bluff
EPA approved a lead waiver for EAI White Bluff on January 20, 2011. This approval was based on AERMOD modeling results that indicated that White Bluff’s 2008 emissions of 1.43 tpy would result in a maximum three-month average concentration level of <0.01 µg/m3. Pb emissions from White Bluff have decreased since the 2008 emissions used in the modeling. See Figure 4. Therefore, E&E
6 Data Source: 2008 NEI, 2011 NEI, 2012 State EI, 2013 State EI, 2014 NEI, 2015 State EI, 2016 State EI, 2017 NEI, 2018 State EI, 2019 State EI
0.6
0.7
0.8
0.9
1
1.1
1.2
1.3
1.4
1.5
2008 2011 2012 2013 2014 2015 2016 2017 2018 2019
Lead
Em
issi
ons (
tpy)
20 of 21
requested renewal of the waiver in 2015 and again in 2020 as part of Five Year Network Assessments that E&E submitted to EPA. EPA granted the 2015 renewal request in a letter dated November 16, 2015. As of the writing of this Network Plan, EPA has not yet acted upon E&E’s 2020 request to renew the waiver for Independence.
Figure 4. 2008–2019 Pb Emissions from EAI White Bluff7
7 Data Source: 2008 NEI, 2011 NEI, 2012 State EI, 2013 State EI, 2014 NEI, 2015 State EI, 2016 State EI, 2017 NEI, 2018 State EI, 2019 State EI
0.6
0.7
0.8
0.9
1
1.1
1.2
1.3
1.4
1.5
2008 2011 2012 2013 2014 2015 2016 2017 2018 2019
Lead
Em
issi
ons (
tpy)
21 of 21
III. Contact Information
Questions concerning Pb emissions and Pb waivers and the Ongoing Data Requirement Annual Updated SO2 Emissions Information should be sent to:
Michael Day – Office of Air Quality Arkansas Department of Energy and Environment Division of Environmental Quality 5301 Northshore Dr. North Little Rock, AR 72118 501-682-0832 [email protected] Any other comments or questions should be sent to:
Shaun Kitchens - Air Lab Arkansas Department of Energy and Environment Laboratory and Monitoring Services 5301 Northshore Dr. North Little Rock, AR 72118 501-682-0924 [email protected]
Appendix A. Entergy Arkansas, Inc. White Bluff- Ongoing Data Requirement for Annual Updated SO2 Emissions Information
DE PAi
o
4^ro
AR KAN SA5EN ERGY & ENVIRONMENT
June ll,202l
Mr. David F. Garcia, P.E.
Director, Air and Radiation DivisionU.S. Environmental Protection Agency, Region 6
1201 Elm Street, Suite 500
Dallas, Texas 7 521 0-2102
Re: 2010 SO2 NAAQS Ongoing Data Requirements Annual Updated Emissions Information and
Further Modeling Recommendation - Entergy Arkansas, Inc. White Bluff Steam Electric Station
Dear Mr. Garcia
A comparison, per 40 CFR 51.1205(b)(1), of the annual SO2 actual emissions included in the
August 2015 modeling analysis (2012-2014) for the Entergy Arkansas, Inc. White Bluff Steam
Electric Station (hereafter, White Bluff Station) and the six years of data (2015-2020) since thisAugust 2015 modeling analysis indicate that SOz emissions at the White Bluff Station for theyears following the August 2015 modeling analysis are lower than those included in the 2015
modeling analysis. Therefore, the Arkansas Department of Energy and Environment, Division ofEnvironmental Quality (DEQ) recommends to the U.S. Environmental Protection Agency (EPA)that no additional modeling analysis is needed at this time and that Jefferson County, ARremains "Attainment/Unclassifiable" for the 2010 SO2 NAAQS.
As background, on June 3, 2010, the EPA revised the 2010 one-hour sulfur dioxide (SOtPrimary National Ambient Air Quality Standard (NAAQS) by establishing a new one-hourstandard at a level of 75 parts per billion (equivalent to 196.5 pglm3). On August 21,2015 theEPA issued its SOz Data Requirements Rule (SO2 DRR), which required characteization of airquality based on modeling or actual monitoring for categories of sources based on annual SO2
emission rates. For areas that were characterized using air quality modeling, the Ongoing DataRequirements in 40 C.F.R. $ 51.1205(b)(1) apply when the modeling was based on actualemissions. In such cases, the air agency will be required to submit an annual report to the EPAproviding updated emissions information and recommending to the EPA whether furthermodeling is warranted to assess any expected changes in recent air quality.
On September 11, 2015, the ADEQ submitted to the EPA an SOz air dispersion modelinganalysis (August 2015 modeling analysis) using actual emissions for the Entergy Arkansas, Inc.White Bluff Steam Electric Station (White Bluff Station) located in Jefferson County, AR. The
Page 1 of4
August 2015 modeling analysis reported that the maximum model-predicted impact of 162.4
Vg/m3 was below the 2010 l-hour SOz NAAQS of 196.5 pg/m3. Therefore, ADEQrecommended to the EPA a designation of "Attainment/Unclassifiable" (meeting the SO2
NAAQS requirements) for Jefferson County. On July 12,2016 (FR Vol. 81, No. 133, 45039)EPA concurred with the ADEQ recommendation and published the Final Rule: Air QualityDesignations for the 2010 Sulfur Dioxide (SO) Primary National Ambient Air QualityStandard-Round 2, that designated Jefferson County, AR as having a designation of"Attainment/Unclassifi able".
For the August 2015 White Bluff Station 1-hour SO2 NAAQS modeling analysis, all five sources
of SOz at the White Bluff Station were included in the modeling analysis (Table 1) and actual
emission data for the years 2012-2014 were used. Because actual emissions data were used in the
August 2015 modeling analysis, ADEQ is subject to the annual follow-up analysis described in40 c.F.R. $s 1.120s(bx1).
Table 1: White Bluff Station SOz SourcesSource Descrintion Source IDUnit No. 1 Boiler SN-O1
Unit No. 2 Boiler SN.O2Auxiliary Boiler SN-O5Emergency Diesel Generator SN-21Emergency Fire Pump Engine SN-22
The requirements of 40 C.F.R. $51.1205(b)(1) entail ADEQ submitting an annual assessment tothe EPA by July 1 of each year that provides updated actual emissions information and
recommends whether further modeling is warranted to assess any expected changes in recent airquality:
S 51.1205 Ongoing data requirements.
ft) Modeled areas. For any area where modeling of actual SOz emissions serve as the
basis for designating suclt area as attainment for the 2010 SO2 NAAQS, the air agency
shall submit an annual report to the EPA Regional Administrator by JuIy I of each year,
either as a stand-alone document made available for public inspection, or as an appendixto its Annual Monitoring Network Plan (also due on July I each year under 40 CFR
58.10), that documents the qnnual SO2 emissions of each applicable source in each such
area and provides an assessment of the cause of any emissions increase from theprevious year. The first report for each such area is due by July I of the calendar yearafter the effective date of the aree's initial designation.(I) The air agency shall include in such report q recommendation regarding whetheradditional modeling is needed to characterize air quality in any area to determinewhether the area meets or does not meet the 2010 SO2 NAAQS. The EPA RegionalAdministrator will consider the emissions report and air agency recommendation, and
Page 2 of 4
may require that the air agency conduct updated air quality modeling for the area andsubmit it to the EPA within l2 months.
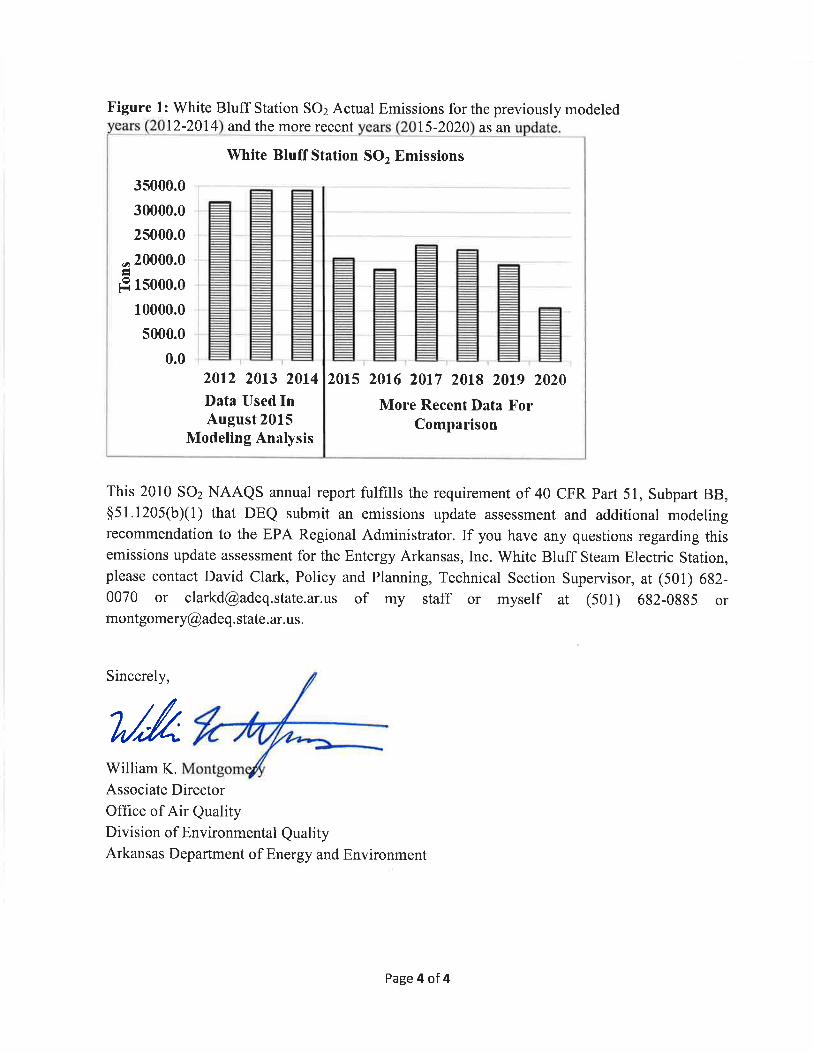
A current assessment of the annual SO2 actual emissions for the three years (2012-2014)included in the August 2015 modeling analysis and the six years subsequent to the August 2015modeling analysis (2015-2020) indicate that SOz emissions at the White Bluff Station for theyears following the 2015 modeling analysis are lower than the levels included in the 2015modeling analysis (Table 2 and Figure l). As a result of this decrease in annual SO2 actualemissions at the White Bluff Station, ADEQ recommends to the EPA that no additionalmodeling is needed at this time to evaluate the SOz emissions from the White Bluff Station andthat Jefferson County, AR remains "Attainment/Unclassifiable" for the 2010 SO2 NAAQS.
Table 2: White Bluff Station SOz Actual Emissions for the previously modeled years (2012-2014 and the more recent l5-202 as an
Emissions from Electrical Generating Units (Unit No. 1 and Unit No. 2 Boilers) as measured by the facility Continuous
^ Emission Monitoring System (CEMS) and reported to the EPA Clean Air Markets Division (CAMD).
'Emissions from Auxiliary Boiler calculated on actual annual fuel oil usage and measured fuel oil sulfur content.'Emissions from Emergency Diesel Generator and Emergency Diesel Fire Pump calculated based on actual annual hours ofoperation and EPA AP-42 emissions factors.
Most RecentData Available 2020 6,255.0 4,456.0 0.08s 0.0020 0.0027 10,711.1
Page 3 of 4
White Bluff Station SO" Emissions
35000.0
30000.0
25000.0
20000.0
15000.0
r0000.0
5000.0
0.024fi 2A16 zufi 2A'8 2At9 2A2A
O
F
2At2 2A13 2014
Data Llsecl InAugust 2015
Modeling Analysis
More Recent Data ForComparison
Figure 1: White Bluff Station SO2 Actual Emissions for the previously modeledt2-2014 and the more recent t5-2020 as an
This 2010 SO2 NAAQS annual report fulfills the requirement of 40 CFR Part 51, Subpart BB,$51.1205(b)(1) that DEQ submit an emissions update assessment and additional modelingrecommendation to the EPA Regional Administrator. If you have any questions regarding thisemissions update assessment for the Entergy Arkansas, Inc. White Bluff Steam Electric Station,please contact David Clark, Policy and Planning, Technical Section Supervisor, at (501) 682-0070 or [email protected] of my staff or myself at (501) 682-0885 ormontgomery@adeq. state. ar. us.
Sincerely,
MhWilliam K.Associate DirectorOffice of Air QualityDivision of Environmental QualityArkansas Department of Energy and Environment
Page 4 of 4
Appendix B. 2020 Update to May/June 2008 Memorandum of Agreement between SCHD, MDEQ and ADEQ concerning air quality monitoring requirements for the Memphis MSA
SHELBY COUNTYHEALTH DEPARTMENT
tEE HARRIS
MAYOR
Robert Rogers, P.E.
ALTSA R. HAUSHALTER, DNP, RN, PHNA.BCURECTOR
BRUCE RANDOIPH, MD, MPHHEATTH OFFICER
hrbllc
April 1sth,2020
Ms. Michelle Walker Owenby, Air DirectorTennessee Department of Environment and ConservationAir Pollution Control DivisionWilliam R. Snodgrass Tennessee Tower312 Rosa L. Parks Ave., 1Sth FloorNashville, TN 37243-1S31
Mr. Chad LaFontaine, Air DirectorMississippi Department of Environmental eualityOffice of Pollution Control, Air DivisionP.O. Box 2261Jackson, MS 39201
Mr. William K. Montgomery, lnterim Associate DirectorArkansas Department of Environmental eualityOffice of Air Quality5301 Northshore Dr.North Little Rock, AR 72118-5J17
Dear All,
ln accordance with the provisions of the Memorandum of Agreement (MOA) signed in May and June of2008 between the Shelby County Health Department (SCHD), Mississippi Department ofEnvironmental Quality (MDEO) and the Arkansas Department of Environrnental euality (ADEe), thisletter serves as a notification that no changes have been made in our current network.
If your agencies do not have current changes to the Network or may be contemplating changes in thenear future, please notify the respective agencies of your intentions.
lf you have any questions, please call me at (g01) 222-g1gg,
Sincerely,
2T *-*
/ Technical ManagerPollution Control SectionShelby County Health Department
MissionTo o protect and the health and environment aII Coun residents.
814 f efferson Avenue0 Mem phis, TN 38105 901 222-9000 www.shelbytnhealth.com
MEMORANDUM OF AGREEMENTON AIR QUALITY MONITORING FOR CRITERIA
POLLUTANTS FORTHE MEMPHIS, TN. MS- AR
METROPOLTTAN STATISTTCAL AREA (MSA)
Participating Agencies
Shelby County Health Department (SCHD)Air Pollution Control Program
Mississlppi Department of Environmental euarity (MDEo)Office of Pollution Control, Air Division
Arkansas Department of Environmentat euality (ADEO)
PURPOSE / OBJECTIVE / GOALS
The purpose of this Memorandum of Agreement (MOA) is to inform the entities of theMemphis, Tennessee-Mississippi-Arkansas Metropolitan StatisticalArea of monitoringletwo{ changes. The MOA between SCHD, MDEQ, and ADEQ is to collectively meltUnited States Environmental Protection Agency (EpA) minimum monitoringrequirements for particles of an aerodynamic diameter of 10 micrometers ind less(PMro), particles of an aerodynamic diameter of 2.5 micrometers and less (PM2.5), andozone; as well as other criteria pollutants air quality monitoring deemed necessary tomeet the needs of the MSA as determined reasonable by all farties. This MOA willformalize and reaffirm the collective agreement in order io provide adequate criteriapollutant monitoring for the Memphis, TN-MS-AR MSA as required by ab cFR sgAppendix D, Section 2, (e).
Countv FederqlReferenced
Method PMu ^
ContinuousPMa.E
SpeciatjpnPMas
CollocatedPMr.s
Shelby County,TN
SCHD3 (includes 1 atthe Near Road
Station)
1 1 1
CrittendenCounty, AR
ADEQ1 1
DeSoto County,MS
MDEQ1 1 1
PM 2.5 MSA monitoring network include:
Criteria Air Pollutant MSA monitoring network include:
RESPONSIBILITIES I ACTIONS
Each of the parties to this Agreement is responsible for ensuring that its obligationsunder the MoA are met. As conditions wariant, the affected aglncies may conducttelephone conference calls, meetings, or other communications [o discuss monitoringactivities for the MSA. Each affected agency shall inform the other affected agencieivia telephone or email of any monitoring changes occurring within its jurisdiction of theMSA at its earliest convenience, after learning of tne need ior the change or making thechanges. Such unforeseen changes may include evictions from ironitoring jt"s,
Gountv PMnn q NO"/NO/NO' co SO,
ShelbyCounty, TN
SCHD2 (includeslow volume
PMro atNCore)
31 (includes 1
at the NearRoad
Station)
2 (includes 1
trace atNCore and 1
trace at theNear Road
Station)
'1 (trace atNCore)
CrittendenCounty, AR
ADEQ1 1
DeSotoCounty, MS
MDEQ1
destruction of monitoring sites due to natural disasters, or any occurrences that result inan extended (greater than one quarter) or permanent change in the monitoring network.
LIMITATIONS
o All commitments made in this MOA are subject to the availability of appropriatedfunds and each agency's budget priorities. Nothing in this MOA oOligjates SCHD,MDEQ, or ADEQ to expend appropriations or to enler into any contrict,assistance agreement, interagency agreement or other finaniial obligation.
a
a
This MoA is neither a fiscal nor a funds obligation document. Any endeavorinvolving reimbursement or contribution of funds between parties to thisagreement will be handled in accordance with applicable laws, regulations, andprocedures, and will be subject to separate agreements that will be affected inwriting by representatives of the parties.
This MoA does not create any right or benefit enforceable by law or equityagainst scHD, MDEQ, or ADEQ, their officers or employeesl or any otherperson. This MoA does not apply to any entity outside scHD, MDEQ, or ADEe
No proprietary information or intellectual property is anticipated to arise out of thisMOA.
TERMINATION
This Memorandum of Agreement may be revised upon the mutual consent of SCHD,MDEQ and ADEQ. Each party reserves the right to terminate this MOA. A thirty (30)day written notice must be given prior to the date of termination.


![WKM DynaSeal 370D4 Trunnion Ball Valves1].pdf · 4 CT-WKM-BALL-TRUN-370D4-02 06/11 SWP-3M WKM® Cameron’s Valves & Measurement (V&M) group is a leading provider of valves and measurement](https://static.documents.pub/doc/80x56/5f8a2d9802cef071943a32bf/wkm-dynaseal-370d4-trunnion-ball-valves-1pdf-4-ct-wkm-ball-trun-370d4-02-0611.jpg)


