122
2021 ECONOMIC AND INDUSTRY OUTLOOK: THIRD QUARTER PERSPECTIVES

2021 ECONOMIC AND INDUSTRY OUTLOOK: THIRD QUARTER PERSPECTIVES


2021 Economic and industry outlook:
third quarter perspectives
This study has been prepared by MAPFRE Economics. Publication rights have been granted to Fundación MAPFRE.
The information contained in this study may be reproduced in part, provided the source is cited.
Cite as: MAPFRE Economics (2021), 2021 Economic and industry outlook: third quarter perspectives, Madrid, Fundación MAPFRE.
© Cover image: iStock
© For the texts: MAPFRE Economics — [email protected] Spain: Carretera de Pozuelo, 52 — Edificio 1
28222 Majadahonda, Madrid Mexico: Avenida Revolución, 507
Col. San Pedro de los Pinos 03800 Benito Juárez, Mexico City
© For this edition: 2021, Fundación MAPFRE Paseo de Recoletos, 23. 28004 Madrid www.fundacionmapfre.org
July 2021.

MAPFRE Economics
Manuel Aguilera Verduzco General Director [email protected]
Gonzalo de Cadenas Santiago Director of Macroeconomics and Financial Analysis [email protected]
Ricardo González García Director of Analysis, Sectorial Research and Regulation [email protected]
José Brito Correia [email protected]
Begoña González García [email protected]
Isabel Carrasco Carrascal [email protected]
Fernando Mateo Calle [email protected]
Rafael Izquierdo Carrasco [email protected]
Eduardo García Castro [email protected]
Daniel Santos Torres Clara Soutullo Rodríguez Lourdes Sánchez Iza David Esteban Montes Rojas Jaime Rebolledo Gutiérrez


Contents
Executive summary 9 ...........................................................
1. Economic outlook 1.1 The global economic outlook 13 .............................. 1.1.1 The start of recovery 13 ................................ 1.1.2 Risk assessment 26 ..................................... 1.2 Forecasts and risk assessment in
selected economies 29 ............................................ 1.2.1 United States 29 ........................................... 1.2.2 Eurozone 32 .................................................. 1.2.3 Spain 35 ........................................................ 1.2.4 Germany 38 .................................................. 1.2.5 Italy 41 .......................................................... 1.2.6 United Kingdom 43 ....................................... 1.2.7 Japan 46 ....................................................... 1.2.8 Turkey 48 ...................................................... 1.2.9 Mexico 51 ...................................................... 1.2.10 Brazil 54 ........................................................ 1.2.11 Argentina 56 ................................................. 1.2.12 China 59 ........................................................ 1.2.13 Indonesia 61 ................................................. 1.2.14 Philippines 62 ...............................................
2. Industry outlook 2.1 The economic environment and its impact
on insurance demand: update 67 ............................ 2.1.1 Global markets 67 ........................................ 2.1.2 Eurozone 67 .................................................. 2.1.3 Germany 69 .................................................. 2.1.4 Italy 69 .......................................................... 2.1.5 Spain 69 ........................................................ 2.1.6 United Kingdom 79 ....................................... 2.1.7 United States 80 ........................................... 2.1.8 Brazil 81 ........................................................ 2.1.9 Mexico 81 ...................................................... 2.1.10 Argentina 91 ................................................. 2.1.11 Turkey 91 ...................................................... 2.1.12 China 92 ........................................................ 2.1.13 Japan 92 ....................................................... 2.1.14 Philippines 93 ............................................... 2.2 Regulatory and supervisory trends 94 .....................
Tables: macroeconomic forecast scenarios 107 .................
Index of charts, tables and boxes 111 .................................
References 115.....................................................................

2021 ECONOMIC AND INDUSTRY OUTLOOK (Q3)
Executive summary
2021 Economic and industry outlook: third quarter perspectives
Economic outlook
The course taken by the Covid-19 pandemic remains the main condition governing economic revival in the different regions of the world. Global infection rates have returned almost to their March lows, although the recent trend has been toward a slight rebound. This trend is less pronounced in developed countries, while in emerging countries, despite passing the May peak, infections remain relatively high. Along with this pattern in the number of infections, there has been a trend in the most developed countries toward reducing restrictions on mobility and social contact, while in emerging countries these restrictions have remained virtually unchanged since the beginning of the year.
In this context, the baseline scenario used in this report retains a world GDP growth forecast for 2021 of 6.0%, with healthy growth of 4.4% in 2022 still expected. The prospects for global economic growth, both this year and next, continue to be supported by a recent development in activity. A strong rebound in global growth is
expected as China regains momentum and advanced economies benefit from the easing of restrictions and with this the release of household demand. In emerging markets, due to the increase in infections, growth is anticipated to slow, with an improvement forecast in the second half of the year.
According to business surveys, the world economy is continuing to rebalance away from industry and toward services. Supply bottlenecks and rising cost pressures reflect the strengthening of recovery and inflation forecasts are at an average of 3.5% this year, an acceleration that cannot be compared with the last decade. However, this trend is still expected to be temporary and, in most economies, the current rise in inflation is in response to temporary supply and demand dynamics, and will begin to shift as we approach 2022.
With regard to market movements and changes in the economic picture that have taken place in recent months, the economic outlook in the United States is noteworthy, where improved health conditions, a rebound in employment (which is forecast to return in early 2022 to rates close to those seen in 2019) and the generous fiscal stimulus, among other factors, will contribute to significantly boosting the economy. With regard to inflation in the US economy, a
9

10
2021 ECONOMIC AND INDUSTRY OUTLOOK (Q3)
somewhat hysterical upturn was observed in 2021 and this will continue into 2022. In the eurozone, the improvement of the health situation has helped to ease restrictions by allowing the reopening of sectors such as hospitality and non-essential retail, thereby encouraging consumption and raising prospects for European tourist destinations. This all points to a strong increase in GDP during the second and third quarters of 2021. Inflation, for its part, could reach 2.5% in the second half, driven by price increases in hospitality, supply bottlenecks and base effects. In emerging countries, although the central view remains that growth will recover, only a few have managed to control their Covid-19 outbreaks, and, consequently, quarter-to-quarter growth in the second quarter will be lower than in the first quarter, with a marked difference between the two. The robust global economic recovery will activate both the emerging markets' industrial and exports prospects, with raw materials producers benefiting from the upturn in prices and also a tightening of monetary policy is expected in some of these countries due to rising inflationary pressures and the offsetting of large output gaps.
Industry outlook
Overall, expectations for the economy and insurance markets continue to improve globally, with uncertainty remaining moderate despite specific problems that are arising with new variants of the virus. Central banks continue to deploy ultra-accommodative monetary policies, and fiscal authorities continue to deploy extensive aid packages (supporting the global economy and financial markets), with the exception of some emerging economies that are experiencing a surge in inflation and have exhausted their fiscal capacities, which is forcing them to walk back some of the measures previously taken, resulting in an uneven recovery.
Accordingly, many emerging markets (excluding China) are now in a more delayed phase of recovery as they fight the pandemic, with vaccination campaigns remaining slow. This contrasts with what is happening in most of the developed markets where there has been major progress in vaccination campaigns, which has been reflected in a dramatic reduction in the number of hospitalizations and deaths from Covid-19, enabling some of the restrictions on mobility to be lifted. The broad monetary and fiscal support measures implemented have provided insurance markets with a lot of assistance, and these have shown resilience during this crisis beyond that of previous global crises. The latest published data confirm that the Life segment has suffered the most, virtually across the board, as a result of the pandemic, along with some major Non-Life segments such as Automobiles. This has been partially offset by the positive performance of other segments, mainly Health insurance. Nonetheless, the insurance sector is already beginning to show clear signs of recovery.
Prospects for a return to economic growth are aiding the recovery of insurance markets, and interest rate hikes in some emerging markets have created a favorable environment for the marketing of Life Savings and Annuities products. In Spain, in particular, the return to economic growth and the improvement of expectations are feeding into the insurance market, which is experiencing significant YoY growth. Life segment premiums are experiencing almost double-digit growth, with growth in both Life Protection and Life Savings premiums recovering, although the latter are still far from being at pre-crisis levels.
Finally, it should be pointed out that in the second quarter of 2021, the leading insurance groups in the European Union published the Solvency and Financial Condition Report (SFCR), for fiscal year 2020. It was the fifth such report released by these groups since the new

11
2021 ECONOMIC AND INDUSTRY OUTLOOK (Q3)
regulatory framework introduced under Solvency II entered into force. Analysis of the information for the 16 largest groups shows that their situation is sound, with solvency ratios far exceeding the regulatory minimum.


1.1 The global economic outlook
1.1.1 The start of recovery
The global climate
As noted in our previous quarterly report1, the direction taken by the pandemic remains the main condition governing economic revival in the different regions of the world. In this regard, recent news on the number of Covid-19 cases has been positive, as global case numbers have returned almost to their March lows (albeit with a slight rebound), with an average of 424,000 daily cases2. The trend seems to be much better in developed countries, where infections are at October 2020 levels (82,000 daily infections), while in emerging countries, despite having surpassed the historic peak of May (662,000 daily infections), infections remain relatively high, with a daily average of 342,000. In accordance with this pattern in the number of infections, the trend in the most advanced countries has been to reduce restrictions on mobility and social contact, while in emerging countries these restrictions have remained virtually unchanged since the beginning of the year (see Charts 1.1.1-a and 1.1.1-b). For example, some countries like the United States, the United Kingdom, France, Spain, Italy, The Netherlands, Switzerland and Sweden have high vaccination rates accompanied by a gradual
easing of restrictions, while others, such as India, Peru, the Philippines, Argentina, Colombia, Iran, Indonesia and Brazil still have low vaccination coverage and severe restrictions (see Chart 1.1.1-c).
13
1. Economic outlook
2021 ECONOMIC AND INDUSTRY OUTLOOK (Q3)
0
225,000
450,000
675,000
900,000
0
25
50
75
100
Jan
Feb
Mar Ap
r
May Jun
Jul
Aug
Sept Oc
t
Nov
Dec
Jan
Feb
Mar Ap
r
May Jun
Jul
Stringency index Daily infections: 7-day moving average (right axis)
Source: MAPFRE Economics (based on data from the Coronavirus Government Response Tracker, University of Oxford, undated on 7/12/2021)
Chart 1.1.1-a Global: daily COVID-19 infections vs. stringency index

14
2021 ECONOMIC AND INDUSTRY OUTLOOK (Q3)
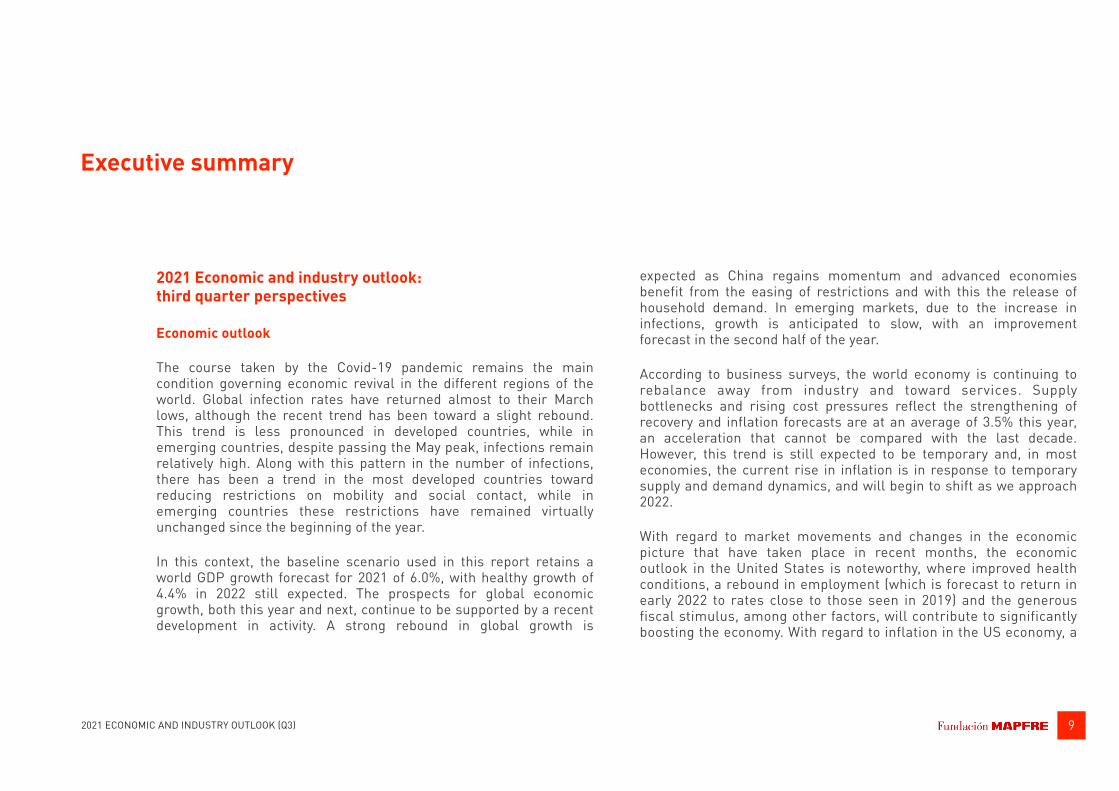
The economic data have continued to consistently outperform economists' expectations. As a result, global risk aversion indicators, such as VIX, are already almost at levels seen at the end of 2019 (see Chart 1.1.1-d). Corporate surveys also indicate that the healthy rebalancing of the global economy is continuing, with a move away from industry and toward services. The purchasing managers' indices (PMIs) show that global services are now comfortably ahead of the manufacturing index, and a recovery in activity levels is being seen not only in China, but also in the United States and the eurozone (see Chart 1.1.1-e)
0
100,000
200,000
300,000
400,000
500,000
0
25
50
75
100
Jan
Feb
Mar Ap
r
May Jun
Jul
Aug
Sept Oc
t
Nov
Dec
Jan
Feb
Mar Ap
r
May Jun
Jul
Stringency index Daily infections: 7-day moving average (right axis)
Source: MAPFRE Economics (based on data from the Coronavirus Government Response Tracker, University of Oxford, undated on 7/12/2021)
Chart 1.1.1-b Developed and emerging: daily COVID-19 infections vs. stringency index
0
200,000
400,000
600,000
800,000
0
25
50
75
100
Jan
Feb
Mar Ap
r
May Jun
Jul
Aug
Sept Oc
t
Nov
Dec
Jan
Feb
Mar Ap
r
May Jun
Jul
DEVELOPED COUNTRIES
EMERGING COUNTRIES
Strin
genc
y in
dex
30
40
50
60
70
80
90
Doses administered per 100 inhabitants0 20 40 60 80 100 120 140
Global
Switzerland
Sweden
United States
ThailandUnited Kingdom
Turkey
SpainNigeria
Portugal
PhilippinesPeru
Iran
Egypt
RussiaMexico
India
Italy
Indonesia Canada
Germany
South Korea
France
Netherlands
Japan
Colombia
Chile
Brazil China
Argentina
Source: MAPFRE Economics (based on data from the Coronavirus Government Response Tracker, University of Oxford, undated on 7/12/2021)
Chart 1.1.1-c Selected countries: stringency index vs. vaccine administration
15
2021 ECONOMIC AND INDUSTRY OUTLOOK (Q3)
High-frequency data anticipate a strong rebound in global growth in the second quarter as the Chinese economy regains momentum and the advanced economies benefit from the easing of activity restrictions and the consequent release of pent-up household demand. The driving effect of China's activity is beginning to be reflected in world trade indicators and manufacturing prices (see Charts 1.1.1-f and 1.1.1-g).
In emerging markets outside China, GDP growth is likely to slow in the second quarter of the year due to the rise in COVID-19 cases, especially in India. However, growth should begin to improve in the second half of the year. At the same time, lower growth and an increase in risk aversion could translate into a new phase of currency weakness, but one that is more mild given the balance-of-payments adjustment suffered in 2019 and 2020 (see Box 1.1.1-a).
20
30
40
50
60
2017
(Jan
)
2017
(Jul
)
2018
(Jan
)
2018
(Jul
)
2019
(Jan
)
2019
(Jul
)
2020
(Jan
)
2020
(Jul
)
2021
(Jan
)
2021
(Jul
)
Manufacturing PMIs Services PMIs Contraction threshold
Source: MAPFRE Economics (based on data from JP Morgan)
Chart 1.1.1-e Global: PMI performance
10
20
30
40
50
60
70
2017
(Jan
)
2017
(Jul
)
2018
(Jan
)
2018
(Jul
)
2019
(Jan
)
2019
(Jul
)
2020
(Jan
)
2020
(Jul
)
2021
(Jan
)
2021
(Jul
)
United States Eurozone China Contraction threshold
0
20
40
60
2017
(Jan
)
2017
(Jul
)
2018
(Jan
)
2018
(Jul
)
2019
(Jan
)
2019
(Jul
)
2020
(Jan
)
2020
(Jul
)
2021
(Jan
)
2021
(Jul
)
Chicago Board Options Exchange Volatility Index
Chart 1.1.1-d Global: risk aversion (VIX)
Source: MAPFRE Economics (based on data from Bloomberg)

16
2021 ECONOMIC AND INDUSTRY OUTLOOK (Q3)
In this context, in our baseline scenario, we have maintained our world GDP growth forecast for 2021 of 6.0%, and we continue to expect a healthy 4.4% increase in 2022. Our prospects for global economic growth, both for this year and next, continue to be supported by the recent increase in activity (see Table A-1 in the appendix to this report).
However, our inflation forecasts also remain in place, reflecting the strengthening of the recovery, supply bottlenecks and rising cost pressures. Globally, inflation is expected to average 3.5% this year, an acceleration that has hardly been seen in a decade. Nevertheless, we still expect this trend to be transitory. In most economies, we continue to believe that the current increase in inflation is in response to a temporary supply and demand dynamic, which will begin to lose pace as we approach 2022. This forecast coincides with the recent, strongly dovish stance of mature-economy central banks,
-20%
-10%
0%
10%
20%
30%
2017
2018
2019
2020
2021
CPB World Trade Volume Index
Source: MAPFRE Economics (based on data from World Trade Monitor)
Chart 1.1.1-g Global: trade volume change
(year-on-year variation)
-100%
0%
100%
200%
300%
400%
500%
2018
2019
2020
2021
Baltic Dry Index
Source: MAPFRE Economics (based on data from Baltic Exchange in London)
Chart 1.1.1-f Global: global trade (average transport cost index)
(year-on-year variation)
0
5
10
15
20
25
30
2017
2018
2019
2020
2021
ECB The Federal Reserve Bank of Japan Central Bank of China
Source: MAPFRE Economics (based on data from the central banks indicated)
Chart 1.1.1-h Global: monetary policy (M2 money supply, % YoY)
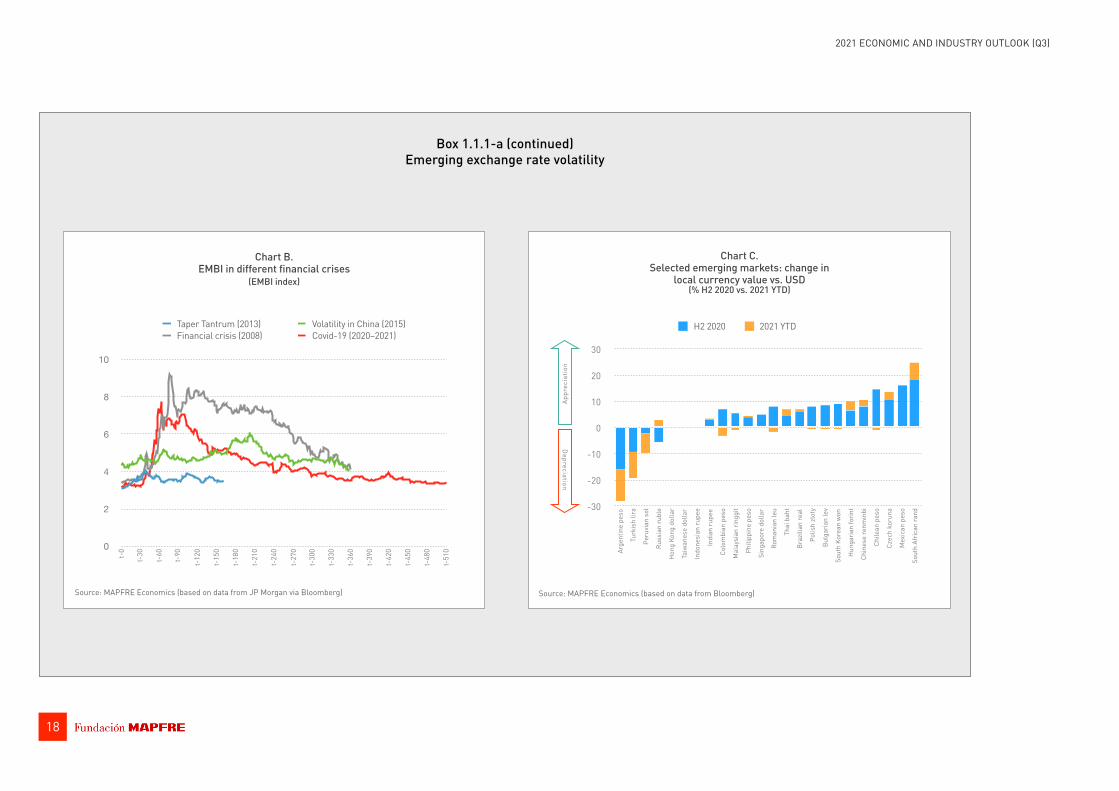
Box 1.1.1-a Emerging exchange rate volatility
Exchange rate volatility
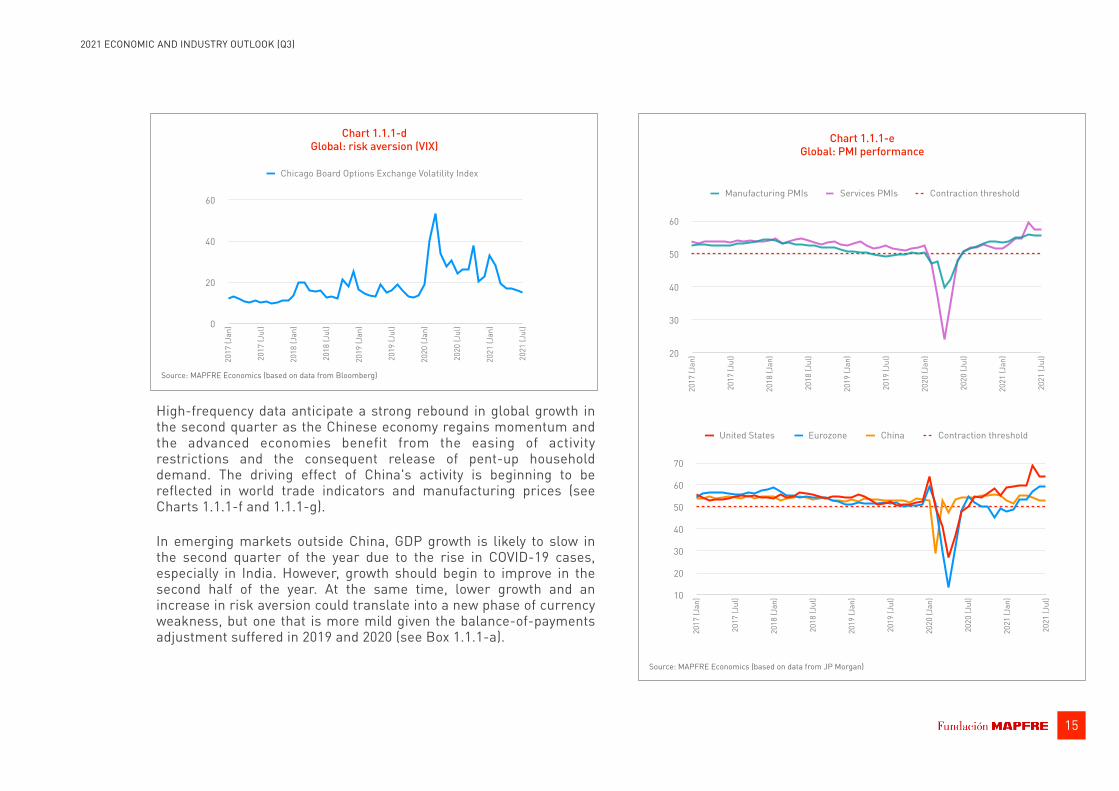
Emerging markets (particularly Latin American countries), whose performance was positive until the pandemic began in early March, have suffered directly from the global risk aversion environment in markets with sharp declines in equity indices, sovereign spreads up and exchange rates depreciating markedly. In terms of capital flows, up to the end of March, portfolio disposals showed higher net disposals than during previous volatility events (see Charts A and B).
However, rapid fiscal and monetary accommodation, in both advanced and emerging countries, has served as a countercyclical stabilizer, allowing the effects of the shock to stabilize. In the following months, until the first half of 2020, debt issues resumed, capital disposals stopped and even reversed selectively, and abrupt exchange-rate fluctuations stabilized; the latter, in part, owing to a starting point of more depreciated real exchange rates as a result of the previous dynamics of trade tensions and a relatively robust reserve position (see Chart C).
In the second half of 2020, after the first phase was overcome, negative dynamics recorded once again appeared selectively despite some recovery of mobility and growing external demand contributions. Moreover, the dynamics occurred in a context in which, following the current-account adjustment in the first half of the year, the region's balance of payments did not have imbalances for the first time in a decade (see Chart D).
The strong depreciation of some currencies (for example, those of Brazil and Colombia) was additionally the catalyst for idiosyncratic factors that increased the perception of risk in the country. Specifically,
Chart A. Portfolio investment flows to emerging markets
in different financial crises (billions of USD accumulated)
-120
-90
-60
-30
0
30
t-0
t-30
t-60
t-90
t-12
0
t-15
0
t-18
0
t-21
0
t-24
0
t-27
0
t-30
0
t-33
0
t-36
0
t-39
0
t-42
0
t-45
0
t-48
0
t-51
0
Taper Tantrum (2013) Volatility in China (2015)Financial crisis (2008) Covid-19 (2020–2021)
Source: MAPFRE Economics (based on data from the Institute of International Finance)
17
2021 ECONOMIC AND INDUSTRY OUTLOOK (Q3)
Box 1.1.1-a (continued) Emerging exchange rate volatility
Chart B. EMBI in different financial crises
(EMBI index)
Source: MAPFRE Economics (based on data from JP Morgan via Bloomberg)
0
2
4
6
8
10
t-0
t-30
t-60
t-90
t-12
0
t-15
0
t-18
0
t-21
0
t-24
0
t-27
0
t-30
0
t-33
0
t-36
0
t-39
0
t-42
0
t-45
0
t-48
0
t-51
0
Taper Tantrum (2013) Volatility in China (2015)Financial crisis (2008) Covid-19 (2020–2021)
-30
-20
-10
0
10
20
30
Arge
ntin
e pe
so
Turk
ish
lira
Peru
vian
sol
Russ
ian
rubl
e
Hon
g Ko
ng d
olla
r
Taiw
anes
e do
llar
Indo
nesi
an ru
pee
Indi
an ru
pee
Colo
mbi
an p
eso
Mal
aysi
an ri
nggi
t
Phili
ppin
e pe
so
Sing
apor
e do
llar
Rom
ania
n le
u
Thai
bah
t
Braz
ilian
real
Polis
h zl
oty
Bulg
aria
n le
v
Sout
h Ko
rean
won
Hun
garia
n fo
rint
Chin
ese
renm
inbi
Chile
an p
eso
Czec
h ko
runa
Mex
ican
pes
o
Sout
h Af
rican
rand
H2 2020 2021 YTD
Chart C. Selected emerging markets: change in
local currency value vs. USD (% H2 2020 vs. 2021 YTD)
Source: MAPFRE Economics (based on data from Bloomberg)
Appr
ecia
tion
Depreciation
18
2021 ECONOMIC AND INDUSTRY OUTLOOK (Q3)

-4
-2
0
2
4
6
8
2001
2003
2005
2007
2009
2011
2013
2015
2017
2019
2021
Errors and omissionsCurrent account balance + capitalReserves
Variation in reservesFinancial account balance (inverse)
AVERAGE PAYMENT BALANCE FOR EMERGING COUNTRIES (% GDP)
-6
-4
-2
0
2
4
6
2001
2003
2005
2007
2009
2011
2013
2015
2017
2019
2021
ServicesCapital incomeAssets
Current account balance + capitalTrade balance
TRADE AND CAPITAL BALANCE (% GDP)
-8
-4
0
4
8
2001
2003
2005
2007
2009
2011
2013
2015
2017
2019
2021
FDIPortfolioCreditReserves
Current account
FINANCIAL ACCOUNT AND CURRENT ACCOUNT COMPOSITION (% GDP, inv. values)
-100
-50
0
50
100
2001
2003
2005
2007
2009
2011
2013
2015
2017
2019
2021
(A) Reserves(A) Debt (other)(A) Equity (other)(A) Debt(A) Equity(A) FDI (debt)(A) FDI (equity)(P) FDI (equity)(P) FDI (debt)(P) Equity(P) Debt(P) Debt (other)
NIIP
NIIP (% GDP)
Chart D. Average for emerging markets: balance of payment structure indicators
Source: MAPFRE Economics (based on data from Haver)
Box 1.1.1-a (continued) Emerging exchange rate volatility
19
2021 ECONOMIC AND INDUSTRY OUTLOOK (Q3)

Box 1.1.1-a (continued) Emerging exchange rate volatility
Colombia's social unrest, tensions resulting from elections in Peru and the regional shock brought about by the Brazilian variant of Covid-19 were some of the factors that contributed to the marked selective depreciation of these currencies during the second half of 2020. Beyond the differential and idiosyncratic effect of some countries, a determining factor was the inability to recover lost ground, as it could not add to the benefits of the global value chain as the world entered a new (more lax) phase of containment. Finally, depreciation was more pronounced where the fiscal leeway available to counter the Covid-19 shock was more curtailed. Countries such as Brazil, Argentina and Colombia have experienced problems with fiscal and pension sustainability. The effect on their currencies was partly influenced by this, especially as these countries could not join in the relaunch of the energy and metal raw materials price cycle.
In 2021, Latin America continues to face an economic context that remains complex and uncertain. The Covid-19 pandemic continued to impact the region due to new waves of cases that have led to the reintroduction of social distancing measures to curb the spread of the virus, pending progress in the vaccination campaign that is still in the early stages. In this context, the recovery in economic activity remains positive, albeit with limited intensity, supported by the increase in the price of raw materials, under still favorable overall financing conditions and a return in capital flows which, although seeing a positive recovery, remain far below pre-pandemic levels. Thus, the fragile economic recovery is not only uncertain, but largely uneven due to an asymmetric initial impact and structural gaps underpinned by various
vulnerabilities, including the balance-of-payments position, highlighting the situation of current, capital and financial accounts and their dependency on capital movements.
Overall, given the institutional efforts made during 2020, the largest Latin American economies are in a more degraded fiscal situation, with much higher levels of external debt (both private and public) and with capital flows that, although substantially higher than those of a year ago, continue to record cumulative figures similar to those of the 2008 crisis, and relatively stable exchange rates thanks to the maintenance of reserve levels and the fact that current account balances remain favorable.
In addition, it should be noted that the social unrest and protests that characterized Latin America in the pre-pandemic period (including events in Chile, Ecuador, Bolivia and other Latin American countries), which paused during the periods of strict social distancing, were recently resurrected, triggered by both prior grievances and more recent discontent with policies implemented during the pandemic. Accordingly, issues such as the poor protection of economic sectors and workers most closely associated with informal economic activities, a greater inequality gap and institutional deterioration could slow the pace of recovery and even create tensions in the region's financial markets.
20
2021 ECONOMIC AND INDUSTRY OUTLOOK (Q3)
21
2021 ECONOMIC AND INDUSTRY OUTLOOK (Q3)
as seen in the Federal Reserve's communiqués and in the change in the monetary policy position announced on July 7 by the European Central Bank (see Chart 1.1.1-h and Box 1.1.1-b).
Outlook for the main economic regions
In reviewing the most salient facts, it is worth noting the cases of the United States, the eurozone and the major emerging markets, which have been where the greatest confluence between changes in economic outlook and market movements have been observed over the last three months.
United States
In the United States, the economy is about to experience a boom fueled by reduced fear of the virus, stable household incomes and high levels of savings. Consumer demand will shift from goods to services, while supply will gradually respond to increased activity. Rising inflation will be a characteristic of the transient imbalance in supply and demand, but we do not anticipate the economy overheating. As health conditions improve and the economy re-opens, generous fiscal stimulus, a surge in employment and increased optimism will drive a double-digit increase in consumption. For its part, 559,000 job positions have been added to the labor market, while the unemployment rate fell to 5.8%, encompassing a smaller proportion of the active population. In addition, the systematic creation of one million job positions is expected during the summer months, returning unemployment to near 2019 levels for the beginning of 2022.
Regarding inflation, a surge is being seen with somewhat of a lag in 2021, which will last into 2022, although we have ruled out a change in inflation policy and we believe that the Federal Reserve
will be comfortable with rates above 2% for some time, as interpreted from the review of their mandate a few months ago (now imitated by the ECB). The Federal Open Market Committee (FOMC) is expected to formally announce quantitative easing (QE) tapering plans at the annual Jackson Hole Economic Symposium in August, with tapering to begin in early 2022. Thereafter, we believe that the Federal Reserve will announce a rate hike in the first quarter of 2023.
Eurozone
As far as the eurozone is concerned, the situation is improving due to the decline in infections and the accelerating increase in vaccination rates; despite the recent concerns raised by the delta variant, the number of hospitalizations is very low. Accordingly, restrictions have begun to be lifted, and consumers are eager to take advantage of this. High-frequency data point to a faster-than-expected surge in consumption, as the reopening of the hospitality and non-essential retail sectors improves the outlook for Europe's tourist destinations. The latest mobility data and surveys also paint a more optimistic outlook for retail sales and tourism. The purchasing managers' indices (PMIs) for June remain high for services, following a three-year peak in May, while mobility data at the end of May suggest that non-essential retail and hospitality activity have risen to a level close to that of last summer's highs. Accordingly, following a 0.6% fall in GDP in the first quarter, progress in vaccination and the gradual but widespread reopening of eurozone economies point to a marked increase in GDP in the second and third quarters of the year.
Also, although inflation recently rose to 2%, this was due to rising energy prices while underlying price pressures remained moderate, with core inflation at 0.9%. Inflation in the eurozone could reach 2.5% in the second half, driven by price increases in hospitality, supply
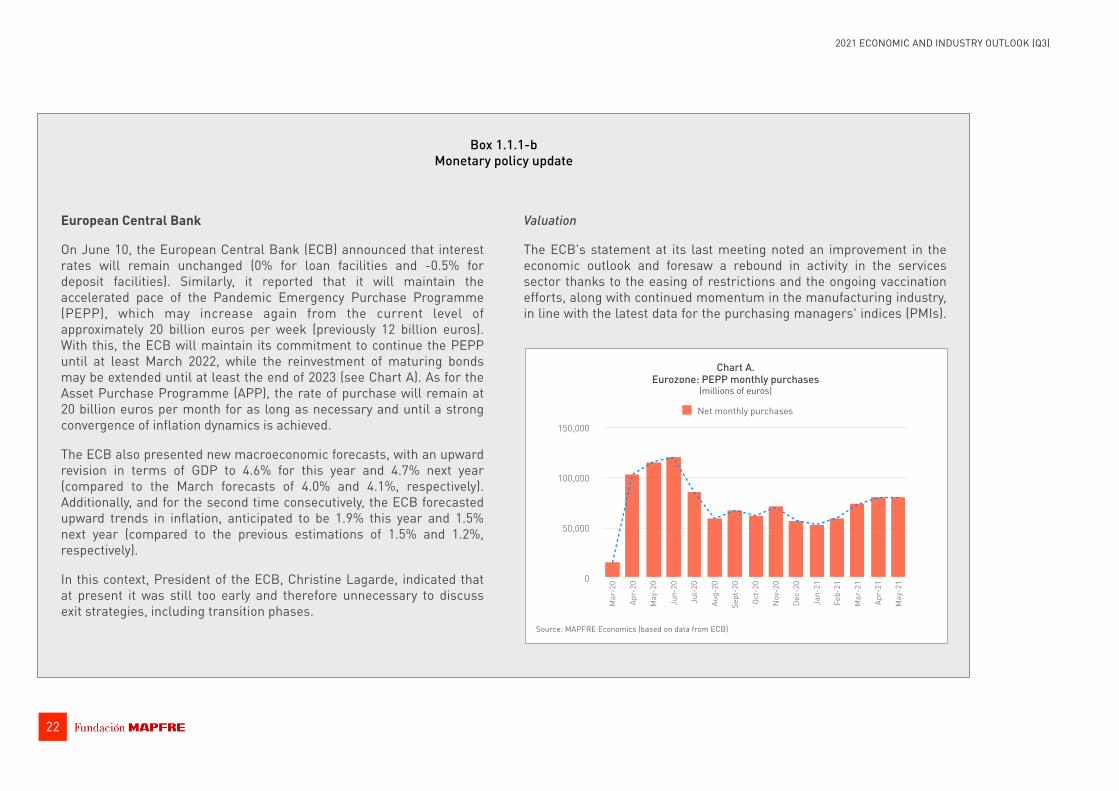
Box 1.1.1-b Monetary policy update
European Central Bank
On June 10, the European Central Bank (ECB) announced that interest rates will remain unchanged (0% for loan facilities and -0.5% for deposit facilities). Similarly, it reported that it will maintain the accelerated pace of the Pandemic Emergency Purchase Programme (PEPP), which may increase again from the current level of approximately 20 billion euros per week (previously 12 billion euros). With this, the ECB will maintain its commitment to continue the PEPP until at least March 2022, while the reinvestment of maturing bonds may be extended until at least the end of 2023 (see Chart A). As for the Asset Purchase Programme (APP), the rate of purchase will remain at 20 billion euros per month for as long as necessary and until a strong convergence of inflation dynamics is achieved.
The ECB also presented new macroeconomic forecasts, with an upward revision in terms of GDP to 4.6% for this year and 4.7% next year (compared to the March forecasts of 4.0% and 4.1%, respectively). Additionally, and for the second time consecutively, the ECB forecasted upward trends in inflation, anticipated to be 1.9% this year and 1.5% next year (compared to the previous estimations of 1.5% and 1.2%, respectively).
In this context, President of the ECB, Christine Lagarde, indicated that at present it was still too early and therefore unnecessary to discuss exit strategies, including transition phases.
Valuation
The ECB's statement at its last meeting noted an improvement in the economic outlook and foresaw a rebound in activity in the services sector thanks to the easing of restrictions and the ongoing vaccination efforts, along with continued momentum in the manufacturing industry, in line with the latest data for the purchasing managers' indices (PMIs).
22
2021 ECONOMIC AND INDUSTRY OUTLOOK (Q3)
Source: MAPFRE Economics (based on data from ECB)
Chart A. Eurozone: PEPP monthly purchases
(millions of euros)
0
50,000
100,000
150,000
Mar
-20
Apr-
20
May
-20
Jun-
20
Jul-
20
Aug-
20
Sept
-20
Oct-
20
Nov
-20
Dec-
20
Jan-
21
Feb-
21
Mar
-21
Apr-
21
May
-21
Net monthly purchases Trend

Box 1.1.1-b (continued) Monetary policy update
Consequently, this greater traction in terms of economic activity levels may translate into higher inflation, the transitory nature of which remains uncertain.
As discussed in the update provided in the report on the previous quarter, the increase in the eurozone's inflation projections presents a relatively asymmetric scenario, albeit of a transitory nature, with latent pressures in the short-term (reversal of the VAT reduction in Germany, changes in HICP weightings and the base effect, all coupled with supply-side bottlenecks), while in the medium- to long-term the outlook remains stable with a consensus of rates below the 2% target.
In this sense, and should these forecasted trends come to pass, both fiscal and monetary stimuli would remain unchanged under the current perception of time-bound policies to ensure economic recovery. However, it is possible that these decisions will be postponed and will lead to a more ambitious and longer-term outlook in order to finance, at least in part, a more profound transformation of the eurozone's productive structure.
Strategic review
During its first announcement of the results of its strategy review process on July 8, the ECB firstly announced a new symmetrical inflation target, which, instead of targeting "below, but close to 2%" inflation, provides for greater flexibility and tolerance by allowing "a transitory period in which inflation is moderately above target." Secondly, the ECB addressed rising house prices. It intended to include
in its considerations the cost of owner-occupied housing (OOH), which should provide a small boost to the current figure. However, because the metric is calculated by the statistical office of the European Union (Eurostat), it is likely to be a matter of years before any changes take effect. Thirdly, the ECB confirmed interest rates as the main tool within its monetary policy, while clarifying the use of asset purchases as a more conventional tool. Finally, it presented an action plan to include climate change considerations in its monetary policy strategy, encompassing activities related to financial disclosure, risk assessment, guarantees, and corporate sector asset purchases based on climate change-related eligibility criteria.
The Federal Reserve
At its June meeting, the US Federal Reserve kept its monetary policy unchanged, leaving interest rates in the 0%–0.25% range and maintaining the monthly pace and composition of asset purchases. However, it did introduce changes to the interest rate on excess reserves (IOER), as well as to the reverse repo rate (RRR), with an upward technical adjustment of 5 basis points. This measure was designed to keep the federal funds rate within the target range and to support the functioning of the market. Its justification was based on the unusual fluctuations in recent months in the money market, where excess liquidity in the system had put downward pressure on short-term rates, leading to a string of negative rates in March.
Regarding interest rates, the "dot plot" projections moved toward an increase in rates for 2023 instead of 2024, and more in line with market
23
2021 ECONOMIC AND INDUSTRY OUTLOOK (Q3)

Box 1.1.1-b (continued) Monetary policy update
expectations, after anticipating stronger economic growth (7.0% vs. 6.5%). This was accompanied by recognition that the recent inflation dynamics (5.4% CPI in May and 4.5% core) could reach 3.4% in 2021 (compared to 2.4% previously), albeit with expectations of a transitory trend over the coming years. As a result, the outlook for the Federal Reserve's balance sheet and the possibility of beginning to taper its asset purchases may begin to be reflected in the calendar sooner than expected.
Valuation
Insofar as the data confirm a substantial improvement in the US economy (with a stronger labor market and even signs of wage pressures in certain sectors, the risk of more persistent inflation than initially expected and a backdrop of elevated asset valuations), the
Source: MAPFRE Economics (based on data from Bloomberg)
Chart C. United States: PPI, CPI and NFIB, percentage of companies with
one or more difficult job positions to cover
0
10
20
30
40
50
60
-8
-4
0
4
8
12
2018 2019 2020 2021
US PPI Finished Goods SAUS CPI Urban Consumers SANFIB Small Business Job Openings Hard to Fill
Source: MAPFRE Economics (based on data from Atlanta Federal Reserve)
Chart B. United States: Wu-Xia Shadow Federal Funds Rate
-4
-2
0
2
4
6
2004
2005
2006
2007
2008
2009
2010
2011
2012
2013
2014
2015
2016
2017
2018
2019
2020
2021
Effective federal funds rate (% p.a.), last business day of monthWu-Xia shadow federal funds rate (last business day of month)
24
2021 ECONOMIC AND INDUSTRY OUTLOOK (Q3)
bottlenecks and base effects. The ECB has clearly sent a new message of tolerance with an intention to adjust its forward guidance on inflation and interest rates (see Box 1.1.1-b).
Emerging markets
Recent developments have highlighted the current divergence in the economic trajectories of emerging countries in light of the course taken by the pandemic on the one hand and the existence of vulnerabilities and imbalances on the other that could interrupt their recovery.
While our central view (which has not changed since the beginning of the year) remains that emerging markets outside China will regain
their growth impetus, only a few have managed to control the increase in Covid-19 transmission. So we expect quarter-to-quarter growth in the second quarter to be lower than in the first quarter, and there are large differences between them (emerging Europe, ASEAN countries and Latin America) because the slow pace of vaccination programs will affect the forecast upturn in some countries, for example in India and the ASEAN countries.
There is no doubt that the strong global economic recovery will boost industry in emerging markets and their export prospects, in line with recent PMI readings, and that raw materials producers will benefit from rebounding prices. However, supply shortages and shipment delays could slow down the industrial momentum in the coming months, and production prices could face further upward pressure.
Box 1.1.1-b (continued) Monetary policy update
groundwork is being laid for a less accommodative monetary policy over the coming months. There is a latent risk of a certain self-complacency (under the conviction that the higher inflation will be transitory), and the risk map—though less unfavorable—continues to show several uncertainties. Despite this, however, the basis for the gradual withdrawal of stimuli is already taking shape, starting with the reduction or tapering of the balance sheet as a prelude to the normalization of interest rates.
In this sense, the exposure to prolonged price pressures and the tolerance for inflation (whose target sees greater flexibility, reaching
average values of around 2% over time, in order to prioritize the recovery of the labor market) could encounter the first divergences and begin to abate over the course of the following meetings. The current context is marked by rising forecasts in the face of rebounding inflation and the fact that the labor market is surprisingly driven to absorb excess capacity, all accompanied by upward frictions in salary bargaining. In view of this, a change in the Federal Reserve's stance could begin to emerge as early as the customary Jackson Hole economic symposium this coming August.
25
2021 ECONOMIC AND INDUSTRY OUTLOOK (Q3)
26
2021 ECONOMIC AND INDUSTRY OUTLOOK (Q3)
Moreover, with rising inflationary pressures almost everywhere and compensation for wide production gaps, more central banks are becoming aggressive. In addition to Brazil, Mexico and Russia, where higher interest rates were expected by the end of 2021, Colombia and some Central and Eastern European countries are also expected to tighten their monetary policies.
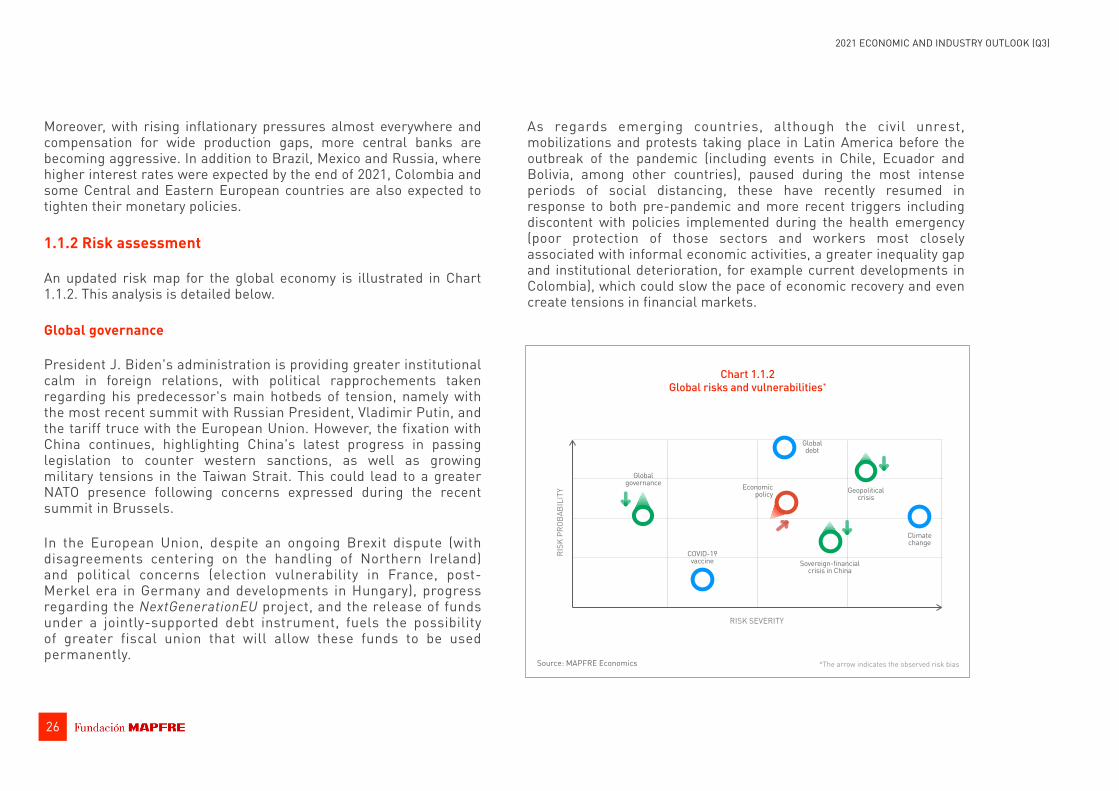
1.1.2 Risk assessment
An updated risk map for the global economy is illustrated in Chart 1.1.2. This analysis is detailed below.
Global governance
President J. Biden's administration is providing greater institutional calm in foreign relations, with political rapprochements taken regarding his predecessor's main hotbeds of tension, namely with the most recent summit with Russian President, Vladimir Putin, and the tariff truce with the European Union. However, the fixation with China continues, highlighting China's latest progress in passing legislation to counter western sanctions, as well as growing military tensions in the Taiwan Strait. This could lead to a greater NATO presence following concerns expressed during the recent summit in Brussels.
In the European Union, despite an ongoing Brexit dispute (with disagreements centering on the handling of Northern Ireland) and political concerns (election vulnerability in France, post-Merkel era in Germany and developments in Hungary), progress regarding the NextGenerationEU project, and the release of funds under a jointly-supported debt instrument, fuels the possibility of greater fiscal union that will allow these funds to be used permanently.
As regards emerging countries, although the civil unrest, mobilizations and protests taking place in Latin America before the outbreak of the pandemic (including events in Chile, Ecuador and Bolivia, among other countries), paused during the most intense periods of social distancing, these have recently resumed in response to both pre-pandemic and more recent triggers including discontent with policies implemented during the health emergency (poor protection of those sectors and workers most closely associated with informal economic activities, a greater inequality gap and institutional deterioration, for example current developments in Colombia), which could slow the pace of economic recovery and even create tensions in financial markets.
*The arrow indicates the observed risk biasSource: MAPFRE Economics
Chart 1.1.2 Global risks and vulnerabilities*
RISK SEVERITY
RISK
PRO
BABI
LITY
Global governance Economic
policy
Sovereign-financial crisis in China
Geopolitical crisis
Global debt
COVID-19 vaccine
Climate change

27
2021 ECONOMIC AND INDUSTRY OUTLOOK (Q3)
Global debt
After reaching a global peak at the end of 2020 (at the highest level since World War II) with $290.5 trillion (359.4% of world GDP), debt figures for the first quarter of 2021 show a slight decrease of $1.7 trillion, led by developed economies (where total debt fell to less than $203 trillion), while emerging economies' debt increased by $0.6 trillion to $86 trillion, which, although rising at a slower pace than in previous quarters, continues to exert pressure in terms of sustainability, which is heightened in those economies with accumulated vulnerabilities.
In developed markets, the huge fiscal and monetary support that has resulted in the public sector leading the leverage process continues to increase, albeit moderately, with the non-financial private sector (corporate and, to a lesser extent, households) leading the deleveraging process and joined, for the first time since 2018, by the finance sector. In emerging markets, the largest leverage continued to be in the private non-financial sector (corporate and, to a lesser extent, households), followed by financials and, conversely, the greatest deleveraging was in the public sector, albeit with regional divergences, and with fiscal limitations showing signs of fragility, and debt sustainability and servicing demonstrating the need to boost fiscal capacity.
Generally speaking, in the developed economies in particular (where the public debt of countries like the United States, much of the eurozone, the United Kingdom and Japan is at record levels under monetary policies that are exerting a downward pressure on yields, with around one-third of current debt trading at negative rates) reinvestment risk could rise as the pursuit of protection from inflation and the monetary response moves toward normality. Under this scenario, debt sustainability, based on the need to service a burden at higher levels under higher interest rates, could weaken
certain countries' economic recovery when returning to greater fiscal discipline. For the time being, that probability is limited and monetary policy is continuing as it is; however, sensitivity to changes in the price-setting process is increasing given the levels of accumulated debt in combination with high deficits.
The greatest risk to emerging economies continues to be for those with high levels of external debt and debt profiles composed of hard currency-denominated debt, and also for those with a divergent recovery process. Low domestic inflation and monetary accommodation (including in advanced economies), domestic savings favoring financing without recourse to external debt (coupled with the positive boost from the raw materials prices) have brought about remarkable progress in certain economies. However, as financial conditions become less favorable and increasing inflation again exerts pressure, those with direct monetary financing from budget deficits, poorer access to capital markets and deterioration in their external debt position could face selective risk aversion events and local instability.
Finally, in the United States, as well as in several European Union countries, the outlook for the corporate debt segment in terms of CDOs (Collateralized Debt Obligations), although improving, remains moderate, despite reaching record issuance levels driven by intense economic revival and demand from yield-seeking investors. Accordingly, the risks for this type of product could be asymmetric in certain high-yield areas given the current environment.
Sovereign-financial crisis in China
The Chinese economy continues to be at the forefront of the global recovery. In addition to the well-known strength of its manufacturing industry and strong exports (in response to demand from countries

28
2021 ECONOMIC AND INDUSTRY OUTLOOK (Q3)
with still incomplete recoveries and enduring health restrictions), there has also been consolidation of domestic demand (with the potential to trigger inflationary pressures), the momentum of which has yet to be fully felt, providing the economy with broad economic support. This situation, coupled with a stable monetary policy and what is anticipated to be an expansionary fiscal policy, supports a positive forecast for the Chinese economy.
Regarding downside risks, given the buoyant expansion, the possibility of economic overheating must be highlighted, with the return of concerns about asset bubbles having caused the Central Bank to try to curb the credit impulse (already in negative territory) and it could lay the groundwork for a resumption of deleveraging policies in anticipation of interest rate hikes and tightening of other monetary-policy measures.
Economic policy
As economies break free of constraints and pent-up demand is unleashed, inflation is rising under a rebound effect. However, factors considered as transient (e.g. persistent bottle necks, supply chains with unrestored capacity, shortages of certain goods, etc.) risk continuing this trend, and its persistent nature (as was reflected in the latest forecasts of the central banks themselves) has set the stage for beginning to communicate a change in the direction of monetary policy toward tightening. In this context, bond markets, whose turbulence over the last few months has shown that they were already expecting this normalization, could again anticipate that there is very limited capacity for tightening at this time and sensitivity to it is very high. Although the first changes are only expected to be seen in short-term asset purchases, because normalization requires that interest rates begin to rise to provide room for maneuver for the next adjustment cycle, signals could re-emerge in debt markets that
demonstrate the likelihood of a monetary policy error until a new level of equilibrium in interest rates is reached.
In terms of the fiscal aspect, the approach remains expansionary and favored by lax monetary policy. However, prolonged, unwanted tightening of financial conditions could compromise the stability of such policies, and some of the current measures could be abandoned to move toward a phase focused on fiscal consolidation for the sake of debt sustainability.
Geopolitical crisis
The global geopolitical context remains stable, with a slight trend toward deterioration. Relieving factors are primarily: (i) broader vaccine diplomacy at the global level and mainly in emerging countries; (ii) a risk of fragmentation in the eurozone relieved by the arrival of the first tranches of European funds and the latest developments in the political landscape that have reduced euro-skepticism in countries such as France (less polarization but low voter turnout) and Italy (greater stability under Prime Minister, Mario Draghi), and (iii) a relaxation of tensions in the Persian Gulf, particularly with the upcoming prospect of an agreement with Iran. Factors adding to tensions are: political instability in certain emerging countries, particularly the risk in Latin America where countries such as Colombia, Peru and Brazil are again entering the spiral of social discontent and institutional deterioration, and also the conflict between Israel and Palestine where the risk of an escalation in the conflict may not diminish under the new government.

29
2021 ECONOMIC AND INDUSTRY OUTLOOK (Q3)
Climate change
The early response to the Covid-19 pandemic by governments, businesses and individuals seems to provide hope for a comprehensive and coordinated response to the climate change crisis. The reaction to slow and still far-off changes requires immediate measures, with insurance and its role in promoting the social dimension of sustainability offering support both in terms of investment in ESG, and for the insurance business itself, providing balance sheet stability, efficient risk allocation and an avoidance of pro-cyclical phenomena in the financial system.
COVID-19 vaccine
While vaccination campaigns are accelerating around the world, and countries with the most advanced campaigns are beginning to ease restrictions, there is a risk that the delta variant of Covid-19 will spread, mainly among the unvaccinated population and those who are still not fully vaccinated (accounting for 20% of new cases in the United States, as restrictions in the United Kingdom ease over time.) In this regard, despite the fact that the vaccines developed continue to show themselves to be highly effective, the highly transmissible nature of the variant, coupled with the prospect of a number of new ramifications, has the potential to delay the attainment of herd immunity (which is still incomplete and unequal) while serving as a basis for new restrictions.
1.2 Forecasts and risk assessment in selected economies
1.2.1 United States
The outlook is improving again, while inflation seems to be set at above 2.3%.
The US economy grew by 0.4% YoY in the first quarter of 2021 (6.4% annualized and seasonally adjusted), and shows signs of strong g r o w t h f o r 2 0 2 1 . A c c o rd i n g ly, o u r 6 . 6 % g r o w t h e s t i m a t e i s maintained for 2021 and we have revised the estimate for 2022 upward from 3.3% to 4.5% (see Table 1.2.1 and Charts 1.2.1-a and 1.2.1-b). This is essentially due to t h e e f fe c ts o f re co rd -breaking stimulus plans amounting to $1.9 trillion. This plan, added to the $900 billion made available at the end of 2020, represents a strong fiscal boost in 2021 equating to around 4.3 points of GDP. At the end of June, the Senate approved a $579 billion infrastructure plan (still pending in Congress), less than originally proposed, but it certainly constitutes another boost to recovery. In addition to fiscal stimulus, the vaccination campaign is progressing at a good rate (52% of the population and 99.6 doses administered per 100 inhabitants) and restrictions have gradually
• The Federal Reserve is changing its tone, anticipating possible interest rate hikes in 2023.
• The debate now seems to focus on the end of asset purchase programs (tapering).
• The early indicators point to an improvement in the coming quarters.
• The forecasted GDP growth of 6.6% for 2021 has been maintained.

30
2021 ECONOMIC AND INDUSTRY OUTLOOK (Q3)
Table 1.2.1 United States: main macroeconomic aggregates
Baseline (BS) Stressed (SS)
2016 2017 2018 2019 2020(e) 2021(f) 2022(f) 2021(f) 2022(f)
GDP (% YoY) 1.7 2.3 3.0 2.2 -3.5 6.6 4.5 5.0 -1.3Domestic demand contribution 1.9 2.6 3.3 2.4 -3.5 8.1 4.3 6.1 -2.0External demand contribution -0.2 -0.2 -0.3 -0.2 -0.0 -1.5 0.2 -1.1 0.8Private consumption contribution 1.9 1.8 1.9 1.7 -2.7 5.5 3.6 4.3 -1.1Total investment contribution 0.4 0.7 1.0 0.5 -0.2 1.7 0.6 1.1 -0.7Public spending contribution 0.3 0.1 0.2 0.2 0.0 0.2 0.0 0.2 0.0Private consumption (% YoY) 2.8 2.6 2.7 2.4 -3.9 7.9 5.1 6.2 -1.5Public consumption (% YoY) 1.8 0.6 1.5 1.8 0.3 1.7 0.3 1.7 0.3Total investment (% YoY) 1.8 3.5 4.8 2.3 -0.8 7.5 2.6 4.9 -3.3Exports (% YoY) 0.3 3.9 3.0 -0.1 -12.9 6.5 9.5 4.2 3.0Imports (% YoY) 1.7 4.7 4.1 1.1 -9.3 13.6 5.3 9.8 -2.7
Unemployment rate (%, last quarter) 4.8 4.1 3.8 3.6 6.8 4.4 3.9 5.7 5.7Inflation (% YoY, last quarter) 2.1 2.1 1.9 2.3 1.4 4.3 2.3 5.4 3.0Fiscal balance (% of GDP) -5.4 -4.2 -6.2 -6.6 -15.8 -11.1 -5.3 -12.0 -8.0Primary fiscal balance (% of GDP) n/a n/a n/a n/a n/a n/a n/a n/a n/aTrade balance (% of GDP) -4.1 -4.3 -4.4 -4.1 -4.3 -4.5 -4.3 -4.0 -3.4Current account balance (% of GDP) -2.1 -1.9 -2.2 -2.2 -3.1 -3.4 -3.0 -3.3 -2.5
Official interest rate (end of period) 0.75 1.50 2.50 1.75 0.25 0.25 0.25 0.25 0.253-month interest rate (end of period) 1.00 1.69 2.81 1.91 0.24 0.25 0.27 0.26 0.1910-year interest rate (end of period) 2.45 2.40 2.69 1.92 0.93 2.08 2.50 2.09 2.63Exchange rate vs. USD (end of period) n/r n/r n/r n/r n/r n/r n/r n/r n/rExchange rate vs. euro (end of period) 1.05 1.20 1.15 1.12 1.23 1.23 1.24 1.23 1.24
Private lending (% YoY, average) 3.3 6.9 4.6 5.3 6.2 16.6 1.0 14.4 -3.2Household lending (% YoY, average) 2.1 3.4 3.6 3.2 3.5 6.9 6.8 6.7 6.2P.S. non-financial lending (% YoY, average) 5.4 6.7 9.0 6.5 8.6 -0.3 4.2 -0.3 4.2P.S. financial lending (% YoY, average) 4.3 2.9 2.2 2.2 1.9 1.1 1.9 1.2 3.1Savings rate (as % avg. disp. income) 6.9 7.2 7.8 7.5 16.2 11.5 5.7 13.3 10.7
Source: MAPFRE Economics (based on data from the Federal Reserve) Forecast end date: July 12, 2021.
Click here to access the interactive version of this information
-15
-10
-5
0
5
10
15
20
2019
2020
2021
2022
External demand contributionDomestic demand contribution
GDP BS (YoY, %) GDP SS (YoY, %)
Source: MAPFRE Economics (based on data from the Federal Reserve)
Chart 1.2.1-b United States: domestic demand
breakdown and forecasts
-15
-10
-5
0
5
10
15
20
2019
2020
2021
2022
Public spending Inventory changesTotal investment Private consumption
Chart 1.2.1-a United States: GDP breakdown
and forecasts
Source: MAPFRE Economics (based on data from the Federal Reserve)
31
2021 ECONOMIC AND INDUSTRY OUTLOOK (Q3)
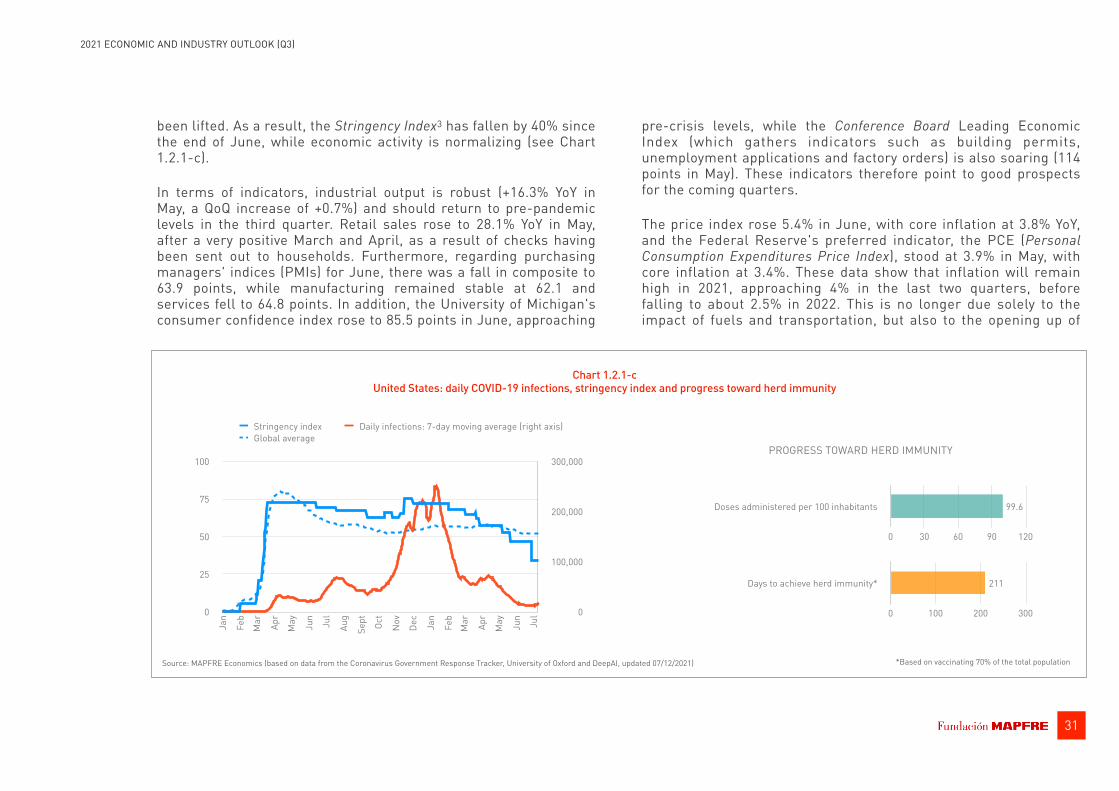
been lifted. As a result, the Stringency Index3 has fallen by 40% since the end of June, while economic activity is normalizing (see Chart 1.2.1-c).
In terms of indicators, industrial output is robust (+16.3% YoY in May, a QoQ increase of +0.7%) and should return to pre-pandemic levels in the third quarter. Retail sales rose to 28.1% YoY in May, after a very positive March and April, as a result of checks having been sent out to households. Furthermore, regarding purchasing managers' indices (PMIs) for June, there was a fall in composite to 63.9 points, while manufacturing remained stable at 62.1 and services fell to 64.8 points. In addition, the University of Michigan's consumer confidence index rose to 85.5 points in June, approaching
pre-crisis levels, while the Conference Board Leading Economic Index (which gathers indicators such as building permits, unemployment applications and factory orders) is also soaring (114 points in May). These indicators therefore point to good prospects for the coming quarters.
The price index rose 5.4% in June, with core inflation at 3.8% YoY, and the Federal Reserve's preferred indicator, the PCE (Personal Consumption Expenditures Price Index), stood at 3.9% in May, with core inflation at 3.4%. These data show that inflation will remain high in 2021, approaching 4% in the last two quarters, before falling to about 2.5% in 2022. This is no longer due solely to the impact of fuels and transportation, but also to the opening up of
0
100,000
200,000
300,000
0
25
50
75
100
Jan
Feb
Mar Ap
r
May Jun
Jul
Aug
Sept Oc
t
Nov
Dec
Jan
Feb
Mar Ap
r
May Jun
Jul
Stringency index Daily infections: 7-day moving average (right axis)Global average
Source: MAPFRE Economics (based on data from the Coronavirus Government Response Tracker, University of Oxford and DeepAI, updated 07/12/2021)
Chart 1.2.1-c United States: daily COVID-19 infections, stringency index and progress toward herd immunity
Doses administered per 100 inhabitants
0 30 60 90 120
99.6
Days to achieve herd immunity*
0 100 200 300
211
*Based on vaccinating 70% of the total population
PROGRESS TOWARD HERD IMMUNITY
32
2021 ECONOMIC AND INDUSTRY OUTLOOK (Q3)
activities (ending of restrictions) together with the accumulated savings of households, which lead the Federal Reserve to assume that inflation may remain above the 2% level for some time. Consistent with this logic, the 5-year inflation swap is now above 2.3%.
For its part, the Federal Reserve, at its June meeting, clearly changed its tone from one of accommodation to one anticipating a change of cycle in interest rates, indicating that it expects to raise rates twice during the course of 2023. This explains why discussions now center around when to begin tapering (end bond purchases), keeping markets on tenterhooks for more signals from the August meeting. For now, the Federal Reserve has maintained monthly purchases of $80 billion in Treasuries and $40 billion in mortgage-backed securities, and has kept the federal funds rate in the 0% - 0.25% range.
In addition to these facts, the risks in the coming months, centered around the course taken by the health crisis, inflationary pressures and inflation expectations, both from raw materials and from the increase in consumption associated with the ending of restrictions, will have to be monitored as they may lead to a tightening of financial conditions, both in terms of official interest rates and financing conditions in the markets. Further, it will be important to monitor labor market performance for any further adjustment, which could feed through into salary increases. In terms of the external context, we will have to look at how the recovery process progresses at the global level and the impact this will have on raw materials, the dollar and financial conditions. At the geopolitical level, the current administration appears to be promoting stable relations with China and Russia, with the aim of reducing the tensions that usually exist between these three powers.
1.2.2 Eurozone
Greater optimism for the return of in-person activities and for global recovery.
The eurozone contracted by -1.3% YoY (-0.3% QoQ) in the first quarter of the year, in a context of mobility restrictions that remained relatively high and which at the end of June left the Stringency Index below 50%. In the second quarter, restrictions began to relax as the incidence of disease d e c l i n e d a n d t h e v a c c i n a t i o n p r o c e s s progressed with 89.9 doses a d m i n i s t e r e d p e r 1 0 0 inhabitants at the beginning of July (see Chart 1.2.2-c). On the one hand, the lifting of restrictions will facilitate recovery, but consideration must also be given to voluntary limitation of movement as long as the population is not completely sure that the pandemic has ended. At the end of June, mobility in the eurozone was about 10% below that of 2019.
• Improvements are seen in pur-chasing managers' indices and trust.
• The deployment of European Union funds will begin in the sec-ond half of 2021, aimed at digital investment and the environment.
• The European Central Bank main-tains a faster pace of purchases in order to ensure broad liquidity conditions and low interest rates.
• The forecast for GDP growth in 2021 is revised upward to 4.5%.

33
2021 ECONOMIC AND INDUSTRY OUTLOOK (Q3)
Table 1.2.2 Eurozone: main macroeconomic aggregates
Baseline (BS) Stressed (SS)
2016 2017 2018 2019 2020(e) 2021(f) 2022(f) 2021(f) 2022(f)
GDP (% YoY) 1.8 2.7 1.9 1.3 -6.7 4.5 4.5 2.3 -0.3Domestic demand contribution 2.3 2.3 1.7 1.8 -6.1 3.7 4.7 1.6 0.0External demand contribution -0.4 0.4 0.1 -0.5 -0.6 0.8 -0.2 0.7 -0.3Private consumption contribution 1.0 1.0 0.8 0.7 -4.2 1.5 3.7 0.1 0.5Total investment contribution 0.8 0.9 0.7 1.2 -1.8 1.3 0.9 0.8 -0.4Public spending contribution 0.4 0.2 0.2 0.4 0.3 0.6 0.3 0.6 0.3Private consumption (% YoY) 1.9 1.9 1.5 1.3 -8.0 3.0 7.0 0.1 1.0Public consumption (% YoY) 1.9 1.1 1.2 1.8 1.4 2.8 1.2 2.8 1.2Total investment (% YoY) 3.9 4.2 3.2 5.7 -8.4 6.0 4.1 3.7 -1.8Exports (% YoY) 2.9 5.9 3.6 2.5 -9.6 9.0 6.1 6.6 -0.2Imports (% YoY) 4.2 5.4 3.6 3.9 -9.1 8.0 7.0 5.6 0.6
Unemployment rate (%, last quarter) 9.8 8.7 7.9 7.4 8.3 8.7 8.3 10.0 10.3Inflation (% YoY, last quarter) 0.7 1.4 1.9 1.0 -0.3 2.7 1.3 3.7 1.8Fiscal balance (% of GDP) -1.5 -0.9 -0.5 -0.6 -7.3 -6.8 -3.9 -7.7 -7.0Primary fiscal balance (% of GDP) 0.6 1.0 1.4 1.0 -5.7 5.1 7.2 4.4 4.9Trade balance (% of GDP) 0.0 0.0 0.0 0.0 0.0 0.0 0.0 0.0 0.0Current account balance (% of GDP) 3.0 3.2 3.1 2.4 2.2 2.5 2.3 2.4 2.4
Official interest rate (end of period) 0.00 0.00 0.00 0.00 0.00 0.00 0.00 0.00 0.003-month interest rate (end of period) -0.32 -0.33 -0.31 -0.38 -0.55 -0.48 -0.44 -0.47 -0.4210-year interest rate (end of period) 0.93 1.14 1.17 0.32 -0.19 0.52 0.73 1.77 1.81Exchange rate vs. USD (end of period) 1.05 1.20 1.15 1.12 1.23 1.23 1.24 1.23 1.24Exchange rate vs. euro (end of period) n/r n/r n/r n/r n/r n/r n/r n/r n/r
Private lending (% YoY, average) n/a n/a n/a n/a n/a n/a n/a n/a n/aHousehold lending (% YoY, average) 1.5 2.3 2.7 3.3 2.9 3.1 3.9 2.8 1.7P.S. non-financial lending (% YoY, average) 2.9 1.4 2.9 1.7 2.5 0.1 2.0 -0.7 0.0P.S. financial lending (% YoY, average) 3.8 2.2 -0.6 1.6 -0.8 -1.0 3.3 -1.0 4.0Savings rate (as % avg. disp. income) 12.4 12.3 12.5 12.9 19.8 17.7 13.0 19.3 17.6
Source: MAPFRE Economics (based on data from ECB) Forecast end date: July 12, 2021.
Click here to access the interactive version of this information
-20
-10
0
10
2020
19
2020
2021
2022
External demand contributionDomestic demand contribution
GDP BS (YoY, %) GDP SS (YoY, %)
Source: MAPFRE Economics (based on data from ECB)
Chart 1.2.2-b Eurozone: domestic demand breakdown
and forecasts
-20
-10
0
10
20
2019
2020
2021
2022
Public spending Inventory changesTotal investment Private consumption
Chart 1.2.2-a Eurozone: GDP breakdown
and forecasts
Source: MAPFRE Economics (based on data from ECB)

34
2021 ECONOMIC AND INDUSTRY OUTLOOK (Q3)
Looking ahead to the next few quarters, everything points to an improvement in expectations, with consumer confidence rising and retail sales, industrial output and mobility also increasing in malls and leisure centers. Purchasing managers' indices (PMIs) improved in June, with the composite at 59.2 points, manufacturing at 63.4 and services at 58 points. New vehicle registrations have partially recovered but are at 30% of pre-crisis levels.
One factor of the utmost importance to take into account is the NextGenerationEU (NGEU) assistance program, which is beginning to be deployed and which will play a key role in boosting eurozone economies. In addition to these funds, the level of private consumption will also play a prominent role in the economic recovery,
as households are set to spend savings accumulated during periods of restricted mobility. Nonetheless, there remains a degree of uncertainty around growth forecasts, mainly linked to tourism and leisure activities, consumer behavior, and the role of exports and private investment. In this context, which is showing signs of improvement, the GDP growth forecast has been raised to 4.5% (from 4.0%) for 2021 and to 4.5% (from 4.1%) for 2022 (see Table 1.2.2 and Charts 1.2.2-a and 1.2.2-b).
Inflation in the eurozone stood at 1.9% in June, mainly because of the increase in fuel prices, with core inflation at 0.9%. It should also continue to rise toward 2.5% by Year-end, due to the effect of the price of oil, which has already pushed through 75 US dollars per
-60,000
0
60,000
120,000
180,000
0
25
50
75
100
Jan
Feb
Mar Ap
r
May Jun
Jul
Aug
Sept Oc
t
Nov
Dec
Jan
Feb
Mar Ap
r
May Jun
Jul
Stringency index Daily infections: 7-day moving average (right axis)Global average
Source: MAPFRE Economics (based on data from the Coronavirus Government Response Tracker, University of Oxford and DeepAI, updated 07/12/2021)
Chart 1.2.2-c Eurozone: daily COVID-19 infections, stringency index and progress toward herd immunity
Doses administered per 100 inhabitants
0 30 60 90 120
89.9
Days to achieve herd immunity*
0 100 200 300
81
*Based on vaccinating 70% of the total population
PROGRESS TOWARD HERD IMMUNITY
35
2021 ECONOMIC AND INDUSTRY OUTLOOK (Q3)
barrel. In the longer-term, the trend in prices will depend on the recovery of consumption, possible supply disruptions, changes in raw materials prices and, no less important, changes in salaries, which should not increase too sharply as long as there is some "slack" in the labor market.
For its part, the European Central Bank (ECB), at its meeting on June 10, held interest rates at: 0% on the main financing operations and -0.50% on the deposit facility, and does not expect to change these until inflation is very close to, but below 2%. The ECB also intends to keep the pace of purchases under the PEPP (Pandemic Emergency Purchase Programme) at a higher level than in the first months of the year, and this program is expected to run until March 2022. The ECB has also decided to maintain the conditions of the APP (pre-pandemic Asset Purchase Programme) and TLTRO III (long-term refinancing for credit institutions) programs. The aim is to preserve favorable financing conditions for all sectors of the economy, which are necessary for a sustained recovery of the economy and to safeguard price stability.
Risks in the eurozone at the sovereign economic and financial level appear to be under control as a result of ample liquidity, low interest rates, ECB support and government stimulus programs. The major unknown element is how the withdrawal of support for temporarily unemployed persons will be implemented and what effects this will have on companies. NGEU funds will begin to be deployed soon and are expected to be a major support, but they will go toward investments in the "environmental transition" and "digital" spheres rather than supporting businesses affected by the crisis. It is worth remembering that the pandemic may seem to be subsiding now, but it is not over, so the main risk is of new waves occurring, as seen in the United Kingdom, or of vaccines not being effective against new variants of the virus.
1.2.3 Spain
The focus is on the recovery of tourism in the summer season and the application of NGEU funds.
Spain's GDP fell by -4.3% YoY in the first quarter of 2021 (by -0.5% QoQ), and mobility restrictions in the previous year only began to be lifted at the end of the q u a r t e r . P r i v a t e consumption fell by -3.9% YoY (by -0.1% QoQ), exports remained almost stagnant (down -0.1% QoQ), while public spending rose by 3.8% YoY (up +0.5% QoQ) and investment contracted by -4.2% YoY (down -1.9% QoQ). With the end of the state of emergency in Spain on May 9, a number of activities have returned to normal. Although there are s t i l l s o m e h e a l t h recommendations, the legal underpinning for extending some curfew measures and mobility limitations has already lapsed. Moreover, with the progress of vaccination, which was close to 50% of the population at the end of June (with 99.7 doses administered per 100 inhabitants), there is a perception that the epidemic is beginning to be controlled (see Chart 1.2.3-c).
• Despite being open to tourism (subject to certain restrictions), the United Kingdom did not place Spain on its list of unrestricted countries.
• From the second half of 2021, the appropriate use of European Union funds (NGEU) will be impor-tant in order to boost investment and to secure medium-term pro-ductivity gains.
• The rise in inflation will increase pension spending.
• As the Central Bank of Spain has pointed out, there is an urgent need to enact fiscal consolidation and a spending review.

36
2021 ECONOMIC AND INDUSTRY OUTLOOK (Q3)
Table 1.2.3 Spain: main macroeconomic aggregates
Baseline (BS) Stressed (SS)
2016 2017 2018 2019 2020(e) 2021(f) 2022(f) 2021(f) 2022(f)
GDP (% YoY) 3.0 3.0 2.4 2.0 -10.8 6.0 6.0 3.8 0.8Domestic demand contribution 2.0 3.2 3.0 1.4 -8.9 5.5 5.4 3.2 -0.4External demand contribution 1.0 -0.2 -0.6 0.6 -1.9 0.5 0.6 0.6 1.1Private consumption contribution 1.6 1.8 1.0 0.5 -6.9 3.4 3.7 2.2 0.2Total investment contribution 0.4 1.3 1.2 0.5 -2.2 1.4 1.7 0.6 -0.2Public spending contribution 0.2 0.2 0.5 0.4 0.8 0.8 0.3 0.8 0.4Private consumption (% YoY) 2.7 3.0 1.8 0.9 -12.1 6.0 6.6 3.9 0.3Public consumption (% YoY) 1.0 1.0 2.6 2.3 3.8 3.5 1.7 3.5 1.7Total investment (% YoY) 2.4 6.8 6.1 2.7 -11.4 7.3 8.5 3.3 -1.0Exports (% YoY) 5.4 5.5 2.3 2.3 -20.2 11.0 10.1 8.8 4.0Imports (% YoY) 2.7 6.8 4.2 0.7 -15.8 9.9 8.7 7.2 0.6
Unemployment rate (%, last quarter) 18.6 16.6 14.5 13.8 16.1 15.7 15.0 18.6 18.4Inflation (% YoY, last quarter) 1.6 1.1 1.2 0.8 -0.5 2.8 1.3 3.8 1.4Fiscal balance (% of GDP) -4.3 -3.0 -2.5 -2.9 -11.0 -8.2 -5.8 -9.4 -9.1Primary fiscal balance (% of GDP) -1.5 -0.5 -0.1 -0.6 -8.8 -6.2 -3.9 -7.4 -7.0Trade balance (% of GDP) -1.3 -1.9 -2.5 -2.1 -0.8 -0.9 -2.3 -0.8 -1.2Current account balance (% of GDP) 3.2 2.8 1.9 2.1 0.7 0.8 1.5 0.9 2.3
Official interest rate (end of period) 0.00 0.00 0.00 0.00 0.00 0.00 0.00 0.00 0.003-month interest rate (end of period) -0.32 -0.33 -0.31 -0.38 -0.55 -0.48 -0.44 -0.47 -0.4210-year interest rate (end of period) 1.37 1.57 1.42 0.47 0.06 0.86 1.22 2.38 2.76Exchange rate vs. USD (end of period) 1.05 1.20 1.15 1.12 1.23 1.23 1.24 1.23 1.24Exchange rate vs. euro (end of period) n/r n/r n/r n/r n/r n/r n/r n/r n/r
Private lending (% YoY, average) n/a n/a n/a n/a n/a n/a n/a n/a n/aHousehold lending (% YoY, average) -2.5 -1.4 -0.3 -0.2 -0.9 3.6 3.1 3.2 0.3P.S. non-financial lending (% YoY, average) -2.7 -1.1 -1.4 -0.6 2.3 2.1 2.4 -2.1 -6.0P.S. financial lending (% YoY, average) -16.4 -7.9 -0.5 -4.9 3.0 8.4 3.1 8.6 4.2Savings rate (as % avg. disp. income) 7.5 6.1 5.9 6.6 15.4 9.7 5.4 10.7 8.8
Source: MAPFRE Economics (based on data from INE) Forecast end date: July 12, 2021.
Click here to access the interactive version of this information
-30
-20
-10
0
10
20
2019
2020
2021
2022
External demand contributionDomestic demand contribution
GDP BS (YoY, %) GDP SS (YoY, %)
Source: MAPFRE Economics (based on data from INE)
Chart 1.2.3-b Spain: domestic demand breakdown
and forecasts
-30
-20
-10
0
10
20
2019
2020
2021
2022
Public spending Inventory changesTotal investment Private consumption
Chart 1.2.3-a Spain: GDP breakdown
and forecasts
Source: MAPFRE Economics (based on data from INE)

37
2021 ECONOMIC AND INDUSTRY OUTLOOK (Q3)
Hotel and tourism activities have reopened, although subject to certain conditions. Spain has been open to foreign tourism, subject to provision of either a negative PCR diagnostic test or a vaccination certificate. However, opening to tourism will be undermined by the conditions (quarantines) imposed on some originating countries, in particular the United Kingdom which, as of June, had not included Spain on its green list (so no quarantine exemption on return to that country). The number of tourists may also be restricted by people's own fears about travel, until the pandemic is completely over.
Also, the disbursement of European Union funds (NGEU), mainly for investment in environmental and digitization areas, will provide significant support in emerging from the crisis. These funds will seek to boost growth in the second half of 2021 and throughout 2022, but they will not be able to fully make up for lower activity in other sectors. With regard to indicators, outlook surveys improved in May, while the consumer confidence indicator also continued to rise to -9.9, while the European Union's economic sentiment indicator saw a return to 2019 levels (108.3). Purchasing managers' indices (PMIs) are improving, including services (62.5 points in June), manufacturing (60.4 points in June) and composite (59.2 points in May). In May, retail sales rose by 18.9% and industrial output increased by 28.2%.
-10,000
0
10,000
20,000
30,000
40,000
0
25
50
75
100
Jan
Feb
Mar Ap
r
May Jun
Jul
Aug
Sept Oc
t
Nov
Dec
Jan
Feb
Mar Ap
r
May Jun
Jul
Stringency index Daily infections: 7-day moving average (right axis)Global average
Source: MAPFRE Economics (based on data from the Coronavirus Government Response Tracker, University of Oxford and DeepAI, updated 07/12/2021)
Chart 1.2.3-c Spain: daily COVID-19 infections, stringency index and progress toward herd immunity
Doses administered per 100 inhabitants
0 30 60 90 120
99.7
Days to achieve herd immunity*
0 100 200 300
34
*Based on vaccinating 70% of the total population
PROGRESS TOWARD HERD IMMUNITY
38
2021 ECONOMIC AND INDUSTRY OUTLOOK (Q3)
Accordingly, we maintain our estimate of 6.0% for economic growth in 2021 and have revised our 2022 estimate upward to 6.0% from 5.0% (see Table 1.2.3 and Charts 1.2.3-a and 1.2.3-b).
Inflation in May was pushed up to 2.7%, due to the rise in the price of oil (core inflation was 0.2%), and could end the year at around 2% (in contrast to our previous estimate of 1.6%). In the medium-term, however, if the price of oil stabilizes, we believe that inflation will come down again as there is slack in the labor market and downward pressure on salaries. Meanwhile, the 2021 inflation average will lead to an increase in state pension spending to over two billion euros.
Finally, risks to be taken into account with regard to the Spanish economy stem mainly from a summer with fewer tourists than expected, and also from the increase in energy expenditure due to the rise in the price of oil. This is without forgetting the risks associated with the fact that the battle against the pandemic has still not been won and an influx of tourists could lead to a return of transmission, despite the cautions being taken. If European Union funds are well channeled, they should help increase economic output and growth and rebalance public finances, which need to be consolidated, which must include a review of expenditure, following recommendations by the Central Bank of Spain.
1.2.4 Germany
Consumer confidence and industry surveys indicate a strong recovery from the second quarter.
GDP contracted by -3.1% YoY in the first quarter (by -1.8% QoQ) due to restrictions adopted to deal with the Covid-19 pandemic, which resulted in a Stringency Index of 68%, the highest in the eurozone
(see Chart 1.2.4-c). Consumption accordingly fell by -8.9% YoY (by -5.4% QoQ), partly also affected by the raising of VAT to its usual level, while exports declined (down -0.2% YoY, but up +1.9% QoQ). Our outlook for 2021 is for GDP growth of 3.7%, which was constrained by the heavy restrictions in the first quarter of the current year, followed by growth of 4.4% in 2022 (see Table 1.2.4 and Charts 1.2.4-a and 1.2.4-b).
The GfK Consumer Confidence Barometer has risen to -0.3 going into July, and the economic outlook soared to 58.4 points in June, while the income outlook has improved (19.5 points), although still below 2019. Factory orders increased (up +78.9%) with industrial output also rising (up +26.4%); both performed well in April, well above the declines seen in the previous year. Purchasing managers' indices (PMIs) remained high in June, with the composite a t 6 0 . 4 p o i n t s , manufacturing at 65.1 points and services at 58.1 points. The IFO indices for capital goods and machinery and equ ipment orders a lso signal an anticipated upturn i n e x p o r t s . T h e Z E W I n d i c a t o r o f E c o n o m i c Sentiment is also strong due to an increase of +79.8 to June, with the automotive, chemical and consumer goods industries confirming the trend.
• Growth will rebound from the second quarter, although the current year has already seen a f i r s t - q u a r t e r c o n t r a c t i o n (-3.1%).
• Consumer confidence points toward recovery in the second, third and fourth quarters.
• Industry expectations and factory orders rebound strongly in anticipation of robust exports.
• The September general election will entail a need for coalitions; even so, voting could be very tight.
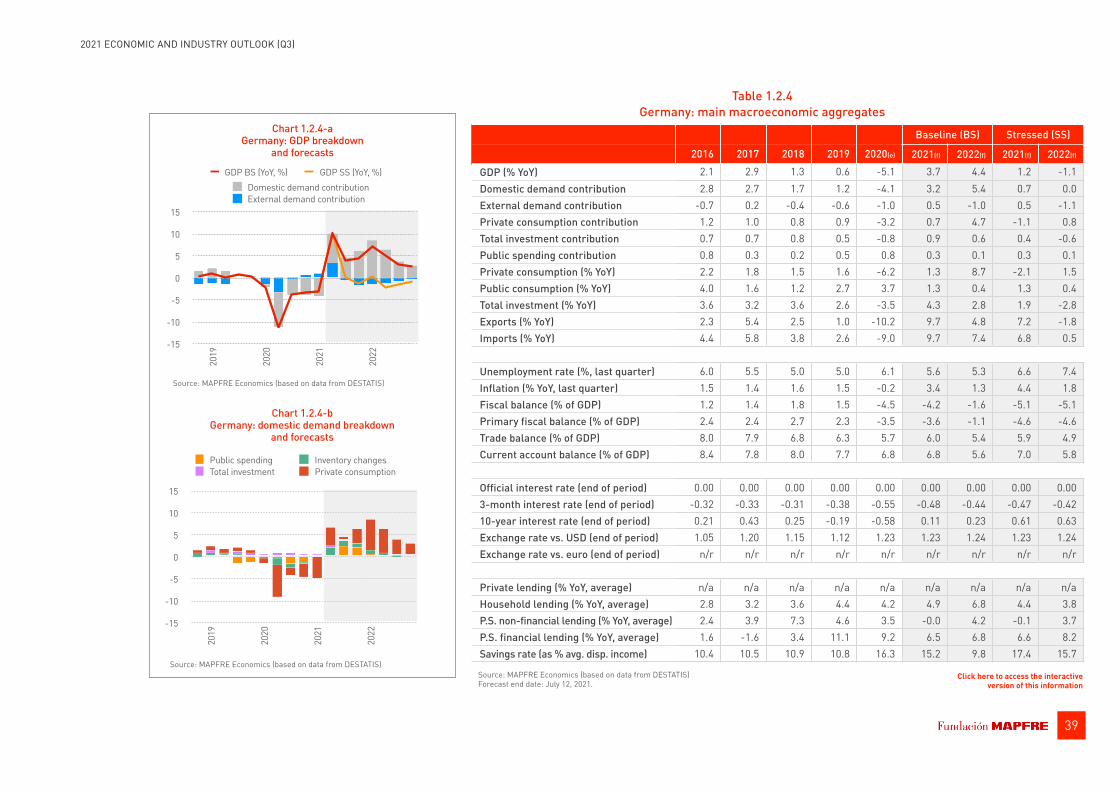
39
2021 ECONOMIC AND INDUSTRY OUTLOOK (Q3)
Table 1.2.4 Germany: main macroeconomic aggregates
Baseline (BS) Stressed (SS)
2016 2017 2018 2019 2020(e) 2021(f) 2022(f) 2021(f) 2022(f)
GDP (% YoY) 2.1 2.9 1.3 0.6 -5.1 3.7 4.4 1.2 -1.1Domestic demand contribution 2.8 2.7 1.7 1.2 -4.1 3.2 5.4 0.7 0.0External demand contribution -0.7 0.2 -0.4 -0.6 -1.0 0.5 -1.0 0.5 -1.1Private consumption contribution 1.2 1.0 0.8 0.9 -3.2 0.7 4.7 -1.1 0.8Total investment contribution 0.7 0.7 0.8 0.5 -0.8 0.9 0.6 0.4 -0.6Public spending contribution 0.8 0.3 0.2 0.5 0.8 0.3 0.1 0.3 0.1Private consumption (% YoY) 2.2 1.8 1.5 1.6 -6.2 1.3 8.7 -2.1 1.5Public consumption (% YoY) 4.0 1.6 1.2 2.7 3.7 1.3 0.4 1.3 0.4Total investment (% YoY) 3.6 3.2 3.6 2.6 -3.5 4.3 2.8 1.9 -2.8Exports (% YoY) 2.3 5.4 2.5 1.0 -10.2 9.7 4.8 7.2 -1.8Imports (% YoY) 4.4 5.8 3.8 2.6 -9.0 9.7 7.4 6.8 0.5
Unemployment rate (%, last quarter) 6.0 5.5 5.0 5.0 6.1 5.6 5.3 6.6 7.4Inflation (% YoY, last quarter) 1.5 1.4 1.6 1.5 -0.2 3.4 1.3 4.4 1.8Fiscal balance (% of GDP) 1.2 1.4 1.8 1.5 -4.5 -4.2 -1.6 -5.1 -5.1Primary fiscal balance (% of GDP) 2.4 2.4 2.7 2.3 -3.5 -3.6 -1.1 -4.6 -4.6Trade balance (% of GDP) 8.0 7.9 6.8 6.3 5.7 6.0 5.4 5.9 4.9Current account balance (% of GDP) 8.4 7.8 8.0 7.7 6.8 6.8 5.6 7.0 5.8
Official interest rate (end of period) 0.00 0.00 0.00 0.00 0.00 0.00 0.00 0.00 0.003-month interest rate (end of period) -0.32 -0.33 -0.31 -0.38 -0.55 -0.48 -0.44 -0.47 -0.4210-year interest rate (end of period) 0.21 0.43 0.25 -0.19 -0.58 0.11 0.23 0.61 0.63Exchange rate vs. USD (end of period) 1.05 1.20 1.15 1.12 1.23 1.23 1.24 1.23 1.24Exchange rate vs. euro (end of period) n/r n/r n/r n/r n/r n/r n/r n/r n/r
Private lending (% YoY, average) n/a n/a n/a n/a n/a n/a n/a n/a n/aHousehold lending (% YoY, average) 2.8 3.2 3.6 4.4 4.2 4.9 6.8 4.4 3.8P.S. non-financial lending (% YoY, average) 2.4 3.9 7.3 4.6 3.5 -0.0 4.2 -0.1 3.7P.S. financial lending (% YoY, average) 1.6 -1.6 3.4 11.1 9.2 6.5 6.8 6.6 8.2Savings rate (as % avg. disp. income) 10.4 10.5 10.9 10.8 16.3 15.2 9.8 17.4 15.7
Source: MAPFRE Economics (based on data from DESTATIS) Forecast end date: July 12, 2021.
Click here to access the interactive version of this information
-15
-10
-5
0
5
10
1520
19
2020
2021
2022
External demand contributionDomestic demand contribution
GDP BS (YoY, %) GDP SS (YoY, %)
Source: MAPFRE Economics (based on data from DESTATIS)
Chart 1.2.4-b Germany: domestic demand breakdown
and forecasts
-15
-10
-5
0
5
10
15
2019
2020
2021
2022
Public spending Inventory changesTotal investment Private consumption
Chart 1.2.4-a Germany: GDP breakdown
and forecasts
Source: MAPFRE Economics (based on data from DESTATIS)

40
2021 ECONOMIC AND INDUSTRY OUTLOOK (Q3)
Germany is one of the major beneficiaries of the global recovery. Its exports are set to increase by 9.7%; demand is mainly from Asian countries, where imports fell briefly during the crisis and are already on the rise. Investment is also rising, with an increase of 4.3% anticipated, while private consumption should rise sharply in the second quarter with the end of the restrictions, as consumers spend savings that were accumulated during the lockdowns.
Inflation soared in May to 2.5%, due to the effect of fuel prices (up +27.2%), vehicle servicing (up +14%) and vehicle purchases (up +2.7%). In the particular case of Germany, the end of the temporary
VAT reduction on December 31 will have an effect on inflation for the whole of 2021 (+2.5% increase expected), which should be more moderate in 2022 (+1.4% increase expected).
It is important to note that Germany will hold general elections on September 26, 2021, the first election without Angela Merkel, after 16 years as Chancellor. The CDU/CSU Conservatives, with their candidate, Armin Laschet, are once again leading in the polls after a brief period of the Greens being ahead following the election of Annalena Baerbock as their candidate. The CDU/CSU coalition with
0
10,000
20,000
30,000
0
25
50
75
100
Jan
Feb
Mar Ap
r
May Jun
Jul
Aug
Sept Oc
t
Nov
Dec
Jan
Feb
Mar Ap
r
May Jun
Jul
Stringency index Daily infections: 7-day moving average (right axis)Global average
Source: MAPFRE Economics (based on data from the Coronavirus Government Response Tracker, University of Oxford and DeepAI, updated 07/12/2021)
Chart 1.2.4-c Germany: daily COVID-19 infections, stringency index and progress toward herd immunity
Doses administered per 100 inhabitants
0 30 60 90 120
97.1
Days to achieve herd immunity*
0 100 200 300
55
*Based on vaccinating 70% of the total population
PROGRESS TOWARD HERD IMMUNITY

41
2021 ECONOMIC AND INDUSTRY OUTLOOK (Q3)
the Greens is the most likely to come to power, although the two combined still seem to have a very narrow margin.
Risks to the German economy seem to be under control. However, risks that could affect the recovery include a relapsing global economic recovery (which would impact exports) or a recurrence of the pandemic as a result of the higher mobility expected this summer.
1.2.5 Italy
The reopening of activities and the better global context will drive the Italian recovery.
The final growth data for the first quarter of 2021 have been revised upward to -0.8% YoY (from -1.4%). The increase has been a t t r i b u t e d t o b e t t e r investment data (+3.7% QoQ) and an improvement in inventories. Meanwhile, p r i v a t e c o n s u m p t i o n continued to decline (down -1.2% QoQ), as successive pandemic waves kept the country in a strict lockdown until the end of April with a tightening Stringency Index that was below 50% at the beginning of July (see Chart 1.2.5-c), while exports grew slightly (+0.5% QoQ).
Looking ahead to the second quarter of the year, consumption is expected to be strong due to the easing of restrictions as accumulated savings are converted into consumption. However, exports and investment should also be more dynamic going into the second half, and together with the disbursement of NextGenerationEU funds, the recovery will be even stronger.
The industrial output data for April (+79.5% YoY; +1.8% MoM) were very strong, even taking into account the base effect (down -42.5% in April 2020). All confidence indicators and factory orders are improving, and the purchasing managers' indices (PMIs) also reflect improved prospects: composite has risen to 55.7 points (May), manufacturing to 62.3 (June) and services to 53.1 (May). Accordingly, as shown in Table 1.2.5 and in Charts 1.2.5-a and 1.2.5-b, GDP growth is expected to be 4.9% (revised upward from 4.7%) for the whole of 2021 and 4.6% (revised upward from 4.2%) for 2022. A better outlook for consumption will contribute to this improvement, if the pandemic allows for progress in reopening activities, with exports also contributing significantly, driven by the global recovery.
Further, inflation rose to 1.3% in May, driven by the rise in fuel prices (+13.6%), transport services (+4.8%) and electricity (+5.9%). Inflation will be close to 2.2% by Year-end, before falling to a more moderate rate of approximately 1% by mid-2022. Salary and pension indexation clauses will certainly weigh on the public accounts, but we do not anticipate sustained high inflation as long as there is some slack in the labor market.
In terms of risks, the level of debt persists, together with a deficit that will reach 11% in 2021. It is important to appropriately direct European funds toward improving economic output and carrying out structural reforms. However, in the long-term, markets are asking
• Industrial output and factory orders confirm improved prospects.
• Exports should accelerate for the rest of the year, as consumption increases due to the return of mobility.
• Fiscal sustainability and debt levels are pending European funds and structural reforms.
• Our GDP growth estimate has been raised to 4.9% in 2021 and to 4.6% in 2022.
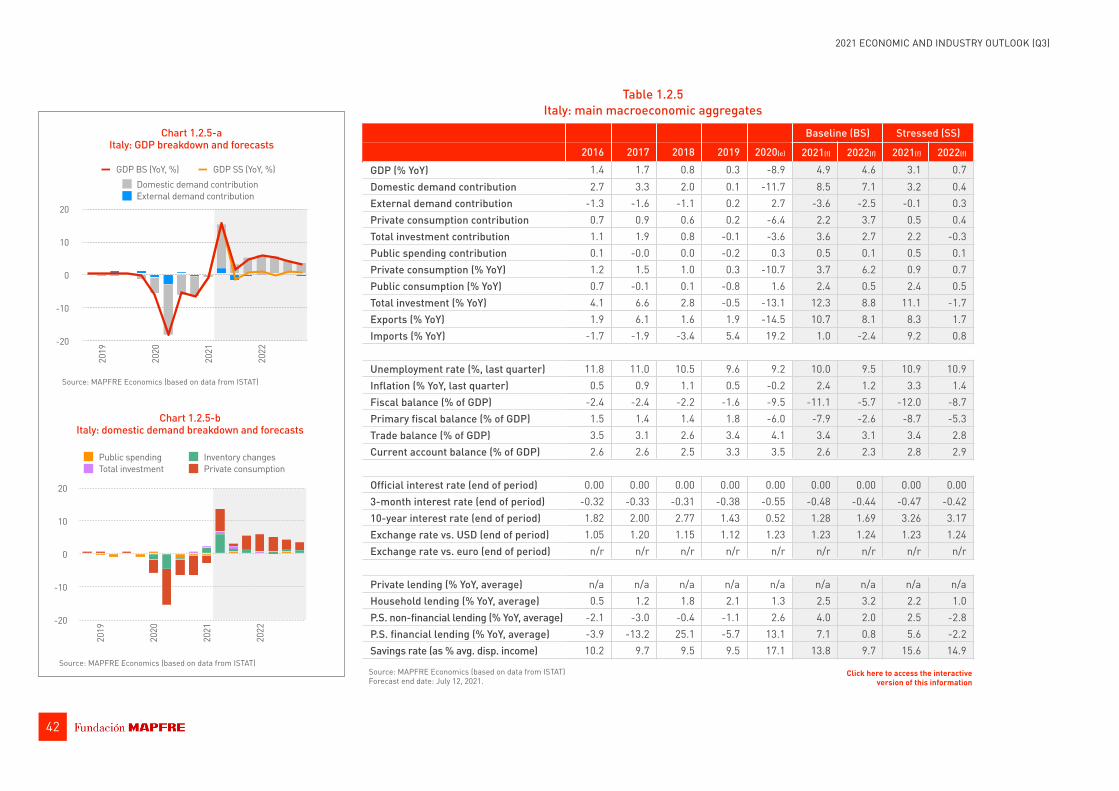
42
2021 ECONOMIC AND INDUSTRY OUTLOOK (Q3)
Table 1.2.5 Italy: main macroeconomic aggregates
Baseline (BS) Stressed (SS)
2016 2017 2018 2019 2020(e) 2021(f) 2022(f) 2021(f) 2022(f)
GDP (% YoY) 1.4 1.7 0.8 0.3 -8.9 4.9 4.6 3.1 0.7Domestic demand contribution 2.7 3.3 2.0 0.1 -11.7 8.5 7.1 3.2 0.4External demand contribution -1.3 -1.6 -1.1 0.2 2.7 -3.6 -2.5 -0.1 0.3Private consumption contribution 0.7 0.9 0.6 0.2 -6.4 2.2 3.7 0.5 0.4Total investment contribution 1.1 1.9 0.8 -0.1 -3.6 3.6 2.7 2.2 -0.3Public spending contribution 0.1 -0.0 0.0 -0.2 0.3 0.5 0.1 0.5 0.1Private consumption (% YoY) 1.2 1.5 1.0 0.3 -10.7 3.7 6.2 0.9 0.7Public consumption (% YoY) 0.7 -0.1 0.1 -0.8 1.6 2.4 0.5 2.4 0.5Total investment (% YoY) 4.1 6.6 2.8 -0.5 -13.1 12.3 8.8 11.1 -1.7Exports (% YoY) 1.9 6.1 1.6 1.9 -14.5 10.7 8.1 8.3 1.7Imports (% YoY) -1.7 -1.9 -3.4 5.4 19.2 1.0 -2.4 9.2 0.8
Unemployment rate (%, last quarter) 11.8 11.0 10.5 9.6 9.2 10.0 9.5 10.9 10.9Inflation (% YoY, last quarter) 0.5 0.9 1.1 0.5 -0.2 2.4 1.2 3.3 1.4Fiscal balance (% of GDP) -2.4 -2.4 -2.2 -1.6 -9.5 -11.1 -5.7 -12.0 -8.7Primary fiscal balance (% of GDP) 1.5 1.4 1.4 1.8 -6.0 -7.9 -2.6 -8.7 -5.3Trade balance (% of GDP) 3.5 3.1 2.6 3.4 4.1 3.4 3.1 3.4 2.8Current account balance (% of GDP) 2.6 2.6 2.5 3.3 3.5 2.6 2.3 2.8 2.9
Official interest rate (end of period) 0.00 0.00 0.00 0.00 0.00 0.00 0.00 0.00 0.003-month interest rate (end of period) -0.32 -0.33 -0.31 -0.38 -0.55 -0.48 -0.44 -0.47 -0.4210-year interest rate (end of period) 1.82 2.00 2.77 1.43 0.52 1.28 1.69 3.26 3.17Exchange rate vs. USD (end of period) 1.05 1.20 1.15 1.12 1.23 1.23 1.24 1.23 1.24Exchange rate vs. euro (end of period) n/r n/r n/r n/r n/r n/r n/r n/r n/r
Private lending (% YoY, average) n/a n/a n/a n/a n/a n/a n/a n/a n/aHousehold lending (% YoY, average) 0.5 1.2 1.8 2.1 1.3 2.5 3.2 2.2 1.0P.S. non-financial lending (% YoY, average) -2.1 -3.0 -0.4 -1.1 2.6 4.0 2.0 2.5 -2.8P.S. financial lending (% YoY, average) -3.9 -13.2 25.1 -5.7 13.1 7.1 0.8 5.6 -2.2Savings rate (as % avg. disp. income) 10.2 9.7 9.5 9.5 17.1 13.8 9.7 15.6 14.9
Source: MAPFRE Economics (based on data from ISTAT) Forecast end date: July 12, 2021.
Click here to access the interactive version of this information
-20
-10
0
10
20
2019
2020
2021
2022
External demand contributionDomestic demand contribution
GDP BS (YoY, %) GDP SS (YoY, %)
Source: MAPFRE Economics (based on data from ISTAT)
Chart 1.2.5-b Italy: domestic demand breakdown and forecasts
-20
-10
0
10
20
2019
2020
2021
2022
Public spending Inventory changesTotal investment Private consumption
Chart 1.2.5-a Italy: GDP breakdown and forecasts
Source: MAPFRE Economics (based on data from ISTAT)

43
2021 ECONOMIC AND INDUSTRY OUTLOOK (Q3)
who will replace the ECB in terms of demand for Italian bonds once the Pandemic Emergency Purchase Programme comes to an end.
1.2.6 United Kingdom
The economy is improving as a result of domestic demand, although exports driven by the effect of Brexit have not yet taken off.
First-quarter GDP in the United Kingdom fell by -6.1% YoY (-1.5% QoQ), after a sharp peak in cases was confirmed with corresponding mobility restrictions implemented in January. Since then, the restriction measures began to be relaxed (with a Stringency Index of 51% at the beginning of July), especially in the hospitality and
leisure sectors in mid-April. More recently, the decision was made to extend restrictions by one more month, until July 19 (whereas they were initially set to end on June 21), as a result of the Indian variant that has caused a rebound in the number of infections (see Chart 1.2.6-c). This spread affects the economic growth forecast, which was improving in line with developments in other parts of the world.
Activity data reveal a slight drop in industrial output in April, falling by -1.3% MoM, but the Index of Services rose by 3.4% in April. Retail sales rose by 9% MoM (37% compared to the previous year, due to the base effect) and vehicle registrations increased by 11% MoM in May (no comparison with 2020 when they cratered).
0
10,000
20,000
30,000
40,000
0
25
50
75
100Ja
n
Feb
Mar Ap
r
May Jun
Jul
Aug
Sept Oc
t
Nov
Dec
Jan
Feb
Mar Ap
r
May Jun
Jul
Stringency index Daily infections: 7-day moving average (right axis)Global average
Source: MAPFRE Economics (based on data from the Coronavirus Government Response Tracker, University of Oxford and DeepAI, updated 07/12/2021)
Chart 1.2.5-c Italy: daily COVID-19 infections, stringency index and progress toward herd immunity
Doses administered per 100 inhabitants
0 30 60 90 120
92.5
Days to achieve herd immunity*
0 100 200 300
55
*Based on vaccinating 70% of the total population
PROGRESS TOWARD HERD IMMUNITY

44
2021 ECONOMIC AND INDUSTRY OUTLOOK (Q3)
Table 1.2.6 United Kingdom: main macroeconomic aggregates
Baseline (BS) Stressed (SS)
2016 2017 2018 2019 2020(e) 2021(f) 2022(f) 2021(f) 2022(f)
GDP (% YoY) 1.7 1.7 1.3 1.4 -9.8 5.1 5.3 4.9 0.8Domestic demand contribution 4.5 2.1 1.8 2.6 -14.9 5.8 8.7 4.7 0.6External demand contribution -2.8 -0.4 -0.6 -1.2 5.0 -0.6 -3.3 0.1 0.1Private consumption contribution 2.3 0.6 0.8 0.7 -6.5 0.5 4.4 0.6 0.7Total investment contribution 1.2 0.8 0.9 0.9 -5.3 1.0 3.1 1.0 0.0Public spending contribution 0.2 0.1 0.1 0.8 -1.3 3.0 0.0 3.0 0.0Private consumption (% YoY) 3.7 1.0 1.3 1.1 -10.6 0.8 7.4 1.0 1.2Public consumption (% YoY) 1.0 0.7 0.6 4.0 -6.5 13.9 0.2 13.9 0.2Total investment (% YoY) 3.9 2.6 2.7 2.7 -17.8 3.6 10.2 5.7 0.2Exports (% YoY) 2.7 5.4 3.0 2.7 -15.8 2.1 8.2 -0.3 2.1Imports (% YoY) 0.1 -0.5 -0.6 -0.6 22.5 1.1 -1.5 0.5 2.0
Unemployment rate (%, last quarter) 4.7 4.4 4.0 3.8 5.1 5.0 4.5 6.3 7.2Inflation (% YoY, last quarter) 1.8 2.7 2.0 1.3 0.8 2.3 2.1 3.2 2.7Fiscal balance (% of GDP) -3.3 -2.4 -2.2 -2.4 -12.4 -10.5 -4.9 -11.3 -7.8Primary fiscal balance (% of GDP) -0.6 0.5 0.5 0.1 -10.4 -8.7 -3.0 -9.4 -5.7Trade balance (% of GDP) -6.6 -6.5 -6.4 -5.9 -5.5 -5.7 -6.0 -5.5 -5.1Current account balance (% of GDP) -5.5 -3.8 -3.7 -3.1 -3.5 -3.2 -3.5 -3.1 -2.8
Official interest rate (end of period) 0.25 0.50 0.75 0.75 0.10 0.10 0.13 -0.24 -0.193-month interest rate (end of period) 0.37 0.52 0.91 0.79 0.03 0.10 0.12 -0.01 -0.0210-year interest rate (end of period) 1.24 1.19 1.27 0.83 0.20 1.01 1.32 1.39 1.42Exchange rate vs. USD (end of period) 1.23 1.35 1.28 1.32 1.37 1.43 1.44 1.42 1.43Exchange rate vs. euro (end of period) 1.17 1.13 1.12 1.18 1.11 1.16 1.16 1.16 1.16
Private lending (% YoY, average) n/a n/a n/a n/a n/a n/a n/a n/a n/aHousehold lending (% YoY, average) 3.7 4.0 3.1 2.1 2.8 3.3 3.5 3.2 2.4P.S. non-financial lending (% YoY, average) 4.5 9.4 7.1 -2.6 5.6 0.1 1.4 0.0 1.0P.S. financial lending (% YoY, average) 7.7 8.4 5.3 2.7 10.7 -1.2 5.0 -1.1 6.3Savings rate (as % avg. disp. income) 7.6 5.7 6.1 6.5 15.8 12.3 7.3 14.6 12.8
Source: MAPFRE Economics (based on data from the Office for National Statistics) Forecast end date: July 12, 2021.
Click here to access the interactive version of this information
-30
-20
-10
0
10
20
30
2019
2020
2021
2022
External demand contributionDomestic demand contribution
GDP BS (YoY, %) GDP SS (YoY, %)
Source: MAPFRE Economics (based on data from the Office for National Statistics)
Chart 1.2.6-b United Kingdom: domestic demand breakdown
and forecasts
-30
-20
-10
0
10
20
30
2019
2020
2021
2022
Public spending Inventory changesTotal investment Private consumption
Chart 1.2.6-a United Kingdom: GDP breakdown and forecasts
Source: MAPFRE Economics (based on data from the Office for National Statistics)

45
2021 ECONOMIC AND INDUSTRY OUTLOOK (Q3)
GfK's Consumer Confidence Barometer rose to -9, up to 2018/19 levels, but far short of pre-Brexit levels seen in 2015. The purchasing managers' indices (PMIs) for June were very positive, with composite at 61.7 points, manufacturing at 63.9 and services at 61.7.
In this context, our estimate for growth continues to be 5.1% for 2021 and we have increased our 2022 estimate by 0.1% to 5.3% (see Table 1.2.6 and Charts 1.2.6-a and 1.2.6-b). This recovery is mainly led by government expenditure (+13.9%) and investment (+3.6%). However, exports will not recover until the UK succeeds in refocusing on new export markets after Brexit.
Further, inflation rose more than expected in June to 2.1%, with core inflation at 2.0%. There were base and temporary effects on fuels, and also on electricity, in addition to transportation, vehicle prices and home appliances. It is expected that in 2021 inflation will average 1.4% and in 2022 it will be above 2%.
• The scheduled reopening in June was delayed to July due to the number of pandemic cases. The United Kingdom is the European country where vaccination is most advanced, opening up the possibility of a quicker removal of restrictions.
• Exports are not yet picking up as a result of Brexit . Consumer confidence and retail sales improve.
0
20,000
40,000
60,000
0
25
50
75
100
Jan
Feb
Mar Ap
r
May Jun
Jul
Aug
Sept Oc
t
Nov
Dec
Jan
Feb
Mar Ap
r
May Jun
Jul
Stringency index Daily infections: 7-day moving average (right axis)Global average
Source: MAPFRE Economics (based on data from the Coronavirus Government Response Tracker, University of Oxford and DeepAI, updated 07/12/2021)
Chart 1.2.6-c United Kingdom: daily COVID-19 infections, stringency index and progress toward herd immunity
Doses administered per 100 inhabitants
0 30 60 90 120
117.9
Days to achieve herd immunity*
0 100 200 300
50
*Based on vaccinating 70% of the total population
PROGRESS TOWARD HERD IMMUNITY

46
2021 ECONOMIC AND INDUSTRY OUTLOOK (Q3)
The Bank of England, at its meeting on June 24, held interest rates at 0.10% and purchases of sterling-denominated investment-grade non-financial corporate bonds at £20 billion. The central bank kept the target for government bond holdings at £875 billion and the total asset stock at £895 billion. The Bank of England has taken the view that the effects of raw materials prices and some supply difficulties will have a transitional effect on prices, and therefore thinks that its monetary policy position is appropriate at the moment.
Regarding risks, there remains that of a slow increase in exports post-Brexit, as well as those related to the health crisis. It remains to be seen whether vaccines in the country that has made most progress in this area have indeed been the solution and whether they will effectively protect against virus variants. Activity re-openings and the spending of accumulated savings could, meanwhile, positively impact economic activity levels.
1.2.7 Japan
The recovery is taking a long time due to lower mobility, but exports are buoyant.
The Japanese economy contracted by -1.6% YoY (-1.0% QoQ) in the first quarter of 2021, due to the return of mobility restrictions. Some indicators, such as retail sales and consumer confidence, point to the fact that the second quarter will still be difficult. Mobility indicators for business and leisure are not as bad as they were in the first quarter (-20% and -25%, respectively), but are still -15% below normal. The Stringency Index stood at 53% at the beginning of July. The vaccination campaign began later than in other countries and, for the time being, the coefficient is 45.3 doses per 100 inhabitants, so the lifting of restrictions may be slower than in other countries (see Chart 1.2.7-c).
Industrial output increased (up +15.4% in April) and exports are strong. In fact, exports are expected to rise 12.8% this year, due to the improved external context. Domestic consumption will not be fully restored until normality returns (private consumption +1.6% and public consumption +1.7%). The purchasing managers' indices (PMIs) for June stood at 47.8 points for c o m p o s i t e , 5 2 . 4 f o r manufacturing and 47.2 for services, revealing that the services sector has still not fully recovered. For its part, Tankan business conditions indicators are improving, mainly for manufacturing, however non-manufacturing indicators remain in negative territory. Accordingly, our GDP growth forecast for 2021 of 2.4% and 2.9% for 2022 is based on moderate consumption growth and a very positive upturn in exports (see Table 1.2.7 and Charts 1.2.7-a and 1.2.7-b).
Inflation, for its part, remains negative (-0.4% in May), with core inflation at -0.1%, and is expected to remain negative in the coming quarters despite the inflationary context being confirmed in other parts of the world. Food is negative, as is electricity and gas, while fuels inflation has risen to 11.8%. At its meeting on June 18, the Bank of Japan held interest rates at -0.10% and further decided to: (i) extend the special support program (for the pandemic) for six months, until March 2022; (ii) control the curve (purchase the necessary amounts, without setting limits) of 10-year bonds, so that
• Recovery for the Japanese economy will remain slow until the services sector completely returns to normal.
• Vaccination started late; only 12% of the population is vaccinated.
• Exports are strong, benefiting from a recovering external context
• There will be elections at the end of the summer for the Prime M i n i s t e r a n d H o u s e o f Representatives.

47
2021 ECONOMIC AND INDUSTRY OUTLOOK (Q3)
Table 1.2.7 Japan: main macroeconomic aggregates
Baseline (BS) Stressed (SS)
2016 2017 2018 2019 2020(e) 2021(f) 2022(f) 2021(f) 2022(f)
GDP (% YoY) 0.7 1.7 0.6 0.0 -4.7 2.4 2.9 0.8 -0.8Domestic demand contribution 0.1 1.6 1.1 0.6 -5.2 2.9 3.1 0.1 -0.8External demand contribution 0.6 0.1 -0.5 -0.6 0.5 -0.5 -0.1 0.7 -0.1Private consumption contribution -0.3 0.6 0.1 -0.1 -3.2 0.8 1.5 -0.1 -0.4Total investment contribution -0.2 0.6 0.7 0.2 -1.3 1.5 0.8 -0.1 -0.3Public spending contribution 0.3 0.0 0.2 0.4 0.6 0.4 0.0 0.4 0.0Private consumption (% YoY) -0.5 1.1 0.2 -0.2 -6.0 1.6 2.8 -0.2 -0.8Public consumption (% YoY) 1.6 0.1 1.0 1.9 2.7 1.7 0.1 1.7 0.1Total investment (% YoY) -1.2 3.3 3.8 1.1 -7.3 7.9 4.2 -0.3 -1.3Exports (% YoY) 1.6 6.6 3.8 -1.5 -11.8 14.0 6.5 10.9 -1.0Imports (% YoY) 2.8 -0.0 0.6 0.9 9.4 2.5 -0.6 6.1 -0.5
Unemployment rate (%, last quarter) 3.0 2.7 2.4 2.3 3.0 2.7 2.4 3.3 3.5Inflation (% YoY, last quarter) 0.3 0.6 0.9 0.5 -0.8 1.0 0.1 1.3 0.1Fiscal balance (% of GDP) -3.6 -3.1 -2.5 -2.9 -12.2 -10.3 -6.0 -10.9 -8.2Primary fiscal balance (% of GDP) n/a n/a n/a n/a n/a n/a n/a n/a n/aTrade balance (% of GDP) 1.0 0.9 0.2 0.0 0.6 0.7 0.6 0.4 -0.1Current account balance (% of GDP) 3.8 4.2 3.5 3.4 3.2 3.2 3.5 3.0 2.8
Official interest rate (end of period) -0.06 -0.06 -0.06 -0.07 -0.03 -0.03 -0.06 0.00 -0.073-month interest rate (end of period) -0.05 -0.02 -0.07 -0.05 -0.08 -0.02 -0.05 -0.00 -0.0610-year interest rate (end of period) 0.04 0.05 0.01 -0.02 0.04 0.03 0.02 0.38 0.27Exchange rate vs. USD (end of period) 116.80 112.90 110.83 109.12 103.54 109.96 107.61 108.27 105.72Exchange rate vs. euro (end of period) 123.12 135.40 126.90 122.59 127.05 135.41 133.12 133.06 130.66
Private lending (% YoY, average) 2.2 4.2 2.6 2.0 5.3 3.8 1.5 2.7 -2.7Household lending (% YoY, average) 1.5 2.5 3.0 2.4 3.3 0.2 -2.1 -0.1 -3.9P.S. non-financial lending (% YoY, average) 1.8 2.2 1.9 3.4 7.5 2.0 -0.6 1.9 -0.7P.S. financial lending (% YoY, average) -0.2 8.0 6.3 3.0 16.6 -1.0 -5.8 -0.9 -5.1Savings rate (as % avg. disp. income) 1.9 1.6 1.7 2.7 10.5 5.3 2.4 6.5 4.2
Source: MAPFRE Economics (based on data from the Statistics Bureau) Forecast end date: July 12, 2021.
Click here to access the interactive version of this information
-15
-10
-5
0
5
1020
19
2020
2021
2022
External demand contributionDomestic demand contribution
GDP BS (YoY, %) GDP SS (YoY, %)
Source: MAPFRE Economics (based on data from the Statistics Bureau)
Chart 1.2.7-b Japan: domestic demand breakdown
and forecasts
-15
-10
-5
0
5
10
2019
2020
2021
2022
Public spending Inventory changesTotal investment Private consumption
Chart 1.2.7-a Japan: GDP breakdown and forecasts
Source: MAPFRE Economics (based on data from the Statistics Bureau)
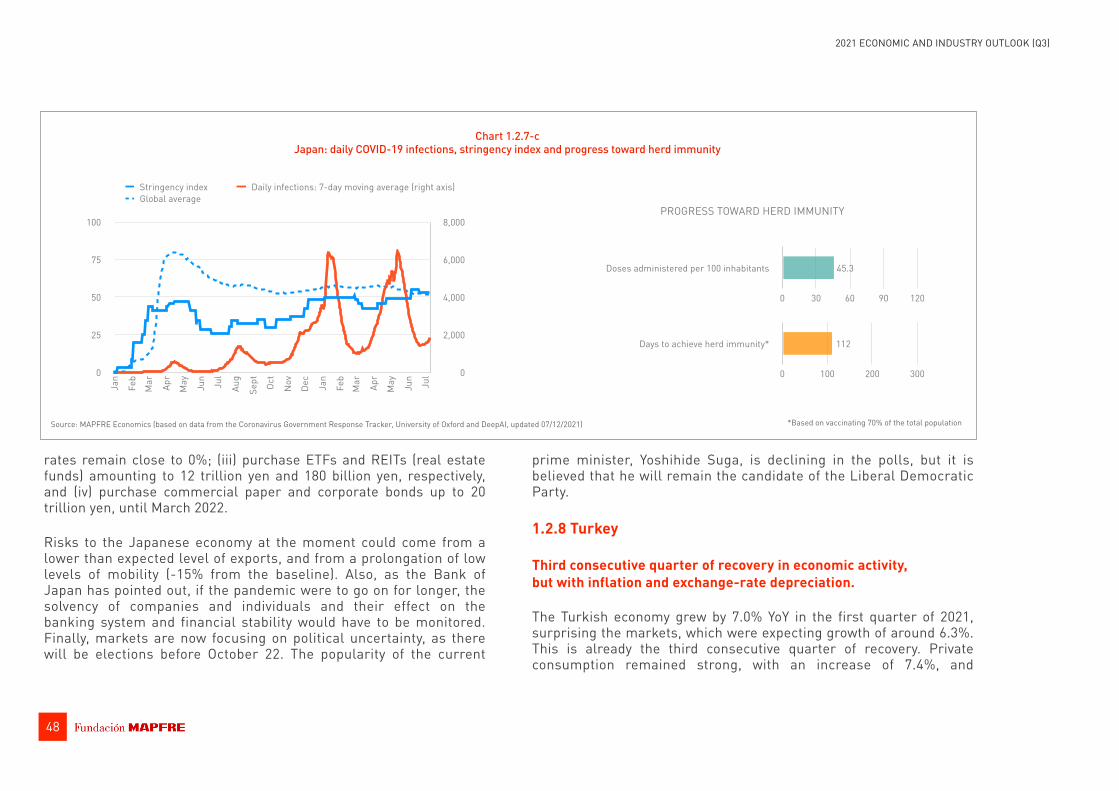
48
2021 ECONOMIC AND INDUSTRY OUTLOOK (Q3)
rates remain close to 0%; (iii) purchase ETFs and REITs (real estate funds) amounting to 12 trillion yen and 180 billion yen, respectively, and (iv) purchase commercial paper and corporate bonds up to 20 trillion yen, until March 2022.
Risks to the Japanese economy at the moment could come from a lower than expected level of exports, and from a prolongation of low levels of mobility (-15% from the baseline). Also, as the Bank of Japan has pointed out, if the pandemic were to go on for longer, the solvency of companies and individuals and their effect on the banking system and financial stability would have to be monitored. Finally, markets are now focusing on political uncertainty, as there will be elections before October 22. The popularity of the current
prime minister, Yoshihide Suga, is declining in the polls, but it is believed that he will remain the candidate of the Liberal Democratic Party.
1.2.8 Turkey
Third consecutive quarter of recovery in economic activity, but with inflation and exchange-rate depreciation.
The Turkish economy grew by 7.0% YoY in the first quarter of 2021, surprising the markets, which were expecting growth of around 6.3%. This is already the third consecutive quarter of recovery. Private consumption remained strong, with an increase of 7.4%, and
0
2,000
4,000
6,000
8,000
0
25
50
75
100
Jan
Feb
Mar Ap
r
May Jun
Jul
Aug
Sept Oc
t
Nov
Dec
Jan
Feb
Mar Ap
r
May Jun
Jul
Stringency index Daily infections: 7-day moving average (right axis)Global average
Source: MAPFRE Economics (based on data from the Coronavirus Government Response Tracker, University of Oxford and DeepAI, updated 07/12/2021)
Chart 1.2.7-c Japan: daily COVID-19 infections, stringency index and progress toward herd immunity
Doses administered per 100 inhabitants
0 30 60 90 120
45.3
Days to achieve herd immunity*
0 100 200 300
112
*Based on vaccinating 70% of the total population
PROGRESS TOWARD HERD IMMUNITY

49
2021 ECONOMIC AND INDUSTRY OUTLOOK (Q3)
Table 1.2.8 Turkey: main macroeconomic aggregates
Baseline (BS) Stressed (SS)
2016 2017 2018 2019 2020(e) 2021(f) 2022(f) 2021(f) 2022(f)
GDP (% YoY) 3.3 7.5 3.0 0.9 1.8 5.2 3.4 4.9 -1.3Domestic demand contribution 4.9 9.2 -0.4 -3.1 5.5 2.8 4.8 1.1 -1.3External demand contribution -1.6 -1.7 3.4 4.0 -3.8 2.4 -1.4 3.9 0.0Private consumption contribution 2.3 3.5 0.3 0.9 1.9 1.6 2.7 1.8 -0.0Total investment contribution 0.7 2.6 -1.4 -1.1 1.6 -0.3 1.1 1.1 -1.2Public spending contribution 1.3 0.7 0.9 0.6 0.3 0.1 0.2 0.1 0.2Private consumption (% YoY) 3.8 5.9 0.5 1.6 3.2 2.7 4.5 3.0 -0.0Public consumption (% YoY) 9.5 5.0 6.6 4.4 2.3 0.7 1.7 0.7 1.7Total investment (% YoY) 3.0 10.6 -6.4 -5.3 7.4 -1.6 5.5 4.2 -4.7Exports (% YoY) -1.7 12.4 9.0 4.9 -15.4 16.5 5.1 14.6 0.7Imports (% YoY) 0.3 -3.3 1.5 8.3 16.7 4.2 -2.9 -3.3 0.6
Unemployment rate (%, last quarter) 12.1 10.3 12.3 13.3 12.9 12.5 11.6 13.3 13.0Inflation (% YoY, last quarter) 8.5 11.9 20.3 11.8 14.6 15.2 10.2 18.0 11.5Fiscal balance (% of GDP) -1.3 -1.6 -1.9 -2.9 -3.5 -2.4 -2.5 -2.5 -3.4Primary fiscal balance (% of GDP) 0.7 0.2 0.0 -0.6 -0.8 0.9 1.4 0.8 0.7Trade balance (% of GDP) -4.6 -6.8 -5.2 -2.2 -5.3 -4.7 -5.6 -4.9 -5.9Current account balance (% of GDP) -3.1 -4.8 -2.8 0.9 -5.2 -3.5 -3.4 -3.8 -3.9
Official interest rate (end of period) 8.31 12.75 24.06 11.43 17.03 17.00 12.50 18.80 12.583-month interest rate (end of period) 9.90 14.61 24.07 10.76 17.53 17.88 13.89 19.88 13.8410-year interest rate (end of period) 11.40 11.72 16.53 11.95 12.51 15.72 13.00 17.32 14.56Exchange rate vs. USD (end of period) 3.52 3.80 5.29 5.95 7.44 9.04 9.39 10.37 10.78Exchange rate vs. euro (end of period) 3.71 4.55 6.06 6.68 9.11 11.14 11.61 12.75 13.33
Private lending (% YoY, average) 13.1 20.9 20.2 8.4 30.1 14.0 6.4 14.7 7.0Household lending (% YoY, average) 7.1 17.5 9.8 3.3 41.8 16.5 9.8 15.8 7.5P.S. non-financial lending (% YoY, average) 14.7 24.3 20.9 5.4 26.6 24.5 6.8 22.6 -1.7P.S. financial lending (% YoY, average) 9.0 27.2 25.1 18.3 21.2 16.8 12.9 15.9 11.1Savings rate (as % avg. disp. income) 34.3 32.5 32.1 30.5 21.3 19.3 19.2 19.3 16.8
Source: MAPFRE Economics (based on data from TURKSTAT) Forecast end date: July 12, 2021.
Click here to access the interactive version of this information
-20
-10
0
10
2020
19
2020
2021
2022
External demand contributionDomestic demand contribution
GDP BS (YoY, %) GDP SS (YoY, %)
Source: MAPFRE Economics (based on data from TURKSTAT)
Chart 1.2.8-b Turkey: domestic demand breakdown
and forecasts
-20
-10
0
10
20
2019
2020
2021
2022
Public spending Inventory changesTotal investment Private consumption
Chart 1.2.8-a Turkey: GDP breakdown and forecasts
Source: MAPFRE Economics (based on data from TURKSTAT)
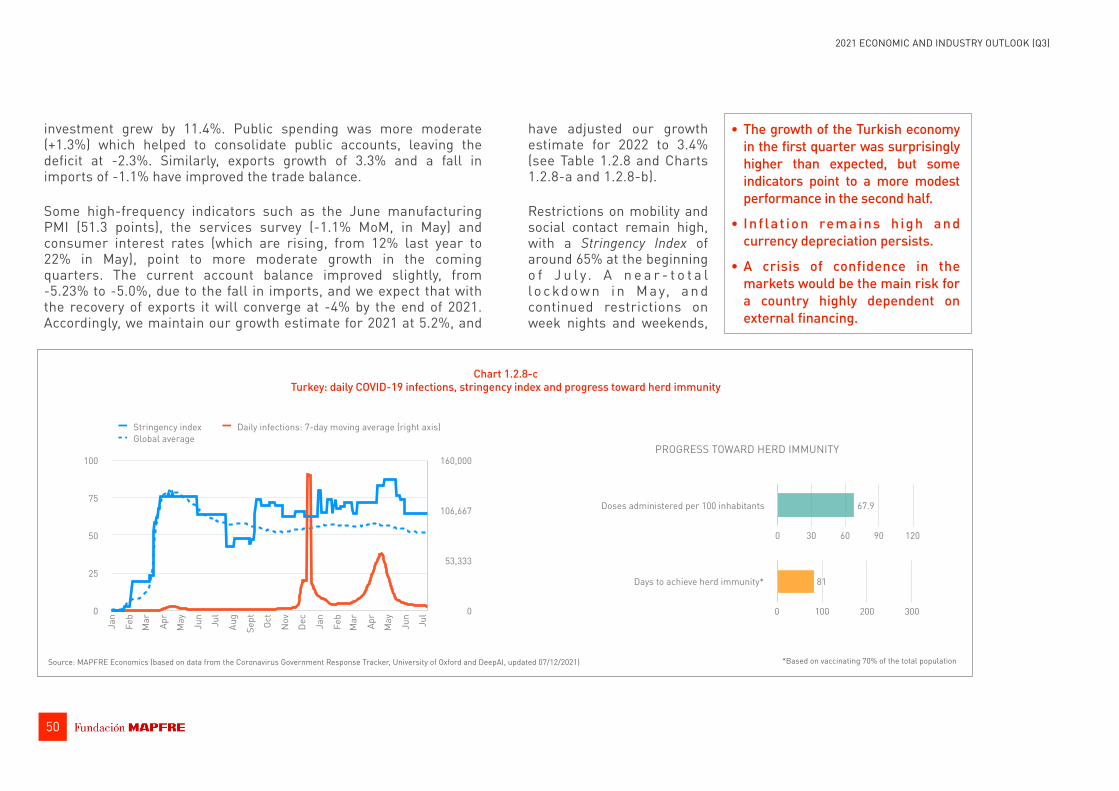
50
2021 ECONOMIC AND INDUSTRY OUTLOOK (Q3)
investment grew by 11.4%. Public spending was more moderate (+1.3%) which helped to consolidate public accounts, leaving the deficit at -2.3%. Similarly, exports growth of 3.3% and a fall in imports of -1.1% have improved the trade balance.
Some high-frequency indicators such as the June manufacturing PMI (51.3 points), the services survey (-1.1% MoM, in May) and consumer interest rates (which are rising, from 12% last year to 22% in May), point to more moderate growth in the coming quarters. The current account balance improved slightly, from -5.23% to -5.0%, due to the fall in imports, and we expect that with the recovery of exports it will converge at -4% by the end of 2021. Accordingly, we maintain our growth estimate for 2021 at 5.2%, and
have adjusted our growth estimate for 2022 to 3.4% (see Table 1.2.8 and Charts 1.2.8-a and 1.2.8-b).
Restrictions on mobility and social contact remain high, with a Stringency Index of around 65% at the beginning o f J u l y . A n e a r - t o t a l l o c kd o w n i n M a y, a n d continued restrictions on week nights and weekends,
• The growth of the Turkish economy in the first quarter was surprisingly higher than expected, but some indicators point to a more modest performance in the second half.
• Inf lat ion remains h igh and currency depreciation persists.
• A crisis of confidence in the markets would be the main risk for a country highly dependent on external financing.
0
53,333
106,667
160,000
0
25
50
75
100
Jan
Feb
Mar Ap
r
May Jun
Jul
Aug
Sept Oc
t
Nov
Dec
Jan
Feb
Mar Ap
r
May Jun
Jul
Stringency index Daily infections: 7-day moving average (right axis)Global average
Source: MAPFRE Economics (based on data from the Coronavirus Government Response Tracker, University of Oxford and DeepAI, updated 07/12/2021)
Chart 1.2.8-c Turkey: daily COVID-19 infections, stringency index and progress toward herd immunity
Doses administered per 100 inhabitants
0 30 60 90 120
67.9
Days to achieve herd immunity*
0 100 200 300
81
*Based on vaccinating 70% of the total population
PROGRESS TOWARD HERD IMMUNITY

51
2021 ECONOMIC AND INDUSTRY OUTLOOK (Q3)
will hurt second-quarter growth. Vaccination continues, albeit more slowly, with a coefficient of 67.9 doses per 100 inhabitants at the beginning of July (see Chart 1.2.8-c).
Inflation stood at 16.6% in May, with core inflation at 17% and with food (17.0%), housing (14.1%) and transportation (28.4%) leading the rise. Exchange-rate depreciation, with TRY/USD exceeding 8.60, will continue to affect the price of imported products. The consumer price index basket shows that inflation for food (+17.0%), vehicles (+41%), restaurants and hotels (+16.8%) remains high. The Central Bank of Turkey held interest rates (7-day Repo Rate) at 19.00% at its June meeting. Inflationary pressures, the rising price of oil and continued currency depreciation may delay the expected reduction in interest rates.
High external dollar indebtedness remains one of the main risks to the Turkish economy, which as the lira depreciates, is getting worse. External debt stands at 63% of GDP compared with an average of 40% for the other five major issuers among emerging markets. US dollar debt renewals of about 20% of GDP in 2021 are significant. Likewise, with the money supply increasing by around 20% and inflation above 17%, the currency should continue to depreciate.
1.2.9 Mexico
A recovery began in the second quarter that could maintain its momentum moving into the second half of the year.
The Mexican economy contracted -3.6% YoY (+0.8% QoQ) in the first quarter of 2021. The level of restrictions resulting from the pandemic remained very high until the end of February and have since been relaxed, with the Stringency Index below 50% in the last four months
(44% at the beginning of July), while the vaccination campaign at the beginning of July stood at 28% of the population, with 38.7 doses a d m i n i s t e r e d p e r 1 0 0 inhabitants and with a third wave of infections having already started (see Chart 1 .2 .9-c) . This s i tuat ion affected consumption in general, as reflected in the variation in tertiary activities (-4%), retail trade (-3.8%), transportation (-12.7%), leisure and culture (-45%) and accommodation and h o s p i t a l i t y ( - 3 3 . 3 % ) . Secondary activity was also affected, falling by -2.7% with oil-related activity down by -2.8%.
Recovery in the price of oil should help bolster public accounts and exports. In April, exports performed extraordinarily well (75.6%), taking into account the falling base effect of the previous year (-41.3%). Oil exports increased by 140% in April and industrial output rose by 36%, but the outlook for manufacturing according to the June PMIs is still impaired (48.8 points). The unemployment rate fell to 4.0% in May, after reaching 4.7% in April.
In the second quarter, with the partial lifting of the restrictions, it is anticipated that activity will have rebounded strongly thereby maintaining momentum going into the next quarters. In particular, we hope that investment, which has been very slack since 2019, will begin to pick up. Favorable consumption and export performance is
• Economic activity is recovering due to the lessening of restrictions from March.
• Exports ought to be favored by the vigorous recovery of the US economy.
• Inflation is surging, with high core inflation, which could force the Bank of Mexico to continue tightening its monetary stance.
• The price of oil is recovering, which benefits the public accounts.
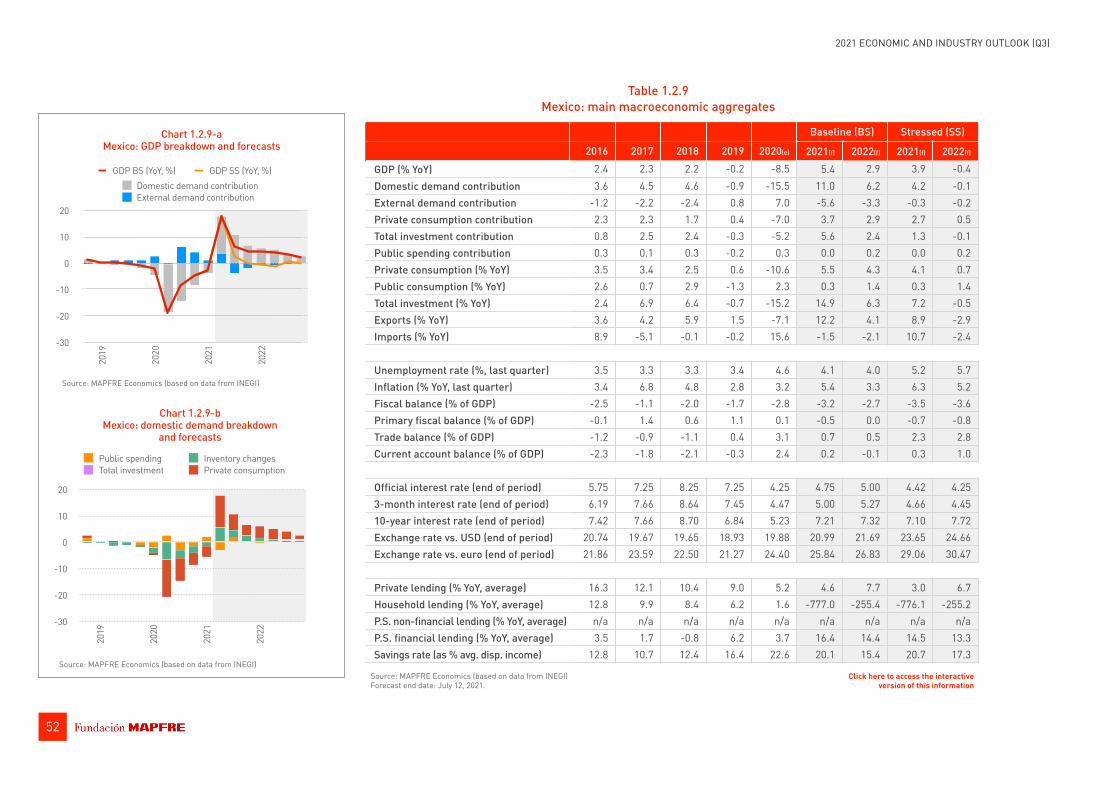
52
2021 ECONOMIC AND INDUSTRY OUTLOOK (Q3)
Table 1.2.9 Mexico: main macroeconomic aggregates
Baseline (BS) Stressed (SS)
2016 2017 2018 2019 2020(e) 2021(f) 2022(f) 2021(f) 2022(f)
GDP (% YoY) 2.4 2.3 2.2 -0.2 -8.5 5.4 2.9 3.9 -0.4Domestic demand contribution 3.6 4.5 4.6 -0.9 -15.5 11.0 6.2 4.2 -0.1External demand contribution -1.2 -2.2 -2.4 0.8 7.0 -5.6 -3.3 -0.3 -0.2Private consumption contribution 2.3 2.3 1.7 0.4 -7.0 3.7 2.9 2.7 0.5Total investment contribution 0.8 2.5 2.4 -0.3 -5.2 5.6 2.4 1.3 -0.1Public spending contribution 0.3 0.1 0.3 -0.2 0.3 0.0 0.2 0.0 0.2Private consumption (% YoY) 3.5 3.4 2.5 0.6 -10.6 5.5 4.3 4.1 0.7Public consumption (% YoY) 2.6 0.7 2.9 -1.3 2.3 0.3 1.4 0.3 1.4Total investment (% YoY) 2.4 6.9 6.4 -0.7 -15.2 14.9 6.3 7.2 -0.5Exports (% YoY) 3.6 4.2 5.9 1.5 -7.1 12.2 4.1 8.9 -2.9Imports (% YoY) 8.9 -5.1 -0.1 -0.2 15.6 -1.5 -2.1 10.7 -2.4
Unemployment rate (%, last quarter) 3.5 3.3 3.3 3.4 4.6 4.1 4.0 5.2 5.7Inflation (% YoY, last quarter) 3.4 6.8 4.8 2.8 3.2 5.4 3.3 6.3 5.2Fiscal balance (% of GDP) -2.5 -1.1 -2.0 -1.7 -2.8 -3.2 -2.7 -3.5 -3.6Primary fiscal balance (% of GDP) -0.1 1.4 0.6 1.1 0.1 -0.5 0.0 -0.7 -0.8Trade balance (% of GDP) -1.2 -0.9 -1.1 0.4 3.1 0.7 0.5 2.3 2.8Current account balance (% of GDP) -2.3 -1.8 -2.1 -0.3 2.4 0.2 -0.1 0.3 1.0
Official interest rate (end of period) 5.75 7.25 8.25 7.25 4.25 4.75 5.00 4.42 4.253-month interest rate (end of period) 6.19 7.66 8.64 7.45 4.47 5.00 5.27 4.66 4.4510-year interest rate (end of period) 7.42 7.66 8.70 6.84 5.23 7.21 7.32 7.10 7.72Exchange rate vs. USD (end of period) 20.74 19.67 19.65 18.93 19.88 20.99 21.69 23.65 24.66Exchange rate vs. euro (end of period) 21.86 23.59 22.50 21.27 24.40 25.84 26.83 29.06 30.47
Private lending (% YoY, average) 16.3 12.1 10.4 9.0 5.2 4.6 7.7 3.0 6.7Household lending (% YoY, average) 12.8 9.9 8.4 6.2 1.6 -777.0 -255.4 -776.1 -255.2P.S. non-financial lending (% YoY, average) n/a n/a n/a n/a n/a n/a n/a n/a n/aP.S. financial lending (% YoY, average) 3.5 1.7 -0.8 6.2 3.7 16.4 14.4 14.5 13.3Savings rate (as % avg. disp. income) 12.8 10.7 12.4 16.4 22.6 20.1 15.4 20.7 17.3
Source: MAPFRE Economics (based on data from INEGI) Forecast end date: July 12, 2021.
Click here to access the interactive version of this information
-30
-20
-10
0
10
20
2019
2020
2021
2022
External demand contributionDomestic demand contribution
GDP BS (YoY, %) GDP SS (YoY, %)
Source: MAPFRE Economics (based on data from INEGI)
Chart 1.2.9-b Mexico: domestic demand breakdown
and forecasts
-30
-20
-10
0
10
20
2019
2020
2021
2022
Public spending Inventory changesTotal investment Private consumption
Chart 1.2.9-a Mexico: GDP breakdown and forecasts
Source: MAPFRE Economics (based on data from INEGI)

53
2021 ECONOMIC AND INDUSTRY OUTLOOK (Q3)
also expected, which will bolster GDP growth at around 5.4% and 2.9% for 2022 (see Table 1.2.9 and Charts 1.2.9-a and 1.2.9-b).
Meanwhile, inflation is pushing upward, at 5.88% in June, with core inflation at 4.58% and non-core at 10.00%. There continues to be inflation in merchandise (5.81%) and in energy (+12.45%). The inflationary pressure is related to the external inflationary context, originating in raw materials, and the drought affecting agricultural and meat products. The Bank of Mexico, at its June 24 meeting, raised official rates by 25 basis points to 4.25%, surprising the consensus of analysts, having taken the view that the increase was necessary to avoid adverse effects on inflation expectations, achieve
an orderly adjustment of relative prices and facilitate price convergence toward the 3% target.
Mexico had federal elections on June 6, which resulted in a simple majority for Morena and the Labor Party, with a total of 235 deputies, plus 48 Green Party deputies. The president has announced the appointment of Rogelio Ramírez de la O as the new Treasury Secretary, while Arturo Herrera (the outgoing Treasury Secretary) will be proposed as governor of the Bank of Mexico in December.
Risks to the Mexican economy are related to public policy, both in terms of controlling the health crisis and in the recovery of investor
0
6,000
12,000
18,000
0
25
50
75
100
Jan
Feb
Mar Ap
r
May Jun
Jul
Aug
Sept Oc
t
Nov
Dec
Jan
Feb
Mar Ap
r
May Jun
Jul
Stringency index Daily infections: 7-day moving average (right axis)Global average
Source: MAPFRE Economics (based on data from the Coronavirus Government Response Tracker, University of Oxford and DeepAI, updated 07/12/2021)
Chart 1.2.9-c Mexico: daily COVID-19 infections, stringency index and progress toward herd immunity
Doses administered per 100 inhabitants
0 30 60 90 120
38.7
Days to achieve herd immunity*
0 100 200 300
261
*Based on vaccinating 70% of the total population
PROGRESS TOWARD HERD IMMUNITY
54
2021 ECONOMIC AND INDUSTRY OUTLOOK (Q3)
confidence, given the decline in investment over the last two years. On the positive side, the strong recovery of the US economy will favor manufacturing and exports. In addition, the rise in the price of oil and export volumes will favor overall activity and the public accounts.
1.2.10 Brazil
The pandemic has not abated, and recovery is at risk from rising inflation.
The Brazilian economy grew by 2.2% YoY (seasonally adjusted; by 1.0% YoY unadjusted), consumption fell by -1.7%, and government spending fell by -4.9%, in the throes of a pandemic that has seen peaks and troughs, and continues to worsen. The vaccination c a m p a i g n i s m a k i n g headway, although it is still only at 27% (with 53.1 doses administered per 100 inhabitants), which entailed restrictions in the f i r s t q u a r t e r a n d a Stringency Index above 70%, which relaxed in the second quarter to 61% in e a r ly J u ly ( s e e C h a r t 1.2.10-c).
I n d u s t r i a l a c t i v i t y i s improving, with an increase in output of 34.7% in April, and with the
survey of the Brazilian National Confederation of Industry also pointing to continuing improvement (61.7% in June). Private consumption in the first quarter was still falling (-1.7% YoY), but it is expected that in the second quarter it will rebound significantly as restrictions are relaxed. The outlook for the whole year is one of improvement, but the level of uncertainty is relatively high as the pandemic is not yet relinquishing its grasp. Purchasing managers' indices (PMIs) continue to improve, with composite at 49.2 points (May), manufacturing at 56.4 (June) and services at 48.3 points (May).
In this context, as shown in Table 1.2.10 and in Charts 1.2.10-a and 1.2.10-b, we have increased our GDP growth forecast to 5.1% (from 3.6%) for 2021, and have accordingly adjusted our GDP growth forecast for 2022 to 2.2% (from 2.8%), in anticipation of a recovery in consumption (+4.8%), in exports (+5.6%) and a strong rebound in investment (+17.3%).
Inflation, for its part, rose to 8.1% (general HICP) in May, due to electricity, fuel and food prices rising by 12.5% (15.4% for household food), with, in particular, an increase in the price of meat (+38% YoY) and cereals (+37.5%). In addition, electricity is highly dependent on water production, and reservoirs are at their lowest level in the last 20 years. The central bank, at its June meeting, raised SELIC interest rates by 75 basis points to 4.25%, in response to inflationary pressures. It indicated that it views the normalization of monetary policy as "appropriate," up to a neutral level of 6%-7%. Accordingly, another increase of 75 basis points, taking rates up to 5%, is expected at the next meeting.
Clearly inflation, the impact of drought on electricity prices, rising food prices and subsequent interest rate hikes could derail recovery, as the pandemic is not under control and, although there have been peaks and troughs, the contagion curve continues to be an ascending
• Inflation rose to 8.1% in May, with pressure on food, electricity and fuels.
• The central bank has already entered an interest rate bull cycle, making recovery difficult.
• Production indicators are improving and consumption, investment and exports are expected to boost activity.
• The pandemic is not under control and restrictions could return.

55
2021 ECONOMIC AND INDUSTRY OUTLOOK (Q3)
Table 1.2.10 Brazil: main macroeconomic aggregates
Baseline (BS) Stressed (SS)
2016 2017 2018 2019 2020(e) 2021(f) 2022(f) 2021(f) 2022(f)
GDP (% YoY) -3.5 1.6 1.7 1.4 -4.4 5.1 2.2 4.6 -1.2Domestic demand contribution -5.3 2.1 2.3 2.0 -5.8 7.2 2.5 6.5 -1.6External demand contribution 1.8 -0.4 -0.7 -0.6 1.5 -2.2 -0.3 -2.0 0.4Private consumption contribution -2.6 1.3 1.6 1.5 -3.8 2.6 2.3 2.2 -0.9Total investment contribution -2.1 -0.4 0.9 0.6 -0.1 3.4 0.2 3.1 -0.7Public spending contribution 0.0 -0.1 0.1 -0.1 -0.8 0.2 0.6 0.2 0.6Private consumption (% YoY) -3.9 1.9 2.4 2.2 -5.5 3.8 3.4 3.3 -1.3Public consumption (% YoY) 0.2 -0.7 0.8 -0.4 -4.7 1.1 3.4 1.1 3.4Total investment (% YoY) -12.2 -2.6 5.3 3.4 -0.6 17.3 0.9 15.6 -3.5Exports (% YoY) 0.9 5.1 3.4 -2.3 -2.1 5.6 6.0 3.7 1.0Imports (% YoY) -10.3 7.3 6.8 1.1 -10.4 17.3 6.3 14.6 -1.4
Unemployment rate (%, last quarter) 12.0 11.8 11.6 11.0 13.9 12.0 11.9 12.7 13.2Inflation (% YoY, last quarter) 6.3 2.9 3.7 4.3 4.5 5.4 3.7 6.7 5.4Fiscal balance (% of GDP) -9.0 -7.8 -7.0 -5.8 -13.6 -6.8 -6.5 -7.1 -7.9Primary fiscal balance (% of GDP) -2.5 -1.7 -1.5 -0.8 -9.4 -2.3 -2.1 -2.6 -3.3Trade balance (% of GDP) 2.5 2.8 2.3 1.4 2.2 3.2 3.1 3.6 4.9Current account balance (% of GDP) -1.4 -1.1 -2.7 -3.5 -1.7 -1.3 -1.9 -1.0 -0.4
Official interest rate (end of period) 13.75 7.00 6.50 4.50 2.00 7.00 7.00 7.04 9.413-month interest rate (end of period) 13.65 6.90 6.40 4.40 1.90 6.89 6.91 6.93 9.2610-year interest rate (end of period) 11.42 10.21 9.24 6.81 6.98 9.25 9.52 9.73 11.48Exchange rate vs. USD (end of period) 3.26 3.31 3.87 4.03 5.20 5.25 5.44 5.99 6.18Exchange rate vs. euro (end of period) 3.44 3.97 4.44 4.53 6.38 6.46 6.73 7.37 7.64
Private lending (% YoY, average) n/a n/a n/a n/a n/a n/a n/a n/a n/aHousehold lending (% YoY, average) 4.4 4.7 7.0 10.8 10.1 13.9 9.4 13.8 8.7P.S. non-financial lending (% YoY, average) n/a n/a n/a n/a n/a n/a n/a n/a n/aP.S. financial lending (% YoY, average) n/a n/a n/a n/a n/a n/a n/a n/a n/aSavings rate (as % avg. disp. income) 17.2 17.4 16.4 16.2 19.4 14.1 11.9 14.8 14.5
Source: MAPFRE Economics (based on data from the Brazilian Institute of Geography and Statistics (IBGE)) Forecast end date: July 12, 2021.
Click here to access the interactive version of this information
-20
-10
0
10
2020
19
2020
2021
2022
External demand contributionDomestic demand contribution
GDP BS (YoY, %) GDP SS (YoY, %)
Source: MAPFRE Economics (based on data from the Brazilian Institute of Geography and Statistics (IBGE))
Chart 1.2.10-b Brazil: domestic demand breakdown
and forecasts
-20
-10
0
10
20
2019
2020
2021
2022
Public spending Inventory changesTotal investment Private consumption
Chart 1.2.10-a Brazil: GDP breakdown and forecasts
Source: MAPFRE Economics (based on data from the Brazilian Institute of Geography and Statistics (IBGE))

56
2021 ECONOMIC AND INDUSTRY OUTLOOK (Q3)
one. Also, if measures to support the economy continue, these could lead to persistent deficits and put sovereign solvency at risk. Structural changes in public spending are necessary to ensure solvency in the medium-term.
1.2.11 Argentina
The recovery is benefiting from rising raw materials prices, although consumption is still being influenced by the pandemic.
The Argentine economy grew by 2.5% YoY (+2.6% QoQ) with consumption still significantly influenced by restrictions (-0.7%) and
public consumption by budgetary constraints (-0.5%). Exports are rising without fanfare (+1.2%), while investment is the area that is performing best (+38.4%).
The pandemic is continuing, with a high level of cases and more than 400 cases/million in June, although decreasing from the peak of more than 700 cases/million at the end of May. Restrictions remain very strict (Stringency Index of 75% at the beginning of July) and vaccination rates are still low, with a coefficient of 53.2 doses administered per 100 inhabitants, similar to that of Brazil (see Chart 1.2.11-c).
0
20,000
40,000
60,000
80,000
0
25
50
75
100
Jan
Feb
Mar Ap
r
May Jun
Jul
Aug
Sept Oc
t
Nov
Dec
Jan
Feb
Mar Ap
r
May Jun
Jul
Stringency index Daily infections: 7-day moving average (right axis)Global average
Source: MAPFRE Economics (based on data from the Coronavirus Government Response Tracker, University of Oxford and DeepAI, updated 07/12/2021)
Chart 1.2.10-c Brazil: daily COVID-19 infections, stringency index and progress toward herd immunity
Doses administered per 100 inhabitants
0 30 60 90 120
53.1
Days to achieve herd immunity*
0 100 200 300
140
*Based on vaccinating 70% of the total population
PROGRESS TOWARD HERD IMMUNITY

57
2021 ECONOMIC AND INDUSTRY OUTLOOK (Q3)
Table 1.2.11 Argentina: main macroeconomic aggregates
Baseline (BS) Stressed (SS)
2016 2017 2018 2019 2020(e) 2021(f) 2022(f) 2021(f) 2022(f)
GDP (% YoY) -2.1 2.8 -2.6 -2.1 -9.9 5.8 2.6 5.1 -0.5Domestic demand contribution -1.7 6.6 -4.0 -8.8 -10.2 6.2 2.4 5.2 -0.7External demand contribution -0.4 -3.8 1.4 6.7 0.3 -0.4 0.2 -0.1 0.2Private consumption contribution -0.6 3.1 -1.7 -4.7 -9.0 4.3 2.2 3.9 -0.1Total investment contribution -1.1 2.8 -1.2 -2.7 -2.2 2.2 -0.2 1.5 -1.1Public spending contribution -0.1 0.4 -0.2 -0.1 -0.7 0.6 0.4 0.6 0.4Private consumption (% YoY) -0.8 4.2 -2.2 -6.6 -13.1 6.3 3.1 5.7 -0.2Public consumption (% YoY) -0.5 2.6 -1.7 -1.0 -4.7 4.3 2.7 4.3 2.7Total investment (% YoY) -5.8 13.4 -6.0 -16.0 -13.0 12.4 -1.2 8.7 -6.5Exports (% YoY) 5.3 2.6 0.5 9.0 -17.7 8.7 3.9 7.5 -2.3Imports (% YoY) 5.8 15.6 -4.5 -19.0 -18.1 10.3 2.9 7.4 -3.2
Unemployment rate (%, last quarter) 7.6 7.2 9.1 8.9 11.0 9.3 8.1 10.3 9.8Inflation (% YoY, last quarter) 37.5 23.3 47.4 52.2 36.1 44.9 30.3 49.2 32.7Fiscal balance (% of GDP) -5.8 -5.9 -5.0 -3.8 -8.5 -5.0 -3.4 -5.2 -4.3Primary fiscal balance (% of GDP) -4.2 -3.8 -2.3 -0.4 -6.5 -3.6 -2.0 -3.8 -2.8Trade balance (% of GDP) 0.8 -0.8 -0.1 4.1 3.8 3.8 3.9 4.1 4.9Current account balance (% of GDP) -2.7 -4.8 -5.0 -0.9 0.8 1.1 0.9 1.1 1.7
Official interest rate (end of period) 24.75 28.75 59.25 55.00 38.00 38.00 24.00 35.83 24.203-month interest rate (end of period) 26.23 27.44 56.76 45.13 29.55 31.00 22.75 31.58 23.4810-year interest rate (end of period) 7.00 5.91 10.86 19.36 14.61 10.77 7.90 12.13 9.25Exchange rate vs. USD (end of period) 15.89 18.65 37.70 59.89 84.15 120.54 149.68 146.44 170.61Exchange rate vs. euro (end of period) 16.75 22.37 43.17 67.28 103.26 148.44 185.16 179.97 210.86
Private lending (% YoY, average) n/a n/a n/a n/a n/a n/a n/a n/a n/aHousehold lending (% YoY, average) n/a n/a n/a n/a n/a n/a n/a n/a n/aP.S. non-financial lending (% YoY, average) n/a n/a n/a n/a n/a n/a n/a n/a n/aP.S. financial lending (% YoY, average) n/a n/a n/a n/a n/a n/a n/a n/a n/aSavings rate (as % avg. disp. income) n/a n/a n/a n/a n/a n/a n/a n/a n/a
Source: MAPFRE Economics (based on data from INDEC) Forecast end date: July 12, 2021.
Click here to access the interactive version of this information
-30
-20
-10
0
10
20
3020
19
2020
2021
2022
External demand contributionDomestic demand contribution
GDP BS (YoY, %) GDP SS (YoY, %)
Source: MAPFRE Economics (based on data from INDEC)
Chart 1.2.11-b Argentina: domestic demand breakdown
and forecasts
-30
-20
-10
0
10
20
30
2019
2020
2021
2022
Public spending Inventory changesTotal investment Private consumption
Chart 1.2.11-a Argentina: GDP breakdown and forecasts
Source: MAPFRE Economics (based on data from INDEC)
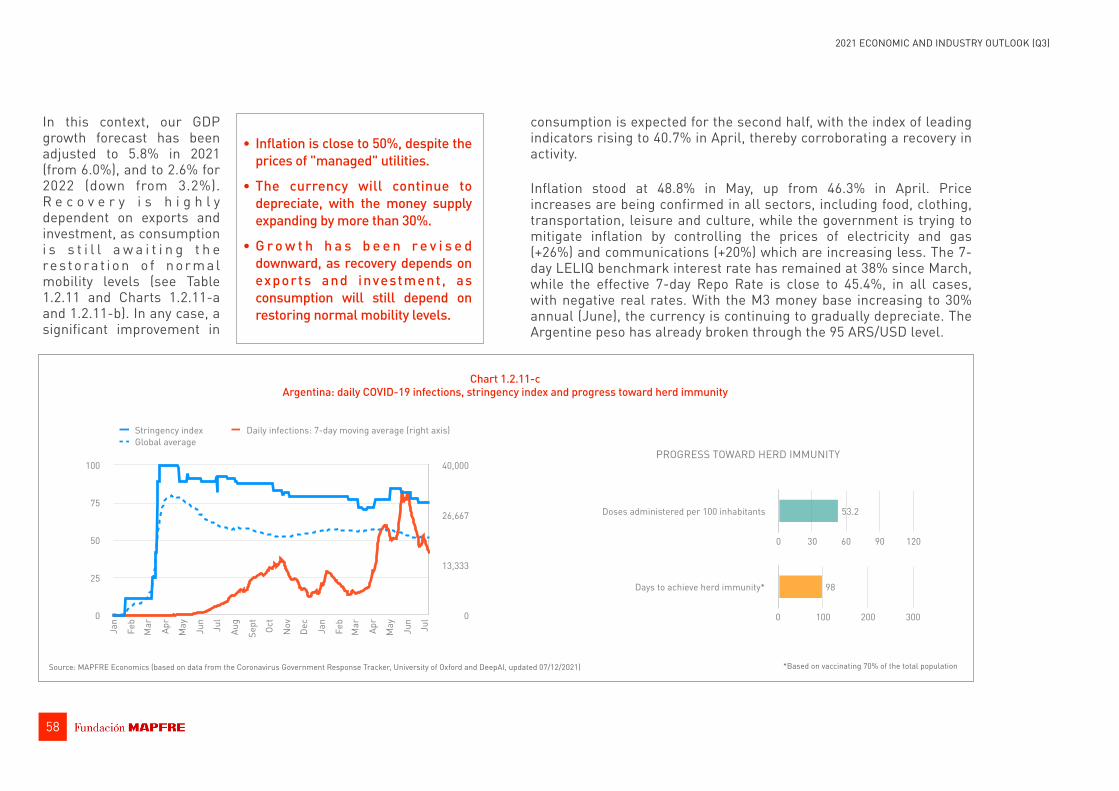
58
2021 ECONOMIC AND INDUSTRY OUTLOOK (Q3)
In this context, our GDP growth forecast has been adjusted to 5.8% in 2021 (from 6.0%), and to 2.6% for 2022 (down from 3.2%). R e c o v e r y i s h i g h l y dependent on exports and investment, as consumption i s s t i l l a w a i t i n g t h e re s t o ra t i o n o f n o r m a l mobility levels (see Table 1.2.11 and Charts 1.2.11-a and 1.2.11-b). In any case, a significant improvement in
consumption is expected for the second half, with the index of leading indicators rising to 40.7% in April, thereby corroborating a recovery in activity.
Inflation stood at 48.8% in May, up from 46.3% in April. Price increases are being confirmed in all sectors, including food, clothing, transportation, leisure and culture, while the government is trying to mitigate inflation by controlling the prices of electricity and gas (+26%) and communications (+20%) which are increasing less. The 7-day LELIQ benchmark interest rate has remained at 38% since March, while the effective 7-day Repo Rate is close to 45.4%, in all cases, with negative real rates. With the M3 money base increasing to 30% annual (June), the currency is continuing to gradually depreciate. The Argentine peso has already broken through the 95 ARS/USD level.
• Inflation is close to 50%, despite the prices of "managed" utilities.
• The currency will continue to depreciate, with the money supply expanding by more than 30%.
• G r o w t h h a s b e e n r e v i s e d downward, as recovery depends on exports and investment, as consumption will still depend on restoring normal mobility levels.
0
13,333
26,667
40,000
0
25
50
75
100
Jan
Feb
Mar Ap
r
May Jun
Jul
Aug
Sept Oc
t
Nov
Dec
Jan
Feb
Mar Ap
r
May Jun
Jul
Stringency index Daily infections: 7-day moving average (right axis)Global average
Source: MAPFRE Economics (based on data from the Coronavirus Government Response Tracker, University of Oxford and DeepAI, updated 07/12/2021)
Chart 1.2.11-c Argentina: daily COVID-19 infections, stringency index and progress toward herd immunity
Doses administered per 100 inhabitants
0 30 60 90 120
53.2
Days to achieve herd immunity*
0 100 200 300
98
*Based on vaccinating 70% of the total population
PROGRESS TOWARD HERD IMMUNITY

59
2021 ECONOMIC AND INDUSTRY OUTLOOK (Q3)
Argentina will hold mid-term legislative elections on November 14, 2021, so no major changes in public policy are expected before then. The government is focusing on containing inflation, which should still be above 46% in 2021, by controlling certain key prices, and also on ensuring currency stability by maintaining exchange controls. However, currency exchange markets are adept at interpreting this "managed" inflation control, and they know that this can be reversed later.
In this context, it is clear that Argentina needs a fiscal consolidation plan and a brake on monetary expansion. These objectives will be very difficult to achieve, especially in the midst of a pandemic and during an election year, so macroeconomic stability remains at a high risk. On a more positive note, however, energy prices and the price of other raw materials are recovering, and this can work in favor of exports and tax revenues and reduce macroeconomic imbalances.
1.2.12 China
The clear winner of the pandemic. Strong domestic demand and exports.
China's economy has grown by 7.9% (seasonally adjusted YoY) in the second quarter of 2021 (1.3% QoQ) which, even considering the base effect (falling by -6.8% YoY in the first quarter of 2020), remains a spectacular growth rate. Exports grew by 33.7% in the first quarter (after the fall of -10% the previous year), and remained strong in April and May (+22% and +18%, respectively). Exports for 2021 as a whole could therefore grow by around 19%. China, from its position of strength, is substituting industrial output and exports to other East Asian countries that are failing to meet external demand because of the constraints generated by the health crisis. Imports also remain
strong, above 30% (32.2% in April and 39.5% in May), both because of the strength of domestic demand and due to imports of raw materials for manufacturing. Therefore, consumption is expected to grow by 8.9% and government spending by 6.4%. The restrictions, according to the Stringency Index, remain higher than in many Western countries (66% at the beginning of July), although cases of infection and death appear to be very low, while the country's vaccination coefficient is 94.9 doses administered per 100 inhabitants, similar to that of advanced countries. (See Chart 1.2.12-c.)
In terms of indicators that will drive performance in the coming months, the purchasing managers' indices (PMIs) stood at 51.0 for manufacturing in June and at 55.2 points for non-manufacturing, with both rising. Similarly, industrial output rose to 9.8% in April and retail sales increased to 17.7%. In this context, we expect China's economy to grow by 8.4% in 2021, followed by 5.7% in 2022; extraordinary levels for an economy that grew by 2.3% in 2020 (see Table 1.2.12 and Charts 1.2.12-a and 1.2.12-b).
I n f l a t i o n w a s m o r e moderate in June, with 1.1% CPI. Meanwhile, producer prices are already reflecting increases in raw materials prices, at 8.5% in May and 6.8% in April. The increase m a i n l y r e f l e c t s transportation, due to the price of fuels. Core inflation (excluding energy and food) stood at 0.7%. Therefore, if the price of energy is kept under control, headline inflation should also be kept
• The Chinese economy should grow by 8.4% in 2021, after achieving growth of 2.3% in 2020.
• China's strong external sector is substituting demand for exports to which other Asian neighbors are unable to respond.
• Fiscal policy will remain expan-sionary in the coming years, with deficits exceeding -7%.
• For now, a stable outlook regarding monetary policy is anticipated.
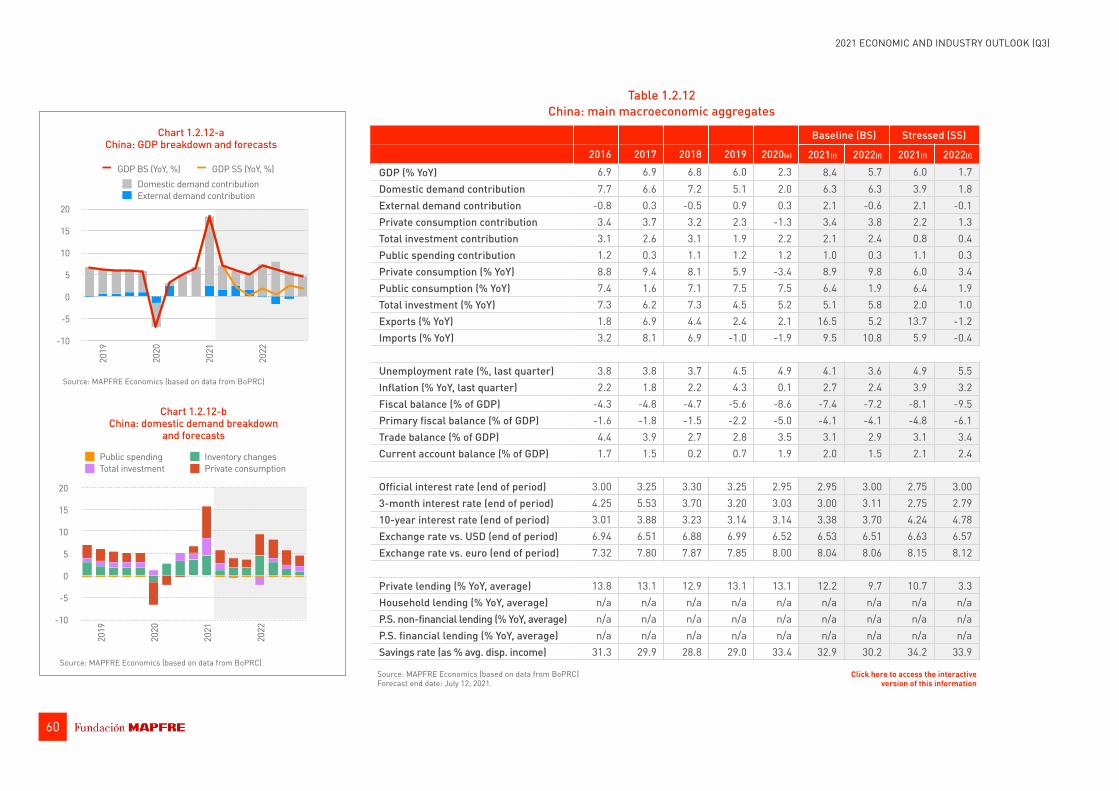
60
2021 ECONOMIC AND INDUSTRY OUTLOOK (Q3)
Table 1.2.12 China: main macroeconomic aggregates
Baseline (BS) Stressed (SS)
2016 2017 2018 2019 2020(e) 2021(f) 2022(f) 2021(f) 2022(f)
GDP (% YoY) 6.9 6.9 6.8 6.0 2.3 8.4 5.7 6.0 1.7Domestic demand contribution 7.7 6.6 7.2 5.1 2.0 6.3 6.3 3.9 1.8External demand contribution -0.8 0.3 -0.5 0.9 0.3 2.1 -0.6 2.1 -0.1Private consumption contribution 3.4 3.7 3.2 2.3 -1.3 3.4 3.8 2.2 1.3Total investment contribution 3.1 2.6 3.1 1.9 2.2 2.1 2.4 0.8 0.4Public spending contribution 1.2 0.3 1.1 1.2 1.2 1.0 0.3 1.1 0.3Private consumption (% YoY) 8.8 9.4 8.1 5.9 -3.4 8.9 9.8 6.0 3.4Public consumption (% YoY) 7.4 1.6 7.1 7.5 7.5 6.4 1.9 6.4 1.9Total investment (% YoY) 7.3 6.2 7.3 4.5 5.2 5.1 5.8 2.0 1.0Exports (% YoY) 1.8 6.9 4.4 2.4 2.1 16.5 5.2 13.7 -1.2Imports (% YoY) 3.2 8.1 6.9 -1.0 -1.9 9.5 10.8 5.9 -0.4
Unemployment rate (%, last quarter) 3.8 3.8 3.7 4.5 4.9 4.1 3.6 4.9 5.5Inflation (% YoY, last quarter) 2.2 1.8 2.2 4.3 0.1 2.7 2.4 3.9 3.2Fiscal balance (% of GDP) -4.3 -4.8 -4.7 -5.6 -8.6 -7.4 -7.2 -8.1 -9.5Primary fiscal balance (% of GDP) -1.6 -1.8 -1.5 -2.2 -5.0 -4.1 -4.1 -4.8 -6.1Trade balance (% of GDP) 4.4 3.9 2.7 2.8 3.5 3.1 2.9 3.1 3.4Current account balance (% of GDP) 1.7 1.5 0.2 0.7 1.9 2.0 1.5 2.1 2.4
Official interest rate (end of period) 3.00 3.25 3.30 3.25 2.95 2.95 3.00 2.75 3.003-month interest rate (end of period) 4.25 5.53 3.70 3.20 3.03 3.00 3.11 2.75 2.7910-year interest rate (end of period) 3.01 3.88 3.23 3.14 3.14 3.38 3.70 4.24 4.78Exchange rate vs. USD (end of period) 6.94 6.51 6.88 6.99 6.52 6.53 6.51 6.63 6.57Exchange rate vs. euro (end of period) 7.32 7.80 7.87 7.85 8.00 8.04 8.06 8.15 8.12
Private lending (% YoY, average) 13.8 13.1 12.9 13.1 13.1 12.2 9.7 10.7 3.3Household lending (% YoY, average) n/a n/a n/a n/a n/a n/a n/a n/a n/aP.S. non-financial lending (% YoY, average) n/a n/a n/a n/a n/a n/a n/a n/a n/aP.S. financial lending (% YoY, average) n/a n/a n/a n/a n/a n/a n/a n/a n/aSavings rate (as % avg. disp. income) 31.3 29.9 28.8 29.0 33.4 32.9 30.2 34.2 33.9
Source: MAPFRE Economics (based on data from BoPRC) Forecast end date: July 12, 2021.
Click here to access the interactive version of this information
-10
-5
0
5
10
15
20
2019
2020
2021
2022
External demand contributionDomestic demand contribution
GDP BS (YoY, %) GDP SS (YoY, %)
Source: MAPFRE Economics (based on data from BoPRC)
Chart 1.2.12-b China: domestic demand breakdown
and forecasts
-10
-5
0
5
10
15
20
2019
2020
2021
2022
Public spending Inventory changesTotal investment Private consumption
Chart 1.2.12-a China: GDP breakdown and forecasts
Source: MAPFRE Economics (based on data from BoPRC)
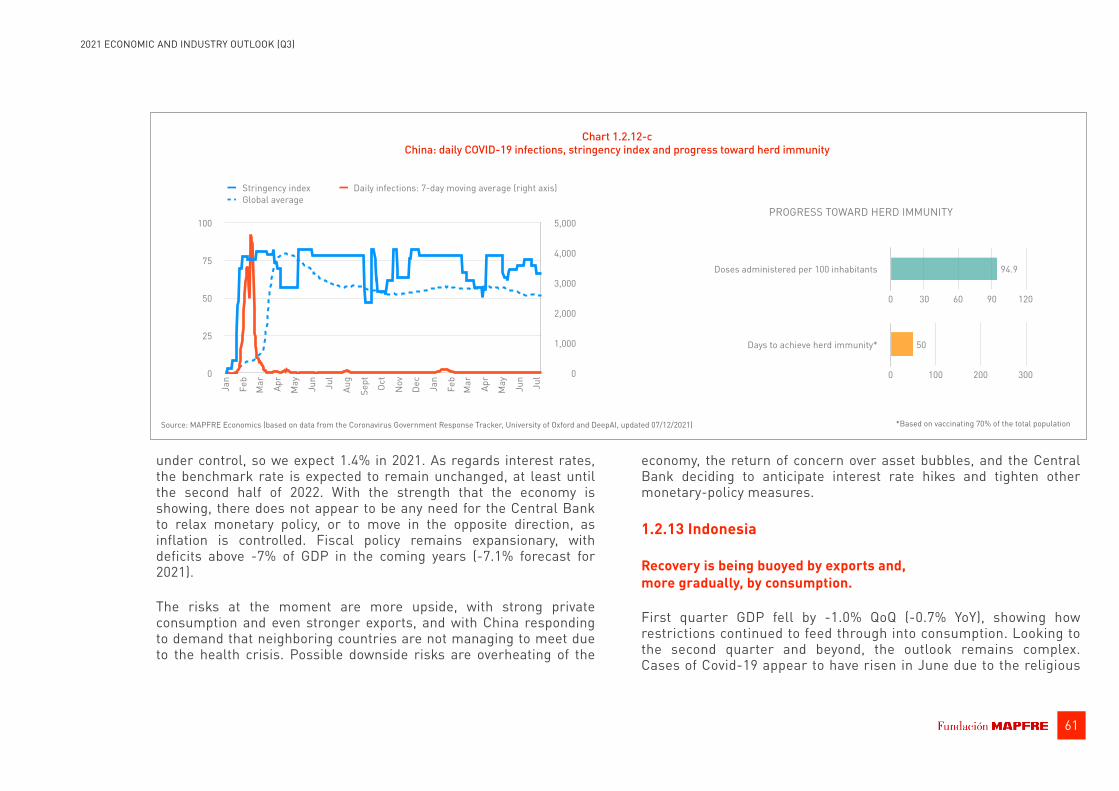
61
2021 ECONOMIC AND INDUSTRY OUTLOOK (Q3)
under control, so we expect 1.4% in 2021. As regards interest rates, the benchmark rate is expected to remain unchanged, at least until the second half of 2022. With the strength that the economy is showing, there does not appear to be any need for the Central Bank to relax monetary policy, or to move in the opposite direction, as inflation is controlled. Fiscal policy remains expansionary, with deficits above -7% of GDP in the coming years (-7.1% forecast for 2021).
The risks at the moment are more upside, with strong private consumption and even stronger exports, and with China responding to demand that neighboring countries are not managing to meet due to the health crisis. Possible downside risks are overheating of the
economy, the return of concern over asset bubbles, and the Central Bank deciding to anticipate interest rate hikes and tighten other monetary-policy measures.
1.2.13 Indonesia
Recovery is being buoyed by exports and, more gradually, by consumption.
First quarter GDP fell by -1.0% QoQ (-0.7% YoY), showing how restrictions continued to feed through into consumption. Looking to the second quarter and beyond, the outlook remains complex. Cases of Covid-19 appear to have risen in June due to the religious
0
1,000
2,000
3,000
4,000
5,000
0
25
50
75
100Ja
n
Feb
Mar Ap
r
May Jun
Jul
Aug
Sept Oc
t
Nov
Dec
Jan
Feb
Mar Ap
r
May Jun
Jul
Stringency index Daily infections: 7-day moving average (right axis)Global average
Source: MAPFRE Economics (based on data from the Coronavirus Government Response Tracker, University of Oxford and DeepAI, updated 07/12/2021)
Chart 1.2.12-c China: daily COVID-19 infections, stringency index and progress toward herd immunity
Doses administered per 100 inhabitants
0 30 60 90 120
94.9
Days to achieve herd immunity*
0 100 200 300
50
*Based on vaccinating 70% of the total population
PROGRESS TOWARD HERD IMMUNITY
62
2021 ECONOMIC AND INDUSTRY OUTLOOK (Q3)
holidays in May. Mobility indices for that month showed normal mobility for small businesses and l e i s u r e , w h i l e t h e Stringency Index remains high (69% at the beginning of July). The contradiction i m p l i c i t i n t h e s e t wo indicators suggests a low level of compliance with restrictions. At the same t i m e , t h e v a cc i n a t i o n campaign is progressing slowly, with a coefficient of j u s t 1 8 . 5 d o s e s a d m i n i ste re d p e r 1 0 0 inhabitants (see Chart 1.2.13-c).
Consumption is expected to return to more normal levels in the coming quarters (+4.5–5.0% YoY). The biggest boost for GDP is coming from exports, which rose 6.7% just in the first quarter, and which could reach 15% for the whole year. The purchasing managers' indices (PMIs) for manufacturing in June fell to 53.5 points, with the PMI components of ordering and production above 58 and 59, respectively. The current account deficit is widening (estimated average of -1.6% for 2021) because imports (due to the recovery in consumption and manufacturing inputs) are even stronger than exports. Accordingly, our GDP growth forecast has been revised to 4.7% and 5.5%, respectively, for 2021 and 2022 (see Table 1.2.13 and Charts 1.2.13-a and 1.2.13-b).
Inflation stood at 1.7% in May, with core inflation at 1.4%, a very moderate level given what is happening globally. Inflation should rise in the coming quarters, driven by the costs of energy, raw materials and food, reflecting a strengthening of both internal and external demand. The Central Bank of Indonesia held interest rates at 3.50% at its June meeting, and is not expected to touch these in 2021; rather, they may remain at this level for an extended period, probably until mid-2023 when it is clear that there has been a recovery.
In addition to increased restrictions due to a sudden increase in the health risk, risks to the Indonesian economy stem from its high dependence on external financing. A rise in interest rates globally would also feed through into the public finances, which would make public and private spending and investment plans more difficult. A higher perception of risk would also have implications for the exchange rate.
1.2.14 Philippines
Recovery is lagging, with restriction indices still high.
The Philippine economy contracted -4.2% YoY in the first quarter of 2021, but grew by 0.3% compared to the previous quarter. The second quarter of 2021 was also difficult, with the government reintroducing restrictions on freedom of movement in April and May. The mobility index in restaurants and leisure is 30% below the usual level. Also, the level of restrictions at this time, measured by the Stringency Index, is 75%, while the vaccination campaign is progressing slowly with only 11.4 doses administered per 100 inhabitants (see Chart 1.2.14-c).
• The recovery of the Indonesian economy is being led mainly by exports and an increase in private consumption.
• Infections began to increase in June and restrictions remain rela-tively strict.
• Mobility in business and leisure has recovered, but not as a result of lifting restrictions, suggesting there is some tolerance to the risk of the virus.

63
2021 ECONOMIC AND INDUSTRY OUTLOOK (Q3)
Table 1.2.13 Indonesia: main macroeconomic aggregates
Baseline (BS) Stressed (SS)
2016 2017 2018 2019 2020(e) 2021(f) 2022(f) 2021(f) 2022(f)
GDP (% YoY) 5.0 5.1 5.2 5.0 -2.1 4.7 5.5 3.3 1.5Domestic demand contribution 3.7 6.5 7.9 3.0 -5.5 9.0 7.1 3.6 1.8External demand contribution 1.4 -1.4 -2.8 2.1 3.5 -4.2 -1.6 -0.3 -0.3Private consumption contribution 2.8 2.8 2.8 2.9 -1.5 2.0 2.6 1.1 0.7Total investment contribution -0.5 1.6 2.6 -1.4 -2.4 4.1 1.3 2.0 0.5Public spending contribution -0.0 0.2 0.4 0.3 0.2 0.7 0.5 0.7 0.6Private consumption (% YoY) 5.0 5.0 5.1 5.2 -2.7 3.6 4.9 2.1 1.3Public consumption (% YoY) -0.1 2.1 4.8 3.3 1.9 8.3 6.3 8.3 6.3Total investment (% YoY) -2.4 8.1 12.1 -7.4 -14.7 21.5 6.7 6.2 1.4Exports (% YoY) -1.7 8.9 6.5 -0.9 -7.7 16.5 4.1 14.1 -1.8Imports (% YoY) 5.8 6.7 2.0 3.4 25.3 9.4 -0.9 18.8 -0.6
Unemployment rate (%, last quarter) 5.5 5.3 5.1 5.1 6.7 6.4 5.6 7.1 7.7Inflation (% YoY, last quarter) 3.3 3.5 3.3 2.7 1.6 2.7 3.0 4.2 5.6Fiscal balance (% of GDP) -2.5 -2.6 -1.7 -2.2 -6.2 -6.2 -4.7 -6.4 -5.6Primary fiscal balance (% of GDP) n/a n/a n/a n/a n/a n/a n/a n/a n/aTrade balance (% of GDP) 1.6 1.9 -0.0 0.3 2.7 1.8 1.0 2.2 1.0Current account balance (% of GDP) -1.8 -1.6 -2.9 -2.7 -0.4 -1.7 -2.4 -1.7 -2.5
Official interest rate (end of period) 4.75 4.25 6.00 5.00 3.75 3.50 3.50 4.74 4.693-month interest rate (end of period) 7.46 5.48 7.70 5.51 4.06 3.79 3.80 4.98 4.8610-year interest rate (end of period) 7.94 6.31 7.98 7.10 6.10 6.94 7.27 7.54 8.32Exchange rate vs. USD (end of period) 13,525 13,484 14,380 13,883 14,050 14,622 14,133 16,011 15,675Exchange rate vs. euro (end of period) 14,257 16,171 16,465 15,596 17,241 18,005 17,483 19,677 19,372
Private lending (% YoY, average) 7.8 8.2 10.8 8.8 1.3 2.9 15.3 3.6 17.7Household lending (% YoY, average) n/a n/a n/a n/a n/a n/a n/a n/a n/aP.S. non-financial lending (% YoY, average) n/a n/a n/a n/a n/a n/a n/a n/a n/aP.S. financial lending (% YoY, average) 10.1 15.1 5.6 -3.0 -6.0 10.9 17.5 9.7 14.8Savings rate (as % avg. disp. income) 22.9 23.6 24.0 22.8 21.4 21.6 22.5 22.1 23.8
Source: MAPFRE Economics (based on data from BPS) Forecast end date: July 12, 2021.
Click here to access the interactive version of this information
-10
-5
0
5
1020
19
2020
2021
2022
External demand contributionDomestic demand contribution
GDP BS (YoY, %) GDP SS (YoY, %)
Source: MAPFRE Economics (based on data from BPS)
Chart 1.2.13-b Indonesia: domestic demand breakdown
and forecasts
-10
-5
0
5
10
2019
2020
2021
2022
Public spending Inventory changesTotal investment Private consumption
Chart 1.2.13-a Indonesia: GDP breakdown and forecasts
Source: MAPFRE Economics (based on data from BPS)

Economic recovery is expected to increase in the second half, as an easing of mobility restrictions is expected in that period (unlike in the first half). With household consumption affected, the government will have to continue to support the economy, leading to a fiscal deficit of around -8%. Investment and exports should be helped by an improvement in confidence and a recovery in the global climate. The government has decided to lower corporate tax from 30% to 25%, as a support measure. This revenue reduction (which will lead to greater indebtedness at this crisis stage, but which will be offset in the medium-term by the lower tax burden) will be applied with a lag so as not to forfeit much-needed support at this stage. The purchasing managers' indices (PMIs) for manufacturing in June were in positive territory (50.8 points), up from 49.9 points in the previous month. Although financial
conditions are favorable, there has been no increase in either commercial or consumer credit, possibly owing to concerns about the future. Under these conditions, we have revised our GDP growth estimate to 5.4% in 2021 and 6.9% in 2022 (see Table 1.2.14 and Charts 1.2.14-a and 1.2.14-b).
Further, inflation stood at 4.5% in April, with food prices rising by 4.8% and with the biggest increase seen in transportation prices (+17.9%). The rise in the price of oil in recent months will push up headline inflation. At its June meeting, the Central Bank of the Philippines kept interest rates unchanged at 2.00% (Overnight Repo Rate). It is anticipated that the Central Bank will not have to make changes until it sees that the recovery is more entrenched, or until inflation is no longer controlled. In this regard, the Central Bank
Source: MAPFRE Economics (based on data from the Coronavirus Government Response Tracker, University of Oxford and DeepAI, updated 07/12/2021)
Chart 1.2.13-c Indonesia: daily COVID-19 infections, stringency index and progress toward herd immunity
Doses administered per 100 inhabitants
0 30 60 90 120
18.5
Days to achieve herd immunity*
0 100 200 300 400
384
*Based on vaccinating 70% of the total population
PROGRESS TOWARD HERD IMMUNITY
0
10,000
20,000
30,000
40,000
0
25
50
75
100
Jan
Feb
Mar Ap
r
May Jun
Jul
Aug
Sept Oc
t
Nov
Dec
Jan
Feb
Mar Ap
r
May Jun
Jul
Stringency index Daily infections: 7-day moving average (right axis)Global average
64
2021 ECONOMIC AND INDUSTRY OUTLOOK (Q3)

65
2021 ECONOMIC AND INDUSTRY OUTLOOK (Q3)
Table 1.2.14 Philippines: main macroeconomic aggregates
Baseline (BS) Stressed (SS)
2016 2017 2018 2019 2020(e) 2021(f) 2022(f) 2021(f) 2022(f)
GDP (% YoY) 7.1 6.9 6.3 6.1 -9.6 5.4 6.9 3.3 2.9Domestic demand contribution 17.8 13.5 15.2 7.3 -19.6 11.1 14.5 4.6 3.8External demand contribution -10.7 -6.6 -8.9 -1.2 10.0 -5.8 -7.6 -1.3 -1.0Private consumption contribution 5.3 4.3 4.2 4.2 -5.9 3.6 3.5 2.0 0.8Total investment contribution 6.8 5.9 6.1 0.9 -7.6 4.0 6.1 1.9 2.8Public spending contribution 1.1 0.7 1.6 1.1 1.6 1.1 0.3 1.1 0.3Private consumption (% YoY) 7.2 6.0 5.8 5.9 -7.9 4.9 4.9 2.7 1.2Public consumption (% YoY) 9.4 6.5 13.4 9.1 10.5 7.3 2.0 7.3 2.0Total investment (% YoY) 18.8 15.1 14.6 2.3 -21.6 10.7 15.3 8.6 11.6Exports (% YoY) 9.2 17.4 11.8 2.6 -16.3 8.8 14.4 6.4 7.7Imports (% YoY) -5.8 -0.2 -0.6 -0.8 37.8 15.8 -2.1 8.5 8.4
Unemployment rate (%, last quarter) 4.7 5.0 5.1 4.6 8.7 8.2 6.6 9.1 8.7Inflation (% YoY, last quarter) 2.0 3.0 5.9 1.5 3.1 3.8 2.7 5.6 4.3Fiscal balance (% of GDP) -2.3 -2.1 -3.1 -3.4 -7.6 -7.7 -6.2 -8.0 -8.0Primary fiscal balance (% of GDP) n/a n/a n/a n/a n/a n/a n/a n/a n/aTrade balance (% of GDP) -11.2 -12.2 -14.7 -13.1 -8.8 -10.1 -10.8 -9.9 n/aCurrent account balance (% of GDP) -0.4 -0.7 -2.6 -0.8 3.6 1.9 0.7 1.7 0.0
Official interest rate (end of period) 3.00 3.00 4.75 4.00 2.00 2.00 2.25 4.00 3.383-month interest rate (end of period) 2.50 3.22 5.03 3.97 2.00 2.02 2.41 3.94 3.4910-year interest rate (end of period) 4.63 5.70 7.05 4.44 2.97 4.72 5.22 5.41 6.60Exchange rate vs. USD (end of period) 49.81 49.92 52.72 50.74 48.04 48.55 47.40 53.43 52.05Exchange rate vs. euro (end of period) 52.51 59.87 60.37 57.01 58.95 59.79 58.64 65.66 64.33
Private lending (% YoY, average) 15.3 17.6 16.8 9.5 4.0 3.3 17.5 4.0 20.0Household lending (% YoY, average) n/a n/a n/a n/a n/a n/a n/a n/a n/aP.S. non-financial lending (% YoY, average) n/a n/a n/a n/a n/a n/a n/a n/a n/aP.S. financial lending (% YoY, average) 8.5 9.4 10.3 6.9 -8.0 8.7 12.0 7.3 7.8Savings rate (as % avg. disp. income) 9.3 9.7 9.3 8.4 6.0 3.8 7.1 4.4 9.7
Source: MAPFRE Economics (based on data from PSA) Forecast end date: July 12, 2021.
Click here to access the interactive version of this information
-30
-20
-10
0
10
2020
19
2020
2021
2022
External demand contributionDomestic demand contribution
GDP BS (YoY, %) GDP SS (YoY, %)
Source: MAPFRE Economics (based on data from PSA)
Chart 1.2.14-b Philippines: domestic demand breakdown
and forecasts
-30
-20
-10
0
10
20
2019
2020
2021
2022
Public spending Inventory changesTotal investment Private consumption
Chart 1.2.14-a Philippines: GDP breakdown and forecasts
Source: MAPFRE Economics (based on data from PSA)

66
2021 ECONOMIC AND INDUSTRY OUTLOOK (Q3)
estimates that inflation will be in the upper range of 2–4% in 2021, and takes the view that inflationary risks are now balanced against the risk of an economic downturn, such that m o n e t a r y co n d i t i o n s a re a p p r o p r i a t e . F i n a n c i a l condi t ions are favorable , c o n s u m e r c r e d i t h a s decreased (-10.2% in April) and the M3 money supply increased to 8.3% in the first quarter of the year.
At the moment, the continuation of mobility restrictions appears to be the greatest risk to the recovery of the Philippine economy. A delay in recovery, which will mean a more enduring public deficit and an increase in public debt, could potentially jeopardize its investment-grade credit rating.
• Consumption is expected to recover in the second half of the year. The global recovery should lift exports as early as the second quarter.
• The slow progress of vaccination is delaying the normalization of social and economic activity.
• No further drop in interest rates is expected, owing to the inflation dynamics.
0
3,000
6,000
9,000
12,000
0
25
50
75
100
Jan
Feb
Mar Ap
r
May Jun
Jul
Aug
Sept Oc
t
Nov
Dec
Jan
Feb
Mar Ap
r
May Jun
Jul
Stringency index Daily infections: 7-day moving average (right axis)Global average
Source: MAPFRE Economics (based on data from the Coronavirus Government Response Tracker, University of Oxford and DeepAI, updated 07/12/2021)
Chart 1.2.14-c Philippines: daily COVID-19 infections, stringency index and progress toward herd immunity
Doses administered per 100 inhabitants
0 30 60 90 120
11.4
Days to achieve herd immunity*
0 200 400 600
552
*Based on vaccinating 70% of the total population
PROGRESS TOWARD HERD IMMUNITY
2. Industry outlook
2.1 The economic environment and its impact on insurance demand: update
2.1.1 Global markets
According to the most recent forecasts from MAPFRE Economics, world economic growth in 2021 could range from 6.0% (baseline scenario) to 3.7% (stressed scenario), after a contraction in 2020 of around -3.3%, in line with estimates from the previous quarter. The level of uncertainty is moderate and recovery is expected to be higher than the previous year's contraction (even in the stressed scenario), despite the specific problems that are occurring with new variants of the virus. However, many emerging countries are now in a more delayed phase of recovery and the fight against the pandemic with what is still a slow rate of vaccination. This contrasts with what is happening in the more developed countries, where there have been significant advances in vaccination which have been reflected in a drastic reduction in the number of hospitalizations and deaths due to Covid-19, which, consequently, make it possible to make restrictions on mobility and social contact more flexible and therefore favor their economies and the development of their insurance industry.
Central banks continue to deploy ultra-accommodative monetary policies, and fiscal authorities continue to deploy extensive aid packages (supporting the global economy and financial markets), with the exception of some emerging economies that are experiencing a surge in inflation and have exhausted their fiscal capacities, which is forcing them in some cases to walk back some of the measures previously taken to support their economies.
This environment anticipates that recovery from this crisis will be asynchronous and uneven. Insurance markets, for their part, have been resilient during the crisis, with the Life segment having the biggest declines almost across the board, along with some Non-Life segments like Automobiles (partially offset by the positive performance of Health insurance), but there are already signs of recovery.
2.1.2 Eurozone
In the case of the eurozone, economic growth for 2021 is forecast to range from 4.5% (baseline scenario) to 2.3% (stressed scenario), following an estimated decline of around -6.7% in 2020, which continues to be an improvement on the forecasts made throughout the year. Vaccination campaigns have accelerated and improved all macroeconomic indicators as a result of the lifting of many of the
672021 ECONOMIC AND INDUSTRY OUTLOOK (Q3)

68
2021 ECONOMIC AND INDUSTRY OUTLOOK (Q3)
mobility restrictions in the second quarter of the year. Meanwhile, there have already been two bond issues to finance large fiscal aid plans through the European Union's NextGenerationEU fund, although they will still take some time to implement. In any case, the economic recovery expected this year will favor the recovery of the insurance industry which, in 2020, suffered significant setbacks in its main markets, especially in the Life segment that was affected by both the sharp economic contraction and the persistent low-interest-rate environment of eurozone markets. The Non-Life segment only slowed, but did not suffer a decline, except in some isolated markets.
For its part, the European Central Bank (ECB) has kept asset purchase programs and other unconventional measures intact, while keeping short-term interest rates at current levels (0% for the main refinancing operations and -0.5% for the deposit facility), making clear in its monetary policy statements that it will continue to maintain ultra-accommodative monetary conditions until it sees a clear economic recovery and its inflation target is met (which it set out again at its meeting on July 8 keeping it explicitly at 2%, symmetrical). This message was reflected in the curves produced by the European Insurance and Occupational Pensions Authority (EIOPA) which stabilized during the quarter with a very slight rise seen in the risk-free interest rate across all areas, easing off again after increasing significantly in the previous quarter, with positive rates from maturities above nine years (see Chart 2.1.24). The upward movement of rates, therefore, has slowed, which increases the cost of financing for economic operators and which could damage the recovery due to the direction taken and its continuation over time.
Despite the slight rebound in risk-free interest rates, levels remain low, thereby favoring economic recovery and insurance industry activity, especially for its more cyclical (Non-Life) lines of
business. This does, however, damage the traditional Life business and the profitability of insurance companies generally. Also, the Euro Stoxx 50 index continued the strong performance seen in previous quarters, favoring the development of Life insurance products for which the policyholder assumes the risk of the investment (unit-linked type). Further, improving economic expectations may help this business line, since, coupled with the move toward post-pandemic normalization, the preference of economic operators for remaining in liquidity positions is declining.
-0.8%
-0.6%
-0.4%
-0.2%
0.0%
0.2%
0.4%
0.6%
Years1 2 3 4 5 6 7 8 9 10 11 12 13 14 15 16 17 18 19 20
2020 average Mar 2021 Jun 2021
Source: MAPFRE Economics (based on data from EIOPA)
Minimum and maximum 2020
Chart 2.1.2 Eurozone: risk-free yield curve
(%)
Click here to access the interactive version of this information

69
2021 ECONOMIC AND INDUSTRY OUTLOOK (Q3)
2.1.3 Germany
The German economy is expected to grow by between 3.7% (baseline scenario) and 1.2% (stressed scenario) in 2021, following an estimated decline of around -5.1% in 2020, which represents a slight improvement on expectations, albeit with greater uncertainty. Despite the poor start to the year, economic indicators are continuing to improve, and a return to growth (with the help of the broad packages of expansionary fiscal measures adopted) may help to moderate the negative effects of the crisis on the insurance sector, which, in 2020, experienced a sharp downturn in growth of more than four percentage points as a result of the sharp deterioration of the Life business.
Accordingly, the environment remains complicated for the traditional Life Savings and annuities business, due to the low interest rates in which Germany and the entire eurozone economy have been mired. The yield on Germany's sovereign bond (which improved in the previous quarter) fell again in the second quarter, returning to negative levels for all maturities under 25 years. The German DAX, for its part, once again rose in the second quarter, although more modestly than in the previous quarter, which may stimulate the development of Life insurance products in which the policyholder assumes the risk of the investment, although to a lesser extent since it is reaching maximum levels.
2.1.4 Italy
In 2021, the Italian economy is expected to grow within the range of 4.9% (baseline scenario) and 3.1% (stressed scenario), compared to an estimated 2020 contraction of -8.9%. This represents an improvement in growth expectations based on economic indicators that continue to improve after the reopening,
helped by the extensive monetary and fiscal support packages from the ECB, the Italian government and the European Union. The expected return to economic growth this year will help to boost activity in the country's insurance market, which deteriorated markedly in 2020 (-2.7% for premiums in the Non-Life segment and -6.3% for premiums in the Life segment) as a result of the sharp economic contraction that occurred, with a gradual recovery in insurance premiums, in line with the partial recovery expected for the Italian economy in 2021.
Meanwhile, the ECB's forceful intervention in bond markets has kept the risk premium and the term premium of Italian sovereign debt low, making the rate environment less favorable to the Life business. In the second quarter of 2021, the yield differential on the ten-year German bond relaxed again, in response to moderate growth in the previous quarter, while stock markets were somewhat more volatile, complicating the environment for the recovery of this segment.
2.1.5 Spain
The economic growth forecast for Spain in 2021 is estimated to range from 6.0% (baseline scenario) to 3.8% (stressed scenario), after an estimated decline in 2020 of -10.8%. The reopening of the economy following the lifting of most of the restrictions is being reflected in all economic indicators, but the recovery expected for 2021 will be mainly conditional upon the consequences of measures that may be taken on tourism in response to new outbreaks in which the number of cases among young people is rising and on the protection being offered by vaccines against new variants of the virus in terms of the number of infections, hospitalizations and deaths.

Box 2.1.5 Spanish insurance industry performance:
forecasts for premium growth
Changes in the environment
Since the publication of our previous forecasts in April 2021, Spain has succeeded in its vaccination deployment with 99.7 doses administered per 100 inhabitants, which includes over one-third of the population and the entire population over 65 years of age being fully vaccinated. Accordingly, this progress made it possible at the start of the tourist season to aim to achieve at least half the level of tourism of the previous year. This has served as a milestone with greater tolerance concerning the pandemic and the easing of restrictions on mobility following the outbreak of the pandemic-related crisis in Spain in March 2020.
Recently, even with the sharp spike expected among the young with the emergence of the delta variant of the virus, measures taken remain generally relaxed. In the second quarter, it may be seen that the level of restriction measured by the stringency index fell steadily between April and July, which also served as a basis for a degree of socio-political complacency, as is confirmed by the current minimum level of the uncertainty indicator (See Chart A). The effect of this phenomenon on the other vectors that determine the growth outlook for insurance premiums (expectations, demand and the finance sector) has been palpably clear in every respect.
The lifting of restrictions, and specifically the end of the state of emergency in Spain, not only led to a surge in the level of industrial confidence which was already improving last quarter, but also finally buoyed that of the services sector to near pre-crisis levels (see Chart B).
70
2021 ECONOMIC AND INDUSTRY OUTLOOK (Q3)
0
100
200
300
-4
-2
0
2
2019 2020 2021
Economic policy uncertainty (right axis) Stringency index
Chart A Spain: stringency index vs. economic policy uncertainty
Source: MAPFRE Economics (based on data from Oxford Economics and EPU Bloom 2013)
Chart B Spain: retail and services confidence vs. stringency index
-60%
-40%
-20%
0%
20%
40%
-3
-2
-1
0
1
2
3
4
2013 2014 2015 2016 2017 2018 2019 2020 2021
Retail confidence Stringency index Services confidence
2020 2021

Consumers, for their part, echoed the improved outlook on all consumer fronts: employment, income and financial situation, although the liquidity situation remains tight as exemplified by savings expectations (see Chart C). In the real sector, the second quarter of the year saw a moderate recovery in both manufacturing output (automobiles) and the arrival of tourists, although still far from 2019 levels (see Chart D).
On the financial front, the lower risk aversion was seen in the slower rate of deposit growth, but this was accompanied by greater resistance to the granting of credit, especially consumer and corporate credit, as a result of the imminent ending of the guarantee program offered by the State (see Chart E). Similarly, the acceleration of inflation expectations during the second quarter maintained the positive yield curve with a moderate, but still slight, slope (see Chart F).
In short, all vectors (financial, real and expectations) reflected the change in the environment toward the ending of the state of emergency and the relaxation of lockdown and social distancing measures, which impacted confidence and therefore consumption and savings among the population; factors that have translated into a vigorous recovery in insurance revenues.
Updated premium growth forecasts
In this context, Non-Life segment premiums have continued the dynamics recorded in the first quarter of 2021, growing again close to
Box 2.1.5 (continued) Spanish insurance industry performance:
forecasts for premium growth
-1.0
-0.5
0.0
0.5
1.0
2010 2011 2012 2013 2014 2015 2016 2017 2018 2019 2020 2021
Employment confidence (inverse) Savings confidenceEconomic situation confidence Financial situation confidence
Chart C Spain: consumer confidence
(savings, economic, financial and employment situation)
Source: MAPFRE Economics (based on data from Haver)
Chart D Spain: automobile production and inflow of tourists at annual rate
-200%
0%
200%
400%
2012 2013 2014 2015 2016 2017 2018 2019 2020 2021
Automobile production (%, YoY) Inflow of tourists (%, YoY)
71
2021 ECONOMIC AND INDUSTRY OUTLOOK (Q3)

Box 2.1.5 (continued) Spanish insurance industry performance:
forecasts for premium growth
-6%
-4%
-2%
0%
2%
4%
-20%
-10%
0%
10%
20%
2010 2011 2012 2013 2014 2015 2016 2017 2018 2019 2020 2021
Deposits Consumer loansBusiness loans Mortgage loans (right axis)
Chart E Spain: evolution of credit and deposits at annual rate
Source: MAPFRE Economics (based on data from Haver and EIOPA)
Chart F Eurozone: risk-free yield curve
-0.8%-0.6%-0.4%-0.2%0.0%0.2%0.4%0.6%
1 2 3 4 5 6 7 8 9 10 11 12 13 14 15 16 17 18 19 20
2020 average Mar 2021 Jun 2021
Range of minimum and maximum values 2020
72
2021 ECONOMIC AND INDUSTRY OUTLOOK (Q3)
-4%
-2%
0%
2%
4%
6%
2013
2014
2015
2016
2017
2018
2019
2020
2021
2022
2023
Acyclic lines Cyclical lines Non-Life (total)
Chart G Spain: contribution to growth by Non-Life lines (optimistic scenario)
(%)
Source: MAPFRE Economics
-4%
-2%
0%
2%
4%
6%
2013
2014
2015
2016
2017
2018
2019
2020
2021
2022
2023
Acyclic lines Cyclical lines Non-Life (total)
Chart H Spain: contribution to growth by Non-Life lines (pessimistic scenario)
(%)
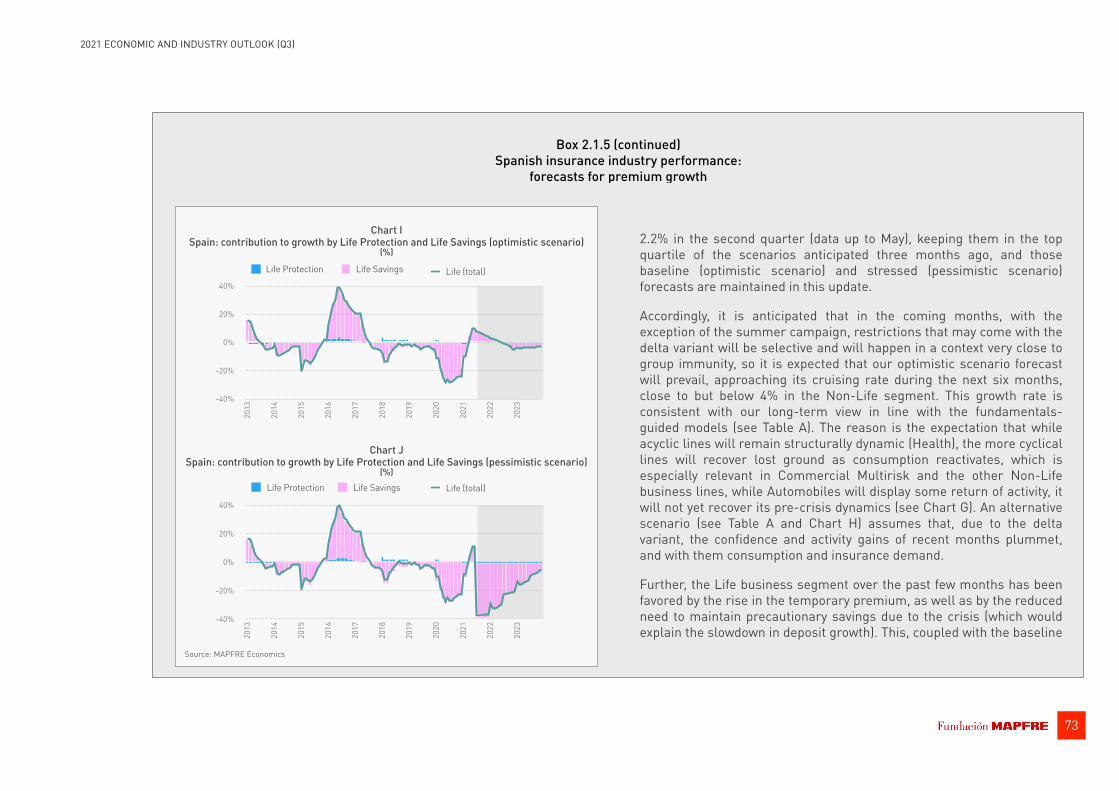
2.2% in the second quarter (data up to May), keeping them in the top quartile of the scenarios anticipated three months ago, and those baseline (optimistic scenario) and stressed (pessimistic scenario) forecasts are maintained in this update.
Accordingly, it is anticipated that in the coming months, with the exception of the summer campaign, restrictions that may come with the delta variant will be selective and will happen in a context very close to group immunity, so it is expected that our optimistic scenario forecast will prevail, approaching its cruising rate during the next six months, close to but below 4% in the Non-Life segment. This growth rate is consistent with our long-term view in line with the fundamentals-guided models (see Table A). The reason is the expectation that while acyclic lines will remain structurally dynamic (Health), the more cyclical lines will recover lost ground as consumption reactivates, which is especially relevant in Commercial Multirisk and the other Non-Life business lines, while Automobiles will display some return of activity, it will not yet recover its pre-crisis dynamics (see Chart G). An alternative scenario (see Table A and Chart H) assumes that, due to the delta variant, the confidence and activity gains of recent months plummet, and with them consumption and insurance demand.
Further, the Life business segment over the past few months has been favored by the rise in the temporary premium, as well as by the reduced need to maintain precautionary savings due to the crisis (which would explain the slowdown in deposit growth). This, coupled with the baseline
Box 2.1.5 (continued) Spanish insurance industry performance:
forecasts for premium growth
73
2021 ECONOMIC AND INDUSTRY OUTLOOK (Q3)
Source: MAPFRE Economics
-40%
-20%
0%
20%
40%
2013
2014
2015
2016
2017
2018
2019
2020
2021
2022
2023
Life Protection Life Savings Life (total)
-40%
-20%
0%
20%
40%
2013
2014
2015
2016
2017
2018
2019
2020
2021
2022
2023
Life Protection Life Savings Life (total)
Chart I Spain: contribution to growth by Life Protection and Life Savings (optimistic scenario)
(%)
Chart J Spain: contribution to growth by Life Protection and Life Savings (pessimistic scenario)
(%)
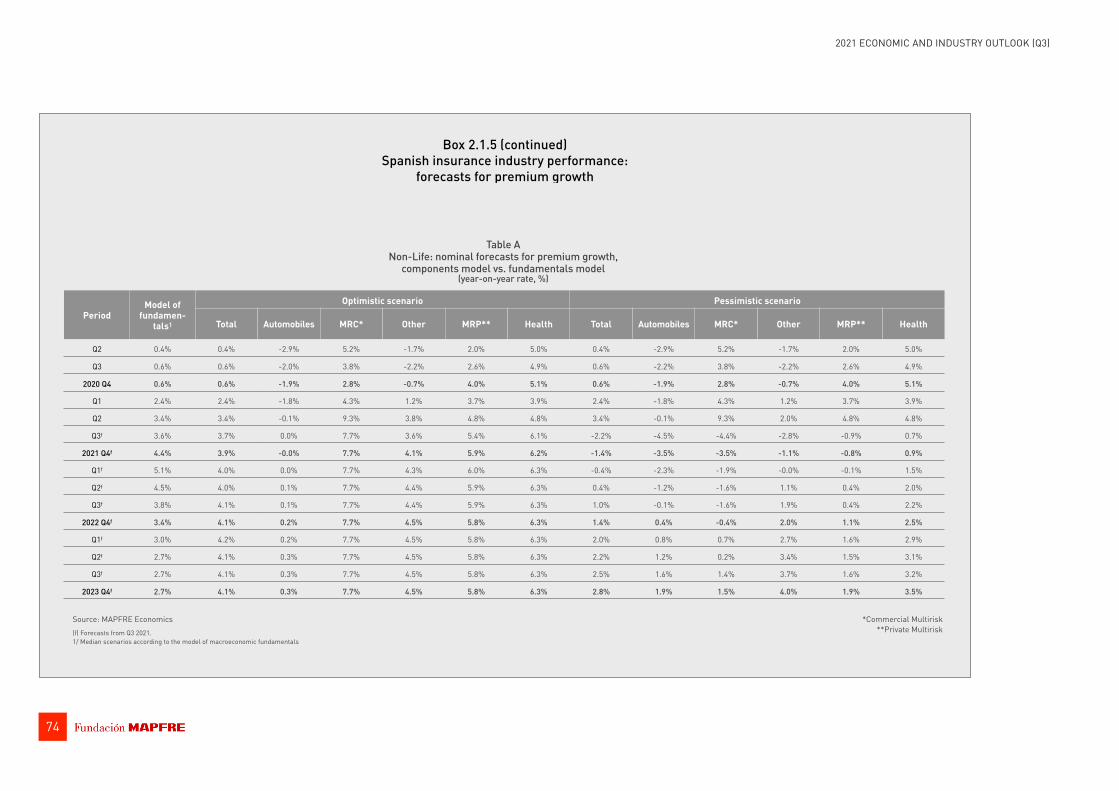
Box 2.1.5 (continued) Spanish insurance industry performance:
forecasts for premium growth
74
2021 ECONOMIC AND INDUSTRY OUTLOOK (Q3)
PeriodModel of
fundamen-tals1
Optimistic scenario Pessimistic scenario
Total Automobiles MRC* Other MRP** Health Total Automobiles MRC* Other MRP** Health
Q2 0.4% 0.4% -2.9% 5.2% -1.7% 2.0% 5.0% 0.4% -2.9% 5.2% -1.7% 2.0% 5.0%
Q3 0.6% 0.6% -2.0% 3.8% -2.2% 2.6% 4.9% 0.6% -2.2% 3.8% -2.2% 2.6% 4.9%
2020 Q4 0.6% 0.6% -1.9% 2.8% -0.7% 4.0% 5.1% 0.6% -1.9% 2.8% -0.7% 4.0% 5.1%
Q1 2.4% 2.4% -1.8% 4.3% 1.2% 3.7% 3.9% 2.4% -1.8% 4.3% 1.2% 3.7% 3.9%
Q2 3.4% 3.4% -0.1% 9.3% 3.8% 4.8% 4.8% 3.4% -0.1% 9.3% 2.0% 4.8% 4.8%
Q3f 3.6% 3.7% 0.0% 7.7% 3.6% 5.4% 6.1% -2.2% -4.5% -4.4% -2.8% -0.9% 0.7%
2021 Q4f 4.4% 3.9% -0.0% 7.7% 4.1% 5.9% 6.2% -1.4% -3.5% -3.5% -1.1% -0.8% 0.9%
Q1f 5.1% 4.0% 0.0% 7.7% 4.3% 6.0% 6.3% -0.4% -2.3% -1.9% -0.0% -0.1% 1.5%
Q2f 4.5% 4.0% 0.1% 7.7% 4.4% 5.9% 6.3% 0.4% -1.2% -1.6% 1.1% 0.4% 2.0%
Q3f 3.8% 4.1% 0.1% 7.7% 4.4% 5.9% 6.3% 1.0% -0.1% -1.6% 1.9% 0.4% 2.2%
2022 Q4f 3.4% 4.1% 0.2% 7.7% 4.5% 5.8% 6.3% 1.4% 0.4% -0.4% 2.0% 1.1% 2.5%
Q1f 3.0% 4.2% 0.2% 7.7% 4.5% 5.8% 6.3% 2.0% 0.8% 0.7% 2.7% 1.6% 2.9%
Q2f 2.7% 4.1% 0.3% 7.7% 4.5% 5.8% 6.3% 2.2% 1.2% 0.2% 3.4% 1.5% 3.1%
Q3f 2.7% 4.1% 0.3% 7.7% 4.5% 5.8% 6.3% 2.5% 1.6% 1.4% 3.7% 1.6% 3.2%
2023 Q4f 2.7% 4.1% 0.3% 7.7% 4.5% 5.8% 6.3% 2.8% 1.9% 1.5% 4.0% 1.9% 3.5%
Table A Non-Life: nominal forecasts for premium growth,
components model vs. fundamentals model (year-on-year rate, %)
Source: MAPFRE Economics (f) Forecasts from Q3 2021. 1/ Median scenarios according to the model of macroeconomic fundamentals
*Commercial Multirisk **Private Multirisk

effect of the abrupt fall in the transition months between the first and second quarter, has led to visible premium growth through the second quarter of this year, which is expected to be diluted during the transition from 2021 to 2022. So, although in the short-term we now anticipate near 4.4% growth in the medium- and long-term optimistic scenario, we still believe that structural forces will continue to weigh on premiums and keep them in negative territory (see Table B and Chart I). In the pessimistic (risk) scenario, however, the restrictions, uncertainty and lack of liquidity could again lead to a sudden drop in premiums (see Chart J).
Component model forecasts vs. fundamental model forecasts
Forecasts of nominal premium growth based on component models reveal that short-term performance depends heavily on expectations and the effect of restrictions; this is not captured by fundamental-based models based on income and consumption paradigms.
The latter models, however, are useful for checking the consistency of the central forecasts of the component models. Therefore, it should be remembered that the long-term forecasts for both types of models tend to converge, as shown in Charts K and L.
Box 2.1.5 (continued) Spanish insurance industry performance:
forecasts for premium growth
75
2021 ECONOMIC AND INDUSTRY OUTLOOK (Q3)
PeriodModel of funda-
mentals1
Optimistic scenario Pessimistic scenario
Total Savings Risk Total Savings Risk
Q2 -26.0% -26.0% -32.0% 0.1% -26.0% -32.0% 0.1%
Q3 -25.8% -25.8% -31.3% -0.2% -25.8% -31.3% -0.2%
2020 Q4 -23.6% -20.7% -25.0% -0.4% -20.7% -25.0% -0.4%
Q1 -3.2% -3.2% -3.7% -1.9% -3.2% -3.7% -1.9%
Q2f 9.2% 9.2% 10.6% 5.2% 9.1% 10.6% 5.2%
Q3f 8.4% 6.5% 6.8% -1.7% -48.2% -49.5% -3.6%
2021 Q4f 7.9% 4.4% 4.6% -1.4% -46.9% -48.2% -3.4%
Q1f 9.1% 2.1% 2.2% -1.2% -43.7% -45.0% -3.2%
Q2f 9.4% 0.1% 0.1% -0.9% -38.8% -39.9% -3.0%
Q3f 8.9% -2.1% -2.2% -0.7% -34.3% -35.3% -2.8%
2022 Q4f 8.3% -4.5% -4.6% -0.4% -31.1% -32.0% -2.6%
Q1f 7.5% -3.8% -3.9% -0.2% -25.4% -26.2% -2.0%
Q2f 6.8% -3.4% -3.5% 0.0% -19.6% -20.1% -2.0%
Q3f 6.3% -3.1% -3.2% 0.0% -14.8% -15.2% -2.0%
2023 Q4f 6.0% -2.8% -2.9% 0.0% -8.9% -9.1% -2.0%
Table B Life: nominal forecasts for premium growth, components model vs. fundamentals model
(year-on-year rate, %)
Source: MAPFRE Economics (f) Forecasts from Q3 2021. 1/ Median scenarios according to the model of macroeconomic fundamentals

Box 2.1.5 (continued) Spanish insurance industry performance:
forecasts for premium growth
Non-Life forecasts in real terms
Finally, given the strong impact of the effect of the price level on premium growth, especially in lines with a high loss experience, our price forecasts for each insurance line have been taken into account to build a real (non-nominal) growth forecast for Non-Life premiums in both scenarios.
As can be seen in Table C, as well as in the M, N, O and P series of Charts, real growth of Non-Life premiums in an optimistic scenario is close to 1% in the long-term, slightly above the nearest horizon. Also, in the most severe scenario (pessimistic scenario), we envisage a cumulative contraction of 6% over 3 years.
-3%
0%
3%
6%
2020 2021 2022 2023
Components: optimistic scenario Components: pessimistic scenarioFundamentals: median scenarios
-60%
-30%
0%
30%
2020 2021 2022 2023
Components: optimistic scenario Components: pessimistic scenarioFundamentals: median scenarios
Chart K Spain: comparison of nominal forecasts for Non-Life models
(YoY, %)
Source: MAPFRE Economics
Chart L Spain: comparison of nominal forecasts for Life models
(YoY, %)
76
2021 ECONOMIC AND INDUSTRY OUTLOOK (Q3)

Box 2.1.5 (continued) Spanish insurance industry performance:
forecasts for premium growth
77
2021 ECONOMIC AND INDUSTRY OUTLOOK (Q3)
-6%
-4%
-2%
0%
2%
4%
6%
2021 2022 2023
Automobiles MRC Other MRP Health
Chart P Spain: actual quarterly forecasts for Non-Life premiums (pessimistic scenario)
(YoY, %)
-10%
-8%
-6%
-4%
-2%
0%
2%
4%
2021 2022 2023
Automobiles MRC Other MRP Health
Chart O Spain: actual quarterly forecasts for Non-Life premiums (optimistic scenario)
(YoY, %)
Source: MAPFRE Economics
-6%
-4%
-2%
0%
2%
4%
2020 2021 2022 2023
Components: optimistic scenario Components: pessimistic scenarioFundamentals: median scenarios
Chart M Spain: actual quarterly forecasts of Non-Life premiums, components model vs. funda-
mentals model (YoY, %)
Chart N Spain: actual quarterly forecasts for Non-Life premiums
(YoY, %)
Source: MAPFRE Economics (based on data from INE)
-4%
-2%
0%
2%
4%
2020 2021 2022 2023
Average of fundamentals model Average of components model
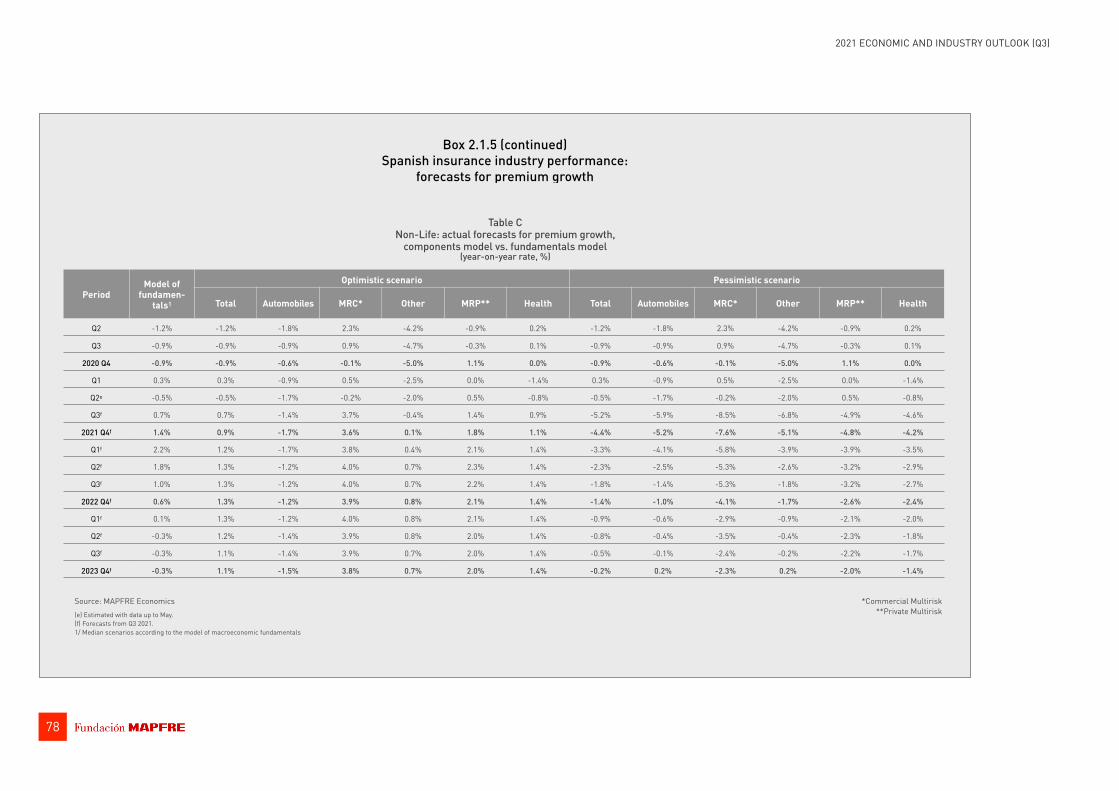
Box 2.1.5 (continued) Spanish insurance industry performance:
forecasts for premium growth
PeriodModel of
fundamen-tals1
Optimistic scenario Pessimistic scenario
Total Automobiles MRC* Other MRP** Health Total Automobiles MRC* Other MRP** Health
Q2 -1.2% -1.2% -1.8% 2.3% -4.2% -0.9% 0.2% -1.2% -1.8% 2.3% -4.2% -0.9% 0.2%
Q3 -0.9% -0.9% -0.9% 0.9% -4.7% -0.3% 0.1% -0.9% -0.9% 0.9% -4.7% -0.3% 0.1%
2020 Q4 -0.9% -0.9% -0.6% -0.1% -5.0% 1.1% 0.0% -0.9% -0.6% -0.1% -5.0% 1.1% 0.0%
Q1 0.3% 0.3% -0.9% 0.5% -2.5% 0.0% -1.4% 0.3% -0.9% 0.5% -2.5% 0.0% -1.4%
Q2e -0.5% -0.5% -1.7% -0.2% -2.0% 0.5% -0.8% -0.5% -1.7% -0.2% -2.0% 0.5% -0.8%
Q3f 0.7% 0.7% -1.4% 3.7% -0.4% 1.4% 0.9% -5.2% -5.9% -8.5% -6.8% -4.9% -4.6%
2021 Q4f 1.4% 0.9% -1.7% 3.6% 0.1% 1.8% 1.1% -4.4% -5.2% -7.6% -5.1% -4.8% -4.2%
Q1f 2.2% 1.2% -1.7% 3.8% 0.4% 2.1% 1.4% -3.3% -4.1% -5.8% -3.9% -3.9% -3.5%
Q2f 1.8% 1.3% -1.2% 4.0% 0.7% 2.3% 1.4% -2.3% -2.5% -5.3% -2.6% -3.2% -2.9%
Q3f 1.0% 1.3% -1.2% 4.0% 0.7% 2.2% 1.4% -1.8% -1.4% -5.3% -1.8% -3.2% -2.7%
2022 Q4f 0.6% 1.3% -1.2% 3.9% 0.8% 2.1% 1.4% -1.4% -1.0% -4.1% -1.7% -2.6% -2.4%
Q1f 0.1% 1.3% -1.2% 4.0% 0.8% 2.1% 1.4% -0.9% -0.6% -2.9% -0.9% -2.1% -2.0%
Q2f -0.3% 1.2% -1.4% 3.9% 0.8% 2.0% 1.4% -0.8% -0.4% -3.5% -0.4% -2.3% -1.8%
Q3f -0.3% 1.1% -1.4% 3.9% 0.7% 2.0% 1.4% -0.5% -0.1% -2.4% -0.2% -2.2% -1.7%
2023 Q4f -0.3% 1.1% -1.5% 3.8% 0.7% 2.0% 1.4% -0.2% 0.2% -2.3% 0.2% -2.0% -1.4%
Table C Non-Life: actual forecasts for premium growth,
components model vs. fundamentals model (year-on-year rate, %)
Source: MAPFRE Economics (e) Estimated with data up to May. (f) Forecasts from Q3 2021. 1/ Median scenarios according to the model of macroeconomic fundamentals
*Commercial Multirisk **Private Multirisk
78
2021 ECONOMIC AND INDUSTRY OUTLOOK (Q3)

The return to economic growth and improved expectations are translating across to the insurance market, which is experiencing year-on-year growth. With the latest data available for June 20215, aggregate premium growth was 5.5%, compared to the same period in the previous year. Life business premiums were growing by 9.2% year-on-year in the first six months of the year (compared to the drop of -20.7% in 2020, for the whole year), with Life Savings insurance premiums growing by 10.6% (-25.0% in 2020) and Life Protection insurance premiums by 5.2% (-0.4% in 2020), although these still remain far from pre-crisis levels. Growth in Non-Life premiums appears to have recovered year-on-year in the first five months, growing by around 3.4% at the aggregate level compared to premiums in the same period of the previous year (compared to 1.1% growth in 2020 throughout the year as a whole). The Health insurance line showed growth of around 4.8% (5.1% in 2020), as also did multirisk and homeowners with 5.2% (2.7% in 2020) and condominium with 2.8% (2.8% in 2020). Finally, Box 2.1.5 shows the most recent update of the Spanish insurance market growth forecasts prepared by MAPFRE Economics.
2.1.6 United Kingdom
For 2021, UK economic growth is anticipated to be within the range of 5.1% (baseline scenario) and 4.9% (stressed scenario), compared to the sharp contraction of -9.8% in 2020. Uncertainty about the partial recovery of the British economy is being mitigated by the major advance in the vaccination campaign, which is allowing the strict mobility restrictions the country had to apply to be lifted. Expectations for the performance of the insurance business in 2021 have therefore improved in line with the onset of economic recovery. It should be noted that the economic crisis caused by the pandemic had a strong negative impact on the UK insurance market, with a drop in total premiums of around -8%, which mainly affected the Life business with a decline of around -11%. The Non-Life business,
however, had positive growth of around 1.7%, which partially offset the strong decline in the Life business.
With regard to traditional Life Savings and Annuities insurance, in EIOPA's risk-free yield curves (see Figure 2.1.6), an easing in interest rates is again seen in the medium and long sections of the curve for the previous quarter, reversing their upward trajectory in the previous quarter, and losing some of their positive slope. This worsens the outlook for these types of products, as the term premium they can offer is lower, although the slight rebound in short-term interest rates may help offset the negative effect of the medium- and long-term rate reversal. Coupled with the positive effect on the business of the return to economic growth and the good performance of the FTSE
Chart 2.1.6 United Kingdom: risk-free yield curve
(%)
-0.4%
0.0%
0.4%
0.8%
1.2%
1.6%
Years1 2 3 4 5 6 7 8 9 10 11 12 13 14 15 16 17 18 19 20
2020 average Mar 2021 Jun 2021 Minimum and maximum 2020
Source: MAPFRE Economics (based on data from EIOPA)Click here to access the interactive
version of this information
79
2021 ECONOMIC AND INDUSTRY OUTLOOK (Q3)
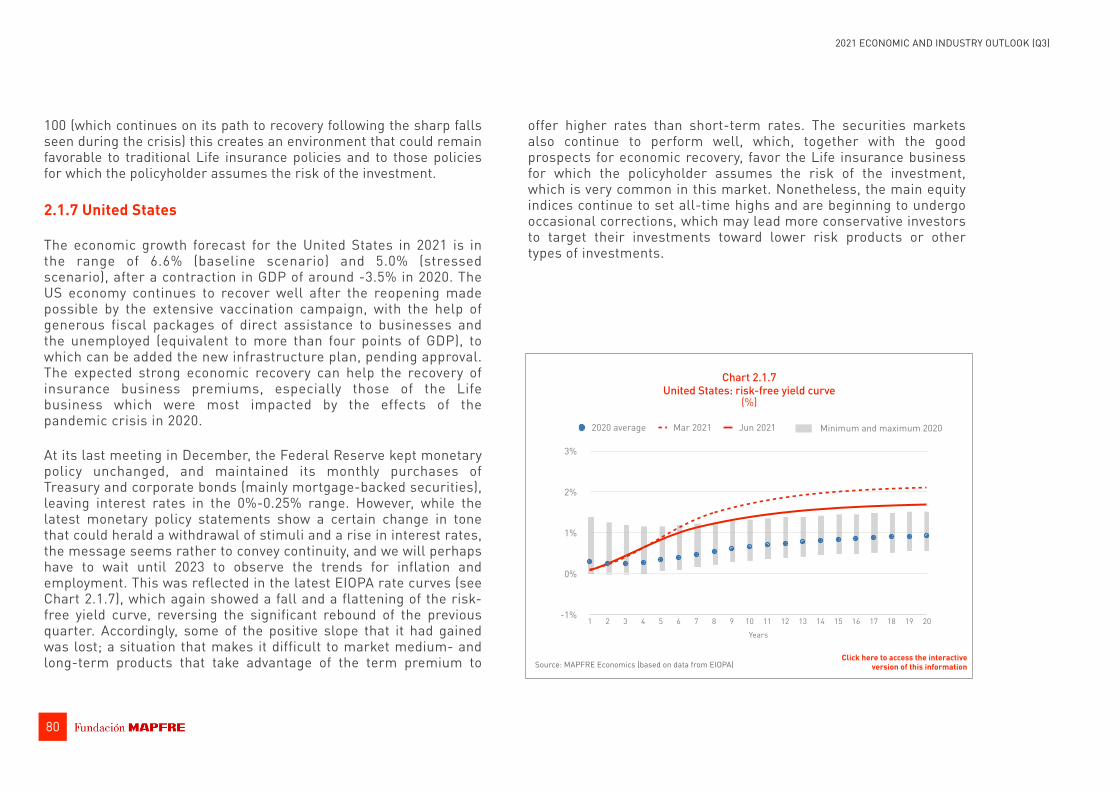
100 (which continues on its path to recovery following the sharp falls seen during the crisis) this creates an environment that could remain favorable to traditional Life insurance policies and to those policies for which the policyholder assumes the risk of the investment.
2.1.7 United States
The economic growth forecast for the United States in 2021 is in the range of 6.6% (baseline scenario) and 5.0% (stressed scenario), after a contraction in GDP of around -3.5% in 2020. The US economy continues to recover well after the reopening made possible by the extensive vaccination campaign, with the help of generous fiscal packages of direct assistance to businesses and the unemployed (equivalent to more than four points of GDP), to which can be added the new infrastructure plan, pending approval. The expected strong economic recovery can help the recovery of insurance business premiums, especially those of the Life business which were most impacted by the effects of the pandemic crisis in 2020.
At its last meeting in December, the Federal Reserve kept monetary policy unchanged, and maintained its monthly purchases of Treasury and corporate bonds (mainly mortgage-backed securities), leaving interest rates in the 0%-0.25% range. However, while the latest monetary policy statements show a certain change in tone that could herald a withdrawal of stimuli and a rise in interest rates, the message seems rather to convey continuity, and we will perhaps have to wait until 2023 to observe the trends for inflation and employment. This was reflected in the latest EIOPA rate curves (see Chart 2.1.7), which again showed a fall and a flattening of the risk-free yield curve, reversing the significant rebound of the previous quarter. Accordingly, some of the positive slope that it had gained was lost; a situation that makes it difficult to market medium- and long-term products that take advantage of the term premium to
offer higher rates than short-term rates. The securities markets also continue to perform well, which, together with the good prospects for economic recovery, favor the Life insurance business for which the policyholder assumes the risk of the investment, which is very common in this market. Nonetheless, the main equity indices continue to set all-time highs and are beginning to undergo occasional corrections, which may lead more conservative investors to target their investments toward lower risk products or other types of investments.
Chart 2.1.7 United States: risk-free yield curve
(%)
-1%
0%
1%
2%
3%
Years1 2 3 4 5 6 7 8 9 10 11 12 13 14 15 16 17 18 19 20
2020 average Mar 2021 Jun 2021 Minimum and maximum 2020
Source: MAPFRE Economics (based on data from EIOPA)Click here to access the interactive
version of this information
80
2021 ECONOMIC AND INDUSTRY OUTLOOK (Q3)

2.1.8 Brazil
Economic forecasts for Brazil anticipate GDP growth in the range of 5.1% (baseline scenario) to 4.6% (stressed scenario) in 2021, compared to an estimated real drop of -4.4% in 2020. The Brazilian economy continues to be impacted less than other countries in the region and prospects for economic growth are improving, but the level of uncertainty is high because the pandemic is still far from being over. The Non-Life business continues to recover from the heavy falls suffered in the first half of last year, a recovery that began to take place in the second half of the year, with even the beginnings of a certain return to life in the Automobiles business, which was most affected by the crisis. The expected partial economic recovery
improves prospects and may help to mitigate the negative impact that the sharp fall in GDP had on the Brazilian insurance industry, which suffered a decline in real terms during the previous year as a result of the poorer performance of the Life business. Additionally, Box 2.1.8 shows the most recent update to Brazilian insurance market growth forecasts prepared by MAPFRE Economics.
Furthermore, the Bank of Brazil has once again been forced to tighten the accommodative monetary policy it was applying to stimulate the economy, as a result of rising inflation, and it raised interest rates once again in June. The EIOPA risk-free yield curve (see Chart 2.1.8) shows a significant rise from where the curve stood at the beginning of the year in all sections. The higher interest rate environment and a positive term premium (making it possible to offer medium- and long-term rates that are guaranteed to be higher than short-term rates) for the Life Savings and Annuities insurance businesses, continues to improve. This is in addition to an improving economic outlook for 2021.
2.1.9 Mexico
The economic growth forecast for Mexico ranges from 5.4% (baseline scenario) and 3.9% (stressed scenario) for 2021, which represents an improvement on expectations, following a marked decline in real GDP of -8.5% in 2020. The pandemic situation seems to be improving and is already far from the acute phase experienced earlier this year that led to record numbers of deaths in January. Although the vaccination campaign is progressing more slowly than in other large Latin American countries such as Brazil and Argentina, the price of oil continues to climb and the US economy is proving very dynamic in its recovery, which benefits the Mexican economy because of its close ties to it. The insurance industry continues to suffer from the effects of the sharp economic downturn, and in the first quarter of this year
0%
2%
4%
6%
8%
10%
Years1 2 3 4 5 6 7 8 9 10 11 12 13 14 15 16 17 18 19 20
2020 average Mar 2021 Jun 2021
Chart 2.1.8 Brazil: risk-free yield curve
(%)
Source: MAPFRE Economics (based on data from EIOPA)
Minimum and maximum 2020
Click here to access the interactive version of this information
81
2021 ECONOMIC AND INDUSTRY OUTLOOK (Q3)
Box 2.1.8 Brazilian insurance industry performance:
forecasts for premium growth
General update environment
The forecasts for premium growth made for the Brazilian market for the period 2021–2023 have been updated based on our model for cyclical and acyclic lines using high-frequency information collected on monthly indicators and their response to the levels of social restrictions as expressed in the social restrictions indicator. The collection of charts depicted by the central (optimistic) and stressed (pessimistic) scenarios for these forecasts is set out in Charts A and B.
In Brazil, production indicators are generally improving and some drag on consumption, investment and exports is expected. Inflation remains consistently high, particularly due to pressure on food, electricity and fuels, causing the central bank to tighten monetary and financial conditions, which will hinder a more dynamic recovery.
Despite the latest data, the pandemic is far from being under control, so the recent relaxation of mobility restrictions could be reversed. This is not our baseline scenario, however, which is one of gradual normalization and recovery of activity. Accordingly, the optimistic scenario envisages activity, expectations and financial conditions remaining unchanged, as presented in July; that is to say, within normal bounds, in line with social restriction indices. The risk scenario (pessimistic scenario), for its part, assumes that the restrictions will return and be significant during the next six months and will remain in place at least until the end of 2022 with an inevitable impact on activity and expectations.
Premium growth forecasts
In the context of a slight improvement in activity levels and, above all, a significant increase in prices, insurance premiums up to the second quarter were better than was expected in our last report. Premiums in the Non-Life segment grew by 12% in the first quarter of 2021, which leads us to estimate that their growth in the second quarter will be between 10% and 11%, although much of the growth will be nominal, as a result of the previously mentioned rebound in inflation.
Our view of activity and inflation levels, and inertia in the insurance industry in the optimistic scenario, leads us to review nominal premium growth in the Non-Life segment. Accordingly, the current dynamism of the second quarter is expected to decelerate to around 6% by the end of 2021, in line with the brake effect of the monetary policy. After that point, given the anticipated improved context for activity and financial conditions, it is foreseeable that it will converge again toward the long-term which we place in the 8% environment (see Table A and Chart C). In this convergence toward long-term levels, the Automobiles line will make a marginal contribution (contributing less than a quarter of growth), while most of the dynamism will come from the other lines within the segment.
Meanwhile, in the risk scenario (pessimistic scenario), the economy would come to a sudden stop across the board that would affect exchange rates, inflation, expectations and activity. This standstill would arrive exogenously, brought about by the inability to control the
82
2021 ECONOMIC AND INDUSTRY OUTLOOK (Q3)

Box 2.1.8 (continued) Brazilian insurance industry performance:
forecasts for premium growth
83
2021 ECONOMIC AND INDUSTRY OUTLOOK (Q3)
Source: MAPFRE Economics
Chart A Brazil: evolution of explanatory variables (optimistic scenario)
Automobile flow (%, YoY)
-200%
0%
200%
400%
600%
800%
1,000%
-0.5
0.0
0.5
1.0
2019
2020
2021
2022
2023
2024
Analyzed variable (right axis) Stringency index
Inflation expectations (%, YoY)
2.5%
3.0%
3.5%
4.0%
4.5%
5.0%
-0.5
0.0
0.5
1.0
2019
2020
2021
2022
2023
2024
Capacity used
50
60
70
80
90
100
-0.5
0.0
0.5
1.0
2019
2020
2021
2022
2023
2024
Services revenue (%, YoY)
-100%
-50%
0%
50%
100%
150%
-0.5
0.0
0.5
1.0
2019
2020
2021
2022
2023
2024
Credit (%, YoY)
-30%
-20%
-10%
0%
10%
20%
30%
40%
-0.5
0.0
0.5
1.0
2019
2020
2021
2022
2023
2024
REER
100
120
140
160
-0.5
0.0
0.5
1.0
2019
2020
2021
2022
2023
2024

Box 2.1.8 (continued) Brazilian insurance industry performance:
forecasts for premium growth
84
2021 ECONOMIC AND INDUSTRY OUTLOOK (Q3)
Source: MAPFRE Economics
Chart A (continued) Brazil: evolution of explanatory variables (optimistic scenario)
Services confidence
40
60
80
100
120
-0.5
0.0
0.5
1.0
2019
2020
2021
2022
2023
2024
Analyzed variable (right axis) Stringency index
Assessment of current conditions
60
65
70
75
80
85
-0.5
0.0
0.5
1.0
2019
2020
2021
2022
2023
2024
Consumer expectations
50
60
70
80
90
100
-0.5
0.0
0.5
1.0
2019
2020
2021
2022
2023
2024
Overall economic confidence
50
60
70
80
90
100
-0.5
0.0
0.5
1.0
2019
2020
2021
2022
2023
2024
Retail confidence
60
80
100
120
-0.5
0.0
0.5
1.0
2019
2020
2021
2022
2023
2024
Economic policy uncertainty
0
50
100
150
200
250
-0.5
0.0
0.5
1.0
2019
2020
2021
2022
2023
2024

Box 2.1.8 (continued) Brazilian insurance industry performance:
forecasts for premium growth
85
2021 ECONOMIC AND INDUSTRY OUTLOOK (Q3)
Source: MAPFRE Economics
Chart B Brazil: evolution of explanatory variables (pessimistic scenario)
Automobile flow (%, YoY)
-180%
0%
180%
360%
540%
720%
900%
-0.4
0.0
0.4
0.8
1.2
2019
2020
2021
2022
2023
2024
Analyzed variable (right axis) Stringency index
Inflation expectations (%, YoY)
2.5%
3.0%
3.5%
4.0%
4.5%
5.0%
-0.4
0.0
0.4
0.8
1.2
2019
2020
2021
2022
2023
2024
Capacity used
50
60
70
80
90
100
-0.4
0.0
0.4
0.8
1.2
2019
2020
2021
2022
2023
2024
Services revenue (%, YoY)
-100%
-50%
0%
50%
100%
150%
-0.4
0.0
0.4
0.8
1.2
2019
2020
2021
2022
2023
2024
Credit (%, YoY)
-30%
-20%
-10%
0%
10%
20%
30%
40%
-0.4
0.0
0.4
0.8
1.2
2019
2020
2021
2022
2023
2024
REER
100
120
140
160
-0.4
0.0
0.4
0.8
1.2
2019
2020
2021
2022
2023
2024
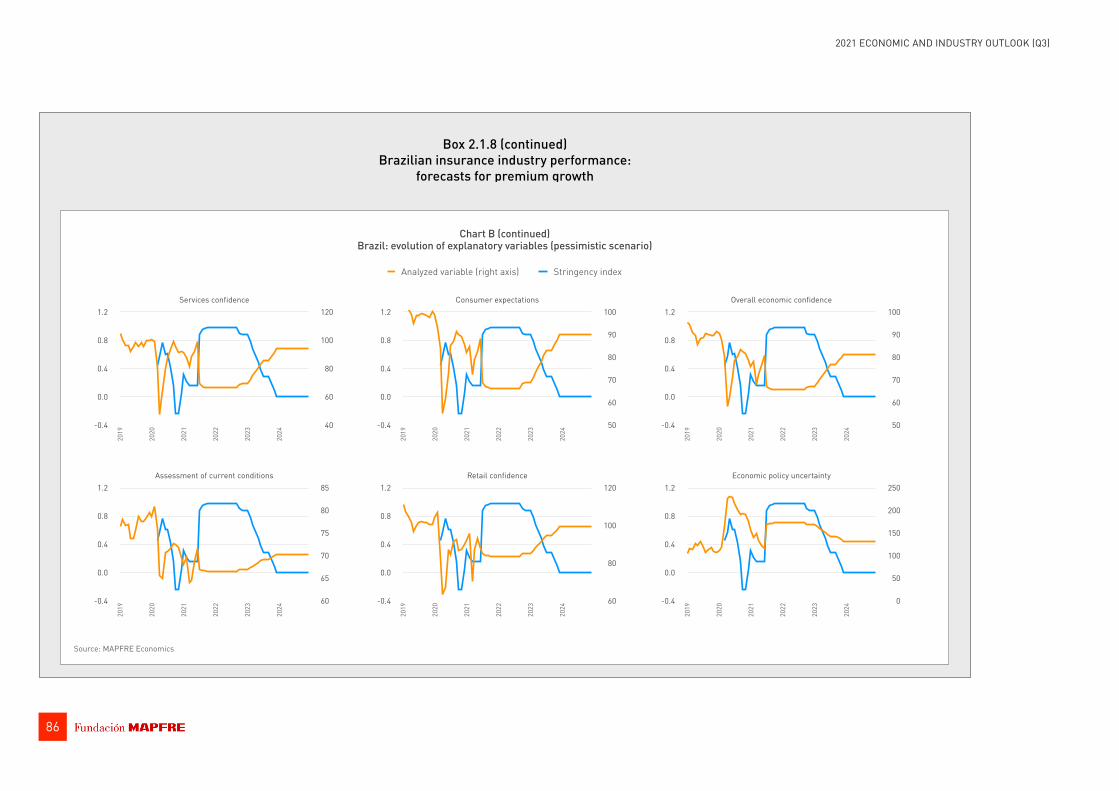
Box 2.1.8 (continued) Brazilian insurance industry performance:
forecasts for premium growth
86
2021 ECONOMIC AND INDUSTRY OUTLOOK (Q3)
Source: MAPFRE Economics
Chart B (continued) Brazil: evolution of explanatory variables (pessimistic scenario)
Services confidence
40
60
80
100
120
-0.4
0.0
0.4
0.8
1.2
2019
2020
2021
2022
2023
2024
Analyzed variable (right axis) Stringency index
Assessment of current conditions
60
65
70
75
80
85
-0.4
0.0
0.4
0.8
1.2
2019
2020
2021
2022
2023
2024
Consumer expectations
50
60
70
80
90
100
-0.4
0.0
0.4
0.8
1.2
2019
2020
2021
2022
2023
2024
Overall economic confidence
50
60
70
80
90
100
-0.4
0.0
0.4
0.8
1.2
2019
2020
2021
2022
2023
2024
Retail confidence
60
80
100
120
-0.4
0.0
0.4
0.8
1.2
2019
2020
2021
2022
2023
2024
Economic policy uncertainty
0
50
100
150
200
250
-0.4
0.0
0.4
0.8
1.2
2019
2020
2021
2022
2023
2024

Box 2.1.8 (continued) Brazilian insurance industry performance:
forecasts for premium growth
87
2021 ECONOMIC AND INDUSTRY OUTLOOK (Q3)
pandemic and, therefore, by the return of restrictions on mobility. In this context, activity would plummet from current figures into negative territory in the first quarter of 2022, with particular erosion of the Automobiles line and a much lower contribution from other lines. After this slump, with activity normalizing from that point on, the insurance activity would return to the previously stated long-term levels, although more slowly in the short-term with greater acceleration at the end of the forecast period, as a result of meeting the pent-up demand for 2021/2022 (see Chart D).
The Life business segment would be more volatile than Non-Life. The rise in the rate curve, the base effect of the fall in business during 2020 due to liquidity requirements as well as some inorganic operations have brought about a very marked increase in the first two quarters of the year, which we estimate at around 15%, almost entirely due to similar growth in VGBL (Vida Gerador de Beneficios Livres (Life Free Benefit Generator)) -type insurance. As monetary policy exerts a chilling effect on activity and prices, this rate is expected to stabilize at around 11% in the medium- and long-term (see Table B and Chart E). By contrast, an extreme event (which would occur in our pessimistic scenario) could sink insurance supply and demand for the remainder of 2021 and 2022, driving premium growth to contract by more than 5% in 2022, before resuming its long-term convergence by 2023, when it would grow by about 8% (see Chart F).
-10
0
10
20
30
2011
2012
2013
2014
2015
2016
2017
2018
2019
2020
2021
2022
2023
2024
Automobiles Non-Automobiles Non-Life (total)
Chart C Brazil: contribution to growth by Non-Life lines (optimistic scenario)
(%)
Source: MAPFRE Economics
-10
0
10
20
30
2011
2012
2013
2014
2015
2016
2017
2018
2019
2020
2021
2022
2023
2024
Automobiles Non-Automobiles Non-Life (total)
Chart D Brazil: contribution to growth by Non-Life lines (pessimistic scenario)
(%)

Box 2.1.8 (continued) Brazilian insurance industry performance:
forecasts for premium growth
88
2021 ECONOMIC AND INDUSTRY OUTLOOK (Q3)
PeriodModel of
fundamen-tals1
Optimistic scenario Pessimistic scenario
TotalVGBL
(Life Free Benefit
Generator)
Individual and group Total
VGBL (Life Free
Benefit Generator)
Individual and group
Q2 -5.7% -5.7% -7.9% 0.4% -5.7% -7.9% 0.4%
Q3 -0.2% -0.2% -2.1% 5.2% -0.2% -2.1% 5.2%
2020 Q4 0.4% 0.4% -1.8% 7.0% 0.4% -1.8% 7.0%
Q1 2.4% 12.9% 13.0% 9.6% 12.9% 13.0% 9.6%
Q2 8.6% 17.0% 17.3% 7.0% -3.0% -3.2% 1.9%
Q3 11.6% 14.1% 14.3% 5.8% -3.5% -3.7% 1.0%
2021 Q4 11.3% 14.8% 15.1% 5.8% -2.9% -3.0% 0.9%
Q1 11.0% 12.4% 12.6% 5.8% -5.2% -5.4% 0.9%
Q2 10.7% 11.5% 11.7% 5.8% -6.2% -6.4% 0.9%
Q3 10.5% 10.6% 10.8% 5.8% -7.0% -7.2% 0.9%
2022 Q4 10.2% 10.3% 10.5% 5.8% -5.3% -5.5% 1.4%
Q1 9.9% 11.2% 11.3% 5.8% -1.1% -1.2% 2.4%
Q2e 9.6% 11.5% 11.6% 5.8% 4.9% 4.9% 3.9%
Q3f 9.3% 11.7% 11.9% 5.8% 6.9% 7.0% 4.4%
2023 Q4 9.0% 11.8% 12.0% 5.8% 12.2% 12.4% 5.8%
Q1 8.9% 11.6% 11.7% 5.8% 11.6% 11.7% 5.8%
Q2 8.9% 11.5% 11.6% 5.8% 11.5% 11.6% 5.8%
Q3 8.9% 11.4% 11.5% 5.8% 11.4% 11.5% 5.8%
2024 Q4 8.9% 11.3% 11.5% 5.8% 11.3% 11.5% 5.8%
Table B Life: forecasts for premium growth,
components model vs. fundamentals model (year-on-year rate, %)
Source: MAPFRE Economics (e) Estimated with data up to April. (f) Forecasts from Q3 2021. 1/ Median scenarios according to the model of macroeconomic fundamentals
PeriodModel of
fundamen-tals1
Optimistic scenario Pessimistic scenario
Total Automo-biles
Non-Automo-
bilesTotal Automo-
bilesNon-
Automo-biles
Q2 -1.8% -1.8% -12.2% 7.2% -1.8% -12.2% 7.2%
Q3 0.3% 0.3% -9.3% 8.6% 0.3% -9.3% 8.6%
2020 Q4 2.5% 2.5% -6.6% 10.4% 2.5% -6.6% 10.4%
Q1 12.0% 12.0% 1.3% 21.4% 12.0% 1.3% 21.4%
Q2 10.8% 10.6% 3.6% 15.7% 10.6% 3.6% 15.7%
Q3 9.4% 6.9% 1.6% 10.7% 1.4% -5.3% 6.3%
2021 Q4 8.8% 5.8% -0.5% 10.4% 1.4% -4.3% 5.6%
Q1 8.7% 4.3% 0.1% 7.0% 0.0% -3.5% 2.2%
Q2 9.2% 6.4% 0.8% 9.9% 2.1% -2.7% 5.1%
Q3 9.6% 6.2% 1.5% 9.2% 2.0% -1.8% 4.4%
2022 Q4 9.6% 6.5% 2.1% 9.4% 2.6% -1.1% 5.1%
Q1 9.6% 8.3% 2.6% 11.6% 4.7% 0.5% 7.2%
Q2e 9.5% 7.3% 3.1% 9.7% 5.0% 2.1% 6.8%
Q3f 9.3% 7.7% 3.5% 10.2% 6.6% 2.9% 8.8%
2023 Q4 9.3% 7.7% 3.8% 10.0% 7.1% 3.9% 9.1%
Q1 9.3% 7.1% 4.1% 8.7% 7.1% 4.2% 8.7%
Q2 9.3% 7.9% 4.4% 9.8% 7.9% 4.5% 9.8%
Q3 9.3% 7.8% 4.6% 9.6% 7.8% 4.7% 9.5%
2024 Q4 9.3% 7.9% 4.8% 9.6% 7.8% 4.8% 9.6%
Table A Non-Life: forecasts for premium growth,
components model vs. fundamentals model (year-on-year rate, %)
Source: MAPFRE Economics (e) Estimated with data up to April. (f) Forecasts from Q3 2021. 1/ Median scenarios according to the model of macroeconomic fundamentals

Box 2.1.8 (continued) Brazilian insurance industry performance:
forecasts for premium growth
89
2021 ECONOMIC AND INDUSTRY OUTLOOK (Q3)
-40
-20
0
20
40
60
2011
2012
2013
2014
2015
2016
2017
2018
2019
2020
2021
2022
2023
2024
Life — VGBL Life — Individual and Group Life (total)
Source: MAPFRE Economics
Chart F Brazil: contribution to growth by Life Protection and
Life Savings (pessimistic scenario) (%)
-40
-20
0
20
40
60
2011
2012
2013
2014
2015
2016
2017
2018
2019
2020
2021
2022
2023
2024
Life — VGBL Life — Individual and Group Life (total)
Chart E Brazil: contribution to growth by Life Protection and
Life Savings (optimistic scenario) (%)
-5%
0%
5%
10%
15%
2020 2021 2022 2023 2024
Components: optimistic scenario Components: pessimistic scenarioFundamentals: median scenarios
-10%
0%
10%
20%
2020 2021 2022 2023 2024
Components: optimistic scenario Components: pessimistic scenarioFundamentals: median scenarios
Chart G Brazil: comparison of forecasts for Non-Life models
(YoY, %)
Source: MAPFRE Economics
Chart H Brazil: comparison of forecasts for Life models
(YoY, %)
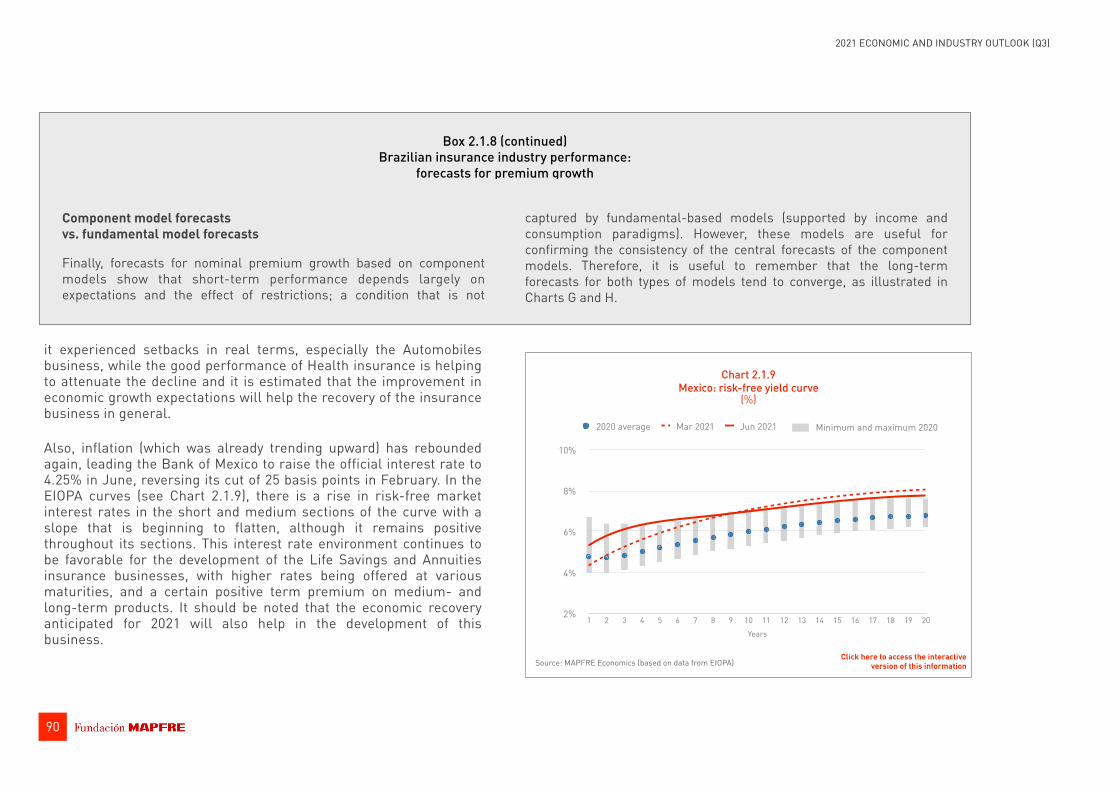
it experienced setbacks in real terms, especially the Automobiles business, while the good performance of Health insurance is helping to attenuate the decline and it is estimated that the improvement in economic growth expectations will help the recovery of the insurance business in general.
Also, inflation (which was already trending upward) has rebounded again, leading the Bank of Mexico to raise the official interest rate to 4.25% in June, reversing its cut of 25 basis points in February. In the EIOPA curves (see Chart 2.1.9), there is a rise in risk-free market interest rates in the short and medium sections of the curve with a slope that is beginning to flatten, although it remains positive throughout its sections. This interest rate environment continues to be favorable for the development of the Life Savings and Annuities insurance businesses, with higher rates being offered at various maturities, and a certain positive term premium on medium- and long-term products. It should be noted that the economic recovery anticipated for 2021 will also help in the development of this business.
Box 2.1.8 (continued) Brazilian insurance industry performance:
forecasts for premium growth
Component model forecasts vs. fundamental model forecasts
Finally, forecasts for nominal premium growth based on component models show that short-term performance depends largely on expectations and the effect of restrictions; a condition that is not
captured by fundamental-based models (supported by income and consumption paradigms). However, these models are useful for confirming the consistency of the central forecasts of the component models. Therefore, it is useful to remember that the long-term forecasts for both types of models tend to converge, as illustrated in Charts G and H.
90
2021 ECONOMIC AND INDUSTRY OUTLOOK (Q3)
2%
4%
6%
8%
10%
Years1 2 3 4 5 6 7 8 9 10 11 12 13 14 15 16 17 18 19 20
2020 average Mar 2021 Jun 2021
Chart 2.1.9 Mexico: risk-free yield curve
(%)
Source: MAPFRE Economics (based on data from EIOPA)
Minimum and maximum 2020
Click here to access the interactive version of this information
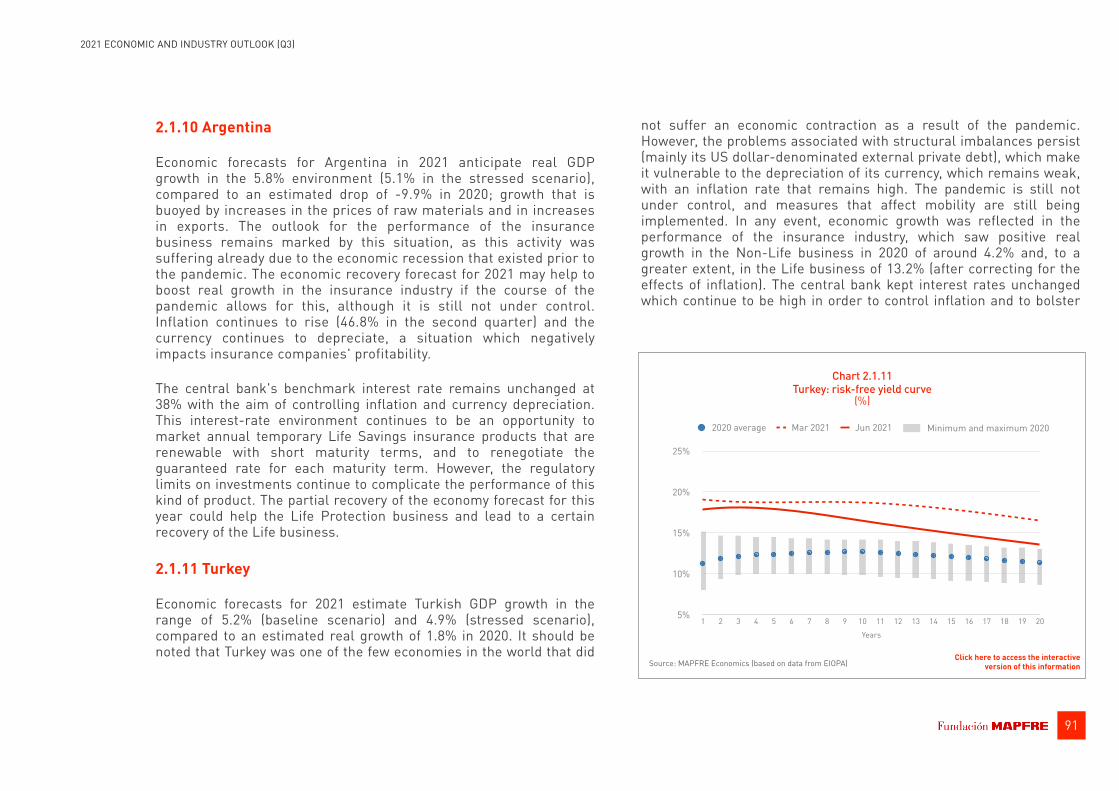
91
2021 ECONOMIC AND INDUSTRY OUTLOOK (Q3)
2.1.10 Argentina
Economic forecasts for Argentina in 2021 anticipate real GDP growth in the 5.8% environment (5.1% in the stressed scenario), compared to an estimated drop of -9.9% in 2020; growth that is buoyed by increases in the prices of raw materials and in increases in exports. The outlook for the performance of the insurance business remains marked by this situation, as this activity was suffering already due to the economic recession that existed prior to the pandemic. The economic recovery forecast for 2021 may help to boost real growth in the insurance industry if the course of the pandemic allows for this, although it is still not under control. Inflation continues to rise (46.8% in the second quarter) and the currency continues to depreciate, a situation which negatively impacts insurance companies' profitability.
The central bank's benchmark interest rate remains unchanged at 38% with the aim of controlling inflation and currency depreciation. This interest-rate environment continues to be an opportunity to market annual temporary Life Savings insurance products that are renewable with short maturity terms, and to renegotiate the guaranteed rate for each maturity term. However, the regulatory limits on investments continue to complicate the performance of this kind of product. The partial recovery of the economy forecast for this year could help the Life Protection business and lead to a certain recovery of the Life business.
2.1.11 Turkey
Economic forecasts for 2021 estimate Turkish GDP growth in the range of 5.2% (baseline scenario) and 4.9% (stressed scenario), compared to an estimated real growth of 1.8% in 2020. It should be noted that Turkey was one of the few economies in the world that did
not suffer an economic contraction as a result of the pandemic. However, the problems associated with structural imbalances persist (mainly its US dollar-denominated external private debt), which make it vulnerable to the depreciation of its currency, which remains weak, with an inflation rate that remains high. The pandemic is still not under control, and measures that affect mobility are still being implemented. In any event, economic growth was reflected in the performance of the insurance industry, which saw positive real growth in the Non-Life business in 2020 of around 4.2% and, to a greater extent, in the Life business of 13.2% (after correcting for the effects of inflation). The central bank kept interest rates unchanged which continue to be high in order to control inflation and to bolster
5%
10%
15%
20%
25%
Years1 2 3 4 5 6 7 8 9 10 11 12 13 14 15 16 17 18 19 20
2020 average Mar 2021 Jun 2021
Chart 2.1.11 Turkey: risk-free yield curve
(%)
Minimum and maximum 2020
Source: MAPFRE Economics (based on data from EIOPA)Click here to access the interactive
version of this information

92
2021 ECONOMIC AND INDUSTRY OUTLOOK (Q3)
its currency, which is helping to underpin the financial profitability of the insurance business.
In the EIOPA curves (see Chart 2.1.11), a slight decline in risk-free interest rates can be observed, with a curve that has gained some negative slope in its medium and long sections. This interest-rate scenario remains favorable for marketing Life Savings insurance products with temporary renewable short-term guaranteed rates that enable the guaranteed rates to be revised at each renewal. Good economic growth forecasts also favor the Life business.
2.1.12 China
For China's economy, forecasts for 2021 anticipate GDP growth in the range of 8.4% (baseline scenario) and 6.0% (stressed scenario), compared to estimated growth in 2020 of 2.3%. This means strong economic growth supported by both domestic demand and a searing recovery in exports, overcoming the marked slowdown in the Chinese economy in the previous year, although it was one of the only economies in the world that grew in that year. The strong GDP growth expected in 2021 will favor the insurance industry, whose business slowed in 2020 with growth of 6.1% (half that of 2019), and could return to double-digit premium growth underpinned by the low level of insurance penetration in the Chinese economy. The slowdown in the insurance business affected both Non-Life and Life insurance, which both grew at about half the rate they had done in the previous year.
The EIOPA curves (see Chart 2.1.12) show stabilization of interest rates following the recovery from the sharp fall at the height of the pandemic, maintaining a positive slope, despite a slight flattening in this quarter. This interest-rate environment continues to work in favor of the Life Savings and annuities insurance businesses, by
being able to offer guaranteed medium- and long-term rates that are higher than short-term rates. This is in addition to the positive effect that the recovery of the expected high rates of economic growth has on this type of business, which means that the environment continues to be highly favorable for the performance of this business.
2.1.13 Japan
Economic forecasts for Japan estimate GDP growth for 2021 in the range of 2.4% (baseline scenario) and 0.8% (stressed scenario), which is a slight downward revision of previous estimates. This growth contrasts with the sharp contraction of the Japanese
0%
1%
2%
3%
4%
Years1 2 3 4 5 6 7 8 9 10 11 12 13 14 15 16 17 18 19 20
2020 average Mar 2021 Jun 2021
Chart 2.1.12 China: risk-free yield curve
(%)
Source: MAPFRE Economics (based on data from EIOPA)
Minimum and maximum 2020
Click here to access the interactive version of this information

93
2021 ECONOMIC AND INDUSTRY OUTLOOK (Q3)
economy of -4.7% in 2020. Given this outlook, the Japanese authorities are continuing to expand the broad packages of fiscal and monetary expansion, and seek to ramp up the vaccination campaign which is going more slowly than in other developed countries. This is forcing them to apply restrictions on mobility in response to the spread of new virus variants. Forecasts of a return to economic growth will help the recovery of the insurance industry which, in 2020, suffered a sharp contraction that originated in the Life business. The Non-Life business experienced a significant slowdown, but did not decline.
The EIOPA curves (see Chart 2.1.13) again show a fall in all sections of the risk-free yield curve (which saw a certain rebound in the previous quarter) and continue to show negative values for maturities
up to ten years (versus eight years in the previous quarter), as well as an increase in the term premium from these maturities (although less than in the previous quarter). This may favor the marketing of Life Savings and annuities products, although rates are still very low and the curve flattened again this quarter. This sustained low-interest-rate environment, which is expected to continue for a long time, continues to be detrimental to the development of the aforementioned lines of business. The fall in interest rates on US Treasury bonds, which Japanese Life insurance companies have been using as an alternative investment to increase the profitability of their portfolios, are again becoming less attractive in terms of the performance of this business (in contrast to what happened in the previous quarter).
2.1.14 Philippines
Economic forecasts for the Philippines for 2021 estimate GDP growth in the range of 5.4% (baseline scenario) and 3.3% (stressed scenario), a slight downward revision of expectations. The country is still in an acute phase of the pandemic and continues to have a low level of vaccination. However, this growth contrasts with the estimated sharp economic contraction of -9.6% in 2020, among the biggest in the world. This prospect of a partial economic recovery in 2021 will help the insurance industry, particularly the Non-Life business, since its performance is closely tied to the economic cycle and, in 2020, it experienced a decline in real terms that was even greater than the percentage of GDP decline.
With regard to Life insurance, the Central Bank of the Philippines has kept the monetary policy benchmark rate at 2% (after making three cuts in 2020, from 4%) and already has little room for maneuver in the wake of the surge in inflation. The yield on the ten-year sovereign bond which was 2.97% at the end of December has risen to around 4%, causing an upward slope in the yield curve, leading to an
-0.4%
-0.2%
0.0%
0.2%
0.4%
Years1 2 3 4 5 6 7 8 9 10 11 12 13 14 15 16 17 18 19 20
2020 average Mar 2021 Jun 2021
Source: MAPFRE Economics (based on data from EIOPA)
Minimum and maximum 2020
Chart 2.1.13 Japan: risk-free yield curve
(%)
Click here to access the interactive version of this information
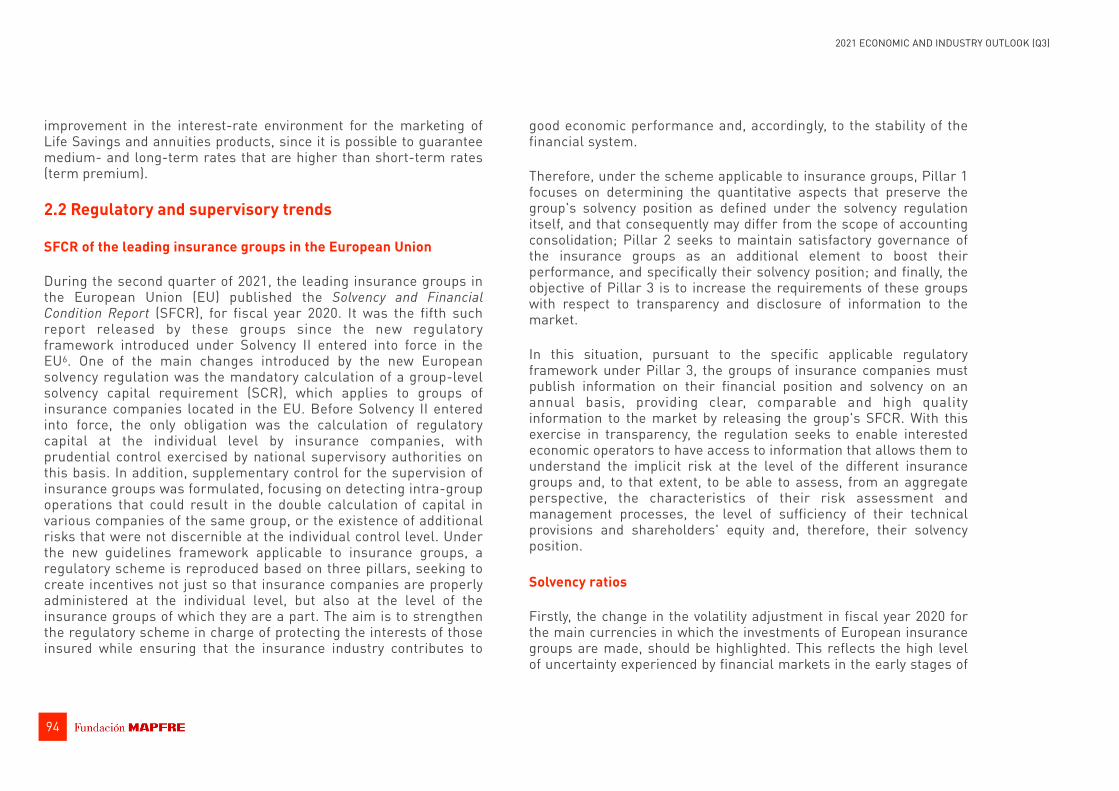
94
2021 ECONOMIC AND INDUSTRY OUTLOOK (Q3)
improvement in the interest-rate environment for the marketing of Life Savings and annuities products, since it is possible to guarantee medium- and long-term rates that are higher than short-term rates (term premium).
2.2 Regulatory and supervisory trends
SFCR of the leading insurance groups in the European Union
During the second quarter of 2021, the leading insurance groups in the European Union (EU) published the Solvency and Financial Condition Report (SFCR), for fiscal year 2020. It was the fifth such report released by these groups since the new regulatory framework introduced under Solvency II entered into force in the EU6. One of the main changes introduced by the new European solvency regulation was the mandatory calculation of a group-level solvency capital requirement (SCR), which applies to groups of insurance companies located in the EU. Before Solvency II entered into force, the only obligation was the calculation of regulatory capital at the individual level by insurance companies, with prudential control exercised by national supervisory authorities on this basis. In addition, supplementary control for the supervision of insurance groups was formulated, focusing on detecting intra-group operations that could result in the double calculation of capital in various companies of the same group, or the existence of additional risks that were not discernible at the individual control level. Under the new guidelines framework applicable to insurance groups, a regulatory scheme is reproduced based on three pillars, seeking to create incentives not just so that insurance companies are properly administered at the individual level, but also at the level of the insurance groups of which they are a part. The aim is to strengthen the regulatory scheme in charge of protecting the interests of those insured while ensuring that the insurance industry contributes to
good economic performance and, accordingly, to the stability of the financial system.
Therefore, under the scheme applicable to insurance groups, Pillar 1 focuses on determining the quantitative aspects that preserve the group's solvency position as defined under the solvency regulation itself, and that consequently may differ from the scope of accounting consolidation; Pillar 2 seeks to maintain satisfactory governance of the insurance groups as an additional element to boost their performance, and specifically their solvency position; and finally, the objective of Pillar 3 is to increase the requirements of these groups with respect to transparency and disclosure of information to the market.
In this situation, pursuant to the specific applicable regulatory framework under Pillar 3, the groups of insurance companies must publish information on their financial position and solvency on an annual basis, providing clear, comparable and high quality information to the market by releasing the group's SFCR. With this exercise in transparency, the regulation seeks to enable interested economic operators to have access to information that allows them to understand the implicit risk at the level of the different insurance groups and, to that extent, to be able to assess, from an aggregate perspective, the characteristics of their risk assessment and management processes, the level of sufficiency of their technical provisions and shareholders' equity and, therefore, their solvency position.
Solvency ratios
Firstly, the change in the volatility adjustment in fiscal year 2020 for the main currencies in which the investments of European insurance groups are made, should be highlighted. This reflects the high level of uncertainty experienced by financial markets in the early stages of
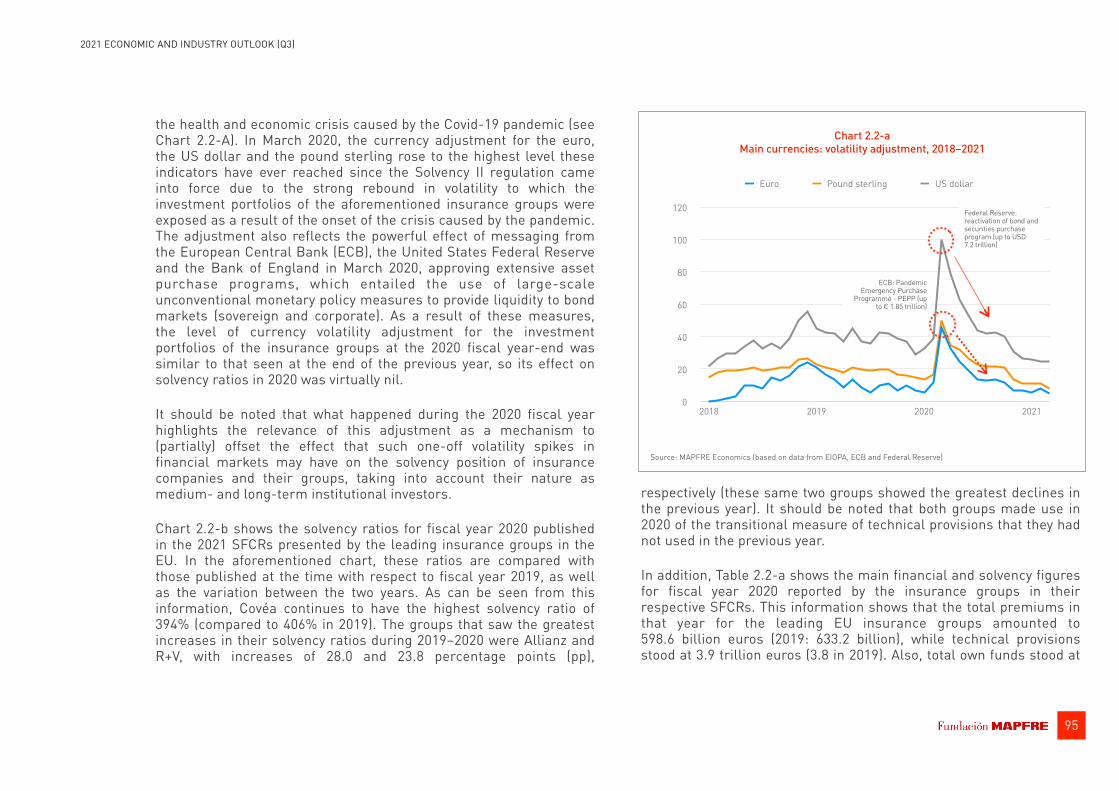
95
2021 ECONOMIC AND INDUSTRY OUTLOOK (Q3)
the health and economic crisis caused by the Covid-19 pandemic (see Chart 2.2-A). In March 2020, the currency adjustment for the euro, the US dollar and the pound sterling rose to the highest level these indicators have ever reached since the Solvency II regulation came into force due to the strong rebound in volatility to which the investment portfolios of the aforementioned insurance groups were exposed as a result of the onset of the crisis caused by the pandemic. The adjustment also reflects the powerful effect of messaging from the European Central Bank (ECB), the United States Federal Reserve and the Bank of England in March 2020, approving extensive asset purchase programs, which entailed the use of large-scale unconventional monetary policy measures to provide liquidity to bond markets (sovereign and corporate). As a result of these measures, the level of currency volatility adjustment for the investment portfolios of the insurance groups at the 2020 fiscal year-end was similar to that seen at the end of the previous year, so its effect on solvency ratios in 2020 was virtually nil.
It should be noted that what happened during the 2020 fiscal year highlights the relevance of this adjustment as a mechanism to (partially) offset the effect that such one-off volatility spikes in financial markets may have on the solvency position of insurance companies and their groups, taking into account their nature as medium- and long-term institutional investors.
Chart 2.2-b shows the solvency ratios for fiscal year 2020 published in the 2021 SFCRs presented by the leading insurance groups in the EU. In the aforementioned chart, these ratios are compared with those published at the time with respect to fiscal year 2019, as well as the variation between the two years. As can be seen from this information, Covéa continues to have the highest solvency ratio of 394% (compared to 406% in 2019). The groups that saw the greatest increases in their solvency ratios during 2019–2020 were Allianz and R+V, with increases of 28.0 and 23.8 percentage points (pp),
respectively (these same two groups showed the greatest declines in the previous year). It should be noted that both groups made use in 2020 of the transitional measure of technical provisions that they had not used in the previous year.
In addition, Table 2.2-a shows the main financial and solvency figures for fiscal year 2020 reported by the insurance groups in their respective SFCRs. This information shows that the total premiums in that year for the leading EU insurance groups amounted to 598.6 billion euros (2019: 633.2 billion), while technical provisions stood at 3.9 trillion euros (3.8 in 2019). Also, total own funds stood at
0
20
40
60
80
100
120
2018 2019 2020 2021
Euro Pound sterling US dollar
Source: MAPFRE Economics (based on data from EIOPA, ECB and Federal Reserve)
Chart 2.2-a Main currencies: volatility adjustment, 2018–2021
Federal Reserve: reactivation of bond and securities purchase program (up to USD 7.2 trillion)
ECB: Pandemic Emergency Purchase
Programme - PEPP (up to € 1.85 trillion)

96
2021 ECONOMIC AND INDUSTRY OUTLOOK (Q3)
Chart 2.2-b 2020 Solvency ratios and variation vs. 2019
Source: MAPFRE Economics (based on data from the SFCRs published by the indicated companies)
Covéa
Poste
Talanx
Groupama
Allianz
Crédit Agricole
Generali
CNP
Axa
Aegon
Sogecap
MAPFRE
RSA
R+V
Aviva
BNP
0% 100% 200% 300% 400% 500%
198%
183%
159%
178%
187%
241%
201%
198%
227%
224%
263%
212%
301%
246%
312%
406%
173%
178%
183%
189%
193%
195%
196%
200%
208%
224%
227%
240%
244%
260%
299%
394%
2020 2019
-60 -40 -20 0 20 40
-25.0
-5.4
23.8
10.7
6.1
-45.6
-5.0
1.7
-19.0
-0.3
-36.0
28.0
-57.0
14.0
-12.4
-12.0
2020 variation vs. 2019 (pp)Premiums Technical
provisionsEligible
own fundsSCR
requiredSolvency
ratio
Allianz 137,153 647,707 98,470 40,950 240.5%
Axa 94,269 545,817 55,000 27,460 200.3%
Generali 70,704 421,637 44,428 19,850 223.8%
Aviva 47,597 421,021 32,729 18,390 178.0%
Talanx 41,106 123,450 23,074 8,874 260.0%
Crédit Agricole 29,442 353,068 31,857 14,015 227.3%
CNP 27,654 373,717 34,080 16,370 208.2%
Aegon 21,800 167,296 18,582 9,473 196.2%
BNP 20,747 228,424 17,291 9,990 173.1%
MAPFRE 20,482 37,617 8,917 4,622 192.9%
R+V 19,210 104,657 15,161 8,295 182.8%
Poste 16,901 147,435 11,194 3,740 299.3%
Covéa 16,566 89,647 25,985 6,593 394.1%
Groupama 14,256 79,395 13,044 5,343 244.1%
Sogecap 11,417 143,876 9,073 4,651 195.1%
RSA 9,330 11,712 3,680 1,950 188.7%
Total 598,634 3,896,476 442,563 200,566 220.7%
Source: MAPFRE Economics (based on data from the SFCRs published by the indicated companies)
Table 2.2-a Main financial and solvency figures, 2020
(millions of euros)
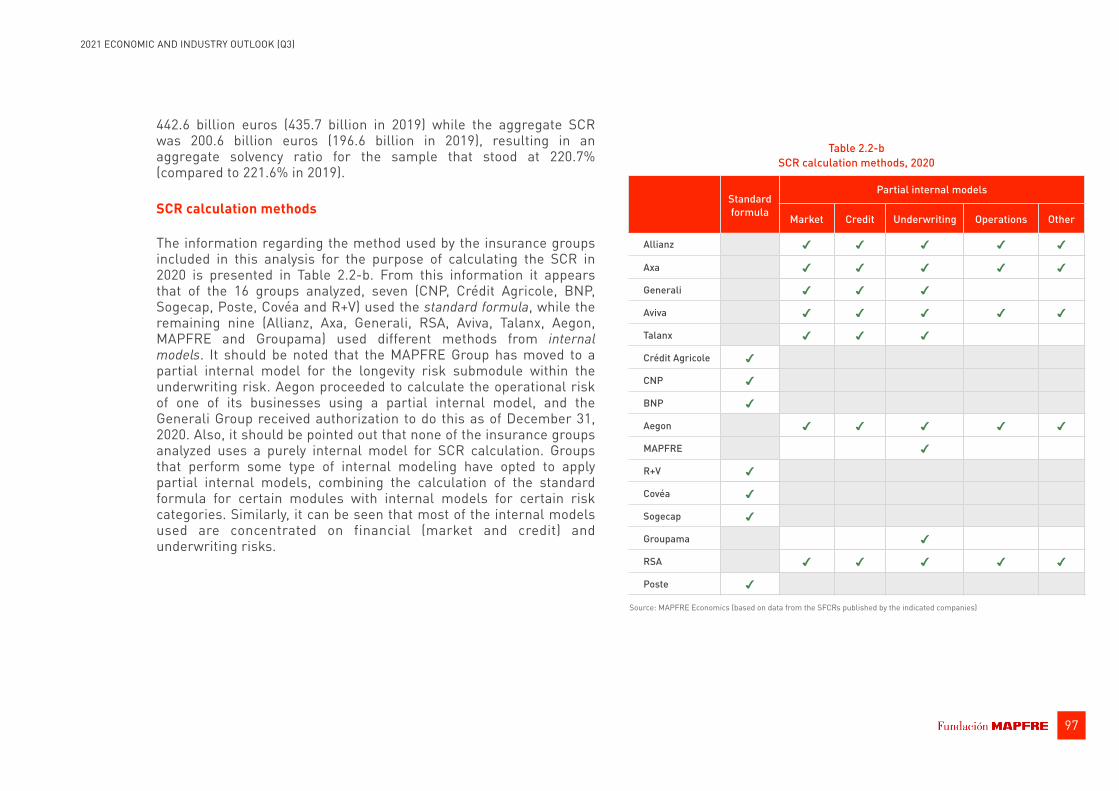
97
2021 ECONOMIC AND INDUSTRY OUTLOOK (Q3)
442.6 billion euros (435.7 billion in 2019) while the aggregate SCR was 200.6 billion euros (196.6 billion in 2019), resulting in an aggregate solvency ratio for the sample that stood at 220.7% (compared to 221.6% in 2019).
SCR calculation methods
The information regarding the method used by the insurance groups included in this analysis for the purpose of calculating the SCR in 2020 is presented in Table 2.2-b. From this information it appears that of the 16 groups analyzed, seven (CNP, Crédit Agricole, BNP, Sogecap, Poste, Covéa and R+V) used the standard formula, while the remaining nine (Allianz, Axa, Generali, RSA, Aviva, Talanx, Aegon, MAPFRE and Groupama) used different methods from internal models. It should be noted that the MAPFRE Group has moved to a partial internal model for the longevity risk submodule within the underwriting risk. Aegon proceeded to calculate the operational risk of one of its businesses using a partial internal model, and the Generali Group received authorization to do this as of December 31, 2020. Also, it should be pointed out that none of the insurance groups analyzed uses a purely internal model for SCR calculation. Groups that perform some type of internal modeling have opted to apply partial internal models, combining the calculation of the standard formula for certain modules with internal models for certain risk categories. Similarly, it can be seen that most of the internal models used are concentrated on financial (market and credit) and underwriting risks.
Standard formula
Partial internal models
Market Credit Underwriting Operations Other
Allianz ✔ ✔ ✔ ✔ ✔
Axa ✔ ✔ ✔ ✔ ✔
Generali ✔ ✔ ✔
Aviva ✔ ✔ ✔ ✔ ✔
Talanx ✔ ✔ ✔
Crédit Agricole ✔
CNP ✔
BNP ✔
Aegon ✔ ✔ ✔ ✔ ✔
MAPFRE ✔
R+V ✔
Covéa ✔
Sogecap ✔
Groupama ✔
RSA ✔ ✔ ✔ ✔ ✔
Poste ✔
Source: MAPFRE Economics (based on data from the SFCRs published by the indicated companies)
Table 2.2-b SCR calculation methods, 2020

98
2021 ECONOMIC AND INDUSTRY OUTLOOK (Q3)
Eligible own funds
Table 2.2-c sets out information on the quality of eligible own funds available to cover their capital requirements by the different insurance groups included in this analysis. According to this information, at the aggregate level, 85.0% of eligible own funds were of the highest quality or Tier 1, 13.4% were Tier 2 and 1.6% corresponded to Tier 3.
These percentages are similar to those seen in the sample of groups analyzed in the 20197 study, although there is a slight increase of 0.3 pp in Tier 3 funds, to the detriment of Tier 2 funds. As in the previous year, the cases of Covéa and R+V continue to stand out, whose highest quality eligible own funds are at levels close to 100%. In support of this information, Charts 2.2-c, 2.2-d and 2.2-e illustrate a comparison of the amount of eligible own funds in relation to certain figures relevant to the balance sheet and business (assets, technical provisions and premiums) of the various insurance groups included in the analysis, as well as variations recorded in these relevant references with regard to 2019. In the relationship between own funds and assets, the cases of Covéa, RSA and MAPFRE stand out, with a ratio of 20.8%, 20.2% and 15.3%, respectively; in the relationship between own funds and technical provisions, the first three positions are also held by RSA, Covéa and MAPFRE, with a ratio of 31.4%, 29.0% and 23.7%, in each case; and finally, in the relationship between own funds and premiums, Covéa, CNP and Crédit Agricole rank first, with 156.9%, 123.2% and 108.2%, respectively.
Transitional and adjustment measures
When analyzing the level of the solvency ratios of the insurance groups, a significant aspect is the effect of the transitional and adjustment measures that were introduced in the Solvency II
Directive in order to alleviate potential harm to the business arising from the existence of product portfolios with long-term guarantees. These measures establish a broad transitional regime for the full entry into force of Solvency II, considering the nature of long-term institutional investors that insurance companies and their groups have, which may have to contend with volatilities of financial markets with market spread increments, without requiring forced sales to be made (volatility adjustment) and the satisfactory management of asset-liability risks (matching adjustment). In this way, the transitional regime allows for a smooth transition to the requirements of the new system for those who decide to make use of it. More specifically, the measures adopted by the Directive in this regard were as follows:
• Transitional measure of technical provisions. This measure allows the difference between the technical provision estimated under the parameters of Solvency II and the one calculated in line with the previous standards under Solvency I to be phased in gradually over an initial 16-year period, until January 1, 2032 (five years having now elapsed). This applies only to portfolios existing at the time that the new system entered into force on January 1, 2016.
• Volatility adjustment measure. This adjustment allows for correcting the discount interest rate for the technical provisions to mitigate the effects of momentary volatilities in credit spreads in investment portfolios.
• Matching adjustment measure between assets and liabilities. If certain requirements are met, the measure allows companies to adjust the discount curve on technical provisions in line with institutions holding fixed income assets to maturity with a duration that is similar to their liabilities, and which are therefore not exposed to market volatility in credit spreads.
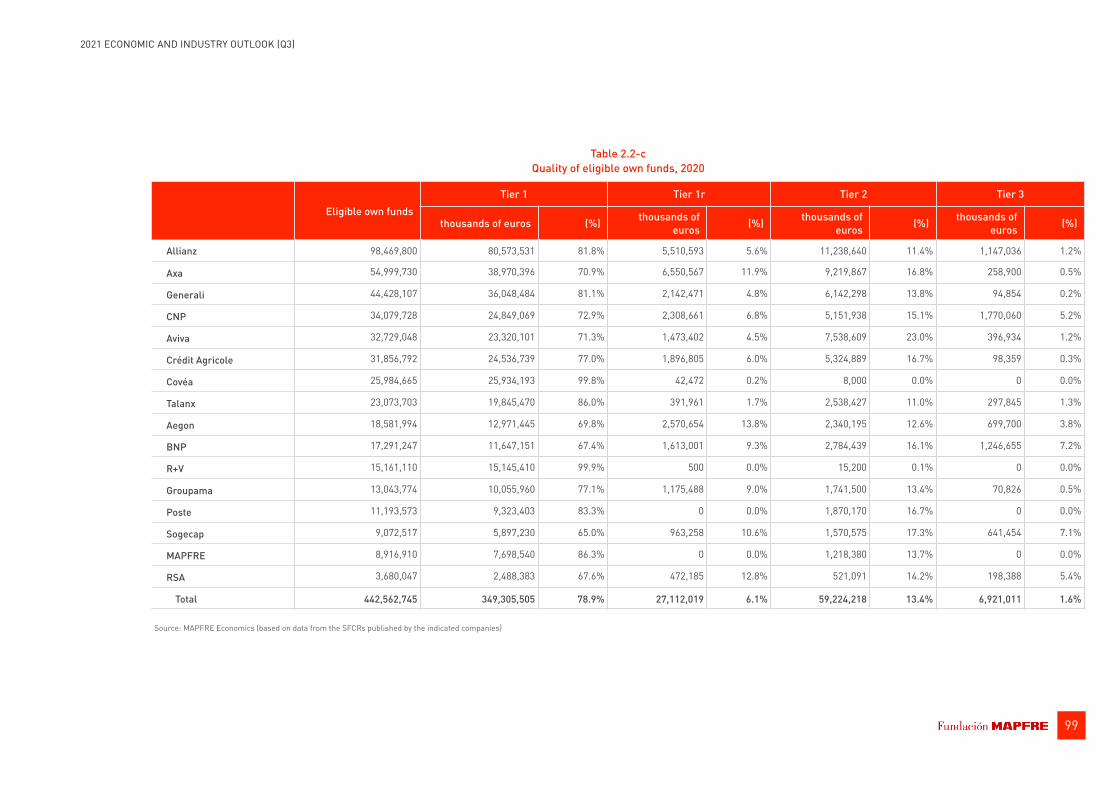
99
2021 ECONOMIC AND INDUSTRY OUTLOOK (Q3)
Eligible own fundsTier 1 Tier 1r Tier 2 Tier 3
thousands of euros (%) thousands of euros (%) thousands of
euros (%) thousands of euros (%)
Allianz 98,469,800 80,573,531 81.8% 5,510,593 5.6% 11,238,640 11.4% 1,147,036 1.2%
Axa 54,999,730 38,970,396 70.9% 6,550,567 11.9% 9,219,867 16.8% 258,900 0.5%
Generali 44,428,107 36,048,484 81.1% 2,142,471 4.8% 6,142,298 13.8% 94,854 0.2%
CNP 34,079,728 24,849,069 72.9% 2,308,661 6.8% 5,151,938 15.1% 1,770,060 5.2%
Aviva 32,729,048 23,320,101 71.3% 1,473,402 4.5% 7,538,609 23.0% 396,934 1.2%
Crédit Agricole 31,856,792 24,536,739 77.0% 1,896,805 6.0% 5,324,889 16.7% 98,359 0.3%
Covéa 25,984,665 25,934,193 99.8% 42,472 0.2% 8,000 0.0% 0 0.0%
Talanx 23,073,703 19,845,470 86.0% 391,961 1.7% 2,538,427 11.0% 297,845 1.3%
Aegon 18,581,994 12,971,445 69.8% 2,570,654 13.8% 2,340,195 12.6% 699,700 3.8%
BNP 17,291,247 11,647,151 67.4% 1,613,001 9.3% 2,784,439 16.1% 1,246,655 7.2%
R+V 15,161,110 15,145,410 99.9% 500 0.0% 15,200 0.1% 0 0.0%
Groupama 13,043,774 10,055,960 77.1% 1,175,488 9.0% 1,741,500 13.4% 70,826 0.5%
Poste 11,193,573 9,323,403 83.3% 0 0.0% 1,870,170 16.7% 0 0.0%
Sogecap 9,072,517 5,897,230 65.0% 963,258 10.6% 1,570,575 17.3% 641,454 7.1%
MAPFRE 8,916,910 7,698,540 86.3% 0 0.0% 1,218,380 13.7% 0 0.0%
RSA 3,680,047 2,488,383 67.6% 472,185 12.8% 521,091 14.2% 198,388 5.4%
Total 442,562,745 349,305,505 78.9% 27,112,019 6.1% 59,224,218 13.4% 6,921,011 1.6%
Source: MAPFRE Economics (based on data from the SFCRs published by the indicated companies)
Table 2.2-c Quality of eligible own funds, 2020

100
2021 ECONOMIC AND INDUSTRY OUTLOOK (Q3)
Chart 2.2-c Relative weight of own funds to assets
in 2020 and variation vs. 2019
Source: MAPFRE Economics (based on data from the SFCRs published by the indicated companies)
Covéa
RSA
MAPFRE
Talanx
Groupama
Allianz
R+V
Aegon
Generali
Axa
CNP
Crédit Agricole
Poste
Aviva
BNP
Sogecap
0% 5% 10% 15% 20% 25%
5.7%
6.2%
6.6%
7.8%
8.3%
7.8%
8.6%
9.5%
9.1%
9.9%
10.5%
13.5%
13.6%
15.2%
19.8%
21.5%
5.4%
6.5%
6.5%
6.8%
7.5%
7.6%
7.7%
8.7%
8.9%
11.8%
11.9%
12.5%
13.5%
15.3%
20.2%
20.8%
2020 2019
-1 0 1 2
-0.4
0.2
-0.1
-0.9
-0.9
-0.2
-0.9
-0.7
-0.2
1.9
1.4
-1.0
-0.1
0.1
0.4
-0.8
2020 variation vs. 2019 (pp)
Chart 2.2-d Relative weight of own funds to technical provisions in 2020 and variation vs. 2019
Source: MAPFRE Economics (based on data from the SFCRs published by the indicated companies)
RSA
Covéa
MAPFRE
Talanx
Groupama
Allianz
R+V
Aegon
Generali
Axa
CNP
Crédit Agricole
Aviva
Poste
BNP
Sogecap
0% 10% 20% 30% 40%
6.7%
7.3%
8.6%
8.0%
10.1%
9.4%
11.4%
11.5%
11.3%
12.1%
13.2%
17.9%
18.8%
23.5%
30.3%
30.6%
6.3%
7.6%
7.6%
7.8%
9.0%
9.1%
10.1%
10.5%
11.1%
14.5%
15.2%
16.4%
18.7%
23.7%
29.0%
31.4%
2020 2019
-2 0 2 4
-0.4
0.3
-1.0
-0.2
-1.0
-0.3
-1.3
-1.0
-0.2
2.4
2.0
-1.5
-0.1
0.2
-1.3
0.9
2020 variation vs. 2019 (pp)
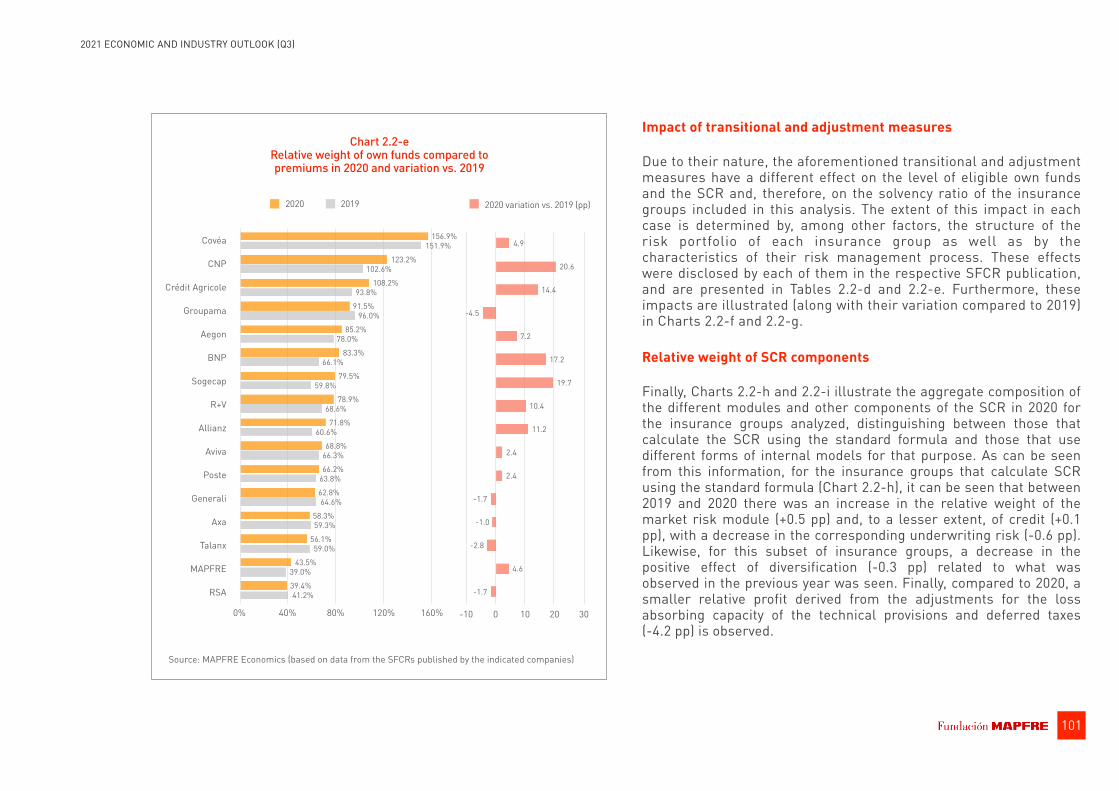
101
2021 ECONOMIC AND INDUSTRY OUTLOOK (Q3)
Impact of transitional and adjustment measures
Due to their nature, the aforementioned transitional and adjustment measures have a different effect on the level of eligible own funds and the SCR and, therefore, on the solvency ratio of the insurance groups included in this analysis. The extent of this impact in each case is determined by, among other factors, the structure of the risk portfolio of each insurance group as well as by the characteristics of their risk management process. These effects were disclosed by each of them in the respective SFCR publication, and are presented in Tables 2.2-d and 2.2-e. Furthermore, these impacts are illustrated (along with their variation compared to 2019) in Charts 2.2-f and 2.2-g.
Relative weight of SCR components
Finally, Charts 2.2-h and 2.2-i illustrate the aggregate composition of the different modules and other components of the SCR in 2020 for the insurance groups analyzed, distinguishing between those that calculate the SCR using the standard formula and those that use different forms of internal models for that purpose. As can be seen from this information, for the insurance groups that calculate SCR using the standard formula (Chart 2.2-h), it can be seen that between 2019 and 2020 there was an increase in the relative weight of the market risk module (+0.5 pp) and, to a lesser extent, of credit (+0.1 pp), with a decrease in the corresponding underwriting risk (-0.6 pp). Likewise, for this subset of insurance groups, a decrease in the positive effect of diversification (-0.3 pp) related to what was observed in the previous year was seen. Finally, compared to 2020, a smaller relative profit derived from the adjustments for the loss absorbing capacity of the technical provisions and deferred taxes (-4.2 pp) is observed.
Chart 2.2-e Relative weight of own funds compared to premiums in 2020 and variation vs. 2019
Source: MAPFRE Economics (based on data from the SFCRs published by the indicated companies)
Covéa
CNP
Crédit Agricole
Groupama
Aegon
BNP
Sogecap
R+V
Allianz
Aviva
Poste
Generali
Axa
Talanx
MAPFRE
RSA
0% 40% 80% 120% 160%
41.2%
39.0%
59.0%
59.3%
64.6%
63.8%
66.3%
60.6%
68.6%
59.8%
66.1%
78.0%
96.0%
93.8%
102.6%
151.9%
39.4%
43.5%
56.1%
58.3%
62.8%
66.2%
68.8%
71.8%
78.9%
79.5%
83.3%
85.2%
91.5%
108.2%
123.2%
156.9%
2020 2019
-10 0 10 20 30
-1.7
4.6
-2.8
-1.0
-1.7
2.4
2.4
11.2
10.4
19.7
17.2
7.2
-4.5
14.4
20.6
4.9
2020 variation vs. 2019 (pp)
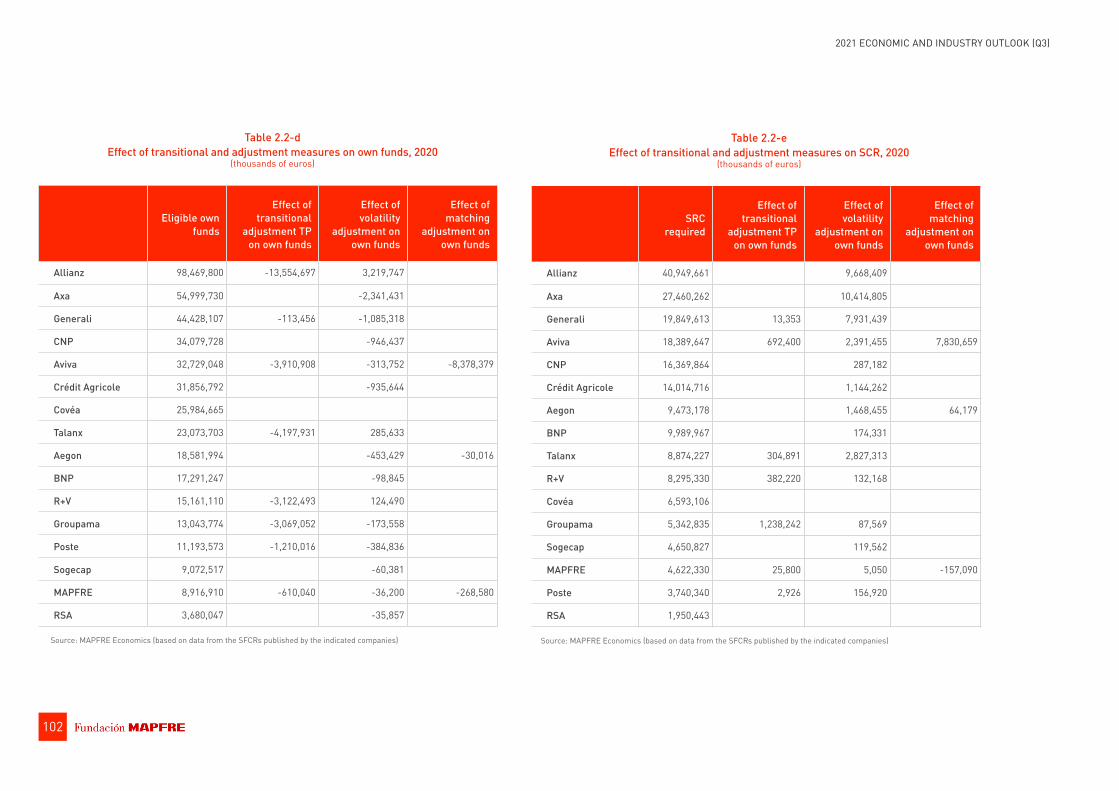
102
2021 ECONOMIC AND INDUSTRY OUTLOOK (Q3)
Table 2.2-e Effect of transitional and adjustment measures on SCR, 2020
(thousands of euros)
SRC required
Effect of transitional
adjustment TP on own funds
Effect of volatility
adjustment on own funds
Effect of matching
adjustment on own funds
Allianz 40,949,661 9,668,409
Axa 27,460,262 10,414,805
Generali 19,849,613 13,353 7,931,439
Aviva 18,389,647 692,400 2,391,455 7,830,659
CNP 16,369,864 287,182
Crédit Agricole 14,014,716 1,144,262
Aegon 9,473,178 1,468,455 64,179
BNP 9,989,967 174,331
Talanx 8,874,227 304,891 2,827,313
R+V 8,295,330 382,220 132,168
Covéa 6,593,106
Groupama 5,342,835 1,238,242 87,569
Sogecap 4,650,827 119,562
MAPFRE 4,622,330 25,800 5,050 -157,090
Poste 3,740,340 2,926 156,920
RSA 1,950,443
Source: MAPFRE Economics (based on data from the SFCRs published by the indicated companies)
Table 2.2-d Effect of transitional and adjustment measures on own funds, 2020
(thousands of euros)
Eligible own funds
Effect of transitional
adjustment TP on own funds
Effect of volatility
adjustment on own funds
Effect of matching
adjustment on own funds
Allianz 98,469,800 -13,554,697 3,219,747
Axa 54,999,730 -2,341,431
Generali 44,428,107 -113,456 -1,085,318
CNP 34,079,728 -946,437
Aviva 32,729,048 -3,910,908 -313,752 -8,378,379
Crédit Agricole 31,856,792 -935,644
Covéa 25,984,665
Talanx 23,073,703 -4,197,931 285,633
Aegon 18,581,994 -453,429 -30,016
BNP 17,291,247 -98,845
R+V 15,161,110 -3,122,493 124,490
Groupama 13,043,774 -3,069,052 -173,558
Poste 11,193,573 -1,210,016 -384,836
Sogecap 9,072,517 -60,381
MAPFRE 8,916,910 -610,040 -36,200 -268,580
RSA 3,680,047 -35,857
Source: MAPFRE Economics (based on data from the SFCRs published by the indicated companies)

103
2021 ECONOMIC AND INDUSTRY OUTLOOK (Q3)
Source: MAPFRE Economics (based on data from the SFCRs published by the indicated companies) * Negative variation implies increased impact of adjustment.
Effect on own funds in 2020 Variation vs. 2019*
Axa
Allianz
Generali
RSA
Talanx
Aviva
Aegon
Groupama
R+V
CNP
Crédit Agricole
MAPFRE
BNP
Poste
Sogecap
Covéa
-16,000 -12,000 -8,000 -4,000 0 4,000
-3
7
-375
-19
-40
191
-1
-585
-309
124
-40
-45
55
13
-36
-293
-228
-678
110
51
-3,122
176
625
-888
-113
-13,555
Axa
Allianz
Generali
RSA
Talanx
Aviva
Aegon
Groupama
R+V
CNP
Crédit Agricole
MAPFRE
BNP
Poste
Sogecap
Covéa
-16,000 -12,000 -8,000 -4,000 0 4,000
-269
-30
-8,378
-60
-385
-99
-36
-936
-946
124
-174
-453
-314
286
-36
-1,085
3,220
-2,341
-1,210
-610
-3,122
-3,069
-3,911
-4,198
-113
-13,555
TP transitional adjustment Volatility adjustment Matching adjustment
Chart 2.2-f Effect of transitional and adjustment measures on own funds, 2020
(millions of euros)
Chart 2.2-g Effect of transitional and adjustment measures on SCR, 2020
(millions of euros)
Source: MAPFRE Economics (based on data from the SFCRs published by the indicated companies) * Negative variation implies increased impact of adjustment.
Effect on SCR in 2020 Variation vs. 2019*
Axa
Allianz
Generali
RSA
Talanx
Aviva
Aegon
Groupama
R+V
CNP
Crédit Agricole
MAPFRE
BNP
Poste
Sogecap
Covéa
-2,000 0 2,000 4,000
139
6
-84
36
105
123
2
799
-2
132
-32
564
1,152
123
1,224
2,619
3,089
3
24
382
-94
94
305
13
Axa
Allianz
Generali
RSA
Talanx
Aviva
Aegon
Groupama
R+V
CNP
Crédit Agricole
MAPFRE
BNP
Poste
Sogecap
Covéa
-3,000 0 3,000 6,000 9,000 12,000
-157
64
7,831
120
157
174
5
1,144
287
132
88
1,468
2,391
2,827
7,931
9,668
10,415
3
26
382
1,238
692
305
13
TP transitional adjustment Volatility adjustment Matching adjustment

104
2021 ECONOMIC AND INDUSTRY OUTLOOK (Q3)
(MIL
LION
S OF
EUR
OS)
0
50,000
100,000
150,000
200,000
Mar
ket r
isk
Cred
it ris
k
Unde
rwrit
ing
risk
Inta
ngib
les
Sum
of r
isks
Dive
rsifi
catio
n
BSCR
Oper
atio
ns
TP/D
efer
red
tax
adju
stm
ents
Glob
al S
CR a
nd o
ther
sec
tors
SCR
Chart 2.2-i Relative weight of the different components of the SCR
for groups that use partial internal models in 2020 and variations vs. 2019 (millions of euros and percentages)
Source: MAPFRE Economics (based on data from the SFCRs published by the indicated companies)
48.4%
9.6%
41.9%
184,407
-35.4%
119,106
13.4%
-13.4%
132,290
0.0%
13.0%
-0.3 pp +0.8 pp -0.6 pp 0.0 pp 2,770 +0.3 pp 1,263 -0.9 pp -0.6 pp -0.4 pp -1,056Variation vs. 2019
(MIL
LION
S OF
EUR
OS)
0
30,000
60,000
90,000
120,000
150,000
180,000
Mar
ket r
isk
Cred
it ris
k
Unde
rwrit
ing
risk
Sum
of r
isks
Dive
rsifi
catio
n
BSCR
Oper
atio
ns
TP/D
efer
red
tax
adju
stm
ents
Glob
al S
CR a
nd o
ther
sec
tors
SCR
Chart 2.2-h Relative weight of the different components of the SCR
for groups that use the standard formula in 2020 and variation vs. 2019 (millions of euros and percentages)
Source: MAPFRE Economics (based on data from the SFCRs published by the indicated companies)
71.2%
2.6%26.2%
160,738
-18.4%
131,171
5.4%
-52.0%
68,276
3.4%
+0.5 pp +0.1 pp -0.6 pp -2,888 -0.3 pp -1,885 +0.2 pp -4.2 pp +0.7 pp 5,639Variation vs. 2019

105
2021 ECONOMIC AND INDUSTRY OUTLOOK (Q3)
In the case of the subset made up of insurance groups using different types of internal models (Chart 2.2- i), an increase occurred between 2019 and 2020 in the relative weight of the credit risk component (+0.8 pp), while the market risk component shows a slight decrease compared to the previous year (-0.3 pp), as was the case with the underwriting risk (-0.6 pp). Further, in this subset, there was an increase in diversification profits (+0.3 pp) in 2020, and a reduction in the weight of operational risk (-0.9 pp). Also, regarding the effect of the adjustments on the loss absorption capacity of the technical provisions and deferred taxes, it is correct to note that, in the case of insurance groups that used internal models, this metric is indicating solely the effect of the adjustments that had been modeled but not incorporated in the other components of the SCR.


Tables: macroeconomic forecast scenarios
1072021 ECONOMIC AND INDUSTRY OUTLOOK (Q3)
Table A-1 Baseline and stressed scenarios: gross domestic product
(annual growth, %)
Baseline scenario (BS) Stressed scenario (SS)
2017 2018 2019 2020(e) 2021(f) 2022(f) 2017 2018 2019 2020(e) 2021(f) 2022(f)
United States 2.3 3.0 2.2 -3.5 6.6 4.5 2.3 3.0 2.2 -3.5 5.0 -1.3
Eurozone 2.7 1.9 1.3 -6.7 4.5 4.5 2.7 1.9 1.3 -6.7 2.3 -0.3
Germany 2.9 1.3 0.6 -5.1 3.7 4.4 2.9 1.3 0.6 -5.1 1.2 -1.1
France 2.3 1.8 1.5 -8.1 5.6 4.0 2.3 1.8 1.5 -8.1 2.6 0.9
Italy 1.7 0.8 0.3 -8.9 4.9 4.6 1.7 0.8 0.3 -8.9 3.1 0.7
Spain 3.0 2.4 2.0 -10.8 6.0 6.0 3.0 2.4 2.0 -10.8 3.8 0.8
United Kingdom 1.7 1.3 1.4 -9.8 5.1 5.3 1.7 1.3 1.4 -9.8 4.9 0.8
Japan 1.7 0.6 0.0 -4.7 2.4 2.9 1.7 0.6 0.0 -4.7 0.8 -0.8
Emerging markets 4.8 4.5 3.6 -2.2 6.7 5.0 4.8 4.5 3.6 -2.2 4.7 2.0
Latin America1 1.3 1.2 0.2 -7.0 4.6 3.1 1.3 1.2 0.2 -7.0 3.8 1.3
Mexico 2.3 2.2 -0.2 -8.5 5.4 2.9 2.3 2.2 -0.2 -8.5 3.9 -0.4
Brazil 1.6 1.7 1.4 -4.4 5.1 2.2 1.6 1.7 1.4 -4.4 4.6 -1.2
Argentina 2.8 -2.6 -2.1 -9.9 5.8 2.6 2.8 -2.6 -2.1 -9.9 5.1 -0.5
Emerging Europe2 4.1 3.4 2.4 -2.0 4.4 3.9 4.1 3.4 2.4 -2.0 1.5 1.1
Turkey 7.5 3.0 0.9 1.8 5.2 3.4 7.5 3.0 0.9 1.8 4.9 -1.3
Asia Pacific3 6.6 6.4 5.3 -1.0 8.6 6.0 6.6 6.4 5.3 -1.0 4.9 1.8
China 6.9 6.8 6.0 2.3 8.4 5.7 6.9 6.8 6.0 2.3 6.0 1.7
Indonesia 5.1 5.2 5.0 -2.1 4.7 5.5 5.1 5.2 5.0 -2.1 3.3 1.5
Philippines 6.9 6.3 6.1 -9.6 5.4 6.9 6.9 6.3 6.1 -9.6 3.3 2.9
World 3.8 3.6 2.8 -3.3 6.0 4.4 3.8 3.6 2.8 -3.3 3.7 1.3
Source: MAPFRE Economics
1Argentina, Brazil, Chile, Colombia, Mexico and Peru; 2Russia, Turkey, Commonwealth of Independent States (CIS) and Central Europe; 3Association of Southeast Asian Nations (ASEAN) Forecast end date: July 12, 2021.
Click here to access the interactive version of this information

108
2021 ECONOMIC AND INDUSTRY OUTLOOK (Q3)
Table A-2 Baseline and stressed scenarios: inflation
(end of period, %)
Baseline scenario (BS) Stressed scenario (SS)
2017 2018 2019 2020(e) 2021(f) 2022(f) 2017 2018 2019 2020(e) 2021(f) 2022(f)
United States 2.1 1.9 2.3 1.4 4.3 2.3 2.1 1.9 2.3 1.4 5.4 3.0
Eurozone 1.4 1.9 1.0 -0.3 2.7 1.3 1.4 1.9 1.0 -0.3 3.7 1.8
Germany 1.4 1.6 1.5 -0.2 3.4 1.3 1.4 1.6 1.5 -0.2 4.4 1.8
France 1.2 2.1 1.3 0.5 1.3 1.1 1.2 2.1 1.3 0.5 1.9 2.1
Italy 0.9 1.1 0.5 -0.2 2.4 1.2 0.9 1.1 0.5 -0.2 3.3 1.4
Spain 1.1 1.2 0.8 -0.5 2.8 1.3 1.1 1.2 0.8 -0.5 3.8 1.4
United Kingdom 2.7 2.0 1.3 0.8 2.3 2.1 2.7 2.0 1.3 0.8 3.2 2.7
Japan 0.6 0.9 0.5 -0.8 1.0 0.1 0.6 0.9 0.5 -0.8 1.3 0.1
Emerging markets 4.4 4.9 5.1 5.1 4.9 4.4 4.4 4.9 5.1 5.1 5.4 5.8
Latin America1 6.3 6.6 7.7 6.4 7.2 6.6 6.3 6.6 7.7 6.4 13.3 11.2
Mexico 6.8 4.8 2.8 3.2 5.4 3.3 6.8 4.8 2.8 3.2 6.3 5.2
Brazil 2.9 3.7 4.3 4.5 5.4 3.7 2.9 3.7 4.3 4.5 6.7 5.4
Argentina 23.3 47.4 52.2 36.1 44.9 30.3 23.3 47.4 52.2 36.1 49.2 32.7
Emerging Europe2 5.6 6.4 6.6 5.4 6.5 5.4 5.6 6.4 6.6 5.4 5.6 5.9
Turkey 11.9 20.3 11.8 14.6 15.2 10.2 11.9 20.3 11.8 14.6 18.0 11.5
Asia Pacific3 2.4 2.7 3.3 3.1 2.3 2.7 2.4 2.7 3.3 3.1 2.8 4.4
China 1.8 2.2 4.3 0.1 2.7 2.4 1.8 2.2 4.3 0.1 3.9 3.2
Indonesia 3.5 3.3 2.7 1.6 2.7 3.0 3.5 3.3 2.7 1.6 4.2 5.6
Philippines 3.0 5.9 1.5 3.1 3.8 2.7 3.0 5.9 1.5 3.1 5.6 4.3
World 3.2 3.6 3.5 3.2 3.5 3.2 3.2 3.6 3.5 3.2 4.0 3.8
Source: MAPFRE Economics
1Argentina, Brazil, Chile, Colombia, Mexico and Peru; 2Russia, Turkey, Commonwealth of Independent States (CIS) and Central Europe; 3Association of Southeast Asian Nations (ASEAN) Forecast end date: July 12, 2021.
Click here to access the interactive version of this information

109
2021 ECONOMIC AND INDUSTRY OUTLOOK (Q3)
Table A-3 Baseline and stressed scenarios: 10-year government bond yield
(end of period, %)
Baseline scenario (BS) Stressed scenario (SS)
2017 2018 2019 2020(e) 2021(f) 2022(f) 2017 2018 2019 2020(e) 2021(f) 2022(f)
United States 2.40 2.69 1.92 0.93 2.08 2.50 2.40 2.69 1.92 0.93 2.09 2.63
Eurozone 1.13 1.17 0.32 -0.19 0.52 0.73 1.13 1.17 0.32 -0.19 1.77 1.81
Source: MAPFRE Economics Forecast end date: July 12, 2021.
Click here to access the interactive version of this information
Table A-4 Baseline and stressed scenarios: exchange rates
(end of period, %)
Baseline scenario (BS) Stressed scenario (SS)
2017 2018 2019 2020(e) 2021(f) 2022(f) 2017 2018 2019 2020(e) 2021(f) 2022(f)
USD-EUR 0.83 0.87 0.89 0.81 0.81 0.81 0.83 0.87 0.89 0.81 0.81 0.81
EUR-USD 1.20 1.15 1.12 1.23 1.23 1.24 1.20 1.15 1.12 1.23 1.23 1.24
GBP-USD 1.35 1.28 1.32 1.36 1.43 1.44 1.35 1.28 1.32 1.36 1.42 1.43
USD-JPY 112.90 110.83 109.12 103.54 109.96 107.61 112.90 110.83 109.12 103.54 108.27 105.72
USD-CNY 6.51 6.88 6.99 6.52 6.53 6.51 6.51 6.88 6.99 6.52 6.63 6.57
Source: MAPFRE Economics Forecast end date: July 12, 2021.
Click here to access the interactive version of this information
Table A-5 Baseline and stressed scenarios: official benchmark interest rate
(end of period, %)
Baseline scenario (BS) Stressed scenario (SS)
2017 2018 2019 2020(e) 2021(f) 2022(f) 2017 2018 2019 2020(e) 2021(f) 2022(f)
United States 1.50 2.50 1.75 0.25 0.25 0.25 1.50 2.50 1.75 0.25 0.25 0.00
Eurozone 0.00 0.00 0.00 0.00 0.00 0.00 0.00 0.00 0.00 0.00 0.00 0.00
China 3.25 3.30 3.25 2.95 2.95 3.00 3.25 3.30 3.25 2.95 2.65 2.75
Source: MAPFRE Economics Forecast end date: July 12, 2021.
Click here to access the interactive version of this information


Index of charts, tables and boxes
Charts
Chart 1.1.1-a Global: daily COVID-19 infections vs. stringency index. 13 .............................................................................................................................Chart 1.1.1-b Developed and emerging: daily COVID-19 infections vs. stringency index 14 ................................................................................................Chart 1.1.1-c Selected countries: stringency index vs. vaccine administration 14 ..............................................................................................................Chart 1.1.1-d Global: risk aversion (VIX) 15 ...........................................................................................................................................................................Chart 1.1.1-e Global: PMI performance 15 ............................................................................................................................................................................Chart 1.1.1-f Global: global trade (average transport cost index) 16 ...................................................................................................................................Chart 1.1.1-g Global: trade volume change 16 ......................................................................................................................................................................Chart 1.1.1-h Global: monetary policy 16 ..............................................................................................................................................................................Chart 1.1.2 Global risks and vulnerabilities 26 ..................................................................................................................................................................Chart 1.2.1-a United States: GDP breakdown and forecasts 30 ............................................................................................................................................Chart 1.2.1-b United States: domestic demand breakdown and forecasts 30 ......................................................................................................................Chart 1.2.1-c United States: daily COVID-19 infections, stringency index and progress toward herd immunity 31 ............................................................Chart 1.2.2-a Eurozone: GDP breakdown and forecasts 33 ..................................................................................................................................................Chart 1.2.2-b Eurozone: domestic demand breakdown and forecasts 33 .............................................................................................................................Chart 1.2.2-c Eurozone: daily COVID-19 infections, stringency index and progress toward herd immunity 34 ...................................................................Chart 1.2.3-a Spain: GDP breakdown and forecasts. 36 ........................................................................................................................................................Chart 1.2.3-b Spain: domestic demand breakdown and forecasts 36 ...................................................................................................................................Chart 1.2.3-c Spain: daily COVID-19 infections, stringency index and progress toward herd immunity. 37 ........................................................................Chart 1.2.4-a Germany: GDP breakdown and forecasts 39 ...................................................................................................................................................Chart 1.2.4-b Germany: domestic demand breakdown and forecasts 39 .............................................................................................................................Chart 1.2.4-c Germany: daily COVID-19 infections, stringency index and progress toward herd immunity 40 ...................................................................Chart 1.2.5-a Italy: GDP breakdown and forecasts. 42 ..........................................................................................................................................................Chart 1.2.5-b Italy: domestic demand breakdown and forecasts 42 .....................................................................................................................................Chart 1.2.5-c Italy: daily COVID-19 infections, stringency index and progress toward herd immunity 43 ...........................................................................
1112021 ECONOMIC AND INDUSTRY OUTLOOK (Q3)
112
2021 ECONOMIC AND INDUSTRY OUTLOOK (Q3)
Chart 1.2.6-a United Kingdom: GDP breakdown and forecasts 44 ........................................................................................................................................Chart 1.2.6-b United Kingdom: domestic demand breakdown and forecasts 44 ..................................................................................................................Chart 1.2.6-c United Kingdom: daily COVID-19 infections, stringency index and progress toward herd immunity. 45 .......................................................Chart 1.2.7-a Japan: GDP breakdown and forecasts. 47 .......................................................................................................................................................Chart 1.2.7-b Japan: domestic demand breakdown and forecasts 47 ..................................................................................................................................Chart 1.2.7-c Japan: daily COVID-19 infections, stringency index and progress toward herd immunity. 48 .......................................................................Chart 1.2.8-a Turkey: GDP breakdown and forecasts 49 .......................................................................................................................................................Chart 1.2.8-b Turkey: domestic demand breakdown and forecasts 49 .................................................................................................................................Chart 1.2.8-c Turkey: daily COVID-19 infections, stringency index and progress toward herd immunity. 50 ......................................................................Chart 1.2.9-a Mexico: GDP breakdown and forecasts 52 .......................................................................................................................................................Chart 1.2.9-b Mexico: domestic demand breakdown and forecasts. 52 ................................................................................................................................Chart 1.2.9-c Mexico: daily COVID-19 infections, stringency index and progress toward herd immunity 53 .......................................................................Chart 1.2.10-a Brazil: GDP breakdown and forecasts. 55 .......................................................................................................................................................Chart 1.2.10-b Brazil: domestic demand breakdown and forecasts. 55 .................................................................................................................................Chart 1.2.10-c Brazil: daily COVID-19 infections, stringency index and progress toward herd immunity 56 ........................................................................Chart 1.2.11-a Argentina: GDP breakdown and forecasts 57 ..................................................................................................................................................Chart 1.2.11-b Argentina: domestic demand breakdown and forecasts. 57 ...........................................................................................................................Chart 1.2.11-c Argentina: daily COVID-19 infections, stringency index and progress toward herd immunity. 58 .................................................................Chart 1.2.12-a China: GDP breakdown and forecasts. 60 .......................................................................................................................................................Chart 1.2.12-b China: domestic demand breakdown and forecasts 60 ...................................................................................................................................Chart 1.2.12-c China: daily COVID-19 infections, stringency index and progress toward herd immunity. 61 ........................................................................Chart 1.2.13-a Indonesia: GDP breakdown and forecasts. 63 .................................................................................................................................................Chart 1.2.13-b Indonesia: domestic demand breakdown and forecasts. 63 ...........................................................................................................................Chart 1.2.13-c Indonesia: daily COVID-19 infections, stringency index and progress toward herd immunity 64 ..................................................................Chart 1.2.14-a Philippines: GDP breakdown and forecasts. 65 ...............................................................................................................................................Chart 1.2.14-b Philippines: domestic demand breakdown and forecasts 65 ..........................................................................................................................Chart 1.2.14-c Philippines: daily COVID-19 infections, stringency index and progress toward herd immunity 66 ................................................................Chart 2.1.2 Eurozone: risk-free yield curve 68 ...................................................................................................................................................................Chart 2.1.6 United Kingdom: risk-free yield curve 79 ........................................................................................................................................................Chart 2.1.7 United States: risk-free yield curve 80 ............................................................................................................................................................Chart 2.1.8 Brazil: risk-free yield curve 81 ........................................................................................................................................................................Chart 2.1.9 Mexico: risk-free yield curve 90 .......................................................................................................................................................................Chart 2.1.11 Turkey: risk-free yield curve 91 .......................................................................................................................................................................

113
2021 ECONOMIC AND INDUSTRY OUTLOOK (Q3)
Table 1.2.1 United States: main macroeconomic aggregates 30 ......................................................................................................................................Table 1.2.2 Eurozone: main macroeconomic aggregates 33 .............................................................................................................................................Table 1.2.3 Spain: main macroeconomic aggregates 36 ...................................................................................................................................................Table 1.2.4 Germany: main macroeconomic aggregates 39 .............................................................................................................................................Table 1.2.5 Italy: main macroeconomic aggregates 42 ......................................................................................................................................................Table 1.2.6 United Kingdom: main macroeconomic aggregates 44 ..................................................................................................................................Table 1.2.7 Japan: main macroeconomic aggregates 47 ..................................................................................................................................................Table 1.2.8 Turkey: main macroeconomic aggregates 49 .................................................................................................................................................Table 1.2.9 Mexico: main macroeconomic aggregates 52 .................................................................................................................................................Table 1.2.10 Brazil: main macroeconomic aggregates 55 ...................................................................................................................................................Table 1.2.11 Argentina: main macroeconomic aggregates 57 ............................................................................................................................................Table 1.2.12 China: main macroeconomic aggregates 60 ...................................................................................................................................................Table 1.2.13 Indonesia: main macroeconomic aggregates 63 ............................................................................................................................................Table 1.2.14 Philippines: main macroeconomic aggregates 65 ..........................................................................................................................................
Tables
Chart 2.1.12 China: risk-free yield curve 92 .........................................................................................................................................................................Chart 2.1.13 Japan: risk-free yield curve. 93 .......................................................................................................................................................................Chart 2.2-a Main currencies: volatility adjustment, 2018–2021 95 ....................................................................................................................................Chart 2.2-b 2020 Solvency ratios and variation vs. 2019 96 ................................................................................................................................................Chart 2.2-c Relative weight of own funds to assets in 2020 and variation vs. 2019 100 ....................................................................................................Chart 2.2-d Relative weight of own funds to technical provisions in 2020 and variation vs. 2019. 100 .............................................................................Chart 2.2-e Relative weight of own funds compared to premiums in 2020 and variation vs. 2019. 101 ............................................................................Chart 2.2-f Effect of transitional and adjustment measures on own funds, 2020. 103 .....................................................................................................Chart 2.2-g Effect of transitional and adjustment measures on SCR, 2020. 103 ...............................................................................................................Chart 2.2-h Relative weight of the different components of the SCR for
groups that use the standard formula in 2020 and variation vs. 2019 104 .....................................................................................................Chart 2.2-i Relative weight of the different components of the SCR for
groups that use partial internal models in 2020 and variations vs. 2019 104................................................................................................

114
2021 ECONOMIC AND INDUSTRY OUTLOOK (Q3)
Box 1.1.1-a Emerging exchange rate volatility 17 .........................................................................................................................................................Box 1.1.1-b Monetary policy update 22 ........................................................................................................................................................................Box 2.1.5 Spanish insurance industry performance: forecasts for premium growth 70 ..........................................................................................Box 2.1.8 Brazilian insurance industry performance: forecasts for premium growth 82........................................................................................
Boxes
Table 2.2-a Main financial and solvency figures, 2020 96 ..................................................................................................................................................Table 2.2-b SCR calculation methods, 2020 97 ..................................................................................................................................................................Table 2.2-c Quality of eligible own funds, 2020. 99 ............................................................................................................................................................Table 2.2-d Effect of transitional and adjustment measures on own funds, 2020 102 ......................................................................................................Table 2.2-e Effect of transitional and adjustment measures on SCR, 2020 102 ................................................................................................................Table A-1 Baseline and stressed scenarios: gross domestic product 107 .....................................................................................................................Table A-2 Baseline and stressed scenarios: inflation 108 ...............................................................................................................................................Table A-3 Baseline and stressed scenarios: 10-year government bond yield 109 .........................................................................................................Table A-4 Baseline and stressed scenarios: exchange rates 109 ...................................................................................................................................Table A-5 Baseline and stressed scenarios: official benchmark interest rate 109 ........................................................................................................
References
1/ See: MAPFRE Economics (2021), 2021 Economic and industry outlook: second quarter perspectives, Madrid, Fundación MAPFRE.
2/ See the interactive section "Institutional response to the COVID-19 crisis and effects on expected growth" prepared by MAPFRE Economics, at: https://app.klipfolio.com/published/ca635768cc1b32264d33836fc491e79c/institucional-response-to-the-covid19-crisis-and-effects-on-expected-growth
3/ See: Oxford Covid-19 Government Response Tracker (OxCGRT), at: https://www.bsg.ox.ac.uk/research/research-projects/covid-19-government-response-tracker
4/ Chart 2.1.2-a shows the minimum, average and maximum levels reached in 2020, along with the level of the latest curves published by EIOPA for March and June 2021. Other months and currencies can be seen in the interactive chart at: https://app.klipfolio.com/published/29577612d0ba9ff3681af85b8ee8a998/curvas-eiopa
5/ ICEA data, taken from a sample of 129 companies with a market share of 94.9%.
6/ The Solvency and Financial Condition Reports (SFCR) for 2020 that are used as the basis for the preparation of this report were consulted as required at the following links:
Allianz: https://www.allianz.com/content/dam/onemarketing/azcom/Allianz_com/investor-relations/en/results-reports/sfcr/2021/en-Allianz-Group-SFCR-2020.pdf
Axa: https://www-axa-com.cdn.axa-contento-118412.eu/www-axa-com/d87a089b-4f7b-42d9-8167-65168a7f7937_axa_sfcr_2020_va.pdf
Generali: https://www.generali.com/doc/jcr:51062ddb-528c-468c-bf91-d2947a5fdbba/SFCR%20Generali%20Group%202020%20ENG.PDF/lang:en/SFCR_Generali_Group_2020_ENG.PDF
Aviva: https://www.aviva.com/content/dam/aviva-corporate/documents/investors/pdfs/regulatoryreturns/2020/aviva-plc-group-sfcr-2020.pdf
Talanx: https://www.talanx.com/media/Files/investor-relations/pdf/geschaeftsberichte/risikoberichte/2020_sfcr_hdi_gruppe_en.pdf
Crédit Agricole: https://www.ca-assurances.com/previewPDF/22096/CAA_%20SFCR%202020_FR.pdf
CNP: https://www.cnp.fr/en/cnp/content/download/9644/file/CNP-Assurances-SFCR-Groupe-2020-VA.pdf
BNP: https://www.bnpparibascardif.com/c/document_library/get_file?uuid=09509602-57a5-ad17-5579-aeb307a9733e&groupId=348001
Aegon: https://www.aegon.com/contentassets/93133cb175974c9eb139d0b00bf6455e/2020-sfcr-aegon-group.pdf
1152021 ECONOMIC AND INDUSTRY OUTLOOK (Q3)

MAPFRE: https://www.mapfre.com/media/accionistas/2021/2020-sfcr-grupo-mapfre.pdf
R+V: https://www.ruv.de/dam/jcr:228f74ff-e273-4542-8bf8-f3b3faf79034/2020-SFCR-Gruppe.pdf
Covéa: https://www.covea.eu/sites/default/files/2021-05/sfcr_covea_2020_fr.pdf
Sogecap: https://www.assurances.societegenerale.com/uploads/tx_bisgnews/08_GROUPESOGECAP_SFCR2021_VA_PLANCHE.pdf
Groupama: https://www.groupama.com/wp-content/uploads/2021/05/SFCR-2020-Groupe-Groupama-1.pdf
RSA: https://www.rsagroup.com/media/3uedkvar/rsa-group-sfcr-2020.pdf
Poste Vita: https://www.poste.it/files/1476538733185/RelazioneUnicaSolvibilita_CondizioneFinanziaria_31122020.pdf
7/ See: MAPFRE Economics (2020), 2020 Economic and industry outlook: third quarter perspectives, Madrid, Fundación MAPFRE, pg. 84–96.
116
2021 ECONOMIC AND INDUSTRY OUTLOOK (Q3)

Other MAPFRE Economics reports
117
MAPFRE Economics (2021), The Spanish insurance market in 2020, Madrid, Fundación MAPFRE.
MAPFRE Economics (2021), 2020 Ranking of the largest European insurance groups, Madrid, Fundación MAPFRE.
MAPFRE Economics (2021), 2020 Ranking of insurance groups in Latin America, Madrid, Fundación MAPFRE.
MAPFRE Economics (2021), Pension systems from a global perspective, Madrid, Fundación MAPFRE.
MAPFRE Economics (2021), Insurance industry investments, Madrid, Fundación MAPFRE.
MAPFRE Economics (2021), 2021 Economic and industry outlook, Madrid, Fundación MAPFRE.
MAPFRE Economics (2020), The Latin American insurance market in 2019, Madrid, Fundación MAPFRE.
MAPFRE Economics (2020), Components for the development of Life insurance, Madrid, Fundación MAPFRE.
MAPFRE Economics (2020), Financial inclusion in insurance, Madrid, MAPFRE Economics.
MAPFRE Economics (2019), Population aging, Madrid, Fundación MAPFRE.
MAPFRE Economics (2018), Health systems: a global analysis, Madrid, Fundación MAPFRE.
MAPFRE Economics (2018), Insurance solvency regulation systems, Madrid, Fundación MAPFRE.

119
NOTICE
This document has been prepared by MAPFRE Economics for information purposes only. It does not reflect the views or opinions of MAPFRE or Fundación MAPFRE. The document presents and compiles data, views and estimates relative to the time at which it was prepared. These were prepared directly by MAPFRE Economics or otherwise obtained from or prepared using sources considered reliable, but which have not been independently verified by MAPFRE Economics. Therefore, MAPFRE and Fundación MAPFRE specifically refuse all liability with respect to its precision, integrity or correctness.
The estimates contained in this document have been prepared on the basis of widely accepted methodologies and should be treated as forecasts or projections only, given that the results obtained from positive or negative historical data cannot be considered as a guarantee of future performance. This document and its contents are also subject to changes that will depend on variables like the economic outlook or market performance. MAPFRE and Fundación MAPFRE therefore refuse all liability with respect to how up to date or relevant these contents may be.
This document and its contents do not constitute any form of offer, invitation or solicitation to purchase, participate or divest in financial assets or instruments. This document and its contents cannot form part of any contract, commitment or decision. With regard to the investment in financial assets connected with the economic variables analyzed in this document, readers of this study must be aware that under no circumstances should they base their investment decisions on the information given in this document. People or companies offering investment products to potential investors are legally bound to provide the necessary information by which to make a suitable investment decision. For all of the foregoing, MAPFRE and Fundación MAPFRE specifically refuse all liability for any direct or indirect loss or damage that may ensue from the use of this document or its contents for these purposes.
The contents of this document are protected by intellectual property laws. The information contained in this study may be reproduced in part, provided the source is cited.


www.fundacionmapfre.org Paseo de Recoletos, 23
28004 Madrid

www.fundacionmapfre.org Paseo de Recoletos, 23
28004 Madrid


