Press release Regulated information
30 July 2021 • 7:00 a.m. CET
Press & Investors • Katelijn Bohez • T +32 56 76 66 10 • bekaert.com 1 / 31
2021 first half-year results
Bekaert delivers superior performance All-time high H1 sales and uEBIT uEBIT of € 285 million or 12.4% margin on sales net debt/uEBITDA of 0.69
Bekaert achieved strong sales and vigorous margin growth in the first half of 2021. This performance was achieved
on the back of a volume rebound to pre-Covid-19 levels, an overall stronger business portfolio, the lasting impact
from the implemented improvement programs, and a significant pricing and inventory valuation impact from raw
material price increases.
Financial highlights H1 20211
Consolidated sales of € 2 306 million (+33%2) and combined sales of € 2 782 million (+39%2)
Underlying EBIT of € 285 million, generating a margin on sales of 12.4%, up 7.2 ppt from H1 last year
Underlying EBITDA of € 376 million, generating a margin on sales of 16.3%, up 5.3 ppt from H1 last year
Underlying ROCE of 26.9%, compared to 7.7% in H1 2020
EPS of € 3.66 per share, versus € 0.59 last year
Working capital of € 667 million or an average working capital on sales of 13.0%, significantly below the
average of H1 (20.1%) and FY 2020 (16.4%), despite the impact from wire rod price increases
Solid Operating Free Cash Flow of € 155 million (versus € 61 million in H1 2020) driven by higher profitability
Net debt of € 519 million, € -436 million down from € 955 million as at 30 June 2020, and a further decrease
(€ -85 million) from the close of 2020. This resulted in a net debt on underlying EBITDA of 0.69, down from
2.46 on 30 June last year and 1.26 at year-end 2020.
Focus and effectiveness of our actions
Our actions have been geared towards three main areas, which have contributed each about one third of the year-
on-year underlying EBIT improvement (more details in the underlying EBIT bridge on page 3).
Volume recovery to pre-Covid-19 levels, enabled by:
- Capturing the opportunities from the global demand rebound
- Driving growth through a customer-centric and go-to-market strategy and focus
- Securing supply chain excellence to ensure delivery continuity to customers worldwide
Structural improvement of the overall Bekaert performance:
Driving further performance improvements across the Group, through:
- Product and business mix improvements, in line with our strategy to upgrade the business portfolio
- Pricing discipline aligned with raw material price evolutions
- Acceleration of our commercial and manufacturing excellence programs
- Continued effective working capital and cost control
As a result of these improvement actions, all four business units delivered an underlying EBIT margin
between ~10% and ~17%.
Seizing the opportunities from temporary tailwinds:
- Positive non-cash inventory valuation impact of raw material price increases
- Excluding the H1 2021 inventory valuation impact, the underlying EBIT margin would have reached
approximately 10%.
1 All comparisons are relative to the first half of 2020, unless otherwise indicated. 2 Organic growth at constant exchange rates
Press Release
2021 first half-year results
2 / 31
Market developments
Demand from tire markets was very strong at a global level throughout the first half of 2021. Demand in China
started to tail off in June 2021, linked to lower export business for Chinese tire makers as a result of container
shortage and fiscal policy reforms. This was partly compensated by a demand rebound in North America and
surging demand in EMEA and India. Demand from OEM automotive markets rebounded, though not yet to pre-
Covid levels as a result of the global chip shortage.
Demand from construction and infrastructure markets was strong throughout the first half in Latin America, and
progressively improved in the rest of the world. Stimulus programs have supported demand and the ongoing de-
globalization trend has been beneficial, as a global player with a strong foothold in all continents.
Demand in energy & utility markets was strong, with positive evolutions for the flexible pipe armoring and overhead
power cable business, improved order books and project wins for ropes, and opportunities in hydrogen power and
other renewable energy markets.
Agriculture, fishing & marine, and mining markets remained solid with good sales volumes for our steel wire and
ropes business. The global industrial recovery also boosted demand for Bekaert’s hose reinforcement and filtration
solutions.
2021 Outlook and mid-term ambitions
We project good demand in most markets in the second half of the year but we take into account the usual
seasonality effects and remain cautious about supply chain interruptions and other challenges posed by the
Covid-19 pandemic.
We project the positive inventory valuation impact to trend down significantly in the second half due to an
anticipated stabilization in raw material prices as of the fourth quarter of 2021 onwards.
The underlying EBIT of the second half will therefore be lower than the first half of 2021 and is projected to
approximate or exceed the solid level of the second half last year.
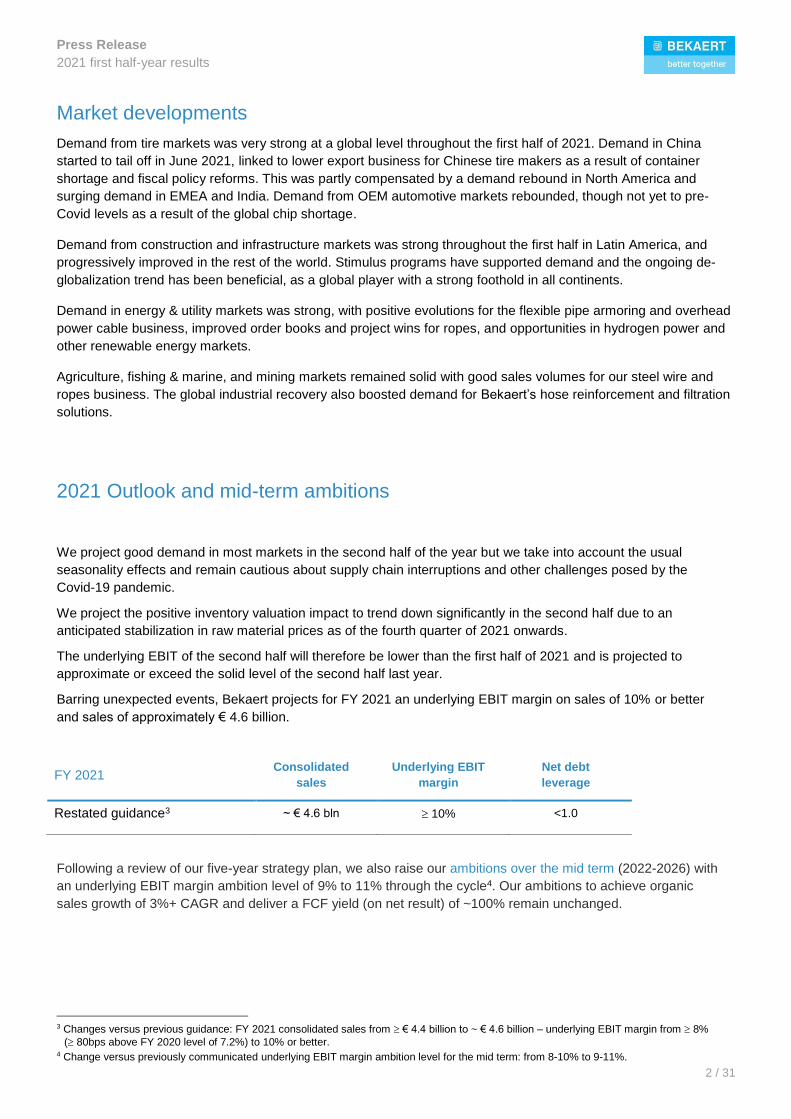
Barring unexpected events, Bekaert projects for FY 2021 an underlying EBIT margin on sales of 10% or better
and sales of approximately € 4.6 billion.
FY 2021 Consolidated
sales
Underlying EBIT
margin
Net debt
leverage
Restated guidance3 ~ € 4.6 bln 10% <1.0
Following a review of our five-year strategy plan, we also raise our ambitions over the mid term (2022-2026) with
an underlying EBIT margin ambition level of 9% to 11% through the cycle4. Our ambitions to achieve organic
sales growth of 3%+ CAGR and deliver a FCF yield (on net result) of ~100% remain unchanged.
3 Changes versus previous guidance: FY 2021 consolidated sales from € 4.4 billion to ~ € 4.6 billion – underlying EBIT margin from 8%
( 80bps above FY 2020 level of 7.2%) to 10% or better. 4 Change versus previously communicated underlying EBIT margin ambition level for the mid term: from 8-10% to 9-11%.
Press Release
2021 first half-year results
3 / 31
Financial Statements Summary
Underlying Reported
in millions of € H1 2020 H2 2020 H1 2021 H1 2020 H2 2020 H1 2021
Consolidated sales 1 770 2 002 2 306 1 770 2 002 2 306
Operating result (EBIT) 92 181 285 87 170 288
EBIT margin on sales 5.2% 9.0% 12.4% 4.9% 8.5% 12.5%
Depreciation, amortization and impairment losses 103 104 91 101 115 84
EBITDA 194 285 376 188 285 372
EBITDA margin on sales 11.0% 14.2% 16.3% 10.6% 14.2% 16.1%
ROCE (H2 = FY 2020 references) 7.7% 12.2% 26.9% 7.3% 11.5% 27.1%
Combined sales 2 065 2 373 2 782 2 065 2 373 2 782
Underlying EBIT bridge
Bekaert’s H1 underlying EBIT increased by € +193 million to € 285 million, reflecting a margin on sales of 12.4%.
The robust increase was the result of three main drivers:
Raw material price increases induced an upward inventory valuation effect of € 56.6 million in the first half of
2021. Compared with the adverse effect of € -8.5 million in the same period last year, the total year-on-year
increase amounted to € +65 million.
The volume recovery to pre-Covid-19 levels contributed another € +65 million in the year-on-year comparison.
Price-Mix improvements driven by better segmentation, product portfolio innovations, strict pricing discipline and
reduced presence in lower margin applications contributed € 61 million.
Structural cost improvements added € +16 million versus H1 2020 and more than offset the net negative impact
(€ -13 million) of other elements.
Sales
Bekaert achieved +32.7% organic sales growth in the first half of 2021, reaching € 2 306 million in consolidated
revenue. This robust growth stemmed from higher volumes (+22.5%) and a positive impact from passed-on wire
rod price changes and other mix effects (+10.2%). Part of the growth was offset by adverse currency movements
(-2.4%), resulting in a top-line increase of +30.3%.
Including the vigorous sales growth of the Brazilian joint ventures (+73.8%), the combined5 organic sales growth
was +39.2%. Adverse currency movements (-4.5%) tempered the growth to +34.7% or a combined top-line of
€ 2 782 million for the first half.
5 Combined sales are sales of fully consolidated companies plus 100% of sales of joint ventures and associates after intercompany elimination.
in millions of €
Press Release
2021 first half-year results
4 / 31
Consolidated and combined sales by segment – in millions of €
Consolidated third party sales H1 2020 H1 2021 Share Variance6 Organic FX
Rubber Reinforcement 709 991 43% +40% +43% -3%
Steel Wire Solutions 639 849 37% +33% +35% -3%
Specialty Businesses 185 227 10% +23% +24% -1%
BBRG 229 236 10% +3% +5% -1%
Group 9 3 - - - -
Total 1 770 2 306 100% +30% +33% -2%
Combined third party sales7 H1 2020 H1 2021 Share Variance6 Organic FX
Rubber Reinforcement 760 1 072 39% +41% +45% -4%
Steel Wire Solutions 892 1 247 45% +40% +46% -7%
Specialty Businesses 185 227 8% +23% +24% -1%
BBRG 229 236 8% +3% +5% -1%
Total 2 065 2 782 100% +35% +39% -5%
2021 quarter-on-quarter progress – in millions of €
Consolidated third party sales 1st Q 2nd Q Q2:Q1 Q2 y-o-y8
Rubber Reinforcement 497 494 - +69%
Steel Wire Solutions 411 438 +7% +49%
Specialty Businesses 103 124 +20% +43%
BBRG 115 120 +4% +6%
Group 1 2 - -
Total 1 128 1 178 +4% +48%
Combined third party sales7 1st Q 2nd Q Q2:Q1 Q2 y-o-y8
Rubber Reinforcement 533 539 +1% +75%
Steel Wire Solutions 586 660 +13% +64%
Specialty Businesses 103 124 +20% +43%
BBRG 115 120 +4% +6%
Group 1 -1 - -
Total 1 339 1 443 +8% +58%
6 Comparisons are made relative to the first half of 2020, unless otherwise indicated. 7 Combined sales are sales of fully consolidated companies plus 100% of sales of joint ventures and associates after intercompany elimination. 8 Q2 year-on-year sales: 2nd quarter 2021 versus 2nd quarter 2020.
10%
10%
37%
43%
BBRG
Specialty Businesses
Steel Wire Solutions
Rubber Reinforcement
Consolidated sales
8%
8%
45%
39%
BBRG
Specialty Businesses
Steel Wire Solutions
Rubber Reinforcement
Combined sales
Press Release
2021 first half-year results
5 / 31
Segment reports
Rubber Reinforcement: strong organic sales growth and robust uEBIT margin of 13.8%
Underlying Reported
Key figures (in millions of €) H1 2020 H2 2020 H1 2021 H1 2020 H2 2020 H1 2021
Consolidated third party sales 709 905 991 709 905 991
Consolidated sales 725 920 1 010 725 920 1 010
Operating result (EBIT) 28 116 139 27 109 140
EBIT margin on sales 3.9% 12.6% 13.8% 3.7% 11.9% 13.8%
Depreciation, amortization and impairment losses 52 52 47 52 52 47
EBITDA 81 168 186 79 161 187
EBITDA margin on sales 11.1% 18.3% 18.4% 10.9% 17.6% 18.5%
Combined third party sales 760 983 1 072 760 983 1 072
Segment assets 1 359 1 404 1 537 1 359 1 404 1 537
Segment liabilities 194 310 361 194 310 361
Capital employed 1 165 1 094 1 176 1 165 1 094 1 176
ROCE - FY2020 references 12.4% 24.5% 11.7% 24.6%
Consolidated sales
Bekaert’s Rubber Reinforcement business achieved strong organic sales growth (+42.8%) compared to the first half
of 2020, which was significantly affected by the impact of the Covid-19 pandemic. The organic growth stemmed from
volume rebound (+30.4%) and positive price-mix effects (+12.4%) including the impact of passed-on raw material
prices. Top-line growth was partly tempered by adverse currency movements (-3.0%), resulting in € 991 million third
party sales for the first half (+39.9%).
Sales were strong in EMEA and India throughout the first half with volume growth above pre-Covid-19 levels. In
North America, demand progressively improved in the second quarter. Sales in China and Indonesia were at a high
level until June, when demand started to tail off due to lower export sales by tire makers resulting from container
shortage.
Overall demand is expected to remain solid in most markets in the second half of 2021, but we do take into account
some seasonality impact as well as softening business conditions for China and Indonesia.
Financial performance
The business unit saw benefits continue to flow through from earlier measures implemented to lower the cost
structure and improve the business mix, as already reflected in the strong profit performance of the second half of
2020.
The segment reported an underlying EBIT of € 139 million for the first half of 2021 or 13.8% margin on sales. The
one-off elements were € +1 million positive (reversal of provisions), leading to a reported EBIT of € 140 million.
The underlying EBITDA margin was 18.4%, up 7.3 ppt from the first half of 2020.
Capital expenditure (PP&E) amounted to € 12 million and mainly related to investments in EMEA and Asia.
Combined sales and joint venture performance
The Rubber Reinforcement joint venture in Brazil reported +74.5% sales growth at constant exchange rates. The
devaluation of the Brazilian real had a significant adverse effect (-16.8%), resulting in top-line growth of +57.7%.
Including joint ventures, the business unit’s combined sales increased by +41.1% to € 1 072 million.
The margin performance of the joint venture was strong. The results are accounted for in Bekaert’s Income
Statement under the equity method as part of the ‘share in the results of joint ventures and associates’.
Press Release
2021 first half-year results
6 / 31
Steel Wire Solutions: sales rebound above pre-Covid levels and robust uEBIT margin of 13.4%
Underlying Reported
Key figures (in millions of €) H1 2020 H2 2020 H1 2021 H1 2020 H2 2020 H1 2021
Consolidated third party sales 639 694 849 639 694 849
Consolidated sales 655 708 867 655 708 867
Operating result (EBIT) 40 56 116 39 49 118
EBIT margin on sales 6.0% 8.0% 13.4% 5.9% 6.9% 13.6%
Depreciation, amortization and impairment losses 27 26 21 25 27 17
EBITDA 67 82 138 64 76 135
EBITDA margin on sales 10.2% 11.6% 15.9% 9.8% 10.8% 15.6%
Combined third party sales 892 989 1 247 892 989 1 247
Segment assets 849 805 976 849 805 976
Segment liabilities 282 308 397 282 308 397
Capital employed 566 497 580 566 497 580
ROCE - FY2020 references 17.6% 43.2% 16.1% 43.7%
Sales
Steel Wire Solutions delivered robust organic sales growth in the first half (+35.3% compared to H1 last year). This
growth stemmed from favorable price-mix effects (+18.4%) including the impact of passed-on raw material prices and
from strong volume growth (+16.9%), particularly in Latin America, EMEA and China. Adverse currency movements
accounted for -2.5%, resulting in a top-line growth of +32.8% to € 849 million, well above pre-Covid-19 levels.
Demand is expected to remain solid in most markets in the second half of 2021. We do take into account the usual
seasonality effects in EMEA and remain cautious about supply chain and other challenges posed by the pandemic.
The merger in Colombia that integrates the Almasa business within Proalco SAS (owned by Bekaert Ideal Holding)
is projected to add € 11 million in revenue in the second half of the year.
Financial performance
Steel Wire Solutions delivered a very strong underlying EBIT of € 116 million and a margin on sales of 13.4%, far
above previous reporting periods. This was the result of high volumes, an improved business mix, cost control,
pricing discipline, and a positive inventory valuation effect from raw material price increases.
Reported EBIT amounted to € 118 million after adding minor one-off elements (€ +1.5 million).
Underlying EBITDA further strengthened to a solid 15.9% margin on sales.
Capital expenditure (PP&E) amounted to € 11 million and included investments in all regions.
Combined sales and joint venture performance
The Steel Wire Solutions joint venture in Brazil reported +73.7% sales growth at constant exchange rates but the
strong devaluation of the Brazilian real (-16.8%) reduced the top-line growth to +56.9%. Including joint ventures,
the business unit’s combined sales increased by +39.8% to € 1 247 million.
The margin performance of the Steel Wire Solutions joint venture was strong. The results are accounted for in
Bekaert’s Income Statement under the equity method as part of the ‘share in the results of joint ventures and
associates’.
Press Release
2021 first half-year results
7 / 31
Specialty Businesses: solid sales growth and strong underlying EBIT of 17.3%
Underlying Reported
Key figures (in millions of €) H1 2020 H2 2020 H1 2021 H1 2020 H2 2020 H1 2021
Consolidated third party sales 185 205 227 185 205 227
Consolidated sales 188 208 233 188 208 233
Operating result (EBIT) 24 21 40 23 14 40
EBIT margin on sales 12.9% 10.1% 17.3% 12.0% 6.6% 17.1%
Depreciation, amortization and impairment losses 7 9 7 7 11 7
EBITDA 31 30 48 30 25 47
EBITDA margin on sales 16.6% 14.6% 20.4% 15.7% 12.0% 20.0%
Segment assets 317 288 329 317 288 329
Segment liabilities 69 71 89 69 71 89
Capital employed 248 217 240 248 217 240
ROCE – FY2020 references 20.0% 35.4% 16.0% 34.9%
Sales
The business unit Specialty Businesses reported a sales increase of +23.1% to € 227 million, driven by solid
organic growth (+24.1%) above pre-Covid-19 levels and limited adverse currency effects (-1.0%). Building Products
reported strong volume growth and a good product mix. Combustion Technologies saw increased demand for
environmentally-friendly burners, particularly in EMEA. Fiber Technologies achieved strong growth in Asia and in
high-end filtration, microcable, and conductive fiber markets in general. Demand for heat-resistant textiles for the
glass bending industry was affected by the prevailing global shortage of microchips in automotive OEM.
The business unit projects continued good demand in the second half of 2021, while taking into account the usual
seasonality effects.
Financial performance
Specialty Businesses delivered an underlying EBIT result of € 40 million, +67% above the same period last year
and reaching an underlying EBIT margin on sales of 17.3% (versus 12.9% last year). The solid margin
improvement primarily resulted from the high production and sales volumes, positive mix effects from an increased
share of high-end applications, and the result of footprint actions taken in 2020, including expansions in India and
Czech Republic (Building Products), Romania (Combustion Technologies), and exiting the loss-generating
diamond sawing wire business in China in December last year.
The one-off elements were limited (€ -0.5 million).
The underlying EBITDA margin reached 20.4%, far above the level in previous reporting periods.
Capital expenditure (PP&E) amounted to almost € 8 million and mainly included investments in Building Products
(Czech Republic and US) and to a lesser extent in Fiber and Combustion Technologies.
Press Release
2021 first half-year results
8 / 31
Bridon-Bekaert Ropes Group: solid revenue and underlying EBIT margin of 9.8%
Underlying Reported
Key figures (in millions of €) H1 2020 H2 2020 H1 2021 H1 2020 H2 2020 H1 2021
Consolidated third party sales 229 196 236 229 196 236
Consolidated sales 230 197 237 230 197 237
Operating result (EBIT) 24 10 23 24 0 19
EBIT margin on sales 10.3% 5.1% 9.8% 10.3% 0.0% 8.0%
Depreciation, amortization and impairment losses 16 15 16 16 22 14
EBITDA 39 25 39 39 22 33
EBITDA margin on sales 17.2% 12.7% 16.5% 17.2% 11.2% 13.9%
Segment assets 546 506 541 546 506 541
Segment liabilities 84 83 112 84 83 112
Capital employed 462 423 429 462 423 429
ROCE – FY2020 references 7.4% 10.9% 5.2% 9.0%
Sales
Bridon-Bekaert Ropes Group (BBRG) recorded an organic sales growth of +4.5% compared to the first half of
2020, almost all of which was driven by higher volumes, particularly in the Advanced Cords business. Top-line
growth was +3.1% as a result of adverse currency movements (-1.4%) and reached € 236 million.
Demand from mining, crane and industrial, and fishing and marine ropes markets was strong and is projected to
remain solid in the second half of 2021 as evidenced in the order books. Advanced cords reported strong sales in
elevator and automotive applications, which more than offset subdued demand in timing belt markets.
Financial performance
The business unit delivered an underlying EBIT of € 23.2 million at a margin on sales of 9.8%, approximating the
strong H1 result of last year. Underlying EBITDA reached a strong margin of 16.5%, slightly below the margin of
the same period last year.
Reported EBIT was € 19 million and included € -4 million in one-offs, mainly related to the plant closure in Pointe-
Claire, Canada. These one-off elements consisted of gain on the sale of the property (€ +11 million) and severance
costs as well as asset write-downs and provisions (€ -15 million). The benefits from the consolidation of all ropes
activities for North America in the US are expected to start to flow through from the second half of 2021 onwards
and will reach their full potential in the coming years.
BBRG invested € 10.5 million in PP&E, mainly in UK, US and in Advanced Cords Belgium.
Press Release
2021 first half-year results
9 / 31
Investment update and other information
Investments in property, plant and equipment amounted to € 40 million in the first half of 2021, € +2.5 million above the
investments in the same period of 2020.
Net debt amounted to € 519 million, down from € 604 million at the close of 2020 and from € 955 million on 30 June
2020. This resulted in net debt on underlying EBITDA of 0.69, significantly down from 2.46 on 30 June 2020 and 1.26
on 31 December 2020.
The average working capital on sales was 13.0%, significantly down from 20.1% in the first half of 2020 and 16.4% for
the full fiscal year 2020. Total working capital was € 667 million on 30 June 2021, down € -53 million from 30 June
2020 but up € +132 million from year-end 2020. Inventories increased by € 212 million from year-end 2020: the
organic increase of € +192 million was driven equally by higher volumes and the upward inventory valuation from
higher raw materials prices. Currency movements added € +15 million and reversed inventory write-offs € +6 million.
Trade accounts receivable increased by € +92 million from year-end 2020 due to higher sales and currency
movements. Factoring increased by € +78 million from year-end 2020 to € 231 million. Accounts payable increased by
€ +171 million, in line with the increased purchase of raw materials.
Between 1 January 2021 and 30 June 2021, a total of 437 108 stock options were exercised under Stock Option
Plan 2010-2014, Stock Option Plan 2015-2017 and Stock Option Plan 2 and 437 108 own shares were used for
that purpose. Bekaert sold 9 112 own shares to members of the Bekaert Group Executive in the framework of the
Bekaert Personal Shareholding Requirement Plan and granted 10 940 own shares to non-executive Directors of
Bekaert as remuneration for the performance of duties. As a result, Bekaert owned 3 352 374 treasury shares on
30 June 2021.
Financial review
Financial results
Bekaert achieved an operating result (EBIT-underlying) of € 285 million (versus € 92 million in the first half of
2020). This resulted in a margin on sales of 12.4% (5.2% in H1 2020). The one-off items amounted to € +2 million
(€ -5 million in H1 2020) and were the result of the gain on the disposal of the land and building of the Canadian
BBRG plant (€ +11 million), offset by various restructuring and other one-off costs and provisions (€ -9 million).
Including one-off items, EBIT was € 288 million, representing an EBIT margin on sales of 12.5% (versus € 87
million or 4.9% in H1 2020). Underlying EBITDA was € 376 million (16.3% margin) compared with € 194 million
(11.0%) and EBITDA reached € 372 million, or a margin on sales of 16.1% (versus 10.6%).
The underlying overhead expenses decreased as a percentage on sales by 80 basis points to 8.5% (9.3% for H1
2020), but increased by € +31 million in absolute numbers due to higher provisions for short-term and long-term
incentive programs, consultancy fees for specific projects and the overall business activity rebound versus last
year, when temporary unemployment was in place for many overhead functions.
Underlying other operating revenues and expenses increased from € 4 million last year to € 9 million in 2021 due to
an increase in royalties received and gains from a real estate sale in Peru. Reported other operating revenues and
expenses (€ +21 million) were significantly higher than the same period last year (€ +4 million) due to the gain on
the sale of real estate in Canada and Malaysia.
Interest income and expenses amounted to € -23 million, down from € -28 million in the first half of 2020 and a
result of lower gross debt and a lower amount of interest adjustments on derivative financial instruments compared
to the same period in 2020. Other financial income and expenses amounted to € 4 million (€ -15 million in H1 2020)
and included € +6 million valuation gain on the VPPA contract in the US.
Income taxes increased from € -23 million to € -71 million. The overall effective tax rate dropped from 53% to 26%,
resulting from tax saving measures and the utilization of deferred tax assets.
Press Release
2021 first half-year results
10 / 31
The share in the result of joint ventures and associated companies was € +34 million (versus € +13 million last
year), reflecting the strong performance of the joint ventures in Brazil.
The result for the period thus totaled € +231 million, compared with € +34 million in the same period of 2020. The
result attributable to non-controlling interests was € +23 million (versus € +0.4 million in H1 2020) due to the profit
increase in entities with minority shareholders, particularly in Latin America. After non-controlling interests, the
result for the period attributable to equity holders of Bekaert was € +208 million versus € +33 million in the same
period last year. Earnings per share amounted to € +3.66, significantly up from € +0.59 in H1 2020.
Balance sheet
As at 30 June 2021, equity represented 41.6% of total assets, up from 35.8% at year-end 2020. The gearing ratio
(net debt to equity) was 28.6%, significantly down from 39.4% at year-end 2020 due to strong deleveraging.
Net debt on underlying EBITDA was 0.69, significantly down from 2.46 on 30 June 2020 and 1.26 on 31 December
2020.
Cash flow statement
Cash flows from operating activities amounted to € +181 million, higher than the € +111 million in the first half of
2020 as a result of higher profitability, partly offset by the working capital increase and higher income taxes.
Cash flows attributable to investing activities amounted to € -16 million (versus € -47 million in H1 2020) due to the
proceeds from the real estate sales in Peru, Malaysia and Canada. The cash-out from tangible and intangible asset
investments remained stable.
Cash flows from financing activities totaled € -468 million, compared with € +213 million in the first half of 2020. H1
2020 included a drawdown on committed credit facilities and the refinancing of some local loans. H1 2021 included
the repayment of the convertible bond and other loans (€ -402 million), and dividend payments (€ -60 million),
whereas in 2020 the dividend payment was postponed to H2 due to uncertainty related to the pandemic.
NV Bekaert SA (statutory accounts)
The Belgium-based entity's sales amounted to € 193 million, compared with € 141 million in the first half of 2020.
The operating result including non-recurring items was € 38 million, compared with € 5 million in the first half of
2020. The financial result including non-recurring items was € 28 million (versus € -37 million in the first half of
2020), mainly due to higher dividends received and the write offs on financial fixed assets in 2020. This led to a
result for the period of € 66 million compared with € -31 million loss in the first half of 2020.
Press Release
2021 first half-year results
11 / 31
Financial Calendar
2021 half year results 30 July 2021
The CEO and the CFO of Bekaert will present the results to the investment community at 02:00 p.m. CET. This virtual conference can be accessed live upon registration via the Bekaert website (bekaert.com/en/investors) in listen-only mode.
Third quarter trading update 2021 19 November 2021
Statement from the responsible persons The undersigned persons state that, to the best of their knowledge:
the consolidated condensed interim financial statements of NV Bekaert SA and its subsidiaries as of 30 June 2021 have been prepared in accordance with the International Financial Reporting Standards, and give a true and fair view of the assets and liabilities, financial position and results of the whole of the companies included in the consolidation; and
the interim management report gives a fair overview of the information required to be included therein.
Taoufiq Boussaid Chief Financial Officer Oswald Schmid Chief Executive Officer
Disclaimer This press release may contain forward-looking statements. Such statements reflect the current views of management regarding future events, and involve known and unknown risks, uncertainties and other factors that may cause actual results to be materially different from any future results, performance or achievements expressed or implied by such forward-looking statements. Bekaert is providing the information in this press release as of this date and does not undertake any obligation to update any forward-looking statements contained in this press release in light of new information, future events or otherwise. Bekaert disclaims any liability for statements made or published by third parties and does not undertake any obligation to correct inaccurate data, information, conclusions or opinions published by third parties in relation to this or any other press release issued by Bekaert.
Company Profile Bekaert (bekaert.com) is a world market and technology leader in steel wire transformation and coating technologies. We pursue to be the preferred supplier for our steel wire products and solutions by continuously delivering superior value to our customers worldwide. Bekaert (Euronext Brussels: BEKB) is a global company with more than 27 000 employees worldwide, headquarters in Belgium and € 4.4 bi llion in combined revenue in 2020.
Press & Investors Contact Katelijn Bohez Phone: +32 56 76 66 10 E-mail: [email protected] bekaert.com
Press Release
2021 first half-year results
12 / 31
Interim financial statements
Note 1: Consolidated income statement
(in thousands of €) H1 2020 H2 2020 H1 2021
Sales 1 769 909 2 002 465 2 306 150
Cost of sales -1 520 599 -1 693 457 -1 847 309
Gross profit 249 310 309 007 458 841
Selling expenses -80 729 -86 412 -87 439
Administrative expenses -59 594 -73 932 -76 159
Research and development expenses -25 514 -26 846 -28 620
Other operating revenues 10 810 73 849 32 211
Other operating expenses -7 266 -26 156 -11 263
Operating result (EBIT) 87 017 169 510 287 570
of which
EBIT - Underlying 91 537 180 708 285 375
One-off items -4 520 -11 197 2 195
Interest income 1 366 2 020 1 773
Interest expense -29 298 -30 256 -24 601
Other financial income and expenses -15 174 -14 991 3 657
Result before taxes 43 911 126 283 268 399
Income taxes -23 319 -33 194 -70 984
Result after taxes (consolidated companies) 20 592 93 090 197 415
Share in the results of joint ventures and associates 13 204 21 151 33 684
RESULT FOR THE PERIOD 33 796 114 240 231 099
Attributable to
equity holders of Bekaert 33 354 101 333 208 059
non-controlling interests 442 12 908 23 040
EARNINGS PER SHARE (in € per share)
Result for the period attributable to equity holders of Bekaert
Basic 0.59 3.66
Diluted 0.59 3.63
Press Release
2021 first half-year results
13 / 31
Note 2: Reported and Underlying
(in thousands of €) H1 2020 H1 2020 H1 2020 H1 2021 H1 2021 H1 2021
Reported
of which underlying
of which one-offs Reported
of which underlying
of which one-offs
Sales 1 769 909 1 769 909 - 2 306 150 2 306 150 -
Cost of sales -1 520 599 -1 517 539 -3 059 -1 847 309 -1 833 297 -14 012
Gross profit 249 310 252 370 -3 059 458 841 472 853 -14 012
Selling expenses -80 729 -80 888 160 -87 439 -88 358 919
Administrative expenses -59 594 -58 618 -976 -76 159 -78 130 1 971
Research and development expenses -25 514 -25 208 -306 -28 620 -29 493 873
Other operating revenues 10 810 10 640 170 32 211 15 429 16 781
Other operating expenses -7 266 -6 758 -508 -11 263 -6 925 -4 338
Operating result (EBIT) 87 017 91 537 -4 520 287 570 285 375 2 195
Press Release
2021 first half-year results
14 / 31
Note 3: One-off items
One-off items H1 2021 (in thousands of €)
Cost of Sales
Selling expenses
Admini- strative
expenses R&D
Other operating revenues
Other operating expenses Total
Restructuring programs by segment
Rubber Reinforcement9 291 402 -25 - - - 668
Steel Wire Solutions10 -849 -43 -63 - 5 043 -2 540 1 548
Specialty Businesses11 245 103 -49 5 193 -909 -412
Bridon-Bekaert Ropes Group (BBRG)12 -12 496 34 12 - 11 083 -475 -1 842
Group13 1 221 573 2 143 868 182 -313 4 674
Total restructuring programs -11 588 1 069 2 019 873 16 501 -4 238 4 636
Business disposals
Group14 - -150 - - - - -150
Total business disposals - -150 - - - - -150
Environmental provisions/ (reversals of provisions)
Bridon-Bekaert Ropes Group (BBRG)12 -2 328 - - - - - -2 328
Total environmental provisions/(reversals) -2 328 - - - - - -2 328
Other events and transactions
Steel Wire Solutions - - -23 - - - -23
Specialty Businesses -95 - - - - - -95
Group - - -25 - 280 -100 155
Total other events and transactions -95 - -48 - 280 -100 37
Total -14 012 919 1 971 873 16 781 -4 338 2 195
One-off items H1 2020 (in thousands of €)
Cost of Sales
Selling expenses
Admini- strative
expenses R&D
Other operating revenues
Other operating expenses Total
Restructuring programs by segment
Rubber Reinforcement9 -1 410 - - - - -52 -1 461
Steel Wire Solutions10 -88 125 -847 - 123 -39 -726
Specialty Businesses11 -1 523 -7 -11 - 19 -196 -1 718
Bridon-Bekaert Ropes Group (BBRG) 6 41 -81 - 56 - 22
Group -45 - 139 -306 - -222 -433
Intersegment - - - - -27 - -27
Total restructuring programs -3 059 160 -801 -306 170 -508 -4 344
Other events and transactions
Steel Wire Solutions - - -79 - - - -79
Bridon-Bekaert Ropes Group (BBRG) - - -43 - - - -43
Group - - -54 - - - -54
Total other events and transactions - - -176 - - - -176
Total -3 059 160 -976 -306 170 -508 -4 520
9 Related mainly to reversal of provisions in Figline plant (Italy) and Belgium (2021) and to the closure of Figline plant (Italy), Indirect Workforce
Program (Indonesia) (2020). 10 Related mainly to restructuring revenues and expenses in North America, reversal of provisions in Belgium and revenues in Malaysia (2021)
and lay-off expenses in Latin America, restructuring expenses and reversal impairment losses in North America (2020). 11 Related mainly to the restructuring in North America and Sawing Wire (2021) and the Dramix plant closure in Belgium (2020). 12 Related mainly to the restructuring in Canada (2021). 13 Related mainly to the restructuring in Belgium (2021). 14 Contractual liability indemnification related to previous divestments (2021).
Press Release
2021 first half-year results
15 / 31
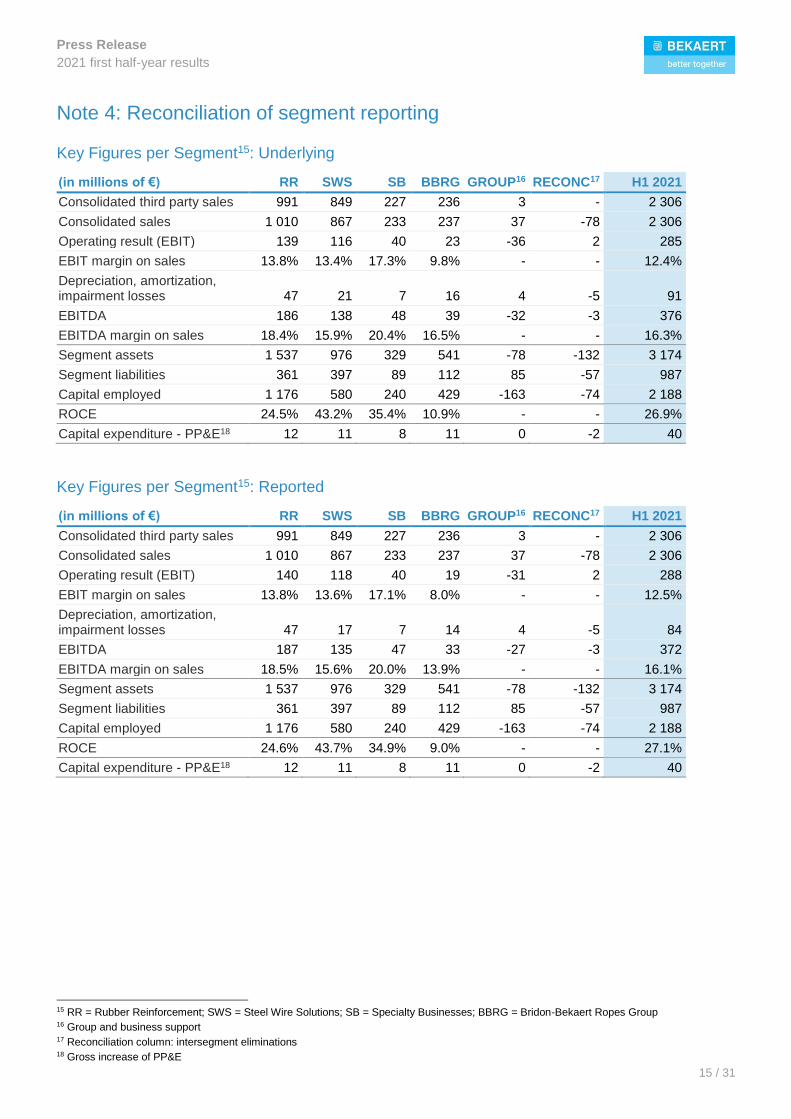
Note 4: Reconciliation of segment reporting
Key Figures per Segment15: Underlying
(in millions of €) RR SWS SB BBRG GROUP16 RECONC17 H1 2021
Consolidated third party sales 991 849 227 236 3 - 2 306
Consolidated sales 1 010 867 233 237 37 -78 2 306
Operating result (EBIT) 139 116 40 23 -36 2 285
EBIT margin on sales 13.8% 13.4% 17.3% 9.8% - - 12.4%
Depreciation, amortization, impairment losses 47 21 7 16 4 -5 91
EBITDA 186 138 48 39 -32 -3 376
EBITDA margin on sales 18.4% 15.9% 20.4% 16.5% - - 16.3%
Segment assets 1 537 976 329 541 -78 -132 3 174
Segment liabilities 361 397 89 112 85 -57 987
Capital employed 1 176 580 240 429 -163 -74 2 188
ROCE 24.5% 43.2% 35.4% 10.9% - - 26.9%
Capital expenditure - PP&E18 12 11 8 11 0 -2 40
Key Figures per Segment15: Reported
(in millions of €) RR SWS SB BBRG GROUP16 RECONC17 H1 2021
Consolidated third party sales 991 849 227 236 3 - 2 306
Consolidated sales 1 010 867 233 237 37 -78 2 306
Operating result (EBIT) 140 118 40 19 -31 2 288
EBIT margin on sales 13.8% 13.6% 17.1% 8.0% - - 12.5%
Depreciation, amortization, impairment losses 47 17 7 14 4 -5 84
EBITDA 187 135 47 33 -27 -3 372
EBITDA margin on sales 18.5% 15.6% 20.0% 13.9% - - 16.1%
Segment assets 1 537 976 329 541 -78 -132 3 174
Segment liabilities 361 397 89 112 85 -57 987
Capital employed 1 176 580 240 429 -163 -74 2 188
ROCE 24.6% 43.7% 34.9% 9.0% - - 27.1%
Capital expenditure - PP&E18 12 11 8 11 0 -2 40
15 RR = Rubber Reinforcement; SWS = Steel Wire Solutions; SB = Specialty Businesses; BBRG = Bridon-Bekaert Ropes Group 16 Group and business support 17 Reconciliation column: intersegment eliminations 18 Gross increase of PP&E
Press Release
2021 first half-year results
16 / 31
Key Figures per Segment19: Underlying
(in millions of €) RR SWS SB BBRG GROUP20 RECONC21 H1 2020
Consolidated third party sales 709 639 185 229 9 - 1 770
Consolidated sales 725 655 188 230 33 -61 1 770
Operating result (EBIT) 28 40 24 24 -28 3 92
EBIT margin on sales 3.9% 6.0% 12.9% 10.3% - - 5.2%
Depreciation, amortization, impairment losses 52 27 7 16 6 -5 103
EBITDA 81 67 31 39 -22 -2 194
EBITDA margin on sales 11.1% 10.2% 16.6% 17.2% - - 11.0%
Segment assets 1 359 849 317 546 60 -129 3 001
Segment liabilities 194 282 69 84 70 -37 663
Capital employed 1 165 566 248 462 -10 -92 2 338
ROCE 4.7% 13.7% 20.1% 10.0% - - 7.7%
Capital expenditure - PP&E22 17 7 11 3 0 -1 37
Key Figures per Segment19: Reported
(in millions of €) RR SWS SB BBRG GROUP20 RECONC21 H1 2020
Consolidated third party sales 709 639 185 229 9 - 1 770
Consolidated sales 725 655 188 230 33 -61 1 770
Operating result (EBIT) 27 39 23 24 -28 3 87
EBIT margin on sales 3.7% 5.9% 12.0% 10.3% - - 4.9%
Depreciation, amortization, impairment losses 52 25 7 16 6 -5 101
EBITDA 79 64 30 39 -23 -2 188
EBITDA margin on sales 10.9% 9.8% 15.7% 17.2% - - 10.6%
Segment assets 1 359 849 317 546 60 -129 3 001
Segment liabilities 194 282 69 84 70 -37 663
Capital employed 1 165 566 248 462 -10 -92 2 338
ROCE 4.5% 13.4% 18.7% 10.0% - - 7.3%
Capital expenditure - PP&E22 17 7 11 3 0 -1 37
19 RR = Rubber Reinforcement; SWS = Steel Wire Solutions; SB = Specialty Businesses; BBRG = Bridon-Bekaert Ropes Group 20 Group and business support 21 Reconciliation column: intersegment eliminations 22 Gross increase of PP&E
Press Release
2021 first half-year results
17 / 31
Note 5: Consolidated statement of comprehensive income
(in thousands of €) H1 2020 H1 2021
Result for the period 33 796 231 099
Other comprehensive income (OCI)
Other comprehensive income reclassifiable to income statement in subsequent periods
Exchange differences arising during the year -82 585 59 673
Reclassification adjustments relating to entity disposals or step acquisitions
- 100
OCI reclassifiable to income statement in subsequent periods, after tax
-82 585 59 773
Other comprehensive income non-reclassifiable to income statement in subsequent periods:
Remeasurement gains and losses on defined-benefit plans -8 111 29 818
Net fair value gain (+)/loss (-) on investments in equity instruments designated as at fair value through OCI
-41 1 345
Deferred taxes relating to non-reclassifiable OCI -2 535 -1 097
OCI non-reclassifiable to income statement in subsequent Periods, after tax
-10 687 30 067
Other comprehensive income for the period -93 272 89 840
TOTAL COMPREHENSIVE INCOME FOR THE PERIOD -59 476 320 939
Attributable to
equity holders of Bekaert -55 563 294 114
non-controlling interests -3 913 26 825
Press Release
2021 first half-year results
18 / 31
Note 6: Consolidated balance sheet
(in thousands of €) 31-Dec-20 30-Jun-21
Non-current assets 1 822 503 1 854 600
Intangible assets 54 664 56 883
Goodwill 149 398 149 908
Property, plant and equipment 1 191 781 1 182 317
RoU Property, plant and equipment 132 607 131 916
Investments in joint ventures and associates 123 981 161 142
Other non-current assets 45 830 53 944
Deferred tax assets 124 243 118 491
Current assets 2 465 597 2 510 426
Inventories 683 477 895 781
Bills of exchange received 54 039 41 762
Trade receivables 587 619 692 208
Other receivables 101 330 132 869
Short-term deposits 50 077 50 080
Cash and cash equivalents 940 416 649 037
Other current assets 41 898 47 758
Assets classified as held for sale 6 740 931
Total 4 288 100 4 365 026
Equity 1 535 055 1 817 068
Share capital 177 812 177 812
Share premium 37 884 37 884
Retained earnings 1 614 781 1 776 573
Other Group reserves -382 597 -286 725
Equity attributable to equity holders of Bekaert 1 447 880 1 705 544
Non-controlling interests 87 175 111 524
Non-current liabilities 1 163 759 1 134 242
Employee benefit obligations 130 948 96 938
Provisions 25 166 26 644
Interest-bearing debt 968 076 964 470
Other non-current liabilities 1 231 945
Deferred tax liabilities 38 337 45 245
Current liabilities 1 589 286 1 413 716
Interest-bearing debt 641 655 269 883
Trade payables 668 422 839 323
Employee benefit obligations 149 793 149 634
Provisions 11 421 5 919
Income taxes payable 53 543 71 746
Other current liabilities 64 451 77 211
Liabilities associated with assets classified as held for sale - -
Total 4 288 100 4 365 026
Press Release
2021 first half-year results
19 / 31
Note 7: Consolidated statement of changes in equity
Attributable to equity holders of Bekaert
(in thousands of €) Share
capital Share
premium Retained earnings
Treasury shares
Cumulative translation
adjustments Other
reserves Total
Non- controlling
interests Total
equity
Balance as at 1 January 2020 177 793 37 751 1 492 022 -107 463 -113 964 -51 029 1 435 110 96 430 1 531 540
Result for the period - - 33 354 - - - 33 354 442 33 796
Other comprehensive income - - - - -78 658 -10 259 -88 917 -4 355 -93 272
Effect of NCI purchase - - -502 - - - -502 -8 468 -8 970
Equity-settled share-based payment plans - - 6 109 - - - 6 109 - 6 109
Treasury shares transactions - - -201 551 - - 350 - 350
Dividends - - -19 787 - - - -19 787 -1 291 -21 079
Balance as at 30 June 2020 177 793 37 751 1 510 995 -106 912 -192 622 -61 288 1 365 717 82 758 1 448 475
Balance as at 1 January 2021 177 812 37 884 1 614 781 -106 148 -227 823 -48 626 1 447 880 87 175 1 535 055
Result for the period - - 208 059 - - - 208 059 23 040 231 099
Other comprehensive income - - - - 56 740 29 315 86 055 3 785 89 840
Equity-settled share-based payment plans - - 8 691 - - - 8 691 - 8 691
Treasury shares transactions - - 1 838 9 816 - - 11 654 - 11 654
Dividends - - -56 795 - - - -56 795 -2 475 -59 271
Balance as at 30 June 2021 177 812 37 884 1 776 573 -96 332 -171 082 -19 311 1 705 544 111 524 1 817 068
Press Release
2021 first half-year results
20 / 31
Note 8: Consolidated cash flow statement
(in thousands of €) H1 2020 H1 2021
Operating result (EBIT) 87 017 287 570
Non-cash items included in operating result 114 346 97 842
Investing items included in operating result -136 -13 327
Amounts used on provisions and employee benefit obligations -26 674 -23 444
Income taxes paid -25 327 -43 348
Gross cash flows from operating activities 149 225 305 293
Change in operating working capital -32 836 -107 691
Other operating cash flows -5 674 -16 823
Cash flows from operating activities 110 715 180 779
New business combinations -767 -
Other portfolio investments - -39
Proceeds from disposal of investments - -85
Dividends received 3 275 9 846
Purchase of intangible assets -781 -4 546
Purchase of property, plant and equipment -49 290 -45 887
Proceeds from disposals of fixed assets 545 24 234
Cash flows from investing activities -47 018 -16 476
Interest received 1 345 1 986
Interest paid -18 103 -13 790
Gross dividends paid 301 -59 896
Proceeds from long-term interest-bearing debt 12 762 7 204
Repayment of long-term interest-bearing debt -78 086 -402 271
Cash flows from / to (-) short-term interest-bearing debt 305 301 -10 484
Treasury shares transactions 350 11 654
Sales and purchases of NCI -8 970 -
Other financing cash flows -2 025 -1 934
Cash flows from financing activities 212 875 -467 530
Net increase or decrease (-) in cash and cash equivalents 276 572 -303 227
Cash and cash equivalents at the beginning of the period 566 176 940 416
Effect of exchange rate fluctuations -9 055 11 848
Cash and cash equivalents at the end of the period 833 692 649 037
Press Release
2021 first half-year results
21 / 31
Note 9: Additional key figures
(in € per share) H1 2020 H1 2021
Number of existing shares at 30 June 60 408 441 60 414 841
Book value 22.61 28.23
Share price at 30 June 17.45 37.58
Weighted average number of shares
Basic 56 543 997 56 813 437
Diluted 56 594 082 57 322 432
Result for the period attributable to equity holders of Bekaert
Basic 0.59 3.66
Diluted 0.59 3.63
(in thousands of € - ratios) H1 2020 H1 2021
EBITDA 187 797 371 614
EBITDA - Underlying 194 256 376 232
Depreciation and amortization and impairment losses 100 780 84 044
Capital employed 2 338 479 2 187 609
Operating working capital 720 248 666 585
Net debt 954 941 519 228
EBIT on sales 4.9% 12.5%
EBIT - Underlying on sales 5.2% 12.4%
EBITDA on sales 10.6% 16.1%
EBITDA - Underlying on sales 11.0% 16.3%
Equity on total assets 33.3% 41.6%
Gearing (net debt on equity) 65.9% 28.6%
Net debt on EBITDA 2.5 0.7
Net debt on EBITDA - Underlying 2.5 0.7
NV Bekaert SA - Statutory Profit and Loss Statement
(in thousands of €) H1 2020 H1 2021
Sales 141 144 192 858
Operating result before non-recurring items 5 023 37 717
Non-recurring operational items 259 -150
Operating result after non-recurring items 5 283 37 566
Financial result before non-recurring items -36 951 28 774
Non-recurring financial items -348 -809
Financial result after non-recurring items -37 299 27 965
Profit before income taxes -32 017 65 532
Income taxes 1 156 985
Result for the period -30 860 66 516
Press Release
2021 first half-year results
22 / 31
Note 10: Additional disclosures on disaggregation of revenues
The Group recognizes revenue from the following sources: delivery of products and, to a limited extend, of services
and construction contracts. Bekaert assessed that the delivery of products represents the main performance
obligation. The Group recognizes revenue at a point in time when it transfers control over a product to a customer.
Customers obtain control when the products are delivered (based on the related inco terms in place). The amount
of revenue recognized is adjusted for volume discounts. No adjustment is made for return nor for warranty as the
impact is deemed immaterial based on historical information.
In the following table, net sales is disaggregated by industry, as this analysis is often presented in press releases,
shareholders’ guides and other presentations. The table includes a reconciliation of the net sales by industry with
the Group’s operating segments.
H1 2020
in thousands of €
Rubber
Reinforcement
Steel Wire
Solutions
Specialty
Businesses BBRG Group Consolidated
Industry
Tire & Automotive 668 988 61 141 16 058 - - 746 187
Energy & Utilities - 96 693 20 181 43 925 - 160 799
Construction - 173 675 127 246 33 563 - 334 485
Consumer Goods - 48 559 - - - 48 559
Agriculture - 128 145 - - - 128 145
Equipment 39 642 40 496 - 59 816 8 761 * 148 715
Basic Materials - 90 542 17 137 69 275 - 176 954
Other - - 4 055 22 010 - 26 065
Total 708 630 639 252 184 678 228 588 8 761 1 769 909
H1 2021
in thousands of €
Rubber
Reinforcement
Steel Wire
Solutions
Specialty
Businesses BBRG Group Consolidated
Industry
Tire & Automotive 938 383 84 570 18 599 4 266 - 1 045 818
Energy & Utilities - 107 668 10 918 38 389 - 156 975
Construction - 268 145 166 194 35 306 - 469 645
Consumer Goods - 63 241 1 968 - - 65 209
Agriculture - 144 756 - 19 056 - 163 812
Equipment 52 788 44 319 1 945 70 919 3 322 * 173 293
Basic Materials - 135 970 27 649 67 779 - 231 398
Total 991 171 848 669 227 273 235 715 3 322 2 306 150
* Sales engineering
Press Release
2021 first half-year results
23 / 31
Note 11: Additional disclosures on fair value of financial instruments
In accordance with IFRS23, specific interim disclosures are required regarding the fair value of each class of
financial assets and financial liabilities and the way their fair value was measured.
The following tables list the different classes of financial assets and financial liabilities with their carrying amounts in
the balance sheet and their respective fair value and analyzed by their measurement category under IFRS 9.
Cash and cash equivalents, short-term deposits, trade and other receivables, bills of exchange received, loans and
receivables primarily have short terms to maturity; hence, their carrying amounts at the reporting date approximate
the fair values. For the same reason, the carrying amounts of trade and other payables also approximate their fair
values. Furthermore, the Group has no exposure to collateralized debt obligations (CDOs).
Abbreviations used are explained below:
Abbreviation Category in accordance with IFRS 9
AC Financial assets or financial liabilities at amortized cost
FVTOCI/Eq Equity instruments designated as at fair value through OCI
FVTPL/Mnd
Financial assets mandatorily measured at fair value through profit
or loss
HfT Financial liabilities Held for Trading
FVO Fair Value Option: financial liabilities designated as at fair value
through profit or loss
23 IAS 34, Interim Reporting, §16(j), referring to IFRS 7, Financial Instruments: Disclosures, §§ 25, 26 and 28-30, and to IFRS 13, Fair Value
Measurement, §§ 91-93(h), 94-96, 98 and 99.
Press Release
2021 first half-year results
24 / 31
(in thousands of €)
Carrying amount vs fair value
Category in
accordance
with IFRS 9
Carrying
amount Fair value
Carrying
amount Fair value
Assets
Non-current financial assets
- Financial & other receivables
and cash guarantees AC 10 365 10 365 12 236 12 236
- Equity investments FVTOCI/Eq 13 372 13 372 14 771 14 771
- Derivatives
- Held for trading FVTPL/Mnd 3 762 3 762 9 644 9 644
Current financial assets
- Financial receivables and cash
guarantees AC 7 707 7 707 6 150 6 150
- Cash and cash equivalents AC 940 416 940 416 649 037 649 037
- Short term deposits AC 50 077 50 077 50 080 50 080
- Trade receivables AC 587 619 587 619 692 208 692 208
- Bills of exchange received AC 54 039 54 039 41 762 41 762
- Other current assets
- Other receivables AC 17 830 17 830 29 722 29 722
- Derivatives
- Held for trading FVTPL/Mnd 5 250 5 250 1 641 1 641
Liabilities
Non-current interest-bearing debt
- Leases liabilities AC 60 760 60 760 58 574 58 574
- Cash guarantees received AC 171 171 174 174
- Credit institutions AC 187 511 187 511 185 955 185 955
- Schuldschein loans AC 319 635 319 635 319 768 319 768
- Bonds AC 400 000 401 693 400 000 396 811
Current interest-bearing debt
- Leases liabilities AC 19 746 19 746 20 167 20 167
- Credit institutions AC 246 817 246 817 249 716 249 716
- Bonds AC 375 092 377 929 - -
Other non-current liabilities
- Other derivatives HfT 1 081 1 081 795 795
- Other payables AC 150 150 150 150
Trade payables AC 668 422 668 422 839 323 839 323
Other current liabilities
- Conversion option HfT 34 34 - -
- Other payables AC 25 621 25 621 36 283 36 283
- Derivatives
- Held for trading HfT 1 851 1 851 876 876
Aggregated by category in accordance with IFRS 9
Financial assets AC 1 668 053 1 668 053 1 481 194 1 481 194
FVTOCI/Eq 13 372 13 372 14 771 14 771
FVTPL/Mnd 9 012 9 012 11 285 11 285
Financial liabilities AC 2 303 925 2 308 454 2 110 109 2 106 920
HfT 2 967 2 967 1 670 1 670
FVTPL - - - -
31-Dec-20 30-Jun-21
Press Release
2021 first half-year results
25 / 31
Financial instruments by fair value measurement hierarchy
The fair value measurement of financial assets and financial liabilities can be characterized in one of the following ways:
- ‘Level 1’ fair value measurement: the fair values of financial assets and liabilities with standard terms and conditions and traded on active liquid markets are determined with reference to quoted market prices in active markets for identical assets and liabilities. This mainly relates to financial assets at fair value through other comprehensive income such as the investment in Shougang Concord Century Holdings Ltd.
- ‘Level 2’ fair value measurement: the fair values of other financial assets and financial liabilities are determined in accordance with generally accepted pricing models based on discounted cash flow analysis using prices from observable current market transactions and dealer quotes for similar instruments. This mainly relates to derivative financial instruments. Forward exchange contracts are measured using quoted forward-exchange rates and yield curves derived from quoted interest rates matching the maturities. Interest-rate swaps are measured at the present value of future cash flows estimated and discounted using the applicable yield curves derived from quoted interest rates. The fair value measurement of cross-currency interest-rate swaps is based on discounted estimated cash flows using quoted forward exchange rates, quoted interest rates and applicable yield curves derived therefrom.
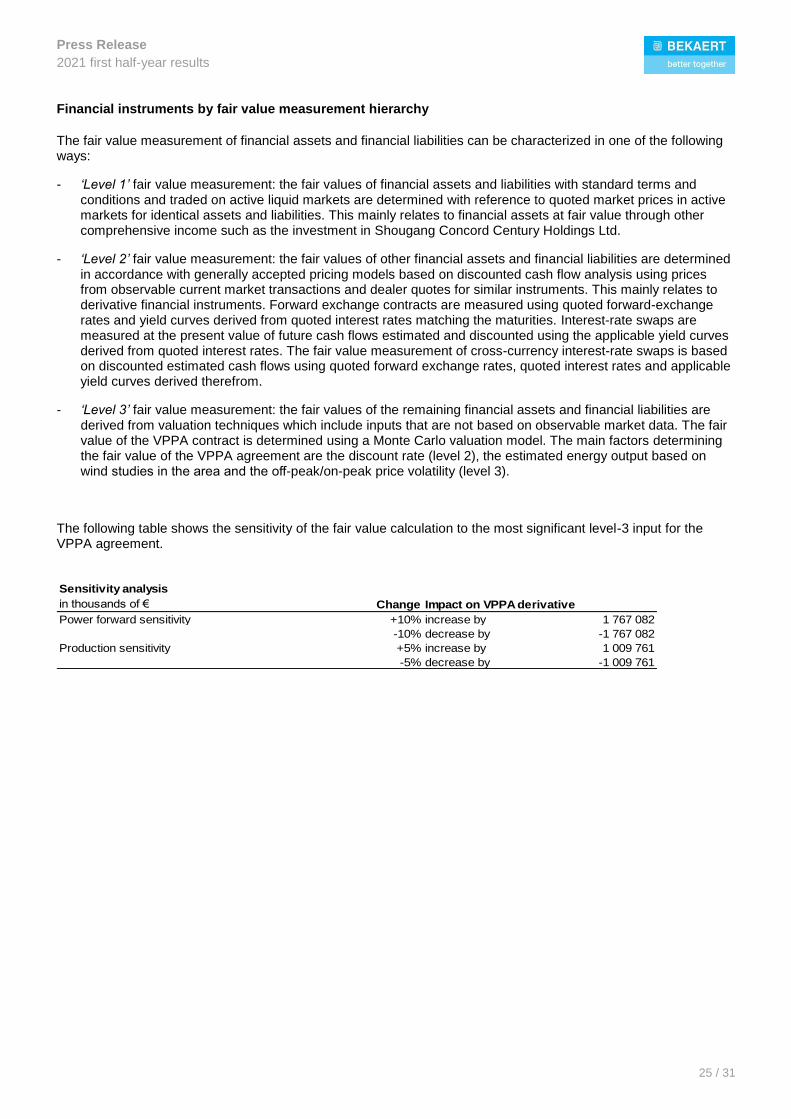
- ‘Level 3’ fair value measurement: the fair values of the remaining financial assets and financial liabilities are derived from valuation techniques which include inputs that are not based on observable market data. The fair value of the VPPA contract is determined using a Monte Carlo valuation model. The main factors determining the fair value of the VPPA agreement are the discount rate (level 2), the estimated energy output based on wind studies in the area and the off-peak/on-peak price volatility (level 3).
The following table shows the sensitivity of the fair value calculation to the most significant level-3 input for the VPPA agreement.
Sensitivity analysis
in thousands of € Change Impact on VPPA derivative
Power forward sensitivity +10% increase by 1 767 082
-10% decrease by -1 767 082
Production sensitivity +5% increase by 1 009 761
-5% decrease by -1 009 761
Press Release
2021 first half-year results
26 / 31
The following table provides an analysis of financial instruments measured at fair value in the balance sheet, in accordance with the fair value measurement hierarchy described above:
2020
in thousands of € Level 1 Level 2 Level 3 Total
Financial assets mandatorily measured as at fair
value through profit or loss
Derivative financial assets - 5 834 3 178 9 012
Equity instruments designated as at fair value
through OCI
Equity investments 5 833 7 538 - 13 372
Total assets 5 833 13 372 3 178 22 384
Financial liabilities held for trading
Conversion option - - 34 34
Other derivative financial liabilities - 2 932 - 2 932
Total liabilities - 2 932 34 2 967
H1 2021
in thousands of € Level 1 Level 2 Level 3 Total
Financial assets mandatorily measured as at fair
value through profit or lossDerivative financial assets - 1 944 9 340 11 285
Equity instruments designated as at fair value
through OCIEquity investments 6 057 8 714 - 14 771
Total assets 6 057 10 658 9 340 26 055
Financial liabilities held for trading
Conversion option - - - -
Other derivative financial liabilities - 1 670 - 1 670
Total liabilities - 1 670 - 1 670
Press Release
2021 first half-year results
27 / 31
Note 12: Other disclosures
Treasury shares
Between 1 January 2021 and 30 June 2021, a total of 437 108 stock options were exercised under Stock Option
Plan 2010-2014, Stock Option Plan 2015-2017 and Stock Option Plan 2 and 437 108 own shares were used for
that purpose. Bekaert sold 9 112 own shares to members of the Bekaert Group Executive in the framework of the
Bekaert Personal Shareholding Requirement Plan and granted 10 940 own shares to non-executive Directors of
Bekaert as remuneration for the performance of duties. As a result, Bekaert owned 3 352 374 treasury shares on
30 June 2021.
Related parties
There were no other related parties transactions or changes that could materially affect the financial position or
results of the Group.
Accounting policies
These unaudited and condensed consolidated interim financial statements have been prepared in accordance with
IAS 34 – Interim Financial Reporting. This interim report only provides an explanation of events and transactions
that are significant to understand the changes in financial position and financial performance since the last annual
reporting period. It should therefore be read in conjunction with the consolidated financial statements for the
financial year ended on December 31, 2020, which have been prepared in accordance with International Financial
Reporting Standards (IFRSs) as issued by the International Accounting Standards Board (IASB) and adopted by
the European Union.
In preparing this interim report, the same accounting policies and methods of computation have been used as in
the 2020 annual consolidated financial statements. For an overview of the IFRS standards, amendments and
interpretations that have become effective in 2021, we refer to the Statement of Compliance (section 2.1) of the
financial review in the 2020 Annual Report.
Subsequent events
The integration of the merged Almasa business with Proalco SAS (Colombia) is projected to add € 11 million in
revenue in the second half of the year.
End of July a plot of land situated in Zwevegem (Belgium) was divested to the private limited company incorporated
under Belgian law "L.H.Z.". The proceeds from this transaction were € 5.9 million and the consolidated gain (EBIT-
underlying) amounted to € 5.8 million.
Press Release
2021 first half-year results
28 / 31
Note 13: Alternative performance measures: definitions and reasons for use
Metric Definition Reason for use
Capital employed
(CE)
Working capital + net intangible assets + net goodwill +
net property, plant and equipment + net RoU Property,
plant and equipment. The weighted average CE is
weighted by the number of periods that an entity has
contributed to the consolidated result.
Capital employed consists of the main balance sheet items that operating
management can actively and effectively control to optimize its financial
performance, and serves as the denominator of ROCE.
Capital ratio
(financial autonomy)
Equity relative to total assets. This ratio provides a measure of the extent to which the Group is equity-
financed.
Current ratio Current assets to Current liabilities. This ratio provides a measure for the liquidity of the company. It measures
whether a company has enough resources to meet it short-term obligations.
Combined figures Sum of consolidated companies + 100% of joint
ventures and associates after elimination of
intercompany transactions (if any). Examples: sales,
capital expenditure, number of employees.
In addition to Consolidated figures, which only comprise controlled
companies, combined figures provide useful insights of the actual size and
performance of the Group including its joint ventures and associates.
EBIT Operating result (earnings before interest and
taxation).
EBIT consists of the main income statement items that operating
management can actively and effectively control to optimize its profitability,
and a.o. serves as the numerator of ROCE and EBIT interest coverage.
EBIT – underlying EBIT before operating income and expenses that are
related to restructuring programs, impairment losses,
business combinations, business disposals,
environmental provisions or other events and
transactions that have a material one-off effect that is
not inherent to the business.
EBIT – underlying is presented to enhance the reader’s understanding of the
operating profitability before one-off items, as it provides a better basis for
comparison and extrapolation.
EBITDA Operating result (EBIT) + depreciation, amortization
and impairment of assets + negative goodwill.
EBITDA provides a measure of operating profitability before non-cash effects
of past investment decisions and working capital assets.
EBITDA – underlying EBITDA before operating income and expenses that
are related to restructuring programs, impairment
losses, business combinations, business disposals,
environmental provisions or other events and
transactions that have a material one-off effect that is
not inherent to the business.
EBITDA – underlying is presented to enhance the reader’s understanding of
the operating profitability before one-off items and non-cash effects of past
investment decisions and working capital assets, as it provides a better basis
for comparison and extrapolation.
EBIT interest
coverage
Operating result (EBIT) divided by net interest
expense.
The EBIT interest coverage provides a measure of the Group’s capability to
service its debt through its operating profitability.
Free Cash Flow
(FCF)
Cash flows from Operating activities - capex +
dividends received - net interest paid
Free cash flow (FCF) represents the cash available for the company to repay
financial debt or pay dividends to investors.
Gearing Net debt relative to equity. Gearing is a measure of the Group's financial leverage and shows the extent
to which its operations are funded by lenders versus shareholders.
Margin on sales EBIT, EBIT-underlying, EBITDA and EBITDA-
underlying on sales.
Each of these ratios provides a specific measure of operating profitability
expressed as a percentage on sales.
Net capitalization Net debt + equity. Net capitalization is a measure of the Group’s total financing from both
lenders and shareholders.
Net debt Interest-bearing debt net of current loans, non-current
financial receivables and cash guarantees, short-term
deposits, cash and cash equivalents.
Net debt is a measure of debt after deduction of financial assets that can be
deployed to repay the gross debt.
Net debt on EBITDA
Net debt divided by EBITDA. Net debt on EBITDA provides a measure of the Group’s capability (expressed
as a number of years) to repay its debt through its operating profitability.
Operating free cash
flow
Cash flows from Operating activities – capex (net of
disposals of fixed assets)
Operating cash flow measures the net cash required to support the business
(working capital and capital expenditure needs).
Return on capital
employed (ROCE)
Operating result (EBIT) relative to the weighted
average capital employed.
ROCE provides a measure of the Group’s operating profitability relative to the
capital resources deployed and managed by operating management.
Return on equity
(ROE)
Result for the period relative to average equity. ROE provides a measure of the Group’s net profitability relative to the capital
resources provided by its shareholders.
WACC Cost of debt and cost of equity weighted with a target
gearing of 50% (net debt/equity structure) after tax.
WACC is used to assess an investor’s return on an investment in the
Company.
Working capital
(operating)
Inventories + trade receivables + bills of exchange
received + advanced paid - trade payables - advances
received - remuneration and social security payables -
employment-related taxes.
Working capital includes all current assets and liabilities that operating
management can actively and effectively control to optimize its financial
performance. It represents the current component of capital employed.
Press Release
2021 first half-year results
29 / 31
APM reconciliation table
in millions of EUR H1 2020 FY 2020 H1 2021
Net debt
Non-current interest-bearing debt 784 968 964
Current interest-bearing debt 1 070 642 270
Total financial debt 1 854 1 610 1 234
Non-current financial receivables and cash guarantees -7 -7 -10
Current loans -8 -8 -6
Short-term deposits -50 -50 -50
Cash and cash equivalents -834 -940 -649
Net debt 955 604 519
Capital employed
Intangible assets 54 55 57
Goodwill 149 149 150
Property, plant and equipment 1 271 1 192 1 182
RoU Property plant and equipment 144 133 132
Working capital (operating) 720 535 667
Capital employed 2 338 2 063 2 188
Weighted average capital employed 1 187 2 235 1 063
Working capital (operating)
Inventories 757 683 896
Trade receivables 562 588 692
Bills of exchange received 49 54 42
Advances paid 15 19 24
Trade payables -540 -668 -839
Advances received -12 -16 -17
Remuneration and social security payables -103 -116 -125
Employment-related taxes -8 -9 -6
Working capital (operating) 720 535 667
EBIT Underlying to EBIT Note 2 - 3 press release
EBITDA
EBIT 87 257 288
Amortization intangible assets 5 10 5
Depreciation property, plant & equipment 83 161 76
Depreciation RoU property, plant & equipment 12 24 12
Write-downs/(reversals of write-downs) on inventories and receivables
2 7 -6
Impairment losses/ (reversals of depreciation and impairment losses) on fixed assets
-1 14 -2
EBITDA 188 473 372
Press Release
2021 first half-year results
30 / 31
in millions of EUR H1 2020 FY 2020 H1 2021
EBITDA - Underlying
EBIT - Underlying 92 272 285
Amortization intangible assets 5 10 5
Depreciation property, plant & equipment 83 161 76
Depreciation RoU property, plant & equipment 12 24 12
Write-downs/(reversals of write-downs) on inventories and receivables
2 7 -1
Impairment losses/ (reversals of impairment losses) on fixed assets
0 5 0
EBITDA - Underlying 194 479 376
ROCE
EBIT 87 257 288
Weighted average capital employed 1 187 2 235 1 063
ROCE 7.3% 11.5% 27.1%
EBIT interest coverage
EBIT 87 257 288
(Interest income) -1 -3 -2
Interest expense 29 60 25
(interest element of discounted provisions) -1 -3 -1
Net interest expense 27 53 22
EBIT interest coverage 3.2 4.8 13.0
ROE (return on equity)
Result for the period 34 148 231
Average equity 1 490 1 533 1 676
ROE 4.5% 9.7% 27.6%
Capital ratio (Financial autonomy)
Equity 1 448 1 535 1 817
Total assets 4 348 4 288 4 365
Financial autonomy 33.3% 35.8% 41.6%
Gearing
Net debt 955 604 519
Equity 1 448 1 535 1 817
Gearing (net debt on equity) 65.9% 39.4% 28.6%
Net debt on EBITDA
Net debt 955 604 519
EBITDA 188 473 372
Net debt on EBITDA (annualized) 2.5 1.3 0.7
Press Release
2021 first half-year results
31 / 31
in millions of EUR H1 2020 FY 2020 H1 2021
Net debt on EBITDA - Underlying
Net debt 955 604 519
EBITDA-Underlying 194 479 376
Net debt on EBITDA-underlying (annualized) 2.5 1.3 0.7
Current Ratio
Current Assets 2 409 2 466 2 510
Current Liabilities 1 908 1 589 1 414
Current Ratio 1.3 1.6 1.8
Operating free cash flow
Cash flow from operating activities 111 505 181
Purchase of intangibe assets -1 -3 -5
Purchase of PP&E -49 -104 -46
Purchase of RoU Land - - -
Proceeds from disposals of fixed assets 1 52 24
Operating free cash flow 61 449 155
Free Cash Flow (FCF)
Cash flow from operating activities 111 505 181
Purchase of intangibe assets -1 -3 -5
Purchase of PP&E -49 -104 -46
Purchase of RoU Land - - -
Dividens received 3 25 10
Interests received 1 3 2
Interest paid -18 -43 -14
Free Cash Flow 47 383 128