65
2021 Q1 REPORT Management’s Discussion & Analysis 1 Financial Statements 35

2021 Q1 REPORT
Management’s Discussion & Analysis 1
Financial Statements 35

MANAGEMENT'S DISCUSSION AND ANALYSIS OF FINANCIAL POSITION AND RESULTS OF OPERATIONSFirst Quarter Ended March 31, 2021
INDEX
Introduction 2About IAMGOLD 2Financial and Operating Highlights 3Key Strategic Objectives 8Environmental, Social and Governance 9Outlook 11Quarterly Updates
Operating and Financial PerformanceNorth America 12South America 16West Africa 18
Discontinued Operations 20Exploration 21
Financial ConditionLiquidity and Capital Resources 21Cash Flow 23Market Trends 23Market Risk 24Shareholders’ Equity 26
Quarterly Financial Review 26Disclosure Controls and Procedures and Internal Control over Financial Reporting 26Critical Judgments, Estimates and Assumptions 27New Accounting Standards 27Risks and Uncertainties 27Non-GAAP Performance Measures 29Cautionary Statement on Forward-Looking Information 34
IAMGOLD CORPORATIONFirst Quarter 2021 Management’s Discussion and Analysis 1

INTRODUCTION
The following Management’s Discussion and Analysis (“MD&A”) of IAMGOLD Corporation (“IAMGOLD” or the “Company”), dated May 3, 2021, is intended to supplement and complement the unaudited condensed consolidated interim financial statements and notes thereto as at and for the three months ended March 31, 2021 ("consolidated interim financial statements"). This MD&A should be read in conjunction with IAMGOLD's audited annual consolidated financial statements and related notes as at and for the fiscal year ended December 31, 2020 and the related MD&A included in the 2020 annual report. All figures in this MD&A are in U.S. dollars and tabular dollar amounts are in millions, unless stated otherwise. Additional information on IAMGOLD can be found at www.iamgold.com.
ABOUT IAMGOLD
IAMGOLD is a mid-tier gold mining company operating in three regions globally: North America, South America and West Africa. Within these regions the Company is developing high potential mining districts that encompass operating mines, construction, development, and exploration projects. The Company’s operating mines include Westwood in Canada, Rosebel (including Saramacca) in Suriname and Essakane in Burkina Faso. A solid base of strategic assets is complemented by the Côté Gold construction project in Canada, the Boto Gold development project in Senegal, as well as greenfield and brownfield exploration projects in various countries located in the Americas and West Africa. IAMGOLD employs approximately 5,000 people. IAMGOLD is committed to maintaining its culture of accountable mining through high standards of Environmental, Social and Governance ("ESG") practices, including its commitment to Zero Harm®, in every aspect of its business. IAMGOLD (www.iamgold.com) is listed on the New York Stock Exchange (NYSE:IAG) and the Toronto Stock Exchange (TSX:IMG) and is one of the companies on the JSI index1.
______________________________1 Jantzi Social Index (“JSI”). The JSI is a socially screened market capitalization-weighted common stock index modeled on the S&P/TSX 60. It consists of
companies which meet a set of broadly based environmental, social and governance rating criteria.
IAMGOLD CORPORATIONFirst Quarter 2021 Management’s Discussion and Analysis 2

FINANCIAL AND OPERATING HIGHLIGHTS
In the first quarter 2021, the Company made good progress toward its operating and development goals. The operations generated $89.5 million in mine-site free cash flow and available liquidity at the end of the quarter was approximately $1.5 billion. Production was strong at Essakane and as expected at Westwood’s Grand Duc open pit, with Rosebel and the Saramacca satellite deposit impacted by unusually heavy seasonal rains and COVID-19 restrictions. The carbon-in-leach ("CIL") mill upgrade at Essakane was completed and camp expansions at Rosebel continue. Major earthworks started ahead of schedule at the Côté Gold construction project, with the project achieving 18% completion by March 31, 2021. The Boto Gold development project continues to be de-risked with the advancement of essential infrastructure work, including the access road and camp construction. The following table summarizes certain operating and financial results for the three months ended March 31, 2021, December 31, 2020 and March 31, 2020.
Q1 2021 Q4 2020 Q1 2020
Key Operating StatisticsGold production – attributable (000s oz) 156 169 170 Gold sales – attributable (000s oz) 153 172 159 Average realized gold price1 ($/oz) $ 1,781 $ 1,865 $ 1,603 Cost of sales2 ($/oz) $ 1,075 $ 1,045 $ 1,054 Total cash costs1 ($/oz) $ 1,052 $ 998 $ 993 All-in sustaining costs1 ($/oz) $ 1,238 $ 1,294 $ 1,230 Gold margin1 ($/oz) $ 729 $ 867 $ 610
Financial Results3 ($ millions, except where noted)Revenues $ 297.4 $ 347.5 $ 274.5 Gross profit $ 44.2 $ 84.0 $ 31.9 Net earnings (loss) attributable to equity holders $ 19.5 $ 59.0 $ (34.4) Net earnings (loss) per share attributable to equity holders $ 0.04 $ 0.12 $ (0.07) Adjusted net earnings (loss) attributable to equity holders1 $ 6.2 $ 19.1 $ (4.9) Adjusted net earnings (loss) per share attributable to equity holders1 $ 0.01 $ 0.04 $ (0.01) Net cash from operating activities $ 101.7 $ 128.7 $ 44.0 Net cash from operating activities before changes in working capital1 $ 82.5 $ 108.0 $ 72.8 Mine-site free cash flow1 $ 89.5 $ 77.7 $ 14.1 Capital expenditures4 – sustaining $ 13.7 $ 27.3 $ 14.8 Capital expenditures4 – expansion $ 88.8 $ 79.1 $ 52.7
Financial Position ($ millions)Cash, cash equivalents and short-term investments $ 967.8 $ 947.5 $ 802.2 Long-term debt $ 466.7 $ 466.6 $ 419.1 Available credit facility $ 498.2 $ 498.3 $ 499.6
1 Throughout this MD&A, gold margin, net cash flow from operating activities before changes in working capital, mine-site free cash flow, average realized gold price per ounce sold, adjusted net earnings (loss) attributable to equity holders, total cash costs per ounce produced, and all-in sustaining costs per ounce sold are non-GAAP financial performance measures with no standard meaning under International Financial Reporting Standards ("IFRS"), and are further discussed in the non-GAAP performance measures section.
2 Throughout this MD&A, cost of sales, excluding depreciation, as disclosed in note 30 of the consolidated interim financial statements, is expressed on an attributable ounce sold basis (excluding the non-controlling interests of 10% at Essakane and 5% at Rosebel).
3 Financial results from continuing operations.4 Throughout this MD&A, capital expenditures represent cash expenditures for property, plant and equipment and exploration and evaluation assets.
IAMGOLD CORPORATIONFirst Quarter 2021 Management’s Discussion and Analysis 3

Attributable Gold Production (000s oz)
102 10384
47 5264
714 22
156169 170
Essakane Rosebel Westwood
Q1 2021 Q4 2020 Q1 2020
Gross Margin
$297.4$347.5
$274.5$253.2 $263.5 $242.6
15%24%
12%
Revenue ($ millions) Cost of sales ($ millions) Gross margin (%)
Q1 2021 Q4 2020 Q1 2020
Q1 2021 vs Q4 2020 Revenues($ millions)
$347.5
$(14.0)$(35.4) $(0.7)
$297.4
Q4 2020 Price Volume Other Q1 2021
Q1 2021 vs Q1 2020 Revenues($ millions)
$274.5
$29.7
$(5.6) $(1.2)
$297.4
Q1 2020 Price Volume Other Q1 2021
Cost of sales¹, Total cash costs² andAll-in sustaining costs²
$1,075 $1,045 $1,054$1,052$998 $993
$1,238$1,294
$1,230
156169 170
153172
159
Cost of sales¹ ($/oz) Total cash costs² ($/oz)All-in sustaining costs² ($/oz) Attributable production (000s oz)Attributable sales (000s oz)
Q1 2021 Q4 2020 Q1 2020
Net cash from operating activities andMine-site free cash flow²
$101.7
$128.7
$44.0
$89.5$77.7
$14.1
$1,781 $1,865
$1,603
Net cash from operating activities ($ millions)Mine-site free cash flow² ($ millions)Average realized gold price² ($/oz)
Q1 2021 Q4 2020 Q1 2020
______________________________1 Cost of sales, excluding depreciation, is on an attributable ounce sold basis (excluding the non-controlling interests of 10% at Essakane and 5% at Rosebel).2 This is a non-GAAP measure. Refer to the non-GAAP performance measures section of this MD&A.
IAMGOLD CORPORATIONFirst Quarter 2021 Management’s Discussion and Analysis 4

Q1 2021 vs Q4 2020 All-in sustaining costs¹($/oz)
$1,294
$(119)$(81)
$144
$1,238
Q4 2020 Operatingand
OtherCost
SustainingCapex
SalesVolume
Q1 2021
Q1 2021 vs Q1 2020 All-in sustaining costs¹($/oz)
$1,230
$(26) $(8)
$42
$1,238
Q1 2020 Operatingand
OtherCost
SustainingCapex
SalesVolume
Q1 2021
Q1 2021 vs Q4 2020 Mine-site free cash flow¹ ($ millions)
$77.7
$(10.7)
$22.5
$89.5
Q4 2020 Mine-site operatingcash flow
Mine-sitecapital
expenditures
Q1 2021
Q1 2021 vs Q1 2020 Mine-site free cash flow¹ ($ millions)
$14.1
$57.7
$17.7
$89.5
Q1 2020 Mine-site operatingcash flow
Mine-sitecapital
expenditures
Q1 2021
Summary of Financial and Operating Results2
Contributors to Change Q1 2021 vs. Q4 2020
FinancialRevenues s $297.4 million, down $50.1 million or 14%, primarily due to lower sales volume at
Rosebel ($19.6 million), Westwood ($14.0 million), and Essakane ($1.8 million). Revenues were also adversely impacted by a lower realized gold price ($14.0 million or $84/oz).
Cost of sales s $253.2 million, down $10.3 million or 4%, due to lower operating costs as a result of lower sales ($14.0 million) and lower royalties ($0.7 million), partially offset by higher depreciation expense ($4.4 million).
Depreciation expense r $74.0 million, up $4.4 million or 6%, primarily due to higher depreciation of capitalized stripping at Essakane, as the mine sequenced into ore rich zones.
General and administrative expenses s $9.4 million, down $5.7 million or 38%, primarily due to lower share-based
compensation ($3.2 million), lower salaries ($1.5 million) and higher realized gains on cash flow hedges ($0.6 million).
Exploration expenses s $7.6 million, down $1.2 million, due to lower exploration activity.
Income tax expense s $10.5 million, down $6.4 million, comprised of current income tax expense of $12.4 million (fourth quarter 2020 - $14.5 million) and deferred income tax recovery of $1.9 million (fourth quarter 2020 - expense of $2.4 million).
______________________________1 This is a non-GAAP measure. Refer to the non-GAAP performance measures section of this MD&A.2 Financial results from continuing operations.
IAMGOLD CORPORATIONFirst Quarter 2021 Management’s Discussion and Analysis 5

Contributors to Change Q1 2021 vs. Q4 2020
FinancialNet earnings attributable to equity holders s $19.5 million, or $0.04 per share, compared to net earnings of $59.0 million, or $0.12
per share. The decrease was primarily due to the reversal of non-cash impairment charges in the prior quarter ($45.8 million) and lower gross profit ($39.8 million). The decrease was partially offset by higher interest income, derivatives and other investment gains (losses) ($26.7 million), primarily related to the gain on the sale of the Company's non-core royalty portfolio ($35.7 million), higher foreign exchange gain ($6.7 million), lower other expenses ($7.1 million), and lower income taxes ($6.4 million).
Adjusted net earnings attributable to equity holders s $6.2 million, or $0.01 per share, compared to adjusted net earnings of $19.1 million, or
$0.04 per share.Net cash from operating activities s $101.7 million, down $27.0 million, primarily due to lower earnings after non-cash
adjustments ($29.5 million) and lower dividends received from related parties ($8.2 million), partially offset by lower income taxes paid ($8.9 million) and higher cash receipts from settlement of derivatives ($3.5 million).
Net cash from operating activities before changes in working capital
s $82.5 million, down $25.5 million, primarily due to the factors noted above.
Mine-site free cash flow r $89.5 million, up $11.8 million, primarily due to lower capital expenditures for property, plant and equipment ($17.5 million) and higher operating cash flow at Essakane ($10.5 million), partially offset by lower operating cash flow at Rosebel ($19.9 million).
Financial PositionCash, cash equivalents, short-term investments and restricted cash
r $1,005.3 million comprised of cash and cash equivalents of $963.0 million, short-term investments of $4.8 million and restricted cash of $37.5 million, up $19.2 million.
OperatingAttributable gold production s 156,000 ounces, down 13,000 ounces or 8%, due to lower production at Westwood
(7,000 ounces) as the underground operations were in care and maintenance following the seismic event in the fourth quarter 2020, lower production at Rosebel (5,000 ounces) and Essakane (1,000 ounces).
Attributable gold sales s 153,000 ounces, down 19,000 ounces or 11%, due to lower sales volume at Rosebel (10,000 ounces), Westwood (7,000 ounces), and Essakane (2,000 ounces).
Capital expenditures s $102.5 million, down $3.9 million or 4%, primarily due to timing and lower capitalized stripping at Essakane, partially offset by higher spending on the Côté Gold construction project and the Boto Gold development project due to the accelerated start of Côté Gold and the continued de-risking of Boto Gold.
Cost of sales per ounce produced r $1,075, up 3%, primarily due to lower sales volume and increased expensed stripping.
Total cash costs per ounce produced r $1,052, up 5%, primarily due to lower production and increased expensed stripping,
partially offset by the positive impact of realized derivative gains of $5 per ounce produced (fourth quarter 2020 - $5 loss).
All-in sustaining costs per ounce sold s $1,238, down 4%, primarily due to lower sustaining capital expenditures and the
positive impact of realized derivative gains of $11 per ounce sold (fourth quarter 2020 - $2 loss).
Contributors to change Q1 2021 vs. Q1 2020
FinancialRevenues r $297.4 million, up $22.9 million or 8%, primarily due to higher sales volume at
Essakane ($50.3 million) and a higher realized gold price ($29.7 million or $180/oz), partially offset by lower sales volume at Rosebel ($33.7 million) and Westwood ($22.2 million).
Cost of sales r $253.2 million, up $10.6 million or 4%, due to higher depreciation expense ($10.6 million) and higher royalties ($2.2 million), partially offset by lower operating costs ($2.2 million).
Depreciation expense r $74.0 million, up $10.6 million or 17.0%, primarily due to higher depreciation of capitalized stripping and higher production at Essakane, as the mine sequenced into ore rich zones, partially offset by the reclassification of depreciation at Westwood to care and maintenance.
General and administrative expenses s $9.4 million, down $2.5 million or 21%, primarily due to lower salaries ($2.2 million) and
higher realized derivative gains ($1.2 million), partially offset by higher consulting fees ($0.6 million) and share-based compensation ($0.3 million).
Exploration expenses s $7.6 million, down $0.8 million.
IAMGOLD CORPORATIONFirst Quarter 2021 Management’s Discussion and Analysis 6

Contributors to change Q1 2021 vs. Q1 2020
FinancialIncome tax expense r $10.5 million, up $6.9 million, comprised of current income tax expense of $12.4 million
(first quarter 2020 - $8.9 million) and deferred income tax recovery of $1.9 million (first quarter 2020 - $5.3 million).
Net earnings/(loss) attributable to equity holders r $19.5 million, or $0.04 per share, compared to net loss of $34.4 million, or $0.07 per
share. The increase was primarily due to higher interest income, derivatives and other investment gains (losses) ($62.4 million), primarily from the gain on the sale of the Company's non-core royalties ($35.7 million) and a decrease in loss on non-hedge derivatives and warrants ($29.6 million), higher gross profit ($12.3 million), partially offset by higher other expense ($17.3 million) and higher income taxes ($6.9 million).
Adjusted net earnings/(loss) attributable to equity holders r $6.2 million, or $0.01 per share, compared to adjusted net loss of $4.9 million, or $0.01
per share.Net cash from operating activities r $101.7 million, up $57.7 million, primarily due to higher earnings after non-cash
adjustments ($8.4 million), favourable movements in non-cash working capital items primarily resulting from a decrease in receivables and other current assets primarily due to receipts for value-added taxes ($38.8 million) and a decrease in inventory and non-current ore stockpiles ($10.0 million), and higher realized derivative gains ($3.5 million).
Net cash from operating activities before changes in working capital
r $82.5 million, up $9.7 million, primarily due to the factors noted above.
Mine-site free cash flow r $89.5 million, up $75.4 million, primarily due to higher operating cash flow ($92.6 million) and lower capital expenditures ($12.0 million) at Essakane, partially offset by lower operating cash flow at Rosebel ($20.6 million).
OperatingAttributable gold production s 156,000 ounces, down 14,000 ounces or 8%, due to lower production at Rosebel
(17,000 ounces) and Westwood (15,000 ounces) as the underground operations were in care and maintenance, partially offset by higher production at Essakane due to head grades (18,000 ounces).
Attributable gold sales s 153,000 ounces, down 6,000 ounces or 4%, due to lower sales volume at Rosebel (20,000 ounces) and Westwood (14,000 ounces), partially offset by higher sales volume at Essakane (28,000 ounces).
Capital expenditures r $102.5 million, up $35.0 million or 52%, primarily due to higher spending on the Côté Gold construction project and the Boto Gold development project.
Cost of sales per ounce sold r $1,075, up 2%, primarily due to lower sales volume and increased expensed stripping.
Total cash costs per ounce produced r $1,052, up 6%, primarily due to lower production volume and increased expensed
stripping, partially offset by the positive impact of realized derivative gains of $5 per ounce produced (first quarter 2020 - $9 loss).
All-in sustaining costs per ounce sold r $1,238, up 1%, primarily due to higher cost of sales per ounce partially offset by lower
sustaining capital expenditures and the positive impact of realized derivative gains of $11 per ounce sold (first quarter 2020 - $12 loss).
Global COVID-19 PandemicThe global COVID-19 pandemic continues to evolve, including the continuing imposition of restrictions on the movement of people and goods, social distancing measures, restrictions on group gatherings, quarantine requirements and contact tracing. Despite the beginning of mass immunization campaigns across several countries, another wave of new COVID-19 cases is emerging globally, triggering the return of more aggressive mitigation strategies. These include the re-imposition of hard social distancing measures such as quarantines, curfews and lockdowns in certain jurisdictions. The Company has been closely monitoring and is taking necessary measures to manage the impact of the COVID-19 pandemic on its operations, development projects and exploration activities. The Company is managing the financial and operational challenges of COVID-19 while addressing the needs of its employees. The Company continues to work closely with local and national governments and communities on limiting the impact of the COVID-19 pandemic on its people and business, and supporting local efforts to manage the pandemic. There has been an increase in positive COVID-19 cases during the first quarter in Suriname and, as a result, additional restrictions around daily commuting of employees to limit the contact within the site and neighboring communities have been implemented, resulting in the necessity to add site accommodations at Rosebel which is in progress. The previously implemented protocols across operations and offices, to protect the health and safety of employees, contractors and local communities in response to the COVID-19 pandemic, including implementation of sanitary measures recommended by Health Authorities and other COVID-19 prevention protocols remain in place and there have been no other material impacts at our operations and construction sites during the first quarter 2021. The protocols include: restricting site access to employees, contractors and incoming supplies; screening processes (the use of external laboratories for PCR testing, the use of antigen test kits and the use of thermal cameras to check temperatures before entering the sites), physical distancing and the use of personal protective equipment.
IAMGOLD CORPORATIONFirst Quarter 2021 Management’s Discussion and Analysis 7

KEY STRATEGIC OBJECTIVES
The Company's key strategic objectives are focused on three pillars: Operational Excellence, Growth and Financial Performance.
Operational ExcellenceThe Company is committed to maintaining its culture of accountable mining through high standards of ESG practices as discussed in the ESG section. The Company also continues to seek opportunities to improve operational performance in a cost effective, safe and responsible manner. First quarter 2021 insights include:Westwood• A business recovery plan has been in progress and rehabilitation work has been underway.• On April 22, 2021, the Company announced that it had started a staged recall of employees to ramp up rehabilitation
activities with a decision expected in the second quarter with respect to a possible targeted safe restart in the second half of the year.
Rosebel• Engineering and procurement of the adsorption, desorption and recovery circuit upgrade commenced with increased
recoveries expected by the end of the year.• The addition of 150 beds in the first quarter and a further 210 beds expected in the second quarter will increase workforce
availability that has been impacted by COVID-19 restrictions.• Continued progress towards Saramacca project infrastructure completion with delays experienced due to weather, lodging
restrictions and hauling availability.Essakane• Mill upgrade project completed, providing additional crushing capacity for the ramp up of hard rock throughput from 10.8 to
11.7 million tonnes per annum.• Introduction of near-pit fueling has saved approximately 1,925 haul truck operating hours, allowing approximately an
additional 540,000 tonnes to be moved in the first quarter.
GrowthThe Company is focusing its activities in high potential mining districts in North America, South America and West Africa, which encompass operating mines, construction, development, and exploration projects. The Company continues to support sustained exploration programs resulting in a robust pipeline of new growth opportunities. In line with its objectives of generating increased positive free cash flows, the Company is targeting gold production of greater than one million ounces per annum and all-in sustaining costs of less than $1,000 per ounce by 2024 as a result of improved operations and the completion of the Côté Gold Project in 2023. First quarter 2021 insights include:• Major earthworks, which commenced ahead of schedule, and expansion of the camp are progressing, with the Côté Gold
Project 18% physically complete at March 31, 2021.• De-risking activities at the Boto Gold Project continue with plant engineering 75% complete and access road construction on
track to allow permanent access to the Boto site during the upcoming wet season starting in July.• Greenfield and brownfield exploration activities continued with the completion of a maiden resource estimate for the
Gosselin zone, 1.5 kilometres northeast of the Côté Gold Project, on track for the second half of 2021.
Financial PerformanceThe Company continues to seek opportunities to improve financial strength and optimize returns to stakeholders, with an emphasis on maintaining a strong balance sheet and managing capital in a disciplined manner. First quarter 2021 insights include:• Cash, cash equivalents and short-term investments of $967.8 million.• Total available liquidity at March 31, 2021 of $1,466 million, with the maturity date of the Company’s largely undrawn $490
million credit facility extended to January 31, 2025, providing appropriate headroom to finance the Company's ongoing development activities.
• Cash proceeds of $35.7 million received in March 2021 and an additional payment of $10.5 million received in April 2021 from the sale of non-core royalties.
• Mine-site free cash flow of $89.5 million.
IAMGOLD CORPORATIONFirst Quarter 2021 Management’s Discussion and Analysis 8

ENVIRONMENTAL, SOCIAL AND GOVERNANCE
The Company is committed to:• Maintaining its culture of accountable mining through high standards of ESG practices; and • The principle of Zero Harm®, in every aspect of its business, with particular emphasis on respecting the natural environment,
building strong community partnerships and putting the health and safety of the Company's employees first.The Company implemented the Toward Sustainable Mining framework at all its operations and is working towards the implementation of the World Gold Council’s Responsible Gold Mining Principles.ESG policies, systems and practices are embedded throughout the business and the Company reports annually on its ESG performance via its Global Reporting Initiative compliant Health, Safety and Sustainability Report.
EnvironmentalThe Company recognizes that mining activities are energy intensive and generate significant greenhouse gas emissions. The fight against climate change ultimately requires the mining industry to prioritize responsible energy use, improve efficiencies, and explore new options for fuel switching and renewables.The Company is working at both the global and local level to advance these priorities and to reduce the Company’s carbon footprint. An audit of the Company’s greenhouse gas emissions profile across all sites will be completed in 2021. The audit will inform the development of an action plan for achieving net zero emissions, which the Company intends to announce in 2022. The Company has invested extensively in solar infrastructure at both the Suriname and Burkina Faso operations. The Company commissioned what was at the time the world’s largest hybrid solar/thermal plant at Essakane in 2018. The Company also promotes the use of solar power with financing and installation of solar power in schools and medical facilities in the Boto Gold Project surrounding communities.
SocialHealth and SafetyHealth and safety is core to the Company’s relentless pursuit of its Zero Harm® vision. To maintain a healthy and safe workplace, the Company knows it is about more than just policies and procedures - it is about building a culture of health and safety alongside its employees and promoting local community health and well-being. The Company continues to implement a wellness program at all sites.The DART (days away, restricted, transferred duty) frequency rate was 0.46, and the TRI (total recordable injuries) frequency rate was 0.67 in the first quarter 2021, which is consistent with 2020. The Côté Gold Project had achieved 1.24 million hours without lost time by March 31, 2021. Through various programs, the Company continuously promotes a safe work environment.
Social and Economic DevelopmentThe Company is continuously exploring opportunities for investing and partnering with communities impacted by its operations. At both Essakane and Rosebel, the Company has committed to establishing and seeding community funds. Going forward, the bulk of its funding for community investment initiatives at these sites will flow through these dedicated community funds to ensure consistent funding on a year-to-year basis, thereby avoiding the uncertainty of annual budgetary reviews. This is a particularly important change in the context of a highly cyclical industry like gold mining. The Rosebel Community Fund was officially launched in October 2019, with an endowment of $2.5 million from the Company. The Company has further committed to making an annual contribution to the Fund of 0.25% of annual revenues, in order to make it sustainable over time. The Company has also committed to making an annual contribution to the Suriname Environmental & Mining Foundation of 0.25% of annual revenues. The Company finalized its participation in the Mining Fund for Local Development in Burkina Faso, which was established by the government. As part of its agreement, the Company contributed $14.5 million in to the Fund from 2017 to 2020, with a commitment to contribute 1% of annual revenues going forward. The Company is also engaged in discussions with the Abitibiwinni First Nation on a potential project agreement relating to the potential development of satellite deposits to the Westwood complex, such as the Fayolle Property.For the Côté Gold Project, the Company signed an impact and benefits agreement ("IBA") with Mattagami First Nation and Flying Post First Nation in April 2019. This provided the Company with a strong foundation to move forward with the project building on early days engagement. As well as employment and environmental initiatives, a detailed socioeconomic management and monitoring plan is being co-developed with these communities to monitor the impact of the mine on neighbouring communities. This plan will be co-owned and co-managed by Mattagami First Nation and Flying Post First Nation and the Company. Oversight and implementation is provided through a joint environmental management committee. The Company is also advancing discussions with the Métis Nation of Ontario regarding an agreement that is expected to be signed this year.For the Boto Gold Project and the exploration program in Senegal, the Company is committed to investing $3.4 million in local community development activities over the 2020-2023 period. The program, developed with local stakeholders, will focus first on responding to the development of priority infrastructure to meet the basic needs of the communities, initiatives aimed at the long-term empowerment of the communities by initially focusing on the implementation of local employment and local procurement strategies.
IAMGOLD CORPORATIONFirst Quarter 2021 Management’s Discussion and Analysis 9

Diversity, Equity and InclusionThe Company unequivocally condemns inequity, discrimination and hatred in all its forms. One of the Company's values is to conduct itself with respect and embrace diversity. The Company has established a Diversity, Equity and Inclusion Steering Committee and Employee Council Groups to further enhance the Company's strong commitment to these important values through data collection, education, awareness and action planning at a global level.
GovernanceThe Board of Directors of the Company (the "Board") believes it important and a matter of good governance to facilitate the fresh, innovative and diverse perspective and ideas of its members on the business and affairs of the Company and its long-term strategy. The Board continually reviews the mix of the knowledge, skills, competencies, experiences and diversity it ought to, collectively, possess and represent in order for it to effectively fulfill its mandate and oversee the execution of the long-term strategy of the Company, namely, the long-term creation and preservation of stakeholder value. The Board, at least annually, assesses the performance and contributions of incumbent directors to its mandate. It is in the context of these regular reviews and assessments by the Board that tenure, succession and renewal are considered.Early this year, the Board adopted new diversity and renewal guidelines, reflecting governance best practices. In terms of diversity, the Board agreed that its membership should comprise, at a minimum, the greater of (i) two and (ii) 30%, female directors. With respect to renewal, it was decided that the average tenure of the Board should not exceed ten years and that no director should serve as the chair of the Board or the chair of any committee for more than ten years. The guidelines were immediately implemented by the Board, with a view to ensuring new and diverse perspectives and ideas of its members on an ongoing basis, while also ensuring continuity and orderly Board succession. Following the meeting of shareholders on May 4, women will represent 29% of the directors, or 33% of the independent directors, and the average tenure of the Board will be approximately 5.5 years.
Recent Highlights• Anne Marie Toutant and Deborah Starkman were appointed as independent directors of the Company, effective December
14, 2020. John Caldwell stepped down from the Board, effective January 4, 2021, and Mahendra Naik and Sybil Veenman are not standing for re-election at the upcoming meeting of shareholders.
• Ranked 10th out of 116 global mining companies on the Corporate Knights 2021 Global 100 Sustainability scorecard.• Included in the 2021 Bloomberg Gender Equality Index for the 3rd consecutive year, and recognized among 380 global
companies that foster a more inclusive and equitable workplace. • Rosebel Community Fund provided $400,000 funding, along with supplemental government contributions, for the installation
of solar LED street lights for public security, electrification and potable water supplies in communities around Rosebel and Saramacca.
• Public-Private Partnership with Canada’s government, One Drop Foundation, and Cowater on the Triangle d’Eau Project completed Phase I bringing potable water to 60,000 people near Essakane; advanced Phase II to bring potable water to an additional 75,000 people.
• In response to the urgent need for COVID-19 vaccinations globally, in April 2021 the Company committed to contribute $250,000 to UNICEF to support the International ACT-A / COVAX Emergency Response. ACT-A (Access to COVID-19 Tools Accelerator) is a global collaboration to accelerate the distribution of COVID-19 vaccines, strengthen core health systems, assist low and middle income countries beyond the pandemic and mitigate the public health and economic impact in West and Central Africa.
• In partnership with Giants of Africa, the Company is investing $950,000 in a 4-year program, starting in 2021, aimed at encouraging the development of youth through sports. The program includes: the construction of basketball courts in the Company’s host communities in Burkina Faso, Senegal and Mali, multi-day basketball and life-skills camps in each region as well as two-day mentorship camps, and a Women’s Empowerment Career workshop in Senegal.
• The Company is a sponsor of the Artemis Project, which aims to promote female business owners and entrepreneurs in the mining sector. Artemis members include innovative and award-winning social and natural scientists with over 500 years of combined practical and global sector experience, 75% of whom are engineers.
• On April 29, 2021, the Company received Mining Association of Canada’s prestigious Towards Sustainable Mining® (TSM) Excellence Award in the Environmental category for its innovative recycling of plastic at the Essakane mine in Burkina Faso. Working with a local entrepreneur, the Company supported the development of a plastics recycling business to manage waste generated by the mine site. The recycling business shreds different types of plastics and places the resulting granules in reusable bags for resale, enhancing the management of plastic waste and creating permanent jobs for community members, who lead the program. To-date, over 65 tons of plastics previously stored at the mine site have been recycled.
IAMGOLD CORPORATIONFirst Quarter 2021 Management’s Discussion and Analysis 10

OUTLOOK
Operating Performance
ActualQ1 2021
Full Year Guidance 20211
Essakane (000s oz) 102 365 – 390Rosebel (000s oz) 47 220 – 245Westwood (000s oz) 7 45 – 65Total attributable production (000s oz) 156 630 – 700
Cost of sales ($/oz) $ 1,075 $980 – $1,030Total cash costs2,3 ($/oz) $ 1,052 $930 – $980All-in sustaining costs2,3 ($/oz) $ 1,238 $1,230 – $1,280Depreciation expense ($ millions) $ 74 $295 – $305Income taxes4 ($ millions) $ 7.5 $45 – $55
1 The outlook is based on 2021 full year assumptions with an average realized gold price of $1,750 per ounce, USDCAD exchange rate of 1.30, EURUSD exchange rate of 1.19 and average crude oil price of $47 per barrel.
2 This is a non-GAAP measure. Refer to the non-GAAP performance measures section of this MD&A.3 Consists of Essakane, Rosebel, and Westwood on an attributable basis.4 The Company has updated its full year cash taxes guidance from $78 million to $88 million to the range of $45 million to $55 million. This revision largely reflects
lower 2021 tax payments expected for Rosebel. Cash tax payments do not occur evenly by quarter, because payments reflect final payments in respect of the prior year and installments due at different prescribed times for different countries.
Production guidance for Westwood is based on the targeted restart of underground mining operations in the second half of 2021, supplementing ore from the Grand Duc open pit. Production at Rosebel is expected to improve in the second half of the year after the impacts of the seasonal rains subside, all additional site accommodations are completed and productivity and other initiatives are achieved. Rosebel production is expected to be strongest in the fourth quarter, benefiting from the progression of mining activities into the targeted higher grade ore zones at the Saramacca deposit. Refinements to the mining sequences at Essakane are underway to mitigate the risks to production guidance posed by reduced recovery of gold from pockets of higher graphitic ore. Higher grades achieved at Essakane in the first quarter are expected to normalize in the second quarter onwards.
Unit costs are expected to decrease in the second half of the year commensurate with higher expected production and sales, while noting the potential for adverse impacts should the increase in certain costs, including energy and supplies, continue along with a stronger Canadian dollar and euro.
Capital Expenditures1
Actual Q1 2021 Full Year Guidance 2021($ millions) Sustaining2 Expansion3 Total Sustaining2 Expansion3 TotalEssakane $ 5.4 $ 14.5 $ 19.9 $ 60 $ 90 $ 150 Rosebel4 7.6 10.8 18.4 50 75 125 Westwood 0.4 0.6 1.0 10 10 20
13.4 25.9 39.3 120 175 295 Côté Gold (70%)5 — 48.4 48.4 — 355 355 Boto Gold — 14.5 14.5 — 60 60 Corporate 0.3 — 0.3 — — — Total6,7,8 (±5%) $ 13.7 $ 88.8 $ 102.5 $ 120 $ 590 $ 710
1 100% basis, unless otherwise stated.2 Sustaining capital includes capitalized stripping at Essakane of $nil and $10 million for the first quarter and for the full year 2021 guidance, respectively.3 Expansion capital includes capitalized stripping of (i) $9.2 million for Essakane and $7.3 million for Rosebel in the first quarter 2021, and (ii) $65 million for
Essakane and $45 million for Rosebel for the full year 2021 guidance.4 Includes Saramacca at 70%.5 The Côté Gold Project is expected to incur an additional $13 million of non-capital expenditures in 2021.6 Includes $13 million of capitalized exploration and evaluation expenditures also included in the Exploration Outlook guidance table.7 Capitalized borrowing costs are not included.8 In addition to the above capital expenditures, $23 million in total principal lease payments are expected.
Sustaining capital expenditures are expected to increase during the remainder of the year, compared to the first quarter, reflecting the timing of spend on major projects at Essakane and Rosebel, alongside increased development costs as underground operations are targeted to resume at Westwood. Expansion capital expenditures are expected to increase in the remainder of the year, reflecting construction progress at the Côté Gold Project and increased activities at the Boto Gold Project, as well as increased expansionary stripping campaigns anticipated in the second half of the year at Essakane and Rosebel.
IAMGOLD CORPORATIONFirst Quarter 2021 Management’s Discussion and Analysis 11

Exploration
Actual Q1 2021 Full Year Guidance 2021
($ millions) Capitalized Expensed Total Capitalized Expensed Total
Exploration projects - greenfield $ — $ 5.5 $ 5.5 $ — $ 33 $ 33
Exploration projects - brownfield1 3.1 1.8 4.9 13 10 23
$ 3.1 $ 7.3 $ 10.4 $ 13 $ 43 $ 56 1 Exploration projects - brownfield includes planned near-mine exploration and resource development of (i) $3.1 million in the first quarter 2021, and (ii) $13 million in
the full year 2021 guidance.
QUARTERLY UPDATES
North America
Abitibi District, CanadaThe Company is developing a “hub-and-spoke" model in the Abitibi District to exploit the available mill capacity at the Westwood complex, located 35 kilometres northeast of Rouyn-Noranda and 80 kilometres west of Val d'Or in southwestern Québec, Canada. In addition to feed from the Westwood underground mine and the Grand Duc open pit mine, the Company is targeting future supplemental feed from assets such as the recently acquired Fayolle exploration property and the optioned Rouyn Gold Project.
Westwood Mine (IAMGOLD interest – 100%)
Q1 2021 Q4 2020 Q1 2020Mine operating statisticsOre mined (000s t) – underground — 40 111 Ore mined (000s t) – other sources 246 169 109 Ore mined (000s t) – Total 246 209 220 Ore milled (000s t) 227 221 207 Head grade (g/t) – underground — 6.86 5.77 Head grade (g/t) – other sources 1.09 1.20 0.92 Head grade (g/t) – Total 1.09 2.24 3.47 Recovery (%) 93 93 94 Gold production (000s oz) 7 14 22 Gold sales (000s oz) 8 15 22 Performance measuresAverage realized gold price1 ($/oz) $ 1,785 $ 1,864 $ 1,595 Cost of sales ($/oz) $ 1,149 $ 1,083 $ 1,162 Total cash costs1 ($/oz) $ 1,186 $ 1,016 $ 1,176 All-in sustaining costs1 ($/oz) $ 1,187 $ 1,212 $ 1,242 Capital expenditures ($ millions)Sustaining $ 0.4 $ 2.1 $ 2.4 Expansion $ 0.6 $ 1.9 $ 2.2 Total $ 1.0 $ 4.0 $ 4.6
1 This is a non-GAAP measure. Refer to the non-GAAP performance measures section of this MD&A.
Q1 InsightsFollowing the seismic event in the fourth quarter 2020, the Company announced a temporary reduction in the underground workforce of approximately 70% at the Westwood mine and the underground operations were placed on care and maintenance. A business recovery plan has been in progress and rehabilitation work has been ongoing with a small crew. The Company announced on April 22, 2021 that it had started a staged recall of employees. Activities will be focused on training and rehabilitation work in the second quarter 2021. Mill feed in 2021 is being sourced from the lower grade Grand Duc open pit, located 3 kilometres from the Westwood mill complex, and is expected to be supplemented by underground material from the Westwood mine commencing in the second half of 2021.Westwood implemented random antigen testing on site to provide additional protection for the workforce against COVID-19.
IAMGOLD CORPORATIONFirst Quarter 2021 Management’s Discussion and Analysis 12

Q1 PerformanceGold production of 7,000 ounces was (i) 50% lower than the prior quarter, and (ii) 68% lower than the same prior year period, as the ore feed in the current period was primarily sourced from lower grade material mined at the Grand Duc open pit.Total cost of sales per ounce sold of $1,149 and total cash costs per ounce produced of $1,186 were (i) higher by 6% and 17%, respectively, compared to the prior quarter, primarily due to lower sales and production, and (ii) in line with the same prior year period as lower sales and production volumes were offset by lower operating costs as the underground mine was in care and maintenance.All-in sustaining costs per ounce sold of $1,187 were lower by (i) 2% compared to the prior quarter, and (ii) 4% compared to the same prior year period, primarily due to lower sustaining capital expenditures.Included in total cash costs and all-in sustaining costs was the positive impact of realized derivative gains of $43 per ounce produced and $42 per ounce sold, respectively (fourth quarter 2020 - $27 gain and $34 gain, and first quarter 2020 - $9 loss and $10 loss).Sustaining capital expenditures of $0.4 million primarily included fixed equipment of $0.3 million. Expansion capital expenditures of $0.6 million related to advancing detailed engineering and permitting for the Fayolle Property.OutlookRehabilitation activities are expected to ramp up following the workforce recall in the second quarter. The Company expects to make a decision in the second quarter with respect to a possible targeted safe restart, which would commence with the East Zone and progress to the other zones in a staged manner. The business continuity assessment in the West Zone will be ongoing. The production guidance range for the Westwood complex for 2021 remains 45,000 to 65,000 ounces assuming a restart of underground mining in the second half of the year. Mill feed will continue to be sourced from the Grand Duc open pit and would be supplemented with underground material when the Westwood mine restarts. Capital expenditures are expected to be approximately $20 million, mostly related to deferred development and underground construction.Brownfield ExplorationDuring the first quarter 2021, the Company completed approximately 3,100 metres of surface drilling, approximately 1,500 metres of underground resource development drilling, and approximately 5,500 metres of underground geotechnical drilling. Surface drilling was focused on upgrading inferred resources at the Grand Duc satellite pit. Underground drilling was focused on evaluating a potential restart of underground mining operations.Approximately 39,000 metres of underground and surface diamond drilling is planned in 2021 that will continue to focus on resource definition and development and include approximately 10,000 metres of surface project exploration.
Fayolle Property The Company is evaluating the potential development of the Fayolle deposit, 29 kilometres northwest of the Westwood complex, which, pending permitting, may provide incremental feed commencing in the fourth quarter 2022. Drilling to support the geotechnical study for the Fayolle property commenced during the quarter. Permitting, environmental study and sampling activities are ongoing.
Rouyn Gold ProjectThe Company holds a purchase option with Yorbeau Resources Inc. (“Yorbeau”) for the Rouyn Gold Project, located near Rouyn-Noranda. Under the terms of the purchase option agreement, the Company can acquire a 100% interest in the project by completing remaining scheduled cash payments totaling C$1.5 million and remaining exploration expenditures totaling approximately C$5 million by December 2022. By the end of the expenditure period, the Company must complete a resource estimate in accordance with National Instrument 43-101, after which the Company, at its election, can purchase a 100% interest in the project, subject to a 2% net smelter return, by paying Yorbeau the lesser of C$15 per resource ounce or C$30 million.During the first quarter 2021, the Company completed approximately 950 metres of diamond drilling focused on both geotechnical and expansion drilling on the Lac Gamble Zone. In addition, the Company reported assay results from its 2020 exploration diamond drilling program completed on the Astoria Target Area, which included the following highlights: 7.6 metres grading 9.7 g/t Au, 11.1 metres grading 3.7 g/t Au, and 14.0 metres grading 3.4 g/t Au (see news release dated March 3, 2021).Approximately 11,000 metres of diamond drilling is planned in 2021 to further delineate the Lac Gamble and Astoria zones and to support a future initial resource estimation. The program will also initiate the evaluation of the resource potential of other selected targets including in the Cinderella and Augmitto areas.
IAMGOLD CORPORATIONFirst Quarter 2021 Management’s Discussion and Analysis 13
Côté District, CanadaThe Côté District, located 125 kilometres southwest of Timmins and 175 kilometres north of Sudbury, Ontario, Canada includes the Côté Gold construction project and the adjacent Gosselin exploration zone (formerly the Gosselin and Young-Shannon zones). The project is being developed by a 70:30 joint venture between IAMGOLD, as the operator, and Sumitomo Metal Mining Co., Ltd. ("SMM") as a 13.1 million tonnes per year open pit operation estimated to produce, on a 100% basis, an average of approximately 469,000 gold ounces at $693 per ounce all-in sustaining costs annually in its first six years of operation under the extended case mine plan1. The Company effectively owns 64.75% of the project and the Gosselin zone which is currently undergoing a resource delineation drilling program and could provide future supplemental feed to the Côté mill.
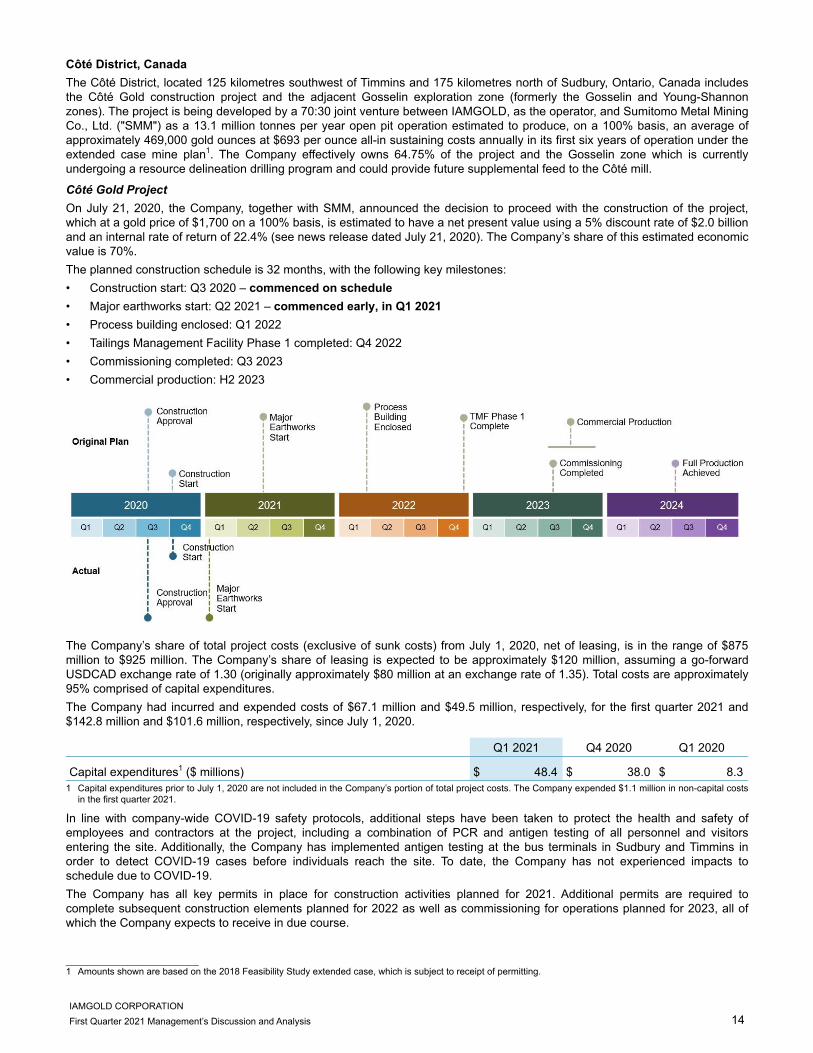
Côté Gold ProjectOn July 21, 2020, the Company, together with SMM, announced the decision to proceed with the construction of the project, which at a gold price of $1,700 on a 100% basis, is estimated to have a net present value using a 5% discount rate of $2.0 billion and an internal rate of return of 22.4% (see news release dated July 21, 2020). The Company’s share of this estimated economic value is 70%.The planned construction schedule is 32 months, with the following key milestones:• Construction start: Q3 2020 – commenced on schedule• Major earthworks start: Q2 2021 – commenced early, in Q1 2021• Process building enclosed: Q1 2022• Tailings Management Facility Phase 1 completed: Q4 2022• Commissioning completed: Q3 2023• Commercial production: H2 2023
The Company’s share of total project costs (exclusive of sunk costs) from July 1, 2020, net of leasing, is in the range of $875 million to $925 million. The Company’s share of leasing is expected to be approximately $120 million, assuming a go-forward USDCAD exchange rate of 1.30 (originally approximately $80 million at an exchange rate of 1.35). Total costs are approximately 95% comprised of capital expenditures.The Company had incurred and expended costs of $67.1 million and $49.5 million, respectively, for the first quarter 2021 and $142.8 million and $101.6 million, respectively, since July 1, 2020.
Q1 2021 Q4 2020 Q1 2020
Capital expenditures1 ($ millions) $ 48.4 $ 38.0 $ 8.3 1 Capital expenditures prior to July 1, 2020 are not included in the Company’s portion of total project costs. The Company expended $1.1 million in non-capital costs
in the first quarter 2021.
In line with company-wide COVID-19 safety protocols, additional steps have been taken to protect the health and safety of employees and contractors at the project, including a combination of PCR and antigen testing of all personnel and visitors entering the site. Additionally, the Company has implemented antigen testing at the bus terminals in Sudbury and Timmins in order to detect COVID-19 cases before individuals reach the site. To date, the Company has not experienced impacts to schedule due to COVID-19.The Company has all key permits in place for construction activities planned for 2021. Additional permits are required to complete subsequent construction elements planned for 2022 as well as commissioning for operations planned for 2023, all of which the Company expects to receive in due course.
______________________________1 Amounts shown are based on the 2018 Feasibility Study extended case, which is subject to receipt of permitting.
IAMGOLD CORPORATIONFirst Quarter 2021 Management’s Discussion and Analysis 14

At March 31, 2021, detailed engineering reached 83%. Procurement and expediting of major equipment contracts are progressing with the contract for the mining fleet being awarded in the first quarter. During the first quarter 2021, the earthwork contractors continued work on road widening and overburden stripping, and commenced work on the water management infrastructure for the tailings management facility. Temporary camps are now fully erected and commissioned. Construction of the permanent camp is underway, which will serve to supplement peak construction workforce requirements. Of the total number of rooms planned, approximately 50% have been installed to-date, meeting the current requirements of the site. As at March 31, 2021, overall the project was 18% complete.The Côté Gold Project’s costs are primarily incurred in Canadian dollars. As at March 31, 2021, the Company had executed hedges for approximately 44% of this exposure in 2021 and, together with C$145 million of cash on hand, had achieved foreign exchange risk management in respect of approximately 73% of the estimated 2021 Canadian dollar expenditures. Exposures in 2022 and 2023 are approximately 28% and 65% hedged, respectively. The Company has hedged approximately 90% of the project’s total expected fuel costs for the construction period. OutlookThe work plan will continue to focus on earthwork construction, haul road construction and water management infrastructure around the pit site. A portion of the permanent camp will be commissioned during the second quarter 2021 to increase the current capacity on site, with the camp expected to be fully commissioned in the third quarter 2021. Civil works are underway at the plant site and concrete activities, as well as initial pre-stripping work in the pit, are expected to be initiated during the second quarter 2021 as planned.The Company's share of the remaining total costs are expected to be expended as follows: 2021 - $319 million (including $307 million of capital expenditures), 2022 - $380 to $420 million and 2023 - $75 million to $85 million.Greenfield ExplorationIn addition to planned delineation drilling programs to support the future mining activities of the Côté deposit itself, the Company is also carrying out an ongoing greenfield exploration program on the Côté property. This greenfield exploration is not included in the project budget, but is included in the corporate exploration budget. In 2021, the Company expects to spend $2.8 million on greenfield exploration related to the Côté property, including the Gosselin zone.
Gosselin ZoneThe Gosselin zone is centered approximately 1.5 kilometres northeast of the Côté gold deposit. During the first quarter 2021, the Company reported further assay results from its ongoing delineation drilling program at the Gosselin zone. Drilling highlights included: 417.3 metres grading 0.95 g/t Au (including 197.3 metres grading 1.60 g/t Au), 353.0 metres grading 1.04 g/t Au (including 46.0 metres grading 3.39 g/t Au), 86.0 metres grading 5.57 g/t Au (including 30.35 metres grading 14.70 g/t Au) and 101.6 metres grading 1.86 g/t Au (see news releases dated January 21 and March 8, 2021).The Company completed approximately 3,000 metres of diamond drilling and spent $0.9 million during the quarter, compared to $0.7 million in the fourth quarter 2020, on greenfield exploration activities which were focused on continued delineation diamond drilling. Approximately 13,000 to 16,000 metres of diamond drilling is planned in 2021, including 12,000 to 14,000 metres to continue the delineation drilling program on the Gosselin zone to support the completion of an initial resource estimate, expected in the second half of 2021.
Chibougamau District, CanadaThe Chibougamau District includes the Nelligan Gold Project and the Monster Lake Project.
Nelligan Gold ProjectThe Nelligan Gold Project is located approximately 40 kilometres south of the Chapais – Chibougamau area in Quebec and is operating as a 75:25 earn-in option to joint venture with Vanstar Mining Resources Inc. The Company holds an option to earn an additional 5% interest, to hold an 80% interest, by completing a feasibility study on the project. During the first quarter 2021, the Company commenced a ground induced polarization geophysical survey to help guide the targeting for future drilling programs. Approximately 8,000 to 10,000 metres of diamond drilling is planned for 2021 to support the completion of an updated resource estimate expected in the second half of 2021. Exploration activities will also continue to identify and evaluate new targets.
Monster Lake ProjectThe Company holds a 100% interest in the Monster Lake Project, which is located approximately 15 kilometres north of the Nelligan Project in the Chapais – Chibougamau area in Quebec. Approximately 3,000 metres of diamond drilling is planned for 2021 to continue evaluating the resource potential of the Annie Shear Zone, located along the +4 kilometres long structural corridor hosting the Megane 325 resource.
IAMGOLD CORPORATIONFirst Quarter 2021 Management’s Discussion and Analysis 15

South America
Rosebel District, SurinameThe Rosebel District includes the Rosebel open pit mine located 85 kilometres south of the capital city of Paramaribo, Suriname, and the Saramacca open pit satellite mine, a higher grade deposit located 25 kilometres from the Rosebel operations.
Rosebel Mine (IAMGOLD interest – 95%)1
Q1 2021 Q4 2020 Q1 2020Mine operating statisticsOre mined2 (000s t) 1,247 1,987 2,234 Waste mined2 (000s t) 8,910 11,121 13,627 Total material mined2 (000s t) 10,157 13,108 15,861 Strip ratio2,3 7.1 5.6 6.1 Ore milled2 (000s t) – Total 2,548 2,663 2,905 Ore milled (000s t) – Rosebel 1,640 1,305 2,839 Ore milled2 (000s t) – Saramacca 908 1,358 66 Head grade2 (g/t) 0.79 0.90 0.77 Recovery2 (%) 88 88 94 Gold production2 (000s oz) – 100% 57 68 67 Gold production (000s oz) – Owner Operator 49 55 67 Attributable gold production (000s oz) – 95% 47 52 64 Gold sales (000s oz) – 100% 45 55 66 Performance measuresAverage realized gold price4 ($/oz) $ 1,752 $ 1,870 $ 1,605 Cost of sales ($/oz) $ 1,244 $ 1,135 $ 1,114 Royalties ($/oz) $ 112 $ 101 $ 94 Total cash costs4 ($/oz) $ 1,288 $ 1,133 $ 1,042 All-in sustaining costs4 ($/oz) $ 1,450 $ 1,310 $ 1,248 Capital expenditures ($ millions)Sustaining5 $ 7.6 $ 8.1 $ 6.8 Expansion $ 10.8 $ 12.3 $ 13.7 Total $ 18.4 $ 20.4 $ 20.5 Capitalized stripping (included in Sustaining and Expansion)6 $ 7.3 $ 7.3 $ 5.1
1 Rosebel at 100% and Saramacca at 70% from April 1, 2020, as included in the consolidated interim financial results, unless otherwise stated.2 Includes Saramacca at 100%. 3 Strip ratio is calculated as waste mined divided by ore mined.4 On an attributable basis. This is a non-GAAP measure. Refer to the non-GAAP performance measures section of this MD&A. 5 On an attributable basis, sustaining capital expenditures for the first quarter 2021 were $7.2 million (fourth quarter 2020 - $7.7 million, first quarter 2020 - $6.5
million).6 Includes expansion capitalized stripping for the first quarter 2021 of $7.3 million (fourth quarter 2020 - $7.3 million, first quarter 2020 - $5.1 million).
Q1 InsightsAn increase in positive COVID-19 cases in the country and among the workforce led to a temporary suspension of daily commuting by employees during the quarter. Employees who live offsite in the surrounding villages were required to remain at site for seven or fourteen days during the suspension of daily commuting. To accommodate the full workforce under established COVID-19 protocols, a project has been underway that added 150 beds in the first quarter, enabling mining capacity to increase and will add a further 210 beds in the second quarter.Rosebel experienced an unusual amount of seasonal rain, twice the volume as in the same period in 2020, resulting in soft road and ground conditions, and water accumulation on benches during and after rain events. The site is reviewing potential solutions to mitigate the impact of ongoing soft underfoot conditions. The operations were also limited by rock hauling capacity, which was mitigated with the temporary addition of a contractor. Lower mill throughput was impacted by wet, soft ore from Saramacca combined with lower ore availability from Rosebel due to mine sequencing. Lower grade stockpiles were utilized in the interim to supplement the mill feed, which impacted overall head grades. Mill performance in the quarter was also impacted by unscheduled maintenance and lower recoveries. Engineering and procurement of the adsorption, desorption and recovery circuit upgrade project has commenced and, before the end of the year, this project is expected to improve recovery by mitigating CIL liquid losses.
IAMGOLD CORPORATIONFirst Quarter 2021 Management’s Discussion and Analysis 16

Construction of Saramacca infrastructure progressed, despite the impacts of weather, lodging restrictions and hauling availability. Activities during the quarter included the completion of the community by-pass road and non-critical infrastructure related construction.The increase in strip ratio to 7.1 reflects the resumption of strategic pushbacks and mine development, which were paused in 2020. These activities are intended to expose higher grade ore zones while mining volumes at the Saramacca deposit continue to ramp up into higher grade zones.The Company’s collective labour agreement with the Rosebel Union expired on August 15, 2020. Negotiations on a new agreement continued to progress into the second quarter. The Company has experienced intermittent disruptions from work stoppages and the local community’s response to daily commute restrictions, which have impacted production levels.Q1 PerformanceAttributable gold production of 47,000 ounces was lower by (i) 10% compared to the prior quarter, and (ii) 27% compared to the same prior year period, primarily due to lower head grades and throughput as a result of the factors noted above.Gold sales of 45,000 ounces were lower by (i) 18% compared to the prior quarter, and (ii) 32% compared to the same prior year period, reflecting lower production and an increase in gold inventory in the current period.Cost of sales per ounce sold of $1,244 and total cash costs per ounce produced of $1,288 were higher by (i) 10% and 14%, respectively, compared to the prior quarter, and (ii) 12% and 24%, respectively, compared to the same prior year period, primarily due to lower sales and production volumes, partially offset by lower direct operating costs resulting from lower mine production due to the factors noted above.All-in sustaining costs per ounce sold of $1,450 were higher by (i) 11% compared to the prior quarter, and (ii) 16% compared to the same prior year period, primarily due to the lower sales volume noted above.Included in total cash costs and all-in sustaining costs was the positive impact of realized derivative gains of $8 per ounce produced and $9 per ounce sold, respectively (fourth quarter 2020 - $3 loss, and first quarter 2020 - $9 loss, respectively).Sustaining capital expenditures of $7.6 million included resource development of $2.2 million, capital spares of $1.9 million, mill equipment of $1.4 million, tailings management of $1.2 million, mobile equipment of $0.4 million and other sustaining projects of $0.5 million. Expansion capital expenditures of $10.8 million primarily included capitalized stripping of $7.3 million, Saramacca project of $2.4 million and camp room capacity increases of $0.9 million.OutlookThe 2021 attributable production guidance for Rosebel remains between 220,000 and 245,000 ounces. Additional site accommodations will allow for an increase in the workforce level which is expected to result in higher production in the second half of the year. Although improving, restricted manpower and the rainy season are expected to result in second quarter gold production at a level similar to the first quarter. The mined grades at Saramacca are expected to improve in the second half of the year but are expected to remain below reserve grade due to mine sequencing. The Company is expecting certain cost pressures, including higher diesel, power and haulage costs. Unit costs are expected to be lower in the second half of the year with the increase in production levels.Capital expenditures are expected to be approximately $125 million, comprising $50 million of sustaining and $75 million of expansion capital.Brownfield ExplorationDuring the first quarter 2021, the Company completed approximately 10,500 metres of diamond drilling, approximately 1,500 metres of geotechnical drilling, and approximately 1,300 metres of reverse circulation ("RC") drilling. Diamond drilling was focused on evaluating potential resource expansions in the vicinity of the existing operations as well as infill drilling at the Royal Hill and Rosebel pits. Geotechnical diamond drilling was completed for infrastructure planning and RC drilling was focused on regional exploration to evaluate various exploration targets along the Brokolonko – Saramacca trend. Approximately 61,000 metres of diamond and RC drilling is planned in 2021 to improve resource confidence, target resource expansions and continue to explore high priority exploration targets on the mining lease and surrounding exploration concessions.
IAMGOLD CORPORATIONFirst Quarter 2021 Management’s Discussion and Analysis 17

West Africa
Essakane District, Burkina FasoThe Essakane District includes the Essakane Mine, the Falagountou Deposit, and the surrounding mining lease and exploration concessions totaling approximately 1,000 square kilometres. Ongoing exploration programs continue to evaluate a number of prospects and target areas for the presence of mineralized zones which could have potential to support future satellite mining operations, within 15 kilometres of the Essakane mill.
Essakane Mine (IAMGOLD interest – 90%)1
Q1 2021 Q4 2020 Q1 2020Mine operating statisticsOre mined (000s t) 4,435 3,710 3,953 Waste mined (000s t) 10,437 9,816 11,250 Total material mined (000s t) 14,872 13,526 15,203 Strip ratio2 2.4 2.6 2.8 Ore milled (000s t) 3,189 3,266 3,230 Head grade (g/t) 1.34 1.34 1.01 Recovery (%) 82 81 90 Gold production (000s oz) 113 114 93 Attributable gold production (000s oz) – 90% 102 103 84 Gold sales (000s oz) 114 115 83 Performance measuresAverage realized gold price3 ($/oz) $ 1,793 $ 1,864 $ 1,604 Cost of sales ($/oz) $ 999 $ 993 $ 970 Royalties ($/oz) $ 89 $ 95 $ 76 Total cash costs3 ($/oz) $ 934 $ 928 $ 909 All-in sustaining costs3 ($/oz) $ 1,061 $ 1,153 $ 1,054 Capital expenditures ($ millions)Sustaining4 $ 5.4 $ 16.7 $ 5.6 Expansion $ 14.5 $ 20.7 $ 26.3 Total $ 19.9 $ 37.4 $ 31.9 Capitalized stripping (included in Sustaining and Expansion)5 $ 9.2 $ 15.6 $ 19.0
1 100% basis, unless otherwise stated.2 Strip ratio is calculated as waste mined divided by ore mined.3 On an attributable basis. This is a non-GAAP measure. Refer to the non-GAAP performance measures section of this MD&A.4 On an attributable basis, sustaining capital expenditures for the first quarter 2021 were $4.9 million (fourth quarter 2020 - $15.0 million, first quarter 2020 - $5.0
million).5 Includes expansion capitalized stripping for the first quarter 2021 of $9.2 million (fourth quarter 2020 - $15.6 million, first quarter 2020 - $19.0 million).
Q1 InsightsThe mill upgrade project was completed during the first quarter 2021 with an increase in screening capacity at the crushing area and optimization of the SAG mill shell liners. The new equipment is in place and optimization is ongoing with the intended annual hard rock capacity increase from 10.8 million tonnes to 11.7 million tonnes expected to be fully achieved before the end of the year. The main objective of the mill upgrade project is to improve crusher circuit capacity and de-bottleneck the mill in anticipation of increased volumes of hard rock and transitional material expected beginning in 2022. Similar to the fourth quarter 2020, gold production was positively impacted by higher grades as the mine sequenced through enriched zones at the bottom of the main pit, in combination with lower capitalized stripping. The higher grades were accompanied by graphitic content, which resulted in lower recoveries and increased consumption of reagents compared to the first quarter 2020. In order to mitigate the impact of complex ore on overall recovery, optimization of the gravity circuit was ongoing throughout the first quarter 2021. A geometallurgical study completed in 2018 continues to help identify pockets of graphitic material in the ore zones.Essakane experienced mechanical issues at one of the two conveyors that move ore from the crusher to the mill. This did not impact mill throughput as crushed ore was transferred to the mill using the second conveyor with the permanent repair expected to be completed in the second quarter.
IAMGOLD CORPORATIONFirst Quarter 2021 Management’s Discussion and Analysis 18

The site has commenced several continuous improvement initiatives to increase mine productivity, including the deployment of fuel trucks at the pits to reduce equipment downtime and provide a favourable offset to the longer hauling cycles as mining depth increases in the Essakane Main Zone. This initiative saved approximately 1,925 haul truck operating hours, allowing approximately an additional 540,000 tonnes to be moved in the quarter. Simulation training for truck operators and upgrades to lighter haul truck bodies are ongoing in order to maximize the hauling capacity of available equipment.Essakane implemented additional measures in the quarter to protect against COVID-19 that included thermal screening of all personnel and visitors entering the site and the Ouagadougou office. The 20-bed field hospital and medical confinement house established in Ouagadougou in 2020 remain to accommodate any future COVID-19 cases. Q1 PerformanceAttributable gold production of 102,000 ounces was (i) in line with the prior quarter as both periods benefited from higher grades noted above, and (ii) higher by 21% compared to the same prior year period, primarily due to higher head grades, partially offset by lower recoveries.Gold sales of 114,000 ounces were (i) in line with the prior quarter, and (ii) higher by 37% compared to the same prior year period, reflecting increased production and the postponement of gold shipments in the first quarter 2020 due to COVID-19 related border closures.Cost of sales per ounce sold of $999 and total cash costs per ounce produced of $934 were (i) in line with the prior quarter, and (ii) higher by 3% compared to the same prior year period, primarily due to lower capitalized stripping, higher consumption of reagents, higher energy prices, and higher royalties due to a higher realized gold price, partially offset by higher sales and production volumes.All-in sustaining costs per ounce sold of $1,061 were (i) lower by 8% compared to the prior quarter, primarily due to lower sustaining capital expenditures, and (ii) higher by 1% compared to the same prior year period, primarily due to higher cost of sales per ounce, partially offset by lower sustaining capital expenditures.There was no impact from realized derivatives to total cash costs per ounce produced and all-in sustaining costs per ounce sold for the first quarter 2021 (fourth quarter 2020 - $10 loss, and first quarter 2020 - $9 loss and $10 loss, respectively).Sustaining capital expenditures of $5.4 million primarily included capital spares of $2.9 million, security of $0.9 million and mobile and mill equipment of $0.8 million. Expansion capital expenditures of $14.5 million primarily included capitalized stripping of $9.2 million, community village resettlement of $1.6 million and the mill upgrade project costs of $1.0 million.OutlookAttributable production guidance for 2021 for Essakane remains between 365,000 and 390,000 ounces. Mine production is expected to continue at current levels and the site will commence strategic push backs resulting in increased capitalized stripping in the second half of the year. Mill feed will be supplemented by ore stockpiles and grades are expected to be lower than the first quarter for the remainder of the year. The Company will also be completing an updated internal study in the second half of the year with respect to its proposed future heap leach operation. Negotiations on Essakane's expiring three year collective labour agreement are expected to begin at the end of the second quarter.Capital expenditures are expected to be approximately $150 million, comprising $60 million of sustaining and $90 million of expansion capital. Capital expenditures are expected to increase in the second half of the year with higher capitalized stripping on strategic pushbacks.Brownfield ExplorationDuring the first quarter 2021, exploration activities focused on an air core drilling and sampling program over selected target areas on the Essakane mining lease and adjacent exploration concessions. The results of this program will be used to help guide future drilling programs targeting the discovery of new zones of shallow oxide mineralization proximal to the Essakane mill. Approximately 7,000 metres of diamond and RC drilling is planned in 2021 to evaluate the resource potential at select high-priority targets within trucking distance to Essakane, including GEM, Korizena, and Tassiri.
Bambouk DistrictThe Bambouk District includes the Boto Gold Project, the Karita Gold Project and the Diakha-Siribaya Gold Project.The Company is building on its exploration success along the Senegal-Mali Shear Zone with additional discoveries located within 15 kilometres of the Boto Gold Project in adjacent countries. Ongoing exploration programs include delineation drilling to upgrade and convert mineral resources to a higher confidence level at the Diakha deposit in Mali and support an initial resource estimate at the Karita discovery in Guinea, expected in 2022. To support this developing district, the Company continues to examine initiatives to identify synergies to support the evaluation of various potential development scenarios for these new discoveries in the Bambouk District.
Boto Gold Project, SenegalThe Boto Gold Project is a shovel ready development project located in southeastern Senegal along the border with Mali. The project is owned 90% by the Company, with the Republic of Senegal owning a 10% free carried interest. The project is located on an exploitation permit granted in 2020 for an initial 20 year period and is currently undergoing various de-risking activities as detailed below.
IAMGOLD CORPORATIONFirst Quarter 2021 Management’s Discussion and Analysis 19

During the first quarter 2021, project de-risking activities continued, with plant engineering advancing to approximately 75% complete. Activities included advancing access road and permanent camp construction, with camp facility contracts expected to be awarded in the second quarter 2021. Various geotechnical and hydrogeological assessments are underway which will be used to refine facility and pit design. Restrictions related to the COVID-19 pandemic eased during the fourth quarter 2020, and continue to allow work on site to progress with the proper controls and processes in place to ensure a safe working environment for all personnel and nearby communities. Capital expenditures during the first quarter totaled $14.5 million.Boto has implemented random antigen testing on site to provide additional protection for the workforce against COVID-19.
Q1 2021 Q4 2020 Q1 2020
Capital expenditures ($ millions) $ 14.5 $ 6.2 $ 2.2
OutlookIn 2021, capital expenditures are expected to total $60 million with an early works package that includes the completion of a road providing permanent access to the Boto site, engineering for critical plant equipment, and sustainability programs targeted to promote cohesion with local communities and ensure adequate environmental protections. These expenditures are being incurred in the process of de-risking and positioning the project for a future construction decision.
Karita Gold Project, GuineaThe Karita Gold Project is wholly-owned by IAMGOLD and was acquired in 2017 as a granted exploration permit that covers approximately 100 square kilometres, located in Guinea between the Company's Boto Gold Project in Senegal to the north, and its Diakha-Siribaya Gold Project in Mali to the south. During 2019, a first pass RC drilling program totaling approximately 1,800 metres was completed from which reported assay results confirmed a new discovery of mineralization along this portion of the Senegal-Mali Shear Zone. Assay highlights include: 29.0 metres grading 2.96 g/t Au; 21.0 metres grading 9.01 g/t Au; and 16.0 metres grading 3.17 g/t Au (see news release dated October 2, 2019). Approximately 20,000 metres of delineation drilling is planned in 2021 to support completion of a future initial resource estimate, targeted for 2022.
Diakha-Siribaya Gold Project, MaliThe Diakha-Siribaya Project is wholly-owned by IAMGOLD and consists of eight contiguous exploration permits which cover a total area of 596.5 square kilometres, located in the Kédougou-Kéniéba inlier of the West African Craton region of western Mali along the borders with Senegal and Guinea. During the first quarter 2021, the Company completed approximately 4,000 metres of diamond and RC drilling focused on infill drilling to upgrade resource confidence at the Diakha deposit as well as explore selected targets areas elsewhere on the property.Approximately 28,000 metres of infill drilling is planned in 2021 to upgrade inferred resources in support of ongoing evaluation studies of the Bambouk District as well as evaluate priority exploration targets for potential new zones of mineralization.
Discontinued Operations Mali - Yatela MineOn February 14, 2019, Sadiola Exploration Limited ("SADEX"), a subsidiary jointly held by the Company and AngloGold Ashanti Limited ("AGA"), entered into a share purchase agreement with the Government of Mali, as amended from time to time, whereby SADEX agreed to sell to the Government of Mali its 80% participation in Société d’Exploitation des Mines d’Or de Yatela ("Yatela"), for a consideration of $1. The transaction remains subject to the fulfillment of a number of conditions precedent, among which the adoption of two laws, one to create a state entity, and the other to create a dedicated state account for the sole purpose of financing the closure and rehabilitation of the Yatela mine as well as certain social projects to the benefit of the surrounding populations. As part of the transaction, and upon its completion, SADEX will make a one-time payment of approximately $37.0 million to the dedicated state account, corresponding to the estimated costs of completing the rehabilitation and closure of the Yatela mine, and also financing certain outstanding social programs. Upon completion and this payment being made, SADEX and its affiliated companies will be released of all obligations relating to the Yatela mine. The Company will fund approximately $18.5 million of the payment.At the end of the first quarter 2021, the Yatela disposal group continued to meet the criteria to be classified as held for sale as the Company remains confident that the conditions precedent will be fulfilled and the sale will close. The Yatela disposal group is presented as discontinued operations in the Consolidated statements of earnings (loss) and the Consolidated statements of cash flows.
IAMGOLD CORPORATIONFirst Quarter 2021 Management’s Discussion and Analysis 20

ExplorationThe Company was active at brownfield and greenfield exploration projects in nine countries located in West Africa and the Americas.In the first quarter 2021, expenditures for exploration and project studies totaled $10.4 million compared to $11.2 million in the prior quarter, and $10.9 million in the same prior year period, of which $7.3 million was expensed and $3.1 million was capitalized. Total exploration expenditures continue to reflect the impact of localized work restrictions and program curtailments experienced across some projects arising from the ongoing global COVID-19 pandemic. During the quarter, drilling activities on active projects and mine sites totaled approximately 40,000 metres. For additional information regarding the brownfield and greenfield exploration projects, refer to the Regions section. The Company's exploration guidance for 2021 is $56 million.
($ millions) Q1 2021 Q4 2020 Q1 2020Exploration projects - greenfield $ 5.5 $ 6.1 $ 6.0 Exploration projects - brownfield1 4.9 5.1 4.9
$ 10.4 $ 11.2 $ 10.9 1 Exploration projects - brownfield for the first quarter 2021 included near-mine exploration and resource development of $3.1 million (fourth quarter 2020 - $2.7
million, first quarter 2020 - $2.5 million).
Loma Larga, EcuadorThe Company, through its 35.5% equity ownership interest in INV Metals Inc., has an indirect interest in the Loma Larga gold, silver and copper project in southern Ecuador. During the first quarter 2021, the Company participated in a private placement and acquired an additional 4.8 million common shares at a price of C$0.45 per share for an aggregate amount of $1.7 million (C$2.2 million) to maintain a 35.5% ownership interest.
FINANCIAL CONDITION
Liquidity and Capital ResourcesAs at March 31, 2021, the Company had $967.8 million in cash and cash equivalents ($963.0 million) and short-term investments ($4.8 million). Restricted cash to guarantee the environmental indemnities related to Essakane totaled $37.5 million.As at March 31, 2021, the Company had C$215.3 million ($171.3 million) of uncollateralized surety bonds to guarantee the environmental indemnities related to the Doyon division and the Côté Gold Project, up $2.5 million compared to December 31, 2020.Uncollateralized performance bonds of C$39.1 million ($31.1 million) were outstanding to guarantee the Company's obligations in accordance with section 36 of the Fisheries Act (Canada) and the Connection and Cost Recovery Agreement related to the Côté Gold Project.Working capital as at March 31, 2021, was $976.9 million, down $83.8 million compared to December 31, 2020. The decrease was due to lower current assets ($29.6 million) and higher current liabilities ($54.2 million).Current assets as at March 31, 2021 were $1,365.9 million, down $29.6 million compared to December 31, 2020. The decrease was primarily due to lower receivables and other current assets ($27.8 million), inventories ($22.1 million), and short-term investments ($1.2 million), partially offset by higher cash and cash equivalents ($21.5 million). Current liabilities as at March 31, 2021 were $389.0 million up $54.2 million compared to December 31, 2020. The increase was primarily due to higher current portion of deferred revenue ($48.8 million), accounts payable and accrued liabilities ($6.6 million), income taxes payable ($2.6 million), and current portion of provisions ($2.2 million), partially offset by lower current portion of derivative liabilities ($6.0 million).
March 31, 2021 December 31, 2020Working capital1 ($ millions) $ 976.9 $ 1,060.7 Current working capital ratio2
3.5 4.2 1 Working capital is defined as current assets less current liabilities.2 Current working capital ratio is defined as current assets divided by current liabilities.
The following table summarizes the Company's long-term debt:
($ millions) Q1 2021 Q4 2020 Q1 20205.75% Senior Notes1 $ 441.7 $ 438.6 $ — 7% Senior Notes — — 400.2 Equipment Loans2 25.0 28.0 18.9
$ 466.7 $ 466.6 $ 419.1 1 The carrying amount of the long-term debt excludes unamortized deferred transaction costs of $7.0 million as at March 31, 2021 (December 31, 2020 - $7.2
million) and also excludes the embedded derivative.2 The carrying amount of the long-term debt excludes unamortized deferred transaction costs of $0.2 million as at March 31, 2021 (December 31, 2020 - $0.2
million).
IAMGOLD CORPORATIONFirst Quarter 2021 Management’s Discussion and Analysis 21

Debt Maturity Schedule¹
$36.4 $68.9 $53.6
$527.6
<1 yr 1-2 yrs 3-4 yrs >4 yrs
1 Includes principal and interest payments in $ millions.
To provide additional financial flexibility as it executes its growth strategy, in January 2019, the Company entered into a gold sale prepayment arrangement (the "Arrangement") with a syndicate of banks with a gold floor price of $1,300 per ounce and a cap price of $1,500 per ounce. Pursuant to the Arrangement, the Company received a cash prepayment of $169.8 million in December 2019 in exchange for delivering 150,000 ounces of gold in 2022. The cost of the Arrangement is 5.38% per annum.In April 2021, the Company entered into gold sale prepayment arrangements at an average cost of 4.44% per annum in respect of 50,000 gold ounces at an average price of $1,753 per ounce, which will result in a total prepayment to the Company of $80.3 million over the course of 2022 and the requirement on the part of the Company to physically deliver such ounces to the counterparties over the course of 2024. These transactions have the effect of rolling one-third of the Arrangement from 2022 to 2024, with the new gold deliveries occurring after the completion of the construction of the Côté Gold Project.In September 2020, the Company completed the issuance of $450 million of Senior Notes at face value with an interest rate of 5.75% per annum (the "Notes"). The Notes are denominated in U.S. dollars and mature on October 15, 2028. Interest is payable in arrears in equal semi-annual installments on April 15 and October 15 of each year, beginning on April 15, 2021. The Company’s interest payment on April 15, 2021 totaled $14.5 million. The Notes are guaranteed by certain of the Company's subsidiaries. The Company incurred transaction costs of $7.5 million which have been capitalized and offset against the carrying amount of the Notes within Long-term debt in the Consolidated balance sheets and are being amortized using the effective interest rate method.The Company has a $500 million secured credit facility, which was entered into in December 2017 and amended in February 2021 to primarily extend the maturity date to January 31, 2025 for $490 million of the available credit. As at March 31, 2021, the Company had letters of credit in the amount of $1.8 million issued under the credit facility to guarantee certain environmental indemnities and $498.2 million was available under the credit facility resulting in available liquidity at March 31, 2021 of $1,466 million.In addition to the gold sale prepayment arrangements noted above, the Company previously announced that, under appropriate conditions, it may enter into derivative contracts in respect of up to an additional 25% of total annual production to mitigate financial exposures during the construction of the Côté Gold Project between 2021 and mid-2023. Refer to the Market Risk section - Summary of Hedge Portfolio for the outstanding gold bullion derivative contracts. Periodically, the Company reviews opportunities to return capital to its shareholders including through dividends or a share buy back program in the context of market conditions, share price, its financial position, capital requirements, forecast performance and realized gold prices. The Company is committed to delivering superior shareholder returns, with the current focus on developing its top-tier Côté Gold Project. The project requires significant capital investment funded by the Company's current available liquidity and future cash flows from operations. As the project becomes operational, dependent on the gold price environment, the Company expects to generate significant free cash flow. This could allow the Company to consider returns to shareholders through instituting a sustainable dividend or a share repurchase program that would recognize the interests of its shareholders in the Company’s anticipated strong performance while balancing capital allocation between future growth and distributions to shareholders.
Contractual ObligationsAs at March 31, 2021, contractual obligations with various maturities were $1,365.9 million, primarily comprising expected future contractual payments of long-term debt, purchase obligations, capital expenditure obligations and lease obligations. Management believes these obligations will be met through available cash resources and net cash from operating activities.The Company uses derivative contracts to hedge for risk management purposes. Details of these contracts are included in the Market Risk section - Summary of Hedge Portfolio.
IAMGOLD CORPORATIONFirst Quarter 2021 Management’s Discussion and Analysis 22

Cash Flow
($ millions) Q1 2021 Q4 2020 Q1 2020Net cash from (used in) per consolidated interim financial statements:
Operating activities $ 101.7 $ 128.7 $ 44.0 Investing activities (63.3) (78.0) (64.1) Financing activities (14.2) (9.0) (7.3)
Effects of exchange rate fluctuation on cash and cash equivalents (2.7) 9.2 (8.2) Increase (decrease) in cash and cash equivalents 21.5 50.9 (35.6) Cash and cash equivalents, beginning of the period 941.5 890.6 830.6 Cash and cash equivalents, end of the period $ 963.0 $ 941.5 $ 795.0
Operating ActivitiesNet cash from operating activities for the first quarter 2021 was $101.7 million, a decrease of $27.0 million from the prior quarter, primarily due to lower earnings after non-cash adjustments ($29.5 million), lower dividends received from related parties ($8.2 million), partially offset by lower income taxes paid ($8.9 million) and higher cash receipts from settlement of derivatives ($3.5 million).Compared to the first quarter 2020, the increase of $57.7 million resulted primarily from higher earnings after non-cash adjustments ($8.4 million), favourable movements in non-cash working capital items, primarily resulting from a decrease in receivables and other current assets ($38.8 million) primarily from receipts for value added tax and a decrease in inventory and non-current ore stockpiles ($10.0 million), and higher cash receipts from settlement of derivatives ($3.5 million).The first quarter 2021 movements in non-cash working capital items and non-current ore stockpiles is an inflow of $19.2 million which is broken down as follows:• Receivables and other current assets were an inflow of $31.7 million, primarily due to receipts for value added tax;• Inventories and non-current ore stockpiles were an inflow of $0.4 million; and• Accounts payable and accrued liabilities were an outflow of $12.9 million, primarily related to the settlement of supplier
invoices and the payment of the bonus liability.
Investing ActivitiesNet cash used in investing activities for the first quarter 2021 was $63.3 million, a decrease of (i) $14.7 million from the prior quarter, primarily due to proceeds from the sale of the Company's non-core royalty portfolio ($35.7 million), partially offset by proceeds from the sale of Sadiola in the fourth quarter 2020 ($25.0 million); and (ii) $0.8 million from the same prior year period, primarily due to an increase in capital expenditures for property, plant and equipment ($34.4 million), offset by proceeds from the sale of the Company's non-core royalty portfolio ($35.7 million).
Financing ActivitiesNet cash used in financing activities for the first quarter 2021 was $14.2 million, an increase of (i) $5.2 million from the prior quarter, primarily due to dividends paid to non-controlling interest ($4.3 million) and an increase in other financing activities ($1.6 million); and (ii) $6.9 million from the same prior year period, primarily due to dividends paid to non-controlling interest ($4.3 million) and an increase in lease obligations, equipment loans, and other financing activities.
Market TrendsGlobal Financial Market Conditions and Gold PriceGold started the year on a strong note, making a high of $1,959 in January 2021. Rising U.S. treasury rates saw the precious metal drift to a low of $1,677 in March. Growing optimism that the worst of the COVID-19 pandemic was over may have also diminished investors’ interest in allocating gold in their risk mitigation strategies, as they had been doing under more uncertain market conditions in the previous year.The price of gold is a key driver of the Company’s profitability. The average and closing market gold price and the Company’s average realized gold price in the first quarter 2021 are set out below. The Company’s hedging strategy is designed to mitigate gold price risk during the Côté Gold Project construction period. Refer to the Market Risk section for more information.
Q1 2021 Q4 2020 Q1 2020Average market gold price ($/oz) $ 1,794 $ 1,874 $ 1,583 Average realized gold price1 ($/oz) $ 1,781 $ 1,865 $ 1,603 Closing market gold price ($/oz) $ 1,691 $ 1,888 $ 1,609
1 This is a non-GAAP measure. Refer to the non-GAAP performance measures section of this MD&A.
IAMGOLD CORPORATIONFirst Quarter 2021 Management’s Discussion and Analysis 23

Currency and Oil PricesThe U.S. dollar is the Company’s functional currency. The Company's revenues are denominated in U.S. dollars as gold is priced in U.S. dollars. The Company’s main exposures are to the Canadian dollar and oil prices, which have a direct impact on the Company’s Canadian and international mining activities and operations.The Canadian dollar appreciated approximately 1% against the U.S. dollar in the first quarter 2021 compared to the prior quarter. Interest rate cuts in the U.S. in 2020 have brought U.S. Treasury yields to a lower premium over those in other countries. This low treasury yield trend continued to persist in 2021 and has made the U.S. dollar less attractive against the Canadian dollar.The Company has minimal exposure to euro denominated operational and capital expenditures in West Africa as it sells a portion of its gold in euros.The Company's Canadian dollar exposures relate to operational and capital expenditures in Canada. The Company’s hedging strategy is designed to mitigate the risk of exposure to exchange rate volatility of the Canadian dollar. Refer to the Market Risk section for more information.The price of Brent and WTI were approximately 22% higher than in the prior quarter. Expectations of strong demand for goods and services with the global roll-out of COVID-19 vaccines contributed to the surge in crude prices in the first quarter 2021. The Company's oil exposures relate primarily to its mining operations in West Africa and South America. The Company’s hedging strategy is designed to mitigate the risk of oil price appreciation given it is a significant input cost in the production of gold. Refer to the Market Risk section for more information.
Q1 2021 Q4 2020 Q1 2020Average rates
USDCAD 1.2661 1.3027 1.3444 EURUSD 1.2053 1.1930 1.1026
Closing rates
USDCAD 1.2572 1.2754 1.4120 EURUSD 1.1743 1.2228 1.1021
Average Brent price ($/barrel) $ 61 $ 45 $ 51 Closing Brent price ($/barrel) $ 64 $ 52 $ 23 Average WTI price ($/barrel) $ 58 $ 43 $ 46 Closing WTI price ($/barrel) $ 59 $ 49 $ 20
Sensitivity ImpactThe following table provides estimated cost per ounce sensitivities around certain inputs, excluding the impact of the Company’s hedging program which can affect the Company’s operating results, assuming guided 2021 production levels:
Change of Annualized impact on Cost of Sales $/oz
Annualized impact on Total Cash Costs1 $/oz
Annualized impact on All-in Sustaining Costs1 $/oz
Gold price2 $100/oz $7/oz $7/oz $7/ozOil price $10/barrel $13/oz $13/oz $15/ozUSDCAD $0.10 $10/oz $10/oz $15/ozEURUSD $0.10 $14/oz $14/oz $20/oz
1 This is a non-GAAP measure. Refer to the non-GAAP performance measures section of this MD&A. Total cash costs and all-in sustaining costs consist of Essakane, Rosebel and Westwood on an attributable basis.
2 Gold price sensitivities relate to royalty cost arrangements and additional costs with a gold price link, which are included in total cost of sales, cash costs and all-in sustaining costs.
Market RiskMarket risk is the risk that the fair value or future cash flows of a financial instrument will fluctuate because of changes in market prices. For hedging activities, it is the risk that the fair value of a derivative might be adversely affected by a change in underlying commodity prices or currency exchange rates and that this in turn affects the Company’s financial condition. The Company establishes trading agreements with counterparties under which there is no requirement to post any collateral or make any margin calls on derivatives. Counterparties cannot require settlement solely because of an adverse change in the fair value of a derivative.
IAMGOLD CORPORATIONFirst Quarter 2021 Management’s Discussion and Analysis 24

Currency Exchange Rate RiskThe Company’s functional currency is the U.S. dollar which creates currency exchange risk exposure primarily associated with its expenditures denominated in Canadian dollars and euros. To manage this risk, the Company uses various hedging strategies, including selling a portion of its gold in euros to create a natural off-set to the exposure, and derivative contracts such as forwards or options. Option contracts can be combined through the use of put option contracts and call option contracts (collar structure), within a range of expiry dates and strike prices.
Oil Contracts and Fuel Market Price RiskBrent and West Texas Intermediate (“WTI”) are components of diesel and fuel oil which are among the key inputs impacting the Company’s costs. To manage the risk associated with the fluctuation in the costs of these commodities, the Company uses various hedging strategies, such as the use of options. Option contracts can be combined through the use of put option contracts and call option contracts (collar structure), within a range of expiry dates and strike prices.
Gold Contracts and Market Price RiskThe Company’s primary source of revenue is gold. To manage the risk associated with the fluctuation in the price of gold, the Company uses various hedging strategies, such as the use of call option contracts. Option contracts can also be combined with the use of put option contracts and call option contracts (collar structure), within a range of expiry dates and strike prices. The Company’s hedging strategy is designed to mitigate gold price risk during the Côté Gold Project construction period.
Summary of Hedge PortfolioAt March 31, 2021, the Company’s outstanding hedge derivative contracts were as follows:
2021 2022 2023 2024Foreign Currency1
Canadian dollar contracts (millions of C$M) 234 210 185Rate range2 (USDCAD) 1.28 - 1.47 1.30 - 1.48 1.30 - 1.46Hedge ratio 40% 29% 33%
Commodities1,3,4
Brent oil contracts (barrels)5 441 520 428 270Contract price range ($/barrel of crude oil) 54 - 65 50 - 65 41 - 65 41 - 55Hedge ratio 77% 69% 57% 37%
WTI oil contracts (barrels)5 447 573 473 270Contract price range ($/barrel of crude oil) 31 - 62 38 - 62 36 - 60 38 - 50Hedge ratio 89% 92% 71% 40%
Gold bullion contracts (ounces)6 145 18 24Contract price range ($/ounce) 1,600 - 3,000 1,800 - 3,000 1,700 - 2,700
1 The Company executed currency and fuel hedges due to favourable market conditions relative to internal planning rates.2 The Company executed Canadian dollar collar options, which consist of Canadian dollar call and put options within the given range in 2021 through 2023. The
Company will recognize a gain from the difference between a lower market price and the Canadian dollar call strike price. The Company will incur a loss from the difference between a higher market price and the Canadian dollar put strike price.
3 The Company executed Brent and WTI collar options, which consist of Brent and WTI put and call options with strike prices within the given range in 2021 through 2024. The Company will incur a loss from the difference between a lower market price and the put strike price. The Company will recognize a gain from the difference between a higher market price and the call strike price.
4 The Company executed gold collar options, which consist of gold put and call options with strike prices within the given range in 2021 and 2023. The Company will incur a loss from the difference between a higher market price and the call strike price. The Company will recognize a gain from the difference between a lower market price and the put strike price. Gold hedges in 2022 do not include the 150,000 ounces which the Company has committed to deliver to its counterparties under the Arrangement.
5 Quantities of barrels are in thousands.6 Quantities of ounces are in thousands.
During the first quarter 2021, the Company executed gold collar option contracts in the range of $1,700 to $2,700 per ounce, from January to June 2023 to hedge its gold revenue. The premium paid for these contracts was $1.1 million. The Company also hedged C$45 million of the Côté Gold Project’s Canadian dollar exposure at an average forward contract rate of $1.28 from April to October 2021.Subsequent to the end of the first quarter 2021, the Company entered into gold sale prepayment arrangements at an average cost of 4.44% per annum in respect of 50,000 gold ounces at an average price of $1,753 per ounce, which will result in a total prepayment to the Company of $80.3 million over the course of 2022 and the requirement on the part of the Company to physically deliver such ounces over the course of 2024. These transactions had the effect of rolling one-third of the Arrangement from 2022 to 2024, after the completion of the construction of the Côté Gold Project.
IAMGOLD CORPORATIONFirst Quarter 2021 Management’s Discussion and Analysis 25

Shareholders' Equity
Number issued and outstanding (millions) March 31, 2021 April 30, 2021Common shares 476.5 476.6 Share options1 5.2 5.1
1 Refer to note 23 of the consolidated interim financial statements for all outstanding equity awards.
QUARTERLY FINANCIAL REVIEW
2021 2020 2019($ millions, except where noted) Q1 Q4 Q3 Q2 Q1 Q4 Q3 Q2Revenues $ 297.4 $ 347.5 $ 335.1 $ 284.6 $ 274.5 $ 293.4 $ 274.4 $ 246.5 Net earnings (loss) from continuing operations1 $ 21.7 $ 68.0 $ (7.7) $ 27.3 $ (32.9) $ (291.1) $ (8.4) $ (18.5) Net earnings (loss) from discontinued operations $ — $ 4.1 $ — $ — $ — $ (50.1) $ 7.2 $ 4.2
Net earnings (loss) attributable to equity holders $ 19.5 $ 63.1 $ (11.6) $ 25.5 $ (34.4) $ (353.9) $ (3.0) $ (14.4) Basic and diluted earnings (loss) per share attributable to equity holders $ 0.04 $ 0.13 $ (0.02) $ 0.05 $ (0.07) $ (0.76) $ — $ (0.03)
1 In the fourth quarter 2019, Net loss from continuing operations was higher primarily due to impairment charges, net of reversal.
DISCLOSURE CONTROLS AND PROCEDURES AND INTERNAL CONTROL OVER FINANCIAL REPORTING
Disclosure Controls and ProceduresThe Company’s disclosure controls and procedures are designed to provide reasonable assurance that all relevant information is communicated to senior management to allow timely decisions regarding required disclosure. An evaluation of the effectiveness of the Company’s disclosure controls and procedures, as defined under the rules of the Canadian Securities Administration, was conducted as at December 31, 2020 under the supervision of the Company’s Disclosure Committee and with the participation of management. Based on the results of that evaluation, the Chief Executive Officer ("CEO") and Chief Financial Officer ("CFO") concluded that the Company’s disclosure controls and procedures were effective as at December 31, 2020 providing reasonable assurance that the information required to be disclosed in the Company’s annual filings, interim filings or other reports filed or submitted by it under securities legislation is recorded, processed, summarized and reported in accordance with securities legislation. Since the December 31, 2020 evaluation, there have been no material changes to the Company's disclosure controls and procedures and their design remains effective.
Internal Control over Financial ReportingInternal control over financial reporting is designed to provide reasonable assurance regarding the reliability of the Company’s financial reporting and the preparation of consolidated financial statements in compliance with IFRS as issued by the International Accounting Standards Board ("IASB"). The Company’s internal control over financial reporting includes policies and procedures that:• pertain to the maintenance of records that accurately and fairly reflect the transactions of the Company;• provide reasonable assurance that transactions are recorded as necessary to permit preparation of consolidated financial
statements in accordance with IFRS as issued by the IASB; • ensure the Company’s receipts and expenditures are made only in accordance with authorization of management and the
Company’s directors; and• provide reasonable assurance regarding prevention or timely detection of unauthorized transactions that could have a
material effect on the consolidated financial statements.An evaluation of the effectiveness of the Company’s internal control over financial reporting, including an evaluation of material changes that may have materially affected or are reasonably likely to have materially affected the internal controls over financial reporting based on the criteria established in Internal Control - Integrated Framework (2013) issued by the Committee of Sponsoring Organizations of the Treadway Commission, was conducted as of December 31, 2020 by the Company’s management, including the CEO and CFO. Based on this evaluation, management, including the CEO and the CFO, has concluded that the Company’s internal control over financial reporting was effective as of December 31, 2020.There have been no material changes in the Company's internal control over financial reporting or in other factors that could affect internal controls during the first quarter 2021 and their design remains effective.
Limitations of Control and ProceduresThe Company’s management, including the CEO and CFO believe that any disclosure controls and procedures and internal controls over financial reporting, no matter how well designed, can have inherent limitations. Therefore, even those systems determined to be effective can provide only reasonable assurance that the objectives of the control system are met.
IAMGOLD CORPORATIONFirst Quarter 2021 Management’s Discussion and Analysis 26

CRITICAL JUDGMENTS, ESTIMATES AND ASSUMPTIONS
The Company’s management makes judgments in its process of applying the Company’s accounting policies in the preparation of its consolidated financial statements. In addition, the preparation of financial data requires that the Company’s management make assumptions and estimates of effects of uncertain future events on the carrying amounts of the Company’s assets and liabilities at the end of the reporting period and the reported amounts of revenues and expenses during the reporting period. Actual results may differ from those estimates as the estimation process is inherently uncertain. Estimates are reviewed on an ongoing basis based on historical experience and other factors that are considered to be relevant under the circumstances. Revisions to estimates and the resulting effects on the carrying amounts of the Company’s assets and liabilities are accounted for prospectively.The critical judgments, estimates and assumptions applied in the preparation of the Company's consolidated financial statements are reflected in note 3 of the Company's audited annual consolidated financial statements for the year ended December 31, 2020.
Qualified Person and Technical InformationThe technical and scientific information relating to exploration activities disclosed in this document was prepared under the supervision of and verified and reviewed by Craig MacDougall, P.Geo., Executive Vice President, Growth, IAMGOLD. Mr. MacDougall is a Qualified Person as defined by National Instrument 43-101.Data verification involves data input and review by senior project geologists at site, scheduled weekly and monthly reporting to senior exploration management and the completion of project site visits by senior exploration management to review the status of ongoing project activities and data underlying reported results. All drilling results for exploration projects or supporting resource and reserve estimates referenced in this MD&A have been previously reported in news release disclosures either by the Company or the project operator as the case may be (see referenced news releases), and have been prepared in accordance with National Instrument 43-101 Standards of Disclosure for Mineral Projects. The sampling and assay data from drilling programs are monitored through the implementation of a quality assurance - quality control (QA-QC) program designed to follow industry best practice. Drill core (HQ and NQ size) samples are selected by the project geologists and sawn in half with a diamond saw at the project site. Half of the core is typically retained at the site for reference purposes. Generally, sample intervals are 1.0 to 1.5 metres in length and reverse circulation holes are sampled at 1.0 metre intervals at the drill rig. Samples are prepared and analyzed at site for the Company's producing mines and at accredited regional laboratories for the Company's exploration projects, using analysis techniques such as standard fire assay with a 50 gram charge; fire assay with gravimetric finish, or LeachWELL rapid cyanide leach with fire assay with a 50 gram charge.
NEW ACCOUNTING STANDARDS
For a discussion of new accounting standards adopted and new accounting standards issued but not yet effective that may impact the Company, refer to note 3 of the Company’s consolidated interim financial statements.
RISKS AND UNCERTAINTIES
The Company is subject to various business, financial and operational risks which could materially adversely affect the Company’s future business, operations and financial condition and could cause such future business, operations and financial condition to differ materially from the forward-looking statements and information contained in this MD&A and as described in the Cautionary Statement on Forward-Looking Information found in this document.Readers of this MD&A should consider the information included or incorporated by reference in this document and the consolidated interim financial statements. The nature of the Company’s activities and the locations in which it operates mean that the Company’s business generally is exposed to significant risk factors, known and unknown, many of which are beyond its control. Managing these risks is a key component of the Company’s business strategy and is supported by a risk management culture and an effective enterprise risk management (“ERM”) approach. The Company’s view of risks is not static. An important component of the Company's ERM approach is to ensure key risks which are evolving or emerging are appropriately identified, managed, and incorporated into existing ERM assessment, measurement, monitoring, reporting, and mitigation processes. For a comprehensive discussion of the risk factors that affect the Company and its business, please refer to the Company’s latest annual information form ("AIF"), filed with Canadian securities regulatory authorities at www.sedar.com and filed under Form 40-F with the United States Securities Exchange Commission at www.sec.gov/edgar.html and the 2020 year-end audited consolidated financial statements. These risk disclosures are incorporated by reference herein.
IAMGOLD CORPORATIONFirst Quarter 2021 Management’s Discussion and Analysis 27

The principal risks and uncertainties to the Company’s business, financial condition and/or results of operations that were new, elevated or remain elevated in the first quarter 2021 are described above under Market Risk and below:
Labour DisruptionsThe Company is dependent on its workforce to extract and process minerals and labour disruptions at any of the Company’s material properties could have a material adverse impact on its business, results of operations and financial condition. A number of the Company’s employees are represented by labour unions under various collective labour agreements. However, these agreements may not prevent a strike or work stoppage at the Company’s facilities in the future, and any such strike or work stoppage, including ones that result from unsuccessful negotiations with respect to labour agreements, could have a material adverse effect on the Company’s earnings, financial condition and/or operating results. The collective labour agreement with the Rosebel labour union expired in August 2020 and negotiations for the renewal of the collective agreement are still in progress. In addition, the collective labour agreement with the Essakane labour union expires in June 2021, with negotiations expected to start in May 2021. Until the final agreements are signed, there is uncertainty on how the results from negotiations with respect to these new labour agreements will impact the Company’s future operational and financial plans.
Geotechnical Risk Mining operations have inherently high geotechnical risks for both underground and open pit operations. Underground workings, pit slopes, ore waste dumps or stockpiles, and other excavations may be subject to local or widespread geotechnical failure due to numerous factors, such as over-steepening, seismically induced destabilization, water saturation, material degradation, settling, overtopping, foundation failure or other factors. The occurrence of one or more of these events could result in the longer or permanent closure of all or part of a mining operation, injuries to mine personnel or others, and/or damage to mine infrastructure, equipment or facilities. The ground conditions continue to generate seismic events of different magnitude, impacting the development and progression of production at the Westwood mine. The ore body remains very complex and challenging, despite the significant work carried out to optimize the mining methods, cost structure and refocus the mining activities to deliver operating results safely and as planned. The mine continues to experience seismic events and, after the most recent seismic activity in October 2020, underground operations were suspended to allow for the completion of additional studies including geotechnical and other reviews. A business recovery plan is in progress and a rehabilitation plan is currently underway. The Company is expecting to make a decision in the second quarter 2021 with respect to a possible targeted safe restart in the second half of the year. Although the annual production plans have been adjusted accordingly, there can be no assurance that the current plans can be achieved, and the production could potentially be below the estimated levels. The Company's guidance incorporates underground production from the Westwood mine commencing in the second half of 2021.In addition, the Company's open pit mines could be affected by pit walls instability, rock fall, landslides, major mine wall failure, and pit flooding due to extreme weather events including unseasonal and/or intense rainfall events. An unusual amount of rain has been recorded during the first quarter 2021 at Rosebel and has continued into the second quarter, impacting the operational plans and slowing down production. To mitigate the risk, detailed engineering plans are in place to ensure continuous monitoring of the ground controls, pit infrastructure and water management. However, there can be no assurance that the current mitigation plans will prevent any material impact to the Company’s operations.
Major Equipment Failure The Company’s Essakane and Rosebel mines have been in operation for more than ten years. The ageing equipment and infrastructure is a significant risk for the operations. A major failure of one or more of the critical equipment at the operating mines could lead to a production stoppage that could have a material adverse effect on the Company’s operations. Prolonged usage, associated with unfavorable environmental conditions such as extreme weather-related events and high humidity and dust levels, could lead to a more rapid deterioration of infrastructure and properties, key mobile and mill equipment such as the shovels, SAG mill or the ball mill. In March 2021, Essakane experienced the breakdown of a conveyor structure, however the rapid implementation of an alternative method to continue mill feed after this breakdown ensured that there was minimal impact on production. Although the Company conducts extensive maintenance and monitoring, and incurs significant costs to maintain the Company’s equipment and infrastructure, unanticipated failures or damage, may occur that could expose the personnel to serious occupational and workplace accidents, and could cause temporary or permanent closure of all or part of the operation. These events may result in significant losses as well as substantial costs to respond to and recover from the event, and possibly to modify existing or future infrastructure requirements to prevent recurrence.
IAMGOLD CORPORATIONFirst Quarter 2021 Management’s Discussion and Analysis 28

NON-GAAP1 PERFORMANCE MEASURES
The Company uses certain non-GAAP financial performance measures in its MD&A, which are described in the following section.
Gold MarginThe Company’s MD&A refers to gold margin per ounce, a non-GAAP performance measure, in order to provide investors with information about the measure used by management to monitor the performance of its gold mines. The information allows management to assess how well the gold mines are performing, relative to the plan and to prior periods, as well as assess the overall effectiveness and efficiency of gold operations.In periods of volatile gold prices, profitability changes with altering cut-off gold grades. Such a decision to alter the cut-off gold grade will typically result in a change to total cash costs per ounce, but it is equally important to recognize gold margins also change at a similar rate. While mining lower-grade ore results in less gold being processed in any given period, over the long-run it allows the Company to optimize the production of profitable gold, thereby maximizing the Company’s total financial returns over the life of the mine to maximize the total value of the asset going forward. At the same time, the site operating teams seek to achieve the best performance in terms of cost per tonne mined, cost per tonne processed and overheads.Gold margin per ounce does not have any standardized meaning prescribed by IFRS, is unlikely to be comparable to similar measures presented by other issuers, and should not be considered in isolation or as a substitute for measures of performance prepared in accordance with IFRS.
($/oz of gold) Q1 2021 Q4 2020 Q1 2020Average realized gold price1 $ 1,781 $ 1,865 $ 1,603 Total cash costs2,3 1,052 998 993 Gold margin $ 729 $ 867 $ 610
1 Refer to page 30 for calculation.2 Refer to page 32 for calculation.3 Consists of Essakane, Rosebel and Westwood on an attributable basis.
Net Cash from Operating Activities before Changes in Working CapitalThe Company makes reference to a non-GAAP performance measure for net cash from operating activities before changes in working capital. Working capital can be volatile due to numerous factors, including a build-up or reduction of inventories. Management believes by excluding these non-cash items, this non-GAAP measure provides investors with the ability to better evaluate the operating cash flow performance of the Company.Net cash from operating activities before changes in working capital does not have any standardized meaning prescribed by IFRS, may not be comparable to similar measures presented by other issuers, and should not be considered in isolation or as a substitute for measures of performance prepared in accordance with IFRS.The following table provides a reconciliation of net cash from operating activities before changes in working capital to net cash from operating activities.
($ millions, except where noted) Q1 2021 Q4 2020 Q1 2020Net cash from operating activities $ 101.7 $ 128.7 $ 44.0 Adjusting items from non-cash working capital items and non-current ore stockpiles
Receivables and other current assets (31.7) 4.5 8.0 Inventories and non-current ore stockpiles (0.4) (13.3) 9.7 Accounts payable and accrued liabilities 12.9 (11.9) 11.1
Net cash from operating activities before changes in working capital $ 82.5 $ 108.0 $ 72.8
__________________________1 GAAP - Generally accepted accounting principles.
IAMGOLD CORPORATIONFirst Quarter 2021 Management’s Discussion and Analysis 29

Mine-Site Free Cash FlowMine-site free cash flow is a non-GAAP financial performance measure calculated as cash flow from mine-site operating activities less mine-site related property, plant and equipment expenditures. The Company believes this measure is useful to investors in assessing the Company's ability to operate its mine sites without reliance on additional borrowing or usage of existing cash. Mine-site free cash flow does not have any standardized meaning prescribed by IFRS, may not be comparable to similar measures presented by other issuers, and should not be considered in isolation or as a substitute for measures of performance prepared in accordance with IFRS.
($ millions, except where noted) Q1 2021 Q4 2020 Q1 2020Net cash from operating activities $ 101.7 $128.7 $44.0Adjusting items:
Operating cash flow used by non-mine site activities 27.1 10.8 27.1Cash flow from operating mine sites $ 128.8 $139.5 $71.1
Capital expenditures for property, plant and equipment $ 102.5 $ 106.4 $ 67.5 Adjusting items:
Capital expenditures from construction and development projects and corporate (63.2) (44.6) (10.5)
Capital expenditure from operating mine-sites $ 39.3 $ 61.8 $ 57.0 Mine-site free cash flow $ 89.5 $ 77.7 $ 14.1
Average Realized Gold Price per Ounce SoldAverage realized gold price per ounce sold is intended to enable management to understand the average realized price of gold sold in each reporting period after removing the impact of non-gold revenues and by-product credits.Average realized gold price per ounce sold does not have any standardized meaning prescribed by IFRS, may not be comparable to similar measures presented by other issuers, and should not be considered in isolation or as a substitute for measures of performance prepared in accordance with IFRS.The following table provides a reconciliation of average realized gold price per ounce sold to revenues as per the consolidated interim financial statements.
($ millions, except where noted) Q1 2021 Q4 2020 Q1 2020Revenues $ 297.4 $ 347.5 $ 274.5 Gold hedging losses (gains) 0.5 — — By-product credit and other revenues (0.4) (0.6) (1.1) Revenues $ 297.5 $ 346.9 $ 273.4 Sales (000s oz) 167 185 171 Average realized gold price per ounce1,2 ($/oz) $ 1,781 $ 1,865 $ 1,603
1 Average realized gold price per ounce sold may not calculate based on amounts presented in this table due to rounding. 2 Average realized gold price per ounce sold, consists of Essakane, Rosebel and Westwood.
IAMGOLD CORPORATIONFirst Quarter 2021 Management’s Discussion and Analysis 30
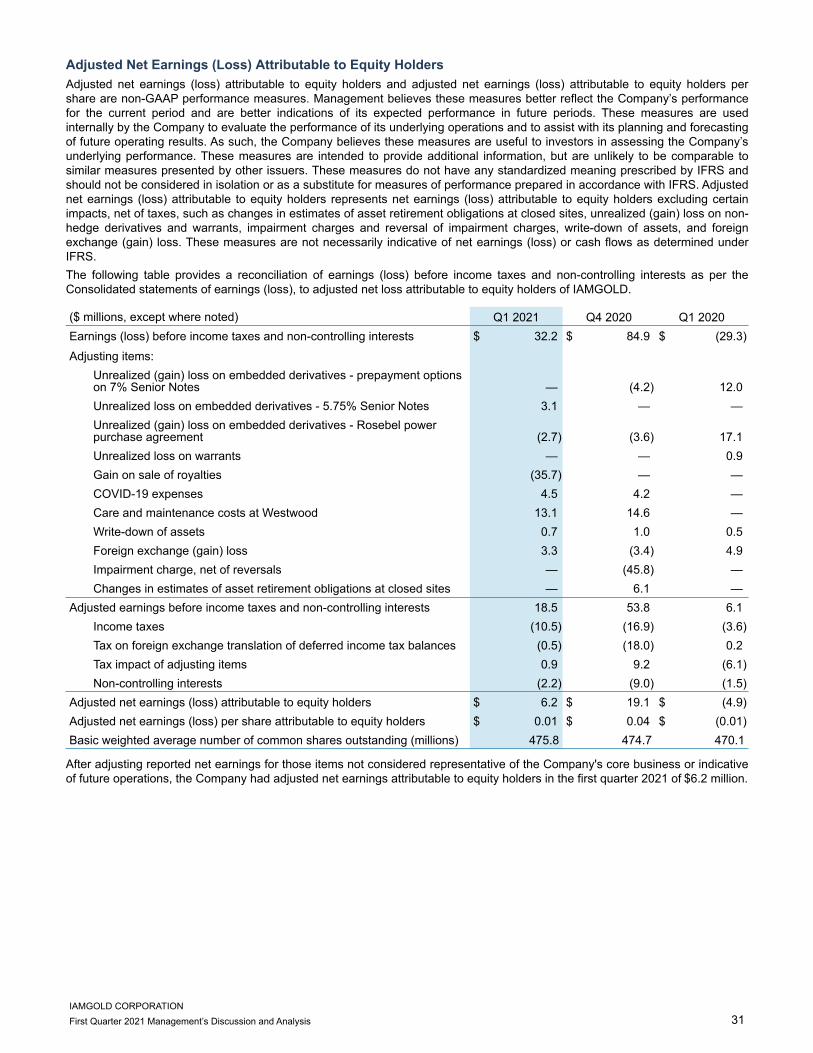
Adjusted Net Earnings (Loss) Attributable to Equity HoldersAdjusted net earnings (loss) attributable to equity holders and adjusted net earnings (loss) attributable to equity holders per share are non-GAAP performance measures. Management believes these measures better reflect the Company’s performance for the current period and are better indications of its expected performance in future periods. These measures are used internally by the Company to evaluate the performance of its underlying operations and to assist with its planning and forecasting of future operating results. As such, the Company believes these measures are useful to investors in assessing the Company’s underlying performance. These measures are intended to provide additional information, but are unlikely to be comparable to similar measures presented by other issuers. These measures do not have any standardized meaning prescribed by IFRS and should not be considered in isolation or as a substitute for measures of performance prepared in accordance with IFRS. Adjusted net earnings (loss) attributable to equity holders represents net earnings (loss) attributable to equity holders excluding certain impacts, net of taxes, such as changes in estimates of asset retirement obligations at closed sites, unrealized (gain) loss on non-hedge derivatives and warrants, impairment charges and reversal of impairment charges, write-down of assets, and foreign exchange (gain) loss. These measures are not necessarily indicative of net earnings (loss) or cash flows as determined under IFRS.The following table provides a reconciliation of earnings (loss) before income taxes and non-controlling interests as per the Consolidated statements of earnings (loss), to adjusted net loss attributable to equity holders of IAMGOLD.
($ millions, except where noted) Q1 2021 Q4 2020 Q1 2020Earnings (loss) before income taxes and non-controlling interests $ 32.2 $ 84.9 $ (29.3)
Adjusting items:Unrealized (gain) loss on embedded derivatives - prepayment options on 7% Senior Notes — (4.2) 12.0 Unrealized loss on embedded derivatives - 5.75% Senior Notes 3.1 — — Unrealized (gain) loss on embedded derivatives - Rosebel power purchase agreement (2.7) (3.6) 17.1 Unrealized loss on warrants — — 0.9 Gain on sale of royalties (35.7) — — COVID-19 expenses 4.5 4.2 — Care and maintenance costs at Westwood 13.1 14.6 — Write-down of assets 0.7 1.0 0.5 Foreign exchange (gain) loss 3.3 (3.4) 4.9 Impairment charge, net of reversals — (45.8) — Changes in estimates of asset retirement obligations at closed sites — 6.1 —
Adjusted earnings before income taxes and non-controlling interests 18.5 53.8 6.1 Income taxes (10.5) (16.9) (3.6) Tax on foreign exchange translation of deferred income tax balances (0.5) (18.0) 0.2 Tax impact of adjusting items 0.9 9.2 (6.1) Non-controlling interests (2.2) (9.0) (1.5)
Adjusted net earnings (loss) attributable to equity holders $ 6.2 $ 19.1 $ (4.9) Adjusted net earnings (loss) per share attributable to equity holders $ 0.01 $ 0.04 $ (0.01) Basic weighted average number of common shares outstanding (millions) 475.8 474.7 470.1
After adjusting reported net earnings for those items not considered representative of the Company's core business or indicative of future operations, the Company had adjusted net earnings attributable to equity holders in the first quarter 2021 of $6.2 million.
IAMGOLD CORPORATIONFirst Quarter 2021 Management’s Discussion and Analysis 31

Total Cash Costs per Ounce ProducedThe Company’s MD&A refers to total cash costs per ounce produced, a non-GAAP performance measure, in order to provide investors with information about a key measure used by management to monitor performance. This information is used to assess how well the producing gold mines are performing compared to plan and prior periods, and also to assess their overall effectiveness and efficiency.Total cash costs are calculated in accordance with a standard developed by the Gold Institute, which was a worldwide association of gold and gold product suppliers, including leading North American gold producers. Although the Gold Institute ceased operations in 2002, the standard is still an accepted measure of reporting cash costs of gold production in North America. Adoption of the standard is voluntary and the cost measures presented herein may not be comparable to other similarly titled measures of other companies. Costs include mine site operating costs such as mining, processing, administration, royalties, production taxes, and realized derivative gains or losses, exclusive of depreciation, reclamation, capital expenditures and exploration and evaluation costs. These costs are then divided by the Company’s attributable ounces of gold produced by mine sites in commercial production to arrive at the total cash costs per ounce produced.The Company reports the measure for the Essakane, Rosebel and Westwood mines.The measure, along with revenues, is considered to be one of the key indicators of a company’s ability to generate operating earnings and cash flow from its mining operations. Total cash costs does not have any standardized meaning prescribed by IFRS, are unlikely to be comparable to similar measures presented by other issuers, and should not be considered in isolation or as a substitute for measures of performance prepared in accordance with IFRS. These measures are not necessarily indicative of net earnings or cash flow from operating activities as determined under IFRS.The following table provides a reconciliation of total cash costs per ounce produced to cost of sales, excluding depreciation expense as per the consolidated interim financial statements.
($ millions, except where noted) Q1 2021 Q4 2020 Q1 2020Cost of sales1, excluding depreciation expense $ 179.2 $ 193.9 $ 179.2 Adjust for:
By-product credit, excluded from cost of sales (0.4) (0.6) (1.1) Stock movement 5.8 (0.5) 7.7 Other mining costs (7.2) (10.3) (5.1) Cost attributed to non-controlling interests2 (13.7) (13.6) (12.0)
$ (15.5) $ (25.0) $ (10.5)
Total cash costs3 $ 163.7 $ 168.9 $ 168.7 Total attributable gold production (000s oz) 156 169 170 Total cash costs3,4 ($/oz) $ 1,052 $ 998 $ 993
1 As per note 30 of the consolidated interim financial statements. 2 Adjustments for the consolidation of Essakane (90%) and Rosebel (95%) to their attributable portion of cost of sales.3 Consists of Essakane, Rosebel and Westwood on an attributable basis.4 Total cash costs per ounce produced may not calculate based on amounts presented in this table due to rounding.
IAMGOLD CORPORATIONFirst Quarter 2021 Management’s Discussion and Analysis 32

All-In Sustaining Costs per Ounce SoldThe Company believes, although relevant, the current total cash costs measure commonly used in the gold industry does not capture the sustaining expenditures incurred in producing gold, therefore, may not present a complete picture of a company’s operating performance or its ability to generate free cash flow from its current operations. For these reasons, the World Gold Council (“WGC”) defined an all-in sustaining costs measure which better represents the costs associated with producing gold.The all-in sustaining costs (“AISC”) per ounce sold measure better meets the needs of analysts, investors and other stakeholders of the Company in assessing its operating performance and its ability to generate free cash flow. The definition of AISC, on an attributable basis, commences with cost of sales, excluding depreciation expense, and includes sustaining capital expenditures which are required to maintain existing operations, sustaining exploration and evaluation expenses, sustaining lease principal payments, environmental rehabilitation accretion and depreciation, by-product credits, and corporate general and administrative costs.This measure seeks to represent the cost of selling gold from current operations, and therefore does not include capital expenditures attributable to construction and development projects or mine expansions, greenfield exploration expenses, income tax payments, working capital defined as current assets less current liabilities (except for inventory adjustments), items needed to normalize earnings, interest costs or dividend payments.Consequently, this measure is not representative of all of the Company’s cash expenditures and is not indicative of the Company’s overall profitability. The calculation of AISC per ounce sold is based on the Company’s attributable interest in sales from its gold mines. The usage of an attributable interest presentation is a fairer and more accurate way to measure economic performance than using a consolidated basis. The Company reports the AISC per ounce sold measure on an attributable sales basis, compared with the Company’s current total cash costs presentation, which is on an attributable production basis.The Company reports the measure with and without a deduction for by-product credits and reports the measure for the Essakane, Rosebel and Westwood mines.AISC does not have any standardized meaning prescribed by IFRS, may not be comparable to similar measures presented by other issuers, and should not be considered in isolation or as a substitute for measures of performance prepared in accordance with IFRS. This measure is not necessarily indicative of net earnings or cash flow from operating activities as determined under IFRS.
($ millions, attributable, except where noted) Q1 2021 Q4 2020 Q1 2020Cost of sales1, excluding depreciation expense $ 165.0 $ 179.4 $ 167.5 Sustaining capital expenditures1 12.8 25.2 14.0 Sustaining lease principal payments 1.5 1.5 1.5 By-product credit, excluded from cost of sales (0.4) (0.5) (1.1) Corporate general and administrative costs2 8.9 14.5 11.6 Environmental rehabilitation accretion and depreciation 2.1 2.1 2.2
$ 189.9 $ 222.2 $ 195.7
Attributable gold sales (000s oz) 153 172 159 AISC3,4 ($/oz) $ 1,238 $ 1,294 $ 1,230 AISC excluding by-product credit3,4 ($/oz) $ 1,240 $ 1,298 $ 1,237
1 Refer to note 30 of the consolidated interim financial statements for cost of sales of total gold mines, on a 100% basis, and refer to the capital expenditures table of the MD&A on page 3 for 2021 sustaining capital expenditures, on a 100% basis.
2 Corporate general and administrative costs exclude depreciation expense.3 Consists of Essakane, Rosebel and Westwood on an attributable basis.4 AISC per ounce sold may not calculate based on amounts presented in this table due to rounding.
IAMGOLD CORPORATIONFirst Quarter 2021 Management’s Discussion and Analysis 33

CAUTIONARY STATEMENT ON FORWARD-LOOKING INFORMATION
All information included in this MD&A, including any information as to the Company’s future financial or operating performance, and other statements that express management’s expectations or estimates of future performance, including statements in respect of the prospects of the Company’s projects, other than statements of historical fact, constitute forward-looking information or forward-looking statements and are based on expectations, estimates and projections as of the date of this MD&A. For example, forward-looking statements contained in this MD&A are found under, but are not limited to being included under, the headings “Outlook”, "Market Trends", “Quarterly Updates” and "Exploration", and include, without limitation, statements with respect to: the Company’s guidance for production, cost of sales, total cash costs, all-in sustaining costs, depreciation expense, effective tax rate, capital expenditures, operations outlook, development and expansion projects, exploration, the future price of gold, the estimation of mineral reserves and mineral resources, the realization of mineral reserve and mineral resource estimates, the timing and amount of estimated future production, costs of production, permitting timelines, currency fluctuations, requirements for additional capital, government regulation of mining operations, environmental risks, unanticipated reclamation expenses, title disputes or claims and limitations on insurance coverage. Forward-looking statements are provided for the purpose of providing information about management’s current expectations and plans relating to the future. Forward-looking statements are generally identifiable by, but are not limited to, the use of the words “may”, “will”, “should”, “continue”, “expect”, "budget", "forecast", “anticipate”, “estimate”, “believe”, “intend”, “plan”, "schedule", “guidance”, “outlook”, “potential”, "transformational", "best-in-class", "top-tier", “seek”, “targets”, "suspended", "superior return(s)", "superior shareholder return(s)", "cover", “strategy”, "superior" or “project” or the negative of these words or other variations on these words or comparable terminology. Forward-looking statements are necessarily based upon a number of estimates and assumptions that, while considered reasonable by management, are inherently subject to significant business, economic and competitive uncertainties and contingencies and, as such, undue reliance must not be placed on them. The Company cautions the reader that reliance on such forward-looking statements involves known and unknown risks, uncertainties and other factors that may cause the actual results, performance or achievements of IAMGOLD to be materially different from the Company’s estimated future results, performance or achievements expressed or implied by those forward-looking statements. These risks, uncertainties and other factors include, but are not limited to, changes in the global prices for gold, copper, silver or certain other commodities (such as diesel and electricity); changes in U.S. dollar and other currency exchange rates, interest rates or gold lease rates; risks arising from holding derivative instruments; the level of liquidity and capital resources; access to capital markets, and financing; mining tax regimes; ability to successfully integrate acquired assets; legal, litigation, legislative, political or economic risks and new developments in the jurisdictions in which the Company carries on business; the failure to obtain in a timely manner from authorities key permits, authorizations or approvals necessary for exploration, development or operation, operating or technical difficulties in connection with mining or development activities, including geotechnical difficulties and major equipment failure, such as a conveyor belt breakdown; and seismicity, such as the seismic event that occurred at Westwood mine on October 30, 2020; laws and regulations governing the protection of the environment; employee relations; attraction and retention of key employees; availability and increasing costs associated with mining inputs and labour, negotiations with respect to new, reasonable collective labour agreements may not be agreed to; the inaccuracy of estimated reserves and resources, metallurgical recoveries, capital and operating costs, the speculative nature of exploration and development, including the risks of diminishing quantities or grades of reserves; illegal mining; adverse changes in the Company’s credit rating; contests over title to properties, particularly title to undeveloped properties; the inability to participate in any gold price increase above the cap in any collar transaction entered into in conjunction with a gold sale prepayment arrangement; the potential direct or indirect operational impacts resulting from infectious diseases or pandemics, such as the COVID-19 outbreak; and the inherent risks involved in the exploration, development and mining business generally. Please see the AIF or Form 40-F available on www.sedar.com or www.sec.gov/edgar.shtml for a comprehensive discussion of the risks faced by the Company, and which may cause the actual financial results, operating performance or achievements of IAMGOLD to be materially different from the Company’s estimated future results, operating performance or achievements expressed or implied by forward-looking information or forward-looking statements.Although the Company has attempted to identify important factors that could cause actual results to differ materially from those contained in forward-looking statements, there may be other factors that cause results not to be as anticipated, estimated or intended. There can be no assurance that such statements will prove to be accurate, as actual results and future events could differ materially from those anticipated in such statements.The Company disclaims any intention or obligation to update or revise any forward-looking statements whether as a result of new information, future events or otherwise except as required by applicable law.
IAMGOLD CORPORATIONFirst Quarter 2021 Management’s Discussion and Analysis 34

UNAUDITED CONDENSED CONSOLIDATED INTERIM FINANCIAL STATEMENTS
As At and For the Three Months Ended March 31, 2021
INDEX
Consolidated balance sheets 36
Consolidated statements of earnings (loss) 37
Consolidated statements of comprehensive income (loss) 38
Consolidated statements of changes in equity 39
Consolidated statements of cash flows 40
Notes to condensed consolidated interim financial statements 41 to 63
IAMGOLD CORPORATIONUnaudited Condensed Consolidated Interim Financial Statements – March 31, 2021 35

CONSOLIDATED BALANCE SHEETS
(Unaudited)(In millions of U.S. dollars) Notes
March 31,2021
December 31, 2020
AssetsCurrent assets
Cash and cash equivalents 5 $ 963.0 $ 941.5 Short-term investments 4.8 6.0 Receivables and other current assets 7 92.9 120.7 Inventories 8 305.2 327.3
1,365.9 1,395.5 Non-current assets
Investment in associate 9 9.8 9.0 Property, plant and equipment 11 2,408.2 2,362.0 Exploration and evaluation assets 12 55.4 54.8 Restricted cash 6 37.5 38.6 Inventories 8 221.1 198.3 Other assets 13 106.0 96.1
2,838.0 2,758.8 $ 4,203.9 $ 4,154.3
Liabilities and EquityCurrent liabilities
Accounts payable and accrued liabilities $ 251.3 $ 244.7 Income taxes payable 32.2 29.6 Current portion of provisions 14 8.9 6.7 Current portion of lease liabilities 18.3 18.0 Current portion of derivative liabilities 15 3.4 9.4 Current portion of long-term debt 17 7.6 7.9 Current portion of deferred revenue 18 48.8 — Liabilities classified as held for sale 10 18.5 18.5
389.0 334.8 Non-current liabilities
Deferred income tax liabilities 167.8 168.8 Provisions 14 395.0 388.0 Lease liabilities 45.5 48.8 Derivative liabilities 15 17.4 25.9 Long-term debt 17 459.1 458.7 Deferred revenue 18 133.4 179.8 Other liabilities 3.6 4.0
1,221.8 1,274.0 1,610.8 1,608.8
EquityAttributable to equity holders
Common shares 21 2,717.0 2,710.8 Contributed surplus 56.0 60.6 Accumulated deficit (288.4) (307.9) Accumulated other comprehensive income (loss) 23.3 (5.3)
2,507.9 2,458.2 Non-controlling interests 85.2 87.3
2,593.1 2,545.5 Contingencies and commitments 14(b), 29Subsequent event 31
$ 4,203.9 $ 4,154.3 The accompanying notes are an integral part of these unaudited condensed consolidated interim financial statements.
IAMGOLD CORPORATIONUnaudited Condensed Consolidated Interim Financial Statements – March 31, 2021 36

CONSOLIDATED STATEMENTS OF EARNINGS (LOSS)
(Unaudited) Three months ended March 31,(In millions of U.S. dollars, except per share amounts) Notes 2021 2020Revenues $ 297.4 $ 274.5 Cost of sales 24 253.2 242.6 Gross profit 44.2 31.9 General and administrative expenses (9.4) (11.9) Exploration expenses (7.6) (8.4) Other expenses 25 (20.2) (2.9) Earnings from operations 7.0 8.7 Share of net loss from investment in associate, net of income taxes 9 (0.2) (0.4) Finance costs 26 (7.2) (6.2) Foreign exchange loss (3.3) (4.9) Interest income, derivatives and other investment gains (losses) 27 35.9 (26.5) Earnings (loss) before income taxes 32.2 (29.3) Income taxes 16 (10.5) (3.6) Net earnings (loss) $ 21.7 $ (32.9) Net earnings (loss) attributable toEquity holders $ 19.5 $ (34.4) Non-controlling interests 2.2 1.5 Net earnings (loss) $ 21.7 $ (32.9)
Attributable to equity holdersWeighted average number of common shares outstanding (in millions)
Basic 22 475.8 470.1Diluted 22 480.9 470.1
Basic and diluted earnings (loss) per share 22 $ 0.04 $ (0.07) The accompanying notes are an integral part of these unaudited condensed consolidated interim financial statements.
IAMGOLD CORPORATIONUnaudited Condensed Consolidated Interim Financial Statements – March 31, 2021 37

CONSOLIDATED STATEMENTS OF COMPREHENSIVE INCOME (LOSS)
(Unaudited) Three months ended March 31,(In millions of U.S. dollars) Notes 2021 2020Net earnings (loss) $ 21.7 $ (32.9) Other comprehensive income (loss), net of income taxesItems that will not be reclassified to the statements of earnings (loss)Movement in marketable securities fair value reserveNet unrealized change in fair value of marketable securities (2.8) (2.1)
Net realized change in fair value of marketable securities 19(a) — (4.9) Tax impact 0.3 0.1
(2.5) (6.9) Items that may be reclassified to the statements of earnings (loss)Movement in cash flow hedge fair value reserve Effective portion of changes in fair value of cash flow hedges 19(b) 37.8 (47.7) Time value of options contracts excluded from hedge relationship 19(b) (1.3) (9.6) Net change in fair value of cash flow hedges reclassified to the statements of earnings (loss) 19(b) (1.3) 1.9 Tax impact (1.1) 3.4
34.1 (52.0) Currency translation adjustment 9 (0.7) (2.1)
33.4 (54.1) Total other comprehensive income (loss) 30.9 (61.0) Comprehensive income (loss) $ 52.6 $ (93.9)
Comprehensive income (loss) attributable to:Equity holders $ 50.4 $ (95.4) Non-controlling interests 2.2 1.5 Comprehensive income (loss) $ 52.6 $ (93.9)
The accompanying notes are an integral part of these unaudited condensed consolidated interim financial statements.
IAMGOLD CORPORATIONUnaudited Condensed Consolidated Interim Financial Statements – March 31, 2021 38

CONSOLIDATED STATEMENTS OF CHANGES IN EQUITY
(Unaudited) Three months ended March 31,(In millions of U.S. dollars) Notes 2021 2020
Common sharesBalance, beginning of the period $ 2,710.8 $ 2,686.8 Issuance of common shares for share-based compensation 21 6.2 7.2 Balance, end of the period 2,717.0 2,694.0
Contributed surplusBalance, beginning of the period 60.6 54.0 Issuance of common shares for share-based compensation (6.2) (7.2) Share-based compensation 2.3 1.9 Other (0.7) 0.5 Balance, end of the period 56.0 49.2 Accumulated deficitBalance, beginning of the period (307.9) (350.2) Net earnings (loss) attributable to equity holders 19.5 (34.4) Balance, end of the period (288.4) (384.6)
Accumulated other comprehensive income (loss)Marketable securities fair value reserveBalance, beginning of the period (32.2) (31.9) Net change in fair value of marketable securities, net of income taxes (2.5) (6.9) Balance, end of the period (34.7) (38.8) Cash flow hedge fair value reserveBalance, beginning of the period 29.4 (9.5) Net change in fair value and time value of cash flow hedges recognized in property, plant and equipment 19(b) (2.3) 0.1 Net change in fair value of cash flow hedges recognized in other comprehensive income (loss), net of income taxes 34.1 (52.0) Balance, end of the period 61.2 (61.4) Currency translation adjustmentBalance, beginning of the period (2.5) (3.1) Change for the period 9 (0.7) (2.1) Balance, end of the period (3.2) (5.2) Total accumulated other comprehensive income (loss) 23.3 (105.4) Equity attributable to equity holders 2,507.9 2,253.2
Non-controlling interestsBalance, beginning of the period 87.3 72.7 Net earnings attributable to non-controlling interests 2.2 1.5 Dividends to non-controlling interests (4.3) — Balance, end of the period 85.2 74.2
$ 2,593.1 $ 2,327.4 The accompanying notes are an integral part of these unaudited condensed consolidated interim financial statements.
IAMGOLD CORPORATIONUnaudited Condensed Consolidated Interim Financial Statements – March 31, 2021 39

CONSOLIDATED STATEMENTS OF CASH FLOWS
(Unaudited) Three months ended March 31,(In millions of U.S. dollars) Notes 2021 2020Operating activitiesNet earnings (loss) $ 21.7 $ (32.9)
Net loss from closed mines 0.4 0.3 Net earnings (loss) related to open mines 22.1 (32.6) Adjustments for:
Finance costs 26 6.9 6.0 Depreciation expense 79.0 63.8 Derivative (gain) loss 19(b),19(c) (0.9) 31.9 Income taxes 16 10.5 3.6 Gain on sale of royalties 27 (35.7) — Write-down of inventories 8 1.8 0.7 Other non-cash items 28(a) 5.6 7.5
Adjustments for cash items:Settlement of derivatives 1.6 (1.9) Disbursements related to asset retirement obligations — (0.1)
Movements in non-cash working capital items and non-current ore stockpiles 28(b) 19.2 (28.7) Cash from operating activities, before income taxes paid 110.1 50.2 Income taxes paid (7.5) (5.4) Net cash from operating activities related to open mines 102.6 44.8 Net cash used in operating activities related to closed mines 28(c) (0.9) (0.8) Net cash from operating activities 101.7 44.0 Investing activitiesCapital expenditures for property, plant and equipment (101.9) (67.5) Capitalized borrowing costs 26 (0.4) (0.3) Capital expenditures for exploration and evaluation assets (0.6) — Proceeds from sale of royalties 27 35.7 — Other investing activities 28(d) 3.9 3.7 Net cash used in investing activities related to open mines (63.3) (64.1) Net cash used in investing activities related to closed mines — — Net cash used in investing activities (63.3) (64.1) Financing activitiesInterest paid 26 (0.7) (0.8) Payment of lease obligations (4.5) (3.4) Dividends paid to non-controlling interests (4.3) — Repayment of Equipment Loans 28(e) (1.9) (1.1) Other financing activities (2.6) (1.7) Net cash used in financing activities related to open mines (14.0) (7.0) Net cash used in financing activities related to closed mines (0.2) (0.3) Net cash used in financing activities (14.2) (7.3) Effects of exchange rate fluctuation on cash and cash equivalents (2.7) (8.2) Increase (decrease) in cash and cash equivalents 21.5 (35.6) Cash and cash equivalents, beginning of the period 941.5 830.6 Cash and cash equivalents, end of the period $ 963.0 $ 795.0
The accompanying notes are an integral part of these unaudited condensed consolidated interim financial statements.
IAMGOLD CORPORATIONUnaudited Condensed Consolidated Interim Financial Statements – March 31, 2021 40
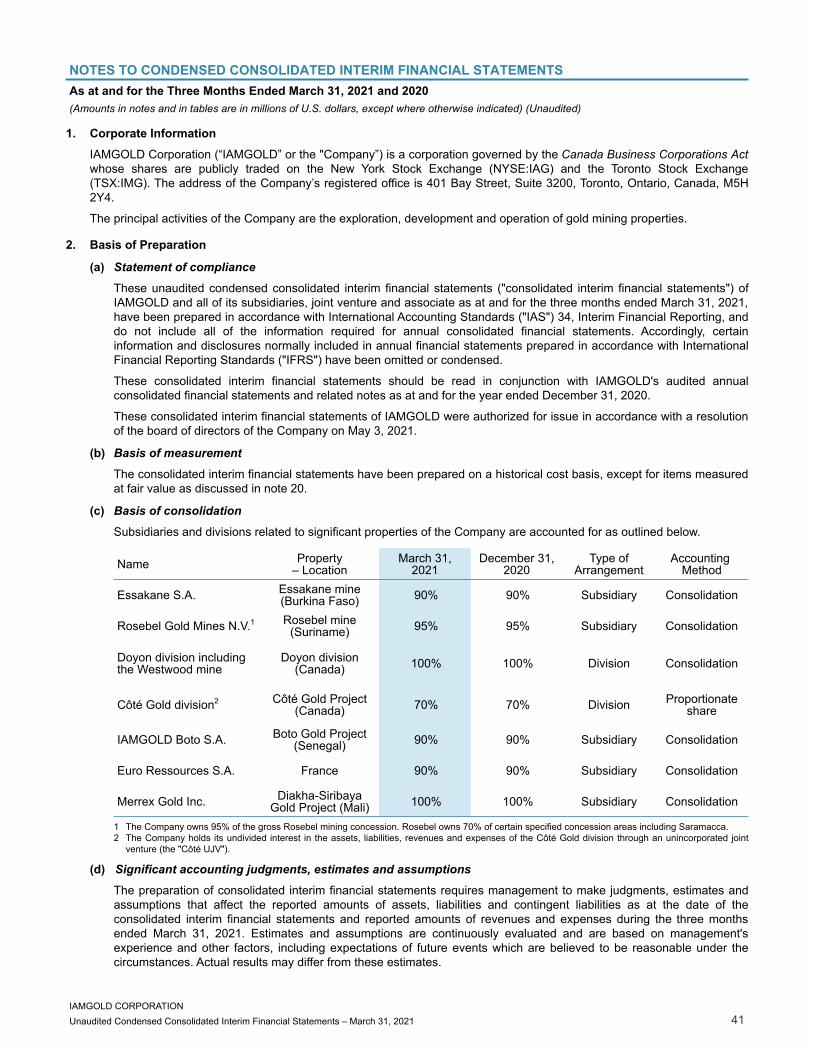
NOTES TO CONDENSED CONSOLIDATED INTERIM FINANCIAL STATEMENTSAs at and for the Three Months Ended March 31, 2021 and 2020(Amounts in notes and in tables are in millions of U.S. dollars, except where otherwise indicated) (Unaudited)
1. Corporate Information
IAMGOLD Corporation (“IAMGOLD” or the "Company”) is a corporation governed by the Canada Business Corporations Act whose shares are publicly traded on the New York Stock Exchange (NYSE:IAG) and the Toronto Stock Exchange (TSX:IMG). The address of the Company’s registered office is 401 Bay Street, Suite 3200, Toronto, Ontario, Canada, M5H 2Y4.
The principal activities of the Company are the exploration, development and operation of gold mining properties.
2. Basis of Preparation
(a) Statement of compliance
These unaudited condensed consolidated interim financial statements ("consolidated interim financial statements") of IAMGOLD and all of its subsidiaries, joint venture and associate as at and for the three months ended March 31, 2021, have been prepared in accordance with International Accounting Standards ("IAS") 34, Interim Financial Reporting, and do not include all of the information required for annual consolidated financial statements. Accordingly, certain information and disclosures normally included in annual financial statements prepared in accordance with International Financial Reporting Standards ("IFRS") have been omitted or condensed.
These consolidated interim financial statements should be read in conjunction with IAMGOLD's audited annual consolidated financial statements and related notes as at and for the year ended December 31, 2020.
These consolidated interim financial statements of IAMGOLD were authorized for issue in accordance with a resolution of the board of directors of the Company on May 3, 2021.
(b) Basis of measurement
The consolidated interim financial statements have been prepared on a historical cost basis, except for items measured at fair value as discussed in note 20.
(c) Basis of consolidation
Subsidiaries and divisions related to significant properties of the Company are accounted for as outlined below.
Name Property– Location
March 31,2021
December 31,2020
Type ofArrangement
Accounting Method
Essakane S.A. Essakane mine (Burkina Faso) 90% 90% Subsidiary Consolidation
Rosebel Gold Mines N.V.1 Rosebel mine (Suriname) 95% 95% Subsidiary Consolidation
Doyon division including the Westwood mine
Doyon division (Canada) 100% 100% Division Consolidation
Côté Gold division2 Côté Gold Project(Canada) 70% 70% Division Proportionate
share
IAMGOLD Boto S.A. Boto Gold Project (Senegal) 90% 90% Subsidiary Consolidation
Euro Ressources S.A. France 90% 90% Subsidiary Consolidation
Merrex Gold Inc. Diakha-Siribaya Gold Project (Mali) 100% 100% Subsidiary Consolidation
1 The Company owns 95% of the gross Rosebel mining concession. Rosebel owns 70% of certain specified concession areas including Saramacca. 2 The Company holds its undivided interest in the assets, liabilities, revenues and expenses of the Côté Gold division through an unincorporated joint
venture (the "Côté UJV").
(d) Significant accounting judgments, estimates and assumptions
The preparation of consolidated interim financial statements requires management to make judgments, estimates and assumptions that affect the reported amounts of assets, liabilities and contingent liabilities as at the date of the consolidated interim financial statements and reported amounts of revenues and expenses during the three months ended March 31, 2021. Estimates and assumptions are continuously evaluated and are based on management's experience and other factors, including expectations of future events which are believed to be reasonable under the circumstances. Actual results may differ from these estimates.
IAMGOLD CORPORATIONUnaudited Condensed Consolidated Interim Financial Statements – March 31, 2021 41

3. Adoption of New Accounting Standards and New Accounting Standards Issued but Not Yet Effective
(a) Adoption of new accounting standards
These consolidated interim financial statements have been prepared following the same accounting policies and methods of computation as the audited annual consolidated financial statements for the year ended December 31, 2020.
(b) New accounting standards issued but not effective
The following new accounting standards were not yet effective for the three months ended March 31, 2021, and have not been applied in preparing these consolidated interim financial statements.
IAS 16, Property, Plant and Equipment
The International Accounting Standards Board ("IASB") issued an amendment to IAS 16, Property, Plant and Equipment to prohibit deducting from property, plant and equipment amounts received from selling items produced while preparing an asset for its intended use. Instead, sales proceeds and related costs must be recognized in profit or loss. The amendment will require companies to distinguish between costs associated with producing and selling items before the item of property, plant and equipment is available for use and costs associated with making the item of property, plant and equipment available for its intended use. The amendment is effective for annual periods beginning on or after January 1, 2022, with earlier application permitted. The extent of the impact of adoption of this standard has not yet been determined.
4. Saramacca
As per the Mineral Agreement, as amended, Rosebel Gold Mines N.V. (“Rosebel”) had an obligation to establish an unincorporated joint venture (“Rosebel UJV”) with the Republic of Suriname related to the concession areas within the Rosebel UJV Area of Interest (which includes Saramacca), whereby Rosebel would hold a 70% participating interest and the Republic of Suriname would acquire the remaining 30% participating interest on a fully paid basis.
On April 22, 2020, Rosebel signed the Rosebel UJV agreement (the “Agreement”) with Staatsolie Maatschappij Suriname N.V. (“Staatsolie”), which was designated by the Republic of Suriname to hold its 30% participating interest. The Rosebel UJV excludes the existing Gross Rosebel mining concession, which is 95% owned by Rosebel and 5% owned by the Republic of Suriname. Upon the establishment of the Rosebel UJV, Rosebel contributed the properties within the Rosebel UJV Area of Interest, including Saramacca, and Staatsolie acquired a 30% participating interest in the Rosebel UJV. Rosebel continues to hold a 70% participating interest in the Rosebel UJV.
Pursuant to the Agreement, Staatsolie was required to make an initial contribution equal to 30% of all operating and capital expenditures related to Saramacca, as well as 30% of all acquisition, exploration and development costs within the Rosebel UJV Area of Interest incurred by Rosebel up to March 31, 2020. At the time of signing the Agreement Staatsolie paid Rosebel an initial amount of $34.0 million toward an aggregate amount owing of $54.9 million. The remaining amount, in addition to ongoing operating and capital expenditures, will be paid out of Staatsolie’s gold entitlement from the Saramacca property until the outstanding amount is recovered. The remaining amount outstanding from Staatsolie is included in Receivables and other current assets (Note 7).
Upon the establishment of the Rosebel UJV, the Company derecognized 30% of the assets and liabilities related to the Rosebel UJV Area of Interest and recorded a gain of $16.9 million, which has been included under Interest income and derivatives and other investment gains (losses) in the Consolidated statements of earnings (loss).
The Company continues to control the Rosebel UJV. Judgment was applied by the Company in determining the appropriate accounting treatment for its undivided interest in the Rosebel UJV assets and liabilities, and, based on interpretation of guidance under IFRS 11 Joint Arrangements, the Company has accounted for the Rosebel UJV by recording its 70% share of assets, liabilities, revenues and expenses in these Consolidated financial statements.
The following table represents the 30% interest in the Rosebel UJV derecognized by the Company:
Carrying AmountProperty, plant and equipment $ 35.2 Ore stockpiles 2.8
$ 38.0
The following table represents the Company’s gain recorded on the derecognition of the 30% interest in the Rosebel UJV:
Gross consideration receivable from Staatsolie $ 54.9 Derecognition of the 30% interest in the Rosebel UJV (38.0) Gain on establishment of the Rosebel UJV $ 16.9
IAMGOLD CORPORATIONUnaudited Condensed Consolidated Interim Financial Statements – March 31, 2021 42

5. Cash and Cash Equivalents
March 31,2021
December 31,2020
Cash $ 853.8 $ 920.9 Short-term deposits with initial maturities of three months or less 109.2 20.6
$ 963.0 $ 941.5
6. Restricted Cash
The Company had long-term restricted cash of $37.5 million as at March 31, 2021 (December 31, 2020 - $38.6 million), to guarantee the environmental indemnities related to the Essakane mine.
7. Receivables and Other Current Assets
NotesMarch 31,
2021December 31,
2020Income taxes receivable $ 6.1 $ 8.3 Receivables from governments1 26.2 56.7 Receivable from Staatsolie 3.6 7.5 Receivable from Allied Gold Corporation — 1.8 Deferred consideration from Allied Gold Corporation 1.2 1.2 Other receivables 4.6 5.2 Total receivables 41.7 80.7 Prepayment for other assets 1.0 — Prepaid expenses 19.0 19.6 Derivatives 20(a) 31.2 20.4 $ 92.9 $ 120.7
1 Receivables from governments relate primarily to value added tax.
8. Inventories
March 31,2021
December 31,2020
Finished goods $ 83.1 $ 74.4 Ore stockpiles 52.6 80.1 Mine supplies 169.5 172.8 305.2 327.3 Non-current ore stockpiles 221.1 198.3
$ 526.3 $ 525.6
For the three months ended March 31, 2021, the Company recognized a write-down in mine supplies inventories amounting to $1.8 million (three months ended March 31, 2020 - $0.7 million).
IAMGOLD CORPORATIONUnaudited Condensed Consolidated Interim Financial Statements – March 31, 2021 43

9. Investment in Associate
The Company has an investment in INV Metals Inc. ("INV Metals"), which is accounted for under the equity method.
INV Metals1
Balance, January 1, 2020 $ 10.0 Currency translation adjustment 0.6 Share of net loss, net of income taxes (1.6) Balance, December 31, 2020 9.0 Purchase of additional shares of associate2 1.7 Currency translation adjustment (0.7) Share of net loss, net of income taxes (0.2) Balance, March 31, 2021 $ 9.8
1 IAMGOLD includes results based on the latest publicly available information.2 Associate relates to INV Metals, a publicly traded company incorporated in Canada. The Company's ownership interest in INV Metals as at March 31, 2021
was 35.5% (December 31, 2020 - 35.5%). On January 28, 2021, the Company participated in a private placement and acquired an additional 4.8 million common shares of INV Metals at a price of C$0.45 per share for an aggregate amount of $1.7 million (C$2.2 million) to maintain a 35.5% ownership interest.
The Company's investment in the Yatela joint venture is classified as held for sale as at March 31, 2021 and is presented as a discontinued operation (Note 10). As of the date of classification as held for sale, equity accounting for the investment ceased.
10. Liabilities Held for Sale and Discontinued Operations
On February 14, 2019, Sadiola Exploration Limited ("SADEX"), a subsidiary jointly held by the Company and AngloGold Ashanti Limited, entered into a share purchase agreement with the Government of Mali, as amended from time to time, whereby SADEX agreed to sell to the Government of Mali its 80% participation in Société d’Exploitation des Mines d’Or de Yatela ("Yatela"), for a consideration of $1. The transaction remains subject to the fulfillment of a number of conditions precedent, among which the adoption of two laws, one to create a state entity, and the other to create a dedicated state account for the sole purpose of financing the closure and rehabilitation of the Yatela mine as well as certain social projects to the benefit of the surrounding populations. As part of the transaction, and upon its completion, SADEX will make a one-time payment of approximately $37.0 million to the dedicated state account, corresponding to the estimated costs of completing the rehabilitation and closure of the Yatela mine, and also financing certain outstanding social programs. Upon completion and this payment being made, SADEX and its affiliated companies will be released of all obligations relating to the Yatela mine. The Company will fund approximately $18.5 million of the payment.
As of March 31, 2019, the Yatela disposal group met the criteria to be classified as held for sale. The net carrying value of the investment in Yatela before classification as held for sale was in a liability position of ($13.2 million). A loss of $5.3 million as a result of writing down the carrying amount of the disposal group to its fair value less costs to sell was included in Loss from discontinued operations. The total carrying value of ($18.5 million) is presented as current liabilities held for sale. The Yatela disposal group continues to meet the criteria to be classified as held for sale as the Company remains confident that the conditions precedent will be fulfilled and the sale will close.
The Yatela disposal group is presented as discontinued operations in the Consolidated statements of earnings (loss) and the Consolidated statements of cash flows.
March 31,2021
December 31,2020
Liabilities related to assets held for sale - Yatela $ (18.5) $ (18.5)
IAMGOLD CORPORATIONUnaudited Condensed Consolidated Interim Financial Statements – March 31, 2021 44

11. Property, Plant and Equipment
Constructionin progress
Miningproperties
Plant andequipment
Right-of-use assets1 Total
CostBalance, January 1, 2020 $ 504.2 $ 2,961.0 $ 1,964.0 $ 68.1 $ 5,497.3 Additions2 164.2 130.4 70.0 26.1 390.7 Changes in asset retirement obligations — 7.6 — — 7.6 Disposals — — (67.8) (2.2) (70.0) Derecognition on the establishment of the Rosebel UJV (2.0) (32.1) (1.3) — (35.4) Transfers within Property, plant and equipment (41.6) 39.7 1.7 0.2 — Balance, December 31, 2020 624.8 3,106.6 1,966.6 92.2 5,790.2 Additions2 87.1 22.9 12.6 1.8 124.4 Changes in asset retirement obligations — 9.9 — — 9.9 Disposals — — (28.0) (0.2) (28.2) Transfers within Property, plant and equipment (10.5) 4.3 6.2 — — Balance, March 31, 2021 $ 701.4 $ 3,143.7 $ 1,957.4 $ 93.8 $ 5,896.3
Constructionin progress
Miningproperties
Plant andequipment
Right-of-use assets1 Total
Accumulated Depreciation and ImpairmentBalance, January 1, 2020 $ — $ 1,987.4 $ 1,261.8 $ 8.5 $ 3,257.7 Depreciation expense3 — 143.3 127.8 12.5 283.6 Disposals — — (65.5) (1.6) (67.1) Derecognition on the establishment of the Rosebel UJV — (0.1) (0.1) — (0.2) Reversal of impairment — (45.8) — — (45.8) Balance, December 31, 2020 — 2,084.8 1,324.0 19.4 3,428.2 Depreciation expense3 — 49.4 34.3 3.7 87.4 Disposals — — (27.3) (0.2) (27.5) Balance, March 31, 2021 $ — $ 2,134.2 $ 1,331.0 $ 22.9 $ 3,488.1 Carrying amount, December 31, 2020 $ 624.8 $ 1,021.8 $ 642.6 $ 72.8 $ 2,362.0 Carrying amount, March 31, 2021 $ 701.4 $ 1,009.5 $ 626.4 $ 70.9 $ 2,408.2
1 Right-of-use assets consist of buildings and plant and equipment under IFRS 16. 2 For the three months ended March 31, 2021, borrowing costs attributable to qualifying assets associated with the Essakane, Rosebel and Westwood mines
and the Côté Gold, Boto Gold and Saramacca projects totaling $4.2 million (three months ended March 31, 2020 - $5.6 million) were capitalized. 3 Excludes depreciation expense related to Corporate assets, included within Other non-current assets, which is included in General and administrative
expenses.
12. Exploration and Evaluation Assets
Diakha-Siribaya Gold
ProjectFayolle
PropertyMonster
Lake Project Other TotalBalance, January 1, 2020 $ 36.6 $ — $ 2.5 $ 3.1 $ 42.2 Acquired Exploration and evaluation assets1,2 — 7.3 5.3 — 12.6 Balance, December 31, 2020 $ 36.6 $ 7.3 $ 7.8 $ 3.1 $ 54.8 Exploration and evaluation expenditures — 0.6 — — 0.6 Balance, March 31, 2021 $ 36.6 $ 7.9 $ 7.8 $ 3.1 $ 55.4
1 During the second quarter 2020, the Company acquired the Fayolle Property from Monarch Gold Corporation in exchange for 1,851,145 common shares of IAMGOLD. The value of the share consideration of $6.7 million was capitalized to exploration and evaluation assets. An additional fee of $0.6 million was capitalized for the year ended December 31, 2020.
2 During the fourth quarter 2020, the Company acquired the remaining 25% interest of the Monster Lake Project from Tomagold Corporation in exchange for 1,464,377 common shares of IAMGOLD, valued at $4.9 million, and a cash consideration of $0.4 million. The total value of the consideration of $5.3 million was capitalized to Exploration and evaluation assets.
IAMGOLD CORPORATIONUnaudited Condensed Consolidated Interim Financial Statements – March 31, 2021 45
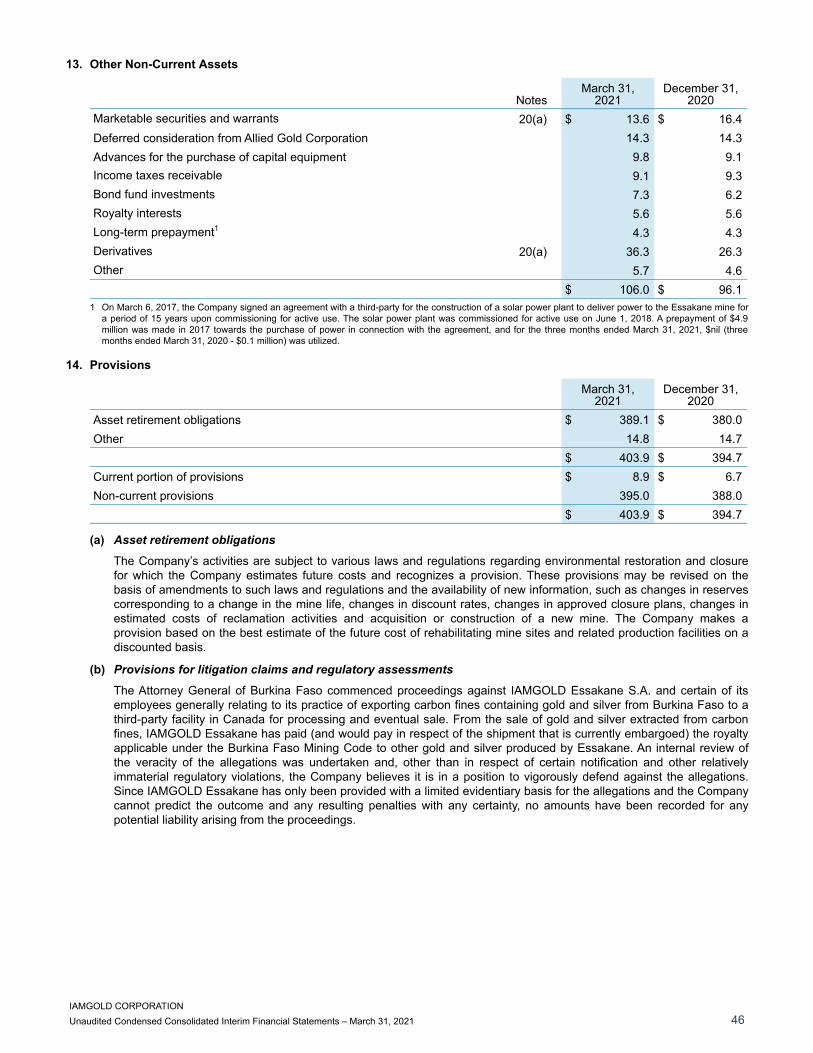
13. Other Non-Current Assets
NotesMarch 31,
2021December 31,
2020Marketable securities and warrants 20(a) $ 13.6 $ 16.4 Deferred consideration from Allied Gold Corporation 14.3 14.3 Advances for the purchase of capital equipment 9.8 9.1 Income taxes receivable 9.1 9.3 Bond fund investments 7.3 6.2 Royalty interests 5.6 5.6 Long-term prepayment1 4.3 4.3 Derivatives 20(a) 36.3 26.3 Other 5.7 4.6
$ 106.0 $ 96.1 1 On March 6, 2017, the Company signed an agreement with a third-party for the construction of a solar power plant to deliver power to the Essakane mine for
a period of 15 years upon commissioning for active use. The solar power plant was commissioned for active use on June 1, 2018. A prepayment of $4.9 million was made in 2017 towards the purchase of power in connection with the agreement, and for the three months ended March 31, 2021, $nil (three months ended March 31, 2020 - $0.1 million) was utilized.
14. Provisions
March 31,2021
December 31,2020
Asset retirement obligations $ 389.1 $ 380.0 Other 14.8 14.7
$ 403.9 $ 394.7 Current portion of provisions $ 8.9 $ 6.7 Non-current provisions 395.0 388.0
$ 403.9 $ 394.7
(a) Asset retirement obligations
The Company’s activities are subject to various laws and regulations regarding environmental restoration and closure for which the Company estimates future costs and recognizes a provision. These provisions may be revised on the basis of amendments to such laws and regulations and the availability of new information, such as changes in reserves corresponding to a change in the mine life, changes in discount rates, changes in approved closure plans, changes in estimated costs of reclamation activities and acquisition or construction of a new mine. The Company makes a provision based on the best estimate of the future cost of rehabilitating mine sites and related production facilities on a discounted basis.
(b) Provisions for litigation claims and regulatory assessments
The Attorney General of Burkina Faso commenced proceedings against IAMGOLD Essakane S.A. and certain of its employees generally relating to its practice of exporting carbon fines containing gold and silver from Burkina Faso to a third-party facility in Canada for processing and eventual sale. From the sale of gold and silver extracted from carbon fines, IAMGOLD Essakane has paid (and would pay in respect of the shipment that is currently embargoed) the royalty applicable under the Burkina Faso Mining Code to other gold and silver produced by Essakane. An internal review of the veracity of the allegations was undertaken and, other than in respect of certain notification and other relatively immaterial regulatory violations, the Company believes it is in a position to vigorously defend against the allegations. Since IAMGOLD Essakane has only been provided with a limited evidentiary basis for the allegations and the Company cannot predict the outcome and any resulting penalties with any certainty, no amounts have been recorded for any potential liability arising from the proceedings.
IAMGOLD CORPORATIONUnaudited Condensed Consolidated Interim Financial Statements – March 31, 2021 46

15. Derivative Liabilities
NotesMarch 31,
2021December 31,
2020Embedded derivative - Rosebel power purchase agreement1 19(c),20(a),20(b) $ 20.6 $ 23.3 Derivatives 20(a),20(b) 0.2 12.0
$ 20.8 $ 35.3 Current portion of derivative liabilities $ 3.4 $ 9.4 Non-current portion of derivative liabilities 17.4 25.9
$ 20.8 $ 35.3 1 Rosebel has a power purchase agreement with the Government of Suriname. This agreement specifies both the quantity of power Rosebel is expected to
purchase as well as the price per kilowatt hour. An embedded derivative exists in the Rosebel power purchase agreement as increases in electricity prices are linked to the price of gold. This embedded derivative is accounted for separately from the host contract at fair value through profit or loss as the economic characteristics and risks of the host contract and the embedded derivative are not closely related. The Company recognized an embedded derivative liability of $20.6 million as at March 31, 2021 due primarily to the forward price of gold exceeding the minimum price threshold set in the agreement.
16. Income Taxes
The Company estimates the effective tax rates expected to be applied for the full year and uses these rates to determine income tax provisions in interim periods. The impact of changes in judgments and estimates concerning the probable realization of losses, changes in tax rates, and foreign exchange rates are recognized in the interim period in which they occur.
The income tax expense for the three months ended March 31, 2021 was $10.5 million (three months ended March 31, 2020 - $3.6 million) and varied from the income tax expense calculated using the combined Canadian federal and provincial statutory tax rate of 26.5%. The variance was mainly due to net foreign earnings taxed at different tax rates and fluctuations in the mix of income for the recognition of certain tax benefits and related deferred tax assets.
17. Long-term Debt and Credit Facility
NotesMarch 31,
2021December 31,
20205.75% Senior Notes (a) $ 441.7 $ 438.6 Equipment Loans (b) 25.0 28.0
$ 466.7 $ 466.6 Current portion of long-term debt $ 7.6 $ 7.9 Non-current portion of long-term debt 459.1 458.7
$ 466.7 $ 466.6
(a) 5.75% Senior Notes ("Notes")
On September 23, 2020, the Company completed the issuance of $450 million aggregate principal amount of Notes with an interest rate of 5.75% per annum. The Notes are denominated in U.S. dollars and mature on October 15, 2028. Interest is payable in arrears in equal semi-annual installments on April 15 and October 15 of each year, beginning on April 15, 2021. The Notes are guaranteed by certain of the Company's subsidiaries.
The Company incurred transaction costs of $7.5 million which have been capitalized and offset against the carrying amount of the Notes within Long-term debt in the Consolidated balance sheets and are being amortized using the effective interest rate method.
Prior to October 15, 2023, the Company may redeem some or all of the Notes at a price equal to 100% of the principal amount of the Notes plus a "make-whole" premium, plus accrued and unpaid interest.
After October 15, 2023, the Company may redeem the Notes, in whole or in part, at the relevant redemption price (expressed as a percentage of the principal amount of the Notes) and accrued and unpaid interest on the Notes up to the redemption date. The redemption price for the Notes during the 12-month period beginning on October 15 of each of the following years is: 2023 - 104.313%; 2024 - 102.875%; 2025 - 101.438%; 2026 and thereafter - 100%.
Prior to October 15, 2023, using the cash proceeds from an equity offering, the Company may redeem up to 40% of the original aggregate principal amount of the Notes at a redemption price equal to 101% of the aggregate principal amount thereof, plus accrued and unpaid interest, if any, up to the redemption date.
The prepayment options are options that represent an embedded derivative asset to the Company and are presented as an offset to the Notes on the Consolidated balance sheets. The debt component was initially recognized at $454.2 million, which represented the difference between the fair value of the financial instrument as a whole and the fair value of the embedded derivative at inception.
IAMGOLD CORPORATIONUnaudited Condensed Consolidated Interim Financial Statements – March 31, 2021 47

Subsequently, the debt component is recognized at amortized cost using the effective interest rate method. The embedded derivative represents the prepayment options and is classified as a financial asset at fair value through profit or loss ("FVTPL"). The embedded derivative is recognized at fair value with changes in the fair value recognized in the Company’s Consolidated statements of earnings (loss). The fair value of the embedded derivative as at March 31, 2021 was $5.3 million (December 31, 2020 - $8.4 million) (note 20(a)).
Under the indenture governing the Notes, if the Company makes certain asset sales it may use an amount equal to the net proceeds to repay certain debt obligations and/or reinvest, or commit to reinvest, in the Company’s business, within 365 days after the applicable asset sale. At the end of the 365-day period, if there remains $50 million or more of the net proceeds that the Company has not used in this manner, the Company would be required to use any such excess proceeds to offer to purchase the Notes at par in the manner described in the indenture.
The following are the contractual maturities related to the Notes, including interest payments:
Payments due by period
Notes balance as atCarrying amount1
Contractual cash flows <1 yr 1-2 yrs 3-4 yrs >4 yrs
March 31, 2021 $ 450.0 $ 658.7 $ 27.5 $ 51.8 $ 51.8 $ 527.6 December 31, 2020 $ 450.0 $ 658.7 $ 27.5 $ 51.8 $ 51.8 $ 527.6
1 The carrying amount of the long-term debt excludes unamortized deferred transaction costs of $7.0 million as at March 31, 2021 (December 31, 2020 – $7.2 million) and the embedded derivative.
(b) Equipment loans
On June 27, 2019, the Company executed a €20.5 million ($23.3 million) loan agreement with Caterpillar Financial Services Corporation (the “Equipment Loan”) with an interest rate of 5.23% per annum. The Equipment Loan, secured by certain mobile equipment at Essakane, matures on June 27, 2024 and is repayable in quarterly installments starting September 27, 2019. The Company incurred transaction costs of $0.3 million which have been capitalized and offset against the carrying amount of the Equipment Loan within Long-term debt in the Consolidated balance sheets and are being amortized using the effective interest rate method.
On May 12, 2020, the Company executed a CFA 6.545 billion ($10.9 million) loan agreement with Bank of Africa with an interest rate of 5.95% per annum (the "Equipment Loan"). The Equipment Loan, secured by certain mobile equipment, is due to mature on May 31, 2024 and is repayable in monthly installments beginning on June 30, 2020.
The Equipment Loans are carried at amortized cost on the Consolidated balance sheets.
The following are the contractual maturities related to the Equipment Loans, including interest payments:
Payments due by periodEquipment Loans balance as at
Carrying amount1
Contractual cash flows <1 yr 1-2 yrs 3-4 yrs >4 yrs
March 31, 2021 $ 25.2 $ 27.8 $ 8.9 $ 17.1 $ 1.8 $ — December 31, 2020 $ 28.2 $ 31.3 $ 9.4 $ 17.9 $ 4.0 $ —
1 The carrying amount of the long-term debt excludes unamortized deferred transaction costs of $0.2 million as at March 31, 2021 (December 31, 2020 - $0.2 million).
(c) Credit facility
The Company has a $500 million credit facility, which was entered into in December 2017. The credit facility was amended in February 2021, primarily to extend the maturity date on $490 million of committed credit to January 31, 2025. As of March 31, 2021, the Company had letters of credit worth $1.8 million drawn against the credit facility for the guarantee of certain environmental indemnities (December 31, 2020 - $1.7 million) and was in compliance with the credit facility covenants.
The credit facility provides for an interest rate margin above London Interbank Offered Rate (“LIBOR”), banker’s acceptance (“BA”) prime rate and base rate advances which vary according to the total net debt ratio of the Company. Fees related to the credit facility vary according to the total net debt ratio of the Company. This credit facility is secured by certain of the Company's real assets, guarantees by certain of the Company’s subsidiaries and pledges of shares of certain of the Company's subsidiaries. The key terms of the facility include limitations on incremental debt, certain restrictions on distributions and financial covenants including Net Debt to Earnings Before Interest, Taxes, Depreciation and Amortization, and Interest Coverage.
(d) Uncollateralized surety bonds
As at March 31, 2021, C$215.3 million (March 31, 2021 - $171.3 million; December 31, 2020 - C$215.3 million, $168.8 million) of surety bonds were outstanding to guarantee the environmental indemnities related to the Doyon division and the Côté Gold Project. The surety bonds were issued pursuant to arrangements with international insurance companies.
IAMGOLD CORPORATIONUnaudited Condensed Consolidated Interim Financial Statements – March 31, 2021 48

(e) Uncollateralized performance bonds
As at March 31, 2021, performance bonds of C$39.1 million (March 31, 2021 - $31.1 million; December 31, 2020 - C$39.1 million, $30.7 million) were outstanding to guarantee the Company's obligations in accordance with section 36 of the Fisheries Act (Canada) and for the Connection and Cost Recovery Agreement related to the Côté Gold Project.
18. Deferred Revenue
On January 15, 2019, the Company entered into a gold sale prepayment arrangement (the “Arrangement”) with a syndicate of banks whereby the Company received a cash prepayment of $169.8 million in exchange for delivering 12,500 ounces of gold per month in 2022, with a gold floor price of $1,300 per ounce and a cap price of $1,500 per ounce.
The Arrangement has been accounted for as a contract in the scope of IFRS 15 Revenue from Contracts with Customers whereby the cash prepayment has been recorded as deferred revenue in the consolidated balance sheets and will be recognized as revenue when deliveries are made. The prepayment represents a payment of the floor price of $1,300 per ounce. If the spot price on delivery of the gold ounces exceeds $1,300 per ounce, the Company will receive the difference between the spot price and $1,300 per ounce in cash, capped at $1,500 per ounce, which also will be recognized as revenue when the gold is delivered.
An interest cost, representing the significant financing component of the cash prepayment, is recognized as part of finance costs.
The following table summarizes the change in deferred revenue:
NotesBalance, January 1, 2020 $ 170.5 Finance costs 9.3 Balance, December 31, 2020 179.8 Finance costs 26 2.4 Balance, March 31, 2021 $ 182.2 Current portion of deferred revenue $ 48.8 Non-current deferred revenue 133.4
$ 182.2
19. Financial Instruments
(a) Financial assets measured at fair value through other comprehensive income
Marketable securities fair value reserve
Share market price exposure risk is related to the fluctuation in the market price of marketable securities. The Company’s portfolio of marketable securities is not part of its core operations, and accordingly, gains and losses from these marketable securities are not representative of the Company’s performance during the period. Consequently, the Company has designated all of its investments in marketable securities to be measured at fair value through Other comprehensive income ("OCI"). The Company’s portfolio of marketable securities is primarily focused on the mining sector and relates entirely to investments in equity securities.
Three months ended March 31,2021 2020
Proceeds from sale of marketable securities $ — $ 10.4 Acquisition date fair value of marketable securities sold — (10.3) Gain on sale of marketable securities recorded in OCI — 0.1 Reduction in value of marketable securities — (5.0) Net realized change in fair value of marketable securities $ — $ (4.9)
IAMGOLD CORPORATIONUnaudited Condensed Consolidated Interim Financial Statements – March 31, 2021 49

(b) Cash flow hedge fair value reserve
(i) Hedge gain/loss
Gain (loss) recognized in cash flow hedge reserve
(Gain) loss reclassified or adjusted from cash flow hedge
reserve
Three months ended March
31, 2021
Three months ended March
31, 2020
Three months ended March
31, 2021
Three months ended March
31, 2020Exchange rate risk
Canadian dollar option contracts $ 4.4 $ (7.7) $ (2.9) $ 0.6 Canadian dollar forward contracts 2.1 (0.7) (1.0) —
Crude oil option contracts 20.4 (39.3) (0.3) 1.4 Gold bullion option contracts 10.9 — (0.8) —
37.8 (47.7) (5.0) 2.0 Time value of option contracts excluded from hedge relationship (1.3) (9.6) 1.4 —
$ 36.5 $ (57.3) $ (3.6) $ 2.0
(Gain) loss reclassified or adjusted from cash flow hedge
reserve to:
Three months ended March
31, 2021
Three months ended March
31, 2020Consolidated balance sheets
Property, plant and equipment $ (2.3) $ 0.1 Consolidated statements of earnings (loss)
Revenue 0.6 — Cost of sales (0.7) 1.6 General and administrative expenses (0.9) 0.3 Other expenses (0.3) —
$ (3.6) $ 2.0
There was no hedge ineffectiveness for the three months ended March 31, 2021 and 2020.
(ii) Currency exchange rate risk
Movements in the Canadian dollar (C$) against the U.S. dollar ($) have a direct impact on the Company’s consolidated interim financial statements.
The Company manages its exposure to the Canadian dollar by executing option and forward contracts. The Company’s objective is to hedge its exposure to the Canadian dollar resulting from operating and capital expenditure requirements at some of its mine sites, corporate offices and development projects.
The Company has designated option and forward contracts as cash flow hedges for its highly probable forecasted Canadian dollar expenditure requirements. The Company has elected to only designate the change in the intrinsic value of options in the hedging relationships. The change in fair value of the time value component of options is recorded in OCI as a cost of hedging.
As at March 31, 2021, the Company's outstanding derivative contracts which qualified for hedge accounting and the periods in which the cash flows are expected to occur and impact the Consolidated statements of earnings (loss) and Property, plant and equipment balance on the Consolidated balance sheets are as follows:
2021 2022 2023 TotalCash flow hedges
Exchange rate riskCanadian dollar forward and option contracts (C$M) $ 234 $ 210 $ 185 $ 629
Rate range ($/C$)1 1.28 - 1.47 1.30 - 1.48 1.30 - 1.461 The Company executed Canadian dollar collar options, which consist of Canadian dollar call and put options within the given range in 2021
through 2023. The Company will recognize a gain from the difference between a lower market price and the Canadian dollar call strike price. The Company will incur a loss from the difference between a higher market price and the Canadian dollar put strike price.
IAMGOLD CORPORATIONUnaudited Condensed Consolidated Interim Financial Statements – March 31, 2021 50

Additional information on hedging instruments and hedged forecast transactions related to currency exchange rate risk as at March 31, 2021 and December 31, 2020 is as follows:
Carrying amount
Fair value changes used for calculating hedge
ineffectiveness
As at March 31, 2021 Assets Liabilities
Accumulated cash flow hedge fair
value reserve (before tax)
Hedging instruments Hedged items
Canadian dollar option contracts $ 27.6 $ — $ 23.8 $ 23.8 $ (23.8) Canadian dollar forward contracts 10.0 — 8.9 8.9 (8.9)
$ 37.6 $ — $ 32.7 $ 32.7 $ (32.7)
Carrying amount
Fair value changes used for calculating hedge
ineffectiveness
As at December 31, 2020 Assets Liabilities
Accumulated cash flow hedge fair
value reserve (before tax)
Hedging instruments
Hedged items
Canadian dollar option contracts $ 26.2 $ — $ 23.8 $ 23.8 $ (23.8) Canadian dollar forward contracts 8.9 — 8.9 8.9 (8.9)
$ 35.1 $ — $ 32.7 $ 32.7 $ (32.7)
(iii) Oil and fuel market price risk
Low sulfur diesel and fuel oil are key inputs to extract tonnage and, in some cases, to wholly or partially power operations, and construction and development activities. Brent crude oil and West Texas Intermediate ("WTI") crude oil prices are components of diesel and fuel oil costs, respectively, such that changes in the price of crude oil directly impacts diesel and fuel oil costs. The Company established a hedging strategy to economically hedge future consumption of diesel and fuel oil at the Rosebel and Essakane mines. During the third quarter 2020, the Company established a hedging program to limit the impact of fluctuations in crude oil prices to economically hedge future consumption of diesel and fuel oil to be used in the construction of the Côté Gold Project. The Company has designated option contracts as cash flow hedges for the crude oil component of its highly probable forecasted low sulfur diesel and fuel oil purchases.
As at March 31, 2021, the Company’s outstanding crude oil derivative contracts, which qualified for hedge accounting, and the periods in which the cash flows are expected to occur and impact the Consolidated statements of earnings (loss) and the Property, plant and equipment balance on the Consolidated balance sheets are as follows:
2021 2022 2023 2024 TotalBrent crude oil option contracts (barrels)1 441 520 428 270 1,659 Option contracts with strike prices at ($/barrel)2 54 - 65 50 - 65 41 - 65 41 - 55WTI crude oil option contracts (barrels)1 447 573 473 270 1,763 Option contracts with strike prices at ($/barrel)2 31 - 62 38 - 62 36 - 60 38 - 50
1 Quantities of barrels are in thousands.2 The Company executed Brent and WTI collar options, which consist of Brent and WTI put and call options with strike prices within the given
range in 2021 through 2024. The Company will incur a loss from the difference between a lower market price and the put strike price. The Company will recognize a gain from the difference between a higher market price and the call strike price.
IAMGOLD CORPORATIONUnaudited Condensed Consolidated Interim Financial Statements – March 31, 2021 51

Additional information on hedging instruments and hedged forecast transactions related to oil and fuel market price risk as at March 31, 2021 and December 31, 2020 was as follows:
Carrying amount
Fair value changes used for calculating hedge
ineffectiveness
As at March 31, 2021 Assets Liabilities
Accumulated cash flow hedge fair
value reserve (before tax)
Hedging instruments Hedged items
Brent crude oil option contracts $ 4.8 $ (0.2) $ (3.4) $ (3.4) $ 3.4 WTI crude oil option contracts 7.3 — 1.3 1.3 (1.3)
$ 12.1 $ (0.2) $ (2.1) $ (2.1) $ 2.1
Carrying amount
Fair value changes used for calculating hedge
ineffectiveness
As at December 31, 2020 Assets Liabilities
Accumulated cash flow hedge fair
value reserve (before tax)
Hedging instruments Hedged items
Brent crude oil option contracts $ 1.6 $ (7.5) $ (3.4) $ (3.4) $ 3.4 WTI crude oil option contracts 1.9 (4.5) 1.3 1.3 (1.3)
$ 3.5 $ (12.0) $ (2.1) $ (2.1) $ 2.1
(iv) Gold bullion market price risk
Movements in the spot price of gold have a direct impact on the Company’s consolidated financial statements as gold bullion is sold at prevailing market prices which fluctuate in line with market forces. The Company’s hedging strategy is designed to mitigate gold price risk during the Côté Gold Project construction period.
The Company has designated option contracts as cash flow hedges for its highly probable forecasted gold bullion sales upon entering into gold option contracts. The Company has elected to only designate the change in the intrinsic value of options in the hedging relationships. The changes in fair value of the time value component of options is recorded in OCI as a cost of hedging and reclassified to earnings (loss) when revenue for the underlying gold sale is recognized.
As at March 31, 2021, the Company’s outstanding gold bullion derivative contracts, which qualified for hedge accounting, and the periods in which the cash flows are expected to occur and impact the Consolidated statements of earnings (loss), are as follows:
2021 2022 2023 TotalGold bullion option contracts (ounces)1 145 18 24 187 Price range ($/ounce)2 1,600 - 3,000 1,800 - 3,000 1,700 - 2,700
1 Quantities of gold bullion are in thousands.2 The Company executed gold bullion collar options, which consist of put and call options with strike prices within the given range in 2021 through
2023. The Company will incur a gain from the difference between a lower market price and the put strike price. The Company will recognize a loss from the difference between a higher market price and the call strike price.
IAMGOLD CORPORATIONUnaudited Condensed Consolidated Interim Financial Statements – March 31, 2021 52

Additional information on hedging instruments and hedged forecasted transactions related to gold bullion market price risk as at March 31, 2021 and December 31, 2020 was as follows:
Carrying amount
Fair value changes used for calculating hedge
ineffectiveness
As at March 31, 2021 Assets Liabilities
Accumulated cash flow hedge fair
value reserve (before tax)
Hedging instruments Hedged items
Gold bullion option contracts $ 17.8 $ — $ 10.0 $ 10.0 $ (10.0)
Carrying amount
Fair value changes used for calculating hedge
ineffectiveness
As at December 31, 2020 Assets Liabilities
Accumulated cash flow hedge fair
value reserve (before tax)
Hedging instruments Hedged items
Gold bullion option contracts $ 8.1 $ — $ — $ — $ —
(c) Gain (loss) on non-hedge derivatives and warrants
Gains and losses on non-hedge derivatives, including embedded derivatives and warrants are included in Interest income, derivatives and other investment gains (losses) (note 27) in the Consolidated statements of earnings (loss).
These gains and losses relate to the Company's fair value movements of the embedded derivative related to prepayment options for the Notes (note 17(a)), the embedded derivative related to the Rosebel power purchase agreement (note 15), and warrants associated with investments in marketable securities.
Three months ended March 31,Notes 2021 2020
Embedded derivatives 15,17(a) $ (0.4) $ (29.1) Warrants and other — (0.9)
27 $ (0.4) $ (30.0)
20. Fair Value Measurements
The fair value hierarchy categorizes into three levels the inputs to valuation techniques used to measure fair value. The fair value hierarchy gives the highest priority to quoted prices (unadjusted) in active markets for identical assets or liabilities (Level 1 inputs) and the lowest priority to unobservable inputs (Level 3 inputs).
• Level 1 inputs are quoted prices (unadjusted) in active markets for identical assets or liabilities which the entity can access at the measurement date.
• Level 2 inputs are inputs other than quoted prices included within Level 1 which are observable for the asset or liability, either directly or indirectly such as those derived from prices.
• Level 3 inputs are unobservable inputs for the asset or liability.
There have been no changes in the classification of the financial instruments in the fair value hierarchy since December 31, 2020.
IAMGOLD CORPORATIONUnaudited Condensed Consolidated Interim Financial Statements – March 31, 2021 53
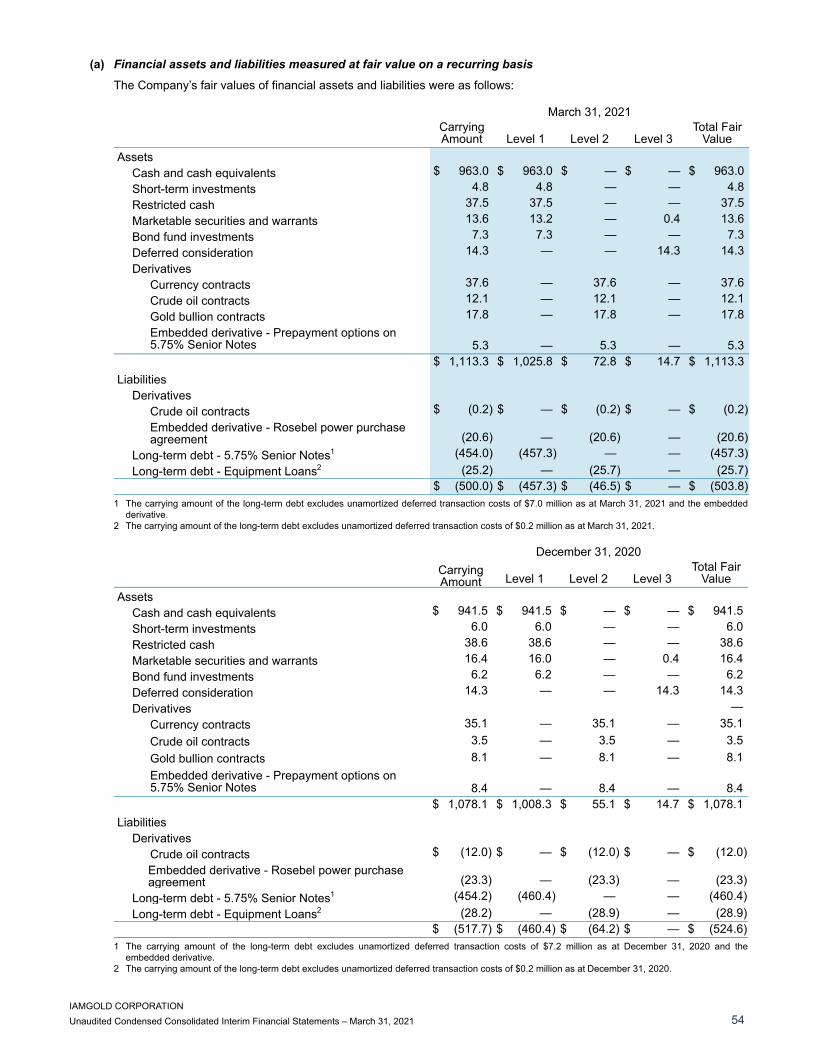
(a) Financial assets and liabilities measured at fair value on a recurring basis
The Company’s fair values of financial assets and liabilities were as follows:
March 31, 2021Carrying Amount Level 1 Level 2 Level 3
Total Fair Value
AssetsCash and cash equivalents $ 963.0 $ 963.0 $ — $ — $ 963.0 Short-term investments 4.8 4.8 — — 4.8 Restricted cash 37.5 37.5 — — 37.5 Marketable securities and warrants 13.6 13.2 — 0.4 13.6 Bond fund investments 7.3 7.3 — — 7.3 Deferred consideration 14.3 — — 14.3 14.3 Derivatives
Currency contracts 37.6 — 37.6 — 37.6 Crude oil contracts 12.1 — 12.1 — 12.1 Gold bullion contracts 17.8 — 17.8 — 17.8 Embedded derivative - Prepayment options on 5.75% Senior Notes 5.3 — 5.3 — 5.3
$ 1,113.3 $ 1,025.8 $ 72.8 $ 14.7 $ 1,113.3 Liabilities
DerivativesCrude oil contracts $ (0.2) $ — $ (0.2) $ — $ (0.2) Embedded derivative - Rosebel power purchase agreement (20.6) — (20.6) — (20.6)
Long-term debt - 5.75% Senior Notes1 (454.0) (457.3) — — (457.3) Long-term debt - Equipment Loans2 (25.2) — (25.7) — (25.7)
$ (500.0) $ (457.3) $ (46.5) $ — $ (503.8) 1 The carrying amount of the long-term debt excludes unamortized deferred transaction costs of $7.0 million as at March 31, 2021 and the embedded
derivative.2 The carrying amount of the long-term debt excludes unamortized deferred transaction costs of $0.2 million as at March 31, 2021.
December 31, 2020Carrying Amount Level 1 Level 2 Level 3
Total Fair Value
AssetsCash and cash equivalents $ 941.5 $ 941.5 $ — $ — $ 941.5 Short-term investments 6.0 6.0 — — 6.0 Restricted cash 38.6 38.6 — — 38.6 Marketable securities and warrants 16.4 16.0 — 0.4 16.4 Bond fund investments 6.2 6.2 — — 6.2 Deferred consideration 14.3 — — 14.3 14.3 Derivatives —
Currency contracts 35.1 — 35.1 — 35.1 Crude oil contracts 3.5 — 3.5 — 3.5 Gold bullion contracts 8.1 — 8.1 — 8.1 Embedded derivative - Prepayment options on 5.75% Senior Notes 8.4 — 8.4 — 8.4
$ 1,078.1 $ 1,008.3 $ 55.1 $ 14.7 $ 1,078.1 Liabilities
DerivativesCrude oil contracts $ (12.0) $ — $ (12.0) $ — $ (12.0) Embedded derivative - Rosebel power purchase agreement (23.3) — (23.3) — (23.3)
Long-term debt - 5.75% Senior Notes1 (454.2) (460.4) — — (460.4) Long-term debt - Equipment Loans2 (28.2) — (28.9) — (28.9)
$ (517.7) $ (460.4) $ (64.2) $ — $ (524.6) 1 The carrying amount of the long-term debt excludes unamortized deferred transaction costs of $7.2 million as at December 31, 2020 and the
embedded derivative. 2 The carrying amount of the long-term debt excludes unamortized deferred transaction costs of $0.2 million as at December 31, 2020.
IAMGOLD CORPORATIONUnaudited Condensed Consolidated Interim Financial Statements – March 31, 2021 54

(b) Valuation techniques
Cash, cash equivalents, short-term investments and restricted cash
Cash, cash equivalents, short-term investments and restricted cash are included in Level 1 due to the short-term maturity of these financial assets.
Marketable securities and warrants
The fair value of marketable securities included in Level 1 is determined based on a market approach. The closing price is a quoted market price from the exchange market which is the principal active market for the particular security. The fair value of warrants included in Level 2 is obtained through the use of Black-Scholes pricing model, which uses share price inputs and volatility measurements. The fair value of investments in equity instruments which are not actively traded is determined using valuation techniques which require inputs that are both unobservable and significant, and therefore were categorized as Level 3 in the fair value hierarchy. The Company uses the latest market transaction price for these securities, obtained from the entity, to value these marketable securities.
Marketable securities included in level 3Balance, December 31, 2020 $ 0.4 Reduction in value of marketable securities — Change in fair value reported in Other comprehensive income (loss), net of income taxes — Balance, March 31, 2021 $ 0.4
Bond fund investments
The fair value of bond fund investments included in Level 1 is measured using quoted prices (unadjusted) in active markets.
Derivatives
For derivative contracts, the Company obtains a valuation of the contracts from counterparties of those contracts. The Company assesses the reasonableness of these valuations through internal methods and third-party valuations. The Company then calculates a credit valuation adjustment to reflect the counterparty’s or the Company’s own default risk. Valuations are based on market valuations considering interest rate and volatility, taking into account the credit risk of the financial instrument. Valuations of derivative contracts are therefore classified within Level 2 of the fair value hierarchy.
Embedded derivatives - Prepayment options on the Notes
The fair value of the embedded derivatives as at March 31, 2021 was $5.3 million (December 31, 2020 - $8.4 million) and is accounted for at FVTPL. The valuation is based on the discounted cash flows at the risk-free rate to determine the present value of the prepayment option. Key inputs used in the valuation include the credit spread, volatility parameter and the risk-free rate curve. Valuation of the prepayment option is therefore classified within Level 2 of the fair value hierarchy.
Embedded derivative - Rosebel power purchase agreement
The fair value of the embedded derivative on Rosebel's power purchase agreement as at March 31, 2021 was $20.6 million (December 31, 2020 - $23.3 million) and is accounted for at FVTPL. Included in the power purchase agreement is a price escalator which results in increases in electricity prices linked to the price of gold. The valuation is based on the discounted estimated incremental cash flows above the baseline power price at the risk-free rate to determine the present value of the price escalator. Key inputs used in the valuation include the credit spread, volatility parameter, the risk-free rate curve and future gold price estimates. Valuation of the price escalator is therefore classified within Level 2 of the fair value hierarchy.
Notes
The fair value of the Notes required to be disclosed is determined using quoted prices (unadjusted) in active markets, and is therefore classified within Level 1 of the fair value hierarchy. The fair value of the Notes as at March 31, 2021 was $457.3 million (December 31, 2020 - $460.4 million).
Equipment Loans
The fair value of the Equipment Loans required to be disclosed is determined by applying a discount rate, reflecting the credit spread based on the Company's credit rating to future cash flows and is therefore classified within Level 2 of the fair value hierarchy. The fair value of the Equipment Loans as at March 31, 2021 was $25.7 million (December 31, 2020 - $28.9 million).
Other financial assets and liabilities
The fair value of all other financial assets and liabilities of the Company approximate their carrying amounts.
IAMGOLD CORPORATIONUnaudited Condensed Consolidated Interim Financial Statements – March 31, 2021 55

21. Share Capital
The Company is authorized to issue an unlimited number of common shares, first preference shares issuable in series and second preference shares issuable in series.
Three months ended March 31,Number of common shares (in millions) 2021 2020Outstanding, beginning of the period 475.3 469.0 Issuance of shares for share-based compensation 1.2 1.9
Outstanding, end of the period 476.5 470.9
22. Earnings (Loss) Per Share
Basic earnings (loss) per share computation
Three months ended March 31,2021 2020
NumeratorNet earnings (loss) attributable to equity holders $ 19.5 $ (34.4) Denominator (in millions)Weighted average number of common shares (basic) 475.8 470.1 Basic earnings (loss) per share attributable to equity holders $ 0.04 $ (0.07)
Diluted earnings (loss) per share computation
Three months ended March 31,2021 2020
Denominator (in millions)Weighted average number of common shares (basic) 475.8 470.1 Dilutive effect of share options 0.2 — Dilutive effect of full value award units 4.9 — Weighted average number of common shares (diluted) 480.9 470.1 Diluted earnings (loss) per share attributable to equity holders $ 0.04 $ (0.07)
Equity instruments excluded from the computation of diluted earnings per share, which could be dilutive in the future, were as follows:
Three months ended March 31,(in millions) Notes 2021 2020Share options 23(a) 4.2 5.8 Full value awards 23(b) — 6.9
4.2 12.7
IAMGOLD CORPORATIONUnaudited Condensed Consolidated Interim Financial Statements – March 31, 2021 56

23. Share-Based Compensation
(a) Share option award plan
(i) Share option award plan
A summary of the status of the Company's share option award plan and changes during the period is presented below:
Three months ended March 31, 2021
Shareoptions
(in millions)
Weighted average
exercise price (C$/share)1
Outstanding, beginning of the period 4.7 $ 4.91 Granted 0.9 3.98 Expired (0.4) 4.38 Outstanding, end of the period 5.2 $ 4.80 Exercisable, end of the period 2.9 $ 4.74
1 Exercise prices are denominated in Canadian dollars. The exchange rate at March 31, 2021 between the U.S. dollar and Canadian dollar was $0.7955/C$.
(ii) Summary of awards granted
The following were the weighted average inputs to the Black-Scholes model used in determining the fair value of the options granted. The estimated fair value of the options is expensed over their expected life.
Three months ended March 31, 2021Weighted average risk-free interest rate 0.7% Weighted average expected volatility1 57% Weighted average dividend yield 0.0% Weighted average expected life of options issued (years) 5.0 Weighted average grant-date fair value (C$ per share) $ 2.06 Weighted average share price at grant date (C$ per share) $ 3.98 Weighted average exercise price (C$ per share) $ 3.98
1 Expected volatility is estimated by considering historic average share price volatility based on the average expected life of the options.
(b) Full value award plans
(i) Full value award reserve
A summary of the status of the Company’s director share units, restricted share units, and performance share units issued to employees and directors under the full value award plan and changes during the period is presented below.
Three months ended March 31, (in millions) 2021Outstanding, beginning of the period 6.7 Granted 2.4 Issued (1.2) Forfeited and withheld for tax (0.4) Outstanding, end of the period 7.5 Exercisable, end of the period 0.3
IAMGOLD CORPORATIONUnaudited Condensed Consolidated Interim Financial Statements – March 31, 2021 57

(ii) Summary of awards granted
Director share units
The following were the weighted average inputs to the Black-Scholes model used in determining the fair value of the director share units granted. The estimated fair value of the awards is expensed over their vesting period.
Three months ended March 31, 2021Granted during the period (in millions) 0.1 Weighted average risk-free interest rate 0.2% Weighted average expected volatility1 68.3% Weighted average dividend yield 0.0% Weighted average expected life of deferred share units issued (years) 1.0 Weighted average grant-date fair value (C$ per share) $ 4.67 Weighted average share price at grant date (C$ per share) $ 4.67
1 Expected volatility is estimated by considering historic average share price volatility based on the average expected life of the units.
Restricted share units
Employee restricted share unit grants vest over twelve to thirty-six months, have no restrictions upon vesting and are equity settled. The following were the weighted average inputs to the Black-Scholes model used in determining the fair value of the restricted share units granted. The estimated fair value of the awards is expensed over their vesting period.
Three months ended March 31, 2021Granted during the period (in millions) 1.8 Weighted average risk-free interest rate 0.3% Weighted average expected volatility1 56.1% Weighted average dividend yield 0.0% Weighted average expected life of restricted share units issued (years) 3.0 Weighted average grant-date fair value (C$ per share) $ 4.17 Weighted average share price at grant date (C$ per share) $ 4.17
1 Expected volatility is estimated by considering historic average share price volatility based on the average expected life of the restricted share units.
Performance share units
Employee performance share unit grants vest over thirty-six months, are equity settled and vesting is subject to long-term performance measures. The following were the weighted average inputs to the Black-Scholes and Monte Carlo models used in determining the fair value of the performance share units granted. The estimated fair value of the awards is expensed over their vesting period.
Three months ended March 31, 2021Granted during the period (in millions) 0.5 Weighted average risk-free interest rate 0.3% Weighted average expected volatility1 56.1% Weighted average dividend yield 0.0% Weighted average expected life of performance share units issued (years) 3.0 Weighted average grant-date fair value (C$ per share) $ 4.39 Weighted average share price at grant date (C$ per share) $ 4.15
1 Expected volatility is estimated by considering historic average share price volatility based on the average expected life of the performance share units.
IAMGOLD CORPORATIONUnaudited Condensed Consolidated Interim Financial Statements – March 31, 2021 58

24. Cost of Sales
Three months ended March 31,2021 2020
Operating costs1 $ 163.6 $ 165.8 Royalties 15.6 13.4 Depreciation expense2 74.0 63.4
$ 253.2 $ 242.6 1 Operating costs include mine production, transport and smelter costs, and site administrative expenses.2 Depreciation expense excludes depreciation related to Corporate assets, which is included in General and administrative expenses.
25. Other Expenses
Three months ended March 31,2021 2020
COVID-19 expenses1 $ 4.5 $ — Care and maintenance costs2 13.1 1.3 Write-down of assets 0.7 0.5 Consulting costs 0.2 0.7 Other 1.7 0.4
$ 20.2 $ 2.9 1 COVID-19 expenses pertain to incremental costs incurred resulting from the impact of COVID-19 on the operations of the Company, including costs related
to incremental labour, transportation, safety and other new operational measures and processes implemented to manage the impact of COVID-19.2 Westwood mine was on care and maintenance between March 25, 2020 and April 15, 2020 as directed by the Government of Quebec in response to the
global COVID-19 crisis. Westwood mine was placed on care and maintenance following a seismic event which occurred on October 30, 2020.
26. Finance Costs
Three months ended March 31,Notes 2021 2020
Interest expense $ 3.5 $ 2.6 Credit facility fees 1.3 1.2 Accretion expense - Gold prepayment 18 2.4 2.3 Accretion expense - Other — 0.1 $ 7.2 $ 6.2
Total interest paid during the three months ended March 31, 2021 was $1.1 million (three months ended March 31, 2020 - $1.1 million). Interest paid relates to interest charges on notes, credit facilities, the Equipment Loans and leases.
27. Interest Income, Derivatives and Other Investment Gains (Losses)
Three months ended March 31,Notes 2021 2020
Gain on sale of royalties1 $ 35.7 $ — Interest income 1.2 3.9 Loss on non-hedge derivatives and warrants 19(c) (0.4) (30.0) Other losses (0.6) (0.4)
$ 35.9 $ (26.5) 1 The Company sold 33 royalties on various non-core exploration and development properties to Triple Flag Precious Metals Corp for cash consideration of
$35.7 million. The Company recognized a gain of $35.7 million on the sale. Subsequent to the quarter, the Company sold another 2 royalties for cash consideration of $10.5 million. After transaction costs of $0.1 million, the Company will recognize a gain of $10.4 million in the second quarter 2021.
IAMGOLD CORPORATIONUnaudited Condensed Consolidated Interim Financial Statements – March 31, 2021 59

28. Cash Flow Items
(a) Adjustments for other non-cash items within operating activities
Three months ended March 31,2021 2020
Share-based compensation $ 2.3 $ 1.9 Write-down of assets 0.7 0.5 Share of net loss from investments in associate and incorporated jointventures, net of income taxes 0.2 0.4 Interest income (1.2) (3.9) Effects of exchange rate fluctuation on cash and cash equivalents 2.7 8.2 Effects of exchange rate fluctuation on restricted cash 1.6 0.5 Other (0.7) (0.1) $ 5.6 $ 7.5
(b) Movements in non-cash working capital items and non-current ore stockpiles
Three months ended March 31,2021 2020
Receivables and other current assets $ 31.7 $ (8.0) Inventories and non-current ore stockpiles 0.4 (9.7) Accounts payable and accrued liabilities (12.9) (11.0)
$ 19.2 $ (28.7)
(c) Net cash used in operating activities related to closed mines
Three months ended March 31,Notes 2021 2020
Net loss from closed mines $ (0.4) $ (0.3) Adjustments for:Finance costs at closed mines 26 0.3 0.2 Movement in non-cash working capital at closed sites — (0.1)
Adjustments for cash items:Disbursements related to asset retirement obligations at closed sites (0.8) (0.6)
$ (0.9) $ (0.8)
(d) Other investing activities
Three months ended March 31,2021 2020
Advances to Staatsolie $ (11.1) $ — Repayments from Staatsolie 15.0 — Cash received on sale of Sadiola 1.8 — Interest received 1.1 3.5 Purchase of additional common shares of associate (1.7) — Prepayment for other assets (1.0) — Repayments from related parties — 0.1 Other (0.2) 0.1 $ 3.9 $ 3.7
IAMGOLD CORPORATIONUnaudited Condensed Consolidated Interim Financial Statements – March 31, 2021 60

(e) Reconciliation of long-term debt arising from financing activities
NotesEquipment
Loans
5.75% Senior Notes
7% Senior Notes Total
Balance, January 1, 2020 $ 20.4 $ — $ 388.1 $ 408.5 Cash changes:
Gross proceeds 17(c) 10.9 450.0 — 460.9 Deferred transaction costs — (7.5) — (7.5) Repayments (6.2) — (421.3) (427.5)
Non-cash changes:Amortization of deferred financing charges 0.1 0.3 0.5 0.9 Foreign currency translation 2.8 — — 2.8 Change in fair value of embedded derivative 17(b) — (4.2) 12.0 7.8 Loss on redemption — — 22.5 22.5 Other — — (1.8) (1.8)
Balance, December 31, 2020 $ 28.0 $ 438.6 $ — $ 466.6 Cash changes:
Repayments (1.9) — — (1.9) Non-cash changes:
Amortization of deferred financing charges — 0.2 — 0.2 Foreign currency translation (1.1) — — (1.1) Change in fair value of embedded derivative 17(b) — 3.1 — 3.1 Other — (0.2) — (0.2)
Balance, March 31, 2021 $ 25.0 $ 441.7 $ — $ 466.7
29. Commitments
March 31,2021
December 31, 2020
Purchase obligations $ 120.6 $ 120.3 Capital expenditure obligations 490.8 400.6 Lease obligations 68.0 72.4
$ 679.4 $ 593.3
Commitments – payments due by period
As at March 31, 2021 Total <1 yr1 1-2 yrs2 3-4 yrs3 >4 yrs4
Purchase obligations $ 120.6 $ 112.0 $ 2.3 $ 4.0 $ 2.3 Capital expenditure obligations 490.8 372.6 118.2 — — Lease obligations 68.0 15.7 35.2 15.5 1.6
$ 679.4 $ 500.3 $ 155.7 $ 19.5 $ 3.9 1 Due over the period from April 1, 2021 to December 31, 2021.2 Due over the period from January 1, 2022 to December 31, 2023.3 Due over the period from January 1, 2024 to December 31, 2025.4 Due from January 1, 2026 and beyond.
IAMGOLD CORPORATIONUnaudited Condensed Consolidated Interim Financial Statements – March 31, 2021 61

30. Segmented Information
The Company’s gold mines are divided into geographic segments as follows:• Burkina Faso - Essakane mine;• Suriname - Rosebel mine and Saramacca pit; and• Canada - Doyon division, including Westwood mine.
The Company’s non-gold mine segments are divided as follows:• Côté Gold Project1;• Exploration and evaluation and development; and• Corporate - includes royalty interests located in Canada and investment in associate.
March 31, 2021 December 31, 2020Total non-
currentassets
Totalassets
Totalliabilities
Total non-currentassets
Totalassets
Totalliabilities
Gold minesBurkina Faso $ 956.1 $ 1,228.2 $ 272.5 $ 976.9 $ 1,332.5 $ 284.4 Suriname 720.1 929.6 402.8 698.5 1,003.4 399.0 Canada 327.7 344.1 201.6 331.7 349.0 205.9
Total gold mines 2,003.9 2,501.9 876.9 2,007.1 2,684.9 889.3 Côté Gold Project 634.5 696.7 51.3 566.8 618.2 35.6 Exploration and evaluation and development 97.6 243.9 8.2 85.7 234.3 11.6 Corporate 102.0 761.4 674.4 99.2 616.9 672.3 Total $ 2,838.0 $ 4,203.9 $ 1,610.8 $ 2,758.8 $ 4,154.3 $ 1,608.8
Three months ended March 31, 2021
Consolidated statements of earnings (loss) information
Capitalexpenditures4 Revenues
Cost ofsales1
Depreciationexpense2
General and
administrative3 Exploration Other
Earnings(loss) fromoperations
Gold minesBurkina Faso $ 204.1 $ 113.8 $ 55.8 $ — $ 0.4 $ 1.6 $ 32.5 $ 19.9 Suriname 78.8 56.1 17.4 — 0.7 3.2 1.4 18.4 Canada 14.5 9.3 0.4 — — 14.0 (9.2) 1.0
Total gold mines 297.4 179.2 73.6 — 1.1 18.8 24.7 39.3 Côté Gold Project — — — — 0.6 — (0.6) 48.4 Exploration and evaluation and development5 — — — — 5.9 — (5.9) 14.5 Corporate6 — — 0.4 9.4 — 1.4 (11.2) 0.3 Total $ 297.4 $ 179.2 $ 74.0 $ 9.4 $ 7.6 $ 20.2 $ 7.0 $ 102.5
1 Excludes depreciation expense.2 Depreciation expense excludes depreciation related to Corporate assets, which is included in General and administrative expenses.3 Includes depreciation expense relating to Corporate and Exploration and evaluation assets. 4 Includes cash expenditures for Property, plant and equipment and Exploration and evaluation assets.5 Closed site costs on Exploration and evaluation properties included in Other expenses.6 Includes earnings from royalty interests.
______________________________
1 The Côté Gold Project is considered a separate operating segment following the decision to proceed with construction as the financial information for the Project is reviewed regularly by the Company’s Chief Operating Decision Maker to assess the performance of the Project and to make resource allocation decisions. The segment includes the financial information of the Côté UJV as well as other financial information for the Côté Gold Project outside of the Côté UJV.
IAMGOLD CORPORATIONUnaudited Condensed Consolidated Interim Financial Statements – March 31, 2021 62

Three months ended March 31, 2020
Consolidated statements of earnings (loss) information
Capitalexpenditures4 Revenues
Cost ofsales1
Depreciationexpense2
General and
administrative3 Exploration Other
Earnings(loss) fromoperations
Gold minesBurkina Faso $ 132.5 $ 80.1 $ 35.1 $ — $ — $ — $ 17.3 $ 31.9 Suriname 106.0 73.6 20.7 — 0.9 0.4 10.4 20.5 Canada 36.0 25.5 6.8 — — 2.0 1.7 4.6
Total gold mines 274.5 179.2 62.6 — 0.9 2.4 29.4 57.0 Côté Gold Project — — — — 0.7 — (0.7) 8.3 Exploration and evaluation and development5 — — — — 6.8 — (6.8) 2.2 Corporate6 — — 0.8 11.9 — 0.5 (13.2) — Total $ 274.5 $ 179.2 $ 63.4 $ 11.9 $ 8.4 $ 2.9 $ 8.7 $ 67.5
1 Excludes depreciation expense.2 Depreciation expense excludes depreciation related to Corporate assets, which is included in General and administrative expenses.3 Includes depreciation expense relating to Corporate and Exploration and evaluation assets.4 Includes cash expenditures for Property, plant and equipment and Exploration and evaluation assets.5 Closed site costs on Exploration and evaluation properties included in Other expenses.6 Includes earnings from royalty interests.
31. Subsequent Event
Gold sale prepayment arrangements
In April 2021, the Company entered into gold sale prepayment arrangements at an average cost of 4.44% per annum in respect of 50,000 gold ounces at an average price of $1,753 per ounce, which will result in a total prepayment to the Company of $80.3 million over the course of 2022 and the requirement on the part of the Company to physically deliver such ounces to the counterparties over the course of 2024.
IAMGOLD CORPORATIONUnaudited Condensed Consolidated Interim Financial Statements – March 31, 2021 63

IAMGOLD Corporation
401 Bay Street, Suite 3200, PO Box 153
Toronto, Ontario, Canada M5H 2Y4
Toll Free 1 888 IMG 9999
www.iamgold.com


