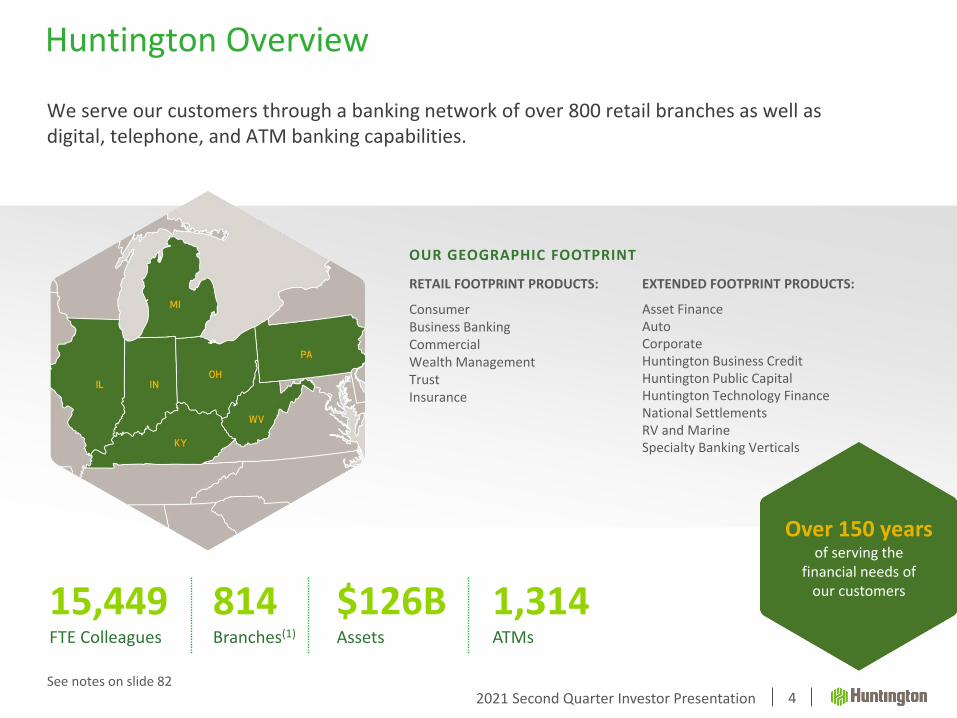
Asset FinanceAutoCorporateHuntington Business CreditHuntington Public CapitalHuntington Technology FinanceNational SettlementsRV and MarineSpecialty Banking Verticals
OUR GEOGRAPHIC FOOTPRINT
15,449FTE Colleagues
1,314ATMs
814Branches(1)
$126BAssets
Over 150 yearsof serving the
financial needs of our customers
4See notes on slide 82
2021 Second Quarter Investor Presentation
Julie Tutkovics
Executive Vice President,Chief Marketing and Communications Officer
Experienced, Diverse Executive Leadership Team
5
Stephen Steinour
Chairman, President, and CEO,Huntington Bancshares Incorporatedand The Huntington National Bank
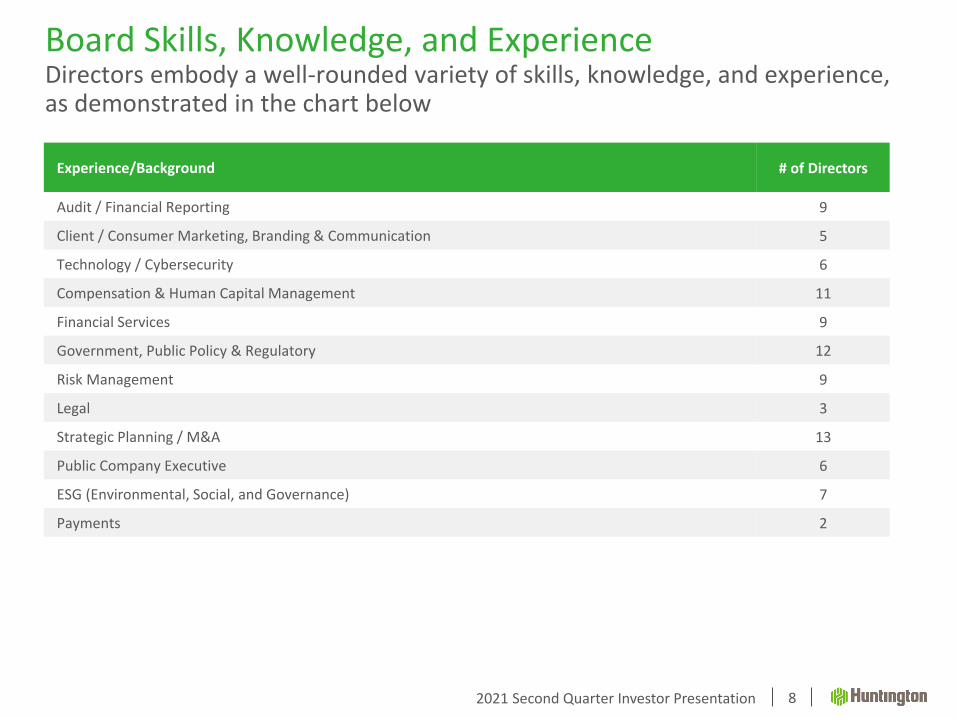
Client / Consumer Marketing, Branding & Communication 5
Technology / Cybersecurity 6
Compensation & Human Capital Management 11
Financial Services 9
Government, Public Policy & Regulatory 12
Risk Management 9
Legal 3
Strategic Planning / M&A 13
Public Company Executive 6
ESG (Environmental, Social, and Governance) 7
Payments 2
8
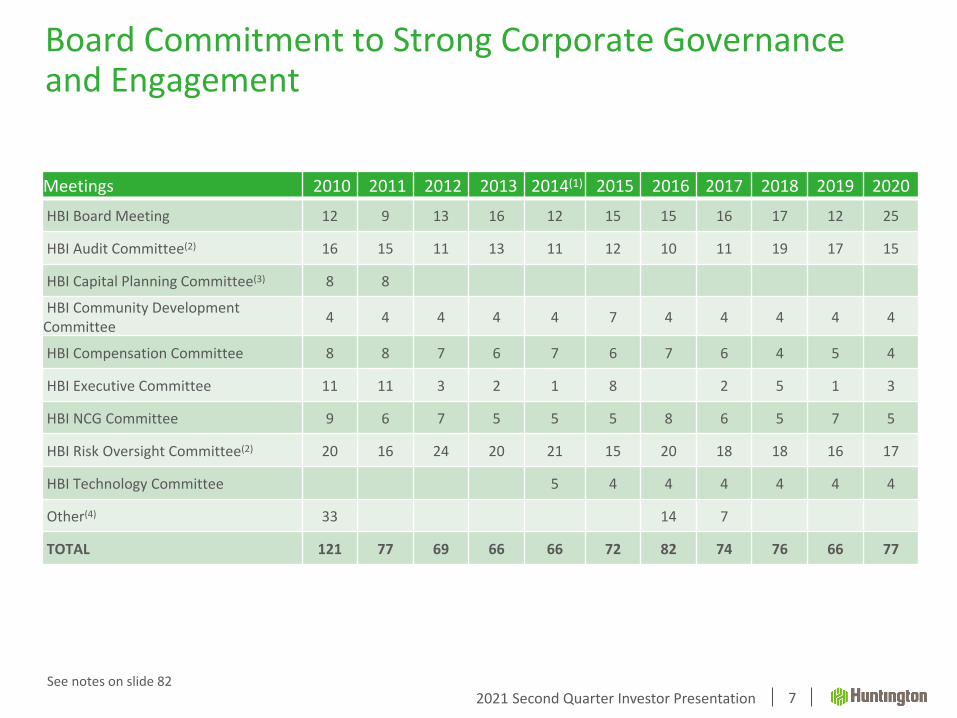
Board Skills, Knowledge, and ExperienceDirectors embody a well-rounded variety of skills, knowledge, and experience, as demonstrated in the chart below
2021 Second Quarter Investor Presentation
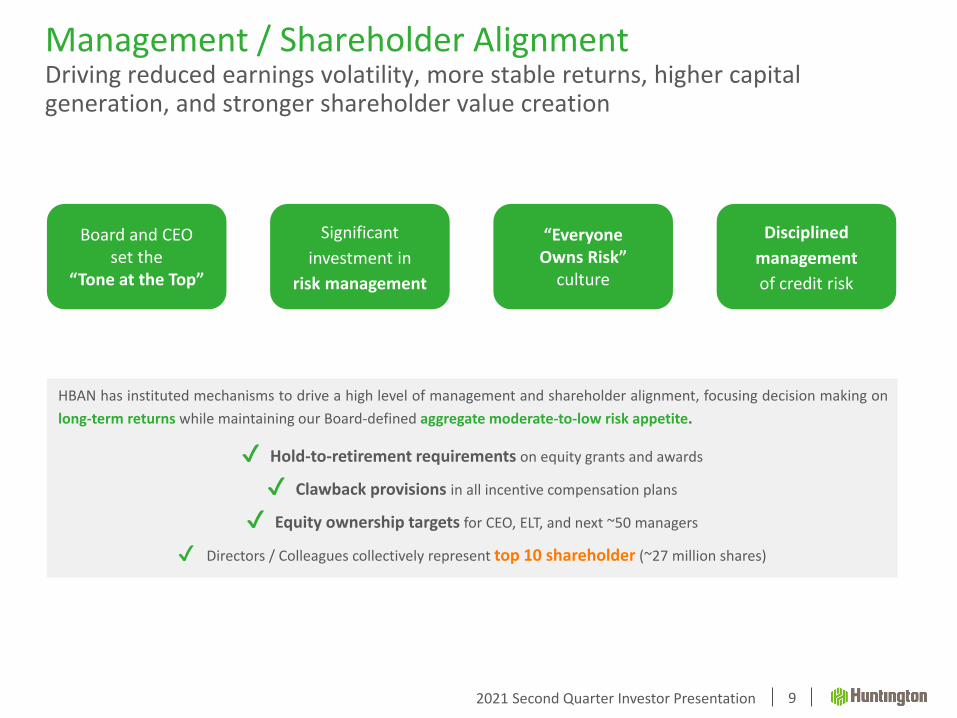
HBAN has instituted mechanisms to drive a high level of management and shareholder alignment, focusing decision making on
long-term returns while maintaining our Board-defined aggregate moderate-to-low risk appetite.
✔ Hold-to-retirement requirements on equity grants and awards
✔ Clawback provisions in all incentive compensation plans
✔ Equity ownership targets for CEO, ELT, and next ~50 managers
✔ Directors / Colleagues collectively represent top 10 shareholder (~27 million shares)
Board and CEOset the
“Tone at the Top”
“Everyone Owns Risk”
culture
Disciplined
management
of credit risk
Significant
investment in
risk management
Management / Shareholder AlignmentDriving reduced earnings volatility, more stable returns, higher capital generation, and stronger shareholder value creation
9
2021 Second Quarter Investor Presentation
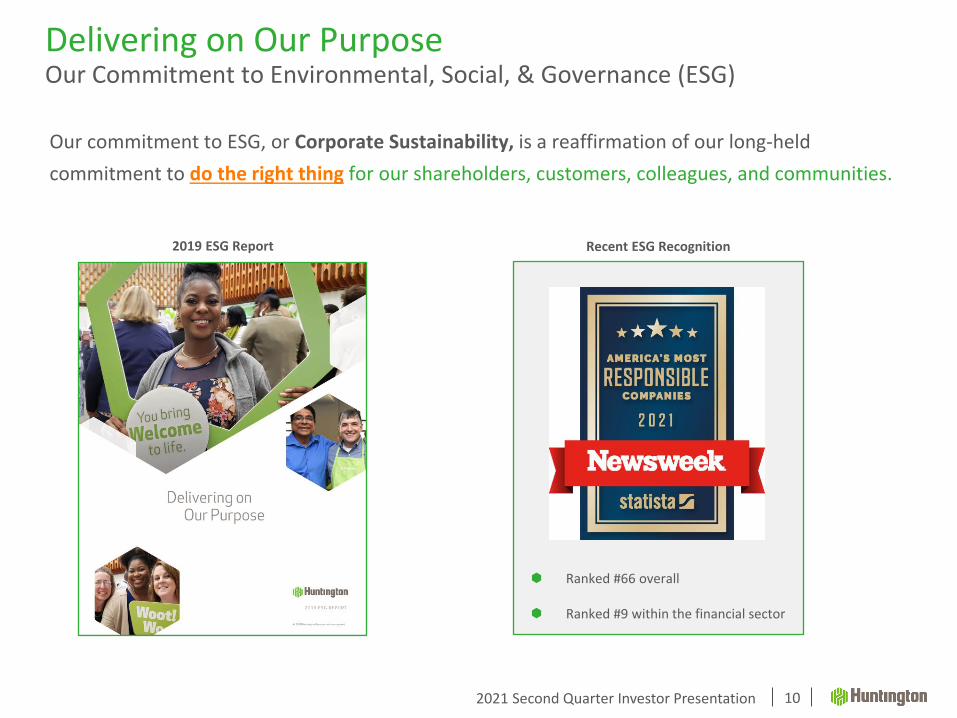
Ranked #66 overall
Ranked #9 within the financial sector
Recent ESG Recognition
Delivering on Our PurposeOur Commitment to Environmental, Social, & Governance (ESG)
10
Our commitment to ESG, or Corporate Sustainability, is a reaffirmation of our long-held
commitment to do the right thing for our shareholders, customers, colleagues, and communities.
2019 ESG Report
2021 Second Quarter Investor Presentation
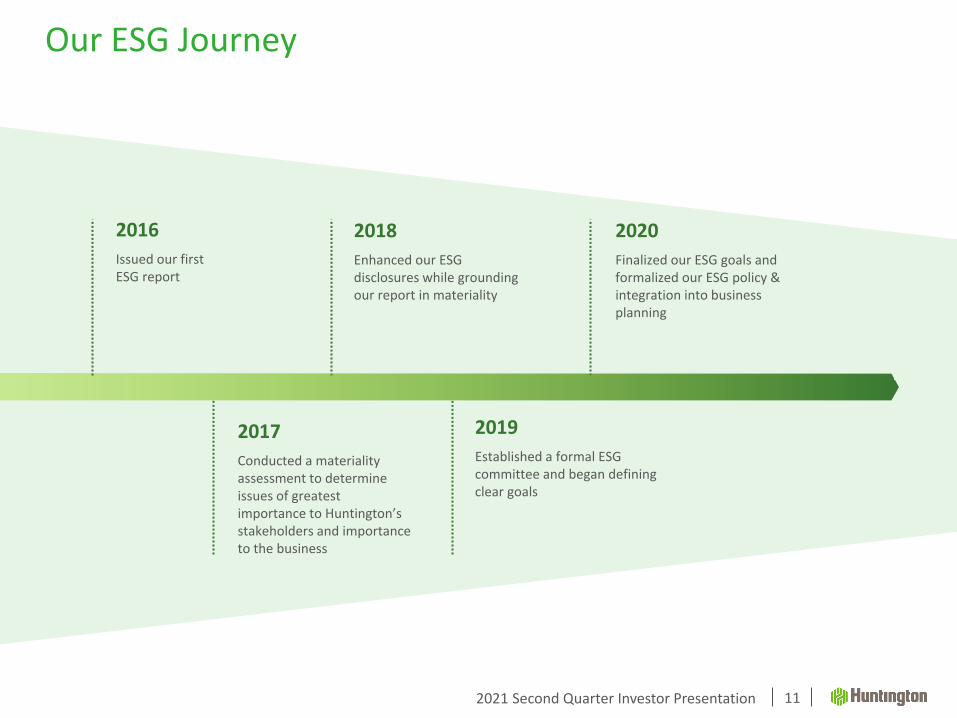
Our ESG Journey
2018
Enhanced our ESG disclosures while grounding our report in materiality
2020
Finalized our ESG goals and formalized our ESG policy & integration into business planning
2017
Conducted a materiality assessment to determine issues of greatest importance to Huntington’s stakeholders and importance to the business
2019
Established a formal ESG committee and began defining clear goals
2016
Issued our first ESG report
11
2021 Second Quarter Investor Presentation
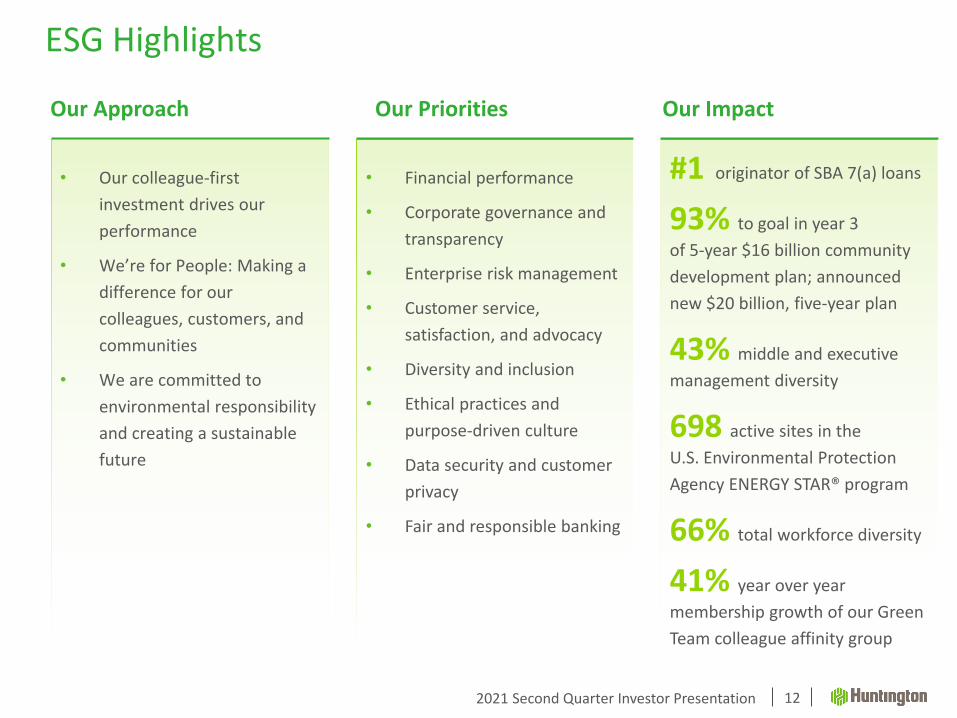
ESG Highlights
• Our colleague-first
investment drives our
performance
• We’re for People: Making a
difference for our
colleagues, customers, and
communities
• We are committed to
environmental responsibility
and creating a sustainable
future
• Financial performance
• Corporate governance and
transparency
• Enterprise risk management
• Customer service,
satisfaction, and advocacy
• Diversity and inclusion
• Ethical practices and
purpose-driven culture
• Data security and customer
privacy
• Fair and responsible banking
#1 originator of SBA 7(a) loans
93% to goal in year 3
of 5-year $16 billion community
development plan; announced
new $20 billion, five-year plan
43% middle and executive
management diversity
698 active sites in the
U.S. Environmental Protection
Agency ENERGY STAR® program
66% total workforce diversity
41% year over year
membership growth of our Green
Team colleague affinity group
Our Approach Our Priorities Our Impact
12
Strategy
2021 Second Quarter Investor Presentation
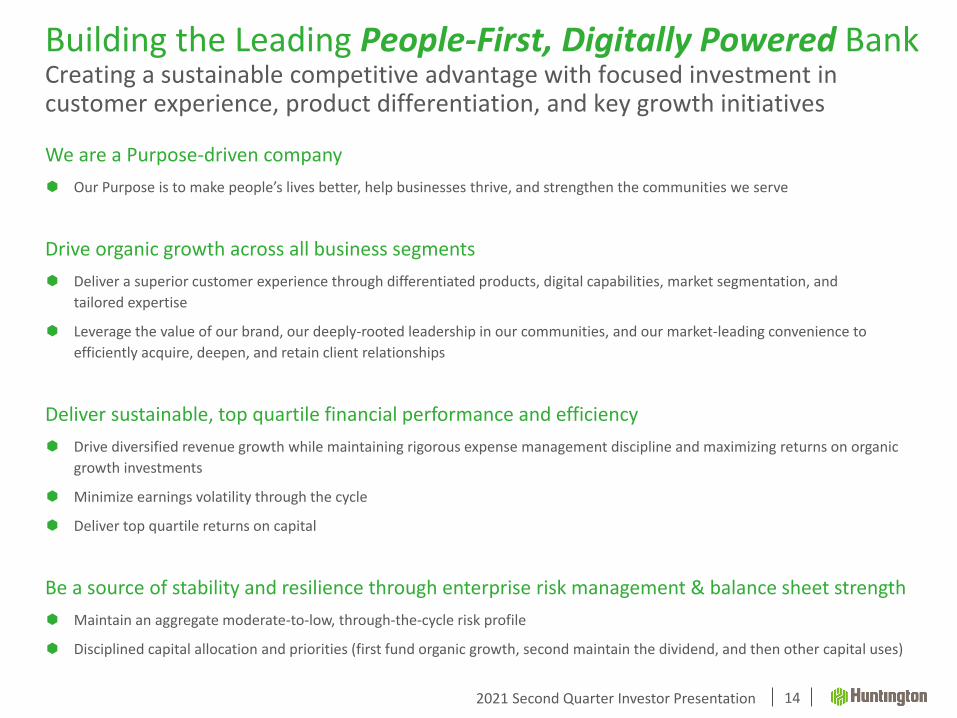
Building the Leading People-First, Digitally Powered BankCreating a sustainable competitive advantage with focused investment in customer experience, product differentiation, and key growth initiatives
14
We are a Purpose-driven company
Our Purpose is to make people’s lives better, help businesses thrive, and strengthen the communities we serve
Drive organic growth across all business segments
Deliver a superior customer experience through differentiated products, digital capabilities, market segmentation, and
tailored expertise
Leverage the value of our brand, our deeply-rooted leadership in our communities, and our market-leading convenience to
efficiently acquire, deepen, and retain client relationships
Deliver sustainable, top quartile financial performance and efficiency
Drive diversified revenue growth while maintaining rigorous expense management discipline and maximizing returns on organic
growth investments
Minimize earnings volatility through the cycle
Deliver top quartile returns on capital
Be a source of stability and resilience through enterprise risk management & balance sheet strength
Maintain an aggregate moderate-to-low, through-the-cycle risk profile
Disciplined capital allocation and priorities (first fund organic growth, second maintain the dividend, and then other capital uses)
2021 Second Quarter Investor Presentation
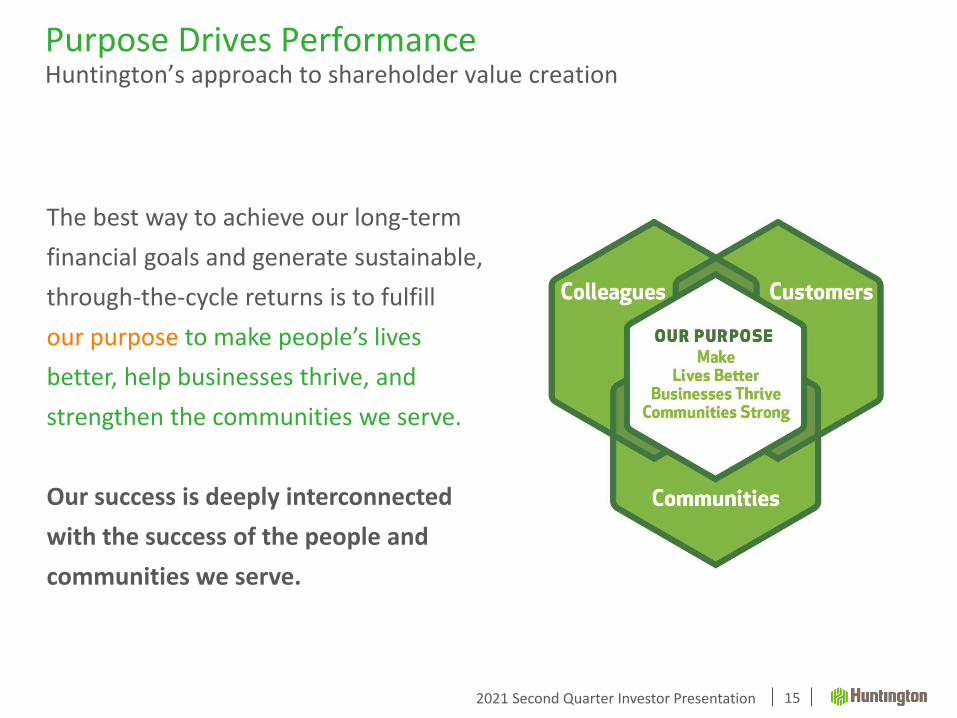
Purpose Drives PerformanceHuntington’s approach to shareholder value creation
The best way to achieve our long-term
financial goals and generate sustainable,
through-the-cycle returns is to fulfill
our purpose to make people’s lives
better, help businesses thrive, and
strengthen the communities we serve.
Our success is deeply interconnected
with the success of the people and
communities we serve.
15
2021 Second Quarter Investor Presentation
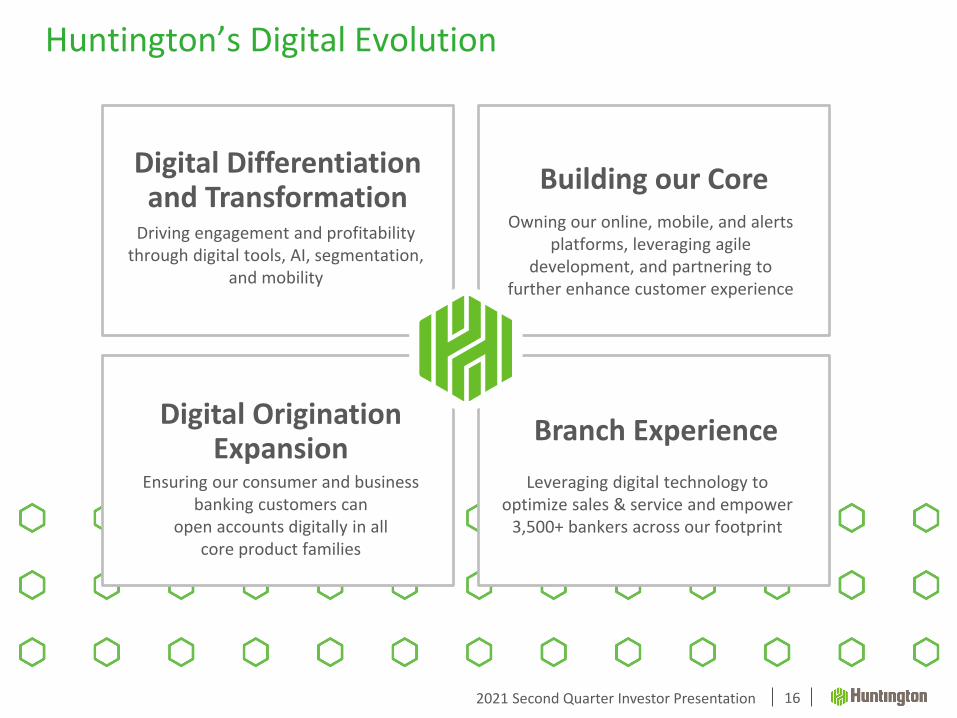
Huntington’s Digital Evolution
16
Digital Differentiation and Transformation
Building our Core
Digital Origination Expansion
Branch Experience
Driving engagement and profitability through digital tools, AI, segmentation,
and mobility
Owning our online, mobile, and alerts platforms, leveraging agile
development, and partnering to further enhance customer experience
Ensuring our consumer and business banking customers can
open accounts digitally in all core product families
Leveraging digital technology to optimize sales & service and empower
3,500+ bankers across our footprint
2021 Second Quarter Investor Presentation
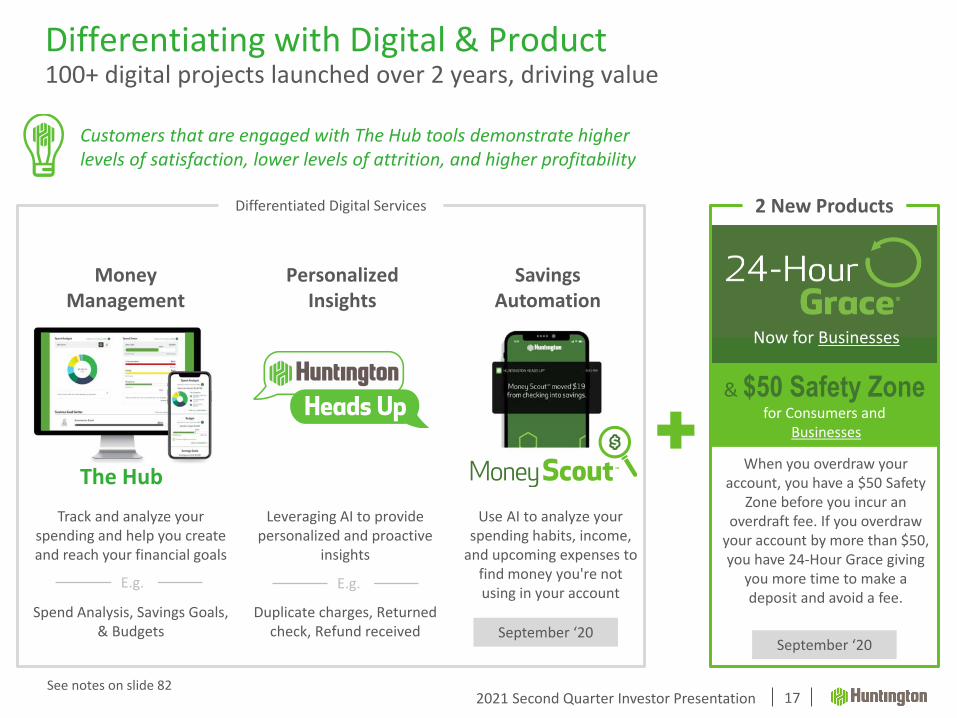
Differentiating with Digital & Product100+ digital projects launched over 2 years, driving value
17
Customers that are engaged with The Hub tools demonstrate higher levels of satisfaction, lower levels of attrition, and higher profitability
The Hub
SavingsAutomation
PersonalizedInsights
MoneyManagement
Differentiated Digital Services
Track and analyze your spending and help you create and reach your financial goals
Spend Analysis, Savings Goals, & Budgets
Leveraging AI to provide personalized and proactive
insights
Duplicate charges, Returned check, Refund received
Use AI to analyze your spending habits, income,
and upcoming expenses to find money you're not using in your account
E.g. E.g.
September ‘20
See notes on slide 82
When you overdraw your account, you have a $50 Safety
Zone before you incur an overdraft fee. If you overdraw
your account by more than $50, you have 24-Hour Grace giving
you more time to make a deposit and avoid a fee.
September ‘20
& $50 Safety Zone for Consumers and
Businesses
Now for Businesses
2 New Products
2021 Second Quarter Investor Presentation
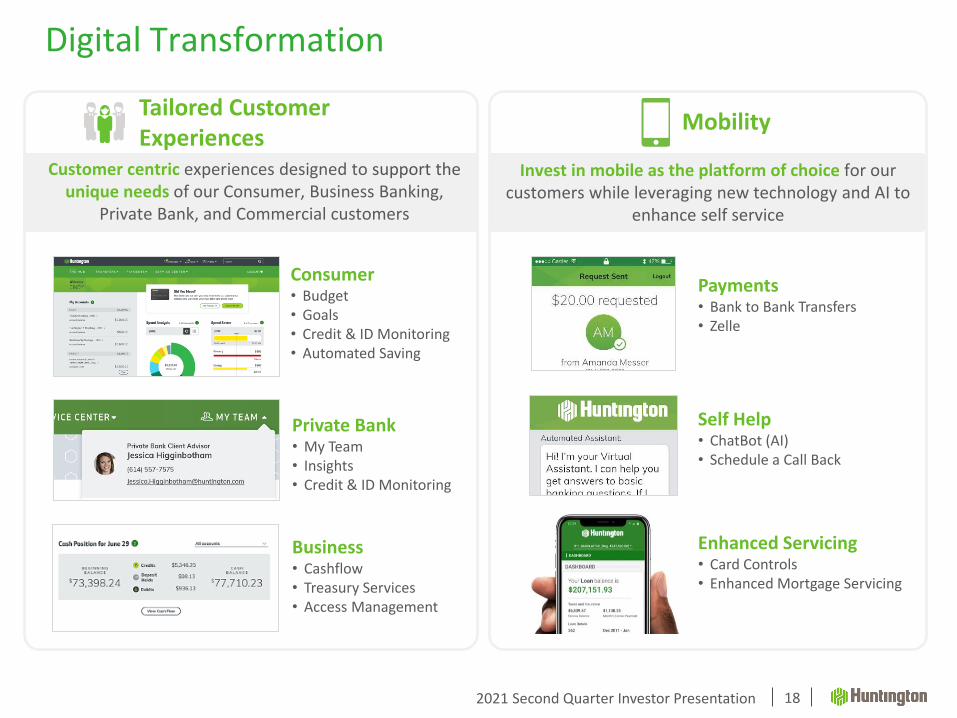
Digital Transformation
18
Tailored Customer Experiences
Customer centric experiences designed to support the unique needs of our Consumer, Business Banking,
Private Bank, and Commercial customers
Mobility
Invest in mobile as the platform of choice for our customers while leveraging new technology and AI to
enhance self service
Consumer• Budget• Goals• Credit & ID Monitoring• Automated Saving
Private Bank• My Team• Insights• Credit & ID Monitoring
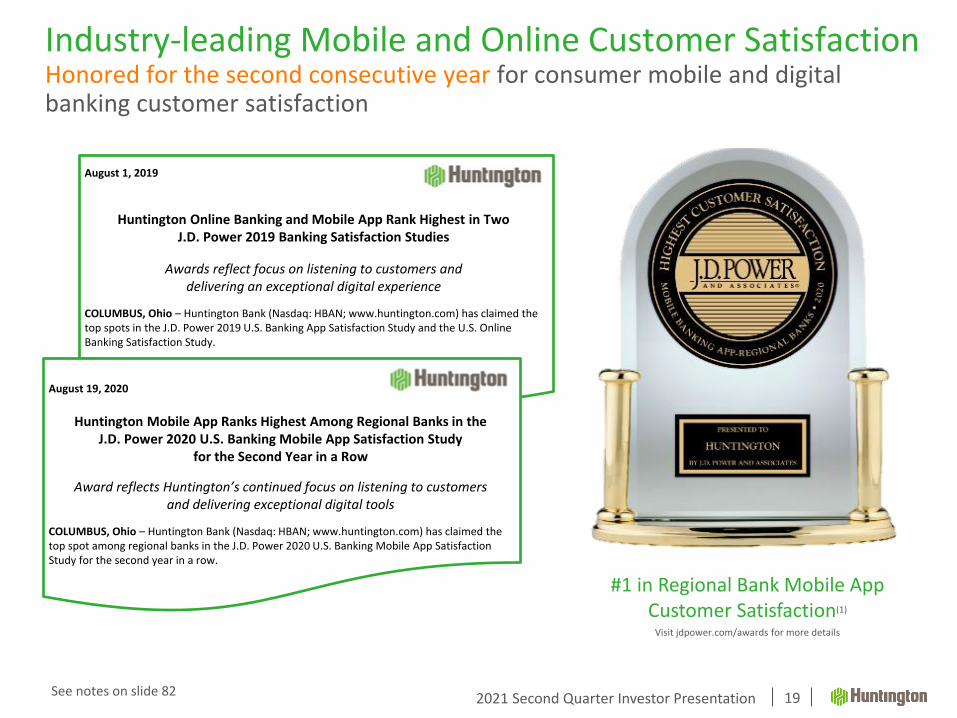
Industry-leading Mobile and Online Customer SatisfactionHonored for the second consecutive year for consumer mobile and digital banking customer satisfaction
19
#1 in Regional Bank Mobile App Customer Satisfaction(1)
Visit jdpower.com/awards for more details
See notes on slide 82
August 1, 2019
Huntington Online Banking and Mobile App Rank Highest in Two J.D. Power 2019 Banking Satisfaction Studies
Awards reflect focus on listening to customers and delivering an exceptional digital experience
COLUMBUS, Ohio – Huntington Bank (Nasdaq: HBAN; www.huntington.com) has claimed the top spots in the J.D. Power 2019 U.S. Banking App Satisfaction Study and the U.S. Online Banking Satisfaction Study.
August 19, 2020
Huntington Mobile App Ranks Highest Among Regional Banks in theJ.D. Power 2020 U.S. Banking Mobile App Satisfaction Study
for the Second Year in a Row
Award reflects Huntington’s continued focus on listening to customersand delivering exceptional digital tools
COLUMBUS, Ohio – Huntington Bank (Nasdaq: HBAN; www.huntington.com) has claimed the top spot among regional banks in the J.D. Power 2020 U.S. Banking Mobile App Satisfaction Study for the second year in a row.
2021 Second Quarter Investor Presentation
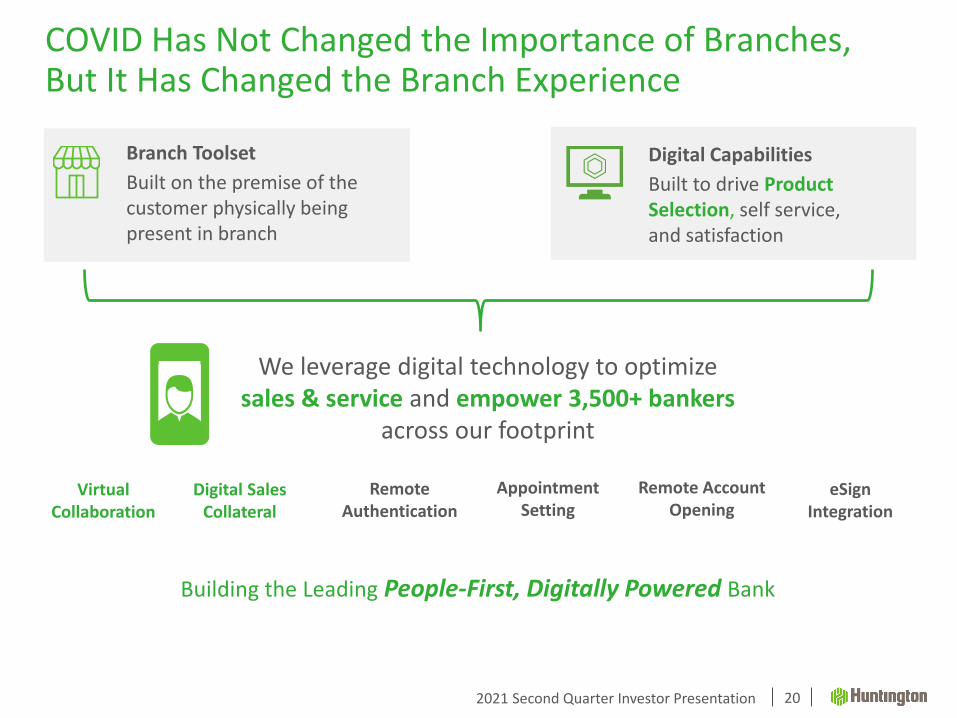
COVID Has Not Changed the Importance of Branches, But It Has Changed the Branch Experience
20
VirtualCollaboration
Remote Authentication
eSignIntegration
Appointment Setting
We leverage digital technology to optimize sales & service and empower 3,500+ bankers
across our footprint
Building the Leading People-First, Digitally Powered Bank
Remote Account Opening
Digital Sales Collateral
Branch Toolset
Built on the premise of the customer physically being present in branch
Digital Capabilities
Built to drive Product Selection, self service, and satisfaction
2021 Second Quarter Investor Presentation
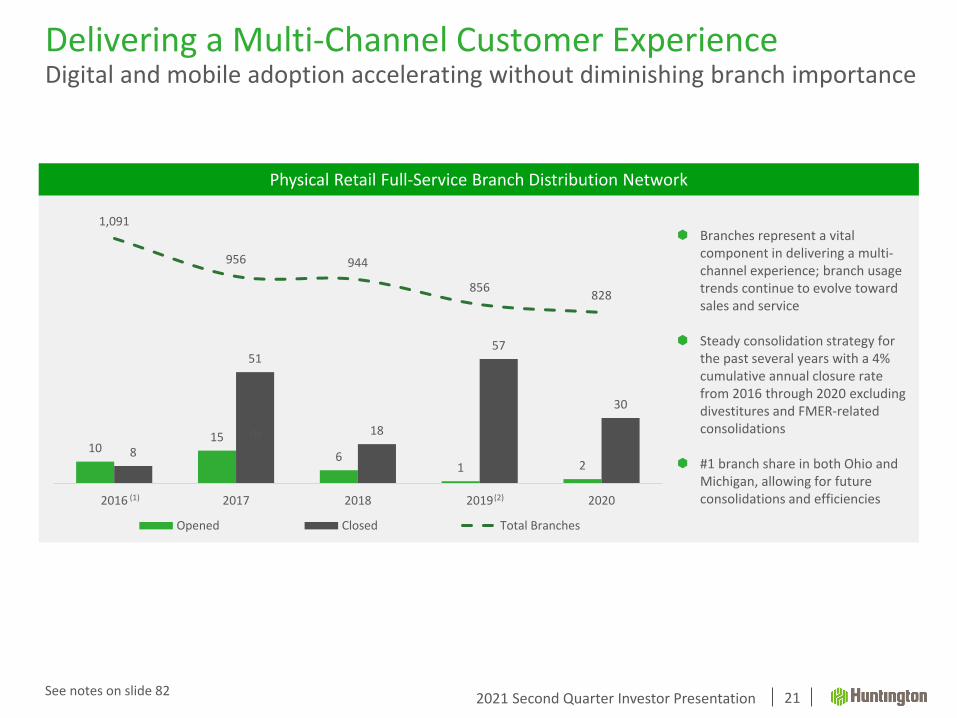
Branches represent a vital component in delivering a multi-channel experience; branch usage trends continue to evolve toward sales and service
Steady consolidation strategy for the past several years with a 4% cumulative annual closure rate from 2016 through 2020 excluding divestitures and FMER-related consolidations
#1 branch share in both Ohio and Michigan, allowing for future consolidations and efficiencies
1015
61 2
8
51
18
57
30
1,091
956 944
856828
2016 2017 2018 2019 2020
Opened Closed Total Branches
Delivering a Multi-Channel Customer ExperienceDigital and mobile adoption accelerating without diminishing branch importance
21
Physical Retail Full-Service Branch Distribution Network
(2)
See notes on slide 82
(1)
(1)
2021 Second Quarter Investor Presentation
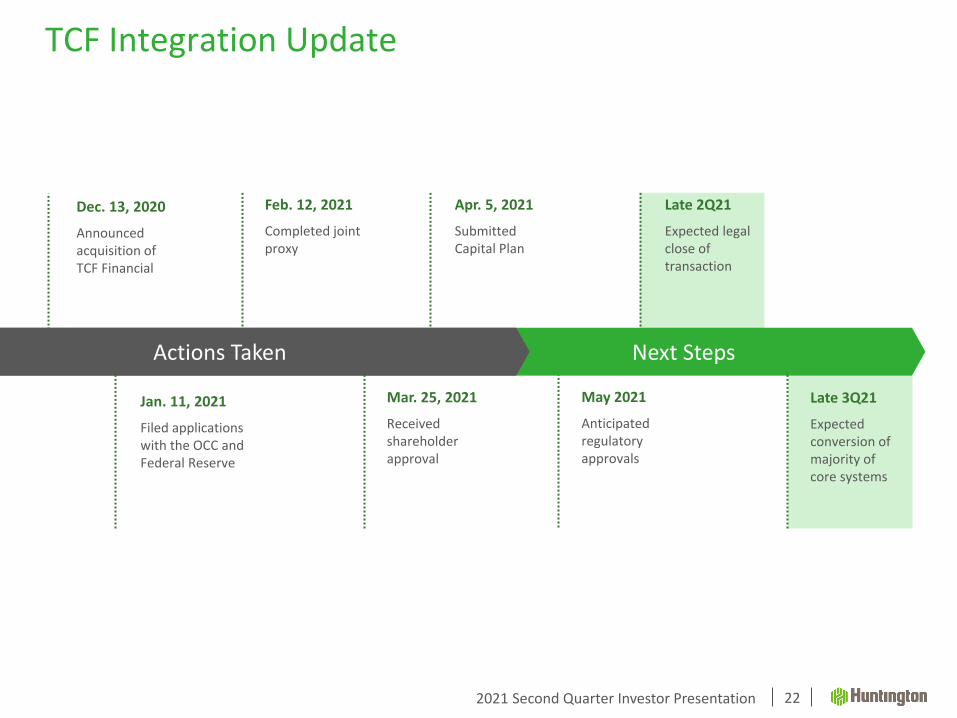
May 2021
Anticipated regulatory approvals
Late 2Q21
Expected legal close of transaction
Next Steps
TCF Integration Update
Feb. 12, 2021
Completed joint proxy
Apr. 5, 2021
Submitted Capital Plan
Jan. 11, 2021
Filed applications with the OCC and Federal Reserve
Mar. 25, 2021
Received shareholder approval
Dec. 13, 2020
Announced acquisition of TCF Financial
22
Late 3Q21
Expected conversion of majority of core systems
Actions Taken
Financial Update
2021 Second Quarter Investor Presentation
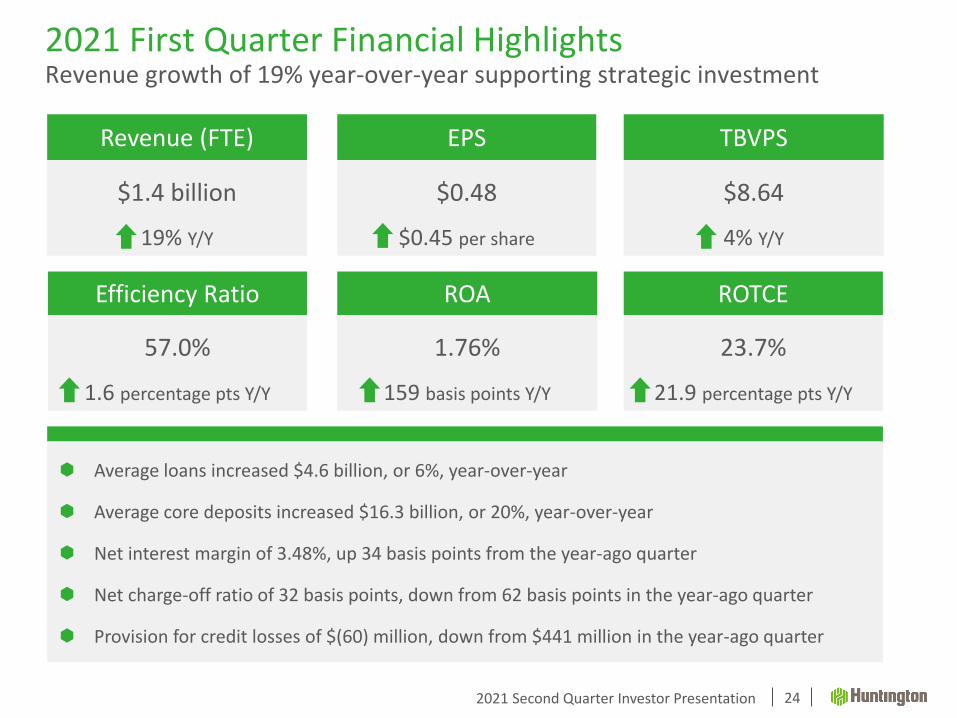
2021 First Quarter Financial HighlightsRevenue growth of 19% year-over-year supporting strategic investment
24
$1.4 billion
19% Y/Y
Revenue (FTE)
$0.48
$0.45 per share
EPS
$8.64
4% Y/Y
TBVPS
57.0%
1.6 percentage pts Y/Y
Efficiency Ratio
1.76%
159 basis points Y/Y
ROA
23.7%
21.9 percentage pts Y/Y
ROTCE
Average loans increased $4.6 billion, or 6%, year-over-year
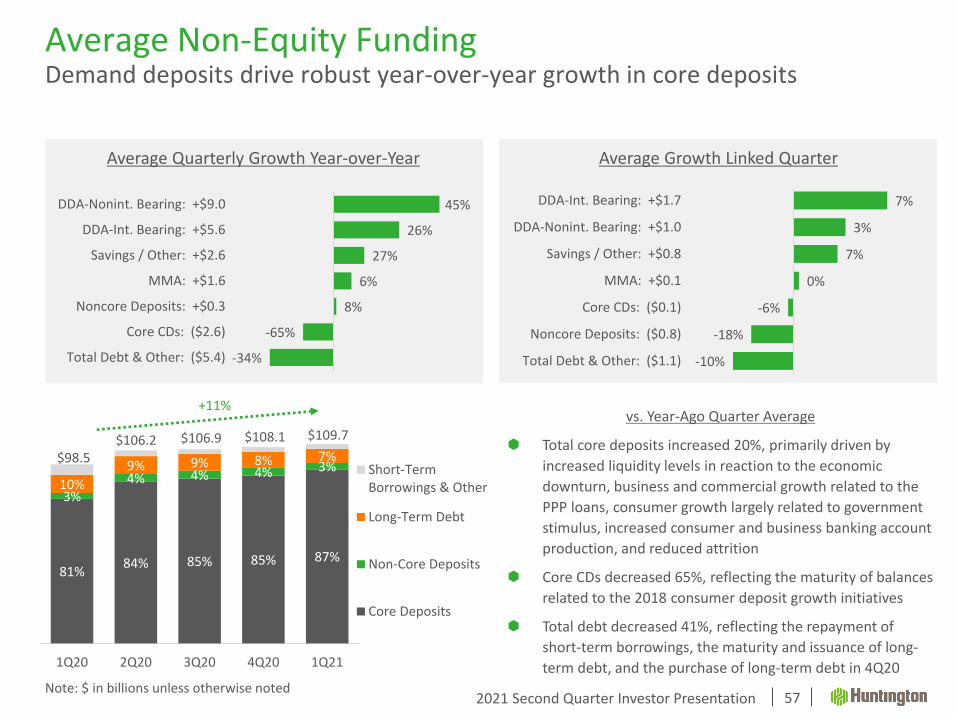
Average core deposits increased $16.3 billion, or 20%, year-over-year
Net interest margin of 3.48%, up 34 basis points from the year-ago quarter
Net charge-off ratio of 32 basis points, down from 62 basis points in the year-ago quarter
Provision for credit losses of $(60) million, down from $441 million in the year-ago quarter
2021 Second Quarter Investor Presentation
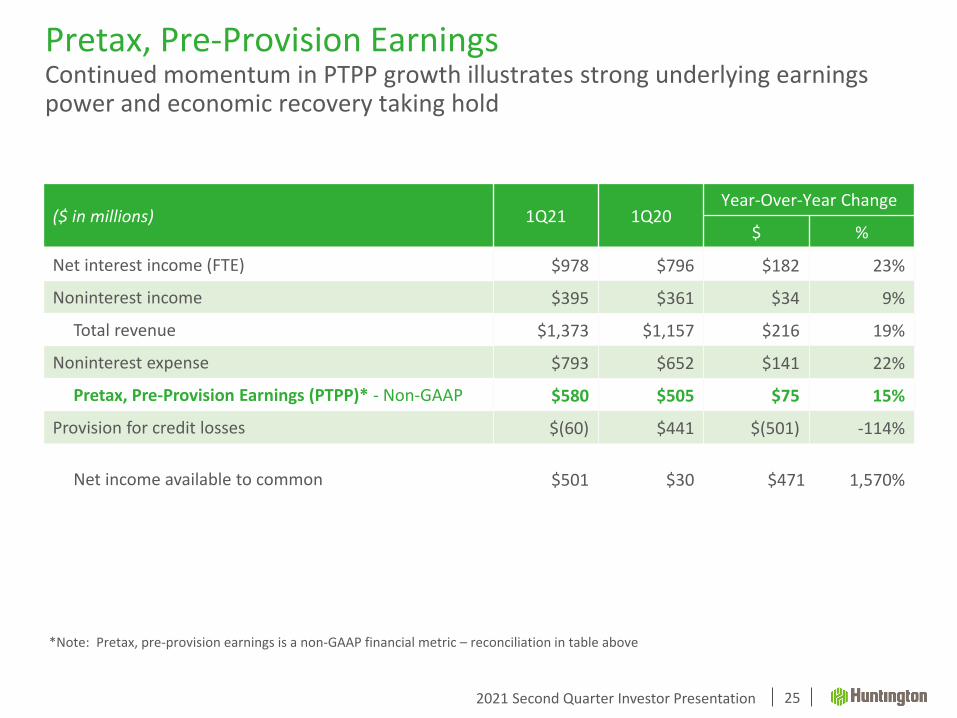
Pretax, Pre-Provision EarningsContinued momentum in PTPP growth illustrates strong underlying earnings power and economic recovery taking hold
25
*Note: Pretax, pre-provision earnings is a non-GAAP financial metric – reconciliation in table above
Provision for credit losses $(60) $441 $(501) -114%
Net income available to common $501 $30 $471 1,570%
2021 Second Quarter Investor Presentation
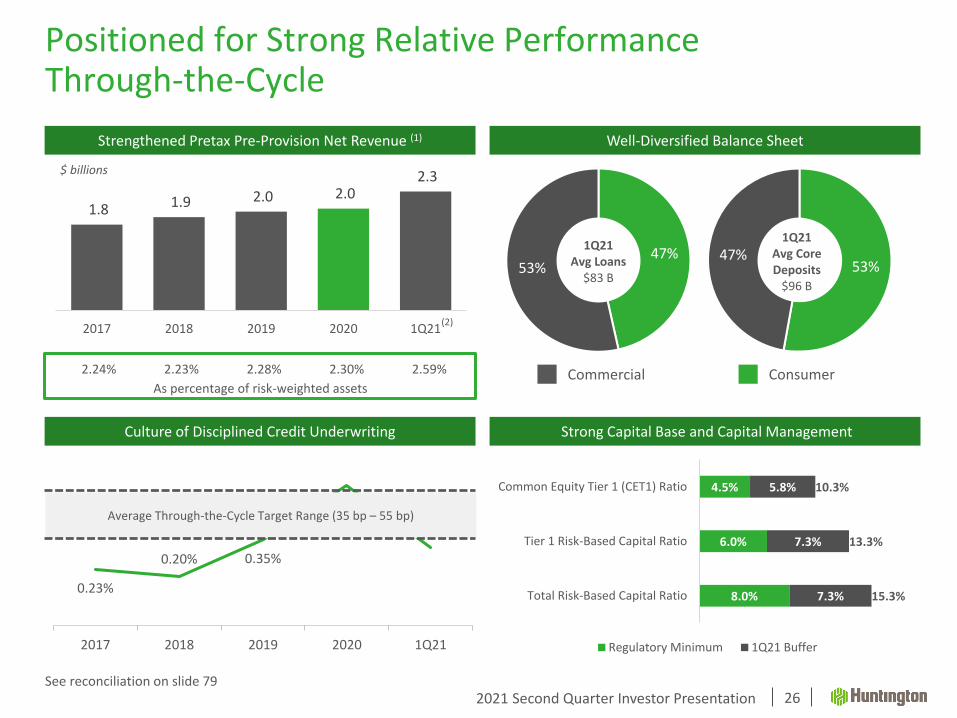
0.23%
0.20% 0.35%
0.57%
0.32%
2017 2018 2019 2020 1Q21
Average Through-the-Cycle Target Range (35 bp – 55 bp)
1.8 1.9 2.0 2.0 2.3
2017 2018 2019 2020 1Q21
2.28%
Positioned for Strong Relative Performance Through-the-Cycle
26
47%53%
1Q21Avg Loans
$83 B53%
47%1Q21
Avg Core Deposits
$96 B
Commercial Consumer
Well-Diversified Balance SheetStrengthened Pretax Pre-Provision Net Revenue (1)
Culture of Disciplined Credit Underwriting
$ billions
Strong Capital Base and Capital Management
As percentage of risk-weighted assets
2.24% 2.23% 2.30%
8.0%
6.0%
4.5%
7.3%
7.3%
5.8%
15.3%
13.3%
10.3%
Total Risk-Based Capital Ratio
Tier 1 Risk-Based Capital Ratio
Common Equity Tier 1 (CET1) Ratio
Regulatory Minimum 1Q21 Buffer
See reconciliation on slide 79
(2)
2.59%
2021 Second Quarter Investor Presentation
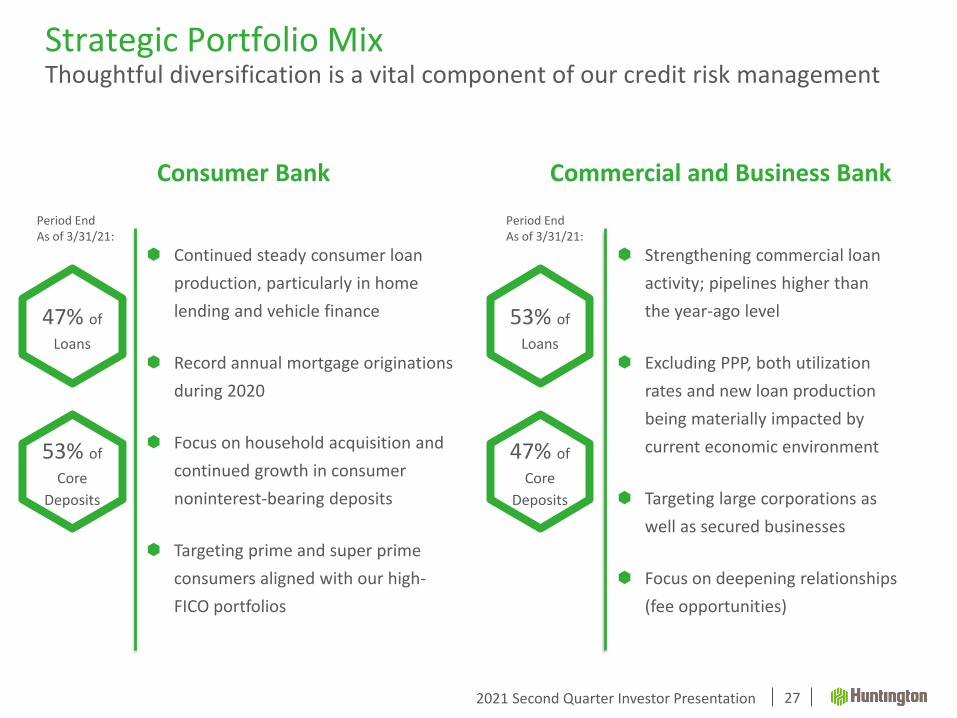
Continued steady consumer loan
production, particularly in home
lending and vehicle finance
Record annual mortgage originations
during 2020
Focus on household acquisition and
continued growth in consumer
noninterest-bearing deposits
Targeting prime and super prime
consumers aligned with our high-
FICO portfolios
53% of
Loans
Strategic Portfolio MixThoughtful diversification is a vital component of our credit risk management
27
Consumer Bank
Period EndAs of 3/31/21:
Commercial and Business Bank
Strengthening commercial loan
activity; pipelines higher than
the year-ago level
Excluding PPP, both utilization
rates and new loan production
being materially impacted by
current economic environment
Targeting large corporations as
well as secured businesses
Focus on deepening relationships
(fee opportunities)
Period EndAs of 3/31/21:
47% of
Loans
53% of
Core
Deposits
47% of
Core
Deposits
2021 Second Quarter Investor Presentation
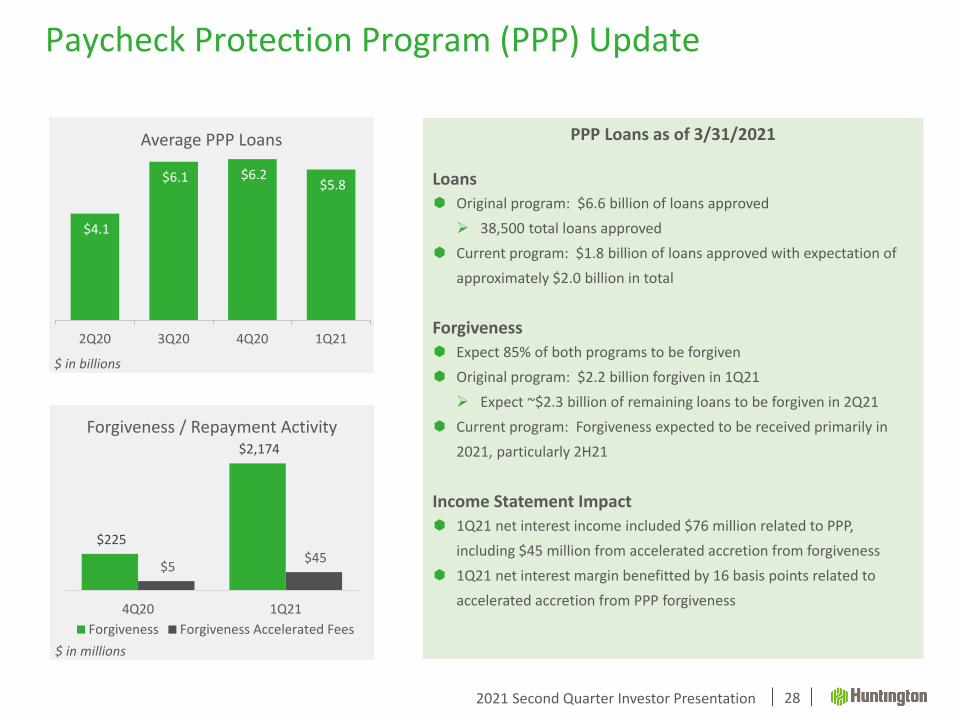
$225
$2,174
$5 $45
4Q20 1Q21
Forgiveness / Repayment Activity
Forgiveness Forgiveness Accelerated Fees
Paycheck Protection Program (PPP) Update
28
PPP Loans as of 3/31/2021
Loans
Original program: $6.6 billion of loans approved
➢ 38,500 total loans approved
Current program: $1.8 billion of loans approved with expectation of
approximately $2.0 billion in total
Forgiveness
Expect 85% of both programs to be forgiven
Original program: $2.2 billion forgiven in 1Q21
➢ Expect ~$2.3 billion of remaining loans to be forgiven in 2Q21
Current program: Forgiveness expected to be received primarily in
2021, particularly 2H21
Income Statement Impact
1Q21 net interest income included $76 million related to PPP,
including $45 million from accelerated accretion from forgiveness
1Q21 net interest margin benefitted by 16 basis points related to
accelerated accretion from PPP forgiveness
$4.1
$6.1 $6.2 $5.8
$0.00
$1.00
$2.00
$3.00
$4.00
$5.00
$6.00
$7.00
2Q20 3Q20 4Q20 1Q21
Average PPP Loans
$ in billions
$ in millions
Income Statement
2021 Second Quarter Investor Presentation
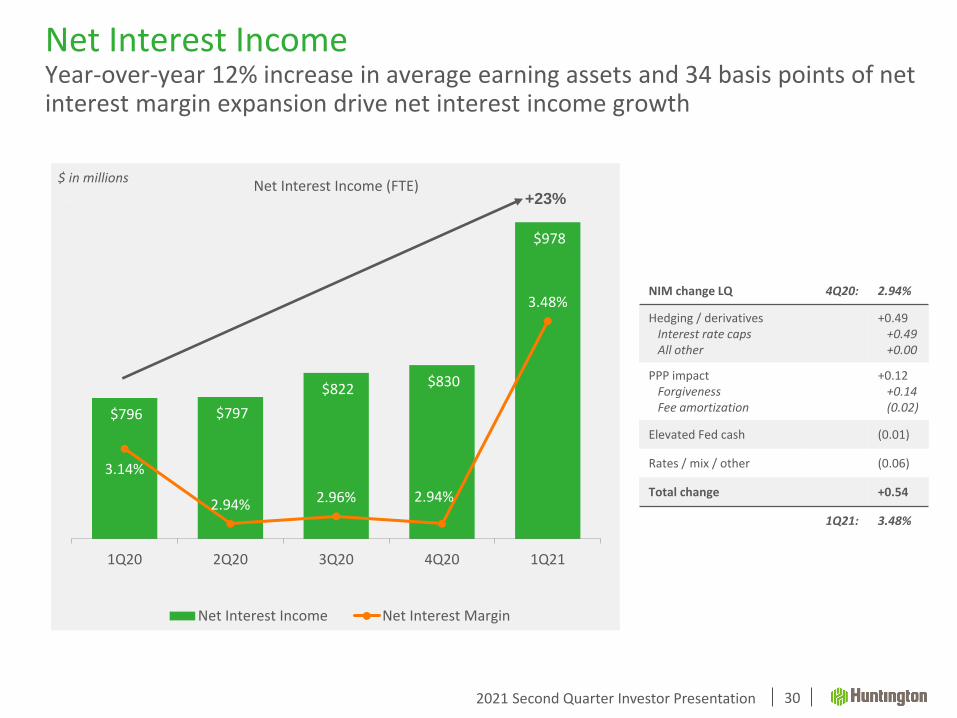
$796 $797
$822 $830
$978
3.14%
2.94% 2.96% 2.94%
3.48%
2.90%
3.00%
3.10%
3.20%
3.30%
3.40%
3.50%
3.60%
3.70%
3.80%
$650.00
$700.00
$750.00
$800.00
$850.00
$900.00
$950.00
$1,000.00
1Q20 2Q20 3Q20 4Q20 1Q21
Net Interest Income (FTE)
Net Interest Income Net Interest Margin
$ in millions
Net Interest IncomeYear-over-year 12% increase in average earning assets and 34 basis points of net interest margin expansion drive net interest income growth
30
+23%
NIM change LQ 4Q20: 2.94%
Hedging / derivativesInterest rate capsAll other
+0.49+0.49+0.00
PPP impactForgivenessFee amortization
+0.12+0.14(0.02)
Elevated Fed cash (0.01)
Rates / mix / other (0.06)
Total change +0.54
1Q21: 3.48%
2021 Second Quarter Investor Presentation
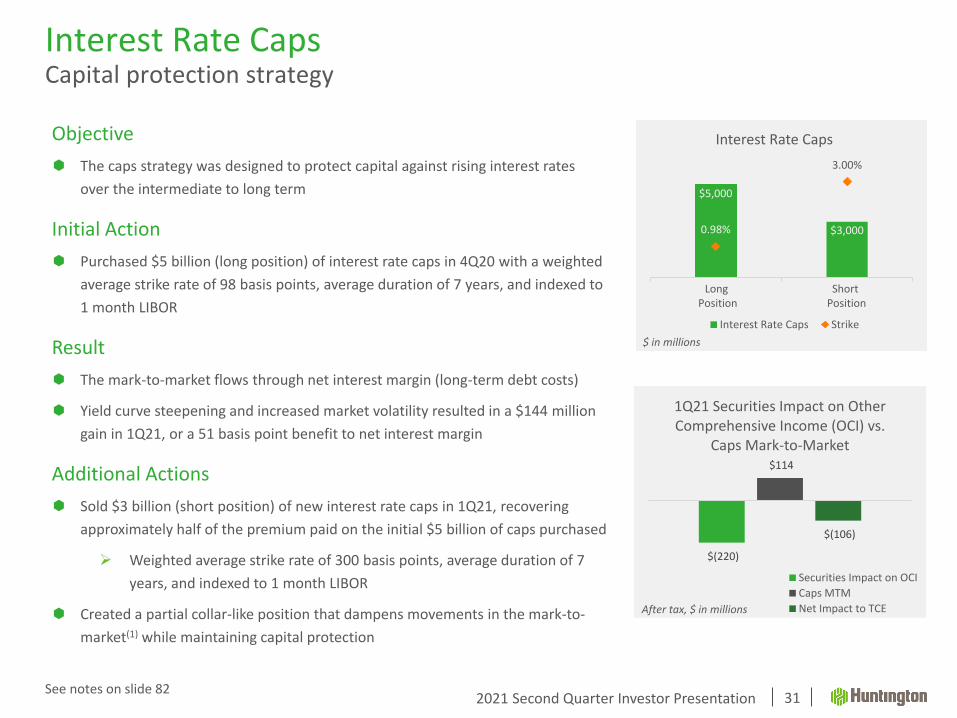
Objective
The caps strategy was designed to protect capital against rising interest rates
over the intermediate to long term
Initial Action
Purchased $5 billion (long position) of interest rate caps in 4Q20 with a weighted
average strike rate of 98 basis points, average duration of 7 years, and indexed to
1 month LIBOR
Result
The mark-to-market flows through net interest margin (long-term debt costs)
Yield curve steepening and increased market volatility resulted in a $144 million
gain in 1Q21, or a 51 basis point benefit to net interest margin
Additional Actions
Sold $3 billion (short position) of new interest rate caps in 1Q21, recovering
approximately half of the premium paid on the initial $5 billion of caps purchased
➢ Weighted average strike rate of 300 basis points, average duration of 7
years, and indexed to 1 month LIBOR
Created a partial collar-like position that dampens movements in the mark-to-
market(1) while maintaining capital protection
Interest Rate CapsCapital protection strategy
31
$5,000
$3,0000.98%
3.00%
Interest Rate Caps
Interest Rate Caps Strike
Long Position
Short Position
$ in millions
See notes on slide 82
$(220)
$114
$(106)
1Q21 Securities Impact on Other Comprehensive Income (OCI) vs.
Caps Mark-to-Market
Securities Impact on OCI
Caps MTM
Net Impact to TCEAfter tax, $ in millions
2021 Second Quarter Investor Presentation
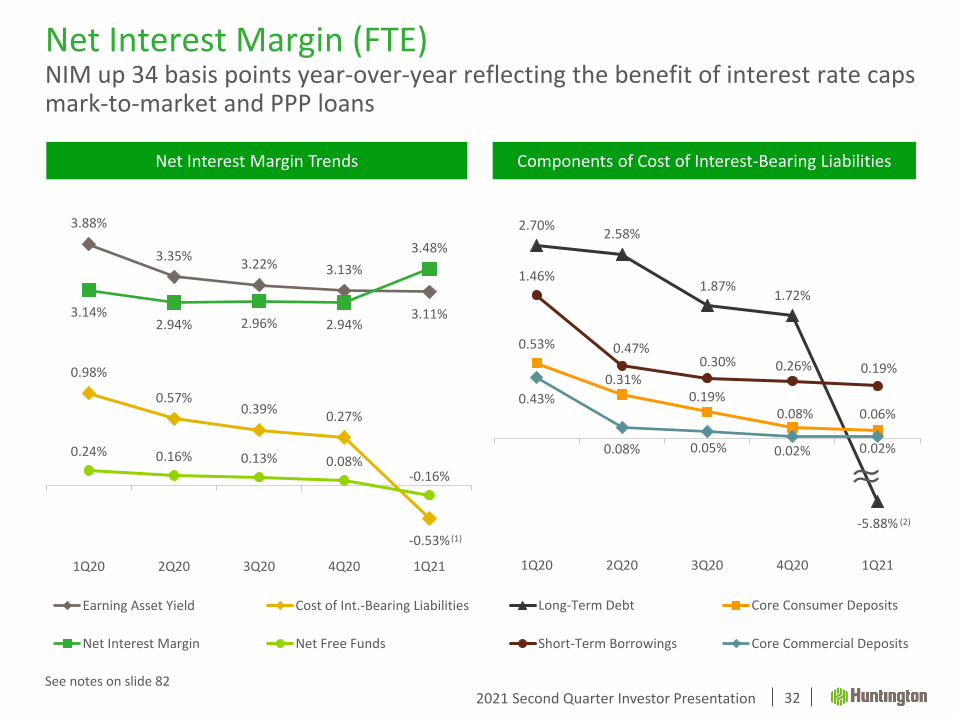
Net Interest Margin (FTE)NIM up 34 basis points year-over-year reflecting the benefit of interest rate caps mark-to-market and PPP loans
32
2.70%2.58%
1.87%1.72%
-5.88%
0.53%
0.31%0.19%
0.08% 0.06%
1.46%
0.47%0.30% 0.26% 0.19%
0.43%
0.08% 0.05% 0.02% 0.02%
1Q20 2Q20 3Q20 4Q20 1Q21
Long-Term Debt Core Consumer Deposits
Short-Term Borrowings Core Commercial Deposits
3.88%
3.35%3.22% 3.13%
3.11%
0.98%
0.57%0.39%
0.27%
-0.53%
3.14%2.94% 2.96% 2.94%
3.48%
0.24% 0.16% 0.13% 0.08%-0.16%
1Q20 2Q20 3Q20 4Q20 1Q21
Earning Asset Yield Cost of Int.-Bearing Liabilities
Net Interest Margin Net Free Funds
Net Interest Margin Trends Components of Cost of Interest-Bearing Liabilities
≈
(1)
(2)
See notes on slide 82
2021 Second Quarter Investor Presentation
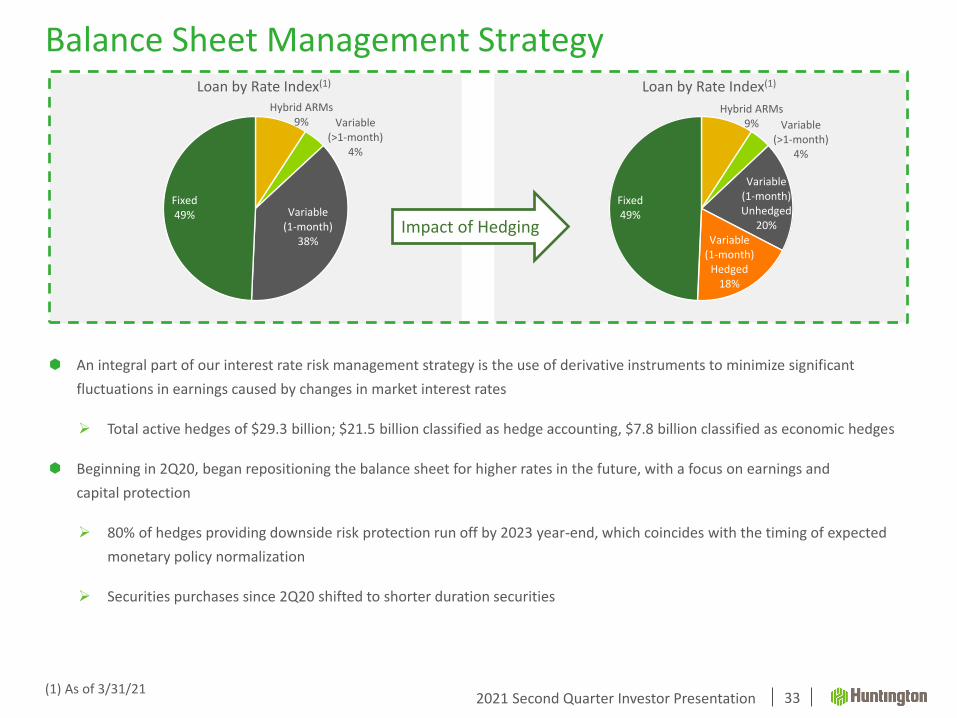
Hybrid ARMs9% Variable
(>1-month)4%
Variable (1-month) Unhedged
20%Variable
(1-month) Hedged
18%
Fixed49%
Loan by Rate Index(1)
Hybrid ARMs9% Variable
(>1-month)4%
Variable (1-month)
38%
Fixed49%
Loan by Rate Index(1)
Balance Sheet Management Strategy
33
Impact of Hedging
(1) As of 3/31/21
An integral part of our interest rate risk management strategy is the use of derivative instruments to minimize significant
fluctuations in earnings caused by changes in market interest rates
➢ Total active hedges of $29.3 billion; $21.5 billion classified as hedge accounting, $7.8 billion classified as economic hedges
Beginning in 2Q20, began repositioning the balance sheet for higher rates in the future, with a focus on earnings and
capital protection
➢ 80% of hedges providing downside risk protection run off by 2023 year-end, which coincides with the timing of expected
monetary policy normalization
➢ Securities purchases since 2Q20 shifted to shorter duration securities
2021 Second Quarter Investor Presentation
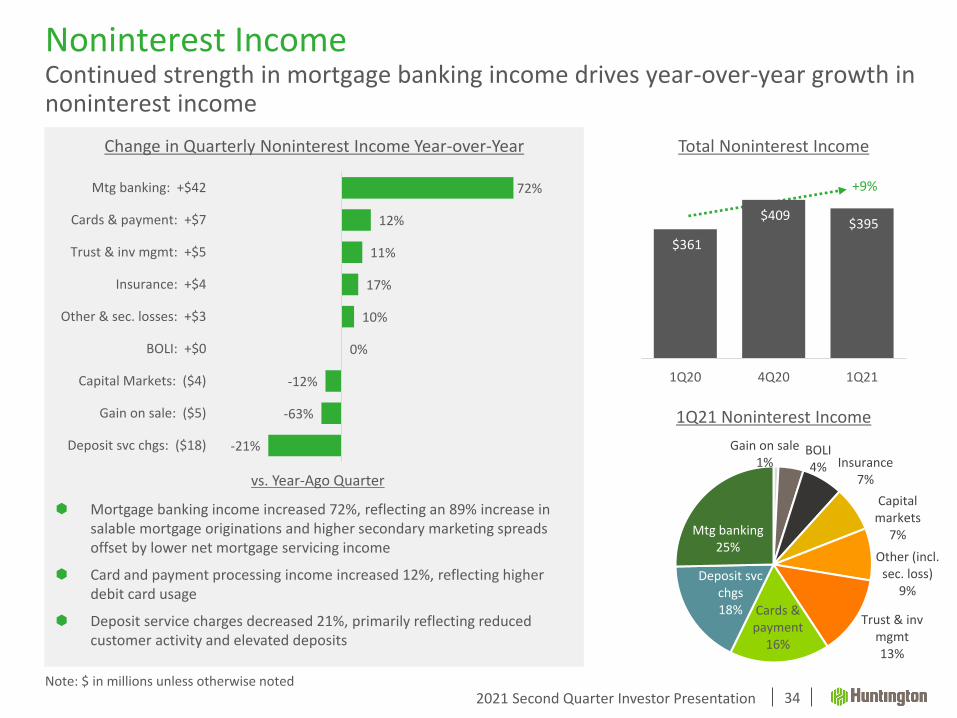
$361
$409 $395
1Q20 4Q20 1Q21
Gain on sale1%
BOLI4% Insurance
7%
Capital markets
7%
Other (incl. sec. loss)
9%
Trust & inv mgmt13%
Cards & payment
16%
Deposit svc chgs18%
Mtg banking25%
Noninterest IncomeContinued strength in mortgage banking income drives year-over-year growth in noninterest income
34
Total Noninterest IncomeChange in Quarterly Noninterest Income Year-over-Year
1Q21 Noninterest Income
vs. Year-Ago Quarter
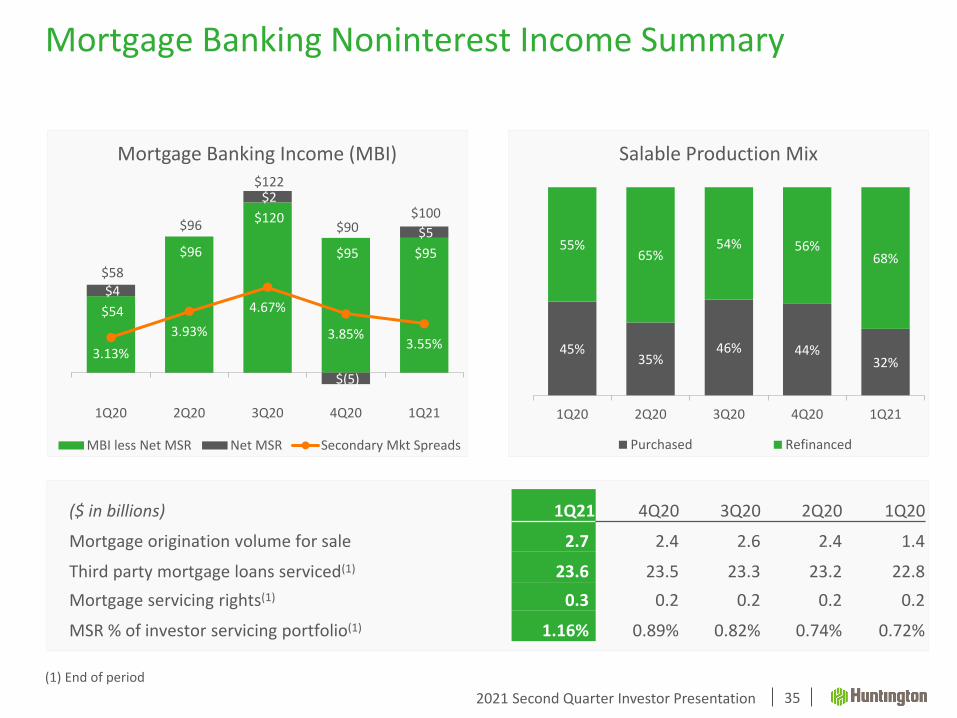
Mortgage banking income increased 72%, reflecting an 89% increase in salable mortgage originations and higher secondary marketing spreads offset by lower net mortgage servicing income
Card and payment processing income increased 12%, reflecting higher debit card usage
Deposit service charges decreased 21%, primarily reflecting reduced customer activity and elevated deposits
72%
12%
11%
17%
10%
0%
-12%
-63%
-21%
Mtg banking: +$42
Cards & payment: +$7
Trust & inv mgmt: +$5
Insurance: +$4
Other & sec. losses: +$3
BOLI: +$0
Capital Markets: ($4)
Gain on sale: ($5)
Deposit svc chgs: ($18)
+9%
Note: $ in millions unless otherwise noted
2021 Second Quarter Investor Presentation
Mortgage Banking Noninterest Income Summary
35
$54
$96
$120
$95 $95
$4
$2
$(5)
$5
$58
$96
$122
$90 $100
3.13%
3.93%
4.67%
3.85%3.55%
$(15)
$5
$25
$45
$65
$85
$105
$125
$145
1Q20 2Q20 3Q20 4Q20 1Q21
Mortgage Banking Income (MBI)
MBI less Net MSR Net MSR Secondary Mkt Spreads
($ in billions) 1Q21 4Q20 3Q20 2Q20 1Q20
Mortgage origination volume for sale 2.7) 2.4 2.6 2.4 1.4
Third party mortgage loans serviced(1) 23.6) 23.5 23.3 23.2 22.8
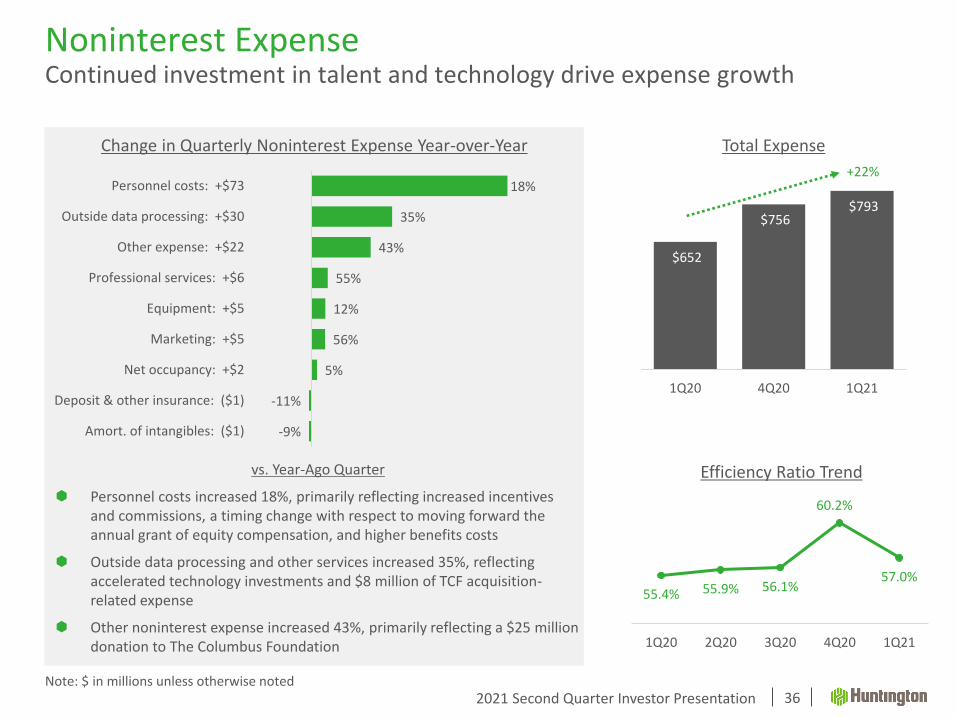
Noninterest ExpenseContinued investment in talent and technology drive expense growth
36
Change in Quarterly Noninterest Expense Year-over-Year
+22%
vs. Year-Ago Quarter
Personnel costs increased 18%, primarily reflecting increased incentives and commissions, a timing change with respect to moving forward the annual grant of equity compensation, and higher benefits costs
Outside data processing and other services increased 35%, reflecting accelerated technology investments and $8 million of TCF acquisition-related expense
Other noninterest expense increased 43%, primarily reflecting a $25 million donation to The Columbus Foundation
55.4% 55.9% 56.1%
60.2%
57.0%
1Q20 2Q20 3Q20 4Q20 1Q21
Efficiency Ratio Trend
18%
35%
43%
55%
12%
56%
5%
-11%
-9%
Personnel costs: +$73
Outside data processing: +$30
Other expense: +$22
Professional services: +$6
Equipment: +$5
Marketing: +$5
Net occupancy: +$2
Deposit & other insurance: ($1)
Amort. of intangibles: ($1)
Note: $ in millions unless otherwise noted
Balance Sheet
2021 Second Quarter Investor Presentation
9%
9%
0%
0%
0%
-6%
-1%
-1%
-1%
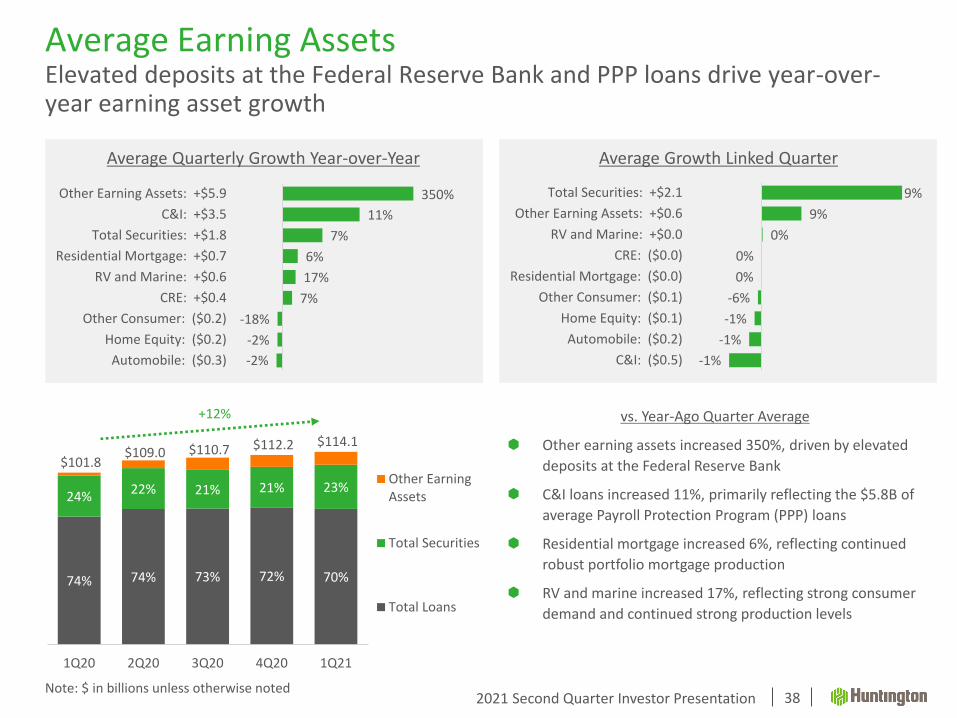
Total Securities: +$2.1
Other Earning Assets: +$0.6
RV and Marine: +$0.0
CRE: ($0.0)
Residential Mortgage: ($0.0)
Other Consumer: ($0.1)
Home Equity: ($0.1)
Automobile: ($0.2)
C&I: ($0.5)
Average Growth Linked Quarter
Average Earning AssetsElevated deposits at the Federal Reserve Bank and PPP loans drive year-over-year earning asset growth
38
350%
11%
7%
6%
17%
7%
-18%
-2%
-2%
Other Earning Assets: +$5.9
C&I: +$3.5
Total Securities: +$1.8
Residential Mortgage: +$0.7
RV and Marine: +$0.6
CRE: +$0.4
Other Consumer: ($0.2)
Home Equity: ($0.2)
Automobile: ($0.3)
74% 74% 73% 72% 70%
24%22% 21% 21% 23%
$101.8 $109.0 $110.7 $112.2 $114.1
1Q20 2Q20 3Q20 4Q20 1Q21
Other EarningAssets
Total Securities
Total Loans
vs. Year-Ago Quarter Average
Other earning assets increased 350%, driven by elevated
deposits at the Federal Reserve Bank
C&I loans increased 11%, primarily reflecting the $5.8B of
average Payroll Protection Program (PPP) loans
Residential mortgage increased 6%, reflecting continued
robust portfolio mortgage production
RV and marine increased 17%, reflecting strong consumer
demand and continued strong production levels
+12%
Note: $ in billions unless otherwise noted
Average Quarterly Growth Year-over-Year
2021 Second Quarter Investor Presentation
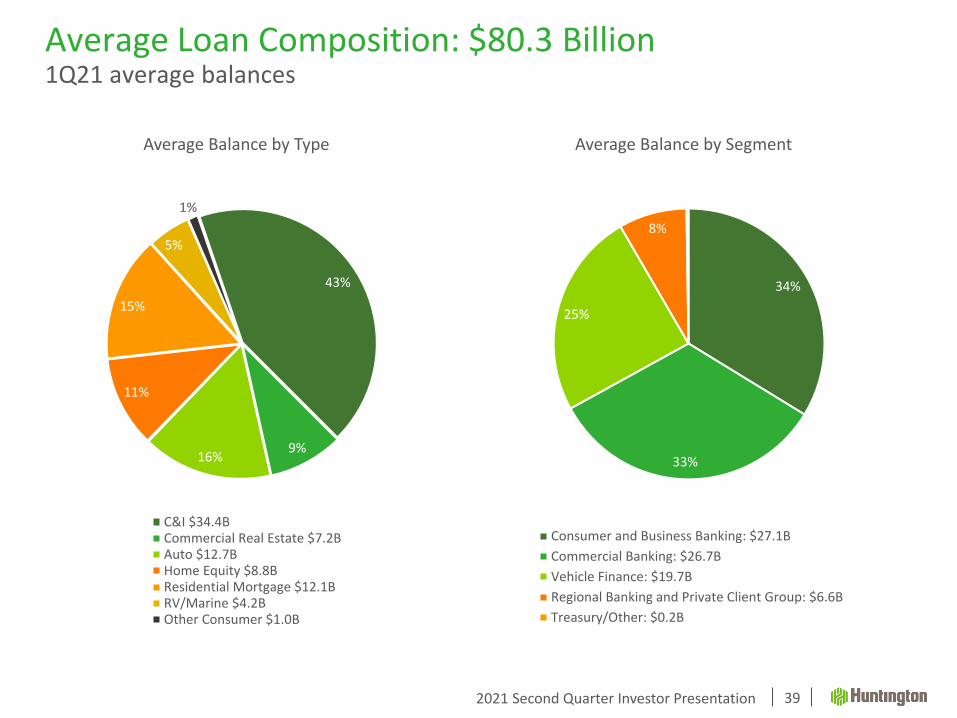
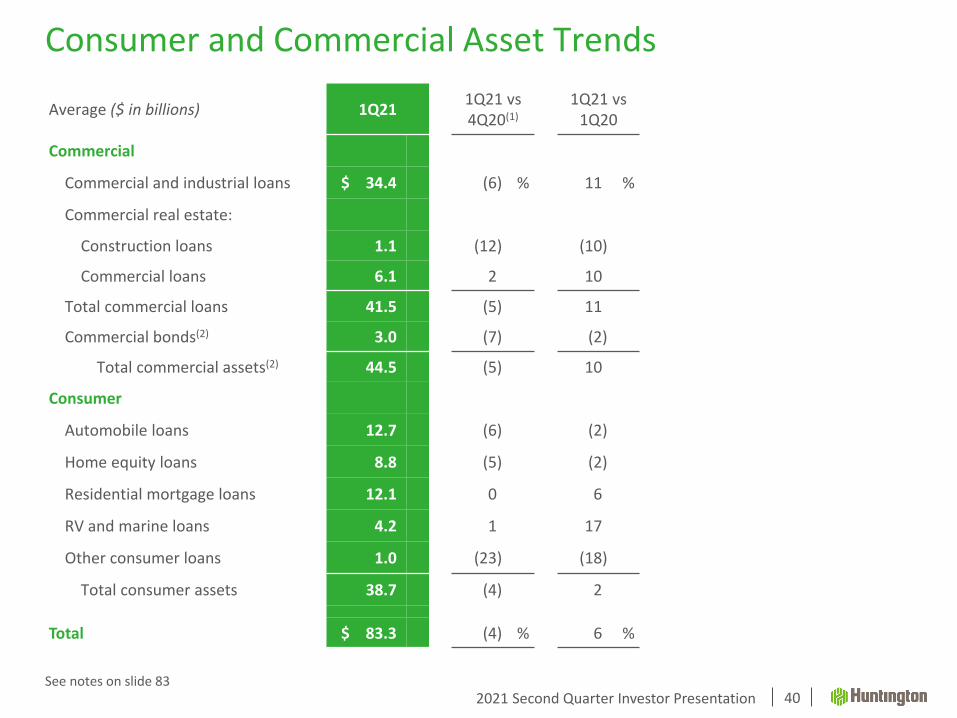
Average Loan Composition: $80.3 Billion1Q21 average balances
Commercial and industrial loans $ 34.4 (6) % 11) %
Commercial real estate:
Construction loans 1.1 (12) (10)
Commercial loans 6.1 2) 10)
Total commercial loans 41.5 (5) 11)
Commercial bonds(2) 3.0 (7) (2)
Total commercial assets(2) 44.5 (5) 10)
Consumer
Automobile loans 12.7 (6) (2)
Home equity loans 8.8 (5) (2)
Residential mortgage loans 12.1 0) 6)
RV and marine loans 4.2 1) 17)
Other consumer loans 1.0 (23) (18)
Total consumer assets 38.7 (4) 2)
Total $ 83.3 (4) % 6) %
See notes on slide 83
2021 Second Quarter Investor Presentation
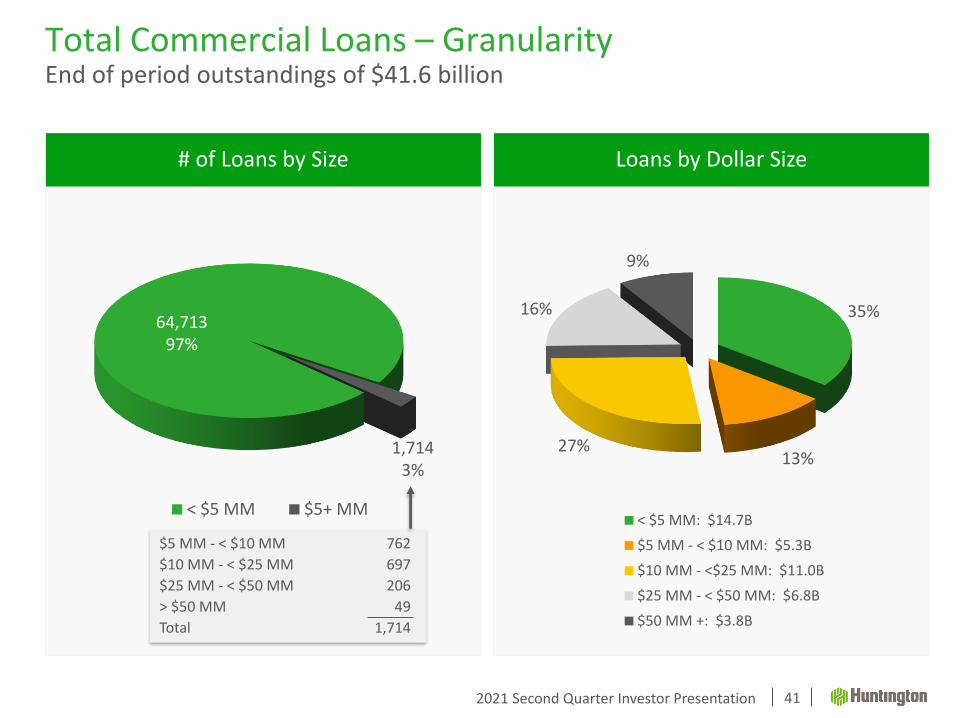
35%
13%27%
16%
9%
< $5 MM: $14.7B
$5 MM - < $10 MM: $5.3B
$10 MM - <$25 MM: $11.0B
$25 MM - < $50 MM: $6.8B
$50 MM +: $3.8B
< $5 MM $5+ MM
1,7143%
64,71397%
$5 MM - < $10 MM 762
$10 MM - < $25 MM 697
$25 MM - < $50 MM 206
> $50 MM 49
Total 1,714
Total Commercial Loans – GranularityEnd of period outstandings of $41.6 billion
41
Loans by Dollar Size# of Loans by Size
2021 Second Quarter Investor Presentation
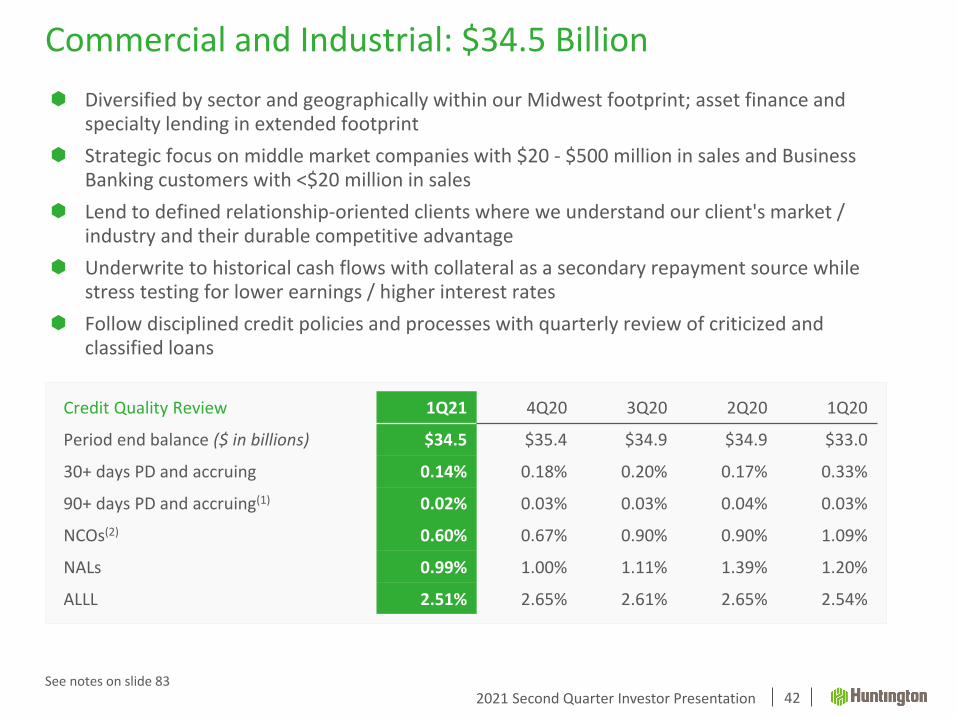
Commercial and Industrial: $34.5 Billion
42
Diversified by sector and geographically within our Midwest footprint; asset finance and specialty lending in extended footprint
Strategic focus on middle market companies with $20 - $500 million in sales and Business Banking customers with <$20 million in sales
Lend to defined relationship-oriented clients where we understand our client's market / industry and their durable competitive advantage
Underwrite to historical cash flows with collateral as a secondary repayment source while stress testing for lower earnings / higher interest rates
Follow disciplined credit policies and processes with quarterly review of criticized and classified loans
Credit Quality Review 1Q21 4Q20 3Q20 2Q20 1Q20
Period end balance ($ in billions) $34.5 $35.4 $34.9 $34.9 $33.0
30+ days PD and accruing 0.14% 0.18% 0.20% 0.17% 0.33%
90+ days PD and accruing(1) 0.02% 0.03% 0.03% 0.04% 0.03%
NCOs(2) 0.60% 0.67% 0.90% 0.90% 1.09%
NALs 0.99% 1.00% 1.11% 1.39% 1.20%
ALLL 2.51% 2.65% 2.61% 2.65% 2.54%
See notes on slide 83
2021 Second Quarter Investor Presentation
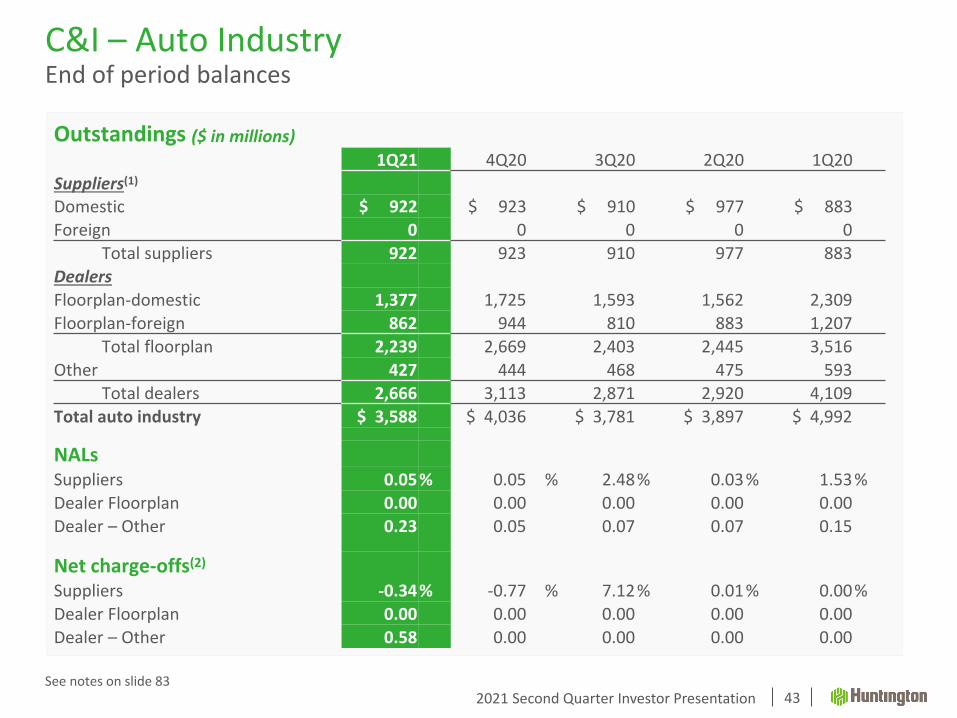
Outstandings ($ in millions)
1Q21 4Q20 3Q20 2Q20 1Q20
Suppliers(1)
Domestic $ 922 $ 923 $ 910 $ 977 $ 883
Foreign 0 0 0 0 0
Total suppliers 922 923 910 977 883
Dealers
Floorplan-domestic 1,377 1,725 1,593 1,562 2,309
Floorplan-foreign 862 944 810 883 1,207
Total floorplan 2,239 2,669 2,403 2,445 3,516
Other 427 444 468 475 593
Total dealers 2,666 3,113 2,871 2,920 4,109
Total auto industry $ 3,588 $ 4,036 $ 3,781 $ 3,897 $ 4,992
NALsSuppliers 0.05% 0.05 % 2.48% 0.03% 1.53%
Dealer Floorplan 0.00 0.00 0.00 0.00 0.00
Dealer – Other 0.23 0.05 0.07 0.07 0.15
Net charge-offs(2)
Suppliers -0.34% -0.77 % 7.12% 0.01% 0.00%
Dealer Floorplan 0.00 0.00 0.00 0.00 0.00
Dealer – Other 0.58 0.00 0.00 0.00 0.00
C&I – Auto IndustryEnd of period balances
43See notes on slide 83
2021 Second Quarter Investor Presentation
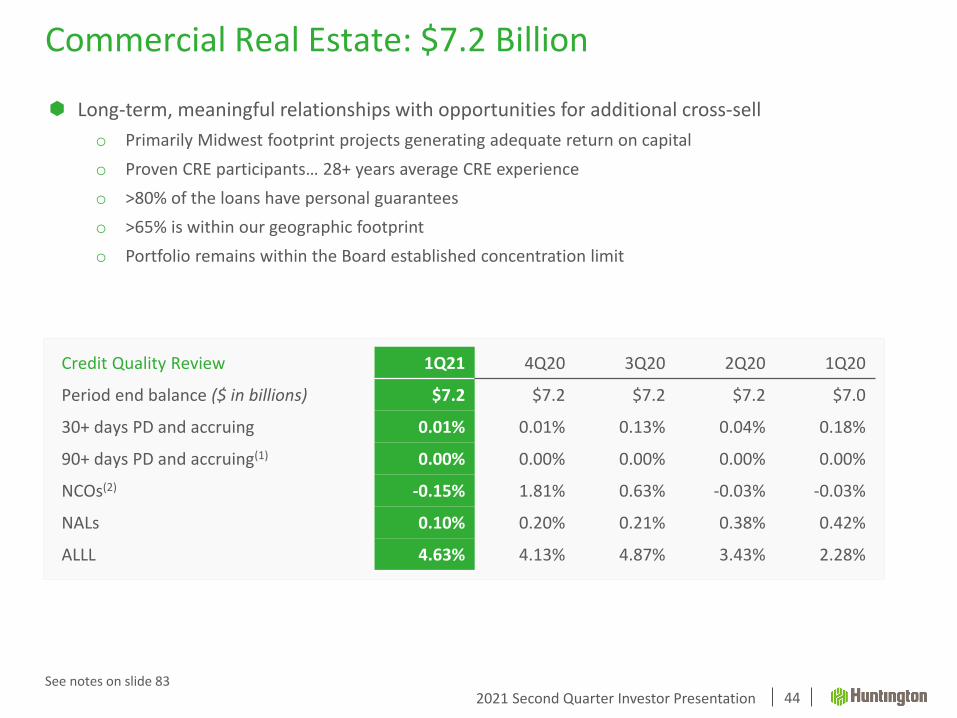
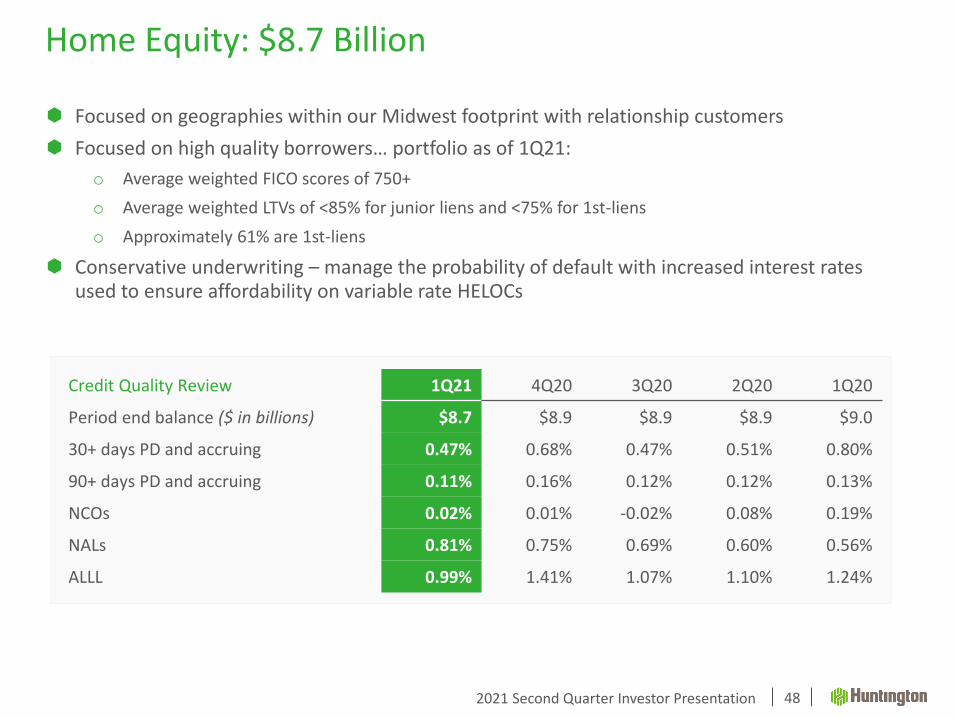
Long-term, meaningful relationships with opportunities for additional cross-sell
o Primarily Midwest footprint projects generating adequate return on capital
o Proven CRE participants… 28+ years average CRE experience
o >80% of the loans have personal guarantees
o >65% is within our geographic footprint
o Portfolio remains within the Board established concentration limit
Commercial Real Estate: $7.2 Billion
44
Credit Quality Review 1Q21 4Q20 3Q20 2Q20 1Q20
Period end balance ($ in billions) $7.2 $7.2 $7.2 $7.2 $7.0
30+ days PD and accruing 0.01% 0.01% 0.13% 0.04% 0.18%
90+ days PD and accruing(1) 0.00% 0.00% 0.00% 0.00% 0.00%
NCOs(2) -0.15% 1.81% 0.63% -0.03% -0.03%
NALs 0.10% 0.20% 0.21% 0.38% 0.42%
ALLL 4.63% 4.13% 4.87% 3.43% 2.28%
See notes on slide 83
2021 Second Quarter Investor Presentation
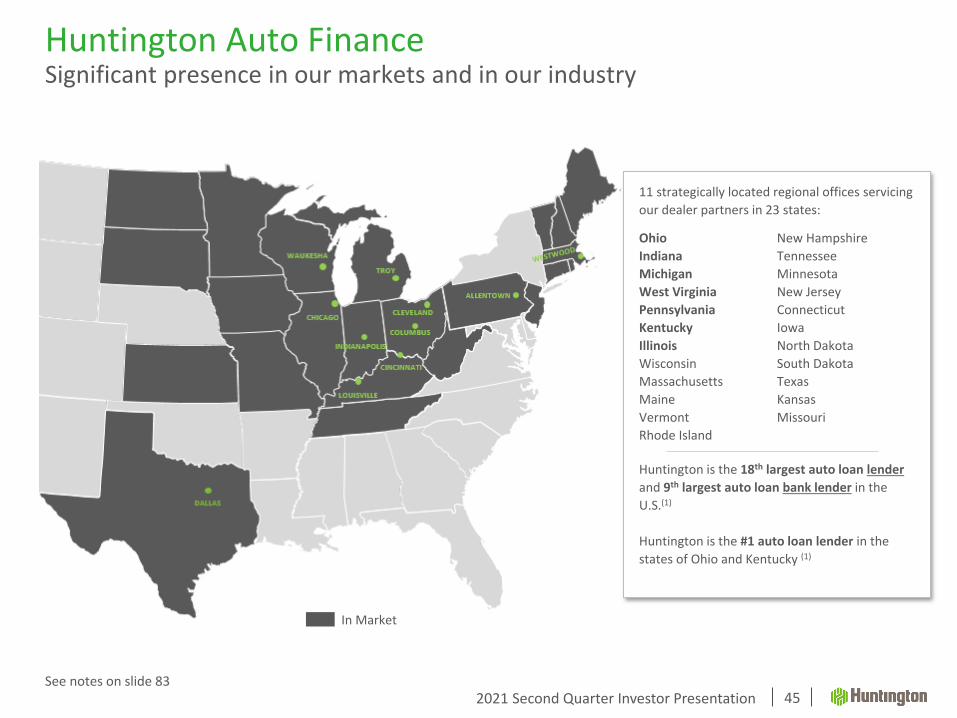
Huntington Auto FinanceSignificant presence in our markets and in our industry
45
11 strategically located regional offices servicing
our dealer partners in 23 states:
Ohio New Hampshire
Indiana Tennessee
Michigan Minnesota
West Virginia New Jersey
Pennsylvania Connecticut
Kentucky Iowa
Illinois North Dakota
Wisconsin South Dakota
Massachusetts Texas
Maine Kansas
Vermont Missouri
Rhode Island
Huntington is the 18th largest auto loan lender
and 9th largest auto loan bank lender in the
U.S.(1)
Huntington is the #1 auto loan lender in the
states of Ohio and Kentucky (1)
In Market
See notes on slide 83
2021 Second Quarter Investor Presentation
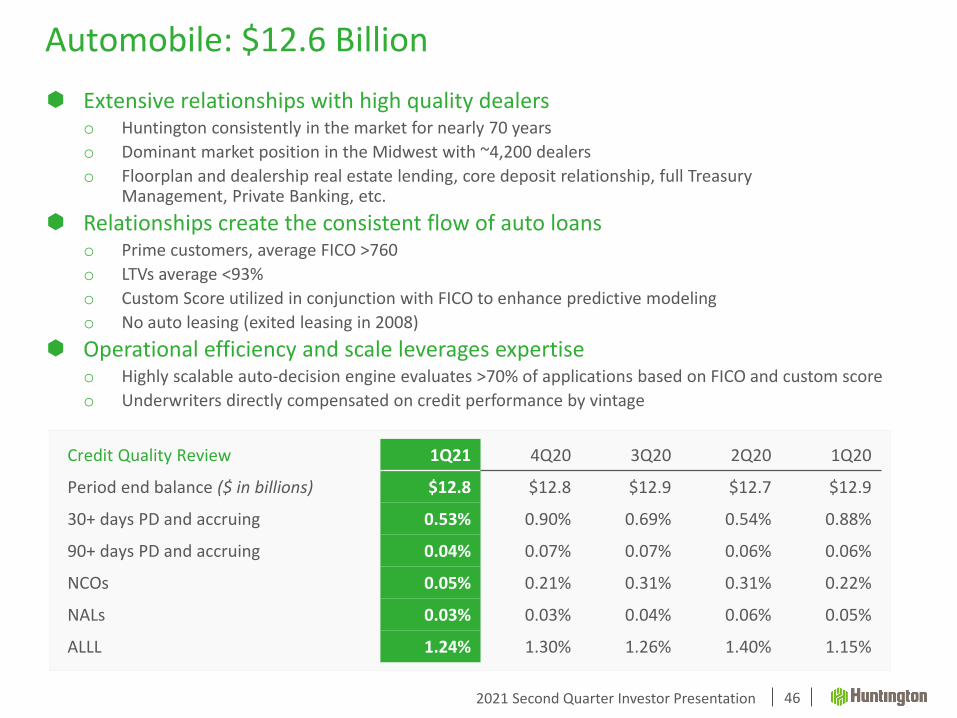
Automobile: $12.6 Billion
46
Extensive relationships with high quality dealerso Huntington consistently in the market for nearly 70 years
o Dominant market position in the Midwest with ~4,200 dealers
o Floorplan and dealership real estate lending, core deposit relationship, full Treasury Management, Private Banking, etc.
Relationships create the consistent flow of auto loanso Prime customers, average FICO >760
o LTVs average <93%
o Custom Score utilized in conjunction with FICO to enhance predictive modeling
o No auto leasing (exited leasing in 2008)
Operational efficiency and scale leverages expertiseo Highly scalable auto-decision engine evaluates >70% of applications based on FICO and custom score
o Underwriters directly compensated on credit performance by vintage
Credit Quality Review 1Q21 4Q20 3Q20 2Q20 1Q20
Period end balance ($ in billions) $12.8 $12.8 $12.9 $12.7 $12.9
30+ days PD and accruing 0.53% 0.90% 0.69% 0.54% 0.88%
90+ days PD and accruing 0.04% 0.07% 0.07% 0.06% 0.06%
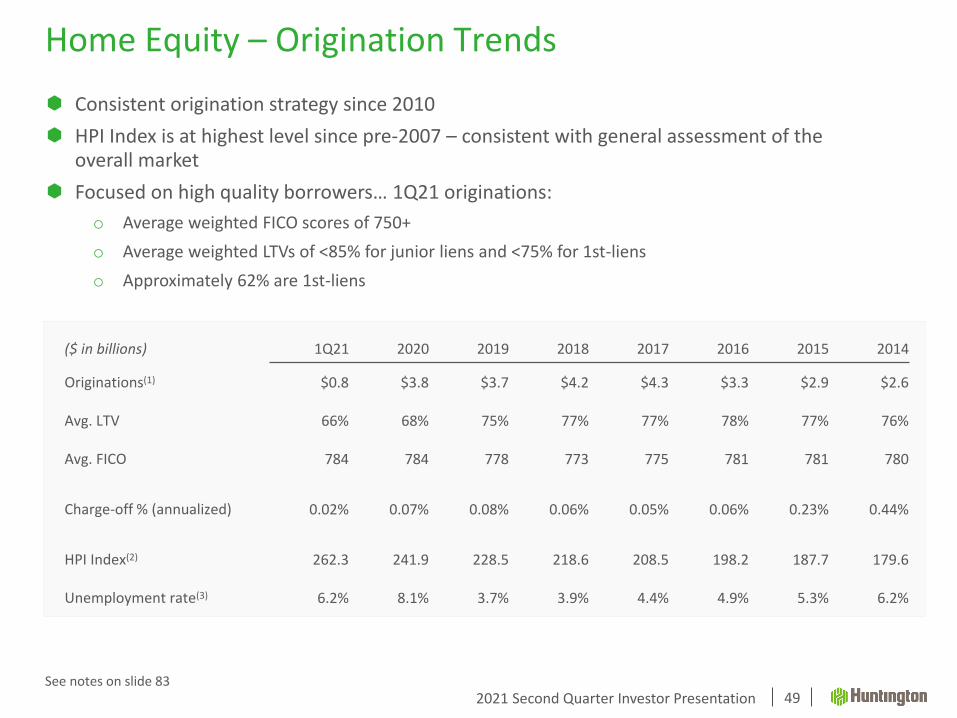
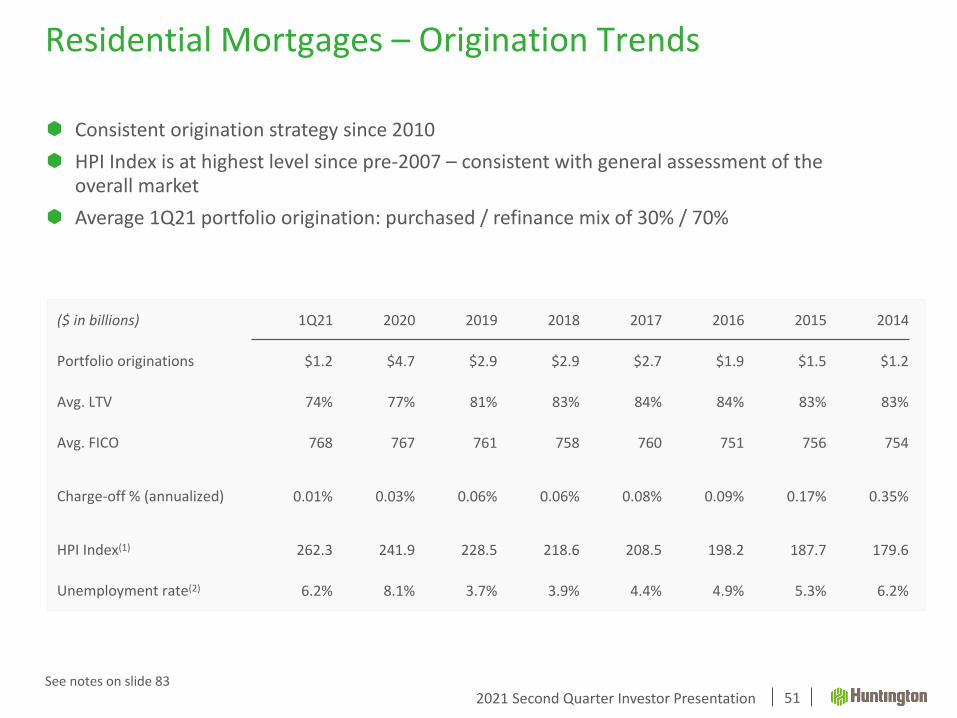
HPI Index is at highest level since pre-2007 – consistent with general assessment of the overall market
Average 1Q21 portfolio origination: purchased / refinance mix of 30% / 70%
See notes on slide 8351
2021 Second Quarter Investor Presentation
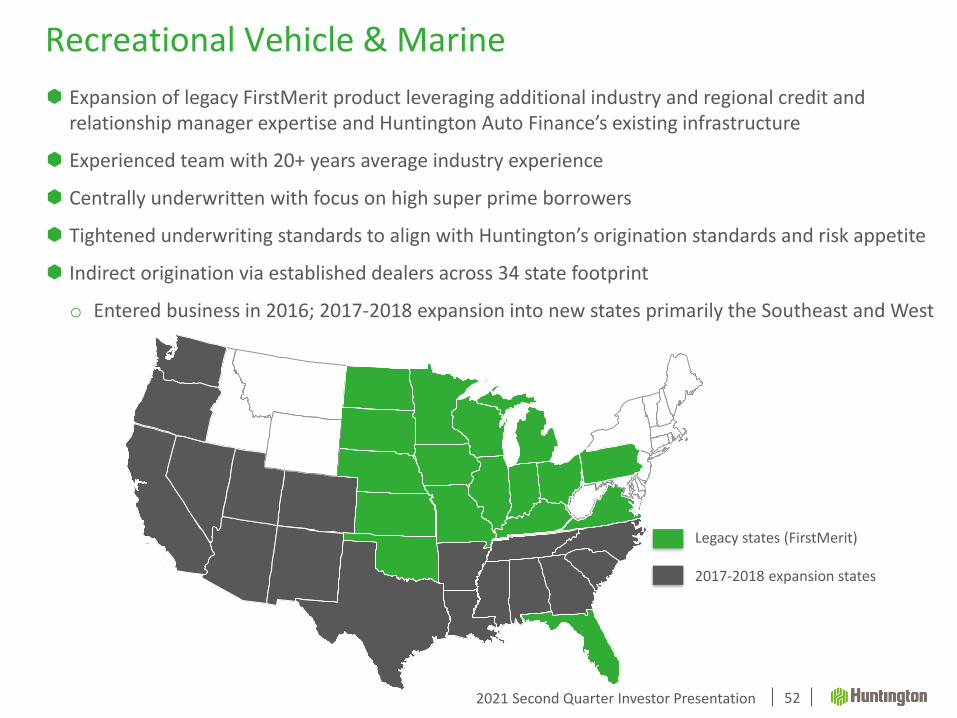
Expansion of legacy FirstMerit product leveraging additional industry and regional credit and relationship manager expertise and Huntington Auto Finance’s existing infrastructure
Experienced team with 20+ years average industry experience
Centrally underwritten with focus on high super prime borrowers
Tightened underwriting standards to align with Huntington’s origination standards and risk appetite
Indirect origination via established dealers across 34 state footprint
o Entered business in 2016; 2017-2018 expansion into new states primarily the Southeast and West
Recreational Vehicle & Marine
52
Legacy states (FirstMerit)
2017-2018 expansion states
2021 Second Quarter Investor Presentation
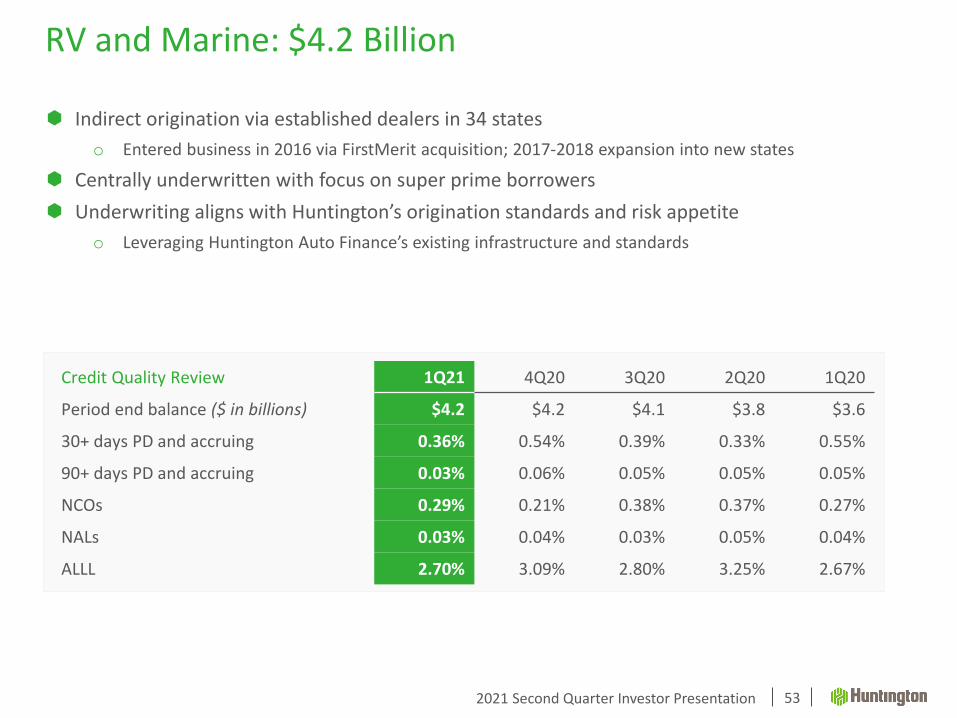
Credit Quality Review 1Q21 4Q20 3Q20 2Q20 1Q20
Period end balance ($ in billions) $4.2 $4.2 $4.1 $3.8 $3.6
30+ days PD and accruing 0.36% 0.54% 0.39% 0.33% 0.55%
90+ days PD and accruing 0.03% 0.06% 0.05% 0.05% 0.05%
NCOs 0.29% 0.21% 0.38% 0.37% 0.27%
NALs 0.03% 0.04% 0.03% 0.05% 0.04%
ALLL 2.70% 3.09% 2.80% 3.25% 2.67%
RV and Marine: $4.2 Billion
53
Indirect origination via established dealers in 34 states
o Entered business in 2016 via FirstMerit acquisition; 2017-2018 expansion into new states
Centrally underwritten with focus on super prime borrowers
Underwriting aligns with Huntington’s origination standards and risk appetite
o Leveraging Huntington Auto Finance’s existing infrastructure and standards
2021 Second Quarter Investor Presentation
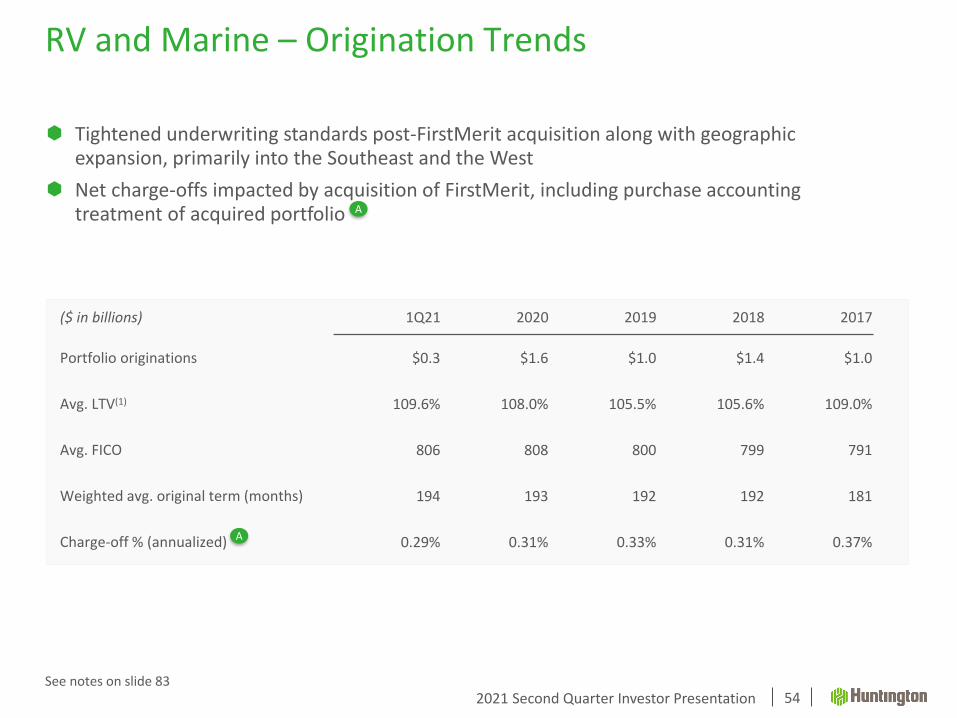
Tightened underwriting standards post-FirstMerit acquisition along with geographic expansion, primarily into the Southeast and the West
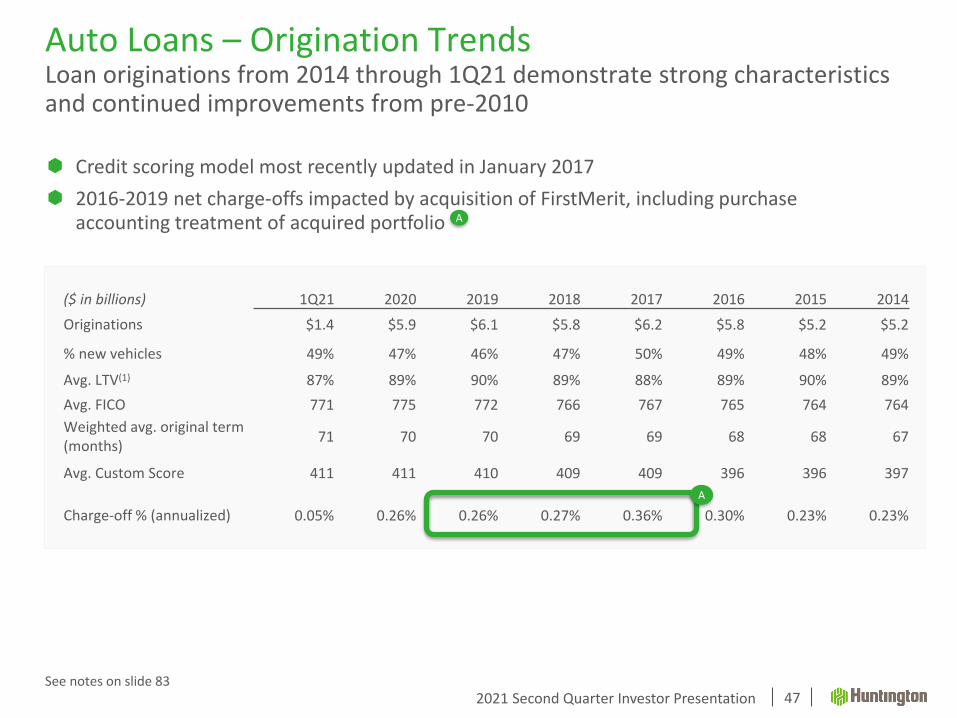
Net charge-offs impacted by acquisition of FirstMerit, including purchase accounting treatment of acquired portfolio
($ in billions) 1Q21 2020 2019 2018 2017
Portfolio originations $0.3 $1.6 $1.0 $1.4 $1.0
Avg. LTV(1) 109.6% 108.0% 105.5% 105.6% 109.0%
Avg. FICO 806 808 800 799 791
Weighted avg. original term (months) 194 193 192 192 181
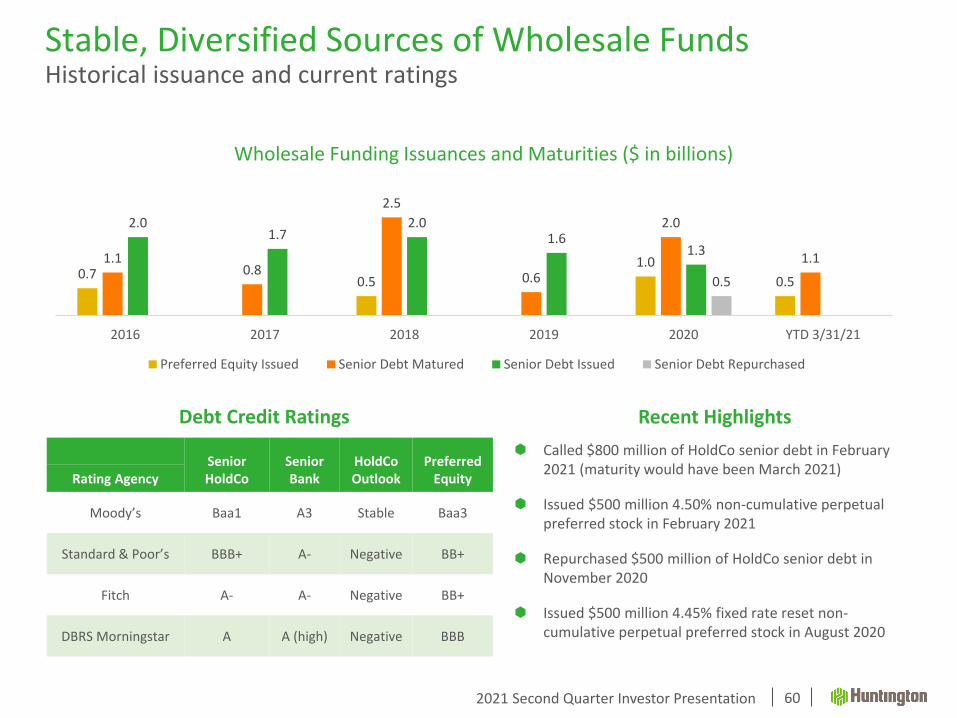
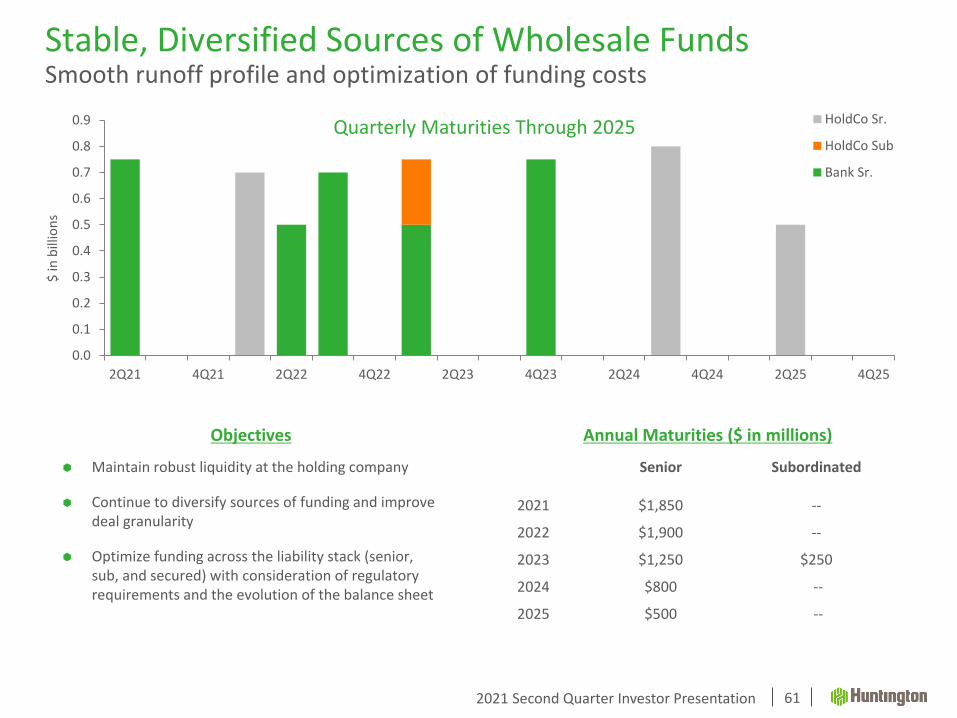
Continue to diversify sources of funding and improve deal granularity
Optimize funding across the liability stack (senior, sub, and secured) with consideration of regulatory requirements and the evolution of the balance sheet
0.0
0.1
0.2
0.3
0.4
0.5
0.6
0.7
0.8
0.9
2Q21 4Q21 2Q22 4Q22 2Q23 4Q23 2Q24 4Q24 2Q25 4Q25
Quarterly Maturities Through 2025 HoldCo Sr.
HoldCo Sub
Bank Sr.
$ in
bill
ion
sStable, Diversified Sources of Wholesale FundsSmooth runoff profile and optimization of funding costs
61
Senior Subordinated
2021 $1,850 --
2022 $1,900 --
2023 $1,250 $250
2024 $800 --
2025 $500 --
Annual Maturities ($ in millions)
Capital
2021 Second Quarter Investor Presentation
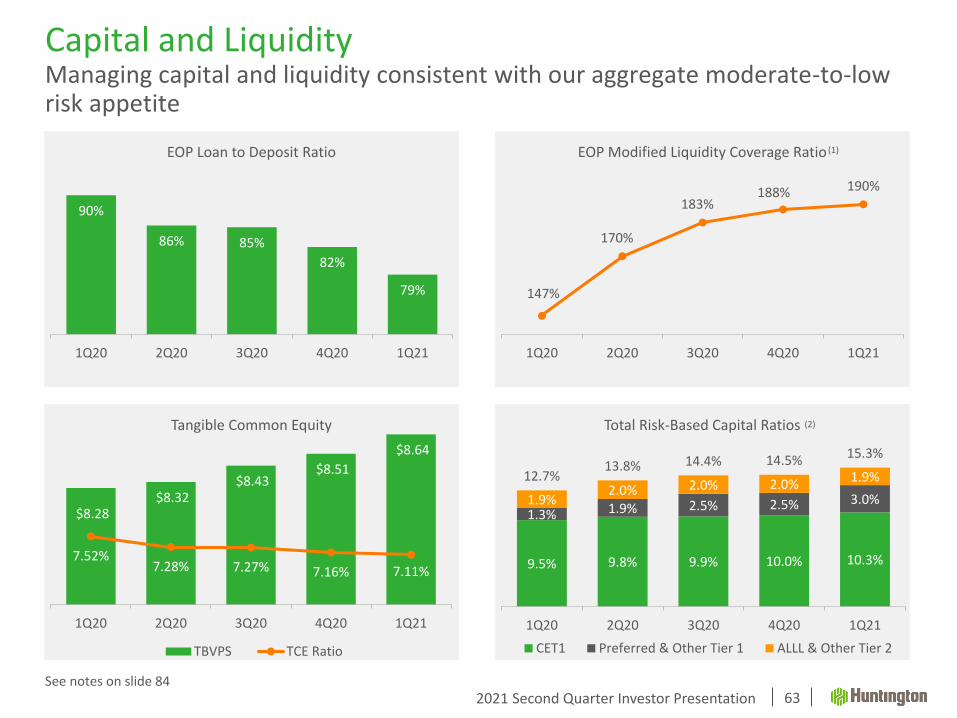
$8.28 $8.32
$8.43 $8.51
$8.64
7.52%7.28% 7.27% 7.16% 7.11%
6.00%
6.50%
7.00%
7.50%
8.00%
8.50%
9.00%
9.50%
10.00%
$7.50
$7.70
$7.90
$8.10
$8.30
$8.50
$8.70
1Q20 2Q20 3Q20 4Q20 1Q21
Tangible Common Equity
TBVPS TCE Ratio
Capital and LiquidityManaging capital and liquidity consistent with our aggregate moderate-to-low risk appetite
63
147%
170%
183%188% 190%
$1.40
$1.50
$1.60
$1.70
$1.80
$1.90
$2.00
$2.10
1Q20 2Q20 3Q20 4Q20 1Q21
EOP Modified Liquidity Coverage Ratio
9.5% 9.8% 9.9% 10.0% 10.3%
1.3% 1.9% 2.5% 2.5% 3.0%1.9%2.0% 2.0% 2.0%
1.9%12.7%13.8% 14.4% 14.5% 15.3%
1Q20 2Q20 3Q20 4Q20 1Q21
Total Risk-Based Capital Ratios
CET1 Preferred & Other Tier 1 ALLL & Other Tier 2
See notes on slide 84
(1)
(2)
90%
86% 85%
82%
79%
$0.70
$0.75
$0.80
$0.85
$0.90
$0.95
1Q20 2Q20 3Q20 4Q20 1Q21
EOP Loan to Deposit Ratio
2021 Second Quarter Investor Presentation
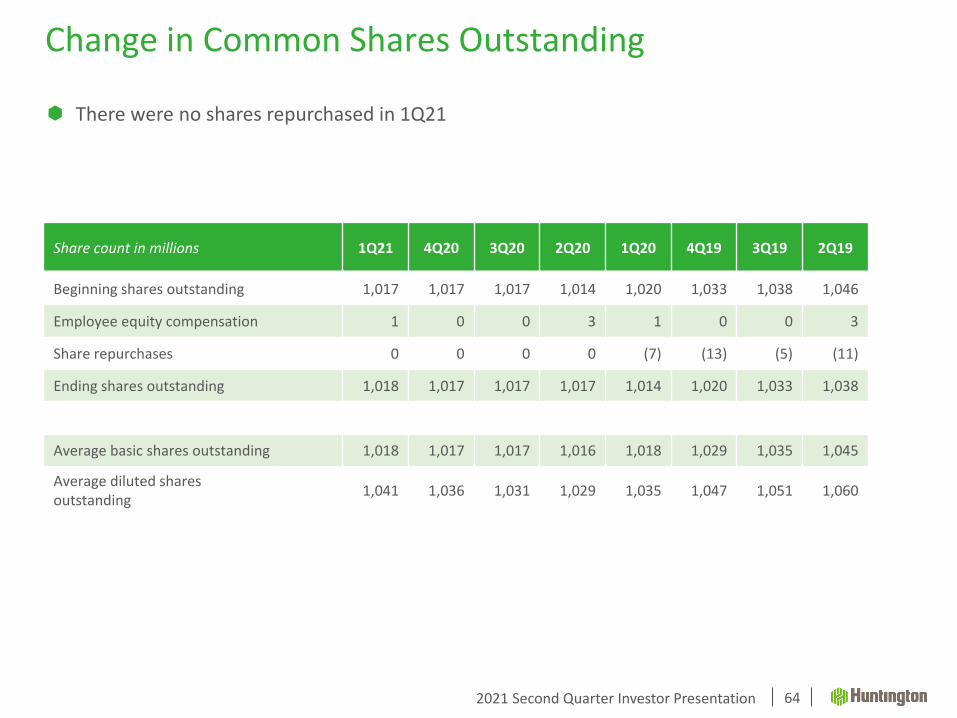
There were no shares repurchased in 1Q21
Change in Common Shares Outstanding
64
Share count in millions 1Q21 4Q20 3Q20 2Q20 1Q20 4Q19 3Q19 2Q19
CAUTION REGARDING FORWARD-LOOKING STATEMENTSThis communication may contain certain forward-looking statements, including, but not limited to, certain plans, expectations, goals, projections, and statements about the benefits of the proposed transaction, the plans, objectives, expectations and intentions of Huntington and TCF, the expected timing of completion of the transaction, and other statements that are not historical facts. Such statements are subject to numerous assumptions, risks, and uncertainties. Statements that do not describe historical or current facts, including statements about beliefs and expectations, are forward-looking statements. Forward-looking statements may be identified by words such as expect, anticipate, believe, intend, estimate, plan, target, goal, or similar expressions, or future or conditional verbs such as will, may, might, should, would, could, or similar variations. The forward-looking statements are intended to be subject to the safe harbor provided by Section 27A of the Securities Act of 1933, Section 21E of the Securities Exchange Act of 1934, and the Private Securities Litigation Reform Act of 1995.
While there is no assurance that any list of risks and uncertainties or risk factors is complete, below are certain factors which could cause actual results to differ materially from those contained or implied in the forward-looking statements: changes in general economic, political, or industry conditions; the magnitude and duration of the COVID-19 pandemic and its impact on the global economy and financial market conditions and our business, results of operations, and financial condition; uncertainty in U.S. fiscal and monetary policy, including the interest rate policies of the Federal Reserve Board; volatility and disruptions in global capital and credit markets; movements in interest rates; reform of LIBOR; competitive pressures on product pricing and services; success, impact, and timing of our business strategies, including market acceptance of any new products or services including those implementing our “Fair Play” banking philosophy; the nature, extent, timing, and results of governmental actions, examinations, reviews, reforms, regulations, and interpretations, including those related to the Dodd-Frank Wall Street Reform and Consumer Protection Act and the Basel III regulatory capital reforms, as well as those involving the OCC, Federal Reserve, FDIC, and CFPB; the occurrence of any event, change or other circumstances that could give rise to the right of one or both of the parties to terminate the merger agreement between Huntington and TCF; the outcome of any legal proceedings that may be instituted against Huntington or TCF; delays in completing the transaction; the failure to obtain necessary regulatory approvals (and the risk that such approvals may result in the imposition of conditions that could adversely affect the combined company or the expected benefits of the transaction); the failure to satisfy any of the conditions to the transaction on a timely basis or at all; the possibility that the anticipated benefits of the transaction are not realized when expected or at all, including as a result of the impact of, or problems arising from, the integration of the two companies or as a result of the strength of the economy and competitive factors in the areas where Huntington and TCF do business; the possibility that the transaction may be more expensive to complete than anticipated, including as a result of unexpected factors or events; diversion of management’s attention from ongoing business operations and opportunities; potential adverse reactions or changes to business or employee relationships, including those resulting from the announcement or completion of the transaction; the ability to complete the transaction and integration of Huntington and TCF successfully; the dilution caused by Huntington’s issuance of additional shares of its capital stock in connection with the transaction; and other factors that may affect the future results of Huntington and TCF. Additional factors that could cause results to differ materially from those described above can be found in Huntington’s Annual Report on Form 10-K for the year ended December 31, 2020, which is on file with the Securities and Exchange Commission (the “SEC”) and available in the “Investor Relations” section of Huntington’s website, http://www.huntington.com, under the heading “Publications and Filings” and in other documents Huntington files with the SEC, and in TCF’s Annual Report on Form 10-K for the year ended December 31, 2020, which is on file with the SEC and available on TCF’s investor relations website, ir.tcfbank.com, under the heading “Financial Information” and in other documents TCF files with the SEC.
All forward-looking statements speak only as of the date they are made and are based on information available at that time. Neither Huntington nor TCF assumes any obligation to update forward-looking statements to reflect circumstances or events that occur after the date the forward-looking statements were made or to reflect the occurrence of unanticipated events except as required by federal securities laws. As forward-looking statements involve significant risks and uncertainties, caution should be exercised against placing undue reliance on such statements.
2021 Second Quarter Investor Presentation
Basis of Presentation
77
Use of Non-GAAP Financial Measures
This document contains GAAP financial measures and non-GAAP financial measures where management believes it to be helpful in understanding Huntington’s results of operations or financial position. Where non-GAAP financial measures are used, the comparable GAAP financial measure, as well as the reconciliation to the comparable GAAP financial measure, can be found in this document, conference call slides, or the Form 8-K related to this document, all of which can be found in the Investor Relations section of Huntington’s website, http://www.huntington.com.
Annualized Data
Certain returns, yields, performance ratios, or quarterly growth rates are presented on an “annualized” basis. This is done for analytical and decision-making purposes to better discern underlying performance trends when compared to full-year or year-over-year amounts. For example, loan and deposit growth rates, as well as net charge-off percentages, are most often expressed in terms of an annual rate like 8%. As such, a 2% growth rate for a quarter would represent an annualized 8% growth rate.
Fully-Taxable Equivalent Interest Income and Net Interest Margin
Income from tax-exempt earning assets is increased by an amount equivalent to the taxes that would have been paid if this incomehad been taxable at statutory rates. This adjustment puts all earning assets, most notably tax-exempt municipal securities and certain lease assets, on a common basis that facilitates comparison of results to results of competitors.
Earnings per Share Equivalent Data
Significant income or expense items may be expressed on a per common share basis. This is done for analytical and decision-making purposes to better discern underlying trends in total corporate earnings per share performance excluding the impact ofsuch items. Investors may also find this information helpful in their evaluation of our financial performance against published earnings per share mean estimate amounts, which typically exclude the impact of Significant Items. Earnings per share equivalents are usually calculated by applying an effective tax rate to a pre-tax amount to derive an after-tax amount, which is divided by the average shares outstanding during the respective reporting period. Occasionally, when the item involves special tax treatment, the after-tax amount is disclosed separately, with this then being the amount used to calculate the earnings per share equivalent.
2021 Second Quarter Investor Presentation
Basis of Presentation
78
Rounding
Please note that columns of data in this document may not add due to rounding.
Significant Items
From time to time, revenue, expenses, or taxes are impacted by items judged by management to be outside of ordinary banking activities and/or by items that, while they may be associated with ordinary banking activities, are so unusually large that their outsized impact is believed by management at that time to be infrequent or short term in nature. We refer to such items as “Significant Items”. Most often, these Significant Items result from factors originating outside the company – e.g., regulatory actions/assessments, windfall gains, changes in accounting principles, one-time tax assessments/refunds, and litigation actions. In other cases they may result from management decisions associated with significant corporate actions out of the ordinary course of business – e.g., merger/restructuring charges, recapitalization actions, and goodwill impairment.
Even though certain revenue and expense items are naturally subject to more volatility than others due to changes in market and economic environment conditions, as a general rule volatility alone does not define a Significant Item. For example, changes in the provision for credit losses, gains/losses from investment activities, and asset valuation write-downs reflect ordinary banking activities and are, therefore, typically excluded from consideration as a Significant Item.
Management believes the disclosure of “Significant Items”, when appropriate, aids analysts/investors in better understanding corporate performance and trends so that they can ascertain which of such items, if any, they may wish to include/exclude from their analysis of the company’s performance - i.e., within the context of determining how that performance differed from their expectations, as well as how, if at all, to adjust their estimates of future performance accordingly. To this end, management has adopted a practice of listing “Significant Items” in our external disclosure documents (e.g., earnings press releases, quarterlyperformance discussions, investor presentations, Forms 10-Q and 10-K).
“Significant Items” for any particular period are not intended to be a complete list of items that may materially impact current or future period performance. A number of items could materially impact these periods, including those which may be described from time to time in Huntington’s filings with the Securities and Exchange Commission.
2021 Second Quarter Investor Presentation
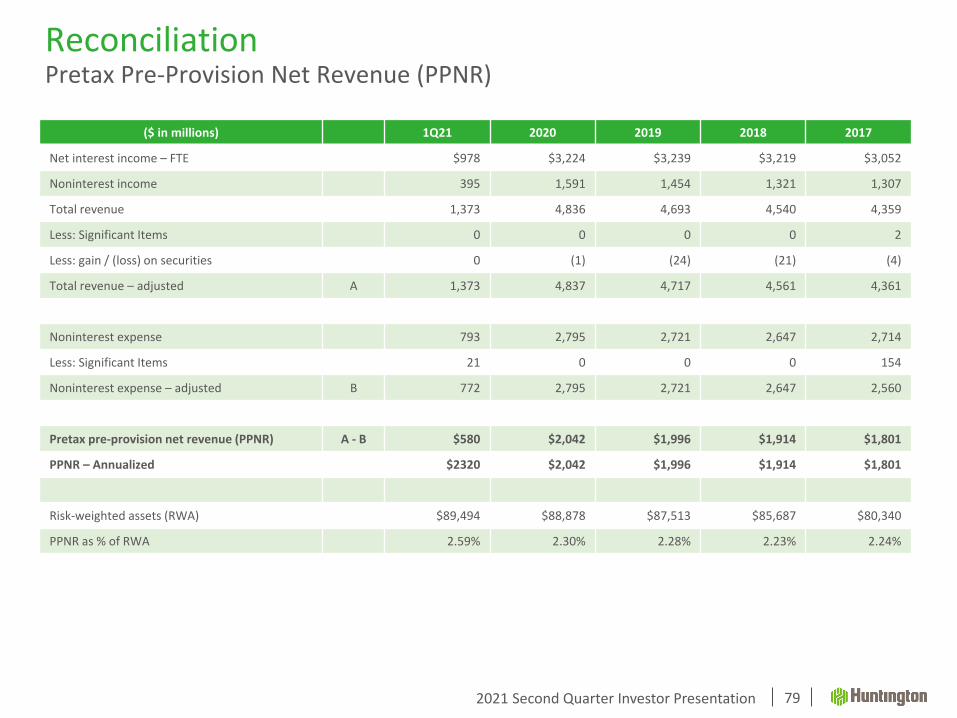
ReconciliationPretax Pre-Provision Net Revenue (PPNR)
($ in millions) 1Q21 2020 2019 2018 2017
Net interest income – FTE $978 $3,224 $3,239 $3,219 $3,052
Noninterest income 395 1,591 1,454 1,321 1,307
Total revenue 1,373 4,836 4,693 4,540 4,359
Less: Significant Items 0 0 0 0 2
Less: gain / (loss) on securities 0 (1) (24) (21) (4)
Total revenue – adjusted A 1,373 4,837 4,717 4,561 4,361
Noninterest expense 793 2,795 2,721 2,647 2,714
Less: Significant Items 21 0 0 0 154
Noninterest expense – adjusted B 772 2,795 2,721 2,647 2,560
Pretax pre-provision net revenue (PPNR) A - B $580 $2,042 $1,996 $1,914 $1,801
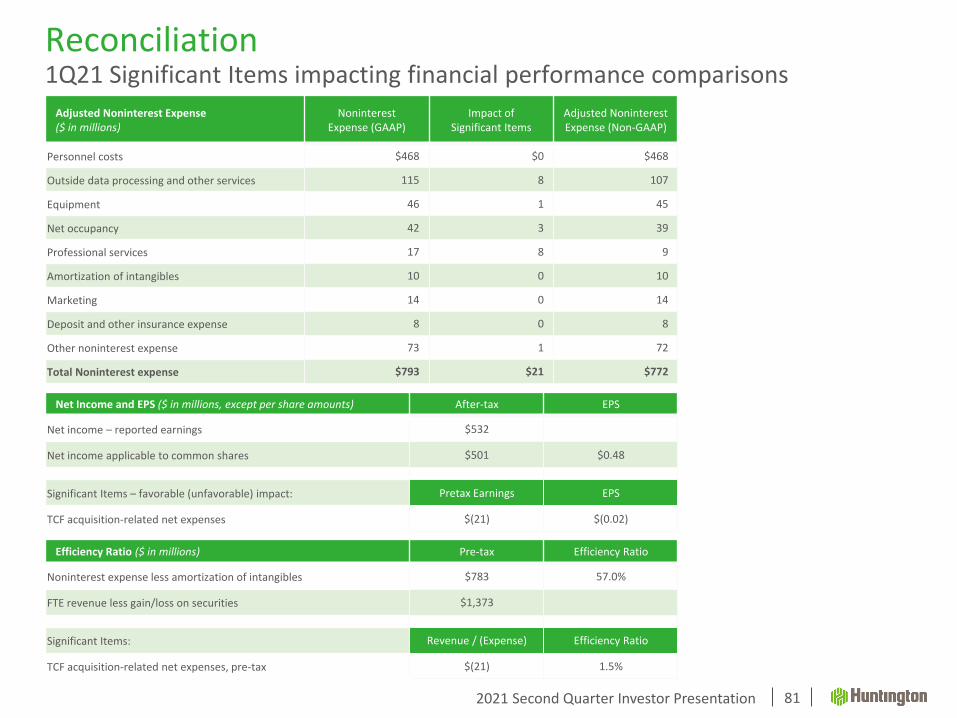
TCF acquisition-related net expenses $(21) $(0.02)
Efficiency Ratio ($ in millions) Pre-tax Efficiency Ratio
Noninterest expense less amortization of intangibles $783 57.0%
FTE revenue less gain/loss on securities $1,373
Significant Items: Revenue / (Expense) Efficiency Ratio
TCF acquisition-related net expenses, pre-tax $(21) 1.5%
2021 Second Quarter Investor Presentation
Notes
82
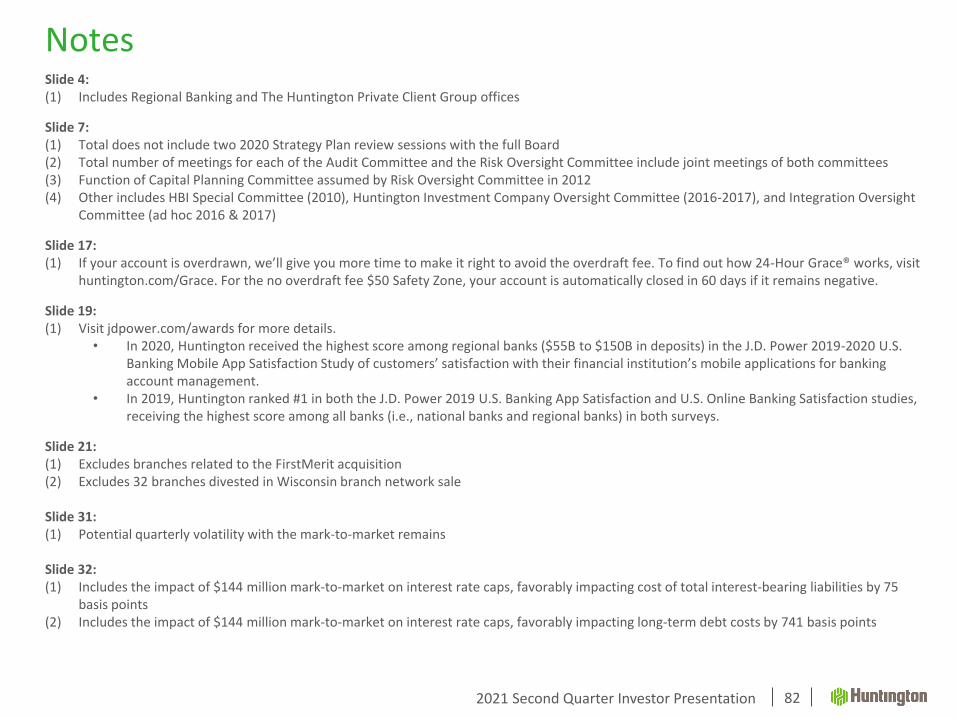
Slide 4:(1) Includes Regional Banking and The Huntington Private Client Group offices
Slide 7:(1) Total does not include two 2020 Strategy Plan review sessions with the full Board(2) Total number of meetings for each of the Audit Committee and the Risk Oversight Committee include joint meetings of both committees(3) Function of Capital Planning Committee assumed by Risk Oversight Committee in 2012(4) Other includes HBI Special Committee (2010), Huntington Investment Company Oversight Committee (2016-2017), and Integration Oversight
Committee (ad hoc 2016 & 2017)
Slide 17:(1) If your account is overdrawn, we’ll give you more time to make it right to avoid the overdraft fee. To find out how 24-Hour Grace® works, visit
huntington.com/Grace. For the no overdraft fee $50 Safety Zone, your account is automatically closed in 60 days if it remains negative.
Slide 19:(1) Visit jdpower.com/awards for more details.
• In 2020, Huntington received the highest score among regional banks ($55B to $150B in deposits) in the J.D. Power 2019-2020 U.S.Banking Mobile App Satisfaction Study of customers’ satisfaction with their financial institution’s mobile applications for banking account management.
• In 2019, Huntington ranked #1 in both the J.D. Power 2019 U.S. Banking App Satisfaction and U.S. Online Banking Satisfaction studies, receiving the highest score among all banks (i.e., national banks and regional banks) in both surveys.
Slide 21:(1) Excludes branches related to the FirstMerit acquisition(2) Excludes 32 branches divested in Wisconsin branch network sale
Slide 31:(1) Potential quarterly volatility with the mark-to-market remains
Slide 32:(1) Includes the impact of $144 million mark‐to‐market on interest rate caps, favorably impacting cost of total interest‐bearing liabilities by 75
basis points(2) Includes the impact of $144 million mark‐to‐market on interest rate caps, favorably impacting long‐term debt costs by 741 basis points
2021 Second Quarter Investor Presentation
Notes
83
Slide 40:(1) Linked-quarter percent changes annualized(2) Includes commercial bonds booked as investment securities under GAAP
Slide 42:(1) All amounts represent accruing purchased impaired loans; under the applicable accounting guidance (ASC 310-30), the loans were recorded
at fair value upon acquisition and remain in accruing status(2) Annualized
Slide 43:(1) Companies with > 25% of their revenue from the auto industry(2) Annualized
Slide 44:(1) All amounts represent accruing purchased impaired loans; under the applicable accounting guidance (ASC 310-30), the loans were recorded
at fair value upon acquisition and remain in accruing status(2) Annualized
Slide 45:(1) Experian data from January 2020 through December 2020
Slide 47:(1) Auto LTV based on retail value
Slide 49:(1) Originations are based on commitment amounts(2) FHFA Regional HPI ENC Season-Adj; U.S. and Census Division(3) Source: BLS.gov; average of monthly seasonally-adjusted unemployment rate for period
Slide 51:(1) FHFA Regional HPI ENC Season-Adj; U.S. and Census Division(2) Source: BLS.gov; average of monthly seasonally-adjusted unemployment rate for period
Slide 54:(1) RV/Marine LTV based on wholesale value
2021 Second Quarter Investor Presentation
Notes
84
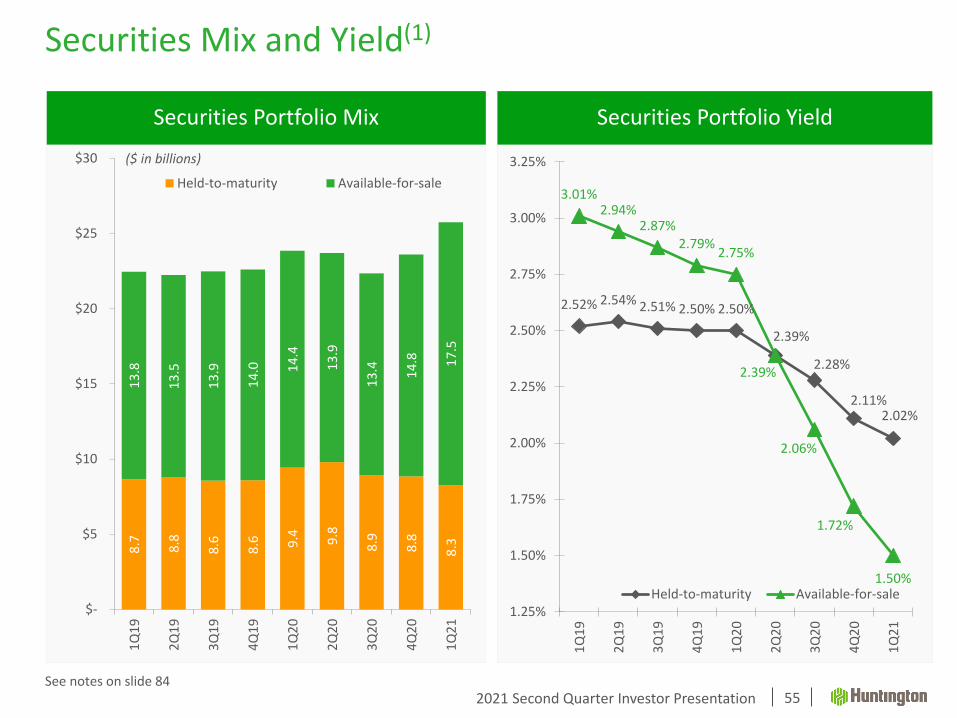
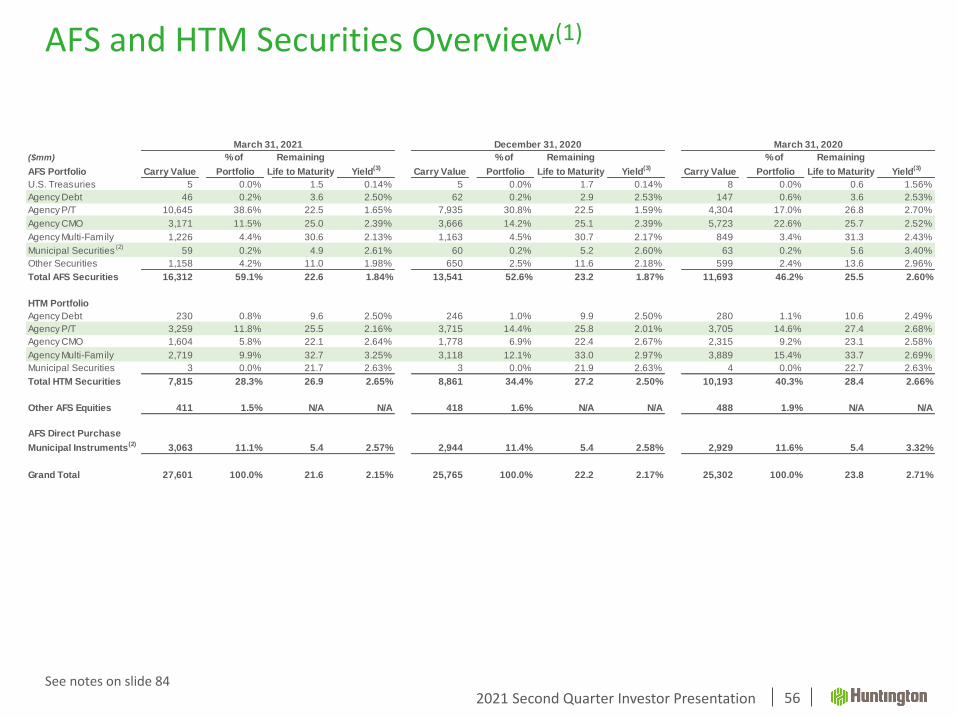
Slide 55:(1) Average balances; Trading Account and Other securities excluded
Slide 56:(1) End of period(2) Tax-equivalent yield on municipal securities calculated as of March 31, 2021 using 21% corporate tax rate(3) Weighted average yields were calculated using carry value
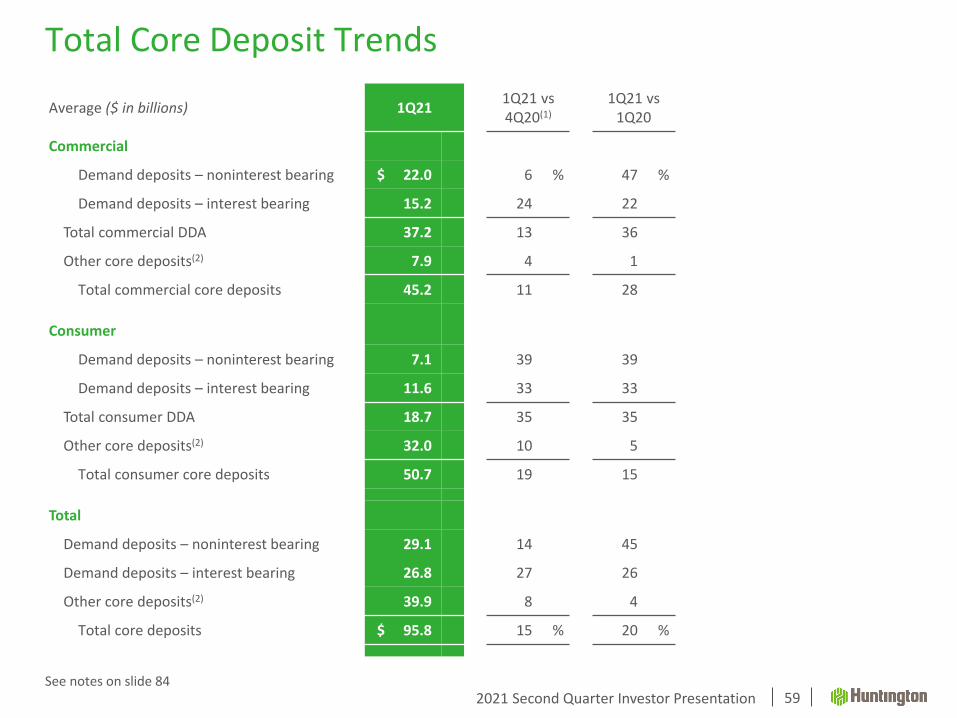
Slide 59:(1) Linked-quarter percent change annualized(2) Money market deposits, savings / other deposits, and core certificates of deposit
Slide 63:(1) As of December 31, 2019, Huntington is no longer subject to the Federal Reserve’s modified Liquidity Coverage Ratio.(2) March 31, 2021 figures are estimated. Amounts are presented on a Basel III standardized approach basis for calculating risk-weighted
assets. The 2020 capital ratios reflect Huntington’s election of a five-year transition to delay for two years the full impact of CECL on regulatory capital, followed by a three-year transition period.
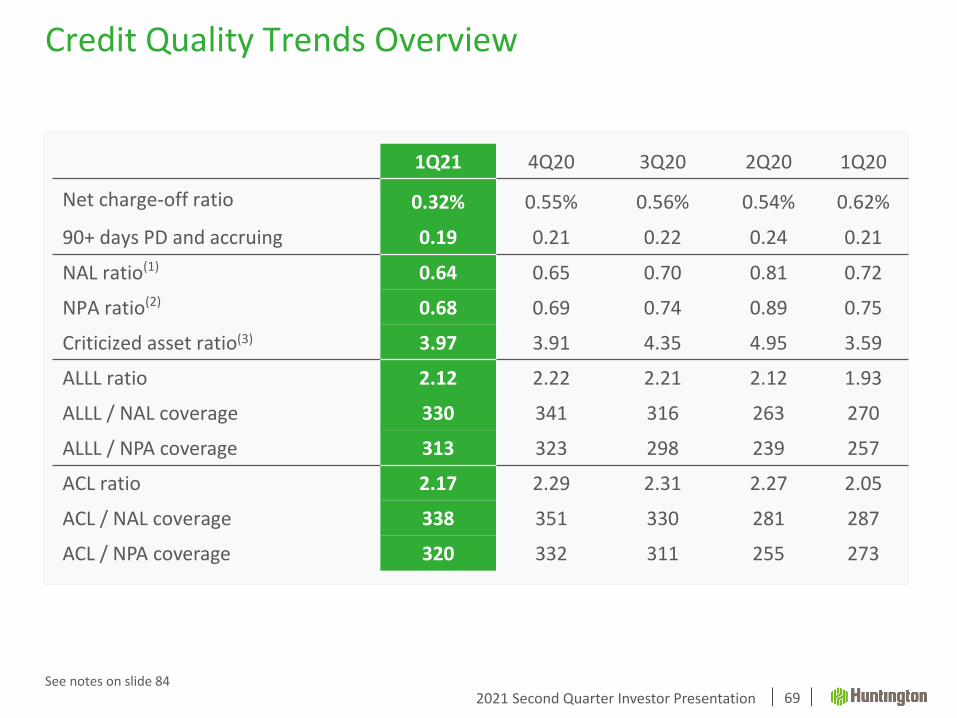
Slide 69:(1) NALs divided by total loans and leases(2) NPAs divided by the sum of loans and leases, net other real estate owned, and other NPAs(3) Criticized assets = commercial criticized loans + consumer loans >60 DPD + OREO; Total criticized assets divided by the sum of loans and
leases, net other real estate owned, and other NPAs
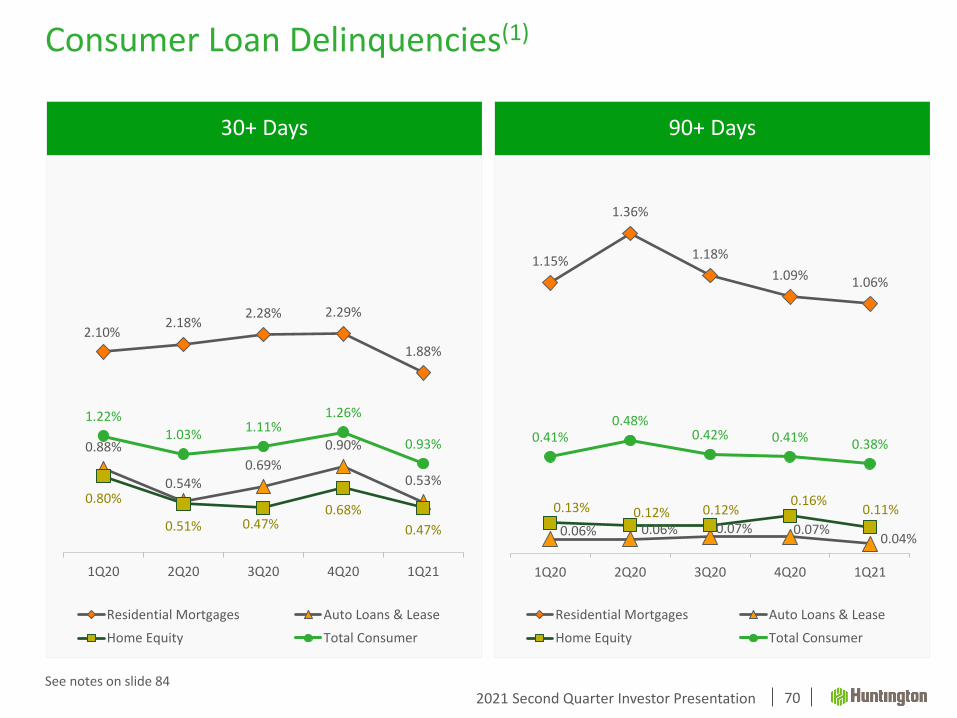
Slide 70:(1) End of period; delinquent but accruing as a % of related outstandings at end of period
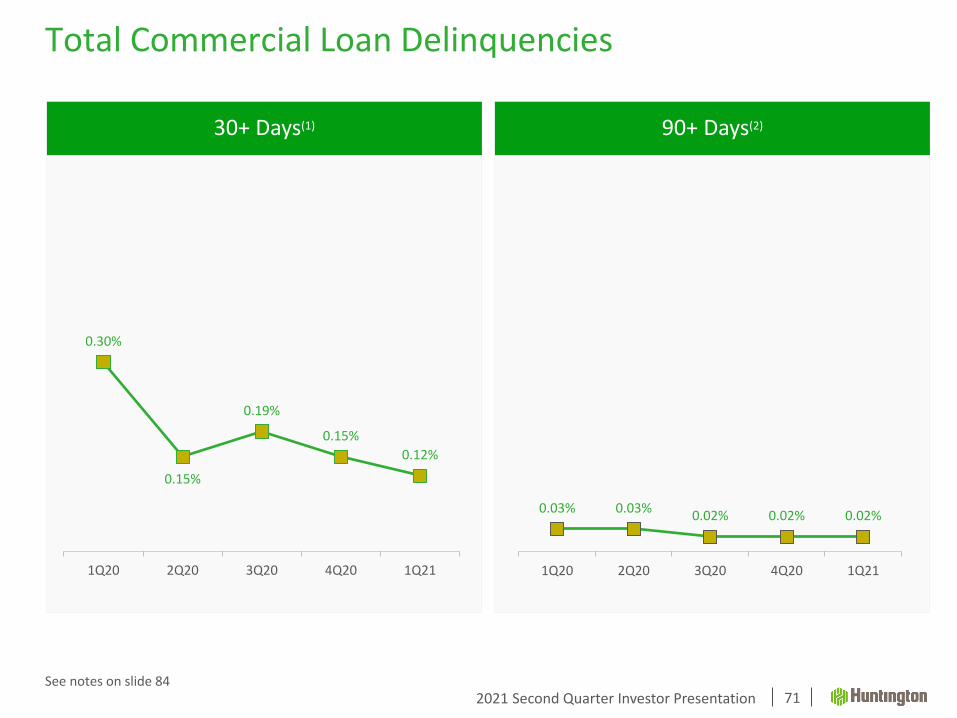
Slide 71:(1) Amounts include Huntington Technology Finance administrative lease delinquencies(2) Amounts include Huntington Technology Finance administrative lease delinquencies and accruing purchased impaired loans acquired in
the FirstMerit transaction. Under the applicable accounting guidance (ASC 310-30), the accruing purchased impaired loans were recorded at fair value upon acquisition and remain in accruing status.