43
Summer Business Update July 22, 2021 Charles Schwab Corporation

Summer Business Update
July 22, 2021
Charles Schwab Corporation

Forward Looking Statements
2
This presentation contains “forward-looking statements” within the meaning of Section 27A of the Securities Act of 1933 and Section 21E of the Securities Exchange Act of 1934. Forward-looking statements include statements that refer to expectations, projections or other characterizations of future events or circumstances and are identified by words such as “believe,” “expect,” “will,” “may,” “should,” “could,” “continue,” “growth,” “remain,” “drive,” “sustain,” “enhance,” “estimate,” “potential,” “target,” “on track,” “deliver,” “outcome,” “build,” “progress,” “maintain,” “advance,” “upside,” “position,” “investment,” “opportunity,” “assumptions,” “illustrative,” “focus,” “trajectory,” “increase,” “enable,” “trend,” and other similar expressions.
These forward-looking statements relate to: the company’s strategy and “no trade-offs” approach; business momentum; client engagement and activity levels; growth in the client base, client accounts and assets; key initiatives to add scale and efficiency, win-win monetization, and client segmentation; positioning; opportunities; RIA growth; investments and acquisitions to fuel and support growth, serve clients, and drive scale and efficiency; the integration of TD Ameritrade and other acquisitions, including current expectations regarding the timing and amount of expense and revenue synergies, and the timing of client conversion; digital transformation; the launch of personalized investing solutions; stockholder value; BDA transfers; USAA referral program; capital and liquidity management; Tier 1 Leverage Ratio operating objective; 2021 financial outlook, including underlying assumptions, investor behavioral drivers, and illustrative financial outcomes; growth in revenues, earnings, and profits; capital expenditures; expense growth; net interest margin; balance sheet growth; balancing near-term results and long-term investments; estimated revenue impact from revenue sensitivities; the company’s views of broad industry trends, client views and the competitive landscape; and market share.
These forward-looking statements, which reflect management’s beliefs, objectives, and expectations as of today, are estimates based on the best judgment of the company’s senior management. Achievement of the expressed beliefs, expectations, and objectives is subject to risks and uncertainties that could cause actual results to differ materially from those beliefs, expectations, or objectives. Important factors that may cause such differences are discussed in the company’s filings with the Securities and Exchange Commission, including the Annual Report on Form 10-K and Quarterly Reports on Form 10-Q. Other important factors include general market conditions, including equity valuations, trading activity, the level of interest rates - which can impact money market fund fee waivers - and credit spreads; market volatility; the company’s ability to attract and retain clients and RIAs and grow those relationships and associated client assets; competitive pressures on pricing; the company’s ability to develop and launch new and enhanced products, services, and capabilities, as well as enhance its infrastructure, in a timely and successful manner; client use of the company’s advisory solutions and other products and services; the company’s ability to support client activity levels; the risk that expected revenue and expense synergies and other benefits from the TD Ameritrade and other acquisitions may not be fully realized or may take longer to realize than expected, and that integration expense may be higher than expected; client liquidity needs; asset-liability management considerations; daily average trades; margin balances; balance sheet cash; client cash allocations; client sensitivity to rates; the level of client assets, including cash balances; the company’s ability to monetize client assets; capital and liquidity needs and management; the company’s ability to manage expenses; the migration of BDA balances; integration-related and other technology projects; prepayment speeds for mortgage-backed securities; investment yields; interest earning asset mix and growth; securities lending; the scope and duration of the COVID-19 pandemic and actions taken by governmental authorities to contain the spread of the virus and the economic impact; regulatory guidance; the effect of adverse developments in litigation or regulatory matters and the extent of any charges associated with such matters; and any adverse impact of financial reform legislation and related regulations. The information in this presentation speaks only as of July 22, 2021 (or such earlier date as may be specified herein). The company makes no commitment to update any of this information.
Charles Schwab Corporation

Walt BettingerChief Executive Officer
3Charles Schwab Corporation

Clients remain at the center of our strategy as we build the future of modern wealth management.
Charles Schwab Corporation 4
Overall business momentum and client engagement remains strong despite moderating trading and related activity from the heights of the first quarter
Our contemporary full-service model continues to resonate across the spectrum of individual investors and the advisors who serve them
We continue to progress on multiple key initiatives, including capturing initial benefits from our recent strategic acquisitions, which we believe will help maintain our favorable positioning relative to key industry themes – and therefore bolster our ability to capture the long-term growth opportunities still ahead

Evolving macro factors weighed on rates during the second quarter, as equity markets hit new highs.
5
While major market indices marched steadily higher as investor confidence was buoyed by further economic progress and contained volatility,...
…longer-term interest rates stopped short of pre-pandemic levels, and even retreated, as inflation expectations tempered.
Jun-21Dec-19
Note: NASDAQ® = NASDAQ Composite index. DJIA® = Dow Jones Industrial Average.
1.92%1.74%
1.45%
21%
33%
62%
VIX®
Select Index Returns Since December 2019 (%)
S&P 500® up 33%NASDAQ® up 62% DJIA® up 21%
10-year U.S. Treasury Yield (%)
COVID-19
Mar-20 Jun-20 Sep-20 Dec-20 Mar-21
Jun-21Dec-19 Mar-20 Jun-20 Sep-20 Dec-20 Mar-21Charles Schwab Corporation

New brokerage accounts5
Three consecutive quarters of 1M+ new accounts
Clients continued to look to Schwab for their investing needs…
Charles Schwab Corporation 6Note: TDA = TD Ameritrade. K = Thousands. M = Millions. B = Billions. Core net new assets = net new assets before significant one-time flows, such as acquisitions/divestitures or extraordinary flows (generally greater than $10 billion) relating to a specific client. These flows may span multiple reporting periods. 1. Organic growth rate shown on an annualized basis. 2. 2020 gross new brokerage accounts exclude 1.1 million accounts and 14.5 million accounts directly acquired as part of the USAA and TD Ameritrade transactions, respectively. 3. Full-year results only include TD Ameritrade from October 6, 2020 forward. 4. Pro forma combined includes both Schwab and TDA.
Core Net New Assets ($B)
20172016 2018 2019 2020
$126
$228
$199$212
$282
7% 7% 7% 7%5%
Core Net New Assets5
Record first half
Core NNA already surpassed all prior full-year results except 20203
Up ~30% vs. pro forma combined 1H204
Organic Growth Rate1 (%) 8%
New Brokerage Accounts2 (K) 1,5681,5761,4411,093 3,027 4,810
$120
$257
6%
1,167
1H20 1H21
Mutual Fund Clearing
IS and AS (ex-Mutual Fund Clearing)
TDA

…and while trading activity moderated during 2Q, broader engagement remained robust.
Charles Schwab Corporation 7
1,744
5,457
8,414
6,042
1Q212Q19 2Q20 2Q21
Daily Average Trades1 (K)
Schwab Bank Loans, EOP ($B)
Note: EOP = End-of-period. DATs = Daily average trades. 1. DATs, digital interactions, and EOP margin balances shown on a pro forma combined company basis. 2. Digital interactions include total web and mobile logins across both the Schwab and TDA platforms.
Margin Balances, EOP1 ($B)
Total Digital Interactions1,2 (M)
$40.3
$79.8
Dec-19 Jun-21
COVID-19$28.9BWith loan growthof 14% vs. 1Q21
~700~785
~1,060
~920
2Q20 4Q20 1Q21 2Q21

Schwab’s “no trade-offs” approach attracts a wide range of Retail investors.
Charles Schwab Corporation 8
Retail asset gathering remains pronounced.
+65%
Note: Avg. = Average. HH = Household. 1. Retail NNA excluding $80 billion in assets related to the acquisition of certain assets from USAA in May 2020. 2. As of June 30, 2021. All data shown on a pro forma combined company basis.
Increase in NNAversus 2Q201
Our contemporary full-service model continues to help clients build their financial futures.2
$200 $211$231 $225 $235
4Q203Q202Q20 2Q211Q21
50.9 50.6 50.4 49.5 49.4Avg. Retail client age
Avg. Assets per HH ($K)
Select 2Q21 Household sizes
Avg. affluent HH Size
Avg. assets per HH <40
Avg. assets per HH <30
~$1.5M
~$45K
~$25K

Our custody platform remains a destination of choice for RIAs.
Charles Schwab Corporation 9
More Advisors are turning independent
Competitive positioning continues to be strong
Deal sizes and volumes have increased
Asset gathering demonstrates success
$10
$24
2Q20 2Q21
+52%Increase in AIT
teams since 2Q20$64
$78
2Q20 2Q21
+84%
Average AIT Size ($M)
2Q20
2Q21
ASI NNA ($B)
We remain favorably positioned in one of the fastest growing financial services channels.
Net TOA Flows ($B)
Note: RIAs = Registered Investment Advisors. TOA = Transfer of Assets. AIT = Advisor in Transition. ASI = Advisor Services Institutional. All data shown on a pro forma combined company basis.
2.0
2.9Net TOA Ratio
New RIAs
Existing RIAs

Consistency of focus and effort is paramount as we further advance against our key initiatives,…
Charles Schwab Corporation 10
Scale & Efficiency Win–Win Monetization Client Segmentation
Launch personalized investing solutions
Enhance fixed income offering
Advance acquisition integration efforts
Continue technology and digital evolution
Support business growth
Deliver tailored experiences to Retail and RIA clients
Provide specialized lending solutions
Empower self-directed traders and investors
Third-party fee arrangements
Further enhancing our offer to clients positions us to continue building long-term stockholder value

…led by the integration of recent acquisitions.
Charles Schwab Corporation 11
With initial successes to date, along with the incremental opportunities to be unlocked by the Motif transaction, we believe our recent acquisitions will continue to benefit all stakeholders.
On track to meet Year 1 expense synergy expectations and achieve client conversion within 30–36 months post-close
Initiating early revenue synergies, including select balance transfers, order routing harmonization, and securities lending program
Launched 20 fixed income strategies, including six SMAs, two ultra-short funds, and 12 bond ladders
YTD net flows of $3B+, or ~30% of total AUM acquired upon closing
On pace to deliver cost synergy targets outlined at deal announcement
Nearly 70K accounts already referred to Schwab via our ongoing arrangement, with potentially more upside over time
Note: SMA = Separately managed account. YTD = Year-to-date. AUM = Assets under management.

Schwab is well positioned to benefit from evolving industry themes.
Charles Schwab Corporation 12
Broad Trends
ClientViews
CompetitiveLandscape
~13%
U.S. Retail Market: $60T+1
Current market share estimate2
Note: See slides 35–37 in the appendix for the detailed view of these key themes initially presented at the Winter Business Update on February 2, 2021. 1. Total U.S. Retail Assets based on Schwab estimates from Federal Reserve Flow of Funds. 2. Market share estimate based on total client assets as of June 30, 2021.
RelationshipsMatter
Low-costbeta products
New “normal” for trading activity
Brand aloneisn’t enough
Omni-channel experience
Best-in-classService
Financial planning
Personalizedinvesting
Role of trading
Financial wellness
Scale
Breadth of platform
Lending
Continued rapid growth of RIAs
People + technology
Value-oriented advice

Clients remain at the center of our strategy as we build the future of modern wealth management.
Charles Schwab Corporation 13
Overall business momentum and client engagement remains strong despite moderating trading and related activity from the heights of the first quarter
Our contemporary full-service model continues to resonate across the spectrum of individual investors and the advisors who serve them
We continue to progress on multiple key initiatives, including capturing initial benefits from our recent strategic acquisitions, which we believe will help maintain our favorable positioning relative to key industry themes – and therefore bolster our ability to capture the long-term growth opportunities still ahead

Peter CrawfordChief Financial Officer
14Charles Schwab Corporation

Our diversified model keeps us well positioned across a range of environments.
Charles Schwab Corporation 15
Today we’ll discuss:
2Q21 Results
Updated Illustrations
Capital Perspectives
Persistent business momentum through an extended tax season helped our all-weather model deliver strong financial performance even as trading activity subsided from 1Q21 levels
Client engagement and certain external factors will continue to influence our full-year results
Thoughtful balance sheet management enables us to support further growth, including initial BDA transfers which began in early 3Q21

Sustained success with clients, plus a favorable environment, helped us navigate post-peak trading…
Equity Markets (S&P 500®)
4,298 8%
2Q21 vs. 1Q21
Client MarginBalances
11%$79.8B
Average 5-yearTreasury Yield1
0.84% 22 bps
Note: YTD = Year-to-date. NNA = Net new assets. Bps = Basis points. 1. 5-year Treasury Yield represents the daily average for 2Q21 and 1Q21, respectively.
Tradesper Day
28%6.0M
16Charles Schwab Corporation
$257.0
Core NNA ($B)
YTD 2021
New Brokerage Accounts (M)
4.8

…to produce solid top-line results for 2Q21.
Charles Schwab Corporation 17
Total Net Revenues ($M)
41%
22%
26%
43%
21%
7%
23%
1Q21
7%
2Q21
$4,527
NIR
AMAF
Trading
BDA
$4,715-4%
Average interest-earning assets increased by ~3% Rebound in securities lending activity after an April slowdown Slower CPR speeds nudged premium amortization down2%
Net Interest Revenue (NIR)
2Q21 vs. 1Q21
3%
Persistent equity market strength Record flows into our proprietary fund products and solutions1
Lower short-term rates pushed MMF waivers slightly higher
Asset Management and Administration Fees (AMAF)
(21%)
DATs declined 28% from 1Q21 6% increase in revenue per trade due to higher derivatives mix
helped partially offset lower volume
Trading
Note: CPR = Conditional prepayment rate. MMF = Money market mutual funds. DATs = Daily average trades. 1. Excludes net flows related to Schwab Advisor Network and proprietary money market mutual funds.

Attentive expense management yielded a 2% sequential increase in GAAP expenses.
Charles Schwab Corporation 18
1Q21GAAP
Expenses
$2,755
Non-GAAP Adjustments
Compensation & Benefits
Professional Services
Other Non-Compensation Expenses
$144$154
Amortization of Acquired Intangibles
Acquisition & integration-
related costs
2Q21 GAAP
Expenses
$2,808
2Q21 Adjusted Total
Expenses2
$2,510 Adjusted total expenses up 1% vs. 1Q21
− 2Q results include a non-recurring $200 million charge on both a GAAP and an adjusted basis (expected to be non-deductible)
− Compensation & benefits costs declined 8% sequentially due primarily to seasonal factors
− Advertising spend was up 10% vs. 1Q21 in support of continued strong NNA flows
Composition of 2Q21 Expenses ($M)
$2,482M1Q21 Adjusted total expenses2
$273Mof adjustments1
Note: NNA = net new assets. 1. $273M of non-GAAP adjustments includes $119M in acquisition and integration-related costs as well as $154M in amortization of acquired intangibles. 2. Adjusted total expenses exclude acquisition and integration-related costs as well as amortization of acquired intangible assets, consistent with the non-GAAP adjustments discussed on slide 38. Further detail on non-GAAP financial measures and a reconciliation of such measures to reported results are included on slides 38–42 of this presentation.
$200Mcharge

Our profitability and return on capital remained quite healthy during the quarter.
Charles Schwab Corporation 19
Pre-tax ProfitMargin (PTPM)
Adjusted Pre-tax Profit Margin1
ROTCEReturn onEquity (ROE)
Return on Tangible Common Equity
(ROTCE)1,2
Note: ROE = Return on Common Equity. 1. Further detail on non-GAAP financial measures and a reconciliation of such measures to reported results are included on slides 38–42 of this presentation. 2. Due to the timing of the TDA acquisition closing on October 6, 2020, the full quarterly impact of the purchase accounting adjustments were not reflected in the 4Q20 ROTCE measure.
36.2% 36.3% 35.3%
41.6%38.0%
40.0% 39.1%
45.6%47.4%
44.6%
2Q20 2Q213Q20 4Q20 1Q21
280 bpsvs. 1Q21
400 bpsvs. 1Q2110% 10% 11% 12% 10%12% 12%
21%24%
20%
2Q20 3Q20 4Q20 1Q21 2Q21
Adjusted PTPM
Impact of chargeon PTPM = ~440 bps
Impact of chargeon ROTCE = ~300 bps

Our balance sheet grew ~2% sequentially.
Charles Schwab Corporation 20Note: AOCI = Accumulated Other Comprehensive Income. Results include TDA from October 6, 2020 forward. Parent Liquidity equals Parent Working Capital plus Level 1 Securities (at fair market value) as defined by the Liquidity Coverage Ratio rule. Tier 1 Leverage Ratio is based on Tier 1 Capital, which is End of Period Capital (Stockholders’ Equity less AOCI and other regulatory adjustments), divided by Average Total Consolidated Assets. * Preliminary.
($M, EOP) 2Q20 1Q21 2Q21*
Total Assets $400,484 $563,457 $574,532
Receivables from Brokerage Clients
$21,421 $74,711 $82,245
Bank Deposits $301,566 $369,898 $368,638
Payables to Brokerage Clients
$50,135 $101,339 $105,012
Long-term Debt $8,526 $17,698 $18,708
Stockholders’ Equity $30,815 $55,594 $57,450
Parent Liquidity $7,350 $14,345 $10,556
Tier 1 Leverage Ratio 5.9% 6.4% 6.4%
Modest balance sheet growth was mainly attributable to growth in payables, borrowings, and stockholders’ equity
Receivables from brokerage clients increased 10% from the prior quarter driven by margin utilization
Deposits were essentially flat compared to 1Q21 as investor net equity buying and tax disbursements offset cash inflows
Long-term debt was up ~$1 billion sequentially as we issued $2.25 billion in new senior notes followed by $1.2 billion of scheduled maturities
Completed the previously announced redemption of all $600 million of Series C preferred stock
Stockholders’ Equity increased ~3% sequentially due primarily to an increase in AOCI
Tier 1 Leverage Ratio held steady at 6.4%, which is well above regulatory minimums, but still below our long-term operating objective of 6.75% – 7.00%

Charles Schwab Corporation 21
$11 $10
($3)
($25)($17)($13) ($19) ($13) ($16) ($12)
$27 $30
$54 $53
$28
2Q20 3Q20 4Q20 1Q21 2Q21
OtherFixed IncomeEquities
Quarterly Organic Net Flows to Bank Sweep and Schwab One Balances ($B)
$25 $21 $39 $11Total NetQuarterly Flows1
2
Source of NetInflow / (Outflow)
Client Cash as %Total Client Assets3 13.6% 12.8% 12.3% 10.5%
($1)
11.5%
Net equity purchase activity reflects positive investor sentiment during 1H21.
Note: 1. Net quarterly flows reflect changes in Schwab brokerage accounts; totals may not tie to underlying components due to rounding. 2. “Other Flows” includes net new asset flows, dividends and interest as well as net movements of balance sheet client deposits to other alternatives, including Purchased Money Market Funds (PMMFs), Certificates of Deposit (CDs) and other income-oriented investments. 3. Cash includes all bank and broker-dealer deposits and non-interest-bearing credits, plus sweep and purchased money market funds. As of October 6, 2020, all cash and assets in TDA accounts are included in the cash % assets figures.

During 2Q21, select macro drivers were broadly consistent with our underlying assumptions,…
Charles Schwab Corporation 22
Underlying Assumptions1 YTD Actual Results2
Market S&P appreciates 6.5%from December 31, 2020
S&P up 14.4%since end of 2020
Rates Average 5-year Treasury yield of ~90 bps for FY 2021
Average 5-year Treasury yield of ~73 bps through 2Q21
BDA
Note: YTD = Year-to-date. B/S = Balance sheet. EOP = end-of-period. 1. As presented during Spring Business Update on April 22, 2021. 2. YTD results as of June 30, 2021. 3. Schwab balance sheet cash represents existing bank deposits and payables to brokerage clients as of June 30, 2021 – excludes any potential BDA balance migrations that may occur starting in July 2021.
Initial migrations tobegin on June 30, 2021 --
Impact
Securities Lending
Average of the prior two quarters(~$200 million) $187 million
SchwabB/S Cash3
Increase 10–12% versus balanceas of December 31, 2020 Up 2.5% as of June 30, 2021
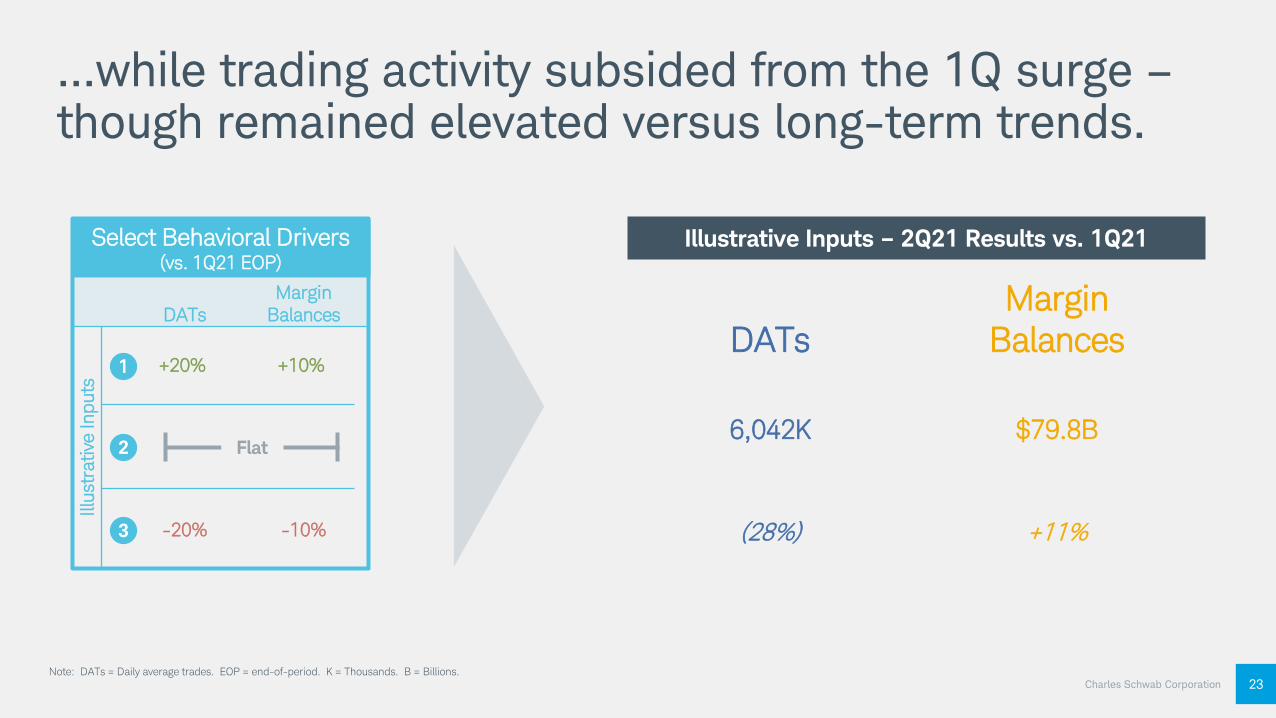
Charles Schwab Corporation 23
DATsMargin
Balances
6,042K $79.8B
(28%) +11%
Illustrative Inputs – 2Q21 Results vs. 1Q21
Note: DATs = Daily average trades. EOP = end-of-period. K = Thousands. B = Billions.
…while trading activity subsided from the 1Q surge –though remained elevated versus long-term trends.
MarginBalances
Select Behavioral Drivers(vs. 1Q21 EOP)
DATs
+20% +10%
Illus
trat
ive
Inpu
ts
1
2
3 -20% -10%
Flat

Charles Schwab Corporation 24
Revenue Adj. Total Expenses3 Adj. PTPM3
8%
20%
11%
5%
7%
10%
46%+46%
Note: DATs = Daily average trades. B/S = Balance sheet. EOP = end-of-period. K = Thousands. M = Millions. B = Billions. Adj. = Adjusted. YTD = Year=to-date. 1. April illustrative financial outcomes shared as part of the Spring Business Update on April 22, 2021. 2. Both YTD 2021 and 4Q20 results annualized for comparison purposes. 3. Further detail on non-GAAP financial measures and a reconciliation of such measures to reported results are included on slides 38–42 of this presentation.
Year-to-date results also remain broadly consistent with the mathematical illustrations shared in April 20211.
MarginBalances
Select Behavioral Drivers(vs. 1Q21 EOP)
DATs
+20% +10%
Illus
trat
ive
Inpu
ts
1
2
3 -20% -10%
Flat
Financial Outcomes – YTD Results vs. 4Q202
Includes the impact of the $200M charge= YTD Result
= Impact of charge
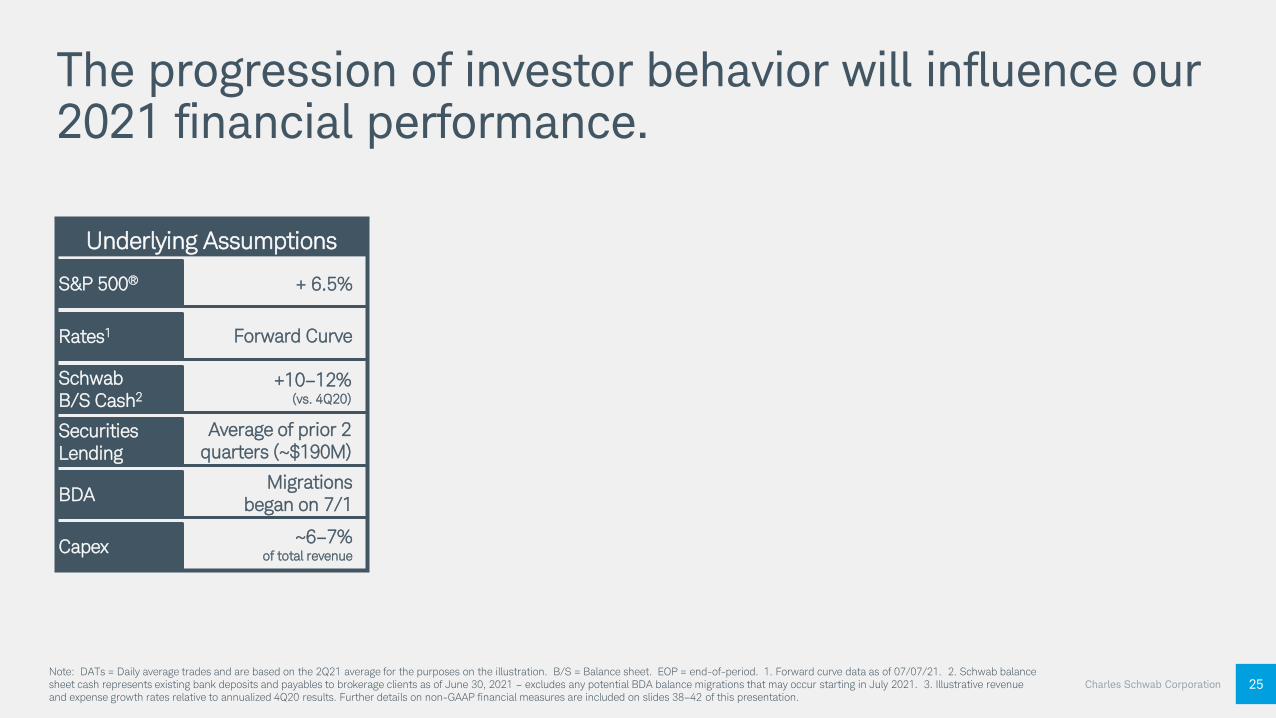
The progression of investor behavior will influence our 2021 financial performance.
Charles Schwab Corporation 25Note: DATs = Daily average trades and are based on the 2Q21 average for the purposes on the illustration. B/S = Balance sheet. EOP = end-of-period. 1. Forward curve data as of 07/07/21. 2. Schwab balance sheet cash represents existing bank deposits and payables to brokerage clients as of June 30, 2021 – excludes any potential BDA balance migrations that may occur starting in July 2021. 3. Illustrative revenue and expense growth rates relative to annualized 4Q20 results. Further details on non-GAAP financial measures are included on slides 38–42 of this presentation.
Underlying Assumptions
S&P 500® + 6.5%
Rates1
SchwabB/S Cash2
Securities Lending
BDA
Capex
Migrationsbegan on 7/1
+10–12%(vs. 4Q20)
~6–7%of total revenue
Average of prior 2 quarters (~$190M)
Forward Curve

Charles Schwab Corporation 26
MarginBalances
Select Behavioral Drivers(vs. 2Q21 EOP)
DATs
+20% +10%
Illus
trat
ive
Inpu
ts
1
2
3 -20% -10%
Flat
The progression of investor behavior will influence our 2021 financial performance.
Note: DATs = Daily average trades and are based on the 2Q21 average for the purposes on the illustration. B/S = Balance sheet. EOP = end-of-period. 1. Forward curve data as of 07/07/21. 2. Schwab balance sheet cash represents existing bank deposits and payables to brokerage clients as of June 30, 2021 – excludes any potential BDA balance migrations that may occur starting in July 2021. 3. Illustrative revenue and expense growth rates relative to annualized 4Q20 results. Further details on non-GAAP financial measures are included on slides 38–42 of this presentation.
Underlying Assumptions
S&P 500® + 6.5%
Rates1
SchwabB/S Cash2
Securities Lending
BDA
Capex
Migrationsbegan on 7/1
+10–12%(vs. 4Q20)
~6–7%of total revenue
Average of prior 2 quarters (~$190M)
Forward Curve

Charles Schwab Corporation 27
Illustrative Financial Outcomes3
Revenue PTPM
Illus
trat
ive
Gro
wth
1
2
3
11%–13%
Adjusted
9%–11%
45%+
6%–8%
8%
6%
Total ExpensesAdjustedvs. 4Q20 annualized
~14 bpsAdj. EOCA
(or better)
Note: DATs = Daily average trades and are based on the 2Q21 average for the purposes on the illustration. B/S = Balance sheet. EOP = end-of-period. 1. Forward curve data as of 07/07/21. 2. Schwab balance sheet cash represents existing bank deposits and payables to brokerage clients as of June 30, 2021 – excludes any potential BDA balance migrations that may occur starting in July 2021. 3. Illustrative revenue and expense growth rates relative to annualized 4Q20 results. Further details on non-GAAP financial measures are included on slides 38–42 of this presentation.
The progression of investor behavior will influence our 2021 financial performance.
Range includes the impact of the $200M charge(~2% of annualized 4Q20 adjusted total expenses)
MarginBalances
Select Behavioral Drivers(vs. 2Q21 EOP)
DATs
+20% +10%
Illus
trat
ive
Inpu
ts
1
2
3 -20% -10%
Flat
Underlying Assumptions
S&P 500® + 6.5%
Rates1
SchwabB/S Cash2
Securities Lending
BDA
Capex
Migrationsbegan on 7/1
+10–12%(vs. 4Q20)
~6–7%of total revenue
Average of prior 2 quarters (~$190M)
Forward Curve

Our illustrations suggest full-year NIM still tracking towards the mid-to-upper 140 bps range.
Charles Schwab Corporation 28
2.34%
2.14%
1.53%
1.38%1.55%
1.48% 1.46%
3Q214Q19 1Q20 2Q214Q202Q20 3Q20 1Q21 4Q21
Net Interest Margin (%)
PotentialNIM trajectory
Illustrative
Note: NIM = Net interest Margin. Bps = Basis points. MBS = Mortgage-backed security. ALM = Asset-Liability Management.
The continued evolution of certain factors may impact the 2021 NIM trajectory, including:
MBS Prepayment Speeds
Investment Yields and ALM Parameters
Interest-Earning Asset Mix and Growth
Securities Lending
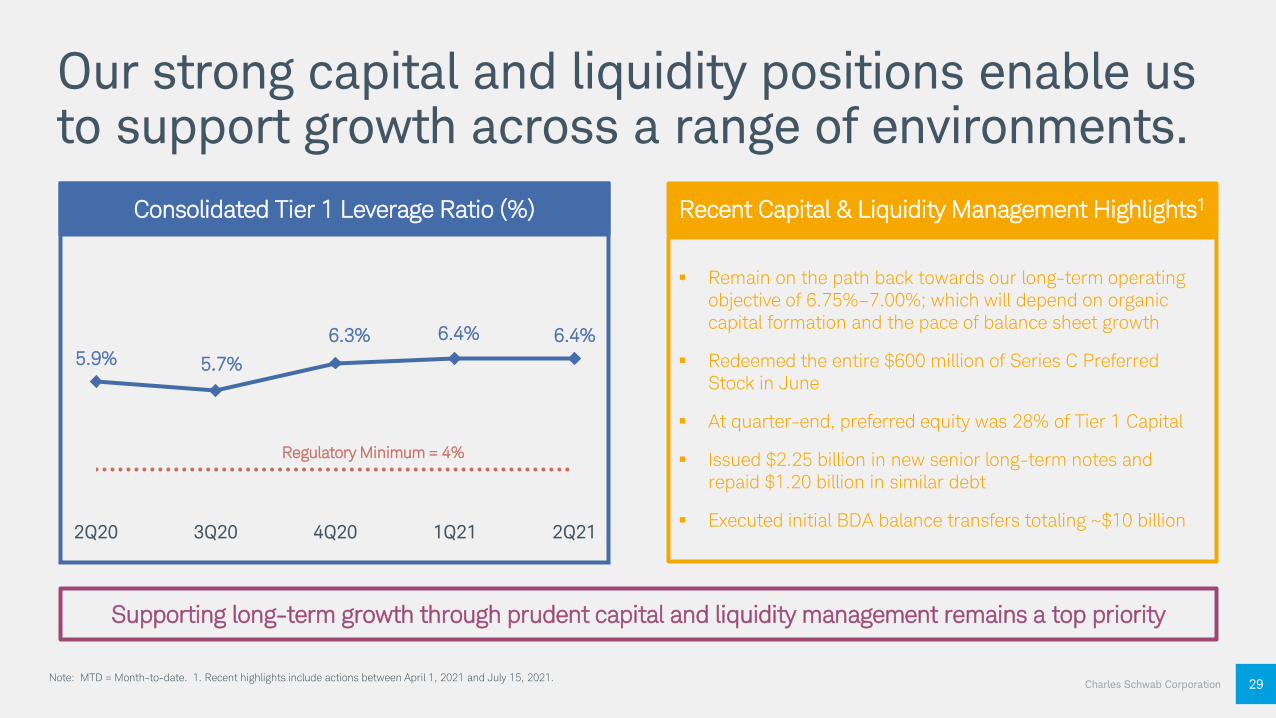
Our strong capital and liquidity positions enable us to support growth across a range of environments.
Charles Schwab Corporation 29
5.9% 5.7%
6.3% 6.4% 6.4%
2Q214Q202Q20 3Q20 1Q21
Regulatory Minimum = 4%
Consolidated Tier 1 Leverage Ratio (%)
Supporting long-term growth through prudent capital and liquidity management remains a top priority
Note: MTD = Month-to-date. 1. Recent highlights include actions between April 1, 2021 and July 15, 2021.
Remain on the path back towards our long-term operating objective of 6.75%–7.00%; which will depend on organic capital formation and the pace of balance sheet growth
Redeemed the entire $600 million of Series C Preferred Stock in June
At quarter-end, preferred equity was 28% of Tier 1 Capital
Issued $2.25 billion in new senior long-term notes and repaid $1.20 billion in similar debt
Executed initial BDA balance transfers totaling ~$10 billion
Recent Capital & Liquidity Management Highlights1

Our diversified model keeps us well positioned across a range of environments.
Charles Schwab Corporation 30
Our unwavering focus on serving the needs of individual investors helps bolster underlying business momentum and fuel healthy financial results
We continue to make progress on key initiatives, including the TD Ameritrade integration, that we believe will unlock enhanced long-term value for both clients and stockholders
Consistency is key – we must continue to strike an appropriate balance between delivering today and investing for tomorrow
Continued business growth through our client-first strategy
Our priorities remain unchanged:
Long-term revenue growth through multiple sources
Thoughtful expense discipline enabling sustainable performance

Q&A
31Charles Schwab Corporation

Charles Schwab Corporation 32
AppendixRevenue Sensitivities
Target Fed Funds Rate
+ 25 bps
~$750M– $950M
5-Year Treasury
+/- 10 bps~$75M
Bank Sweep Balances+/- $1B
~$10M
S&P 500®
+/- 1%~$25M
Daily Average Trades
+/- 100K
~$60MMargin
Balances+/- $1B
~$30M
Note: For the Fed Funds and Treasury sensitivities, assumes static interest-earning asset balances as of June 30, 2021 and depends on the mix and duration of the bank investment portfolio, to the extent there is a parallel shift in the yield curve, how quickly the fixed portfolio reprices, and deposit betas.

AppendixBank Deposit Account Summary (as of June 30, 2021)
Charles Schwab Corporation 33
Mix of Average BDA Balances ($B,%)1
$33.4(21%)
$128.0(79%)
$161.4
$36.4
$19.1 $19.3 $19.1$16.6
$25.5
$17.7
$8.0
Floating Year 3Year 1 Year 2 Year 4 Year 7Year 6Year 5
FixedFloating
Fixed Maturities: $125.4 (77% of total)1 | Net Rate2: 1.05%
BDA Balances by Maturity, EOP ($B)
Net Rate2 (0.07%) 1.66% 1.72% 1.71% 1.52% 0.11% 0.22% 0.32%
AnnualRevenue3 ($25M) $321M $336M $331M $256M $29M $40M $26M
Total Balance: $161.9B Net Rate2: 0.80% Annual Revenue3: $1,313M
Note: Certain totals may not foot due to rounding. BDA = Bank Deposit Account. Net yields calculated on an actual/360 basis. 1. Balances maturing by remaining duration term (e.g., Year 1 maturities are balances rolling off the fixed-rate ladder over the next 12 months). 2. EOP net rate of maturities as of early July 2021 and includes all related fees and client pay rates. 3. Revenue figures presented on an annualized run-rate basis per the amended Insured Deposit Agreement (IDA) arrangement.
Net Rate(0.07%)
1.06%
2Q21 Revenue($6M)
$342M FloatingFixed

Charles Schwab Corporation 34
Note: AIEA = Average interest-earning assets. RMBS = Residential Mortgage-backed Security. CMBS = Commercial Mortgage-backed Security. 1. Bank Investment Portfolio includes available-for-sale held within the consolidated bank investment portfolio, but excludes cash investments; please note percentage may be rounded and therefor may not round to 100%. 2. Lending Activities comprises of client margin debits and bank loans. 3. Total may not round to 100% due to rounding. “Other” includes U.S. Treasuries, corporate debt, ABS, and other investment securities as appropriate. 4. Rate shock analysis is presented on an option-adjusted basis as of June 2021. 5. LUMSTRUU is a Bloomberg Barclays index composed of investment grade pass-through MBS issued and/or guaranteed by a U.S. government agency.
65%
19%
16%
Bank InvestmentPortfolio
LendingActivities
Other IEA
$530.6
2Q21 Avg. Interest-earning Assets1, 2 Bank Investment Portfolio Spotlight
Fixed vs.Floating 89% Fixed / 11% Floating
Securities Mix3
59% 30% 11%
OtherAgency RMBS Agency CMBS
DurationAnalysis4
~4.3Portfolio
Duration (Years)
RateShock(bps)
+100
-100
SCHW LUMSTRUU5
+0.36 yrs.
-0.28 yrs.
+0.60 yrs.
-1.07 yrs.
85-90% backed by U.S. government or agency
AppendixAverage Interest-earning Assets & Bank Investment Portfolio (as of June 30, 2021)

Client relationships and trust matter more than investment products. Firms with trusted end-client relationships will gain market share.
Active management will gather flows in certain asset classes, but various forms of low-cost indexing will capture the majority of client asset flows.
Pandemic-level trading volumes are not sustainable. Over time, retail trading volumes will moderate, but at higher levels than in the 2010s due to lower costs and ease of access.
Although brand still matters, brand alone won’t ensure retention as investors are more willing than ever to change providers in search of lower cost, better service, solution breadth, and greater transparency.
35
Broad Trends
AppendixThemes Shaping the Next Decade of Investing (1 of 3)
Charles Schwab Corporation

36
ClientViews
Clients will no longer accept compromises or trade-offs. Their core expectations include omni-channel service, availability of live interactions, digital solutions, great value, and financial stability from their providers.
Client service expectations are formed by experiences often outside the investment industry – they expect service in the unique channel they want to engage in at that moment, that meets their needs, while respecting their time and offering ease of use.
Although investment performance matters, the concept of “beating the market” has largely given way to a client focus on achieving investment goals via financial planning, asset allocation, tax efficiency, and low-cost investing.
Personalized investing that reflects each investor’s unique situation, values, and aspirations will become the norm –driven by technology, direct indexing, thematic investing, interest in ESG investing, and fractional share offerings.
Active trading is an important investment strategy for many investors. These investors expect access to quality platforms, value-added insights, great pricing, and strong risk management tools.
As a result of corporate fiduciary risks, 401(k) plan sponsors will grow ever more fee conscious while their paternalistic drive will ensure they look for ways to deliver more personalized advice and broader financial wellnessto their employees.
AppendixThemes Shaping the Next Decade of Investing (2 of 3)
Charles Schwab Corporation

37
CompetitiveLandscape
Scale will play an increasingly large role in determining the “winners”, as costs related to digital capabilities, omni-channel service, cyber security, compliance, and regulatory oversight challenge the operational efficiency of sub-scale firms.
Investors will consider consolidation for convenience or preferential pricing/service, resulting in market share gains for firms with scale and broad capabilities.
Large banks will compete aggressively for wealth management clients, increasingly utilizing balance sheet productsas relationship levers.
Firms offering world class relationships, live and digital advice and service, and great value will gain market share.
Independent registered investment advisors will continue to grow faster than the industry overall due to an acceleration of brokers turning independent and affluent consumers’ expectations for transparency and a fiduciary standard experience.
Fiduciary standard advice, fee transparency, and downward pressure on advisory fees will become “cost of entry”and represent an increasing challenge to traditional brokerage firms’ growth and retention of their top brokers.
AppendixThemes Shaping the Next Decade of Investing (3 of 3)
Charles Schwab Corporation
Charles Schwab Corporation 38
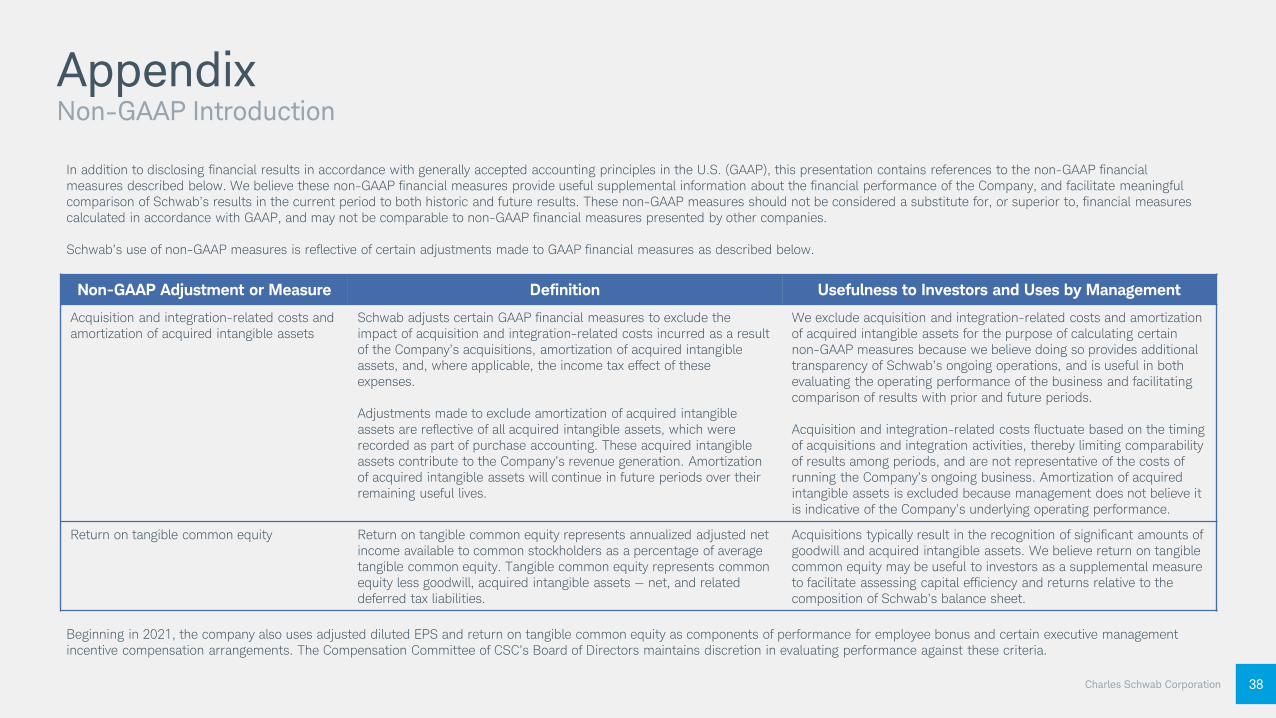
AppendixNon-GAAP Introduction
In addition to disclosing financial results in accordance with generally accepted accounting principles in the U.S. (GAAP), this presentation contains references to the non-GAAP financial measures described below. We believe these non-GAAP financial measures provide useful supplemental information about the financial performance of the Company, and facilitate meaningful comparison of Schwab’s results in the current period to both historic and future results. These non-GAAP measures should not be considered a substitute for, or superior to, financial measures calculated in accordance with GAAP, and may not be comparable to non-GAAP financial measures presented by other companies.
Schwab’s use of non-GAAP measures is reflective of certain adjustments made to GAAP financial measures as described below.
Non-GAAP Adjustment or Measure Definition Usefulness to Investors and Uses by Management
Acquisition and integration-related costs and amortization of acquired intangible assets
Schwab adjusts certain GAAP financial measures to exclude the impact of acquisition and integration-related costs incurred as a result of the Company’s acquisitions, amortization of acquired intangible assets, and, where applicable, the income tax effect of these expenses.
Adjustments made to exclude amortization of acquired intangible assets are reflective of all acquired intangible assets, which were recorded as part of purchase accounting. These acquired intangible assets contribute to the Company’s revenue generation. Amortization of acquired intangible assets will continue in future periods over their remaining useful lives.
We exclude acquisition and integration-related costs and amortization of acquired intangible assets for the purpose of calculating certain non-GAAP measures because we believe doing so provides additional transparency of Schwab’s ongoing operations, and is useful in both evaluating the operating performance of the business and facilitating comparison of results with prior and future periods.
Acquisition and integration-related costs fluctuate based on the timing of acquisitions and integration activities, thereby limiting comparability of results among periods, and are not representative of the costs of running the Company’s ongoing business. Amortization of acquired intangible assets is excluded because management does not believe it is indicative of the Company’s underlying operating performance.
Return on tangible common equity Return on tangible common equity represents annualized adjusted net income available to common stockholders as a percentage of average tangible common equity. Tangible common equity represents common equity less goodwill, acquired intangible assets — net, and related deferred tax liabilities.
Acquisitions typically result in the recognition of significant amounts of goodwill and acquired intangible assets. We believe return on tangible common equity may be useful to investors as a supplemental measure to facilitate assessing capital efficiency and returns relative to the composition of Schwab’s balance sheet.
Beginning in 2021, the company also uses adjusted diluted EPS and return on tangible common equity as components of performance for employee bonus and certain executive management incentive compensation arrangements. The Compensation Committee of CSC’s Board of Directors maintains discretion in evaluating performance against these criteria.

Charles Schwab Corporation 39
AppendixNon-GAAP Reconciliation: Adjusted total expenses and Adjusted net income
Note: N/A = Not applicable. 1. Acquisition and integration-related expenses are primarily included in compensation and benefits, professional services, occupancy and equipment, and other expense. 2. The income tax effect of the non-GAAP adjustments is determined using an effective tax rate reflecting the exclusion of non-deductible acquisition costs and is used to present the acquisition and integration-related costs and amortization of acquired intangible assets on an after-tax basis.
Three Months Ended,
June 30, 2021 March 31, 2021 June 30, 2020 March 31, 2020
Total Expenses Excluding Interest Net Income
Total Expenses Excluding Interest Net Income
Total Expenses Excluding Interest Net Income
Total Expenses Excluding Interest Net Income
Total expenses excluding interest (GAAP), Net income (GAAP) $ 2,808 $ 1,265 $ 2,755 $ 1,484 $ 1,562 $ 671 $ 1,570 $ 795
Acquisition and integration-related costs (1) (144) 144 (119) 119 (81) 81 (37) 37
Amortization of acquired intangible assets (154) 154 (154) 154 (12) 12 (6) 6
Income tax effects (2) N/A (80) N/A (67) N/A (22) N/A (11)
Adjusted total expenses (Non-GAAP), Adjusted net income (Non-GAAP) $ 2,510 $ 1,483 $ 2,482 $ 1,690 $ 1,469 $ 742 $ 1,527 $ 827
Charles Schwab Corporation 40
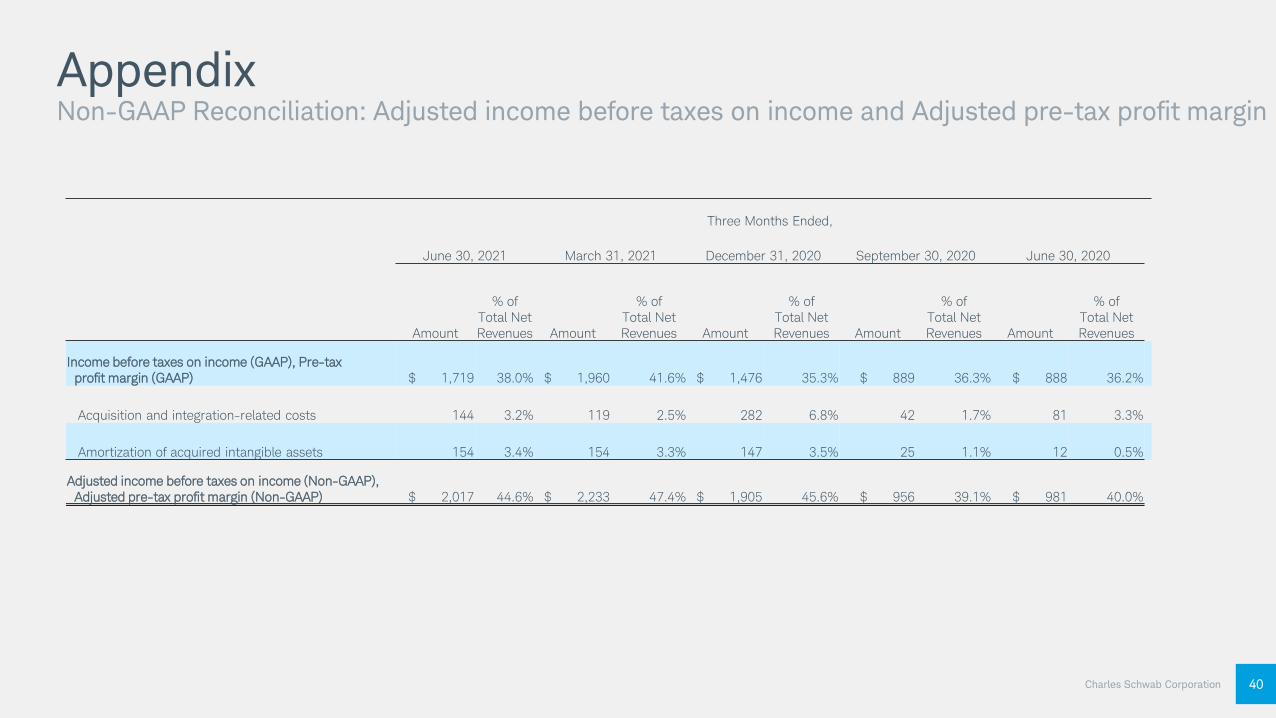
AppendixNon-GAAP Reconciliation: Adjusted income before taxes on income and Adjusted pre-tax profit margin
Three Months Ended,
June 30, 2021 March 31, 2021 December 31, 2020 September 30, 2020 June 30, 2020
Amount
% of Total Net Revenues Amount
% of Total Net Revenues Amount
% of Total Net Revenues Amount
% of Total Net Revenues Amount
% of Total Net Revenues
Income before taxes on income (GAAP), Pre-tax profit margin (GAAP) $ 1,719 38.0% $ 1,960 41.6% $ 1,476 35.3% $ 889 36.3% $ 888 36.2%
Acquisition and integration-related costs 144 3.2% 119 2.5% 282 6.8% 42 1.7% 81 3.3%
Amortization of acquired intangible assets 154 3.4% 154 3.3% 147 3.5% 25 1.1% 12 0.5%
Adjusted income before taxes on income (Non-GAAP), Adjusted pre-tax profit margin (Non-GAAP) $ 2,017 44.6% $ 2,233 47.4% $ 1,905 45.6% $ 956 39.1% $ 981 40.0%

Charles Schwab Corporation 41
AppendixNon-GAAP Reconciliation: Adjusted net income to common stockholders and Adjusted diluted EPS
Three Months Ended,
June 30, 2021 March 31, 2021 December 31, 2020 September 30, 2020 June 30, 2020
Amount Diluted EPS AmountDiluted
EPS AmountDiluted
EPS AmountDiluted
EPS AmountDiluted
EPS
Net income available to common stockholders (GAAP), Earnings per common share — diluted (GAAP) $ 1,117 $ .59 $ 1,388 $ .73 $ 1,050 $ .57 $ 615 $ .48 $ 621 $ .48
Acquisition and integration-related costs 144 .08 119 .06 282 .15 42 .03 81 .07
Amortization of acquired intangible assets 154 .08 154 .08 147 .08 25 .02 12 .01
Income tax effects (80) (.05) (67) (.03) (105) (.06) (16) (.02) (22) (.02)
Adjusted net income available to common stockholders (Non-GAAP), Adjusted diluted EPS (Non-GAAP) $ 1,335 $ .70 $ 1,594 $ .84 $ 1,374 $ .74 $ 666 $ .51 $ 692 $ .54

Charles Schwab Corporation 42
AppendixNon-GAAP Reconciliation: Return on average tangible common stockholders’ equity
Three Months Ended
June 30, 2021 March 31, 2021 December 31, 2020 September 30, 2020 June 30, 2020
Return on average common stockholders' equity (GAAP) 10% 12% 11% 10% 10%
Average common stockholders' equity $ 46,276 $ 46,691 $ 37,198 $ 25,810 $ 24,515
Less: Average goodwill (11,952) (11,952) (6,845) (1,735) (1,480)
Less: Average acquired intangible assets — net (9,762) (9,915) (5,624) (1,268) (700)
Plus: Average deferred tax liabilities related to goodwill and acquiredintangible assets — net 1,907 1,935 1,005 67 67
Average tangible common equity $ 26,469 $ 26,759 $ 25,734 $ 22,874 $ 22,402
Adjusted net income available to common stockholders1 $ 1,335 $ 1,594 $ 1,374 $ 666 $ 692
Return on tangible common equity (Non-GAAP) 20% 24% 21% 12% 12%
Note: 1. See table on slide 41 for the reconciliation of net income available to common stockholders to adjusted net income available to common stockholders (non-GAAP).

Summer Business Update
July 22, 2021
Charles Schwab Corporation


