726
| Date post: | 26-Dec-2015 |
| Category: |
Documents |
| Upload: | adi-buzea |
| View: | 7,235 times |
| Download: | 2,165 times |


ii
Introduction GENERAL NAVIGATION
© Oxford Aviation Academy (UK) Limited 2008All Rights Reserved
This text book is to be used only for the purpose of private study by individuals and may not be reproduced in any form or medium, copied, stored in a retrieval system, lent, hired, rented, transmitted or adapted in whole or in part without the prior written consent of Oxford Aviation Academy.
Copyright in all documents and materials bound within these covers or attached hereto, excluding that material which is reproduced by the kind permission of third parties and acknowledged as such, belongs exclusively to Oxford Aviation Academy.
Certain copyright material is reproduced with the permission of the International Civil Aviation Organisation, the United Kingdom Civil Aviation Authority and the European Aviation Safety Agency (EASA).
This text book has been written and published as a reference work to assist students enrolled on an approved EASA Air Transport Pilot Licence (ATPL) course to prepare themselves for the EASA ATPL theoretical knowledge examinations. Nothing in the content of this book is to be interpreted as constituting instruction or advice relating to practical flying.
Whilst every effort has been made to ensure the accuracy of the information contained within this book, neither Oxford Aviation Academy nor the distributor gives any warranty as to its accuracy or otherwise. Students preparing for the EASA ATPL theoretical knowledge examinations should not regard this book as a substitute for the EASA ATPL theoretical knowledge training syllabus published in the current edition of ‘CS-FCL 1 Flight Crew Licensing (Aeroplanes)’ (the Syllabus). The Syllabus constitutes the sole authoritative definition of the subject matter to be studied in an EASA ATPL theoretical knowledge training programme. No student should prepare for, or is currently entitled to enter himself/herself for the EASA ATPL theoretical knowledge examinations without first being enrolled in a training school which has been granted approval by an EASA authorised national aviation authority to deliver EASA ATPL training.
Oxford Aviation Academy excludes all liability for any loss or damage incurred or suffered as a result of any reliance on all or part of this book except for any liability for death or personal injury resulting from Oxford Aviation Academy’s negligence or any other liability which may not legally be excluded.
Cover Photograph: Boeing 777 - 200 cockpit display
Photographed by Bailey, for www.airteamimages.com
This edition distributed by Transair (UK) Ltd, Shoreham, England: 2008Printed in Singapore by KHL Printing Co. Pte Ltd

iii
IntroductionGENERAL NAVIGATION
Textbook Series
Book Title EASA Ref. No. Subject
1 010 Air Law 010
2 020 Aircraft General Knowledge 1 021 01 Airframes & Systems
021 01 01-04 Fuselage, Wings & Stabilising Surfaces021 01 05 Landing Gear021 01 06 Flight Controls021 01 07 Hydraulics021 01 08-09 Air Systems & Air Conditioning021 01 10 Anti-icing & De-icing021 01 11 Fuel Systems021 04 00 Emergency Equipment
3 020 Aircraft General Knowledge 2 021 02 Electrics – Electronics
021 02 01 Direct Current021 02 02 Alternating Current021 02 05 Basic Radio Propagation.
4 020 Aircraft General Knowledge 3 021 00 Powerplant
021 03 01 Piston Engines021 03 02 Gas Turbines
5 020 Aircraft General Knowledge 4 022 Instrumentation
022 01 Flight Instruments022 03 Warning & Recording022 02 Automatic Flight Control022 04 Power Plant & System Monitoring Instruments
6 030 Flight Performance & Planning 1 031 Mass & Balance032 Performance
7 030 Flight Performance & Planning 2 033 Flight Planning & Monitoring
8 040 Human Performance & Limitations 040
9 050 Meteorology 050
10 060 Navigation 1 061 General Navigation
11 060 Navigation 2 062 Radio Navigation
12 070 Operational Procedures 070
13 080 Principles of Flight 080
14 090 Communications 091 VFR Communications092 IFR Communications

iv
Introduction GENERAL NAVIGATION
v
IntroductionGENERAL NAVIGATION
Contents
DIRECTION, LATITUDE and LONGITUDE . . . . . . . . . . . . . . . . . . . . . . . . . 1
GREAT CIRCLES, RHUMB LINES and DIRECTIONS ON THE EARTH . . . . . . . . 19
EARTH MAGNETISM. . . . . . . . . . . . . . . . . . . . . . . . . . . . . . . . . . . . . 41
THE NAVIGATION COMPUTER - SLIDE RULE FACE. . . . . . . . . . . . . . . . . . 67
THE NAVIGATION COMPUTER - DISTANCE, SPEED, TIME and CONVERSIONS 83
THE NAVIGATION COMPUTER - TAS and ALTITUDE CONVERSIONS . . . . . . .103
THE NAVIGATION COMPUTER - TRIANGLE OF VELOCITIES . . . . . . . . . . . .123
THE NAVIGATION COMPUTER - WIND FINDING and CALCULATION of HEADING 137
THE NAVIGATION COMPUTER - MULTI-DRIFT WINDS and WIND COMPONENTS 171
THE 1 IN 60 RULE . . . . . . . . . . . . . . . . . . . . . . . . . . . . . . . . . . . . . . .191
NAVIGATION USING THE 1 IN 60 RULE . . . . . . . . . . . . . . . . . . . . . . . . .201
OTHER APPLICATIONS OF THE 1 IN 60 RULE. . . . . . . . . . . . . . . . . . . . . .213
TOPOGRAPHICAL MAPS AND MAP READING. . . . . . . . . . . . . . . . . . . . .223
CONVERGENCY AND CONVERSION ANGLE. . . . . . . . . . . . . . . . . . . . . .241
DEPARTURE . . . . . . . . . . . . . . . . . . . . . . . . . . . . . . . . . . . . . . . . . .263
SCALE . . . . . . . . . . . . . . . . . . . . . . . . . . . . . . . . . . . . . . . . . . . . . .275
GENERAL CHART PROPERTIES . . . . . . . . . . . . . . . . . . . . . . . . . . . . . .283
MERCATOR CHARTS - PROPERTIES . . . . . . . . . . . . . . . . . . . . . . . . . . .295
MERCATOR CHARTS - SCALE . . . . . . . . . . . . . . . . . . . . . . . . . . . . . . .311
MERCATOR CHARTS - PLOTTING . . . . . . . . . . . . . . . . . . . . . . . . . . . . .323
LAMBERT’S CONFORMAL CHART . . . . . . . . . . . . . . . . . . . . . . . . . . . .339
LAMBERT’S CONFORMAL CHART - 2 . . . . . . . . . . . . . . . . . . . . . . . . . .353
MID COURSE TEST . . . . . . . . . . . . . . . . . . . . . . . . . . . . . . . . . . . . . .367
THE POLAR STEREOGRAPHIC CHART. . . . . . . . . . . . . . . . . . . . . . . . . .381
TRANSVERSE AND OBLIQUE MERCATOR CHARTS . . . . . . . . . . . . . . . . . .393
TIME (1) . . . . . . . . . . . . . . . . . . . . . . . . . . . . . . . . . . . . . . . . . . . . .407
TIME (2) . . . . . . . . . . . . . . . . . . . . . . . . . . . . . . . . . . . . . . . . . . . . .421
TIME (3) . . . . . . . . . . . . . . . . . . . . . . . . . . . . . . . . . . . . . . . . . . . . .449
CRITICAL POINT (CP) and POINT OF NO RETURN (PNR) . . . . . . . . . . . . . .483
GRIDDED CHARTS . . . . . . . . . . . . . . . . . . . . . . . . . . . . . . . . . . . . . .493
PLOTTING . . . . . . . . . . . . . . . . . . . . . . . . . . . . . . . . . . . . . . . . . . .517
THE DIRECT INDICATING COMPASS . . . . . . . . . . . . . . . . . . . . . . . . . . .533
REMOTE INDICATING MAGNETIC COMPASS . . . . . . . . . . . . . . . . . . . . .553
AIRCRAFT MAGNETISM . . . . . . . . . . . . . . . . . . . . . . . . . . . . . . . . . .571
Continued . . . . . . . . . .

vi
Introduction GENERAL NAVIGATION
INERTIAL NAVIGATION SYSTEM . . . . . . . . . . . . . . . . . . . . . . . . . . . . .583
INERTIAL REFERENCE SYSTEM . . . . . . . . . . . . . . . . . . . . . . . . . . . . . .609
FLIGHT MANAGEMENT SYSTEM . . . . . . . . . . . . . . . . . . . . . . . . . . . . .617
GENERAL NAVIGATION PROBLEMS . . . . . . . . . . . . . . . . . . . . . . . . . . .627
REVISION QUESTIONS. . . . . . . . . . . . . . . . . . . . . . . . . . . . . . . . . . . .635
Contents Continued

1
Chapter 1Direction, Latitude and Longitude
CHAPTER ONE
DIRECTION, LATITUDE and LONGITUDE
Contents
THE SHAPE OF THE EARTH . . . . . . . . . . . . . . . . . . . . . . . . . . . . . . . . . 3
GEODOSY AND GEOID MODELS . . . . . . . . . . . . . . . . . . . . . . . . . . . . . . 3
THE POLES . . . . . . . . . . . . . . . . . . . . . . . . . . . . . . . . . . . . . . . . . . . . 4
BASIC DIRECTION ON THE EARTH . . . . . . . . . . . . . . . . . . . . . . . . . . . . . 4
SEXAGESIMAL SYSTEM / TRUE DIRECTION . . . . . . . . . . . . . . . . . . . . . . . 5
POSITION REFERENCE SYSTEMS . . . . . . . . . . . . . . . . . . . . . . . . . . . . . . 7
CIRCLES ON THE EARTH . . . . . . . . . . . . . . . . . . . . . . . . . . . . . . . . . . . 7
The EQUATOR . . . . . . . . . . . . . . . . . . . . . . . . . . . . . . . . . . . . . . . . . . 8
The MERIDIANS . . . . . . . . . . . . . . . . . . . . . . . . . . . . . . . . . . . . . . . . . 8
The PRIME (OR GREENWICH) MERIDIAN . . . . . . . . . . . . . . . . . . . . . . . . . 8
SMALL CIRCLE . . . . . . . . . . . . . . . . . . . . . . . . . . . . . . . . . . . . . . . . . 8
PARALLELS OF LATITUDE . . . . . . . . . . . . . . . . . . . . . . . . . . . . . . . . . . 8
GRATICULE . . . . . . . . . . . . . . . . . . . . . . . . . . . . . . . . . . . . . . . . . . . 8
LATITUDE . . . . . . . . . . . . . . . . . . . . . . . . . . . . . . . . . . . . . . . . . . . . 9
GEOCENTRIC AND GEODETIC LATITUDE . . . . . . . . . . . . . . . . . . . . . . . 10
SPECIAL CASES OF PARALLELS OF LATITUDE. . . . . . . . . . . . . . . . . . . . . 11
LONGITUDE . . . . . . . . . . . . . . . . . . . . . . . . . . . . . . . . . . . . . . . . . . 12
REVERSAL OF THE APPARENT SENSE OF LONGITUDE . . . . . . . . . . . . . . . 12
AT THE GREENWICH ANTI-MERIDIAN (180 °E /W) . . . . . . . . . . . . . . . . . . 12
DIFFERENCE IN PRINCIPLE BETWEEN LATITUDE AND LONGITUDE. . . . . . . 13
POSITIONS IN LATITUDE AND LONGITUDE . . . . . . . . . . . . . . . . . . . . . . 13
CONVERSION OF LATITUDE AND LONGITUDE TO DISTANCE ON THE EARTH 13
RESOLUTION ACCURACY USING LATITUDE AND LONGITUDE . . . . . . . . . . 14
GREAT CIRCLE VERTICES. . . . . . . . . . . . . . . . . . . . . . . . . . . . . . . . . . 15
QUESTIONS . . . . . . . . . . . . . . . . . . . . . . . . . . . . . . . . . . . . . . . . . . 17
ANSWERS . . . . . . . . . . . . . . . . . . . . . . . . . . . . . . . . . . . . . . . . . . . 18

2
Chapter 1 Direction, Latitude and Longitude
3
Chapter 1Direction, Latitude and Longitude
THE SHAPE OF THE EARTH
The simple view of the shape of the Earth is that it is a sphere, and this is nearly true. In fact, the Earth’s shape is commonly described as an oblate spheroid, that is, a sphere which is slightly flattened at its poles. This shape developed when the Earth formed from a gas-cloud as the spin of the cloud caused higher centrifugal forces at the equatorial region than in regions nearer the poles. The flattening is called compression and in the case of the Earth is approximately 0.3% (1/300th). More simply put, the Earth’s polar diameter is 27 statute miles (or 23 nautical miles or 43 km) less than its equatorial diameter. Recent satellite surveys of the earth have also shown it to be slightly pear-shaped with its maximum diameter occurring South of the equator. This southern hemisphere distortion is considerably less than the compression distortion and is measured in tens of metres rather than kilometres.
If the Earth were perfectly spherical, then its cross-section would be a circle. Mathematicians could deal with that quite easily in producing the equations necessary to produce map projections. If the compression were completely symmetrical, then the cross-section would be a perfect ellipse, which would also not be too mathematically complicated.
However, the Earth is not quite either of these, and so the only word to describe it is “Earth-shaped”. This is what the word geoid (of Greek origin) means.
GEODOSY AND GEOID MODELS
A number of different agencies have measured and modeled the Earth (and produced the equations to define their geoids). Each agency has tended to optimise its geoid to give the best fit to the actual shape of the Earth over the area in which it is interested in mapping. This may mean that the geoid does not fit the actual Earth in another part of the world. For example, the UK Ordnance Survey uses a geoid based on a survey of 1936 (OS36), France has tended to use the Nouvelle Triangulation de France (NTF) 1970 model, some other European countries use the European Datum 1950 model (ED50), and the USA uses the World Geodetic System 1984 (WGS 84).
Use of different geoids can result in arriving at different values for defining latitude and longitude. There can be differences of up to the order of 200 metres for positions on the extremities of the European ED50 and the UK OS36. This may not sound much to an airline pilot - though it would to the programmer of a cruise missile which was guided to latitude and longitude coordinates! Until recently, these differences have not been considered significant, but two recent developments, however, have changed this. These are the arrival of the Global Positioning System (GPS) and the widespread use of Flight Managements Systems (FMS).
GPS is an electronic navigation system in which aircraft receivers compare signals from several of the 24 transmitters in the satellites which make up the GPS constellation. It can be received over the whole globe and its accuracy is of the order of tens of metres. The system accuracy is such that the differences in geoids becomes significant, and the system has world-wide application. The US government adopted WGS 84 for GPS.
FMS compares the output of Inertial Reference Systems (IRS) with positions derived from range information received from Distance Measuring Equipment (DME). The positions of the DME stations are stored in latitude and longitude held in the data base of the FMS computer. DME is a very accurate system and any inaccuracy in the datum positions would degrade the position calculation of FMS. If the data base held the positions of all the UK DMEs in OS36 and the French DMEs in NTF70, it could cause large discontinuities in the calculation of FMS position as the aircraft crossed the English Channel.
4
Chapter 1 Direction, Latitude and Longitude
For these reasons, ICAO has adopted WGS 84 as the world standard.
In modern navigation systems, position information is corrected for the distortions of the Earth’s shape automatically in the navigation computers.
For any calculations that you may be required to do for the JAA examination syllabus, the Earth may be considered to be a true sphere.
THE POLES
The Poles are defined as the extremities of the axis about which the Earth spins. The axis of the Poles is inclined to the axis of the Earth’s orbit around the Sun at an angle of 23½°. This topic will be covered more fully in the chapter on “Time”. However, in this chapter the polar axis will be drawn upright.
BASIC DIRECTION ON THE EARTH
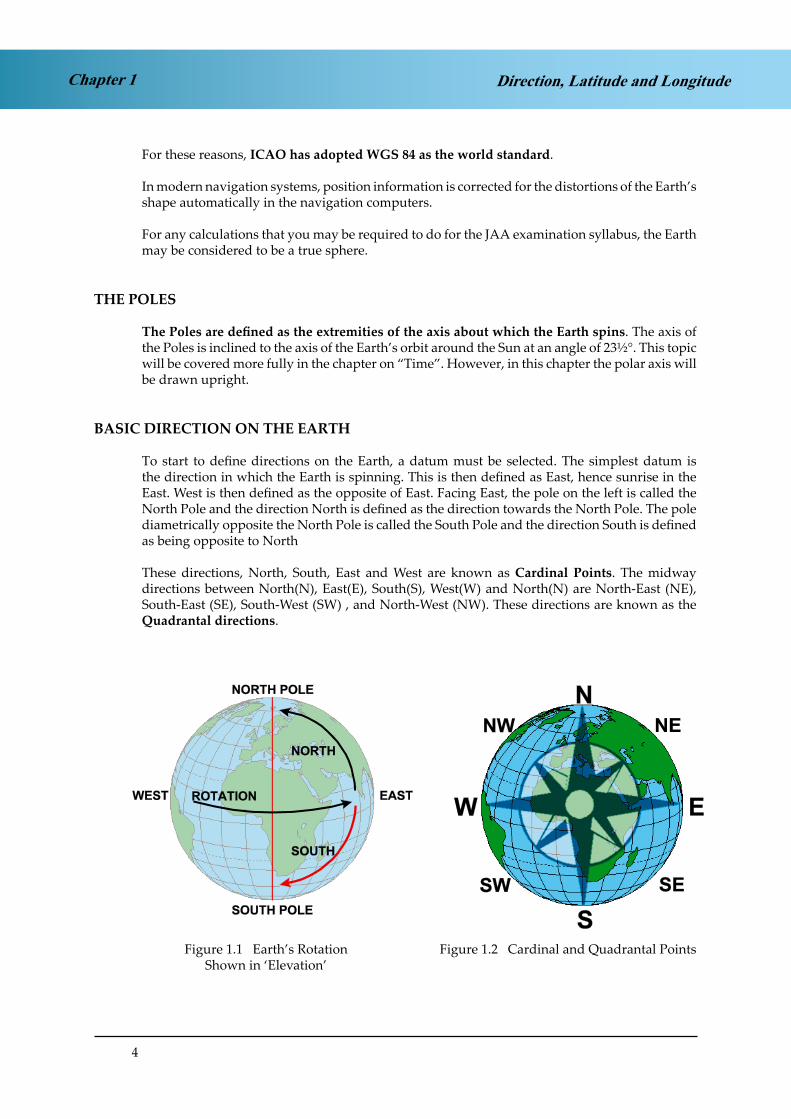
To start to define directions on the Earth, a datum must be selected. The simplest datum is the direction in which the Earth is spinning. This is then defined as East, hence sunrise in the East. West is then defined as the opposite of East. Facing East, the pole on the left is called the North Pole and the direction North is defined as the direction towards the North Pole. The pole diametrically opposite the North Pole is called the South Pole and the direction South is defined as being opposite to North
These directions, North, South, East and West are known as Cardinal Points. The midway directions between North(N), East(E), South(S), West(W) and North(N) are North-East (NE), South-East (SE), South-West (SW) , and North-West (NW). These directions are known as the Quadrantal directions.
Figure 1.1 Earth’s Rotation Shown in‘Elevation’
Figure 1.2 Cardinal and QuadrantalPoints
Figure 1.1 Earth’s Rotation Figure 1.2 Cardinal and Quadrantal Points Shown in ‘Elevation’

5
Chapter 1Direction, Latitude and Longitude
To solve navigation problems, the student may occasionally need to consider the Earth when viewed from above either the North Pole or the South Pole. When viewed from above the North Pole, the Earth appears to rotate in an anti-clockwise (counter- clockwise) direction. When viewed from above the South Pole, the Earth appears to rotate in a clockwise direction.
Figure 1.3 Earth’s Rotation ‘PlanView.’
Figure 1.4Figure 1.3 Earth’s Rotation ‘Plan View’ Figure 1.4
The system of Cardinal and Quadrantal directions was widely used in maritime navigation. Further sub-divisions were made to give more precision but the system is too cumbersome and does not allow for the precise definition of direction required in air navigation. To achieve the required precision, air navigation terminology retains the cardinal points as a reference but uses the Sexagesimal system for measuring directions.
SEXAGESIMAL SYSTEM / TRUE DIRECTION
The Sexagesimal system utilises the fact that a clockwise rotation of direction from North through East, South and West and back to North is a circle of 360 degrees. If North is defined as 000°, East becomes 090°, South becomes 180° and West becomes 270°. Finally, continuing the rotation back to North makes North 360°. In practice, the use of 000° or 360° for North is a personal choice (but a northerly runway would be labelled ‘36’).
6
Chapter 1 Direction, Latitude and Longitude
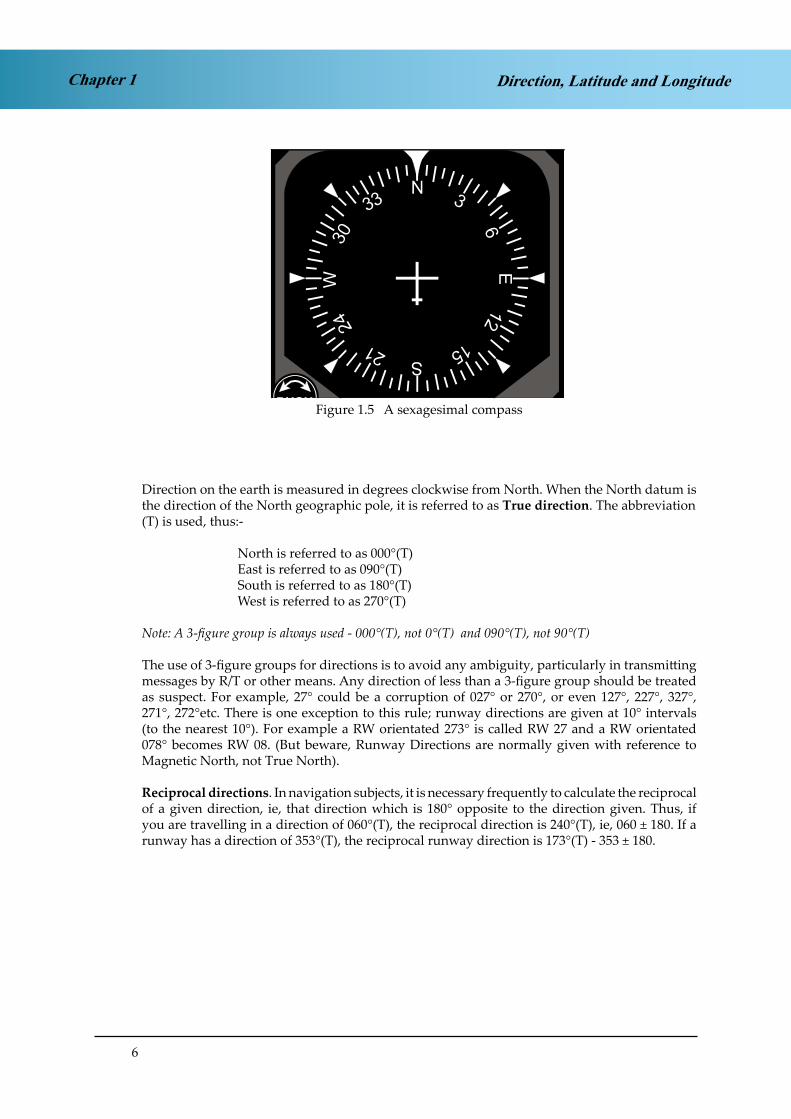
Fig 1.5 A sexagesimal compass
Figure 1.5 A sexagesimal compass
Direction on the earth is measured in degrees clockwise from North. When the North datum is the direction of the North geographic pole, it is referred to as True direction. The abbreviation(T) is used, thus:-
North is referred to as 000°(T) East is referred to as 090°(T) South is referred to as 180°(T) West is referred to as 270°(T)
Note: A 3-figure group is always used - 000°(T), not 0°(T) and 090°(T), not 90°(T)
The use of 3-figure groups for directions is to avoid any ambiguity, particularly in transmitting messages by R/T or other means. Any direction of less than a 3-figure group should be treated as suspect. For example, 27° could be a corruption of 027° or 270°, or even 127°, 227°, 327°, 271°, 272°etc. There is one exception to this rule; runway directions are given at 10° intervals (to the nearest 10°). For example a RW orientated 273° is called RW 27 and a RW orientated 078° becomes RW 08. (But beware, Runway Directions are normally given with reference to Magnetic North, not True North).
Reciprocal directions. In navigation subjects, it is necessary frequently to calculate the reciprocal of a given direction, ie, that direction which is 180° opposite to the direction given. Thus, if you are travelling in a direction of 060°(T), the reciprocal direction is 240°(T), ie, 060 ± 180. If a runway has a direction of 353°(T), the reciprocal runway direction is 173°(T) - 353 ± 180.

7
Chapter 1Direction, Latitude and Longitude
POSITION ON THE EARTHPOSITION REFERENCE SYSTEMS
Navigation is a fundamental process whereby an aircraft is directed from one position to another; it is therefore necessary to use a Position Reference System which defines position accurately and unambiguously on the Earth’s surface.
On a plane surface (such as graph paper), position can be defined accurately and unambiguously using Cartesian co-ordinates ±x and ±y from 2 mutually perpendicular axes, the X and Y axes. For instance, a Cartesian system is used for the UK National Grid System, eg, Ordnance Survey Landranger Maps.
The Cartesian system works well on a flat surface but must be modified to work on a spherical surface, i.e. the Earth. In practice, the linear co-ordinates x and y are replaced by angular co- ordinates known as Longitude and Latitude. The first requirement for this spherical system is to define the 2 mutually perpendicular axes (the equivalents of the X,Y axes). The definition and use of these axes involves circles on the Earth - Great Circles and Small Circles.
CIRCLES ON THE EARTH
Great Circle: A circle on the surface of the earth whose centre and radius are those of the earth itself is called a Great Circle. It is called ‘great’ because a disc cut through the earth in the plane of the Great Circle would have the largest area that can be achieved.
Figure 1.7 Great CircleFigure 1.7 Great Circle
The shortest distance between two points on the Earth’s surface is the shorter arc of theGreat Circle joining the two points.
Given two points on the Earth’s surface, there will be only one Great Circle joining them(unless the points are diametrically opposed).

8
Chapter 1 Direction, Latitude and Longitude
The EQUATOR
The Great Circle whose plane is at 90° to the axis of rotation of the earth (the polar axis) is called the Equator. It lies in an East-West direction and divides the earth equally into two hemispheres. For the definition of position on the Earth, the Equator is the datum for defining Latitude and is the equivalent of the X axis of the Cartesian system.
The MERIDIANS
Meridians are semi-Great circles joining the North and South poles. All meridians indicate True North-South direction. Every Great Circle passing through the poles forms a meridian and its Anti-meridian. The meridians cross the Equator at 90°.
The PRIME (OR GREENWICH) MERIDIAN
The meridian passing through Greenwich is known the Prime Meridian . The Prime Meridian is the datum for defining Longitude and is the equivalent of the Y axis of the Cartesian system.
SMALL CIRCLE
A circle on the surface of the earth whose centre and radius are not those of the earth is called a Small Circle. The main small circles of relevance to position are the Parallels of Latitude.
PARALLELS OF LATITUDE
The parallels of latitude are small circles on the surface of the earth whose planes are parallel to the Equator. They lie in an East-West direction. Their function is to indicate position North or South of the Equator.
GRATICULE
The network formed on a map or the surface of a globe by the Prime Meridian, the meridians, the Equator and the parallels of latitude is called the Graticule. The graticule is an analogy on the Earth’s surface of the X - Y grid on graph paper.

9
Chapter 1Direction, Latitude and Longitude
Figure 1.8. A Graticule on a Globe.Figure 1.8 A Graticule on a Globe
Using the graticule, the position of any point can be accurately and unambiguously defined. However, position is defined by angular measurement (degrees, minutes, and seconds of arc), not by distance, as on Cartesian co-ordinates. This is the foundation of the Latitude/ Longitude system.
Angular MeasurementsThe fundamental unit of angular measurement is the degree (°) which is defined as the angle subtended at the centre of a circle by an arc equal to the 360th part of the circumference (hence360° in a circle).
For more accuracy A degree is sub-divided into 60 minutes of arc (‘) A minute can be further sub-divided into 60 seconds of arc (“).
The above units are mainly used for angular measurement of position but for angular measurement of direction, it is more common to use degrees and decimals of degrees.
LATITUDE
The latitude of any point is the arc (angular distance) measured along the meridian through the point from the Equator to the point. It is expressed in degrees, minutes, and seconds of arc and is annotated North or South according to whether the point lies North or South of the Equator. In Figure 1.9, you are looking at the Earth ‘sideways on’ from space, ie, the N pole is at the top of the diagram. The angular distance between where the meridian of A crosses the Equator (point P) and point A is 40° and the latitude of point A is 40°N. (It can also be said that A lies on the Parallel of Latitude of 40°N).

10
Chapter 1 Direction, Latitude and Longitude
Figure 1.9 LatitudeFigure 1.9 Latitude On Figure 1.9, come in from the Equator to the centre of the Earth. Then, for a Northerly latitude of, say, 40°N, construct a line from the centre of the Earth with an elevation angle from the Equator of 40° (depression angle for Southerly latitudes). Where this line touches the surface of the Earth is the 40°N parallel of latitude.
The range of latitude values covers the Equator (0°N/S) to the geographic poles - the North Pole is 90°N and the South Pole is 90°S.
GEOCENTRIC AND GEODETIC LATITUDE
The definition of Latitude given above is based on the centre of the Earth, namely it is the smaller angle between the line joining the point to the centre of the Earth and the plane of the Equator. This is Geocentric Latitude. Because the Earth is actually an oblate spheroid, a different definition of Latitude can be used, namely, Geodetic (or Geographic) Latitude. Geodetic (or Geographic) Latitude is the smaller angle between the normal (90°) to the meridian at the point on the spheroid and the plane of the equator. This normal line does not necessarily pass through the centre of the spheroid as illustrated in the diagram below. Note that the shapes used in the diagram are exaggerated for illustration purposes and the real spheroid is much closer to a sphere than shown. The latitudes plotted on navigation charts are Geodetic Latitudes. The maximum difference between Geocentric and Geodetic Latitudes occurs at approx 45° N/S and is about 11.6 minutes of arc.

11
Chapter 1Direction, Latitude and Longitude
Figure 1.10 Geodetic and Geocentric LatitudeFigure 1.10 Geodetic and Geocentric Latitude
SPECIAL CASES OF PARALLELS OF LATITUDE
There are several ‘special’ cases of the parallels of latitude (other than the Equator) which will be explained in the Chapter on “Time”. These relate to the seasons and the periods of day and night throughout the year. Briefly these are:
Arctic Circle the parallel of 66½°N (note that 66½° is value of the Earth’s tilt)
Antarctic Circle the parallel of 66½°S
Tropic of Cancer the parallel of 23½°N (the sun is overhead the Tropic of Cancer on mid-summers day in the
Northern hemisphere)
Tropic of Capricorn the parallel of 23½°S (the sun is overhead the Tropic of Capricorn on mid- winters day in the
Northern hemisphere)

12
Chapter 1 Direction, Latitude and Longitude
LONGITUDE
The longitude of any point is the shorter distance in the arc along the Equator between the Prime Meridian and the meridian through the point. Longitude is measured in degrees and minutes of arc and is annotated East (E) or West (W) depending whether the point lies East or West of the Prime Meridian (Greenwich). In Figure 1.11, you are looking ‘down’ on the North Pole from a point out in space. The meridian of point B crosses the Equator (at point Q) at, say, 40°of arc to the East of the Prime Meridian. Point B is said to be at longitude 040°E.
Figure 1.11 LongitudeFigure 1.11 Longitude
Longitude can be measured up to 180°E or 180°W of the Prime Meridian. These 2 meridians are coincident and are known as the anti-Prime Meridian (APM), commonly labelled 180°E/W.
REVERSAL OF THE APPARENT SENSE OF LONGITUDEAT THE GREENWICH ANTI-MERIDIAN (180 °E /W)
Figure 1.12 Figure 1.13 Figure 1.1 Figure 1.13

13
Chapter 1Direction, Latitude and Longitude
On the Greenwich Meridian, the Eastern Longitudes are East of you. The Western Longitudes are West of you. But now travel round the globe to the 180°E /W longitude (the Greenwich anti- meridian). The direction of East has not changed. It is still 090°T, the direction of the Earth’s spin. Nor has the direction of West. It is still 270°T, the opposite direction to the Earth’s spin. But in Figure 1.13, the Eastern Longitudes are out to your left (West of you) and the Western Longitudes are out to the right of you (East of you). So you get a situation where the Eastern hemisphere to your West and the Western Hemisphere is to your East. It can cause confusion in solving some navigation problems.
DIFFERENCE IN PRINCIPLE BETWEEN LATITUDE AND LONGITUDE
These 2 angular co-ordinate systems are quite different in principle. Lines of latitude are all parallel to each other. Indeed, it is normal to talk of ‘parallels of latitude’. Lines of longitude, however, emanate from a point (the North Pole), reach a maximum separation at the Equator, and then converge back to a point again, at the South Pole.
You may find it a helpful illustration to think of latitude as like slicing a pineapple (parallels of latitude) whilst longitude is like segmenting an orange (meridians of longitude).
POSITIONS IN LATITUDE AND LONGITUDE
When giving a position in latitude and longitude, the latitude is always quoted first and the longitude second : thus New York’s position is 41°N 074°W. Alternative forms are: 41°00’N 074°00’W, or 4100N 07400W which are used to allow more precision by the inclusion of minutes of arc. For example, the Aerodrome Reference Point (ARP) for Oxford Airport is approximately 51°50’ N, 001°19’W or 5150N 00119W.
Even greater precision can be achieved by quoting position in seconds of arc although this is not normally required in these notes. For example, the precise position for the Oxford ARP is 51°50’12”N, 001°19’11”W or 515012N 0011911W.(As a point of interest, the ARP for Oxford is at the midpoint of R/W 02/20)
CONVERSION OF LATITUDE AND LONGITUDE TO DISTANCE ON THE EARTH
The definition of a nautical mile has been chosen to make it relate to angular arc on a Great Circle. It so happens that the mean radius of the Earth is approximately 20.9 million feet in length. This means that on a Great Circle, 1 minute of arc corresponds to a distance on the Earth’s surface of 6080 feet. This distance of 6080 feet is defined as 1 nautical mile.
Therefore you can relate angle along a Great Circle arc to distance on the Earth. For instance, all meridians (lines of longitude) are Great Circles, so the distance up or down a meridian (which is change of latitude) has this relationship. The difference in latitude between positions 5000N 00100W and 5005N 00100W is exactly 5 minutes, so they are exactly 5 nautical miles apart. This is true of differences in longitude only at the Equator, because the Equator is the only parallel of latitude which is also a Great Circle.

14
Chapter 1 Direction, Latitude and Longitude
RESOLUTION ACCURACY USING LATITUDE AND LONGITUDE
Suppose a position is quoted as 51°49’N, 001°19’W or 5149N 00119W. By writing 5149, we are making a declaration of the accuracy of the resolution we are interested in. We are saying that it is nearer to 5149 than 5148 or 5150. This means that we are quoting to the nearest 1 minute of latitude, which is an accuracy to the nearest one nautical mile. In longitude, if we write 00119W, we are also quoting to the nearest minute, but in this case, because at latitude 50N the meridians are closer together than at the Equator, we are quoting to about the nearest 0.6 of a nautical mile. To avoid this complication at this stage, in discussing resolution accuracy, we will consider latitude only.
There are 2 ways of quoting positions to a greater accuracy than the nearest whole minute. It can either be given as decimal minutes (5150.2N) or as degrees, minutes, seconds (DMS) (51°50’12”N). In decimal minutes, only the first decimal place is used. If we need greater accuracy than that, we go to DMS.
Normally, modern automatic navigation systems in which positions are entered by the pilot use decimal minutes. If a position is entered into an Inertial Navigation System, Inertial Reference System, Flight Management Computer, or Global Positioning System, it will be to the nearest decimal minute, ie, 5150.2 N. This is a statement that the position is nearer 5150.2 than 5150.3 or 5150.1. By quoting to decimal minutes, you are declaring an accuracy of 0.1 of a nautical mile, or 608 feet, or 185 metres.
However, where greater accuracy is required, on large-scale maps and charts, positions will be given in DMS, i.e. 515013N. In this case, we are declaring an accuracy of the nearest second, i.e. the position is nearer 515013 than 515014 or 515012. This is an accuracy of 1/60th of a minute, or about 101 feet or 30 metres. The Aerodrome Reference Point (ARP) for Oxford Airport, which is the midpoint of Runway 02/20, is quoted in the official CAA publication, the UK Aeronautical Information Package (AIP), as 515013N 0011912W.
Even greater accuracy can be achieved by use of decimals of a second. The first decimal place implies an accuracy of 1/10th of a second, which is 10 feet, or 3 metres, whilst the use of 2 decimal places of a second implies an accuracy of 1/100th of a second, i.e. 1 foot, or 30 centimetres. THE UK AIP quotes the position of the OX locator beacon, our low-powered homing beacon at Oxford as 514956.93N 0011923.66W, which is an overall accuracy, taking into account both latitude and longitude, of within 50 cms. This is perhaps a bit more accurate than we really need for a homing aid, but is an appropriate level of accuracy for a landing aid such as an ILS (Instrument Landing System) localiser. Accuracy at this level would certainly be needed for inspection and flight calibration of an ILS.
It says much for the flexibility of this system of position reference that, whilst for most of the time in flight we are interested in our position accuracy only to the nearest mile or so, and can simply write our position as 5150 N 00119W - a total of 11 fairly simple numbers or letters, we can also use the system to establish a position to within half a metre by writing 514956.93N 0011923.66W, which is really not too long-winded considering the level of accuracy achieved.

15
Chapter 1Direction, Latitude and Longitude
A summary of accuracy resolution is given the following table:
How Written Level of Accuracy Typical Application
5321 N 1 nm = 6080 feet En route navigation
5321.3 N 600 feet or 185 m INS, IRS, FMS, GPS displays
53°21’17”N 100 feet or 30 m Airfield diagram chart
53°21’17.3”N 10 feet or 3 metres Location of precision navaid (ILS)
53°21’17.32”N 1 foot or 30 cm Calibration of precision navaid
GREAT CIRCLE VERTICES
The northern vertex of a Great Circle is simply the most northerly point on that Great Circle. Similarly, the southern vertex is the most southerly point on the Great Circle. The vertices are antipodal and the Great Circle distance between them is 10,800 nm.
Figure 1.14Figure 1.14
The vertices lie on meridian and anti-meridian and have latitude values of equal value but of opposite sign. For example, if the southern vertex of a great circle is 63S170W, its northern vertex will be 63N 010E.

16
Chapter 1 Direction, Latitude and Longitude
At either of its vertices, the direction of the Great Circle will be East 090°(T)/West 270°(T). Knowing the co-ordinates of either vertex enables calculation of where and at what angle the Great Circle crosses the Equator.
A Great Circle will cross the Equator at the 2 points whose longitude is 90° removed from either of its vertices. Thus, a Great Circle with a north vertex at 50N 030W (and a south vertex at 50S 150E) will cross the Equator in positions120W and 060E.
A Great circle will cross the Equator at an angle equal to the latitude of its vertices. Thus a Great Circle with vertices at 50N/S will cross the equator at an angle of 50°. The direction of the Great Circle when it crosses the Equator will depend on whether travelling eastbound or westbound. In the Example above, travelling eastbound, the great circle first crosses the Equator at 060E in direction 140°(T) (090 + 50) travelling towards the Southern vertex.
Having passed the southern vertex, the Great circle next crosses the Equator at 120W in direction 040°(T) (090 - 50) travelling back to the north vertex. Westbound travel would have the same crossing points but reciprocal directions.
Two special cases:
A great circle with vertices at 90 N/S (a meridian) crosses the equator at 90° in direction 180°(T) (090 + 90) or 000°(T) (090-90).
A great circle with vertices at 0 N/S crosses the Equator at 0°(T) (it is the Equator) and has direction 090°(T) or 270°(T).

17
Chapter 1Direction, Latitude and Longitude
QUESTIONS
1. What is the approximate compression of the Earth?
a. 3%b. 0.03%c. 0.3%d. 1/3000
2. A Graticule is the name given to:-
a. A series of lines drawn on a chartb. A series of Latitude and Longitude lines drawn on a chart or mapc. A selection of small circles as you get nearer to either pole
3. A great circle has its North vertex at 70N 130E. What is the position of its South vertex?
4. In Question 3, at what longitudes and in what direction would the Great Circle cross the Equator assuming :
a. Initial direction is East from the Northern Vertex?
b. Initial direction is West from the Northern Vertex?
5. Given that the compression value of the Earth is 1/297 and that the semi-major axis of the Earth, measured at the axis of the Equator is 6378.4 km, what is the semi-major axis of the Earth measured at the axis of the Poles?
a. 6399.9 kmb. 6356.9 kmc. 6378.4 kmd. 6367.0 km

18
Direction, Latitude and LongitudeChapter 1
ANSWERS
1 C
2 B
3 70S 050W
4a 140W 160°(T)
4b 040E 200°(T)
5 B
19
Chapter 2Great Circles, Rhumb Lines &Directions on the Earth
CHAPTER TWO
GREAT CIRCLES, RHUMB LINES and DIRECTIONS ON THE EARTH
Contents
A REMINDER ABOUT GREAT CIRCLES . . . . . . . . . . . . . . . . . . . . . . . . . . 21
THE RHUMB LINE . . . . . . . . . . . . . . . . . . . . . . . . . . . . . . . . . . . . . . 22
LINES WHICH ARE BOTH GREAT CIRCLES AND RHUMB LINES . . . . . . . . . . 26
GREAT CIRCLE DIRECTION . . . . . . . . . . . . . . . . . . . . . . . . . . . . . . . . 26
DISTANCE ON THE EARTH . . . . . . . . . . . . . . . . . . . . . . . . . . . . . . . . . 28
VARIATIONS IN THE LENGTH OF A NAUTICAL MILE . . . . . . . . . . . . . . . . 30
CONVERSION FACTORS. . . . . . . . . . . . . . . . . . . . . . . . . . . . . . . . . . . 30
GREAT CIRCLE DISTANCES. . . . . . . . . . . . . . . . . . . . . . . . . . . . . . . . . 30
QUESTIONS . . . . . . . . . . . . . . . . . . . . . . . . . . . . . . . . . . . . . . . . . . 37
ANSWERS . . . . . . . . . . . . . . . . . . . . . . . . . . . . . . . . . . . . . . . . . . . 40

20
Chapter 2 Great Circles, Rhumb Lines &Directions on the Earth

21
Chapter 2Great Circles, Rhumb Lines &Directions on the Earth
A REMINDER ABOUT GREAT CIRCLES
Great Circle: A circle on the surface of the earth whose centre and radius are those of the earth itself is called a Great Circle.
It is called ‘great’ because a disc cut through the earth in the plane of the Great Circle would have the largest area that can be achieved.
Figure 2.1 Great CircleFigure 2.1 Great Circle
The shortest distance between two points on the Earth’s surface is the shorter arc of the Great Circle joining the two points.
Given two points on the Earth’s surface, there will be only one Great Circle joining them (unless the points are diametrically opposed).

22
Chapter 2 Great Circles, Rhumb Lines &Directions on the Earth
THE RHUMB LINE
Consider the figure below. We will discuss projections at a later stage of the course, but we will mention now that this is Mercator projection. The Mercator projection is one of the most common for general use and is the traditional “schoolroom atlas” or “classroom wallchart” projection. You will almost certainly have come across it before, even if you did not realise it at the time. It introduces distortions in that it draws all the meridians (the vertical lines) as parallel to each other, when in fact this only happens at the Equator. At any other point on the real Earth, they converge towards the nearer pole.
MERCATOR
Figure 2.2 Mercator ProjectionFigure 2.2 Mercator Projection
We have drawn on to this chart a straight line track from Moscow to Vancouver. You can see that, because it is a straight line, and because this particular projection depicts all meridians as parallel, the track line cuts all the meridians at the same angle. If you get your protractor out and measure anywhere along this line using the nearest meridian as the datum for North, you will always get the same track angle, which (to the nearest degree) is 267°. This line is an example of a Rhumb Line.
A Rhumb Line is a regularly curved line on the surface of the Earth which cuts all meridians at the same angle - a line of constant direction.

23
Chapter 2Great Circles, Rhumb Lines &Directions on the Earth
If we transfer the line from the Mercator chart to a globe, it follows the path shown below.
Figure 2.3 Moscow - Vancouver Rhumb Line TrackFigure 2.3 Moscow - Vancouver Rhumb Line Track
This constant track direction was an enormously important property for all mariners and aviators until about 30 years ago, when cheap powerful computing started to become widely available. Prior to that, one calculated a constant straight line track and then held the compass heading which would give that track. This made establishing the track a relatively simple problem although, unlike the Great Circle route, it did not give the shortest distance over the Earth between the two points.
However, In the case of our Moscow to Vancouver route, you can see that the Great Circle track between those points passes very close to the North Pole, and is much shorter.

24
Chapter 2 Great Circles, Rhumb Lines &Directions on the Earth
Figure 2.4 Moscow - Vancouver Great CircleTrack
Figure 2.4 Moscow - Vancouver Great Circle Track
Comparing the Great Circle and the Rhumb line together:
Figure 2.5 Moscow - Vancouver Great Circle
Track compared with Rhumb LineFigure 2.5 Moscow - Vancouver Great Circle Track compared with Rhumb Line
25
Chapter 2Great Circles, Rhumb Lines &Directions on the Earth
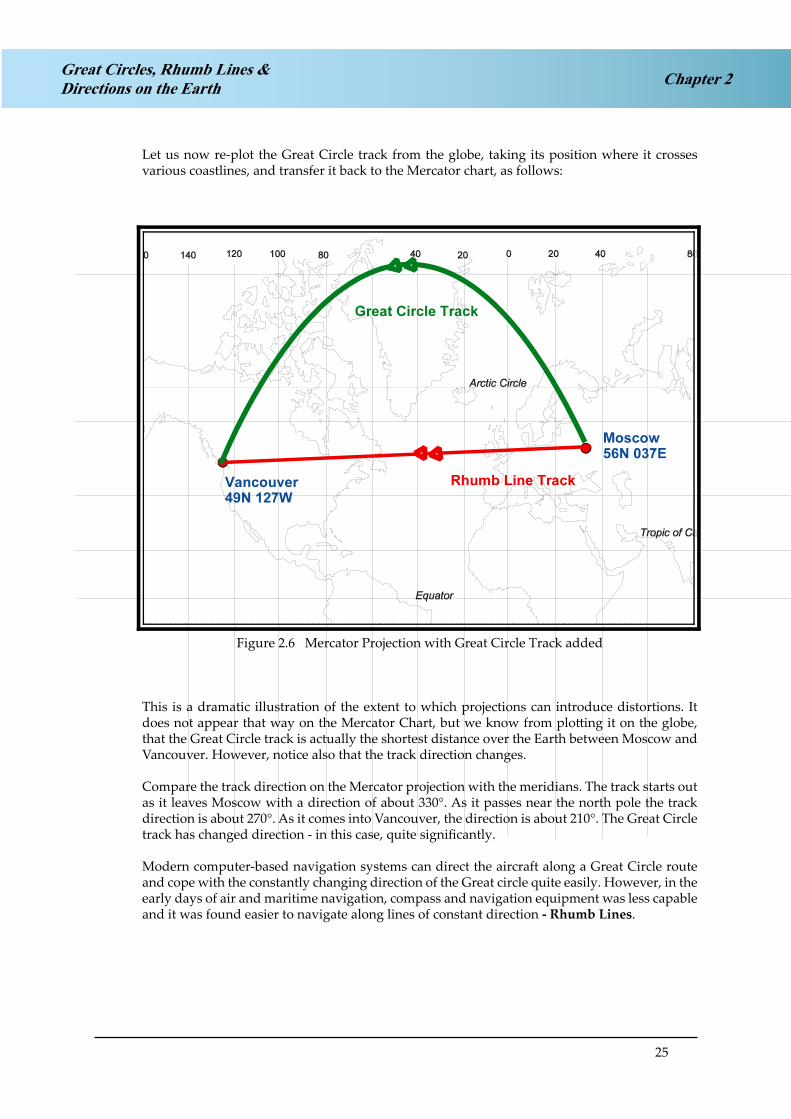
Let us now re-plot the Great Circle track from the globe, taking its position where it crosses various coastlines, and transfer it back to the Mercator chart, as follows:
MERCATOR
Figure 2.6 Mercator Projection with Great Circle Track addedFigure 2.6 Mercator Projection with Great Circle Track added
This is a dramatic illustration of the extent to which projections can introduce distortions. It does not appear that way on the Mercator Chart, but we know from plotting it on the globe, that the Great Circle track is actually the shortest distance over the Earth between Moscow and Vancouver. However, notice also that the track direction changes.
Compare the track direction on the Mercator projection with the meridians. The track starts out as it leaves Moscow with a direction of about 330°. As it passes near the north pole the track direction is about 270°. As it comes into Vancouver, the direction is about 210°. The Great Circle track has changed direction - in this case, quite significantly.
Modern computer-based navigation systems can direct the aircraft along a Great Circle route and cope with the constantly changing direction of the Great circle quite easily. However, in the early days of air and maritime navigation, compass and navigation equipment was less capable and it was found easier to navigate along lines of constant direction - Rhumb Lines.

26
Chapter 2 Great Circles, Rhumb Lines &Directions on the Earth
As with Great Circles, there is only one Rhumb Line that can be drawn between 2 points.Examples of common Rhumb Lines are:
Parallels of Latitude (because they cut all meridians at 90°).
Equator (a special case because the Equator is also a Great Circle).
Meridians (are also Great Circles and the cut angle involved is 0°).
The Rhumb Line between 2 points will always lie nearer to the Equator than the corresponding Great Circle. Conversely, the Great Circle between the 2 points will always lie nearer the Pole than the Rhumb Line.
In some explanations the shape of the Rhumb line may be stated as convex to the Equator or concave to the nearer Pole.
LINES WHICH ARE BOTH GREAT CIRCLES AND RHUMB LINES
The only lines which are both Great Circles and Rhumb lines are the Equator and any meridian (along with its associated anti-meridian). There are no other lines that are both Great Circles and Rhumb Lines. The parallels of latitude are Rhumb Lines because they cut all meridians at 90°, but they are Small Circles as they do not have the same radius and centre as the earth.
GREAT CIRCLE DIRECTION
The direction of the Great Circle over the Earth’s surface changes, as we have seen. The Great Circle track is always nearer to the nearer pole. In Figure 2.7, which again represents a Mercator chart, we have 2 Rhumb Line tracks, each in an E-W direction, one in the northern Hemisphere and one in the Southern. Both are at fairly high latitudes (say, 50N or 50S) in order to show a reasonable curvature on their Great Circle tracks, but the effect occurs, to some extent, at any latitude other than the Equator.

27
Chapter 2Great Circles, Rhumb Lines &Directions on the Earth
Fig 2.7 Change in Direction of Great Circle tracksFigure 2.7 Change in Direction of Great Circle tracks
Northern Hemisphere. Consider the track left to right in the Northern Hemisphere - a Rhumb Line track of 090°.
If heading in an Easterly direction, the Great Circle track starts with an initial direction of about 030°, then curves round to 090° and finishes up on about 150°. In other words, the track direction is increasing.
If heading in a Westerly direction, the Great Circle track starts with an initial direction of about 330°, then curves round to 270° and finishes up on about 210°. In other words, the track direction is decreasing.
Southern Hemisphere. Consider the track left to right in the Southern Hemisphere - a Rhumb Line track of 090°.
If heading in an Easterly direction, the Great Circle track starts with an initial direction of about 150o, then curves round to 090° and finishes up on about 030°. In other words, the track direction is decreasing.
If heading in a Westerly direction, the Great Circle track starts with an initial direction of about 210°, then curves round to 270° and finishes up on about 330°. In other words, the track direction is increasing.

28
Chapter 2 Great Circles, Rhumb Lines &Directions on the Earth
This can be summarised in the following diagram. North and South represent the hemispheres. Left and right indicate that the track direction is Easterly (right) or Westerly (left). This gives a diagram which spells out DIID - (decreasing - increasing - increasing - decreasing).
Figure 2.8 Direction of Great Circle TrackFigure 2.8 Direction of Great Circle Track
In all the above cases, note that the Great Circle direction always changes towards the Equator.
DISTANCE ON THE EARTH
Both metric and Imperial measures are in common use in aviation. Because many students will not have used the smaller Imperial measures of distance, the conversions below should be remembered.
1 metre(m) = 100 centimetres (cm) = 1000 millimetres (mm)1 centimetre(cm) = 10 millimetres (mm)1 metre(m) = 3.28 feet (ft)1 foot (ft) = 12 inches ( ‘in’ or “ )1 inch (in) = 2.54 centimetres (cm)1 yard (yd) = 3 feet (ft)
The Navigation Computer is accurate enough for any conversion for the purposes of aviation.

29
Chapter 2Great Circles, Rhumb Lines &Directions on the Earth
The Kilometre (km). The definition of the Kilometre is 1/10,000th of the average distance on the Earth between the Equator and either Pole. Thus there are 10,000 km between the Equator and either Pole, and the circumference of the Earth is 40,000 km.For conversions between Kilometres and Imperial units:
1 Kilometre (km = 3280 feet (ft) 1 metre(m) = 3.28 ft.
The Statute Mile (sm). Although the Statute Mile (5280 feet) is widely used on the ground it is hardly ever used in aviation nowadays. Older airspeed indicators used to be calibrated in mph, and still are for some American light aircraft, but this is now rare. Also, visibility is still given in statute miles in the USA. Otherwise, the only time a modern pilot will need to know about mph is to inform passengers in UK or US aircraft how fast the aircraft is travelling in terms of the same units they use in their cars.
The Nautical Mile (nm). The nautical mile is the most important large measure of distance used in aviation because it can be related directly to the angular measurements of the Latitude/ Longitude graticule of the Earth.
The ICAO definition of the nautical mile is that it is a measure of distance of 1852 metres.
The Standard Nautical Mile is defined as a length of 6080 feet.
(You may have noticed that 1852 metres converted to feet at a factor of 3.28 does not give exactly 6080 feet. For all JAA ATPL practical use, either 1852 metres or 6080 feet will give close enough answers to any problems which you will have to solve).
Because they all use Great Circle arcs, the definition of the Nautical mile is similar to the definitions of Latitude and Longitude. Remember the following:
One minute of latitude = 1 nautical mile(nm) One degree of latitude = 60 minutes = 60 nm
But
One minute of Longitude = 1 nm AT THE EQUATOR ONLY.
As there are 90° of Latitude change between the Equator and the Poles, the distance between the Equator and the Poles is 90 x 60 = 5400nm
The circumference of the Earth at the Equator is 360 x 60 = 21,600nm

30
Chapter 2 Great Circles, Rhumb Lines &Directions on the Earth
VARIATIONS IN THE LENGTH OF A NAUTICAL MILE
The full definition of the length of a nautical mile is that length of arc of a Great Circle which subtends an angle of one minute at the centre of curvature of the Earth’s surface.
It might seem initially therefore, that the longer the Earth radius, the longer the nautical mile, and this would be true if we used geocentric latitude. However our system of latitude and longitude is based on geodetic, not geocentric, latitude.
Because the Earth is flattened at the Poles, the radius of curvature is increased and a greater arc is required to subtend an angle of one minute at the centre of curvature, hence a nautical mile is longer at the Poles, at about 6108 feet. The amount of curvature is greatest at the Equator (the radius of curvature is decreased) and therefore the length of arc required to generate an angle of one minute at the centre of curvature is less. A nautical mile is shortest at the Equator and measures about 6048 feet. The average value, 6076.1 feet, is known as the International Nautical Mile and it is approximately 1852 metres. However, as stated before, for navigation calculations on this course, the Standard (or Admiralty) Nautical Mile of 6080 feet will be used.
Figure 2.9 Geodetic and Geocentric LatitudeFigure 2.9 Geodetic and Geocentric Latitude
CONVERSION FACTORS
5400 nautical miles (from the Equator to either pole) = 10,000 kilometres
21,600 nautical miles (circumference of the Earth) = 40,000 kilometres
GREAT CIRCLE DISTANCES
The Great Circle distance between any 2 points on the Earth can be calculated using a general equation involving spherical geometry - this is not part of the JAA syllabus. Consequently, JAA problems involving the calculation of great circle distances are limited to those where the 2 points lie on the special great circles, i.e. on the same meridian, on meridian and anti-meridian, or on the Equator.

31
Chapter 2Great Circles, Rhumb Lines &Directions on the Earth
There are 5 general cases illustrated in the following examples. In all the examples, consider the direction that is flown - there may be some surprises!
The latitudes/longitudes for the named points are chosen to illustrate the example and are only in the approximate geographic ‘ball-park’.
Example 1 - Same meridian, same hemisphere
What is the shortest (great circle) distance between (A) London (5137N 00012W) and (B) Accra (0648N 00012W)?
Note: Both positions are on the same meridian (00012W).
Draw a simple sectional diagram of the Earth as below using the Great Circle formed by the 00012W meridian and its anti- meridian (17948E) although the latter is not needed for this example.
Figure 2.10Figure 2.10
The positions of B (06°48’ north of the Equator measured at the centre of the Earth, C.) and A(51°37’ north of the Equator) are shown both on the 00012’W meridian. The angular distance between them (Change in Latitude or ch.Lat) is 51°37’ - 06°48’ = 44°49’ South from A to B.
To calculate the Great Circle distance from A to B, convert the angular distance into linear distance , i.e., multiply the degrees by 60 and add the extra minutes.
Thus 44°49’ = (44 x 60) + 49 = 2689 minutes of latitude
= 2689 nms
Be prepared to convert this answer to km or sm as required by the question. Always read the question carefully because although the basic calculation is done in nm, the Examiner may want the answer in different units.

32
Chapter 2 Great Circles, Rhumb Lines &Directions on the Earth
Example 2 - Same meridian, different hemispheres
What is the shortest distance between (D) Durban (2930S 03030E) and (E) Leningrad (5947N03030E)?
Again, note that both positions are on the same meridian but in this case they are in opposite hemispheres. Draw a sectional diagram as below.
Figure 2.11Figure 2.11
The ch.lat is now 29°30’ plus 59°47’ so the angular distance between D and E is 89°17’ north from D. The linear distance is (89x60) + 17 = 5357 nm

33
Chapter 2Great Circles, Rhumb Lines &Directions on the Earth
Example 3 - Meridian and anti-meridian, same hemisphere
What is the shortest distance between (F) Rome (4155N 01110E) and (G) Honolulu (2117N16850W)?
Both positions are in the same hemisphere but they are on meridian and anti-meridian - the two longitude values are of opposite sign and add up numerically to 180°.
011°10’E + 168°50’W = 180°.
Draw a sectional diagram as follows:
Figure 2.12Figure 2.12
The Great Circle between F (Rome) and G (Honolulu) is over the North Pole - a surprising but important result if you wanted to travel in one stage). By inspection, the simplest way to calculate the angular distance in this case is to add the 2 latitudes and subtract their total from 180°, i.e. Angular distance = 180° - ( 41°55’ + 21°17’ ) = 180° - 63°12’ = 116°48’.
An alternative method is to calculate the ch.lat from F to the Pole ( 90° - 41°55’ = 48°05’) and from the Pole to G ( 90°-21°17’ = 68°43’) and add the two to give the total angular distance. (48°05’ + 68°43’ =116°48’).
Both methods are mathematically the same.
Angular distance 116° 48’ = (116 x 60) + 48 = 7008 nm.The initial direction from F to the pole is North and then south from the Pole to G.
34
Chapter 2 Great Circles, Rhumb Lines &Directions on the Earth
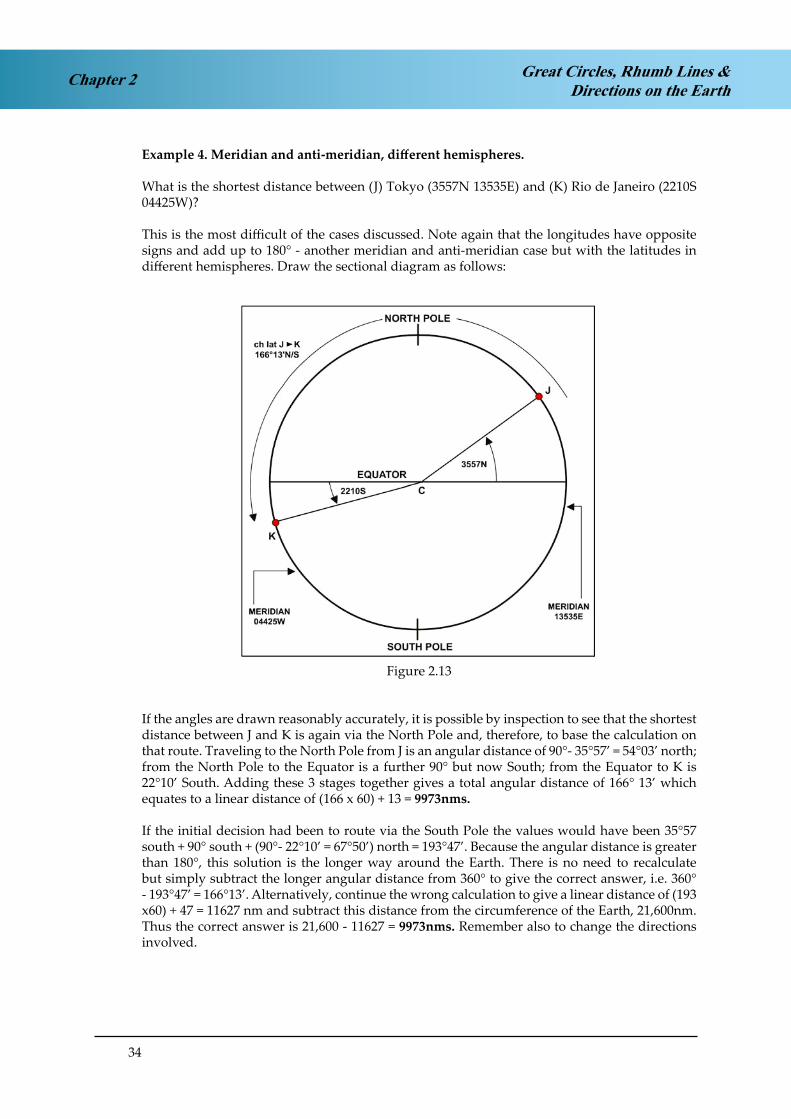
Example 4. Meridian and anti-meridian, different hemispheres.
What is the shortest distance between (J) Tokyo (3557N 13535E) and (K) Rio de Janeiro (2210S 04425W)?
This is the most difficult of the cases discussed. Note again that the longitudes have opposite signs and add up to 180° - another meridian and anti-meridian case but with the latitudes in different hemispheres. Draw the sectional diagram as follows:
Figure 2.13Figure 2.13
If the angles are drawn reasonably accurately, it is possible by inspection to see that the shortest distance between J and K is again via the North Pole and, therefore, to base the calculation on that route. Traveling to the North Pole from J is an angular distance of 90°- 35°57’ = 54°03’ north; from the North Pole to the Equator is a further 90° but now South; from the Equator to K is 22°10’ South. Adding these 3 stages together gives a total angular distance of 166° 13’ which equates to a linear distance of (166 x 60) + 13 = 9973nms.
If the initial decision had been to route via the South Pole the values would have been 35°57 south + 90° south + (90°- 22°10’ = 67°50’) north = 193°47’. Because the angular distance is greater than 180°, this solution is the longer way around the Earth. There is no need to recalculate but simply subtract the longer angular distance from 360° to give the correct answer, i.e. 360° - 193°47’ = 166°13’. Alternatively, continue the wrong calculation to give a linear distance of (193 x60) + 47 = 11627 nm and subtract this distance from the circumference of the Earth, 21,600nm. Thus the correct answer is 21,600 - 11627 = 9973nms. Remember also to change the directions involved.

35
Chapter 2Great Circles, Rhumb Lines &Directions on the Earth
Example 5 - Two points on the Equator
What is the shortest distance between (L) Dakar (0000N 01635W) and (M) Singapore (0000N 10355E)?
This example uses the fact that a minute of longitude equals one nautical mile but only at the Equator. The sectional diagram is drawn in the plane of the Equator viewed from above the North Pole and, for reference, the Prime Meridian (00E/W) and the Anti- Prime Meridian(180E/W) are drawn.
Figure 2.14Figure 2.14
The change of longitude (ch.long) from L to M is 016°35’ in an easterly direction to the Prime Meridian and a further 103°55’ in an easterly direction to M giving a total easterly ch.long of 120°30’. At the Equator only, an angular measurement of 120°30’ equals a linear measurement of (120° x 60) + 30 = 7230 nm

36
Chapter 2 Great Circles, Rhumb Lines &Directions on the Earth
Example 6 - A special case
What is the shortest distance between (N) Greenwich (5130N 00000E) and (P) Antipodes Island (5130S 18000E)?
Figure 2.15Figure 2.15
The points N and P are on meridian and anti-meridian and have equal latitudes north and south of the Equator. They are diametrically opposite each other on the same great circle and are said to be antipodal , hence Captain Cook named the nearest land diametrically opposite London as Antipodes Island. The great circle distance between any point and its antipodes is 180° in angular terms, 10,800nm in linear measure, ie, the semi-circumference of the Earth.

37
Chapter 2Great Circles, Rhumb Lines &Directions on the Earth
QUESTIONS
1. What is the Change of Latitude between the following positions:-
a. 52°15’N to 39°35’N b. 49°35’N to 60°20’S c. 74°20’S to 34°30’Sd. 71°20’N to 86°45’N over the north pole.
2. What is the difference in nautical miles and in kilometres from position A (41°25’N) to position B (79°30’N)? Both are on the same meridian.
3. What is the Change of Longitude between the following positions:-
a. 075°40’W to 125°35’W b. 001°20’E to 004°20’W c. 150°40’E to 179°30’E d. 162°36’W to 140°42’E
4. Give the Direction and Change of Latitude and Longitude from X to Y in each case:
X Y a. 50°31’N 006°30’W to 52°00’N 008°35’W b. 47°32’N 002°46’W to 43°56’N 001°33’W c. 61°47’N 003°46’W to 62°13’N 001°36’E d. 31°27’S 091°47’E to 35°57’N 096°31’E e. 51°05’N 177°42’E to 51°06’N 167°42’W
5. Give the shortest distance in nautical miles and kilometres between the following positions:
a. 52°06’N 002°32’E and 53°36’N 002°32’E b. 04°41’S 163°36’W and 03°21’N 163°36’W c. 62°00’N 093°00’E and 62°00’N 087°00’W d. 00°00’N 176°00’E and 00°00’N 173°00’We. 43°57’N 071°37’W and 43°57’S 108°23’E
6. An aircraft is to fly from position 72°00’N 002°30’E to position 72°00’N 177°30’W on the shortest possible route.
a. Give the initial (True) track directionb. Will the track direction remain the same for the whole flight?c. Give a reason for the answer given in b above.
7. You are at position A at 54°20’N 002°30’W. Given a ch.lat of 16°20’N and a ch.long of 020°30’W to B, what is the position of B?
8. You are at position C at 36°47’S 179°21’E. Given a ch. lat of 46°47’N and a ch. long of 20°30’E to D, what is the position of D?

38
Great Circles, Rhumb Lines &Directions on the EarthChapter 2
9. What is the position of the Rhumb Line between 2 points relative to the Great Circle between the same points if the points are:
a. In the Northern Hemisphere?b. In the Southern Hemisphere?
10. Any Meridian Line is a:
a. Rhumb Lineb. Semi Great Circlec. Rhumb Line and a semi Great Circle
11. A Rhumb Line cuts all meridians at the same angle. This gives:
a. The shortest distance between two points.b. A line which could never be a great circle track c. A line of constant direction

39
Chapter 2Great Circles, Rhumb Lines &Directions on the Earth

40
Great Circles, Rhumb Lines &Directions on the EarthChapter 2
ANSWERS
1 A. 12° 40’ S B. 109° 55’ S C. 39° 50’ N D. 21° 55’
2. 2285 nm is 4224 km or 4236 km using a calculator or 4230 km using the Navigation Computer.
Answers in km will vary depending on which conversion factor is used.
3. A. 49° 55’ W B. 05° 40’ W C. 28° 50’ E D. 56° 42’ W (Not 303° 18’ - we want the smaller arc).
4. A. 01° 29’ N 002° 05’ W B. 03° 36’ S 001° 13’ E C. 00° 26’ N 005° 22’ E D. 67° 24’ N 004° 44’ E E. 00° 01’ N 014° 36’ E
5. A. 90 nm 166 km B. 482 nm 890 km C. 3360 nm 6228 km D. 660 nm 1220 km E. 10800nm 20000 km
6. A. 360°(T) B. No C. Route over the North Pole, initial track True North, then once over the Pole, True South.
7. 70° 40’ N 023° 00’ W
8. 10° 00’ N 160° 09’ W
9. A. Nearer the Equator (South of the Great Circle) B. Nearer the Equator (North of the Great Circle)
10. C
11. C
41
Chapter 3Earth Magnetism
CHAPTER THREE
EARTH MAGNETISM
Contents
TRUE DIRECTION. . . . . . . . . . . . . . . . . . . . . . . . . . . . . . . . . . . . . . . 43
MAGNETIC DIRECTION . . . . . . . . . . . . . . . . . . . . . . . . . . . . . . . . . . . 43
MAGNETIC NORTH . . . . . . . . . . . . . . . . . . . . . . . . . . . . . . . . . . . . . 44
MAGNETIC DIRECTION . . . . . . . . . . . . . . . . . . . . . . . . . . . . . . . . . . . 44
VARIATION . . . . . . . . . . . . . . . . . . . . . . . . . . . . . . . . . . . . . . . . . . 44
CHANGE OF VARIATION . . . . . . . . . . . . . . . . . . . . . . . . . . . . . . . . . . 44
SITUATION AT THE POLES . . . . . . . . . . . . . . . . . . . . . . . . . . . . . . . . . 46
THE REAL VARIATION MAP . . . . . . . . . . . . . . . . . . . . . . . . . . . . . . . . 47
REAL VARIATION AT THE POLES . . . . . . . . . . . . . . . . . . . . . . . . . . . . . 49
CHANGES IN VARIATION OVER TIME . . . . . . . . . . . . . . . . . . . . . . . . . . 49
UPDATING ISOGONALS. . . . . . . . . . . . . . . . . . . . . . . . . . . . . . . . . . . 51
MAGNETIC DIP ANGLE . . . . . . . . . . . . . . . . . . . . . . . . . . . . . . . . . . . 52
DEVIATION . . . . . . . . . . . . . . . . . . . . . . . . . . . . . . . . . . . . . . . . . . 57
APPLICATION OF VARIATION AND DEVIATION . . . . . . . . . . . . . . . . . . . 58
DEFINITIONS . . . . . . . . . . . . . . . . . . . . . . . . . . . . . . . . . . . . . . . . . 61
QUESTIONS . . . . . . . . . . . . . . . . . . . . . . . . . . . . . . . . . . . . . . . . . . 63
ANSWERS . . . . . . . . . . . . . . . . . . . . . . . . . . . . . . . . . . . . . . . . . . . 66

42
Chapter 3 Earth Magnetism

43
Chapter 3Earth Magnetism
TRUE DIRECTION
In the chapter on the Form of the Earth, we defined direction with reference to the poles about which the Earth spins (North or South) and the direction in which the Earth spins (East). This is the basis of what is known as True Direction and is what is shown on maps. If you need to fly from, say, Oxford to Leicester, you draw a straight line on the map (assuming that there are no air traffic or other obstacles) between the two airports and measure its direction. This is a True direction. Notice that, at this stage, there has been no reference to magnetic compasses. If there were such a thing as a “compass that works in True Direction”, we would not even need to consider Earth magnetism. However, until about 40 years ago, no such thing existed. (They do now - the Inertial Navigation System (INS) finds its direction by establishing the direction of Earth rotation, and so is a genuine “true compass”. But these are very expensive and are fitted only to sophisticated aircraft). Most aircraft are still steered by a magnetic compass, and even aircraft with INS will have a standby compass, which will be magnetic.
MAGNETIC DIRECTION
It has been known for hundreds, and probably for thousands, of years, that it is possible to hold a reasonably constant direction by making use of Earth magnetism. Because the centre of the Earth is still cooling down, at its centre is a mass of molten liquid. This has the effect of making the Earth act magnetically as though there were a huge bar magnet running through it, aligned fairly closely to the North and South True poles.
The alignment of this magnetic effect is only approximately in line with the True poles and this can lead to marked differences between True and Magnetic direction in some parts of the world. Furthermore, the magnetic pattern is not symmetrical in the N - S sense; the North and South magnetic poles are not exactly opposite each other on the Earth. In effect, it’s like a bent bar magnet.
Figure 3.1. The Earth's PolesFigure 3.1 The Earth’s Poles

44
Chapter 3 Earth Magnetism
MAGNETIC NORTH
Magnetic North is the horizontal direction indicated by a freely suspended magnet influenced only by the Earth’s magnetic field. This direction is sometimes referred to as the ‘magnetic meridian’ at that point.
MAGNETIC DIRECTION
Magnetic Direction is measured from magnetic North clockwise through 360°, and is suffixed by the letter ‘M’, e.g. 043(M) and 270(M).
VARIATION
Variation is the angular difference between the directions of True and Magnetic North at any point.
Variation is the angle between True and Magnetic North and is measured in degrees East or West from True North.
A line on the surface of the Earth joining points of equal magnetic variation is called an Isogonal.
CHANGE OF VARIATIONACCORDING TO OBSERVER’S POSITION ON THE EARTH
The amount and the direction of variation depends on the relative geometry of the observer, theTrue Poles, and the Magnetic Poles.
Consider Figure 3.2. It shows the True North Pole and the Magnetic North Pole. The red line on the globe is the current longitude of the Magnetic North Pole (about 110°W).

45
Chapter 3Earth Magnetism
Fig 3.2 Idealised Model of World VariationFigure 3.2 Idealised Model of World Variation
To an observer at A, True North is the direction up the meridian at A to the True North Pole. Magnetic North is the direction that his compass needle will point, i.e. towards the Magnetic North Pole, which, from A, is to the right (East) of True North. In other words, Magnetic North is East of True North.
To an observer at B, the direction of Magnetic North will be left of True North because the geometry of the relative positions is different. Magnetic North is West of True North.
Now consider an observer at C. For him, as for the case of A, Magnetic North is East of True North. However, because he is so much further away from both of them, the difference in their directions (i.e. the variation) is a smaller angle.
Similarly, for an observer at D, like the one at B, Magnetic North is West of True North, so variation is West. However, it will be a smaller angle of variation than for the observer at B. Note also the situation for an observer at E. We have started at the True Pole, taken the Great Circle to the Magnetic Pole and then continued it in a Great Circle round the Earth. To an observer at E, the line joining him to the Magnetic North Pole and to the True North Pole will be the same Great Circle. It will be the direction of True North (i.e. straight up the meridian) and it will also be the direction in which his compass needle will point. For him, the value of variation will be zero.
This line is called the Agonic Line. It is the line connecting points of zero variation.

46
Chapter 3 Earth Magnetism
SITUATION AT THE POLES
For an aircraft flying between the North True Pole and the North Magnetic Pole, the variation on that shorter arc of the Great Circle is not zero, it is 180°. Consider the diagram below.
Fig 3.3 True and Magnetic North Poles - IdealisedFigure 3.3 True and Magnetic North Poles - Idealised
An aircraft is at position ‘A’, somewhere on the line between the North True Pole and the North Magnetic Pole. The meridian connecting him to the True Pole is the direction of True North. However, its compass needle will point at the Magnetic North Pole, in exactly the opposite direction. The variation at this point will be 180°. The zero variation line is shown in yellow and the180° variation line is shown in green.
Therefore, the maximum possible value of variation is 180° and this occurs at both the North and the South Poles.

47
Chapter 3Earth Magnetism
THE REAL VARIATION MAP
Figure 3.3 showed a somewhat idealised situation. As we said earlier, the North and South Magnetic Poles are not actually antipodal (i.e. not directly opposite each other). There is no reason why they should be. Earth magnetism is not really caused by a large bar magnet - this is simply a convenient analogy. It is actually caused by the swirling of molten magnetic magma below the surface of the earth. The effect is more like a bent bar magnet. The National Environmental Research Council (NERC) magnetic map for 1st Jan 2000 positions the North Magnetic Pole at approximately 81N 110W whilst the South Magnetic Pole is at 63S 135E.
The actual situation is shown by the charts at Figures 3.4, 3,5 and 3.6 The disposition of variation is not quite as geometrically neat as the diagram in Figure 3.3, but there definitely are 2 lines of zero variation, one running southwards from the True North Pole and the other running southwards from the Magnetic Pole. One runs down through Europe (the variation near Stuttgart, in Germany, is zero) and the other runs down through the USA.
Fig 3.4 Variation at the North PoleFigure 3.4 Variation at the North Pole

48
Chapter 3 Earth Magnetism
Figure 3.6. Variation at the South PoleFigure 3.6 Variation at the South Pole
(Charts supplied by the British Geological Survey (NERC) in March 2002)
The isogonal running down through the USA continues through South America (Figure 3.5) and then continues to the True South Pole (Figure 3.6), much as one would expect from the idealised model. However, the isogonal running down out of the North True Pole passes through Stuttgart into Central Africa, then curves upward again back onto the North Polar chart (Figure 3.4) into North Central Asia, then southwards again through Australia to the South Magnetic Pole.
It is important to realise that isogonals are not the actual magnetic lines of flux (which are a natural phenomenon). They are the difference between the alignment of the lines of flux and the local direction of True North at any point. This difference is a man-made concept. This is not the same thing. This point becomes more obvious in the next paragraph.

49
Chapter 3Earth Magnetism
REAL VARIATION AT THE POLES
Figure 3.7 shows the actual variation at the North Poles. The agonic line running up from Europe (yellow) changes to 180° (black) at the True North Pole. The red isogonals round the True Pole go from 015°E to 180°E variation whilst the blue ones go from 015°W to 180°W.
Figure 3.7 Variation at the North PoleFigure 3.7 Variation at the North Pole(Chart supplied by the British Geological Survey (NERC) in March 2002).
Therefore the isogonals converge on the True North Pole.
However, exactly the same thing occurs round the Magnetic North Pole. The agonic line running up from the USA (yellow) changes to 180° variation (black) between Magnetic and True Poles. Again, the red isogonals round the Magnetic Pole go from zero to 180°E variation whilst the blue ones go from zero to 180°W. Therefore the isogonals converge on the Magnetic North Pole as well. A study of Figure 3.6 will show the same phenomenon at the South Poles also.
Isogonals converge on both the True and the Magnetic North and South Poles.
CHANGES IN VARIATION OVER TIME
The value of variation at any point on the Earth changes over a period of time. For instance, the present (2002) value of variation at Oxford is about 4°W. However, this appears to be reducing at a rate of approximately one degree every 9 years. In 1960, Oxford’s variation was about 8°W and, if the present trend continues, the value should fall to zero in about 2040, becoming easterly subsequently. Other changes are taking place in other parts of the world.
The reason for the change is that the position of the Magnetic North Pole (which is to the West of Oxford, but by more than 90°W of longitude) is moving westwards round the North True Pole, thereby reducing the variation. The reasons for this movement are not fully understood, but it is evidently associated with movement of the molten magma in the Earth’s core.

50
Chapter 3 Earth Magnetism
At one time it used to be thought that the Magnetic North Pole rotated in a near-perfect circle round the True Pole at a rate of one revolution every 960 years. However, this hypothesis was based simply on empirical observation over a period of time and more recent and accurate observation over the last 50 years has shown that, at least over the last few years, the Magnetic Pole has moved northwards as well as westwards. All that can be said is that the Earth’s magnetic field is certainly changing, and by observing it over a period of time and extrapolating the change, we can make reasonably accurate forecasts of variation for up to about ten years ahead.
There appear to be at least 3 predictable cycles in the pattern:
Secular. The secular movement is this long-term change described above.
Annual. Superimposed on this long-term change is a sinusoidal change with a period of one year. This is associated with the Earth’s orbit round the Sun.
Diurnal. Superimposed on these 2 patterns is a sinusoidal change with a period of one day. This appears to be associated with the daily changes in the height of the ionosphere as the Earth rotates, presenting different areas of the upper atmosphere to the Sun. The variation can change up to about 0.1o over the course of a day.
In addition, there are unpredictable changes. One is associated with solar activity and one with local anomalies.
Solar Activity. The Sun experiences cycles of sunspot activity which peak every 11 years. Huge solar flares are expelled far out into space. The period is predictable, but whether it affects the Earth is not. If one of these flares is pointed towards Earth, a tongue of intense ionisation curls around the upper atmosphere, causing various effects, the most notable of which is the Aurora Borealis (the Northern Lights). There is also a similar effect round the South Magnetic Pole, called the Aurora Australis.
These are known as ‘magnetic storms’ and the effects can be very intense. During the most recent of these 11-year cycles, variation changes of up to 7° were observed. Sunspot activity and solar flares occur at other times as well and minor magnetic storms can occur outside the 11-year peak of the period.
Local Anomalies. Local magnetic anomalies are caused by magnetic deposits or rock formations that cause the field to be different within a particular area.
In addition, scientific surveys have shown that variation can change slightly with altitude, though few aircraft systems would be sensitive enough for this effect to be noticed.
Accordingly, it is very difficult to know the precise instantaneous value of variation affecting an aircraft to better than about 2 degrees and, even if great care is taken over finding and correcting for it, to better than about half a degree over a period of time. This is why the emergence of systems based on highly accurate gyros, particularly INS, in the 1960s/70s was such a major advance in navigation technology. It was not merely that they calculated present position, important though that was. It was because, for the first time, there was a source of accurate reliable heading.

51
Chapter 3Earth Magnetism
UPDATING ISOGONALS
Pilots should always fly with the most up-to-date chart for flight safety reasons. Aeronautical information is constantly changing, airways are re-aligned, the positions and frequencies of VORs and DMEs are changed and danger areas alter shape or are moved as civil and defence requirements change within a country. If the chart is republished at frequent intervals, the isogonals should be comparatively recent as well and for most radio navigation charts it is not normally necessary to update the isogonals.
However the interval between reissues of topographical maps may be considerably longer - perhaps every 5 or 10 years. In this case, if the variation has changed significantly, it may be necessary for the pilot to bring the isogonals up to date during the flight planning process. On most maps and charts the year of origin is shown and some indication of the annual change (due to the movement of the magnetic poles) is given. This may be done by a small arrow showing the direction and distance on the annual change of the position of the isogonal as in Figure 3.8,
Figure 3.8Figure 3.8
or by a statement giving the annual change in the variation quoted on the isogonal as in Figure 3.9.
Figure 3.9Figure 3.9

52
Chapter 3 Earth Magnetism
MAGNETIC DIP ANGLE
Consider the diagram at Figure 3.10, showing the lines of magnetic force round the Earth’s surface. Imagine aircraft at positions A, B, and C. The lines of force will make different angles to the horizontal in each location. This angle is known as the Angle of Dip and is shown diagrammatically in Figure 3.11.
Figure 3.10. Lines of ForceFigure 3.10 Lines of Force
The Earth Magnetic field is along the total line of force, shown as T. This can be resolved into a horizontal component H and a vertical component Z.
Vertical Component. The vertical component Z is of no value in determining horizontal direction. In fact, it is undesirable for two reasons.
Firstly, it causes the needle of a direct reading magnetic compass to dip from the horizontal. This is partially corrected by the use of pendulous suspension, but the end result is that the needle still hangs down to some extent, so that the centre of gravity is no longer directly below the centre of suspension, thereby resulting in the well-known problems of turning and acceleration errors.
Figure 3.11. The Angle of DipFigure 3.11 The Angle of Dip

53
Chapter 3Earth Magnetism
Secondly, the vertical component of the Earth’s field induces vertical soft-iron magnetism in the aircraft, thereby increasing the deviation.
Horizontal Component. The horizontal component is the part which is detected by the compass needle in order to determine magnetic north and is known as the directive force. In the region of the magnetic equator the strength of the directive force H approaches the value of T, while Z approaches zero as does the angle of dip.
Figure 3.12 considers positions A, B, and C on the Earth’s surface as shown in Figure 3.10. It becomes apparent that the directive force H decreases as the angle of dip increases, and vice versa.
Figure 3.12. The Effect of Latitude on the Componentsof Dip
Figure 3.12 The Effect of Latitude on the Components of Dip
When either of the earth’s magnetic poles is approached, this component approaches zero strength, while the value of Z approaches that of T.
Magnetic field strength is measured in units of micro-teslas. The generally accepted figure at which the horizontal component of the Earth’s field becomes too small to be detected by a compass is 6 micro-teslas. Clearly, in practice, the actual detection threshold will depend on the design of the particular compass being used, but 6µ teslas is the notional figure normally quoted.
The maximum possible dip angle is 90° and this occurs overhead the North and South Magnetic Poles.

54
Chapter 3 Earth Magnetism
Figure 3.13 is an illustration of the 6µ tesla zone round the North Poles. This particular diagram is dated about 1950, but it has been chosen because the type of projection shows a reasonably representative shape near the Poles.
Figure 3.13. The 6µ Tesla Zone in the Arctic - Polar ProjectionFigure 3.13 The 6µ Tesla Zone in the Arctic - Polar Projection
Figures 3.14 and 3.15 show more recent surveys of the 6µ tesla zone. They have been included because they demonstrate that there is a 6µ tesla zone around the South Magnetic Pole as well as the North. They are dated 01 Jan 2000. The projection used is a Winkel, which introduces distortions near the True Pole, which has the effect of making the zone round the North Pole appear larger than the one round the South when, in fact, they are approximately the same size and shape.
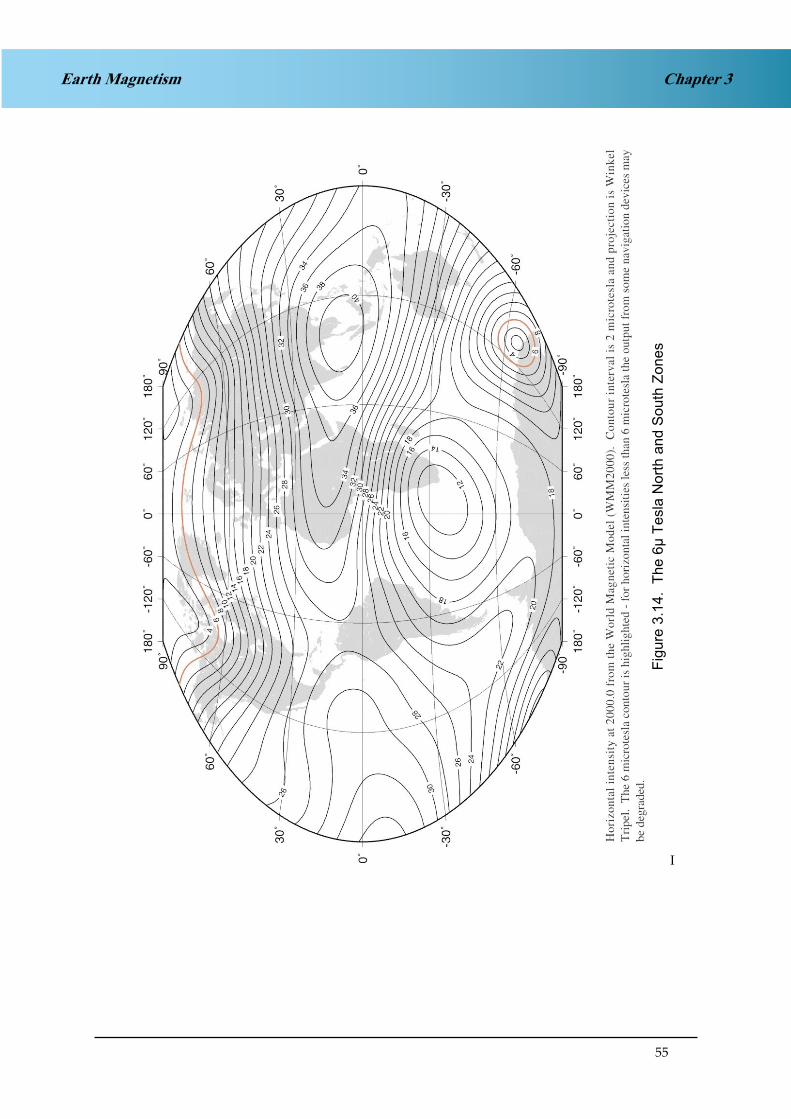
55
Chapter 3Earth Magnetism
Fig
ure
3.1
4.
Th
e 6
µ T
esla
No
rth
an
d S
ou
th Z
on
es
I

56
Chapter 3 Earth Magnetism
Fig
ure
3.1
5.
Dip
An
gle

57
Chapter 3Earth Magnetism
In fact, the relationship between H and dip angle is not quite as simple as suggested by Figure 3.11 because of irregularities in the pattern of the Earth’s field and changes with position and time of the total magnetic force T.
The angle of dip at Oxford is about 66° but the use of pendulous suspension in a simple Direct Reading Compass reduces the dip of the magnetic compass assembly to about 2°. However, this small residual angle is still sufficient to give the well-known turning and acceleration errors.
DEVIATION
In addition to the correction for the difference between True and Magnetic North (variation), there is a further correction to be applied. This is for the difference between Magnetic North and the direction that a compass needle points. Why are these not the same?
The reason is that the aircraft itself is full of magnetic influences (metal, electric currents, etc. and so acts partially as a magnet itself. Therefore the compass needle is mainly attracted to the Magnetic North Pole, but partially attracted to the magnetism within the aircraft. This aircraft magnetism deflects the compass needle from Magnetic North to a new direction, which we call Compass North. The difference between Magnetic North and Compass North is called Deviation.
Deviation is defined as the angle measured at a point between the direction indicated by a compass needle and the direction of Magnetic North.It is termed East or West according to whether Compass North lies to the East or West of Magnetic North.
Deviation can also be quoted as plus or minus. For instance a deviation of -3° is the same as 3°W deviation. Plus is East, minus is West. The reason for this is that deviation is seen as a correction to be applied to the compass in order to establish Magnetic heading.
When deviations are quoted as plus or minus they are to be applied to the compass heading in order to give magnetic heading.

58
Chapter 3 Earth Magnetism
APPLICATION OF VARIATION AND DEVIATION
When Magnetic direction is the same as True direction the variation is nil; otherwise Magnetic North direction may lie either to the West or East of the True North Direction. See Figures 3.16a & 3.16b.
Figure 3.16 a. Westerly Variation Figure 3.16 b. Easterly Variation
Figure 3.16a Westerly Variation Figure 3.16b Easterly Variation
The direction of the aircraft The direction of the aircraftrelative to True North is 105° relative to True North is 105°
The direction of the aircraft The direction of the aircraftrelative to Magnetic North relative to Magnetic Northis 122°. is 088°.
Magnetic North is to the West Magnetic North is to the Eastof True North of True North.
VARIATION IS 17° W VARIATION IS 17° E
The direction in which the fore and aft axis of the aircraft is pointing is known as the aircraft’sheading.
We are thus able to complete the following tables:-
From Figure 3.16a From Figure 3.16b
Heading True Variation Heading
MagneticHeading
True Variation Heading Magnetic
105° 17°W 122° 105° 17°E 088°
and from this we deduce the following rule which must be remembered:-
VARIATION WEST MAGNETIC BEST
VARIATION EAST MAGNETIC LEAST

59
Chapter 3Earth Magnetism
Deviation is the angle between Magnetic North and Compass North measured in degreesEast or West from Magnetic North. Figures 3.17a & 3.17b illustrate this.
Figure 3.17a. Westerly Deviation Figure 3.17b. Easterly DeviationFigure 3.17a Westerly Deviation Figure 3.17b Easterly Deviation
The direction of the aircraft The direction of the aircraft relative to True North is 100°. relative to Magnetic North is 100°
The direction of the aircraft The direction of the aircraftrelative to Magnetic North is 125° relative to Magnetic North is 125°.
The direction of the aircraft The direction of the aircraftindicated by the Compass indicated by the Compass is 135°. is 115°.
and we are able to complete the following tables:-
From Figure 3.17a
Heading True Variation Heading Magnetic Deviation Heading
Compass
100° 25°W 125° 10°W 135°
From Figure 3.17b
Heading True Variation Heading Magnetic Deviation Heading
Compass
100° 25°W 125° 10°E 115°
and from this we deduce the following rule which must be remembered:-
DEVIATION EAST - COMPASS LEAST
DEVIATION WEST - COMPASS BEST

60
Chapter 3 Earth Magnetism
The signs for plus and minus are sometimes used as a prefix instead of the suffixes East or West, in which case you will see that the rule is to apply the deviation (as stated. to the Compass Heading to obtain the Magnetic Heading and conversely apply the deviation (with the sign changed. to Magnetic Heading to obtain Compass Heading.
For example:-
Deviation 3°E
Hdg 263(M) deviation 3°E Deviation East Compass Least Hdg 260(C)
Hdg 260(C) deviation 3°E Deviation East Compass Least Hdg 263(M)
Alternatively Deviation +3°
Hdg 263(M) deviation +3 to convert from Magnetic to Compass.Change the sign and apply to Hdg(M);
Hdg 263 - 3 = Hdg 260(C)
Or
Hdg 260(C) + 3 to convert from Compass to Magnetic.Apply deviation to Hdg(C)
Hdg 263 - 3 = Hdg 260(C)
Another rule, equivalent to the one stated above, is also used:-
From Compass to True the signs are true (E is +, W is -)

61
Chapter 3Earth Magnetism
DEFINITIONS
Definitions of terms associated with direction on the Earth.
Heading is the direction in which the fore and aft axis of the aircraft is pointing; it may be measured from True, Magnetic, or Compass North.
Variation is the angle measured at a point between True North direction and the direction indicated by a freely suspended compass needle influenced only by the Earth’s magnetic field. It is termed East or West according to whether Magnetic North lies to the East or West of True North.
Deviation is the angle measured at a point between the direction indicated by a compass needle and the direction of Magnetic North. It is termed East or West according to whether the Compass North lies to the East or West of Magnetic North.
Isogonals are pecked lines on a map or chart joining places of equal magnetic variation.
Agonic Line is the name given to isogonals joining places of zero variation.
The Angle of Dip is the angle in the vertical plane between the horizontal and the Earth’s magnetic field at a point.
Isoclinals are lines on a map or chart joining places of equal magnetic dip.
Aclinic Lines is the name given to isoclinals joining places of zero dip.
Note:- Isoclinals and Aclinic lines do not appear on Navigation charts.

62
Chapter 3 Earth Magnetism

63
Chapter 3Earth Magnetism
QUESTIONS
1. The sensitivity of a direct reading magnetic compass is:
a. Inversely proportional to the horizontal component of the earth’s magnetic field. b. Proportional to the horizontal component of the earth’s magnetic field.c. Inversely proportional to the vertical component of the earth’s magnetic field.d. Inversely proportional to the vertical and horizontal components of the earth’s magnetic
field.
2. What is the definition of magnetic variation?
a. The angle between the direction indicated by a compass and Magnetic North. b. The angle between True North and Compass North.c. The angle between Magnetic North and True North.d. The angle between Magnetic Heading and Magnetic North.
3. At the magnetic equator:
a. Dip is zerob. Variation is zeroc. Deviation is erod. The isogonal is an agonic line
4. Which of these is a correct statement about the Earth’s magnetic field?
a. It acts as though there is a large blue magnetic pole in Northern Canadab. The angle of dip is the angle between the vertical and the total magnetic force.c. It may be temporary, transient, or permanent.d. It has no effect on aircraft deviation.
5. Where is a compass most effective?
a. About midway between the earth’s magnetic poles b. In the region of the magnetic South polec. In the region of the magnetic North pole d. On the geographic equator
6. The value of variation:
a. is zero at the magnetic equatorb. has a maximum value of 180°c. has a maximum value of 45° E or 45° Wd. cannot exceed 90°
7. The agonic line:
a. is midway between the magnetic North and South polesb. follows the geographic equatorc. is the shorter distance between the respective True and Magnetic North and South
polesd. Follows separate paths out of the North polar regions, one currently running through
Western Europe and the other through the USA

64
Earth MagnetismChapter 3
8. The angle between True North and Magnetic north is known as:
a. deviationb. variationc. alignment error d. dip
9. The value of magnetic variation on a chart changes with time. This is due to:
a. Movement of the magnetic poles, causing an increase b. Increase in the magnetic field, causing an increasec. Reduction in the magnetic field, causing a decreased. Movement of the magnetic poles, which can cause either an increase or a decrease
10. Isogonal lines converge as follows:
a. At the North Magnetic Poleb. At the North and South Magnetic and Geographical Poles c. At the North and South Magnetic Polesd. At the Magnetic equator.
11. What is the maximum possible value of Dip Angle?
a. 66° b. 180° c. 90° d. 45°
12. What is the dip angle at the South Magnetic Pole?a. 0° b. 90°c. 180° d. 64°
13. What is a line of equal magnetic variation?
a. An isoclineb. An isogonalc. An isogrivd. An isovar
14. If variation is West; then:
a. True North is West of Magnetic North b. Compass North is West of Magnetic North c. True North is East of Magnetic Northd. Magnetic North is West of Compass North

65
Chapter 3Earth Magnetism
15. Fill in the blank spaces in the table below.
°TRUE VARN °MAG DEVN °COMP
260 291 3E
10W 1E 070
7W 001 2E
17W 0 020
306 10E 1W
036 031 033
5E 025 023
359 3W 2E
23E 2W 221
312 322 319
002 3W 1W
260 291 -3
5E +1 070
3W 001 +2
022 10W 3W 035

66
Earth MagnetismChapter 3
ANSWERS
1 B 6 B 11 C
2 C 7 D 12 B
3 A 8 B 13 B
4 A 9 D 14 C
5 A 10 B
15.
°TRUE VARN °MAG DEVN °COMP
260 31W 291 3E 288
061 10W 071 1E 070
354 7W 001 2E 359
003 17W 020 0 020
306 10E 296 1W 297
036 5E 031 2W 033
030 5E 025 2E 023
359 3W 002 2E 000
242 23E 219 2W 221
312 10W 322 3E 319
002 3W 005 1W 006
260 31W 291 -3 294
076 5E 071 +1 070
358 3W 001 +2 359
022 10W 032 3W 035

67
Chapter 4The Navigation ComputerSlide Rule Face
CHAPTER FOUR
THE NAVIGATION COMPUTER - SLIDE RULE FACE
Contents
THE NAVIGATION COMPUTER . . . . . . . . . . . . . . . . . . . . . . . . . . . . . . 69
SLIDE RULE THEORY . . . . . . . . . . . . . . . . . . . . . . . . . . . . . . . . . . . . 69
MULTIPLICATION . . . . . . . . . . . . . . . . . . . . . . . . . . . . . . . . . . . . . . 75
DIVISION . . . . . . . . . . . . . . . . . . . . . . . . . . . . . . . . . . . . . . . . . . . . 76
RATES AND RATIOS . . . . . . . . . . . . . . . . . . . . . . . . . . . . . . . . . . . . . 78
QUESTIONS . . . . . . . . . . . . . . . . . . . . . . . . . . . . . . . . . . . . . . . . . . 81
ANSWERS . . . . . . . . . . . . . . . . . . . . . . . . . . . . . . . . . . . . . . . . . . . 82

68
Chapter 4 The Navigation ComputerSlide Rule Face
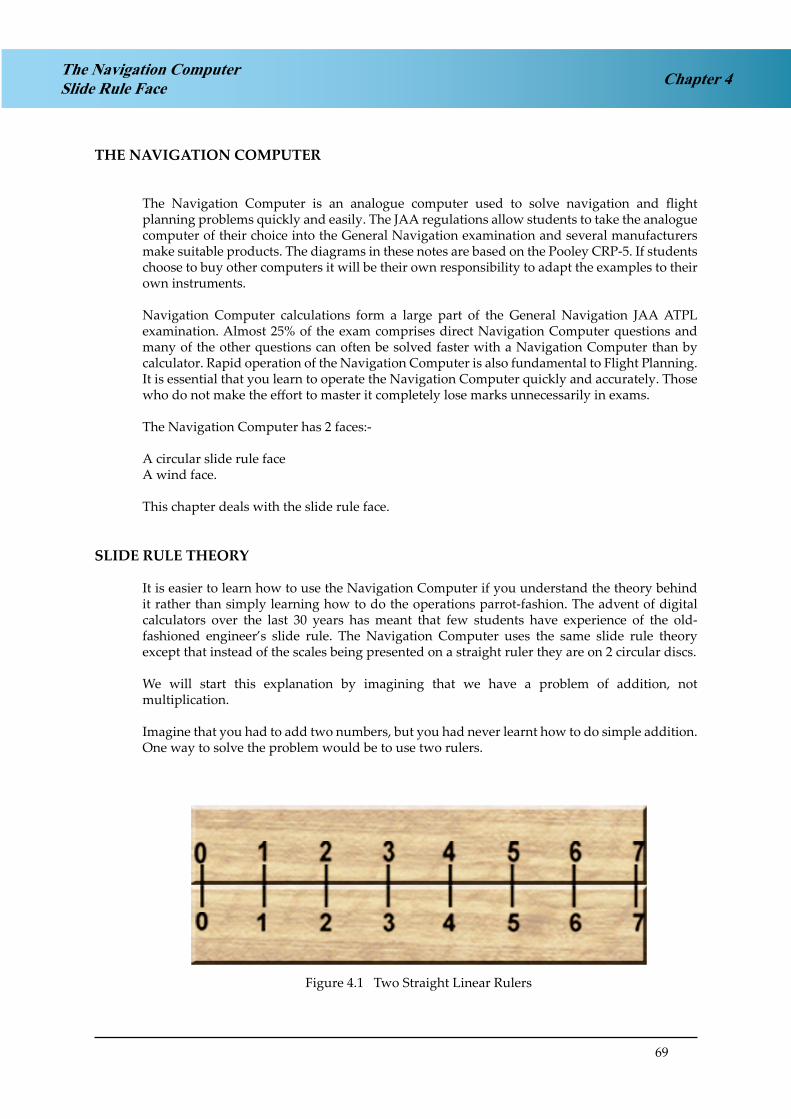
69
Chapter 4The Navigation ComputerSlide Rule Face
THE NAVIGATION COMPUTER
The Navigation Computer is an analogue computer used to solve navigation and flight planning problems quickly and easily. The JAA regulations allow students to take the analogue computer of their choice into the General Navigation examination and several manufacturers make suitable products. The diagrams in these notes are based on the Pooley CRP-5. If students choose to buy other computers it will be their own responsibility to adapt the examples to their own instruments.
Navigation Computer calculations form a large part of the General Navigation JAA ATPL examination. Almost 25% of the exam comprises direct Navigation Computer questions and many of the other questions can often be solved faster with a Navigation Computer than by calculator. Rapid operation of the Navigation Computer is also fundamental to Flight Planning. It is essential that you learn to operate the Navigation Computer quickly and accurately. Those who do not make the effort to master it completely lose marks unnecessarily in exams.
The Navigation Computer has 2 faces:-
A circular slide rule faceA wind face.
This chapter deals with the slide rule face.
SLIDE RULE THEORY
It is easier to learn how to use the Navigation Computer if you understand the theory behind it rather than simply learning how to do the operations parrot-fashion. The advent of digital calculators over the last 30 years has meant that few students have experience of the old- fashioned engineer’s slide rule. The Navigation Computer uses the same slide rule theory except that instead of the scales being presented on a straight ruler they are on 2 circular discs.
We will start this explanation by imagining that we have a problem of addition, not multiplication.
Imagine that you had to add two numbers, but you had never learnt how to do simple addition. One way to solve the problem would be to use two rulers.
Figure 4.1 Two Straight Linear Rulers
Figure 4.1 Two Straight Linear Rulers

70
Chapter 4 The Navigation ComputerSlide Rule Face
Suppose you had to add 3 + 3. Put the zero of the top ruler against the ‘3’ on the bottom, as in Figure 4.2
Now look down from the ‘2’ on the top ruler to read off the ‘5’ on the bottom.
Figure 4.2 Adding 3 + 2Figure 4.2 Adding 3 + 2
In addition, note that with just one alignment of the ruler you can also read off the answer to the sum:-
Figure 4.3 Multiple Simultaneous AdditionsFigure 4.3 Multiple Simultaneous Additions
3 + any other number = ?
Note: You can subtract. In Figure 4.4 below, by aligning ‘4’ on the bottom ruler with ‘1’ on the top ruler and then looking back to the zero on the top ruler, you can read off the answer ‘1’.
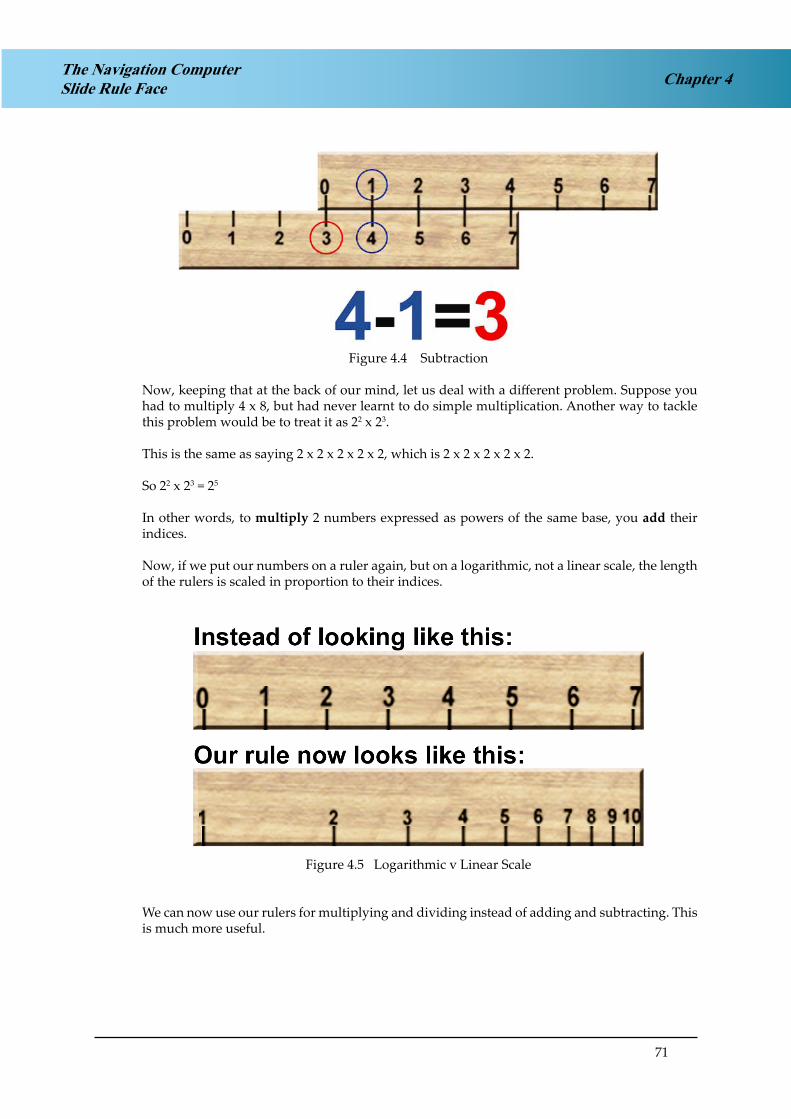
71
Chapter 4The Navigation ComputerSlide Rule Face
Figure 4.4 SubtractionFigure 4.4 Subtraction
Now, keeping that at the back of our mind, let us deal with a different problem. Suppose you had to multiply 4 x 8, but had never learnt to do simple multiplication. Another way to tackle this problem would be to treat it as 22 x 23.
This is the same as saying 2 x 2 x 2 x 2 x 2, which is 2 x 2 x 2 x 2 x 2.
So 22 x 23 = 25
In other words, to multiply 2 numbers expressed as powers of the same base, you add their indices.
Now, if we put our numbers on a ruler again, but on a logarithmic, not a linear scale, the length of the rulers is scaled in proportion to their indices.
Figure 4.5 Logarithmic v Linear ScaleFigure 4.5 Logarithmic v Linear Scale
We can now use our rulers for multiplying and dividing instead of adding and subtracting. This is much more useful.

72
Chapter 4 The Navigation ComputerSlide Rule Face
For example, in order to multiply by 2, we align the ‘1’ on the top scale with the ‘2’ on the bottom scale.
Figure 4.6 MultiplicationFigure 4.6 Multiplication
Then, by simply reading off the top scale at any point we can find that number multiplied by 2 on the bottom scale.
This works for any number. Suppose we now want to multiply by 3. All we do is align the ‘3’ on the bottom scale with the ‘1’ on the top scale as in Figure 4.7 below. We have now set the scales in the ratio 3:1. We do not need a different scale for each number. The same 2 scales do all numbers.
Figure 4.7 Multiplying by a different number
Figure 4.7 Multiplying by a different number
Now ‘1’ is aligned with ‘3’, ‘2’ is aligned with ‘6’, ‘3’ is aligned with ‘9’, and so on.
Note that it works with the positions of the two scales reversed. We can have our 2 scales like this:

73
Chapter 4The Navigation ComputerSlide Rule Face
Figure 4.8a
Figure 4.8aOr like this:
Figure 4.8b
Figure 4.8b
Note: We can use it for dividing as well as multiplying, in the same way that we could use the linear scale for subtracting as well as adding.
When set up like this, we can divide 6 (top scale) by 2 (bottom scale), and read off the answer ‘3’.
Figure 4.9 DivisionFigure 4.9 Division

74
Chapter 4 The Navigation ComputerSlide Rule Face
The Navigation Computer turns our straight slide rule into a circular one, as follows:-
Figure 4.10 The Circular Slide RuleFigure 4.10 The Circular Slide Rule

75
Chapter 4The Navigation ComputerSlide Rule Face
MULTIPLICATION
Before we can start using the Navigation Computer, we need to look at the scale.
From Figure 4.11 overleaf, you can see that there is no number smaller than 10 or larger than 99.9. Therefore we need to mentally insert the decimal point; for instance, the number 12 can be used to represent 0.12, 12, 120, 1200, etc. We put the decimal point in after the Navigation Computer operation.
This means that you have to carry out a rough calculation in your head to know what order of magnitude your solution will be.
Figure 4.11 No number smaller than 10 or greater than 99.9Figure 4.11 No number smaller than 10 or greater than 99.9
An example should make this clear.
Suppose you have to multiply 11.5 by 2.54.
First, the approximate calculation.
This is approximately 10 (11.54) times approximately 2½ (2.54).
The answer will be approximately 25. It will not be 2½ or 250.
Now we know the order of magnitude of the solution, we can use the slide rule.
Against 11.5 on the outer scale, line up 10 (representing 1.0) on the inner scale - Figure 4.12.

76
Chapter 4 The Navigation ComputerSlide Rule Face
Figure 4.12 Line up 11.5 (outer scale) with 1.0 (inner scale)
Figure 4.12 Line up 11.5 (outer scale) with 1.0 (inner scale)
Now find 2.54 on the inner scale (shown as 25.4). Align the cursor (see Figure 4.13).
Read off the answer (29.2) on the outer scale.
Figure 4.13 MultiplicationFigure 4.13 Multiplication
Is this the correct order of magnitude? Is the answer 2.92, 29.2, or 292?
We know from our rough calculation that the answer is about 25. So 29.2 is the correct order of magnitude.
DIVISION
Divide 3050 by 3.28.
Again, the rough calculation. This is approximately 3000 divided by approximately 3. The answer will be just under 1000, i.e. about nine hundred and something.

77
Chapter 4The Navigation ComputerSlide Rule Face
Find 3050 on the outer scale and align the cursor. Now find 3.28 on the inner scale and align the cursor. It should then look as in Figure 4.14 below.
Figure 4.14 Setting up for DivisionFigure 4.14 Setting up for Division
Now find 10 on the inner scale and read off against the outer scale, as in Figure 4.15 below.
Figure 4.15 Reading off the Answer - DivisionFigure 4.15 Reading off the Answer - Division
The initial answer is 93.0. Is this the right order of magnitude? We know from our rough calculation that it should be about 900, so the correct answer must be 930.

78
Chapter 4 The Navigation ComputerSlide Rule Face
RATES AND RATIOS
Let’s reinforce the division process by doing another example. Placing it into an aviation-related situation:-.
The average rate of climb of a particular aircraft is given as 700 feet per minute. How long will it take to climb from 3,000 to 20,000 feet?
The aircraft is to climb through 17,000 feet at 700 feet per minute. Straightforward division of 17,000 by 700 will determine the number of minutes for the climb.
What is the rough order of magnitude?
700 feet in one minute so...............................................7,000 feet in ten minutes, and........................................14,000 feet in twenty minutes; therefore.........................17,000 feet in a few more minutes than twenty.............
Alternatively, 700 fpm is not too far from 1000 fpm. So the sum is approximately17000 / 1000, which will be a bit more than 17, i.e. somewhere in the low twenties.
Hold the computer with the 17,000 (shown as 17) of the outer scale at the top.
Rotate the disc to bring the 700 (shown as 7) of the inner scale immediately opposite the outer scale 17.
Turn the instrument the shortest way (clockwise in this case) to bring 10 of the inner scale to the top.
Opposite this ‘10’ read off from the outer scale the answer digits 243.
Which leads us to a final answer of 24.3 minutes.
You may prefer a slightly different approach to this type of problem, solving in terms of proportion rather than division. Restating the problem we have:-
Aircraft climbs 700 feet in one minute
It will climb 17,000 feet in ‘t’ minutes (where ‘t’ is the answer we wish to discover)
This can be written as:-
700 = 17,000 1 t
Now if you arrange this equation on your circular slide rule with the numerators 700 and 17,000 on the outer scale set respectively above the denominators 1 and ‘t’ on the inner scale, the problem is solved.

79
Chapter 4The Navigation ComputerSlide Rule Face
Figure 4.16 700 fpm set up as a RatioFigure 4.16 700 fpm set up as a Ratio
As shown in Figure 4.16, align the 700 (shown as 70) of the outer scale exactly over the 1 (shown as 10) on the inner scale. This sets up the left hand side of the equation.
Figure 4.17 The Solution as a RatioFigure 4.17 The Solution as a Ratio
Turn the instrument clockwise and look for the right hand side of the equation. Look for 17,000 (shown as 17) on the outer scale.
Immediately under it, read off 24.3 from the inner scale.
This is the same answer that we had before. If you solve the problem in this manner you still have to perform a rough mental calculation, as before, to position the decimal point correctly.
This proportioning, or ratio, technique is important. It is the basis of all distance, speed and time calculations and of fuel consumption calculations. We will return to it in the next lesson.

80
Chapter 4 The Navigation ComputerSlide Rule Face

81
Chapter 4The Navigation ComputerSlide Rule Face
QUESTIONS
MULTIPLY: Again giving your answer to three significant figures.
1. 9 x 8 = ....................... 6. 275 x 45 = .......................
2. 11 x 30 = ....................... 7. 121.5 x 14 = .......................
3. 111 x 12 = ....................... 8. 12 x 12 x 12 = .......................
4. 202 x 2.1 = ....................... 9. 237 x 7 x 0.5 = .......................
5. 315 x 0.3 = ....................... 10. 12 x 15 x 13 = .......................
DIVIDE: Giving your answer to three significant figures.
1. 35 ÷ 7 = ....................... 6. 275 ÷ 45 = .......................
2. 210 ÷7 = ....................... 7. 2705 ÷ 4.5 = .......................
3. 32 ÷ 8 = ....................... 8. 72 960 ÷ 12 = .......................
4. 325 ÷ 5 = ....................... 9. 755 ÷ 0.8 = .......................
5. 39 ÷ 60 = ....................... 10. 20.2 ÷ 22 = .......................
PROPORTIONING
1. In the Ruritanian currency, there are 73 skroats to a blat. Fill in the following table:
Skroats 73
Blats 1 2 5 7 13 17
2. Your rate of descent is 270 metres per minute. How many minutes to descend through 2100 metres?
3. How far do you descend in 7 minutes?

82
The Navigation ComputerSlide Rule FaceChapter 4
ANSWERS
1. 9 x 8 = 72.0 6. 275 x 45 = 12375
2. 11 x 30 = 330 7. 121.5 x 14 = 1700
3. 111 x 12 = 1332 8. 12 x 12 x 12 = 1728
4. 202 x 2.1 = 424.2 9. 237 x 7 x 0.5 = 830
5. 315 x 0.3 = 94.4 10. 12 x 15 x 13 = 2340
1. 35 ÷ 7 = 5.00 6. 275 ÷ 45 = 6.11
2. 210 ÷7 = 30.0 7. 2705 ÷ 4.5 = 601.1
3. 32 ÷ 8 = 4.00 8. 72 960 ÷ 12 = 6080
4. 325 ÷ 5 = 65.0 9. 755 ÷ 0.8 = 944
5. 39 ÷ 60 = 0.65 10. 20.2 ÷ 22 = 0.917
1. Skroats 73 146 365 511 949 1241 Blats 1 2 5 7 13 17
2. 7.8 minutes
3. 1890 metres

83
Chapter 5The Navigation ComputerDistance, Speed, Time and Conversions
CHAPTER FIVE
THE NAVIGATION COMPUTER - DISTANCE, SPEED, TIME and CONVERSIONS
Contents
INTRODUCTION . . . . . . . . . . . . . . . . . . . . . . . . . . . . . . . . . . . . . . . 85
DISTANCE, SPEED AND TIME . . . . . . . . . . . . . . . . . . . . . . . . . . . . . . . 86
THE YELLOW SCALE. . . . . . . . . . . . . . . . . . . . . . . . . . . . . . . . . . . . . 88
THE BLUE SCALE . . . . . . . . . . . . . . . . . . . . . . . . . . . . . . . . . . . . . . . 88
FUEL CONSUMPTION . . . . . . . . . . . . . . . . . . . . . . . . . . . . . . . . . . . . 89
DISTANCE CONVERSIONS . . . . . . . . . . . . . . . . . . . . . . . . . . . . . . . . . 91
VOLUME CONVERSIONS . . . . . . . . . . . . . . . . . . . . . . . . . . . . . . . . . . 93
VOLUME TO WEIGHT . . . . . . . . . . . . . . . . . . . . . . . . . . . . . . . . . . . . 94
QUESTIONS . . . . . . . . . . . . . . . . . . . . . . . . . . . . . . . . . . . . . . . . . . 98
ANSWERS . . . . . . . . . . . . . . . . . . . . . . . . . . . . . . . . . . . . . . . . . . .100

84
Chapter 5 The Navigation ComputerDistance, Speed, Time and Conversions

85
Chapter 5The Navigation ComputerDistance, Speed, Time and Conversions
INTRODUCTION
In the last chapter, we saw how it was possible to use a proportioning, or ratio, technique on the Navigation Computer when dealing with problems of rates, i.e. quantities per minute or quantities per hour. The example we used was a rate of climb, which was expressed as 700 feet per minute. By setting ‘700’ (outer scale) against ‘1’ (inner scale), we could read off the number of feet gained (outer scale) in 2 minutes, 3 minutes, 4 minutes, etc (inner scale).
Figure 5.1 700 fpm set up as a ratioFigure 5.1 700 fpm set up as a ratio
The red arrow on the inner scale of the Navigation Computer is the indicator of ‘1’, and is used as the inner scale reference if the answer we want is in the same units. If the red arrow is used to indicate ‘1 minute’, then the answer will be in minutes (and decimals of a minute). This is useful if the rate is given in quantity per minute, as, for instance, rate of climb or descent usually is. If the red arrow is used to indicate ‘1 hour’, then the answer will be in hours and decimals of an hour. This may not be so useful, because few of us work in decimals of an hour. Usually, even if the rate is given ‘per hour’ we want the answer in minutes, or hours and minutes.
Figure 5.2 Base ‘1’ and Base ‘60’ IndicesFigure 5.2 Base ‘1’ and Base ‘60’ Indices

86
Chapter 5 The Navigation ComputerDistance, Speed, Time and Conversions
If this is the case - for instance, fuel flow is usually given in pounds (or kilogrammes) per hour but we usually want the answer in minutes or hours and minutes - then we put the ‘60’ index (the black triangular arrow) against the hourly rate. Suppose our fuel flow is 2000 kg/hour. Then by putting 60 minutes (inner scale) instead of one hour against 2000 (outer scale) we are dividing 2000 by 60. If you now look at the red arrow you are getting the rate per minute (33.33 kg).
Figure 5.3 2000 kg/hour (black triangle) equals 33.3 kg/min (red arrow)
Figure 5.3 2000 kg/hour (black triangle) equals 33.3 kg/min (red arrow)
DISTANCE, SPEED AND TIME
For distance, speed and time problems the outer scale is always distance or speed and the inner scale is always time.
Example. How far do you go in 48 minutes at 120 knots groundspeed?
First, set what you know. Set the groundspeed. Bring the ‘60’ black triangle against 120 knots on the outer scale.
Now find 48 minutes on the minutes (inner) scale. Read off the answer - 96 nm on the outer scale.
Figure 5.4 Finding distance from speed and timeFigure 5.4 Finding distance from speedand time

87
Chapter 5The Navigation ComputerDistance, Speed, Time and Conversions
Example. In 30 minutes you have covered 90 nm over the ground. What is your groundspeed?
Set what you know on the computer. Set 30 minutes (inner scale) against 90 nm (outer scale).
Now read off the groundspeed against the ‘60’ black triangle. The answer is 18.0.
What order of magnitude? At 18 knots, you’d stall. At 1800 knots, you’d strip the wings off. Common sense tells you that this must be 180 knots - which is the right answer.
Figure 5.5 Finding groundspeed from distance and time
Example. Your groundspeed is 220 knots and you have 57 nm to go. How long will it take you?
As before, set what you know. Move the black ‘60’ triangle against 220 knots.
Now bring the cursor round to 57 nm (outer scale, because it’s a distance).
Read off the time on the inner scale. The answer is 15.5. Are we expecting 15 minutes or 150 minutes? 57 nm is about a quarter of 220, so about a quarter of an hour is obviously the right answer. It is 15.5 minutes.
Figure 5.6 Finding time from distance and speed
Figure 5.5 Finding groundspeed fromdistance and time
Figure 5.6 Finding time from distance and speed

88
Chapter 5 The Navigation ComputerDistance, Speed, Time and Conversions
THE YELLOW SCALE
What is the purpose of the yellow scale? It is simply to allow you to convert from minutes to hours and minutes. If we use the ‘60’ black triangle for an hourly rate, we get the answer in minutes, even when it is in excess of one hour. Often, in aviation, we want the answer in hours and minutes.
Suppose an answer comes to 142.6 minutes. Looking at the yellow ring, you can see that this is between 2 hours and 2 hours 30 m. Therefore it must be2 hours 22.6 m.
This is the sole purpose of the yellow scale
Figure 5.7 Between 2 hrs and 2 hrs 30 mins
THE BLUE SCALE
The blue scale gives the value of ram rise. Ram rise is the difference between Static Air Temperature (SAT) and Total Air Temperature (TAT).
Ram Rise = ( TAT - SAT )
Static Air Temperature is the temperature of the ambient atmosphere surrounding the aircraft with no inaccuracies caused by the measurement process. This is the temperature we need to calculate True Air Speed (TAS) from Calibrated Air Speed (CAS) and Pressure Altitude, or to calculate TAS from Mach No. However, what we measure with our temperature probe is the TAT, which is affected by compressibility and kinetic or adiabatic heating, and is always a higher temperature than the SAT.
A good approximation for the value of ram rise is:
Ram Rise = TAS 2 where TAS is in knots
100
Thus, if the TAS is 400 knots, the ram rise is approximately 16°C, if the TAS is 500 the ram rise is approximately 25°C, and so on. However, although this approximation is usually good enough for most practical purposes, it tends to be slightly low and is not as accurate as the answer produced by the Navigation Computer, which is the one which will expected for JAA ATPL examinations.
Figure 5.7 Between 2 hrs and 2 hrs 30 mins
( (

89
Chapter 5The Navigation ComputerDistance, Speed, Time and Conversions
Suppose your TAS is 400 knots. Align the cursor with 400 knots (upper portion of blue scale). Read off the Ram Rise on the lower portion of the blue scale. It’s about 17°C.
So, if the TAT at 400 knots TAS were, say, -22°C, then the SAT would be -39°C.
Figure 5.8 400 knots TAS gives a Ram Rise of 17°C
FUEL CONSUMPTION
Fuel consumption problems work exactly like distance/speed/time calculations. We normally get a fuel consumption per hour, use base 60, and read the answer in minutes. If it comes to more than 60 minutes we use the yellow scale to read the answer in hours and minutes.
Example. Your fuel consumption is 2300 kg/hour. Your time to destination is 1 hour 37 minutes. How much fuel will you use?
Remember - minutes are always on the inner scale.
Set the black triangle against 2300. Align the cursor with 1 hour 37 minutes (97 minutes). Read off the answer - 37.2. The correct answer is obviously 3720 kg.
Using a calculator gives you the answer 3718.33 kg. This should reassure you that the navigation computer is very accurate - in fact, probably considerably more accurate than your fuel gauges.
Figure 5.9 Fuel Consumption
Figure 5.8 400 knots TAS gives aRam Rise of 17°C
Figure 5.9 Fuel Consumption

90
Chapter 5 The Navigation ComputerDistance, Speed, Time and Conversions
Example Your fuel flow is 130 Imp gallons per hour. You have 380 gallons left above your reserves. What is your Safe Endurance?
Set the black triangle against 130.
Align the cursor with 380 (outer scale).
Read off the answer - 175.5 (inner scale). Use the yellow ring to see that this is 2 hours and 55.5 minutes.
Figure 5.10 Fuel Consumption - 2
Example You have used 3700 litres of fuel in the last 1 hour 45 minutes. What is your fuel consumption rate?
Find 3700 on the outer scale and align the cursor.
Bring 1 hour 45 minutes (105 minutes) on the minutes scale into alignment with the cursor. Use the yellow scale to convert hours and minutes to minutes if necessary.
Read off the consumption against the black ‘60’ triangle.
The answer is 21.1. A common- sense check shows that this must be 2110 kg/hour.
The electronic calculator solution is 2114.29. Figure 5.11 Fuel Consumption
Figure 5.10 Fuel Consumption - 2
Figure 5.11 Fuel Consumption

91
Chapter 5The Navigation ComputerDistance, Speed, Time and Conversions
DISTANCE CONVERSIONS
The Navigation Computer can also be used for distance, volume and weight conversions. Taking distance first:
Round the edge of the outer scale are various index marks with red labels. These 3 are for distance conversions:
Figure 5.12 Kilometres to statute miles and nautical miles
Example: Convert 148 kilometres to statute miles and to nautical miles.
The km-m-ltr index on the outer scale is at 10 and the naut m index is at 54 (or 5.4). You should remember that the distance from the Equator to the pole is 10,000 km and is also (90 x 60), i.e., 5400 nautical miles. So 10,000 km = 5400 nm and 10 km = 5.4 nm.
Align 148 on the inner scale with the km- m-ltr index.
Figure 5.13 148 km against the km red index
Figure 5.12 Kilometres to statute miles and nautical miles
Figure 5.13 148 km against the km red index

92
Chapter 5 The Navigation ComputerDistance, Speed, Time and Conversions
Now move the cursor to the naut m index.
Read off the answer 8.0 (on the inner scale) - which must be 80 nm.
Figure 5.14 Align with naut m index
To get the answer in statute miles, now move the cursor to the stat m index and read off 92.
Always remember to read the answer off the inner scale.
A common mistake is to read these conversion answers off the outer scale and then to wonder why they are always the same - 54 nm and 62.5 st m.
Now do one for metres, yards and feet:
Example: Convert 256 metres to yards and feet.
Set on what you know:-Opposite the m (metres and 10) index on the outer scale, set 256 (which is 25.6) on the inner scale.
Then, opposite the yards index on the outer scale read off 28.0 (obviously 280).
Against the feet index on the outer scale, read off 84.0 (obviously 840) on the inner scale.
256 metres = 280 yards = 840 feet.
Figure 5.14 Align with naut m index

93
Chapter 5The Navigation ComputerDistance, Speed, Time and Conversions
VOLUME CONVERSIONS
You can also do volume conversions.These are the litres, Imperial gallons and US gallons index marks.
Figure 5.15 Volume conversion index marksFigure 5.15 Volume conversion index marks
Example: Convert 136 litres to Imperial and to US gallons.
As always, set what you know on the navigation computer.
Put 136 against the litres index Read off against the imp gall index
Figure 5.16 136 against the litres index
Figure 5.17 Reading off the imp gall index This gives 30 Imperial gallons
Figure 5.16 136 against the litres index Figure 5.17 Reading off the imp gall index

94
Chapter 5 The Navigation ComputerDistance, Speed, Time and Conversions
Figure 5.18 Reading off the u.s. gall indexThis gives 36 US gallons
Figure 5.18 Reading off the u.s. gall index
You need to remember that there are about 4½ litres to an Imperial gallon and that there are 5 Imperial galls to 6 US gallons in order to get the order of magnitude right.
VOLUME TO WEIGHT
There is also a facility on the Navigation Computer to convert volume in litres or gallons to weight in kilogrammes or pounds if you know the specific gravity of the liquid (usually fuel). These indices have been spaced so that you can begin with an argument in one set of units and read off the answer in the other units.
A little revision on specific gravity may be useful here. Specific gravity (also known as ‘relative density’) is the density compared with the density of water. One litre of water weighs ONE kilogramme in the metric system and one Imperial gallon of water weighs TEN pounds in the Imperial system. For example, if a fuel has a specific gravity of 0.80, then one litre weighs 0.80 kg and one Imp gall weighs 8.0 pounds.
The calorific value of fuel is related to its mass, not its volume. You need a greater volume of fuel at a lower SG to give the same amount of energy as a smaller volume at a higher SG. This energy may be expressed as range in nautical air miles, or possibly as endurance. Thus, 200 litres at .80 SG weighs 160 kg. If fuel at .75 SG is used, then 213 litres will be needed to cover the same distance.

95
Chapter 5The Navigation ComputerDistance, Speed, Time and Conversions
Example: Convert 300 US Gallons to:
a) Imperial gallons
b) litres
c) pounds weight
d) kilogrammes
using a Specific Gravity of 0.80.
As always, set what you know.Align 300 on the inner scale against the u.s. gall index on the outer scale
Figure 5.19 300 US Gallons
Read off against the imp gall index.
This gives 250 Imperial gallons.
Figure 5.20 250 Imperial Gallons
Figure 5.19 300 US Gallons
Figure 5.20 250 Imperial Gallons

96
Chapter 5 The Navigation ComputerDistance, Speed, Time and Conversions
Now read off against the litres index.
This gives 1135 litres.
Figure 5.21 1135 litres
So far, so familiar. Now look at these 2 scales.
Figure 5.22 SG Scales
Let’s do the ‘pounds weight’ conversion first.
Without moving the inner scale, which is already set up as you require, move the cursor to 0.80 specific gravity on the Sp.G lbs scale. This scale is marked from 70 to 95, representing SGs of 0.70 to 0.95.
Read off 20.0 on the inner scale.
What is the order of magnitude?Remember, we are dealing with 250 Imp Galls. Remember, the SG is 0.8. Therefore we are expecting an answer of about 2000 lbs. Figure 5.23 Converting to pounds weightIn this case, the answer is exactly 2000 lbs.
Figure 5.21 1135 litres
Figure 5.22 SG Scales
Figure 5.23 Converting to pounds weight
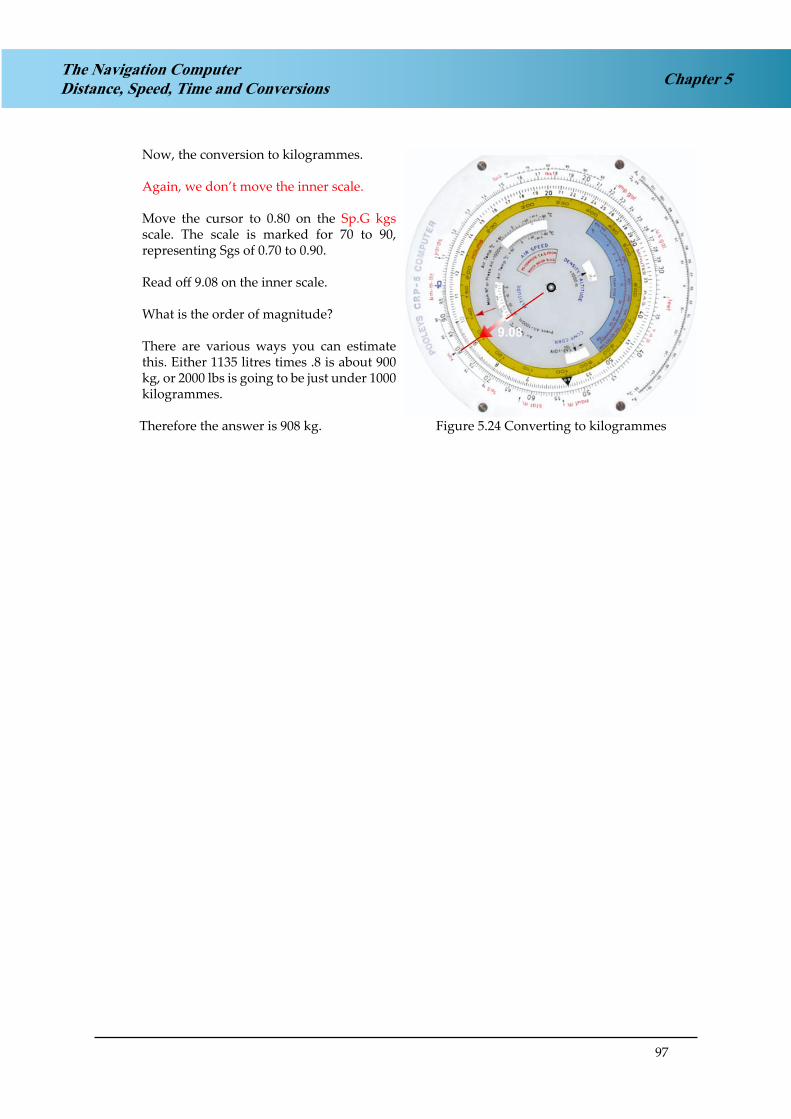
97
Chapter 5The Navigation ComputerDistance, Speed, Time and Conversions
Now, the conversion to kilogrammes.
Again, we don’t move the inner scale.
Move the cursor to 0.80 on the Sp.G kgs scale. The scale is marked for 70 to 90, representing Sgs of 0.70 to 0.90.
Read off 9.08 on the inner scale.
What is the order of magnitude?
There are various ways you can estimate this. Either 1135 litres times .8 is about 900 kg, or 2000 lbs is going to be just under 1000 kilogrammes.
Therefore the answer is 908 kg. Figure 5.24 Converting to kilogrammesFigure 5.24 Converting to kilogrammes

98
The Navigation ComputerDistance, Speed, Time and ConversionsChapter 5
QUESTIONS
Complete the tabulations:-
Groundspeed (kt) Distance (nm) Time (min)
230 33
175 234
182 510
145 15
260 77
200 51
46.5 16.5
231 97
156 43
320 3.5
Fuel Flow Time. Fuel Used
140 litres/hr 1 h 20 min
2120 kg/hr 570 kg
3 h 25 min 400 Imp Gall
8.7 US Gall/hr 2 h 15 min
9800 lb/hr 5 h 20 min
165 kg/hr 420 kg
1 h 47 min 1075
295 US Gall/hr 4 h 40 min
160 litres/hr 1 h 45 min
260 Imp Gall /hr 1120 Imp Gall

99
Chapter 5The Navigation ComputerDistance, Speed, Time and Conversions
Complete the following conversions:-
Nautical Mile Statute Mile Kilometre
88
27
87
141
147
310
10 000
433
Metres Feet
1 000
29
120
356
Litres Imp Gall US Gall SG kg lb
1000 .78
420 .81
800 .84
.80 1000
.72 2000

100
The Navigation ComputerDistance, Speed, Time and ConversionsChapter 5
ANSWERS
Groundspeed (kt) Distance (nm) Time (min)
230 33 8.6
175 234 80
182 510 168
145 36 15
260 334 77
200 170 51
169 46.5 16.5
143 231 97
218 156 43
320 18.5 3.5
Fuel Flow Time Fuel Used
140 litres/hr 1 h 20 min 187 litres
2120 kg/hr 16 min 570 kg
117 Imp Gall 3 h 25 min 400 Imp Gall
8.7 US Gall/hr 2 h 15 min 19.6 US Gall
9800 lb/hr 5 h 20 min 52,267 lb
165 kg/hr 2h 33 min 420 kg
603 lb/hr 1 h 47 min 1075
295 US Gall/hr 4 h 40 min 1377 US Gall
160 litres/hr 1 h 45 min 280 litres
260 Imp Gall /hr 4 h 18 min 1120 Imp Gall
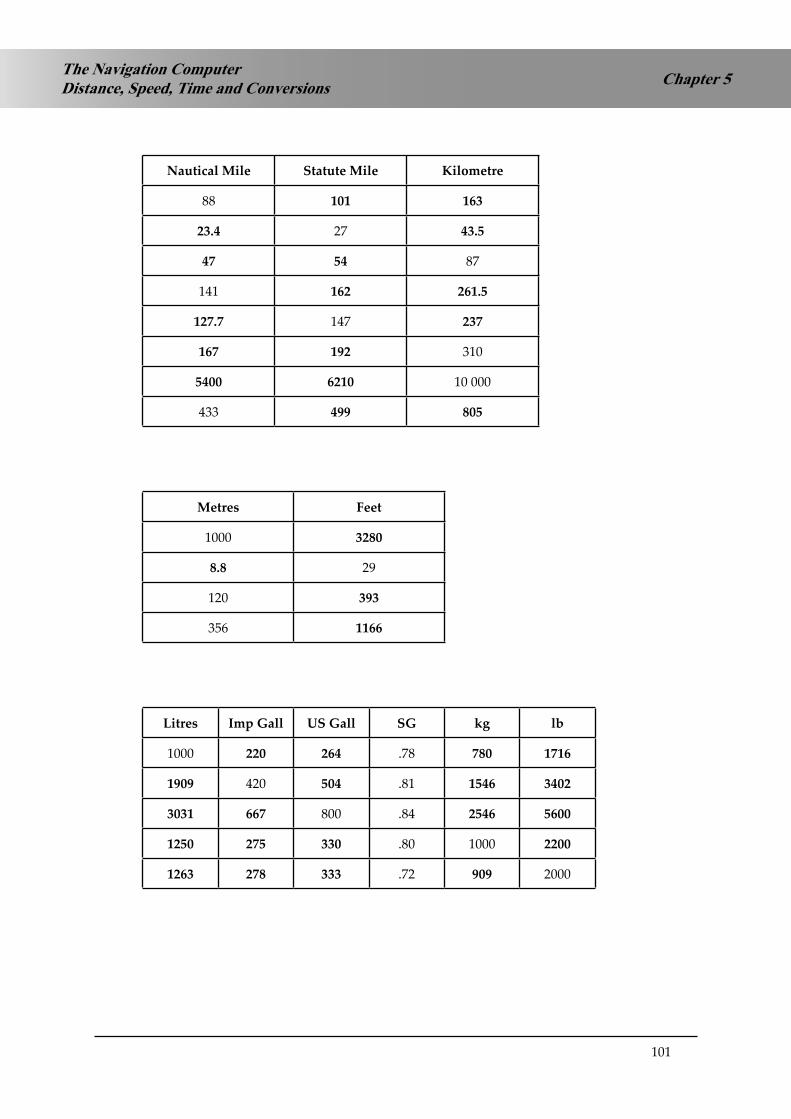
101
Chapter 5The Navigation ComputerDistance, Speed, Time and Conversions
Nautical Mile Statute Mile Kilometre
88 101 163
23.4 27 43.5
47 54 87
141 162 261.5
127.7 147 237
167 192 310
5400 6210 10 000
433 499 805
Metres Feet
1000 3280
8.8 29
120 393
356 1166
Litres Imp Gall US Gall SG kg lb
1000 220 264 .78 780 1716
1909 420 504 .81 1546 3402
3031 667 800 .84 2546 5600
1250 275 330 .80 1000 2200
1263 278 333 .72 909 2000

102
The Navigation ComputerDistance, Speed, Time and ConversionsChapter 5

103
Chapter 6The Navigation ComputerTAS and Altitude Conversions
CHAPTER SIX
THE NAVIGATION COMPUTER - TAS and ALTITUDE CONVERSIONS
Contents
TAS AND ALTITUDE CONVERSIONS . . . . . . . . . . . . . . . . . . . . . . . . . . .105
AIRSPEED INDICATOR ERRORS - APPLICATION OF CORRECTIONS. . . . . . . .105
SUMMARY OF CORRECTIONS TO AIRSPEED INDICATOR . . . . . . . . . . . . . .106
CALCULATION OF TAS FROM CAS - CORRECTION OF DENSITY ERROR . . . . .107
CORRECTION OF COMPRESSIBILITY ERROR . . . . . . . . . . . . . . . . . . . . . .111
CALCULATION OF TAS FROM MACH NUMBER . . . . . . . . . . . . . . . . . . . .113
CALCULATION OF TRUE ALTITUDE . . . . . . . . . . . . . . . . . . . . . . . . . . .115
CALCULATION OF DENSITY ALTITUDE . . . . . . . . . . . . . . . . . . . . . . . . .117
QUESTIONS . . . . . . . . . . . . . . . . . . . . . . . . . . . . . . . . . . . . . . . . . .119
ANSWERS . . . . . . . . . . . . . . . . . . . . . . . . . . . . . . . . . . . . . . . . . . .121

104
Chapter 6 The Navigation ComputerTAS and Altitude Conversions

105
Chapter 6The Navigation ComputerTAS and Altitude Conversions
TAS AND ALTITUDE CONVERSIONS
The Navigation Computer can also be used for the following functions:
Calculation of TAS from CAS
Correction of compressibility error
Calculation of TAS from Mach Number
Calculation of True Altitude from Indicated Altitude
Calculation of Density Altitude from Pressure Altitude
AIRSPEED INDICATOR ERRORS - APPLICATION OF CORRECTIONS
Figure 6.1 overleaf is a breakdown of the corrections to the airspeed indicator (ASI) and the order in which they are applied.
What you see on the instrument is called Indicated Air Speed (IAS). Instrument Error and Pressure (or Position) Error are then applied to give Calibrated Air Speed (CAS). This is the more modern and generally accepted term, but many documents use the older term Rectified Air Speed (RAS). The corrections are applied by use of a correction card usually stuck beside the instrument.
In practice, we do not have separate cards for the Instrument Error and the Pressure Error. It is simpler to combine both corrections onto a single card. IAS is therefore corrected for both Instrument and Pressure Error by the correction card, to give CAS.
Strictly speaking, CAS is then corrected for compressibility error to give Equivalent Air Speed (EAS), to allow for the fact that the density of air is rarely precisely 1225 grams per cubic metre, which is the value for which the ASI is calibrated. (The ISA atmosphere at Mean Sea Level). In practice, as an airline pilot, you are unlikely to deal with EAS and it is rarely encountered outside scientific and test flying. The ASI is already calibrated to allow for compressibility at ISA at MSL and, under those conditions, no compressibility correction is necessary. Compressibility correction is small at True Air Speeds (TAS) lower than 300 knots and no correction is considered necessary.
You will therefore always calculate the Density Error Correction first to give True Air Speed (TAS). If the TAS you find is 300 knots or less, no further correction is necessary. If the TAS is greater than 300 knots, Compressibility Error correction must be applied.

106
Chapter 6 The Navigation ComputerTAS and Altitude Conversions
SUMMARY OF CORRECTIONS TO AIRSPEED INDICATOR
Indicated Air Speed (IAS)
Instrument Error
Pressure (or Position) Error
CAS - Calibrated Air Speed
(Low speed) (High speed)
Density Error Compressibility
< 300 kn = True Air Speed (TAS) Equivalent Air Speed (EAS)
( > 300 kn + Compressibility) Density
True Air Speed (TAS)
Figure 6.1 Sequence of ASI Error Correction

107
Chapter 6The Navigation ComputerTAS and Altitude Conversions
CALCULATION OF TAS FROM CAS - CORRECTION OF DENSITY ERROR
To correct CAS to TAS we need to divide by the square root of the relative density. You will recall this formula from Phase 1:
CAS = TAS √ relative density
Relative to what? The answer is that it is relative to ISA at Mean Sea Level, i.e. 1225 grammes per cubic metre. Look at Figure 6.2 below, which is a table of standard values of the ISA atmosphere.
Flight Level ISA Temp Pressure ISA Density Number of feet to a(°C) (hectopascals) (gm/m3) hectopascal at this
level
00 15 1013.25 1225 27
50 5 843 1056 32
100 -5 697 905 37
150 -15 572 771 43
200 -25 466 653 51
250 -35 376 549 61
Figure 6.2 Values for the ISA Standard Atmosphere
Imagine that we are flying at 100 knots CAS at FL 200 in an ISA atmosphere. The density at that level is 653 grammes per cubic metre. To calculate the relative density:
relative density = 653
= .5331 1225
Therefore:
√relative density = √ 53.5331 = .7301
So, with a CAS of 100 knots, TAS = 100
= 136 knots .7301
If we had an instrument which measured the density of the air we are flying through, we could calculate our TAS in this way. But, in fact, there is no flight deck instrument which gives such a reading.
However, you should remember from your Principles of Flight lectures that:
p
= constant or D ∝ p
TD T
where p = pressure T = temperature and D = density
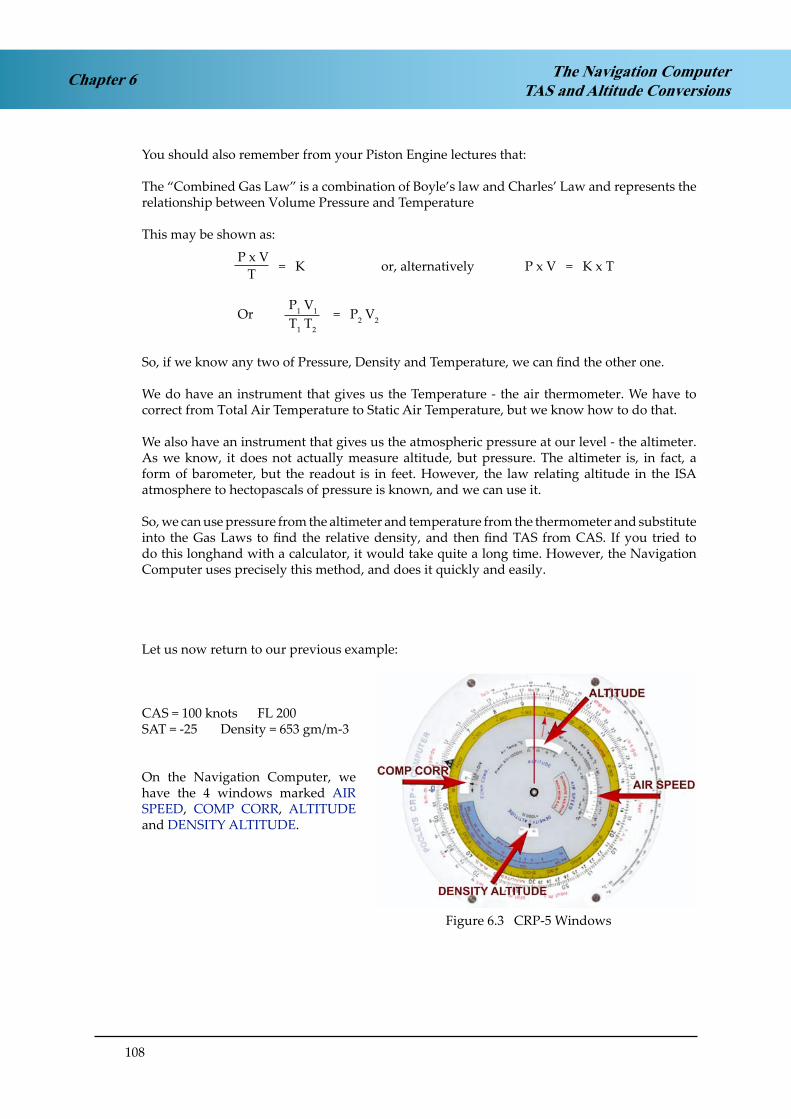
108
Chapter 6 The Navigation ComputerTAS and Altitude Conversions
You should also remember from your Piston Engine lectures that:
The “Combined Gas Law” is a combination of Boyle’s law and Charles’ Law and represents the relationship between Volume Pressure and Temperature
This may be shown as:
P x V
= K or, alternatively P x V = K x T T
Or P1 V1 = P2 V2
T1 T2
So, if we know any two of Pressure, Density and Temperature, we can find the other one.
We do have an instrument that gives us the Temperature - the air thermometer. We have to correct from Total Air Temperature to Static Air Temperature, but we know how to do that.
We also have an instrument that gives us the atmospheric pressure at our level - the altimeter. As we know, it does not actually measure altitude, but pressure. The altimeter is, in fact, a form of barometer, but the readout is in feet. However, the law relating altitude in the ISA atmosphere to hectopascals of pressure is known, and we can use it.
So, we can use pressure from the altimeter and temperature from the thermometer and substitute into the Gas Laws to find the relative density, and then find TAS from CAS. If you tried to do this longhand with a calculator, it would take quite a long time. However, the Navigation Computer uses precisely this method, and does it quickly and easily.
Let us now return to our previous example:
CAS = 100 knots FL 200SAT = -25 Density = 653 gm/m-3
On the Navigation Computer, we have the 4 windows marked AIR SPEED, COMP CORR, ALTITUDE and DENSITY ALTITUDE.
Figure 6.3 CRP-5 WindowsFigure 6.3 CRP-5 Windows

109
Chapter 6The Navigation ComputerTAS and Altitude Conversions
In the AIR SPEED window, align FL200 against -25°C.
This has altered the position of the inner scale relative to the outer scale. You have aligned them up in the ratio of the square root of the relative density. If you want to check this, look at the ‘1’ (shown as ‘10’) on the outer scale. Against it, on the inner scale, you will see the ratio .7301.
Figure 6.4 Align FL200 with -25°C
You now have CAS on the inner scale against TAS on the outer scale. As our theoretical explanation on the previous page showed, 100 knots CAS at FL200 and -25°C is 136 knots TAS.
Figure 6.5 CAS (inner scale) against TAS (outer scale)
You do not require to know, or understand, the theoretical explanation. All that is required is to be able to use the Navigation Computer practically.
Figure 6.4 Align FL200 with -25°C
Figure 6.5 CAS (inner scale) againstTAS (outer scale)
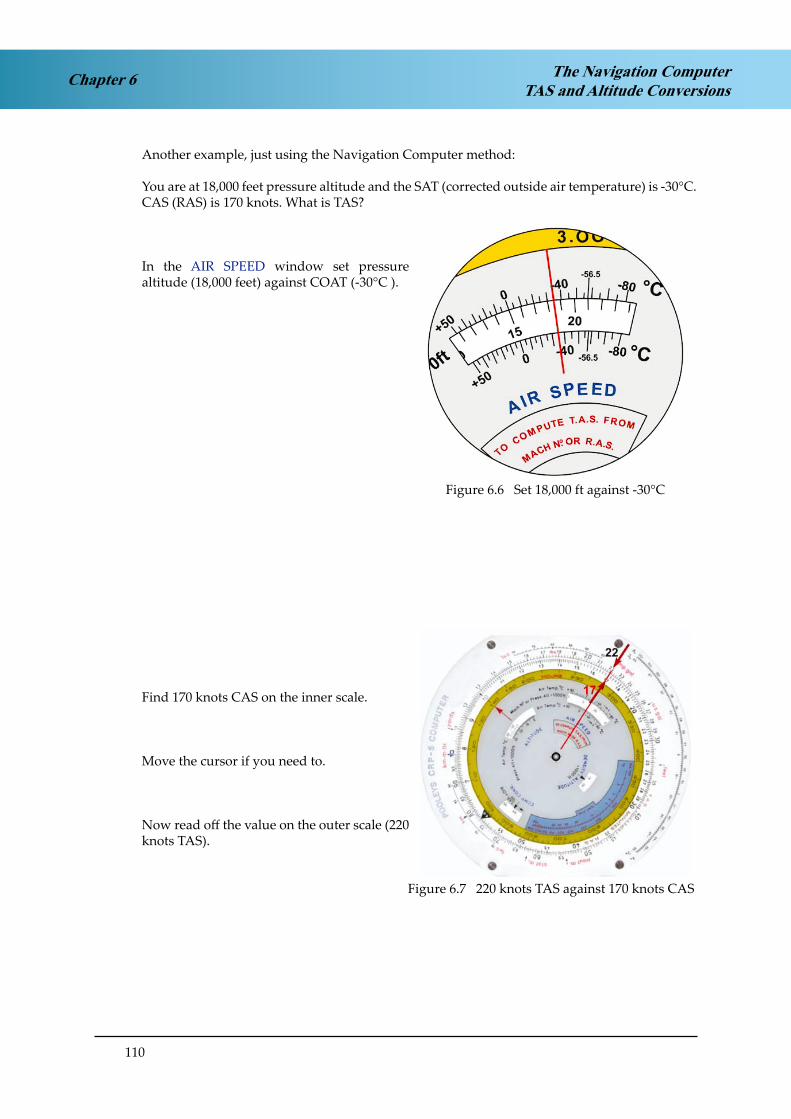
110
Chapter 6 The Navigation ComputerTAS and Altitude Conversions
Another example, just using the Navigation Computer method:
You are at 18,000 feet pressure altitude and the SAT (corrected outside air temperature) is -30°C. CAS (RAS) is 170 knots. What is TAS?
In the AIR SPEED window set pressure altitude (18,000 feet) against COAT (-30°C ).
Figure 6.6 Set 18,000 ft against -30°C
Find 170 knots CAS on the inner scale.
Move the cursor if you need to.
Now read off the value on the outer scale (220 knots TAS).
Figure 6.7 220 knots TAS against 170 knots CAS
Figure 6.6 Set 18,000 ft against -30°C
Figure 6.7 220 knots TAS against 170knots CAS

111
Chapter 6The Navigation ComputerTAS and Altitude Conversions
CORRECTION OF COMPRESSIBILITY ERROR
The ASI is calibrated to allow for compressibility at an atmospheric pressure of 1225 grammes per cubic metre (ISA at MSL), but at any other density (nearly always), compressibility error must be corrected.
Compressibility correction is insignificant at airspeeds less than 300 knots TAS, but must be applied if the initial calculation gives a TAS of more than 300 knots.
Example: Flight Level 350, COAT = -47°C, CAS = 280 knots. What is TAS?
Start by calculating TAS from CAS in the usual way.
In the AIR SPEED window, set FL 350 against -47°C.
Figure 6.8 FL370 against -47°C
Find 280 knots CAS on the inner scale.
Now read off the value on the outer scale (500 knots TAS).
Figure 6.9 280 KCAS against 500 KTAS
Figure 6.8 FL370 against -47°C
Figure 6.9 280 KCAS against 500 KTAS

112
Chapter 6 The Navigation ComputerTAS and Altitude Conversions
This is more than 300 knots TAS. So how do we correct for compressibility?
Under the COMP CORR window you will see the equation here:
TAS - 3 DIV
100
Divide the initial TAS (500 in this case) by 100 and subtract 3.
500 - 3 = 2.0 100
Now, in the COMP CORR window, move the arrow 2 divisions to the left.
From here:
Figure 6.10 The COMP CORR Window
To here:
Figure 6.11 Index moved to the left
This has moved the inner scale to the left, altering the relationship of CAS to TAS, correcting it for compressibility.
Figure 6.10 The COMP CORR Window
Figure 6.11 Index moved to the left

113
Chapter 6The Navigation ComputerTAS and Altitude Conversions
Now read off the new value of TAS on the outer scale corresponding to 280 knots CAS on the inner scale.
This gives a revised TAS of 480 knots.
Figure 6.12 TAS corrected for compressibility
CALCULATION OF TAS FROM MACH NUMBER
Finding TAS from Mach Number is easier than from CAS because there is only one variable - temperature - and no correction for compressibility.
There are 2 methods - a formula, or the Navigation Computer method
The formula is as follows:
TAS = Mach No x 38.95 √ T° A
0°A is -273.16 °C, though -273 °C is a good enough approximation.
Example: COAT = -47°C Mach No = 0.82 What is the TAS?
-47°C = (273 - 47) = 226°A
TAS = 0.82 x 38.95 x √ 226 = 480 knots
Now we will do the same calculation using the Navigation Computer:-
Move the AIR SPEED window round until the Mach No index appears.
Figure 6.13 Location of the Mach No Index
Figure 6.12 TAS corrected for compressibility
Figure 6.13 Location of the Mach No Index

114
Chapter 6 The Navigation ComputerTAS and Altitude Conversions
Set the COAT of -47°Cagainst the index arrow.
Figure 6.14 COAT against Index Arrow
This has set up a relationship between Mach No on the inner scale and TAS on the outer scale.
Read off the TAS of 482 on the outer scale.
Figure 6.15 Mach No (inner) against TAS (outer)
Figure 6.14 COAT against Index Arrow
Figure 6.15 Mach No (inner) against TAS (outer)

115
Chapter 6The Navigation ComputerTAS and Altitude Conversions
CALCULATION OF TRUE ALTITUDEFROM INDICATED ALTITUDE AND TEMPERATURE
The altimeter is calibrated against an ISA atmosphere, so a particular set of values of temperature is assumed. If the temperatures on the day at the various levels of the atmosphere are different from ISA, the indicated value will not correspond to true altitude. At higher levels this is not a problem since all aircraft experience the same temperature error in the same part of the atmosphere and can still maintain vertical separation from each other. However, when close to the ground it is necessary to know true altitude in order to maintain terrain clearance.
If the other altimeter corrections have been made (position error, instrument error) and the correct QNH is set, the indicated error differs from the true altitude by temperature error. This can be corrected either by use of a formula or with the Navigation Computer.
The formula is as follows:
True Altitude = Indicated Altitude + ISA Deviation x Indicated Altitude 273
However, if you treat 1/273 as 1/250, then you can write it as 4/1000. This is the basis of the “4% rule” used in Meteorology.
True Altitude = Indicated Altitude + (ISA Deviation x 4 x Indicated Altitude) 1000
Example: Indicated Altitude is 20,000 feet. SAT is -35°C. What is True Altitude?
ISA at FL200 is -25°C, so our SAT of -35°C is ISA -10°C.
Substituting into the above equation:
True Altitude = 20,000 + ( - 10 x 4 x 20,000) 1000
True Altitude = 20,000 + ( - 800 ) = 19,200 feet
This corresponds to what you would expect. The column of air is 10°C colder than ISA. This means that it is denser air. Therefore the pressure reduces more rapidly than ISA as you climb through the atmosphere because there are fewer feet to a hectopascal with denser air. So you will pass through the required number of hectopascals needed to give an indication of 20,000 feet in less than 20,000 feet True Altitude.
However, it is rather easier with the Navigation Computer. We carry out the correction using the ALTITUDE window.
Figure 6.16 The ALTITUDE Window
( (
Figure 6.16 The ALTITUDE Window

116
Chapter 6 The Navigation ComputerTAS and Altitude Conversions
Using the same example, in the ALTITUDEwindow, align 20,000 feet with the SAT of -35°C. By doing this, you have set up a relationship between the inner and the outer scales.
Figure 6.17 Setting Ind Alt against SAT
The outer scale now shows the True Altitude corresponding to the Indicated Altitude on the inner scale.
Against 20,000 feet (indicated altitude) on the inner scale, read 19,200 feet (True Altitude) on the outer scale.
Figure 6.18 True Alt (outer scale) against Indicated Alt (inner scale)
In any question which requires you to correct Indicated Altitude to True Altitude, the Navigation Computer should always give an accurate answer and there is no need to use the formula. In addition, you can use the ambient temperature directly and there is no need to calculate ISA deviation. True Altitude questions should therefore always be solved by use of the Navigation Computer.
Figure 6.17 Setting Ind Alt againstSAT
Figure 6.18 True Alt (outer scale)against Indicated Alt (inner scale)

117
Chapter 6The Navigation ComputerTAS and Altitude Conversions
CALCULATION OF DENSITY ALTITUDEFROM PRESSURE ALTITUDE AND TEMPERATURE
Density Altitude has nothing to do with vertical distance. It is a measure of aircraft performance. Density Altitude is the altitude in the ISA atmosphere which corresponds to the density which you are experiencing in your current ambient atmosphere. It affects aircraft performance and engine power. Most manufacturers quote a declared performance in terms of Density Altitude. Most performance graphs already allow for this correction in the entering arguments to the graph, but if yours does not you need to be able to calculate it.
As before, there are 2 methods of solving the problem - the formula and the use of the Navigation Computer.
The formula is as follows:
Density Altitude = Pressure Altitude + (ISA Deviation x 120)
(Strictly speaking, the conversion factor should be 118.8, not 120, but 120 is close enough)
Example:You are at Nairobi, pressure altitude 5,500 feet. SAT is +35°C. What is Density Altitude?
ISA at FL5.5 is +4°C, so our SAT of +35°C is ISA +31°C.
Substituting into the above equation:
Density Altitude = 5,500 + ( + 31 x 120 )
Density Altitude = 5,500 + ( 3720 ) = 9,220
Now try the same problem on the Navigation Computer.
This one is not so obvious because you start off with the AIR SPEED window.
Figure 6.19 The AIR SPEED Window
Set 5,500 feet against +35°C.
Figure 6.20 FL against SAT
Figure 6.19 The AIR SPEED Window
Figure 6.20 FL against SAT

118
Chapter 6 The Navigation ComputerTAS and Altitude Conversions
Now look in the DENSITY ALTITUDE window.
Read off the answer of 9,200 feet.
Figure 6.21 DENSITY ALT Window
Figure 6.22 Reading the Answer
Unfortunately, the divisions on the Navigation Computer DENSITY ALTITUDE window are rather small and it can sometimes be difficult to separate closely spaced JAA ATPL examination answer options. With Density Altitude calculations, unlike True Altitude, it may sometimes be necessary to use the formula rather than the Navigation Computer to get a sufficiently accurate answer.
Figure 6.21 DENSITY ALTWindow
Figure 6.22 Reading theAnswer

119
Chapter 6The Navigation ComputerTAS and Altitude Conversions
QUESTIONS
Complete the following tables:
CAS Pressure Altitude SAT(°C) TAS
140 10000 - 10
175 8000 + 5
220 15000 - 22
300 30000 - 40
180 12500 - 25
165 9000 +7
163 11000 +10
295 31000 - 53
160 12000 - 10
260 35000 -45
Mach No SAT (°C) TAS
.82 -50
.66 375
-38 425
.77 -60
.92 580
-47 415
Ind Alt SAT (°C) True Alt
10,000 -20
18,000 -30
6,000 +10
27,000 -50
21,500 -35
8,000 +10

120
The Navigation ComputerTAS and Altitude ConversionsChapter 6
Pressure Alt SAT (°C) Density Altitude
Navigation Computer Solution
Formula Solution
10,000 +15
6,000 +20
27,000 -40
23,000 -22
25,000 -45
29,000 -38

121
Chapter 6The Navigation ComputerTAS and Altitude Conversions
ANSWERS
CAS knots Pressure Altitude SAT(°C) TAS
140 10,000 - 10 162
175 8,000 + 5 200
220 15,000 - 22 273
300 30,000 - 40 472
180 12,500 - 25 212
165 9,000 +7 193
163 11,000 10 199
295 31,000 - 53 465
160 12,000 - 10 192
260 35,000 -45 450
Mach No SAT (°C) TAS
.82 -50 477
.66 -60 375
.71 -38 425
.77 -60 438
.92 -11 580
.71 -47 415
Ind Alt SAT (°C) True Alt
10,000 -20 9,450
18,000 -30 17,400
6,000 +10 6,150
27,000 -50 25,600
21,500 -35 20,800
8,000 +10 8,350
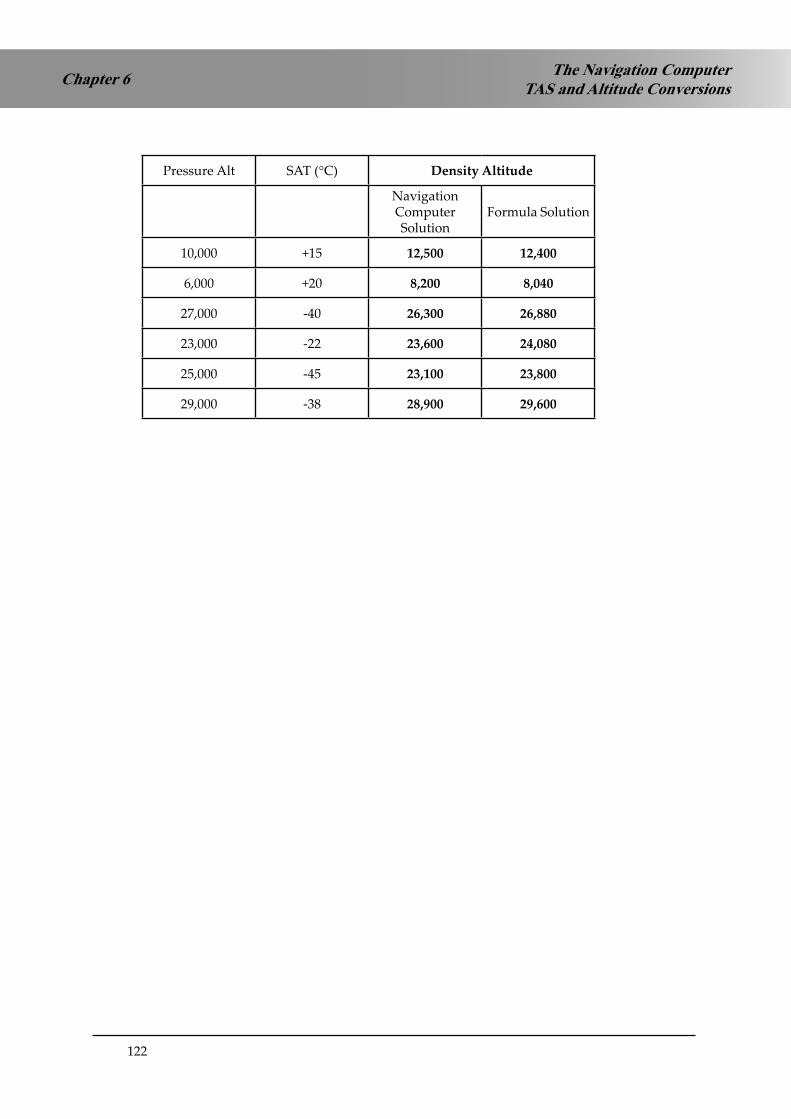
122
The Navigation ComputerTAS and Altitude ConversionsChapter 6
Pressure Alt SAT (°C) Density Altitude
Navigation Computer Solution
Formula Solution
10,000 +15 12,500 12,400
6,000 +20 8,200 8,040
27,000 -40 26,300 26,880
23,000 -22 23,600 24,080
25,000 -45 23,100 23,800
29,000 -38 28,900 29,600

123
Chapter 7The Navigation ComputerTriangle of Velocities
CHAPTER SEVEN
THE NAVIGATION COMPUTER - TRIANGLE OF VELOCITIES
Contents
THE WIND FACE OF THE NAVIGATION COMPUTER . . . . . . . . . . . . . . . . .125
SOME DEFINITIONS . . . . . . . . . . . . . . . . . . . . . . . . . . . . . . . . . . . . .125
THE EFFECT OF WIND . . . . . . . . . . . . . . . . . . . . . . . . . . . . . . . . . . . .126
THE TRIANGLE OF VELOCITIES . . . . . . . . . . . . . . . . . . . . . . . . . . . . . .128
A PRACTICAL EXAMPLE . . . . . . . . . . . . . . . . . . . . . . . . . . . . . . . . . .129
SOLVING THE SAME PROBLEM ON THE NAVIGATION COMPUTER . . . . . . .130
QUESTIONS . . . . . . . . . . . . . . . . . . . . . . . . . . . . . . . . . . . . . . . . . .133
ANSWERS . . . . . . . . . . . . . . . . . . . . . . . . . . . . . . . . . . . . . . . . . . .135

124
Chapter 7 The Navigation ComputerTriangle of Velocities

125
Chapter 7The Navigation ComputerTriangle of Velocities
THE WIND FACE OF THE NAVIGATION COMPUTER
We have completed all aspects of the slide rule face of the Navigation Computer and we now turn our attention to the wind face. However, before we do so we must define some terms, and then discuss the effect of wind on navigation, and introduce the concept of the Triangle of Velocities.
SOME DEFINITIONS
Heading is the direction in which the aircraft is pointing. This is not necessarily the direction in which it is tracking over the ground. As we shall shortly see, if there is any cross-wind component there will be a difference between the direction in which the aircraft is pointing and the direction in which it is traveling.
Heading is defined as the direction in which the fore and aft axis of the aircraft is pointing; it may be measured from True, Magnetic, or Compass North.
Track is the direction of the aircraft’s path over the ground. It may be measured from True or Magnetic North.
Drift is the difference between heading and track. You always drift from your heading to your track. Thus, if your heading is 090°T and your track is 097°T, you are drifting to the right (from heading to track). If your heading is 030°T and your track is 026°T, you are drifting to the left. Have a look at the diagram of the Triangle of Velocities at Figure 7.4 of this chapter. It shows drift to the right.
Port and Starboard. Most countries, and certainly the USA, use the terms ‘left’ and ‘right’ in aviation. However, the British retain an affection for their maritime tradition and so use the terms ‘Port’ and ‘Starboard’ when referring either to the left or right side of the aircraft (looking forwards) or when referring to drift. ‘Port’ is left (easy to remember - ‘Port’ has 4 letters and so does ‘left’). ‘Starboard’ is right.
Course is a word that can lead to enormous confusion. Early British terminology used ‘course’ to mean heading - the direction in which the aircraft is pointing. This practice ceased around 1950, when ‘heading’ became the accepted UK term. However, many present American publications use the word ‘course’ to mean track - the direction of the aircraft’s path over the ground.
Because of this potential for confusion, we will not use the word ‘course’. The unambiguous words ‘heading’ and ‘track’ will always be used. However, the word course may sometimes be used in formal examinations to mean ‘desired track’.

126
Chapter 7 The Navigation ComputerTriangle of Velocities
THE EFFECT OF WIND
Aircraft do not always travel in the direction in which they are pointed. If there is any cross- wind, the track will be different from the heading. We will start by explaining this in terms of a boat crossing a river.
Imagine a river 10 nm wide. Imagine that it has a current of 5 knots.
Figure 7.1 River with currentFigure 7.1 River with current
If you stand at Point A and throw a stick into the river, after one hour it will have been carried 5 nm downstream.
Now imagine that the river has been dammed, and has become a lake. There is now no current and the water is still. This time, you are at Point A with a boat with an outboard motor and a speed of 10 knots through the water. If you set off from Point A to cross directly to the opposite bank, one hour later you will be at Point B.
Figure 7.2 Triangle of velocities - boat crossing riverFigure 7.2 Triangle of velocities - boat crossing river

127
Chapter 7The Navigation ComputerTriangle of Velocities
Now combine these two ideas. The dam is removed and the lake has become a river again. We have our 5 knots current back. We set off in our boat from Point A heading towards Point B. However the effect of the current is to take us downstream, as before, and this time we finish up at Point C, 10 miles across the river and 5 miles downstream. Note that we pointed the boat (heading) towards B, but have actually traveled (track) to C. If we want to finish up at Point B, we need to aim off to the left towards Point D.
This is a continuous process. If we head towards Point B, after, say, 12 minutes (1/5th of an hour), we will be 2 miles across the river and one mile displaced to the right. After 24 minutes, we will be 4 miles across the river and 2 miles downstream, and so on. The boat tracks along the vector AC.
Exactly the same process takes place with aircraft traveling through the air. On a day when the air is completely calm (analogous to the lake), the aircraft tracks where is pointed. We get completely calm days about 6 times a year. However, we still have to be able to navigate on the other 359, so we need to be able to take account of wind, or moving air (analogous to the river).
This term ‘wind’ tends to suggest something transient and many newcomers to aviation find it hard to imagine that something so unsubstantial could have such an effect on such a dense massive aircraft as, say, a Boeing 747, or a dense fast moving aircraft such as a Tornado. This is why this chapter uses this rather elaborate analogy of the river. It is easy to imagine a boat or a twig being carried downstream by a 10 mile expanse of river moving at 5 knots. However, wind is not simply little puffy transient eddies of air. Wind is the continuous movement of an air mass.
An air mass is a large homogenous body of air traveling over the ground - we normally do not regard it as an air mass unless it is at least, say, 60nm by 60nm in size. This whole air mass travels over the ground, just like the river. Your aircraft is supported by this broad mass of air in just the same way as the boat or the twig is supported by the river and it therefore travels in it just as the twig travels in the river.

128
Chapter 7 The Navigation ComputerTriangle of Velocities
THE TRIANGLE OF VELOCITIES
Accordingly, we have to take account of this movement of air when we navigate and this problem is solved by constructing a vector triangle of velocities. The components are always the same:
The Air Vector: The Air Vector consists of Heading and True Air Speed (TAS). TAS is the true (not indicated) speed of the aircraft through the air, and it is the speed that the aircraft would travel over the ground if there were no wind. The Air Vector is always drawn with one direction arrow.
The Wind Vector. The Wind Vector consists of Wind Direction and Wind Speed. Wind direction is always given in terms of the direction that the wind has come from, not where it is blowing to. Thus a wind vector arrow like this:
Figure 7.3 WindVelocity Arrow
Figure 7.3 Wind Velocity Arrow
indicates a wind direction of 330°T, not 150°T. (This does actually correspond to the way that we normally discuss wind direction in everyday speech. A South wind is warm because it has blown up from Morocco, a West wind is warm and wet because it has blown across the Atlantic and over Ireland, etc.). The Wind Vector is always drawn with 3 direction arrows.
The Ground Vector. The Ground Vector is drawn by joining up the Air Vector and the Wind Vector. The resultant vector is Track and Ground Speed. The Ground Vector is always drawn with 2 direction arrows.
Figure 7.4 is a diagram of the Triangle of Velocities. In practice, pilots do not normally draw it out to scale on graph paper, but solve it using an analogue navigation computer. However, as we are just about to find out, the Navigation Computer is merely a device for quickly producing a scale drawing and is actually drawing the Triangle of Velocities for you.
Figure 7.4 Triangle of VelocitiesFigure 7.4 Triangle of Velocities

129
Chapter 7The Navigation ComputerTriangle of Velocities
A PRACTICAL EXAMPLE
Take the following situation:
You are in a Warrior PA 28. TAS is 100 knots.Heading of 000°T.The forecast W/V is 240/30.
What will be your track and groundspeed?
Start by drawing out your Triangle of Velocities.
On a piece of paper (graph paper, ideally), draw in the Air Vector. It will have a direction of000°T and a vector length equivalent to 100 knots (say, 100 mm).
Fig 7.5 The Air Vector
Figure 7.5 The Air Vector
Now draw in the Wind Vector. It was 240/30.
Remember, it’s from 240°. It will actually point in the direction 060°T.Whatever units you used in proportion to 100 knots TAS (100 mm), draw the length of the wind vector in the same units (30 mm).
Fig 7.6 The Air Vector andthe Wind Vector
Figure 7.6 The Air Vector and the Wind Vector
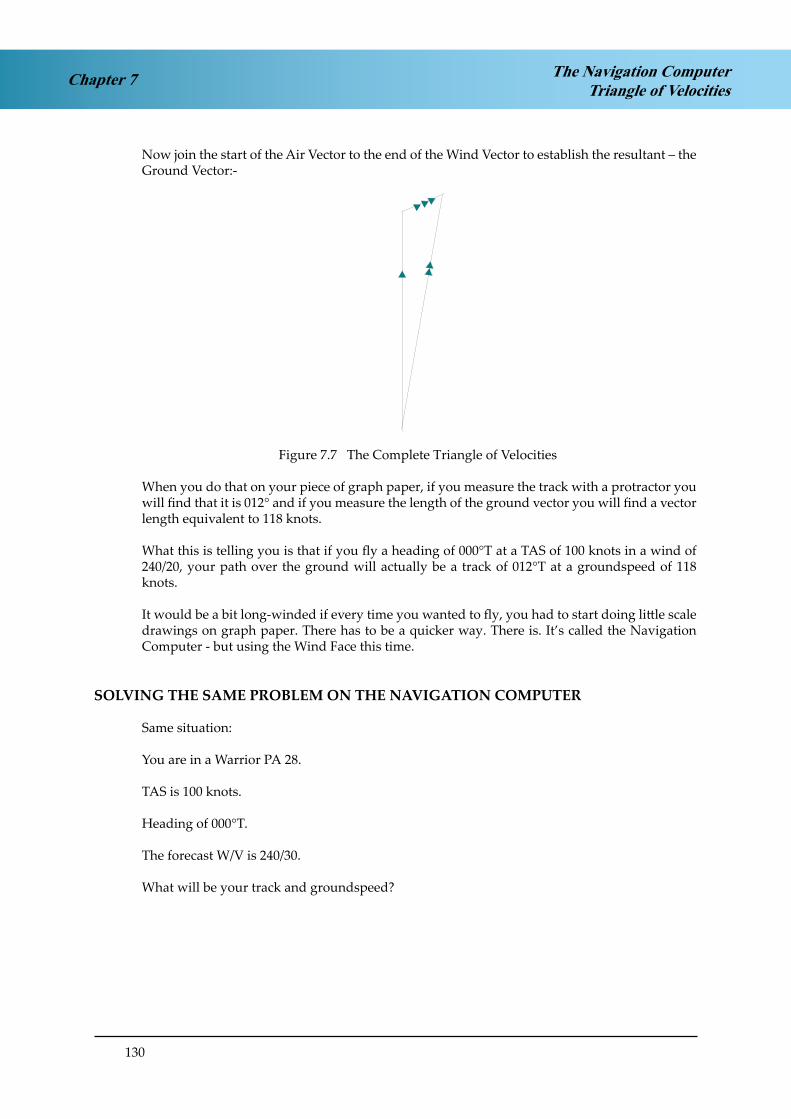
130
Chapter 7 The Navigation ComputerTriangle of Velocities
Now join the start of the Air Vector to the end of the Wind Vector to establish the resultant – the Ground Vector:-
Fig 7.7 The Complete Triangle of Velocities
Figure 7.7 The Complete Triangle of Velocities
When you do that on your piece of graph paper, if you measure the track with a protractor you will find that it is 012° and if you measure the length of the ground vector you will find a vector length equivalent to 118 knots.
What this is telling you is that if you fly a heading of 000°T at a TAS of 100 knots in a wind of 240/20, your path over the ground will actually be a track of 012°T at a groundspeed of 118 knots.
It would be a bit long-winded if every time you wanted to fly, you had to start doing little scale drawings on graph paper. There has to be a quicker way. There is. It’s called the Navigation Computer - but using the Wind Face this time.
SOLVING THE SAME PROBLEM ON THE NAVIGATION COMPUTER
Same situation:
You are in a Warrior PA 28.
TAS is 100 knots.
Heading of 000°T.
The forecast W/V is 240/30.
What will be your track and groundspeed?

131
Chapter 7The Navigation ComputerTriangle of Velocities
Start off by putting the W/V on the Navigation Computer.
Rotate the wind face to bring 240 up to the index (the 12 o’clock position).
Put any convenient datum to measure from (say 100 knots) under the blue circle in the centre of the wind face. (Alternatively, you can use the ‘graph paper’ square grid at the bottom of the slide).
Now plot downwards (in the 6 o’clock direction).
Mark off 30 knots on the wind face. We recommend that you use a soft pencil. You can use a felt-tip pen PROVIDED that it is water-based (non-permanent) ink (pens with grey barrels). DON’T use spirit-based (permanent) pens (with black barrels). Figure 7.8 Plotting the W/V Vector
That’s the Wind Vector plotted. Now for the Air Vector.
Rotate the wind disc to put the Heading (000°) against the True Heading index (12 o’clock position)
Move the slide to put your TAS (100 knots) under the blue circle in the centre.
It should now look like this.
Figure 7.9 Navigation Computer showing the Drift and Groundspeed
Figure 7.9 CRP-5 showing the Drift and Groundspeed

132
Chapter 7 The Navigation ComputerTriangle of Velocities
Now look where the wind mark is positioned. It is about 12 degrees right of the centreline. This means that you have 12 degrees of starboard drift. Your heading is 000°, so your track is 012°.
The groundspeed is obtained by reading it off against the radial arcs. In the above example, it is 118 knots.
These are the same answers that we got by scale drawing.
All that the Navigation Computer has done is to produce an analogue model of our scale drawing.
Figure 7.10 TheTriangle of Velocities on the Face of the CRP-5Figure 7.10 The Triangle of Velocities on the Face of the Navigation Computer
The centre line is the Air Vector, pointing 000°, with a length of 100 knots TAS.
It is joined to the Wind Vector, which you have plotted downwind yourself.
The resultant vector, which connects the start of the Air Vector to the end of the Wind Vector, is the Ground Vector. It tracks up the 12° starboard drift line to give Track direction and Groundspeed vector length.
Now try the examples on the next page:

133
Chapter 7The Navigation ComputerTriangle of Velocities
QUESTIONS
To calculate track and groundspeed:
1. Set wind direction under true heading index.2. Mark in wind dot on centre line of computor BELOW centre dot at a distance equal to
wind speed scale to scale.3. Set true heading at true heading index.4. Set TAS under centre dot.
THE COMPUTER IS NOW SET UP CORRECTLY WITH HEADING AT THE TRUE HEADING INDEX. DO NOT DISTURB THE SETTINGS.
5. Read off drift under wind dot.6. Read off track on circular scale beneath drift on drift scale.7. Read off groundspeed beneath wind dot.
HDG°(T) W/V TRACK°(T) TAS GS
273 230/40 150
181 150/30 90
054 350/28 88
084 255/55 210
141 280/35 190
274 030/40 150
213 060/35 150
029 090/40 170
305 350/16 100
187 270/60 110
310 045/45 320

134
The Navigation ComputerTriangle of VelocitiesChapter 7
HDG°(T) W/V TRACK°(T) TAS GS
138 125/50 390
253 180/70 415
131 210/40 485
100 315/55 480
270 315/55 110
200 125/50 210
180 210/40 135
140 180/70 170
093 045/45 210
103 060/35 240
237 270/60 205
343 030/40 350
030 350/16 390
315 280/35 375
145 090/40 420
290 255/55 490
191 150/30 480
257 350/28 475
157 230/140 460

135
Chapter 7The Navigation ComputerTriangle of Velocities
ANSWERS
HDG°(T) W/V TRACK°(T) TAS GS
273 230/40 286 150 124
181 150/30 194 90 66
054 350/28 073 88 80
084 255/55 082 210 264
141 280/35 135 190 217
274 030/40 262 150 171
213 060/35 218 150 181
029 090/40 016 170 155
305 350/16 297 100 89
187 270/60 157 110 119
310 045/45 302 320 327

136
The Navigation ComputerTriangle of VelocitiesChapter 7
HDG°(T) W/V TRACK°(T) TAS GS
138 125/50 140 390 340
253 180/70 263 415 400
131 210/40 126 485 480
100 315/55 104 480 525
270 315/55 242 110 81
200 125/50 214 210 204
180 210/40 168 135 102
140 180/70 119 170 125
093 045/45 103 210 182
103 060/35 109 240 215
237 270/60 225 205 158
343 030/40 338 350 322
030 350/16 032 390 379
315 280/35 318 375 346
145 090/40 150 420 400
290 255/55 294 490 445
191 150/30 193 480 459
257 350/28 254 475 480
157 230/140 139 460 440

137
Chapter 8The Navigation ComputerWind Finding and Calculation of Heading
CHAPTER EIGHT
THE NAVIGATION COMPUTER - WIND FINDING and CALCULATION of HEADING
Contents
USES OF THE WIND FACE. . . . . . . . . . . . . . . . . . . . . . . . . . . . . . . . . .139
APPLICATION OF FINDING TRACK . . . . . . . . . . . . . . . . . . . . . . . . . . .139
WIND FINDING . . . . . . . . . . . . . . . . . . . . . . . . . . . . . . . . . . . . . . . .140
QUESTIONS . . . . . . . . . . . . . . . . . . . . . . . . . . . . . . . . . . . . . . . . . .144
ANSWERS . . . . . . . . . . . . . . . . . . . . . . . . . . . . . . . . . . . . . . . . . . .146
SOLVING FOR HEADING AND GROUNDSPEED . . . . . . . . . . . . . . . . . . . .148
CHANGING DRIFT . . . . . . . . . . . . . . . . . . . . . . . . . . . . . . . . . . . . . .151
BALANCING THE DRIFT . . . . . . . . . . . . . . . . . . . . . . . . . . . . . . . . . .152
ANOTHER METHOD OF BALANCING THE DRIFT . . . . . . . . . . . . . . . . . . .155
YET ANOTHER METHOD OF BALANCING THE DRIFT . . . . . . . . . . . . . . . .156
QUESTIONS . . . . . . . . . . . . . . . . . . . . . . . . . . . . . . . . . . . . . . . . . .160
ANSWERS . . . . . . . . . . . . . . . . . . . . . . . . . . . . . . . . . . . . . . . . . . .162
PRACTICE FLIGHT PLAN . . . . . . . . . . . . . . . . . . . . . . . . . . . . . . . . . .164
FLIGHT PLAN 1 . . . . . . . . . . . . . . . . . . . . . . . . . . . . . . . . . . . . . . . .165
FLIGHT PLAN 2 . . . . . . . . . . . . . . . . . . . . . . . . . . . . . . . . . . . . . . . .166
FLIGHT PLAN 3 . . . . . . . . . . . . . . . . . . . . . . . . . . . . . . . . . . . . . . . .167
ANSWERS . . . . . . . . . . . . . . . . . . . . . . . . . . . . . . . . . . . . . . . . . . .168
FLIGHT PLAN 1 . . . . . . . . . . . . . . . . . . . . . . . . . . . . . . . . . . . . . . . .168
FLIGHT PLAN 2 . . . . . . . . . . . . . . . . . . . . . . . . . . . . . . . . . . . . . . . .169
FLIGHT PLAN 3 . . . . . . . . . . . . . . . . . . . . . . . . . . . . . . . . . . . . . . . .170

138
Chapter 8 The Navigation ComputerWind Finding and Calculation of Heading

139
Chapter 8The Navigation ComputerWind Finding and Calculation of Heading
USES OF THE WIND FACE
In the previous chapter we showed how, given heading, TAS and a forecast wind, we could use the wind face of the Navigation Computer to calculate the resulting track and groundspeed. In fact, there are several operations that can be carried out using the wind face. Three of the most common are tabulated below:
To Find From When Used
TrackGroundspeed
HeadingTASW/V
If held on a mandatory heading
W/V
HeadingTAS
TrackGroundspeed
Wind finding (the found wind will be more recent and more local than a forecast W/V)
HeadingGroundspeed
TrackTASW/V
Flight planning, or re-calculating a heading in flight (new track or new wind).
APPLICATION OF FINDING TRACK
Finding track, when given heading, as in the last chapter is the simplest operation, though not the one most generally used, and you may have thought that the reason we show it is because it is the simplest one to use to explain the Triangle of Velocities, but has no practical operation. This is not true; its practical use can occur as follows:
Suppose that you are on some pre-planned track, for instance, on airway R123 between Brookman’s Park and Clacton. You have used your Navigation Computer to calculate the desired heading to maintain the track (we have not covered how you do this yet, but that follows shortly) and you still have the forecast W/V marked up on your Navigation Computer. Then, because of a conflict of tracks with other traffic, ATC gives you a mandatory radar heading of 030°T, taking you temporarily off the airway at time 1003. You make a note of your VOR/DME position at the time.
Fig 8.1 Mandatory radar heading off theAirway
Figure 8.1 Mandatory radar heading off the Airway
After a while, the conflict is resolved and 1009 ATC inform you that “You are cleared own navigation to Clacton”. At just that moment, the VOR unlocks. You have no area navigation equipment. How are you going to find the required track to Clacton?

140
Chapter 8 The Navigation ComputerWind Finding and Calculation of Heading
Answer: You use your Navigation Computer. You should have the forecast wind (let us say 315/15) marked up on the wind face from when you were flight planning before the flight. Put your TAS (say, 160 knots) under the centre circle, set the heading of 030° and read off the drift and groundspeed, exactly as in the last lesson. This gives 5° starboard drift, making a track of 035°(T), and a groundspeed of 157 knots.
From the position you noted at 1003, draw a track line of 035°(T) on your chart. You have gone6 minutes (one-tenth of an hour) at 157 knots groundspeed, so that is 15.7 nautical miles. That is your best estimate of position (known as a “dead reckoning” or “DR” position and shown by the following symbol: ).
Fig 8.2 Calculating the DR PositionFigure 8.2 Calculating the DR Position
From the DR position draw a straight line to Clacton. That is your new desired track.
The purpose of this last example is to make the point that there are occasions where you need to be able to calculate track from a given heading, not the other (more common) way round. You will be tested on all 3 Navigation Computer operations in the ATPL examination and you need to be completely familiar with all 3 and to be able to distinguish the use of one from the other.
WIND FINDING
A pilot needs to know what wind is affecting his aircraft in flight at his particular level. This knowledge is available from the meteorological forecast, but the problem with forecasts is that they cover a large area and their period of validity extends over several hours. They can therefore only be a general guide for your area. If you want to find out exactly what wind is affecting you in your local area at the present time, the Navigation Computer can be used to find the wind.

141
Chapter 8The Navigation ComputerWind Finding and Calculation of Heading
Take the following situation:
You are heading 060°(T) at a TAS on 140 knots, in order to fly some planned track.
Figure 8.3 Heading 060°(T)Figure 8.3 Heading 060°(T)
Once airborne, you get a fix at B, say 20 minutes after passing over a known landmark A.
You measure the track angle from A to B on your chart and find that it is 065°(T).
You also measure the distance A to B on your chart and find that it is 40 nautical miles.If you have flown 40 nm in 20 minutes, your groundspeed must be 120 knots.
You now know the following:
Heading = 060°(T)TAS = 140 knotsTrack = 065°(T)Groundspeed = 120 knots
Your triangle of velocities looks like this (Figure 8.4):
Figure 8.4 The Complete Triangle of VelocitiesFigure 8.4 The Complete Triangle of Velocities

142
Chapter 8 The Navigation ComputerWind Finding and Calculation of Heading
What is the wind velocity?
On your Navigation Computer, put the heading 060° against the heading index and the TAS of 140 knots against the blue circle.
The track is 065°, which means you have 5° starboard drift. Make a mark where the 5° S line crosses 120 knots groundspeed.
This is the wind point.
Figure 8.6 The Triangle of Velocities
Figure 8.5 Plotting the Wind Point
Your triangle of velocities looks like this:
Now we need to measure the wind.
Figure 8.6 The Triangle of VelocitiesFigure 8.6 The Triangle of Velocities

143
Chapter 8The Navigation ComputerWind Finding and Calculation of Heading
You can see from the wind face in its present position that the wind direction is from about 030° and that the wind strength is about 20 knots.
Figure 8.7 Wind Direction and Wind Speed
However, we need to measure it a bit more accurately than this.
This is the only reason we rotate the wind vector - to measure it more accurately.
Rotate the wind cross to the 6 o’clock position. You can now read the direction accurately from the 12 o’clock index.
You can also read the length of the wind vector accurately.
So the W/V is, in this example, 034°/23 knots.
This is the wind that has affected you over the last 20 minutes. It will be far more recent and far more local than any area met forecast.
Figure 8.8 Reading the Wind Velocity Accurately
Figure 8.7 Wind Direction and Wind Speed
Figure 8.8 Reading the Wind Velocity Accurately

144
Chapter 8 The Navigation ComputerWind Finding and Calculation of Heading
QUESTIONS
To calculate the wind velocity:
1. Set true heading at the heading index.2. Set TAS under the centre dot.3. Read off drift on drift scale opposite track on circular scale.4. Mark in wind dot at intersection of groundspeed and drift line.5. Rotate face until wind dot lies on centre line BELOW centre dot.6. Read off wind direction at true heading index and wind speed to scale.
HDG°(T) W/V TRACK°(T) TAS GS
209 219 150 134
270 266 180 202
223 224 206 246
069 079 138 124
299 293 125 120
167 162 202 190
213 231 85 80
014 005 200 218
330 348 90 90
179 168 196 226
098 100 310 338
091 080 440 435
050 055 398 415
351 340 393 405
288 292 434 462
276 281 335 316
280 275 430 435
291 292 330 360
097 095 343 322

145
Chapter 8The Navigation ComputerWind Finding and Calculation of Heading
HDG°(T) W/V TRACK°(T) TAS GS
056 055 287 320
108 109 480 530
176 171 428 438
270 265 335 308
248 243 406 332
247 252 380 352
200 202 435 403
198 202 340 325
275 275 435 395
274 275 290 270
321 326 338 280
045 061 285 305
196 205 210 245
311 295 482 435
011 358 198 211
355 008 248 270
111 115 120 114
228 245 460 505
175 168 121 114

146
Chapter 8 The Navigation ComputerWind Finding and Calculation of Heading
ANSWERS
HDG°(T) W/V TRACK°(T) TAS GS
209 155/30 219 150 134
270 055/25 266 180 202
223 050/40 224 206 246
069 014/26 079 138 124
299 002/14 293 125 120
167 217/22 162 202 190
213 144/26 231 85 80
014 129/38 005 200 218
330 250/28 348 90 90
179 300/50 168 196 226
098 300/30 100 310 338
091 172/80 080 440 435
050 298/40 055 398 415
351 085/75 340 393 405
288 155/41 292 434 462
276 224/35 281 335 316
280 014/40 275 430 435
291 125/30 292 330 360
097 124/25 095 343 322

147
Chapter 8The Navigation ComputerWind Finding and Calculation of Heading
HDG°(T) W/V TRACK°(T) TAS GS
056 227/32 055 287 320
108 298/50 109 480 530
176 277/40 171 428 438
270 312/40 265 335 308
248 270/80 243 406 332
247 200/41 252 380 352
200 172/32 202 435 403
198 143/25 202 340 325
275 275/40 275 435 395
274 245/22 275 290 270
321 298/60 326 338 280
045 308/85 061 285 305
196 065/50 205 210 245
311 011/135 295 482 435
011 110/50 358 198 211
355 262/62 008 248 270
111 060/10 115 120 114
228 130/148 245 460 505
175 233/16 168 121 114

148
Chapter 8 The Navigation ComputerWind Finding and Calculation of Heading
SOLVING FOR HEADING AND GROUNDSPEED
Chapter 7 showed how, if you are given the heading, the TAS, and the W/V, you can find your track and groundspeed. The first few pages of this chapter showed the practical use of this and how you can use this when held on a fixed heading.
However, the most common requirement in navigation and planning is finding the heading to fly. In planning a trip, you will join up your turning points on a map using a ruler and then measure the track of the straight line. This means that you already know your track. What you need to know is the heading to fly, because the wind will probably cause some drift. It’s the reverse of the problem we solved earlier.
So let’s see how you use the Navigation Computer, given track, to find the heading to fly.
Take this example:
You are in an aircraft with a planned TAS of 146 knots. The forecast W/V is 315/20.You need to fly a track of 040°T.
What is the heading to fly, and what will your groundspeed be?
Start off by plotting the wind on in the usual way. It’s 315/20.
Figure 8.9 Plotting a wind of 315/20Figure 8.9 Plotting a wind of 315/20

149
Chapter 8The Navigation ComputerWind Finding and Calculation of Heading
Now put the TAS (146 knots) under the blue circle and rotate the central disc round to put the desired track (040°) against the 12 o’clock index.
This will show a drift of 8 degrees starboard, like this:
Figure 8.10 Heading 040°, TAS 146, Drift 8° StarboardFigure 8.10 Heading 040°, TAS 146, Drift 8° Starboard
What this is telling you is that if you fly a HEADING of 040°, you will experience 8° starboard drift and fly a TRACK of 048°.
You want to fly a TRACK of 040°. So what heading do you need?
If a heading of 040° gives you 8° starboard drift, try aiming off 8° to the left and seeing if the drift changes. Try a heading of 032°.

150
Chapter 8 The Navigation ComputerWind Finding and Calculation of Heading
Rotate the disc to put 032° under the 12 o’clock index and check to see whether the drift has changed. Sometimes it does, sometimes it doesn’t. It depends on the geometry of your particular triangle of velocities.
Figure 8.11 Adjusting the Heading to give the Desired Track
Figure 8.11 Adjusting the Heading to give the Desired Track
The drift is still 8° starboard. This means that we have solved the problem. With a heading of032° and 8° starboard drift, we get a track of 040° - which is what we wanted.
Now there’s just one final thing to do - establish what the groundspeed will be.
Figure 8.12 Indication of GroundspeedFigure 8.12 Indication of Groundspeed
You can now see that the groundspeed will be 143 knots.

151
Chapter 8The Navigation ComputerWind Finding and Calculation of Heading
CHANGING DRIFT
Whether the drift changes from your initial attempt at a heading (040° in our last example) to your final heading which gives you the right answer (032° in our last example) depends on the geometry of your triangle of velocities. In the last example, the drift did not change. It was 8° starboard in both cases.
An example of a heading change which gives no change of drift is shown below.
Fig 8.13 Heading Change but no Drift Change
Figure 8.13 Heading Change but no Drift Change
However, in the example below (Figure 8.14), the heading change, with the same wind, gives a change of drift. The drift in the diagram on the right is obviously smaller. It just depends on how big the wind vector is compared to the air vector, how large the heading change is, and the initial value of the angle between wind and heading.
Fig 8.14 Heading Change which causes Drift Change
Figure 8.14 Heading Change which causes Drift Change

152
Chapter 8 The Navigation ComputerWind Finding and Calculation of Heading
BALANCING THE DRIFT
Our first example worked out quite easily because the drift on 032° (your final heading) was the same as the drift on 040° (your first attempt).
This isn’t always the case. Take this example:
TAS = 76 knots Desired Track = 230° Forecast W/V = 110/40
Start in the usual way. Plot the W/V of 110/40.
Figure 8.15 Plotting a W/V of 110/40Figure 8.15 Plotting a W/V of 110/40
Now put 76 knots under the blue circle and bring the desired track of 230° up to the top.
Figure 8.17 The Drift ChangesFigure 8.16 20° Starboard Drift
This shows that if you fly a heading of 230°, with that TAS and W/V, you get 20° starboard drift - a track of 250°.

153
Chapter 8The Navigation ComputerWind Finding and Calculation of Heading
You don’t want this. You want a track of 230°. So aim off 20° to the left - on to a heading of210°. 210° plus 20° starboard drift should give you a track of 230°. Rotate the NavigationComputer wind disc to put 210° at the top.
Figure 8.17 The Drift Changes
But as we do this the drift changes. With the change of heading it now goes out to 25° starboard. This will not give us the desired track. A heading of 210° plus 25° starboard drift gives a track of 235°.
So try aiming off another 5°. Try a heading of 205°. With 25° of drift, that should give us a track of 230°.
Figure 8.18 Drift Increases to 27° Starboard
But it doesn’t! The drift has now increased to 27° starboard. A heading of 205° plus 27° starboard drift will give us a track of 232° . We want 230°.

154
Chapter 8 The Navigation ComputerWind Finding and Calculation of Heading
So try again. Try a heading of 203°. 203° plus 27° starboard drift should give us a track of 230°. Bring 203° against the index at the top and see whether the drift remains at 27° starboard.
Figure 8.19 The Drift Balances
Yes, it does. You still have 27° starboard drift with a heading of 203°. This gives a track of 230°which is what we wanted.
It quite often happens that the first correction for drift changes the drift, so you have to re-adjust. On this particular example we needed 3 movements of the wheel before we got the sum of heading and drift to equal track, and this is unusual, but a second adjustment is not uncommon.
Finally, having got the drift to balance, read off the groundspeed.
In this example, it is 87 knots.

155
Chapter 8The Navigation ComputerWind Finding and Calculation of Heading
ANOTHER METHOD OF BALANCING THE DRIFT
As stated, the last problem was a particularly tricky one, involving 3 twists of the computer. It is known as ‘balancing the drift’. In fact, it is far more complicated to describe in this blow-by-blow account, than to actually do, especially once you have had a bit of practice. However, if you found the method difficult to operate, try this slightly different procedure.
Take the same situation.
TAS = 76 knotsDesired Track = 230°Forecast W/V = 110/40
Start in the usual way. Plot the W/V of 110/40.
Figure 8.20 Plotting a W/V of 110/40
Now bring the desired track of 230° up to the top.
Figure 8.21 20° Starboard Drift
Now observe that the drift under the wind point is 20° starboard and rotate the disc 20° clockwise to bring the desired track of 230° against 20° on the DRIFT STBD scale.
Look at the wind point. The drift has increased to 25° starboard so rotate the disc 5° clockwise to bring 230° against 25° on the DRIFT STBD scale. Check the drift again. It’s now 27°S.
Figure 8.20 Plotting a W/V of 110/40
Figure 8.17 The Drift Changes

156
Chapter 8 The Navigation ComputerWind Finding and Calculation of Heading
Rotate the disc a further 2° clockwise so that track 230° against 27° on the DRIFT STBD scale.
Check the wind point again. The drift is still 27° S. Check that 76 is still exactly under the centre dot (the blue circle).
Read off true heading 203° against the TRUE HEADING index and groundspeed 87 knots from under the wind point - exactly the same answers as before.
Figure 8.22 Balancing the Drift - An Alternative MethodFigure 8.22 Balancing the Drift - An Alternative Method
Some people prefer this method. Practice both and choose the best one for yourself.
YET ANOTHER METHOD OF BALANCING THE DRIFT
Some people find either of the above procedures for accurately balancing the drift difficult to remember and understand. They aren’t difficult, especially with practice, and you will certainly need to be proficient at one of them for your General Navigation and Flight Planning exams.
However, if you are just starting, you may find the following method easier, at least initially. But it is slightly slower, and we do not recommend its use in exams, because speed matters - most people find them tight for time. But this method may at least help you to get started before you switch to the recommended method set earlier.
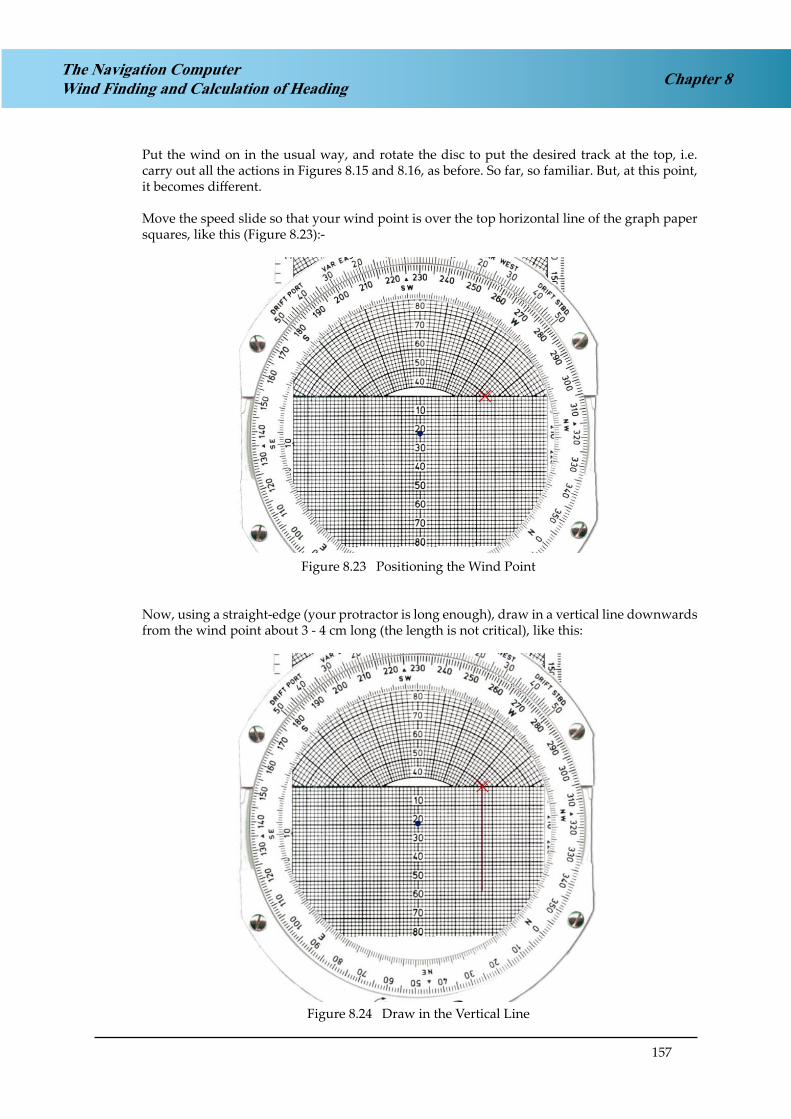
157
Chapter 8The Navigation ComputerWind Finding and Calculation of Heading
Put the wind on in the usual way, and rotate the disc to put the desired track at the top, i.e. carry out all the actions in Figures 8.15 and 8.16, as before. So far, so familiar. But, at this point, it becomes different.
Move the speed slide so that your wind point is over the top horizontal line of the graph paper squares, like this (Figure 8.23):-
Figure 8.23 Positioning the Wind PointFigure 8.23 Positioning the Wind Point
Now, using a straight-edge (your protractor is long enough), draw in a vertical line downwards from the wind point about 3 - 4 cm long (the length is not critical), like this:
Figure 8.24 Draw in the Vertical LineFigure 8.24 Draw in the Vertical Line

158
Chapter 8 The Navigation ComputerWind Finding and Calculation of Heading
Now move the slide to put the TAS (76 knots in this example) under the blue circle, like this:-
Figure 8.25 TAS correctly positionedFigure 8.25 TAS correctly positioned
Rotate the wind disc until your line lines up with one of the drift lines:
Figure 8.26 Aligned with a Drift LineFigure 8.26 Aligned with a Drift Line

159
Chapter 8The Navigation ComputerWind Finding and Calculation of Heading
When it is aligned, you will find that your heading index is now on 203°. You have balanced the drift in one action.
Figure 8.27 Balancing the DriftFigure 8.27 Balancing the Drift
Finally, read off the groundspeed of 87 knots.
Figure 8.28 Read off the GroundspeedFigure 8.28 Read off the Groundspeed

160
The Navigation ComputerWind Finding and Calculation of HeadingChapter 8
QUESTIONS
To calculate heading and groundspeed (Note that this is the one which is normally required):
1. Mark in wind dot.2. Set true track at true heading index.3. Set TAS under centre dot.
THE COMPUTER IS NOW SET UP INCORRECTLY, TRACK IS SET AT THE HEADING INDEX. THE COMPUTER NEEDS RE-SETTING.
4. Read off drift indicated beneath the wind dot.5. Move the track reading on the circular scale to coincide with the drift read off at 4 above
on the drift scale.6. Repeat 4 and 5 above until drift indicated under wind dot agrees with drift indicated
on the drift scale.
THE COMPUTER IS NOW CORRECTLY SET UP. TRUE HEADING IS AT THE TRUE HEADING INDEX AND TAS IS BENEATH THE CENTRE DOT. THE DRIFT HAS BEEN BALANCED.
7. Read off true heading at the true heading index.8. Read off groundspeed under the wind dot.
HDG°(T) W/V TRACK°(T) TAS GS
040/40 155 140
280/27 226 94
320/14 198 136
190/52 284 260
270/83 132 544
310/105 262 572
300/60 355 620
270/75 113 570
240/80 301 455
210/55 313 545

161
Chapter 8The Navigation ComputerWind Finding and Calculation of Heading
HDG°(T) W/V TRACK°(T) TAS GS
335/75 220 553
040/20 005 110
125/35 045 196
170/23 113 210
145/20 021 80
170/30 287 220
300/30 200 137
180/40 130 190
280/24 116 199
262/90 234 605
210/80 071 620
190/80 339 523
305/30 038 585
295/60 355 515
340/85 091 588
235/66 032 485
055/35 197 176
255/15 018 180
090/15 147 74
020/25 140 99

162
The Navigation ComputerWind Finding and Calculation of HeadingChapter 8
ANSWERS
HDG°(T) W/V TRACK°(T) TAS GS
140 040/40 155 140 152
239 280/27 226 94 75
203 320/14 198 136 142
272 190/52 284 260 258
138 270/83 132 544 600
270 310/105 262 572 496
350 300/60 355 620 585
116 270/75 113 570 637
292 240/80 301 455 413
307 210/55 313 545 555

163
Chapter 8The Navigation ComputerWind Finding and Calculation of Heading
HDG°(T) W/V TRACK°(T) TAS GS
227 335/75 220 553 582
011 O40/20 005 110 92
055 125/35 045 196 187
118 170/23 113 210 198
033 145/20 021 80 89
280 170/30 287 220 232
212 300/30 200 137 140
139 180/40 130 190 161
118 280/24 116 199 221
238 262/90 234 605 526
076 210/80 071 620 675
334 190/80 339 523 592
035 305/30 038 585 585
349 295/60 355 515 480
083 340/85 091 588 610
029 235/66 032 485 545
190 055/35 197 176 202
014 255/15 018 180 188
137 090/15 147 74 65
127 020/25 140 99 108

164
The Navigation ComputerWind Finding and Calculation of HeadingChapter 8
PRACTICE FLIGHT PLAN
We now bring together those Navigation Computer facilities on both the Slide Rule face and the Wind face which are needed to complete a flight plan.
In all of the following exercises, work across the rows, row by row. Do not do them column by column. Doing it by rows makes you think about each individual operation and what it is that you are trying to achieve. Doing it by columns just turns it into a no-thought mechanical exercise.

165
Chapter 8The Navigation ComputerWind Finding and Calculation of Heading
FLIGHT PLAN 1
ALT
FT
TEMP
°C
CAS
KT
TAS
KT
TRACK
°(T)
W/V
HDG
°(T)
VAR
HDG
°M
DEV
HDG
°C
GS
KT
DIST
NM
TIM
E
MINS
12
00
0-1
01
60
10
03
30
/17
5°W
1°W
50
24
70
0-2
17
02
27
30
0/1
03
°E2
°E1
12
34
00
0-1
01
75
13
42
62
/17
3°W
1°E
30
42
00
0+
21
70
15
71
10
/12
6°W
2°W
38
.5
56
00
0-
31
54
10
03
20
/18
4°E
1°W
60
65
00
0-1
51
50
05
01
10
/45
8°W
2°E
13
71
00
00
-81
73
32
01
81
/27
3°E
-34
4

166
The Navigation ComputerWind Finding and Calculation of HeadingChapter 8
FLIGHT PLAN 2
ALT
FT
TEMP
°C
CAS
KT
TAS
KT
TRACK
°(T)
W/V
HDG
°(T)
VAR
HDG
°M
DEV
HDG
°C
GS
KT
DIST
NM
TIM
E
MINS
15000
+5
170
070
230/25
5°W
1°E
86
26500
-2170
234
210/30
3°W
2°E
71
36000
+2
174
240
210/22
4°W
1°E
57
47500
+2
175
166
110/30
6°W
3°E
89
58000
-2174
190
245/36
4°E
1°W
60
69000
-5180
050
110/45
11°W
2°E
13
712000
-11
184
324
190/47
3°E
+2
50
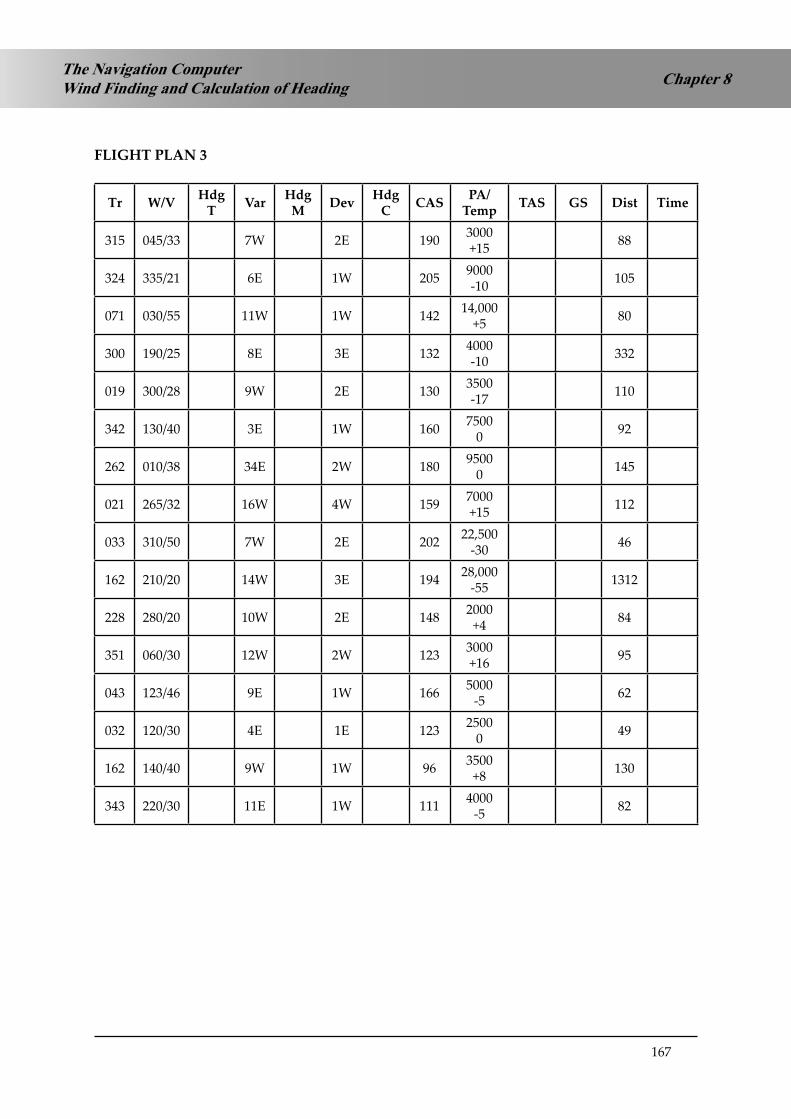
167
Chapter 8The Navigation ComputerWind Finding and Calculation of Heading
FLIGHT PLAN 3
Tr W/V HdgT Var Hdg
M Dev HdgC CAS PA/
Temp TAS GS Dist Time
315 045/33 7W 2E 190 3000+15 88
324 335/21 6E 1W 205 9000-10 105
071 030/55 11W 1W 142 14,000+5 80
300 190/25 8E 3E 132 4000-10 332
019 300/28 9W 2E 130 3500-17 110
342 130/40 3E 1W 160 75000 92
262 010/38 34E 2W 180 95000 145
021 265/32 16W 4W 159 7000+15 112
033 310/50 7W 2E 202 22,500-30 46
162 210/20 14W 3E 194 28,000-55 1312
228 280/20 10W 2E 148 2000+4 84
351 060/30 12W 2W 123 3000+16 95
043 123/46 9E 1W 166 5000-5 62
032 120/30 4E 1E 123 25000 49
162 140/40 9W 1W 96 3500+8 130
343 220/30 11E 1W 111 4000-5 82
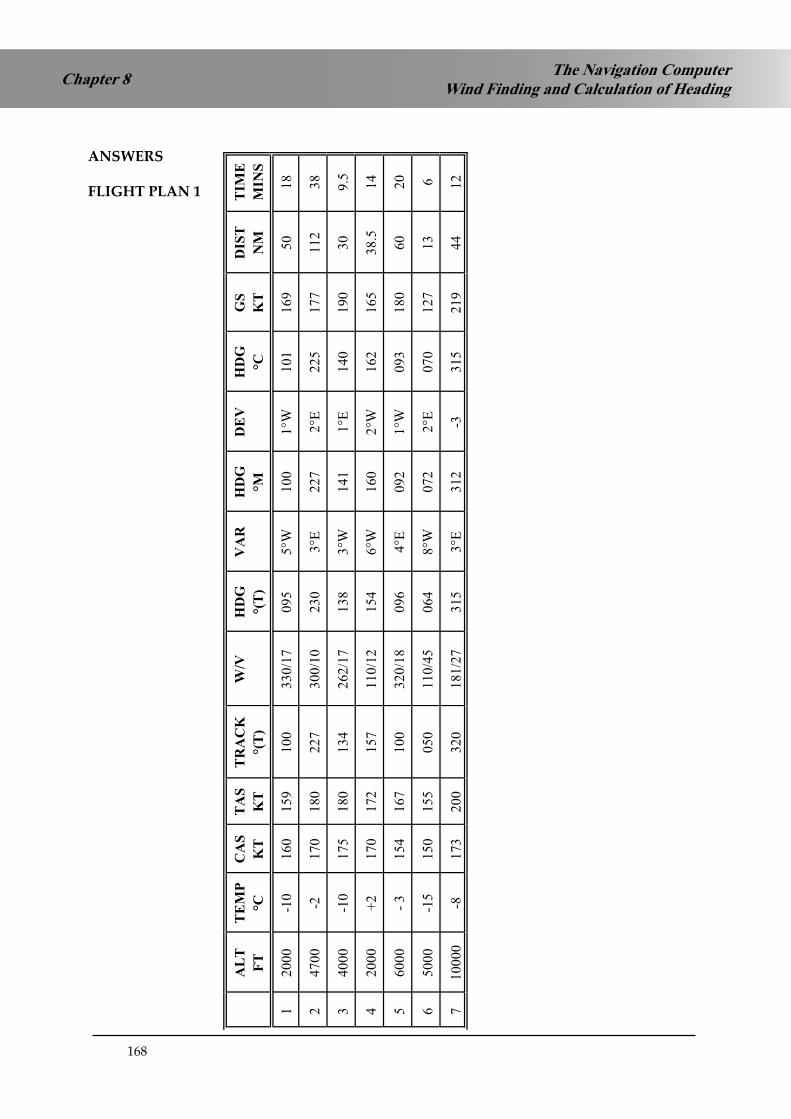
168
The Navigation ComputerWind Finding and Calculation of HeadingChapter 8
ANSWERS
FLIGHT PLAN 1
ALT
FT
TEMP
°C
CAS
KT
TAS
KT
TRACK
°(T)
W/V
HDG
°(T)
VAR
HDG
°M
DEV
HDG
°C
GS
KT
DIST
NM
TIM
E
MINS
12
00
0-1
01
60
15
91
00
33
0/1
70
95
5°W
10
01
°W1
01
16
95
01
8
24
70
0-2
17
01
80
22
73
00
/10
23
03
°E2
27
2°E
22
51
77
11
23
8
34
00
0-1
01
75
18
01
34
26
2/1
71
38
3°W
14
11
°E1
40
19
03
09
.5
42
00
0+
21
70
17
21
57
11
0/1
21
54
6°W
16
02
°W1
62
16
53
8.5
14
56
00
0-
31
54
16
71
00
32
0/1
80
96
4°E
09
21
°W0
93
18
06
02
0
65
00
0-1
51
50
15
50
50
11
0/4
50
64
8°W
07
22
°E0
70
12
71
36
71
00
00
-81
73
20
03
20
18
1/2
73
15
3°E
31
2-3
31
52
19
44
12

169
Chapter 8The Navigation ComputerWind Finding and Calculation of Heading
FLIGHT PLAN 2
ALT
FT
TEMP
°C
CAS
KT
TAS
KT
TRACK
°(T)
W/V
HDG
°(T)
VAR
HDG
°(M)
DEV
HDG
°(C)
GS
KT
DIST
NM
TIM
E
MINS
15000
+5
170
183
070
230/25
073
5°W
078
1°E
077
206
86
25
26500
-2170
186
234
210/30
230
3°W
233
2°E
231
158
71
27
36000
+2
174
190
240
210/22
237
4°W
241
1°E
240
171
57
20
47500
+2
175
197
166
110/30
159
6°W
165
3°E
162
179
89
30
58000
-2174
196
190
245/36
196
4°E
192
1°W
193
180
60
20
69000
-5180
206
050
110/45
061
11°W
072
2°E
070
180
13
4
712000
-11
184
220
324
190/47
315
3°E
312
+2
310
250
50
12

170
The Navigation ComputerWind Finding and Calculation of HeadingChapter 8
FLIGHT PLAN 3
Tr W/V HdgT Var Hdg
M Dev HdgC CAS PA/
Temp TAS GS Dist Time
315 045/33 325 7W 332 2E 330 190 3000+15 200 197 88 27
324 335/21 325 6E 319 1W 320 205 9000-10 230 210 105 30
071 030/55 059 11W 070 1W 071 142 14,000+5 182 137 80 35
300 190/25 290 8E 282 3E 279 132 4000-10 135 141 332 141
019 300/28 007 9W 016 2E 014 130 3500-17 132 122 110 54
342 130/40 349 3E 346 1W 347 160 75000 179 211 92 26
262 010/38 272 34E 238 2W 240 180 95000 208 217 145 40
021 265/32 012 16W 028 4W 032 159 7000+15 180 192 112 35
033 310/50 023 7W 030 2E 028 202 22,500-30 284 274 46 10
162 210/20 165 14W 179 3E 176 194 28,000-55 291 279 1312 281
228 280/20 234 10W 244 2E 242 148 2000+4 150 137 84 37
351 060/30 003 12W 015 2W 017 123 3000+16 130 116 95 49
043 123/46 058 9E 049 1W 050 166 5000-5 175 161 62 23
032 120/30 046 4E 042 1E 041 123 25000 124 120 49 25
162 140/40 153 9W 162 1W 163 96 3500+8 101 63 130 124
343 220/30 330 11E 319 1W 320 111 4000-5 115 129 82 38

171
Chapter 9The Navigation ComputerMulti-Drift Winds and Wind Components
CHAPTER NINE
THE NAVIGATION COMPUTER - MULTI-DRIFT WINDS and WIND COMPONENTS
Contents
FURTHER USES OF THE WIND FACE . . . . . . . . . . . . . . . . . . . . . . . . . . .173
MULTI-DRIFT WINDS . . . . . . . . . . . . . . . . . . . . . . . . . . . . . . . . . . . .173
TWO-DRIFT WINDS. . . . . . . . . . . . . . . . . . . . . . . . . . . . . . . . . . . . . .176
QUESTIONS . . . . . . . . . . . . . . . . . . . . . . . . . . . . . . . . . . . . . . . . . .177
ANSWERS . . . . . . . . . . . . . . . . . . . . . . . . . . . . . . . . . . . . . . . . . . .178
WIND COMPONENTS . . . . . . . . . . . . . . . . . . . . . . . . . . . . . . . . . . . .179
REQUIREMENT FOR WIND COMPONENT CALCULATIONS. . . . . . . . . . . . .180
WIND DIRECTIONS – TRUE OR MAGNETIC? . . . . . . . . . . . . . . . . . . . . . .180
CALCULATION OF WIND COMPONENTS . . . . . . . . . . . . . . . . . . . . . . . .181
MAXIMUM WIND STRENGTH FOR A GIVEN CROSSWIND COMPONENT . . . .182
HEADWIND AND CROSSWIND LIMITS . . . . . . . . . . . . . . . . . . . . . . . . .184
TAILWIND COMPONENTS . . . . . . . . . . . . . . . . . . . . . . . . . . . . . . . . .185
ALLOWABLE WIND ANGLE FOR A GIVEN WINDSPEED . . . . . . . . . . . . . . .187
QUESTIONS . . . . . . . . . . . . . . . . . . . . . . . . . . . . . . . . . . . . . . . . . .189
ANSWERS . . . . . . . . . . . . . . . . . . . . . . . . . . . . . . . . . . . . . . . . . . .190

172
Chapter 9 The Navigation ComputerMulti-Drift Winds and Wind Components

173
Chapter 9The Navigation ComputerMulti-Drift Winds and Wind Components
FURTHER USES OF THE WIND FACE
There are 2 other applications of the wind face which can be of use to pilots. One is finding winds from measuring drift only, not groundspeed. This is called “multi-drift winds”. The other is the use of the Navigation Computer to establish head/tailwind and crosswind components. The technique could well be practical use to a pilot operating is basic environment without sophisticated navigation aids.
MULTI-DRIFT WINDS
Experienced pilots can often assess their drift with considerable accuracy just by estimation of the angle between their heading and the angle that a particular object on the ground makes as it appears to track underneath their aircraft at low altitude. Bush pilots and maritime patrol pilots, in particular, tend to develop this skill with experience. However, it is very difficult to assess groundspeed quickly, except by timing the rate of DME distance change over a short period, and this only works when tracking directly towards or away from the DME, which may not always be the case. The alternative is using a stopwatch over a short pre-calculated distance, but this requires detailed pre-flight preparation and is not usually practicable.
However, it is possible to find a W/V by use of drift only, though it requires the pilot to fly on 2, or preferably, 3 headings which cut at a large angle to each other. This technique is known as the “multi-drift wind”.
The best multi-drift winds come from a 3-heading check, with the headings at 60° to each other. We will assume that a pilot is flying an initial heading of 030° at a TAS of 120 knots and decides that he needs an update of the W/V. He therefore assesses his drift on his present heading, then turns 60° left and makes another drift assessment, then turns 120° right for a third drift assessment. He then returns to his original heading. He notes the drift in each case and comes up with the following summary:-
Heading Drift
030° 10°P
330° 5°P
090° 5°P
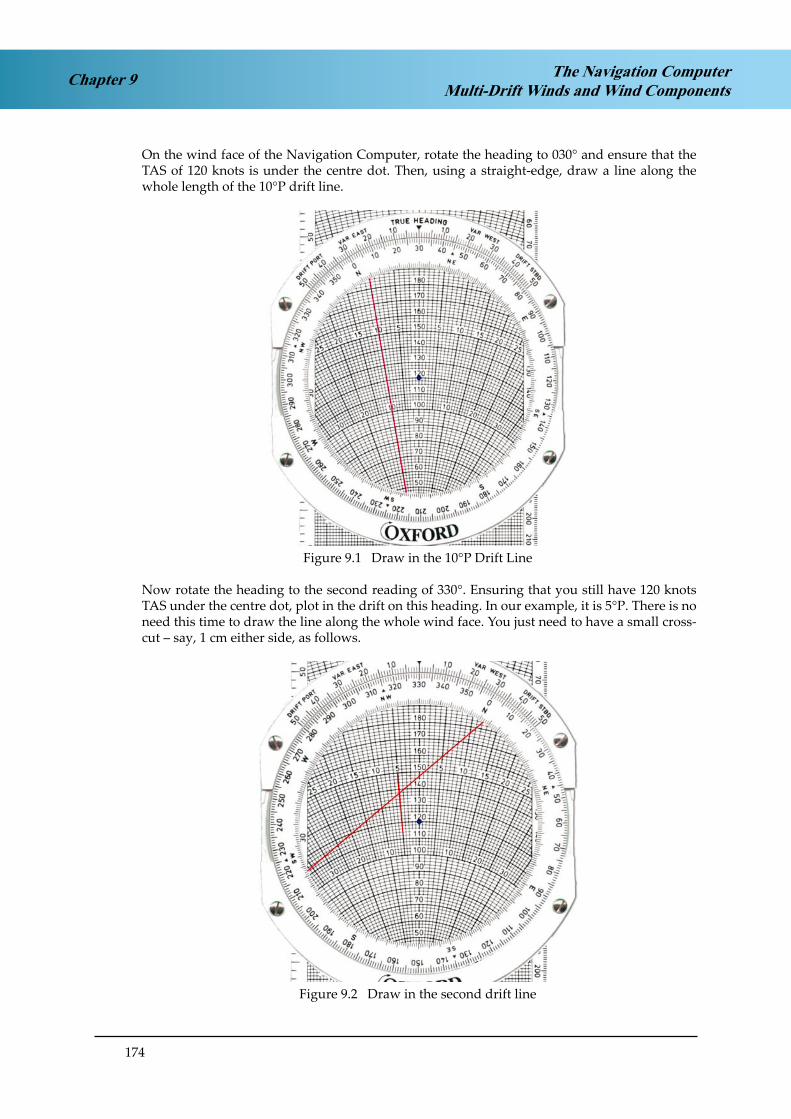
174
Chapter 9 The Navigation ComputerMulti-Drift Winds and Wind Components
On the wind face of the Navigation Computer, rotate the heading to 030° and ensure that the TAS of 120 knots is under the centre dot. Then, using a straight-edge, draw a line along the whole length of the 10°P drift line.
Figure 9.1 Draw in the 10°P Drift LineFigure 9.1 Draw in the 10°P Drift Line
Now rotate the heading to the second reading of 330°. Ensuring that you still have 120 knots TAS under the centre dot, plot in the drift on this heading. In our example, it is 5°P. There is no need this time to draw the line along the whole wind face. You just need to have a small cross-cut – say, 1 cm either side, as follows.
Figure 9.2 Draw in the Second Drift LineFigure 9.2 Draw in the second drift line

175
Chapter 9The Navigation ComputerMulti-Drift Winds and Wind Components
Now rotate the heading to the third reading of 090°. Ensuring that you still have 120 knots TAS under the centre dot, plot in the drift on this heading. In our example, it is 5°P again
If the drifts have been assessed correctly, the third line should lie over or very near the other two, like this:-
Figure 9.3 Plotting the FinalLine
Figure 9.3 Plotting the final line
If the 3 lines do not coincide, a triangle will be formed by the intersection. This triangle is known as the “cocked hat”. The size of the triangle is an indication of the accuracy of the drift assessment. If they coincide, it is probable that all the drift assessments were correct. A small cocked hat means that the probable error is small. With a larger cocked hat, probably one or more of the drifts is in error to some extent.
However, assuming no cocked hat or only a small one (in which case you take the centre), you have established the W/V by taking the intersection of the drift lines. The 3 lines intersect at the wind point. Rotate it round to the 6 o’clock position to measure the wind speed and direction. In this example it is 115/21.
Figure 9.4 Read off the W/VFigure 9.4 Read off the W/V

176
Chapter 9 The Navigation ComputerMulti-Drift Winds and Wind Components
TWO-DRIFT WINDS
The 3-drift wind would only be necessary for particular applications (for example, bush flying and maritime flying, as previously discussed). However, it would be possible to use 2-drift winds when flying on airways in UK in an aircraft which is not equipped with more than airways minimum navaids (i.e. no RNAV, GPS, INS or FMS). In this case, the 2 headings need to be at nearly right angles to each other, and certainly in excess of 70°. Consider the situation below:
Figure 9.5 An Airways Route from Brecon to Ottringham via Wallasey
Figure 9.5 An airways route from Brecon to Ottringham via Wallasey
The planned track from Brecon to Wallasey is 008°M along airway A25, then from Wallasey to Ottringham on a track of 085°M along airway B1. The pilot homes into Wallasey by applying his planned drift to the VOR track. If his drift is wrong, the VOR radial will change. He gets back onto the correct centreline, then modifies his drift depending on how the radial changed. After a short period of trial and error he will establish the correct drift to hold the radial.
He then arrives at Wallasey and turns onto the planned heading to hold the outbound track along B1. Again, if the planned drift was not correct there will another short series of trials and corrections until he finds the heading that holds the VOR radial consistently. He now has drifts for 2 headings and can use the Navigation Computer to find the wind point from the cross-cut of the drifts on the appropriate headings. The only problem with a 2-drift wind is that there is no confirmatory third cut to give some confidence in the other two, but it should be possible to assess the drift reasonably accurately when flying along a VOR centreline.

177
Chapter 9The Navigation ComputerMulti-Drift Winds and Wind Components
QUESTIONS
1 TAS = 180 knots
Heading Drift
130 6°P
070 4°P
190 2°P
W\V
2 TAS = 150 knots
Heading Drift
045 3°S
345 6°P
105 8°S
W\V
3 TAS = 120 knots
Heading Drift
270 2°S
210 12°S
330 9½°P
W\V
4 TAS = 165 knots
Heading Drift
100 2°P
040 14°P
160 12°S
W\V

178
The Navigation ComputerMulti-Drift Winds and Wind ComponentsChapter 9
ANSWERS
1 TAS = 180 knots
Heading Drift
130 6°P
070 4°P
190 2°P
W\V 205/18
2 TAS = 150 knots
Heading Drift
045 3°S
345 6°P
105 8°S
W\V 026/22
3 TAS = 120 knots
Heading Drift
270 2°S
210 12°S
330 9½°P
W\V 098/30
4 TAS = 165 knots
Heading Drift
100 2°P
040 14°P
160 12°S
W\V 107/40

179
Chapter 9The Navigation ComputerMulti-Drift Winds and Wind Components
WIND COMPONENTS
The resolution of wind into head or tail wind and crosswind components is of importance both in en route flying (particularly as part of the Flight Planning syllabus) and in take-off and landing. There are various techniques of rapidly calculating crosswind components using mental arithmetic and rule of thumb methods, but these are not precise enough for General Navigation ATPL exam questions, which have to be resolved by use of the Navigation Computer in order to ensure the required level of accuracy.
The wind rarely blows directly along the line of an en route track or along the centreline of a runway. There is almost always an angle between the track or the runway direction and the direction from which the wind is blowing.
Figure 9.6 Wing Direction and RunwayRelationship
Figure 9.6 Wing Direction and Runway Relationship
If the wind direction and the runway direction were the same, the full force of the wind would be directed along the runway and there would be no effect across it.
However, in the above example where the wind is blowing at an ‘angle-off’ of 30° from the right, only part of the force is directed along the runway. The other part is directed across the runway from right to left. The wind velocity of 300°M/30 knots is resolved into 2 components, one acting along the runway, called the headwind component, and the other acting across the runway, called the crosswind component.
It would be possible to solve this by taking the sine and cosine of the wind angle of 30°. The headwind component will be 30 knots x cos 30°, i.e. 26 knots, whilst the crosswind component will be 30 knots x sin 30°, i.e. 15 knots. However, it is simpler to do it using the Navigation Computer.
Figure 9.7 Wind ComponentsFigure 9.7 Wind Components

180
Chapter 9 The Navigation ComputerMulti-Drift Winds and Wind Components
REQUIREMENT FOR WIND COMPONENT CALCULATIONS
Pilots need to be able to calculate both headwind and crosswind components. Taking headwind first:
Threshold speed is CAS (or IAS, for all practical purposes). This corresponds to a TAS. However, stopping on a runway depends on the value of ½mv2. The ‘v’ is groundspeed. A headwind will reduce the groundspeed on touchdown, requiring less brake energy to stop in a given runway length. For a heavy aircraft on a short runway, there may be a minimum headwind requirement, below which it will not be possible to stop with an adequate safety margin.
Crosswind can be even more critical. This is because:
With a crosswind, the pilot needs to line up on the approach using the extended centreline of the runway as a reference, then point the nose into wind to lay off for the drift on finals. At the moment that the undercarriage is about to touch down, it is necessary to apply rudder to re-align the aircraft with the runway. This is usually called “kicking off the drift”, although it should be a controlled application of rudder, not a “kick”, and applying the correct amount requires a certain amount of skill and judgement. The greater the crosswind, the more difficult this problem becomes.
Even if the pilot judges this perfectly and the aircraft is precisely lined up with the runway at the moment the tyres make contact there will still be a sideways velocity. Tyres are mainly stressed to take fore-and-aft loads, not sideways ones, and it is possible to burst tyres on crosswind landings.
Finally, once the pilot has got the aircraft down, he may have trouble holding it on the runway, especially if the aircraft has a high tail fin. As the speed slows down, the rudder has less control authority and may not be able to counteract the crosswind component acting on the rest of the fin. The aircraft may run off the runway.
For these reasons, there will be a maximum crosswind component specified for the type of aircraft. Companies may also apply their own rules, quite apart from the aircraft limitation. For instance, an aircraft may be cleared to land in up to 25 knots crosswind, but a company might have rules that the first officer may only land with a crosswind of up to 15 knots. Above that, it has to be the captain’s landing.
WIND DIRECTIONS – TRUE OR MAGNETIC?
Any FORECAST wind is given in true direction. Thus any written meteorological information (TAF, METAR, etc) will be in true. Forecast winds are used for planning navigation as well as landing and navigation tracks are normally initially measured in true.
Any information used to help the pilot line the aircraft up on the runway will be given in magnetic, because runway directions are always magnetic. Thus a wind from an ATC controller will be magnetic and the ATIS always quotes magnetic wind direction.
To summarise:-
MAGNETIC - ATC and ATIS TRUE - VOLMET, TAF and METAR

181
Chapter 9The Navigation ComputerMulti-Drift Winds and Wind Components
CALCULATION OF WIND COMPONENTS
Navigation Computer
Take the following example:-
R/W 27 ATIS W/V 310/30
Firstly, using the ‘graph paper’ part of the Navigation Computer scale at the bottom of the slide, plot the wind velocity in the normal way.
Figure 9.8 Plot W/V of 310/30Figure 9.8 Plot W/V of 310/30
Now rotate the wind disc to put the runway QDM of 270 at the 12 o’clock index.
Figure 9.9 Rotate to Runway QDM (270)
Figure 9.9 Rotate to Runway QDM (270)

182
Chapter 9 The Navigation ComputerMulti-Drift Winds and Wind Components
Now read vertically ‘down’ the y-axis. This gives you the headwind component. In this example it is 23 knots headwind.
Read across from the centreline (the x-axis). This gives you the crosswind component. In this example it is 19 knots crosswind (from right to left).
Figure 9.10 Reading off Headwind and CrosswindFigure 9.10 Reading off Headwind and Crosswind
MAXIMUM WIND STRENGTH FOR A GIVEN CROSSWIND COMPONENT
Sometimes the wind is blowing from a known given direction but it is gusting. A gust is defined as a change of 10 knots wind over a period of one minute. However, gusts are often stronger and change more rapidly than that. You may wish to try to land between gusts. In this case you continue the approach down to the point at which you must commit to a landing or go around. For a visual approach this will be far lower than an instrument decision height. It may be 50 feet or lower, depending on the handling of your aircraft. At the last moment you request a spot readout of wind from the tower. If the windstrength from the actual direction gives a crosswind component of your crosswind limit or less, you can land. Otherwise, you must go around.
The moment of visual committal decision is no time to start calculating crosswind limits. You should have thought about it beforehand. Before you start the approach, you calculate what windstrength from the forecast direction corresponds to your crosswind limit on the runway in use. The calculations are made at the top of descent to allow an instant decision at the visual committal point.
Take the following case:
TAF W/V 180/ 10G50Variation 15WR/W 23Crosswind limit 25 knots
This type of calculation requires a different technique. In this case, you do not have a single value of wind, so you cannot put it on your Navigation Computer.
Instead you put the runway and the crosswind on your computer, as follows:

183
Chapter 9The Navigation ComputerMulti-Drift Winds and Wind Components
Put the R/W QDM (230) up at the top.
Then draw in 25-knot cross limit parallel lines either side of the centreline.
Figure 9.11 Mark in Crosswind Limits
Now rotate the wind disc to the direction that the wind is coming from.
Don’t forget to apply variation, if necessary.
In this example, the wind comes from a TAF, which is true direction. So the magnetic direction will be 195°M.
Now note where the applicable crosswind limit line crosses the centreline.
In this case, it is at 41 knots.
Figure 9.12 Rotate to Wind Direction
What this is telling you is that when the wind from 195°M reaches 41 knots, it will give you 25 knots crosswind on R/W 23. Provided that the wind is less than 41 knots from 195°M, you may land.
Figure 9.11 Mark in Crosswind Limits
Figure 9.12 Rotate to Wind Direction

184
Chapter 9 The Navigation ComputerMulti-Drift Winds and Wind Components
HEADWIND AND CROSSWIND LIMITS
On occasions you can be limited by both crosswind AND headwind. You might have to land a heavy aircraft on to a single-runway airport and that runway might be short. In this case, you may be on your Landing Distance Available (LDA) performance limits and may need, say, at least 10 knots down the runway to land. At the same time, there is a crosswind.
Take this example:-
R/W 35ATC W/V 030/10G40Min Headwind 10 knotsCrosswind Limit 20 knots
As before, draw in the 20 knot crosswind parallel markers. But this time, in addition, draw in a 10-knot headwind limit line.
Figure 9.13 Parallel Crosswind Limit Lines and aHeadwind Limit LineFigure 9.13 Parallel Crosswind limit lines and a Headwind limit line

185
Chapter 9The Navigation ComputerMulti-Drift Winds and Wind Components
Now rotate to the direction that the wind will be coming from – in this case, 030°M:
Figure 9.14 Rotate and read offCentreline Intersections
Figure 9.14 Rotate and read off centreline intersections
It is not necessary for you to draw in the shading lines, but in Figure 9.14 the shaded areas represent an unacceptable solution. The answer has to lie within the unshaded area.Note where the unshaded area intersects the centreline – at 11 knots and 31 knots.
What this is telling you is that, when landing on R/W 35, if the wind from 030°M is less than 11 knots, you have less than 10 knots headwind down the runway. You cannot land. If the wind is any greater than 31 knots from 030°M, you have more than 20 knots of crosswind component. You cannot land.
If the wind is between 11 and 31 knots from 030°M, you have 10 knots or more of headwind component AND you have 25 knots or less of crosswind component. You can land.
TAILWIND COMPONENTS
In general, you should avoid landing with a tailwind. If you are given a runway with a tailwind component, ask ATC if you can use the other end. It is usually poor airmanship to accept a tailwind and you will not have a leg to stand on afterwards if you run off the end – even if your brakes fail!
However, you may occasionally have questions that involve tailwind components, so you should know how to deal with them.
The first thing to notice is that you cannot directly plot the horizontal line representing a tailwind component in the normal way because it is above the horizontal scale line. You are in the curved part of the wind slide.

186
Chapter 9 The Navigation ComputerMulti-Drift Winds and Wind Components
Figure 9.15 Position of a Tailwind LimitLine
Figure 9.15 Position of a tailwind limit line
Let’s take a worked example.
R/W 09Var 10EATIS W/V 320/10G30
Your maximum tailwind component for this particular landing is 10 knots. What is the maximum windspeed from the given direction that you can accept?
ATIS is magnetic direction, so the value of variation is unnecessary information. Ignore it. (Watch out for this trap).
Bring the R/W direction (09) round to the top.
Now move the speed slide to bring 10 knots under the centre dot.
Draw in the tailwind component limit line.
Figure 9.16 Drawing in the tailwind limit line
THEN DON’T FORGET TO MOVE THE SPEED SLIDE BACK TO PUT ZERO UNDER THE CENTRE DOT!

187
Chapter 9The Navigation ComputerMulti-Drift Winds and Wind Components
Now rotate round to the wind direction.
Read off the value of the intersection.
In this example, it is 16 knots.
Figure 9.17 Rotate to Wind Direction
If you find all that too complicated, don’t forget that you can always treat it as a headwind problem on the reciprocal runway!
Try treating it as the same type of problem as shown on pages 182 and 183, with the same wind of 320/10G30 but landing on R/W 27. You get the same answer – 16 knots.
ALLOWABLE WIND ANGLE FOR A GIVEN WINDSPEED
Another problem sometimes arises which is quickly solved on the computer. It takes the form of determining between what directions a wind of given speed can blow without exceeding a stated crosswind component.
For example, it is required to find the directions between which a wind of 50 kt may blow without creating a crosswind component of more than 30 kt on a runway of direction 250°(M).
1. With the runway direction set against the true index, mark a cross on the centre vertical line to represent the wind speed of 50 kt.
2. Turn the plastic disc clockwise until the cross indicates a crosswind of 30 kt. Note the direction which now appears against the true index (214°(M)).
3. Now turn the plastic disc anti-clockwise and repeat the procedure, reading off the direction which appears against the true index (286°(M)).
4. The same crosswind component will be present if the wind direction is between 034°(M) - 106°(M) - the reciprocals of the directions found in b) and c) above, but a tailwind component will be present on this runway.
Figure 9.17 Rotate to Wind Direction
188
Chapter 9 The Navigation ComputerMulti-Drift Winds and Wind Components

189
Chapter 9The Navigation ComputerMulti-Drift Winds and Wind Components
QUESTIONS
1 An airfield has runways 18/36 and 07/25, all of equal length. The TAF W/V is 310/25. Variation is 20°E. Which will be the best R/W for take-off and landing?
a. 18b. 36c. 07d. 25
2 In the Question 1 situation, what will be the head and cross wind components on this runway?
Head Cross
a. 24 17b. 13 19c 19 16d. 17 12
3 An aircraft requires 10 knots headwind component for take-off. The crosswind limit for the aircraft is 20 knots. The only runway available is 25. The ATIS W/V is 290/10G40. What are the minimum and maximum windspeeds for take-off?
Min Max
a. 17 31b. 13 17c. 13 31d. 17 26
4 On a particular take-off, you can accept up to 10 knots tailwind. The runway QDM is 047, the variation is 17oE and the ATIS gives the wind direction as 210. What is the maximum wind strength you can accept?
a. 18 knotsb. 11 knotsc. 8 knotsd. 4 knots

190
The Navigation ComputerMulti-Drift Winds and Wind ComponentsChapter 9
ANSWERS
1 D
2 C
3 C
4 B

191
Chapter 10The 1 in 60 Rule
CHAPTER TEN
THE 1 IN 60 RULE
Contents
THE 1 IN 60 RULE . . . . . . . . . . . . . . . . . . . . . . . . . . . . . . . . . . . . . . .193
MEASURING ANGLES IN FLIGHT . . . . . . . . . . . . . . . . . . . . . . . . . . . . .193
THE GEOMETRY OF THE 1 IN 60 RULE . . . . . . . . . . . . . . . . . . . . . . . . . .194
ANOTHER EXPLANATION . . . . . . . . . . . . . . . . . . . . . . . . . . . . . . . . .195
EXPANDING OR CONTRACTING THE TRIANGLE . . . . . . . . . . . . . . . . . . .196
QUESTIONS . . . . . . . . . . . . . . . . . . . . . . . . . . . . . . . . . . . . . . . . . .199
ANSWERS . . . . . . . . . . . . . . . . . . . . . . . . . . . . . . . . . . . . . . . . . . .200

192
Chapter 10 The 1 in 60 Rule

193
Chapter 10The 1 in 60 Rule
THE 1 IN 60 RULE
When you are flying, one or both hands will be on the control yoke. The other may have to be on the throttle some of the time. Either way, this does not leave you many spare hands to use to measure an angle on your map with a protractor.
Over the years, therefore, pilots have had to find other ways to calculate angles quickly and easily. One of these is called the “1 in 60 rule”.
Imagine that you have a line on a piece of paper exactly 60 mm long:
Figure 10.1
Now raise a perpendicular at one end, exactly 10 mm high, and join them with a hypotenuse:
Z60
10
Figure 10.2
This will create an angle, z, in the above diagram. If the adjacent is 60 cm long and the opposite is 10 cm long, then the angle z will be 10°.
Similarly, if the adjacent is 60 cm long and the opposite is 5 cm high, z will be 5°. If the opposite is 8 cm high, z will be 8°, and so on - up to a maximum of about 20 degrees, when the theory starts to break down.
MEASURING ANGLES IN FLIGHT
Suppose you are flying along a planned track of 100°T and you have flown 60 miles since your last fix, which was on track. You now pass over a clearly recognisable ground feature and you note from your map that it is 4 miles right of track. Using the 1 in 60 rule, you can establish that your actual track flown (i.e. the Track Made Good, or TMG) was 4 degrees right of your planned track and you have actually flown a TMG of 104°T. You are now in a position to calculate some sort of correction – and you have not had to use a protractor to establish the angle. We will discuss how you make the appropriate correction in the next chapter.

194
Chapter 10 The 1 in 60 Rule
THE GEOMETRY OF THE 1 IN 60 RULE
To use the 1 in 60 rule as a practical pilot, you don’t really need to know why it works - as long as you just accept that it does. However, for those who are interested, the explanation is as follows:
Imagine a circle of 1 metre radius.
1m
Figure 10.3
What is the formula to calculate the circumference?
Circumference = 2 π r
Taking π as 3.142, which is close enough for our purposes, then thecircumference = 2 x 3.142 x 1 = 6.284 metres.
Now imagine that we go one metre round the circumference – not the short cut across the chord, but along the circumference, like this:
θ
Figure 10.4
One metre at the circumference will subtend an angle θ at the centre. We need to calculate the value of θ. Those of you who have done some engineering or applied maths will know that θ has a value of 1 radian. However, for those who have not, we can calculate its value from first principles.

195
Chapter 10The 1 in 60 Rule
Starting at any point on the circumference and going all the way round once gives an angle of 360° and a distance of 6.284 metres. Going just one metre along the circumference gives an angle θ. These are in proportion, so we can write the following equation:
360 = θ6.284 1
Therefore θ = 57.3°
It is a fundamental principle of geometry that provided we keep the ratios the same, we can scale a geometrical diagram up or down and the angles will not change. For instance, if we take a circle of 2 metres radius then, as long as we also take a 2 metre length of the circumference, θ will still be 57.3°. Similarly, θ will remain at 57.3° if we take a circle of 10 metres radius, as long as we also take 10 metres of circumference.
Therefore, if we take a circle with a radius of 57.3 metres and consider a length of the circumference of 57.3 metres, we now have a situation where 57.3 degrees corresponds to 57.3 metres – a perfect one to one ratio. However, this only occurs with a radius of 57.3 metres.
Strictly, then, this should be the “1 in 57.3 rule”. But 57.3 is a difficult number to use in mental arithmetic when flying, so we approximate it to 60, which introduces only about 5% error, which is perfectly acceptable for our purposes.
ANOTHER EXPLANATION
Another way of looking at it is as follows:
opp
adj
Figure 10.5
Let’s write a series of values for z between 1 and 20 in the above diagram and then compare the angles with their tangents and see if we can see any relationship.
z 1 2 5 10 15 20tan z .017 .035 .087 .175 .268 .364
Nothing leaps out of the page at us. If there is a relationship, it’s not a clearly obvious one. Looking at the diagram above, what this tangent relationship is saying is, if the adjacent side is 1 metre, then the length of the opposite side is the number of metres in the “tan z” row, i.e. 0.017 metres for 1°, 0.035 metres for 2°, and so on.
Let’s now expand the adjacent side to 60 metres in length. This will mean multiplying the opposites by 60 as well.
Adding a third row to the above table:-z 1 2 5 10 15 20
tan z .017 .035 .087 .175 .268 .36460 tan z 1.02 2.1 5.22 10.56 16.08 21.64

196
Chapter 10 The 1 in 60 Rule
Suddenly, there seems to be a very close correlation between the angle z and 60 tan z. Now a one degree track difference gives 1.02 nm off track in 60 nm along track. A ten-degree track difference gives 10.56 nm off track in 60 nm along track. Even at 15 and 20 degrees, the relationship is pretty close. But you should not really need to use the 1 in 60 rule for angles much above 10 degrees - you should never get that far off track.
There are 2 reasons why the above rule does not give a perfect one-to-one correlation as the angles get bigger, whilst the first explanation, using the circle, gave an exact relationship - 57.3 degrees gave exactly 57.3 metres. The first reason is that we intentionally introduced a 5% error to make the arithmetic easier - we use a 1 in 60 rule in the air, not a 1 in 57.3 rule. Knock 5% off all the above figures in the “60 tan z” row, and the correlation becomes very close.
The second reason is that the perfect correlation comes from using the arc of a circle. The above explanation considers a right-angled triangle. The tangent of an angle is not a linear relationship, but up to about 20 degrees it is very close.
However, as previously stated, you don’t need to know why the 1 in 60 rule works as long as you accept that it does and you can apply it in the air.
EXPANDING OR CONTRACTING THE TRIANGLE
8
60
Figure 10.6
In the above diagram, the adjacent side represents 60 nautical miles distance gone along track. The pilot fixes himself 8 miles left of track. He therefore has a track angle error of 8° left.
However, fixes do not always come conveniently at 60 mile intervals. In any event, 60 nm at Warrior speeds corresponds to 30 - 40 minutes, depending on the groundspeed, which is too long an interval between fixes. We therefore need to be able to use the 1 in 60 rule when the along track distance is a figure other than 60.
The problem is a simple one - a matter of similar triangles. Suppose we have only gone 30 miles along track. For the same track angle error, 8° left, we will only be 4 miles left of track.
4
8
303060
Figure 10.7

197
Chapter 10The 1 in 60 Rule
We simply take the ratio of 60 nm to our along-track distance and multiply our cross-track distance by this ratio. This sounds complicated, but is not when you try a few practical examples. Four miles in 30 is obviously the same as 8 in 60, so the angle is 8°. Ten miles in 120 is obviously the same as 5 in 60, so the angle is 5°, and so on.
If the numbers really do not lend themselves to simple mental proportioning, there is a formula:-
z = distance off x 60 distance gone
For instance:- You find yourself 6 miles right of track after 40 miles along track.In the above formula:
z = 6 x 60 40
= 9°

198
Chapter 10 The 1 in 60 Rule

199
Chapter 10The 1 in 60 Rule
QUESTIONS
1 You are flying from A to B. You find that your position is 60 nm outbound from A and 7 nm left of the required track. What is your track error angle?
2 You are flying from C to D. You find that your position is 120 nm outbound from C and 8 nm right of the required track. What is your track error angle?
3 You are flying from E to F. You find that your position is 90 nm outbound from E and 6 nm right of the required track. What is your track error angle?
4 You are flying from G to H. You find that your position is 30 nm outbound from G and 4 nm left of the required track. What is your track error angle?
5 You are flying from J to K, which is a required track of 045oT. You find that your position is 80 nm outbound from J and 4 nm left of the required track. What is your track made good?
6 You are flying from L to M, which is a required track of 220oT. You find that your position is 45 nm outbound from L and 3 nm right of the required track. What is your track made good?
7 You are flying from N to P, which is a required track of 315oT. You find that your position is 40 nm outbound from N and 6 nm left of the required track. What is your track made good?
8 A surveyor places himself 660 metres from a mast and measures an elevation angle of 4o to the top of the mast. What is the height of the mast?
9 You are flying an instrument approach to an airfield and the required glide slope angle is 3.00o. What height should you be passing when you are exactly 2 nautical miles from the touchdown point? (NOTE: For this question, assume 1 nm = 6000 feet).
10 You are flying an instrument approach to an airfield and the required glide slope angle is 2.5o. You are correctly on the glideslope and you are passing a height of 1000 feet QFE. What is your range from the touchdown point? (Assume 1 nm = 6000 feet).
11 You are flying from Q to R, which is a required track of 125oT. You find that your position is 40 nm from R and 2 nm left of the required track. What track must you fly to arrive overhead R?
12 You are flying from S to T, which is a required track of 272oT. You find that your position is 50 nm from T and 5 nm right of the required track. What track must you fly to arrive overhead T?

200
The 1 in 60 RuleChapter 10
ANSWERS
1 7° L
2 4° R
3 4° R
4 8° L
5 042° T
6 224° T
7 306° T
8 44 metres
9 600 feet
10 4 nm
11 128° T
12 266° T

201
Chapter 11Navigation Using the 1 in 60 Rule
CHAPTER ELEVEN
NAVIGATION USING THE 1 IN 60 RULE
Contents
RETURNING TO TRACK . . . . . . . . . . . . . . . . . . . . . . . . . . . . . . . . . . .203
DOUBLE TRACK ANGLE ERROR METHOD . . . . . . . . . . . . . . . . . . . . . . .204
TRACK ERROR ANGLE AND CLOSING ANGLE . . . . . . . . . . . . . . . . . . . .206
COMBINED TRACK ERROR ANGLE AND CLOSING ANGLE . . . . . . . . . . . . .207
USING THESE METHODS PRACTICALLY . . . . . . . . . . . . . . . . . . . . . . . .208
NEW TRACK REFERENCE . . . . . . . . . . . . . . . . . . . . . . . . . . . . . . . . . .209
QUESTIONS . . . . . . . . . . . . . . . . . . . . . . . . . . . . . . . . . . . . . . . . . .211
ANSWERS . . . . . . . . . . . . . . . . . . . . . . . . . . . . . . . . . . . . . . . . . . .212

202
Chapter 11 Navigation Using the 1 in 60 Rule

203
Chapter 11Navigation Using the 1 in 60 Rule
RETURNING TO TRACK
If you find that you have strayed from track, it may be for a variety of reasons. You could have failed to fly the flight plan heading accurately enough, or possibly made too shallow a turn from the last track when over the initial turning point. However, for en-route navigation, it is assumed that the most likely reason is that the wind has changed.
It is also assumed that, for small changes, a change of track of, say, 10 degrees, is achieved by a change of heading of exactly 10 degrees. In fact, as you should recall from the chapter on the Navigation Computer and the Triangle of Velocities, sometime as you alter heading, the drift changes. However, these rapid navigation techniques assume you will alter your track by the same amount that you alter heading.
There are a few points to remind ourselves about tracking errors.
Fig 11.1 Planned track and TMG
planned track
track made good
Figure 11.1 Planned track and TMG
The track you intended to fly is called the “planned track”. The track you actually make over the ground (presumably because the actual wind is different from the forecast) is called the “track made good” (or TMG). The difference between them is called “Track Error Angle”.
Track Error Angle is NOT drift. This is a common mistake amongst beginners to this subject. Drift is the angle between Heading and Track (either planned track or TMG). Adding to Figure 11.1 to draw in the heading should make this clear.
Suppose that, with the forecast wind on the day, you needed to fly a True heading of 100°T to give you a planned track of 090°T. This gives the following diagram:-
Fig 11.2 Heading, Expected Drift, Actual Drift, and Track Error Angle
planned track
heading
track made good
090°
100°
Figure 11.2 Heading, Expected Drift, Actual Drift, and Track Error Angle
The difference between the planned track and the TMG (shown as green in Figure 11.2) is the track error angle. The difference between the heading and the planned track (shown in red) is the expected drift. The difference between the heading and the TMG is the actual drift experienced (shown in blue).
It is true that Track Error Angle is the difference between the expected drift and the actual drift, but Track Error Angle is not drift itself. This point is important.

204
Chapter 11 Navigation Using the 1 in 60 Rule
There are 3 basic techniques for getting back to track:
Double Track Angle Error
Track Error Angle and Closing Angle
Combined Track Error Angle and Closing Angle Single Calculation.
The last one is simply a variation on the second one, and is a quicker method of achieving the same answer.
From these 3 basic techniques, we come up with the Oxford preferred technique, which is called New Track Reference.
DOUBLE TRACK ANGLE ERROR METHOD
Consider the following situation. You are planning to fly a particular track (say 090°T) and you have done your flight plan and calculated a heading to fly. You fly that heading (accurately, we assume) but after 30 miles along track you get a pinpoint (a visual fix) which puts you 4 miles left of track.
Figure 11.3 4 nm left of track after 30 nm along track
30
4
Figure 11.3 4 nm left of track after 30 nm along track
Firstly, calculate the Track Error Angle. Four nm off in 30 nm along is 8°.
If we do nothing about it, we will continue to diverge from track at the same rate. The following situation will develop:-
Figure 11.4 Continuing to Diverge from Track
4
30
Figure 11.4 Continuing to Diverge from Track
The first thing to do is to stop this trend. We are diverging by 8° to the left, so turn 8° right.
Figure 11.5 Paralleling Track
4
30
Figure 11.5 Paralleling Track

205
Chapter 11Navigation Using the 1 in 60 Rule
Just turning 8° right has not solved the navigation problem, though. It has merely prevented it from getting any worse. We are now paralleling track, 4 nm to the left of it, but not getting back to it.
It is not good enough to just turn a little bit more - say, another 10° right - and then map-read our way back to track. Firstly, there might not be anything significant to see to tell us when we are back on track and, secondly, we do not want a navigation technique that requires continuous attention from the pilot – i.e. continuous map-reading, in this case. As a single-pilot, you have many other things to do - fly the aeroplane, monitor changing weather, think about fuel, make radio calls as appropriate, carry out engine and electrics checks periodically and, most importantly, look out to avoid other aircraft. We want some method that allows us to minimise the amount of time spent actually navigating. We therefore want to make a measured and controlled turn in a way that will indicate to us when we are back on track without having to map-read.
What we do, therefore, is turn another 8° right, making a total change of 16° right. Now consider Figure 11.5 below:
Figure 11.5 Isosceles Triangle
4
30
Figure 11.5 Isosceles Triangle
By turning through exactly double the track error angle, i.e. 16° right, we are creating an isosceles triangle. It is symmetrical about the cross-track error line (marked ‘4’ in the above diagram), i.e. we are converging back to track at a closing angle of 8°. This means that it takes the same distance to get back on track as it took to get off track. Therefore the times will be the same (there may be a tiny difference because the groundspeeds are not absolutely identical, but it will only be a matter of seconds - certainly less than a minute).
So, if I start off on track at 1000 hours and find myself off track at 1020, and if I turn by double the Track Angle Error, I will be back on track at 1040. No continuous map-reading is required; all I have to do is look at my watch.
1020
1000 1040
Figure 11.6 Back on track at 1040 hours
4
30
Figure 11.6 Back on track at 1040 hours

206
Chapter 11 Navigation Using the 1 in 60 Rule
However, the story does not end here. If we do nothing about it once we re-cross our planned track, having turned 16° right at our pinpoint, we will now diverge to the right of track, like this:-
Figure 11.7 Diverging to right of track
4
30
Figure 11.7 Diverging to right of track
So now we turn back 8° left, once we get back to track. And, unless the wind changes again, we should now stay on track.
Figure 11.8 Maintaining track by turning back again
4
30
Figure 11.8 Maintaining track by turning back again
Notice that we have now finished up on a heading 8° right of our initial heading. We turned 16° right, then 8° left, making a total of 8° right. However, notice that our initial heading took us 8° to the left of track - this is why we had the initial track error. Having turned a total of 8° right, once back on track, we are now on the heading which, if we had followed initially, would never have taken us off track in the first place. So we continue with this for the rest of the leg (or until the wind changes again).
TRACK ERROR ANGLE AND CLOSING ANGLE
Sometimes we may wish, once have found ourselves off track, to head directly for the destination (or next turning point), rather than merely regain track. Also, if we are more than half-way along track at the first pinpoint, the double track error angle method will not get us back on track before the next turning point. In these cases we use a combination of the Track Error Angle and the Closing Angle.
Consider the following situation. Your total track distance is 78 nm. As before, after 30 nm along track, you get a pinpoint 4 nm left of track. As before, your track error angle is 8° to the left.
Track Error Angle Closing Angle
78 nm total distance
Figure 11.9 Track Error Angle and Closing Angle
30
4
Figure 11.9 Track Error Angle and Closing Angle
As before, turning 8° to the right will only parallel track. We now need to calculate the closing angle on order to proceed to the turning point.

207
Chapter 11Navigation Using the 1 in 60 Rule
This is not too difficult. if we have gone 30 nm along a 78 nm track, there must still be a further 48 nm remaining. We are 4 nm off track in 48 to go, so that is 1 in 12 - which is 5 in 60. Therefore our closing angle is 5°.
So, we turn 8° right to parallel track and a further 5° right to converge, making a total turn of 13° required.
Therefore, to summarise, the required amount of turn is the sum of Track Error Angle and Closing Angle.
COMBINED TRACK ERROR ANGLE AND CLOSING ANGLESINGLE CALCULATION
There is an arithmetical method of solving the above calculation which gives exactly the same answer, but does not require you to calculate Track Error Angle. Only the Closing Angle needs to established and it is then multiplied by a factor dependant upon the proportion of your distance along track to the total leg distance. This can be quicker.
Consider exactly the same problem. We have a track 78 miles long and after 30 miles along track, we are 4 miles left of track. This time, don’t bother to work out the Track Error Angle. Just consider the Closing Angle.
Closing Angle
30 48
Total Leg Length = 78
Figure 11.10 Closing Angle Only
4
Figure 11.10 Closing Angle Only
As before, if you are 30 nm along a 78 nm leg, you must have 48 nm to go. (In practice, you won’t even have to work this out, because we normally mark our maps up with distance-to-go, not distance gone). As before, 4 nm off track in 48 to go is 1 in 12 - which is 5 in 60 - so our closing angle is 5°.
Take the proportion of your distance along track to the total leg length and invert it. In this case,
30 becomes 78 78 30
Now multiply the closing angle by the inverted fraction and, hey presto, you have the required angle to turn in one calculation.
5° x 78 = 13° 30
This is not an approximation. You can show by a geometrical proof that this method gives precisely the same answer as separately calculating the Track error Angle and Closing Angle. In this example, we deliberately chose numbers that were not exactly half or a third or a quarter to show that the arithmetic works even for numbers like 13. In practice, most of the time, all you will do is estimate that you are approximately, say, one-third of the way along your leg, so you need to alter by 3 times your Closing Angle.

208
Chapter 11 Navigation Using the 1 in 60 Rule
USING THESE METHODS PRACTICALLY
In practice, you do not have to carry out 1-in-60 calculations in order to work out your Track Error Angle and Closing Angle. Instead, what you should do is, in the pre-flight preparation stage, mark up the track on your map with 5 degree and 10 degree guide lines, as shown in Figure 11.11 over the page.
Figure 11.11 5º and 10º Guidelines
10
5
10
5
10
10
5
5
Figure 11.11 5° and 10° Guidelines
Now, with the guidelines, you can rapidly assess the Track Error Angle and Closing Angle of any visual fix you get on that leg. You now just have to add the Track Error Angle to the Closing Angle to know the total angle to turn to head for the destination turning point.
Practically speaking, this results in too cluttered a chart. The recommended teaching is to draw just one guideline at each end of track, at 10°, as in Figure 11.12 below:
Figure 11.12 One10º Guideline each end of Track Figure 11.12 One 10° Guideline each end of Track
Similarly, you do not have to use a ruler in the air in order to assess your distances along and across track. Mark up your map with distance-to-go using 10 nm markers. Do not use distance gone - that is of no interest to you. What you need to know is how many miles remain, without having to carry out subtraction in your head. Mark up the map as follows:
Figure 11.13 Distance-to-go Markers
10203040
Figure 11.13 Distance-to-go Markers
Figure 11.13 shows a track of length 44 nm and any time you get a visual fix you can instantly see how far you have to go. You also have a useful 10 nm scale to help you assess distances off track, if you need to.
The recommended technique is a combination of these 2 methods. Mark up the Closing Angle guidelines and the distance-to-go markers. Then, if you get a fix a quarter of the way along track, alter heading by 4 times the Closing Angle. If you get a fix a third of the way along track, alter heading by 3 times the Closing Angle. If you get a fix half-way along track, alter heading by 2 times the Closing Angle, and so on.

209
Chapter 11Navigation Using the 1 in 60 Rule
NEW TRACK REFERENCE
New Track Reference is the preferred method. Start off as in the previous paragraph.
Firstly, It is necessary to hold a steady heading until the aircraft’s position is definitely pinpointed – rather than making rash panicky alterations.
Once the aircraft’s position is established, calculate the required heading alteration as follows:
1. Estimate, as a fraction, the proportion of the total leg distance covered.
2. Invert this fraction.
3. Multiply the inverted fraction by the closing angle.
Figure 11.14 Initial Heading Correction
C (pinpoint)A
¼
½
¾
Closing Angle = 5º
B
Figure 11.14 Initial Heading Correction
In Figure 11.14, you pinpoint yourself at C, to the left of your desired track from A to B. The closing angle is 5° and you are about ¼ of the way down your track. So:
1. Proportion of leg travelled = ¼
2. Invert this fraction, giving 4/1
3. Multiply this by the closing angle of 5°.
This gives 20°. You alter heading 20° (starboard, of course) for destination B.
We hope that this alteration will allow the aircraft to follow a new track from C to B.
Now, let us assume that the wind has changed subsequently, and we later fix our position at D, to the port of our ‘new’ track from C to B.

210
Chapter 11 Navigation Using the 1 in 60 Rule
Figure 11.15 Further pinpoint and track correction
CA
¼
½
¾B
D (new pinpoint)
New Closing Angle = 2º
Figure 11.15 Further pinpoint and track correction
We apply the system again, this time with respect to our ‘new’ track C-B. Suppose the 10° lines show that angle DBC, which is the closing angle with respect to our ‘new’ desired track C-B is 2°. Suppose that our new pinpoint D is about halfway between C and B. Then our new alteration (to starboard) will be: 2/1 x 2° = 4°.
The only point to bear in mind is that the closing angle must be calculated from the ‘new’ track, which will not be drawn on your chart. If you use your 10° guidelines, you must near in mind that they were drawn with respect to the original track, and mentally allow for the first closing angle. Similarly, you must estimate the proportion you have travelled of the ‘new’ distance CB, not the old distance AB.

211
Chapter 11Navigation Using the 1 in 60 Rule
QUESTIONS
1 If an aircraft is 3° off required track at a range of 120nm, how far in nautical miles (nm) is the aircraft off required track?
2 If an aircraft is 2 miles off required track at a range of 40nm, what it the angle off track (track error)?
3 An aircraft leaves A to fly to B, 95 nms distance. Having flown 35nms, the aircraft position is found from a ‘pinpoint’ (a geographical point over which the aircraft has flown); the pinpoint is 7 nms right of track.
a. What is the track error?b. What alteration of heading is required to fly direct to B?c. What is the drift? (Trap question).
4 An aircraft is flying from Oxford to Cambridge, planned track 074°M, distance 70nm, heading 065°M. Having flown 30nm, the pilot ‘pinpoints’ the aircraft position overhead Cranfield, 4nm left of planned track.
a. What is the track error overhead Cranfield?b. What is the Track Made Good (TMG) from Oxford?c. What was the expected drift?d. What has the actual drift been?e. What alteration of heading should be made over Cranfield to fly direct to Cambridge?f. What is the new heading to be flown from overhead Cranfield?
5 An aircraft is flying from Norwich to Oxford, planned track 250°M, distance 96nms, heading 260°M, ground speed 180 kts. The aircraft departs Norwich at 1000 hrs. At 1012, the aircraft is overhead Ely, 3nms right of planned track. Use the 1:60 to estimate the following.
a. What was the planned drift?b. What is the track error at 1012 hrs?c. What TMG has been flown between 1000 hrs and 1012 hrs.d. What has the actual drift been between 1000 hrs and 1012 hrs?e. What alteration of heading should be made to track directly to Oxford?f. What heading is required to fly directly to Oxford?g. What alteration of heading should be made to regain track at 1024 hrs?h. What heading should be flown between 1012 and 1024 hrs to regain track at 1024 hrs?i. Given the situation in g. and h. above, what heading change should be made at 1024 hrs
and what heading should be flown from 1024 hrs onwards?j. Estimate the ETA at Oxford.

212
Navigation Using the 1 in 60 RuleChapter 11
ANSWERS
1 6nm
2 3°
3 a. 12° right b. 19° left (TE = 12°, CA = 7°) c. Cannot calculate as heading not given. To calculate drift, you must know
heading. Drift is defined as the angle between heading and “track”.
4 a. 8° left b. 066°M c. 9°S d. 1°S e. 14° right (TE = 8°, CA = 6°) f. 079°M
5 a. 10°P (Hdg 260M, planned track 250M) b. 5° right (aircraft has travelled 12 minutes at 180kts = 36nms. 3nm in 36nm = 5°
error). c. TMG = 255°M d. 5° port (left) (Heading 260M, TMG 255 M) e. 8° left (TE = 5°, CA = 3°) f. Heading 252°M g. 10° left (2 x TE = 2 x 5 = 10) h. Heading 250°M i. Heading 255°M (original planned heading corrected for track error). j. ETA 1032 hrs (1000-1012 = 36nms 1012-1024 = 36nms) (Leaves 24 miles which takes 24 x 12 = 8 mins) 36

213
Chapter 12Other Applications of the 1 in 60 Rule
CHAPTER TWELVE
OTHER APPLICATIONS OF THE 1 IN 60 RULE
Contents
OTHER APPLICATIONS OF THE 1 in 60 RULE . . . . . . . . . . . . . . . . . . . . . .215
HEIGHT ON A GLIDE SLOPE . . . . . . . . . . . . . . . . . . . . . . . . . . . . . . . .215
RATE OF DESCENT (ROD) . . . . . . . . . . . . . . . . . . . . . . . . . . . . . . . . . .216
CHANGE OF SPEED ON A GLIDESLOPE . . . . . . . . . . . . . . . . . . . . . . . . .217
VOR/DME PROBLEMS . . . . . . . . . . . . . . . . . . . . . . . . . . . . . . . . . . . .218
FINDING RANGE FROM CHANGE OF VOR BEARING . . . . . . . . . . . . . . . .219
ANSWERS . . . . . . . . . . . . . . . . . . . . . . . . . . . . . . . . . . . . . . . . . . .222
214
Chapter 12 Other Applications of the 1 in 60 Rule

215
Chapter 12Other Applications of the 1 in 60 Rule
OTHER APPLICATIONS OF THE 1 in 60 RULE
The other main applications which may be examined are:
Calculation of height on a glide slope. Calculation of rate of descent to maintain a glide slope. Calculation of shallow slopes, particularly runway slopes. Calculation of distance off required track using radio aids such as VOR/DME.
HEIGHT ON A GLIDE SLOPE
To find a Rule of Thumb for calculating height on a glide slope, we can use the track error technique but view the situation in side elevation rather than plan. For convenience, the glideslope angle is referred to as Z°. You need only to understand how to apply the formula, not how it is derived.
Figure 12.1Figure 12.1
In Figure 12.1, suppose the range is 1 nautical mile. This is 6080 feet, but an acceptable approximation for the 1 in 60 rule is to call it 6000 feet. This introduces only about 1% error.
If Z = 1°
When range = 60 feet, the height is 1 foot. When range = 600 feet, the height is 10 feet. When range = 6000 feet, the height is 100 feet.
If Z = 2°
When range = 60 feet, the height is 2 feet. When range = 600 feet, the height is 20 feet. When range = 6000 feet, the height is 200 feet.This gives the rule:
To make good a glide slope of Z°, your rate of descent should be (100 x Z) ft per nautical mile:
2.5° glide slope 250 ft per nautical mile 3° glide slope 300 ft per nautical mile 3.5° glide slope 350 ft per nautical mile 5.5° glide slope 550 ft per nautical mile.

216
Chapter 12 Other Applications of the 1 in 60 Rule
Example 1
On a 3° glide slope at 4nms from touchdown.
Height (ft) = 3 x 100 x 4 = 1200 ft
Example 2
On a 5.5° glide slope at 3 miles from touchdown.
Height (ft) = 5.5 x 100 x 3 = 1650 ft
Note: 3° glide slopes are the most common. 2.5° glide slopes are often found at military airfields operating high speed jets. Glide slopes greater than 3° are normally found when airfields are located near high terrain or high buildings. London City has an extremely steep glide slope of 5.5°.
In all problems, glide slopes will be given
RATE OF DESCENT (ROD)
The rate of descent (ROD) required to maintain a glide slope at a given speed can be estimated using the 1:60 rule.
The simple problem is to calculate the height of the aircraft when it is one minute from touchdown. After all, the aircraft has to lose this height in one minute. The range at one minute is given by ground speed divided by 60.
Figure 12.2Figure 12.2
So, if your groundspeed is 60 knots, your range is one mile. On a 3° glideslope, this means that your height is 300 feet. So your rate of descent needs to be 300 feet per minute.

217
Chapter 12Other Applications of the 1 in 60 Rule
If your groundspeed is 120 knots, your range is two miles. On a 3° glideslope, this means that your height is 600 feet. So your rate of descent needs to be 600 feet per minute.
ROD (in feet per minute) = 5 x Ground speed (in knots) - for a 3° glideslope only
If the glideslope is some angle other than 3°, the easiest way is to solve for a 3° glideslope and then factor the answer by actual glideslope ÷ 3°.
For example:
What rate of descent do you require to maintain a 4° glideslope at a groundspeed of 100 knots?
For a 3° glideslope it would be 5 x 100 - 500 feet per minute.
For a 4° glideslope, it would be 500 x 4/3, which is 667 feet per minute - 670 for practical purposes.
CHANGE OF SPEED ON A GLIDESLOPE
Students may need also to calculate the effect on ROD of changing speed. Firstly, apply the following rules:
To maintain a glideslope:
Decrease groundspeed, decrease RODIncrease groundspeed, increase ROD
To calculate the amount of the change:
Change in ROD = 5 x change in speed (3° glideslopes only)
Note: the previous caveats regarding glide slopes other than 3° still apply
Example 1
You are on an ILS approach to London Heathrow using a 3° glide slope. If your ground speed is 140kts, what Rate of Descent (ROD) is required to maintain the glide slope?
For this problem, involving a 3° glide slope, you may use the 5 x ground speed estimate.
ROD = 5 x 140 = 700 ft/min.
Example 2
You are approaching London City Airport on a glide slope of 5.5° at a ground speed of 120kts. What rate of descent is required to maintain the glide slope?
ROD = 5 x 120 x 5.5/3 = 1100 feet per minute

218
Chapter 12 Other Applications of the 1 in 60 Rule
Example 3
Approaching London Heathrow (3° glideslope), an aircraft decreases speed from 140 kts to 120kts. What change in the ROD must be made to maintain the glide slope?
Decrease speed = Decrease ROD
Again, for a 3° glide slope only, the 5 x rule can be used.
Change in ROD = 5 x change in ground speed (3° glideslopes only) = 5 x 20 = 100ft/min
Decrease ROD by 100ft/min (this links with Example 1 and would result in a new ROD of 600 ft/min).
Example 4
Approaching London City airport (glideslope 5.5°), you reduce ground speed from 120kts to 110 kts. What change should you make to your ROD to maintain the glide slope?
Decrease speed = Decrease ROD
For a 3° glide slope.
Change in ROD = 5 x groundspeed change = 5 x10 x 50 fpm
For a 5.5° glide slope.
Change in ROD = 50 x 5.5/3 = 92 ft/min
VOR/DME PROBLEMS
A typical examination example:
You are flying along an airway to VOR/DME ‘Q’; the airway QDM is 271°M. Your Radio Magnetic Indicator indicates your QDM to Q as 266°M, range 48nm. How far are you off the airway centreline and to which side?
KING
Figure 12.4Fig 12.3 VOR crosstrack problem

219
Chapter 12Other Applications of the 1 in 60 Rule
Again, we can use the Track Error formula.
Track Error = Distance off x 60 and modifying the formula Distance gone
Angle off (TE) = Distance off (DO) x 60
DME range (DG)
5° = DO x 60
48
DO = 5 x 48 = 4 nm to the right of centreline. 60
Note: you are off track but still within the airway because most airways are 10 nm wide, i.e. 5nms either side of centerline.
FINDING RANGE FROM CHANGE OF VOR BEARING
It is possible to use the 1 in 60 rule to work out range from a VOR using the change in VOR bearing.
Suppose an aircraft is tracking 090°M at 180 knots G/S and at 1100 hrs the QDM to the VOR is 002° (or the QDR from it is 182°). Five minutes later the QDM to the VOR has changed to 357° (or the QDR from it is 177°). What is the range R from the VOR to the aircraft (at the closest point of approach)?
VOR
002° 357°
R
The closest point of approach occurs as the aircraft is perpendicular to track (ie, at a relative bearing of 270°, or when the QDM is 000°). You can treat this as 2 separate right-angled triangles of 2° and 3° at the top, but it is easier to do both sums at once and treat it as a near-right-angled triangle with a 5° at the top.
Fig 12.4 Range from flying abeam a VOR

220
Chapter 12 Other Applications of the 1 in 60 Rule
The aircraft has a G/S of 180 knots. Five minutes flight gives a ground distance of 15 nm between the first bearing and the second. Therefore an angle of 5° subtends a distance of 15 nm along track.
For each 60 nm of range R, the angle will subtend 5 nm of range. The range must therefore be equal to 3 times 60 = 180 nm.
Alternatively, use the formula:
Z = opposite (15 nm along track) x 60 Range R
5 = 15 x 60 R
re-arranging:
R = 15 x 60 = 180 nm 5

221
Chapter 12Other Applications of the 1 in 60 Rule
QUESTIONS
1. An aircraft is flying due South. At 1000 hrs, point P bears 267°(T) from the aircraft. At 1006 hrs, point P bears 275° (T) from the aircraft. If the aircraft has a ground speed of 120kts, estimate the range of the aircraft from point P.
2. You are approaching Innsbruck, Austria on a glide slope of 3.5°. What height (QFE) should you be at 2 miles range?
3. You are approaching Rota, Spain on runway 28 which has a glide slope of 2.6°. At what height should you be at 4 miles range?
4. You are approaching Paris/Charles de Gaulle on a glide slope of 3°. At what height (QFE) should you be at a range of 2nm?
5. Using the detail in questions 2 - 4, what rates of descent (ROD) are required to maintain the glide slopes in:
a. question 2 if ground speed is 120 kts b. question 3 if ground speed is 180 kts c. question 4 if ground speed is 150 kts.
6. On the approach to London Heathrow runway 27, glide slope 3°, you reduce speed from 150 kts to 120 kts. What change should you make to your ROD to maintain glideslope?
7. You are flying an aircraft into Gioia Del Colle, Italy, on a glide slope of 2.5°. Having had a hydraulic failure, you cannot select any flaps. You approach at 220 kts TAS and have a headwind component of 10kts.
a. What rate of descent do you need to maintain the glideslope?
On the approach, you regain some hydraulic power and can select ‘mid’ flaps position. This enables you to reduce your approach speed to 190 kts TAS.
b. What change in the ROD is required to continue to maintain the glideslope?c. What is your new ROD?
8. You are flying an airway with a centreline QDM of 137 ° M towards VOR/DME ‘A’. Your RMI reads 141° M/DME 90 nms.
a. Are you left or right of centreline?b. What is your distance off the airway centreline?c. Are you in trouble with ATC? (Airways normally extend 5 nm either side of the
centreline).

222
Other Applications of the 1 in 60 RuleChapter 12
ANSWERS
1. 90nm
2. 700ft (2 x 350) 3. 1040ft (4 x 260)
4. 600ft (2 x 300)
5. a. 700 ft/min b. 780 ft/min c. 750 ft/min
6. Decrease ROD by 150 ft/min
7. This is the same basic question as used in Qs 5 & 6. For ROD, you need ground speed which is 220 kts - 10kts headwind = 210 kts. For change in ROD, you only need the change in TAS.
a. 875 ft/min b. Decrease ROD by 125 ft/min c. 750 ft/min
8. a. left b. 6nms
c. Usually, yes. (Airways are generally only 5nms wide from centreline in most countries, but rules may vary).

223
Chapter 13Topographial Maps and Map Reading
CHAPTER THIRTEEN
TOPOGRAPHICAL MAPS AND MAP READING
Contents
INTRODUCTION . . . . . . . . . . . . . . . . . . . . . . . . . . . . . . . . . . . . . . .225
RELIEF (TERRAIN) . . . . . . . . . . . . . . . . . . . . . . . . . . . . . . . . . . . . . .225
OTHER FEATURES . . . . . . . . . . . . . . . . . . . . . . . . . . . . . . . . . . . . . .226
SCALE . . . . . . . . . . . . . . . . . . . . . . . . . . . . . . . . . . . . . . . . . . . . . .227
MAP READING . . . . . . . . . . . . . . . . . . . . . . . . . . . . . . . . . . . . . . . .228
VISUAL CHECK POINTS . . . . . . . . . . . . . . . . . . . . . . . . . . . . . . . . . . .228
SELECTING VISUAL CHECK POINTS . . . . . . . . . . . . . . . . . . . . . . . . . . .228
SOME TYPICAL VISUAL CHECKPOINTS. . . . . . . . . . . . . . . . . . . . . . . . .229
SOME VISUAL NAVIGATION HAZARDS . . . . . . . . . . . . . . . . . . . . . . . . .230
NAVIGATION TECHNIQUES . . . . . . . . . . . . . . . . . . . . . . . . . . . . . . . .231
LOST PROCEDURE . . . . . . . . . . . . . . . . . . . . . . . . . . . . . . . . . . . . . .231
CHART SYMBOLS . . . . . . . . . . . . . . . . . . . . . . . . . . . . . . . . . . . . . . .232
QUESTIONS . . . . . . . . . . . . . . . . . . . . . . . . . . . . . . . . . . . . . . . . . .237
Appendix A to Questions . . . . . . . . . . . . . . . . . . . . . . . . . . . . . . . . . . .239
ANSWERS . . . . . . . . . . . . . . . . . . . . . . . . . . . . . . . . . . . . . . . . . . .240

224
Chapter 13 Topographial Maps and Map Reading

225
Chapter 13Topographial Maps and Map Reading
INTRODUCTION
Modern aircraft navigation systems tend to be very reliable and accurate. However they do fail occasionally or suffer degraded accuracy. Moreover, many light aircraft are not equipped with sophisticated navigation systems. There is therefore a need for pilots to develop and maintain visual navigation skills using the basic aids of map/compass/stopwatch/eye and brain. It is essential that pilots can interpret the conventional symbols (the legend) of all the aeronautical charts they use. A set of legend decodes is included at the end of this chapter.
Aeronautical charts show 3 basic characteristics:
Relief (Terrain) Other Features Scale
RELIEF (TERRAIN)
If an aircraft is to be navigated safely in poor weather, great care must be taken to avoid high ground, either by flying round it or over it at a safe altitude. However, terrain features can make excellent visual references in good weather.
Pilots should therefore understand how these features are depicted.
Information concerning the location and height of high ground is given on maps in various ways.
Contours. Lines drawn joining all places which are at the same elevation above mean sea level are called contours and the intervals at which they are drawn can be read from the chart. Always check whether the contours are depicted in feet or metres. Contours which are close together indicate steeply sloping ground whereas widely spaced contours indicate gently sloping ground.
Layer Tinting (Colour Gradient). A different colour is used for ground in different elevation bands. For example, land between mean sea level and 250 feet may be coloured white, between 250 feet and 500 feet light yellow, and so on. A key to colour code is given in the margin of the map.
It is important to realise that both contours and layer tinting (which is effectively contours with the spaces between them coloured in) are based on elevation, i.e. vertical distance above mean sea level.
Spot Elevations. The elevations of prominent peaks are shown in figures. For easy recognition the highest spot height is printed on a white rectangle which has a black perimeter, and its position is given in the margin. Others are simply a dot, for the exact position, with the elevation printed alongside.
Maximum Elevation Figure (MEF) or Minimum Safe Altitude (MSA). Most Government-produced topographical charts (for instance, the CAA charts and the US Government TPC and ONC series) show Maximum Elevation Figures (MEF). Many commercially-produced charts (such as Jeppesen’s) show Minimum Safe Altittude (MSA) - which may also be known as Grid Minimum Off-Route Altitude (Grid MORA).
It is important that you check which is shown on the chart you are using. The difference may, quite literally, be a matter of life and death.

226
Chapter 13 Topographial Maps and Map Reading
Whether MEF or MSA, the basic calculation of the dominant obstacle is the same. The chart is divided up into convenient-sized rectangles of latitude and longitude for the scale of the chart. On the CAA and TPC 1:500,000 charts the rectangles are half a degree of latitude and longitude, on the ONC every whole degree, on some of the Jeppesen small-scale charts every 5 degrees, and so on. Within the rectangle, the highest natural feature (mountain, hill, ridge) is noted. The highest man-made obstruction (TV transmitter mast, crane, tall building, etc) is also noted. Every structure of a height AGL of 300 feet (UK and US) or 100 metres (328 feet - continental Europe) or more is required by law in the appropriate country to be notified to the national aviation authority (CAA, FAA, etc). Therefore there may be unknown structures of less than 300 feet (or 100 metres). In order to take account of these possible unknowns, the following rules are applied:
For a made-made obstruction, the elevation is accurately known, so no further allow- ance is necessary.
For a natural feature, someone may have built an obstruction of up to 300 feet (100 me- tres) on top of a hill quite legally without informing the CAA. Therefore a safety factor of 300 feet (100 metres) is added to the elevation of natural features.
The higher of (a) and (b) is taken and then rounded up to the next whole hundred feet, i.e. 968feet becomes 1000 feet.
Consider an example. Within a particular rectangle there is a TV mast of elevation 1432’ and a hill of 1268’. Add 300’ to the hill; it becomes 1568’. Round this up to 1600’.
For a chart displaying Maximum Elevation Features (MEF), the figures 16 would appear in the rectangle. If the chart shows Minimum Safe Altitude (MSA) - also known as ‘Safety Altitude’, a further safety factor is added. If the rounded-up figure is 5000 feet or more, 2000 feet is added.If it is less than 5000 feet, then 1000 feet is added. In the example shown above, the MSA would become 26.
Note that CAA charts, TPCs and ONCs all show MEFs, not Safety Altitudes. THE MEF IS NOT A SAFETY ALTITUDE.
OTHER FEATURES
Water Whether sea, lake or river, the colour used is blue. Woods Shown in green. Roads Shown as red lines. Railways Shown as black lines.
An exercise to consolidate knowledge of chart symbols is given at the end of this Chapter.
In addition to understanding chart symbols, the pilot will need to measure distances on the chart. In many cases, the use of an appropriate navigation ruler will suffice but the pilot should be sure in this case that the chart being used is constant scale. In any event, the pilot should know the various ways that chart scale is depicted.
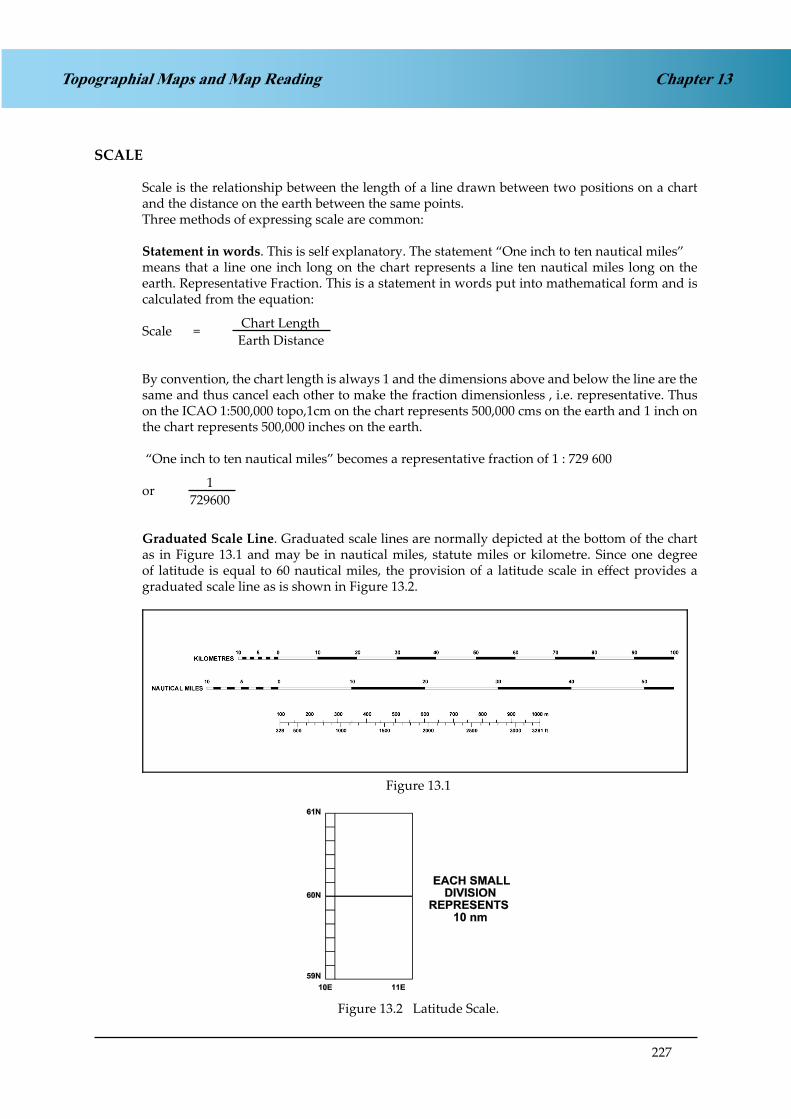
227
Chapter 13Topographial Maps and Map Reading
SCALE
Scale is the relationship between the length of a line drawn between two positions on a chart and the distance on the earth between the same points.Three methods of expressing scale are common:
Statement in words. This is self explanatory. The statement “One inch to ten nautical miles”means that a line one inch long on the chart represents a line ten nautical miles long on the earth. Representative Fraction. This is a statement in words put into mathematical form and is calculated from the equation:
Scale = Chart Length
Earth Distance
By convention, the chart length is always 1 and the dimensions above and below the line are the same and thus cancel each other to make the fraction dimensionless , i.e. representative. Thus on the ICAO 1:500,000 topo,1cm on the chart represents 500,000 cms on the earth and 1 inch on the chart represents 500,000 inches on the earth.
“One inch to ten nautical miles” becomes a representative fraction of 1 : 729 600
or 1 729600
Graduated Scale Line. Graduated scale lines are normally depicted at the bottom of the chart as in Figure 13.1 and may be in nautical miles, statute miles or kilometre. Since one degree of latitude is equal to 60 nautical miles, the provision of a latitude scale in effect provides a graduated scale line as is shown in Figure 13.2.
Figure 13.1Figure 13.1
Figure 13.2. Latitude Scale.Figure 13.2 Latitude Scale.

228
Chapter 13 Topographial Maps and Map Reading
MAP READING
Map reading can be defined as visualizing the physical features of the ground as represented on the map by symbols and forming a mental picture of the ground by relating the features one to another. This is known as reading map-to-ground. This is the basic technique used when confident that you are near track and near on-time. There is a reverse process used when less certain of position called reading ground-to-map which involves seeing an arrangement of features on the ground and being able to find those features on the map and thus locate oneself.
Visual navigation using map reading is a skill which needs practice and which will develop with experience. A number of factors can make the task easier and the most important of these factors are thorough flight planning and pre-flight route study. It is also important in flight to try to remain on track and time and, if off track, to regain track as soon as possible. But do not concentrate too much on navigation alone. It is equally important to keep a good look-out to reduce collision risks, to be aware of any potential weather problems, and to manage the aircraft systems.
VISUAL CHECK POINTS
In the planning stage, the pilot will study the route and select visual check points normally occurring at about 5 to 10 minute intervals. A visual check point will be a significant ground feature which can be overflown or used as a reference to fly an appropriate distance away from. Ideally, the check point should be recognisable from some distance away to allow for timely alterations of heading. Visual checkpoints do not need to be exactly on track; a good feature close to track is better than a poor feature on track.
SELECTING VISUAL CHECK POINTS
The ideal visual checkpoint will be recognisable from some distance away and have the following features:
Large. A large feature will be recognisable from some distance but may be too large to use for precise navigation. A good principle is to use part of a large feature as the checkpoint, e.g. if using Birmingham as a checkpoint, you will see Birmingham from some distance but choose a large Motorway junction as your accurate checkpoint.
Unique. Be sure that the checkpoint chosen could not be mistaken for a similar checkpoint in the same area. For example, disused airfields make good checkpoints but in East Anglia there are so many disused airfields (from WW2 USAF operations) that it is easy to make mistakes.
Vertical Extent. Features which have significant vertical extent ,e.g. masts, mountains, should always be identified for safety reasons, but they do make good visual checkpoints particularly because they can be identified , in good visibility, at some distance. Thus, if you can see a radio mast 20 miles away and you know you need to fly 1 mile to the right of the mast and you’re flying at 120kts, you have solved the navigation problem for the next 10 minutes and can spend your time checking aircraft systems, keeping a good lookout and enjoying your flight. But the value of features with good vertical extent alone may diminish if you fly higher – at 5000ft agl , you may not easily see a 400ft high mast.
229
Chapter 13Topographial Maps and Map Reading
Contrast. A visual checkpoint should contrast in colour or texture with its surroundings. Contrast changes with the seasons and with geographic location ,i.e. the contrast between features may be entirely different in winter and summer or in polar or desert regions. Remember also that you may have to map-read at night when the rules of contrast are significantly different. Then, unless there is a good level of moonlight, the checkpoints must be lit. Finally, serious flight safety risks occur in meteorological/geographic conditions of poor visual contrast leading to the possibility of visual illusions.
It is rare for a visual checkpoint to have all the attributes mentioned above and your selection of checkpoints for a flight will probably be a compromise. Much will depend on the altitude you intend to fly, the seasonal/meteorological conditions and the nature of the terrain over which you will be navigating. In the next section, the relative merits of various types of visual checkpoint are discussed but the section cannot provide a comprehensive guide – you, the pilot, must weigh your own selections against the ideal criteria.
SOME TYPICAL VISUAL CHECKPOINTS.
Coastlines. Coastlines generally provide excellent daytime visual checkpoints and, given reasonable moonlight, can also be used at night. Coastlines are rarely uniform for any great distance and precise navigation can normally be achieved by reference to estuaries, headlands, ports or lighthouses.
Water Features. Lakes, large rivers and canals normally show up well even taking into account seasonal variations such as floods and droughts.
Water features tend to occur in the lowest ground in a particular area and, when flying at low level, small water features may be hidden from view by surrounding high ground. Small rivers are often tree-lined which can help by providing contrast but can hinder the identification of a particular feature of the river.
Mountains/Hills. Mountains and hills can make excellent visual navigation features but flight in hilly/mountainous terrain must only be undertaken after due consideration has been given to safety aspects. In general, terrain features with good vertical extent are more useful for navigation at low altitudes (and also more dangerous). Isolated hills provide the best features whereas terrain which undulates fairly uniformly is difficult to use unless additional features are available. Valleys tend to be good visual navigation features as they can normally be identified from their orientation and the presence of other cultural features, e.g. roads, railways and towns, offer the opportunity of many precise checkpoints.
Towns/Villages. Never overfly built-up areas below 1500ft agl or below a height from which you could glide clear of the built-up area in the event of an engine failure. That said, towns and villages are useful as general indicators of position and may be used to locate more precise visual checkpoints. Towns are useful features at night because they are normally well-lit but the same is not true of villages.
Roads. Motorways (and major roads) can provide excellent check features by day and night. Even if there is no discernible checkpoint available on the feature, the feature itself is a line feature and can be used for a track check or a timing/ground speed check. Generally, precise checkpoints can be found at regular intervals along these features, e.g. crossroads, motorway junctions and service stations.
Minor roads make less reliable check features but can still be significant in areas of open country and barren mountainous terrain. A good general guideline is, the bigger the road, the better for navigation.

230
Chapter 13 Topographial Maps and Map Reading
Railways. When flying near large towns or industrial areas it can be difficult to identify particular railway lines but in more open areas, railway lines are excellent visual line features and can provide precise checkpoints at junctions, stations or where there are conspicuous bridges. Railway lines are not normally visible at night.
Woods. The usefulness of woods as visual check features is variable. In general, the rule remains ‘the bigger, the better’. Large woods often have distinctive shapes if flying above 1000ft agl, but their shapes are often difficult to recognise from lower levels particularly in hilly terrain. Also, woods change shape due to felling and planting programmes and this particularly applies to coniferous plantations (fir forests). Finally, woods are susceptible to seasonal contrast changes. Snow-covered trees do not contrast with snow-covered fields (but on the other hand, snow melts first on the trees and when this happens, shape and contrast are enhanced). Use woods with care.
Other Features. Many other features can provide excellent precise visual checkpoints: Power stations or isolated factories can often be seen at great range and often emit steam or smoke which aids identification and also facilitates estimation of surface wind velocity. If you make use of this, remember that the wind veers and increases with height above the surface. Also remember that power stations are often located along rivers and there may be several power stations along a particular stretch of river. Airfields stand out well by day from heights above 1000ft agl but always be aware whether the airfield is active or not. Airfield identification beacons are readily visible at night.
Quarries stand out particularly well but check NOTAMS for blasting activity.
Monuments, follies and chalk cuttings are precise features but rarely lit.
Lighthouses are excellent features by day or night but they are not unique unless identified in relation to coastal features by day or by their correct light transmission characteristics by night.
SOME VISUAL NAVIGATION HAZARDS
Some meteorological or geographic circumstances when a flight is being flown or navigated visually can lead to increased flight safety risks through the possible occurrence of visual illusions. These circumstances are dealt with in more detail in the Human Performance syllabus but are summarised here below:
In high latitudes, map reading is more difficult than in lower latitudes because the nature of the terrain is drastically different, charts are less detailed and less precise, and seasonal changes may alter the terrain appearance or hide it completely from view.
In areas of snow and ice from horizon to horizon and where the sky consists of a uniform layer of clouds so that no shadows are cast, the horizon disappears causing earth and sky to blend. In this situation and in ‘White-outs’ caused by blowing snow, distance and height above ground are virtually impossible to assess visually.
In conditions of poor contrast and particularly over snow covered ground, it is possible to focus on high ground well ahead of the aircraft and to fly the aircraft to cross that ground with the appropriate clearance. The poor contrast may mask intervening high ground over which your clearance may be considerably less than planned. This situation is known as ‘the hill in front of the hill’ and is particularly dangerous when flying at lower altitudes.

231
Chapter 13Topographial Maps and Map Reading
Flying over a smooth water surface, snow or a smooth desert surface makes it extremely difficult to judge height. The difficulty can be exacerbated in the overland situation if there are no features with vertical extent, e.g. trees. In a desert or tundra landscape, it is easy to see bushes and scrub trees and imagine they are full-size trees when they may actually be only a few metres high.
At night when flying over dark areas of sea or land where there are scattered pinpoints of light(ships, oil rigs, small settlements or isolated buildings) it is possible to become disorientated and to confuse the scattered lights below with the scattered stars above. This situation may be exacerbated after or during aircraft manoeuvres.
NAVIGATION TECHNIQUES
Pilot navigation techniques and chart preparation requirements appropriate to visual navigation(including the 1:60 rule) are discussed in relevant flight exercise briefings.
A disciplined approach is always the most successful. When setting heading from a start point or when altering heading at a turning point, always check that you are flying the correct heading and that the compass is synchronized. Always check that you have the appropriate altimeter setting and are flying at a safe altitude. Always check that you have started/restarted your stopwatch, or you know how much you are running early/late on planned time.
Even the best navigators become occasionally uncertain of position. It is very tempting in this situation to carry on regardless. DON’T! Start immediately to try to resolve any uncertainties using all aids available. This is a critical phase of your flight and it is very common for pilots in this situation to over-concentrate on navigation and to forget to check fuel/aircraft systems. Check your fuel/aircraft systems and then follow a ‘lost’ procedure. If you are still uncertain when you are due at a turning point, turn on time (ETA), and obey the rules above.
LOST PROCEDURE
Check compass/ASI to ensure you are flying planned headings/speeds.
If meteorological/airspace restrictions do not apply, climb to increase your visual/radio horizon.
Fix your position using all aids available (VOR/DME, VDF, Radar fix, or visual fix).
If restricted to visual (map reading ) methods, calculate a DR position. (DR = ‘Deduced Reckoning’, commonly known as ‘Dead Reckoning’)
The DR position should be deduced using the position/time of the last known accurate fix and the track/groundspeed/time flown since that fix.
Then, draw a ‘circle of uncertainty’ around the DR position. (The circle is normally drawn with a radius of 10% of the distance flown since the last fix). Remember that the DR position continues to move along track and the ‘circle of uncertainty’ gets larger with time). Now map-read from ground-to-map. Try to identify a large visual feature and locate the aircraft on the map with reference to this feature. On most occasions the aircraft position should lie within the circle of uncertainty.

232
Chapter 13 Topographial Maps and Map Reading
If still in difficulty, consider turning towards a good visual line feature outside the circle of uncertainty, e.g. coastline, motorway, main railway. On reaching this line feature, turn and follow it until you find a definite visual checkpoint from which proper naviga-tion can be resumed.
Be careful that you do not fly towards high ground in poor weather below safety altitude or that you do not fly into controlled airspace without clearance. Always keep a good lookout, monitor your fuel and aircraft systems and remember that you can use the Emergency Fixing Service on 121.5MHz ( PAN call or Training Fix). If you do have to penetrate controlled airspace without clearance or are in another real emergency, squawk 7700.
CHART SYMBOLS

233
Chapter 13Topographial Maps and Map Reading

234
Chapter 13 Topographial Maps and Map Reading

235
Chapter 13Topographial Maps and Map Reading

236
Chapter 13 Topographial Maps and Map Reading

237
Chapter 13Topographial Maps and Map Reading
QUESTIONS
1. You are flying a VFR route and have become uncertain of your position. Which is the best course of action?
a. set heading towards a line feature - coastline, river or motorwayb. turn round and fly your flight plan tracks in reverse until you see something you
recognised beforec. fly a series of ever-expanding circles from your present position till you find your next
check pointd. Turn round and fly your flight plan in reverse back to base
2. Please refer to Appendix A (Page 13 - 17). What is the symbol for an unlighted obstacle?a. 9b. 10 c. 12d. 15
3. Using the Jeppesen E(LO)1, position 5211N 00931W, which of the following denotes all the symbols?
a. military airport, ILS, NDBb. civil airport, VOR, ILSc. military airport, VOR, ILSd. civil airport, ILS, NDB
4. Using the Jeppesen E(LO)1 chart, what are the symbols at Galway Carnmore (5318.1N00856.5W)?
a. VOR, NDB, DME, compulsory reporting pointb. civil airport, NDB, DME, non-compulsory reporting point c. civil airport, VOR, DME, non-compulsory reporting point d. VOR, NDB, DME, non-compulsory reporting point
For the following questions please refer to Appendix A.
5. Which of the following is the symbol for an exceptionally high (over 1000 feet AGL) lighted obstruction?
a. 6 b. 9c. 10 d. 15
6. What symbol is used to show a VORTAC on a map/chart?
a. 5 b. 7 c. 13 d. 14
238
Topographial Maps and Map ReadingChapter 13
7. Which is the symbol for a VOR?
a. 4 b. 5 c. 13 d. 14
8. What does symbol 3 represent?
a. lit obstacleb. lighthouse c. VRPd. aeronautical ground light

239
Chapter 13Topographial Maps and Map Reading
Appendix A to QuestionsAppendix A to Consolidation Questions

240
Topographial Maps and Map ReadingChapter 13
ANSWERS
1. A
2. D
3. D
4. B
5. C
6. D
7. C
8. D

241
Chapter 14Convergency and Conversion Angle
CHAPTER FOURTEEN
CONVERGENCY AND CONVERSION ANGLE
Contents
INTRODUCTION . . . . . . . . . . . . . . . . . . . . . . . . . . . . . . . . . . . . . . .243
CONVERGENCY. . . . . . . . . . . . . . . . . . . . . . . . . . . . . . . . . . . . . . . .245
CONVERGENCY AND THE GREAT CIRCLE TRACK . . . . . . . . . . . . . . . . . .246
PRACTICAL EXAMPLES . . . . . . . . . . . . . . . . . . . . . . . . . . . . . . . . . . .248
ANSWERS . . . . . . . . . . . . . . . . . . . . . . . . . . . . . . . . . . . . . . . . . . .252
CONVERSION ANGLE . . . . . . . . . . . . . . . . . . . . . . . . . . . . . . . . . . . .254
MORE PRACTICAL EXAMPLES . . . . . . . . . . . . . . . . . . . . . . . . . . . . . .257
QUESTIONS . . . . . . . . . . . . . . . . . . . . . . . . . . . . . . . . . . . . . . . . . .260
ANSWERS . . . . . . . . . . . . . . . . . . . . . . . . . . . . . . . . . . . . . . . . . . .262

242
Chapter 14 Convergency and Conversion Angle
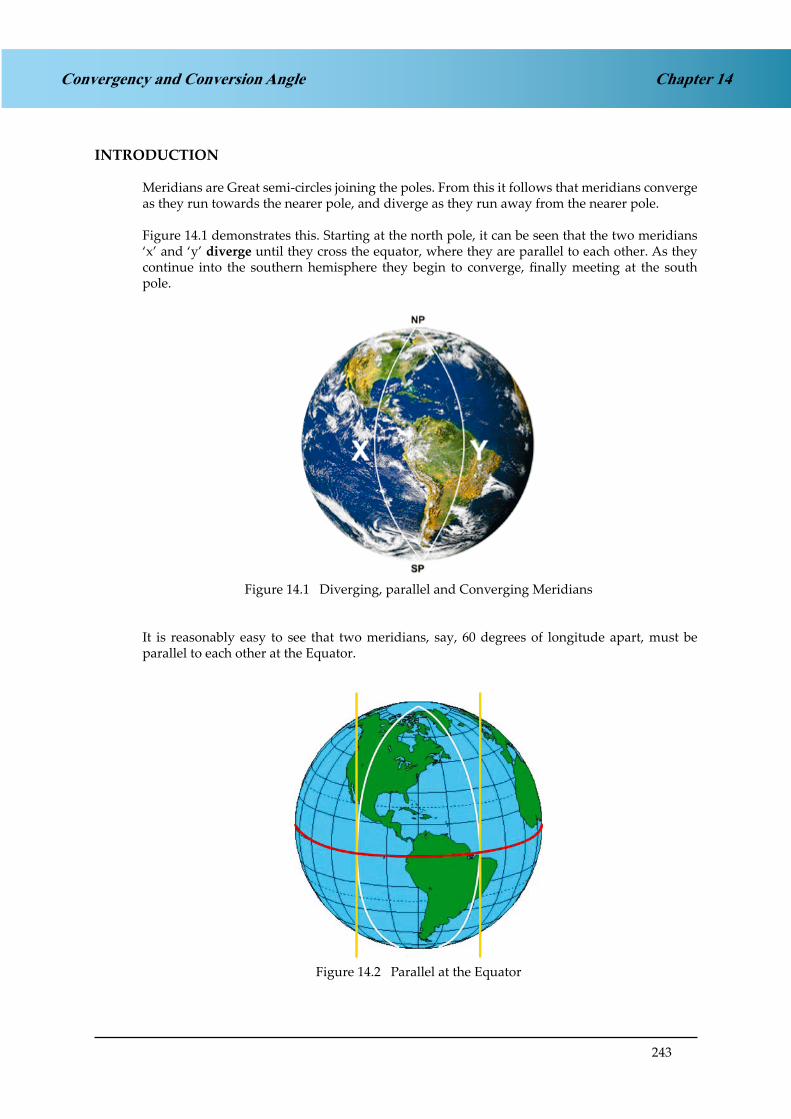
243
Chapter 14Convergency and Conversion Angle
INTRODUCTION
Meridians are Great semi-circles joining the poles. From this it follows that meridians converge as they run towards the nearer pole, and diverge as they run away from the nearer pole.
Figure 14.1 demonstrates this. Starting at the north pole, it can be seen that the two meridians ‘x’ and ‘y’ diverge until they cross the equator, where they are parallel to each other. As they continue into the southern hemisphere they begin to converge, finally meeting at the south pole.
Figure 14.1 Diverging, parallel andConverging Meridians
Figure 14.1 Diverging, parallel and Converging Meridians
It is reasonably easy to see that two meridians, say, 60 degrees of longitude apart, must be parallel to each other at the Equator.
Figure 14.2 Parallel at the EquatorFigure 14.2 Parallel at the Equator

244
Chapter 14 Convergency and Conversion Angle
At the Pole, however, they will converge at an angle exactly equivalent to their difference in longitude - in this case, 60°. There are 360° of longitude - 180°E and 180°W, and a full revolution looking down vertically on the pole is also 360°. Therefore the angle at the pole is the difference in longitude.
Figure 14.3Maximum Convergence at Pole
Figure 14.3 Maximum Convergence at Pole
It also follows that at some intermediate latitude, there will be an intermediate amount of convergence. The angle of inclination of the 2 meridians will be more than zero (the value at the Equator), but less than 60° (the value at the Pole).
Figure 14.4Intermediate Convergence
Figure 14.4 Intermediate Convergence

245
Chapter 14Convergency and Conversion Angle
CONVERGENCY
This angle is known as Convergency or as Earth Convergence. Convergency is defined as the angle of inclination between two selected meridians measured at a given latitude.
Figure 14.5 Converging and Diverging MeridiansFigure 14.5 Converging and Diverging Meridians
Figure 14.5 shows our 3-dimensional problem as a 2-D drawing. However, you should have been able to see from the 3-D drawings of the spherical Earth why the angle at the Poles is the change in longitude.
In Figure 14.5 above:
Position Latitude Change ofLongitude Convergency Convergency
Ch Long
Equator 0° 60° 0° 0
Pole 90° 60° 60° 1.0
At the Equator, where the latitude is 0°, (convergency/ch long) is zero. At the Poles, where the latitude is 90°, (convergency/ch long) is one
Therefore the relationship between convergency and latitude is a function of the sine of the latitude.
This gives us the formula:
Convergency = Change in Longitude x Sine Latitude

246
Chapter 14 Convergency and Conversion Angle
Figure 14.6. ConvergencyFigure 14.6 Convergency
In Figure 14.6 the latitude chosen is 30°N, and tangents have been drawn to each meridian at this latitude. The angle between the slope of the two tangents is convergency.
In this example, the change of longitude is 40°. (sin 30° = 0.5)Therefore:
convergency = 40° x 0.5 = 20°
We now have a formula for calculating convergency between any 2 meridians at the same latitude. However, it may not be immediately obvious why a pilot should wish to know what the convergency between 2 meridians at any particular latitude is.
CONVERGENCY AND THE GREAT CIRCLE TRACK
At any point on the earth, True North is defined with reference to the direction of the local meridian. If you are at a different meridian in flight from the point at which you started, your local direction of True North has changed. This is the reason why a Rhumb Line is a continuously curved line on the earth’s surface. If it did not constantly curve, it could not cut all the meridians (which are at different angles to each other) at the same angle.
If you are flying a Great Circle track (all automatic computing systems, such as Inertial Navigation Systems, Global Positioning Systems, and Flight Management Computers do, in fact, compute steering signals along Great Circle tracks), then your Great Circle track will alter over a period of time with the respect to True North by exactly the amount of convergency. The track direction is defined by reference to the meridians, and if the direction of the meridians changes, then the track direction changes.
The change in Great Circle track direction is the angle of inclination of the meridians at the 2 points where the track is measured.
Figure 14.7 shows a great circle cutting two meridians, X and Y. Tangents to the meridians have been drawn at the points where the great circle cuts them, and convergency is shown in the same way as before.

247
Chapter 14Convergency and Conversion Angle
The great circle direction at meridian X is represented by the angle ‘a’ and the great circle direction at meridian Y by the angle ‘b’. The difference between the two is ‘b’-’a’ - convergency.
Figure 14.7 Convergency as the change in greatcircle direction
Figure 14.7 Convergency as the change in great circle direction
In this case, however, the meridians are not crossed by the Great Circle at the same latitude. Indeed, there are only 2 mean track directions (due East or due West) where they will be at the same latitude. On any other mean track, by definition, there will be some element of north or south latitude change between the meridians.
In this case, we cannot use the simple convergency formula because there is no one term for ‘sine latitude’. Instead we take the sine of the mid-latitude or mean latitude (which are the same thing when there are only 2 points to consider).
To summarise, convergency is the angle of inclination between two selected meridians measured at a given latitude and is equal to the difference between the great circle directions measured at each meridian. Its value may be calculated from the formula:-
Convergency = Change in Longitude x Sine Mean Latitude
where mean latitude is the mean (or average) latitude between the two points.

248
Convergency and Conversion AngleChapter 14
PRACTICAL EXAMPLES
Let’s examine how this works in practice (and also learn how to answer typical exam questions) by looking at a worked example.
Question 1
The initial great circle track from A (4000N 00200W) to B (5000N 00100E) is 060°(T). What is the initial great circle track from B to A?
Start by drawing a diagram. It is only a sketch, to get the situation into your mind - not a scale drawing. You are in the Northern Hemisphere. So draw a couple of meridians converging northwards, like this:
Figure 14.8 Meridians Converging Northwards
Figure 14.8 Meridians Converging Northwards
The initial great circle track from one of them is 060°(T). So make it the left-hand one, because if you draw it from the right hand one, the bearing goes off the diagram, like this:
Figure 14.9 Incorrect Diagram
Figure 14.9 Incorrect Diagram - So choose the other one instead:
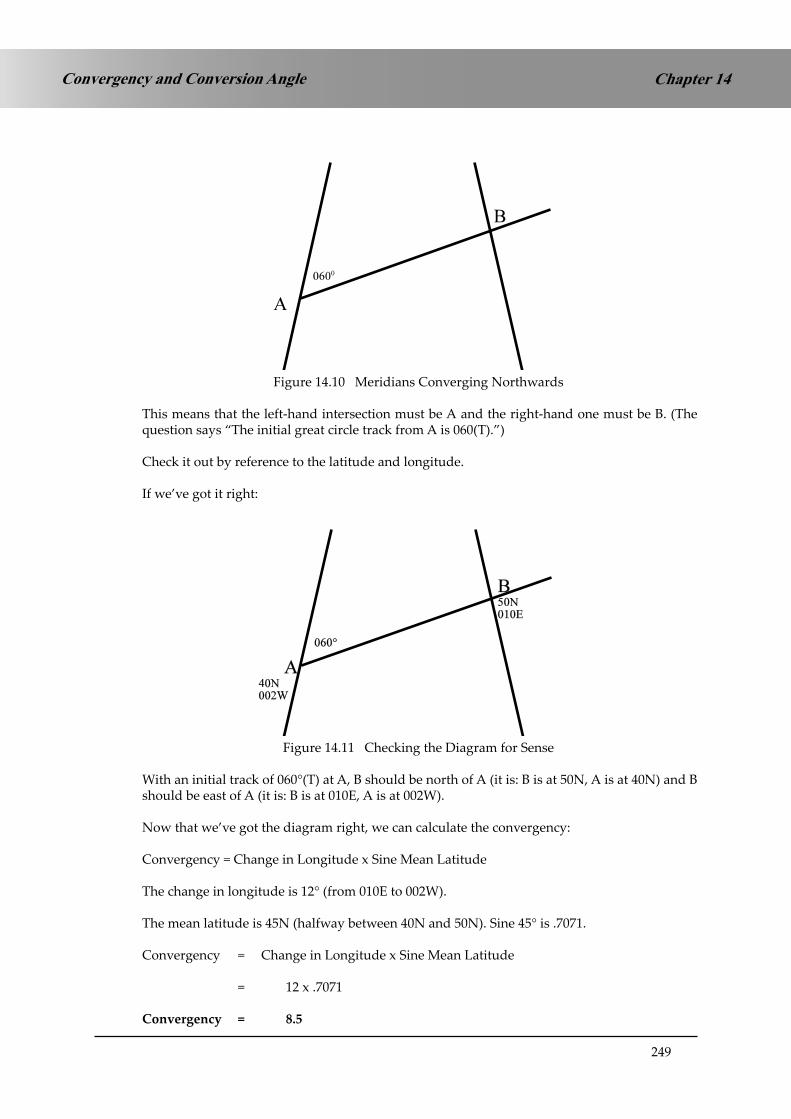
249
Chapter 14Convergency and Conversion Angle
Figure 14.10 Meridians Converging Northwards
Figure 14.10 Meridians Converging Northwards
This means that the left-hand intersection must be A and the right-hand one must be B. (The question says “The initial great circle track from A is 060(T).”)
Check it out by reference to the latitude and longitude.
If we’ve got it right:
Figure 14.11 Checking the Diagram for Sense
Figure 14.11 Checking the Diagram for Sense
With an initial track of 060°(T) at A, B should be north of A (it is: B is at 50N, A is at 40N) and B should be east of A (it is: B is at 010E, A is at 002W).
Now that we’ve got the diagram right, we can calculate the convergency:
Convergency = Change in Longitude x Sine Mean Latitude
The change in longitude is 12° (from 010E to 002W).
The mean latitude is 45N (halfway between 40N and 50N). Sine 45° is .7071.
Convergency = Change in Longitude x Sine Mean Latitude
= 12 x .7071
Convergency = 8.5

250
Convergency and Conversion AngleChapter 14
Now, there are 2 ways to solve this problem, depending on which definition of convergency you prefer.
If you use the definition that:
convergency = change in Great Circle track between 2 meridians, then the Great Circle track has changed 8.5 degrees between A and B.
It left A on a track of 060°, so using the rules given by the D-I-I-D diagram on Page 28:
Traveling eastwards in the Northern hemisphere, the track will increase. The track angle will be 068.5° as it passes through B. To find the track from B to A, as it passes through B, take the reciprocal, 248.5°
If you prefer the definition that: convergency = angle of inclination between 2 meridians,
then start like this:
Figure 14.12 Meridians Converging Northwards
Figure 14.12 Meridians Converging Northwards
Parallel the meridian at A over to B:
Angle M is 8.5° (the inclination of the meridians). Angle N is 060 ° (corresponding angles between meridians in classical geometry).
Therefore the total of M + N is 068.5°.
Fig 14.12 Parallel the MeridianFigure 14.13 Parallel the Meridian

251
Chapter 14Convergency and Conversion Angle
The meridian at B defines True North at that point. So the track angle of the continuation of the line AB is 068.5° at B.
Therefore the Great Circle bearing of A from B, measured at B, is 248.5°
Now try the following:
Question 2
The initial great circle track from C (3600N 01500E) to D (latitude 4200N) is 300°(T) and the final great circle track at D is 295°(T).
a. What is the longitude of D?b. What is the approximate great circle track direction at longitude 01100E?
Question 3
The initial great circle track from H (4000S 17000W) to G (4500S 17400E) is 250°(T). What is the initial great circle track from G to H?

252
Convergency and Conversion AngleChapter 14
ANSWERS
Answer to Question 2
a. As the track has changed from 300°(T) to 295°(T), the convergence must be 5°.
The question tells us that C is at 36°N and D is at 42°N, so the mean latitude must be 39°N.
Now, substituting in to the equation:
convergency = ch long x sin mid lat
5° = Ch long x sin 39°
Change in longitude = 5° = 8° Sin 39
Figure 14.14 The Basic Diagram
Figure 14.14 The Basic Diagram
If the change in longitude is 8° and C is at longitude 015° E and D is west of C, then the longitude of D is 00700E.
b. Longitude 01100E is halfway between 01500E and 00700E. Therefore the Great Circle track will be halfway between 300° (T) and 295° (T), ie 297.5° (T)
Figure 14.15 Mid-LongitudeFigure 14.15 Mid-Longitude

253
Chapter 14Convergency and Conversion Angle
Answer to Question 3
Southern hemisphere this time. Draw in an initial great circle track of 250°(T). It must be from the right-hand side of the diagram if it’s going to cut the other one. Therefore the right-hand one must be H and the left-hand one must be G.
Figure 14.16 Meridians Converging SouthwardsFigure 14.16 Meridians Converging Southwards
Just to be 100% certain we’ve got it right, check the latitudes and longitudes. The question tells us that H is 40S, G is 45S. So G should be south of H on our diagram; it is. H is 170W and G is 174E. As we are crossing the Greenwich anti-meridian (180 E/W), left and right are the right way round on this diagram - confusing, but correct. Check the explanation in chapter 1 if clarification is required.
convergency = ch long x sin mid lat
= 16° ch long x sin 42.5° = 10.8°
Therefore, as before - either say that the convergency is the change in Great Circle track angle, so the track angle at G is 260.8° (T) going westwards, therefore the reciprocal at G is 080.8°(T).
Or, say that convergency is the angle of inclination of the meridians. Draw in a parallel construction line, as follows:
The reciprocal track from the parallel construction line from G to H is 070°. The convergency between the parallel construction line and the meridian at G is 10.8°. Therefore the track angle from True North (i.e. the meridian) at G back to H is 080.8°.
Figure 14.17 Drawing in a parallel
Figure 14.17 Drawing in a parallel

254
Chapter 14 Convergency and Conversion Angle
CONVERSION ANGLE
Consider the following situation:
(In this example, the drawing has been done as a Mercator-type projection, with the meridians shown as parallel lines, even though they are in fact convergent on the Earth. This is to make it clear that the Rhumb Line track does not change track angle but the Great Circle does. The same example is given on page 14-13 as a sketch with convergent meridians).
Figure 14.18 Rhumb Line and Great Circle
Figure 14.18 Rhumb Line and Great Circle
In Figure 14.18, we have 2 meridians 40 degrees of longitude apart. Now consider both the GreatCircle and the Rhumb Lines running from A (30N 020W) to B (30N 020E).
The Rhumb Line (shown in red) is the parallel of latitude of 30N and therefore has a constant track direction of 090°(T) at any point along it.
However, the Great Circle changes direction. The diagram shows that it leaves A on a track angle of less than 090°(T) and crosses B on a track angle of more than 090°(T).
We can calculate the amount that it changes direction, as follows:-
convergency = ch long x sine mid lat
= 40° change of longitude x Sine 30°
= 20°
So, whatever direction it left A on, its track angle will be 20° greater at B. Now, the diagram is completely symmetrical about the mid-latitude (0° E/W, in this example). We know that the Rhumb Line track angle is 090°(T)all the way, which is also the direction of the Great Circle track at mid-longitude. Therefore the Great Circle track must have left on a track of 080°(T) at A and passed through B on a track of 100°(T).
The difference between Great Circle direction and Rhumb Line direction joining two given points is called Conversion Angle

255
Chapter 14Convergency and Conversion Angle
Conversion angle, in our example, is 10°. At A, it is the difference between 080°T(the Great Circle track) and 090°T (the Rhumb Line track). At B, it is the difference between 100°T (the Great Circle track) and 090°T (the Rhumb Line track). Conversion angle is always the same at each end of the 2 points connected by the Great Circle and the Rhumb Line tracks.
This leads to the following definition and formulae:
Figure 14.19 Conversion AngleFigure 14.19 Conversion Angle
Conversion Angle is the difference between Great Circle direction and Rhumb Line direction joining two given points.
Conversion angle is ½ convergency.
Conversion angle = ½ change of longitude x sin mean latitude
Figure 14.20 Same Situation - Different Projection
Figure 14.20 Same Situation - Different Projection
It is equally possible to draw the diagram with convergent meridians. In this case, the Great Circle appears as a straight line, even though its track angle changes direction, and the Rhumb Line appears as a curve, even though it is a line of constant True direction. However, the Great Circle still runs nearer the near pole, exactly as on the globe.

256
Chapter 14 Convergency and Conversion Angle

257
Chapter 14Convergency and Conversion Angle
MORE PRACTICAL EXAMPLES
Question 4
a. Determine the value of convergency between J (5812N 00400W) and K (5812N 00600E).
b. What is the rhumb line track from J to K? c. What is the initial great circle track from K to J?
Question 5
The following waypoints are entered into an inertial navigation system (INS)
WPT 1: 53°08’N 030W WPT 2: 53°08’N 020W WPT 3: 53°08’N 010W
The inertial navigation is connected to the automatic pilot on the route WP1 – WP2 – WP3. The track change on passing WP 2 will be approximately:
a. a 8° increase b. a 4° decrease c. zero d. a 8° decrease
Question 6
Given that:
A is N55° E/W 000° B is N54° E 010°, if the initial true great circle track from A to B is 100° (T), what is the
true Rhumb Line track at A?
a. 096°(T) b. 107°(T) c. 104°(T) d. 100°(T)
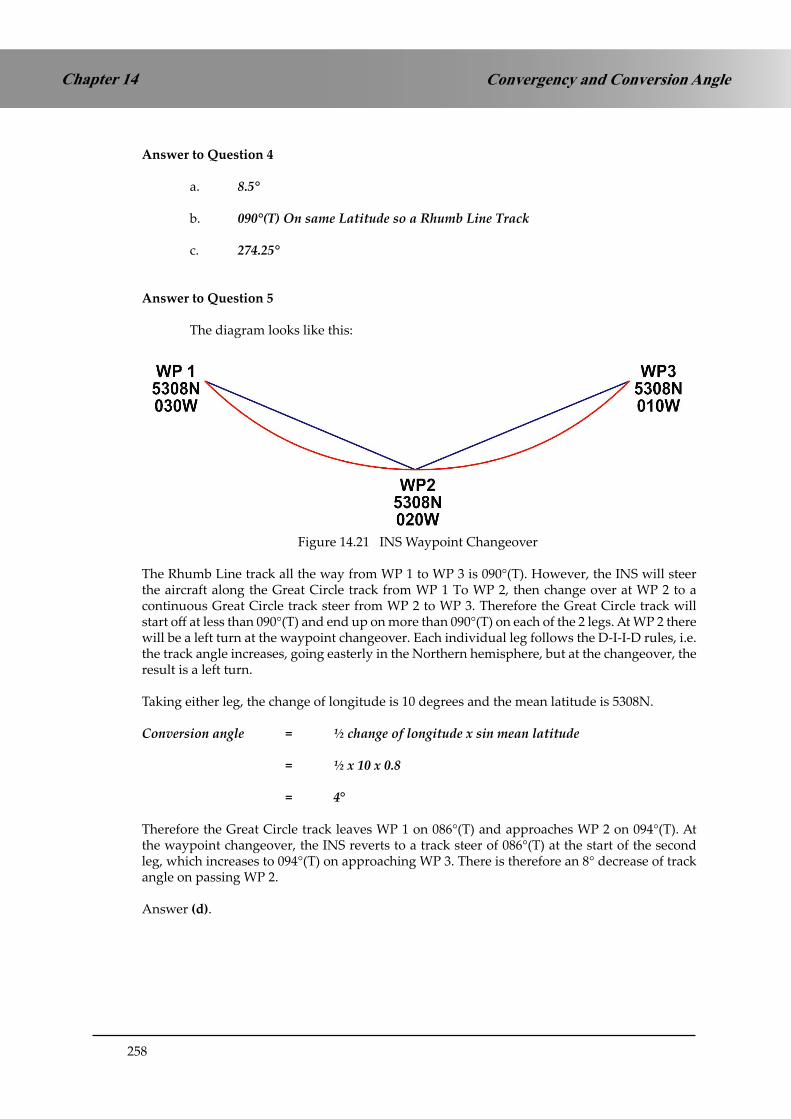
258
Convergency and Conversion AngleChapter 14
Answer to Question 4
a. 8.5°
b. 090°(T) On same Latitude so a Rhumb Line Track
c. 274.25°
Answer to Question 5
The diagram looks like this:
Figure 14.21 INS Waypoint ChangeoverFigure 14.21 INS Waypoint Changeover
The Rhumb Line track all the way from WP 1 to WP 3 is 090°(T). However, the INS will steer the aircraft along the Great Circle track from WP 1 To WP 2, then change over at WP 2 to a continuous Great Circle track steer from WP 2 to WP 3. Therefore the Great Circle track will start off at less than 090°(T) and end up on more than 090°(T) on each of the 2 legs. At WP 2 there will be a left turn at the waypoint changeover. Each individual leg follows the D-I-I-D rules, i.e. the track angle increases, going easterly in the Northern hemisphere, but at the changeover, the result is a left turn.
Taking either leg, the change of longitude is 10 degrees and the mean latitude is 5308N.
Conversion angle = ½ change of longitude x sin mean latitude
= ½ x 10 x 0.8
= 4°
Therefore the Great Circle track leaves WP 1 on 086°(T) and approaches WP 2 on 094°(T). At the waypoint changeover, the INS reverts to a track steer of 086°(T) at the start of the second leg, which increases to 094°(T) on approaching WP 3. There is therefore an 8° decrease of track angle on passing WP 2.
Answer (d).

259
Chapter 14Convergency and Conversion Angle
Answer to Question 6
Here is the diagram:-
Figure 14.22 Question 6 DiagramFigure 14.22 Question 6 Diagram
Conversion angle = ½ change of longitude x sin mean latitude
= ½ x 10 x 0.8
= 4°
IT IS NECESSARY TO APPLY THE CONVERSION ANGLE AT THE POSITION WHERE THE GREAT CIRCLE DIRECTION IS MEASURED.
In this case, the GC track is 100°(T) so, with a CA of 4°, the RL track will be 104°(T).
Answer (c).
Radio waves travel over the surface of the earth along great circle paths. It is often necessary for navigational purposes to convert the great circle direction to a rhumb line direction and this is done by applying conversion angle to the great circle direction to obtain the rhumb line direction. This will be covered in more detail in the chapter on the Mercator chart.

260
Convergency and Conversion AngleChapter 14
QUESTIONS
1. The convergency of the meridians through M and N which are in the southern hemisphere is 12°.If the rhumb line track from M to N is 249°(T), what is the great circle track:
a. from M to N?b. from N to M?
2. The great circle bearing of position B in latitude 30°00’S from position A (30°00’S 165°00’E) is100°(T).What is:
a. The great circle track from B to A?b. The longitude of position B ?
3. The rhumb line from position D (30°00’N 179°00’W) to position C is 090°(T). The great circle initial track from C to D is 287°(T).
What is:
a. The great circle track from D to C?b. The approximate latitude and longitude of position C ?
4. The great circle track from A to B measures 227°(T) at A and 225°(T) at B. What is the convergency of the meridians through A and B and in which hemisphere are they?
5. a. In what latitude is the convergency between two meridians on the earth equal to twice their convergency in latitude 20°N?
b. Is there a latitude where the convergency would be three times the value at 20°N?
6. a. A and B are in the same hemisphere. The initial great circle track from B to Ais 268°(T) and the initial great circle track from
A to B is 092°(T).
i) In which hemisphere are A and B? ii) What is the rhumb line track from A to B?
b. C and D are in the same hemisphere. The initial great circle track from C to C is 063°(T) and the rhumb line track from D to
C is 240°(T).
i) In which hemisphere are C and D? ii) What is the approximate initial great circle track from D to C?
7. Position X 64°00’S 11°50’W. Position Y 64°00’S 05°10’W.Give:
a. The convergency between the meridians of X and Y.b. The approximate initial great circle track from Y to X.c. The rhumb line track from X to Y.

261
Chapter 14Convergency and Conversion Angle
8. a. Calculate the convergency between positions A (55°30’N 04°35’W) and B (64°00’N 22°37’W).
b. If the rhumb line track from A to B is 313°(T) what is the approximate initial great circle track from B to A?
9. The initial great circle track from B to A is 245°(T) and the rhumb line track from A to B is 060°(T).
If the mean latitude between A and B is 53° and the longitude of B is 02°15’E, what is the
longitude of A?
10. A and B are both in the southern hemisphere and the convergency of their meridians is 8°. The initial great circle track from A to B is 094°(T).
If the position of B is 23°00’S 20°00’W, what is the position of A?

262
Convergency and Conversion AngleChapter 14
ANSWERS
1. a. 243°(T)
b. 075°(T)
2. a. 260°(T)b. 155° West
3. a. 073°(T)b. 30°N 111°W
4. 2° of Convergency and in Northern Hemisphere
5. a. Latitude 43° Northb. No, because you can’t have a latitude whose sine is greater than 1.00
6. a. i) Southern Hemisphere ii) 090°(T), as A and B on same latitudeb. i) Southern Hemisphere ii) 237°(T)
7. a. 6°b. 267°(T)c. 090°(T)
8. a. 15.5° Convergency; call it 16°b. 125°(T)
9. 010° 15’ W
10. Position A is at 23° 00S 040° 30’ W. (Rhumb Line is 090° T)

263
Chapter 15Departure
CHAPTER FIFTEEN
DEPARTURE
Contents
DEFINITION OF DEPARTURE. . . . . . . . . . . . . . . . . . . . . . . . . . . . . . . .265
CALCULATION OF DEPARTURE. . . . . . . . . . . . . . . . . . . . . . . . . . . . . .266
TYPES OF DEPARTURE QUESTIONS . . . . . . . . . . . . . . . . . . . . . . . . . . .267
VARIATIONS ON THE BASIC DEPARTURE FORMULA . . . . . . . . . . . . . . . .267
GIVEN DEPARTURE AT ONE LATITUDE, FIND IT AT ANOTHER . . . . . . . . . .268
INSPECTION OF THE ANSWERS . . . . . . . . . . . . . . . . . . . . . . . . . . . . . .269
QUESTIONS . . . . . . . . . . . . . . . . . . . . . . . . . . . . . . . . . . . . . . . . . .270
ANSWERS . . . . . . . . . . . . . . . . . . . . . . . . . . . . . . . . . . . . . . . . . . .272

264
Chapter 15 Departure

265
Chapter 15Departure
DEFINITION OF DEPARTURE
Departure results from the convergence of the meridians at different latitudes.
Departure is the distance between two meridians along a specified parallel of latitude, usually in nautical miles.
Consider Figure 15.2 below. You can see that our 2 meridians represent the same change of longitude, whatever their latitude. However, because they converge from the Equator to the Pole, the same change of longitude does not represent the same East- West distance in nautical miles.
Figure 15.1 Departure
If we take the equator as our specified parallel of latitude, the distance between 2 meridians will be greater than at some higher latitude.
Figure 15.2 Effect of Latitude
Departure is maximum at the equator where 1° Change of Longitude (Ch. Long) equals 60’ of arc of a Great Circle.
Figure 15.3 Maximum at Equator
Figure 15.1 Departure
Figure 15.2 Effect of Latitude
Figure 15.3 Maximum at Equator

266
Chapter 15 Departure
Departure is zero at both poles because the meridians converge and meet at these two points.
Figure 15.4 Zero at PolesFigure 15.4 Zero at Poles
Departure therefore varies as the cosine of the latitude.
It can be found by applying the formula;-
Departure (nm) = Ch.Long (min) × cos.lat
Since this distance is always along a parallel of latitude it represents a Rhumb Line distance.
CALCULATION OF DEPARTURE
Consider 2 meridians on the Earth, joined by a parallel of latitude, as in Figure 15.5. The diagram is reduced to a sketch in Figure 15.6, below:
Figure 15.5 Meridians and a Parallel
In this example, the change of longitude is 20 degrees.
Multiply by 60 to convert it into minutes.
Then multiply by the cosine of 52°.
Departure (n.m.) = Ch.Long (min) × cos.lat
= 20 x 60 x Cos 52°
= 738.8 nautical miles
Figure 15.6 Departure Sketch
Figure 15.5 Meridians and a Parallel
Figure 15.6 Departure Sketch

267
Chapter 15Departure
TYPES OF DEPARTURE QUESTIONS
There are 2 main types of question on departure:
Variations on the basic departure formula Given departure at one longitude, calculate it at another
These are set out in more detail below:-
VARIATIONS ON THE BASIC DEPARTURE FORMULA
Example 1 An aircraft at position 6000N 00522W flies 165 km due East. What is the new position?
Firstly, convert 165 km to nm. 165/1.852 = 89 nm.
Now substitute into the departure formula:
Departure (n.m.) = Ch.Long (min) × cos.lat 89 = Ch long x Cos 60°
Therefore, Ch long = 89 / .5 = 178 mins of longitude
This is 2° 58’ East from an initial longitude of 00522W.
The new position is 6000N 00224W.
Example 2 In which latitude is a difference of longitude of 44°11’ equivalent to a departure of 2000nm?
44°11’ = 2651 minutes of arc
Departure (n.m.) = Ch.Long (min) × cos.lat
2000 = 2651 x Cos lat
cos. Lat. = Dep
D.Long
= 2000 = 0.7544 2651
∴ Latitude is 41° North or South

268
Chapter 15 Departure
GIVEN DEPARTURE AT ONE LATITUDE, FIND IT AT ANOTHER
Example 3
An aircraft leaves position ‘G’ in Latitude 40°S and flies the following Rhumb Line tracks and distances;-
G to H: 180°(T) 240nm H to J: 270°(T) 240nm J to K: 000°(T) 240nm
What is the rhumb line bearing and distance of ‘K’ from ‘G’?
Figure 15.7 Diagram for Example 3
There are 2 ways you can solve these types of question. One is by a double substitution into the basic departure formula. It works, but it’s a bit slower. The other is by use of the following formula:-
Departure at Latitude A = Cos A Departure at Latitude B = Cos B
The new formula is quicker and saves time. Let’s do the question both ways, firstly using double substitution into the basic departure formula and then by use of the new formula. You should then see the advantage of the new formula.
Method 1
240nm = change of Lat of 4° S ∴ Lat of H = 44°S
Departure (n.m.) = Ch.Long (min) × cos.lat
240 = ch long x cos 44
Therefore ch long. H to J = 240 cos 44
ch long. H to J = 333.6 minutes of longitude
Change of lat from J to K also = 4°
Thus K will be at 40°S and change of long from K to G is the same as J to H, i.e. 333.6 mins of long
Departure (n.m.) = Ch.Long (min) × cos.lat
= 333.6 x cos 40
= 255.6 nm
Rhumb Line bearing = 270°(T)
Figure 15.7 Diagram for Example 3

269
Chapter 15Departure
Method 2
Re-arrange this formula:
Departure at Latitude A = Cos A Departure at Latitude B = Cos B
into Departure at Latitude A = Departure at Latitude B x Cos A Cos B
Choose Latitude B to be the one for which you already know the departure (240 nm), which is 44S, which means that you can solve for Latitude A (40S) without any further rearrangement of the algebra.
Departure at Latitude A = 240 x Cos 40 = 255.6 nm Cos 44
INSPECTION OF THE ANSWERS
Don’t forget that for some questions, it is not always necessary to calculate. If the 4 option answers are given, it may be possible to solve the question by elimination of the impossible answers and save calculation time.
Example 4
An aircraft at position 2700N 17000W travels 3000 km on a track of 180°(T), then 3000 km on a track of 090°(T), then 3000 km on a track of 000°(T), then 3000 km on a track of 270°(T). What is its final position?
a. 2700N 17000W b. 0000N/S 17000W c. 2700N 17318W d. 2700N 14300W
Answer: If the aircraft starts at 2700N and it travels the same distance (3000 km) due S, then E, then N, then W, the change of longitude when flying westward (at the higher latitude) will be greater than when it flew eastward at the lower latitude. Therefore it will finish up at the same latitude that it started from, but further west. Answer (c) is the only one that fits. You can do the calculation if you like, and you will get the right answer, but it’s not necessary.

270
DepartureChapter 15
QUESTIONS
1. A flight is to be made along the parallel of latitude from A at 48°00’N 04°00’W to B at 48°00’N 02°27’E. Calculate the distance.
2. An aircraft flies for 1000nm along a rhumb line track of 090°(T) from C at 36°00’N 174°45’E to D. What is the longitude of D?
3. The following rhumb line tracks and distances flown; starting from E in latitude 50°N.E to F 000°(T) 300nm F to G 090°(T) 300nm G to H 180°(T) 300nm
What is the rhumb line bearing and distance of H from E?
4. What is the track and distance measured along the parallel of latitude of 80°S from 176°15’W to 179°45’E?
5. In which latitude is a difference in longitude of 44°10’ the equivalent of a departure of 2295nm?
6. An aircraft leaves J (36°00’S 130°14’E) at 0946 GMT, flying a rhumb line track of 270° at Flight Level 100, temperature 0°C, Mach No. 0.81, wind component 35kt tail. What is the aircraft’s position at 1004 GMT?
7. a. In which latitude is the departure in nm. between two points equal to: i. their difference in longitude in minutes? ii. half their difference in longitude in minutes?
b. In latitude 52°N, i. What is the departure between the meridians of 136°16’W and 43°44’E? ii. what is the shortest distance between the same points?
8. An aircraft leaves position L in latitude 37°S and makes good the following tracks and ground speeds:
L to M 270(T) 310kt M to N 180(T) 280kt N to P 090°(T) 250kt
P is due south of LM is reached 80 minutes after leaving LP is reached 93.5 minutes after leaving N
Calculate the distance and time from M to N.
9. Aircraft Q, ground speed 301kt flies parallel of latitude 46°N through 10° of longitude. Aircraft R, ground speed 364kt flies between the same meridians in the same time as aircraft Q.
What is the latitude of the track of aircraft R?

271
Chapter 15Departure
10. Aircraft S leaves position 36°N 10°E at 1522 hours, and flies a rhumb line track of 090°(T) at ground speed 470kt until it reaches the 13°E meridian when it turns onto a track of 180°(T) at a ground speed of 460kt.
Aircraft T leaves position 30°N 10°E at 1522 hours and flies a rhumb line track of 090°(T) at groundspeed 150kt,
1. Which aircraft reaches position 30°N 13°E first?2. At what time does this occur?3. Give the position of the other aircraft at this time.
11. An aircraft starts at position 0410S 17822W and heads true north for 2950 nm, then turns 90 degrees left, and maintains a rhumb line track for 314 kilometers. What is its final position?
a. 5500N 17422W b. 4500N 17422W c. 5500N 17738Ed. 4500N 17738E
12. An aircraft at position 2700N 17000W travels 3000 km on a track of 180°(T), then 3000 km on a track of 090°(T), then 3000 km on a track of 000°(T), then 3000 km on a track of 270°(T). What is its final position?
a. 2700N 17000W b. 0000N/S 17000W c. 2700N 17318W d. 2700N 14300W
13. An aircraft departs a point 0400N 17000W and flies 600 nm South, followed by 600 nm East, then 600 nm North, then 600 nm West. What is its final position?
a. 0400N 17000Wb. 0600S 17000Wc. 0400N 169° 58.1’Wd. 0400N 170° 01.8’W
14. An aircraft is flying around the Earth eastwards along the 60N parallel of latitude at a groundspeed of 240 knots. At what groundspeed would another aircraft have to fly eastwards along the Equator to fly once round the Earth in the same journey time?
a. 600 knots b. 240 knots c. 480 knots d. 120 knots
15. Your position is 5833N 17400W. You fly exactly 6 nm eastwards. What is your new position?
a. 5833N 17411.5W b. 5833N 17355Wc. 5833N 17340W d. 5833N 17348.5W
272
DepartureChapter 15
ANSWERS
Question 1Change of longitude 6° 27’ = 387 mins long. Distance = 387 x Cos 48° = 259 nm.
Question 2
Distance = 1000 nm = 1000 mins long = 1236’ Cos 36°
= 20°36’ East from 174°45’E
= 164°39’W
Question 3
55°N ........... 300nm Dep 300 x Cos 50 = 336 nmF to G Cos 55
300 nm = 5° (F/G and E/H have SAME change of Longitude
50°N .......... E to H E to H Departure Distance 336 nms
E to F 300 nm = 5° Lat. Lat of F = 55°F to G 300 nm = 300 = 523’ Long. Cos 55°
G to H 300 nm = 5° Lat. Lat of H = 50°At 50° 523’ Long. = 523 x Cos 50° = 336 nm.
Rhumb line bearing H from E = 090° at 336 nm.
Question 4
176°15’W to 179°45’E = 4° = 240’ long.240’ = 240 x Cos 80° = 41.7 nm.
Track = 270°(T) Dist 41.7 nm
Question 5
44°10’ = 2650’ Long.
Dist 2295 = Cos Lat = 0.866 = 30°Mins Long. 2650
Lat = 30°N or S

273
Chapter 15Departure
Question 6
M 0.81 T emp 0° TAS = 520 kt + 35 Tail = 555 kt GS18 mins at 555 kt = 166.5 nm.
166.5nm = 206 mins Long = 3°26’ LongCos 36°
130°14’E - 3°26’ = 126°48’E
Position at 1004 = 36°00’S 126°48’E
Question 7
a. i) At Equator ii) At 60° N/S
b. i) Ch long. = 180° = 10800’ = 10800 x Cos 52° nm = 6653 nm ii) Shortest distance = great circle via pole. (90 - 52) x 2 = 76° = 4560 nm
Question 8M L
N P
L to M = 413.3 nm = 413.3 = 517’ = 8°37’ Cos 37°
N to P = 93.5 mins at 250 kt = 389.6 nm; also = 8°37’ 389.6 = Cos Lat of N and P Lat N & P = 41°00’S 517
Dist M to N = 41°00’S - 37°00’S = 4° = 240 nmTime M to N = 240 nm at 280 = 51.25 mins.
Question 9
Q at 46° 10° Long = 600’ = 600 x Cos 46° = 417 nm @ 301 kt = 83 minsR at GS 364 kt in 83 mins covers 503.5 nm.
Dist nm 503.5 = Cos Lat of R Mins Long 600
Lat of R = 33°00’ N/S

274
DepartureChapter 15
Question 10
S 10°E to 13°E = 180’ Long = 145.6 nm @ 470 kt = 18.5 mins 36°N to 30°N = 360 nm @ 460 kt + 47.0 mins Total = 65.5 mins
T 180’ Long @ 30°N = 155.9 nm @ 150 kt = 62.0 mins
T reaches 30°N 13°E 3.5 mins before S
3.5 mins @ 460 kt = 27 nm = 27’ Lat
When T reaches 30°N 13°E S will be 27’ North
= 30°27’N 13°00’E
11. D
12. C
13. C
14. C
15. D

275
Chapter 16Scale
CHAPTER SIXTEEN
SCALE
Contents
SCALE . . . . . . . . . . . . . . . . . . . . . . . . . . . . . . . . . . . . . . . . . . . . . .277
CONVERTING FROM A STATEMENT IN WORDS TO A REPRESENTATIVE FRACTION . . . . . . . . . . . . . . . . . . . . . . . . . . . . . . . . . . . . . . . . . . . . . . . . . .278
REMINDER ABOUT CONVERSION FACTORS . . . . . . . . . . . . . . . . . . . . . .278
EASY CALCULATOR OPERATION . . . . . . . . . . . . . . . . . . . . . . . . . . . . .279
TYPES OF SCALE QUESTION . . . . . . . . . . . . . . . . . . . . . . . . . . . . . . . .279
ROUNDING ERRORS . . . . . . . . . . . . . . . . . . . . . . . . . . . . . . . . . . . . .280
LARGE AND SMALL SCALE . . . . . . . . . . . . . . . . . . . . . . . . . . . . . . . .280
QUESTIONS . . . . . . . . . . . . . . . . . . . . . . . . . . . . . . . . . . . . . . . . . .281
ANSWERS . . . . . . . . . . . . . . . . . . . . . . . . . . . . . . . . . . . . . . . . . . .282

276
Chapter 16 Scale
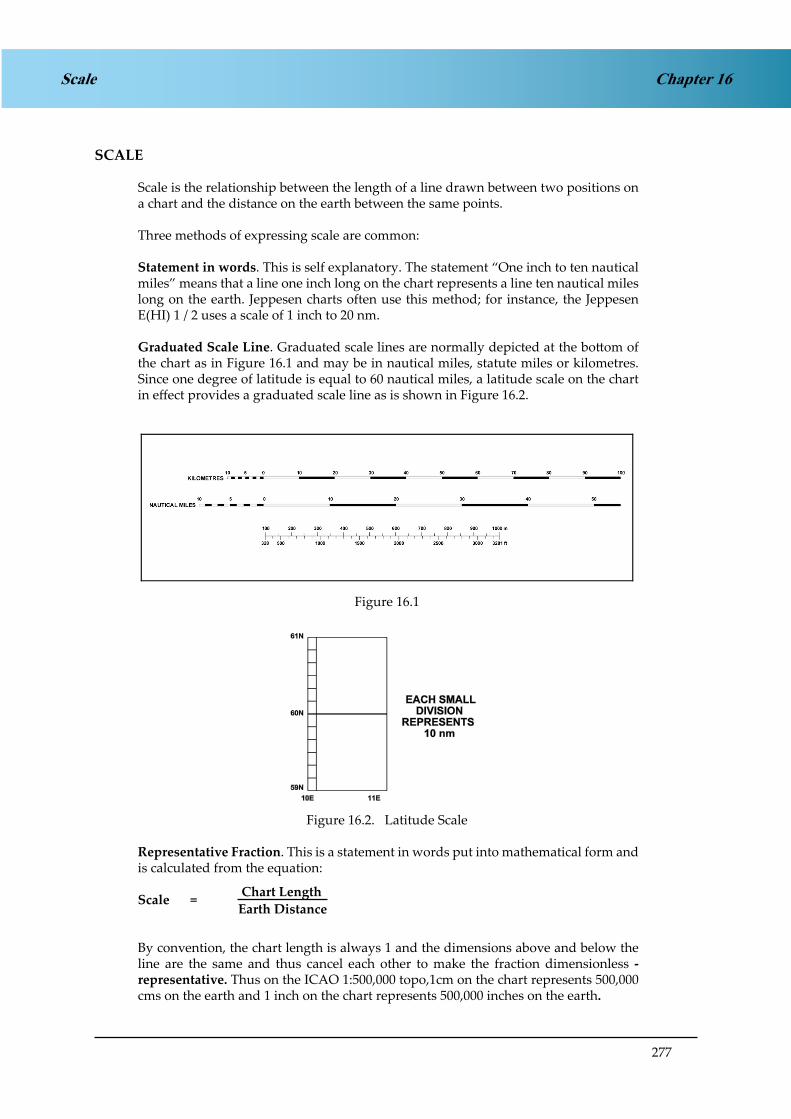
277
Chapter 16Scale
SCALE
Scale is the relationship between the length of a line drawn between two positions on a chart and the distance on the earth between the same points.
Three methods of expressing scale are common:
Statement in words. This is self explanatory. The statement “One inch to ten nautical miles” means that a line one inch long on the chart represents a line ten nautical miles long on the earth. Jeppesen charts often use this method; for instance, the Jeppesen E(HI) 1 / 2 uses a scale of 1 inch to 20 nm.
Graduated Scale Line. Graduated scale lines are normally depicted at the bottom of the chart as in Figure 16.1 and may be in nautical miles, statute miles or kilometres. Since one degree of latitude is equal to 60 nautical miles, a latitude scale on the chart in effect provides a graduated scale line as is shown in Figure 16.2.
Figure 16.1Figure 16.1
Figure 16.2. Latitude ScaleFigure 16.2. Latitude Scale
Representative Fraction. This is a statement in words put into mathematical form and is calculated from the equation:
Scale = Chart Length
Earth Distance
By convention, the chart length is always 1 and the dimensions above and below the line are the same and thus cancel each other to make the fraction dimensionless - representative. Thus on the ICAO 1:500,000 topo,1cm on the chart represents 500,000 cms on the earth and 1 inch on the chart represents 500,000 inches on the earth.
278
Chapter 16 Scale
CONVERTING FROM A STATEMENT IN WORDS TO A REPRESENTATIVE FRACTION
When converting from a statement in words to a Representative Fraction, you must ensure that you use the same units for both the numerator and the denominator. For instance, if converting ‘One inch to ten nautical miles’ into a representative fraction, substitution into the above equation gives:
Representative Fraction = 1 inch 10 nautical miles
Multiply by 6080 to get the denominator into feet:-
Representative Fraction = 1 inch 10 x 6080 feet
And then by 12 to get it into inches:-
Representative Fraction = 1 inch 10 x 6080 x 12 inches
Now both numerator and denominator are in the correct units, i.e.:
Representative Fraction = 1 729600
so the RF becomes dimensionless - it will work with centimetres or any other units as long as the ratios remain the same.
REMINDER ABOUT CONVERSION FACTORS
You will find the following conversion factors useful in dealing with typical scale problems:
1 nautical mile = 6080 feet or 1852 metres1 metre = 3.28 feet1 inch = 2.54 cm5.4 nm = 10 kilometres
Example 1On a particular chart, 5 cm represents 7 nautical miles. What is the scale?
Answer:
Representative Fraction = Chart length
Earth Distance
= 5 cm 7 (nautical miles) x 1852 x 100
(We multiply 7 by 1852 to convert to metres, then by 100 to convert to centimetres)
= 5
1,296,400
279
Chapter 16Scale
However, we always express Representative Fractions with ‘1’ as the numerator. We need to divide both numerator and denominator by 5.
Representative Fraction = 1 259,280
EASY CALCULATOR OPERATION
The easiest way to enter all this on to your calculator in one stage is to evaluate the denominator first then divide by the numerator, ie, in the above example, as follows:
7 x 1852 x 100 ÷ 5 = 259280
The answer comes out as the denominator. You then have to write it down as 1 259280
If you enter numerator first, you get the RF expressed as a decimal, like this:
5 ÷ (7 x 1852 x 100) = 0.000003856
If you then want to use your x -1 key, fine. But it’s quicker to do it the first way.
TYPES OF SCALE QUESTION
There are 2 basic sub-divisions of scale problems: Simple Scale and Mercator Scale. Mercator Scale problems are dealt with in a later chapter. All simple scale problems are dealt with by substituting into the one basic equation:
RF = CL ED
Sometimes you are given the Chart Length and the Earth Distance and asked to find the RF, as in the previous example. Sometimes you are given the scale (the RF) and the ED and asked to find the CL. Sometimes you are given the RF and the CL and asked to find the ED. Just substitute what you know into the above equation, apply any conversion factors necessary to get both CL and ED in the same units, rearrange if necessary to make the unknown the subject of the equation, and solve using your calculator.
Example 2On a chart of scale 1/5,000,000, how many nautical miles on the Earth are represented by 1.7 cm?
RF = CL ED
1 = 1.7 cm
5,000,000 ED
Re-arranging:-
ED = 1.7 x 5,000,000 = 45.89 nm 1852 x 100

280
Chapter 16 Scale
ROUNDING ERRORS
The conversion factors we have quoted are, in many cases, only approximate. There is often more than one way to carry out the conversions, and sometimes a scale numerical problem may be solved by converting both numerator and denominator into metric units or alternatively, both to Imperial units. This may give small differences in the answers. Look at the 4 options given in the question and choose the nearest.
LARGE AND SMALL SCALE
Confusion often exists as to whether a chart is ‘large scale’ or ‘small scale’.
A UK Ordnance Survey Map is an example of a large scale chart. The UK Landranger series of maps used to be known as “1 inch to a mile”, or a “50 thou” map. These maps have a scale of 1:50,000.
Two centimetres on this chart represents one kilometre on the Earth. The chart does not cover much area, but there is lots of detail. This is a LARGE scale chart.
A world atlas would be an example of a small scale chart - it covers a lot of area, but there is not much detail.
LARGE SCALE - LOTS OF DETAIL
SMALL SCALE - LOTS OF AREA
However, the Representative Fraction is in the right sense. A SMALL scale gives a SMALLER RF. A LARGE scale gives a LARGER RF. Consider 2 charts, one a 1/50,000 UK Ordnance Survey and the other a 1/5,000,000 small-scale chart.
Scale
Large 1/50,000 0.00002
Small 1/5,000,000 0.0000002
You can see that 0.00002 is a LARGER number than 0.0000002. The Representative Fractions are in the right sense. The confusion occurs because the denominators are easier to handle and so that is how we usually refer to charts. We call the first chart a “fifty thousand” in conversation. We call the second one a “five million”. We do not refer to them as a “0.00002” or a “0.0000002”. But the logic of ‘large’ or ‘small’ is correct.
So:-
LARGE SCALE - SMALLER DENOMINATOR
SMALL SCALE - LARGER DENOMINATOR

281
Chapter 16Scale
QUESTIONS
1. Give the Scale, as a representative fraction, of the following charts:-
a. One Centimetre represents Five Kilometresb. One Centimetre represents 5.4 Nautical Miles c. One Inch represents 15.4 Kilometresd. 3.5 Inches represents 70 Kilometrese. Five Inches represents Eight Nautical Miles
2. The Representative Fraction of a chart is given as 1: 500,000 (Half Mil Chart)
a. How many (1) Centimetres and (2) Inches would represent 30 Kilometres on the Ground?
b. How many (1) Inches and (2) Centimetres would represent 30 Nautical Miles on the ground?
3. The Representative Fraction of a chart is given as 1: 1000,000
a. What is the Chart length of a line representing an earth distance of 50 Kilometres on this chart? Give your answer in both Centimetres and Inches
b. Is this scale larger or smaller than the one used in question two above?
4. On a chart 5 Centimetres represents 7 Nautical Miles
a. Give the Scale of this chart as a Representative Fractionb. Determine the distance in Inches on this chart which would represent the distance
flown by an aircraft in 5 minutes at a Groundspeed of 156 Knots.
5. On a chart 14.8 Centimetres represents 20 Nautical Miles on the ground
a. Give the Chart Scale as a Representative Fractionb. Determine the length in Inches on this chart which would represent the distance flown
by an aircraft in 9 minutes at a Groundspeed of 185 Knots.
6. On a chart, One Centimetre represents 3.5 Kilometres
a. Give the Scale as a Representative Fractionb. What is the length in Inches on the chart which would represent the distance flown in
4 minutes at a Groundspeed of 204 kilometres per hour?

282
ScaleChapter 16
ANSWERS
1. a. 1:500,000 b. 1:1,000,000 c. 1:600,000 (approx) d. 1:788,000 e. 1:116740
2. a. (1) 6 Centimetres (2) 2.36 Inches b. (1) 4.38 Inches (2) 11.12 Centimetres
3. a. 5 cm = 1.97 in b. Smaller
4. a. 1:260,000 b. 3.65 inches
5. a. 1:250,000 b. 8.1 inches
6. a. 1:350,000 b. 1.53 inches

283
Chapter 17General Chart Properties
CHAPTER SEVENTEEN
GENERAL CHART PROPERTIES
Contents
CHART PROJECTIONS - GENERAL . . . . . . . . . . . . . . . . . . . . . . . . . . . .285
TYPES OF PROJECTION . . . . . . . . . . . . . . . . . . . . . . . . . . . . . . . . . . .285
AZIMUTHAL/PLANE PROJECTIONS . . . . . . . . . . . . . . . . . . . . . . . . . . .285
CYLINDRICAL PROJECTIONS . . . . . . . . . . . . . . . . . . . . . . . . . . . . . . .287
CONICAL PROJECTIONS . . . . . . . . . . . . . . . . . . . . . . . . . . . . . . . . . .288
PROPERTIES OF AN IDEAL CHART . . . . . . . . . . . . . . . . . . . . . . . . . . . .290
REPRESENTATION OF THE EARTH’S SURFACE . . . . . . . . . . . . . . . . . . . .290
NAVIGATION REQUIREMENTS . . . . . . . . . . . . . . . . . . . . . . . . . . . . . .290
ORTHOMORPHISM / CONFORMALITY . . . . . . . . . . . . . . . . . . . . . . . . .290

284
Chapter 17 General Chart Properties

285
Chapter 17General Chart Properties
CHART PROJECTIONS - GENERAL
The transfer of information from a globe on to a flat paper chart is achieved by ‘projection’, because, originally, the technique involved using a light source within the globe to project the latitude/longitude graticule on to a flat sheet of paper. Today, the projection is achieved mostly by using computer models. However, an understanding of the original projection techniques using light is more than adequate for understanding the properties of charts, whatever actual method of production is used.
“Perspective” and “Non-Perspective” Charts
Charts produced directly from a projection are called perspective or geometric projections. Charts produced by mathematical methods are called non-perspective charts. Most of the charts we use are in this latter, non-perspective category but they can be thought of as perspective projections which have been modified mathematically.
The “Reduced Earth”
The term “reduced earth” (RE), means the scale model of the earth on which the projection of the chart is based. To make a 1:1,000,000 chart, a one millionth scale model of the earth will be used.
TYPES OF PROJECTION
There are 3 general types of projection surfaces:
Azimuthal/Plane Cylindrical Conical
AZIMUTHAL/PLANE PROJECTIONS
An azimuthal (or ‘plane’) projection is produced by placing a flat sheet of paper against a point on the earth. A common use is to provide charts of the North/South polar regions (this is the only example taught and examined in the JAA syllabus). The resulting ‘Polar Stereographic’ charts are covered in more detail in a later chapter.
The principle of the projection is illustrated in Figure 17.1

286
Chapter 17 General Chart Properties
Figure 17.1 - Azimuthal ProjectionFigure 17.1 Azimuthal Projection
The graticule of the projection would appear as in Figure 17.2.
Figure 17.2 - Azimuthal GraticuleFigure 17.2 Azimuthal Graticule
Note: Although this projection has produced a chart of the entire southern hemisphere, the chart would only be used in the central area, in this case for flights over Antarctica.

287
Chapter 17General Chart Properties
CYLINDRICAL PROJECTIONS
The earliest chart projections were produced in the 16th century by a Flemish navigator called Gerhard Kremer who used the Latin alias ‘Mercator’. His projections used cylinders of paper wrapped around the “reduced earth” and touching the RE at the Equator. The projection technique is illustrated in Figure 17.3.
Figure 17.3 - Simple Cylindrical Projection and GraticuleFigure 17.3 Simple Cylindrical Projection and Graticule
When the graticule has been projected onto the cylinder, the cylinder is opened to produce at flat sheet of paper. Cartographers then can add the geographic detail.
Note that the shapes look a little strange. This is explained in chapter 18 (Mercator Charts).
Again, notice that most of the world (except the Poles) has been projected and the user would only use a section of the chart (in this case, normally near the Equator).
Other charts that use cylindrical projections are the Transverse Mercator and the ObliqueMercator. These also are explained in a later chapter.

288
Chapter 17 General Chart Properties
CONICAL PROJECTIONS
Conical projections involve placing a cone of paper over the Reduced Earth and projecting the graticule onto the cone. Subsequently the cone is slit along one side and the cone can then be opened to produce a flat sheet of paper. The technique is illustrated in Figure 17.4.
Figure 17.4 a and b - Conical Projections
Figure 17.4 a and b Conical Projections

289
Chapter 17General Chart Properties
Figure 17.4 cFigure 17.4 c
In Figure 17.4(a), the cone is placed over the earth. The graticule is projected onto the cone. The cone is then slit in Figure 17.4(b) (along the Greenwich meridian in this case). The cone is then ‘developed’ (opened) to give the flat sheet of paper and graticule illustrated in Figure 17.4(c). In this case, the chart will show the whole Northern Hemisphere. The user will need only a small section of the chart, for example the rectangle suggested. In this section of the chart, the graticule will look more familiar (similar to the ICAO 1:500,000 topographical chart) and this is illustrated in Figure 17.5.
Figure 17.5 Typical Conical GraticuleFigure 17.5 Typical Conical Graticule
The conical graticule in Figure 17.5 is typical of the Lamberts Conical Chart which is discussed in Chapter 16.
Note: All the projections discussed so far are ‘conical’ in a mathematical sense. An azimuthal projection uses a cone whose apex angle is 180°. A cylinder is a cone whose apex angle is 0°. Later in the course, you may notice similarities in the properties of azimuthal and cylindrical charts with those of conical charts.

290
Chapter 17 General Chart Properties
PROPERTIES OF AN IDEAL CHART
Having developed methods of projecting the spherical Earth onto a flat sheet of paper, we should now consider what properties we require of the chart. The following is a list of properties we might like on an ‘ideal’ (perfect) chart. (The list is not comprehensive).
REPRESENTATION OF THE EARTH’S SURFACE
Angles on the Earth’s surface should be represented by the same angles on the chart.Scale should be constant and ‘correct’. Areas should be represented with their true shape on the chart. Equal areas on the Earth’s surface should be shown as equal areas on the chart.
NAVIGATION REQUIREMENTS
Rhumb Lines should be straight lines. Great Circles should be straight lines. Latitudes/Longitudes should be easy to plot Adjacent sheets should fit correctly. Coverage should be worldwide.
Two of these properties can never be obtained, except on the globe.
Scale can never be constant and correct. We can modify charts mathematically to give nearly constant scale in small areas, but not over large areas.
The shapes of large areas cannot be represented perfectly. However, it is possible to represent the shapes of small areas reasonably accurately.
All the other ideal properties can be obtained on charts, but unfortunately not together on the same chart. However, not all of them are essential for navigation. For instance, it really doesn’t matter to a pilot whether areas are correctly represented or not. You don’t make comparisons of area when flying. Even a reasonable amount of distortion of shape is acceptable, provided it is not too great and landmarks can be recognised.
ORTHOMORPHISM / CONFORMALITY
Of all the ideal properties, the only essential one is that navigation bearings must be “correct” and the critical property is that angles on the Earth must be represented correctly on the chart.
This property is critical to aviation - or indeed for navigation generally. If you draw a line joining 2 points on the chart and measure the angle but then find that this does not correspond to the true direction on the Earth, the chart is useless for navigation. You might previously have thought that if you measure a track off any map, it will correspond to Earth direction but this is not true for most charts. Those charts that do have this property are in the minority and are known as orthomorphic or conformal charts.
Note: Your ICAO 1:500,000 Topographical chart is called a “Lamberts Conformal Conic” - just above the graduated scale

291
Chapter 17General Chart Properties
Remember that people produce charts for many reasons - not just navigation. For example, if your field of expertise is farming, then you might be interested in whether 1000 hectares of land in Kansas produces a greater or a lesser tonnage of wheat than 1000 hectares of land in Azerbaijan. In that case, the property you would look for in a map would be an accurate representation of area - but it would not matter to you whether bearings were represented accurately.
Therefore, from the vast range of projections available, we have to select only those which are orthomorphic (or conformal).
There are two fundamental conditions which must be met to achieve orthomorphism/ conformality.
Condition 1 The meridians and parallels on the chart must intersect at right angles(as they do on the Earth). This is illustrated in Figure 17.6.
Figure 17.6 - Orthomorphism 1Figure 17.6 Orthomorphism 1
Consider a rectangle on the Earth’s surface as depicted in Figure 17.6a. Also, consider the bearing of position X from position 0, which is 056°. In Figure 17.6b, the chart graticule has been distorted and the meridian/parallel intersection is not 90°. Not only is the shape incorrect but the bearing from 0 to X is now 028° rather than 056°. The chart is not conformal.
Look at the graticules so far discussed. They all meet the 90° intersect rule. Later in the course we will study the Transverse and the Oblique Mercator which have unusual graticules. Figure 17.7 illustrates the general form of an Oblique Mercator graticule. Note the relationship between parallels and meridians. The chart is conformal.

292
Chapter 17 General Chart Properties
Figure 17.7 - Graticule of Oblique MercatorFigure 17.7 Graticule of Oblique Mercator
Condition 2 The second condition relates to the scale at a point on the chart and is illustrated in Figure 17.8.
Figure 17.8 - Scale at a Point
Figure 17.8 Scale at a Point
A square on the earth has been illustrated in Figure 17.8(a) along with the line 0Y which has a bearing of 045°(T). In Figure 17.8(b) representing the chart, the N-S scale has changed but the E-W scale has remained the same. The overall effect is that the shape has changed to a rectangle and the bearing 0Y is now 035°(T) rather than the correct 045°(T) on the Earth. The chart is not orthomorphic/conformal.
On an orthomorphic chart, scale at a point should be the same in all directions.
The above diagram implies that a chart should be constant scale which we know is only true on a globe. On a chart, scale will change. The condition 2 is modified to be:

293
Chapter 17General Chart Properties
At any point on a chart, scale should be the same in all directions, or should change at the same rate in all directions.
Refer back to Figure 17.3. The shapes on the simple cylindrical projection have been distorted, in this case stretched in a N-S direction because the N-S scale is changing at a greater rate that the E-W scale. Mercator, the Flemish navigator, recognised this problem and mathematically adjusted the N-S scale change to produce the conformal Mercator chart which is the subject of the next chapter.

294
Chapter 17 General Chart Properties

295
Chapter 18Mercator Charts - Properties
CHAPTER EIGHTEEN
MERCATOR CHARTS - PROPERTIES
Contents
INTRODUCTION . . . . . . . . . . . . . . . . . . . . . . . . . . . . . . . . . . . . . . .297
MERCATOR’S PROJECTION - GENERAL . . . . . . . . . . . . . . . . . . . . . . . . .297
SCALE . . . . . . . . . . . . . . . . . . . . . . . . . . . . . . . . . . . . . . . . . . . . . .299
ORTHOMORPHISM. . . . . . . . . . . . . . . . . . . . . . . . . . . . . . . . . . . . . .301
GRATICULE . . . . . . . . . . . . . . . . . . . . . . . . . . . . . . . . . . . . . . . . . .301
SHAPES . . . . . . . . . . . . . . . . . . . . . . . . . . . . . . . . . . . . . . . . . . . . .301
CHART CONVERGENCE . . . . . . . . . . . . . . . . . . . . . . . . . . . . . . . . . .303
RHUMB LINES . . . . . . . . . . . . . . . . . . . . . . . . . . . . . . . . . . . . . . . . .303
GREAT CIRCLES. . . . . . . . . . . . . . . . . . . . . . . . . . . . . . . . . . . . . . . .303
SUMMARY OF MERCATOR PROPERTIES. . . . . . . . . . . . . . . . . . . . . . . . .307
QUESTIONS . . . . . . . . . . . . . . . . . . . . . . . . . . . . . . . . . . . . . . . . . .308
ANSWERS . . . . . . . . . . . . . . . . . . . . . . . . . . . . . . . . . . . . . . . . . . .310

296
Chapter 18 Mercator Charts - Properties

297
Chapter 18Mercator Charts - Properties
INTRODUCTION
The earliest method of transferring the graticule of meridians and parallels from a globe to a flat sheet of paper was achieved using cylindrical projections, described in the previous chapter. A scale model of the earth, the Reduced Earth (RE), was made at an appropriate scale. A cylinder of paper was wrapped around the RE, touching the RE at the Equator. Using a light source at the centre of the RE, the graticule was projected onto the cylinder. The cylinder was then ‘developed’ or opened up to a flat sheet of paper.
The technique described above would produce a perspective projection. This simple cylindrical projection technique is illustrated below.
Figure 17.3 - Simple Cylindrical Projection and GraticuleFig 18.1 Simple Cylindrical Projection
The projected graticule had one significant advantage for early navigators - the meridians were equally spaced parallel lines. Thus a straight line drawn on the chart would have a constant direction - the straight line on the chart would be a rhumb line. With their basic compass systems, early navigators preferred to sail constant directions and had to accept the fact that they would be sailing a rhumb line. Modern navigators use more advanced guidance systems and normally aim to fly the Great Circle track (more of this later).
MERCATOR’S PROJECTION - GENERAL
In the 16th century, a Flemish navigator called Gerhard Kremer, who used the Latin alias ‘Mercator’, recognised the limitations of the simple cylindrical projection. The projected graticule met one of the requirements for an orthomorphic/conformal chart - the meridians and parallels crossed at right angles. Therefore, a straight line was a line of constant direction - a Rhumb line. Unfortunately, it was not the correct direction. The shapes were clearly not correct and therefore angles on the chart were not correct.
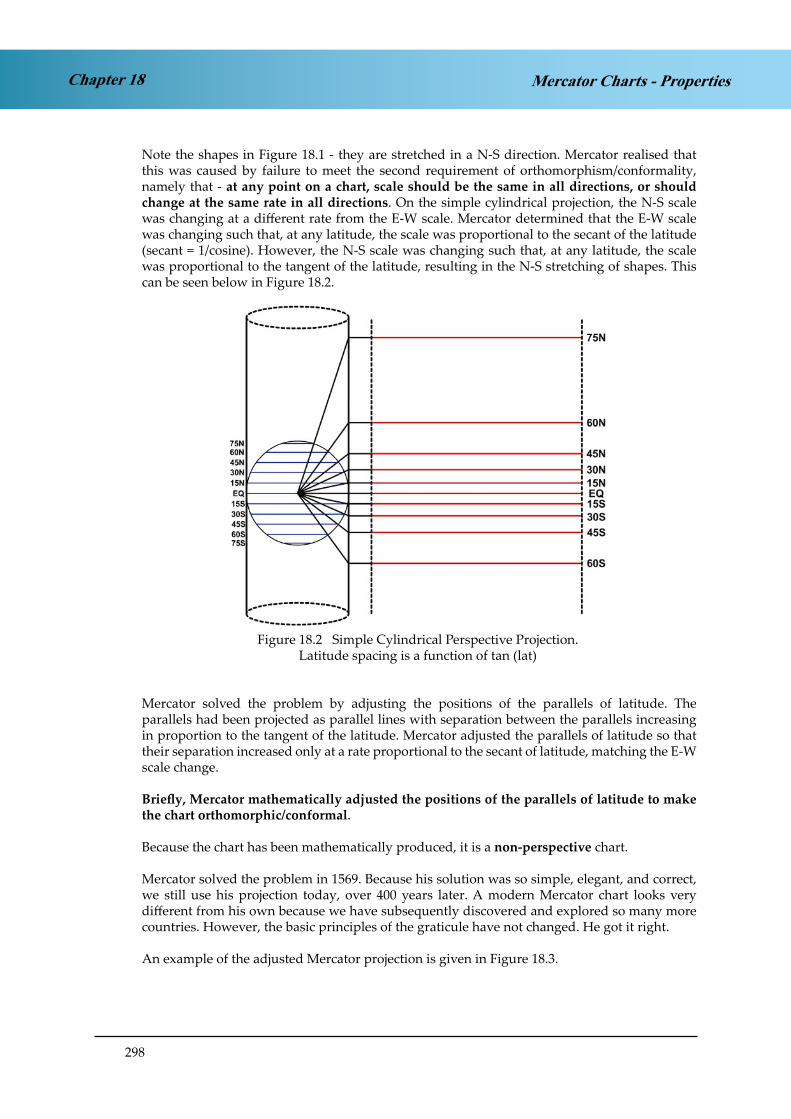
298
Chapter 18 Mercator Charts - Properties
Note the shapes in Figure 18.1 - they are stretched in a N-S direction. Mercator realised that this was caused by failure to meet the second requirement of orthomorphism/conformality, namely that - at any point on a chart, scale should be the same in all directions, or should change at the same rate in all directions. On the simple cylindrical projection, the N-S scale was changing at a different rate from the E-W scale. Mercator determined that the E-W scale was changing such that, at any latitude, the scale was proportional to the secant of the latitude (secant = 1/cosine). However, the N-S scale was changing such that, at any latitude, the scale was proportional to the tangent of the latitude, resulting in the N-S stretching of shapes. This can be seen below in Figure 18.2.
Figure 18.2 Simple Cylindrical Perspective Projection.Latitude spacing is a function of tan (lat)
Figure 18.2 Simple Cylindrical Perspective Projection.Latitude spacing is a function of tan (lat)
Mercator solved the problem by adjusting the positions of the parallels of latitude. The parallels had been projected as parallel lines with separation between the parallels increasing in proportion to the tangent of the latitude. Mercator adjusted the parallels of latitude so that their separation increased only at a rate proportional to the secant of latitude, matching the E-W scale change.
Briefly, Mercator mathematically adjusted the positions of the parallels of latitude to make the chart orthomorphic/conformal.
Because the chart has been mathematically produced, it is a non-perspective chart.
Mercator solved the problem in 1569. Because his solution was so simple, elegant, and correct, we still use his projection today, over 400 years later. A modern Mercator chart looks very different from his own because we have subsequently discovered and explored so many more countries. However, the basic principles of the graticule have not changed. He got it right.
An example of the adjusted Mercator projection is given in Figure 18.3.

299
Chapter 18Mercator Charts - Properties
Figure 18.3 Mercator ProjectionFigure 18.3 Mercator Projection
This Mercator projection is often called a normal or direct Mercator. The projection surface touches the Reduced Earth at the Equator. The geographic poles cannot be projected (they are on the axis of the cylinder). Later in the syllabus we will examine other types of cylindrical projections which can project the poles, the Transverse and Oblique Mercators.
SCALE
Mercator scale expands as the secant of the latitude.
This arises out of the departure formula. You will remember that:
Departure = change of longitude (min) × cos latitude
Mercator realised that, by the use of a cylindrical projection, the meridians were produced as parallel lines. This meant that a change of longitude on the chart was always represented by the same distance on the chart (so many centimetres), whatever the latitude. Therefore, we are holding the change of longitude (the Chart Length) constant and we need to see how the departure (the Earth Distance) changes with latitude. This tells us how the scale changes with latitude. We therefore re-arrange the formula as follows;
change of longitude = Departure
cos latitude
300
Chapter 18 Mercator Charts - Properties
However, in mathematics there is a trigonometrical function called the secant. Its definition is that:
secant θ = 1 cosine θ
Therefore we can re-write the above equation as:
change of longitude = Departure x secant latitude
As the E/W scale has to change as a function of the secant of the latitude (because the meridians are parallel at all latitudes), then, as Mercator realised, the N/S scale has to change by the same amount.
We therefore come up with the following equation:
scale at any latitude (λ ) = scale at Equator x sec (λ )
Let’s see how this works with a practical example. Take a case where the scale at the Equator is 1/1,000,000. Now let’s calculate what the scale on a Mercator chart will be at 8° N (or S) latitude.
scale at 8° N = scale at Equator x sec 8°N
= 1 x 1 1,000,000 Cos 8°
There is no point in evaluating secant as a numerator. In multiplying out Representative Fractions, we want ‘1’ on the top line. We are better off writing secant as 1/cos, because then we shall be multiplying denominators.
So:-
scale at 8° N = 1 x 1 1,000,000 0.990268
= 1 990,268
This shows that the scale at 8°N (or S) latitude is 99% of the scale at the Equator, or within 1% of correct scale.
This 1% figure is of importance in navigation. Up to a scale error of 1%, we can regard a chart as being of “constant scale”, which means that you can measure distances using a ruler. Once the scale error increases to more than 1%, we must find distances either by calculation or by using the local latitude scale and measuring small distances at a time with a pair of dividers.
The most important figures to remember are that Mercator scale is:
Within 1% up to 8° from the Equator.
Within ½% up to 6° from the Equator.
301
Chapter 18Mercator Charts - Properties
In examination questions, 8° is often approximated to 500 nautical miles. 6° can be approximated to 350 nautical miles. If you see those numbers in questions, it is often a clue that the examiner is using them to mean 8° or 6°, and is referring to the 1% or ½ % scale error bands.
To summarise:
Mercator scale is correct (same as the Reduced Earth) at the Equator.
Mercator scale expands as the secant of the latitude.
Mercator scale is within 1% up to 8° from the Equator.
Mercator scale is within ½% up to 6° from the Equator.
ORTHOMORPHISM
All charts used for navigation must be orthormorphic. This chart is orthomorphic/conformal by mathematical construction (Mercator’s adjustment of the parallels of latitude). The projection is non-perspective.
GRATICULE
The graticule is rectangular. Meridians are equally spaced parallel lines. Parallels of latitude are parallel lines with the space between them increasing as the secant of the latitude.
SHAPES
Mercator produced an orthomorphic projection. However, looking again at Figure 18.3, (or Figure 18.4) the student should notice that the areas are not correctly represented. Correct representation of area is not required on an orthomorphic chart.
Thus, Greenland appears as large as Africa on the chart, despite the fact that the land area of Africa is approximately 18 times that of Greenland. In reality, the land area of Greenland is only the same as the small NE corner of Africa, as illustrated in Figure 18.3. Similarly, the land area of Scandinavia illustrated is only one third of the land area of India, but on the chart they appear to have similar areas. Note also the chart length equivalent to 3000 nm at 60N, which is twice the chart length for the same distance at the Equator.
This distortion of area and change of scale also leads to change of shape. Land masses at high latitudes appear too wide too wide for their height compared with the same land masses on a globe or on a chart with convergent meridians. Compare the shape of the North American continent, for instance, on a Mercator with its shape on a globe (Figures 18.5b and 18.5a). The continent appears too wide. The E/W distance from Labrador to Western Alaska seems too great compared with the distance from Northern Alaska to the Gulf of Mexico.
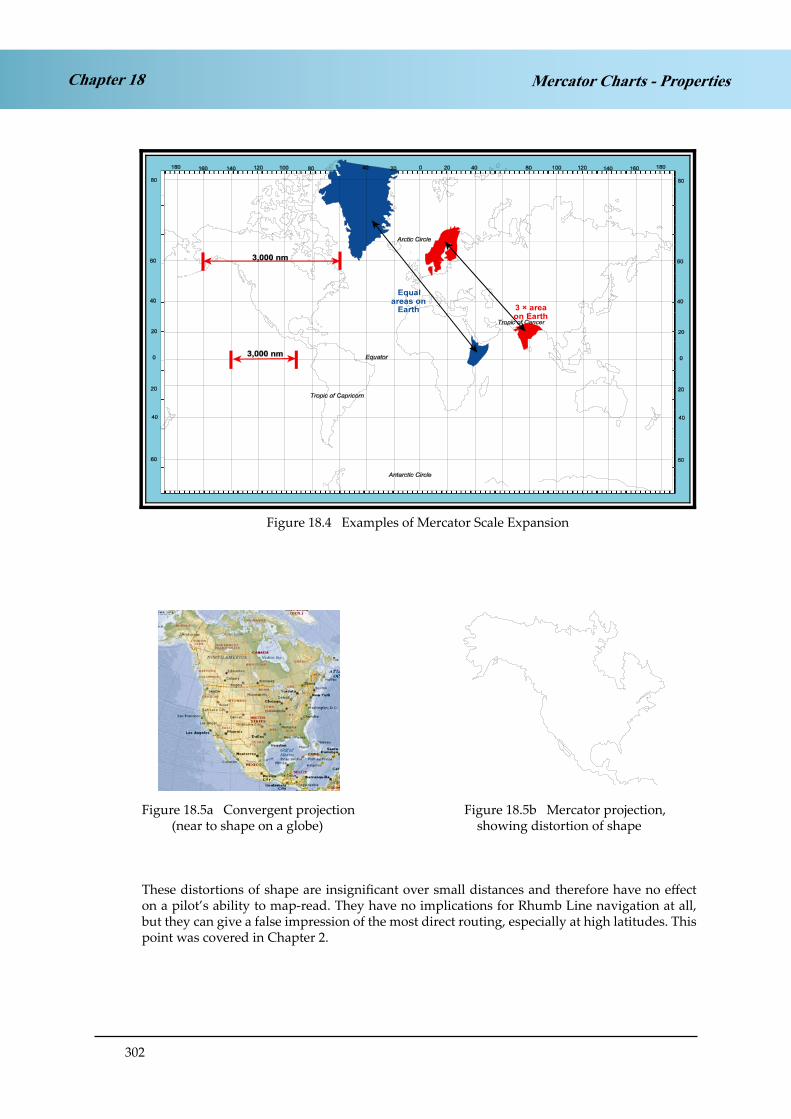
302
Chapter 18 Mercator Charts - Properties
Figure 18.4 Examples of Mercator Scale ExpansionFigure 18.4 Examples of Mercator Scale Expansion
Figure 18.5a Convergent projection Figure 18.5b Mercator projection, (near to shape on a globe) showing distortion of shape
These distortions of shape are insignificant over small distances and therefore have no effect on a pilot’s ability to map-read. They have no implications for Rhumb Line navigation at all, but they can give a false impression of the most direct routing, especially at high latitudes. This point was covered in Chapter 2.
Figure 18.5a Convergentprojection (near to shape
on a globe)
Figure 18.5bMercator projection, showing
distortion of shape
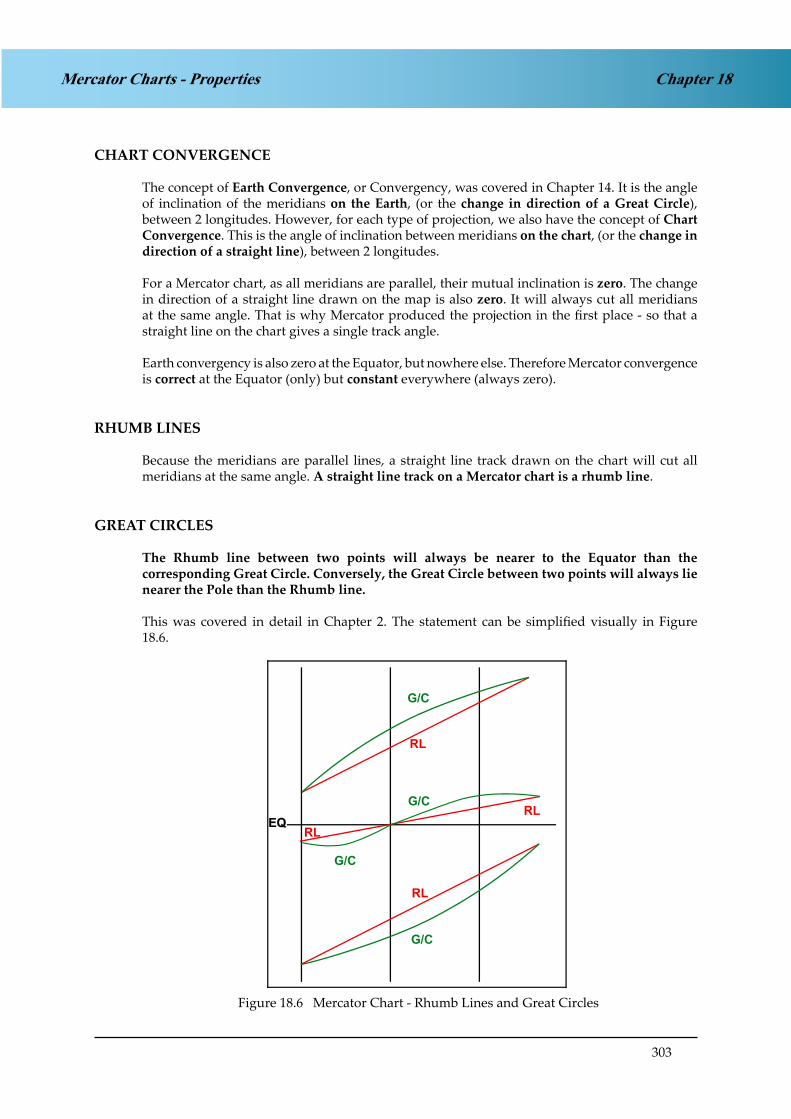
303
Chapter 18Mercator Charts - Properties
CHART CONVERGENCE
The concept of Earth Convergence, or Convergency, was covered in Chapter 14. It is the angle of inclination of the meridians on the Earth, (or the change in direction of a Great Circle), between 2 longitudes. However, for each type of projection, we also have the concept of Chart Convergence. This is the angle of inclination between meridians on the chart, (or the change in direction of a straight line), between 2 longitudes.
For a Mercator chart, as all meridians are parallel, their mutual inclination is zero. The change in direction of a straight line drawn on the map is also zero. It will always cut all meridians at the same angle. That is why Mercator produced the projection in the first place - so that a straight line on the chart gives a single track angle.
Earth convergency is also zero at the Equator, but nowhere else. Therefore Mercator convergence is correct at the Equator (only) but constant everywhere (always zero).
RHUMB LINES
Because the meridians are parallel lines, a straight line track drawn on the chart will cut all meridians at the same angle. A straight line track on a Mercator chart is a rhumb line.
GREAT CIRCLES
The Rhumb line between two points will always be nearer to the Equator than the corresponding Great Circle. Conversely, the Great Circle between two points will always lie nearer the Pole than the Rhumb line.
This was covered in detail in Chapter 2. The statement can be simplified visually in Figure 18.6.
Figure 18.6 Mercator Chart - Rhumb Lines andGreat Circles
Figure 18.6 Mercator Chart - Rhumb Lines and Great Circles

304
Chapter 18 Mercator Charts - Properties
Apply these rules to the Mercator chart at Figure 18.7. Consider a round-the-world trip from London to Los Angeles, USA to Auckland, New Zealand to Singapore and returning to London. The route is drawn on a Mercator chart in Figure 18.7(a).
Figure 18.7a London/LA/Auckland/Singapore/London - Rhumb LinesFigure 18.7a London/LA/Auckland/Singapore/London - Rhumb Lines
All the tracks drawn are rhumb line tracks. From London to LA, the rhumb line track is approximately 257°(T). From LA to Auckland, the rhumb line track is approximately 221°(T). From Auckland to London, the rhumb line track is approximately 301°(T). Note that the Auckland/London rhumb line track passes through Singapore.
Now draw in the Great Circle tracks for the same route.

305
Chapter 18Mercator Charts - Properties
Figure 18.7b London, LA, Auckland, London - Great Circles
Figure 18.7b London, LA, Auckland, London - Great Circles
Note the shapes of the Great Circles. The Equator and the meridians (which are great circles) project as straight lines. All other great circles project as curved lines concave to the Equator (convex to the nearer Pole).
Mathematical CalculationsIn the above discussion, the rules about the shapes of great circles have been stated. Given the rhumb line direction, the student also should be able to calculate the direction of the great circle. The angle between the great circle and the rhumb line is conversion angle (CA) where:
Conversion Angle (CA) = ½ Earth Convergency (EC) or Conversion Angle (CA) = ½ x ch long x sin (Mean Lat)
Now review Figure 18.7b and consider the route from London to Los Angeles.
As stated previously, the rhumb line direction (a straight line on a Mercator chart) is approximately 257°(T). The angle between the rhumb line and the great circle is conversion angle (CA). In this case:
Conversion angle = ½ x ch long x sin (mean lat)
Using approximate values
CA = ½ x 120 x sin 45°
= 60 x .707 = approx 42°
306
Chapter 18 Mercator Charts - Properties
Therefore the Great Circle track from London to LA, measured at London, is approximately257° + 42° = 299°(T)
Now calculate (using equivalent values) the great circle track direction from LA to London, measured at LA.
Answer: approximately 035°(T)
R/L track is 077°(T) - reciprocal of 257°(T).
Conversion angle is approx. 42°.
Therefore, great circle track is approx. 035°(T).
Similar exercises could be carried out for all the other sectors. However, a problem would occur on the sectors crossing the Equator. For example, on the Los Angeles to Auckland sector, it could be argued that the conversion angle is zero because the mean latitude is 0° (the Equator). In these situations the sector would have to be divided into two - the first sector from LA to the Equator (mean lat approx 18°) and the second sector from the Equator to Auckland (mean lat approx 18°).
There are 2 exceptions to this rule.
The Equator and meridians are straight lines (because they are also Rhumb Lines).

307
Chapter 18Mercator Charts - Properties
SUMMARY OF MERCATOR PROPERTIES
A summary of Mercator properties is set out in Figure 18.8 below. All of these are asked in examinations and they should be learnt.
PROPETIES OF A MERCATOR CHART
Scale
Correct on the Equator.Elsewhere increases as the secant of the latitude.Within 1% up to 8° from the Equator.Within ½% up to 6° from the Equator.
Orthomorphic Yes. All charts used for navigation must be.
GraticuleMeridians are straight parallel lines, evenly spaced.Parallels are straight parallel lines with the space between them increasing with the secant of the latitude.
Shapes Reasonably correct over small areas.Distortion over large areas, especially at high latitudes.
ChartConvergence
Zero everywhere.Correct at the Equator.Constant across the chart.
Rhumb lines Straight lines Always! Everywhere!
Great CirclesEquator and meridians are straight lines (because they are also Rhumb Lines). All other Great Circles - curves, with a track nearer the Pole (or concave to the Equator).
Figure 18.8 Summary of Mercator Chart Properties
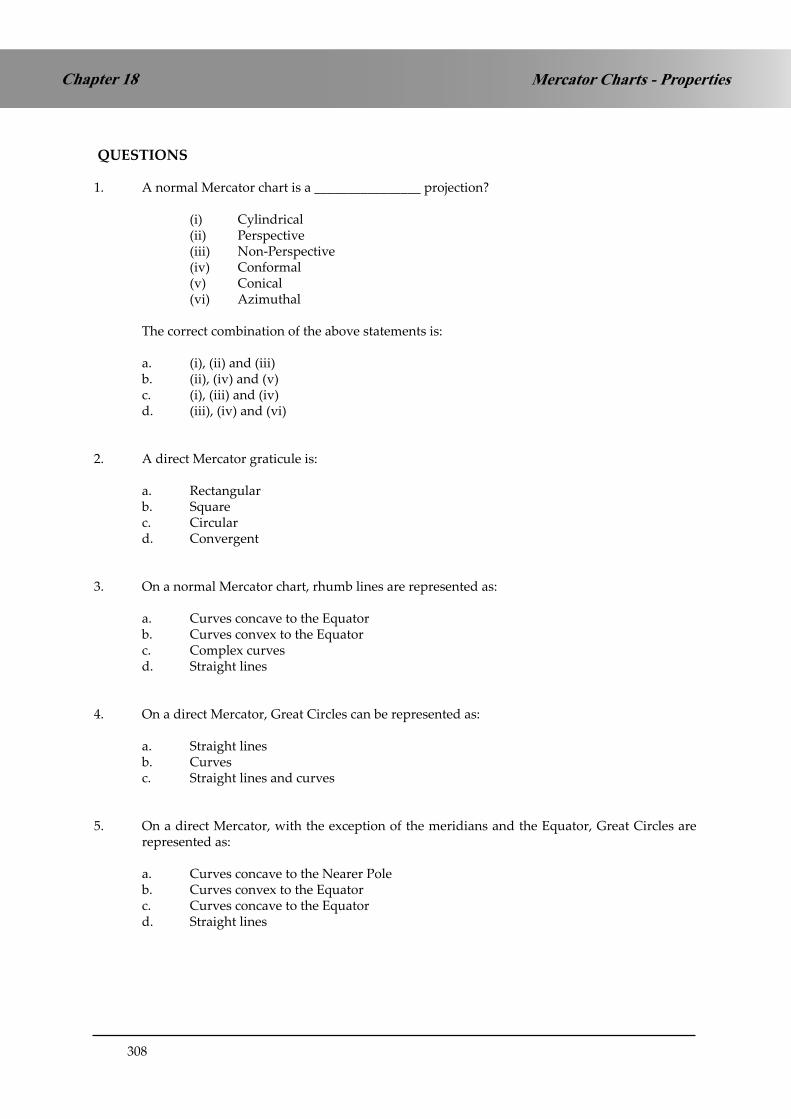
308
Mercator Charts - PropertiesChapter 18
QUESTIONS
1. A normal Mercator chart is a ________________ projection?
(i) Cylindrical (ii) Perspective (iii) Non-Perspective (iv) Conformal (v) Conical (vi) Azimuthal
The correct combination of the above statements is:
a. (i), (ii) and (iii) b. (ii), (iv) and (v) c. (i), (iii) and (iv) d. (iii), (iv) and (vi)
2. A direct Mercator graticule is:
a. Rectangularb. Squarec. Circulard. Convergent
3. On a normal Mercator chart, rhumb lines are represented as:
a. Curves concave to the Equator b. Curves convex to the Equatorc. Complex curvesd. Straight lines
4. On a direct Mercator, Great Circles can be represented as:
a. Straight lines b. Curvesc. Straight lines and curves
5. On a direct Mercator, with the exception of the meridians and the Equator, Great Circles are represented as:
a. Curves concave to the Nearer Pole b. Curves convex to the Equatorc. Curves concave to the Equator d. Straight lines

309
Chapter 18Mercator Charts - Properties
6. The angle between a straight line on a Mercator chart and the corresponding great circle is:
a. Zerob. Earth convergencyc. Conversion Angle d. Chart Convergence
7. If the rhumb line track from Turin (45N 008E) to Khartoum (15N 032E) is 145°(T), what is the direction of the great circle track measured at Turin?
a. 133°(T) b. 139°(T) c. 145°(T) d. 151°(T)
8. In Question 7, what is the direction of the great circle track from Khartoum to Turin?
a. 319°(T) b. 325°(T) c. 331°(T) d. 337°(T)
9. On a Mercator chart, the rhumb line track from Durban (30S 032E) to Perth (30S 116E) is090°(T). What is the great circle track from Perth to Durban?
a. 291°(T)b. 312°(T)c. 228°(T)d. 249°(T)
Note: the examiner may not tell you the rhumb line track if, as in this case, the two points are on the same parallel of latitude
10. At 60S on a Mercator chart, chart convergence is:
a. greater than Earth convergencyb. “correct”c. less than Earth convergency d. equal to ch long x 0.866

310
Mercator Charts - PropertiesChapter 18
ANSWERS
1 C
2 A
3 D
4 C A tricky question! Answers a. and b. are correct. But answer c. is more correct. Great Circles on a Mercator chart can be represented as straight lines but only in the case of the Equator and all meridians. See Question 5.
5 C This is a question involving “concave” and “convex” and the Equator and the Poles.
6 C
7 B This is a convergency/conversion angle problem but often appears as a Mercator problem. A Mercator graticule can be a good way to visualize this problem.
8 C as above
9 D Comments as Q7/8. Notice that the question involves two places at the same latitude - on the same parallel of latitude (30S). The rhumb line track has been given as 090°(T) but an examiner may not necessarily give this information. The examiner may expect the student to recognise that the track between two places on the same parallel of latitude must be East/West 090°(T)/270°(T)
10 C

311
Chapter 19Mercator Charts - Scale
CHAPTER NINETEEN
MERCATOR CHARTS - SCALE
Contents
MERCATOR SCALE - GENERAL PRINCIPLES . . . . . . . . . . . . . . . . . . . . . .313
GIVEN SCALE AT THE EQUATOR, FIND MERCATOR SCALE AT SOME OTHER LATI-TUDE . . . . . . . . . . . . . . . . . . . . . . . . . . . . . . . . . . . . . . . . . . . . . .313
GIVEN MERCATOR SCALE AT SOME LATITUDE, FIND SCALE AT THE EQUATOR 314
GIVEN MERCATOR SCALE AT SOME LATITUDE, FIND MERCATOR SCALE AT SOME OTHER LATITUDE . . . . . . . . . . . . . . . . . . . . . . . . . . . . . . . . . . . . . .315
GIVEN A FIXED CHART DISTANCE BETWEEN MERIDIANS, FIND MERCATOR SCALE AT A SPECIFIC LATITUDE . . . . . . . . . . . . . . . . . . . . . . . . . . . . . . . . . .316
AREA OF “CONSTANT” SCALE . . . . . . . . . . . . . . . . . . . . . . . . . . . . . .318
QUESTIONS . . . . . . . . . . . . . . . . . . . . . . . . . . . . . . . . . . . . . . . . . .319
ANSWERS . . . . . . . . . . . . . . . . . . . . . . . . . . . . . . . . . . . . . . . . . . .321

312
Chapter 19 Mercator Charts - Scale

313
Chapter 19Mercator Charts - Scale
MERCATOR SCALE - GENERAL PRINCIPLES
We covered the general principles of Mercator scale in the previous chapter. A cylindrical projection must produce the meridians as parallel lines. Therefore the scale in the E/W sense at any latitude is defined by the departure equation. The change of longitude (which is a fixed distance on the chart, whatever the latitude) remains constant. By re-arrangement of the equation, we find that this means that the E/W scale depends on the secant of the latitude. Mercator therefore devised a projection in which the N/S spacing of the parallels of latitude is also a function of the secant of the latitude. Now that both the N/S and the E/W scale expansion were at the same rate, the projection became orthomorphic - though non-perspective.
On a Mercator Chart, scale expands away from the Equator. The scale expansion is proportional to the secant of the latitude.
We therefore finish up with the following equation:-
Scale at any latitude (λ ) = Scale at Equator x sec (λ)
This is the starting point for all Mercator scale problems. Questions generally come in one of4 basic types:
Given scale at the Equator, find Mercator scale at some other latitude. Given Mercator scale at some latitude, find scale at the Equator. Given Mercator scale at some latitude, find Mercator scale at some other latitude. Given a fixed chart distance between meridians, find Mercator scale at a specific latitude.
GIVEN SCALE AT THE EQUATOR, FIND MERCATOR SCALE AT SOME OTHER LATITUDE
Example 1
If the scale of a Mercator chart at the Equator is 1:1,000,000, what is the scale at 60N (or S)?
a. 1:2,000,000b. 1:1,000,000c. 1:866,000d. 1:500,000
Whenever solving problems using Representative Fractions (RF) for scale, remember that the scale must be written mathematically in fraction form.
Scale at 60N = Scale at Equator x Secant 60N
= 1 x secant 60° 1,000,000
But it is easier if we write secant as 1/cos. That way, we get 1 as the numerator, which is what we want, and we only have to multiply out the denominators.
Scale at 60N = 1 x 1 1,000,000 cos 60°

314
Chapter 19 Mercator Charts - Scale
= 1 x 1
1,000,000 0.5
= 1
500,000
Answer : 1:500,000 (d)
The trap in this question is that at 60°N/S, the scale on a Mercator chart is double the scale at the Equator. If the scale doubles, the denominator of scale is halved. Remember, if scale expands the denominator decreases, if scale contracts the denominator increases.
GIVEN MERCATOR SCALE AT SOME LATITUDE, FIND SCALE AT THE EQUATOR
Example 2
If the scale of a Mercator chart at 52S is 1:2,000,000, what is the scale at the Equator?
a. 1:3,250,000 b. 1:1,000,000c. 1:866,000d. 1:500,000
Start in the usual way:-
Scale at 52S = Scale at Equator x Secant 52S
Now substitute in what you already know:-
1 = Scale at Equator x 1 2,000,000 cosine 52S
Re-arranging:-
Scale at Equator = cosine 52S 2,000,000
Again, as in some of the basic scale calculations, it is easier to enter this into your calculator denominator first, then divide by the numerator. This gives you the value of the denominator with ‘1’ as the numerator, which is what we want for a Representative fraction.
Key in: 2000000 ÷ cos 52 =
You will then get the answer: 3,248,538
You write it down as 1 3,248,538
The answer is therefore (a).
There are 2 learning points to note from this answer. One is that the options on scale questions are often approximated to the nearest round number. The correct answer to the scale question was 1:3,258,538, but the closest option available is 1:3,250,000. This is not unusual.

315
Chapter 19Mercator Charts - Scale
The other is that you don’t need to do the calculation at all. Scale must expand away from the equator. The denominator must be biggest at the Equator and then reduce as you move away from the Equator. Since you knew that the denominator at 52S was 2,000,000, the denominator at the Equator must be a bigger number, i.e. the scale must be smaller. In this particular set of options, answer (a) is the only one which is smaller. This would have saved you time.
GIVEN MERCATOR SCALE AT SOME LATITUDE, FIND MERCATOR SCALE AT SOME OTHER LATITUDE
There is a short cut formula which gets rid of the need to use secants and the need to remember to write the representative fraction as a fraction. You simply need to remember that the large figure in the RF is the denominator. (It is also the figure we most commonly remember). Thus a 1:500,000 chart (ICAO topo) has a denominator (D) of 500,000.
The following derivations need not be remembered but the final formula is important.
When comparing scales at two different latitudes on a Mercator chart, we can write
At latitude A:
Scale at A = Scale at Equator x secant A
At latitude B:
Scale at B = Scale at Equator x secant B
Divide the two scale formulae:
Scale at A = Scale at Equator x secant A
Scale at B Scale at Equator secant B
This can be simplified to:
Scale A = secant A
Scale B secant B
but even further simplified to:
1 1 DenominatorA Cosine A 1 = 1
DenominatorB Cosine B
The equation to remember is this one:
Denominator A = cos A Denominator B cos B
You may recall that this is also the formula used to compare the departure between two longitudes at different latitudes. The only difference now is that D represents the denominator of scale rather than the departure.

316
Chapter 19 Mercator Charts - Scale
Example 3
On a Mercator chart, the scale at 54S is 1:2,000,000. What is the scale at 25N?
a. 1:2,000,000b. 1:3,084,000c. 1:1,121,000d. 1:3,825,000
Firstly, use your knowledge to discount answers a and c. At 25N, you are closer to the Equator than at 54S. Therefore, scale must contract between 54S and 25N - the denominator at 25N must be larger than at 54S. In some cases, there may only be one appropriate answer given and the answer can be spotted without calculation. In this case, answers b and d could be correct and we need to revert to the simplified formula.
DenominatorA = cos A DenominatorB cos B
Let DA = scale denominator at 25°N DB = scale denominator at 54°S
DA = cos 25 2,000,000 cos 54
Therefore DA = cos 25 x 2,000,000
cos 54
= 3,083,806
Answer: 1:3,084,000 - b
GIVEN A FIXED CHART DISTANCE BETWEEN MERIDIANS, FIND MERCATOR SCALE AT A SPECIFIC LATITUDE
Example 4On a Mercator chart, the chart length between two meridians, 160E and 160W, is 30 cms at 30S. What is the scale of the chart at 30S?
There are 2 ways of doing this, and there is very little to choose between them.
The first is to treat it as a departure problem.
Scale = Chart Length
Earth Distance
Chart Length = 30 cmEarth Distance = Departure
Departure = ch long (mins) x cos lat
= (40° x 60) x 0.866 nms
= 2078 nm

317
Chapter 19Mercator Charts - Scale
Scale = 30 cm 2078 nm
= 1 cm 69.28 nm
= 1 69.28 x 1852 x 100
= 1
12,831,000
Scale is 1:12,831,000
Note: This has little to do with Mercator charts and is essentially a Scale/Departure problem.
Alternatively, you can find the scale at the Equator as a normal RF, then convert to scale at30S, like this:
Scale at Equator = Chart Length Earth Distance
The Earth distance at the Equator is 40° of ch long x 60 nm (the Equator is a great Circle). This comes to 2400 nm. Now get numerator and denominator in the same units and work out the RF.
Scale at Equator = 30 cm = 1 2400 x 1852 x 100 cm 14,816,000
Now we just have a normal scale change problem, just like Example 1.
Scale at 30°S = Scale at Equator x Secant 30°S
Scale at 30°S = 1 x 1 14,816,000 cos 30°
Scale is 1:12,831,000
Example 5 (This appears to be a more complex problem but is as straightforward asExample 4)
At 40N, the scale of Mercator chart is 1:10,000,000. What is the distance in centimetres between the 160E and 160W meridians at 20S?
An immediate problem appears to be that the scale is given at 40N but the distance between the two meridians has to be calculated at 20S. Initially, the student might be tempted to change the scale from 40N to 20S using the scale conversion formula previously given. This is unnecessary. Think about the Mercator chart - it has parallel meridians and so the distance between two meridians will be the same at all latitudes. The problem can be solved completely at 40N.
Scale at Equator = Chart Length Earth Distance

318
Chapter 19 Mercator Charts - Scale
but Earth distance at 40°N = Departure
= ch long (mins) x cos lat
= 2400 x cos 40
= 1838.4 nm
1 = Chart length
10,000,000 1838.4 nm
Chart length = 1838.4 nm
10,000,000
but this needs to be converted to centimetres
Chart length = 1838.4 x 1852 x 100
10,000,000
Answer = 34 cms
AREA OF “CONSTANT” SCALE
For practical navigation, charts may be considered to be constant scale in any area where the scale is within 1% of correct scale.
On a Mercator chart, scale is constant and “correct” only along the Equator.
The scale is within 1% of “correct” scale within a band of 8° latitude either side of theEquator (see Note 1).
The scale is within ½% of correct scale within a band of 6° latitude either side of theEquator (see Note 2).
Note 1 The 8° figure can be quoted in exams as 480/500 nms.
Note 2 The 6° band can be quoted in exams as 350/360 nms.

319
Chapter 19Mercator Charts - Scale
QUESTIONS
1. On a Mercator chart, the scale at the Equator is 1:3,500,000. What is the scale at 37ºS?
2. On a Mercator chart, the scale at 50°N is 1:4,500,000. What is the scale at the Equator?
3. On a Mercator chart, the scale at 15°N is 1:1,500,000. What is the scale at 47ºS?
4. The chart length between meridians 1° apart is 3.2 inches. What is the scale of the chart as a representative fraction at 50N ?
5. A Mercator is to be constructed at a scale of 1:2,237,000 in latitude 44N. What is the required spacing in centimetres between meridians 1° apart ?
6. The scale of a Mercator chart is 1:3,500,000 at 52 N. Give the length in inches of a straight line on the chart from A (58N 42E) to B (58N 34E).
7. On a Mercator chart the spacing of meridians 1° apart is 2.82 cm. In which latitude will the scale be 1:2,319,000 ?
8. On a Mercator chart the spacing of meridians 1° apart is 5.42 cm. What is the scale of the chart as a representative fraction in latitude 56N ?
9. The scale of a Mercator chart is 1:3,500,000 in latitude 52N. What is the spacing, in centimetres, between meridians 1° apart ?
10. The scale of a Mercator chart is 1:5,107,200 in latitude 47N.
a. What distance in nm does one inch on the chart represent in 47N ?b. What is the spacing in cms between meridians 10° apart ?c. Would the scale at 30N have a larger or smaller denominator than 5,107,000 ?
Give a reason for your answer.
11. On a Mercator chart a line drawn along the parallel of 60N, and measuring 4 inches, represents a distance of 200 km.
a. Give the scale at 60N as a representative fraction.b. How many nautical miles will be represented by a line drawn along the same parallel
and measuring 7 cm in length ?
12. The scale of a Mercator chart is 1:2,179,000 at the equator.
a. What is the spacing in centimetres between meridians 10° apart ?b. In which latitude does one inch represent 18.4 nm ?
13. A Mercator chart has a scale of 1:3,000,000 at 60N.
a. In what latitude is the scale:
i. 1:6,000,000 ? ii. 1:5,300,000 ?
b. Is there a latitude on this chart where the scale is 1:6,500,000 ?

320
Mercator Charts - ScaleChapter 19
14. On a particular Direct Mercator wall chart, the 180°W to 180°E parallel of latitude at 53°N is 133 cm long. What is the scale of the chart at 30°S?
a. 1: 3,000,000b. 1: 18,000,000c. 1: 21,000,000d. 1: 27,000,000

321
Chapter 19Mercator Charts - Scale
ANSWERS
1. 1:2,795,224
2. 1:7,000,757
3. 1:1,059,085
4. 60’ of long @ 50N = 60 x Cos 50° nm = 38.58 nm 3.2 ins = 38.58 nm. 1 in = 12.05 nm RF = 1: 12.05 x 72960 = 1: 879333 or 60’ Cos 50° x 6080 x 12 = 1:879624 3.2
5. At 44N 60 @ long = 60 x Cos 44° nm = 43.14 nm = 80 kms Chart Length = Earth Length x 1 RF = 8,000,000 cm = 3.576 cm 2,237,000
6. Ch.long = 8° = 480’ = 480 x Cos 52° = 295.7 nm Chart length = Earth length x 1 RF = 295.7 x 72960 = 6.16 “ (Chart Length same at 52 and 58N) 3500000
7. As the RF is 1:2,319,000, Earth distance = 2.82 x 2,319,000 cm = 65.39 km = 35.28nm. As nm = min long x Cos Lat Then Cos Lat = nm = 35.28 = .588 = Cos 54° N/S min long 60
8. 1° @ 56° = 60 x Cos 56°nm = 33.55 nm = 62.19 km 5.42 cm = 62.19 km 1 cm = 11.47 km RF for Chart = 1 : 1.147,000
9. At 52N 1° = 60 x Cos 52°nm = 36.94 nm = 68.47 km. Chart dist = Earth dist x 1 RF = 68.47 x 1000 x 100 = 1.956 cm 3,500,000
10. a. 1” = 5,107,200 = 5,107,200 = 70 nm 72,960
b. 10° = 600 x Cos 47° = 409.2 nm
409.2 x 72960 = 5.845” = 14.85 cm 5,107,200
c. At 30N the scale is less than at 47N. Mercators chart EXPANDS away from the Equator. Therefore scale denominator would be larger.

322
Mercator Charts - ScaleChapter 19
11. a. 4” = 200 km 1” = 50 km = 26.97 nm SF = 1 : 26.97 x 72960 = 1 : 1,968,000
OR 10.16 cm = 200 km 1 cm = 19.68 km SF = 1 : 1,968,000 (Note that any unit of measurement can be used as scale is same for both)
b. 7 cm = 7 x 19.68 km = 137.79 km = 74.336 nm
12. a. At Equator 10° = 600 nm = 1112.2 km at SF 1 : 2,179,000 = 1112.2 = 51.04 cm 21.79
b. 1” = 18.4 nm SF = 1 : 18.4 x 72960 = 1 : 1,342,464
Cos Lat = 1,342,464 = 0.616 2,179,000
Cos 0.616 is equal to Lats 52N or S
13. a (i) Scale at 60N = 1 : 3,000,000 Scale at Equator = 1 : 3,000,000 x 1
Cos 60°
= 1 : 6,000,000
(ii) Cos Lat = 5,300,000 = .833 = Lat 28N/S 6,000,000
b. NO. Scale on the Mercator is always minimum at the Equator, and expands both North & South away from the Equator.
14. d (the correct answer is nearer to 1/26M, but 1/27M was the nearest option)

323
Chapter 20Mercator Charts - Plotting
CHAPTER TWENTY
MERCATOR CHARTS - PLOTTING
Contents
MERCATOR CHARTS - PLOTTING . . . . . . . . . . . . . . . . . . . . . . . . . . . . .325
ADVANTAGES AND DISADVANTAGES OF A MERCATOR CHART . . . . . . . . .333
ADVANTAGES OF A MERCATOR CHART . . . . . . . . . . . . . . . . . . . . . . . .333
DISADVANTAGES OF A MERCATOR CHART . . . . . . . . . . . . . . . . . . . . . .333
USES OF A MERCATOR CHART . . . . . . . . . . . . . . . . . . . . . . . . . . . . . .334
QUESTIONS . . . . . . . . . . . . . . . . . . . . . . . . . . . . . . . . . . . . . . . . . .335
ANSWERS . . . . . . . . . . . . . . . . . . . . . . . . . . . . . . . . . . . . . . . . . . .338

324
Chapter 20 Mercator Charts - Plotting

325
Chapter 20Mercator Charts - Plotting
MERCATOR CHARTS - PLOTTING
You will not yet have started the plotting part of the General Navigation syllabus but you still need at this stage to understand some basic terminology.
Position Lines
If a pilot called Oxford ATC for a QTE (a true bearing from a station) and received the answer “QTE 240°”, he could draw a line bearing 240°T from Oxford and know that the aircraft is somewhere along the line. The straight line drawn is known as ‘a position line’.
Position Lines on a Mercator Chart
The above situation is more complex that it seems at first sight. A position line plotted on a chart is a straight line. However, on a Mercator chart, the straight line represents a rhumb line, but, radio waves travel along great circles. On a Mercator chart, great circles are curves concave to the Equator (except for meridians and the Equator itself). On a Mercator chart, the basic problem is to convert the great circle bearings provided by radio navigation aids to straight lines which can be used to plot the position of the aircraft on a Mercator chart - to plot the rhumb line.
The angle between the great circle and the rhumb line is Conversion Angle
Conversion Angle (CA) = ½ x Earth Convergency (EC) CA = ½ EC
but EC = ch long x sin mean lat
Therefore
Conversion Angle (CA) = ½ x ch long x sin mean lat
Note: In examinations, students may be given the value of Earth Convergency between the aircraft and the beacon. However, the student might need to calculate EC and CA using the formulae above.

326
Chapter 20 Mercator Charts - Plotting
Example 1
An aircraft receives a QTE from Oxford ATC of 240°(T). What bearing should be plotted fromOxford on a Mercator chart? Convergency between the aircraft and Oxford is 4°.
The situation is illustrated in Figure 20.1.
Figure 20.1 Mercator Plotting Example 1Figure 20.1 Mercator Plotting Example 1
Great Circle bearing (QTE) = 240°(T)
Conversion Angle = ½ EC = ½ x 4° = 2°
Rhumb Line Bearing (straight line) = 240°(T) - 2°
Answer = 238°(T)
Note: that this problem has been set in the Northern Hemisphere.

327
Chapter 20Mercator Charts - Plotting
Example 1(a)
Now repeat the problem using Auckland, New Zealand - a Southern Hemisphere problem.
The new situation is illustrated in Figure 20.2.
Figure 20.2 - Mercator Plotting Example 1aFigure 20.2 Mercator Plotting Example 1a
Great Circle Bearing (QTE) = 240°(T)
Conversion Angle (as in Example 1) = 2°
Rhumb Line Bearing (straight line) = 240°(T) + 2°
Answer = 242°(T)
Most problems follow the pattern of Examples 1 and 1a. However, they can be made more complex by using VOR readings (°M) or relative bearings (°R).

328
Chapter 20 Mercator Charts - Plotting
Example 2
An aircraft in the Northern Hemisphere has a VOR (RMI) reading of 310° to position X. Variation at the aircraft position is 5°E. Variation at the VOR position is 2°E. What bearing should be plotted on a Mercator chart from the beacon to the aircraft? (Earth convergency is 8°).
Convert the VOR (RMI) reading to position X (the QDM) to a QTE (true bearing) from X.
VOR (RMI) = 310° M = QDM
QDR = 310°M ± 180° = 130°M (the tail of the RMI needle)
For navigation plotting, work in °(T).
The VOR beacon is aligned to Magnetic North at the beacon. Therefore, we must convert from °M to °(T) using the variation at the beacon. (In this case, the variation at the aircraft is a ‘red herring’).
QTE = QDR + variation E
= 130° + 2°
= 132°(T) (great circle bearing from beacon to aircraft).
The situation is now the same as in Example 1 and, for plotting on a Mercator chart, we need to apply Conversion Angle to find the rhumb line (straight line) bearing. The situation is illustrated in Figure 20.3.
Great Circle Bearing (QTE) = 132°(T)
Conversion Angle (CA) = ½ Convergency = 4°
Rhumb Line Bearing (straight line) = 132° + 4°
Answer = 136°(T)
What would the answer be if the problem had been in the Southern Hemisphere?
Answer = 128°(T)

329
Chapter 20Mercator Charts - Plotting
Figure 20.3 Mercator Plotting Example 2Figure 20.3 Mercator Plotting Example 2
The next two examples are set to examine the student’s ability to use bearings from Non Directional Beacons (NDBs) which can be given on a Relative Bearing Indicator (RBI) as °R, or on an RMI as °M.
The essential difference between solving problems using NDBs and problems using VORs is to recognise that NDB bearings are measured using the aircraft’s Automatic Direction Finding(ADF) equipment. If variation is to be applied, always use the variation at the aircraft position. In summary:
For VOR problems, use beacon variation
For NDB problems, use aircraft variation

330
Chapter 20 Mercator Charts - Plotting
Example 3
An aircraft flying in the Northern Hemisphere on a heading of 155°M measures the relative bearing of NDB‘Z’ on an RBI as 130°(R). Variation at the NDB is 5°W. Variation at the aircraft is 8°W. If the Earth Convergency between the aircraft and the NDB is 4°, what bearing should be plotted from the beacon to the aircraft on a Mercator chart?
In General Navigation, bearings are normally plotted in °(T). A sensible first step would be to calculate the aircraft’s true heading. Clearly, the variation at the aircraft must be applied (in this case, the variation at the beacon is a ‘red herring’).
Aircraft Heading (°T) = 155°M - 8°W
= 147°(T)
The next sensible step is to resolve the relative (RBI) bearing (°R) to calculate the true bearing of the beacon from the aircraft.
This sub-problem is illustrated in Figure 20.4.
Figure 20.4 Mercator Problems/Relative Bearings Figure 20.4 Mercator Problems/Relative Bearings
True bearing = True heading + relative bearing
= 147°(T) + 130°R
= 277°(T) (the great circle bearing of the beacon from the aircraft) The remainder of the problem is similar to Example 1 except that the initial bearing has been calculated from the aircraft to the beacon (in Example 1, QTE was given). This situation is illustrated in Figure 20.5.

331
Chapter 20Mercator Charts - Plotting
Figure 20.5 Mercator Plotting/Example 3
Figure 20.5 Mercator Plotting/Example 3
True bearing of G/C from aircraft to beacon = 277°(T)
Conversion angle (CA) = ½ EC = ½ x 4 = 2°
Rhumb line from aircraft to beacon = 275°(T)
Therefore rhumb line from beacon to aircraft = 095°(T)
Answer : Plot 095°(T) (Mercator)

332
Chapter 20 Mercator Charts - Plotting
Example 4
An aircraft in the Northern Hemisphere is flying on a heading of 045°M. The ADF is tuned to NDB ‘Q’ and the RMI reads 090°. Variation at NDB ‘Q’ is 2°E and at the aircraft is 2°W. Earth convergency between the aircraft and the NDB is 10°. What bearing should be plotted from the NDB on a Mercator chart?
The ‘red herring’ in this case is the aircraft heading. The Radio Magnetic Indicator (RMI) has already resolved the ADF readings and indicates the magnetic bearing of the radio signal i.e. the great circle to the beacon.
Great Circle (radio bearing) to the beacon - 090°M
Because the beacon is a NDB, the variation to be applied is the variation at the aircraft (see Example 4).
Great Circle to the NDB = 090°M - 2°W
= 088°(T)
The problem is now similar to Example 4. We know the great circle bearing to the NDB but on a Mercator chart, we must plot the rhumb line bearing from the NDB to the aircraft.
Remember that this is a Northern Hemisphere problem.The solution is illustrated in Figure 20.6.
What would the solution be in the Southern Hemisphere?
Answer: 263°(T)
Figure 20.6 Mercator Plotting - Example 4Figure 20.6 Mercator Plotting - Example 4

333
Chapter 20Mercator Charts - Plotting
Great Circle bearing to NDB = 088°(T)
Conversion angle (CA) = ½ EC = ½ x 10 = 5°
Rhumb line bearing to NDB = 088°(T) + 5°
= 093°(T)
Rhumb line from NDB to aircraft = 093 ± 180°(T)
Answer : Bearing to plot from NDB = 273°(T)
ADVANTAGES AND DISADVANTAGES OF A MERCATOR CHART
These final 2 paragraphs are not really about Mercator plotting, but some of them would not have been understood without a knowledge of the previous 2 chapters, so they have been placed here, at the end of the 3 chapters on Mercator instead of in the introduction. We shall list:
Advantages and disadvantages of a Mercator chart.
Uses of a Mercator chart.
ADVANTAGES OF A MERCATOR CHART
Rhumb lines are straight lines on a Mercator chart.
Aircraft compasses detect local north (after allowing for variation and deviation) and so the aircraft is steered along a Rhumb line (after allowing for drift).
If steering by compass (pre-automatic computing of Great Circle track), you track along a straight line by holding a single True track.
The graticule is rectangular, which makes plotting positions easier.
DISADVANTAGES OF A MERCATOR CHART
The chart is not constant scale. Distances must be measured using the latitude scale, and measured in small increments locally along the track.
It is not usable at latitudes greater than, say, 75° N/S because the rate of latitude expan- sion becomes unworkable. The poles cannot be projected.
Radio waves follow Great Circles. But Great Circles cannot be directly plotted. There- fore, to plot bearings (NDB VOR, radar, etc), conversion angles must be calculated and applied.

334
Chapter 20 Mercator Charts - Plotting
USES OF A MERCATOR CHART
Plotting charts of areas up to 75° latitude.
Topographical charts of equatorial areas, where scale distortion is small.
Meteorological synoptic charts of equatorial charts.

335
Chapter 20Mercator Charts - Plotting
QUESTIONS
1. An aircraft receives a QTE from airfield ‘A’ of 063°T. Airfield A is in the Northern Hemisphere. The convergency between the aircraft and the airfield is 6°. What bearing should be plotted on a Mercator chart from the airfield?
a. 060°(T)b. 063°(T)c. 066°(T)d. 069°(T)
2. An aircraft receives a QTE from airfield ‘B’ of 315°(T). Airfield B is in the Southern Hemisphere. The convergency between the aircraft and the airfield is 2°. What bearing should be plotted on a Mercator chart from the airfield?
a. 314° b. 315° c. 316° d. 317°
3. An aircraft flying in the Northern Hemisphere has an RMI reading of 050° to VOR beacon ‘C’. Variation at the aircraft is 5°E. Variation at the VOR beacon is 8°E. If the convergency between the aircraft meridian and the VOR meridian is 4°, what bearing should be plotted on a Mercator chart from the beacon to the aircraft?
a. 234° b. 236° c. 233° d. 238°
4. An aircraft flying in the Southern Hemisphere has an RMI reading of 130° to VOR beacon ‘D’. Variation at the aircraft is 5°W. Variation at the VOR beacon is 2°W. If the convergency between the aircraft meridian the VOR meridian is 2°, what bearing should be plotted on a Mercator chart from the beacon to the aircraft?
a. 310° b. 307° c. 308° d. 309°
5. An aircraft and an NDB are in the Northern Hemisphere. The aircraft’s heading is 236°M. Variation is 13°W at the aircraft and 11°W at the NDB. The relative bearing (RBI) of the NDB is 226° (R). Convergency between the aircraft’s meridian and the meridian of the NDB is 4°. What bearing should be plotted from the NDB on a Mercator chart?
a. 271°(T) b. 269°(T) c. 273°(T) d. 275°(T)

336
Mercator Charts - PlottingChapter 20
6. Repeat Question 5 but with the aircraft and the NDB being in the Southern Hemisphere.
a. 269°(T) b. 267°(T)c. 271°(T) d. 265°(T)
7. On a Mercator chart, positions E and F are on a parallel of latitude of 30°. The longitude of E is 008°W. The great circle bearing of E from F is 265°(T).
a. In which hemisphere are these two positions?b. What is the approximate longitude of F?c. At which longitude would the great circle and rhumb line tracks between E and F have
the same value?
8. The great circle bearing of a radio facility at 175°W from an aircraft at 175°E is 068°(T). Given that the convergency between the meridians is 6°, what bearing should be plotted from the radio facility on a Mercator chart? (Assume Northern Hemisphere).
a. 248° b. 245° c. 254° d. 251°
9. Repeat Question 8 for an aircraft and radio facility in the Southern Hemisphere.
a. 248°T b. 245°Tc. 254°T d. 251°T

337
Chapter 20Mercator Charts - Plotting

338
Mercator Charts - PlottingChapter 20
ANSWERS
1 c. Similar to Mercator Plotting - Example 1
2 c. Similar to Mercator Plotting - Example 1a
3 b. Similar to Mercator Plotting - Example 2
4 d. Similar to Example 2 - (Southern Hemisphere)
5 a. Similar to Example 3
6 b. Similar to Example 3 but Southern Hemisphere
7 a. Southern b. 012°E c. 002°E
8 d.
9 b.

339
Chapter 21Lambert’s Conformal Chart - 1
CHAPTER TWENTY ONE
LAMBERT’S CONFORMAL CHART
Contents
WHY CONICAL CHARTS?. . . . . . . . . . . . . . . . . . . . . . . . . . . . . . . . . .341
BACKGROUND TO THE LAMBERT PROJECTION . . . . . . . . . . . . . . . . . . .341
THE SIMPLE CONIC PROJECTION - CONVERGENCE . . . . . . . . . . . . . . . . .341
THE SIMPLE CONIC PROJECTION - SCALE . . . . . . . . . . . . . . . . . . . . . . .345
LAMBERT’S CONICAL ORTHOMORPHIC PROJECTION . . . . . . . . . . . . . . .345
LAMBERT CHART CONVERGENCE . . . . . . . . . . . . . . . . . . . . . . . . . . . .347
NON-PERSPECTIVE CHART . . . . . . . . . . . . . . . . . . . . . . . . . . . . . . . .348
LAMBERT CHART PROPERTIES . . . . . . . . . . . . . . . . . . . . . . . . . . . . . .348
SUMMARY OF LAMBERT PROPERTIES . . . . . . . . . . . . . . . . . . . . . . . . . .352

340
Chapter 21 Lambert’s Conformal Chart - 1
341
Chapter 21Lambert’s Conformal Chart - 1
WHY CONICAL CHARTS?
We have seen that the Mercator chart has many powerful properties, but it does have 2 limitations. These are:
Great Circles are not projected as straight lines.
The chart is not constant scale. Indeed, scale changes quite rapidly on a Mercator chart.
Navigators wished to maintain Rhumb Line tracks for the first 400 years or so or the life of the Mercator chart, because they were steering by compass, and therefore needed to have a constant track direction.
However, that situation started to change from about 1960 onwards, when automatic computing became available. It is possible to calculate a desired Great Circle track direction by spherical trigonometry formulae, and the computers built into INS, IRS, FMS and GPS do this as a matter of course.
If the aircraft is going to be steered along a Great Circle, it would be helpful to have a chart on which a Great Circle is a straight line. Otherwise the aircraft will appear to go off track in the middle of the leg, then recover back to track again.
If the scale were to remain constant on a chart, we could measure distances with a ruler instead of having to use a pair of dividers, and have to open the dividers to different distances at different latitudes. For aviation, it is useful to be able to use a ruler - most aircraft do not have a large plotting table like a ship.
BACKGROUND TO THE LAMBERT PROJECTION
The basis of the Lambert projection is the simple conical. However, the simple conical projection has some limitations, not least that it is not orthomorphic. A German mathematician called Johann Heinrich Lambert made some modifications to the basic conic in 1777. The result is the orthomorphic, near constant scale Lambert’s Conformal Conic Chart.
The approach taken in the initial part of this chapter will be firstly to derive some of the properties of the simple conic projection. Some of these, particularly the chart convergence, are also found in the Lambert projection. We will next examine why Lambert made his changes and what effect they had. We will then finish up with the properties of the Lambert projection.
THE SIMPLE CONIC PROJECTION - CONVERGENCE
It is possible to project the graticule of the earth on to the inside surface of a cone. This process gives the conical family of projections from which Lambert’s is derived.
A cone is placed over a reduced earth, in such a way that the cone is tangential with the reduced earth along a parallel of latitude. The apex of the cone will lie on the extended line of the earth’s axis as shown in Figure 21.1.

342
Chapter 21 Lambert’s Conformal Chart - 1
Figure 21.1 The Principle of Simple Conical ProjectionFigure 21.1 The Principle of Simple Conical Projection
A light source at the centre of the reduced earth casts shadows of the graticule on the inside surface of the cone.
These shadows could be marked in, the cone removed, cut down its slant side and rolled out flat to give a simple conical projection as illustrated in Figure 21.2.
On the simple conical projection, scale is correct on the parallel of tangency, in this example, 45°N. This parallel, on which scale is correct, is called the ‘Standard Parallel’. Scale expands on either side of the Standard Parallel.
Figure 21.2 illustrates that when the cone is flattened 360° of longitude are represented in a segment of a circle of 255 degrees, in this case. The size of the segment is controlled by the parallel of latitude chosen to be the parallel of tangency - the higher the latitude chosen the larger will be the segment.
Figure 21.2. A Simple Conical Projection - Graticule.Figure 21.2. A Simple Conical Projection - Graticule.

343
Chapter 21Lambert’s Conformal Chart - 1
Look at Fig 21.3. The parallel of tangency is 45N. You can see that if you take this parallel as the base of a triangle formed by the cross-section of the cone, you get an isosceles triangle, with the angle at the apex being 90°. On the other hand, if we had taken a parallel of tangency of 60N, the angle at the apex would have been 120°. The ultimate case is a parallel of tangency of 90N - the North Pole. In this case we would get a flat sheet of paper and the angle at the North Pole would be 180°. The angle at the apex of the triangle is always twice the parallel of tangency.
Figure 21.3 Apex Angle is Twice Parallel of OriginFigure 21.3 Apex Angle is Twice Parallel of Origin
The apex angle is also known as the angle of the cone. It is the angle of the cone which determines the arc of the segment formed by laying the cone flat. In the ultimate case, a 90° parallel of tangency gives a 180° cone angle, which gives no missing gap at all. If the parallel of tangency is at a high latitude, say, 60N, then the paper segment forms quite a large arc and the ‘missing’ segment is small. At a parallel of tangency of 45N the segment is 255°, making the ‘missing’ segment 105°.
The relationship of the segment formed to the original 360° of longitude change is determined by the sine of the parallel of origin.
arc of segment = change of longitude x sine of parallel of origin
= 360° x sine 45°
= 255°
What we are saying here is that 360° (which is the change of longitude between the 180°E and the 180°W meridian in Figure 21.2 - going the long way round - not across the gap) is represented by 255° of angle of inclination between the meridians as drawn on the simple conic chart.
angle of inclination of meridians = ch long x sine of parallel of origin
The angle of inclination of the meridians is known as chart convergence. Therefore:
chart convergence = change of longitude x sine of parallel of origin
This gives a general relationship, which is illustrated as follows:

344
Chapter 21 Lambert’s Conformal Chart - 1
Figure 21.4 Ch long v Chart Convergence over 100°Figure 21.4 Ch long v Chart Convergence over 100°
In Figure 21.4, a change of longitude of 100° is represented on the chart by an angle of inclination of the meridians of (100° x sin 45°), which is 70.71°. In Figure 21.5, a change of longitude of 10° is represented on the chart by an angle of inclination of the meridians of (10° x sin 45°), which is 7.071°.
The sine of the parallel of origin is called “the constant of the cone” and is represented by the symbol “n”.
Figure 21.5 Ch long v Chart Convergence over 10°
Figure 21.5 Ch long v Chart Convergence over 10°

345
Chapter 21Lambert’s Conformal Chart - 1
THE SIMPLE CONIC PROJECTION - SCALE
On the simple conic projection the scale is correct at the parallel of tangency - the paper touches the Reduced Earth at this point.
Figure 21.6 Correct ScaleFigure 21.6 Correct Scale
However, the scale expands away from the parallel of tangency rather rapidly:-
Figure 21.7 Scale ExpansionFigure 21.7 Scale Expansion
LAMBERT’S CONICAL ORTHOMORPHIC PROJECTION
Lambert modified the simple conic in order to reduce this rapid rate of scale change.
Instead of doing this: He did this:
Figure 21.8(a) Simple Conic Figure 21.8(b) LambertFigure 21.8(a) Simple Conic Figure 21.8(b) Lambert

346
Chapter 21 Lambert’s Conformal Chart - 1
Lambert made the cone of his projection go inside the Reduced Earth.
The scale is now correct at these 2 points.
These are now called the Standard Parallels.
Figure 21.9 Lambert - Correct Scale
The scale expands here:
Figure 21.10 Lambert - Expanded Scale
It contracts here:
Figure 21.11 Lambert - Contracted Scale
This has had the effect of evening out the scale error, making it more of a constant scale chart.
Figure 21.9 Lambert - Correct Scale
Figure 21.10 Lambert - Expanded Scale
Figure 21.11 Lambert - Contracted Scale

347
Chapter 21Lambert’s Conformal Chart - 1
This new projection has two standard parallels on which the scale is correct. The old parallel of tangency of the simple conic is renamed the parallel of origin of the new projection, and scale is least on this parallel, just as it was on the simple conic.
Outside the standard parallels scale is greater (more expanded) than it is on the standard parallels, whilst between them scale is less (contracted), being least of all on the parallel.
In Fig 21.12 the standard parallels are 43°N and 47°N and the parallel of origin ( //o) is 45°N. The upper standard parallel appears one sixth of the way from the top of the chart and the lower standard parallel, one sixth of the way from the bottom of the chart.
This is the ‘one sixth rule’, and ensures minimum scale variation over the sheet.
Figure 21.12. Part of a Lambert Conical Orthomorphic
Chart.Figure 21.12. Part of a Lambert Conical Orthomorphic Chart.
LAMBERT CHART CONVERGENCE
In the simple conic the angle of the cone was twice the latitude of the parallel of tangency. This fixed the chart convergence, making it the change of latitude times the sine of the parallel of tangency.
In making the cone go inside the Reduced Earth, Lambert did not change the cone angle. You can either think of it as keeping the cone angle constant and reducing the size of the cone, or, equally validly, just pushing the same cone downwards a bit.
If the cone angle has not changed, then neither has the ‘n’ factor, or constant of the cone. The chart convergence remains the same. This was originally defined by the parallel of tangency, so in the Lambert chart it is defined by the Parallel of Origin.
Thus the scale is correct at the Standard Parallels, but the convergence factor is defined by the Parallel of Origin.

348
Chapter 21 Lambert’s Conformal Chart - 1
NON-PERSPECTIVE CHART
Having brought the cone inside the Reduced Earth, it was necessary to make some mathematical adjustments in order to make the chart orthomorphic.
The Lambert projection is a non-perspective chart.
LAMBERT CHART PROPERTIES
SCALEThis is least on the parallel of origin. It expands away from the parallel of origin, until it is correct on the standard parallels. Scale is greatest on the top and bottom parallels of the projection.
ORTHOMORPHISM
The chart is orthomorphic by mathematical construction.
The meridians converge:
But the parallels curve:
When you put them together,they cut at right angles.

349
Chapter 21Lambert’s Conformal Chart - 1
GRATICULEMeridians are straight lines radiating from the pole. Parallels of latitude are arcs of circles, all of which are centred at the pole. The pole is usually off the map sheet which you are using. The map sheet is shown as a red broken rectangle here.
PARALLEL OF ORIGIN
Figure 21.13Figure 21.13
The parallel of origin is the mathematical basis of the projection. It defines the chart convergence. It is half-way between the 2 Standard Parallels. The sine of the parallel of origin is called ‘the constant of the cone’ and is denoted by the symbol ‘n’.
CHART CONVERGENCEUnlike on the Earth, the meridians of a Lambert projection are straight lines.
Therefore, also unlike the Earth, the convergence between 2 given meridians does not change with latitude.
Figure 21.14. Chart Convergence.
All angles the same
Figure 21.14 Chart Convergence.

350
Chapter 21 Lambert’s Conformal Chart - 1
The formula for calculating chart convergence is: -
Chart Convergence = change in longitude x sine parallel of origin.
Since the meridians are straight lines, the chart convergence between two selected meridians will not change with latitude. In other words, chart convergence is constant on a Lambert chart. This is shown in Figure 21.14, where the meridians through, A, C and E, have been paralleled through B, D and F, respectively, forming angles marked ‘CC’ which are all equal to each other.
RHUMB LINESExcept for meridians which appear as straight lines, rhumb lines are curves concave to the pole of the projection (parallels of latitude).
GREAT CIRCLESExcept for the meridians which appear as straight lines, great circles appear as curves concave to the parallel of origin. A straight line in an ‘east-west’ direction most nearly represents a great circle when drawn between two positions on the parallel of origin. The following series of diagrams explain why:-
Imagine a spherical Earth, (i.e. the real Earth or a Reduced Earth).
The meridians converge towards each other with increasing latitude.
Now imagine 3 Great Circle tracks at different latitudes.
Figure 21.15 Great Circles on Real EarthFigure 21.15 Great Circles on Real Earth
What will happen when we project this real Earth situation onto a Lambert chart with a parallel of origin of 45°N?
The Earth meridians are straightened out into straight-line chart meridians. This means that the formerly straight-line Great Circles are stretched outwards at latitudes higher or lower than the parallel of origin.

351
Chapter 21Lambert’s Conformal Chart - 1
Figure 21.16 Earth Convergence comparedwith Chart Convergence
Figure 21.16 Earth Convergence compared with Chart Convergence
Like this:-
So Great Circles are straight lines at the parallel of origin and curves concave to the parallel of origin at any other latitude.
Figure 21.17 Great Circles on a Lambert ChartFigure 21.17 Great Circles on a Lambert Chart
However, the amount of curvature from the straight line is exaggerated in Figure 21.17 simply to make the explanation clearer. In fact there is very little curvature compared with a straight line and, for all practical purposes, including plotting, Great Circles on a Lambert chart may be treated as straight lines.
The amount of curvature on a Rhumb Line is far greater than a Great Circle. We will return to this point in the next chapter.

352
Chapter 21 Lambert’s Conformal Chart - 1
SUMMARY OF LAMBERT PROPERTIES
A summary of Lambert properties is set out below. All of these are asked in examinations and should be learnt.
PROPERTIES OF A LAMBERT CHART
Scale
Correct on the standard parallels.Contracted within the standard parallels.(least at parallel of origin).Expanded outside standard parallels.
Orthomorphic Yes. All charts used for navigation must be.
GraticuleMeridians are straight lines, originating from the pole. Parallels are arcs of circles, centred at the pole.(The pole is always off the map).
Parallel of Origin Mathematical basis of projection. Assumed to be halfway between the 2 standard parallels.
Chart ConvergenceConstant across the chart.
Chart convergence = ch long x sin parallel of origin
Rhumb lines Meridians are straight lines. All other Rhumb Lines are concave to the pole (ie, parallels of latitude).
Great Circles
Meridians are straight lines.At the parallel of origin - near-straight line. At any other latitude, a curve concave to the parallel of origin.

353
Chapter 22Lambert’s Conformal Chart - 2
CHAPTER TWENTY TWO
LAMBERT’S CONFORMAL CHART - 2
Contents
CONSTANT SCALE . . . . . . . . . . . . . . . . . . . . . . . . . . . . . . . . . . . . . .355
EARTH CONVERGENCE AND CHART CONVERGENCE . . . . . . . . . . . . . . .356
GREAT CIRCLE CURVATURE ON A LAMBERT CHART . . . . . . . . . . . . . . . .358
LINES PARALLEL AT MID-MERIDIAN . . . . . . . . . . . . . . . . . . . . . . . . . .360
THE ADVANTAGES OF A LAMBERT CHART . . . . . . . . . . . . . . . . . . . . . .360
THE DISADVANTAGES OF THE LAMBERT CHART . . . . . . . . . . . . . . . . . .360
PLOTTING ON A LAMBERT CHART . . . . . . . . . . . . . . . . . . . . . . . . . . .360
QUESTIONS . . . . . . . . . . . . . . . . . . . . . . . . . . . . . . . . . . . . . . . . . .364
ANSWERS . . . . . . . . . . . . . . . . . . . . . . . . . . . . . . . . . . . . . . . . . . .366
354
Chapter 22 Lambert’s Conformal Chart - 2

355
Chapter 22Lambert’s Conformal Chart - 2
CONSTANT SCALE
As we have seen, the Lambert chart is not completely constant scale. Scale expands outside the standard parallels and contracts inside them. However, the whole point of Lambert’s modification was to reduce the rate of scale change.
For practical purposes, we regard a chart as being ‘constant scale’ if the amount of scale distortion does not exceed 1%. This means that you can measure distances with a ruler and they will be 1% or less in error. This is good enough for most applications in aviation.
Some published Lambert charts meet this specification and others do not. You can measure distances with a ruler on the UK CAA 1:500,000 topographical maps very accurately (there is about 0.1% maximum error), but there is about 3% scale error on the Jeppesen ED-6.
The amount of scale error depends on the separation of the standard parallels. You are not required to know the formula or the amount of scale error but, just to give you a feel for what are and are not constant scale charts, the following table lists the scale error for various latitude differences.
Figure 22.1 Ch lat of Standard ParallelsFigure 22.1 Ch lat of Standard Parallels
Change of Latitude between Standard Parallels % Scale Error
5⅓° 0.1
16° 1
23° 2
28° 3
32° 4
The UK CAA 1:500,000 topographical maps have SPs at 4940N and 5240N - a separation of 5°. The SPs on the Jeppesen series which includes the ED-6 are 37N and 65N, a separation of 28°. This explains the percentage scale errors.

356
Chapter 22 Lambert’s Conformal Chart - 2
EARTH CONVERGENCE AND CHART CONVERGENCE
Earth convergence (also known as convergency) is the difference in inclination between 2 meridians on the Earth:
Figure 22.2. Earth ConvergenceFigure 22.2 Earth Convergence
or the change in direction of a Great Circle track between 2 meridians on the Earth.
Figure 22.3 Convergency as the
change in great circle direction.
Figure 22.3 Convergency as the change in great circle direction.
Chart convergence is the difference in inclination between 2 meridians on the chart:
Figure 22.4. Chart Convergence.Figure 22.4 Chart Convergence
or the change in direction of a straight line track between 2 meridians on the chart.

357
Chapter 22Lambert’s Conformal Chart - 2
The difference between a Rhumb Line and a Great Circle is known as Conversion Angle and is half Earth Convergence.
The formula is CA = ½ Ch long x sin mid lat.
Figure 22.6 Conversion AngleFigure 22.5 Conversion Angle
The difference between a Rhumb Line and a straight line on the chart is half Chart Convergence.
Figure 22.7 Half Chart ConvergenceFigure 22.6 Half Chart Convergence
The formula is:
Difference between Rhumb Line and straight line = ½ ch long x sin parallel of origin

358
Chapter 22 Lambert’s Conformal Chart - 2
GREAT CIRCLE CURVATURE ON A LAMBERT CHART
This difference between Chart Convergence and Earth Convergence explains why Great Circles are concave to the parallel of origin on the Lambert projection.
Imagine a Lambert chart. Take 2 meridians, say, 20° apart. Now consider 3 different latitudes, say, 47N, 45N (parallel of origin) and 43N.
Figure 22.8 Straight LinesFigure 22.7
Draw straight lines joining the meridians at these latitudes.
Figure 22.9 Straight LinesFigure 22.8 Straight Lines
Now consider the Rhumb Line in each case.
The difference between the Rhumb Line and the straight line will be ½ chart convergence and is equal to ½ ch long x sin parallel of origin.
½ x 20° x .7071 = 7.071° in all 3 cases!

359
Chapter 22Lambert’s Conformal Chart - 2
Now calculate the angle that the Great Circle makes with the Rhumb Line. This is Conversion Angle, and is ½ ch long x sin mean latitude for each line
Calculating this value gives us 3 different answers, one for each latitude.
Figure 22.10 Conversion AngleFigure 22.9 Conversion Angle
CA47N = ½ x 20° x sin 47 = 7.314°
CA45N = ½ x 20° x sin 45 = 7.071°
CA43N = ½ x 20° x sin 43 = 6.820°
Look at the conversion angles in Figure 22.9. You can see that they are different for each latitude.
Plotting the conversion angles in at the other end and joining them up gives us the Great Circle track paths.
This shows why a Great Circle appears as a straight line at the parallel of origin but is concave to the parallel of origin at any other latitude. The straight lines always make the same angle to the Rhumb Line, whatever their latitude, but the angle that the Great Circle makes to the Rhumb Line depends on its latitude.
Figure 22.11 Great CirclesFigure 22.10 Great Circles

360
Chapter 22 Lambert’s Conformal Chart - 2
LINES PARALLEL AT MID-MERIDIAN
If two positions are joined by a straight line, a great circle, and rhumb line on a Lambert chart, they are all parallel to each other at the mid-meridian.
Figure 22.12. Measuring at Mid-Meridian.Figure 22.11 Measuring at Mid-Meridian
THE ADVANTAGES OF A LAMBERT CHART
Great Circles can be treated as straight lines for all practical purposes.
Radio bearings are Great Circles, so can be plotted without application of conversion angle. You still need apply convergence by paralleling the NDB’s meridian from the aircraft’s DR meridian position, but no calculation is involved - this is explained below.
If scale error is small, a graduated ruler can be used to measure distances.
THE DISADVANTAGES OF THE LAMBERT CHART
Flying by compass gives Rhumb Line tracks, so if great circle tracks are to be flown the aircraft must have a system which provides automatic continuous computation of desired track (INS / IRS / FMS / GPS), or the aircraft must be steered by gyro (without transport wander correction). If rhumb line tracks are to be flown, the ‘mid-meridian’ system must be used, since rhumb lines are curves.
The graticule is not rectangular and the plotting of positions is not as simple as on aMercator.
NDB position lines have to be plotted using meridian transfer. This is explained below.
PLOTTING ON A LAMBERT CHART
Plotting bearings on a Lambert chart is less complicated than on a Mercator because Great Circles (radio waves) are straight or near-straight lines, and so there is no conversion angle to apply. However, there may be a correction for chart convergence to apply. It depends on whether the bearing is measured at the ground station or at the aircraft.

361
Chapter 22Lambert’s Conformal Chart - 2
The bearing measurement process for VDF (QDMs and QTEs) and for VOR takes place at the ground station. It may appear with VOR that the bearing is displayed in the aircraft and has been decoded in the aircraft, but it has not been measured in the aircraft. The different between the VOR reference phase and the bearing phase is encoded at the moment of transmission on that particular bearing at the ground station. All that the aircraft VOR receiver does is de-modulate the encoded signal and display it. It does not actually measure a bearing, unlike ADF.
For bearings measured at the ground station (VDF or VOR), the plotting process is simple. You simply correct for variation at the point where it has been added (the ground station), and plot the true bearing from the ground station. This will be the correct Great Circle track at the ground station. The straight-line bearing will change direction with respect to north as it crosses meridians and encounters convergence and therefore will not be the same Great Circle track direction at the aircraft, but it is not being plotted from the aircraft, so this does not matter. It is the correct radio wave path.
For bearings measured at the aircraft (ADF / NDB and AWR (airborne weather radar)), the situation is complicated because there is convergence between the meridian where the bearing is measured (the aircraft) and from where it will be plotted (the NDB). Consider the situation at Figure 22.12. An aircraft measures a bearing of an NDB of 245°(R) while on a heading of 025°(T). It is required to plot the position line on a Lambert chart.
Adding together the relative bearing of 245° and the true heading of 025° gives the true great circle bearing of the NDB from the aircraft, 270°.
But if the reciprocal, 090°, is plotted from the meridian of the NDB the position line will not pass through the aircraft position, as the meridian through the aircraft is not parallel to that through the NDB. See Figure 22.12(a).
Figure 22.13. Plotting an ADF Bearing.Figure 22.12 Plotting an ADF Bearing
If, however, the angle of 090° is measured from a line parallel to the aircraft’s meridian drawn through the NDB, the position line will pass through the aircraft as shown in Figure 22.12(b).
Chart convergence has been automatically allowed for by drawing a line parallel to the aircraft’s meridian through the NDB. This method is always used in plotting.
If it is necessary to obtain the bearing to plot from the meridian of the NDB, reference to Figure 22.12(b) will show that in this case it is equal to 090° minus chart convergence.

362
Chapter 22 Lambert’s Conformal Chart - 2
ExampleAn aircraft flying, in the northern hemisphere, on a heading of 330°(T) measures a bearing of 090°(R) of an NDB. What is the bearing to plot on a Lambert chart:
a. from a line parallel to the aircraft’s meridian drawn through the NDB.
b. from the meridian of the NDB. Chart convergence is 3°.
Solution
a. 330° + 090(R) = 060°(T)(True great circle bearing of NDB from aircraft) Plot 240° from a line parallel to the aircraft’s meridian drawn through the NDB. See Figure 22.13 (a).
b. Bearing to plot from meridian of NDB
= 240° + 3°
060°
A/C
NDB
240°
CC = 3°
(a)
(b)
A/C
060°240°
NDB
Figure 22.14. Plotting an ADF Bearing.Figure 22.13 Plotting an ADF Bearing
Note that, in the case of bearings measured at the aircraft, it is the aircraft’s compass which is used to add to relative bearing in order to obtain true bearing. Therefore, if the heading is magnetic and it is necessary to correct it to True, we always use variation at the aircraft.
Bearings measured at ground station (VOR, VDF) - variation at ground stationBearings measured at aircraft (NDB/ADF, AWR) - variation at aircraft

363
Chapter 22Lambert’s Conformal Chart - 2
Example 1
Two points A and B are plotted on a Lambert chart and joined by a straight line, which from the Meridian of A, measures 250°(T). Given that the chart convergence of the meridians through A and B is 6°, what is:-
a. the rhumb line track from A to B?
b. the approximate great circle bearing of A from B, as given by the straight line, measured from the meridian of B?
Assume Northern Hemisphere.
Solution
The angle between the straight line and the rhumb line is ½ chart convergence = 3° a. 250° - 3° = 247°(T).
b. The rhumb line bearing of A from B is 247°(T) - 180° = 067°(T).
The ‘straight line’ bearing therefore is 067° - 3° = 064°(T).
Example 2
The straight line from A to B, both of which are in the northern hemisphere, is plotted on a Lambert chart and cuts the mid-meridian in the direction of 300°(T). Measured from the meridian through A, the direction of the straight line is 302°(T). What is:-
a. the rhumb line track from A to B?
b. the chart convergence of the meridians through A and B?
c. the approximate GC bearing of A from B, as given by the straight line?
Solution
a. Rhumb line and straight line are parallel at the mid-meridian. Therefore Rhumb line track from A to B = 300°(T)
b. Straight line at A = 302°(T) Rhumb line = 300°(T) So ½ chart convergence = 2° So chart convergence = 4°
c. Rhumb line bearing of A from B = 120°(T) ½ chart convergence = 2° So approx. great circle bearing = 118°(T)

364
Lambert’s Conformal Chart - 2Chapter 22
QUESTIONS
1. A Lamberts Conformal chart extends from 29°N to 45°N.Standard parallels are at 31°N and 43°N. Chart convergency is D.Long x 0.6.On this chart is the scale at 43°N the same, greater or less than the scale at:
i. 45°Nii. 37°Niii. 31°N
2. Using the same chart as Question 1, a straight line track on this chart from A (40°N 12°E) to C which is at 18°W passes through B.The direction of this track is 292° (T) at A and 283° (T) at B.
a. What is the longitude of B?b. Give the approximate values of the rhumb line track angle on this route: i. at A ii. at B
3. A Lamberts Conformal chart extends from 42°S to 64°S. Chart convergency is D.Long x 0.8.(Convergency Factor). A straight line track on this chart from K (48°S 178°E) to M at longitude 152°W passes through L.
The direction of this track at K is 102° (T) and at L is 096° (T).
a. What is the longitude of position L?b. What is the approximate value of the rhumb line track from K to M?c. What is the approximate value of the rhumb line track from K to L?d. What is the Latitude of M?
4. A Lamberts Conical conformal chart has standard parallels at 63N and 41N. What is the constant of the cone?
a. .891 b. .788 c. .656 d. .707
5. Scale on a Lambert’s conformal conic chart
a. is constantb. is constant along a meridian of longitudec. varies slightly as a function of latitude and longitude d. is constant along a parallel of latitude
6. On a conformal chart, the standards parallels are 41 o20’N and 11 o40’N. What is the constant of the cone?
a. .660 b. .202 c. .446 d. .895

365
Chapter 22Lambert’s Conformal Chart - 2
7. Scale on a Lambert conformal chart is:
a. constant along a line of latitude b. constant along a line of longitude c. constant everywhered. correct at the parallel of origin
8. On a Lambert chart, the constant of the cone is .78585. What is the parallel of tangency?
a. 51°02’ b. 51°36’ c. 51°15’ d. 51°48’
9. On a Lambert’s chart the constant of the cone is 0.80. A is at 53N 04W. You plan to fly to B. The initial Lambert’s chart straight-line track is 070°(T) and the Rhumb Line track from A to B is 082°(T). What is the longitude of B?
a. 26E b. 34W c. 11E d. 15E

366
Lambert’s Conformal Chart - 2Chapter 22
ANSWERS
1. i. 45N (Less) ii. 37N (Greater) iii. 31N (Same)
2. a. 003° 00’W
b. i) 283°(T) ii) 283°(T)
3. a. 174°30’W b. K to M (090°(T)) c. K to L (099°(T)) d. 48S
4. B
5. D
6. C
7. A
8. D
9. A

367
Chapter 22AMid Course Test
CHAPTER TWENTY TWO A
MID COURSE TEST
Contents
INTRODUCTION . . . . . . . . . . . . . . . . . . . . . . . . . . . . . . . . . . . . . . .369
PRACTICE TEST . . . . . . . . . . . . . . . . . . . . . . . . . . . . . . . . . . . . . . . .369
ANSWERS . . . . . . . . . . . . . . . . . . . . . . . . . . . . . . . . . . . . . . . . . . .379

368
Mid Course TestChapter 22A

369
Chapter 22AMid Course Test
INTRODUCTION
All the questions are of the same standard as the Gen Nav ATPL exam - it is just that, for this test, they are drawn only from those parts of the syllabus which have already been covered. There are 54 questions in 2 hours, exactly as in the ATPL exam, and most of them are from previous JAA papers, or are very similar. It is a representative and realistic exam.
PRACTICE TEST Practice Test - General Navigation 54 Questions 2 Hours 80 Marks
1. What is the shortest distance in kilometres between San Francisco (38N 123W) and Dubai (25N 057E)?
(2 Marks)a. 7020b. 8073c. 13001d. 11250
2. A Great Circle has a Northern Vertex of 50N 100W. The Southern Vertex is? (1 Mark)
a. 40S 100Wb. 40S 080Ec. 50S 100Wd. 50S 080E
3. An ICAO nautical mile is defined as? (1 Mark)
a. 6080 feetb. 1852 metresc. 1863 feetd. 6062 feet
4. How much is the polar diameter of the Earth different from the equatorial diameter?(2 Marks)
a. less by 40 kmb. greater by 27 statute milesc. less by 27 statute milesd. greater by 27 nautical miles
5. The maximum difference between geodetic and geocentric latitude occurs at about?(1 Mark)
a. 45° North and Southb. 90° North and Southc. 60° North and Southd. 0° (Equator)
6. Required course 045°(T), W/V = 190°(T)/30, FL=55@ISA, Variation = 15°E. CAS = 120 knots. What is magnetic heading and G/S?
(3 Marks)a. 052°(M) 154b. 067°(M) 154c. 037°(M) 154d. 037°(M) 113

370
Mid Course TestChapter 22A
7. What is the shortest distance in kilometres between Cairo (30°17’N 030°10’E) and Durban(29°48’S 030°10’E)?
(2 Marks)a. 3605b. 4146c. 4209d. 6676
8. An aircraft at latitude 02°20’N tracks 1800(T) for 685 km. What is its latitude at the end of the flight?
(2 Marks)a. 03°50’Sb. 02°50’Sc. 02°10’Sd. 08°55’S
9. An aircraft is at latitude 10N and is flying South at 444 km/hour. After 3 hours the latitude is?(2 Marks)
a. 10Sb. 02Nc. 02Sd. 0N/S
10. The circumference of the Earth is approximately? (1 Mark)
a. 43200 nmb. 10800 nmc. 21600 nmd. 5400 nm
11. SAT = +35°C. Pressure alt (corrected for barometric error) = 5000 feet. What is true alt? (2 Marks)
a. 4550 feetb. 5550 feetc. 4920 feetd. 5320 feet
12. Given that the value of ellipticity of the Earth is 1/297 and that the semi-major axis of the Earth, measured at the axis of the Equator is 6378.4 Km, what is the semi-major axis of the earth measured at the axis of the Poles?
(2 Marks)a. 6399.9 Kmb. 6356.9 Kmc. 6378.4 Kmd. 6367.0 Km
13. You plan to fly a track (course) of 348°(T), Drift is 17°port, Variation = 32°W. Deviation is 4°E. What compass heading should you fly?
(2 Marks)a. 041°b. 033°c. 016°d. 359°
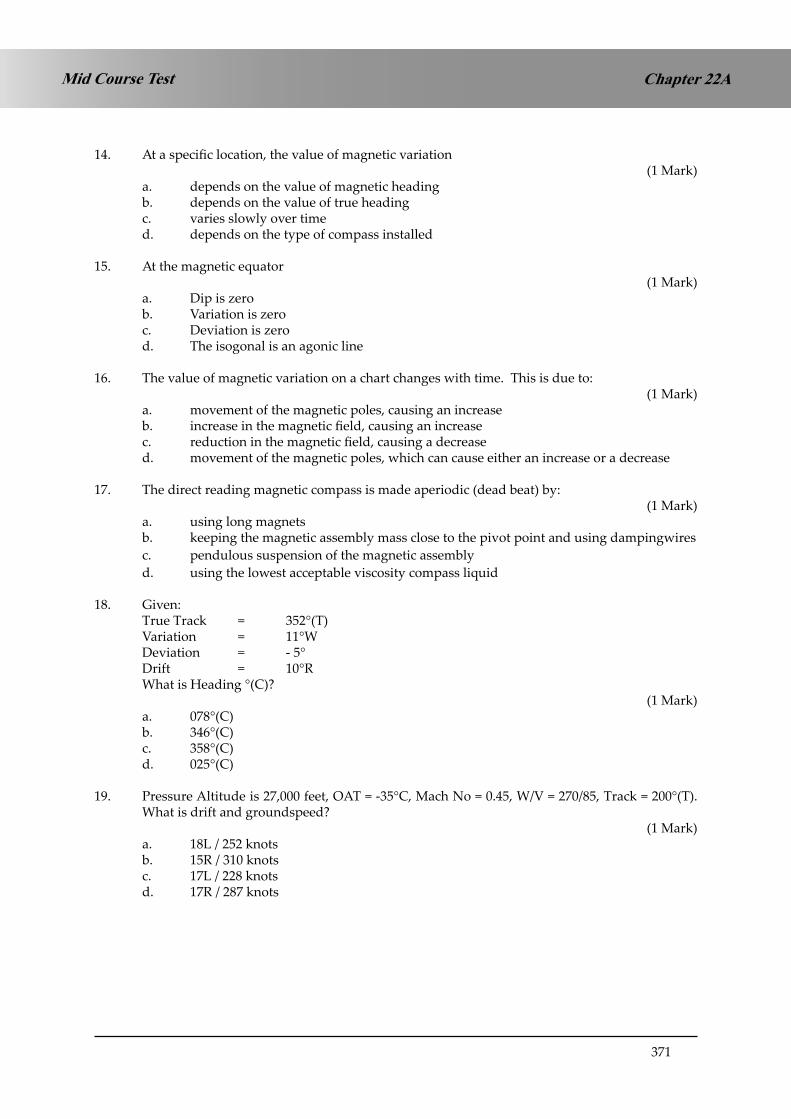
371
Chapter 22AMid Course Test
14. At a specific location, the value of magnetic variation (1 Mark)
a. depends on the value of magnetic headingb. depends on the value of true headingc. varies slowly over timed. depends on the type of compass installed
15. At the magnetic equator (1 Mark)
a. Dip is zerob. Variation is zeroc. Deviation is zerod. The isogonal is an agonic line
16. The value of magnetic variation on a chart changes with time. This is due to: (1 Mark)
a. movement of the magnetic poles, causing an increaseb. increase in the magnetic field, causing an increasec. reduction in the magnetic field, causing a decreased. movement of the magnetic poles, which can cause either an increase or a decrease
17. The direct reading magnetic compass is made aperiodic (dead beat) by: (1 Mark)
a. using long magnetsb. keeping the magnetic assembly mass close to the pivot point and using dampingwiresc. pendulous suspension of the magnetic assemblyd. using the lowest acceptable viscosity compass liquid
18. Given: True Track = 352°(T) Variation = 11°W Deviation = - 5° Drift = 10°R What is Heading °(C)?
(1 Mark)a. 078°(C)b. 346°(C)c. 358°(C)d. 025°(C)
19. Pressure Altitude is 27,000 feet, OAT = -35°C, Mach No = 0.45, W/V = 270/85, Track = 200°(T). What is drift and groundspeed?
(1 Mark)a. 18L / 252 knotsb. 15R / 310 knotsc. 17L / 228 knotsd. 17R / 287 knots

372
Mid Course TestChapter 22A
20. You plan to take off from Khamis Mushayt, Saudi Arabia, elevation 6500 ft. The ambient temperature is +25°C. What is your Density Altitude?
(1 Mark)a. 3500 ftb. 6500 ftc. 9500 ftd. 12500 ft
21. You are flying at 400 kts TAS, Indicated temperature -50°C. What is your COAT?(1 Mark)
a. -67°Cb. -50°Cc. -33°Cd. -17°C
22. You are flying at FL330 at Mach No 0.9M. Ambient temperature is ISA +150. What is your TAS?
(1 Mark)a. 600 knotsb. 595 knotsc. 540 knotsd. 505 knots
23. You plan to land on R/W 14. The met forecast wind velocity is 110/30. Variation is 30°W. What crosswind do you expect?
(1 Mark)a. 15 ktsb. 0 ktsc. 26 ktsd. 30 kts
24. Given: IAS 120 knots, FL 80, OAT +20°C. What is the TAS? (1 Mark)
a. 132 ktb. 141 ktc. 102 ktd. 120 kt
25. Given: TAS 200 kt, Track 1100(T), W/V 015/40, calculate heading (°T) and groundspeed.(2 Marks)
a. 097° - 201 ktb. 099° - 200 ktc. 121° - 207 ktd. 121° - 199 kt
26. Given: True Hdg 145°, TAS 240 kt, True Track 150°, G/S 210 kt, calculate the W/V.(2 Marks)
a. 360/35b. 295/35c. 180/35d. 115/35

373
Chapter 22AMid Course Test
27. Given: TAS 140 kt, Heading 005°(T), W/V 265/25, calculate the drift and groundspeed.(2 Marks)
a. 11R - 140 ktb. 10R - 146 ktc. 9R - 140 ktd. 11R - 142 kt
28. An aircraft is maintaining a 5.2% gradient on a flat terrain. Its height at 7 nm from the runway is approximately?
(2 Marks)a. 3640 feetb. 1890 feetc. 2210 feetd. 680 feet
29. G/S = 240 knots, Distance to go = 500 nm. What is time to go?(1 Mark)
a. 20 minutesb. 29 minutesc. 2h 05 md. 2h 12 m
30. Course 040°(T), TAS 120 kn, Wind speed = 30 knots. From which direction will the wind give the greatest drift?
(1 Mark)a. 215°(T)b. 230°(T)c. 235°(T)d. 240°(T)
31. X Y Z 30 nm 20 nm
ATA X is 1420. ETA Y is 1447. ATA Y is 1450. What is new ETA Z?(1 Mark)a. 1506b. 1512c. 1510d. 1515
32. Heading is 156°(T), TAS is 320 knots, W/V 130/45. What is your true track?(2 Marks)
a. 160b. 152c. 104d. 222
33. You are flying at a True Mach No of .72 in a SAT of -45°C. At 1000 hours you are 100 nm from the CPT DME and your ETA at CPT is 1012. ATC ask you to slow down to be at CPT at 1016. What should your new TMN be if you reduce speed at 100 nm to go?
(3 Marks)a. .67b. .63c. .54d. .51

374
Mid Course TestChapter 22A
34. Track = 090°(T), TAS = 460 knots, W/V = 360°(T) / 100, Variation = 10°E, Deviation = -2. What is compass heading and groundspeed?
(2 Marks)a. 079° - 470 ktb. 069° - 450 ktc. 068° - 460 ktd. 070° - 455 kt
35. You leave A to fly to B, 475 nm away, at 1000 hours. Your ETA at B is 1130. At 1040, you are 190 nm from A. What groundspeed is required to arrive on time at B?
(2 Marks)a. 317 knotsb. 330 knotsc. 342 knotsd. 360 knots
36. The wind velocity is 359/25. An aircraft is heading 180°(T)at a TAS of 198 knots. (All directions are True). What is its track and groundspeed?
(2 Marks)a. 180° - 223 ktb. 179° - 220 ktc. 180° - 220 ktd. 179° - 223 kt
37. An aircraft is climbing at a constant CAS in ISA conditions. What will be the effect on TAS and Mach No?
(1 Mark)a. TAS increases and Mach No decreasesb. Both increasec. Both decreased. TAS decreases and Mach No increases
38. Convert 70 metres/sec into knots.(1 Mark)
a. 136 knotsb. 36 knotsc. 146 knotsd. 54 knots
39. Airfield elevation is 1000 feet. The QNH is 988. Use 27 feet per hectopascal. What is pressure altitude?
(1 Mark)a. 675 feetb. 325 feetc. 1675 feetd. 825 feet
40. You are flying from A to B, planned track 245°(M), distance 225 nm. Your groundspeed is 180 knots. After 15 minutes flying, you fix your position as 3 nm left of planned track. Which of the following statements is correct?
(2 Marks)a. Your drift is 2Pb. Your drift is 4Pc. You should turn 5 right to go direct to Bd. You should turn 8 right to go direct to B

375
Chapter 22AMid Course Test
41. A pilot receives the following signals from a VOR DME station. Radial = 180° +/- 1°, distance = 200 nm What is the approximate maximum error?
(1 Mark)a. +/- 2 nmb. +/- 3.5 nmc. +/- 7 nmd. +/- 1 nm
42. You are flying a VFR route and have become uncertain of your position. Which is the best course of action?
(1 Mark)a. set heading towards a line feature - coastline, river or motorwayb. turn round and fly your flight plan tracks in reverse until you see something you
recognised beforec. fly a series of ever-expanding circles from your present position till you find your next
check pointd. turn round and fly your flight plan in reverse back to base
43. By what amount must you change your rate of descent given a 10 knot increase in headwind on a 3° glideslope?
(1 Mark)a. 50 feet per minute increaseb. 30 feet per minute increasec. 50 feet per minute decreased. 30 feet per minute decrease
44. You are on an ILS 3-degree glideslope which passes over the runway threshold at 50 feet. Your DME range is 25 nm from the threshold. What is your height above the runway threshold elevation? (Use the 1 in 60 rule and 6000 feet = 1 nautical mile).
(1 Mark)a. 8010 feetb. 7450 feetc. 6450 feetd. 7550 feet
45. An INS-equipped aircraft flies from 56N 020W (Waypoint 3) to 56N 030W (Waypoint 4). The initial INS desired track at Waypoint 3 is:
(2 Marks)a. 086°(T)b. 082°(T)c. 274°(T)d. 278°(T)
46. An aircraft starts at position 0410S 17822W and tracks true north for 2950 nm, then turns 90 degrees left, and maintains a rhumb line track for 314 kilometres. What is the final position?
(3 Marks)a. 5500N 17422Wb. 4500N 17422Wc. 5500N 17738Ed. 4500N 17738E

376
Mid Course TestChapter 22A
47. On a chart, 49 nautical miles is represented by 7.0 centimetres. What is the scale?(1 Mark)
a. 1 / 700,000b. 1 / 2,015,396c. 1 / 1,296,400d. 1 / 1,156,600
48. On a particular Direct Mercator wall chart, the 180W to 180E parallel of latitude at 53N is 133 cm long. What is the scale of the chart at 30S?
(2 Marks)a. 1 / 3,00,000b. 1 / 18,000,000c. 1 / 21,000,000d. 1 / 26,000,000
49. Which of the following differences in latitude will give the biggest difference in the initial Great Circle track and the mean Great Circle track between 2 points separated by 100 change of longitude?
(1 Mark)a. 60N and 60Sb. 60N and 55Nc. 30S and 30Nd. 30S and 25S
50. On a chart, meridians at 43N are shown every 10 degrees apart. This is shown on the chart by a distance of 14 cm. What is the scale?
(2 Marks)a. 1 / 2,00,000b. 1 / 4,000,000c. 1 / 5,000,000d. 1 / 6,000,000
51. A non-perspective chart:(1 Mark)
a. is produced directly from a light projection of a Reduced Earthb. cannot be used for navigationc. is produced by mathematically adjusting a light projection of the Reduced Earthd. is used for a Polar Stereographic projection
52. On a Mercator chart, a Rhumb Line appears as a:(1 Mark)
a. small circle concave to the nearer poleb. curve convex to the nearer polec. complex curved. straight line
53. Mercator charts use ................... projections?(1 Mark)
a. cylindricalb. conicalc. plane/azimuthald. complex
377
Chapter 22AMid Course Test
54. How does scale change on a normal Mercator chart?(1 Mark)
a. expands as the secant2 (½ co-latitude)b. expands directly with the secant of the latitudec. correct on the standard parallels, expands outside them, contracts within themd. expands as the secant of the E/W great circle distance

378
Mid Course TestChapter 22A

379
Chapter 22AMid Course Test
ANSWERS
Question Answer Marks Your Score1 c 22 d 13 b 14 c 25 a 16 c 37 d 28 a 29 c 210 c 111 b 212 b 213 b 214 c 115 a 116 d 117 b 118 c 119 c 120 c 121 a 122 c 123 b 124 b 125 b 226 d 227 b 228 c 229 c 130 d 131 c 132 a 233 d 334 b 235 c 236 a 237 b 138 a 139 c 140 c 2

380
Mid Course TestChapter 22A
Question Answer Marks Your Score41 b 142 a 143 c 144 d 145 c 246 d 347 c 148 d 249 b 150 d 251 c 152 d 153 a 154 b 1
TOTALS 80
Your score x 100 = % 80 If you have scored less than 75%, you need to do some more revision.

381
Chapter 23The Polar Stereographic Chart
CHAPTER TWENTY THREE
THE POLAR STEREOGRAPHIC CHART
Contents
INTRODUCTION . . . . . . . . . . . . . . . . . . . . . . . . . . . . . . . . . . . . . . .383
POLAR STEREOGRAPHIC GRATICULE. . . . . . . . . . . . . . . . . . . . . . . . . .383
POLAR STEREOGRAPHIC PROPERTIES . . . . . . . . . . . . . . . . . . . . . . . . .384
USES OF A POLAR STEREOGRAPHIC CHART. . . . . . . . . . . . . . . . . . . . . .387
SUMMARY . . . . . . . . . . . . . . . . . . . . . . . . . . . . . . . . . . . . . . . . . . .388
STRAIGHT-LINE TRACK PROBLEMS . . . . . . . . . . . . . . . . . . . . . . . . . . .389

382
Chapter 23 The Polar Stereographic Chart

383
Chapter 23The Polar Stereographic Chart
INTRODUCTION
The polar stereographic projection is, of those discussed, the only geometric projection, i.e. true perspective projection. It is constructed using the principle shown in Figure 23.1.
A flat surface is used, touching the North Pole (the point of tangency). The light source is positioned at the South Pole (diametrically opposed), creating a graticule, by geometrical projection, which is shown in the lower part of the diagram.
Figure 24.1. A Polar Stereographic Projection.Figure 23.1 A Polar Stereographic Projection.
POLAR STEREOGRAPHIC GRATICULE.
The meridians are straight lines, radiating from the Pole. The parallels are concentric circles. However, they are not evenly spaced. Their spacing from the Pole depends on the scale expansion from the Pole.
To determine this, we need to introduce the concept of the co-latitude. The co-latitude is simply (90° - the latitude). Therefore, if the latitude is, say, 60°, the co-latitude will be 30°.
Now consider the light paths in Figure 23.1. Take the light which passes through the Equator. The Equator’s latitude is 0°, so the co-latitude is 90°. Half of the co-latitude is 45°. In the triangle formed by the light path above, the opposite and the adjacent are both the radius of the Earth, so we have a right-angled triangle with a bottom angle of 45°.
It can be shown by a geometrical proof that the angle that the light path makes with the axis of the Earth is always a function of half the co-latitude. You are not required to understand the proof, but you should remember the result, which is that the scale expands away from the Pole at a rate of the secant squared of half the co-latitude.
Therefore: scale expansion = sec2 (½ co-latitude)

384
Chapter 23 The Polar Stereographic Chart
In Figure 23.2 you can see that the meridians are straight lines, and the parallels are concentric circles. However, the spacing between the parallels is increasing as the distance from the Pole increases.
The Equator can be projected so that a hemisphere or more can be shown on one chart.
Figure 24.2 Polar Stereographic Graticule
Figure 23.2 Polar Stereographic Graticule
POLAR STEREOGRAPHIC PROPERTIES
The properties of the Polar Stereographic chart are analysed below:-
SCALEThe scale is correct at the Pole (where the paper touches the Reduced Earth). Elsewhere it expands as the sec2 (½ co-latitude).
The equation to find scale at any latitude is as follows:
scale at any latitude = scale at Pole x sec2 (½ co-latitude)
We will now substitute a particular value of latitude, 78°, and see how this changes the scale.
Assume that the scale at the Pole is 1/1,000,000.
scale at 78° = 1 x sec2 (½ co-latitude) 1,000,000
If the latitude is 78°, then the co-latitude is 12°. Half the co-latitude is 6°. The equation therefore becomes:
scale at 78° = 1 x sec2 (6°) 1,000,000
This can be written as:
scale at 78° = 1 x sec (6°) x sec (6°) 1,000,000

385
Chapter 23The Polar Stereographic Chart
or, alternatively:
scale at 78° = 1 x 1 x 1
1,000,000 cos 6° cos 6°
= 1 x 1 = 1
1,000,000 0.989074 989,074
In other words, between latitudes 90° and 78°, the scale is within 1% of the scale at the pole, which can be regarded as a constant scale chart.
A similar exercise can be carried out for the latitude of 70°. Out to 70° the scale is within 3% of the scale at the Pole.
To summarise:
Between latitudes 90° and 78° - scale within 1% of scale at Pole.Between latitudes 78° to 70° - scale between 1% and 3% of scale at Pole.
This constancy of scale makes the Polar Stereographic projection an almost ideal map for flying in polar regions. With the breakdown of former political rivalries and the advent of aircraft of long range and endurance, ETOPS procedures, and inertial navigation systems, it has now become common to use polar routes, which are often shorter, and some go very close to the Pole indeed. Consider the situation at Figure 23.3.
70oN
78oN
Fig 24.3 Track near PoleFigure 23.3 Track near Pole
Take the 1% scale zone. The co-latitude of 78° is 12°. Therefore, the distance from the Pole to latitude 78° is 60 nm x 12 = 720 nm. If the aircraft is entering at one side and leaving more or less on the opposite side of the circle, the total distance in the 1% zone is around 1400 nm. At typical jet-liner speeds of around 450 knots TAS, that is approximately 3 hours flying time.
A chart which can be considered constant scale and allows measurement of distances with a ruler for over 3 hours flying is a very useful projection.
ORTHOMORPHISMMeridians are straight lines originating from the pole. Parallels of latitude are arcs of circles centred at the pole. The expansion is at the same rate in any direction from any point Therefore the projection is orthomorphic.
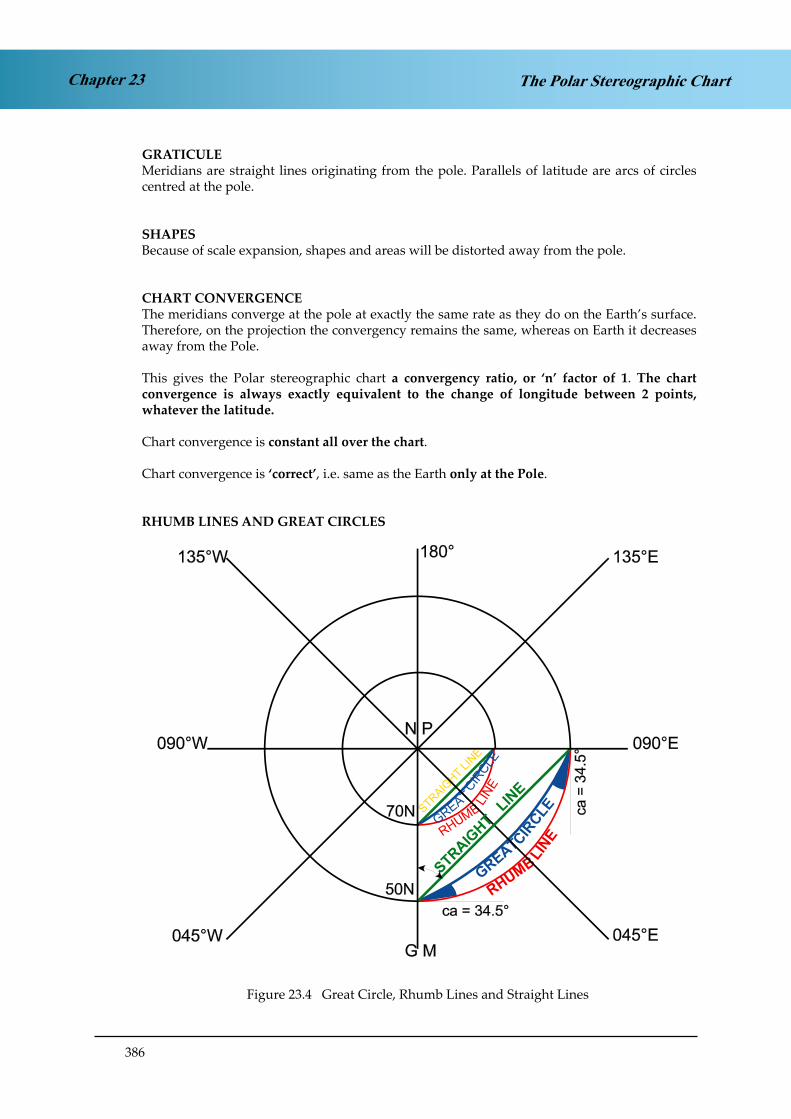
386
Chapter 23 The Polar Stereographic Chart
GRATICULEMeridians are straight lines originating from the pole. Parallels of latitude are arcs of circles centred at the pole.
SHAPESBecause of scale expansion, shapes and areas will be distorted away from the pole.
CHART CONVERGENCEThe meridians converge at the pole at exactly the same rate as they do on the Earth’s surface. Therefore, on the projection the convergency remains the same, whereas on Earth it decreases away from the Pole.
This gives the Polar stereographic chart a convergency ratio, or ‘n’ factor of 1. The chart convergence is always exactly equivalent to the change of longitude between 2 points, whatever the latitude.
Chart convergence is constant all over the chart.
Chart convergence is ‘correct’, i.e. same as the Earth only at the Pole.
RHUMB LINES AND GREAT CIRCLES
Figure 24.4 Great Circle, Rhumb Lines and Straight Lines.Figure 23.4 Great Circle, Rhumb Lines and Straight Lines

387
Chapter 23The Polar Stereographic Chart
In Figure 23.4 a Rhumb Line, a Great Circle and a straight line on the chart have been drawn between longitudes 000°E/W (the Greenwich Meridian) and 090°E, at 2 different latitudes, for example 50°N and 70°N.
As with the Lambert chart, the Rhumb Line has the greatest curvature. A parallel of latitude must cut meridians at right angles. Rhumb Lines are always concave to the nearer Pole.
As with the Lambert chart, the Great Circle is concave to the parallel of origin. It is just that, on this chart, the parallel of origin is the pole. Therefore, Great Circles are also concave to the nearer Pole, but the amount of curvature is less than the Rhumb Line.
It is possible to calculate the difference between a Great Circle and a straight line at any latitude, in order to see how closely a straight line approximates to a Great Circle. The angle between the straight line and the Rhumb Line is half chart convergence, whilst the angle between the Great Circle and the Rhumb Line is Conversion Angle (half Earth convergence).
At 50N, the angle between a straight line and a Rhumb Line is half chart convergence. Over a 90° change of longitude, this is 45° for a Polar Stereographic chart (‘n’ = 1). The angle between the Great Circle and the Rhumb Line is Conversion Angle, which is ½ ch long x sin mean latitude - ½ x 90 x 0.766 = 34½°.
Difference between straight line and Great Circle = 45° - 34½° = 10½°.
This is a large initial difference and therefore it would not be possible to approximate a straight line to a Great Circle at this latitude over this change of longitude. However, if we were flying directly over the Pole, then both the straight line track and the Great circle track would be initially be 000°, then 180° and there would be no difference. So the amount of change of longitude obviously makes a difference.
At 70°N, the angle between a straight line and a Rhumb Line over a 90° change of longitude is also 45°. The angle between the Great Circle and the Rhumb Line is Conversion angle, which is ½ ch long x sin mean latitude - ½ x 90 x 0.9397 = 42.3°.
Difference between straight line and Great Circle = 45° - 42.3° = 2.7°.
Therefore, at 70N, even in the worst case (90° change of longitude) there is less than 3° difference between the straight line and the Great Circle. This shows that the difference between a straight line and a Great Circle becomes smaller as the latitude increases.
With any other change of longitude at 70N, the difference will be even smaller, falling to zero for a track directly over the pole. A straight line may be taken to be a Great Circle on a Polar stereographic chart at latitudes greater than 70°.
USES OF A POLAR STEREOGRAPHIC CHART
The chart is used mainly for plotting in Polar regions. Grid and gyro steering technique is usually used as well, not only because of the projections but also because of proximity to North Magnetic Pole.
Some Meteorological charts are on this projection or on a modified polar stereographic.
The chart is also used for planning purposes (shows the Pole and Equator if desired).

388
Chapter 23 The Polar Stereographic Chart
SUMMARY
PROPERTIES OF A POLAR STEREOGRAPHIC CHART
Scale
Correct at Pole.Elsewhere expands as sec2 (½ co- latitude)Within 1% from latitudes 90° to 78°.Within 3% from latitudes 78° to 70°.
Orthomorphic Yes. All charts used for navigation must be.
Graticule Meridians are straight lines radiating from the Pole.Parallels are concentric circles drawn from the pole.
Shapes Become more distorted as distance increases from the Pole.
Chart Convergence
Correct at the Pole.Constant across the chart.Convergence = change of longitude‘n’ = 1
Rhumb Lines Curves concave to the nearer Pole.
Great Circles
Curves concave to the nearer Pole, butwith less curvature than Rhumb Lines.Can be taken as straight lines at latitudes greater than 70°.

389
Chapter 23The Polar Stereographic Chart
STRAIGHT-LINE TRACK PROBLEMS
Example 1: What is the initial straight-line from A (75N 60W) to B (75N 60E) on PolarStereographic chart?
a. 090°T) b. 030°(T) c. 120°(T) d. 330°(T)
Answer: Start by drawing a diagram of the situation.
The ‘n’ factor of a Polar Stereographic chart is 1 - meridians which are 1 degree apart in longitude will have an angle of inclination to each other of 1 degree. As the longitude of A is 60W and the longitude of B is 60E, meridians A and B are inclined to each other at 120°.
We also know that A and B are both at latitude 75N. Therefore the co-latitude in each case is 15°, i.e. the distance from the pole to A is the same as the distance from the pole to B. So we have an isosceles triangle.
Fig 24.6 Polar Stereo situationFigure 23.6 Polar Stereo situation
The internal angles of a triangle must add up to 180°. If 120 of them are at the apex, that leaves 60 of them to be split equally at B (it’s an isosceles triangle, remember). So angles A and B are both 30°.
Now the direction from A (or any other point on the Earth’s surface, for that matter) to the North Pole is due north, 000°(T). Therefore the direction from A to B is 030°(T). The answer is (b).
Although the question didn’t ask it, we can also work out the straight line track angle from B to A. In this case, the direction from B to the North Pole is also 000°(T), also known as 360°(T) and the direction from B to A is 30° left of 360°(T), so it must be 330°(T).

390
Chapter 23 The Polar Stereographic Chart
If the track angle from B to A is 330°(T) at B, going back to A, then it must be the reciprocal, 150°(T), going from A to B as it passes over B. In other words, the straight-line track A to B starts with a track angle of 030°(T) and finishes on a track angle of 150°(T). We have shown from the geometry of the triangle that the track angle increases by 120°. We should expect this - the chart convergence from A to B is 120°, due to the longitude change of 120° and the ‘n’ factor of 1.
There is another way of solving this problem - by use of the Rhumb Line. If latitude A is 75N and latitude B is 75N then the Rhumb Line track between them is the parallel of latitude of 75N and therefore must have a Rhumb Line track of 090°(T).
The chart convergence between 60W and 60E is 120°. Therefore half chart convergence is 60°. This is the difference between the Rhumb Line and the straight line. Therefore 60° anti-clockwise from the Rhumb Line track of 090°(T) gives us an initial straight-line track of 030°(T).
Fig 24.7 Polar Stereo situation - Rhumb Line trackFigure 23.7 Polar Stereo situation - Rhumb Line track
The same method would work for finding the track from B to A, measured at B. At B, the Rhumb Line track to A is 270°(T). Sixty degrees clockwise from 270°(T) is 330°(T).

391
Chapter 23The Polar Stereographic Chart
Example 2: At what longitude does the straight- line track from A (70N 40W) to B (70N 80E) on a Polar Stereographic chart reach its highest latitude?
a. 040W b. 030W c. 020E d. 040E
Answer: Start by drawing a diagram of the situation.
Fig 24.8 Polar Stereo situationFigure 23.8 Polar Stereo situation
The highest latitude occurs at the shortest co-latitude distance, i.e. the shortest distance from the Pole. This shortest distance to the Pole must be when the line between the Pole and the track is at right angles to the track, as in Figure 23.9.
This must occur at mid-meridian - at 020E.
Answer (c).
Fig 24.9 Right angles to trackFigure 23.9 Right angles to track

392
Chapter 23 The Polar Stereographic Chart
Example 3: On a Polar Stereographic map, a line is drawn from position A (70N 102W) to position B (80N 006E). The point of highest latitude along this line occurs at 035W. What is the initial straight-line track angle from A to B, measured at A?
a. 049°(T) b. 077°(T) c. 229°(T) d. 023°(T)
Again, start by drawing a diagram:
This is clearly a new sort of problem, because A and B are at different latitudes. There appears to be no isosceles triangle or right-angled triangle.
Fig 24.10Figure 23.10
However, we have not used all the information in the question yet. The point of highest latitude must have some significance otherwise presumably the examiner wouldn’t have mentioned it. So let’s draw that in:
Now we have a right-angled triangle, between A, the North Pole, and the point of highest latitude. Angle b is the difference between 035W and 102W, so it is 67°. Angle c is 90°. The internal angles of a triangle must add up to 180°. So angle a must be 23°.
Answer ‘d’.
Fig 24.11Figure 23.11

393
Chapter 24Transverse and Oblique Mercator Charts
CHAPTER TWENTY FOUR
TRANSVERSE AND OBLIQUE MERCATOR CHARTS
Contents
TRANSVERSE MERCATOR . . . . . . . . . . . . . . . . . . . . . . . . . . . . . . . . .395
USES OF A TRANSVERSE MERCATOR PROJECTION . . . . . . . . . . . . . . . . . .397
PROPERTIES OF A TRANSVERSE MERCATOR CHART . . . . . . . . . . . . . . . .398
SUMMARY OF PROPERTIES OF THE TRANSVERSE MERCATOR . . . . . . . . . .399
GREATER VERSATILTY OF TRANSVERSE MERCATOR . . . . . . . . . . . . . . . .399
OBLIQUE MERCATOR . . . . . . . . . . . . . . . . . . . . . . . . . . . . . . . . . . . .400
USES OF THE OBLIQUE MERCATOR CHART . . . . . . . . . . . . . . . . . . . . . .402
OBLIQUE MERCATOR GRATICULE . . . . . . . . . . . . . . . . . . . . . . . . . . . .403
PROPERTIES OF OBLIQUE MERCATOR. . . . . . . . . . . . . . . . . . . . . . . . . .403
SUMMARY OF CHARTS . . . . . . . . . . . . . . . . . . . . . . . . . . . . . . . . . . .404
SUMMARY OF CHARTS . . . . . . . . . . . . . . . . . . . . . . . . . . . . . . . . . . .405
QUESTIONS . . . . . . . . . . . . . . . . . . . . . . . . . . . . . . . . . . . . . . . . . .406
ANSWERS . . . . . . . . . . . . . . . . . . . . . . . . . . . . . . . . . . . . . . . . . . .406

394
Chapter 24 Transverse and Oblique Mercator Charts

395
Chapter 24Transverse and Oblique Mercator Charts
TRANSVERSE MERCATOR
We have covered the Normal (or Direct) Mercator previously. Over most of the Earth, it suffers from the problem of excessive scale expansion.
However, out to 80N or S from the Equator, the scale expansion was within 1% of the scale at the Equator. This gave us a strip, 480 nm each side of the Equator - 960 nm in total, within which the scale could be regarded as constant.
Figure 24.1 Normal or Direct Mercator
The problem with this is that there are not many routes which require us to fly along a parallel of latitude fairly near to the Equator. Perhaps Libreville to Kampala, but that’s about all.
Figure 24.2 Mercator 1% Scale Error Band
However, if we wrap the cylinder round the Reduced Earth horizontally, we get Figure 24.3
Figure 25.3. Transverse MercatorFigure 24.3 Transverse Mercator
Figure 25.1. Normal or Direct Mercator
Fig 25.2 Mercator 1% Scale Error Band

396
Chapter 24 Transverse and Oblique Mercator Charts
This will now give us a projection which contains a vertical band of constant scale. This is far more useful - there are many such routes - Cairo to Johannesburg, for instance, but many others as well. It is also useful for mapping countries which have a long N/S extent but a shorter E/W extent - such as the UK.
Fig 25.4 Vertical Constant Scale BandFigure 24.4 Vertical Constant Scale Band
The Transverse Mercator is a mathematical projection and its projection principle is shown in Figure 24.5
Figure 24.5. The Transverse Mercator Projection.Figure 24.5 The Transverse Mercator Projection
As with the Mercator, a cylinder is used as the developable surface. The cylinder is so positioned that it touches the Earth along a meridian (meridian of tangency) called the Datum or central meridian. (On a normal Mercator the Equator was the parallel of tangency). The light source is positioned in the Earth’s centre.
As with the Mercator projection, a mathematical modification is necessary before orthomorphism is achieved.
This produces a graticule (mathematically modified) whose appearance can be seen in Figure 25.6. The meridian of tangency and the meridian at 90° to it appear as straight lines in this graticule. All other meridians appear as complex curves.

397
Chapter 24Transverse and Oblique Mercator Charts
Figure 25.6. Transverse Mercator Graticule.Figure 24.6 Transverse Mercator Graticule
USES OF A TRANSVERSE MERCATOR PROJECTION
The Transverse Mercator has 3 main uses:
Mapping countries with a long N/S extent but a smaller E/W extent - particularly large-scale charts. The UK Ordnance Survey series uses the Transverse Mercator projec-tion.
Flying routes with a large N/S extent but a smaller E/W extent .
Polar charts . The TM is almost as good as a Polar Stereo for Polar flying. In fact, over the right meridians, it gives a greater distance of constant scale.

398
Chapter 24 Transverse and Oblique Mercator Charts
PROPERTIES OF A TRANSVERSE MERCATOR CHART
Parallels close to the Pole appear almost as circles, becoming ellipses, more and more elongated until the Equator, if it is shown, becomes a straight line, in two parts (meeting at infinity).
The two points on the equator, 90° of ch long removed from the meridian of tangency cannot be shown on this projection.
The scale expands away from the meridian of tangency (at the rate of sec (Great Circle dist)). Distortion, similar in nature to the Mercator projection exists. The scale is, of course, correct along the meridian of tangency.
The convergence of the meridians on the projection is the same as the Earth convergency at the Poles (both of which can be shown) and at the Equator, but not elsewhere.
The Great Circle is generally a complex curve. The only exceptions are the meridian of tangency, the meridian at 90° to it, and the Equator, which all appear as straight lines. Great Circles perpendicular to the Datum meridians are also straight lines.
The Rhumb lines are also complex curves, but the meridian of tangency, the meridian at 90° to it and the Equator, being Great Circles as well as Rhumb Lines, are equally exceptions. Meridians and parallels cross at right angles and shapes and areas are distorted.
The suitability of this projection stems from the fact that any distortion is small in a band 480 nm on either side of the datum meridian.
The scale there can be taken as correct and constant and Great Circles will be shown, for all practical purposes, as straight lines.

399
Chapter 24Transverse and Oblique Mercator Charts
SUMMARY OF PROPERTIES OF THE TRANSVERSE MERCATOR
PROPERTIES OF A TRANSVERSE MERCATOR CHART
Scale Correct Along Datum Meridian. Elsewhere expands as sec (Great Circle Distance E / W)
Orthomorphic Yes. All charts used for navigation must be
Graticule
Datum meridian, meridian perpendicular to it and the Equator are straight lines. Other meridians are complex curves. Parallels are ellipses (Equator is straight lines - limiting case of ellipse)
Shapes Distorted away from Datum Meridian
Chart Convergence Correct at the Pole and Equator
Rhumb lines Complex curves except Datum Meridian, meridian perpendicular to it and the Equator
Great CirclesComplex curves except Datum Meridian, meridian perpendicular to it, Equator and Great Circles perpendicular to the Datum Meridian
GREATER VERSATILTY OF TRANSVERSE MERCATOR
One of the problems with the Normal or Direct Mercator was that the constant-scale area was limited to a band 960 nm wide, 480 nm either side of the Equator. Whilst we are also limited to 480 nm either side of the Datum Meridian on the Transverse Mercator, this is less of a problem. There is only one parallel of latitude which is a Great Circle, whereas there are an infinite number of meridians (and their corresponding anti-meridians) which can be used for the datum Great Circle.
Therefore, if a flight involves a departure of more than 480 nm E/W from the Datum Meridian, we simply change chart to another Transverse Mercator which uses a different Datum Meridian. By changing charts we can fly all the way round the Earth if necessary in an E/W sense using Transverse Mercators. You cannot do this N/S with the Direct Mercator.

400
Chapter 24 Transverse and Oblique Mercator Charts
OBLIQUE MERCATOR
However, there is better way. Suppose you wish to fly from London to Nairobi:
Fig 25.8 London - NairobiFigure 24.7 London - Nairobi
The shortest route between these 2 points is the Great Circle joining them.
Fig 25.9 Connecting Great CircleFigure 24.8 Connecting Great Circle
If the Great Circle route between two points is chosen as the Great Circle of tangency, and the cylinder is wrapped round this, an Oblique Mercator projection results:

401
Chapter 24Transverse and Oblique Mercator Charts
Figure 25.10. Oblique MercatorFigure 24.9 Oblique Mercator
This new Great Circle of tangency (which is often referred to as the ‘False Equator’) will have correct scale all along its length, and will be within 1% out to 480 nm either side of the centreline. This gives a strip of constant scale which is effectively 1000 nm wide and of length which can include the whole of the Earth’s circumference. The Great Circle is a straight line, and any other Great Circle within the cover of the map is, for all practical purposes, also a straight line.
Fig 25.11 ‘False Equator’ stripFigure 24.10 ‘False Equator’ strip
If we take the ‘False Equator’ strip and lay it flat:
Fig 25.12 ‘False Equator’ strip laid flatFigure 24.11 ‘False Equator’ strip laid flat
......then cut it up into usefully-sized segments for a convenient chart:

402
Chapter 24 Transverse and Oblique Mercator Charts
Fig 25.13 Oblique Mercator single sheetFigure 24.12 Oblique Mercator single sheet
......we get a sheet with the False Equator along the centreline, less than 1% scale error anywhere on the chart (provided the scale chosen gives sides which are not more than 480 nm away from the centre), on which straight lines may be taken to be Great Circles.
This has virtually all the advantages we require and almost no drawbacks (calculation of chart convergence is complex, but it is not usually needed). For this reason, use of the Oblique Mercator is becoming more common. Jeppesen still use mainly Lambert projections but nearly all AERAD en route charts are now Oblique Mercator projections.
USES OF THE OBLIQUE MERCATOR CHART
The main use of the Oblique Mercator chart is for flying specific Great Circle routes. However, it also makes a very good general purpose en route chart, plotting chart or radio navigation chart.

403
Chapter 24Transverse and Oblique Mercator Charts
OBLIQUE MERCATOR GRATICULE
The graticule looks like this:-
Fig 25.14 Graticule of Oblique MercatorFigure 24.13 Graticule of Oblique MercatorIt may not look it, but it is in fact orthomorphic. The actual relationship of the lat/long graticule to the Great Circle of tangency - the so-called ‘False Equator’ - will vary according to the choice of False Equator, but the general pattern is as in Figure 24.13.
PROPERTIES OF OBLIQUE MERCATOR
Graticule As above - see Figure 24.13
Scale Expands as secant of Great Circle distance from Great Circle of Tangency
Convergence Correct along Great Circle of Tangency, Poles and Equator
Rhumb Lines Complex curves
Great Circles Complex curves, but may be taken as straight lines close to Great Circle of Tangency

404
Chapter 24 Transverse and Oblique Mercator Charts
SUMMARY OF CHARTS
Cha
rtG
ratic
ule
Scal
eC
onve
rgen
cyRh
umb
Line
sG
reat
Cir
cles
Mer
cato
r(C
ylin
dric
al)
Cyl
inde
r tou
ches
redu
ced
eart
h at
0N
/S
Rect
angu
lar g
ratic
ule
Mer
idia
ns :
//
stra
ight
lines
equ
ally
spa
ced.
//
s of
la
titu
de
are
uneq
ually
sp
aced
//
stra
ight
lin
es,
spac
ing
incr
easi
ng
away
fr
omth
e eq
uato
r.
Cor
rect
at
Eq
uato
r.Ex
pand
s aw
ay
from
equa
tor a
s:
Sec.
Lat
.
1% =
app
rox
80
( 4
80/5
00nm
s)
% =
app
rox
60
(
350
/360
nms)
Cor
rect
at
equa
tor.
At
all o
ther
latit
udes
, cha
rtco
nv(0
) is
le
ss
than
eart
h co
nv.
CA
= ½
Ear
th C
onv
Stra
ight
Lin
esEx
cept
for
equ
ator
and
mer
idia
ns
whi
ch
are
stra
ight
lin
es,
grea
tci
rcle
s ar
e cu
rves
conv
ex
to
the
near
erPo
le
(con
cave
to
th
eEq
uato
r).
Lam
bert
s C
onfo
rmal
(Con
ical
)C
one
touc
hes
redu
ced
eart
h at
//or
igin
.
Con
verg
ent g
ratic
ule
Mer
idia
ns: S
trai
ght l
ines
conv
ergi
ng to
war
ds th
epo
le o
f th
e pr
ojec
tion.
//s o
f Lat
: arc
s of c
ircl
esw
ith c
entr
e at
pol
e of
proj
ectio
n.
Cor
rect
at
St
d //s
.Ex
pand
s ou
tsid
e st
d //s
cont
ract
s be
twee
n st
d//s
. Min
imum
at /
/ori
gin.
n =s
in //
orig
in
Cor
rect
at /
/ori
gin
Cha
rt c
onve
rgen
ce=
Ch.
Long
x S
in //
orig
in
Exce
pt m
erid
ians
, ar
ecu
rves
con
cave
to p
ole
of th
e pr
ojec
tion.
Exce
pt m
erid
ians
, ar
ecu
rves
co
ncav
e to
//ori
gin
Are
clo
sest
to
stra
ight
line
s at
//or
igin
.
Pola
r Ste
reog
raph
ic(A
zim
utha
l)Fl
at
plat
e to
uche
sre
duce
d ea
rth
at p
ole.
Cir
cula
r gra
ticul
e
Mer
idia
ns:
- st
raig
htlin
es
radi
atin
g fr
ompo
le.
//s
of
lat.
-
circ
les
cent
red
on p
ole s
paci
ngin
crea
sing
aw
ay
from
the
pole
.
Co
rrec
t at
p
ole
,ex
pand
s aw
ay fr
om th
epo
le a
s:
Sec
2 ½
Co-
Lat
Cor
rect
at p
ole.
At a
ll po
ints
on
char
t:
Con
v =
Ch.
Long
Exce
pt
for
mer
idia
nsar
e cu
rves
con
cave
to
the
pole
.
Exce
pt m
erid
ians
, ar
ecu
rves
conc
ave
to p
ole.
Clo
se t
o po
le m
ay b
eco
nsid
ered
as
stra
ight
line
s fo
r p
ract
ical
plot
ting
purp
oses
.
1 / 2
N/S
0

405
Chapter 24Transverse and Oblique Mercator Charts
Ch
art
Gra
tic
ule
Sc
ale
Co
nve
rge
nc
yR
hu
mb
Lin
es
Gre
at
Cir
cle
s
Tra
ns
ve
rse
Me
rca
tor
(Cylin
dri
ca
l)
Cy
lin
de
r
tou
ch
es
red
uc
ed
e
art
h
at
se
lecte
d m
eri
dia
n.
(D
at
um
/C
en
tr
al
me
rid
ian
)
Co
mp
lex g
raticu
le.
Da
tum
m
erid
ian
a
nd
me
rid
ian
s a
t 9
0E
to
DM
are
str
aig
ht
line
s,
as i
s
eq
ua
tor.
O
the
r M
erid
s
are
co
mp
lex c
urv
es.
//s
of
La
t e
xce
pt
eq
ua
tor
are
elli
pse
s.
UK
Ord
na
nc
e S
urv
ey
Co
rre
ct
at
da
tum
me
rid
ian
. E
xp
an
ds
aw
ay fro
m D
M a
s:
Se
ca
nt
of
gre
at
cir
cle
dis
t fr
om
D
atu
m
Me
rid
.
an
d 1
:25
0,0
00
Ch
art
s
Co
rre
ct
at
eq
ua
tor
an
d
po
les
. O
the
rw
ise
co
mp
lex.
us
e t
his
pro
jec
tio
n
Exce
pt d
atu
m m
erid
ian
,
me
rid
ian
at
90
E t
o D
M
an
d
eq
ua
tor,
co
mp
lex
cu
rve
s.
Co
mp
lex c
urv
es e
xce
pt:
Da
tum
m
erid
ian
,
Eq
ua
tor a
nd
me
rid
ian
at
90
0 to D
M.
Clo
se
to
D
M
ma
y
be
take
n a
s s
tra
igh
t lin
es.
An
y s
tra
igh
t lin
e a
t rig
ht
an
gle
s t
o D
M is a
gre
at
cir
cle
Ob
liq
ue
Me
rca
tor
(Cylin
dri
ca
l)
Cylin
de
r to
uch
es r
ed
uce
d e
art
h a
lon
g a
se
lecte
d
gre
at circle
ro
ute
. (T
he
gre
at circle
of ta
ng
en
cy)
Co
mp
lex g
raticu
le
Co
rre
ct a
t g
rea
t cir
cle
of
tan
ge
ncy. E
xp
an
ds a
s:
Se
ca
nt
of
gre
at
cir
cle
dis
tan
ce
fr
om
g
rea
t
cir
cle
of
tan
ge
nc
y.
With
in a
bo
ut
50
0 n
m o
f
gre
at
circle
of
tan
ge
ncy
ma
y
be
u
se
d
as
a
co
nsta
nt
sca
le
ch
art
(
1%
).
Co
rre
ct
alo
ng
th
e g
rea
t
circle
o
f ta
ng
en
cy,
at
the
p
ole
s
an
d
at
the
eq
ua
tor
Co
mp
lex c
urv
es
Co
mp
lex
cu
rve
s b
ut
clo
se
to
gre
at
cir
cle
of
tan
ge
ncy m
ay b
e t
ake
n
as s
tra
igh
t lin
es.
All
of
the
ab
ov
e c
ha
rts
are
ort
ho
mo
rph
ic p
roje
cti
on
s
SUMMARY OF CHARTS

406
Transverse and Oblique Mercator ChartsChapter 24
QUESTIONS
1. Convergence on a Transverse Mercator chart is correct at:
a. the datum meridian onlyb. the datum meridian and the Equatorc. the Equator and the Polesd. the Parallel of Origin
2. Where is scale correct on a Transverse Mercator chart?
a. along the great Circle of Tangencyb. at the Poles and the Equatorc. along the Datum Meridian and at meridians at 900 to itd. at the Greenwich meridian
3. What is the main use of a Transverse Mercator chart?
a. flying a specified Great Circle routeb. flying an equatorial routec. mapping countries with a large N/S extent but a lesser E/W extentd. mapping countries with a large E/W extent but a lesser N/S extent
4. What is the main use of an Oblique Mercator chart?
a. flying a specified Great Circle routeb. flying an equatorial routec. mapping countries with a large N/S extent but a lesser E/W extentd. mapping countries with a large E/W extent but a lesser N/S extent
ANSWERS
1. C
2. A
3. C
4. A

407
Chapter 25Time (1)
CHAPTER TWENTY FIVE
TIME (1)
Contents
TIME GENERAL . . . . . . . . . . . . . . . . . . . . . . . . . . . . . . . . . . . . . . . .409
TIME BASICS . . . . . . . . . . . . . . . . . . . . . . . . . . . . . . . . . . . . . . . . . .409
SOLAR SYSTEM - PLANETARY ORBITS - KEPLER’S LAWS . . . . . . . . . . . . . .409
THE SEASONS . . . . . . . . . . . . . . . . . . . . . . . . . . . . . . . . . . . . . . . . .411
MEASUREMENT OF DAYS AND YEARS . . . . . . . . . . . . . . . . . . . . . . . . .414
QUESTIONS . . . . . . . . . . . . . . . . . . . . . . . . . . . . . . . . . . . . . . . . . .417
ANSWERS . . . . . . . . . . . . . . . . . . . . . . . . . . . . . . . . . . . . . . . . . . .420

408
Chapter 25 Time (1)

409
Chapter 25Time (1)
TIME GENERAL
Why do pilots need to study time? There are 2 main applications:
You should know why different countries keep different times and how to find what the standard time is in any country you may land in. Most laymen (and some pilots when using the Public Address to passengers) call this the ‘local time’, but the correct term is ‘Standard Time’.
You need to be able to work out when it gets dark in different parts of the world at different times of the year (or when it gets light in the morning), especially if the airport of destination does not have airfield lighting.
TIME BASICS
Our measures of time are based on the Earth’s rotation about its own axis, the Earth’s rotation around the Sun, and the movement of the solar system in our galaxy and the movement our galaxy in the Universe. We therefore need to know something about elementary astronomy.
SOLAR SYSTEM - PLANETARY ORBITS - KEPLER’S LAWS
The Solar System consists of the sun and major planets (of which the Earth is one).
Planetary orbits (and therefore the Earth’s orbit) are governed by Kepler’s laws of planetary motion which are:
The orbit of each planet is an ellipse with the sun at one of the foci.
The line joining the planet to the sun, known as the radius vector, sweeps out equal areas in equal time.
The square of the sidereal period of a planet is proportional to the cube of its mean distance from the sun.
The important laws (a) and (b) are illustrated in the following diagram:
Figure 26.1 Kepler’s Laws
Figure 25.1 Kepler’s Laws

410
Chapter 25 Time (1)
Kepler’s First LawA planet travels around the Sun in an elliptical orbit as shown. The Sun is at one of the foci, F1, of the ellipse as indicated (the second focal point is shown at F2 but may be ignored). Because of its elliptical orbit, the planet will be at its closest point at P, known as ‘perihelion’ (Greek peri-near, helios - sun). At position A, the planet is at a point furthest from the Sun known as ‘aphelion’. Perihelion occurs in early January (approx 4th). Aphelion occurs in early July (approx 4th).
Kepler’s Second LawAt position B, the planet approaches ‘aphelion’ (A) and the radius vector SB will sweep out the area SBA in the time between B and A. However, a corresponding situation at Q as the planet approaches ‘perihelion’ (P) requires the radius vector SQ (which is shorter than SB) to move faster than SB to ensure that the area SQP has the same area as SBA. Thus the planet moves faster around its orbit near perihelion than it travels around its orbit near aphelion.
In summary, in an elliptical planetary orbit, the orbital speed is fastest at perihelion and slowest at aphelion.
The Earth’s orbital situation is viewed from the North Celestial Pole (NCP), i.e. the point in the sky directly above geographic North Pole, is illustrated in Figure 25.2.
Figure 26.2 Earth Orbit 1Figure 25.2 Earth Orbit
Notes: The earth rotates about its geographic N/S axis in an anti-clockwise direction when viewed from the NCP. This rotation determines our measurement of a ‘day’, (to be discussed later.)
The Earth orbits the Sun in an anti-clockwise direction when viewed from the NCP. The orbital period determines our measurement of a ‘year’. The changing orbital speed affects our measurements of a day (to be discussed later).

411
Chapter 25Time (1)
THE SEASONS
It is a common misconception that the changes of seasons are governed by the Earth’s distance from the Sun. This is not true. As the Sun’s heat is transmitted radially, the effect of the distance change between 91.4 million statute miles at perihelion and 94.6 million statute miles at aphelion would only be to change the amount of heat received by the Earth by about 3%, not enough to explain the marked changes between the summer and winter.
The predominant cause of the Seasons is the inclination (tilt) of the earth. The Earth’s axis is inclined (tilted) at an angle of 66.5° to its orbital plane and this is often stated as 23.5° to the normal to the orbital plane (90°- 66.5° = 23.5°).
Figure 26.3 The Earth’s OrbitFigure 25.3 The Earth’s Orbit
Adding the inclination of the Earth to a diagram of the Earth’s orbit as in the figures below illustrates the annual seasonal changes.
Summer Solstice (June 21)
Sun over 23.5 N
Autumn Equinox (Sept 21)
Sun over Equator
Winter Solstice (Dec 21)
Sun over 23.5 S
Spring (Vernal) Equinox (March 21)
Sun over Equator
Figure 26.4 The SeasonsFigure 25.4 The Seasons

412
Chapter 25 Time (1)
The sun appears vertically above 23½°S on the 21st of December. This is known as:-
NH - Winter Solstice SH - Summer Solstice
The sun will appear above 23½°N on the 21st of June at the:-
NH - Summer Solstice SH - Winter Solstice
The sun crosses the equator from South to North on about 21st March. This is known as:-
NH - Spring Equinox SH - Autumn Equinox
Six months later it crosses the equator from North to South on about 21st September.
NH - Autumn Equinox SH - Spring Equinox
During the period of one day the sun appears to move along a parallel of latitude from East to West.
A simplified diagram is given below for definition purposes.
Figure 26.5 Earth’s Orbit (side view)Figure 25.5 Earth’s Orbit (side view)
In the diagram above, the plane of the Earth’s orbit around the sun is labeled the ‘Plane of the Ecliptic’. This is an adequate definition although some textbooks refer to the Ecliptic as the plane of the annual path of the Sun.
The plane of the equator is called the ‘Plane of the Equinoctial’. (equal day/night but see later).

413
Chapter 25Time (1)
The Plane of the Ecliptic and the Plane of the Equator are inclined to each other at an angle of 23.5°. (This angle is called the obliquity of the ecliptic).
At a given time of year, the angle that the Sun is above or below the equator determines the season and affects the length of daylight/night. The angle is known as DECLINATION. Declination is analogous in the sky to latitude on the Earth.
The Sun’s declination changes annually between 23.5°N (Sun overhead the tropic of Cancer) through 0° (Sun overhead the Equator) to 23.5°S (Sun overhead the Tropic of Capricorn) and then back through 0° to 23.5°N. The annual cycle of the Sun’s declination is illustrated in the diagram below.
Figure 26.6 Declination of the Sun
Figure 25.6 Declination of the Sun
The declination of the Sun may be considered to follow a sine wave with its peak amplitude being 23.5° and its cyclic period being one ‘year’.
You may notice that the dates of the solstices and equinoxes may be quoted in some textbooks as about 21st, 22nd, of the appropriate month. This occurs simply because the precise date depends on the relationship between the year considered and the leap year cycle. Students are not expected to be able to calculate the precise date of these solar events.
The length of daylight/night at a given latitude varies with the declination of the Sun. The rate of change of the length of daylight will therefore be greatest when the rate of change of declination is greatest. The diagram shows that this situation occurs at the equinoxes (about Mar 21 and Sep 21).
The above situation is not true in several special cases, which will be discussed later. These are when the latitude considered is either the Equator or is above 66°N/S.

414
Chapter 25 Time (1)
MEASUREMENT OF DAYS AND YEARS
A ‘day’ may be defined as the length of time taken for the Earth to rotate once about its axis measured against a celestial body, (the Sun or a star). Measurements against a star are called ‘sidereal’ and against the Sun are called ‘solar’.
‘Civil’ DayA ‘civil’ day should be:
Related to periods of light and darkness so that1200 hrs is always about halfway be- tween sunrise and sunset. The civil day should therefore be based on the Sun.
Of a constant length.
Sidereal DayA Sidereal Day is measured against a distant star and is of nearly constant length. However, it is not related to light and dark and is not suitable as a civil day.
Apparent Solar DayAn apparent Solar Day is measured against the real or apparent Sun (the one that ‘appears’ to you). However, using the apparent (real) Sun introduces the problem of the Apparent Solar Day not being a constant length.
Consider the situation including the Earth’s orbit around the Sun, illustrated in the diagram below showing the Earth’s orbit viewed from the North Celestial Pole (NCP). The NCP is an imaginary point at a distance along the continuation of the earth’s axis from the S pole to the N pole projected out into space.
Figure 26.7 Sidereal Day/Apparent Solar DayFigure 25.7 Sidereal Day/Apparent Solar Day
Consider the Earth at position A but in a solar system where the earth was stationary. An observer at position Z would have the Sun and a distant star directly over his meridian. After one complete anti-clockwise rotation of the Earth, the Sun and the star would be over the observer’s meridian again. The apparent solar day and the sidereal day (based on the star) would be equal. This is a false situation.

415
Chapter 25Time (1)
In the period of one 360° revolution, the Earth travels around its orbit to position B. After a 360° revolution, the distant star is again over the observer’s meridian (a sidereal day) but an additional rotation and further orbit to position C is needed put the Sun again over the observer’s meridian. Thus:
An apparent solar day is longer than a sidereal day.
But, as stated before, the Earth’s orbital speed changes throughout the year.Thus, an Apparent Solar Day cannot be of constant length.
Mean Solar DayThe Mean Solar Day is the average length of an apparent solar day (averaged over the year).
It is of constant length and related to light and darkness; it is used as the ‘civil’ day and is divided into hours, minutes and seconds of ‘mean’ time.
It is sometimes helpful to think of the Sun traveling westwards around the Earth rather than the earth spinning eastwards. In the case of mean time, we consider the mean (average) Sun circling the earth every 24 hours. This is the basis of Local Mean Time (LMT).
The maximum difference between Mean Time and apparent (real) sun time is about 16 minutes and occurs in mid-November. A second maximum occurs in mid-February at about 14 minutes difference. In between these maxima, the difference reduces. The difference is known as the Equation of Time.
Fig 26.8 The Equation of TimeFigure 25.8 The Equation of Time
In November, the real Sun crosses an observer’s meridian at 1144 whereas the mean sun crosses the meridian 16 minutes later at 1200 LMT (by definition).
In February, the real sun crosses a meridian at 1214 whereas the mean sun crosses 14 minutes earlier at 1200 LMT (by definition).

416
Chapter 25 Time (1)
A Sidereal Year is the time taken by the Earth to complete an orbit of the Sun measured against a distant star. Its length is 365 days 6 hrs.
A Tropical Year (an apparent solar year) is the length of one cycle of the seasons. Its length is 365 days, 5 hrs and 48.75 minutes.
A Calendar Year is normally 365 days. It is kept in step with the tropical year by adding a day every 4th year, a ‘leap’ year. A fine adjustment is made on 3 occasions every 400 years. (At a centennial, when the first 2 numbers of the century are not divisible by 4, the leap year is omitted.)
Hour AngleThe Declination of a celestial body (in our case, the Sun) has been shown to be similar (analogous) to latitude. In the same way, Hour Angle can be shown to be analogous to longitude.
The Earth spins in an easterly direction, 360° in every 24 hours. Thus, a celestial body (the Sun or a star) will transit across a given meridian at 24 hour intervals. It is convenient to simplify this situation by considering that the celestial bodies circle the Earth in westerly directions. The sun rises in the East and travels in a westerly direction to set in the West and continues westerly to eventually rise again in the East.
The Hour Angle of a celestial body is defined as the arc of the Equator (equinoctial) intercepted between the meridian of a datum and the meridian of the body, measured westwards from 0° to 360°.
Thus when a celestial body transits a given meridian, its Hour Angle is 000°. When the body transits the anti-meridian, its Hour Angle is 180°. If the given meridian is Greenwich, the Hour Angle is known as the Greenwich Hour Angle (GHA) which is directly analogous to longitude. A body with a GHA of 050° will be transiting the 050W meridian. A body with a GHA of 180° will be transiting the 180W meridian. But a body with a GHA of 270° will be transiting the 270W meridian, or the 090E meridian.
Figure 26.9 Local Hour Angle/Greenwich Hour AngleFigure 25.9 Local Hour Angle/Greenwich Hour Angle

417
Chapter 25Time (1)
QUESTIONS
1. When does perihelion occur?
a. early Januaryb. mid Marchc. early Julyd. September 21
2. When does aphelion occur?
a. early Januaryb. mid Marchc. early Julyd. September 21
3. Viewed from the North Celestial Pole (above the North Pole), the Earth orbits the Sun:
a. clockwise in a circular orbitb. anti-clockwise in a circular orbit c. clockwise in an elliptical orbitd. anti-clockwise in an elliptical orbit
4. When do ‘equinoxes’ occur?
a. December and Juneb. February and Novemberc. March and Septemberd. January and July
5. When it is the Winter Solstice in the Southern Hemisphere, the Declination of the Sun is:
a. 0°N/S b. 23½°N c. 66½°N d. 23½°S
6. In the situation given above in Question 5, the sun will be overhead:
a. the Arctic Circleb. the Tropic of Capricornc. the Equatord. the Tropic of Cancer
7. What is the angle between the Equinoctial and the Ecliptic?
a. 66½°b. 23½°c. varies between 23½°N and 23½°Sd. varies between 66½°N and 66½°S

418
Time (1)Chapter 25
8. The Declination of a celestial body (the Sun) measured on the Celestial Sphere is analogous (equivalent) to ________________ on the Earth?
a. latitude b. longitudec. altitude of the body measured from the sensible horizon d. co-latitude
9. ‘The length of daylight/night depends upon the declination of the Sun and the latitude of the observer’. When is the rate of change of the length of daylight greatest?
a. February/November b. January/Julyc. at the Equinoxes d. at the Solstices
10. A sidereal day is?
a. longer than an apparent solar dayb. longer than a real solar dayc. shorter than an apparent solar dayd. equal to a real solar day
11. The maximum difference between mean noon (1200LMT) and real/apparent noon occurs in ________?
a. January/Julyb. March/Septemberc. November/February d. December/June
12. The maximum difference between Mean Time and Apparent Time is:
a. 21 minutes b. 16 minutes c. 30 minutesd. there is no difference
13. What is the length of a Sidereal Year?
a. 365 daysb. 366 daysc. 365 days 6 hrsd. 365 days 5 hrs 48.75 minutes
14. ‘The Calendar Year and the Tropical Year are of different lengths. The difference is adjusted partly by using leap years every fourth calendar year. However, some years are not designated as leap years’. Which of the following years will be a leap year?
a. 2001b. 2100 c. 2300d. 2400

419
Chapter 25Time (1)
15. The Hour Angle (Greenwich Hour Angle) of a celestial body is analogous/equivalent on the Earth to ________?
a. latitude b. longitudec. co-latituded. UTC
16. A star has a Greenwich Hour Angle (GHA) of 220°. Which meridian is the star transitting (crossing)?
a. 040W b. 040E c. 140W d. 140E

420
Time (1)Chapter 25
ANSWERS
1 A (Figure 25.2)
2 C (Figure 25.2)
3 D
4 C (Figure 25.4)
5 B
6 D
7 B
8 A
9 C
10 C
11 C
12 B
13 C
14 D
15 B
16 D (Figure 25.8)
421
Chapter 26Time (2)
CHAPTER TWENTY SIX
TIME (2)
Contents
CONVERSION OF ARC (ANGLE) TO TIME . . . . . . . . . . . . . . . . . . . . . . . .423
LOCAL MEAN TIME . . . . . . . . . . . . . . . . . . . . . . . . . . . . . . . . . . . . .424
CO-ORDINATED UNIVERSAL TIME (UTC) . . . . . . . . . . . . . . . . . . . . . . . .426
LOCAL MEAN TIME/UTC PROBLEMS . . . . . . . . . . . . . . . . . . . . . . . . . .427
ZONE TIME (ZT). . . . . . . . . . . . . . . . . . . . . . . . . . . . . . . . . . . . . . . .428
STANDARD TIME . . . . . . . . . . . . . . . . . . . . . . . . . . . . . . . . . . . . . . .431
QUESTIONS 1 . . . . . . . . . . . . . . . . . . . . . . . . . . . . . . . . . . . . . . . . .436
QUESTIONS 2 . . . . . . . . . . . . . . . . . . . . . . . . . . . . . . . . . . . . . . . . .437
QUESTIONS 3 . . . . . . . . . . . . . . . . . . . . . . . . . . . . . . . . . . . . . . . . .438
ANSWERS 1 . . . . . . . . . . . . . . . . . . . . . . . . . . . . . . . . . . . . . . . . . .439
ANSWERS 2 . . . . . . . . . . . . . . . . . . . . . . . . . . . . . . . . . . . . . . . . . .439
ANSWERS 3 . . . . . . . . . . . . . . . . . . . . . . . . . . . . . . . . . . . . . . . . . .441
422
Chapter 26 Time (2)

423
Chapter 26Time (2)
CONVERSION OF ARC (ANGLE) TO TIME
To solve time problems we need to be able to convert angular arcs to time in hours and minutes.
Because the earth rotates 360° in 24 hrs, we can convert angular arc to time as follows:
360° = 24 hrs15° = 1 hour1° = 4 minutes15’ of a degree of arc = 1 minute of time15”(seconds of arc) = 1 second of time
Note: You are only required to work to the nearest minute of time. Conversion of angular arc to time can be achieved using the table on the last page of the Air Almanac extract (reproduced at the end of this chapter). Angular arcs from 0° to 360° are converted to hours and minutes of time in the first 5 columns. The final column is used to convert minutes of angular arc into minutes and seconds of time.
Example: Convert 137°36’ of arc to time. Use the arc/time table
137° of arc converts to 9 hours 08 minutes of time.
36’ of arc converts to 2 minutes 24 seconds
The final solution is, 9 hours 10 minutes and 24 seconds, but rounding the answer gives:
Answer: 9hrs 10mins
You may not have the arc/time page from the Air Almanac. In this case, you must calculate the arc to time conversion. In most cases, the arc of longitude will be in whole degrees.
Example 1: Convert 127° of arc into time.
Divide 127° by 15 = 8.4667 hours
The answer is now in hours but the hours must be converted to minutes.Convert the decimals of hours (.4667) to minutes by multiplying by 60 - .4667 x 60 = 28
Answer: 8 hrs 28 minutes
Example 2: Convert 096°17’ of arc into time.
Express the arc in decimal form by dividing the minutes by 60. (17÷60) = .283Arc = 096.283°Divide arc by 15 to give decimal time096.283° ÷ 15 = 6.4189 hrs.Convert decimal hours back to minutes.4189 x 60 = 25 minutes (to the nearest minute)
Answer: 6 hours 25 minutes

424
Chapter 26 Time (2)
These problems are most easily solved using the DMS function of a scientific calculator. We recommend that, in problems that appear in this book, students calculate the arc/time conversion and practise using the dms function on the calculator. Answers can then be checked against the arc/time table from the air almanac.
Example: Convert 137°36’ of arc to time.
The actual buttons to be pressed depend on which particular calculator you have bought. With the Casio series that Oxford recommends, the dms button is marked ° ’ ” To convert arc to time, press the following sequence:
1 3 7 (dms) You will then see 137° in the window.
3 6 (dms) You will then see 137° 36° in the window.
÷ 1 5 = You will then see 9°10°24 - 9 hours, 10 minutes, and 24 seconds.
LOCAL MEAN TIME
The Earth rotates daily around its geographic axis, anticlockwise if observed from above the North Pole. It is convenient sometimes to consider the Earth as stationary and the Sun traveling around the Earth once a day in a clockwise direction. This alternative fits well with our perception that the Sun rises in the East and sets in the West. For further discussions, this alternative will be used and, unless otherwise stated, the Sun referred to is the ‘mean’ Sun.
When the mean sun transits (crosses) a particular meridian, the Local Mean Time (LMT) at all places on that meridian is 1200 hrs (midday, noon).
Similarly, when the mean sun transits the anti-meridian of a point, the LMT at the point is 0000hrs (2400hrs) or midnight. Conventionally, midnight of a particular night, say the night of the 6th/7th, is regarded as 2400hrs LMT on the 6th or 0000hrs on the 7th.

425
Chapter 26Time (2)
Fig 27.1 Local Mean Time (LMT)Figure 26.1 Local Mean Time (LMT)
Figure 26.1 illustrates the situation when the mean Sun is transiting (crossing) the meridian of 45E on 16th May (the date is chosen simply for illustrative purposes). Thus the LMT at all places on the 45E meridian (Baghdad, Aden, Madagascar) is 1200 LMT on 16th May (local mean date).
Remember, it takes the Sun 1 hour to travel 15° of longitude.
At 45E, the LMT is 1200 hrs on 16th May, (the Sun is crossing the meridian of 45E).
At 90E (approx India) the LMT is 1500 hrs on 16th May (the Sun passed the meridian 3 hours ago : 45 = 3 x 15 = 3hrs)
At 135E (approx Japan) the LMT is 1800 hrs on 16th May.
At 180E (mid-Pacific in the eastern hemisphere) the LMT is 2100 hrs on 16th May.
Now working to the west from the 045°E meridian.
At 0E/W (the Greenwich Meridian), the LMT is 0900 LMT on 16th May.
LMT at the Greenwich Meridian is known as Greenwich Mean Time (GMT) also called Zulu ‘Z’, which used to be the Earth’s standard time. The present standard time is called Co-ordinated Universal Time (UTC) which for all practical purposes is the same as GMT.
At 45W (Newfoundland) the LMT is 0600LMT on the 16th May.
At 90W (mid USA), the LMT is 0300 LMT on the 16th May.

426
Chapter 26 Time (2)
At 135W (Alaska), the LMT is 0000 LMT on the 16th May. This time may be considered to be also 2400 hrs LMT on the 15th May.
At 180W (mid Pacific in the western hemisphere), LMT is 2100LMT on the 15th May. But, from the previous argument, at 180°E, the LMT is 2100LMT on 16th May.
Thus:At the 180° meridian, the LMT date changes by a day although the LMT time remains the same. Thus:
Traveling westward across the 180° meridian, the LMT date increases by one day. Traveling eastward across the 180° meridian, the LMT date decreases by one day.
This situation is illustrated in Figure 26.2 using an LMT at Greenwich of 0300 LMT on the 19th(0300 UTC on UTC date 19th).
Figure 27.2 - LMT 2Figure 26.2 LMT 2
CO-ORDINATED UNIVERSAL TIME (UTC)
Co-ordinated Universal Time (UTC) changes at a constant rate and is regulated against International Atomic Time (IAT) derived from atomic clocks. UTC is regularly corrected to match GMT (the LMT at the Greenwich Meridian) but the corrections are very small. For all practical navigation purposes, UTC equals GMT. UTC is the datum for world time.
It is often necessary to convert LMT into UTC or vice versa. Based on the fact that the sun appears to travel across the earth from east to west, the following rule applies:
Longitude east, UTC least (less advanced)
Longitude west, UTC best (more advanced)

427
Chapter 26Time (2)
Example:Find the UTC if the LMT in Cairo (longitude 30E) is 0900 hours.
LMT Cairo 0900Arc/Time (Long.30E) - 0200UTC 0700 (UTC LEAST)
Find the UTC if the LMT in Madrid (longitude 04W) is 0400 hours.
LMT Madrid 0400Arc/Time (Long.04W) + 0016UTC 0416 (UTC BEST)
Find the LMT in Berlin (longitude 13E) if the UTC is 1345 hours.
UTC 1345 (UTC LEAST)Arc/Time + 0052LMT Berlin 1437 (Long East)
Find the LMT in San Francisco (longitude 122W) if the UTC is 2115 hours.
UTC 2115 (UTC BEST) Arc/Time - 0808LMT San Francisco 1307 (Long West)
LOCAL MEAN TIME/UTC PROBLEMS
Note that in basic LMT problems, the latitude is unimportant. For instance, all points on the 75W meridian have the same LMT. This example includes Ottawa (Canada), Philadelphia (USA), Kingston (Jamaica), Bogota (Colombia) and Lima (Peru).
We recommend that students lay out problems logically and always work through UTC as in the examples below.
Example 1If the LMT at ‘A’, 40°N 137°50’W, is 1812 LMT on 18 August, what is the LMT at ‘B’, 30°S121°12’E?
Day (D) Hour (H) Minute (M)LMT at A 18 18 12 LMT Arc/Time conversion 137°50’W(Last page of AA) +9 11
UTC (long west, UTC best) 19 03 23 UTC Arc/Time conversion 121°12’E 8 05
LMT ‘B’ (long east, UTC least) 19 11 28 LMT
Answer: 1128 LMT on 19th August
Note: This question could have been completed without UTC. The Ch long between A and B is 259°02’ minutes which converts as 17 hours 16 minutes later than A’s LMT. The method through UTC seems longer but it is too easy to make a mistake if you try to take short cuts, especially if the date changes. Always use the method above and work through UTC.
428
Chapter 26 Time (2)
Example 2If it is 1012 UTC on 15 Dec at 50N 030W, what is the LMT in:
a. Singapore (00°30’N 105°00’E)b. Hawaii (22°00’N 155°00’W)
Note: UTC is the same all over the world. Giving the initial position as 50°N 030°W is a ‘red herring’.
a D H M 15 10 12 UTCArc/Time 105°E +7LMT Singapore (long E, UTC least) 15 17 12 LMT
b. D H M 15 10 12 UTC Arc/Time 155°W 10 20
LMT Hawaii (long W, UTC best) 14 23 52 LMT
ZONE TIME (ZT)
Although UTC is the worldwide time datum for aviation purposes, it has little civil use far from the Greenwich meridian. Humans tend to rise some time in the morning and go to bed some time in the late evening. On a cruise ship in mid Pacific, it would be disappointing if you chose to go up on deck to sunbathe when your watch was reading 1000 hrs UTC! This problem was recognised centuries ago and the system of Zone Time (ZT) was used to keep ships’ time in synchronisation with the periods of light and dark.
Zone Time was based on the fact that the Sun transits 15 degrees in one hour. The datum for the Zone Time system was the Greenwich Meridian (0E/W). All ships within longitudes 7.5W and 7.5E would keep a Zone Time the same as GMT (UTC). The correction from Zone Time to GMT (UTC) would be zero.
Ships between longitudes 7.5E to 22.5E would have a Zone Time one hour later than GMT (UTC). This Zone was numbered - 1, the correction to be applied to Zone Time to calculate GMT (UTC). Similarly, ships between longitudes 22.5E to 37.5E would be in the zone numbered -2. The numerical labels continue as minus values up to 180E.
For ships in the western hemisphere, a similar system applied. Thus, ships at longitudes between 7.5W and 22.5W would be in the zone numbered +1, i.e., the zone time is earlier than UTC and 1 hour must be added to Zone Time to calculate UTC. The numerical labels increase as plus values to 180W.
The system is illustrated in the following diagram:

429
Chapter 26Time (2)
Figure 27.3 Zone TimeFigure 26.3 Zone Time
Note: The 15° zone centred on the 180° meridian is divided in 2 zones. From 172.5W to 180W, the zone is +12. From 172.5E to 180E, the zone is –12. Thus, crossing the 180E/W meridian requires a change of one ‘zone’ day in exactly the same sense as is required in LMT.
Zone LettersThe zones are also labelled using letters, the most familiar zone being that around Greenwich which is labelled ‘Z’ (Zulu). Zones number -1 to -12 (to the east of Greenwich) are labelled A to M in ascending order omitting J. Zones +1 to +12 are labelled N to Y. You will not be required to be able to label the zones alphabetically.
Zone Time CalculationsYou may be required to calculate the Zone Number for a given longitude or to convert between Zone Time and UTC.
To calculate the Zone Number, divide the longitude given by 15 and round to the nearest whole number with .5 rounding up. Easterly longitudes have negative (minus) zone numbers from -1 to -12. Westerly longitudes have positive (plus) zone numbers form +1 to +12. Remember, the zone number is applied to the Zone Time to give UTC. To convert from UTC to Zone Time, the +/- signs need to be reversed. These rules can be confusing and it may be easier to remember:
If it’s midday in London, it’s evening in the Far East and morning in the Wild West.
Or we’re having
‘Breakfast at Tiffany’s (New York), Lunch in London, Tea in India’.
Mathematically:
UTC = Zone Time + Zone Number

430
Chapter 26 Time (2)
Example 1What is the zone number for position, A. 40S 137E, and position B, 60°00’N 097°30’W? Note: latitude is irrelevant in these cases.
Position A Zone number = 137° ÷ 15= 9.13 hrs= 9 hrs (rounded to nearest whole number).
Longitude E is negativeZone Number of position A = -9
Position B Longitude 097°30’W = 97.5W Zone number = 97.5 ÷ 15 = 6.5 hrs = 7hrs (.5s round up)Longitude W is positiveZone Number B = +7
Example 2At position 10S 130E, the Zone Time is 0600 ZT on Zone Date 01 Jan 00. What is the UTC?Zone Number = 130÷15 = 8.66 = -9 (East)
UTC = Zone Time + Zone Number
= 01 0600 (ZT) Jan + (-9)
= 312100 UTC December 99
Example 3At 0300 UTC on 17May, what is the Zone Time and date at 20N 155W?
Zone Number = 10.33 = +10 (West)
UTC = Zone Time + Zone Number
Therefore: Zone Time = UTC - Zone Number
= 170300 May - (+10) = 161700 May
Examples 2 and 3 have been completed above using an algebraic notation in the equations. Common sense should tell you that in Example 2, the UTC should be less than the Zone Time. Similarly, in Example 3, the Zone Time should be less than the UTC.

431
Chapter 26Time (2)
STANDARD TIME
Zone Time (ZT) gives a convenient standard for ships at sea, keeping the hours of the day approximately synchronised with daylight and darkness. However, the system would not be appropriate for use on land. For example, the 7.5E longitude line runs through the middle of Nigeria - it would be inconvenient if western Nigeria kept a time 1 hour in advance of eastern Nigeria.
Similarly, Local Mean Time (LMT) is inappropriate for use in a country as a standard time. In UK, we would have a situation where at 1200 LMT in Greenwich, the time at Oxford (001°20’W) would be 1155LMT and the time in Penzance (005W) would be 1140 LMT. This situation did exist up until the mid-1800s in the UK when lines of communication were slow. With the advent of the railway system, the need for a standardised system was recognised. Indeed, in those very early days, train guards leaving London carried a watch set to Greenwich time. At each station out of London, the station clock would be reset to the guard’s watch (GMT) and, subsequently, church wardens would set church clocks to the station clock, i.e., to London time. Thus, each town in the UK set its clocks to a standard time for the country; this was the foundation of the Standard Time (ST) system.
For the UK, the Standard Time (ST) is UTC (GMT) at all times of the year. In summer, we adjust our clocks forward 1hour and refer to the time as British Summer Time (BST), a time which is one hour added on to our Standard Time (UTC). Summer Time/Daylight Saving Time corrections are discussed later in these notes.
Each country nominates its own Standard Time (ST), normally notified in the Air Almanac as a correction to UTC. Clearly, each country aims to fix a Standard Time such that 1200 hr ST occurs about the middle of the period of light and 0000 hrs ST in about the middle of the period of darkness. Thus Standard Time will be close to both Local Mean Time (LMT) and to Zone Time (ZT) but will not be exactly the same.
Standard Time corrections for most countries are listed in the Air Almanac on pages 1 to 4 inclusive. Countries are listed in 3 general areas:
List 1 (pages 1,2) Countries generally to the east of the Greenwich meridian.List 2 (top of page 3) Countries close to or on the Greenwich meridian.List 3 (pages 3,4) Countries generally to the west of the Greenwich meridian.
Note: The Air Almanac extract issued for exam purposes is a copy from a 1992 Air Almanac. Country names, (for example USSR) may have changed and the corrections may also have changed. For exam purposes, the extract should be treated as valid.
List 1List 1 (pages 1,2) gives Standard Time Corrections for countries mainly east of Greenwich, whose Standard time will be ‘fast’ on UTC, i.e., Standard Time is later than UTC time. The note under the title shows how the corrections should be applied; time corrections given should be added to UTC to give Standard Time, or subtracted from Standard Time to give UTC.
Countries with a large E-W extent may be subdivided. Thus, Standard Time corrections for Australia change depending on the state involved. JAA questions about countries like Australia will specify the state involved. Also, the USSR is divided by states; JAA time questions involving the USSR will give the state of the place concerned.

432
Chapter 26 Time (2)
Some countries do not carry an exact number of hours as a correction. This choice is entirely at that country’s discretion. Also there are a few unusual corrections: Chatham Island at 12hrs 45 mins. and Tonga Islands at 13 hrs. These latter countries are actually in the Western Hemisphere, and the corrections are made because the countries involved wish to keep the same day as their neighbours in the Eastern Hemisphere. This is discussed later in this section.
List 2List 2 countries (top of page 3) are places close to the Greenwich Meridian which normally keep UTC as their Standard Time. Note that this list includes Great Britain.
List 3List 3 countries (pages 3, 4) are those countries generally to the west of Greenwich whose Standard Time is ‘slow’ on UTC, i.e. less than UTC. The corrections given should be subtracted from UTC to give Standard Time or added to Standard Time to give UTC.
Some countries, (for example Canada) are divided by province, and even within some of those provinces (Northwest Territories) the correction is further subdivided by longitude. JAA questions involving these areas will provide all the necessary detail. The USA is divided by states with Alaska being sub-divided by longitude. You do not need to use terms such as ‘Eastern Standard Time’ which are not given in the Air Almanac.
An anomaly does exist in the USA listing for the Aleutian Islands given as 10 hrs, but this will be discussed later.
Summer Time/Daylight Saving Time (DST)Some countries in all lists may carry Summer Time or Daylight Saving Time (DST) (USA) in the summer months. This is normally indicated by an asterisk * against the country listed. Summer time is normally 1 hour in advance of Standard Time. Thus if the Standard Time in UK in June is 1200 (UTC), the British Summer Time is 1300 BST. If the Daylight Saving Time in New York, USA in June is 0900 DST, the Standard Time is 0800 ST.Exam questions will clearly indicate if Summer Time/Daylight Saving Time corrections are to be applied. However, if a country is listed with an asterisk (*), read the notes at the bottom of the page.
Standard Time AnomaliesRemember, Local Mean Time and Zone Time always change by a day at the 180°E/W meridian. Thus, it would be logical to conclude that Standard Time changes by 1 day at the 180°E/W. This is not always so.
In List 1, Chatham Island (44°S 176°W) approximately 400nm south-east of New Zealand, is listed with a correction of 12 hours 45 minutes. The island is administered by New Zealand and populated by New Zealanders (and sheep). However, it lies in the western hemisphere whereas New Zealand lies in the eastern hemisphere. Thus, Chatham Island’s date should be one day earlier than New Zealand’s date, e.g. when it’s Sunday on Chatham Island, it will be Monday in New Zealand. This is administratively inconvenient. To correct the problem the ‘dateline’ which should be on the 180E/W meridian is moved to the East so that, instead of being 176W, the island is considered, for time, to be at 184E. The adjusted dateline is known as the International Date Line - a line generally following the 180E/W meridian but occasionally adjusted to east or west for political/administration purposes.
A similar situation occurs with the Tonga Islands. The Tonga Islands (22°S170°W) are part of the same Pacific Island group as Fiji (17°S178°E) and wish to keep the same day despite being in different hemispheres. Using the dateline of 180E/W, Tonga would have to keep a time one day earlier than Fiji. To overcome this problem, the International Dateline is moved further east to keep Fiji and Tonga on the same Standard Time day.

433
Chapter 26Time (2)
An Interesting Example
Example:If the Local Mean Time (LMT) in the Tonga Islands (22°S 170°W) is 0800 LMT on local mean date 10 May, what is the Standard Time and Standard Date in the Tonga Islands.
Using the recommended logical for this type of problem and working through UTC
Day Hour MinuteLocal Mean Time Tonga 10 08 00 LMT Arc/Time Correction for 170W 11 20UTC 10 19 20 UTC BestStandard Time Correction Tonga (list 1) +13Standard Time Tonga 11 May 08 20 ST
Note: Tonga’s Standard Date is one day different (in advance) from its Local Mean date. A similar situation exists with Chatham Island mentioned previously and with the 2 other anomalies of this type - the extreme far east of Russia and Wrangell Island. In these other cases, the International Dateline has also been adjusted. A corresponding situation exists with the far western islands of the Aleutian chain which lie in the eastern hemisphere. Here, the International Dateline is adjusted further west to keep the whole Aleutian chain on the same day as the USA.
Figure 27.4 - International Date Line
Figure 26.4 International Date Line

434
Chapter 26 Time (2)
Example 1Find the LMT in Tokyo, Japan (longitude 140E) if the standard time is 1425 hours on the16th January.
D H MStandard Time Tokyo 16th 14 25Standard Time Difference (STD) - 09 00 (List 1)UTC 16th 05 25Arc/Time (Long.East) + 9 20 (UTC LEAST)LMT Tokyo 16th 14 45
Example 2Find the LMT in Vancouver, British Columbia Canada (longitude 123W) if the Standard Time is 0008 hours on 5th March.
D H MStandard Time Vancouver 5th 00 08Standard Time Difference (STD) + 08 00 (List 3) UTC 5th 08 08Arc/Time (Long.West) - 8 12 (UTC BEST)LMT Vancouver 4th 23 56
Example 3Find the standard Time in Fairbanks, Alaska (longitude 148W) if the LMT is 0614 on 18th February. D H MLMT Fairbanks 18th 06 14Arc/Time (Long.West) + 9 52 (UTC BEST)UTC 18th 16 06STD Fairbanks - 9 00 (List 3)ST Fairbanks 18th 07 06
Example 4Find the Standard Time in Georgetown, Guyana (08N 060W), when the LMT in Sydney, New South Wales,(longitude 151° 20’E) is 1116 hours on 21st January.
D H MLMT Sydney 21st 11 16Arc/Time (Long.East) - 10 05 (UTC LEAST)UTC 21st 01 11STD Guyana - 3 00 (List 3)ST Georgetown 20th 22 11
Example 5An aircraft left position A (longitude 164W) on a westerly heading at 2200 hours LMT on 3rd May. Give the LMT and local date of arrival at position B (longitude 173E) if the flight time was 6 hours. D H MDepart A 3rd 22 00LMT Arc/Time (Long.West) + 10 56Depart A 4th 08 56 (UTC BEST)Flight Time + 06 00Arrive B 4th 14 56 UTCArc/Time (Long.East) + 11 32Arrive B 5th 02 28

435
Chapter 26Time (2)
Example 6An aircraft left position X (longitude 175E) on an easterly heading at 0100 hours LMT on 18th November. Give the LMT and local date of arrival at position Y (longitude 150W) if the flight time was 4 hours.
D H MDepart X 18th 01 00 LMTArc/Time (Long.West) - 11 40Depart X 17th 13 20 UTC LEASTFlight Time + 04 00Arrive Y 17th 17 20 UTCArc/Time (Long.East) - 10 00Arrive Y 17th 07 20
SUMMARY
LMT is based on the movement of the Mean Sun which travels through 15° of longitude per hour. UTC is the LMT on the Greenwich Meridian.
Difference in LMT at two places is found by finding the difference in their longitudes and converting it into time at the rate of 15° per hour, except where the shorter longitudinal arc spans the date line in which case work through UTC. Be prepared to calculate the time equivalent of Longitude without using the Air Almanac.
Zone Time is in the EASA syllabus. Be prepared to convert longitude into Zone Number and to convert between Zone Time and UTC.
Standard Time is used to prevent the extreme inconvenience of using LMT on clocks. Standard Time Differences for all countries are found in Lists 1, 2 and 3 in the Air Almanac. Conversion of LMT to Standard Time or vice versa is best done through UTC. LMT problems involving an aircraft crossing the International Date Line are also best done through UTC.
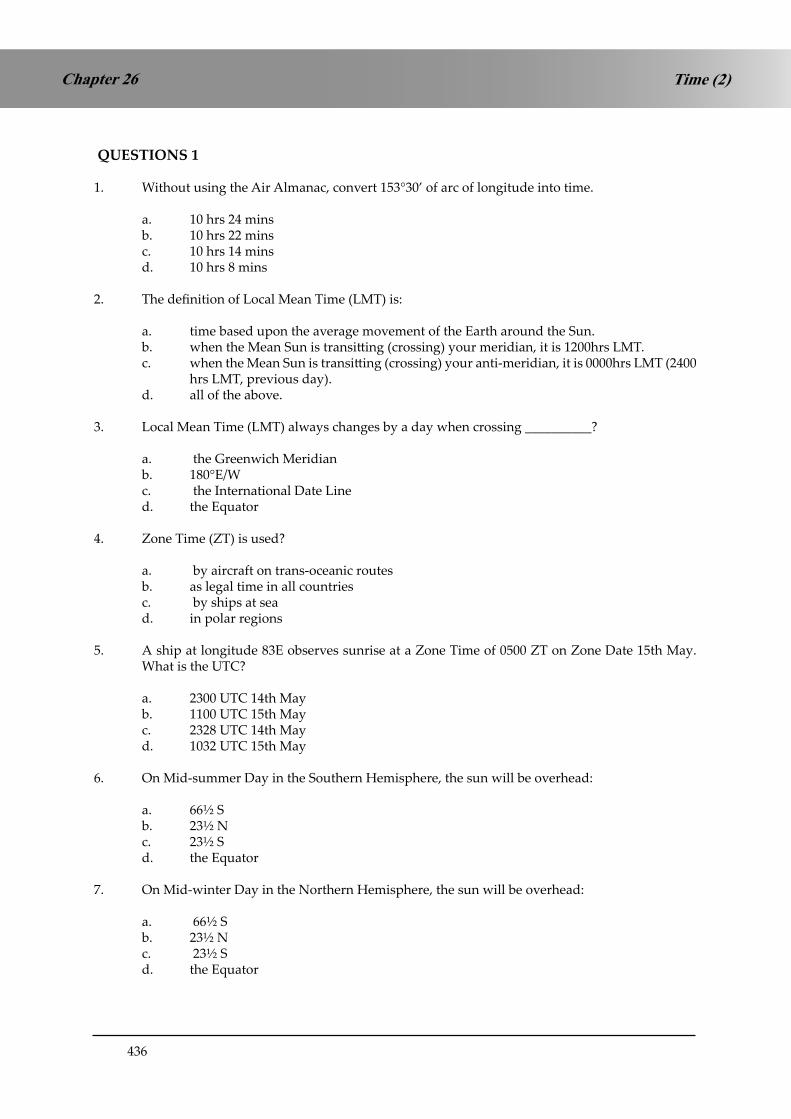
436
Time (2)Chapter 26
QUESTIONS 1
1. Without using the Air Almanac, convert 153°30’ of arc of longitude into time.
a. 10 hrs 24 mins b. 10 hrs 22 mins c. 10 hrs 14 mins d. 10 hrs 8 mins
2. The definition of Local Mean Time (LMT) is:
a. time based upon the average movement of the Earth around the Sun.b. when the Mean Sun is transitting (crossing) your meridian, it is 1200hrs LMT.c. when the Mean Sun is transitting (crossing) your anti-meridian, it is 0000hrs LMT (2400
hrs LMT, previous day). d. all of the above.
3. Local Mean Time (LMT) always changes by a day when crossing __________?
a. the Greenwich Meridianb. 180°E/Wc. the International Date Lined. the Equator
4. Zone Time (ZT) is used?
a. by aircraft on trans-oceanic routesb. as legal time in all countriesc. by ships at sea d. in polar regions
5. A ship at longitude 83E observes sunrise at a Zone Time of 0500 ZT on Zone Date 15th May. What is the UTC?
a. 2300 UTC 14th May b. 1100 UTC 15th May c. 2328 UTC 14th May d. 1032 UTC 15th May
6. On Mid-summer Day in the Southern Hemisphere, the sun will be overhead:
a. 66½ S b. 23½ N c. 23½ Sd. the Equator
7. On Mid-winter Day in the Northern Hemisphere, the sun will be overhead:
a. 66½ Sb. 23½ Nc. 23½ Sd. the Equator

437
Chapter 26Time (2)
QUESTIONS 2
1. At position 4830N 10315E the time is 1045 LMT on the 17th May. What is the LMT and local date at 4830S 00715E?
2. When LMT at 4600N 00830W is 2300 on the 9th May, what is the LMT and local date at:
a. 4600N 10830W?b. 4600N 10830E?
3. The time is 1300 UTC on 1st April. Calculate the LMT and local date at:
a. 5430N 00715Eb. 1627S 10743Wc. 1846N 16835E
4. At 3000N 4630E the time is 0300 LMT. What is the time at 6000N 01615W in:
a. UTC?b. LMT?
5. At 1400 UTC on 6th November what is the Standard Time at the following locations:
a. Iraqb. Libyac. Tongad. Canada, Labradore. New Yorkf. Ghana
6. At 1400 UTC what is the Standard Time in Tonga Islands 2200S 17000W?
7. In position 4830N 6357W the LMT is 1430 on the 10th February. What is the Standard Time in Hong Kong (2220N 11407E)?
8. An aircraft is to fly from Wellington, New Zealand (4110S 17454E) to Samoa (1350S 17145W). The estimated flight time is 6 hours 15 minutes.
Give the Standard Time and date of departure from Wellington if the ETA for Samoa is 2350 LMT on the 8th September 1995.

438
Time (2)Chapter 26
QUESTIONS 3
Note: Unless otherwise stated assume that Summer Time is not being observed.
1. Determine the LMT in WELLINGTON, NEW ZEALAND (17446E) at 0730 UTC.
2. LMT in BOSTON, MASSACHUSETS, USA (07108W) is 1200. What is the UTC?
3. Determine the LMT in HONOLULU, HAWAII, USA (15752W) and the Standard Time in SYDNEY, NEW SOUTH WALES, AUSTRALIA (15113E) for 1335 UTC.
4. An aircraft leaves BRISBANE, QUEENSLAND, AUSTRALIA (15302E) at 2200 UTC on 4th May and lands in MANILA, PHILIPPINE REPUBLIC (12058E) some 6 hours and 45 minutes later. What is the LMT and Standard Time of landing?
5. By how much is LMT, BANGKOK, THAILAND (10100E) later than LMT, SAN FRANCISCO, CALIFORNIA, USA (12225W)?
6. An aircraft left NEW YORK, USA (07500W) on a 5 hour 25 minute scheduled flight to VANCOUVER, BRITISH COLUMBIA, CANADA (12320W). If the ATD was 0915 NEW YORK Summer Time, what will be the ETA (Standard Time) VANCOUVER?
7. Inclusive of flying and refuelling time, the scheduled time from ROME, ITALY (01230E) to HONG KONG (11400E) is 21 hours 40 minutes. If the flight must land at HONG KONG at 1835Standard Time, at what Standard Time must the flight leave ROME to arrive on schedule?
8. The flight time between SYDNEY, NEW SOUTH WALES, AUSTRALIA and HONOLULU, HAWAII (15752W) is 9 hours 50 minutes. If an aircraft leaves SYDNEY at 0930 Standard time on the 8th May, what is the LMT and local date of arrival?
9. An aircraft leaves HONOLULU, HAWAII at 2300 Standard Time on the 10th May. If the flight time to SYDNEY, NEW SOUTH WALES, AUSTRALIA is 10 hours 20 minutes, what is the Standard Time of arrival at SYDNEY?
10. A flight from NEW YORK, USA (07345W) to MADRID, SPAIN (00333W) is planned to leave at 2000 Standard Time on 16th February. If the flight time is 7 hours 45 minutes, give the Standard Time and local date of arrival at MADRID.

439
Chapter 26Time (2)
ANSWERS 1
1. C
2. D
3. B
4. C
5. A
6. C
7. C
ANSWERS 2
Question 1Difference in longitude 96°00
1045 LMT 17 MayArc to time - 0624 0421 LMT 17 May at 007°15’E
Question 2a. Difference in longitude 100°00’
2300 LMT 9 MayArc to time - 0640 1620 LMT 9 May at 108°30 W
b. Difference in longitude 117°00’
2300 LMT 9 MayArc to time + 0748 0648 LMT10 May at 108°30 E
Question 3a. 1300 UTCArc to time + 0029 1329 LMT 1 April at 07°15 E
b. 1300 UTCArc to time - 0711 0549 LMT 1 April at 107°43 W
c. 1300 UTC Arc to time + 1114 0014 LMT 2 April at 168°35 E

440
Time (2)Chapter 26
Question 4a. 0300 LMT Arc to time - 0306 2354 UTC previous day b.Arc to time - 0105 2249 LMT previous day
Question 51400 UTC on 6th November
a. Iraq + 0300 = 1700 ST 6 Novb. Libya + 0100 = 1500 ST 6 Novc. Friendly Is + 1300 = 0300 ST 7 Novd. Labrador - 0400 = 1000 ST 6 Nove. New York - 0500 = 0900 ST 6 Novf. Ghana keeps UTC = 1400 ST 6 Nov
Question 61400 UTC
a. Tonga Is + 1300 = 0300 ST the next day
Question 7
1430 LMT 10 FebArc to time + 0416 1846 UTC 10 FebStandard Time Correction + 0800 0246 ST 11 Feb in Hong Kong
Question 8
Arrival Samoa 2350 LMT 8 SepArc to time + 1127Arrive Samoa 1117 UTC 9 SepFlight Time - 0615Depart Wellington 0502 UTC 9 SepST correction + 1200Depart Wellington 1702 ST 9 Sep
You have won yourself a day!
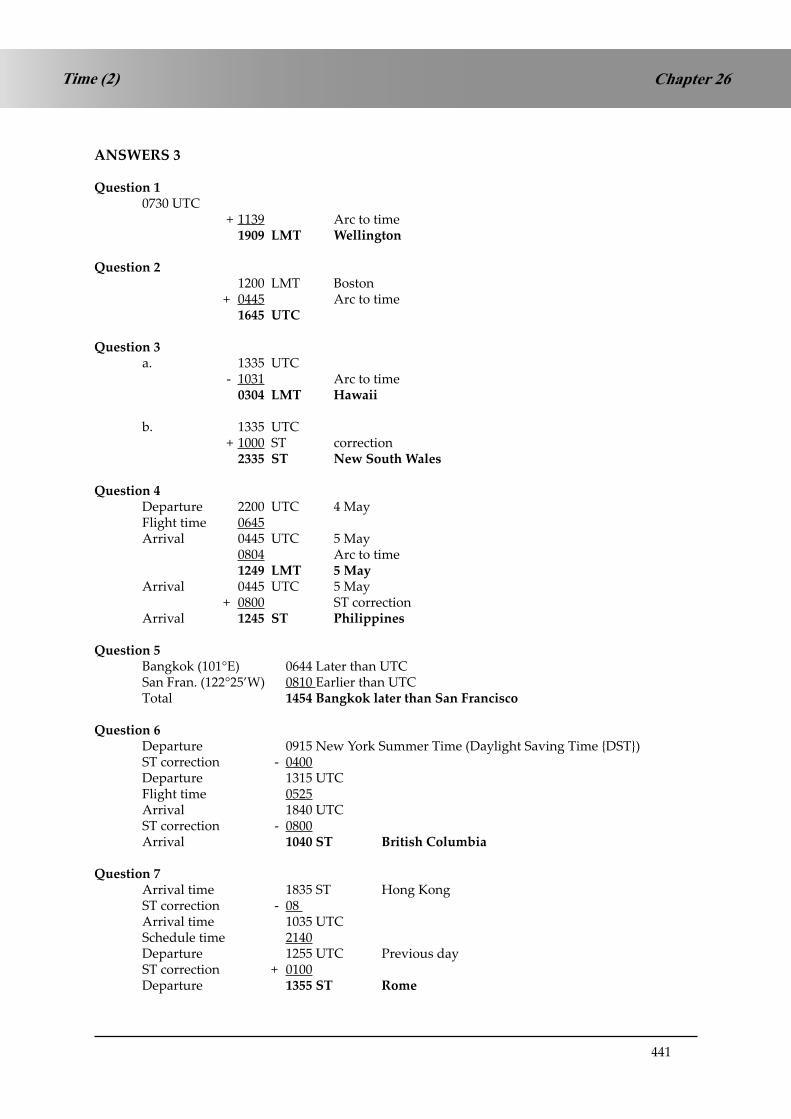
441
Chapter 26Time (2)
ANSWERS 3
Question 10730 UTC + 1139 Arc to time 1909 LMT Wellington
Question 2 1200 LMT Boston + 0445 Arc to time 1645 UTC
Question 3a. 1335 UTC - 1031 Arc to time 0304 LMT Hawaii
b. 1335 UTC + 1000 ST correction 2335 ST New South Wales
Question 4Departure 2200 UTC 4 MayFlight time 0645Arrival 0445 UTC 5 May 0804 Arc to time 1249 LMT 5 MayArrival 0445 UTC 5 May + 0800 ST correctionArrival 1245 ST Philippines
Question 5Bangkok (101°E) 0644 Later than UTC San Fran. (122°25’W) 0810 Earlier than UTCTotal 1454 Bangkok later than San Francisco
Question 6Departure 0915 New York Summer Time (Daylight Saving Time {DST}) ST correction - 0400Departure 1315 UTCFlight time 0525Arrival 1840 UTC ST correction - 0800Arrival 1040 ST British Columbia
Question 7Arrival time 1835 ST Hong KongST correction - 08 Arrival time 1035 UTCSchedule time 2140Departure 1255 UTC Previous dayST correction + 0100Departure 1355 ST Rome

442
Time (2)Chapter 26
Question 8Departure 0930 ST 8 May NSWST correction 10 Departure 2330 UTC 7 MayFlight time 0950Arrival 0920 UTC 8 MayArc to time - 1031Arrival 2249 LMT 7 May
Question 9Departure 2300 ST Hawaii 10 MayST correction + 1000Departure 0900 UTC 11 MayFlight time 1020 Arrival 1920 UTC 11 MayST correction + 1000Arrival 0520 ST 12 May
Question 10Departure 2000 ST New York 16 FebST correction + 0500Departure 0100 UTC 17 FebFlight time 0745Arrival 0845 UTC 17 FebST correction 0100Arrival 0945 ST Madrid 17 Feb

443
Chapter 26Time (2)
AIR ALMANAC EXTRACT
These pages have been reproduced by kind permission of the Controller, Her Majesty’s Stationery Office.

444
Chapter 26 Time (2)
STANDARD TIMES (Corrected to June 1988)LIST 1 - PLACES FAST ON UTC (mainly those EAST OF GREENWICH)
The times given below should be: added to UTC to give Standard Time. subtracted from Standard Time to give UTC.
Admiralty Islands 10 Cyprus, Ercan* 02
Aghanistan 04 30 Larnaca* 02
Albania* 01 Czechosolovakia* 01
Algeria 01 Denmark* 01
Amirante Islands 04 Dijibouti 03
Andaman Islands 05 30 Egypt, Arab Republic of* 02
Angola 01 Equatorial Guinea, Republic of 01
Australia Ethiopia 03
Australian Capital Territory* 10 Fiji 12
New South Wales1* 10 Finland* 02
Northern Territory 09 30 France 01
Queensland 10 Gabon 01
South Australia* 09 30 Germany, East* 01
Tasmania* 10 West 3* 01
Victoria* 10 Gibraltar* 01
Western Australia* 08 Greece* 02
Austria* 01 Guam 10
Bahrain 03 Holland (The Netherlands)* 01
Balearic Islands* 01 Hong Kong 08
Banaba 11 30 Hungary* 01
Bangladesh 06 India 05 30
Belgium* 01 Indonesia, Republic of Bangka, Billiton, Java, West and Middle Kalimantan, Madura, Sumatra
07
Benin (Dahomey) 01 Bali, Flores, South and East Kalimantan, Lombok, Sulawesi, Sumba, Sumbawa, Timor
08
Bhutan 06 Aru, Irian Jaya, Kai, Moluccas, Tanimbar 09
Botswana, Republic of 02 Iran 03 30
Brunei 08 Iraq* 03
Bulgaria* 02 Israel* 02
Burma 06 30 Italy* 01
Burundi 02 Japan 09
Cameroon Republic 01 Jordan* 02
Caroline Islands, Pala Islands 10 Kampuchea, Democratic 07
Yal Islands, Truk Islands 10 Kenya 03
Ponnapel 11 Kiribati Republic4 12
Pingelap Islands, Kusaie 12 Korea, North 09
Central African Republic 01 Republic of (South)* 09
Chad 01 Kuril Islands 11
Chagos Archipelago2 05 Kuwait 03
Chatham Islands* 12 45 Laccadive Islands 05 30
China* 08 Laos 07
Christmas Island, Indian Ocean 07 Lebanon* 02
Cocos Keeling Islands 06 30 Lesotho 02
Comro Islands (Comoros) 03 Libya* 01
Congo Republic 01 Liechtenstein* 01
Corsica* 01 Lord Howe Island* 10 30
Crete* 02 Luxembourg* 01
* Summer time may be kept in these countries. 1 Except Broken Hill Area which keeps 09h30m
2 Except Diego Garcia which keeps 06h 3 Including West Berlin 4 Except Kiritimati Island and the Phoenix Islands which keep 10h and 11h slow on UT

445
Chapter 26Time (2)
Macao 08 Singapore 08
Macias Nguema Biyogo Island (Fernando Poo)
01 Socotra 03
Madagascar, Democratic Republic of 03 Solomon Islands 11
Malawi 02 Somalia Republic 03
Malaysia 08 South Africa, Republic of 02
Malaya, Sabah, Sarawak 08 South West Africa (Namibia) 02
Maldives, Republic of The 05 Spain* 01
Malta* 01 Spanish Possessions in North Africa
Mariana Islands 10 (Ceuta, Meilla)* 01
Marshall Islands1 12 Spitsbergen (Svalbard) 01
Mauritius 04 Sri Lanka 05 30
Monaco* 01 Sudan, Republic of 02
Mongolia* 08 Swaziland 02
Mozambique 02 Sweden* 01
Namibia (South West Africa) 02 Switzerland* 01
Nauru 12 Syria (Syrian Arab Republic)* 02
Nepal 05 45 Taiwan* 08
Netherlands, The* 01 Tanzania 03
New Caledonia* 11 Thailand 07
New Zealand* 12 Tonga 13
Nicobar Islands 05 30 Tunisia* 01
Niger 01 Turkey* 02
Nigeria, Republic of 01 Tuvalu 12
Norfolk Island 11 30 Uganda 03
Norway* 01 Union of Soviet Socialist Republics2*
Novaya Zemlya 03 Zone 1 Amderma, Arkhangelsk, Kiev, Leningrad, Moscow, Odessa
03
Okinawa 09 Zone 2 Baku, Tbilsi, Volgogrnd 04
Oman 04 Zone 3 Ashkabad, Novvy Port, Sverdlovsk
05
Pagalu (Annobon Islands) 01 Zone 4 Alma-Ata, Omsk,
Tashkent 06
Pakistan 05 Zone 5 Krasnoyarsk, Novosibirsk 07
Papua New Guinea 10 Zone 6 Irkutsk 08
Pescadores Islands 08 Zone 7 Tiksi, Yakutsk 09
Philippine Republic 08 Zone 8 Khabarovsk, okhotsk, 10
Vladivostok
Poland* 01 Zone 9 Magnad, Sakhalin I 11
Qatar 03 Zone 10 Anadyr, Petropaviovsk 12
Reunion 04 United Arab Emirates 04
Romania* 02 Vanuatu, Republic of* 11
Rwanda 02 Vietnam, Socialist Republic of 07
Ryukyu Islands 09 Wrangell Island 12
Sakhalin 11 Yemen 03
Santa Cruz Islands 11 Yugoslavia* 01
Sardinia* 01 Zaire
Saudi Arabia 03 Kinshasa, Mbandaka 01
Schouten Islands 09 Haut-Zaire, Kasai, Kivu, Shaba 02
Seychelles 04 Zambia, Republic of 02
Sicily* 01 Zimbabwe 02
* Summer time may be kept in these countries.1 Except the islands of Kwajalein and Eniwctok which keep a time 24h slow on that ot the rest of the islands.2 The boundaries between the zones are irregular; listed are towns in each zone.

446
Chapter 26 Time (2)
STANDARD TIMES (Corrected to June 1988)LIST II - PLACES NORMALLY KEEPING UTC
Ascension Island Ghana Irish Republic* Morocco Sierra Leone
Bourkina-Faso Great Britain1 Ivory Coast Portugal* Togo Republic
Canary Islands* Guinea Bissau Liberia Principe Tristan da Cunha
Channel Islands1 Guinea Republic Madeira* St. Helena
Faeroes*, The Iceland Mali Sao Tome
Gambia Ireland, Northern1 Mauritania Senegal
* Summer time may be kept in these countries.1 Summer time, one hour in advance of UTC, is kept from March 25d01h to October 28d01hUTC, subject to confirmation.
LIST III - PLACES SLOW ON UT (WEST OF GREENWICH) The times given subtracted from UTC to give Standard Time. below should be added to Standard Time to give UTC.
Argentina 03 Cape Verde Islands 01
Austral Islands1 10 Cayman Islands 05
Azores* 01 Chile* 04
Christmas Island, Pacific Ocean 10
Bahamas* 05 Colombia 05
Barbados 04 Cook Islands* 10
Belize 06 Costa Rica 06
Bermuda* 04 Cuba* 05
Bolivia 04 Curacao Island 04
Brazil, eastern2* 03
Territory of Acre* 05 Dominican Republic 04
western* 04
British Antarctic Territory3 03 Easter Island (I. De Pascua)* 06
Ecuador 05
Canada
Alberta* 07 Falkland Islands* 04
British Columbia* 08 Fanning Island 10
Labrador* 04 Fernando de Noronha Island* 02
Manitoba* 06 French Guiana 03
New Brunswick* 04
Newfoundland* 03 30 Galapagos Islands 06
Northwest Territories* Greenland4, Scoresby Sound* 01
east of long. W.68° 04 Angmagssalik and west coast* 03
long. W.68° to W.85° 05 Thule area 04
long W.85° to W.102° 07 Grenada 04
west of long. W.102° 07 Guadeloupe 04
Nova Scotia* 04 Guatemala 06
Ontario*, east of long. W.90° 05 Guyana, Republic of 03
west of long. W.90° 06
Prince Edward Island* 04 Haiti* 05
Quebec*, east of long. W.63° 04 Honduras 06
west of long. W.63° 05
Saskatchewan* Jamaica 05
east of long. W.106° 06 Jan Mayen Island 01
west of long. W106° 07 Johnston Island 10
Yukon* 08 Juan Fernandez Islands* 04
* Summer time may be kept in these countries.1 This is the legal standard time, but local mean time is generally used.2 Including all the coast and Brasilia.3 Except South Georgia which keeps 02h.4 Danmarkshaven keeps UT

447
Chapter 26Time (2)
STANDARD TIMES (Corrected to June 1988)LIST III - (Continued)
Leeward Islands 04 Indiana3 05
Iowa2 06
Marquesas Islands 09 30 Kansas2,3 06
Martinique 04 Kentucky2, eastern part 05
Mexico1 06 western part 06
Midway Islands 11 Louisana2 06
Maine2 05
Nicaragua 06 Maryland2 05
Niue 11 Massachusetts2 05
Michigan2,3 05
Panama, Republic of 05 Minnesota2 06
Paraguay* 04 Mississippi2 06
Peru 05 Missouri2 06
Pitcairn Island 08 30 Montana2 07
Puerto Rico 04 Nebraska2,3 06
Nevada2 08
St. Pierre and Miqeulon 03 New Hampshire2 05
Salvador, El 06 New Jersey2 05
Samoa 11 New Mexico2 07
Society Islands 10 New York2 05
South Georgia 02 North Carolina2 05
Surinam 03 North Dakota2,3 06
Ohio2 05
Tobago 04 Oklahoma2 06
Trinidade Island*, South Atlantic 02 Oregon2,3 08
Trinidad 04 Pennsylvania2 05
Tuamotu Archipelago 10 Rhode Island2 05
Tubuai Islands 10 South Carolina2 05
Turks and Caicos Islands* 05 South Dakota2, eastern part 06
western part 07
United States of America Tennessee2,3 06
Alabama2 06 Texas2,3 06
Alaska2, east of long. W.169°30’ 09 Utah2 07
Aleutian Is., west of W.169°30’ 10 Vermont2 05
Arizona 07 Virginia2 05
Arkansas2 06 Washington2 08
California2 08 Washington, D.C.2 05
Colorado2 07 West Virginia2 05
Conneticut2 05 Wisconsin2 06
Delaware2 05 Wyoming2 07
District of Columbia2 05 Uruguay* 03
Florida2,3 05
Georgia2 05 Venezuela 04
Hawaii2 10 Virgin Islands 04
Idaho2,3 07
Illinois2 06 Windward Islands 04
* Summer time may be kept in these countries.1 Except the states of Sonora, Sinaloa, Nayarit and the Southern District of Lower California, which keep 07h, and the Northern District of lower California, which keeps 08h.2 Summer (daylight-saving) time, one hour fast on the time given, is kept in these states from the first Sunday in April to the last Sunday in October, changing at 02h00m local clock time.3 This applies to the greater portion of the state.

448
Chapter 26 Time (2)
CONVERSION OF ARC TO TIMEhour min hour min hour min hour min hour min hour min min sec
0 0 00 60 4 00 120 8 00 180 12 00 240 16 00 300 20 00 0 0 00
1 0 04 61 4 04 121 8 04 181 12 04 241 16 04 301 20 04 1 0 04
2 0 08 62 4 08 122 8 08 182 12 08 242 16 08 302 20 08 2 0 08
3 0 12 63 4 12 123 8 12 183 12 12 243 16 12 303 20 12 3 0 12
4 0 16 64 4 16 124 8 16 184 12 16 244 16 16 304 20 16 4 0 16
5 0 20 65 4 20 125 8 20 185 12 20 245 16 20 305 20 20 5 0 20
6 0 24 66 4 24 126 8 24 186 12 24 246 16 24 306 20 24 6 0 24
7 0 28 67 4 28 127 8 28 187 12 28 247 16 28 307 20 28 7 0 28
8 0 32 68 4 32 128 8 32 188 12 32 248 16 32 308 20 32 8 0 32
9 0 36 69 4 36 129 8 36 189 12 36 249 16 36 309 20 36 9 0 36
10 0 40 70 4 40 130 8 40 190 12 40 250 16 40 310 20 40 10 0 40
11 0 44 71 4 44 131 8 44 191 12 44 251 16 44 311 20 44 11 0 44
12 0 48 72 4 48 132 8 48 192 12 48 252 16 48 312 20 48 12 0 48
13 0 52 73 4 52 133 8 52 193 12 52 253 16 52 313 20 52 13 0 52
14 0 56 74 4 56 134 8 56 194 12 56 254 16 56 314 20 56 14 0 56
15 1 00 75 5 00 135 9 00 195 13 00 255 17 00 315 21 00 15 1 00
16 1 04 76 5 04 136 9 04 196 13 04 256 17 04 316 21 04 16 1 04
17 1 08 77 5 08 137 9 08 197 13 08 257 17 08 317 21 08 17 1 08
18 1 12 78 5 12 138 9 12 198 13 12 258 17 12 318 21 12 18 1 12
19 1 16 79 5 16 139 9 16 199 13 16 259 17 16 319 21 16 19 1 16
20 1 20 80 5 20 140 9 20 200 13 20 260 17 20 320 21 20 20 1 20
21 1 24 81 5 24 141 9 24 201 13 24 261 17 24 321 21 24 21 1 24
22 1 28 82 5 28 142 9 28 202 13 28 262 17 28 322 21 28 22 1 28
23 1 32 83 5 32 143 9 32 203 13 32 263 17 32 323 21 32 23 1 32
24 1 36 84 5 36 144 9 36 204 13 36 264 17 36 324 21 36 24 1 36
25 1 40 85 5 40 145 9 40 205 13 40 265 17 40 325 21 40 25 1 40
26 1 44 86 5 44 146 9 44 206 13 44 266 17 44 326 21 44 26 1 44
27 1 48 87 5 48 147 9 48 207 13 48 267 17 48 327 21 48 27 1 48
28 1 52 88 5 52 148 9 52 208 13 52 268 17 52 328 21 52 28 1 52
29 1 56 89 5 56 149 9 56 209 13 56 269 17 56 329 21 56 29 1 56
30 2 00 90 6 00 150 10 00 210 14 00 270 18 00 330 22 00 30 2 00
31 2 04 91 6 04 151 10 04 211 14 04 271 18 04 331 22 04 31 2 04
32 2 08 92 6 08 152 10 08 212 14 08 272 18 08 332 22 08 32 2 08
33 2 12 93 6 12 153 10 12 213 14 12 273 18 12 333 22 12 33 2 12
34 2 16 94 6 16 154 10 16 214 14 16 274 18 16 334 22 16 34 2 16
35 2 20 95 6 20 155 10 20 215 14 20 275 18 20 335 22 20 35 2 20
36 2 24 96 6 24 156 10 24 216 14 24 276 18 24 336 22 24 36 2 24
37 2 28 97 6 28 157 10 28 217 14 28 277 18 28 337 22 28 37 2 28
38 2 32 98 6 32 158 10 32 218 14 32 278 18 32 338 22 32 38 2 32
39 2 36 99 6 36 159 10 36 219 14 36 279 18 36 339 22 36 39 2 36
40 2 40 100 6 40 160 10 40 220 14 40 280 18 40 340 22 40 40 2 40
41 2 44 101 6 44 161 10 44 221 14 44 281 18 44 341 22 44 41 2 44
42 2 48 102 6 48 162 10 48 222 14 48 282 18 48 342 22 48 42 2 48
43 2 52 103 6 52 163 10 52 223 14 52 283 18 52 343 22 52 43 2 52
44 2 56 104 6 56 164 10 56 224 14 56 284 18 56 344 22 56 44 2 56
45 3 00 105 7 00 165 11 00 225 15 00 285 19 00 345 23 00 45 3 00
46 3 04 106 7 04 166 11 04 226 15 04 286 19 04 346 23 04 46 3 04
47 3 08 107 7 08 167 11 08 227 15 08 287 19 08 347 23 08 47 3 08
48 3 12 108 7 12 168 11 12 228 15 12 288 19 12 348 23 12 48 3 12
49 3 16 109 7 16 169 11 16 229 15 16 289 19 16 349 23 16 49 3 16
50 3 20 110 7 20 170 11 20 230 15 20 290 19 20 350 23 20 50 3 20
51 3 24 111 7 24 171 11 24 231 15 24 291 19 24 351 23 24 51 3 24
52 3 28 112 7 28 172 11 28 232 15 28 292 19 28 352 23 28 52 3 28
53 3 32 113 7 32 173 11 32 233 15 32 293 19 32 353 23 32 53 3 32
54 3 36 114 7 36 174 11 36 234 15 36 294 19 36 354 23 36 54 3 36
55 3 40 115 7 40 175 11 40 235 15 40 295 19 40 355 23 40 55 3 40
56 3 44 116 7 44 176 11 44 236 15 44 296 19 44 356 23 44 56 3 44
57 3 48 117 7 48 177 11 48 237 15 48 297 19 48 357 23 48 57 3 48
58 3 52 118 7 52 178 11 52 238 15 52 298 19 52 358 23 52 58 3 52
59 3 56 119 7 56 179 11 56 239 15 56 299 19 56 359 23 56 59 3 56
The above table is for converting expressions in arc to their equivalent in time; its main use in this Almanac is for the conversion of longitude
for application to L.M.T. (added if west, subtracted if east) to give UT or vice versa, particularly in the case of sunrise, sunset, etc.

449
Chapter 27Time (3)
CHAPTER TWENTY SEVEN
TIME (3)
Contents
SUNRISE AND SUNSET . . . . . . . . . . . . . . . . . . . . . . . . . . . . . . . . . . .451
SUNRISE AND SUNSET TABLES - METHODOLOGY . . . . . . . . . . . . . . . . . .453
TWILIGHT . . . . . . . . . . . . . . . . . . . . . . . . . . . . . . . . . . . . . . . . . . .454
QUESTIONS 1 . . . . . . . . . . . . . . . . . . . . . . . . . . . . . . . . . . . . . . . . .461
QUESTIONS 2 . . . . . . . . . . . . . . . . . . . . . . . . . . . . . . . . . . . . . . . . .462
ANSWERS 1 . . . . . . . . . . . . . . . . . . . . . . . . . . . . . . . . . . . . . . . . . .464
ANSWERS 2 . . . . . . . . . . . . . . . . . . . . . . . . . . . . . . . . . . . . . . . . . .464
AIR ALMANAC EXTRACT. . . . . . . . . . . . . . . . . . . . . . . . . . . . . . . . . .467

450
Chapter 27 Time (3)

451
Chapter 27Time (3)
SUNRISE AND SUNSET
Local noon occurs at the same Local Mean Time on all meridians (1200 hrs LMT). It is also true to say that the sun rises at the same LMT at all places on the same parallel of Latitude and it sets at the same LMT at all places on the same parallel of latitude.
On an imaginary earth with no tilt and no atmosphere, the Sun would rise at 0600 LMT and set at 1800 LMT (and there would be no seasons). However, the Earth’s tilt results in seasonal changes and the declination of the sun affects the length of night and day, i.e. it changes the times of sunrise and sunset. The effect varies with latitude. The declination of the Sun varies with the calendar. This is illustrated in the next simplified diagrams.
Northern Summer/Southern Winter
Figure 28.1 - Sunrise/Sunset 1Figure 27.1 Sunrise/Sunset 1
This is illustrated for the situation on or about 21 June (Midsummer Day) when the Sun’s declination is furthest North, i.e., the Sun is overhead the Tropic of Cancer (23½°N): the earth’s North Pole is tilted towards the Sun.
Ignoring the effects of atmosphere (see later), half the earth would be in darkness (night).
An observer at ‘R’ would rotate eastwards as shown. He would experience a short period of night and a long period of day. Thus, the sun must rise earlier than 0600 hours and set later than 1800 hours. (In the Northern Hemisphere, it is summer).
An observer at ‘S’ would experience a long period of night and a short period of day. The sun will rise later than 0600 hours and set earlier than 1800 hrs. It is southern winter.
An observer at E (the Equator) experiences equal periods of night and day with sunrise and sunset at approximately 0600 hours and 1800 hours respectively.
An observer at Position X (the Arctic Circle) or further north experiences constant day - this is the ‘land of the midnight sun’. With the effects of the atmosphere included, this occurs at anywhere north of 66N on June 21 (see later).

452
Chapter 27 Time (3)
In contrast, an observer at position Y (the Antarctic Circle or further south), experiences constant night - the Antarctic winter when the sun never rises.
Northern Winter/Southern Summer
Figure 28.2 - Sunrise/Sunset 2Figure 27.2 Sunrise/Sunset 2
A corresponding situation for December 21st when the Northern Hemisphere is tilted away from the Sun is given below.
The observer at R experiences a short period of day and a long period of night. The sun rises later than 0600 and sets earlier than 1800 hours. It is northern winter.
The observer at S experiences a short night and a long day. The sun rises earlier than 0600 and sets later than 1800. It is southern summer.
The observer at E (the Equator) again experiences equal periods of day and night
The observer at X experiences constant night as do all observers north of X (68N)
The observer at Y experiences constant day as do all observers south of Y (66S)
The length of day and night and the timings of sunrise and sunset vary with latitude and with the declination of the Sun (the calendar date). At the Equator, periods of day and night may be considered to be equal at all times of the year. (Because of atmospheric effects, the length of the day at the Equator is approximately 6 minutes longer than the length of the night - see later)

453
Chapter 27Time (3)
SUNRISE AND SUNSET TABLES - METHODOLOGY
The Air Almanac provides tables from which the LMT of sunrise and sunset can be extracted.
Times are shown for every third day and for various latitudes between 72N and 60S.
If the latitude for which the time of sunrise or sunset is required is not one of the listed latitudes, it is necessary to interpolate to the nearest minute of time.
Note: Listed latitudes are 10° apart near the equator, 5° apart in mid latitudes, and 2° apart in high latitudes
Similarly if the required date is not one of those listed it is necessary to interpolate to the nearest minute. Interpolation is only required to the nearest minute.
Sunrise and sunset problems are really ordinary time problems, the starting point of which is the LMT of sunrise or sunset at a given position.
This LMT is extracted from the Air Almanac and is then converted to UTC or Standard Time as required using the methods given in the previous chapter. Examples of these problems are now given.
Example 1Give the Standard Time of sunset at Innsbruck, Austria (4715N 01120E) on 5th September. D H M Sunset 4715’N (from AA.) 5th 18 33 LMTArc/Time (Long.11°20’E) - 45Sunset Innsbruck 5th 17 48 UTC STD Austria + 01 00 (List 1) 5th 18 48 ST
Example 2What is the Standard Time of sunrise at Keflavik, Iceland (64° 00’N 22° 30’W) on 14th October? Summer Time is not being kept. D H MSunrise 64°(from AA.) 14th 06 45 LMTArc/Time (Long. West) + 01 30Sunrise Keflavik 14th 08 15 UTC STD Iceland 00 00 (List 2) 14th 08 15 ST
Example 3An aircraft lands at Goose, Labrador, Canada (5320N 06020W) at 1841 Standard Time on 20th September. Is it a day or night landing? (Ignore Summer Time).
The Air Navigation Order defines the period of night flying as from 30 minutes after sunset to 30 minutes before sunrise at the surface. (This is not necessarily the same as when it gets dark). D H M Sunset Goose (from AA) 20th 18 05 LMTArc/Time (Long. 06020West) + 04 01UTC of Sunset Goose 20th 22 06 UTC STD Labrador - 04 00 (List 3) Sunset Goose (Labrador ST) 20th 18 06 ST Landing Goose 20th 18 41 STLanding is 35 minutes after sunset. Night Landing (according to the ANO definition)

454
Chapter 27 Time (3)
TWILIGHT
Before sunrise, there is a period when it becomes light, and after sunset there is a period when it remains light. These periods are called generally ‘twilight’. Although the Sun is below the horizon, the Sun’s rays are being refracted in from the atmosphere and result in an extended period of light. It is therefore worthwhile to consider what we call the ‘horizon’.
Consider an observer at position Q on the earth’s surface. His ‘Sensible Horizon’ is the tangent to the Earth’s surface (ignoring terrain features). This is the horizon that would be ‘sensed’ by instruments such as a spirit level.
Figure 28.3 - Sensible/Visual HorizonsFigure 27.3 Sensible/Visual Horizons
Because of atmospheric refraction, the ‘visual’ horizon is below the ‘sensible’ horizon by about 34’ of arc (2). When the top ‘lip’ of the sun passes below the visual horizon, at sunset, the centre of the Sun is another 16’ of arc (the radius of the Sun viewed from Earth below the visual horizon). Thus the centre of the Sun is approximately 50 minutes of arc below the sensible horizon at sunset. As 50’ of arc equates to 3 minutes of time, this means that at sunset, the centre of the sun is already 3 minutes of time below the sensible horizon. An equivalent argument would show that, at sunrise, the centre of the Sun is 3 minutes of time below the sensible horizon. This explains why the length of day at the equator is approximately 6 minutes longer than the length of night.
Twilight is that period before sunrise and after sunset when refracted light from the Earth’s atmosphere gives an amount of illumination. The amount of illumination varies with the Sun’s depression below the sensible horizon and with atmospheric conditions.
Civil TwilightCivil twilight occurs when the Sun’s centre is between 0° 50’ and 6° below the sensible horizon. Illumination is such that it is possible to carry out day time tasks without additional artificial lighting. For example, a daytime visual approach is possible. This is the only twilight period considered in the Air Almanac.
Nautical TwilightThe centre of the Sun is between 6° and 12° below the sensible horizon. (General outlines are discernible and the brighter stars are visible).
Astronomical TwilightThe centre of the Sun is between 12° and 18° below the sensible horizon. (Astronomical twilight is often considered to be ‘complete darkness’.)

455
Chapter 27Time (3)
Civil Twilight Tables (Air Almanac)The LMT of civil twilight is given in the Air Almanac on the intervening pages between the sunrise/sunset tables.
The Morning Civil Twilight (MCT) tables give the time when morning twilight starts. MCT ends at sunrise. All times are tabulated in LMT.
The Evening Civil Twilight (ECT) tables give the time when evening twilight ends. ECT starts at Sunset. Again, all times are tabulated in LMT.
The EASA definition of ‘night’ is the ‘period between the end of evening civil twilight and the beginning of morning civil twilight, or such other period between sunset and sunrise as may be prescribed by the appropriate authority’. An example of the latter proviso of the EASA definition is the Air Navigation Order which defines the period of night flying as from 30 minutes after sunset to 30 minutes before sunrise at the surface.
Duration of Twilight CalculationsTo calculate the duration of twilight at a given latitude on a given date, extract the time of sunrise or sunset for that date and the time of MCT/ECT on the same date. The difference in the corresponding times gives the duration of twilight.
ExampleWhat is the duration of evening civil twilight in New York, USA, (41N 074W) on 19 July?
(AA Page 13) Sunset 19 July (41N) = 1929 LMT (interpolate)(AA Page 14) ECT 19 July (41N) = 2001 LMT (interpolate)
Duration of twilight = 2001 LMT - 1929 LMT = 32 minutes
Extreme Cases of TwilightTwo extreme cases exist (and are frequently examined) as follows:
Equator High latitudes (say above 62N/S)
In high latitudes, the Sun may be above or below the horizon all day, or civil twilight may last all night.
The following symbols in the Air Almanac indicate these conditions:
Sun remains continuously above the horizon.
Sun remains continuously below the horizon.
//// In the period between sunset and sunrise, the sun is never less than 6° below the Sensible Horizon. In plain English, twilight lasts from sunset to sunrise the next morning.

456
Chapter 27 Time (3)
Twilight at the EquatorIt is a romantic, but false idea that after sunset at the Equator, it is dark immediately.To demonstrate the true situation, consider the path of the Sun as viewed by an observer at the Equator on or about March 21st/Sep 21st (the Equinoxes). Looking to the East, the Sun will rise and travel apparently vertically upwards until it is directly overhead the observer. It will then descend vertically to the western horizon where it will set.
The sunset situation described is illustrated below:
Figure 28.4 - Twilight 1
Figure 27.4 Twilight 1
At sunset, at position A, the top edge of the sun has just passed below the visual horizon. At this position, the centre of the sun is 50’ of arc below the sensible horizon. At position B, the centre of the sun is 6° below the sensible horizon; this is the end of Evening Civil Twilight. The duration of twilight is therefore 5°10’ of angular arc - 21 minutes of time - the minimum period of twilight at the equator.

457
Chapter 27Time (3)
Twilight Between the Equator and 60°N/S
Figure 27.5 Twighlight 2
Case 1Using the previous illustration, we can demonstrate how the duration of twilight varies with latitude. As a baseline, we use the equatorial situation described previously which gave a minimum duration of twilight of 21 minutes. This is case (i).
Case 2To an observer whose latitude is farther north than the declination of the sun (in this example, an observer in the northern hemisphere):
The Sun will rise in the East The Sun will travel westward. At 1200 LMT (noon), the Sun will be due south of the observer The Sun will set in the West following the general path indicated in case (ii).
The duration of twilight will be longer than 21 minutes.
Case 3To an observer whose latitude is farther south than the declination of the Sun (in this example, an observer in the southern hemisphere):
the Sun will rise in the East the Sun will travel westward at 1200 LMT (noon), the Sun will be due North of the observer. the Sun will set in the west, following the general path indicated in case (iii).
Again, the duration of twilight will be longer than 21 minutes.In both the above examples, the duration of twilight can be calculated using the Air Almanac.

458
Chapter 27 Time (3)
Twilight in High LatitudesIn high latitudes, the Sun may remain above the horizon all day. Thus, on or about June 21, the sun will remain above the horizon all day at latitudes higher than 66°N. This situation is illustrated below. (Remember, in the southern hemisphere further south than 66°S, the Sun will not rise at all.)
Figure 28.6 - Twilight 3Figure 27.6 Twilight 3
The above illustration is based on a 360° time-lapse photograph taken in Lapland in mid-summer. Using the same diagram, we can illustrate what happens earlier or later than June 21 when the Sun is lower in the sky. Similarly, the sun will be lower in the sky as the latitude of the observer increases.
Figure 28.7 - Twilight 4Figure 27.7 Twilight 4
In Figure 27.7 the sun sets at position A and rises at position B. Between the times of sunset (A) and sunrise (B), the sun never goes below 6° below the sensible horizon. Thus it is:
Twilight between sunset and sunrise
This situation is identified in the Air Almanac with the symbol ////
(Check this in your Air Almanac by looking at the time for Evening Civil Twilight at 64N on June 28.)

459
Chapter 27Time (3)
Effect on Sunrise/Sunset/Twilight of Increase in Altitude
The times published in the Air Almanac are in Local Mean Time (LMT) and are published for sea level at the appropriate position.
Increase in altitude results in sunrise occurring earlier and sunset later than published. This is due to the increased visual horizon at altitude.
Increase in altitude results overall in a decrease in the duration of civil twilight . This is because twilight is caused by refraction of the Sun’s rays from the atmosphere; the higher the aircraft, the less light is refracted from the (reduced) upper atmosphere. For observers in the Space Shuttle, the duration of twilight is negligible.

460
Chapter 27 Time (3)

461
Chapter 27Time (3)
QUESTIONS 1
1. On June 21, what is the lowest northerly latitude (listed in the Air Almanac. at which the sun will be above the horizon for 24 hrs (all day)?
a. 64N b. 66N c. 68N d. 70N
2. On December 21, what is the lowest northerly latitude (listed in the Air Almanac. at which the sun never rises (or sets)?
a. 64N b. 66N c. 68N d. 70N
3. Civil Twilight is?
a. the period between sunset and the end of Evening Civil Twilight (ECT)b. the period between the start of Morning Civil Twilight (MCT) and sunrisec. related to the position of the centre of the sun being 6° below the sensible horizon d. a period when it is possible to carry out daylight tasks without artificial lightinge. used in the JAR definition of day flying/night flyingf. all of the above
4. Nautical Twilight and Astronomic Twilight are the twilight periods that follow Civil Twilight. Nautical Twilight occurs when the sun is between _________ and ____________ below the Sensible Horizon?
a. 0°/6°b. 6°/12° c. 12°/18° d. 18°/24°
5. Between 60N and 60S, the minimum duration of Civil Twilight is?
a. 21 minutes b. 16 minutes c. 14 minutes d. 30 minutes
6. Sunrise/Sunset Twilight Tables in the Air Almanac are listed for a sea level situation. An aircraft flying at FL350 would experience sunrise _____________ , sunset ___________ and the length of twilight would ____________
Sunrise Sunset Duration of Twilight
a. later earlier be longer b. earlier later not change c. later earlier not change d. earlier later be shorter

462
Time (3)Chapter 27
QUESTIONS 2
Answer required to the nearest minute for the date and position given in the question.
All dates refer to the air almanac extract.
Consider summer or daylight saving time only when indicated in the question.
1. For position 3000S 12414E) on 9th August, what is the LMT of:
a. Sunriseb. Sunsetc. Beginning of morning of civil twilightd. End of evening of civil twilight
2. Give the duration of morning civil twilight for all positions in latitude 55N on 28th June.What is the meaning of the following symbols which appear in the Air Almanac Extract
i) ii) iii) ////
3. What is the UTC of sunset at KARACHI (2454N 06710E) PAKISTAN on 18th August? Give also the duration of evening civil twilight there on the same date.
4. Determine the interval between the end of evening civil twilight on 14th October and the beginning of morning civil twilight on 15th October for any position in latitude 60N.
5. For PERTH (3157S 11557E) WESTERN AUSTRALIA on 3rd January:-
a. What is the LMT of sunrise?b. What is the UTC of sunset?c. What is the Standard Time of the end of evening civil twilight?
6. For BUENOS AIRES (3500S 05229W) ARGENTINA:-
a. Give the UTC of sunrise on 9th Septemberb. Give the Standard Time of sunset on 25th July
7. At 1500 UTC on 4th July what is the time shown below:
a. NEW YORK, USA (Daylight Saving Time)? b. CHRISTMAS ISLAND, INDIAN OCEAN? c. ALGERIA?d. TONGA ISLAND?
8. What is the UTC and date at the times shown below?
a. 0400 Standard Time on 5th November in MADRID (4026N 00332W) SPAIN?b. 1215 LMT on 10th July in WELLINGTON (4100S 17446E) NEW ZEALAND?c. 2200 UTC on 18th September on the Flight Operations clock at SINGAPORE
INTERNATIONAL?

463
Chapter 27Time (3)
9. What is the difference in hours and minutes between the LMT in KABUL (3430N 07000E) and the LMT in THULE (6930N 05400W) and which place is fast on the other?
10. An aircraft leaves ROME (4150N 01230E) at sunset on 3rd August and after a direct flight lands at NEW YORK (4000N 07500W) USA, at the end of evening civil twilight on the same day. Calculate the flight time.
11. An aircraft leaves TOKYO (3600N 14000E) JAPAN an hour after sunrise on 14th November and lands in HAWAII (2200N 15752W) USA 6 hours 12 minutes later. What is the standard time and date of landing in HAWAII?
12. On 29th October an observer in longitude 01815E sees the sun rise at 0355 UTC what is his latitude?
13. An observer in SOUTH GEORGIA (6000S 03715W) sees the sun set at a watch time of 2257 on19th November. Is the watch fast or slow on UTC and by how much?
14. An aircraft must land at ANCHORAGE (6100N 14900W) ALASKA, USA, at the end of the evening civil twilight on 25th September. The estimated flight time from HONG KONG (2200N 10914E) is 10 hours 45 minutes. What is the latest possible standard time and date of departure from HONG KONG?
15. What is the LMT and date at A (35N 178W) when it is 2020 LMT on 28th October at B (70S 176E)?

464
Time (3)Chapter 27
ANSWERS 1
1 B
2 C
3 F
4 B
5 A
6 D
ANSWERS 2
SR Sunrise MCT Beginning of Morning Civil TwilightSS Sunset ECT End of Evening Civil Twilight
Question 1SR 0640 LMT MCT 0615 LMTSS 1732 LMT ECT 1757 LMT
Question 2a. SR 28 June @ 55°N 0323 LMT MCT 0225 LMT Duration of MCT 58 minutes.
b. Sun remains continuously above the horizon.
Sun remains continuously below the horizon.
//// Permanent twilight during the time the sun is below the horizon.
Question 3SS 1833 LMT - 0429 Arc to time 1404 UTC
ECT 1857SS 1833Duration of ECT 24 minutes.
Question 414 OCT ECT 1738 LMT15 OCT MCT 0556 LMT Time between 1218

465
Chapter 27Time (3)
Question 5SR 0458 LMT SS 1910 LMT 0744 Arc to timeSS 1126 UTC
ECT 1938 LMT 0744 Arc to time 1154 UTC + 0800 ST correctionECT 1954 ST
Question 6SR @ 35S 0609 LMT 0330 Arc to time SR 0939 UTC
SS 1713 LMT 0330 Arc to timeSS 2043 UTC 0300 ST correctionSS 1743 ST
Question 7a. 1100 DST 4 July b. 2200 ST 4 Julyc. 1600 ST 4 July d. 0400 ST 5 July
Question 8a. 0300 UTC 5 Novemberb. 1215 LMT 1139 Arc to time 0036 UTC 10 Julyc. 2200 18 September
Question 9D.Long. 124°00’Arc to time 08:16Kabul is 8 Hrs 16 minutes FAST on Thule
Question 10SS Rome 1917 LMT 0050 Arc to timeSS 1827 UTC
ECT NY 1942 LMT 0500 Arc to time 0042 UTC
Flight time 1827 UTC to 0042 UTC = 06:15

466
Time (3)Chapter 27
Question 11SR Tokyo 0634 LMT 14 NovemberTake off 0734 LMT 0920 Arc to time Take off 2214 UTC 13 NovemberFlight time 0612Land 0426 UTC 14 NovemberFor ST - 1000Land 1826 ST Hawaii
Question 12SR 0355 UTC 0113 Arc to timeSR 0508 LMT
Latitude is 30S
Question 13SS 2026 LMT South Georgia 0229 Arc to timeSS 2255 UTCObservers watch is 2 minutes FAST on UTC.
Question 14ECT 1836 LMT Anchorage 25 Sept. + 0956 Arc to timeECT 0432 UTC 26 Sept - 1045 Flight time 1747 UTC Take off 25 Sept + 0800 Standard time correction 0147 ST Hong Kong 26 September
Question 15 2020 LMT - 1144 Arc to time 176E 0836 UTC 28 October - 1152 Arc to time 178W 2044 LMT 27 October

467
Chapter 27Time (3)
AIR ALMANAC EXTRACTThese pages have been reproduced by kind permission of the Controller, Her Majesty’s Stationery Office.
SUNRISE
Lat.
°
Dec. January February
30 2 5 8 11 14 17 20 23 26 29 1 4 7 10 13 16
h m h m h m h m h m h m h m h m h m h m h m h m h m h m h m h m h m
N72 11 51 11 00 10 31 10 07 09 46 09 27 09 08 08 51
70 11 53 11 09 10 44 10 23 10 05 09 48 09 32 09 16 09 01 08 46 31
68 11 32 11 11 10 55 10 40 10 25 10 12 09 58 09 45 09 32 09 19 09 07 08 54 08 41 28 16
66 10 31 10 26 10 20 10 13 10 05 09 57 09 48 09 38 29 09 19 09 08 08 58 08 47 36 26 15 08 04
64 09 51 09 49 09 45 09 40 09 35 29 22 09 14 09 06 08 58 08 50 41 32 22 13 08 03 07 53
62 24 22 19 09 16 09 12 09 07 09 01 08 55 08 49 42 34 27 19 10 08 02 07 53 44
N60 09 03 09 02 09 00 08 57 08 54 08 50 08 45 08 40 08 34 08 28 08 22 08 15 08 08 08 00 07 53 07 45 07 37
58 08 46 08 45 08 44 42 39 35 31 27 22 17 11 08 05 07 58 07 52 45 37 30
56 32 31 30 28 26 23 19 15 11 08 06 08 01 07 56 50 44 38 31 24
54 19 19 18 16 14 12 09 08 06 08 02 07 57 07 53 48 42 37 31 25 19
52 08 08 08 08 08 07 08 06 08 04 08 02 08 00 07 57 07 53 49 45 41 36 31 25 20 14
N50 07 58 07 58 07 58 07 57 07 56 07 54 07 51 07 49 07 46 07 42 07 38 07 34 07 30 07 25 07 20 07 15 07 10
45 38 38 38 38 37 35 34 32 29 27 24 20 17 13 09 07 05 07 00
40 22 22 22 22 21 21 19 18 16 14 12 07 09 07 06 07 03 07 00 06 56 06 52
35 07 08 07 08 07 08 07 08 07 08 07 08 07 07 07 06 07 05 07 03 07 01 06 59 06 57 06 54 06 52 49 46
30 06 55 06 56 06 57 06 57 06 57 06 57 06 56 06 56 06 55 06 54 06 52 51 49 47 45 42 40
N20 06 34 06 35 06 36 06 37 06 37 06 38 06 38 06 38 06 38 06 37 06 36 06 36 06 35 06 33 06 32 06 31 06 29
N10 06 16 17 18 19 20 21 22 22 22 23 23 22 22 22 21 20 20
0 05 59 06 00 06 02 06 03 06 04 06 05 06 06 06 07 06 08 06 09 06 10 06 10 06 10 06 11 11 11 11
S10 41 05 43 05 45 05 46 05 48 05 49 05 51 05 52 05 54 05 55 05 56 05 57 05 59 05 59 06 00 06 01 06 02
20 23 24 26 28 30 32 34 36 38 40 42 44 45 47 05 49 05 50 05 52
S30 05 01 05 03 05 05 05 07 05 10 05 12 05 15 05 18 05 20 05 23 05 26 05 28 05 31 05 33 05 36 05 38 05 41
35 04 48 04 50 04 52 04 55 04 58 05 01 05 03 05 07 05 10 13 16 19 22 25 28 31 34
40 33 35 38 41 44 04 47 04 50 04 54 04 57 05 01 05 05 05 08 12 16 20 23 27
45 04 15 04 18 04 21 24 27 31 35 39 43 04 47 04 52 04 56 05 00 05 05 05 09 14 18
50 03 53 03 56 03 59 04 03 04 07 11 16 20 25 30 36 41 04 46 04 51 04 57 05 02 07
S52 03 42 03 45 03 49 03 53 03 57 04 02 04 07 04 12 04 17 04 22 04 28 04 34 04 39 04 45 04 51 04 57 05 02
54 30 33 37 41 46 03 51 03 56 04 02 04 08 14 20 26 32 38 45 51 04 57
56 16 20 24 28 33 39 45 03 51 03 57 04 04 04 10 17 24 30 37 44 51
58 03 00 03 04 03 08 03 13 19 25 31 38 45 03 52 03 59 04 07 14 22 29 37 44
S60 02 40 02 44 02 49 02 55 03 01 03 08 03 15 03 23 03 31 03 39 03 47 03 55 04 03 04 12 04 20 04 28 04 36
SUNSET
Dec. January February30 2 5 8 11 14 17 20 23 26 29 1 4 7 10 13 16h m h m h m h m h m h m h m h m h m h m h m h m h m h m h m h m h m
N72 12 36 13 27 13 57 14 22 14 44 15 03 15 22 15 3970 12 30 13 14 13 41 14 03 14 22 14 40 14 58 15 14 29 15 44 15 5968 12 38 13 02 13 21 13 38 13 55 14 11 14 26 14 41 14 55 15 09 15 22 36 15 49 16 01 16 1466 13 34 13 41 13 50 14 00 14 10 14 21 14 32 14 44 14 56 15 07 15 19 30 42 15 53 16 04 15 2664 14 14 14 19 14 25 33 14 41 14 49 14 59 15 08 15 18 27 37 15 47 15 57 16 07 17 27 3662 14 41 14 45 14 51 14 57 15 04 15 11 15 19 27 35 44 15 52 16 01 16 10 19 28 36 4560 15 02 15 06 15 11 15 16 15 22 15 29 15 36 15 43 15 50 15 58 16 05 16 13 16 21 16 29 16 37 16 45 16 5258 19 23 27 32 37 43 15 49 15 56 16 02 16 09 16 23 30 38 45 52 16 5956 34 37 41 45 15 50 15 55 16 01 16 07 13 19 26 32 39 45 52 16 58 17 0554 46 15 49 15 53 15 57 16 02 16 06 12 17 22 28 34 40 46 52 16 58 17 04 1052 15 57 16 00 16 03 16 07 11 16 21 26 31 36 42 47 53 16 58 17 04 09 1550 16 07 16 09 16 13 16 16 16 20 16 25 16 29 16 34 16 38 16 43 16 48 16 53 16 59 17 04 17 09 17 14 17 1945 27 30 33 36 39 43 16 47 16 50 16 55 16 59 17 03 17 07 17 12 16 20 24 2940 44 16 46 16 49 16 51 16 54 16 58 17 01 17 04 17 08 17 11 15 19 22 26 29 33 3635 16 58 17 00 17 02 17 05 17 07 17 10 13 16 19 22 25 28 31 35 37 40 4330 17 10 12 14 16 19 21 24 27 29 32 34 37 39 42 44 47 17 4920 17 31 17 32 17 34 17 36 17 38 17 40 17 42 17 44 17 46 17 48 17 50 17 52 17 54 17 55 17 57 17 58 18 0010 17 49 17 51 17 52 17 54 17 55 17 57 17 58 18 00 18 01 18 03 18 04 18 05 18 06 18 07 18 07 18 08 090 18 06 18 08 18 09 18 10 18 11 18 13 18 14 15 15 16 17 17 17 18 18 18 1810 24 25 26 27 28 29 29 29 30 30 30 30 29 29 28 27 2620 18 42 18 43 18 44 18 45 18 45 18 46 18 46 18 46 18 45 18 45 18 44 43 42 41 39 38 3630 19 04 19 05 19 05 19 06 19 06 19 05 19 05 19 04 19 03 19 02 19 00 18 59 18 57 18 55 18 52 18 50 18 4735 17 17 18 18 17 17 16 15 13 12 10 19 08 19 05 19 03 19 00 18 57 18 5340 32 32 32 32 31 30 29 27 26 23 21 18 15 12 08 19 05 19 0145 19 50 19 50 19 49 19 49 19 48 19 46 19 44 19 42 40 37 34 30 27 23 18 14 0950 20 12 20 12 20 11 20 10 20 08 20 06 20 03 20 01 19 57 19 54 50 45 41 36 31 25 2052 20 22 20 22 20 21 20 20 20 18 20 15 20 12 20 09 20 06 20 01 19 57 19 52 19 47 19 42 19 36 19 31 19 2554 34 34 33 31 29 26 23 19 15 10 20 05 20 00 19 55 49 43 36 3056 20 48 20 48 20 46 44 41 38 34 30 25 20 15 09 20 03 19 56 50 43 3658 21 05 21 04 21 02 20 59 20 56 20 52 20 47 43 37 31 25 19 12 20 05 19 58 50 43S60 21 25 21 23 21 20 21 17 21 13 21 08 21 03 20 58 20 51 20 45 20 38 20 30 20 23 20 15 20 07 19 59 19 50
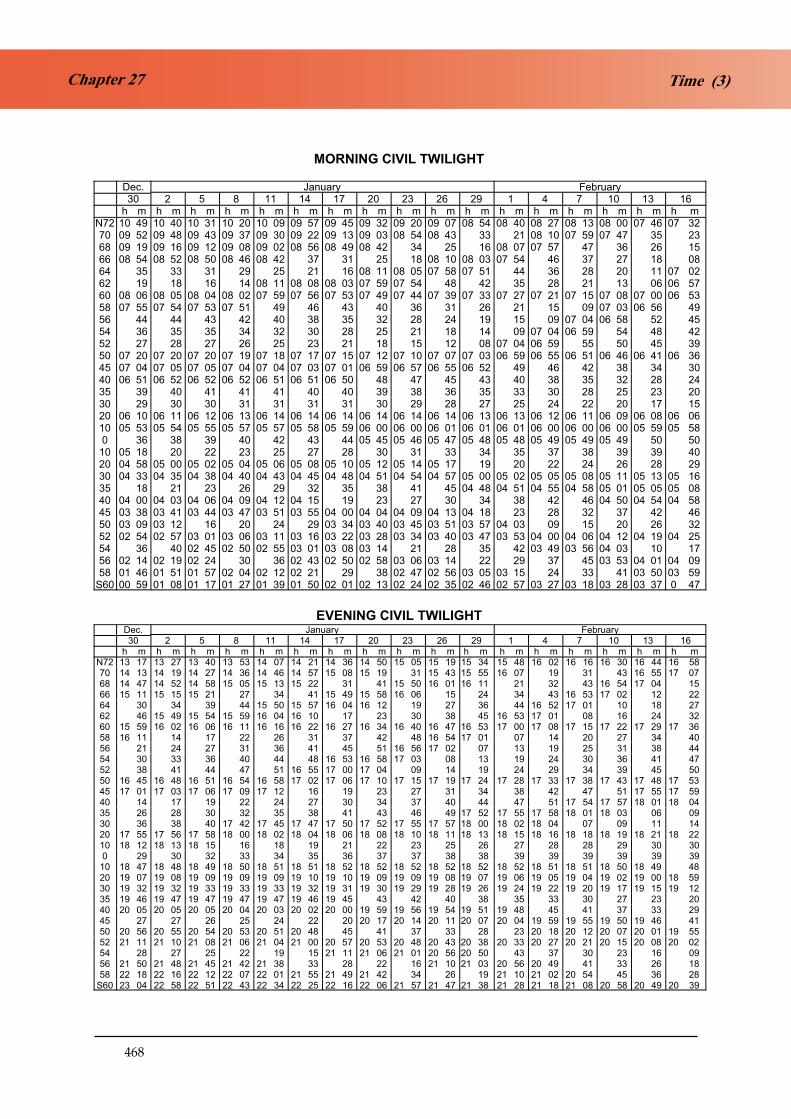
468
Chapter 27 Time (3)
MORNING CIVIL TWILIGHT
Dec. January February30 2 5 8 11 14 17 20 23 26 29 1 4 7 10 13 16h m h m h m h m h m h m h m h m h m h m h m h m h m h m h m h m h m
N72 10 49 10 40 10 31 10 20 10 09 09 57 09 45 09 32 09 20 09 07 08 54 08 40 08 27 08 13 08 00 07 46 07 3270 09 52 09 48 09 43 09 37 09 30 09 22 09 13 09 03 08 54 08 43 33 21 08 10 07 59 07 47 35 2368 09 19 09 16 09 12 09 08 09 02 08 56 08 49 08 42 34 25 16 08 07 07 57 47 36 26 1566 08 54 08 52 08 50 08 46 08 42 37 31 25 18 08 10 08 03 07 54 46 37 27 18 0864 35 33 31 29 25 21 16 08 11 08 05 07 58 07 51 44 36 28 20 11 07 0262 19 18 16 14 08 11 08 08 08 03 07 59 07 54 48 42 35 28 21 13 06 06 5760 08 06 08 05 08 04 08 02 07 59 07 56 07 53 07 49 07 44 07 39 07 33 07 27 07 21 07 15 07 08 07 00 06 5358 07 55 07 54 07 53 07 51 49 46 43 40 36 31 26 21 15 09 07 03 06 56 4956 44 44 43 42 40 38 35 32 28 24 19 15 09 07 04 06 58 52 4554 36 35 35 34 32 30 28 25 21 18 14 09 07 04 06 59 54 48 4252 27 28 27 26 25 23 21 18 15 12 08 07 04 06 59 55 50 45 3950 07 20 07 20 07 20 07 19 07 18 07 17 07 15 07 12 07 10 07 07 07 03 06 59 06 55 06 51 06 46 06 41 06 3645 07 04 07 05 07 05 07 04 07 04 07 03 07 01 06 59 06 57 06 55 06 52 49 46 42 38 34 3040 06 51 06 52 06 52 06 52 06 51 06 51 06 50 48 47 45 43 40 38 35 32 28 2435 39 40 41 41 41 40 40 39 38 36 35 33 30 28 25 23 2030 29 30 30 31 31 31 31 30 29 28 27 25 24 22 20 17 1520 06 10 06 11 06 12 06 13 06 14 06 14 06 14 06 14 06 14 06 14 06 13 06 13 06 12 06 11 06 09 06 08 06 0610 05 53 05 54 05 55 05 57 05 57 05 58 05 59 06 00 06 00 06 01 06 01 06 01 06 00 06 00 06 00 05 59 05 580 36 38 39 40 42 43 44 05 45 05 46 05 47 05 48 05 48 05 49 05 49 05 49 50 5010 05 18 20 22 23 25 27 28 30 31 33 34 35 37 38 39 39 4020 04 58 05 00 05 02 05 04 05 06 05 08 05 10 05 12 05 14 05 17 19 20 22 24 26 28 2930 04 33 04 35 04 38 04 40 04 43 04 45 04 48 04 51 04 54 04 57 05 00 05 02 05 05 05 08 05 11 05 13 05 1635 18 21 23 26 29 32 35 38 41 45 04 48 04 51 04 55 04 58 05 01 05 05 05 0840 04 00 04 03 04 06 04 09 04 12 04 15 19 23 27 30 34 38 42 46 04 50 04 54 04 5845 03 38 03 41 03 44 03 47 03 51 03 55 04 00 04 04 04 09 04 13 04 18 23 28 32 37 42 4650 03 09 03 12 16 20 24 29 03 34 03 40 03 45 03 51 03 57 04 03 09 15 20 26 3252 02 54 02 57 03 01 03 06 03 11 03 16 03 22 03 28 03 34 03 40 03 47 03 53 04 00 04 06 04 12 04 19 04 2554 36 40 02 45 02 50 02 55 03 01 03 08 03 14 21 28 35 42 03 49 03 56 04 03 10 1756 02 14 02 19 02 24 30 36 02 43 02 50 02 58 03 06 03 14 22 29 37 45 03 53 04 01 04 0958 01 46 01 51 01 57 02 04 02 12 02 21 29 38 02 47 02 56 03 05 03 15 24 33 41 03 50 03 59S60 00 59 01 08 01 17 01 27 01 39 01 50 02 01 02 13 02 24 02 35 02 46 02 57 03 27 03 18 03 28 03 37 0 47
EVENING CIVIL TWILIGHTDec. January February30 2 5 8 11 14 17 20 23 26 29 1 4 7 10 13 16h m h m h m h m h m h m h m h m h m h m h m h m h m h m h m h m h m
N72 13 17 13 27 13 40 13 53 14 07 14 21 14 36 14 50 15 05 15 19 15 34 15 48 16 02 16 16 16 30 16 44 16 5870 14 13 14 19 14 27 14 36 14 46 14 57 15 08 15 19 31 15 43 15 55 16 07 19 31 43 16 55 17 0768 14 47 14 52 14 58 15 05 15 13 15 22 31 41 15 50 16 01 16 11 21 32 43 16 54 17 04 1566 15 11 15 15 15 21 27 34 41 15 49 15 58 16 06 15 24 34 43 16 53 17 02 12 2264 30 34 39 44 15 50 15 57 16 04 16 12 19 27 36 44 16 52 17 01 10 18 2762 46 15 49 15 54 15 59 16 04 16 10 17 23 30 38 45 16 53 17 01 08 16 24 3260 15 59 16 02 16 06 16 11 16 16 16 22 16 27 16 34 16 40 16 47 16 53 17 00 17 08 17 15 17 22 17 29 17 3658 16 11 14 17 22 26 31 37 42 48 16 54 17 01 07 14 20 27 34 4056 21 24 27 31 36 41 45 51 16 56 17 02 07 13 19 25 31 38 4454 30 33 36 40 44 48 16 53 16 58 17 03 08 13 19 24 30 36 41 4752 38 41 44 47 51 16 55 17 00 17 04 09 14 19 24 29 34 39 45 5050 16 45 16 48 16 51 16 54 16 58 17 02 17 06 17 10 17 15 17 19 17 24 17 28 17 33 17 38 17 43 17 48 17 5345 17 01 17 03 17 06 17 09 17 12 16 19 23 27 31 34 38 42 47 51 17 55 17 5940 14 17 19 22 24 27 30 34 37 40 44 47 51 17 54 17 57 18 01 18 0435 26 28 30 32 35 38 41 43 46 49 17 52 17 55 17 58 18 01 18 03 06 0930 36 38 40 17 42 17 45 17 47 17 50 17 52 17 55 17 57 18 00 18 02 18 04 07 09 11 1420 17 55 17 56 17 58 18 00 18 02 18 04 18 06 18 08 18 10 18 11 18 13 18 15 18 16 18 18 18 19 18 21 18 2210 18 12 18 13 18 15 16 18 19 21 22 23 25 26 27 28 28 29 30 300 29 30 32 33 34 35 36 37 37 38 38 39 39 39 39 39 3910 18 47 18 48 18 49 18 50 18 51 18 51 18 52 18 52 18 52 18 52 18 52 18 52 18 51 18 51 18 50 18 49 4820 19 07 19 08 19 09 19 09 19 09 19 10 19 10 19 09 19 09 19 08 19 07 19 06 19 05 19 04 19 02 19 00 18 5930 19 32 19 32 19 33 19 33 19 33 19 32 19 31 19 30 19 29 19 28 19 26 19 24 19 22 19 20 19 17 19 15 19 1235 19 46 19 47 19 47 19 47 19 47 19 46 19 45 43 42 40 38 35 33 30 27 23 2040 20 05 20 05 20 05 20 04 20 03 20 02 20 00 19 59 19 56 19 54 19 51 19 48 45 41 37 33 2945 27 27 26 25 24 22 20 20 17 20 14 20 11 20 07 20 04 19 59 19 55 19 50 19 46 4150 20 56 20 55 20 54 20 53 20 51 20 48 45 41 37 33 28 23 20 18 20 12 20 07 20 01 19 5552 21 11 21 10 21 08 21 06 21 04 21 00 20 57 20 53 20 48 20 43 20 38 20 33 20 27 20 21 20 15 20 08 20 0254 28 27 25 22 19 15 21 11 21 06 21 01 20 56 20 50 43 37 30 23 16 0956 21 50 21 48 21 45 21 42 21 38 33 28 22 16 21 10 21 03 20 56 20 49 41 33 26 1858 22 18 22 16 22 12 22 07 22 01 21 55 21 49 21 42 34 26 19 21 10 21 02 20 54 45 36 28S60 23 04 22 58 22 51 22 43 22 34 22 25 22 16 22 06 21 57 21 47 21 38 21 28 21 18 21 08 20 58 20 49 20 39
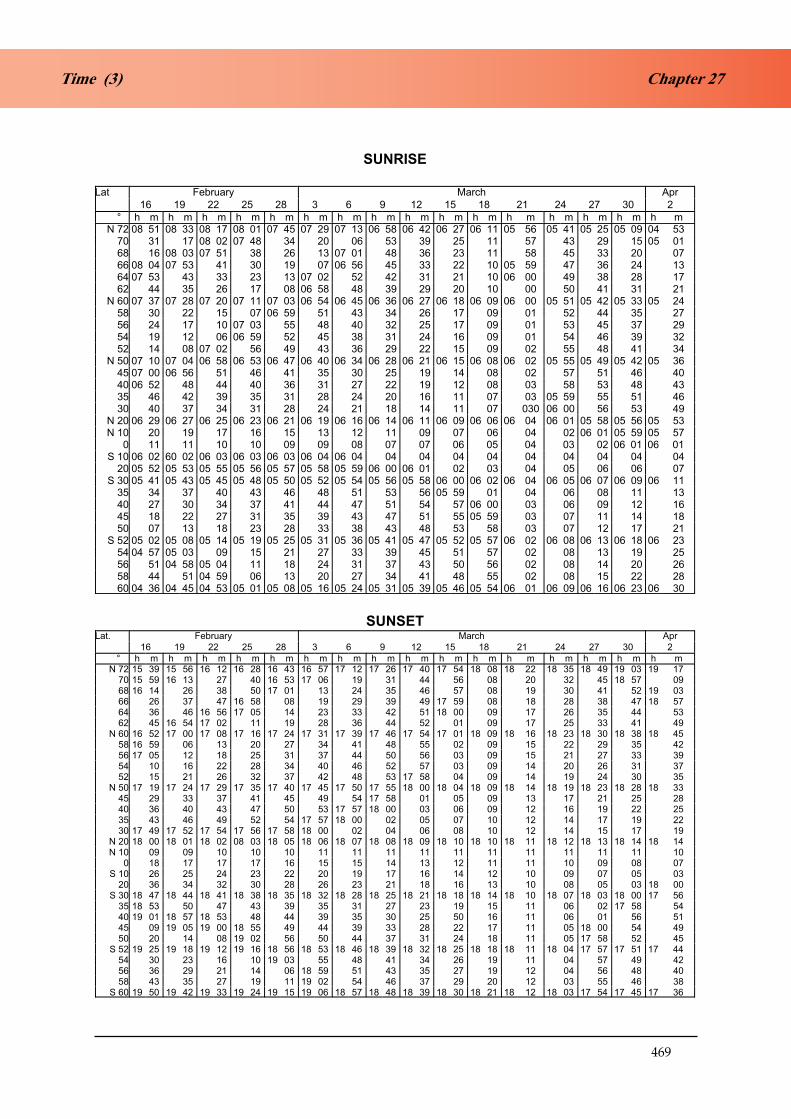
469
Chapter 27Time (3)
SUNRISE
Lat February March Apr
16 19 22 25 28 3 6 9 12 15 18 21 24 27 30 2
° h m h m h m h m h m h m h m h m h m h m h m h m h m h m h m h mN 72 08 51 08 33 08 17 08 01 07 45 07 29 07 13 06 58 06 42 06 27 06 11 05 56 05 41 05 25 05 09 04 53
70 31 17 08 02 07 48 34 20 06 53 39 25 11 57 43 29 15 05 0168 16 08 03 07 51 38 26 13 07 01 48 36 23 11 58 45 33 20 0766 08 04 07 53 41 30 19 07 06 56 45 33 22 10 05 59 47 36 24 1364 07 53 43 33 23 13 07 02 52 42 31 21 10 06 00 49 38 28 1762 44 35 26 17 08 06 58 48 39 29 20 10 00 50 41 31 21
N 60 07 37 07 28 07 20 07 11 07 03 06 54 06 45 06 36 06 27 06 18 06 09 06 00 05 51 05 42 05 33 05 2458 30 22 15 07 06 59 51 43 34 26 17 09 01 52 44 35 2756 24 17 10 07 03 55 48 40 32 25 17 09 01 53 45 37 2954 19 12 06 06 59 52 45 38 31 24 16 09 01 54 46 39 3252 14 08 07 02 56 49 43 36 29 22 15 09 02 55 48 41 34
N 50 07 10 07 04 06 58 06 53 06 47 06 40 06 34 06 28 06 21 06 15 06 08 06 02 05 55 05 49 05 42 05 3645 07 00 06 56 51 46 41 35 30 25 19 14 08 02 57 51 46 4040 06 52 48 44 40 36 31 27 22 19 12 08 03 58 53 48 4335 46 42 39 35 31 28 24 20 16 11 07 03 05 59 55 51 4630 40 37 34 31 28 24 21 18 14 11 07 030 06 00 56 53 49
N 20 06 29 06 27 06 25 06 23 06 21 06 19 06 16 06 14 06 11 06 09 06 06 06 04 06 01 05 58 05 56 05 53N 10 20 19 17 16 15 13 12 11 09 07 06 04 02 06 01 05 59 05 57
0 11 11 10 10 09 09 08 07 07 06 05 04 03 02 06 01 06 01S 10 06 02 60 02 06 03 06 03 06 03 06 04 06 04 04 04 04 04 04 04 04 04 04
20 05 52 05 53 05 55 05 56 05 57 05 58 05 59 06 00 06 01 02 03 04 05 06 06 07S 30 05 41 05 43 05 45 05 48 05 50 05 52 05 54 05 56 05 58 06 00 06 02 06 04 06 05 06 07 06 09 06 11
35 34 37 40 43 46 48 51 53 56 05 59 01 04 06 08 11 1340 27 30 34 37 41 44 47 51 54 57 06 00 03 06 09 12 1645 18 22 27 31 35 39 43 47 51 55 05 59 03 07 11 14 1850 07 13 18 23 28 33 38 43 48 53 58 03 07 12 17 21
S 52 05 02 05 08 05 14 05 19 05 25 05 31 05 36 05 41 05 47 05 52 05 57 06 02 06 08 06 13 06 18 06 2354 04 57 05 03 09 15 21 27 33 39 45 51 57 02 08 13 19 2556 51 04 58 05 04 11 18 24 31 37 43 50 56 02 08 14 20 2658 44 51 04 59 06 13 20 27 34 41 48 55 02 08 15 22 2860 04 36 04 45 04 53 05 01 05 08 05 16 05 24 05 31 05 39 05 46 05 54 06 01 06 09 06 16 06 23 06 30
SUNSETLat. February March Apr
16 19 22 25 28 3 6 9 12 15 18 21 24 27 30 2
° h m h m h m h m h m h m h m h m h m h m h m h m h m h m h m h mN 72 15 39 15 56 16 12 16 28 16 43 16 57 17 12 17 26 17 40 17 54 18 08 18 22 18 35 18 49 19 03 19 17
70 15 59 16 13 27 40 16 53 17 06 19 31 44 56 08 20 32 45 18 57 0968 16 14 26 38 50 17 01 13 24 35 46 57 08 19 30 41 52 19 0366 26 37 47 16 58 08 19 29 39 49 17 59 08 18 28 38 47 18 5764 36 46 16 56 17 05 14 23 33 42 51 18 00 09 17 26 35 44 5362 45 16 54 17 02 11 19 28 36 44 52 01 09 17 25 33 41 49
N 60 16 52 17 00 17 08 17 16 17 24 17 31 17 39 17 46 17 54 17 01 18 09 18 16 18 23 18 30 18 38 18 4558 16 59 06 13 20 27 34 41 48 55 02 09 15 22 29 35 4256 17 05 12 18 25 31 37 44 50 56 03 09 15 21 27 33 3954 10 16 22 28 34 40 46 52 57 03 09 14 20 26 31 3752 15 21 26 32 37 42 48 53 17 58 04 09 14 19 24 30 35
N 50 17 19 17 24 17 29 17 35 17 40 17 45 17 50 17 55 18 00 18 04 18 09 18 14 18 19 18 23 18 28 18 3345 29 33 37 41 45 49 54 17 58 01 05 09 13 17 21 25 2840 36 40 43 47 50 53 17 57 18 00 03 06 09 12 16 19 22 2535 43 46 49 52 54 17 57 18 00 02 05 07 10 12 14 17 19 2230 17 49 17 52 17 54 17 56 17 58 18 00 02 04 06 08 10 12 14 15 17 19
N 20 18 00 18 01 18 02 08 03 18 05 18 06 18 07 18 08 18 09 18 10 18 10 18 11 18 12 18 13 18 14 18 14N 10 09 09 10 10 10 11 11 11 11 11 11 11 11 11 11 10
0 18 17 17 17 16 15 15 14 13 12 11 11 10 09 08 07S 10 26 25 24 23 22 20 19 17 16 14 12 10 09 07 05 03
20 36 34 32 30 28 26 23 21 18 16 13 10 08 05 03 18 00S 30 18 47 18 44 18 41 18 38 18 35 18 32 18 28 18 25 18 21 18 18 18 14 18 10 18 07 18 03 18 00 17 56
35 18 53 50 47 43 39 35 31 27 23 19 15 11 06 02 17 58 5440 19 01 18 57 18 53 48 44 39 35 30 25 50 16 11 06 01 56 5145 09 19 05 19 00 18 55 49 44 39 33 28 22 17 11 05 18 00 54 4950 20 14 08 19 02 56 50 44 37 31 24 18 11 05 17 58 52 45
S 52 19 25 19 18 19 12 19 16 18 56 18 53 18 46 18 39 18 32 18 25 18 18 18 11 18 04 17 57 17 51 17 4454 30 23 16 10 19 03 55 48 41 34 26 19 11 04 57 49 4256 36 29 21 14 06 18 59 51 43 35 27 19 12 04 56 48 4058 43 35 27 19 11 19 02 54 46 37 29 20 12 03 55 46 38
S 60 19 50 19 42 19 33 19 24 19 15 19 06 18 57 18 48 18 39 18 30 18 21 18 12 18 03 17 54 17 45 17 36

470
Chapter 27 Time (3)
MORNING CIVIL TWILIGHT
Lat. February March Apr
16 19 22 25 28 3 6 9 12 15 18 21 24 27 30 2
° h m h m h m h m h m h m h m h m h m h m h m h m h m h m h m h mN 72 07 32 07 18 07 04 06 50 06 35 06 20 06 06 05 51 05 35 05 20 05 04 04 48 04 31 04 14 03 57 03 38
70 23 10 06 58 45 32 19 05 52 38 24 10 04 56 41 26 04 11 03 5568 15 07 04 52 41 29 17 05 53 41 28 15 05 02 49 36 22 04 0866 08 06 58 48 37 27 16 05 54 42 31 19 08 04 56 44 31 1964 07 02 53 44 34 25 15 05 54 44 33 23 12 05 01 50 39 2762 06 57 49 41 32 23 16 04 55 45 36 26 16 06 04 56 45 35
N 60 06 53 06 45 06 39 06 29 06 21 06 13 06 04 05 55 05 46 05 37 05 28 05 19 05 10 05 00 04 51 04 4158 49 42 35 27 19 12 04 55 47 39 30 22 13 40 40 56 4756 45 39 32 25 18 10 03 55 48 40 32 24 16 08 05 00 5154 42 36 30 23 17 10 03 55 48 41 33 26 18 11 03 5652 39 34 28 22 15 09 02 56 49 42 35 28 21 14 07 04 59
N 50 06 36 06 31 06 25 06 20 06 14 06 08 06 02 05 56 05 49 05 43 05 36 05 30 05 23 05 16 05 10 05 0345 30 25 21 16 11 06 06 01 55 50 44 39 33 27 22 16 1040 24 21 17 13 08 04 05 59 55 50 46 41 36 31 26 21 1635 20 16 13 10 06 02 58 54 50 46 42 39 34 29 25 2130 15 12 1 07 06 04 06 00 57 54 50 47 43 39 36 32 28 25
N 20 06 06 06 05 06 03 06 01 05 59 05 56 05 54 05 52 05 49 05 47 05 44 05 42 05 39 05 39 05 34 05 31N 10 05 58 05 57 05 56 05 55 54 53 51 50 48 46 45 43 41 40 39 36
0 50 4 49 49 48 48 47 47 46 45 44 43 42 42 41 40S 10 40 41 41 42 42 42 43 43 43 43 43 43 43 43 43 43
20 29 31 32 34 35 36 37 38 39 40 41 42 43 44 44 45S 30 05 16 05 18 05 21 05 23 05 26 05 28 05 30 05 32 05 34 05 36 05 38 05 40 05 42 05 44 05 45 05 47
35 05 08 11 14 17 20 23 25 28 31 33 36 38 41 43 45 4840 04 58 05 02 05 06 09 13 16 20 23 26 30 33 36 39 42 45 4845 46 04 51 04 56 05 00 05 05 09 13 18 22 26 30 34 38 41 45 4950 32 38 43 04 49 04 54 05 00 05 10 15 21 25 30 35 40 44 49
S 52 04 25 04 31 04 38 04 44 04 50 04 55 05 01 05 07 05 1 05 18 05 23 05 29 05 34 05 39 05 44 05 4954 17 24 31 38 44 51 04 57 05 03 09 15 21 27 32 28 44 4956 04 09 16 24 31 38 45 52 04 59 05 12 18 25 31 37 43 4958 03 59 04 07 15 23 31 39 47 54 05 01 08 15 22 29 36 42 49
S 60 03 47 03 56 04 06 04 15 04 23 04 32 04 40 04 48 04 57 05 04 05 12 05 20 05 27 05 34 05 42 05 49
EVENING CIVIL TWILIGHTLat. February March Apr
16 19 22 25 28 3 6 9 12 15 18 21 24 27 30 2
° h m h m h m h m h m h m h m h m h m h m h m h m h m h m h m h mN 72 16 58 17 12 17 26 17 39 17 53 18 06 18 20 18 34 18 48 1 02 19 16 19 30 19 45 20 01 20 17 20 34
70 17 07 20 32 44 56 08 20 32 44 18 57 09 22 35 19 48 20 02 1668 15 26 37 47 17 58 09 20 31 42 53 04 15 27 38 19 50 20 0366 22 31 41 51 18 00 10 20 30 40 50 19 00 10 20 30 41 19 5264 27 36 45 54 02 11 20 29 38 47 18 45 05 14 24 33 4362 32 40 48 56 04 12 20 28 36 45 53 19 01 09 18 26 35
N 60 17 36 17 44 17 51 17 59 18 06 18 13 18 21 18 28 18 35 18 43 18 50 18 58 19 05 19 13 19 21 19 2958 40 47 54 18 01 07 14 21 28 34 41 48 55 19 02 09 16 2356 44 50 56 02 09 15 21 27 33 40 46 52 18 58 05 11 1754 47 53 17 58 04 10 16 21 27 33 38 44 50 56 19 01 07 1352 50 55 18 01 06 11 16 22 27 32 37 43 48 53 18 58 04 09
N 50 17 53 17 58 18 02 18 07 18 12 18 17 18 22 18 27 18 31 18 36 18 41 18 46 18 51 18 56 19 01 19 0645 17 59 18 03 07 11 15 19 23 27 31 35 38 42 46 50 18 54 18 5840 18 04 08 11 14 17 21 24 27 31 33 36 40 43 46 49 5235 09 12 15 17 20 22 25 27 31 32 35 37 40 42 45 4730 14 16 18 20 22 24 26 28 30 32 34 36 37 39 41 43
N 20 18 22 18 23 18 25 18 26 18 27 18 27 18 29 18 30 18 31 18 32 18 32 18 33 18 34 18 35 18 36 18 37N 10 30 31 31 31 32 32 32 32 32 32 32 32 32 32 32 32
0 39 38 38 37 37 36 36 35 34 33 32 31 30 30 29 28S 10 48 47 46 44 43 41 40 38 37 35 33 32 30 28 26 25
20 18 59 18 57 18 55 18 52 50 48 45 43 40 38 35 32 30 27 25 22S 30 19 12 19 09 19 06 19 03 18 59 18 56 18 52 18 49 18 45 18 42 18 28 18 34 18 31 18 27 18 23 18 20
35 20 16 13 09 19 05 19 01 18 57 53 49 44 40 36 32 27 23 1940 29 25 21 16 12 04 19 02 18 57 52 48 43 38 33 28 23 1845 41 36 30 25 20 14 08 19 03 18 57 51 46 40 34 29 23 1850 19 55 49 42 36 30 23 19 10 19 03 57 50 43 37 30 24 17
S 52 20 02 19 55 19 48 19 41 19 34 19 27 19 20 19 13 19 06 18 59 18 52 18 45 18 28 18 31 18 24 18 1754 09 20 02 19 55 47 40 32 24 17 09 19 02 54 47 39 32 24 1756 18 10 20 02 19 45 46 39 29 21 13 05 18 57 49 41 33 25 1758 28 19 10 20 01 19 52 44 35 26 17 08 19 00 51 42 34 26 17
S 60 20 39 20 29 20 19 20 10 20 00 19 50 19 41 19 31 19 22 19 12 19 03 18 54 18 44 18 35 18 26 18 17

471
Chapter 27Time (3)
SUNRISE
Lat. April May
2 5 8 11 14 17 20 23 26 29 2 5 8 11 14 17
° h m h m h m h m h m h m h m h m h m h m h m h m h m h m h m h mN 72 04 53 04 28 04 21 04 05 03 48 03 30 03 12 02 54 02 34 02 12 01 48 01 19 00 30 G G G
70 05 01 47 33 18 04 03 0 49 33 03 18 03 02 02 45 02 28 02 10 01 50 01 27 00 59 G
68 07 04 55 42 29 16 04 03 03 50 36 23 03 09 02 55 02 41 02 26 02 11 01 55 01 3866 13 05 01 49 38 26 14 04 03 03 51 39 27 03 16 03 04 02 52 02 40 02 28 02 1664 17 06 04 56 45 35 24 13 04 03 03 52 42 32 22 03 12 03 02 02 52 02 4262 21 11 05 01 52 42 32 23 13 04 04 03 54 45 36 27 19 03 11 03 02
N 60 05 24 05 15 05 06 04 57 04 48 04 19 04 30 04 22 04 13 04 05 03 57 03 49 03 41 03 33 03 26 03 1958 27 18 10 05 02 53 45 37 29 22 14 04 07 03 59 03 52 45 39 3356 29 22 14 06 04 58 51 43 36 29 22 15 04 08 04 02 03 56 03 50 4454 32 24 17 10 05 03 04 56 49 42 35 29 23 17 11 04 05 04 00 03 5552 34 27 20 13 07 05 00 54 47 41 35 29 24 18 13 08 04 04
N 50 05 36 05 29 05 23 05 17 05 10 05 04 04 58 04 52 04 47 04 41 04 36 04 30 04 25 04 21 04 16 04 1245 40 34 29 23 18 13 05 08 05 03 04 58 04 53 04 49 44 40 36 33 2940 43 39 34 29 25 20 16 11 05 07 05 03 05 00 04 56 04 52 04 49 46 4335 46 42 39 34 30 26 22 19 15 12 09 05 06 05 03 05 00 04 58 04 5530 49 45 42 38 35 32 28 25 22 19 17 14 12 10 05 08 05 06
N 20 05 53 05 51 05 48 05 46 05 43 05 41 05 38 05 36 05 34 05 32 05 30 05 29 05 27 05 26 05 25 05 23N 10 05 57 05 55 54 52 50 49 47 46 45 44 43 42 41 10 39 39
0 06 01 06 00 05 59 05 58 05 57 05 56 05 56 05 55 05 55 05 54 05 54 05 53 05 53 05 53 05 53 05 53S 10 04 04 06 04 06 04 06 04 06 04 06 0 06 04 06 04 06 04 06 05 06 05 06 05 06 06 06 06 06 07
20 07 08 09 09 10 11 12 13 14 15 16 17 18 19 20 22S 30 06 11 06 13 06 14 06 16 06 18 06 20 06 22 06 24 06 25 06 27 06 29 06 31 06 33 06 35 06 37 06 39
35 13 16 18 20 23 25 27 30 32 34 37 39 41 44 46 06 4840 16 19 22 25 28 30 33 36 39 24 25 48 06 51 06 54 06 57 07 0045 18 22 26 29 33 37 41 44 48 06 52 06 55 06 59 07 02 07 06 06 09 1350 21 26 31 35 40 45 49 54 06 58 07 03 07 07 07 12 16 20 25 29
S 52 06 23 06 28 06 33 06 38 06 43 06 48 06 53 06 58 07 06 07 08 07 13 07 18 07 23 07 27 07 32 07 3654 25 30 36 41 46 52 06 57 07 03 08 14 19 24 29 35 40 4456 26 32 28 44 50 06 56 07 02 08 14 20 26 32 37 43 48 07 5458 28 35 41 48 54 07 01 08 14 21 27 33 40 46 07 52 07 58 08 04
S 60 06 30 06 37 06 45 06 52 06 59 07 06 07 13 07 21 07 28 07 35 07 24 07 49 07 56 08 03 08 10 08 16
SUNSET
Lat. April May
2 5 8 11 14 17 20 23 26 29 2 5 8 11 14 17
° h m h m h m h m h m h m h m h m h m h m h m h m h m h m h m h mN 72 19 17 19 32 19 46 20 01 20 17 20 33 20 50 21 08 21 27 21 49 22 13 22 44 23 52 G G G
70 09 22 35 19 48 20 01 14 28 20 43 20 58 21 14 21 31 21 49 22 09 22 33 23 04 G
68 19 03 14 25 36 19 48 20 00 20 12 24 36 20 49 21 03 21 16 21 31 21 46 22 02 22 2066 28 57 07 17 27 38 19 48 19 58 20 09 19 30 20 34 20 53 21 04 21 16 21 28 21 4064 53 19 02 11 20 29 38 47 19 56 20 06 15 25 34 20 44 20 54 21 03 21 1362 49 18 57 05 13 21 29 38 46 19 54 2 03 20 11 19 28 36 20 44 20 52
N 60 18 45 18 52 19 00 19 07 19 14 19 22 19 29 19 37 19 44 19 52 19 59 20 07 20 14 20 21 20 28 20 3558 42 49 18 55 19 02 09 15 22 29 36 42 49 19 56 20 02 20 09 15 2156 39 45 51 18 58 19 04 10 16 22 28 34 40 46 19 52 19 58 20 04 20 0954 37 42 48 54 18 59 05 10 16 22 27 33 38 43 49 19 54 19 5952 35 40 45 50 55 19 00 05 11 16 21 26 31 36 40 45 50
N 50 18 33 18 37 18 42 18 47 18 51 18 56 19 01 19 06 19 10 19 15 19 19 19 24 19 29 19 33 19 37 19 4145 28 32 36 40 44 47 18 51 18 55 18 59 19 02 19 06 19 10 13 17 21 2440 25 28 31 34 37 40 43 46 49 18 52 18 55 18 58 19 01 19 04 19 07 19 1035 22 24 27 29 31 34 36 38 41 43 46 48 18 51 18 53 18 55 18 5830 19 21 23 24 26 28 30 32 34 36 38 40 42 43 45 47
N 20 18 14 18 15 18 16 18 17 18 18 18 19 18 20 18 21 18 22 18 23 18 24 18 25 18 26 18 27 18 28 18 30N 10 10 10 10 10 10 11 11 11 11 11 12 12 13 13 14 14
0 07 06 05 18 14 18 04 18 03 18 02 18 02 18 01 18 01 18 00 18 00 18 00 18 00 18 00 18 00S 10 03 18 02 18 00 17 59 17 57 17 56 17 54 17 53 17 52 17 50 17 49 17 48 17 48 17 47 17 46 17 46
20 18 00 17 58 18 55 53 50 48 46 43 41 40 38 36 35 33 32 31S 30 17 56 17 53 17 49 17 46 17 42 17 39 17 36 17 33 17 30 17 27 17 24 17 22 17 20 17 18 17 16 17 14
35 54 50 46 42 38 34 30 27 23 20 17 14 11 17 08 17 06 17 0440 51 47 42 37 33 28 24 20 16 12 17 08 17 5 17 01 16 58 16 56 16 5345 49 43 38 32 27 22 17 12 17 07 17 02 16 58 16 54 16 50 46 43 4050 45 39 32 26 20 14 08 17 02 16 57 16 51 46 41 36 32 27 23
S 52 17 44 17 37 17 30 17 23 17 17 17 10 17 04 16 58 16 52 16 46 16 40 16 35 16 30 16 25 16 20 16 1654 42 35 27 20 13 06 17 00 53 47 40 34 28 23 17 12 16 0856 40 32 25 17 10 17 02 16 55 48 41 34 27 21 15 09 16 04 15 5858 38 30 22 13 05 16 57 50 42 34 27 20 13 16 06 16 00 15 54 48
S 60 17 36 17 27 17 18 17 09 17 01 16 52 16 43 16 35 16 27 16 19 16 11 16 03 15 56 15 49 15 42 15 36

472
Chapter 27 Time (3)
MORNING CIVIL TWILIGHT
Lat. April May
2 5 8 11 14 17 20 23 26 29 2 5 8 11 14 17
° h m h m h m h m h m h m h m h m h m h m h m h m h m h m h m h mN 72 03 38 03 19 02 59 02 36 02 12 01 43 01 04 // // // // // // // // // // // // G G G
70 03 55 39 03 21 03 04 02 45 02 24 02 01 01 35 01 00 // // // // // // // // // // // // // //68 04 08 03 54 39 24 03 08 02 51 34 02 15 01 55 01 31 01 01 // // // // // // // // // //66 19 04 06 03 53 40 26 03 12 02 58 02 43 02 27 02 10 01 52 01 32 01 08 00 33 // // // //64 27 16 04 04 03 52 41 28 03 16 03 03 02 50 37 02 23 02 08 01 53 01 37 01 18 00 5762 35 24 14 04 03 03 52 41 30 19 03 08 02 57 02 45 34 02 22 02 10 01 57 01 45
N 60 04 41 01 32 04 22 04 12 04 02 03 53 03 43 03 33 03 23 03 13 03 03 02 54 02 44 02 34 02 24 02 1458 47 38 29 20 11 04 02 03 53 44 36 27 18 03 09 03 01 02 53 02 44 3656 51 43 35 27 19 10 04 02 03 54 46 38 30 23 15 03 08 03 01 02 5454 56 48 40 33 25 18 10 04 03 03 55 48 41 34 28 21 15 03 0952 04 59 52 45 38 31 24 17 10 04 04 03 57 51 44 38 32 27 21
N 50 05 03 04 56 04 50 04 43 04 36 04 30 04 23 04 17 04 11 04 05 03 59 03 53 03 48 03 42 03 37 03 3245 10 05 05 04 59 04 53 48 42 37 31 26 21 04 16 04 12 04 07 04 03 03 59 03 5540 16 11 05 06 05 01 04 57 04 52 47 43 39 34 03 26 23 19 04 16 04 1335 21 17 12 08 05 04 05 00 04 56 04 52 49 45 42 38 35 32 30 2730 25 21 18 14 10 07 05 04 05 00 04 57 04 54 04 51 04 49 04 46 04 44 04 42 04 39
N 20 05 31 05 29 05 26 05 23 05 21 05 18 05 16 05 14 05 12 05 09 05 07 05 06 05 04 05 02 05 01 05 00N 10 36 34 32 31 29 27 26 24 23 22 21 20 19 18 17 16
0 40 39 38 37 36 35 34 34 33 33 32 32 31 31 31 31S 10 43 43 43 42 42 42 42 42 42 43 43 43 43 44 44 44
20 45 46 47 47 48 49 50 51 05 51 05 52 05 53 05 54 05 55 05 56 05 57 05 58S 30 05 47 05 49 05 51 05 52 05 54 05 56 05 57 05 59 06 01 06 03 06 04 06 06 06 08 06 10 06 11 06 13
35 48 50 52 55 05 57 05 59 06 01 06 04 06 08 10 13 15 17 19 2140 48 51 54 05 57 06 00 06 03 06 09 11 14 17 20 23 25 28 3045 49 52 56 06 00 03 07 11 14 18 21 25 28 31 34 38 4150 49 54 58 03 07 12 16 20 25 29 33 37 41 45 49 53
S 52 05 49 05 54 05 59 06 04 06 09 06 14 06 18 06 23 06 28 06 32 06 37 06 41 06 46 06 50 06 54 06 5854 4 55 06 00 05 11 16 21 26 31 36 41 46 51 06 55 07 00 07 0456 49 55 01 07 12 18 24 29 35 40 46 51 06 56 07 01 06 1158 49 55 02 08 14 21 27 33 39 45 51 06 56 07 02 08 13 18
S 60 05 49 05 56 06 03 06 10 06 17 06 23 06 30 06 37 06 43 06 50 06 56 07 03 07 09 07 15 07 21 07 26
EVENING CIVIL TWILIGHTLat. April May
2 5 8 11 14 17 20 23 26 29 2 5 8 11 14 17
° h m h m h m h m h m h m h m h m h m h m h m h m h m h m h m h mN 72 20 34 20 52 21 11 21 32 21 57 22 27 23 11 // // // // // // // // // // // // G G G
70 16 31 20 47 21 03 21 21 21 41 22 04 22 31 23 11 // // // // // // // // // // // // G
68 20 03 16 29 20 43 20 57 21 12 21 29 21 47 22 07 22 32 23 05 // // // // // // // // // //66 19 52 20 03 14 26 38 20 51 21 04 21 18 21 33 21 50 22 07 22 28 22 54 23 41 // // // //64 43 19 53 20 03 13 23 34 20 45 20 57 21 09 22 21 35 21 49 22 04 22 21 22 40 23 0562 35 44 19 53 20 02 11 20 30 40 20 50 21 01 21 12 23 21 34 21 46 21 59 22 12
N 60 19 29 19 36 19 44 19 52 20 01 20 09 20 18 20 26 20 35 20 44 20 53 21 03 21 12 21 22 21 31 21 4158 23 30 37 44 19 52 19 59 20 07 15 22 30 38 20 46 20 54 21 02 21 10 1856 17 24 31 37 44 51 19 57 20 04 11 18 25 32 39 20 47 20 53 21 0054 13 19 25 31 37 43 49 19 56 20 02 20 08 14 21 27 33 39 20 4552 09 15 20 25 31 37 42 48 19 53 19 59 20 05 10 16 22 27 32
N 50 19 06 19 10 19 15 19 20 19 26 19 31 19 36 19 41 19 46 19 51 19 56 20 01 20 07 20 12 20 16 20 2145 18 58 19 02 19 06 10 14 18 22 26 30 35 39 19 43 19 47 19 51 19 55 19 5840 52 18 56 18 59 19 02 19 05 08 11 15 18 21 25 28 31 34 37 4135 47 50 52 18 55 18 57 19 00 19 02 19 05 19 08 10 13 16 18 21 23 2630 43 45 47 49 51 18 53 18 55 18 57 18 59 19 01 19 03 19 05 19 07 19 09 19 11 19 13
N 20 18 37 18 37 18 38 18 39 18 40 18 41 18 42 18 43 18 44 18 46 18 47 18 48 18 49 18 51 18 52 18 53N 10 32 32 32 32 32 32 32 32 33 33 33 34 35 35 36 37
0 28 27 26 25 25 24 23 23 23 22 22 22 22 22 22 22S 10 25 23 21 20 18 17 16 14 13 12 11 18 10 18 09 18 09 18 08 18 08
20 22 19 17 15 12 10 08 18 06 18 04 18 02 18 00 17 59 17 57 17 56 17 55 17 54S 30 18 20 18 16 18 13 18 10 18 06 18 03 18 00 17 57 17 54 17 52 17 49 17 47 17 45 17 43 17 41 17 39
35 19 15 11 07 03 18 00 17 56 53 49 46 43 40 38 35 33 3140 18 14 09 04 18 00 17 56 52 48 44 40 37 33 30 27 24 2245 18 12 07 18 02 17 56 52 47 42 37 33 29 25 21 18 15 1250 17 11 05 17 59 53 47 41 36 30 25 20 16 11 07 17 03 17 00
S 52 18 17 18 11 18 04 17 57 17 51 17 45 17 39 17 33 17 27 17 22 17 16 17 11 17 07 17 02 16 58 16 5454 17 10 03 56 49 43 36 30 24 18 12 07 17 01 16 57 52 4856 17 10 02 55 47 40 33 26 20 14 07 17 02 16 56 51 46 4158 17 09 01 53 45 38 30 23 16 09 17 02 16 56 50 44 39 34
S 60 18 17 18 09 18 00 17 51 17 43 17 35 17 27 17 19 17 11 17 04 16 57 16 50 16 43 16 37 16 31 16 26
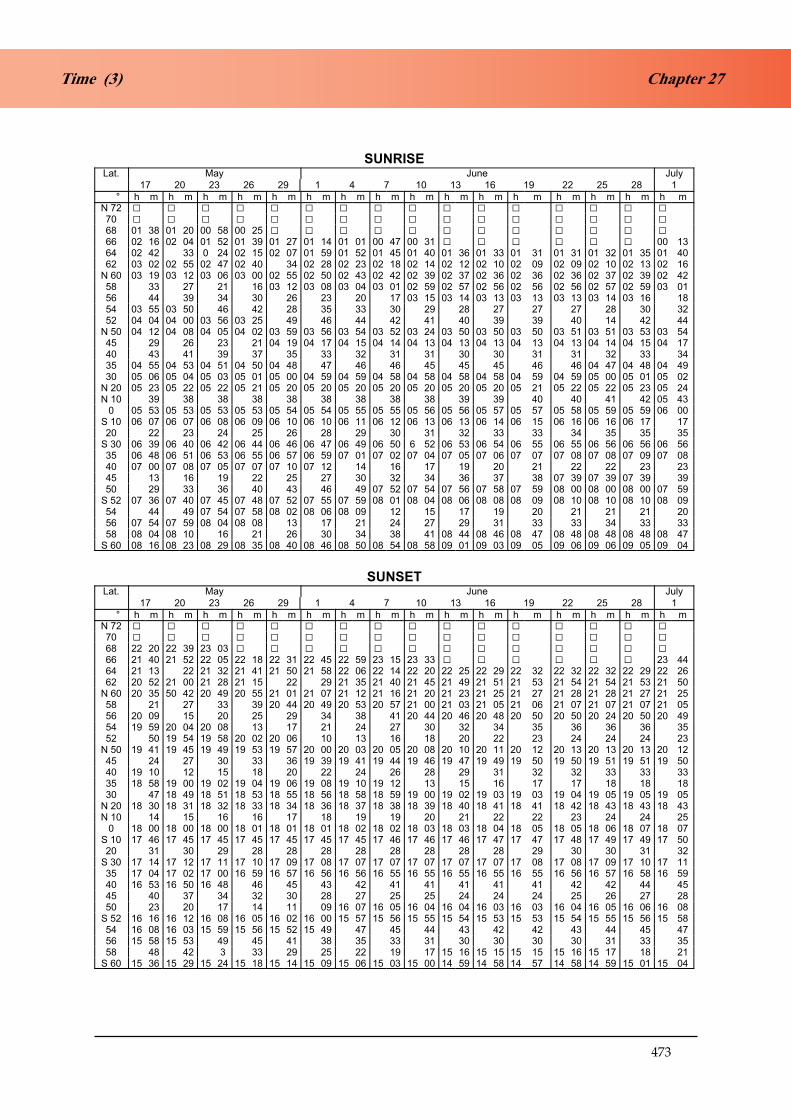
473
Chapter 27Time (3)
SUNRISE
Lat. May June July
17 20 23 26 29 1 4 7 10 13 16 19 22 25 28 1
° h m h m h m h m h m h m h m h m h m h m h m h m h m h m h m h mN 72 G G G G G G G G G G G G G G G G
70 G G G G G G G G G G G G G G G G
68 01 38 01 20 00 58 00 25 G G G G G G G G G G G G
66 02 16 02 04 01 52 01 39 01 27 01 14 01 01 00 47 00 31 G G G G G G 00 1364 02 42 33 0 24 02 15 02 07 01 59 01 52 01 45 01 40 01 36 01 33 01 31 01 31 01 32 01 35 01 4062 03 02 02 55 02 47 02 40 34 02 28 02 23 02 18 02 14 02 12 02 10 02 09 02 09 02 10 02 13 02 16
N 60 03 19 03 12 03 06 03 00 02 55 02 50 02 43 02 42 02 39 02 37 02 36 02 36 02 36 02 37 02 39 02 4258 33 27 21 16 03 12 03 08 03 04 03 01 02 59 02 57 02 56 02 56 02 56 02 57 02 59 03 0156 44 39 34 30 26 23 20 17 03 15 03 14 03 13 03 13 03 13 03 14 03 16 1854 03 55 03 50 46 42 28 35 33 30 29 28 27 27 27 28 30 3252 04 04 04 00 03 56 03 25 49 46 44 42 41 40 39 39 40 14 42 44
N 50 04 12 04 08 04 05 04 02 03 59 03 56 03 54 03 52 03 24 03 50 03 50 03 50 03 51 03 51 03 53 03 5445 29 26 23 21 04 19 04 17 04 15 04 14 04 13 04 13 04 13 04 13 04 13 04 14 04 15 04 1740 43 41 39 37 35 33 32 31 31 30 30 31 31 32 33 3435 04 55 04 53 04 51 04 50 04 48 47 46 46 45 45 45 46 46 04 47 04 48 04 4930 05 06 05 04 05 03 05 01 05 00 04 59 04 59 04 58 04 58 04 58 04 58 04 59 04 59 05 00 05 01 05 02
N 20 05 23 05 22 05 22 05 21 05 20 05 20 05 20 05 20 05 20 05 20 05 20 05 21 05 22 05 22 05 23 05 24N 10 39 38 38 38 38 38 38 38 38 39 39 40 40 41 42 05 43
0 05 53 05 53 05 53 05 53 05 54 05 54 05 55 05 55 05 56 05 56 05 57 05 57 05 58 05 59 05 59 06 00S 10 06 07 06 07 06 08 06 09 06 10 06 10 06 11 06 12 06 13 06 13 06 14 06 15 06 16 06 16 06 17 1720 22 23 24 25 26 28 29 30 31 32 33 33 34 35 35 35
S 30 06 39 06 40 06 42 06 44 06 46 06 47 06 49 06 50 6 52 06 53 06 54 06 55 06 55 06 56 06 56 06 5635 06 48 06 51 06 53 06 55 06 57 06 59 07 01 07 02 07 04 07 05 07 06 07 07 07 08 07 08 07 09 07 0840 07 00 07 08 07 05 07 07 07 10 07 12 14 16 17 19 20 21 22 22 23 2345 13 16 19 22 25 27 30 32 34 36 37 38 07 39 07 39 07 39 3950 29 33 36 40 43 46 49 07 52 07 54 07 56 07 58 07 59 08 00 08 00 08 00 07 59
S 52 07 36 07 40 07 45 07 48 07 52 07 55 07 59 08 01 08 04 08 06 08 08 08 09 08 10 08 10 08 10 08 0954 44 49 07 54 07 58 08 02 08 06 08 09 12 15 17 19 20 21 21 21 2056 07 54 07 59 08 04 08 08 13 17 21 24 27 29 31 33 33 34 33 3358 08 04 08 10 16 21 26 30 34 38 41 08 44 08 46 08 47 08 48 08 48 08 48 08 47
S 60 08 16 08 23 08 29 08 35 08 40 08 46 08 50 08 54 08 58 09 01 09 03 09 05 09 06 09 06 09 05 09 04
SUNSET
Lat. May June July
17 20 23 26 29 1 4 7 10 13 16 19 22 25 28 1
° h m h m h m h m h m h m h m h m h m h m h m h m h m h m h m h mN 72 G G G G G G G G G G G G G G G G
70 G G G G G G G G G G G G G G G G
68 22 20 22 39 23 03 G G G G G G G G G G G G G
66 21 40 21 52 22 05 22 18 22 31 22 45 22 59 23 15 23 33 G G G G G G 23 4464 21 13 22 21 32 21 41 21 50 21 58 22 06 22 14 22 20 22 25 22 29 22 32 22 32 22 32 22 29 22 2662 20 52 21 00 21 28 21 15 22 29 21 35 21 40 21 45 21 49 21 51 21 53 21 54 21 54 21 53 21 50
N 60 20 35 50 42 20 49 20 55 21 01 21 07 21 12 21 16 21 20 21 23 21 25 21 27 21 28 21 28 21 27 21 2558 21 27 33 39 20 44 20 49 20 53 20 57 21 00 21 03 21 05 21 06 21 07 21 07 21 07 21 0556 20 09 15 20 25 29 34 38 41 20 44 20 46 20 48 20 50 20 50 20 24 20 50 20 4954 19 59 20 04 20 08 13 17 21 24 27 30 32 34 35 36 36 36 3552 50 19 54 19 58 20 02 20 06 10 13 16 18 20 22 23 24 24 24 23
N 50 19 41 19 45 19 49 19 53 19 57 20 00 20 03 20 05 20 08 20 10 20 11 20 12 20 13 20 13 20 13 20 1245 24 27 30 33 36 19 39 19 41 19 44 19 46 19 47 19 49 19 50 19 50 19 51 19 51 19 5040 19 10 12 15 18 20 22 24 26 28 29 31 32 32 33 33 3335 18 58 19 00 19 02 19 04 19 06 19 08 19 10 19 12 13 15 16 17 17 18 18 1830 47 18 49 18 51 18 53 18 55 18 56 18 58 18 59 19 00 19 02 19 03 19 03 19 04 19 05 19 05 19 05
N 20 18 30 18 31 18 32 18 33 18 34 18 36 18 37 18 38 18 39 18 40 18 41 18 41 18 42 18 43 18 43 18 43N 10 14 15 16 16 17 18 19 19 20 21 22 22 23 24 24 25
0 18 00 18 00 18 00 18 01 18 01 18 01 18 02 18 02 18 03 18 03 18 04 18 05 18 05 18 06 18 07 18 07S 10 17 46 17 45 17 45 17 45 17 45 17 45 17 45 17 46 17 46 17 46 17 47 17 47 17 48 17 49 17 49 17 5020 31 30 29 28 28 28 28 28 28 28 28 29 30 30 31 32
S 30 17 14 17 12 17 11 17 10 17 09 17 08 17 07 17 07 17 07 17 07 17 07 17 08 17 08 17 09 17 10 17 1135 17 04 17 02 17 00 16 59 16 57 16 56 16 56 16 55 16 55 16 55 16 55 16 55 16 56 16 57 16 58 16 5940 16 53 16 50 16 48 46 45 43 42 41 41 41 41 41 42 42 44 4545 40 37 34 32 30 28 27 25 25 24 24 24 25 26 27 2850 23 20 17 14 11 09 16 07 16 05 16 04 16 04 16 03 16 03 16 04 16 05 16 06 16 08
S 52 16 16 16 12 16 08 16 05 16 02 16 00 15 57 15 56 15 55 15 54 15 53 15 53 15 54 15 55 15 56 15 5854 16 08 16 03 15 59 15 56 15 52 15 49 47 45 44 43 42 42 43 44 45 4756 15 58 15 53 49 45 41 38 35 33 31 30 30 30 30 31 33 3558 48 42 3 33 29 25 22 19 17 15 16 15 15 15 15 15 16 15 17 18 21
S 60 15 36 15 29 15 24 15 18 15 14 15 09 15 06 15 03 15 00 14 59 14 58 14 57 14 58 14 59 15 01 15 04

474
Chapter 27 Time (3)
MORNING CIVIL TWILIGHT
Lat. May June July
17 20 23 26 29 1 4 7 10 13 16 19 22 25 28 1
° h m h m h m h m h m h m h m h m h m h m h m h m h m h m h m h mN 72 G G G G G G G G G G G G G G G G
70 // // G G G G G G G G G G G G G G G
68 // // // // // // // // G G G G G G G G G G G G
66 // // // // // // // // // // // // // // // // // // G G G G G G // //64 00 57 00 23 // // // // // // // // // // // // // // // // // // // // // // // // // // // //62 01 45 01 31 01 17 01 01 00 24 00 10 // // // // // // // // // // // // // // // // // // // //
N 60 02 14 02 05 01 55 01 45 01 36 01 27 01 19 01 11 01 03 00 57 00 52 00 49 00 49 00 51 00 55 01 0258 36 29 02 21 02 14 02 07 02 01 01 55 01 50 01 46 01 43 01 14 01 40 01 40 01 42 01 44 01 4856 02 54 02 47 41 35 30 25 02 21 02 17 02 14 02 12 02 11 02 10 02 10 02 12 02 14 02 1654 03 09 03 03 02 58 02 53 02 48 02 44 41 38 36 34 33 32 33 34 36 3852 21 16 03 12 03 07 03 03 03 00 02 57 02 55 02 53 02 51 02 51 02 50 02 51 05 52 02 53 02 56
N 50 03 32 03 28 03 24 03 20 03 17 03 13 03 11 03 09 03 07 03 06 03 06 03 06 03 06 03 07 03 08 03 1045 03 55 03 51 03 48 03 45 03 43 03 34 03 39 37 36 35 35 35 36 37 03 38 03 3940 04 13 04 10 04 07 04 05 04 03 04 01 04 00 03 59 03 58 03 58 03 58 03 58 03 58 03 59 04 00 04 0235 27 25 13 21 19 18 17 04 16 04 16 04 16 04 16 04 16 04 17 04 17 18 2030 04 39 38 36 35 33 32 32 31 31 31 31 31 32 33 34 35
N 20 05 00 04 59 04 58 04 57 04 56 04 56 04 55 04 55 04 55 04 55 04 56 04 56 04 57 04 58 04 59 04 59N 10 16 05 16 05 15 05 15 05 15 05 15 05 15 05 15 05 15 05 16 05 16 05 17 05 17 05 18 05 19 05 20
0 31 31 31 31 31 32 32 33 33 34 34 35 36 36 37 38S 10 44 45 05 46 05 46 05 47 05 48 05 48 05 49 05 50 05 51 05 51 05 52 05 53 05 53 05 54 05 5420 05 58 05 59 06 01 06 02 06 03 06 04 06 05 06 06 06 07 06 08 06 09 06 09 06 10 06 11 06 11 06 11
S 30 06 13 06 15 06 17 06 18 06 20 06 21 06 23 06 24 06 25 06 26 06 27 06 28 06 29 06 30 06 30 06 3035 21 23 25 27 29 31 33 34 36 37 38 39 40 40 40 4140 30 33 35 58 40 42 44 46 06 47 06 48 06 50 06 51 06 51 06 52 06 52 06 5245 41 44 06 47 06 49 06 52 06 54 06 57 06 59 07 00 07 02 07 03 07 04 07 05 07 05 07 06 07 0550 53 06 56 07 00 07 03 07 06 07 09 07 11 07 14 16 18 19 20 21 21 21 21
S 52 06 58 07 02 07 06 07 09 07 13 07 16 07 19 07 21 07 23 07 25 07 27 07 28 07 29 07 29 07 29 07 2954 07 04 08 13 16 20 23 26 29 31 33 35 36 37 37 37 3756 11 15 20 24 28 31 35 37 40 42 44 45 46 46 46 4658 18 23 28 32 37 41 44 47 07 50 07 52 07 54 07 55 07 56 07 57 07 56 07 56
S 60 07 26 07 32 07 37 07 42 07 47 07 51 07 55 07 58 08 01 08 04 08 06 08 07 08 08 08 08 08 08 08 07
EVENING CIVIL TWILIGHTLat. May June July
17 20 23 26 29 1 4 7 10 13 16 19 22 25 28 1
° h m h m h m h m h m h m h m h m h m h m h m h m h m h m h m h mN 72 G G G G G G G G G G G G G G G G
70 G G G G G G G G G G G G G G G G
68 // // // // // // G G G G G G G G G G G G G
66 // // // // // // // // // // // // // // // // // // G G G G G G // //64 23 05 // // // // // // // // // // // // // // // // // // // // // // // // // // // // // //62 22 12 22 26 22 41 22 58 23 20 // // // // // // // // // // // // // // // // // // // // // //
N 60 21 41 21 51 22 01 22 11 22 21 22 31 22 40 22 49 22 57 23 04 23 10 23 13 23 14 23 13 23 09 23 0358 18 26 21 34 21 42 21 49 21 56 22 02 22 08 22 13 22 17 22 20 22 22 22 23 22 23 22 21 22 1956 21 00 21 07 21 14 20 26 32 21 37 21 41 21 45 21 48 21 51 21 52 21 53 21 53 21 52 21 5054 20 45 20 51 20 57 21 02 21 07 21 12 17 20 24 26 29 30 31 31 30 2952 32 38 43 20 47 20 52 20 56 21 00 21 03 21 06 21 09 21 11 21 12 21 13 21 13 21 12 21 11
N 50 20 21 20 26 20 30 20 35 20 39 20 43 20 46 20 49 20 52 20 54 20 56 20 57 20 58 20 58 20 57 20 5745 19 58 20 02 20 06 20 09 20 12 20 15 20 18 20 21 23 25 26 27 28 28 28 2840 41 19 44 19 46 19 49 19 52 19 54 19 57 19 59 20 01 20 02 20 03 20 04 20 05 20 06 20 06 20 0535 26 28 31 33 35 38 39 41 19 43 19 44 19 45 19 46 19 47 19 47 19 48 19 4730 19 13 19 16 19 18 19 20 19 21 23 25 26 28 29 30 31 32 32 32 32
N 20 18 53 18 55 18 56 18 57 18 59 19 00 19 01 19 02 19 03 19 04 19 05 19 06 19 07 19 07 19 08 19 08N 10 37 37 38 39 40 18 41 18 41 18 42 18 43 18 44 18 45 18 45 18 46 18 47 18 47 18 48
0 22 22 22 23 23 24 24 25 25 26 27 27 28 29 29 30S 10 18 08 18 08 18 07 18 07 18 07 18 08 18 08 18 08 18 09 18 09 18 10 18 10 18 11 18 11 18 12 18 1320 17 54 17 53 17 53 17 52 17 52 17 51 17 51 17 51 17 52 17 52 17 52 17 53 17 53 17 54 17 55 17 56
S 30 17 39 17 38 17 37 17 35 17 35 17 34 17 33 17 33 17 33 17 33 17 34 17 34 17 35 17 35 17 36 17 3735 31 29 28 26 25 24 24 23 23 23 23 23 24 25 26 2740 22 20 18 16 15 13 12 17 12 17 11 17 11 17 11 17 12 17 12 17 13 14 1545 12 17 09 17 06 17 04 17 02 17 01 17 00 16 59 16 58 16 58 16 58 16 58 16 59 16 59 17 01 17 0250 17 00 16 56 16 53 16 51 16 48 16 46 16 45 43 42 42 42 42 43 44 16 45 16 46
S 52 16 54 16 50 16 47 16 44 16 42 16 39 16 38 16 36 16 35 16 35 16 34 16 34 16 35 16 36 16 37 16 3954 48 44 40 37 34 32 30 28 27 26 26 26 27 28 29 3156 41 37 33 30 26 24 21 20 18 17 17 17 18 19 20 2258 34 29 25 21 17 14 12 16 10 16 08 16 07 16 07 16 07 16 07 16 09 16 10 12
S 60 16 26 16 20 16 16 16 11 16 07 16 04 16 01 15 59 15 57 15 56 15 55 15 55 15 56 15 57 15 58 16 01

475
Chapter 27Time (3)
SUNRISE
Lat. June July August
28 1 4 7 10 13 16 19 22 25 28 31 3 6 9 12 15
° h m h m h m h m h m h m h m h m h m h m h m h m h m h m h m h m h mN 72 G G G G G G G G G G G G G 00 49 01 30 01 58 02 2170 G G G G G G G G G G 00 21 01 11 01 39 02 01 02 20 02 37 02 5468 G G G G G G G 00 39 01 10 01 32 01 50 02 07 02 22 02 37 02 51 03 04 03 1766 G 00 13 00 38 00 55 01 10 01 24 01 37 01 50 02 03 02 15 02 27 02 39 02 51 03 03 03 14 25 3664 01 35 01 40 01 46 01 52 02 00 02 08 02 17 02 26 35 02 44 02 54 03 03 03 13 22 32 41 03 5062 02 13 02 16 02 20 02 25 31 37 02 44 02 51 02 58 03 06 03 14 22 30 38 46 03 54 04 02
N 60 02 39 02 42 02 45 02 49 02 54 02 59 03 04 03 10 03 17 03 23 03 30 03 37 03 44 03 51 03 58 04 06 04 1358 02 59 03 01 03 04 03 08 03 12 03 16 21 26 32 38 44 03 50 03 56 04 02 04 09 15 2256 03 16 18 20 23 27 31 35 40 45 03 50 03 55 04 01 04 06 12 18 24 3054 30 32 34 37 40 44 48 03 52 03 56 04 01 04 06 11 16 21 26 31 3752 42 44 46 49 03 52 03 55 03 58 04 02 04 06 10 15 19 24 29 33 38 43
N 50 03 53 03 54 03 57 03 59 04 02 04 05 04 08 04 11 04 15 04 19 04 23 04 27 04 31 04 53 04 40 04 44 04 4945 04 15 04 17 04 18 04 20 23 25 28 31 34 37 40 43 47 04 50 04 54 04 57 05 0140 33 34 36 38 40 42 44 46 04 49 04 51 04 54 04 57 04 59 05 02 05 05 05 08 1135 04 48 04 49 04 51 04 52 04 54 04 56 04 57 04 59 05 01 05 04 05 06 05 08 05 10 13 15 17 1930 05 01 05 02 05 03 05 05 05 06 05 08 05 09 05 11 13 14 16 18 20 22 23 25 27
N 20 05 23 05 24 05 25 05 26 05 27 05 28 05 29 05 30 05 31 05 33 05 34 05 35 05 36 05 37 05 38 05 39 05 40N 10 42 05 43 05 43 05 44 05 45 05 46 05 46 05 47 05 48 05 48 05 49 05 49 05 50 05 50 05 50 05 51 05 51
0 05 59 06 00 06 01 06 01 06 02 06 02 06 02 06 02 06 03 06 03 06 03 06 03 06 03 06 02 06 02 06 02 06 01S 10 06 17 17 18 18 18 18 18 18 18 17 17 16 15 15 14 12 1120 35 35 36 36 36 35 35 34 34 33 32 30 29 27 26 24 22
S 30 06 56 06 56 06 56 06 56 06 56 06 55 06 54 06 53 06 52 06 50 06 48 06 46 06 44 06 42 06 40 06 37 06 3435 07 09 07 08 07 08 07 08 07 07 07 06 07 05 07 04 07 02 07 00 06 58 06 56 06 53 06 50 47 44 4140 23 23 22 22 21 19 18 16 14 12 07 09 07 06 07 03 07 00 06 56 06 53 4945 07 39 39 39 38 36 35 33 31 28 25 22 19 15 11 07 07 07 03 06 5850 08 00 07 59 07 59 07 57 07 56 07 54 07 51 48 45 42 38 34 29 25 20 14 07 09
S 52 08 10 08 09 08 08 08 07 08 05 08 03 08 00 07 57 07 53 07 49 07 45 07 41 07 36 07 31 07 25 07 20 07 1454 21 20 19 17 15 13 09 08 06 08 02 07 58 07 53 48 43 38 32 26 2056 33 33 31 29 27 24 20 16 12 08 07 08 02 07 57 07 51 45 39 33 2658 08 48 08 47 08 45 43 40 37 33 28 24 18 13 08 07 08 01 07 54 47 40 33
S 60 09 05 09 04 09 02 08 59 08 56 08 52 08 48 08 43 08 37 08 31 08 25 08 18 08 11 08 04 07 56 07 49 07 41
SUNSET
Lat. June July August
28 1 4 7 10 13 16 19 22 25 28 31 3 6 9 12 15
° h m h m h m h m h m h m h m h m h m h m h m h m h m h m h m h m h mN 72 G G G G G G G G G G G G G 23 08 22 33 22 06 21 4370 G G G G G G G G G G 23 29 22 52 22 27 22 06 21 46 21 29 21 1268 G G G G G G G 23 22 22 56 22 35 22 18 22 01 21 46 21 31 21 17 21 03 20 4966 G 23 44 23 25 23 10 22 56 22 43 22 31 22 18 22 06 21 54 21 42 21 30 21 18 21 07 20 55 20 43 3164 22 29 22 26 22 21 22 15 22 08 22 01 21 53 21 44 21 36 26 21 17 21 07 20 57 20 47 37 27 1762 21 53 21 50 21 47 21 43 21 38 21 33 27 20 21 13 21 05 20 57 20 49 41 32 23 14 20 05
N 60 21 27 21 25 21 23 21 20 21 16 21 11 21 06 21 01 20 55 20 48 20 41 20 34 20 27 20 19 20 11 20 03 19 5558 21 07 21 05 21 03 21 01 20 58 20 54 20 50 20 45 39 34 28 21 15 20 08 20 01 19 53 4656 20 50 20 49 20 47 20 45 43 39 36 31 27 22 16 10 20 04 19 58 19 52 45 3854 36 35 34 32 30 27 23 20 15 11 20 06 20 01 19 55 50 44 38 3152 24 23 22 20 18 16 13 09 20 06 20 02 19 57 19 52 47 42 37 31 25
N 50 20 13 20 12 20 11 20 10 20 08 20 06 20 03 20 00 19 57 19 53 19 49 19 45 19 40 19 35 19 30 19 25 19 1945 19 51 19 50 19 50 19 49 19 47 19 46 19 43 19 41 38 35 32 29 25 21 17 12 19 0740 33 33 32 32 30 29 27 26 23 21 18 15 12 19 09 19 05 19 01 18 5735 18 18 18 17 16 15 14 13 11 19 09 19 07 19 04 19 02 18 59 18 56 18 52 4930 19 05 19 05 19 05 19 05 19 04 19 03 19 02 19 01 19 00 18 58 18 56 18 54 18 52 50 47 44 42
N 20 18 43 18 43 18 43 18 43 18 43 18 43 18 43 18 42 18 41 18 40 18 39 18 38 18 36 18 35 18 33 18 31 18 29N 10 24 25 25 25 26 26 26 25 25 24 24 23 22 21 20 19 18
0 18 07 18 07 18 08 18 08 18 09 18 09 18 10 18 10 18 10 18 10 18 10 18 10 18 10 18 09 18 09 18 08 18 08S 10 17 49 17 50 17 51 17 52 17 52 17 53 17 54 17 54 17 55 17 56 17 56 17 56 17 57 17 57 17 58 17 58 17 5820 31 32 33 34 35 36 37 38 39 40 41 43 44 45 45 46 47
S 30 17 10 17 11 17 12 17 14 17 15 17 16 17 18 17 20 17 21 17 23 17 25 17 27 17 29 17 30 17 32 17 34 17 3535 16 58 16 59 17 00 17 02 17 03 17 05 17 07 17 09 17 11 13 15 17 20 22 24 26 2840 44 45 16 46 16 48 16 50 16 52 16 54 16 57 16 59 17 02 17 04 17 07 17 10 12 15 18 2145 27 28 30 32 34 37 39 42 45 16 48 16 51 16 55 16 58 17 01 17 05 17 08 1250 16 06 16 08 10 13 15 18 21 25 28 32 36 40 44 16 48 16 52 16 56 17 01
S 52 15 56 15 58 16 00 16 03 16 06 16 09 16 12 16 16 16 20 16 24 16 28 16 33 16 37 16 42 16 46 16 51 16 5654 45 47 15 50 15 52 15 56 15 59 16 03 16 07 11 15 20 25 30 35 40 45 5056 33 35 38 41 44 48 15 52 15 56 16 01 16 06 11 16 22 27 33 38 4458 18 21 23 27 31 35 39 44 15 50 15 55 16 01 16 07 12 18 25 31 37
S 60 15 01 15 04 15 07 15 10 15 15 15 20 15 25 15 30 15 36 15 42 15 49 15 55 16 02 16 09 16 15 16 22 16 29

476
Chapter 27 Time (3)
MORNING CIVIL TWILIGHT
Lat. June July August
28 1 4 7 10 13 16 19 22 25 28 31 3 6 9 12 15
° h m h m h m h m h m h m h m h m h m h m h m h m h m h m h m h m h mN 72 G G G G G G G G G G G G G // // // // // // // //70 G G G G G G G G G G // // // // // // // // // // // // // //68 G G G G G G // // // // // // // // // // // // // // // // // // 01 10 01 3966 G // // // // // // // // // // // // // // // // // // // // // // 00 45 01 19 01 24 02 01 02 1864 // // // // // // // // // // // // // // // // // // 00 36 07 08 01 30 01 48 02 04 02 18 32 02 4562 // // // // // // // // // // 00 24 00 53 01 12 01 28 01 43 01 56 02 09 02 21 32 02 44 02 54 03 05
N 60 00 55 01 02 01 09 01 18 01 27 01 36 01 46 01 56 02 06 02 16 02 25 02 35 02 45 02 54 03 03 03 12 03 2158 01 44 01 48 01 52 01 57 02 03 02 10 02 17 02 24 32 39 02 47 02 55 03 03 03 11 19 27 3556 02 14 02 16 02 20 02 24 29 34 39 02 45 02 52 02 58 03 05 03 12 19 25 32 39 4654 36 38 41 02 44 02 48 02 53 02 58 03 03 03 08 03 14 20 26 32 38 44 50 03 5652 02 53 02 56 02 58 03 01 03 05 03 09 03 13 17 22 27 32 37 43 48 03 54 03 59 04 05
N 50 03 08 03 10 03 13 03 15 03 19 03 22 03 26 03 30 03 34 03 39 03 43 03 48 03 53 03 58 04 03 04 08 04 1345 03 38 03 39 03 41 03 44 03 46 03 49 03 52 03 55 03 59 04 02 04 06 04 090 04 13 04 17 21 25 2940 04 00 04 02 04 03 04 05 04 07 04 10 04 12 04 15 04 17 20 23 26 29 32 36 39 4235 18 20 21 23 25 26 29 31 33 35 38 40 43 45 48 04 50 04 5330 34 35 04 36 04 37 04 39 04 41 04 42 04 44 04 46 04 48 04 50 04 52 04 54 04 56 04 58 05 00 05 02
N 20 04 59 04 59 05 00 05 01 05 03 05 04 05 05 05 06 05 08 05 09 05 10 05 11 05 12 05 14 05 15 05 16 05 17N 10 05 19 05 20 20 21 22 23 24 24 25 26 27 27 28 28 28 29 29
0 37 38 38 39 39 40 40 40 41 41 41 41 41 41 41 40 40S 10 05 54 05 54 05 55 05 55 05 55 05 56 05 56 05 56 05 55 05 55 05 55 05 54 05 53 05 53 05 52 05 51 5020 06 11 06 11 06 12 06 12 06 12 06 12 06 11 06 11 06 10 06 09 06 08 06 07 06 06 06 04 06 03 06 01 05 59
S 30 06 30 06 30 06 30 06 30 06 30 06 29 06 28 06 27 06 26 06 25 06 23 06 21 06 19 06 17 06 15 06 12 06 0935 40 41 40 40 39 39 38 36 35 33 31 29 26 24 21 18 1540 06 52 06 52 06 52 06 51 06 50 06 49 06 48 46 45 42 40 37 34 31 28 25 2145 07 06 07 05 07 05 07 04 07 03 07 02 07 00 06 58 06 56 06 53 06 50 47 43 40 36 32 2750 21 21 21 19 18 16 14 07 12 07 09 07 05 07 02 06 58 54 50 45 40 35
S 52 07 29 07 29 07 28 07 27 07 25 07 23 07 21 07 18 07 15 07 11 07 07 07 03 06 59 06 54 06 49 06 44 06 3954 37 37 36 34 32 30 28 25 21 17 13 09 07 04 06 59 54 48 4256 46 46 44 43 41 38 36 32 28 24 20 15 10 07 04 06 59 53 4758 07 56 07 56 07 54 07 53 07 50 48 44 41 36 32 27 22 16 10 07 04 06 58 51
S 60 08 08 08 07 08 06 08 04 08 01 07 58 07 54 07 50 07 45 07 41 07 35 07 29 07 23 07 17 07 10 07 03 06 56
EVENING CIVIL TWILIGHTLat. June July August
28 1 4 7 10 13 16 19 22 25 28 31 3 6 9 12 15
° h m h m h m h m h m h m h m h m h m h m h m h m h m h m h m h m h mN 72 G G G G G G G G G G G G G // // // // // // // //70 G G G G G G G G G G // // // // // // // // // // // // 23 5168 G G G G G G G // // // // // // // // // // // // // // 23 32 22 50 22 2366 G // // // // // // // // // // // // // // // // // // // // // // 23 15 22 46 22 23 22 04 21 4764 // // // // // // // // // // // // // // // // // // 23 24 22 57 22 37 22 20 22 04 21 49 21 35 2162 // // // // // // // // // // 23 36 23 12 22 55 22 40 22 26 22 13 22 01 21 48 21 36 25 21 13 21 02
N 60 23 09 23 03 22 57 22 49 22 41 22 32 22 23 22 14 22 04 21 55 21 45 21 35 21 25 21 16 21 06 20 56 20 4658 22 21 22 19 22 15 22 11 22 05 22 00 21 53 21 46 21 39 31 23 21 15 21 07 20 59 20 50 42 3356 21 52 21 50 21 48 21 44 21 41 21 36 31 25 19 21 13 21 06 20 59 20 52 45 37 29 2154 30 29 27 24 21 17 21 13 21 08 21 03 20 58 20 52 46 39 33 26 19 1152 21 12 21 11 21 10 21 08 21 05 21 02 20 58 20 54 20 49 45 39 34 28 22 16 10 20 03
N 50 20 57 20 57 20 55 20 53 20 51 20 48 20 45 20 42 20 38 20 33 20 29 20 24 20 18 20 13 20 07 20 01 19 5545 28 28 27 25 24 22 20 19 20 17 20 13 20 10 20 06 20 02 19 58 19 54 19 49 19 44 3940 20 06 20 05 20 05 20 04 20 03 20 01 19 59 19 57 19 55 19 52 19 49 19 46 42 39 35 31 2635 19 48 19 47 19 47 19 47 19 46 19 44 43 41 39 37 35 32 29 26 23 19 1630 32 32 32 32 31 30 29 28 26 25 23 20 18 19 15 19 13 19 10 19 07
N 20 19 08 19 08 19 08 19 08 19 08 19 07 19 07 19 00 19 05 19 04 19 03 09 01 19 00 18 58 18 56 18 54 18 52N 10 18 47 18 48 18 48 18 48 18 48 18 48 18 48 18 48 18 47 18 47 18 46 18 45 18 45 43 42 41 40
0 29 30 30 31 31 31 32 32 32 32 32 32 31 31 30 30 29S 10 18 12 18 13 18 14 18 14 18 15 16 16 17 17 18 18 19 19 19 19 19 1920 17 55 17 56 17 57 17 58 17 59 18 00 18 01 18 02 18 03 18 04 18 05 18 06 18 07 18 07 18 08 18 09 10
S 30 17 36 17 37 17 38 17 40 17 41 17 42 17 44 17 45 17 47 17 49 17 50 17 55 17 45 17 55 17 57 17 58 18 0035 26 27 28 30 31 33 35 36 38 40 42 44 46 48 50 52 17 5440 14 15 17 18 20 22 24 26 29 31 33 36 38 41 43 46 4945 17 01 17 02 17 04 17 05 17 08 17 10 17 12 15 17 20 23 26 29 32 36 39 4250 16 45 16 46 16 48 16 50 16 53 16 55 16 58 17 01 17 04 08 11 15 19 23 26 30 34
S 52 16 37 16 39 16 41 16 43 16 46 16 49 16 52 16 55 16 59 17 02 17 06 17 10 17 14 17 18 17 22 17 27 17 3154 29 31 33 35 38 41 45 48 52 46 56 17 00 17 04 09 13 18 23 2756 20 22 24 27 30 33 37 41 45 49 16 54 16 58 17 03 08 13 18 2358 16 10 12 14 17 21 24 28 32 37 42 46 52 16 57 17 02 08 13 19
S 60 15 58 16 01 16 03 16 06 16 10 16 14 16 18 16 23 16 28 16 33 16 38 16 44 16 50 16 56 17 02 17 08 17 14

477
Chapter 27Time (3)
SUNRISE
Lat. August September Oct
15 18 21 24 27 30 2 5 8 11 14 17 20 23 26 29 2
° h m h m h m h m h m h m h m h m h m h m h m h m h m h m h m h m h mN 72 02 21 02 41 02 59 03 17 03 33 03 49 04 04 04 18 04 33 04 47 05 00 05 14 05 27 05 41 05 54 06 08 06 2170 02 54 03 09 03 23 38 03 51 04 04 17 30 42 04 54 06 18 30 42 54 06 1868 03 17 30 42 03 54 04 05 17 28 39 50 05 01 11 22 32 43 54 04 1566 36 46 03 57 04 07 17 27 37 47 04 56 06 15 25 34 44 53 03 1264 03 50 03 59 04 09 18 27 35 44 53 05 02 10 19 27 36 44 53 02 1062 04 02 04 11 19 27 35 43 51 04 59 06 14 22 30 37 45 53 06 01 08
N 60 04 13 04 20 04 27 04 34 04 42 04 49 04 56 05 03 05 10 05 17 05 24 05 31 05 38 05 45 05 52 05 59 06 0758 22 28 35 41 48 54 05 01 07 14 20 27 33 39 46 52 59 0556 30 36 41 47 53 04 59 05 11 17 23 28 34 40 46 52 58 0454 37 42 47 53 04 58 05 04 09 14 20 25 30 36 41 46 52 57 0352 43 48 53 04 58 05 03 07 12 17 22 27 32 37 42 47 52 57 02
N 50 04 49 04 53 04 58 05 02 05 07 05 11 05 16 05 20 05 24 05 29 05 33 05 38 05 42 05 47 05 51 05 56 06 0145 05 01 05 04 05 08 12 15 19 22 26 29 33 37 40 44 48 51 55 05 5840 11 14 17 20 22 25 28 31 34 37 39 42 45 48 51 54 5735 19 22 24 26 28 31 33 35 37 39 42 44 46 48 50 53 5530 27 29 30 32 34 35 37 39 40 42 44 45 47 48 50 52 54
N 20 05 40 05 41 05 41 05 42 05 43 05 44 05 44 05 45 05 46 05 46 05 47 05 48 05 48 05 49 05 50 05 50 05 51N 10 05 51 05 51 05 51 51 51 51 51 51 50 50 50 50 49 49 49 49 49
0 06 01 06 01 06 00 05 59 05 58 05 57 05 56 05 55 54 53 52 51 50 49 48 47 46S 10 11 10 09 06 07 06 06 06 04 06 02 06 00 05 59 05 57 55 53 51 49 47 46 4420 22 20 18 15 13 11 08 05 06 03 06 00 05 57 55 52 49 47 44 41
S 30 06 34 06 31 06 28 06 25 06 22 06 18 06 15 06 11 06 08 06 04 06 00 05 57 05 53 05 49 05 45 05 42 05 3835 41 38 34 30 26 23 19 14 10 06 02 57 53 49 44 40 3640 49 45 41 36 32 27 23 18 13 08 03 05 59 54 49 44 39 3445 06 58 06 53 49 43 38 33 28 22 17 11 05 06 00 54 48 43 37 3150 07 09 07 03 06 58 52 46 40 33 27 21 14 08 01 54 48 41 35 28
S 52 07 14 07 08 07 02 06 56 06 49 06 43 06 36 06 29 06 2 06 16 06 09 06 02 05 55 05 48 05 41 05 34 05 2754 20 13 07 07 00 53 46 39 32 25 17 10 02 55 47 40 33 2556 26 19 12 05 06 57 50 42 35 27 19 11 03 55 47 39 31 2358 33 25 18 10 07 02 54 46 38 29 21 12 04 55 47 38 30 21
S 60 07 41 07 33 07 24 07 16 07 07 06 59 06 50 06 41 06 32 06 23 06 14 06 05 05 56 05 47 05 37 05 28 05 19
SUNSET
Lat. August September Oct
15 18 21 24 27 30 2 5 8 11 14 17 20 23 26 29 2
° h m h m h m h m h m h m h m h m h m h m h m h m h m h m h m h m h mN 72 21 43 21 22 21 03 20 44 20 27 20 10 19 53 19 36 19 20 19 04 18 49 18 33 18 18 18 02 17 47 17 31 17 1670 21 12 20 55 20 40 24 20 09 19 54 40 26 11 18 57 43 29 42 01 47 34 2068 20 49 35 22 20 09 19 55 42 30 17 19 04 51 38 26 13 01 48 35 2366 31 20 20 08 19 56 44 33 21 09 18 58 46 35 23 11 18 00 48 37 2664 17 20 06 19 56 46 35 25 14 19 03 53 42 31 21 10 17 59 49 38 2862 20 05 19 56 46 37 27 17 08 18 58 48 38 29 19 09 59 49 39 30
N 60 19 55 19 46 19 38 19 29 19 20 19 11 19 02 18 53 18 44 18 35 18 26 18 17 18 08 17 58 17 47 17 40 17 3158 46 38 30 22 14 06 18 57 49 41 32 24 15 07 58 50 41 3356 38 31 24 16 09 19 01 53 45 38 30 22 14 06 58 50 42 3454 31 25 18 11 19 04 18 57 49 42 35 27 20 12 05 58 50 43 3552 35 19 12 06 18 59 53 46 39 32 25 18 11 04 57 50 43 36
N 50 19 19 19 14 19 08 19 02 18 56 18 49 18 43 18 37 18 30 18 24 18 17 18 10 18 04 18 57 17 51 17 44 17 3845 19 07 19 03 18 58 18 52 47 42 36 31 25 20 14 08 03 57 51 46 4040 18 57 18 53 49 45 40 36 31 26 21 16 11 06 01 56 51 47 4235 49 46 42 38 34 30 26 22 18 13 09 05 01 56 52 48 4330 42 39 35 32 27 25 22 18 15 11 07 04 18 00 56 52 49 45
N 20 18 29 18 27 18 25 18 22 18 20 18 17 18 15 18 12 18 10 18 07 18 04 18 01 17 59 17 56 17 53 17 50 17 48N 10 18 17 15 14 12 10 09 07 05 03 18 01 18 00 58 56 54 52 50
0 18 08 18 07 18 06 18 06 18 05 18 04 18 03 18 02 18 01 18 00 17 59 17 58 57 56 55 54 53S 10 17 58 17 58 17 58 17 58 17 58 17 58 17 58 17 57 17 57 17 57 57 56 56 56 56 55 5520 47 48 49 50 50 51 52 52 53 54 54 55 55 56 57 17 57 17 58
S 30 17 35 17 37 17 39 17 40 17 42 17 44 17 45 17 47 17 48 17 50 17 52 17 53 17 55 17 56 17 58 18 00 18 0235 28 31 33 35 37 39 45 44 46 48 50 52 55 57 17 59 01 0440 21 32 26 29 32 35 37 40 43 46 49 51 54 57 18 00 03 0645 12 15 19 22 26 29 33 36 40 43 47 50 54 58 01 05 0950 17 01 05 09 14 18 23 27 31 36 40 45 49 54 58 03 07 12
S 52 16 56 17 00 17 05 17 10 17 15 17 20 17 24 17 29 17 34 17 39 17 44 17 49 17 53 17 58 18 03 18 08 18 1354 50 16 55 17 01 06 11 16 21 27 32 37 43 48 53 59 04 10 1556 44 50 16 55 17 01 07 13 18 24 30 36 41 47 53 59 05 11 1758 37 43 50 16 56 17 02 09 15 21 27 34 40 46 53 17 59 06 12 19
S 60 16 29 16 36 16 43 16 50 16 57 17 04 17 11 17 18 17 25 17 32 17 39 17 46 17 53 18 00 18 07 18 14 18 21

478
Chapter 27 Time (3)
MORNING CIVIL TWILIGHT
Lat. August September Oct
15 18 21 24 27 30 2 5 8 11 14 17 20 23 26 29 2
° h m h m h m h m h m h m h m h m h m h m h m h m h m h m h m h m h mN 72 // // // // // // 01 07 01 44 02 12 02 35 02 55 03 14 03 31 03 47 04 03 04 18 04 32 04 46 05 00 05 1470 // // 01 06 01 40 02 05 02 26 02 45 03 02 03 18 33 03 48 04 01 15 28 40 53 05 1768 01 39 02 02 02 21 02 38 02 54 03 08 22 36 03 48 04 01 13 24 36 47 04 58 09 1966 02 18 34 02 48 03 02 03 14 27 38 03 50 04 01 11 22 32 42 52 05 02 12 2164 02 45 02 57 03 08 20 31 41 03 51 04 01 11 20 30 39 48 04 57 06 14 2362 03 05 03 15 25 35 44 03 53 04 02 11 19 28 36 44 52 05 01 09 16 24
N 60 03 21 03 30 03 38 03 47 03 55 04 03 04 13 04 19 04 27 04 34 04 42 04 49 04 57 05 04 05 11 05 18 05 2558 35 42 03 50 03 57 04 05 12 19 26 33 40 47 53 05 00 07 13 20 2656 46 03 53 04 00 04 06 13 19 26 32 38 45 51 04 57 03 09 15 21 2754 03 56 04 02 08 14 20 26 32 37 43 49 54 05 00 06 11 17 22 2752 04 05 10 16 21 26 32 37 42 47 53 04 58 03 08 13 18 23 28
N 50 04 13 04 18 04 22 04 27 04 32 04 37 04 42 04 47 04 51 04 56 05 01 05 05 05 10 05 15 05 19 05 24 05 2945 29 33 37 41 44 48 04 52 04 56 05 00 05 03 07 11 15 18 22 26 2940 42 45 48 04 51 04 54 04 57 05 00 05 03 06 09 12 15 18 21 24 27 3035 04 53 04 55 04 58 05 00 05 02 05 05 07 09 12 14 16 18 21 23 25 27 3030 05 02 05 04 05 06 07 09 11 13 15 16 18 20 21 23 25 26 28 30
N 20 05 17 05 18 05 19 05 20 05 21 05 21 05 22 05 23 05 24 05 24 05 25 05 26 05 26 05 27 05 28 05 28 05 29N 10 29 29 29 30 30 30 29 29 29 29 29 29 28 28 28 28 28
0 40 39 39 38 37 36 35 35 34 33 32 31 30 29 28 27 25S 10 50 48 47 46 44 43 41 39 38 36 34 32 30 28 26 25 2320 05 59 05 57 05 55 05 53 51 48 46 43 41 38 35 33 30 27 24 22 19
S 30 06 09 06 07 06 04 06 01 05 57 05 54 05 51 05 47 05 44 05 40 05 36 05 33 05 29 05 25 05 21 05 18 05 1435 15 12 08 05 06 01 05 57 53 49 45 41 37 32 28 24 19 15 1140 21 17 13 09 04 06 00 55 51 46 41 36 32 27 22 17 12 0745 27 23 18 14 09 03 05 58 53 47 42 36 31 25 19 13 07 05 0250 35 30 24 19 13 04 06 01 55 48 42 35 29 22 16 09 02 04 56
S 52 06 39 06 33 06 27 06 21 06 15 06 09 06 02 05 56 05 49 05 42 05 35 05 28 05 21 05 14 05 07 05 00 04 5354 42 36 30 24 17 10 03 56 49 42 35 27 20 12 05 04 57 4956 47 40 33 26 19 12 05 57 50 42 34 26 18 10 05 02 54 4658 51 44 37 29 22 14 06 58 50 42 33 25 16 08 04 59 50 42
S 60 06 56 06 48 06 41 06 33 06 25 06 16 06 08 05 59 05 50 05 42 05 33 05 24 05 14 05 05 04 56 04 46 04 37
EVENING CIVIL TWILIGHT
Lat. August September Oct
15 18 21 24 27 30 2 5 8 11 14 17 20 23 26 29 2
° h m h m h m h m h m h m h m h m h m h m h m h m h m h m h m h m h mN 72 // // // // // // 22 45 22 11 21 44 21 20 20 58 20 38 20 19 20 01 19 44 19 27 19 10 18 54 18 38 18 2370 23 51 22 50 22 19 21 54 21 32 21 12 20 54 36 19 20 03 19 47 32 17 19 03 48 34 2068 22 23 22 01 21 41 23 21 06 20 50 34 19 20 04 19 50 36 23 0 18 56 43 31 1866 21 47 21 31 21 15 21 00 20 46 32 19 20 06 19 53 40 27 15 19 03 51 39 28 1664 21 21 08 20 55 20 43 30 18 20 06 19 55 43 32 20 09 18 58 47 36 25 1562 21 02 20 50 39 28 17 20 07 19 56 45 34 24 14 19 04 53 43 33 23 14
N 60 20 46 20 36 20 26 20 16 20 07 19 57 19 47 19 37 9 28 19 18 19 08 18 59 18 50 18 40 18 31 18 22 18 1358 33 24 15 20 06 19 57 48 39 30 22 13 19 04 55 46 38 29 20 1256 21 13 20 05 19 57 49 41 32 24 16 08 18 59 51 43 35 27 19 1154 11 20 04 19 57 49 42 34 26 19 11 03 56 48 40 33 25 18 1052 20 03 19 56 49 42 35 28 21 14 07 19 00 52 45 38 31 24 17 10
N 50 19 55 19 49 19 43 19 36 19 30 19 23 19 16 19 10 19 03 18 56 18 50 18 43 18 36 18 29 18 23 18 16 18 1045 39 34 29 23 18 12 19 07 19 01 18 55 49 43 38 32 26 20 15 0940 26 22 18 13 08 19 03 18 59 18 54 49 44 39 34 28 23 18 13 0935 16 12 08 19 04 19 00 18 56 52 48 43 39 35 30 26 21 17 13 0930 19 07 19 04 19 00 18 57 18 53 50 46 43 39 35 31 27 24 20 16 12 09
N 20 18 52 18 50 18 47 18 45 18 43 18 40 18 37 18 34 18 32 18 29 18 26 18 23 18 21 18 18 18 15 18 12 18 10N 10 40 38 37 35 33 32 30 28 26 24 22 21 19 17 15 13 11
0 29 29 28 27 26 25 24 23 22 21 20 19 18 16 15 14 13S 10 19 19 19 19 19 19 19 18 18 18 18 17 17 17 17 17 1620 10 11 11 12 13 13 14 14 15 16 16 17 18 18 19 20 20
S 30 18 00 18 02 18 03 18 05 18 06 18 08 18 09 18 11 18 12 18 14 18 16 18 17 18 19 18 20 18 22 18 24 18 2635 17 54 17 57 17 57 18 01 18 03 05 07 09 11 13 16 18 20 22 24 27 2940 49 51 54 17 57 17 59 18 02 05 07 10 13 16 18 21 24 27 30 3345 42 45 49 52 55 17 59 18 02 06 09 13 16 20 23 27 31 34 3850 34 39 43 47 51 55 17 59 04 08 12 17 21 26 31 35 40 45
S 52 17 31 17 36 17 40 17 45 17 49 17 54 17 58 18 03 18 08 18 12 18 17 18 22 18 27 18 32 18 37 18 42 18 4754 27 32 37 42 47 52 57 02 07 13 18 23 29 34 40 45 5156 23 29 34 39 45 50 56 01 07 13 18 24 30 36 42 48 5558 19 25 31 37 42 48 54 01 07 13 19 26 32 39 45 52 18 59
S 60 17 14 17 21 17 27 17 33 17 40 17 46 17 53 18 00 18 06 18 13 18 20 18 27 18 34 18 41 18 49 18 56 19 04

479
Chapter 27Time (3)
Lat October November
2 5 8 11 14 17 20 23 26 29 1 4 7 10 13 16 19
° h m h m h m h m h m h m h m h m h m h m h m h m h m h m h m h m h mN72 06 21 06 35 06 49 07 03 07 17 07 32 07 47 08 03 08 19 08 36 08 54 09 13 09 34 09 58 10 27 11 14 -70 18 30 42 06 54 07 07 20 33 07 46 08 00 08 14 28 08 44 08 59 09 16 09 34 09 53 10 1468 15 26 36 47 06 58 10 21 33 07 44 07 56 08 09 21 34 08 48 09 01 09 15 09 3066 12 22 32 41 51 07 01 11 22 32 43 07 53 08 04 15 27 08 38 08 49 09 0164 10 19 28 36 45 06 54 07 03 13 22 31 41 07 50 08 00 08 10 19 29 08 3962 08 16 24 32 40 48 06 57 07 05 13 22 30 39 07 47 07 56 08 04 08 13 21
N60 06 07 06 14 06 21 06 28 06 36 06 43 06 50 06 58 07 06 07 13 07 21 07 29 07 36 07 44 07 52 07 59 08 0758 05 12 18 25 32 38 45 52 06 59 06 13 20 27 34 41 48 07 5456 04 10 16 22 28 34 41 47 53 07 00 06 12 19 25 31 37 4354 03 08 14 19 25 31 36 42 48 06 54 07 00 07 05 11 17 23 29 3452 02 07 12 17 22 27 33 38 43 49 06 54 06 59 07 05 10 16 21 26
N50 06 01 06 05 06 10 06 15 06 19 06 24 06 29 06 34 06 39 06 44 06 49 06 54 06 59 07 04 07 09 07 14 07 1845 05 58 02 06 10 14 18 22 26 30 34 38 42 46 06 50 06 54 06 58 07 0240 57 06 00 06 03 06 09 12 15 18 22 25 28 32 35 39 42 46 06 4935 55 05 57 05 59 06 02 04 07 10 12 15 18 21 23 26 29 32 35 3830 54 55 57 05 59 06 01 06 03 06 05 06 07 06 09 11 13 16 18 20 23 25 28
N20 05 51 05 52 05 52 05 53 05 54 05 55 05 56 05 57 05 59 06 00 06 01 06 03 06 04 06 06 06 07 06 09 06 11N10 49 48 48 48 48 48 49 49 49 05 50 05 50 05 51 05 52 05 53 05 54 05 55 05 56
0 46 45 44 44 43 42 42 41 41 40 40 40 40 40 41 41 42S10 44 42 40 39 37 36 34 33 32 31 30 29 29 28 28 28 2820 41 38 36 33 31 29 26 24 22 20 19 17 16 05 15 05 14 05 13 05 12
S30 05 38 15 34 05 31 05 27 05 24 05 20 05 17 05 14 05 11 05 08 05 06 05 03 05 01 04 59 04 57 04 56 04 5435 36 32 28 24 19 16 12 08 05 05 05 01 04 58 04 55 04 53 50 48 46 4440 34 29 24 19 15 10 05 06 05 02 04 57 04 54 50 46 43 40 37 34 3245 31 26 20 15 09 05 04 04 59 04 54 49 44 40 35 31 27 24 21 1850 28 22 15 09 05 02 04 56 50 44 38 33 27 22 17 13 08 04 04 04 0052 05 27 05 20 05 13 05 06 04 59 04 53 04 46 04 40 04 34 04 28 04 22 04 16 04 11 04 05 04 01 03 56 03 5254 25 18 10 03 56 49 42 35 28 22 15 09 04 03 03 58 03 52 48 4356 23 15 08 05 00 52 44 37 30 22 15 08 04 02 03 55 49 43 38 3258 21 13 05 04 56 48 40 32 24 16 08 04 00 03 53 46 39 33 26 2160 05 19 05 10 05 01 04 52 04 43 04 34 04 25 04 17 04 08 04 00 03 51 03 43 03 35 03 28 03 20 03 13 03 06
SUNSET
Lat October November
2 5 8 11 14 17 20 23 26 29 1 4 7 10 13 16 19
° h m h m h m h m h m h m h m h m h m h m h m h m h m h m h m h m h mN72 17 16 17 01 16 45 16 30 16 14 15 58 15 41 15 25 15 08 14 50 14 32 14 13 13 52 13 28 13 00 12 14 -70 20 06 52 38 24 16 10 15 56 42 27 15 13 14 58 14 42 14 27 14 11 13 54 13 35 13 1568 23 10 16 58 45 33 20 16 08 15 55 43 30 15 17 15 05 14 52 14 39 14 26 14 13 14 0066 26 14 17 03 51 40 29 17 16 06 15 55 44 33 22 15 11 15 00 14 50 14 39 2964 28 17 07 16 56 46 36 25 15 16 05 15 55 45 36 26 17 15 08 15 00 14 5162 30 20 10 17 01 51 42 32 23 14 16 05 15 56 48 39 31 23 16 15 09
N60 17 31 17 22 17 13 17 04 16 56 16 47 16 38 16 30 16 22 16 13 16 06 15 58 15 51 15 43 15 36 15 30 15 2358 33 25 16 08 17 00 52 44 36 28 21 13 16 06 16 00 15 53 47 41 3656 34 26 18 11 03 56 48 41 34 27 21 14 08 16 02 15 56 15 51 4654 35 28 21 14 06 16 59 53 46 39 33 27 21 15 10 16 05 16 00 15 5652 36 29 23 16 09 17 03 16 56 50 44 38 33 27 22 17 12 08 16 04
N50 17 38 17 31 17 25 17 18 17 12 17 06 17 00 16 54 16 49 16 43 16 38 16 33 16 28 16 23 16 19 16 15 16 1245 40 34 29 23 18 13 08 17 03 16 58 16 53 49 45 41 37 34 31 2840 42 37 32 27 23 18 14 10 17 06 17 02 16 58 16 55 16 52 49 46 44 4135 43 39 35 31 27 23 20 16 13 09 17 06 17 04 17 01 16 59 16 56 16 54 16 5330 45 41 38 34 31 28 25 22 19 16 14 11 09 17 07 17 05 17 04 17 03
N20 17 48 17 45 17 43 17 40 17 38 17 36 17 33 17 31 17 29 17 28 17 26 17 24 17 23 17 22 17 21 17 20 17 20N10 50 49 47 45 44 42 41 40 39 38 37 36 35 35 35 35 35
0 53 52 51 50 49 49 48 48 47 47 47 47 47 17 47 17 48 17 48 17 49S10 55 55 17 55 17 55 17 55 17 55 17 56 17 56 17 57 17 57 17 58 17 58 17 59 18 00 18 01 18 02 18 0320 17 58 17 59 18 00 18 01 18 02 18 03 18 04 18 05 18 06 18 07 18 09 18 10 18 12 14 15 17 19
S30 18 02 18 03 18 05 18 07 18 09 18 11 18 13 18 15 18 17 18 20 18 22 18 24 18 27 18 29 18 32 18 34 18 3735 04 06 09 11 13 16 19 21 24 27 30 32 35 38 41 44 4740 06 09 12 15 18 21 25 28 31 35 38 42 45 18 49 18 52 18 56 18 5945 09 12 16 20 24 28 32 36 40 44 18 48 18 53 18 57 19 01 19 05 19 10 19 1450 12 17 21 26 31 36 41 46 51 18 56 19 01 19 06 19 11 16 21 26 3152 18 13 18 18 18 24 18 29 18 34 18 39 18 45 18 50 18 56 19 01 19 07 19 12 19 18 19 24 19 29 19 34 19 4054 15 21 26 32 37 43 49 18 55 19 01 07 13 19 25 31 37 43 19 4956 17 23 29 35 41 48 18 54 19 01 07 14 20 27 34 40 47 19 53 20 0058 19 25 32 39 46 53 19 00 07 14 21 28 36 43 19 50 19 58 20 05 1260 18 21 18 28 18 36 18 43 18 51 18 58 19 06 19 14 19 22 19 30 19 38 19 46 19 54 20 02 20 10 20 18 20 26
SUNRISE

480
Chapter 27 Time (3)
MORNING CIVIL TWILIGHT
Lat October November
2 5 8 11 14 17 20 23 26 29 1 4 7 10 13 16 19
° h m h m h m h m h m h m h m h m h m h m h m h m h m h m h m h m h mN72 05 14 05 27 05 41 05 54 06 07 06 20 06 34 06 47 07 00 07 14 07 27 07 41 07 54 08 08 08 23 08 37 05 5170 17 29 41 52 04 16 27 39 06 51 07 03 14 26 38 07 50 08 02 08 14 2568 19 30 41 51 06 01 12 22 33 43 06 54 07 04 14 25 35 07 46 07 56 08 0666 21 31 40 50 05 59 09 18 27 37 46 06 55 07 05 14 23 32 41 07 5064 23 32 40 49 57 06 14 23 31 40 48 06 56 07 05 13 21 29 3762 24 32 40 48 55 03 11 18 26 34 41 49 06 57 07 04 12 19 26
N60 05 25 05 33 05 40 05 47 05 54 06 01 06 08 06 15 06 22 06 29 06 36 06 43 06 50 06 57 07 03 07 10 07 1658 26 33 39 46 52 05 59 05 12 18 24 31 37 44 50 06 56 07 02 0856 27 33 39 45 51 57 03 09 15 20 26 32 38 44 49 06 55 07 0154 27 33 38 44 49 55 06 00 06 11 17 22 28 33 38 44 49 06 5452 28 33 38 43 48 53 05 58 03 08 13 18 23 28 33 38 43 48
N50 05 29 05 33 05 38 05 42 05 47 05 51 05 56 06 01 06 06 06 10 06 15 06 20 06 24 06 29 06 33 06 38 06 4245 29 33 37 40 44 48 52 05 56 05 59 06 03 07 11 15 19 23 26 3040 30 33 35 38 41 44 48 51 54 05 57 06 00 06 04 07 10 13 17 2035 30 32 34 37 39 42 44 47 49 52 05 54 05 57 06 00 06 02 06 05 08 1130 30 31 33 35 37 39 41 43 45 47 49 51 05 53 05 55 05 58 06 00 06 02
N20 05 29 05 30 05 30 05 31 05 32 05 33 05 34 05 35 05 36 05 37 05 39 05 40 05 41 05 43 05 44 05 46 05 48N10 28 27 27 27 27 27 28 28 28 28 29 29 30 31 32 33 34
0 25 25 24 23 22 21 21 20 19 19 19 19 18 19 19 19 20S10 23 21 19 18 16 14 13 11 10 05 09 05 08 05 07 05 07 05 06 05 06 05 05 05 0520 19 16 14 11 05 08 05 06 05 04 05 02 05 00 04 58 04 56 04 54 04 53 04 51 04 50 04 49 04 48
S30 05 14 05 10 05 07 05 03 04 59 04 56 04 53 04 49 04 46 04 43 04 41 04 38 04 36 04 33 04 31 04 30 04 2835 11 06 05 02 04 58 54 50 46 42 38 35 31 28 25 22 20 18 1640 07 05 02 04 57 52 47 42 38 33 29 25 21 17 04 13 04 10 04 07 04 04 04 0145 05 02 04 56 50 44 39 33 28 23 18 04 12 04 08 04 03 03 59 03 54 03 50 03 47 03 4350 04 56 49 42 36 29 22 16 10 04 03 03 57 03 51 03 46 40 35 30 25 2152 04 53 04 45 04 38 04 31 04 24 04 17 04 10 04 03 03 57 03 50 03 44 03 37 03 31 03 25 03 20 03 14 03 0954 49 42 34 26 19 11 04 04 03 56 49 42 35 28 21 14 03 08 03 02 02 5756 46 38 29 21 13 04 05 03 57 48 41 33 25 17 03 10 03 02 02 55 02 48 4258 42 33 24 15 04 06 03 57 48 40 31 22 13 03 05 02 56 02 48 39 31 2460 04 37 04 27 04 18 04 08 03 58 03 49 03 39 03 29 03 19 03 09 03 00 02 50 02 40 02 30 02 21 02 11 02 01
EVENING CIVIL TWILIGHT
Lat October November
2 5 8 11 14 17 20 23 26 29 1 4 7 10 13 16 19
° h m h m h m h m h m h m h m h m h m h m h m h m h m h m h m h m h mN72 18 23 18 08 17 53 17 38 17 23 17 09 16 55 16 40 16 26 16 12 15 59 15 45 15 31 15 18 15 05 14 51 14 3870 20 07 53 40 27 14 17 01 48 36 24 16 12 16 00 15 48 37 26 15 15 15 0468 18 06 53 41 29 18 06 16 55 44 33 22 11 16 01 15 51 42 33 2466 16 05 54 43 32 21 11 17 00 50 40 31 21 12 16 04 15 55 47 4064 15 04 54 44 34 24 15 05 16 56 47 38 30 22 14 16 06 15 59 15 5362 14 04 54 45 36 27 18 09 17 01 53 45 37 30 23 16 16 10 16 04
N60 18 13 18 04 17 55 17 46 17 38 17 29 17 21 17 13 17 05 16 58 16 50 16 43 16 37 16 30 16 24 16 19 16 1358 12 03 55 47 39 32 24 16 09 17 02 16 56 49 43 37 32 27 2256 11 03 56 48 41 33 26 19 13 06 17 00 54 49 43 38 34 2954 10 03 56 49 42 35 29 22 16 10 04 16 59 54 49 44 40 3652 10 03 56 50 43 37 31 25 19 14 08 17 03 16 58 54 50 46 42
N50 18 10 18 03 17 57 17 51 17 45 17 39 17 33 17 27 17 22 17 17 17 12 17 07 17 03 16 58 16 55 16 51 16 4845 09 03 58 53 47 42 37 33 28 24 20 16 12 17 09 17 05 17 03 17 0040 09 04 17 59 55 50 46 42 38 34 30 27 23 20 17 15 12 1035 09 04 18 00 56 53 49 45 42 39 35 33 30 27 25 23 21 2030 09 05 02 17 58 17 55 52 49 46 43 41 38 36 34 32 31 29 28
N20 18 10 18 07 18 05 18 02 18 00 17 58 17 55 17 53 17 52 17 50 17 49 17 47 17 46 17 45 17 44 17 44 17 43N10 11 10 08 06 05 18 03 18 02 18 01 18 00 17 59 17 58 17 58 17 57 17 57 17 57 17 57 17 57
0 13 13 12 11 10 10 09 09 09 18 09 18 09 18 09 18 09 18 09 18 10 18 10 18 11S10 16 16 16 16 17 17 17 18 18 19 20 20 21 22 23 24 2620 20 21 22 23 24 25 26 28 29 30 32 33 35 37 39 18 41 18 43
S30 18 26 18 27 18 29 18 31 18 33 18 36 18 38 18 40 18 42 18 45 18 47 18 50 18 52 18 55 18 58 19 00 19 0335 29 32 34 37 39 42 45 48 18 50 18 53 18 57 19 00 19 03 19 06 19 09 12 1640 33 36 39 43 46 49 18 53 18 56 19 00 19 04 19 07 11 15 19 23 27 3045 38 42 46 50 18 54 18 58 09 03 19 07 12 16 21 25 30 35 19 39 19 44 19 4850 45 49 54 18 59 19 05 19 10 15 21 26 32 37 43 49 19 54 20 00 20 06 20 1152 18 47 18 53 18 58 19 04 19 09 19 15 19 21 19 27 19 33 19 39 19 45 19 51 19 58 20 04 20 10 20 17 20 2354 51 18 57 19 03 09 15 21 27 34 41 47 19 54 20 01 20 08 15 22 29 3656 55 19 01 08 14 21 28 35 42 49 19 57 20 04 12 20 28 35 20 43 20 5158 18 59 06 13 20 18 36 43 19 51 19 59 20 08 16 25 33 20 42 20 51 21 00 21 0960 19 04 19 12 19 19 19 28 19 36 19 44 19 53 20 02 20 11 20 20 20 30 20 40 20 50 21 00 21 11 21 21 21 32

481
Chapter 27Time (3)
SUNRISE
Lat November December Jan
19 22 25 28 1 4 7 10 13 16 19 22 25 28 31 3
° h m h m h m h m h m h m h m h m h m h m h m h m h m h m h m h mN7270 10 14 10 40 11 1968 09 30 09 45 10 00 10 16 10 33 10 52 11 1466 09 01 09 12 09 23 09 34 09 45 09 55 10 05 10 14 10 22 10 28 10 32 10 35 10 35 10 33 10 30 10 2564 08 39 08 48 08 57 09 06 09 15 09 23 09 30 09 36 09 42 09 47 09 50 09 52 09 53 09 52 09 51 09 4862 21 29 37 08 45 08 52 08 59 09 05 09 10 09 15 09 19 22 24 24 24 23 22
N60 08 07 08 14 08 21 08 28 08 34 08 40 08 45 08 50 08 54 08 58 09 00 09 02 09 03 09 03 09 03 09 0158 07 54 08 01 08 07 13 19 24 29 33 37 40 08 43 08 45 08 46 08 46 08 46 08 4556 43 07 49 07 55 08 01 08 06 08 11 15 19 23 26 28 30 31 32 32 3154 34 40 45 07 50 07 55 07 59 08 03 08 07 08 10 13 15 17 19 19 19 1952 26 31 36 40 45 49 07 53 07 56 07 59 08 02 08 04 08 06 08 07 08 08 08 08 08 08
N50 07 18 07 23 07 28 07 32 07 36 07 40 07 43 07 47 07 50 07 52 07 54 07 56 07 57 07 58 07 59 07 5845 07 02 07 06 07 10 07 14 17 21 24 27 29 32 34 35 37 38 38 3840 06 49 06 53 06 56 06 59 07 02 07 05 07 08 07 10 07 13 15 17 18 20 21 22 2235 38 41 44 46 06 49 06 52 06 54 06 57 06 59 07 01 07 03 07 04 07 06 07 07 07 08 07 0830 28 30 33 35 38 40 43 45 47 06 49 06 50 06 52 06 53 06 54 06 55 06 56
N20 06 11 06 13 06 15 06 16 06 18 06 20 06 22 06 24 06 26 06 28 06 29 06 31 06 32 06 33 06 35 06 36N10 05 56 05 57 05 58 06 00 06 01 06 03 06 04 06 06 06 07 06 09 06 10 06 12 06 13 06 15 06 16 17
0 42 42 43 05 44 05 45 05 46 05 48 05 49 05 50 05 52 05 53 05 55 05 56 05 58 05 59 06 01S10 28 28 28 28 29 30 31 32 33 34 35 37 39 40 42 05 4320 05 12 05 12 05 11 05 11 05 12 05 12 05 13 05 13 05 14 05 15 05 17 05 18 05 20 05 21 23 25
S30 04 54 04 53 04 52 04 52 04 51 04 51 04 52 04 52 04 52 04 53 04 55 04 56 04 58 04 59 05 01 05 0335 44 42 41 40 39 39 39 39 40 41 42 43 45 46 04 48 04 5140 32 30 28 27 26 25 25 25 25 26 27 28 29 31 34 3645 18 04 15 04 13 04 11 04 09 04 08 04 07 04 07 04 07 04 08 04 08 04 10 04 11 04 13 04 16 04 1950 04 00 03 57 03 54 03 51 03 49 03 47 03 45 03 45 03 45 03 45 03 46 03 47 03 49 03 51 03 54 03 5752 03 52 03 48 03 45 03 42 03 39 03 37 03 35 03 35 03 34 03 34 03 35 03 36 03 38 03 40 03 43 03 4654 43 39 35 31 29 26 23 23 22 22 23 24 26 28 31 3456 32 28 23 19 16 03 13 03 09 03 09 03 09 03 08 03 09 03 10 03 12 03 14 17 2158 21 15 03 10 03 06 03 02 02 58 02 53 02 53 02 52 02 52 02 52 02 53 02 55 02 57 03 01 03 0560 03 06 03 00 02 54 02 49 02 44 02 40 02 34 02 34 02 32 02 31 02 31 02 32 02 34 02 37 02 41 02 45
SUNSET
Lat November December Jan
19 22 25 28 1 4 7 10 13 16 19 22 25 28 31 3
° h m h m h m h m h m h m h m h m h m h m h m h m h m h m h m h mN7270 13 15 12 51 12 1368 14 00 13 47 13 33 13 19 13 04 12 47 12 2766 29 14 19 14 10 14 01 13 52 13 44 13 37 13 30 13 26 13 22 13 21 13 21 13 24 13 29 13 35 13 4364 14 51 14 43 36 29 14 22 14 17 14 12 14 08 14 05 14 04 14 03 14 04 14 06 14 10 14 15 14 2162 15 09 15 02 14 56 14 50 14 45 14 41 37 34 32 31 32 33 35 38 14 42 14 47
N60 15 23 15 18 15 12 15 08 15 03 15 00 14 57 14 55 14 54 14 53 14 53 14 55 14 57 14 59 15 03 15 0758 36 31 26 22 19 16 15 13 15 12 15 11 15 10 15 11 15 12 15 14 15 17 20 2456 46 42 38 35 32 29 27 26 25 25 26 27 29 31 34 3854 15 56 15 52 48 45 43 41 39 38 38 38 39 40 42 44 47 15 5052 16 04 16 01 15 58 15 55 15 53 15 51 50 49 48 49 49 15 51 15 52 15 55 15 58 16 01
N50 16 12 16 09 16 06 16 03 16 01 16 00 15 59 15 58 15 58 15 58 15 59 16 01 16 02 16 05 16 07 16 1045 28 26 24 22 21 20 16 19 16 19 16 19 16 19 16 20 21 23 25 28 3040 41 39 38 37 36 35 35 35 35 36 37 38 40 42 44 16 4735 16 53 16 51 16 50 16 49 16 49 16 48 16 48 16 48 16 49 16 50 16 51 16 52 16 54 16 56 16 58 17 0030 17 03 17 01 17 01 17 00 17 00 17 00 17 00 17 01 17 01 17 02 17 04 17 05 17 07 17 09 17 10 13
N20 17 20 17 19 17 19 17 19 17 19 17 20 17 20 17 21 17 22 17 23 17 25 17 26 17 28 17 29 17 31 17 33N10 35 35 35 36 37 37 38 39 41 42 17 43 17 45 17 46 17 48 17 50 17 51
0 17 49 17 50 17 51 17 52 17 53 17 54 17 55 17 56 17 58 17 59 18 01 18 02 18 04 18 05 18 07 18 08S10 18 03 18 05 18 06 18 07 18 09 18 10 18 12 18 14 18 15 18 17 18 20 21 23 24 2520 19 21 23 25 26 28 30 32 34 36 37 18 39 18 40 18 41 18 43 18 44
S30 18 37 18 39 18 42 18 44 18 47 18 49 18 51 18 54 18 56 18 58 18 59 19 01 19 02 19 03 19 04 19 0535 47 18 50 18 53 18 56 18 59 19 02 19 04 19 06 19 09 19 11 19 12 14 15 16 17 1840 18 59 19 03 19 06 19 09 19 13 16 18 21 23 26 27 29 30 31 32 3245 19 14 18 22 25 29 32 36 19 39 19 41 19 44 19 45 19 47 19 48 19 49 19 50 19 5050 31 36 41 45 50 19 54 19 57 20 01 20 03 20 06 20 08 20 10 20 11 20 12 20 12 20 1152 19 40 19 45 19 50 19 55 19 59 20 04 20 07 20 11 20 14 20 17 20 19 20 21 20 22 20 22 20 22 20 2254 19 49 19 55 20 00 20 05 20 10 15 19 23 26 29 31 33 34 34 34 3456 20 00 20 06 12 18 23 28 33 37 40 20 43 20 45 20 47 20 48 20 49 20 48 20 4758 12 19 25 32 38 20 43 20 48 20 53 20 57 21 00 21 02 21 04 21 05 21 05 21 05 21 0360 20 26 20 34 20 41 20 48 20 55 21 01 21 07 21 12 21 17 21 20 21 23 21 25 21 25 21 25 21 24 21 22

482
Chapter 27 Time (3)
MORNING CIVIL TWILIGHTLat November December Jan
19 22 25 28 1 4 7 10 13 16 19 22 25 28 31 3
° h m h m h m h m h m h m h m h m h m h m h m h m h m h m h m h mN72 08 51 09 05 09 20 09 34 09 48 10 02 10 15 10 27 10 38 10 48 10 54 10 57 10 57 10 53 10 46 10 3870 25 08 37 08 48 08 59 09 09 09 19 09 28 09 36 09 43 09 48 09 52 09 54 09 55 09 54 09 51 09 4768 08 06 08 15 25 34 08 42 08 50 08 57 09 04 09 09 09 14 09 17 09 19 09 20 09 20 09 18 09 1566 07 50 07 58 08 06 08 14 22 29 35 08 40 08 45 08 49 08 52 08 54 08 55 08 55 08 54 08 5264 37 44 07 52 07 59 08 05 08 11 17 22 26 29 32 34 35 35 34 3362 26 33 39 45 07 51 07 57 08 02 08 06 08 10 13 16 18 19 19 19 18
N60 07 16 07 23 07 29 07 34 07 40 07 45 17 49 07 53 07 57 08 00 08 02 08 04 08 05 08 06 08 06 08 0558 08 14 19 24 29 34 38 42 45 07 48 07 51 07 52 07 54 07 54 07 54 07 5456 07 01 07 06 11 16 21 25 29 32 36 38 40 42 43 44 44 4454 06 54 06 59 07 04 08 13 17 20 24 27 29 32 33 35 35 36 3552 48 53 06 57 07 01 07 05 09 13 16 19 21 23 25 26 27 28 27
N50 06 42 06 47 06 51 06 55 06 59 07 02 07 06 07 09 07 11 07 14 07 16 07 18 07 19 07 20 07 20 07 2045 30 34 38 41 44 06 47 06 50 06 53 06 56 06 58 07 00 07 02 07 03 07 04 07 05 07 0540 20 23 26 29 32 35 38 40 42 44 06 46 06 48 06 49 06 50 06 51 06 5235 11 13 16 19 21 24 26 29 31 33 34 36 38 39 40 4030 06 02 06 05 06 07 06 10 06 12 06 14 06 16 18 20 22 24 26 27 28 29 30
N20 05 48 05 49 05 51 05 53 05 55 05 56 05 58 06 00 06 02 06 04 06 05 06 07 06 08 06 09 06 11 06 12N10 34 35 36 37 39 40 42 05 43 05 45 05 46 05 48 05 49 05 51 05 52 05 54 05 55
0 20 20 21 22 23 24 25 26 28 29 31 32 34 35 37 38S10 05 05 05 05 05 05 05 06 05 06 05 07 05 08 05 09 05 10 05 11 05 13 05 14 05 16 05 17 05 19 2020 04 48 04 48 04 48 04 47 04 47 04 48 04 48 04 49 04 50 04 51 04 52 04 53 04 55 04 57 04 59 05 00
S30 04 28 04 27 04 26 04 25 04 24 04 24 04 24 04 25 04 25 04 26 04 27 04 28 04 30 04 32 04 34 04 3635 16 04 14 04 12 04 11 04 10 04 10 04 10 04 10 04 10 04 11 04 12 04 13 04 15 04 17 19 2140 04 01 03 59 03 57 03 55 03 54 03 53 03 52 03 52 03 52 03 53 03 54 03 55 03 57 03 59 04 01 04 0445 03 43 40 38 35 33 32 31 30 30 30 31 32 34 36 03 39 03 4250 21 17 13 03 10 03 07 03 04 03 03 03 01 03 01 03 01 03 01 03 03 03 04 03 07 03 10 03 1352 03 09 03 05 03 00 02 57 02 53 02 51 02 49 02 47 02 46 02 46 02 46 02 47 02 49 02 52 02 55 02 5854 02 57 02 51 02 46 42 38 35 32 30 29 28 28 29 31 34 37 4156 42 35 30 24 02 20 02 15 02 12 02 09 02 07 02 06 02 06 02 07 02 09 02 12 02 16 02 2058 24 02 16 02 09 02 02 01 56 01 50 01 46 01 42 01 39 01 37 01 36 01 37 01 39 01 42 01 47 01 5360 02 01 01 52 01 42 01 33 01 24 01 16 01 07 00 59 00 53 00 49 00 47 00 47 00 49 00 54 01 01 01 10
EVENING CIVIL TWILIGHT
Lat November December Jan
19 22 25 28 1 4 7 10 13 16 19 22 25 28 31 3
° h m h m h m h m h m h m h m h m h m h m h m h m h m h m h m h mN72 14 38 14 26 14 13 14 01 13 49 13 37 13 27 13 17 13 09 13 02 12 59 12 59 13 02 13 09 13 19 13 3170 15 04 14 54 14 45 14 36 14 28 14 20 14 14 14 08 14 04 14 02 14 01 14 02 14 04 14 09 14 14 14 2168 24 15 16 15 08 15 01 14 55 14 49 14 44 14 41 14 38 14 36 14 36 14 37 14 39 14 43 14 47 14 5366 40 33 26 20 15 15 15 11 15 07 15 04 15 02 15 01 15 01 15 03 15 05 15 08 15 12 15 1764 15 53 47 41 36 32 28 25 23 21 21 21 22 24 27 31 3562 16 04 15 58 15 54 15 49 46 42 40 38 37 37 37 39 41 43 15 46 15 51
N60 16 13 16 09 16 04 16 01 15 57 15 55 15 53 15 51 15 50 15 50 15 51 15 52 15 54 15 57 16 00 16 0358 22 17 14 10 16 08 16 05 16 04 16 02 16 02 16 02 16 03 16 04 16 06 16 08 11 1556 29 26 22 19 17 15 13 13 12 12 13 14 16 19 21 2554 36 33 30 27 25 23 22 21 21 21 22 24 25 28 30 3352 42 39 36 34 32 31 30 29 29 29 30 32 34 36 39 41
N50 16 48 16 45 16 43 16 41 16 39 16 38 16 37 16 36 16 37 16 37 16 38 16 39 16 41 16 43 16 46 16 4845 17 00 16 58 16 56 16 55 16 53 16 53 16 52 16 52 16 52 16 53 16 54 16 55 16 57 16 59 17 01 17 0440 10 17 09 17 07 17 06 17 06 17 05 17 05 17 05 17 06 17 06 17 08 17 09 17 11 17 13 15 1735 20 18 17 17 16 16 16 17 17 18 19 21 22 24 26 2830 28 27 27 26 26 26 26 27 28 29 30 31 33 35 37 39
N20 17 43 17 43 17 43 17 43 17 43 17 44 17 45 17 45 17 46 17 48 17 49 17 50 17 52 17 53 17 55 17 57N10 17 57 17 57 17 58 17 58 17 59 18 00 18 01 18 02 18 03 18 05 18 06 18 08 18 09 18 11 18 12 18 14
0 18 11 18 12 18 13 18 14 18 15 16 17 19 20 22 23 25 26 28 29 30S10 26 27 29 30 32 33 35 37 38 18 40 18 41 18 43 18 44 18 46 18 47 18 4820 18 43 18 45 18 47 18 49 18 51 18 53 18 55 18 57 18 58 19 00 19 02 19 03 19 05 19 06 19 07 19 08
S30 19 03 19 06 19 09 19 11 19 14 19 16 19 19 19 21 19 23 19 25 19 27 19 28 19 30 19 31 19 32 19 3235 16 19 22 25 28 31 33 36 38 40 19 42 19 44 19 45 19 46 19 47 19 4740 30 34 38 19 41 19 45 19 48 19 51 19 54 19 56 19 58 20 00 20 02 20 03 20 04 20 05 20 0545 19 48 19 53 19 57 20 01 20 05 20 09 20 12 20 16 20 18 20 21 23 25 26 26 27 2750 20 11 20 17 20 22 27 32 37 41 44 20 48 20 50 20 53 20 54 20 55 20 56 20 56 20 5552 20 23 20 29 20 35 20 40 20 45 20 50 20 55 20 59 21 03 21 06 21 08 21 10 21 11 21 11 21 11 21 1054 36 42 20 49 20 55 21 01 21 07 21 12 21 16 20 23 26 27 28 29 28 2756 20 51 20 58 21 06 21 13 20 26 32 21 37 21 42 21 45 21 48 21 50 21 51 21 50 21 49 21 4758 21 09 21 18 27 21 36 21 44 21 51 21 59 22 05 22 10 22 15 22 18 22 20 22 20 22 20 22 18 22 1560 21 32 21 43 21 55 22 06 22 17 22 27 22 39 22 48 22 57 23 04 23 08 23 10 23 09 23 07 23 03 22 56

483
Chapter 28Critical Point (CP) andPoint of No Return (PNR)
CHAPTER TWENTY EIGHT
CRITICAL POINT (CP) and POINT OF NO RETURN (PNR)
Contents
INTRODUCTION . . . . . . . . . . . . . . . . . . . . . . . . . . . . . . . . . . . . . . .485
CRITICAL POINT (CP) . . . . . . . . . . . . . . . . . . . . . . . . . . . . . . . . . . . .486
POINT OF NO RETURN (PNR) . . . . . . . . . . . . . . . . . . . . . . . . . . . . . . .488
RADIUS OF ACTION . . . . . . . . . . . . . . . . . . . . . . . . . . . . . . . . . . . . .491

484
Chapter 28 Critical Point (CP) andPoint of No Return (PNR)

485
Chapter 28Critical Point (CP) andPoint of No Return (PNR)
INTRODUCTION
When planning flights in Europe, the pilot is assured normally that there are numerous diversions available within the safe endurance of the aircraft. This is not always the case and it is still possible today to identify routes where there is either no diversion available or at most one useable diversion. In these situations, it is extremely important at the flight planning stage to consider the action to be taken in the event of an emergency. The principles involved and the decisions to be made are relevant to any flight.
On a flight between departure point (A) and destination (B) without any diversion you may be faced with a time-critical problem (for example a cabin fire or passenger with heart attack). In this emergency, you will have to decide whether it is quicker to return to your departure point or to continue to your destination. This is a classic critical point, CP, (or Point-of-equal-time) situation.
The Critical Point (CP) is the decision point between two airfields from which it would take the same time to fly to either airfield.
Given the same route involving a flight between two airfields without a diversion, you may be faced with a different problem which is fuel-critical rather than time-critical. If the weather at your destination deteriorates below landing minima, and you have no viable weather diversion, you will need to know how far you can proceed along track towards your destination and then decide to return to your departure point within the safe endurance of the aircraft.
This decision point is known as the Point of No Return, PNR, (Point of Safe Return) and is defined as that point furthest removed from departure point to which an aircraft can fly and still return to its departure point within its safe endurance.
The methods for calculating each of these decision points, and the factors which affect the position of each point, are given in the following paragraphs.

486
Chapter 28 Critical Point (CP) andPoint of No Return (PNR)
CRITICAL POINT (CP)(Also known as Point of Equal Time)
The Critical Point (CP) is the decision point between two airfields from which it would take the same time to fly to either airfield. The Critical Point can be calculated by formula, from the fuel Howgozit (the fuel graph) or by graphical construction on the aeronautical chart being used. For the General Navigation syllabus, the student must be able to use the formula method.
CP Formula Method(Derivation of formula not required)Consider the situation when an aircraft is flying from departure point A to destination B, a distance of D nms, as depicted in the diagram below.
Figure 30.1Figure 28.1
A point, C, exists where the time to return from C to A equals the time to continue from C to B. C will be the Critical Point.
Let the distance from A to C be X nms , (X is the distance to the CP). The distance from the CP (C) onwards to destination will be D - X nms. If the outbound groundspeed is O, and the homebound groundspeed is H:
TIME BACK FROM C TO A = TIME ON FROM C TO B
but TIME = DISTANCE and we can substitute in the above equation SPEED
X = D-X H O

487
Chapter 28Critical Point (CP) andPoint of No Return (PNR)
by transposition:
OX = DH - HX
OX + HX = DH X (O + H) = DH
Finally:
X = D H The Critical Point formula (O + H)
Example: An aircraft is flying from A to B at a TAS of 500 kts with a headwind component of 50 kts If the distance between A and B is 2000nms, what is the distance to the Critical Point (CP) and how long after leaving A will the aircraft take to reach the CP?
D = 2000nms, O = 450kts, H = 550kts, O + H = 1000kts (2 x TAS)
Using the CP formula above:
X = 2000 x 550
1000
X = 1100nms
The time taken to reach the CP is the distance to CP(X) divided by the outbound groundspeed (O). Time to CP = Distance (X) = 1100 = 2.44hrs = 2hrs 26mins Outbound GS 450
Some simple CP Rules are:
CP is independent of fuel endurance.
In still air, CP is midway between departure point and destination.
With a headwind CP moves towards destination; with a tailwind ,CP moves back towards departure point. Put simply, CP always moves into wind from the still air midpoint . If the wind reduces, the CP will move towards the still air condition ,ie, the midpoint.
The effect of increasing TAS is the same as that of reducing wind, namely, the CP always moves towards the still air condition - the mid point.

488
Chapter 28 Critical Point (CP) andPoint of No Return (PNR)
POINT OF NO RETURN (PNR)(Also called POINT of SAFE RETURN)
The Point of No Return (PNR) is defined as that point furthest removed from departure point to which an aircraft can fly and still return to its departure point within its safe endurance. The formula solution for PNR is derived from the principle that the distance out to the PNR from the departure point equals the distance back to the departure point (An obvious statement but note that time out/back is not equal as it was in the CP solution).
Figure 30.2Figure 28.2
PNR Formula Method(Derivation of formula not required)
Let the Safe Endurance of the aircraft be E hrs and, as before, let O be the outbound groundspeed and H the homebound groundspeed. In this case, we will use the time to reach the PNR, (T), to derive the basic formula.
We know that the distance out to the PNR equals the distance back from the PNR.
DISTANCE OUT TO PNR = DISTANCE BACK FROM PNR
(But DISTANCE = SPEED x TIME)
Therefore:
SPEED OUT x TIME OUT = SPEED BACK x TIME BACK

489
Chapter 28Critical Point (CP) andPoint of No Return (PNR)
If the speed out is O and the time out is T, then the time back is (E-T) and the speed back is H. The above equation can be written:
O x T = H x (E-T) or OT = HE - HT OT + HT = HE T (O+H) = E (H)
Finally: Time to PNR is given by:
T = E x H this gives the time (T) in hours to the PNR (O + H)
Alternatively, Distance to PNR is given by:
Distance to PNR = E x O x H (O + H)
Example 1 An aircraft is flying from A to B at a TAS of 450 kts in still air. If the aircraft’s safe endurance (E) is 6hrs, what is, (a) the time, (b) the distance, to PNR?
In still air, O = H = TAS = 450kts
a) Time to PNR is given by:
T = E x H = 6 x 450 = 3 hrs O + H 900
b) Distance to PNR is given by:
Distance = E x O x H (O + H)
= 6 x 450 x 450 = 1350 nms. (or simply, 3 hrs at 450 kts) 900
Example 1 may seem simple, but it illustrates an important point, namely that the maximum PNR distance is always achieved in still air. In Example 2, we will examine the effect of a headwind component.

490
Chapter 28 Critical Point (CP) andPoint of No Return (PNR)
Example 2As Example 1, but with a headwind component of 50 kts.
With a 50 kt headwind, TAS = 450 kts, O = 400 kts, H = 500 ktsbut (O+H) remains 900 kts (2 x TAS)
a) Time to PNR is given by:
T = E x H = 6 x 500 = 3.33 hrs = 3 hrs 20 mins (O + H) 900
b) Distance to PNR is given by:
Distance = E x O x H (O + H)
= 6 x 400 x 500 = 1333 nms. (simply, 3 hrs 20 mins at 400 kts) 900
Note: The effect of a headwind is to reduce the distance to PNR. (in this case from 1350 nms to 1333 nms).
The effect of a tailwind:
Example 3As Example 2, but with a tailwind component of 50 kts.
With a 50 kt tailwind, TAS = 450 kts, O = 500 kts, H = 400 ktsbut (O+H) remains 900 kts (2xTAS)
a) Time to PNR is given by:
T = E x H = 6 x 400 = 2.66 hrs = 2 hrs 40 mins (O + H) 900
b) Distance to PNR is given by:
Distance = E x O x H (O + H)
= 6 x 500 x 400 = 1333 nms. (simply, 2 hrs 40 mins at 500 kts) 900
Refer back to Example 2 and note that, numerically, the formula for distance to PNR has not changed.
The effect of a tailwind is to reduce the distance to PNR .
Bearing in mind the result in Example 2, we can now state that all wind components, head or tail, will reduce the distance to the PNR.

491
Chapter 28Critical Point (CP) andPoint of No Return (PNR)
Some simple PNR rules are:
Maximum distance to PNR is achieved in still air conditions. All wind components, head or tail, reduce the distance to PNR.
If a wind component increases, the distance to PNR decreases.
If a wind component decreases, the distance to PNR increases.
An increase in TAS has the same effect as a reduction in wind component - an increase in the distance to PNR. Conversely, a decrease in TAS has the same effect as an increase in wind component - a decrease in the distance to PNR.
RADIUS OF ACTION
Simple PNR problems can be solved by the formulae already given and can be adapted to solve other problems. For example, to conduct a search and rescue operation, a crew may need to know at what range from their base they can conduct a search lasting , say 4 hrs , and still return to base within their Safe Endurance. In other words they need to know their Radius of Action for a given task. The Radius of Action is the distance to the furthest point from departure to which an aircraft can fly, carry out a given task, and return to its departure point within its safe endurance.
The formulae for calculating the Radius of Action are similar to those for calculating PNR but the input ‘E’ , the safe endurance, is now reduced by the time taken doing the given task (often annotated as P - the Patrol time). Thus, for Radius of Action calculations, E becomes Safe Endurance minus Patrol Time.
ExampleA search and rescue aircraft is tasked to carry out a search pattern which will last 2 hrs. If the aircraft’s safe endurance is 8 hrs and it will fly at 240 kts TAS with an outbound headwind of 40 kts, what is its Radius of Action?
TAS = 240 kts, O = 200 kts, H = 280kts, O + H = 480ktsE = Safe Endurance minus Patrol Time = 8 hrs - 2 hrs = 6 hrs
Distance to Radius of Action (like PNR) is given by:
Distance = E x O x H (O + H)
= 6 x 200 x 280 = 700 nms. 480
The rules for how Radius of Action changes with changes in wind component, TAS or fuel available are the same as those for PNR.

492
Chapter 28 Critical Point (CP) andPoint of No Return (PNR)

493
Chapter 29Gridded Charts
CHAPTER TWENTY NINE
GRIDDED CHARTS
Contents
INTRODUCTION . . . . . . . . . . . . . . . . . . . . . . . . . . . . . . . . . . . . . . .495
GRIDDED CHARTS . . . . . . . . . . . . . . . . . . . . . . . . . . . . . . . . . . . . . .498
CONVERGENCE. . . . . . . . . . . . . . . . . . . . . . . . . . . . . . . . . . . . . . . .499
EAST OR WEST CONVERGENCE? . . . . . . . . . . . . . . . . . . . . . . . . . . . . .500
STEERING BY COMPASS . . . . . . . . . . . . . . . . . . . . . . . . . . . . . . . . . . .501
STEERING BY GYRO . . . . . . . . . . . . . . . . . . . . . . . . . . . . . . . . . . . . .504
POLAR GRIDS . . . . . . . . . . . . . . . . . . . . . . . . . . . . . . . . . . . . . . . . .505
GRID / TRUE CONVERSION PROBLEMS . . . . . . . . . . . . . . . . . . . . . . . . .507
MORE GRID / TRUE CONVERSION PROBLEMS . . . . . . . . . . . . . . . . . . . . .509
QUESTIONS . . . . . . . . . . . . . . . . . . . . . . . . . . . . . . . . . . . . . . . . . .513
ANSWERS . . . . . . . . . . . . . . . . . . . . . . . . . . . . . . . . . . . . . . . . . . .516

494
Chapter 29 Gridded Charts

495
Chapter 29Gridded Charts
INTRODUCTION
Why is Grid navigation used? The main reason is that, at high latitudes, the amount of meridian convergence becomes significant. Consider the case at Figure 29.1.
A is at longitude 70W. The line defining True North is the line joining A to the North Pole - the meridian of 70W. The track AB makes an initial track angle of 020°(T).
So suppose we set off using a compass based on True heading and keep applying the appropriate drift to maintain a track of 020°(T).
But as we cross each meridian going eastwards, the direction of True North changes. Relative to the ‘top of the map’, i.e. the 12 o’clock position on the page, the direction of North is turning anti- clockwise. This means that our direction of 020°(T) will also turn anti-clockwise on this map.
Figure 31.1. A High Latitude Track
Figure 29.1 A High Latitude Track
If we maintain a track of 020°(T), our path over the ground will look something like this:
Figure 31.2. Changing True TrackFigure 29.2 Changing True Track

496
Chapter 29 Gridded Charts
Exactly the same problem occurs at lower latitudes (unless a Direct Mercator chart is being used), but it is usually not noticed.
Figure 31.3. A Lambert Chart.Figure 29.3 A Lambert Chart.
We wish to fly from C to D, which are both at 53N. The mean track is 090° (T). The initial track is 082°(T). We are using a Lambert chart. We now have a choice:
1. We can maintain a track of 090°(T). If we do, we will still finish up at D, but we will fly the Rhumb Line track. If we were to take a succession of fixes whilst flying, but not alter track, they would appear like this:
Figure 31.4. Flying the Rhumb Line trackFigure 29.4 Flying the Rhumb Line track
However, this is not how most navigation actually takes place. The idea of having a straight line on your chart is that it is supposed to be the track you are trying to fly. If you wanted to fly the Rhumb Line track, you would use a Mercator chart. So most non-automatic navigation is done using the other option.

497
Chapter 29Gridded Charts
2. We can set off on the initial track of 082°(T). We then settle into our normal regular cycle of fixing and correcting back to track. After a certain time we take our first fix. There will probably be some cross-track error, mainly caused by a combination of the following components.
Changes in the wind from the forecast value.
Inaccurate heading hold.
The cross-track error will also include a small component caused by holding a track of 082°(T) whilst the straight line track has actually altered to, say, 083°(T), but this will be completely swamped by other random navigation errors, of which the above will be far the greatest components. We don’t even notice the cross-track position error caused by convergency because it is usually so small at low to medium latitudes.
We plot our fix, then use our protractor to make a normal correction to get back to track, locally measuring the track near the fix, thereby automatically correcting for the convergency. During the course of the leg, the datum track will change from 082°(T) to 098°(T), but the process happens simply by correcting back to the straight-line track on the chart and measuring using the local meridian.
Figure 31.5. Flying the Great Circle trackFigure 29.5 Flying the Great Circle track

498
Chapter 29 Gridded Charts
GRIDDED CHARTS
This technique of sweeping the change of track into the normal navigation corrections breaks down at high latitudes, however, because the amount of convergency becomes too great to ignore. We therefore have to abandon True North as our direction datum and use a Grid and its associated Grid North on our chart instead. We also have to align our compass to Grid North, not True North
Figure 31.6. Standard North Polar Grid.
Figure 29.6 Standard North Polar Grid.
There are various different methods of selecting the datum direction for Grid North but, for the EASA ATPL syllabus, the datum chosen will always be aligned with a nominated meridian of longitude (the Greenwich meridian, for instance, in the examples in Figs 29.6 and 29.7).
If the Greenwich meridian is the chosen datum, the grid is known as a Standard Grid. Standard grids are widely used in printed grid maps for the European area. Another favourite datum often used in the USA and Canada is 0600W.
At the Datum meridian, there is no difference between Grid North and True North. As the longitude changes further and further East or West from the datum, the angle between True North and Grid North increases (see Figure 29.7) because Grid North remains parallel to the Datum meridian but True North changes with the increasing convergency of the meridians.
Figure 29.7 Creation of GridFigure 31.7 Creation of Grid

499
Chapter 29Gridded Charts
CONVERGENCE
In order to obtain a constant straight line track direction, a datum meridian is selected and lines parallel to this meridian are drawn at suitable intervals on the chart to form a grid.
The direction of the Datum meridian is known as Grid North. The direction of the track measured from Grid north is constant and is known as Grid direction.
This enables an aircraft to fly along approximate great circle tracks.
The difference between True direction and Grid direction at any point is known as convergence. You should be able to see from Figure 29.7 that it is equal to the chart convergence between the meridian at that point and the Datum meridian, because Grid North will be parallel to the Datum Meridian whilst True North will have changed by the amount of the chart convergence between the Datum Meridian and the local meridian at the point being considered.
Convergence is annotated Easterly when True north lies to the East of Grid north and Westerly when True north lies to the West of Grid north.
This enables the conversion of Grid direction to True direction by applying the convergence in the sense:
Convergence EAST True LEAST Convergence WEST True BEST
GRID CONV TRUE
105°(G) 20°W 125°(T)
105°(G) 20°E 085°(T)
Fig 31.9 Convergence East Fig 31.8 Convergence West Figure 29.8 Convergence West Figure 29.8 Convergence West

500
Chapter 29 Gridded Charts
Convergence follows the same pattern of conversion of direction as our previous conversions of:-True Variation Magnetic Deviation Compass
True Variation Magnetic Deviation Compass West Best West Best
Except that it goes on the left-hand side of the columns (if going from True to Compass)
Grid Convergence True Variation Magnetic Deviation Compass West Best West Best West Best
So, to give an example:
Grid Convergence True Variation Magnetic Deviation Compass
090°(G) 10°W 100°(T) 8°W 108°(M) 2°E 106°(C)
EAST OR WEST CONVERGENCE?
There is a logical way of working out whether convergence will be East or West. It depends on whether we are in the Northern or Southern hemisphere and whether the aircraft position is East or West of the Datum Meridian. See the diagram at Figure 29.10.
Fig 31.10 Putting a Grid on the EarthFigure 29.10 Putting a Grid on the Earth
In this diagram, the vertical centre line represents the Datum Meridian. In this particular figure, it is the Greenwich meridian, but it does not have to be. The red lines represent other meridians on the Earth and the green lines represent Grid North.
Now consider the top left quarter of the diagram. This represents the Northern hemisphere, with the aircraft at some position out to the left, ie, on a meridian somewhere to the West of the Datum.

501
Chapter 29Gridded Charts
In this quarter of the diagram, except at the Equator itself, True North leans to the right (the East) of Grid North, like this:
Therefore, by definition, convergence must be East
Figure 29.11 True North East of Grid North
Now work through the other 3 quadrants of the diagram and we finish up with the following:
Figure 31.12 Direction of ConvergenceFigure 29.12 Direction of Convergence
Now that we can convert from True to Grid on the chart, we need to find a method of steering Grid direction. This can either be done using a compass or using a gyro.
STEERING BY COMPASS
If grid technique is being used because of the problem of meridian convergence at high latitudes, then the aircraft may also be fairly near one of the Magnetic Poles. In this case, it may not be practical to use a magnetic compass because variation may be changing too rapidly or the magnetic field strength may be too weak. However, even at high latitudes this may not always be the case. Flying in parts of Northern Canada would probably give a problem, but flying in Northern Europe or Northern Russia, for instance, probably would not, because these areas are a greater distance from the Magnetic North Pole. So it may be possible, under some circumstances, to steer by magnetic compass even when using grid technique.
Fig 31.11 True North East of Grid North

502
Chapter 29 Gridded Charts
The problem is not too complicated and is very comparable to the problem of steering True heading when using a magnetic compass. When using True steering, we apply Deviation to convert the Compass heading to Magnetic heading, then apply the difference between Magnetic direction and True direction (Variation). For Grid steering, all we have to do is apply Deviation to convert the Compass heading to Magnetic heading, then apply the difference between Magnetic direction and Grid direction. We call this Grivation and it is the algebraic sum of Variation and Convergence.
If a Magnetic direction is required from a Grid direction the Convergence and Variation must be applied.
GRID CONV TRUE VAR = MAG090° 10°E 080° 10°E 070°
In the example above Grivation is 20°E. Grivation can be applied directly to Grid direction to give Magnetic direction and vice-versa.
GRID GRIV MAG 090° 20°E 070°
Examples
CONVERGENCE VARIATION GRIVATION
17°W + 4°E = 13°W
11°E + 4°E = 15°E
14°E + 4°W = 10°E
Lines on a chart joining places of equal Grivation are named isogrivs.
For some practice, consider the following situation:
A straight line track is drawn between two points on a Lambert or Polar Stereographic chart as shown in Figure 29.13.
Figure 31.13. A Track Drawn on a Chart withConverging Meridians.
Figure 29.13 A Track Drawn on a Chart with Converging Meridians.

503
Chapter 29Gridded Charts
Now complete the table below.
The trick is to remember is that the Grid Track does not change direction. If you have found the Grid track at one longitude, it must be the same Grid track at all longitudes.
POS °GRID CONV °TRUE VAR GRIV °MAG
A 066 8W
B 6W 090
C 099 4W
D 0 117
E 133 2E
CHECK: GRID + GRIV = MAG TRUE + VAR = MAG
Now let us see how we would use a magnetic compass to steer a True heading as the variation changes, and then we will see that much the same principles can be applied to steering a Grid heading.
Fig 31.14 Updating Variation on Crossing IsogonalsFigure 29.14 Updating Variation on Crossing Isogonals
In Figure 29.14 we have a Rhumb Line track. After correction for drift, we need to maintain a True heading of, say, 080°(T). To the west of the 3.5°W isogonal, the variation is, to the nearest degree, 3°W. To the east of it, the variation is 4°W. Similarly, at the 4.5°W isogonal, tracking eastwards, the variation changes from 4°W to 5°W.
The pilot starts by flying a magnetic heading of 083°(M) in order to maintain a true heading of 080°(T). As he crosses the 3.5°W isogonal, he alters magnetic heading to 084°(M), and then as he crosses the 4.5°W isogonal, he alters magnetic heading to 085°(M), maintaining a true heading of 080°(T).
If a chart is constructed with isogrivs, then the same principles can be used to maintain a Grid heading when using a magnetic compass.

504
Chapter 29 Gridded Charts
Figure 29.15 shows a printed grid chart. The blue graticule is latitude and longitude. The grey graticule is the grid. The Blue dotted lines are isogonals. The grey ones are isogrivs.
Fig 31.15 A Gridded Chart
Lat/long graticule
Grid Graticule
Isogonals
Isogrivs
Figure 29.15 A Gridded Chart
You can see from the above chart that the rate at which the isogrivs are changing is much the same as the rate at which the isogonals are changing, so it is no more difficult, in many parts of the world, to fly a Grid heading using a magnetic compass than it is to fly a True heading when using a magnetic compass.
STEERING BY GYRO
However, one of the reasons that we may be using Grid is because the aircraft is at high latitudes. In this case, a magnetic compass may be unusable in some parts of the world because the route is within the 6 microtesla zone, and the horizontal component of the Earth’s magnetic field is too weak. In other parts, the rate of variation may be changing too rapidly to be usable.
In these cases, we would steer by gyro. The errors of a gyro are Real Drift (also known as Random Wander), Earth Rate, and Transport Wander.
Real DriftReal Drift in INS-quality gyros is of the order of one-hundredth of a degree per hour. However, if an INS were fitted, it would not normally be necessary to use Grid, because most INS are polar-programmed and can continue to operate in True up to very high latitudes. Nevertheless, if no INS is fitted, on a typical modern airline-quality Slaved Gyro Compass, the gyro drift-rate will still be only about one-tenth of a degree per hour when operating in DG mode. In this case, Real Drift is low enough to be insignificant.
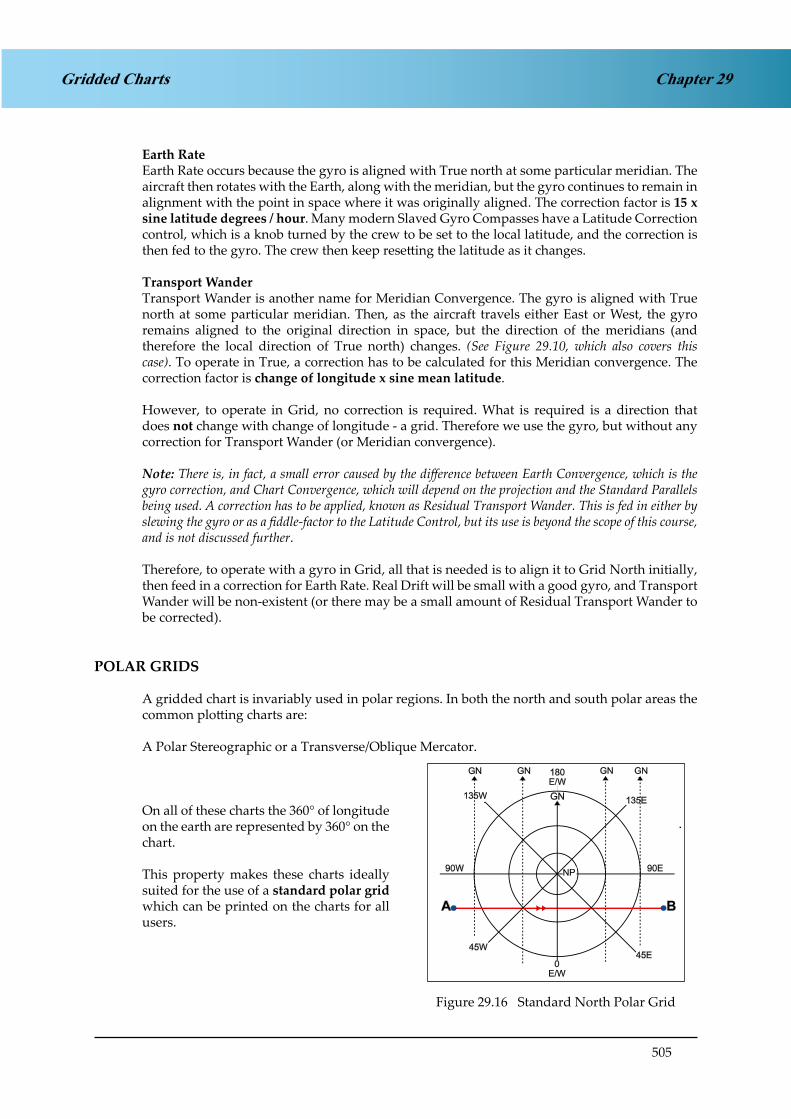
505
Chapter 29Gridded Charts
Earth RateEarth Rate occurs because the gyro is aligned with True north at some particular meridian. The aircraft then rotates with the Earth, along with the meridian, but the gyro continues to remain in alignment with the point in space where it was originally aligned. The correction factor is 15 x sine latitude degrees / hour. Many modern Slaved Gyro Compasses have a Latitude Correction control, which is a knob turned by the crew to be set to the local latitude, and the correction is then fed to the gyro. The crew then keep resetting the latitude as it changes.
Transport WanderTransport Wander is another name for Meridian Convergence. The gyro is aligned with True north at some particular meridian. Then, as the aircraft travels either East or West, the gyro remains aligned to the original direction in space, but the direction of the meridians (and therefore the local direction of True north) changes. (See Figure 29.10, which also covers this case). To operate in True, a correction has to be calculated for this Meridian convergence. The correction factor is change of longitude x sine mean latitude.
However, to operate in Grid, no correction is required. What is required is a direction that does not change with change of longitude - a grid. Therefore we use the gyro, but without any correction for Transport Wander (or Meridian convergence).
Note: There is, in fact, a small error caused by the difference between Earth Convergence, which is the gyro correction, and Chart Convergence, which will depend on the projection and the Standard Parallels being used. A correction has to be applied, known as Residual Transport Wander. This is fed in either by slewing the gyro or as a fiddle-factor to the Latitude Control, but its use is beyond the scope of this course, and is not discussed further.
Therefore, to operate with a gyro in Grid, all that is needed is to align it to Grid North initially, then feed in a correction for Earth Rate. Real Drift will be small with a good gyro, and Transport Wander will be non-existent (or there may be a small amount of Residual Transport Wander to be corrected).
POLAR GRIDS
A gridded chart is invariably used in polar regions. In both the north and south polar areas the common plotting charts are:
A Polar Stereographic or a Transverse/Oblique Mercator.
On all of these charts the 360° of longitude on the earth are represented by 360° on the chart.
This property makes these charts ideally suited for the use of a standard polar grid which can be printed on the charts for all users.
Figure 29.16 Standard North Polar GridFigure 31.16. Standard North Polar Grid.

506
Chapter 29 Gridded Charts
The use of a standard grid eliminates any confusion over the alignment of those few VOR/TACAN stations which are not aligned with Magnetic or True North but with Grid North. In the Northern regions the datum meridian used is the Greenwich meridian. At any True meridian the chart convergency will be equal to the longitude with sign reversed.
For example, at 45°W chart convergency = 45°E.
At 45°E chart convergency = 45°W.
Consider a route from A to B in Figure 29.16. The Grid Track is 0900(T)
At 45°W Track = 090°(G) - 45°E Conv = 045°(T)
At 45°E Track = 090°(G) + 45°W Conv = 135°(T)
In the Southern hemisphere the Greenwich meridian is again used as the datum meridian.
In the Southern hemisphere the chart convergency is always equal to the longitude when a standard grid is used.
To maintain the orientation with Grid north at the top then diagrams illustrating the standard south polar grid are normally drawn with the 180°E/W meridian at the bottom of the diagram.
From Figure 29.17, Grid Track A to B = constant 070°(G).
At A Long = 45°W so conv = 45°W.
070°(G) + 45°W conv = 115°(T).
At point B long = 45°E so conv = 45°E
070°(G) - 45°E conv = 025°(T).At point X track = 090°(G)Conv = 180°E/W
090°(G) +/- 180°E/W = 270°(T).
Figure 29.17 Standard South Polar GridFigure 31.17. Standard South Polar Grid.

507
Chapter 29Gridded Charts
GRID / TRUE CONVERSION PROBLEMS
Northern Hemisphere
Figure 31.19 South Polar Stereographic ProjectionFigure 29.18 North Polar Stereographic Projection
Figure 29.18 represents a North Polar Stereographic Projection. Therefore the ‘n’ factor (the relationship between the inclination of the meridians and the change of longitude) is 1.00.
Aircraft No 1. Consider Aircraft No 1. Just by inspection of the diagram, you can see its Grid heading is 360°(G) whilst the True heading is 270°(T). Therefore the True heading is 90 degrees less than the Grid by simple visual inspection.
Now work it out using Convergence. If Grid North is at the 12 o’clock position, then the Datum Meridian must be the Greenwich Meridian - we now have a Standard Grid. Aircraft 1 is at longitude 090°W, which means that the aircraft is West of the Datum. From the following diagram:
Northern Hemisphere, aircraft West of Datum, therefore Convergence East.
Convergence East, True Least
Therefore True heading should be 90 degree less than Grid - which it is. Both the Convergence formula and the diagram give the same answer.
Now try the same exercise with Aircraft Nos. 2 to 5.
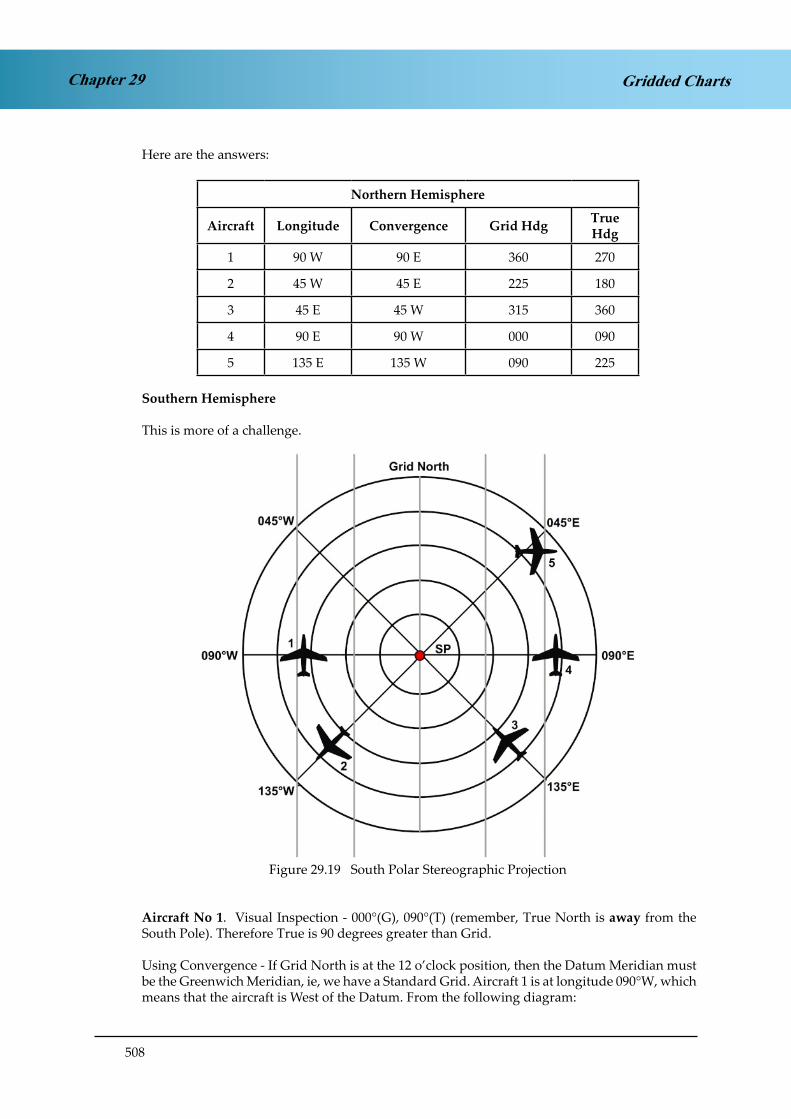
508
Chapter 29 Gridded Charts
Here are the answers:
Northern Hemisphere
Aircraft Longitude Convergence Grid Hdg True Hdg
1 90 W 90 E 360 270
2 45 W 45 E 225 180
3 45 E 45 W 315 360
4 90 E 90 W 000 090
5 135 E 135 W 090 225
Southern Hemisphere
This is more of a challenge.
Figure 31.19 South Polar Stereographic ProjectionFigure 29.19 South Polar Stereographic Projection
Aircraft No 1. Visual Inspection - 000°(G), 090°(T) (remember, True North is away from the South Pole). Therefore True is 90 degrees greater than Grid.
Using Convergence - If Grid North is at the 12 o’clock position, then the Datum Meridian must be the Greenwich Meridian, ie, we have a Standard Grid. Aircraft 1 is at longitude 090°W, which means that the aircraft is West of the Datum. From the following diagram:

509
Chapter 29Gridded Charts
Southern Hemisphere, aircraft West of Datum, therefore Convergence West.
Convergence West, True Best
Therefore True heading should be 90 degrees greater than Grid - which it is. Both the Convergence formula and the diagram give the same answer.
Now try the same exercise with Aircraft Nos 2 to 5.
Here are the answers:
Southern Hemisphere
Aircraft Longitude Convergence Grid Hdg True Hdg
1 90 W 90 W 000 090
2 135 W 135 W 225 360
3 135 E 135 E 315 180
4 90 E 90 E 360 270
5 45 E 45 E 090 045
MORE GRID / TRUE CONVERSION PROBLEMS
Polar Stereographic Charts
Example 1 Aircraft Position 45N 110W Grid Track = 132°(G) Datum = 060°W
What is True Track?
Is the aircraft East or West of the Datum Meridian? Ans: West (50 degrees West)
Is that East or West Convergence? Ans: From diagram below, Northern Hemisphere, therefore East Convergence
With a Polar Stereo Chart, ‘n’ = 1so 50 degree change of longitude = 50 degrees Convergence
Given: Convergence East, True Least, Grid Track is 132°(G).
Therefore True Track = 132°(G) - 50 degrees = 082°(T)
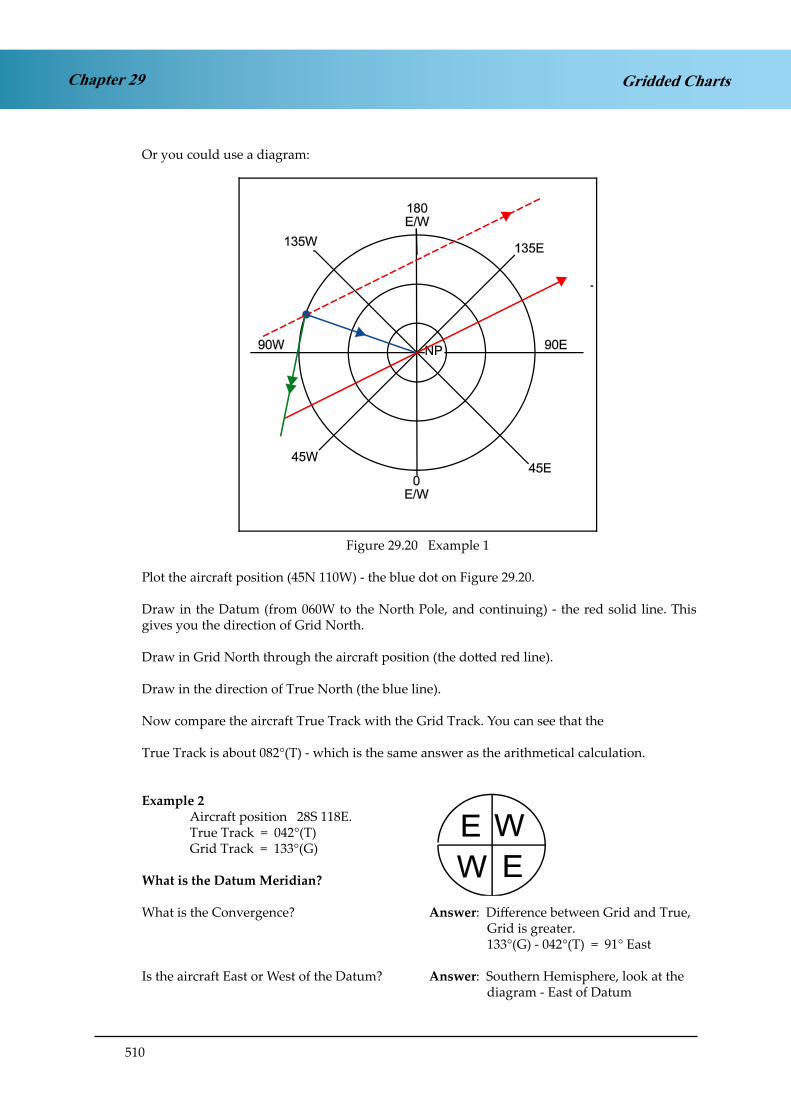
510
Chapter 29 Gridded Charts
Or you could use a diagram:
Figure 31.20. Example 1Figure 29.20 Example 1
Plot the aircraft position (45N 110W) - the blue dot on Figure 29.20.
Draw in the Datum (from 060W to the North Pole, and continuing) - the red solid line. This gives you the direction of Grid North.
Draw in Grid North through the aircraft position (the dotted red line).
Draw in the direction of True North (the blue line).
Now compare the aircraft True Track with the Grid Track. You can see that the
True Track is about 082°(T) - which is the same answer as the arithmetical calculation.
Example 2 Aircraft position 28S 118E. True Track = 042°(T) Grid Track = 133°(G)
What is the Datum Meridian?
What is the Convergence? Answer: Difference between Grid and True, Grid is greater. 133°(G) - 042°(T) = 91° East
Is the aircraft East or West of the Datum? Answer: Southern Hemisphere, look at the diagram - East of Datum

511
Chapter 29Gridded Charts
If the aircraft is 91 degrees East of the Datum and the aircraft is at 118 E, where is the Datum?Answer: 118 E - 91 degrees = 027 E longitude.
Or you could use a diagram:
Figure 31.21. Example 2Figure 29.21 Example 2
Plot the aircraft position (28S 118E) - the blue dot on Figure 29.21.
Draw in the direction of True North (the blue line).
Draw in the True Track of 042°(T) (the green line).
The Grid Track is 133°(G). This gives you the direction of the grid (the red dotted line).
Parallel the grid through the South Pole. This gives you the Datum Meridian.
(Note: These diagrams are only supposed to be sketches, to allow you to visualise the situation. They are not intended to be scale drawing solutions. But they allow you to see which way to apply the convergence, and then do a numerical calculation).

512
Chapter 29 Gridded Charts
Lambert Charts
Lambert chart problems work in much the same way. The only difference is that the ‘n’ factor is not 1.00, so in converting from change of longitude to convergence, it is necessary to multiply the ch long by the ‘n’ factor.
Example 3 Aircraft position 50S 178E
Parallel of origin is 56S, sine parallel of origin is .82 Grid Track = 192°(G) True Track = 211°(T)
What is the Datum Meridian?
What is convergence? Answer: 211°(T) - 192°(G) = 19° W
What is change of longitude? Answer: 19/.82 = 23 degrees
Which way? Answer: See the usual diagram Southern Hemisphere, Westerly Convergence, so aircraft must be West of Datum Meridian.
Aircraft meridian = 178E, therefore Datum is 23 degrees East of this = 201E, which is 159W
Here is the diagram:
Figure 31.22 Example 3Figure 29.22 Example 3
Plot the aircraft position (50S 178E) - the blue dot on Figure 29.22.
Draw in True North (the blue line).
Draw a True Track of 211°(T).
The Grid Track is 192°(G), so draw in Grid North.
Draw a parallel to get the Datum.

513
Chapter 29Gridded Charts
QUESTIONS
1. A Northern Lamberts conformal conic chart with a convergency factor of 0.75 is overprinted with a false grid - where the grid datum is the prime meridian. The grid track at 130E is 335°, will the true track be:
a. 072.5° b. 105.0° c. 205.0° d. 237.5°
2. A Northern Lamberts conformal conic chart is overprinted with a false grid. The constant of the cone of the chart is 0.80. At 60°W the grid track is 090° and the true track is 010°.
At which longitude is the false grid aligned?
a. 160W b. 140W c. 020E d. 040E
3. A Northern Lamberts conformal conic chart is overprinted with a false grid which is aligned with the 25W longitude. The constant of the cone of the chart is 0.80. If the true track at 120W is 090° will the grid track be:
a. 014° b. 166° c. 185° d. 55°
4. A North polar stereographic chart is overprinted with a false grid aligned with the prime meridian. At position 80N 135E the grid track is 235°, will the true track be?
a. 010°b. 100°c. 190°d. 280°
5. A South polar stereographic chart is overprinted with a false grid aligned with the prime meridian. At position 87S 123W the true track of an aircraft is 179° what will the grid track be?
a. 056° b. 123° c. 237° d. 302°
6. A South polar stereographic chart is overprinted with a false grid aligned with the anti-meridian of the prime meridian. At 78S 101E with a grid track of 180° the true track will be?
a. 079° b. 101° c. 259° d. 281°

514
Gridded ChartsChapter 29
7. A North polar stereographic chart is overprinted with a false grid. At 77N 37W the grid track is 175° and the true track is 093°. At which longitude is the false grid aligned?
a. 045W b. 045E c. 082E d. 119W
8. Using the data in the diagram, the false grid datum is..........................and we are in the.......................hemisphere
a. 180° E/W, Northern b. 180° E/W, Southern c. 000° E/W, Northern d. 000° E/W, Southern
9. Using a grid based on 20W what will the magnetic heading be of an aircraft at position 50N 50E, given variation is 8°W and n = 0.75. The grid heading of the aircraft is 224°
a. 162.0° b. 179.5° c. 284.5° d. 302.5°
10. An aircraft at position 40N 10E has a magnetic heading of 150° and a grid heading of 170°. Variation is 10°W and n = 0.8.Where will the datum meridian be:
a. 27°30’W b. 20°00’W c. 40°00’E d. 47°30’E
11. A Lamberts conformal conic chart is overprinted with a false grid. The constant of the cone is 0.60. At 40S 70W the grid track is 197° and the true track is 239°.At which longitude is the false grid aligned?
a. 112Wb. 028Wc. 000E/Wd. 030E
12. A Southern Lamberts conformal conic chart is overprinted with a false grid aligned with the 180°W meridian. The constant of the cone is 0.843. If the true track at 145°E is 333° what will the grid track be:
a. 002.5°b. 029.5°c. 303.5°d. 360°

515
Chapter 29Gridded Charts
13. Assume a North Polar Stereographic chart whose grid is aligned with the Greenwich meridian. An aircraft flies from the geographic north pole for a distance of 480 nm along the 1100E meridian, then follows a grid track of 1540 for a distance of 300 nm.
The aircraft’s final position will be:
85N
80N
75N
90 E
0º E/W
100 nm 200 300 400 500 nm
Annex A
a. 7845 N 087 E b. 8000 N 080 E c. 7915 N 074 E d. 7015 N 080 E

516
Gridded ChartsChapter 29
ANSWERS
1. A
2. D
3. B
4. A
5. A
6. C
7. B
8. D
9. C
10. D
11. C
12. C
13. B

517
Chapter 30Plotting
CHAPTER THIRTY
PLOTTING
Contents
INTRODUCTION . . . . . . . . . . . . . . . . . . . . . . . . . . . . . . . . . . . . . . .519
EQUIPMENT . . . . . . . . . . . . . . . . . . . . . . . . . . . . . . . . . . . . . . . . . .519
DEFINITIONS, ABBREVIATIONS, SYMBOLS . . . . . . . . . . . . . . . . . . . . . . .519
SYMBOLS . . . . . . . . . . . . . . . . . . . . . . . . . . . . . . . . . . . . . . . . . . . .520
FIXING POSITION . . . . . . . . . . . . . . . . . . . . . . . . . . . . . . . . . . . . . . .521
BEARINGS MEASURED BY A GROUND STATION . . . . . . . . . . . . . . . . . . .521
BEARINGS MEASURED BY AN AIRCRAFT . . . . . . . . . . . . . . . . . . . . . . . .522
ADF or AIRBORNE WEATHER RADAR (AWR) . . . . . . . . . . . . . . . . . . . . . .522
CONVERTING A RELATIVE BEARING INTO A TRUE BEARING . . . . . . . . . . .524
DISTANCE MEASURING EQUIPMENT (DME) . . . . . . . . . . . . . . . . . . . . . .524
THE ‘COCKED HAT’ . . . . . . . . . . . . . . . . . . . . . . . . . . . . . . . . . . . . .525
CLIMB AND DESCENT . . . . . . . . . . . . . . . . . . . . . . . . . . . . . . . . . . . .525
LAMBERT AND POLAR STEREO CHARTS - EFFECTS OF CONVERGENCE . . . .526
PLOTTING ON A LAMBERT CHART . . . . . . . . . . . . . . . . . . . . . . . . . . .527
QUESTIONS . . . . . . . . . . . . . . . . . . . . . . . . . . . . . . . . . . . . . . . . . .529
ANSWERS . . . . . . . . . . . . . . . . . . . . . . . . . . . . . . . . . . . . . . . . . . .532

518
Chapter 30 Plotting

519
Chapter 30Plotting
INTRODUCTION
So far in your studies you have become aware of two methods of navigation. One is solo-pilot VFR navigation based on the 1 in 60 rule. The other is the use of automatic computing systems such as INS, IRS, FMS, GPS, and RNAV. However, there is a whole group of aircraft which are more sophisticated than light training aircraft but less sophisticated than the full jet airliner glass cockpit standard. These aircraft are routinely fitted with VOR, DME, ADF and Slaved Gyro Compasses.
For this sort of intermediate complexity aircraft, it becomes necessary to plot on a Radio Navigation chart or a specialist plotting chart, usually a Mercator’s chart or a Lambert’s Conical Orthomorphic chart. The JAA requirement is for the use of the Lambert’s Conical Orthomorphic and occasionally the Polar Stereographic. Techniques for these charts, but not Mercator’s, are given in these notes.
The charts used for most of the question settings are the Jeppesen E(LO)1 and 1a. Any charts used in the exam will be supplied as an Annex to the question paper. However, the UK CAA accepts that the quality of reproduction of the photocopied annexes is not always good and permits students sitting the UK exams to bring their own copy of the E(LO)1 and 1a in with them. Note, though, that you can bring in only these 2 charts - not the whole Jeppesen Manual.
If plotting is required on any other charts, appropriate Annexes will be attached. These are usually skeleton charts or small-scale Jeppesen charts without too much detail and the photocopied quality is acceptable.
EQUIPMENT
The following items of equipment are required for this section of the course:-
A navigational computer A navigational straight-edge Plotting protractor (square type) Dividers 2H and HB pencils for plotting and writing, and a soft eraser
DEFINITIONS, ABBREVIATIONS, SYMBOLS
True or Magnetic?Plotting is normally carried out using True North as the datum. It is possible to plot some types of radio bearing directly in magnetic without converting to True, but usually True tracks and bearings are used.
HeadingThe direction in which the nose of the aircraft is pointing measured in degrees (000-360) clockwise from the True, Magnetic, or Compass North, abbreviations being Hdg(T), Hdg(M), Hdg(C).
If Hdg(M) is given, it must be converted to True by taking into account the variation on the chart.
If Hdg(C) is given, it must be converted to True by taking into account variation and deviation.

520
Chapter 30 Plotting
Fix. The ground position of the aircraft obtained from two or three visual or radio position lines, or by radar.
Position Line. A line somewhere along which the aircraft is known to be a particular time.
QTE. The true bearing of the aircraft from a DF station.
QDM. The track (Magnetic) from the aircraft to the DF station.
QDR. The bearing (Magnetic) of the aircraft from the DF station.
VOR Radial. Sometimes referred to as VOR QDR. The magnetic bearing of the aircraft from a VOR beacon.
VOR QDM. The magnetic track from the aircraft to a VOR beacon.
Isogonal. A line on the chart joining places of equal magnetic variation.
Convergency. The angle between two selected meridians at a given latitude or latitudes.
SYMBOLS
The standard symbols used in plotting are shown below, with their meanings. You will find it a great help to your plotting if you always use these symbols and always record the appropriate time of each occurrence.
Position line at 1115 GNT. Plotted as a True Bearing
Two position line fix at 1121 GMT
Radar fix at 1510 GMT
DF station, VOR, NDB or VDF facility
The simplest form of plot is obtained by plotting the positions of two fixes. Provided that the aircraft has been flying a single heading during the interval between the fixes, a straight line joining them represents the track.
Figure 32.1 Track Made GoodFigure 30.1 Track Made Good
A track of this sort determined between two fixes between which one heading only has been flown is called a Track Made Good (TMG).
521
Chapter 30Plotting
This track made good is easily measured on the chart in the usual way. The distance measured along the TMG gives a method of calculating the actual ground speed. In Figure 30.1, since the distance flown in 30 minutes is 100 nm the actual ground speed must be 200 kt.
FIXING POSITION
If an aircraft is to be navigated safely from one position to another it is necessary to make frequent checks on its ground position, and to make any correction necessary.
A ‘fix’ is a position defined from radio aids whilst a ‘pinpoint’ is a position found by map- reading.
Some fixes give a position directly (for instance a GPS fix or a fix from an ATC ground radar) whilst other are made from a combination of position lines. A position line is a line, somewhere along which an aircraft is known to be at a particular time.
Examples of position lines which are obtainable visually are long straight stretches of railways, roads, rivers or coastlines. The position and direction of line can then be transferred to the plotting chart.
Position lines can be visual, radio or radar. These can be plotted on charts and represent lines, somewhere along which the aircraft is known to be at the time the position line was obtained. Any two position lines obtained at the same time will give a fix, for, as the aircraft is known to be somewhere along each, it must be at the point where they cut each other.
The plotting of visual position lines is quite straightforward. They are simply drawn in on the plotting chart in the same position and direction as on the topographical map. The plotting of radio position lines is not quite so straightforward and needs further explanation.
BEARINGS MEASURED BY A GROUND STATION
It must be remembered that radio waves follow great circle paths and that all directions measured are great circle bearings.
Bearings measured by ground stations are referred to by groups of code letters beginning with the letter Q. These are taken from the old ‘Q code’, most of which is now obsolete.
QTE The true bearing of an aircraft from a ground station.QDM The magnetic track from an aircraft to a ground station.QDR The magnetic track from a ground station to an aircraft. (QDR is the reciprocal of QDM).
QTEs are obtainable by an aircraft when a ground station measures the direction in °(T) from which a radio signal sent out by the aircraft, approaches it. The direction so measured is passed to the aircraft by RT.
QDMs and QDRs are obtained in two ways:-
VDF An aircraft sends out a radio signal and a ground station measures a QTE. The ground station converts the QTE into a QDR by applying Variation at the ground station where the measuring is done. Then by adding or subtracting 180° to change it into the form of a direction from the aircraft to the ground station, a QDM is obtained.

522
Chapter 30 Plotting
True bearing of aircraft measured by ground station (QTE) 140°(T)Variation of ground station 10°WMagnetic bearing of aircraft from ground station (QDR) 150°(M)Add 180°Magnetic bearing of ground station from aircraft (QDM) 330°(M)
VOR A QDM or QDR, depending on which is selected by the operator in the aircraft, is displayed on an indicator in the aircraft.
With VDF, it is obvious that the measuring done at the ground station.However, with VOR, the bearing received by the aircraft is also determined at the ground station. Since the bearings are measured at the ground station, the variation of the ground station is used to convert them to Magnetic direction. After all, the ground station does not know the local variation of the aircraft interrogating it. Therefore GROUND STATION variation is used.
Plotting of VOR BearingsQDMs and QDRs are magnetic bearings. If the chart has a Magnetic North arrow, they can be plotted from the magnetic datum. Otherwise, variation must be applied and they must be plotted as QTEs (true bearing of aircraft from ground station).
Plotting QDMs and QDRsWith QDMs, apply the reciprocal to convert the QDM to a radial. There now 3 ways to plot it.
You could align the protractor with the Magnetic North arrow, if there is one. The problem is that these tend to be very short (usually about 1½ centimetres) and it is difficult to align the protractor accurately.
A better method is to find the variation from the isogonals, then use your protractor to plot the variation at the VOR using the nearest meridian as True North. You now have a Magnetic North arrow, but a much more accurate one. You can now plot the magnetic radial directly without needing to arithmetically apply variation.
However, if the VOR is on an airway, or better still, is used to define several airways, then the airway centrelines will be defined by printed radials on the chart. Take, for instance, Shannon (SHA 5243.3N 00853.1W) on the E(LO)1 chart. There are radials of 052 M, 071 M, 080 M, 115 M, and 173 M. Put the centre of your protractor over the VOR symbol and then turn it until the 052 on its scale goes through the 052 radial, the 071 goes through the 071 radial, and so on. You have now aligned the protractor with the same Magnetic North that Jeppesen have used and you can now plot a magnetic radial directly.
Alternatively, you can convert the magnetic radial to a True bearing by applying variation arithmetically and then plot by reference to the nearest meridian.
BEARINGS MEASURED BY AN AIRCRAFT
ADF or AIRBORNE WEATHER RADAR (AWR)
There are 2 sources of bearings measured at the aircraft. One is ADF and the other is Airborne Weather Radar (AWR). ADF is the more common and familiar method, but it is possible to use AWR in the MAP mode. In this case the normal pencil beam becomes a cosecant2 beam which gives a better performance as a map-painting radar and ranges and bearings can be obtained from suitable ground returns, particularly headlands and islands.

523
Chapter 30Plotting
Since the bearings are measured relative to the fore-and-aft axis of the aircraft, it is necessary to convert them into Magnetic or True directions by use of the aircraft’s compass. The compass is affected by the local variation at the aircraft. Therefore AIRCRAFT variation is used.
ADF. The measurement of the bearing of the ground transmitter from the aircraft is determined by the aircraft. The bearing measured by the aircraft equipment is normally shown as either a relative bearing or a magnetic bearing.
Figure 32.2. True and Relative Bearings.
Figure 30.2 True and Relative Bearings
Relative BearingThis is a bearing measured not from the direction of true or magnetic north, but from the direction in which the aircraft is pointing. For example, if an aircraft is heading in the direction of 030°(T) and there is a NDB due east of the aircraft, the bearing of the NDB from the aircraft is 060° (relative). This bearing would appear on a relative bearing indication (RBI) in the aircraft.
It can be seen from Figure 30.2 that adding together the relative bearing and the true heading will give the true bearing.
Magnetic BearingThis is a bearing measured from the direction of magnetic north, and such a bearing would appear on a radio magnetic indicator (RMI) in the aircraft. To change this into a true bearing, all that is necessary is the application of variation at the aircraft’s position, where the measuring is being done.
AWRAn AWR bearing is a relative bearing from the aircraft. This is combined with True Heading of the aircraft to give a True Bearing TO the response, as above. This is then reciprocated to give the True Bearing to plot FROM the response.

524
Chapter 30 Plotting
CONVERTING A RELATIVE BEARING INTO A TRUE BEARING
AWR bearings are always in the form of relative bearings. ADF bearings will also be relative if the presentation is on an RBI. It is necessary to convert these into True Bearings which can then be plotted from the radar response or the NDB, as appropriate.
Apply AIRCRAFT variation to the Magnetic Heading to get True Heading.
Add Relative Bearing to True Heading in order to get True Bearing TO the NDB / radar response. If the answer comes to more than 360°(T), subtract 360.
Take the reciprocal in order to get the True Bearing to plot FROM the NDB / radar response.
ExampleRBI reading 207Aircraft heading 315°(M)NDB variation 7WAircraft variation 9WWhat is the True Bearing to plot from the NDB?
Mag Heading 315°(M)Aircraft Variation 9WTrue Heading 306°(T)Relative Bearing 207RTrue Bearing 513°(T) (TO the NDB) - 360True Bearing 153°(T) (TO the NDB)
Take the Reciprocal 333°(T) (FROM the NDB)
DISTANCE MEASURING EQUIPMENT (DME)
DME indicates slant range from the ground DME facility to the aircraft. Strictly, this should be converted to plan range before plotting but, unless the height is given in the question, it is not possible to do so. If the range is more than about 10nm the difference is insignificant unless the aircraft is at high altitude.
Often the question will simply require you to combine a VOR bearing with a DME range to arrive at a fix, and this is straightforward. However, sometimes the question is to derive position from 2 DME ranges. This creates a problem of ambiguity, because there will be 2 positions where the ranges intersect.
In a real situation you would probably be able to work out which was the correct intersection from a knowledge of your approximate position.

525
Chapter 30Plotting
However, the exam question will normally tell you your heading and whether the ranges are increasing or decreasing.
If you are told that the aircraft is heading 270°(T) and the ranges are decreasing then you must be in position B, because if you were at A, the ranges would be increasing.
THE ‘COCKED HAT’
The intersection of three position lines usually forms a triangle - called a ‘cocked hat’ - and the fix is then taken to be at the point where the bisectors of the angles of the triangle would meet. This is shown in Figure 30.3.
The size of the cocked hat is an indication of the probable accuracy of your fix.
CLIMB AND DESCENT
Figure 32.3. The Cocked Hat.Figure 30.3 The Cocked Hat
Climb and descent are not really plotting problems, but it is convenient to group them together. They can come as 2 types of question, but they are essentially the same problem - to make the time taken in a vertical direction in the climb or descent the same as the time taken in the horizontal direction. The vertical distance divided by the rate of climb / descent must be the same as the horizontal distance divided by the groundspeed.
Example 1At 65 nm from a VOR you commence a descent from FL330 in order to arrive over the VOR at FL 100. Your mean groundspeed in the descent is 240 knots. What rate of descent is required?
a 1420 feet/min b 1630 feet/min c 1270 feet/min d 1830 feet/min
Answer: 65 nm @ 240 knots will take 16.25 minutes. You need to lose 23000 feet, also in 16.25 minutes. The required ROD is 23000/16.25 = 1415 feet per minute.
Answer (a)
AB

526
Chapter 30 Plotting
Example 2You are homing to overhead a VORTAC and will descend from 7500 QNH to be 1000 AMSL by 6 nm DME. Your groundspeed is 156 knots and the ROD will be 800 feet/min. At what range from the VORTAC do you commence the descent?
a 27.1 nm b 15.8 nm c 11.7 nm d 30.2 nm
Answer: You need to lose 6500 feet @ 800 fpm ROD. 6500/800 = 8.125 minutes in the descent.156 knots for 8.125 minutes will cover 21.1 nm. You need to be down at 1000 feet 6 nm before the DME, so range to start the descent is 27.1 nm.
Answer (a)
LAMBERT AND POLAR STEREO CHARTS - EFFECTS OF CONVERGENCE
For all practical purposes, a straight line on a Lambert Conical Orthomorphic (conformal) chart or a Polar Stereographic chart at high latitudes can be considered to be a great circle. However, the type of plotting with which the student is concerned deals with aircraft which fly rhumb line tracks.
Measuring TracksIf an aircraft is to fly from A to B, the two positions are joined by a straight line (great circle) and its direction is measured as the mid-meridian to give the rhumb line track on the 1:1,000,000 scale chart.
Plotting Headings and TracksIf a known heading or track has to be plotted, this is done using the nearest meridian to the position from which it has to be drawn. Any subsequent error is ignored.
Measuring DistancesIf, on a particular chart, scale cannot be considered constant, distances must be measured using the latitude scale locally.
Plotting PositionsThis takes a little longer than on a Mercator chart, because the Lambert graticule is not rectangular. The procedure is as follows:-
Mark the longitude of the position to be plotted in the longitude scale to the North and also on the one to the South of the position.
Lay a straight edge between the two points.
Using a pair of dividers, plot the latitude along the length of the straight edge, upwards or downwards from the nearest parallel of latitude.
Plotting of ADF BearingsIf the ch. long is 2° or more, draw a line parallel to the aircraft’s meridian through the NDB and plot as shown in Figure 30.4. If ch. long is less than 2°, plot from the meridian of NDB. This is explained in more detail in the next paragraph.

527
Chapter 30Plotting
PLOTTING ON A LAMBERT CHART
Plotting bearings on a Lambert chart is less complicated than on a Mercator because Great Circles (radio waves) are straight or near-straight lines, and so there is no conversion angle to apply. However, there may be a correction for chart convergence to apply. It depends on whether the bearing is measured at the ground station or at the aircraft.
The bearing measurement process for VDF (QDMs and QTEs) and for VOR takes place at the ground station. It may appear with VOR that the bearing is displayed in the aircraft and has been decoded in the aircraft, but it has not been measured in the aircraft. The different between the VOR reference phase and the bearing phase is encoded at the moment of transmission on that particular bearing at the ground station. All that the aircraft VOR receiver does is de-modulate the encoded signal and display it. It does not actually measure a bearing, unlike ADF.
For bearings measured at the ground station (VDF or VOR), the plotting process is simple. You simply correct for variation at the point where it has been added (the ground station), and plot the true bearing from the ground station. This will be the correct Great Circle track at the ground station. The straight-line bearing will change direction with respect to north as it crosses meridians and encounters convergence and therefore will not be the same Great Circle track direction at the aircraft, but it is not being plotted from the aircraft, so this does not matter. It is the correct radio wave path.
For bearings measured at the aircraft (ADF / NDB and AWR (airborne weather radar)), the situation is complicated because there is convergence between the meridian where the bearing is measured (the aircraft) and from where it will be plotted (the NDB). Consider the situation at Fig 30.4. An aircraft measures a bearing of an NDB of 245°(R) while on a heading of 025°(T). It is required to plot the position line on a Lambert chart.
Adding together the relative bearing of 245° and the true heading of 025° gives the true great circle bearing of the NDB from the aircraft, 270°.
But if the reciprocal, 090°, is plotted from the meridian of the NDB the position line will not pass through the aircraft position, as the meridian through the aircraft is not parallel to that through the NDB. See Fig 30.4 (a).
Figure 32.4. Plotting an ADF Bearing.Figure 30.4 Plotting an ADF Bearing

528
Chapter 30 Plotting
If, however, the angle of 090° is measured from a line parallel to the aircraft’s meridian drawn through the NDB, the position line will pass through the aircraft as shown in Figure 30.4(b).
Chart convergence has been automatically allowed for by drawing a line parallel to the aircraft’s meridian through the NDB. This method is always used in plotting.
If it is necessary to obtain the bearing to plot from the meridian of the NDB, reference to Figure 30.4(b) will show that in this case it is equal to 090° minus chart convergence.
ExampleAn aircraft flying on a heading of 330°(T) measures a bearing of 090°(R) of an NDB.What is the bearing to plot on a Lambert chart: -
a. from a line parallel to the aircraft’s meridian drawn through the NDB.b. from the meridian of the NDB. Chart convergence is 3°.
Solution
a. 330° + 090(R) = 060°(T) (True great circle bearing of NDB from aircraft) Plot 240° from a line parallel to the aircraft’s meridian drawn through the NDB. See Figure 30.5(a).
b. Bearing to plot from meridian of NDB = 240° + 3° = 243°
Figure 32.5. Plotting an ADF Bearing.Figure 30.5 Plotting an ADF Bearing
In practice, we would not normally use method (b), plotting from the True meridian. For practical plotting, we draw in a parallel false meridian, as in method (a).
Note: In the case of bearings measured at the aircraft, it is the aircraft’s compass which is used to add to relative bearing in order to obtain true bearing. Therefore, if the heading is magnetic and it is necessary to correct it to True, we always use variation at the aircraft.
Bearings measured at ground station (VOR, VDF) - variation at ground station
Bearings measured at aircraft (NDB/ADF, AWR) - variation at aircraft

529
Chapter 30Plotting
QUESTIONS
1. What is the average magnetic course and distance between 6000N 02000W and Sumburgh VOR? (in the exam they gave an attached chart as an Annex - for revision practice use your Jeppesen Manual chart AT(H/L)1 or 5 AT(HI))
Course Distance a 095 562 b 095 468 c 105 562 d 105 468
2. What is the average true track and distance between WTD NDB (5211.3N 00705.0W) and FOY NDB (5234.0N 00911.7W) - use your Jeppesen E(LO)1
Track Distancea 294 76 b 286 76 c 294 81 d 286 81
3. You are on a heading of 105°(C), deviation 3°E. WTD NDB (5211.3N 00705.0W) bears013°R, CRK VOR (5150.4N 00829.7W) QDM is 211°. What is your position?(Use Jeppesen E(LO)1)
a 5245N 00757W b 5228N 00802W c 5412N 00639W d 5217N 00745W
4. The airport at 5211N 00932W is: (use Jeppesen E (LO) 1)
a Kerry b Cork c Shannond Waterford
5. Reference Jeppesen E(LO)1, position 5211N 00931W, which of the following denotes all the symbols?
a military airport, ILS, NDBb civil airport, VOR, ILSc military airport, VOR, ILSd civil airport, ILS, NDB
6. What is the aircraft position in lat and long given the following (use Jeppesen chart E(LO)1):
CRN (5318N 00857W) 18 DME SHA (5243N 00853W) 20 DME Heading 270°MBoth ranges DME decreasing
a 5201N 00908W b 5301N 00908Wc 5302N 00843W d 5203N 00843W

530
PlottingChapter 30
Chart For Questions 11 - 15.
531
Chapter 30Plotting
7. What is at 5211N 00932W? - (use E(LO)1)
a Kerry VORb Cork Airportc Waterford NDBd Kerry Airport
8. What is the mean true track and distance from the BAL VOR (5318N 00627W) to CFN NDB(5502N 00820W)? - (use E(LO)1)
a 328° 125 nmb 148° 125 nmc 328° 134 nm
d 148° 134nm
9. You are at position 5340N 00800W. What is the QDR from the SHA VOR (5243N 00853W)?- (use E(LO)1)
a 217 b 037 c 209 d 029
10. Your radial from the SHA VOR (5243N 00853W) is 120°(M). From the CRK VOR (5151N00830W), the radial is 033°(M). What is your position? - (use E(LO)1)
a 5320N 00800W b 5240N 00821W c 5220N 00821W d 5230N 00800W
For the following questions use the chart opposite.
11. QTE ‘H’ 326°(T)QTE ‘G’ 101°(T)Give the latitude and longitude of where the 2 position lines cross.
12. QTE ‘G’ 140°(T) QTE ‘H’ 270°(T)Give the latitude and longitude of where the 2 position lines cross.
13. DME ‘L’ 150 NMDME ‘M’ 150 NMGive the latitude and longitude of where the 2 position lines cross.
14. VOR ‘I’ QDR 339°(M)
DME ‘I’ 120 NMGive the latitude and longitude of where the 2 position lines cross.Don’t forget to apply variation to the VOR.
15. Your DR position is 64N 004W.RMI QDM NDB ‘J’ (in Norway) 120°(M) (Meridian Transfer)QTE ‘H’ 042°(T)Give the latitude and longitude of where the 2 position lines cross.

532
PlottingChapter 30
ANSWERS
1. C Questions 11 to 15
2. D
3. B
4. A
5. D
6. C
7. D
8. A
9. B
10. D

533
Chapter 31The Direct Indicating Compass
CHAPTER THIRTY ONE
THE DIRECT INDICATING COMPASS
Contents
THE MAGNETIC COMPASS . . . . . . . . . . . . . . . . . . . . . . . . . . . . . . . . .535
DIRECT INDICATING MAGNETIC COMPASS . . . . . . . . . . . . . . . . . . . . . .535
THE VERTICAL CARD COMPASS . . . . . . . . . . . . . . . . . . . . . . . . . . . . .536
THE GRID RING COMPASS . . . . . . . . . . . . . . . . . . . . . . . . . . . . . . . . .536
COMPASS REQUIREMENTS . . . . . . . . . . . . . . . . . . . . . . . . . . . . . . . . .537
HORIZONTALITY . . . . . . . . . . . . . . . . . . . . . . . . . . . . . . . . . . . . . . .537
SENSITIVITY . . . . . . . . . . . . . . . . . . . . . . . . . . . . . . . . . . . . . . . . . .538
APERIODICITY . . . . . . . . . . . . . . . . . . . . . . . . . . . . . . . . . . . . . . . .538
THE COMPASS LIQUID . . . . . . . . . . . . . . . . . . . . . . . . . . . . . . . . . . .538
SERVICEABILITY CHECKS . . . . . . . . . . . . . . . . . . . . . . . . . . . . . . . . .539
DAMPING AND PIVOT FRICTION TESTS . . . . . . . . . . . . . . . . . . . . . . . .539
DEVIATION . . . . . . . . . . . . . . . . . . . . . . . . . . . . . . . . . . . . . . . . . .540
ACCELERATION AND TURNING ERRORS . . . . . . . . . . . . . . . . . . . . . . . .540
ERRORS CAUSED BY LINEAR ACCELERATION. . . . . . . . . . . . . . . . . . . . .541
SUMMARY OF ACCELERATION ERRORS . . . . . . . . . . . . . . . . . . . . . . . .544
TURNING ERRORS . . . . . . . . . . . . . . . . . . . . . . . . . . . . . . . . . . . . . .544
TURNING ERRORS - LIQUID SWIRL. . . . . . . . . . . . . . . . . . . . . . . . . . . .548
SUMMARY OF TURNING ERRORS. . . . . . . . . . . . . . . . . . . . . . . . . . . . .548
QUESTIONS . . . . . . . . . . . . . . . . . . . . . . . . . . . . . . . . . . . . . . . . . .550
ANSWERS . . . . . . . . . . . . . . . . . . . . . . . . . . . . . . . . . . . . . . . . . . .552

534
Chapter 31 The Direct Indicating Compass

535
Chapter 31The Direct Indicating Compass
THE MAGNETIC COMPASS
A compass is an instrument designed to indicate direction on the surface of the earth, relative to some known datum. The magnetic compass uses the horizontal component of the earth’s field as its directional datum. Unfortunately, the earth’s field is normally not aligned with the true meridian - the most desirable datum from which to measure direction. The angular difference between true and magnetic meridians is called the magnetic variation discussed in the previous chapter.
The purpose of a magnetic ‘steering’ compass in an aircraft is to indicate heading, the direction in which the aircraft is pointing.
Magnetic influences - iron/steel components, electric currents - distort the earth’s field so that the compass magnet assembly deviates from the magnetic meridian. This is called compass deviation.
The rules for applying variation and deviation to the compass heading indication in order to determine true heading are detailed in the Navigation notes.
DIRECT INDICATING MAGNETIC COMPASS
This chapter deals with the direct indicating or direct reading magnetic compass, where the pilot directly reads his heading in relation to the pivoted magnet assembly.
There are two basic types of direct reading magnetic compasses used in aircraft, the vertical card and, less commonly, the grid ring compass.
Figure 33.1. A Vertical Card Compass.Figure 31.1 A Vertical Card Compass

536
Chapter 31 The Direct Indicating Compass
THE VERTICAL CARD COMPASS
The vertical card compass - which is also known as the B-type or E-type - is the direct reading compass in general use. It is usually the main magnetic heading reference in light aircraft and the standby compass in larger aircraft.It consists of a circular compass card attached directly to the magnet assembly. This combined unit is suspended in liquid within the compass bowl. A vertical lubber line on the glass window of the bowl, enables the heading to be read off the compass card.
THE GRID RING COMPASS
The P-type compass or grid ring compass is found on older aircraft. It is more accurate than the vertical card compass and is more stable.
It is however heavier, bulkier and more expensive. In addition it can only be read in straight and level flight, as the grid ring has to be unclamped and aligned with the north reference before a reading can be taken against the lubber line.
The grid ring compass also differs from the vertical card compass in that it achieves a greater periodicity by the addition of damping wires which also rotate through the compass liquid.
Figure 33.2. A Grid Ring Compass.Figure 31.2 A Grid Ring Compass

537
Chapter 31The Direct Indicating Compass
COMPASS REQUIREMENTS
The direct reading magnetic compass contains a pivoted magnet which must be able to align itself, and remain aligned, with the horizontal component of the earth’s magnetic field. For the compass to succeed, certain requirements must be satisfied. The most important of these are that the magnet system must be:
Horizontal Sensitive Aperiodic
HORIZONTALITY
In order to measure direction in the horizontal, the magnets must lie as nearly as possible in the horizontal plane during normal straight and level flight. A freely suspended magnet assembly would align itself with the earth’s total field so the magnets would only be horizontal at the magnetic equator.
To achieve horizontality, the magnet assembly is ‘ pendulously suspended’, the centre of gravity of this assembly being lower than its supporting pivot, as shown in Figure 31.3.
Figure 33.3. Equilibrium (Northern Hemisphere) ViewedFrom West.
Figure 31.3 Equilibrium (Northern Hemisphere) Viewed From West
In this way, the tilting effect caused by the vertical component Z of the earth’s field is opposed by the weight of the magnet assembly, this equilibrium being achieved at the cost of only a very slight residual tilt of the magnets (North-seeking ends down) - by about 2° in mid-latitudes - in the Northern hemisphere. (South-seeking end down in the Southern hemisphere). Figure 31.3. shows the two turning couples involved.
One is produced by Z which exerts a downward force on the red (North-seeking) end of the compass magnet and an upward force on the blue end.
The other couple is produced by the weight W acting downwards through the centre of gravity (displaced because of the tilt) and the reaction R acting upwards through the pivot.
For equilibrium, the magnet takes up the amount of tilt necessary to make the couples balance. (A third - very weak - couple produced by the horizontal component, H, of the earth’s field, opposing the tilt has been omitted for simplicity).

538
Chapter 31 The Direct Indicating Compass
SENSITIVITY
The magnet system is required to seek the horizontal component H of the earth’s field in all areas except near the magnetic poles - where the horizontal component is inadequate.
The notes on magnetism show that the ability of a pivoted magnet to align itself with an external field - its sensitivity - depends on the strength of the external field and on the magnetic moment of the magnet. The weak external field (H) at a place cannot be changed, but the magnetic moment of the magnet can be increased - by increasing the magnet’s length and/or pole strength.
It is however undesirable to increase the magnet length (see Paragraph 9.8) so the pole strength is increased by using two, four or six short magnets or a circular magnet, made of an alloy which will accept and retain the high degree of magnetism required.
Sensitivity is further increased by reducing friction. This is achieved in three ways:
By using an iridium-tipped pivot in a jewelled cup
By lubricating the pivot with the liquid which fills the compass bowl.
By reducing the effective weight of the magnet assembly acting down through the pivot, because the liquid that the magnet assembly is displacing is denser than air .
APERIODICITY
The magnetic assembly is required to be aperiodic or ‘dead beat’, which means that it should settle down quickly on a steady indication after being displaced by turbulence or manoeuvres.
Any tendency to oscillate must be quickly ‘damped out’. The desired aperiodicity is achieved as follows:
Several short magnets are used instead of one longer one. This keeps the mass of the assembly near the centre, so reducing the moment of inertia and consequently making any oscillations easier to damp out. Light alloy is utilised wherever possible in order to minimise the weight of the assembly framework.
The primary purpose of the liquid in the compass bowl is to act as a damping liquid on the compass assembly. The grid ring compass dampens oscillations more rapidly than the vertical card compass, due to addition of damping wires. These wires are attached to the magnet assembly and also pass through the damping liquid. (See Figure 31.2.)
THE COMPASS LIQUID
The liquid mentioned earlier is essential to the design of the compass. Two difficulties may arise. Firstly, the liquid is likely to expand or contract with change of temperature; this is overcome by incorporating an expansion chamber or ‘Sylphon tube’.Secondly, errors occur in sustained turns as a result of ‘liquid swirl’. Liquid swirl occurs due to the viscosity of the liquid, because of this the liquid chosen should have a low viscosity to minimise liquid swirl. Liquid swirl is discussed further in Paragraph 9.17.
Various liquids, including alcohol have been used. The main properties required of a compass liquid are:

539
Chapter 31The Direct Indicating Compass
Low coefficient of expansion Low viscosity Transparency Low freezing point High boiling point Non-corrosiveness
SERVICEABILITY CHECKS
Compass body. Check that there is no obvious damage such as dents or cracks. Any lighting system should be checked, as should the efficacy of the luminous paint.
Compass Liquid. The compass liquid should be checked and be free from:
Sediment and discolouration - either of which would indicate corrosion which would result in increased pivot friction.
Bubbles - which would probably indicate a leaking seal. Turbulence and manoeuvres would cause any bubbles to move about, creating eddies which could disturb the mag-net system.
Accuracy Limit - JAR: ± 10°
DAMPING AND PIVOT FRICTION TESTS
These tests are carried out before a compass is installed or swung, and whenever the accuracy of the instrument is suspect. The exact values quoted in the tests vary with the type, make and mark of compass. Furthermore, the figures are for a specified standard value of the earth’s directive force H. If the tests are to be conducted at latitudes where the value of H is significantly different, there may be a need to modify these figures.
Damping Test. This is also known as a ‘swing’ test designed to check that, after displacement, the magnet assembly returns quickly and without appreciable oscillation to its North alignment.
Using a small magnet, deflect the compass by 90°, holding this deflection for at least 20 seconds to allow the liquid to come to rest. Remove the deflecting magnet; the time taken to swing back through 85° should be 2 to 3 seconds for a standby compass.
Pivot Friction Test. Using a small magnet, deflect the compass by 10° and hold it in this position for at least 10 seconds. Remove the magnet and note the reading when the compass settles. Repeat the procedure, deflecting 10° in the opposite direction, and note the reading when the compass settles again
The two readings should agree within 2½° for a standby compass. It is usual to carry out this test on four headings 90° apart.

540
Chapter 31 The Direct Indicating Compass
DEVIATION
Deviation is produced by the iron/steel components in the aircraft. It is the angle between the local magnetic meridian and the direction in which the compass magnets are lying.
Deviation is named Easterly (or plus) if the North-seeking (red) ends of the magnets point to the East of magnetic North. If the North-seeking ends points to the West of magnetic North, deviation is said to be Westerly (or minus).
Deviation varies with heading so it has to be measured on a series of different headings. This is usually done by conducting a compass swing (which is fully covered in the chapter on aircraft magnetism). Once deviation has been reduced as far as possible, the residual deviation is recorded on a compass deviation card, which is located in the aircraft.
During the swing, normal flying conditions should be simulated as far as possible, with engines running, electrical / radio services switched on, and the aircraft in a level flight attitude.
It is obviously most important that no ferromagnetic objects such as tools, or watches should be placed near the compass as this would introduce unknown amounts of deviation. Furthermore, ferromagnetic payloads should be stowed as far away from the compass as permissible within the loading limits. With exceptionally large ferromagnetic loads, a compass swing may have to be carried out before flight with the load aboard.
ACCELERATION AND TURNING ERRORS
Direct reading compasses are subject to large errors during linear acceleration or deceleration, or during a turn.
Most manoeuvres which cause the centre of gravity of the magnet assembly to move away from its normal position, almost directly below the pivot, will produce an error.
However, if the manoeuvre displaces the centre of gravity North or South of its usual position so that cg and pivot are still in the plane of the magnetic meridian, the magnet assembly merely changes its North-South tilt angle, with no rotation in azimuth and consequently no error.
Note also that turning and acceleration errors only occur where there is a significant vertical component (Z) in the earth’s field, so that except for a small liquid swirl effect in turns, the errors are non-existent near the magnetic equator.
The north seeking end of the compass magnet should remain pointing in the same direction - Magnetic north- whether the aircraft is moving in a straight line or turning.
Acceleration and turning errors occur however when the north seeking end of the magnet is displaced from Magnetic north and therefore an incorrect heading will be shown on the compass card which is attached to the magnet. Figure 31.4 shows a pendulously suspended magnet (with residual dip) in the northern hemisphere.

541
Chapter 31The Direct Indicating Compass
Figure 33.4. A Pendulously Suspended Magnet inthe Northern Hemisphere.
Figure 31.4 A Pendulously Suspended Magnet in the Northern Hemisphere
Note that the vertical line through the pivot point is now closer to the nearer (north) magnetic pole than the magnet’s centre of gravity. Consider an aircraft,(and therefore the magnet assembly) being accelerated towards the west, as shown in Figure 31.4b. The magnet is attached to the aircraft at the pivot point. However while the pivot is being accelerated the magnet’s inertia, which acts at the magnet’s centre of gravity, will try to maintain its state of uniform motion. The result will be that the magnet will rotate (in this case anticlockwise) and the incorrect heading will be shown.
ERRORS CAUSED BY LINEAR ACCELERATION
The size of the acceleration error depends on a number of factors which includes aircraft heading. Acceleration / deceleration errors are maximum on East and West (M) headings and zero on North and South (M) headings.
The error is caused by inertia acting on a magnet which has residual dip due to the effect of the vertical component Z on the magnet.
Acceleration on 270°M (NH)Figure 31.5 shows an aircraft accelerating on a magnetic heading of 270°M in the Northern hemisphere, such as occurs during take-off on runway 27. Since the magnet assembly is pendulously suspended, its inertia will cause it to swing back behind the pivot point which is offset to the north of the magnet’s centre of gravity. This displacement enables a turning couple produced by the earth’s vertical component Z to rotate the magnet assembly anticlockwise round the pivot.
The angle measured clockwise from the North-seeking end round to the aircraft’s nose increases. The compass reading will therefore increase, so indicating an apparent turn towards North. Thus, according to the compass, the aircraft is now heading, say, 280° whereas its real heading is in fact still 270°- the compass is over-reading. Figure 31.5 Acceleration on 270° M (Northern Hemisphere)
Figure 33.5. Acceleration on 270° M(Northern Hemisphere)

542
Chapter 31 The Direct Indicating Compass
Acceleration on 090°M (NH)Figure 31.6 shows an aircraft accelerating on a magnetic heading of 090°M in the Northern hemisphere. Since the magnet assembly is pendulously suspended, its inertia will cause it to swing back behind the pivot point. This displacement enables a turning couple to rotate the magnet assembly clockwise round the pivot. The angle measured clockwise from the North- seeking end round to the aircraft’s nose reduces. The compass reading will therefore decrease, so indicating an apparent turn towards North.
Thus, according to the compass, the aircraft is now heading, say, 080° whereas its real heading is in fact still 090°- the compass is under-reading.
Figure 31.6 Acceleration on 090°M (Northern Hemisphere)
Deceleration on 090°M (NH)Figure 31.7 shows an aircraft decelerating on a magnetic heading of 090°M in the Northern hemisphere.
Since the magnet assembly is pendulously suspended, its inertia will cause it to swing forwards ahead of the pivot point.
This displacement enables a turning couple to rotate the magnet assembly anti-clockwise round the pivot.
The compass reading will therefore increase, so indicating an apparent turn towards South. Thus, according to the compass, the aircraft is now heading, say, 100° whereas its real heading is in fact still 090°- the compass is over-reading.
Figure 31.7 Deceleration on 090° M (Northern Hemisphere)
Figure 33.6. Acceleration on 090°M (Northern Hemisphere)
Figure 33.7. Deceleration on 090° M(Northern Hemisphere)

543
Chapter 31The Direct Indicating Compass
Acceleration on 270°M (SH)Figure 31.8 shows an aircraft accelerating on a magnetic heading of 270°M in the Southern Hemisphere. The inertia will cause the magnet assembly to swing back behind the pivot point which is now offset to the south of the magnet’s centre of gravity. This displacement enables a turning couple to rotate the magnet assembly clockwise round the pivot.
Figure 33.8. Acceleration on 270°M(Southern Hemisphere)
Figure 31.8 Acceleration on 270°M (Southern Hemisphere)
The compass reading will therefore decrease, so indicating an apparent turn towards South. Thus, according to the compass, the aircraft is now heading, say, 260° whereas its real heading is in fact still 270°- the compass is under-reading.
Acceleration on a northerly heading (NH)Figure 31.9 shows an acceleration on a northerly heading (northern hemisphere).
The cg lags and the North-South tilt of the magnet assembly changes, but the magnets are tilting in the vertical plane of the magnetic meridian through the pivot - so no error occurs.
With deceleration on North/South headings there is again no error, only a reduced N/S tilt due to the inertial forward swing of the magnet assembly.
Figure 33.9. Acceleration on 360°M(Northern Hemisphere)
Figure 31.9 Acceleration on 360°M (Northern Hemisphere)

544
Chapter 31 The Direct Indicating Compass
SUMMARY OF ACCELERATION ERRORS
Acceleration errors are zero on N/S magnetic headings (in both hemispheres), increasing to maximum on headings 090°M and 270 ° M. Acceleration causes an apparent turn towards the nearer pole (apparent turn north in the northern hemisphere, apparent turn south in the southern hemisphere). Deceleration causes an apparent turn towards the further pole (apparent turn south in the northern hemisphere, apparent turn north in the southern hemisphere).
Whenever the magnet assembly is displaced clockwise, the readings will decrease and the compass will under read.
Whenever the magnet assembly is displaced anti-clockwise, the readings will increase and the compass will over read.
The size of a linear acceleration error depends on the:
heading magnitude of the acceleration design of the magnet system magnetic latitude (which affects the relative strengths of H and Z).
The errors are maximum near the magnetic poles, decreasing to zero at the magnetic equator.
TURNING ERRORS
Turning errors are maximum when turning through north and south, and ignoring liquid swirl zero when turning through east and west.The basic theory of turning errors is much the same as that for linear acceleration errors.
Due to the earth’s vertical component of the magnetic field, Z, the compass’s cg will be displaced from almost beneath the pivot point away from the nearer pole. In a turn, the aircraft accelerates towards the centre of the turn, and therefore an acceleration force acts through the pivot towards the centre of the turn, while the opposing centrifugal force due to inertia acts outward through the cg.
This results in the magnet assembly tending to ‘swing out’ from the turn, rotating the magnetassembly around the pivot point and producing a turning error.
Turning errors are usually more significant than acceleration errors for the following reasons:-
They are inherently of greater magnitude because greater displacement of the magnet assembly is likely in turns.
Turns occur more often and are likely to be more prolonged than linear accelerations.

545
Chapter 31The Direct Indicating Compass
Turning from 045° to 315° (NH).Consider an aircraft executing a left-hand turn in the Northern hemisphere as it passes through 000°M.
The magnet’s cg is displaced from beneath the pivot point away from the north pole due to the vertical component of the earth’s magnetic field. Because of inertia the magnet assembly will be thrown out of the turn rotating the magnet assembly anti- clockwise.
If there was no turning error the magnet would remain stationary and the aircraft rotate 90° around it - resulting in the pilot seeing 90° passing beneath the compass’s lubber line.
Figure 31.10 Turning from 045° to 315° (Northern Hemisphere)
However the aircraft is turning port and the magnet assembly rotates in the same (anti- clockwise) direction.
Although the aircraft has turned 90° around the compass, the magnet has been displaced and rotated in the same direction by a number of degrees (say 20°). The pilot will therefore only see 70° pass beneath the lubber line and the compass is termed sluggish.
Whenever the magnet rotates anticlockwise it will overread .
This means that if the pilot stops the turn at 315° indicated the actual heading will be numerically smaller such as 295°- therefore the turn must be stopped early (such as 335°) to achieve the correct heading.
This can also be described as undershooting the required heading (note ‘undershoot’ is referring to turning through a smaller angle, and should not be confused with ‘under read’ which means that the numerical heading indicated is too small).
If the pilot deliberately undershoots, rolling out when the compass reads about 325°, he should observe, when the wings are levelled, the compass ‘catch up’ and settle on 315°.

546
Chapter 31 The Direct Indicating Compass
Turning from 315° to 045° (NH).Consider an aircraft turning right through north in the Northern hemisphere as it passes through 000°M, the magnet’s cg is displaced from beneath the pivot point away from the north pole due to the vertical component of the earth’s magnetic field.
Because of inertia the magnet assembly will be thrown out of the turn rotating the magnet assembly clockwise.
Note: The aircraft and the magnet assembly are again rotating in the same direction (but that it is this time clockwise) and therefore the compass will again be sluggish.
Figure 31.11 Turning from 315° to 045° (Northern Hemisphere)
Whenever the magnet rotates clockwise it will under read . This means that if the pilot stops the turn at 045° indicated the actual heading will be numerically larger such as 065°.
Therefore the turn must be stopped early (such as 025°), or the pilot should undershoot the indication, to achieve the correct heading.
Turning from 135° to 225° (NH).Now consider an aircraft turning right as shown in Figure 31.11 through south in the northern hemisphere as it passes through 180°M, the magnet’s cg is displaced from beneath the pivot point away from the nearer pole (the north pole) due to the vertical component of the earth’s magnetic field.
Because of inertia the magnet assembly will be thrown out of the turn rotating the magnet assembly anticlockwise.
The aircraft is turning clockwise (right) but the magnet assembly is rotating anticlockwise.
Figure 31.12 Turning from 135° to 225° (Northern Hemisphere)
Therefore the aircraft and the magnet are now rotating in opposite directions. Although the aircraft has turned 90° around the compass, the magnet has been displaced and rotated in the opposite direction by a number of degrees (say 20°). The pilot will therefore see 110° pass beneath the lubber line and the compass is termed ‘lively’.

547
Chapter 31The Direct Indicating Compass
Whenever the magnet rotates anticlockwise it will over read. This means that if the pilot stops the turn at 225° indicated the actual heading will be numerically smaller, such as 205°.
Therefore the turn must be stopped late (such as 245°), or the pilot should overshoot, to achieve the correct heading.
Turning from 135° to 225° (SH).Now consider an aircraft turning right as shown in Figure 31.12 through south in the southern hemisphere as it passes through 180°M, the magnet’s cg is displaced from beneath the pivot point away from the nearer pole (the south pole). Because of inertia the magnet assembly will be thrown out of the turn rotating the magnet assembly clockwise.
The aircraft and the magnet assembly now are rotating in the same direction (clockwise) and therefore the compass will again be sluggish.
Figure 31.13 Turning from 135° to 225° (Southern Hemisphere)
Whenever the magnet rotates clockwise it will under read . This means that if the pilot stops the turn at 225° indicated the actual heading will be numerically larger such as 245°. Therefore the turn must be stopped early (such as 205°), or undershoot, to achieve the correct heading.
Remember that when the wings are levelled, the compass will ‘catch up’ and settle on 225°.
Turning through East or WestConsider a turning aircraft passing through the magnetic headings of 090° and 270°.The magnets are not horizontal but their tilt is North-South, that is in the vertical plane of the magnetic meridian through the pivot.
There is no rotational couple acting round the pivot, so there is no turning error.Turning errors are zero when passing through East or West.
Other notes on turning errors:It is easier to steer a Southerly rather than a Northerly heading, firstly because on South the compass does not indicate the wrong direction of turn as it can on North, and secondly because the ‘lively’ nature of the indications reduces the risk of over-correcting small steering errors.
Magnitude of Turning Errors:There are many factors affecting the severity of turning errors. They are worst at high latitudes where Z is strong and H is weak.
Other relevant variables include rate of turn, duration of turn, speed of the aircraft, the headings involved, and the design of the compass.
Figure 33.13. Turning from 135° to 225°(Southern Hemisphere)

548
Chapter 31 The Direct Indicating Compass
TURNING ERRORS - LIQUID SWIRL
The effect known as liquid swirl was mentioned earlier. During a turn, the liquid in contact with the inside of the bowl tends to be dragged around with the bowl, so producing in the liquid small eddies which drift inwards from the circumference and deflect the magnet assembly in the direction of turn. Therefore the liquid tends to swirl - and rotate the magnet assembly with it - in the same direction as the aircraft’s turn.
Accordingly, when turning through north in the Northern hemisphere it will increase the magnitude of the turning error (in which the assembly turns in the same direction as the aircraft).
The size of the turning error when turning through south in the northern hemisphere (where the assembly turns in the opposite direction to the aircraft) will be reduced.
In the Southern hemisphere the swirl effect will be in the opposite sense.
Note: At the magnetic equator where there is no vertical component Z in the earth’s field, liquid swirl is the sole source of turning error; with most compasses the effect is only slight.
SUMMARY OF TURNING ERRORS
These are maximum when passing through magnetic North or South, decreasing to zero when passing through East or West.
The error increases with increase in magnetic latitude.At the magnetic equator the only turning error is due to liquid swirl.
Whenever the pilot turns through the nearer pole (north in the northern hemisphere, or south in the southern hemisphere):
the aircraft and compass rotate in the same direction,the compass will be sluggish, andthe pilot should undershoot the turn / roll out early.liquid swirl will increase the turning error.
Whenever the pilot turns through the further pole (south in the northern hemisphere, or north in the southern hemisphere):
the aircraft and compass rotate in the opposite direction,the compass will be lively, andthe pilot should overshoot the turn / roll out late.liquid swirl will reduce the turning error.

549
Chapter 31The Direct Indicating Compass
Table of turning errors
Hemis’ TurningAircraftTurns
Magnets’Turn
At the end of the turn compass reads
Stopturn
Effect ofliquid swirl
Compass Condition
From To
N 45 315Anti
ClockwiseAnti
Clockwise More than 315 deg Early Increases turning error Sluggish
N 315 45Clockwise Clockwise
Less than 045 deg Early Increases turning error Sluggish
N 135 225Clockwise Anti
Clockwise More than 225 deg Late Reduces turning error Lively
N 225 135Anti
ClockwiseClockwise
Less than 135 deg Late Reduces turning error Lively
S 45 315Anti
ClockwiseClockwise
Less than 315 deg Late Reduces turning error Lively
S 315 45Clockwise Anti
Clockwise More than 045 deg Late Reduces turning error Lively
S 135 225Clockwise Clockwise
Less than 225 deg Early Increases turning error Sluggish
S 225 135Anti
ClockwiseAnti
Clockwise More than 135 deg Early Increases turning error Sluggish
Table ExplainedThe term SLUGGISH which appears in the right hand column of the table denotes that the compass HEADING is LAGGING BEHIND the aircraft heading.
Conversely, when the term LIVELY is used, the compass HEADING is LEADING the aircraft around the turn.
The following rules of thumb apply:
During a turn through the pole which is physically nearer to the aircraft, the compass will be SLUGGISH. It is therefore necessary to ROLL OUT EARLY on the indication given by the Direct Reading Compass.
During a turn through the pole which is physically further from the aircraft, the com-pass will be LIVELY. It is therefore necessary to ROLL OUT LATE on the indication given by the Direct Reading Compass.
From the above statements it can be seen that, at the MAGNETIC EQUATOR, there is NO TURNING ERROR because there is no “dip”.
Remember, that it is a displacement of the MAGNETS in a CLOCKWISE direction when viewed from above which causes the compass to UNDERREAD, and a displacement in an ANTICLOCKWISE direction which causes the compass to OVERREAD.

550
The Direct Indicating CompassChapter 31
QUESTIONS
1. In a standby direct reading compass there is:
a. a non-pendulously mounted magnet system. b. a single pendulously mounted bar magnet.c. a circular magnet or pair of bar magnets pendulously mounted.d. a low magnetic moment system, either of circular or bar configuration.
2. The main requirements of a direct reading magnetic compass are that it should be:
a. horizontal, sensitive, periodic.b. easily read, floating in a transparent liquid, quick to react to change in aircraft
heading. c. positioned directly in front of the pilot, easily corrected for magnetic deviation,
aperiodic.d. aperiodic, horizontal, sensitive.
3. For a position in the southern hemisphere, the effect of acceleration errors are greatest on headings:
a. 180 ° and 360 ° b. 045 ° and 225 ° c. 135 ° and 315 ° d. 090 ° and 270 °
4. An aircraft in the southern hemisphere is turning from a heading of 045 °C to 315 °C using a DGI. At the end of the turn the compass will read ....... than 315 ° and liquid swirl will ....... this effect.
a. more; increase b. less; increase c. more; decrease d. less; decrease
5. In a standby compass the magnet system is immersed in a transparent liquid. The purpose of this liquid is to:
a. increase sensitivity, increase aperiodicity. b. increase sensitivity, decrease aperiodicity.c. increase sensitivity at high latitudes, lubricate bearings. d. increase sensitivity, reduce liquid swirl.
6. To improve the horizontality of a compass, the magnet assembly is suspended from a point:
a. on the centre line of the magnet.b. below the centre of gravity.c. above the centre of gravity.d. varying with magnetic latitude.

551
Chapter 31The Direct Indicating Compass
7. The magnitude, and sense, of turning error shown by a direct reading compass varies with:
1. the design of the compass.2. the direction of the turn.3. the rate of turn.4. which hemisphere the aircraft is in.5. the heading of the aircraft.6. the amount of dip at the aircraft’s latitude.
Of these statements:
a. only 1, 2, 5 and 6 are correct. b. only 1, 3, 5 and 6 are correct. c. only 2, 4 and 5 are correct.d. all are correct.
8. During a sustained turn ....... the nearer magnetic pole, the effect of liquid swirl will ....... compass turning error.
a. away from; increase. b. towards; not affect.c. away from; not affect.d. towards; increase.
9. When carrying out a turn at the magnetic equator there will be:
a. no turning error.b. a tendency to underread turns through south and overread turns through north.c. a tendency to underread turns due to liquid swirl.d. no turning error when turning through east or west

552
The Direct Indicating CompassChapter 31
ANSWERS
1 C
2 D
3 D
4 D
5 A
6 C
7 D
8 D
9 C

553
Chapter 32Remote Indicating Magnetic Compass
CHAPTER THIRTY TWO
REMOTE INDICATING MAGNETIC COMPASS
Contents
LIMITATIONS OF THE DIRECT READING COMPASS . . . . . . . . . . . . . . . . .555
LIMITATIONS OF THE DIRECTIONAL GYRO INDICATOR . . . . . . . . . . . . . .555
REQUIREMENT FOR THE GYRO-MAGNETIC COMPASS . . . . . . . . . . . . . . .555
BASIC SYSTEM DESCRIPTION . . . . . . . . . . . . . . . . . . . . . . . . . . . . . . .555
OPERATION WITH STEADY HEADING – CORRECTION FOR GYRO DRIFT . . . .556
OPERATION IN A TURN – GYRO DRIFT SMALL OVER PERIOD OF TURN. . . . .557
RAPID SYNCHRONISATION . . . . . . . . . . . . . . . . . . . . . . . . . . . . . . . .557
DETECTOR UNIT (FLUX VALVE) . . . . . . . . . . . . . . . . . . . . . . . . . . . . . .558
ERROR SIGNAL COMPARISON. . . . . . . . . . . . . . . . . . . . . . . . . . . . . . .562
HEADING INDICATOR . . . . . . . . . . . . . . . . . . . . . . . . . . . . . . . . . . .562
OPERATION AS A DGI . . . . . . . . . . . . . . . . . . . . . . . . . . . . . . . . . . . .563
ANNUNCIATOR. . . . . . . . . . . . . . . . . . . . . . . . . . . . . . . . . . . . . . . .563
KEEPING THE GYRO AXIS HORIZONTAL . . . . . . . . . . . . . . . . . . . . . . . .564
TRANSMITTING HEADING OUTPUT TO OTHER INSTRUMENTS. . . . . . . . . .564
OTHER FACILITIES (NOT FOUND IN ALL GM COMPASSES) . . . . . . . . . . . . .565
SUMMARY . . . . . . . . . . . . . . . . . . . . . . . . . . . . . . . . . . . . . . . . . . .568
QUESTIONS . . . . . . . . . . . . . . . . . . . . . . . . . . . . . . . . . . . . . . . . . .569
ANSWERS . . . . . . . . . . . . . . . . . . . . . . . . . . . . . . . . . . . . . . . . . . .570

554
Chapter 32 Remote Indicating Magnetic Compass

555
Chapter 32Remote Indicating Magnetic Compass
LIMITATIONS OF THE DIRECT READING COMPASS
The Direct Reading Compass has three major limitations:
Turning and acceleration errors. The compass cannot be read accurately during a turn.
The magnetic sensing element (the magnets on the vertical card) is contained within the instrument and is therefore situated close to the pilot so that the card can be seen. The cockpit area is close to sources of deviation, such as electric lights, electric motors and ferrous metal.
The instrument is self-contained. It is not possible to take a magnetic heading and input it into other equipment.
LIMITATIONS OF THE DIRECTIONAL GYRO INDICATOR
The Directional Gyro Indicator attempts to solve some of these problems by use of an air-driven or an electro-mechanical gyro. Turning and acceleration errors are eliminated and an output can be taken to other equipment. However, there is no magnetic input, so if the gyro drifts with time there is no correction except by the pilot manually synchronising to the direct reading compass at regular intervals.
REQUIREMENT FOR THE GYRO-MAGNETIC COMPASS
What is required is a system which combines the best of both. The short-term rigidity of the gyro overcomes turning and acceleration errors. This needs to be combined with the longer-term monitoring of the Earth’s magnetic field so that if the gyro starts to drift, a servo system slaves it to alignment with a magnetic input. Such a system is a gyro-magnetic compass.
The gyro-magnetic compass is known by several names. It can be referred to as the:
Gyro-magnetic compass. Remote Indicating Compass. Slaved Gyro compass. Magnetic Heading Reference System (MHRS)
They all mean the same thing.
BASIC SYSTEM DESCRIPTION
At its simplest, the system comprises the following elements:
Magnetic Detector Unit. This is also often known as a flux valve or a flux detector. Heading Indicator. This is what most people refer to as ‘the compass’. Precession amplifier. This may also be known as a slaving amplifier. Precession motor. This may also be known as a slaving or synchronising motor. Horizontal gyro.
In simple systems, the horizontal gyro is directly connected to the compass card of the heading indicator via a bevel gear and a drive shaft. This is assumed in the description which follows.

556
Chapter 32 Remote Indicating Magnetic Compass
Fig 32.1 Simple Signal Routing
Precession Motor
A
Detector Unit (flux valve)
Heading Indicator
Horizontal Gyro
Direct Drive Shaft
Error Signal (AC)
Amplified Error Signal (DC)
Figure 32.1 Simple Signal Routing
OPERATION WITH STEADY HEADING – CORRECTION FOR GYRO DRIFT
This description assumes a steady heading, which gives a steady input from the Detector Unit (flux valve), and assumes that the compass has already been synchronised. Any difference between the flux valve field and the gyro alignment would only arise if the gyro were to drift.
The Detector Unit (flux valve) senses the earth’s magnetic field and reproduces it within the compass unit, where it is compared with the position of the gyro drive shaft (which also positions the compass card indicator – the indication of heading to the pilot).
If the two are aligned, no further action takes place. The compass card is reading the right heading. If, however, the gyro starts to drift, the drive shaft will not be in alignment with the flux valve field, and an AC error signal is generated and passed to the precession amplifier (marked with a big A in Figure 32.1), where it is a m p l i f i e d , phase detected, and rectified to DC.
The DC signal drives the precession motor, which turns the gyro. This gyro output is fed via the direct drive shaft to the heading indicator for comparison with the flux valve signal.
If the two are aligned, the compass is synchronised and no further action takes place. If not, the error correction continues until the compass is synchronised.

557
Chapter 32Remote Indicating Magnetic Compass
It would be possible to cut out the gyro, in theory. The flux valve field could be passed for comparison with the compass card and the error signal passed to a motor which would directly drive the compass card shaft. This would still give an electro-magnetic compass, with a detector unit remote from the major source of deviations, and its output could be used to drive other systems. However, such a system would be overly responsive to any fluctuations in the field detected by the flux valve and would suffer significantly from turning and acceleration errors. The use of the gyro gives stability and rigidity because the precession motor applies corrections to the drive shaft at the rate of approximately only 3° per minute.
OPERATION IN A TURN – GYRO DRIFT SMALL OVER PERIOD OF TURN
Now consider what happens in a turn. We will assume, initially, that the gyro does not drift during the turn, which is not unreasonable, because even during a full 360° orbit, the turn will only take 2 minutes. The aircraft turns, but the gyro, having rigidity, does not. This gives relative rotation between the horizontal gyro and the instrument case and so operation of the bevel gear causes the direct drive shaft to rotate, changing the heading indication on the compass card. However, at the same time, the heading sensed by the flux valve, which is being passed to the driveshaft for comparison, is changing at the same rate. Therefore no error signal is generated and the compass should remain synchronised during the turn.
If there is some gyro drift during the turn, on completion of the turn there will be a small error signal. This will be taken out as described in the previous paragraph.
RAPID SYNCHRONISATION
When the gyro is started up on initial switch-on, the alignment it adopts is random and is unlikely to be in synchronisation with the earth’s magnetic field. Therefore an error signal is detected at the gyro drive shaft. The problem is that the precession motor’s normal correction rate is only 3° per minute and if the gyro happened to be 90° out, it would take 30 minutes to synchronise, which is obviously unacceptable.
The solution is to have a rapid synchronisation facility, which can either be a mechanical clutch operated by the pilot (as in the DGI) or, in later compasses, a high gain mode for the precession amplifier (similar in principle to rapid erection in the electric artificial horizon). This is operated by a 2 position switch, spring loaded to the normal position, which has to be held against the spring for rapid alignment. Operation of this switch increases the precession motor’s correction rate so that synchronisation takes only a few seconds.
More modern compasses are even more automatic. If a large error is detected fast precession takes place at, typically, 60°/min until the error is zero, then the system automatically reverts to the slow precession rate of, typically, 3°/min.
We therefore have to modify our original block schematic to include the rapid synchronisation facility:-

558
Chapter 32 Remote Indicating Magnetic Compass
Fig 32.2 Heading Indicator Schematic with Rapid Synchronisation added
Precession Motor
A
Detector Unit (flux valve)
Heading Indicator
Horizontal Gyro
Direct Drive Shaft
Error Signal (AC)
Amplified Error Signal (DC)
Rapid Synchronisation Facility
Figure 32.2 Heading Indicator Schematic with Rapid Synchronisation added
DETECTOR UNIT (FLUX VALVE)
The detector unit is positioned in a part of the aircraft least affected by on-board electrical fields (usually the wing tip or tail fin, where any aircraft generated magnetic disturbances are at a minimum). Its function is to sense the direction of the earth’s magnetic field. It contains a pendulous magnetic detecting element mounted on a Hooke’s Joint which enables the detector to swing within limits of 25° about the pitch and roll axes, but allows no rotation in azimuth. The unit itself is contained in a sealed case partially filled with oil to dampen any oscillations created during flight. Figure 32.3 A Magnetic Detector Unit
The circular plate is screwed to the underside of the wing. The black hemisphere protrudes out into the airflow and is simply a protective cover for the flux valve inside. The cable carrying the signals passes along inside the structure of the wing.
Figure 34.6. A Detector Unit.

559
Chapter 32Remote Indicating Magnetic Compass
The primary component is the flux valve, a 3-spoked device, fixed in azimuth but with some freedom in the vertical to allow alignment with the plane of the earth’s magnetic field. Parts of the flux valve are shown in Figure 32.4 below.
Figure 32.4 Flux Valve components
The parts in red in Figure 32.4 are shown in isolation in Figure 32.5 below. All 3 legs are shown together, as in the actual unit:
The curved ‘rams’ horns’ at the end of each of the 3 legs are simply to improve magnetic flux gathering efficiency, but they do not affect the principle The flux valve would detect even without them. To explain how the flux valve works, we will start by considering just a single leg (without the ‘rams’ horns’).
Figure 32.5 Three Flux Valve Legs
A simplified diagram of a flux valve leg is shown here. Alternating current is fed to the coil wound around the centre post which in turn produces fields of opposite sign in the top and bottom legs of the flux valve.
Figure 32.6 A single leg of a Flux Valve
Figure 34.5
Figure 34.1. A Simplified Diagram of a Flux Valve.

560
Chapter 32 Remote Indicating Magnetic Compass
The magnetic flux (a measure of the density of the lines of force) in legs A and B is shown in Figure 32.6 as red and blue lines. They are at the same frequency and amplitude, but are in anti-phase. If we add the components A and B together, the resultant flux (the green line) is therefore zero, and so no current is induced in the pick-off coil.
Figure 32.7 Flux fields at A and B and resultant
If the flux produced by the earth’s magnetic field were present as a background, the positive and negative flux would start from a different baseline, which would not be zero. This is shown below in Figure 32.8.
Figure 32.8 Effect of Earth’s background magnetism
However, the physical characteristics of the metal used in the flux valve legs are such that they magnetically saturate at a certain level. The metal will not magnetise further beyond a certain point. In this case, the saturation curve tops-out at a limiting saturation level, giving the response shown above (the upper end of the blue and red lines).
When we add the flux level together to see the resultant, the total flux follows the path of the green line.
Figure 32.9 Flux density
The operation of the flux valve is in accordance with Faraday’s Law of Electromagnetic Induction:
‘If the number of lines of force threading a circuit is changing , an induced electromotive force will be set up in the circuit, the magnitude of the EMF being proportional to the rate of change in the number of lines of force threading the circuit’
Therefore the secondary winding (the one coloured red in Figure 32.6) will pick up change in magnetic flux density (the dips in the green line) as an EMF. This will be detected as an AC signal.
Figure 16.3.
Figure 16.3.
Figure 34.2.

561
Chapter 32Remote Indicating Magnetic Compass
Figure 32.10 shows that if the flux valve leg is in line with the earth’s field, then the EMF induced will be at a maximum value. The secondary winding (which is aligned with the leg) is shown in the diagram. If the flux valve leg is at right angles to the field, then the EMF induced will be zero.
Figure 34.4.Figure 32.10 Effect of Earth’s field on different directions of flux valve leg
Figure 32.10 shows that the EMF induced varies as the cosine of the magnetic direction of the flux valve leg. Unfortunately, this cannot be transformed directly into heading because, except for 0° and 180°, there are 2 possible values of heading for each value of voltage. Furthermore, any slight change of input voltage would give an altered value of output voltage, resulting in a different measured heading.
Instead, the 3-leg system shown in Figure 32.5 is used and the output from each leg is fed to one of the 3 legs of a stator. This re-creates the earth’s field relative to the direction of the flux valve as shown in Figure 32.11, around the direct drive shaft from the gyro to the heading indicator compass card.
Fig 32.10 Connection of flux valve to stator legs Figure 32.11 Connection of flux valve to stator legs

562
Chapter 32 Remote Indicating Magnetic Compass
ERROR SIGNAL COMPARISON
Earlier we said that if there were any difference between the gyro shaft alignment and the magnetic field detected by the flux valve, an error signal would be generated which would be amplified to precess the gyro so that it takes up the alignment of the magnetic heading. This error signal detection is achieved by rotor-stator comparison.
A wound coil is mounted on the gyro drive shaft. This coil is known as a rotor. If the coil is in line with the AC field generated by the stators, a secondary AC voltage will be induced in the rotor (similar to the situation shown if Figure 32.10). If the rotor is at 90° to the AC field, no secondary voltage is induced. This is known as the null position. At any position other than the null, some secondary voltage is induced. This secondary induced voltage is passed to the precession amplifier where it is amplified, phase detected, and rectified to DC.
Amplified. The reason for the amplification is that the un-amplified error signal is not powerful enough to drive the precession motor.
Phase Detected. It is important that the precession motor ‘knows which way to turn’. Suppose that the gyro shaft is misaligned 2° clockwise from the null. The motor should rotate the shaft 2° anti-clockwise, not all the way round 358° clockwise. Otherwise, the system would go into continuous rotation. The purpose of phase detection is to detect the sense of the error.
Rectified. The mechanism of the precession motor is an electromagnetic solenoid acting on a permanent magnet. This requires DC. The amplified AC is therefore rectified to DC which, depending on the phase detected, will either be in a positive or a negative direction, turning the shaft either clockwise or anti-clockwise for the shortest route for error correction.
HEADING INDICATOR
The Heading Indicator dial (compass card) is directly driven by the shaft from the gyro. The compass card rotates as heading changes and the heading is read against the index line in the 12 o’clock position (the lubber line).
Fig 32.11 – Typical Heading Indicator
Heading Warning Flag
Lubber Line
Heading Selector
Heading Bug
Figure 32.12 Typical Heading Indicator
A desired heading can be selected by the pilot by rotating the heading selector control. The heading select marker (usually called a ‘bug’) indicates the selected heading. If the magnetic input from the flux valve fails, a warning is given in the form of a heading warning flag.

563
Chapter 32Remote Indicating Magnetic Compass
OPERATION AS A DGI
If the magnetic input from the flux valve should fail or if it becomes unreliable due to proximity to one of the Earth’s magnetic poles, it is possible to operate the gyro-magnetic compass in gyro mode only, in which case it acts as a DGI and will need to be re-set periodically to a directional reference such as a standby compass or other source of aircraft heading. When it operates as a DGI, this is referred to as FREE mode, whilst its normal magnetically monitored operation is referred to as SLAVED mode.
Figure 32.13 shows a typical modern compass controller. With the FREE/SLAVE switch at SLAVE, the compass operates as previously described, with the gyro slaved (in the long term) to the input from the flux valve. If the switch is moved to FREE the magnetic signal from the flux valve is disconnected, the rotor/stator comparison ceases, and the gyro is no longer tied in azimuth and so acts as a free gyro (DGI).
When the Heading Indicator in FREE the pilot adjusts the indicated heading in order to correct it to an external datum heading by use of the CCW/CW (counter-clockwise/clockwise) control switch, which is spring-loaded to the central position.
Figure 32.13 Compass Control Panel
ANNUNCIATOR
During normal flight in SLAVE mode there is usually continuous slight motion due to oscillations of heading and to vibration which means that rotor/stator comparison of the magnetic flux valve signal against the gyro shaft position continuously generates very small error signals. The error signal and therefore the precession amplifier are continuously ‘hunting’. This is normal, and is how the system is designed to work.
These error signals pass through an indicator on their way from the amplifier to the precession motor. This indicator is called an annunciator and an example is shown in Figure 32.13.
Fig 32.13 Annunciator in Circuit
Precession Motor
A
Detector Unit (flux valve)
Heading Indicator
Horizontal Gyro
Direct Drive Shaft
Error Signal (AC)
Amplified Error Signal
Annunciator - +
Figure 32.14 Annunciator in Circuit
32.12 Control Panel
Annunciator
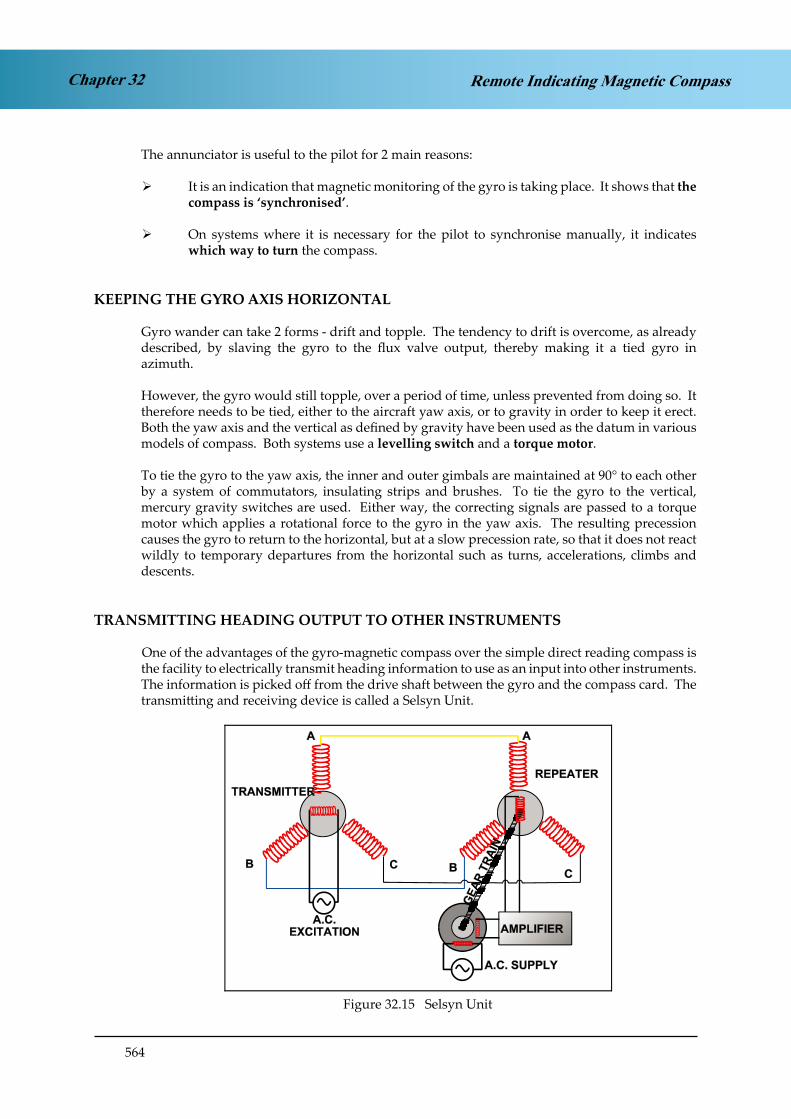
564
Chapter 32 Remote Indicating Magnetic Compass
The annunciator is useful to the pilot for 2 main reasons:
It is an indication that magnetic monitoring of the gyro is taking place. It shows that the compass is ‘synchronised’.
On systems where it is necessary for the pilot to synchronise manually, it indicates which way to turn the compass.
KEEPING THE GYRO AXIS HORIZONTAL
Gyro wander can take 2 forms - drift and topple. The tendency to drift is overcome, as already described, by slaving the gyro to the flux valve output, thereby making it a tied gyro in azimuth.
However, the gyro would still topple, over a period of time, unless prevented from doing so. It therefore needs to be tied, either to the aircraft yaw axis, or to gravity in order to keep it erect.Both the yaw axis and the vertical as defined by gravity have been used as the datum in various models of compass. Both systems use a levelling switch and a torque motor.
To tie the gyro to the yaw axis, the inner and outer gimbals are maintained at 90° to each other by a system of commutators, insulating strips and brushes. To tie the gyro to the vertical, mercury gravity switches are used. Either way, the correcting signals are passed to a torque motor which applies a rotational force to the gyro in the yaw axis. The resulting precession causes the gyro to return to the horizontal, but at a slow precession rate, so that it does not react wildly to temporary departures from the horizontal such as turns, accelerations, climbs and descents.
TRANSMITTING HEADING OUTPUT TO OTHER INSTRUMENTS
One of the advantages of the gyro-magnetic compass over the simple direct reading compass is the facility to electrically transmit heading information to use as an input into other instruments. The information is picked off from the drive shaft between the gyro and the compass card. The transmitting and receiving device is called a Selsyn Unit.
Figure 34.12. Selsyn Unit.Figure 32.15 Selsyn Unit

565
Chapter 32Remote Indicating Magnetic Compass
The rotor of the transmitter (shown in Figure 32.15) is attached to the heading drive shaft and rotates with it. The orientation of the rotor is therefore the heading which is to be transmitted. The rotor is supplied with a constant primary excitation AC voltage, which induces a field in the stators. The stators are directly connected by 3-strand wire to the 3 stator arms of the repeater, so an identical field is reproduced there.
If the rotor of the repeater is not perpendicular to the field in the repeater stators, an AC voltage will be induced in this repeater rotor. This is passed to an amplifier and then to a motor to turn a shaft on which the repeater rotor is mounted. The repeater shaft will turn until no further voltage is detected. The repeater shaft therefore follows any heading changes in the main gyro drive shaft.
OTHER FACILITIES (NOT FOUND IN ALL GM COMPASSES)
There are some facilities and functions which may be found in some gyro-magnetic compasses but not in others, depending on the complexity and the vintage of the particular model.
Correction for Variation. A compass measures magnetic heading, but an earlier generation of automatic navigation equipment needed to operate with an input of True heading. Many compasses have been designed with a facility to correct for variation. The principle is simple. The crew member turns a knob with a graduated dial on it to the desired value of variation E or W. This turns a shaft which offsets the angle at which the stators receiving the flux valve field are set, by the amount of variation. Thus, the new null position for the rotor will be the magnetic field plus the variation and so the gyro will take up True, not magnetic, heading. All indications in the aircraft are True, which is more satisfactory for the navigation equipment but, since ATC invariably work in magnetic headings, the crew have to remember to correct back to magnetic for ATC instructions and other communications. Later magnetic compasses had a TRUE/MAG switch, which allowed the pilot to have magnetic heading displayed, if required, whilst True was passed to the navigation equipment. It was still necessary, for both types, for the crew to remember to keep the variation updated as the isogonals changed along their route.
This facility has become less popular recently because the modern generation of area nav equipment tend to be digital computers (often of little more complexity than a scientific calculator) and it is a simple matter to leave the compass in magnetic for ATC purposes and have automatic arithmetical addition of variation in the present position computer.
Acceleration and Bank Cut-out Switches. Turning and acceleration errors are greatly reduced in the slaved gyro compass, compared with the direct reading compass because of the rigidity of the gyro. Nevertheless, because the Hooke’s joint is pendulous the detector unit will swing back from the vertical in accelerations and swing out from a turn because of centrifugal force. However, because of the slow slaving rate these turning and acceleration errors affect the gyro very little, and only for a short length of time, and the error is slowly corrected out again by slaving once straight and level unaccelerated flight is regained.
These errors, small though they are, can be reduced by disconnecting the slaving whilst turns and accelerations take place. Some GM compasses have longitudinal accelerometers and bank cut-out switches, much like the electric artificial horizon. An acceleration of 0.18g or a bank angle of 10° or more causes the signal from the flux valve to be disconnected and the system operates as a DGI during the turn. Once the bank or acceleration is over, slaving takes place again and, if any error was introduced during the turn through gyro drift, it should be less than that which would have been introduced by the (very small) turning and acceleration errors, and is soon slaved out again.

566
Chapter 32 Remote Indicating Magnetic Compass
Two –Indicator One-Gyro Systems. Some compass systems use 2 heading indicators (for a 2-pilot aircraft) but only one gyro. The second heading indicator is aligned to the gyro by a follow-up amplifier. The diagram is below, in Figure 32.16.
Fig 32.15 Two Heading Indicators Driven by One Gyro
Stator Field Transmission
Precession Motor A
Detector Unit (flux valve)
Heading Indicator
Error
Direct Drive Shaft
Direct Drive Shaft
A
Precession Amplifier
Follow-up Amplifier
Rotor/Stator Comparison
Horizontal Axis Gyro
Follow-up Motor
Rotor/stator comparison
Rotor/stator comparison
Figure 32.16 Two Heading Indicators Driven by One Gyro
The Earth’s magnetic field is detected at the flux valve and reproduced in the stators in the first Heading Indicator. If the rotor on the direct drive shaft from the follow-up motor is not in the null position an error signal is detected and passed to the precession amplifier and precession motor in order to precess the gyro. This will rotate the shaft on the second Heading Indicator, re-positioning a rotor on this shaft. This induces a field in the stators which is reproduced in another set of stators on the first heading indicator. Rotor/stator comparison takes place and any error is passed to the follow-up amplifier and motor, which re-positions the direct drive shaft, thereby moving it to the null position and removing the original difference between the follow-up shaft and the flux valve.
The precession to the gyro is at a slow rate – typically, 3° a minute - since, except for initial synchronisation, the gyro should be in the correct orientation and only needs to be prevented from drifting. Therefore the precession amplifier and precession motor have a slow correction rate.
However, there is no gyro on the follow-up shaft. This shaft is turned by the follow-up motor and has to follow the turn rates of the aircraft, which may be 500 to 600° a minute. The follow-up amplifier and follow-up motor are therefore designed to have a fast follow-up rate.

567
Chapter 32Remote Indicating Magnetic Compass
Remote Systems. Some systems have very high-grade gyros indeed. These could be found in a high-quality twin gyro platform, or the platform of an inertial navigation system. In this case, the gyros drift rate may be as low as between 0.1°/hour and 0.01°/hour and any attempt to precess the gyro using magnetic monitoring would actually degrade it. Nevertheless, there is still value in comparing it with a flux valve in order to pick up any gyro failure or rapid degradation. In this case, a system of comparing the magnetic and gyro outputs which does not disturb the gyro by precessing it is used.
Fig 32.16 Remote System with Compass Coupler
Horizontal Gyro
Detector Unit (flux valve)
Servomotor
Stepper Motor
Rotor/Stator Comparison
Rotor/Stator Comparison
Error
Error
Compass Coupler
Figure 32.17 Remote System with Compass Coupler
Instead of precessing the gyro the output of the gyro is fed to a comparison system called a compass coupler. To see how the comparison takes place, start by assuming that the compass is synchronised and that the main shaft output to the heading indicator is the same as the input from the gyro. The output from the main shaft is compared with the output from the flux valve. If there is any difference, an error signal is fed to a stepper motor. This is a device with a slow follow-up rate (in order to avoid reacting rapidly to minor routine fluctuations from the flux valve). This error signal is now added to the output of the horizontal gyro and the combined signal is passed to the servomotor to slowly adjust the main shaft to correspond to the flux valve output. This results in a system which maintains magnetic monitoring in the long-term, but only allows the stable output of the gyro to be corrected slowly.
If the gyro were to drift (which should not happen to any significant degree) the servomotor will turn the shaft. There will now be an error between the flux valve and the shaft which will be passed through the stepper motor slowly and will be added the output from the gyro, and the combined signal will be passed to the servomotor, repositioning the shaft to the long-term flux valve magnetic output. The gyro output is adjusted and corrected to the magnetic source whilst still maintaining the advantage of gyro stability and without precessing the gyro.

568
Chapter 32 Remote Indicating Magnetic Compass
Dual Systems. Dual systems are simply 2 gyro-magnetic compasses together. They can operate either independently (NORMAL switch position) or, in the event of a failure in one system, both heading indicators can be fed from the other gyro-magnetic compass (BOTH ON 1 or BOTH ON 2).
Fig 32.17 Typical Dual System
NORMALBOTH ON 1
BOTH ON 2 No 2 Heading
Indicator
No 1 Compass Coupler
No 2 Compass Coupler
No 1 Heading Indicator
Figure 32.18 Typical Dual System
SUMMARY
The gyro magnetic compass system overcomes the weaknesses of the direct reading compass (turning and acceleration errors, magnetic element close to source of deviations, no feed to other equipments) and of the directional gyro (no magnetic monitoring).
The gyro magnetic compass system combines the short term stability of a gyroscope with the long term directional stability of the earth’s magnetism.
569
Chapter 32Remote Indicating Magnetic Compass
QUESTIONS
1. A gyro-magnetic compass or magnetic heading reference unit is an assembly which always consists of :
1- a directional gyro2- a vertical axis gyro3- an earth’s magnetic field detector4- an azimuth control5- a synchronising control
The combination of correct statements is :
a 2 and 5b 1, 3 and 5c 2, 3 and 5d 1 and 4
2. A slaved directional gyro derives its directional signal from:
a a direct reading magnetic compassb the flight directorc the flux valved the air data computer
3. The gyro-magnetic compass torque motor:
a causes the directional gyro unit to precessb causes the heading indicator to precessc feeds the error detector systemd is fed by the flux valve
4. The heading information originating from the gyro-magnetic compass flux valve is sent to:
a error detectorb erector systemc heading indicatord amplifier
5. The input signal of the amplifier of the gyro-magnetic compass resetting device originates from the:
a directional gyro erection deviceb error detectorc flux valved directional gyro unit
6. Heading information from the gyro-magnetic compass flux gate is transmitted to the:
a amplifierb error detectorc erecting systemd heading indicator

570
Remote Indicating Magnetic CompassChapter 32
7. A flux valve senses the changes in orientation of the horizontal component of the earth’s magnetic field :
1- the flux valve is made of a pair of soft iron bars2- the primary coils are fed AC voltage3- the information can be used by a “flux gate” compass or a directional gyro4- the flux gate valve casing is dependent on the aircraft three inertial axis5- the accuracy of the value of the magnetic field indication is less than 0.5%
The combination of correct statements is :
a 2, 3 and 5b 1, 3, 4 and 5c 3 and 5d 1, 4 and 5
ANSWERS
1 B
2 C
3 A
4 A
5 B
6 B
7 A

571
Chapter 33Aircraft Magnetism
CHAPTER THIRTY THREE
AIRCRAFT MAGNETISM
Contents
DEVIATION . . . . . . . . . . . . . . . . . . . . . . . . . . . . . . . . . . . . . . . . . .573
COMPASS SWING . . . . . . . . . . . . . . . . . . . . . . . . . . . . . . . . . . . . . . .573
HARD IRON MAGNETISM . . . . . . . . . . . . . . . . . . . . . . . . . . . . . . . . .574
SOFT IRON MAGNETISM . . . . . . . . . . . . . . . . . . . . . . . . . . . . . . . . . .574
CORRECTION OF COEFFICIENTS . . . . . . . . . . . . . . . . . . . . . . . . . . . . .577
ACCURACY LIMITS . . . . . . . . . . . . . . . . . . . . . . . . . . . . . . . . . . . . .577
CHANGE OF MAGNETIC LATITUDE . . . . . . . . . . . . . . . . . . . . . . . . . . .578
OCCASIONS FOR SWINGING THE COMPASS . . . . . . . . . . . . . . . . . . . . . .579
QUESTIONS . . . . . . . . . . . . . . . . . . . . . . . . . . . . . . . . . . . . . . . . . .580
ANSWERS . . . . . . . . . . . . . . . . . . . . . . . . . . . . . . . . . . . . . . . . . . .582

572
Chapter 33 Aircraft Magnetism

573
Chapter 33Aircraft Magnetism
DEVIATION
The compass needle would accurately define the magnetic meridian were it not for the aircraft’s own internal magnetism deflecting it. Deviation is the angular difference measured between the direction taken up by a Compass Needle and the Magnetic Meridian. Deviation is named Easterly or Westerly depending on whether the North seeking end of the compass needle lies to the East or West of the Magnetic meridian.
CompassHeading Deviation Magnetic
Heading
Deviation WestCompass Best 095 -5 090
Deviation EastCompass Least 090 +5 095
PUSH PUSH
DR10-F10.1
Figure 38.1Figure 33.1
COMPASS SWING
The basic method of determining deviation is to compare the aircraft’s heading compass reading with magnetic heading as defined by a high quality ‘land or datum’ compass. This comparison of aircraft compass and magnetic datum readings is carried out in an area selected specifically for this purpose.
Therefore the aims of a compass swing are as follows:
To observe / determine the deviations / differences between Magnetic North (observed on a Landing Compass) and Compass North (observed in the aircraft) on a series of headings
To correct / remove as much deviation as possible
To record the residual deviation which is left after the Compass has been adjusted
The magnetic deviation observed during a compass swing can be said to be derived from Hard Iron and Soft Iron magnetism and this total field can in turn, for our purposes, be later resolved into two further combined components (coefficients B and C).

574
Chapter 33 Aircraft Magnetism
HARD IRON MAGNETISM
The total force at the compass position produced by permanent hard iron magnetism can be resolved into three components. These components will be fixed for a given aircraft and will not change with change of heading.
Figure 33.2
SOFT IRON MAGNETISM
Soft iron magnetism is induced in parts of the aircraft structure by surrounding fields - the most important of these being the earth. The earth’s field has a vertical as well as horizontal component. However, again for our purposes we will within the constraints of the syllabus only consider vertical soft iron (VSI) magnetism (Z is the vertical component of the earths field and H is the horizontal component). The component Z has an increasing affect with latitude as the compass magnets try to follow the earth’s flux lines therefore VSI magnetism must also vary with latitude. However, Z is zero at the equator, where the horizontal component H is greatest, so no VSI magnetism is induced there.
When we examine the effective positioning of the imaginary magnets found when completing a compass swing we must remember that we use a real system (the Compass) to give us aircraft heading and that this readout is affected by these magnetic forces which we have gone to some trouble to discover.
We can see from Figure 33.3 that the positioning can vary,(even to the extent of having two imaginary magnets affecting our compass) but the effect will be easily resolved by the compass swing which can cater for any positioning as long as we follow the basic rules.
For example we may examine the case where the effect of the Blue Pole is said to be in the nose or forward of the aircraft compass.
IN10-F3
Figure 38.3.
DR10-f10.2
Figure 38.2
Figure 33.3

575
Chapter 33Aircraft Magnetism
Heading North the isolated Blue pole is in the same horizontal direction as the earths blue pole and so the needle is not deviated. The directive force or alignment of the earths field is being augmented by the blue pole, effectively they are pulling together.
As the aircraft now turns right on to 045° deviation begins to take place and as we can see from the table by 090° this has become maximum and then starts to become less as we approach 180°.
Remember that the blue pole represents a magnetic force which on this heading acts along the same line but in opposition to the stronger earth’s field.
On the remaining headings 180° to 360° the effects of the blue pole in the nose are as expected i.e. the red end of the compass needle is being attracted to the West of Magnetic North giving the maximum westerly deviation on 270°.
If the deviations caused by the blue pole in the nose are plotted against compass heading, a positive sine curve is obtained. Had the blue pole been aft of the compass a negative sine curve would have been obtained. This would mean that on a heading of 090° the deviation would reach a maximum westerly value instead of a maximum easterly value. The changes in directive force would also be revised, the maximum occurring on 180° and the minimum on 360°.
Figure 33.5Figure 15.5
Figure 15.4a. Hdg C000°
Figure 15.4b. Hdg C045°.
Figure 15.4c. Hdg C090°.
Figure 15.4d
Figure 15.4.e.
Figure 15.4c. Hdg C090°.
Figure 15.4d
Figure 15.4.e.
Figure 15.4c. Hdg C090°.
Figure 15.4d
Figure 15.4.e.
Hdg 000°C
Hdg 180°C
Hdg 045°C Hdg 090°C Hdg 135°C

576
Chapter 33 Aircraft Magnetism
Heading °C Deviation Directive Force
000 Zero Maximum
045 East + some More than earth’s
090 East + max Earths approximately
135 East + some Less than earth’s
180 Zero Minimum
225 West - some Less than earth’s
270 West - max Earth’s approximately
315 West - some More than earth’s
000 Zero Maximum
What we have examined here is known for compass swinging as Coefficient B which we could view as that component which is resolved along the body of the aircraft. The forces resolved follow a simple Sine Curve which in our case here would be ‘positive’ although negative curves occur just as frequently.
Equally we should be able to see that if a further magnetic source is resolved to the right wing we would achieve a positive cosine curve along the same lines and this is more usually described as Coefficient C.
Figure 33.6a
The combination of Coefficients A (a mechanical function yet to be discussed) + B + C are resolved during the compass swing and to some extent can be removed by adjustment but other factors are at work here and will probably leave us with some errors at the end.
Figure 33.6b

577
Chapter 33Aircraft Magnetism
CORRECTION OF COEFFICIENTS
The principle for correcting coefficients is the same for any system and can be summed up as follows:
Coefficient A - a mechanical problem of a displaced Lubber Line corrected by loosening the bolts holding the compass body or in the case of the RIMC the Detector Unit and carefully turning it until the correct heading is in place.
Coefficient B - correction required because of magnetic deviating forces acting upon the DRMC or the detector Unit and giving errors known as deviation. Firstly calculate the error to be removed or more correctly the heading you wish to make the compass read and this will be done on an Easterly or Westerly heading.
Coefficient C - correction required because of magnetic deviating forces acting upon the DRMC or the detector Unit and giving errors known as deviation. Firstly calculate the error to be removed or more correctly the heading you wish to make the compass read and this will be done on a Northerly or Southerly heading.
We can see that the correction for B and C are very similar but that we must remember to apply the sign of the correction properly to ensure an accurate correction to our compass system. When the compass swing is completed we of course have to check our work and this ‘check swing’ is carried out using eight or perhaps twelve points of the compass to allow us to derive a compass card that will be placed in the aircraft. This compass card indicates to us the residual deviations that we have been unable to resolve within the essentially horizontal procedure. Alternatively, the Residual Deviations affecting the compass after the completion of a compass swing may be shown by the use of a Graphical Table or a Curve constructed from the information obtained. Either set of calculations will allow for the placing of a Compass Deviation Card near to the compass in the aircraft.
ACCURACY LIMITS
In accordance with CS Ops-1 (European Regulations) the aircraft’s compasses must, after correction, be within the following limits:
Direct Reading Magnetic Compass +/- 10°
Remote Indicating Compass +/- 1°

578
Chapter 33 Aircraft Magnetism
CHANGE OF MAGNETIC LATITUDE
Tan Dip = Z
H
The changes in deviation due to change of magnetic latitude have to be considered firstly with regard to Hard Iron and secondly to Vertical Soft Iron.
Hard Iron. The hard iron deviating force, remains constant regardless of change of latitude. However, H varies with latitude being maximum at the equator and zero at the poles. Thus the smaller the directive force H the greater the maximum deviation, caused by hard iron deviating force. Hard iron deviating effect increases towards the poles and is minimum at the magnetic equator. The sign of the deviation will be the same in both hemispheres.
To summarise, maximum deviation due to hard iron magnetism, is inversely proportional to the value of H, which changes with change of magnetic latitude.
Vertical Soft Iron. The directive force at the compass position is H, whilst the magnetising agent of any VSI component is Z. The maximum deviation due to VSI magnetism will vary inversely as H.
The VSI maximum deviation will vary directly as Z. Z has no effect on Hard Iron deviation.The maximum deviation produced by VSI magnetism increases towards the magnetic poles.
Max deviation = Z = Tan Dip H
so maximum deviation varies directly with Tan dip.

579
Chapter 33Aircraft Magnetism
OCCASIONS FOR SWINGING THE COMPASS
When compass components are installed or replaced.
Whenever the accuracy of the compass is in doubt.
After a maintenance inspection if required by the schedule.
After a significant aircraft modification, repair or replacement involving magnetic material.
When carrying unusual ferromagnetic payloads!
When the compass has been subjected to significant shock.
If the aircraft has been struck by lightning.
After significant modification to aircraft radio/electrical systems.
After the aircraft has been given a new theatre of operations if the move involves a large change of magnetic latitude.
If the aircraft has been in long term storage standing on one heading.

580
Aircraft MagnetismChapter 33
QUESTIONS
1. European regulations (CS Ops-1) state that the maximum permissible deviations after compensation are:
a. one degree for a remote indicating compass, and ten degrees for a direct reading magnetic compass.
b. three degrees for a direct reading magnetic compass, and one degree for a remote indicating compass.
c. ten degrees for a remote indicating compass, and one degree for a direct reading magnetic compass.
d. one degree for a direct reading magnetic compass, and eleven degrees for a slaved compass.
2. Compass swings should be carried out:
a. on the apron.b. only on the compass swinging base or site. c. at the holding point.d. on the active runway.
3. Aircraft magnetism caused by Vertical Soft Iron:
a. varies with magnetic heading but not with magnetic latitude. b. varies with magnetic latitude but not with heading.c. it is not affected magnetic latitude or heading. d. varies as the cosine of the compass heading.
4. Aircraft magnetism caused by Hard Iron:
a. is not usually influenced by the earth’s magnetic field. b. varies directly with magnetic latitude.c. varies indirectly with magnetic latitude. d. is maximum on east and west.
5. The aim of a compass swing is:
1. to find deviation on the cardinal headings and to calculate coefficients A, B and C.2. to eliminate or reduce the coefficients found.3. to record any residual deviation and to prepare a compass correction card.
a. only answer 1 is correct.b. answers 1 and 3 are correct.c. answers 1, 2 and 3 are all correct.d. none of the above answers are correct.

581
Chapter 33Aircraft Magnetism
6. Aircraft magnetism caused by Vertical Soft Iron:
a. varies with magnetic heading but not with magnetic latitude.b. varies with magnetic latitude but not with heading.c. it is not affected magnetic latitude or heading. d. varies as the cosine of the compass heading.
7. Aircraft magnetism caused by Hard Iron:
a. is not usually influenced by the earth’s magnetic field.b. varies directly with magnetic latitude.c. varies indirectly with magnetic latitude. d. is maximum on east and west.
8. Deviation due to coefficient A is mainly caused by:
a. hard iron force acting along the longitudinal axis.b. hard and soft iron forces acting along the lateral axis.c. vertical soft iron forces.d. a misaligned lubber line.
9. The aim of a compass swing is:
1. to find deviation on the cardinal headings and to calculate coefficients A, B and C.2. to eliminate or reduce the coefficients found.3. to record any residual deviation and to prepare a compass correction card.
a. only answer 1 is correct.b. answers 1 and 3 are correct.c. answers 1, 2 and 3 are all correct.d. none of the above answers are correct.

582
Aircraft MagnetismChapter 33
ANSWERS
1 C
2 D
3 A
4 B
5 D
6 B
7 A
8 D
9 C

583
Chapter 34Inertial Navigation System
CHAPTER THIRTY FOUR
INERTIAL NAVIGATION SYSTEM
Contents
INTRODUCTION . . . . . . . . . . . . . . . . . . . . . . . . . . . . . . . . . . . . . . .585
BASIC PRINCIPLES OF INS . . . . . . . . . . . . . . . . . . . . . . . . . . . . . . . . .586
ACCELEROMETER AND INTEGRATORS . . . . . . . . . . . . . . . . . . . . . . . . .586
ACCELEROMETERS . . . . . . . . . . . . . . . . . . . . . . . . . . . . . . . . . . . . .587
GRAVITY EFFECTS ON ACCELEROMETER. . . . . . . . . . . . . . . . . . . . . . . .590
THE INTEGRATING GYROSCOPE . . . . . . . . . . . . . . . . . . . . . . . . . . . . .591
THE PLATFORM. . . . . . . . . . . . . . . . . . . . . . . . . . . . . . . . . . . . . . . .592
EARTH ORIENTATION . . . . . . . . . . . . . . . . . . . . . . . . . . . . . . . . . . . .593
APPARENT WANDER . . . . . . . . . . . . . . . . . . . . . . . . . . . . . . . . . . . .593
ALIGNMENT OF THE SYSTEM . . . . . . . . . . . . . . . . . . . . . . . . . . . . . . .594
SCHULER PERIOD . . . . . . . . . . . . . . . . . . . . . . . . . . . . . . . . . . . . . .595
ERRORS OF INS . . . . . . . . . . . . . . . . . . . . . . . . . . . . . . . . . . . . . . . .596
BOUNDED ERRORS. . . . . . . . . . . . . . . . . . . . . . . . . . . . . . . . . . . . . .596
UNBOUNDED ERRORS . . . . . . . . . . . . . . . . . . . . . . . . . . . . . . . . . . .596
INHERENT ERRORS . . . . . . . . . . . . . . . . . . . . . . . . . . . . . . . . . . . . .597
INS CONTROL AND DISPLAY PANELS . . . . . . . . . . . . . . . . . . . . . . . . . .597
SUMMARY INS WARNING LIGHTS . . . . . . . . . . . . . . . . . . . . . . . . . . . .600
LED DISPLAY . . . . . . . . . . . . . . . . . . . . . . . . . . . . . . . . . . . . . . . . .600
MANUAL AND AUTOMATIC SYSTEM CHECKS . . . . . . . . . . . . . . . . . . . .604
QUESTIONS . . . . . . . . . . . . . . . . . . . . . . . . . . . . . . . . . . . . . . . . . .605
ANSWERS . . . . . . . . . . . . . . . . . . . . . . . . . . . . . . . . . . . . . . . . . . .608

584
Chapter 34 Inertial Navigation System
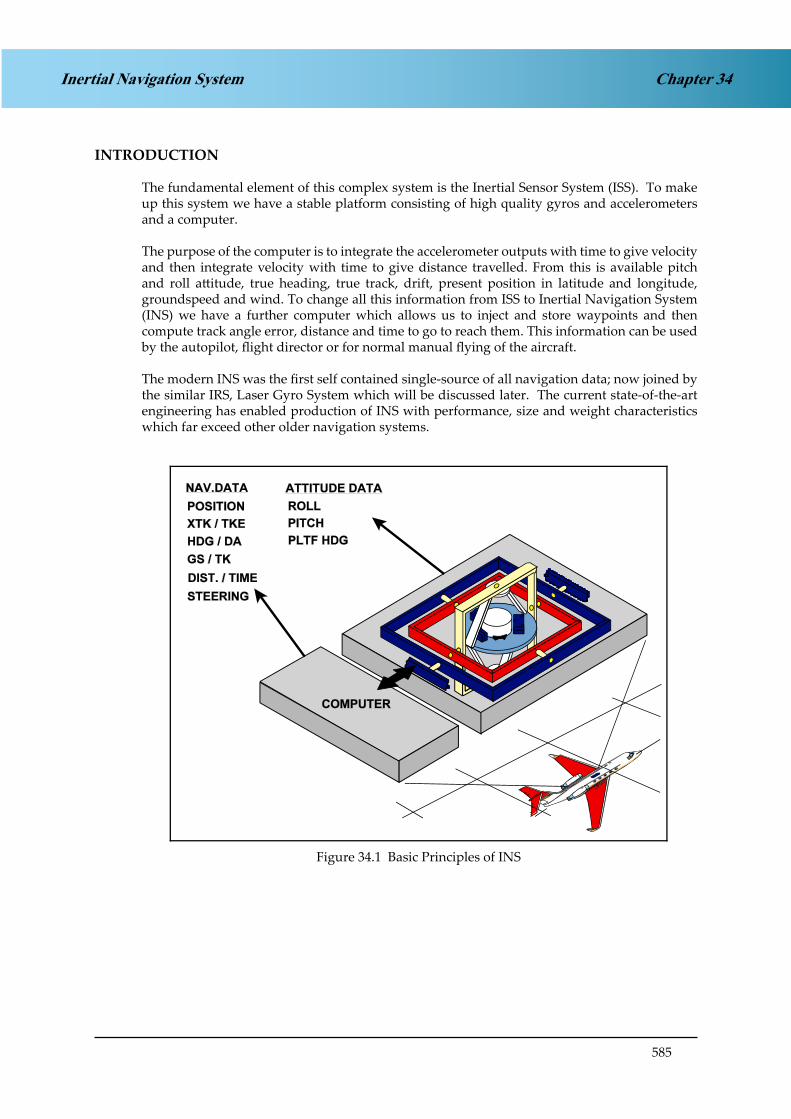
585
Chapter 34Inertial Navigation System
INTRODUCTION
The fundamental element of this complex system is the Inertial Sensor System (ISS). To make up this system we have a stable platform consisting of high quality gyros and accelerometers and a computer.
The purpose of the computer is to integrate the accelerometer outputs with time to give velocity and then integrate velocity with time to give distance travelled. From this is available pitch and roll attitude, true heading, true track, drift, present position in latitude and longitude, groundspeed and wind. To change all this information from ISS to Inertial Navigation System (INS) we have a further computer which allows us to inject and store waypoints and then compute track angle error, distance and time to go to reach them. This information can be used by the autopilot, flight director or for normal manual flying of the aircraft.
The modern INS was the first self contained single-source of all navigation data; now joined by the similar IRS, Laser Gyro System which will be discussed later. The current state-of-the-art engineering has enabled production of INS with performance, size and weight characteristics which far exceed other older navigation systems.
Figure 35.1 Basic Principles of INS.Figure 34.1 Basic Principles of INS

586
Chapter 34 Inertial Navigation System
BASIC PRINCIPLES OF INS
Newton’s laws of motion state:
A body continues in a state of rest, or uniform motion in a straight line, unless it is acted upon by an external force.
The acceleration - rate of change of velocity - of a body is directly proportional to the force acting on the body and is inversely proportional to the mass of the body.
To every action there is an equal and opposite reaction.
Einstein however, in 1905, totally destroyed the premise of absolute motion. The substance of his new theory was that nothing is at rest and that the term at rest meant merely that the object under observation was moving at the same velocity as some other object, its co-ordinate system and the observer.
The primary measuring device in an INS, the accelerometer, demonstrates this theory for it makes no distinction between at rest and any other fixed velocity. It does however, make distinction between truly fixed velocities and those which we may regard as fixed, but are really fixed speeds along curved paths.
ACCELEROMETER AND INTEGRATORS
Two accelerometers are mounted at the heart of the inertial system. These acceleration measuring devices sense any change in the aircraft’s velocity either as an acceleration or deceleration very accurately.
One of the accelerometers m ensures the aircraft‘s acceleration in the North-South direction and the second in the East-West direction.
Figure 35.2 Accelerometer and Integrators.Figure 34.2 Accelerometer and Integrators
The accelerometer is basically a pendulous device. When the aircraft accelerates, the pendulum, due to inertia, swings off the null position. A signal pick off device tells how far the pendulum is off the null position. The signal from this pick off device is sent to an amplifier and current from the amplifier is sent back into a torque motor located in the accelerometer. A torque is generated which will restore the pendulum to the null position. The amount of current that is going into the torquer is a function of the acceleration which the device is experiencing.

587
Chapter 34Inertial Navigation System
The accelerometers would be mounted on a platform, there would be two, one in the North-South direction, the other in the East-West direction (often a third accelerometer is fitted to measure vertical acceleration).
ACCELEROMETERS
Figure 35.3 AccelerometerFigure 34.3 Accelerometer
Figure 35.4 Accelerometers.Figure 34.4 Accelerometers

588
Chapter 34 Inertial Navigation System
The acceleration signal from the amplifier is also sent to an integrator which is a time multiplication device. It starts out with acceleration which is in feet per second squared. In the integrator, it is literally multiplied by time and the result is a velocity in feet per second.
Figure 35.5 Accelerometers and Integrators.Figure 34.5 Accelerometers and Integrators
It is then sent through a second integrator, and again, it’s just a time multiplier. With an input of feet per second which is multiplied by time, the result is a distance in feet or nautical miles.
Figure 35.6 Accelerometers and Integrators.Figure 34.6 Accelerometers and Integrators

589
Chapter 34Inertial Navigation System
The accelerometers would be mounted on a platform, there would be two, one in the North-South direction, the other in the East-West direction (often a third accelerometer is fitted to measure vertical acceleration).
Figure 35.7Figure 34.7
The computer associated with the inertial system knows the latitude and longitude of the take-off point and calculates that the aircraft has travelled so far in the North direction and so far in an East direction. The computer can then compute the new position of the aircraft and give a digital read out which we should note is to tenths of a degree.
In like manner using stored velocity, and present positions the system is able to calculate additional navigation data and display it as requested by the operator. The information is chosen for display through the rotary switch at the bottom left of the control unit: the information that may be obtained will be described in full later.
Figure 34.8 POS (Present Position)Figure 35.8 POS (Present Position).

590
Chapter 34 Inertial Navigation System
GRAVITY EFFECTS ON ACCELEROMETER
Normally the accelerometer is part of the gyro stabilised platform, but if it was hard mounted to the aircraft it could suffer problems in the pitch and roll planes.
The fact that the device has been tilted makes the pendulum swing away from the null position through the effects of gravity.
If this were to take place it would obviously output an erroneous acceleration signal which would in turn result in an erroneous velocity and distance travelled. Therefore, if we allow this there will be a false acceleration problem caused by the pitch or roll angle. If the accelerometer was kept earth horizontal this would not happen and no error would occur.
Figure 35.9 Gravity Effects on Accelerometer. Figure 34.9 Gravity Effects on Accelerometer

591
Chapter 34Inertial Navigation System
THE INTEGRATING GYROSCOPE
An integrating gyroscope used in INS’s is a one degree of freedom gyro using viscous rather than mechanical (spring) restraint as seen in the more commonly found rate gyroscope
Figure 34.10 shows a simple rate- integrating gyro. It is basically a can within which another can (the inner gimbal) is pivoted about its vertical axis. The outer can (frame) is filled with a viscous fluid which supports the weight of the inner gimbal so reducing bearing torques.
Figure 17.10 Rate-Integrating GyroscopeFigure 34.10 Rate-Integrating Gyroscope

592
Chapter 34 Inertial Navigation System
THE PLATFORM
To keep the accelerometer level, it is mounted on a gimbal assembly, commonly called the platform. The platform is nothing more than a mechanical device which allows the aircraft to go through any attitude change and yet the very inner element of the platform on which the accelerometers are mounted is able to stay earth level. Gyroscopes which are used to stabilise the platform are also mounted on the inner-most element of the platform. They provide inputs to amplifiers and motors which control the gimbals and keep the accelerometers level.
Figure 35.11. The Platform.Figure 34.11 The Platform
The gyro and the accelerometer are mounted on a common gimbal. When this gimbal tips off the level position, the spin axis of the gyro will remain fixed. The case of the gyro, then, is moved off level and the amount that the case is tipped will be detected by the signal pick off in the gyro. That signal is then amplified and sent to a gimbal drive motor which restores the gimbal to the level position again. Since the accelerometer is always kept level, it does not sense a component of gravity and is able to sense only the horizontal accelerations of the aircraft as it travels across the surface of the earth.
In reality, three integrating gyros are mounted on the inertial platform, with their input axis mutually perpendicular. Three gimbal motors drive the platform gimbal rings about the pitch, roll and vertical axes respectively. The gyros sense incipient displacement of the platform and activate the appropriate motors to provide for the relative movement of the gimbal rings, as the aircraft moves about the stable platform.

593
Chapter 34Inertial Navigation System
EARTH ORIENTATION
The previously described gyro stabilised platform would remain fixed in space, but the aircraft is not operating in space. It is operating on an earth which is rotating and an earth which is assumed to be round. In order to keep the accelerometers level with respect to the earth so that they sense acceleration of the aircraft in a horizontal direction only, some compensation must be made for the earth rotating and the earth being assumed to be round.
Figure 35.12 Earth Orientation.Figure 34.12 Earth Orientation
APPARENT WANDER
Corrections must be made to gyroscopically stabilised platforms to allow for apparent wander due to earth rotation and aircraft movement over the earth. The required earth rate compensation is a function of latitude since what is being compensated for is the horizontal component of the earth rate felt by the gyros, and that varies with latitude. At the equator, this value is Zero degs per hour and with travel either further North or South, it increases until it becomes a maximum of +/- 15.04 at the poles.
Transport rate compensation is developed using the velocity signal. The electronics through which it is sent contain a term proportional to the earth’s radius. So, in reality, the transport rate signal torquing the gyro is the velocity of the aircraft divided by the earth’s radius.
Both the earth rate and transport rate compensations are compensated by torquing the gyro. The following diagram should be used to follow the system as explained

594
Chapter 34 Inertial Navigation System
There are a number of compensations generated within the system..
Coriolis and Centrifugal effects must be compensated for within the system. Other compensations are necessary because the earth is not a perfect sphere
Figure 35.13 Figure 34.13
Centrifugal accelerations caused by platform rotation to maintain the local earth vertical.
Coriolis accelerations caused by the aircraft following a curved path in space when flying normal earth referenced flights.
ALIGNMENT OF THE SYSTEM
Figure 35.14 Accelerometers and Integrators. Figure 34.14 Accelerometers and Integrators

595
Chapter 34Inertial Navigation System
The stable element in an INS must be accurately aligned in both azimuth and attitude to allow the accelerometers to measure accelerations along their chosen axes.
Warm up period - the first stage in any alignment sequence is to bring the fluid-filled components to the correct operating temperature. This phase normally takes between 3 to 4 minutes.
Coarse alignment - the platform is roughly leveled and aligned in azimuth, this removes gyro alignment errors and cuts the time to a minimum.
Coarse leveling - pitch and roll driven until they are at 90° to each other. The platform is then roughly levelled using either the aircraft frame as reference, or using the outputs from gravity switches or the horizontal accelerometers.
• Coarse azimuth alignment - is achieved by turning the platform until the heading output agrees with the aircraft’s best known True Heading.
• Coarse alignment level and aligns the platform within 1° - 2° in a few seconds.
Fine leveling - with zero output from the accelerometers fine levelling is achieved. The process takes anything up to 1 to 1½ minutes, levelling the platform to within 6 seconds of arc.
Gyro compassing - the platform can be aligned in azimuth by connecting the gyro normally used to stabilise the platform about an East-West axis, to the azimuth gimbal motor. With the platform correctly aligned in azimuth the East gyro should not be subject to rotation of its input axis due to earth rotation; when the platform is out of alignment the East gyro will detect a component of earth rotation and the resultant output signal can be used to torque the azimuth gyro until the table is aligned.
Accelerometers must be levelled (velocity set to zero).
Platform must be orientated to True north - gyro compassing (position verified).
SCHULER PERIOD
Schuler postulated an earth pendulum with length equal to the radius of the earth, it’s bob at the earth’s centre and point of suspension at the earth’s surface. If the suspension point were accelerated around the earth, the bob would remain vertically below the suspension point because it is at the earth’s centre of gravity.
A platform mounted on the suspension point tangential to the earth’s surface, ie horizontal would therefore remain horizontal irrespective of the acceleration experienced.
The vertical defined by the normal to the platform is therefore unaffected by acceleration. If, for any reason the bob on the earth pendulum became displaced from the earth’s centre, the pendulum would start to oscillate. The oscillation period would be 84.4 minutes.
The INS stable element is maintained normal to the local vertical by feeding back the aircraft’s radial velocity as levelling gyro signals, and in this way the North and East accelerometers are prevented from detecting components of the gravity acceleration.

596
Chapter 34 Inertial Navigation System
63.3 21.1
42.2
84.4
0
Platform
R = Radius Earth
Figure 35.15 The Schuler Period.Figure 34.15 The Schuler Period
The control signals are the V/R and U/R terms for vehicle movement. By mechanising the platform to remain horizontal, an analogue of the earth pendulum of period 84.4 minutes is produced. Should the platform be displaced from the horizontal it would oscillate with a period of 84.4 minutes, which is known as the Schuler Period.
ERRORS OF INS
Errors can be conveniently considered under the following headings:
Bounded errorsUnbounded errors Inherent errors
BOUNDED ERRORS
Errors which build up to a maximum and return to zero within 84.4 minutes Schuler cycle, are termed bounded errors. The main cause of these errors are:
Platform tilt due to initial misalignment Inaccurate measurement of acceleration by accelerometers Integrator errors in the first stage of integration
UNBOUNDED ERRORS
Unbounded errors - are either cumulative track errors or distance errors:
Initial azimuth misalignment of the platform Wander of the azimuth gyro
Errors which give rise to cumulative errors in the recording of distance run:
Wander in the levelling gyros. This causes a Schuler oscillation of the platform but the mean recorded value of distance run is increasingly divergent from the true distance run.
Integrator errors in the second stage of integration.

597
Chapter 34Inertial Navigation System
INHERENT ERRORS
The irregular shape and composition of the earth, the movement of the earth through space and other factors provide further possible sources of error. Such errors vary from system to system depending upon the balance achieved between accuracy on one hand and simplicity of design, reliability, ease of construction and cost of production, on the other.
INS CONTROL AND DISPLAY PANELS
There are many makes and models of INS currently on the market. The “state-of-the-art” trend is towards a single control/display unit with a standard keyboard, but with a single small video screen (rather than the various individual LED windows which are shown in the following illustrations). With the modern video screen presentation, the loading and extraction of information is achieved by selecting a “page number”, with each page (which is displayed on the screen) dealing with associated functions. One major advantage of this type of system is that hundreds or even thousands of waypoints can be “stored” in the machine memory. These waypoints (normally airway reporting points such as VORs and intersections) are automatically loaded from a master disc, which is supplied and regularly updated by specialist agencies.
Because of the high capital investment which was involved in the last generation of INS systems, and because they are proving to be extremely reliable, you are perhaps more likely to encounter the traditional type of control/display units described below. Another good reason for considering this system, rather than the modern one, is that the JAA examination questions are based on the older type of INS.
Figure 35.16 Mode Selector Unit. Figure 34.16 Mode Selector Unit
In any event, please appreciate that the following paragraphs are intended only as a general guide and not as a definitive operating instruction for any particular model of INS.
The traditional INS system employs two panels for control and display. The simpler of the two, the mode selector panel, is shown at Figure 34.16.
The function of the mode selector panel is straightforward:
In the standby mode the power is supplied to all parts of the system. It is normal to insert the start position (the aircraft’s ramp position in lat/long to the nearest tenth of a minute of arc) whilst the equipment is in this mode.
In the alignment mode the platform is levelled and aligned (gyro-compassed), and when these processes are complete and READY NAV illuminated. The equipment can now be switched into the Nav mode, and the aircraft is free to taxi without degrading the accuracy of the INS.

598
Chapter 34 Inertial Navigation System
There may be occasions when full navigation computing is not available but the gyros are serviceable. This could be in the event of a computing malfunction so that earth rate and transport wander corrections cannot be calculated or it could be after an align-ment failure in flight.
However, on many aircraft the gyros are used as primary attitude information as well as for inertial navigation and it may be possible to retain gyro information. This is done by selecting ATT REF on the MSU.
Selecting ATT REF disconnects computing and loses alignment, if this has not already happened anyway. The accelerometers now act as gravity switches, as they do during the levelling phase of alignment and the gyros become gravity-tied in the long term - earth gyros. The system now gives attitude information and a limited form of heading. The gyros are normally very accurate, but there is no correction for earth rate and transport wander and the heading needs to be reset periodically to an independent (usually magnetic) source. In effect, the gyros are acting a super-accurate form of DGI and as an attitude indicator.
Should the aircraft electrical supply to the INS cease for any reason the INS will automatically switch to its own battery pack. For as long as a satisfactory level of power is being supplied by the internal battery, the INS Bat light will be illuminated on the Control and Display Unit. As the power from the battery starts to fail, the Bat warning light on the Mode Selector Unit will illuminate, indicating that the INS is about to fail. If you are half way across the Pacific Ocean at this time, this could spoil your whole day, since of course the INS cannot be re-levelled and/or re-aligned in flight (for this the aircraft must be stationary, and the exact position known).The control/display unit (CDU) is shown at Figure 34.17.
The reader who has completed his or her studies of the radio syllabus will undoubtedly notice the similarity between this CDU and the control/display panel of a similar vintage VLF/Omega receiver. Although the inputs for the two equipments are vastly different, the presentation of navigational information to the pilot is more or less identical in both cases.
Figure 35.17 Control Display Unit (CDU).Figure 34.17 Control Display Unit (CDU)
As already mentioned, these notes are not intended as an operator’s brief, but rather to help you pass an examination. Please appreciate that, although other INS panels may look dissimilar to the one shown at Figure 34.17 the information given by the system will be basically the same.

599
Chapter 34Inertial Navigation System
Using the panel shown at Figure 34.17 lets start at the top left hand corner and look at the function of each of the displays and controls.
The two large windows at the top of the panel (labelled left and right numerical displays) comprise the principal outputs of the system. Glance now at the function selector (bottom left hand corner), we’ll start with the selector in the seven o’clock position (TK/GS) and work anti- clockwise through the functions considering the values shown in the two LED windows as we go.
The waypoint selector switch is thumbed to the appropriate waypoint number (shown in the window to the left of the thumbwheel) when loading the waypoint lat/longs before flight, reloading new waypoints in flight, or checking that waypoints are correctly loaded.
The FROM/TO waypoint display shows the two waypoints between which the INS assumes that it is flying. All digital readouts flight director displays and autopilot commands will be based on this information, and so you can imagine the consequences or either giving the equipment the wrong to/from waypoint numbers or feeding the system with the wrong waypoint lat/long to begin with.
The Track change push button enables the operator to tell the system between which two waypoints the aircraft is required to fly (in the event that the system is not set up to fly sequentially through the loaded waypoints).
The Dim control governs the brightness of the LED displays and the panel lighting.
The Alert annunciator warns the operator that the aircraft is approaching the next waypoint. In AUTO mode the alert light will come on, steady, 2 minutes to run to the waypoint, and will extinguish as the track changes overhead the waypoint. In MANUAL mode the alert light will come on, steady, 2 minutes to run to the waypoint; the light will then flash 30 seconds before the waypoint, and will continue to flash until the track is changed. The annunciator will not illuminate below a set speed (typically either 100 kts or 250 kts).
The Battery annunciator will illuminated when the INS is operating on internal power.
The Warning annunciator illuminates when a system malfunction occurs.
The Auto/Manual/Remote switch determines the level of pilot intervention necessary to fly the aircraft. In the automatic mode the INS will automatically switch from one track to the next as each waypoint is overflown. In the manual mode the operator is required to update the waypoint from/to readout as each waypoint is overflown. The exact function of the remote position will depend on the complexity of the INS computer programme, and is outside the scope of this syllabus but in general terms it allows for simultaneous insertion of waypoints into more than one INS from one CDU.
The Insert pushbutton is used in conjunction with the data input keyboard to enter information into the system.
Finally, the Hold pushbutton is used primarily for updating the INS position when overflying a reliable fix, such as a VOR overhead. The HOLD button is depressed as the fix is overflown the function switch is placed in the POS (position) mode, the exact lat/long of the radio fix (in this case the lat/long of the VOR) is punched into the machine, and the hold button is then released. Appreciate that if this is done, the radial error rate assessment (discussed shortly) will be invalid, unless the position update vector is accounted for.

600
Chapter 34 Inertial Navigation System
SUMMARY INS WARNING LIGHTS
LIGHT INDICATION ACTION REQUIRED
READY NAV (MSU) Green light, indicates alignment complete. Select ‘NAV’
BATT (MSU) Red light, indicates battery power too low for operation. Check power supplies
ALERT (CDU)Amber light, indicates approaching (overflying in a MAN) a waypoint.
None, unless in MAN mode when TK CHG is initiated
BATT (CDU) Amber light, indicates INS operating on back up power. Check power supplies.
WARN (CDU) Flash red light, indicates system malfunction.
Set selector to DSR TK/STS note action code and consult users guide for appropriate action.
LED DISPLAY
Note: All of the following descriptions are based upon a Desired Track between waypoints of 060°.
Track & Groundspeed
The INS derived aircraft track (°T) is shown to the nearest tenth of a degree in the LH window.
The INS derived groundspeed is shown to the nearest knot in the RH window.
The track is 040°T and the groundspeed 502 kts at Figure 34.18.
Figure 34.18 TK / GS (Track and Groundspeed)Figure 35.18 TK / GS (Track andGroundspeed).

601
Chapter 34Inertial Navigation System
Heading & DriftThe INS derived true heading (the angle between the north-south axis of the platform and the aircraft fore and aft axis in a north aligned system) is shown to the nearest tenth of a degree in the LH window.
The INS derived drift angle is shown to the nearest tenth of a degree is shown in the RH window, and is preceded by an L(left / port drift) or an R(right / starboard drift).
The heading is 050°T and the drift 10°. Figure 34.19 HDG / DA (Heading and Drift Angle)
Cross Track Error & Track Keeping ErrorXTK/TKE (Cross track distance and track error angle). The cross track distance (the displacement of the aircraft perpendicularly from the direct great circle track between the two waypoints selected) is shown to the nearest tenth of a nautical mile in the LH window. This figure is preceded by an L or an R to indicate that the aircraft is left or right of the direct track.
Figure 35.20 XTK / TKE (Cross track distance and track error angle).Figure 34.20 XTK / TKE (Cross track distance and track error angle)
The track angle error (the angle between the track which the aircraft would require to make good were it flying along the great circle route between the specified waypoints and the track which it is actually making good) is shown to the nearest tenth of a degree in the RH window. The L or R which precedes this value indicates that the actual track is to the left or right of the required track. In this case, remembering that we desire a track of 0600, we must be “making good” a track of 0400 because we have an indication that we are tracking 200 to the left of our desired track between consecutive waypoints.
In summary the cross track error is 12nm to the Right and the track angle error is 20° to the Left in the situation also shown at Figure 34.20
Figure 35.19. HDG / DA (Heading and DriftAngle).
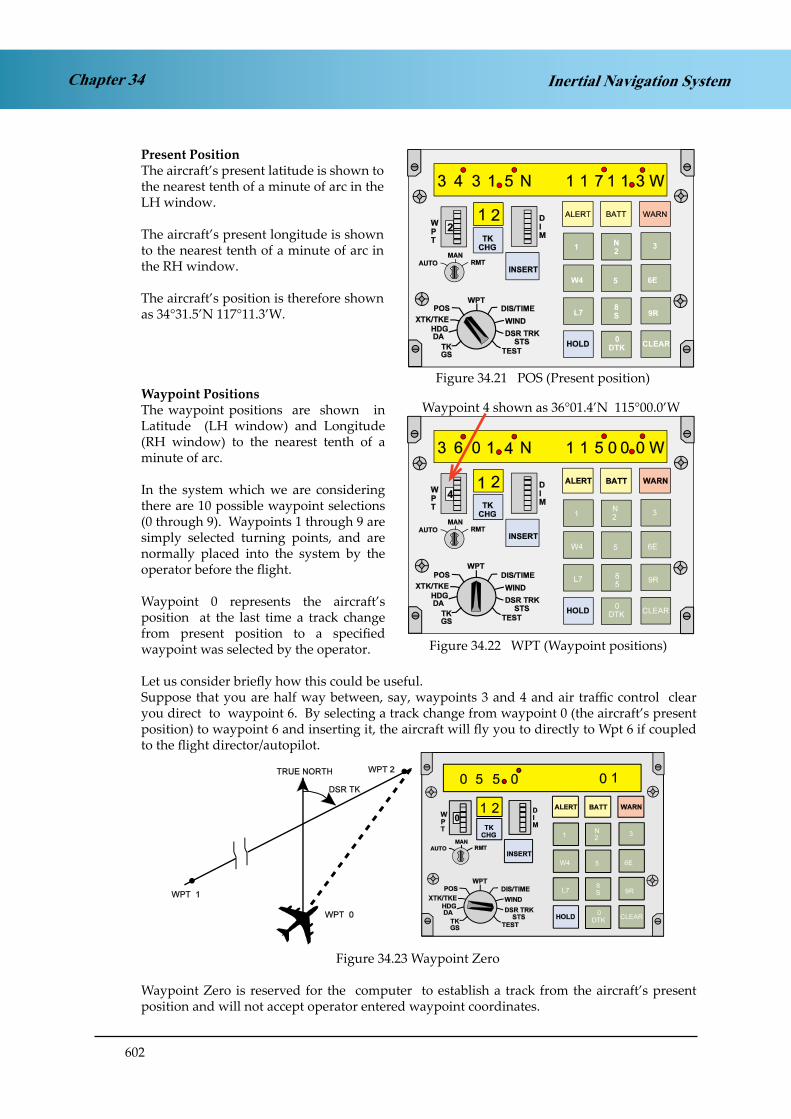
602
Chapter 34 Inertial Navigation System
Present PositionThe aircraft’s present latitude is shown to the nearest tenth of a minute of arc in the LH window.
The aircraft’s present longitude is shown to the nearest tenth of a minute of arc in the RH window.
The aircraft’s position is therefore shown as 34°31.5’N 117°11.3’W.
Figure 34.21 POS (Present position)Waypoint PositionsThe waypoint positions are shown in Latitude (LH window) and Longitude (RH window) to the nearest tenth of a minute of arc.
In the system which we are considering there are 10 possible waypoint selections (0 through 9). Waypoints 1 through 9 are simply selected turning points, and are normally placed into the system by the operator before the flight.
Waypoint 0 represents the aircraft’s position at the last time a track change from present position to a specified waypoint was selected by the operator. Let us consider briefly how this could be useful.Suppose that you are half way between, say, waypoints 3 and 4 and air traffic control clear you direct to waypoint 6. By selecting a track change from waypoint 0 (the aircraft’s present position) to waypoint 6 and inserting it, the aircraft will fly you to directly to Wpt 6 if coupled to the flight director/autopilot.
Figure 35.23 Waypoint ZeroFigure 34.23 Waypoint Zero
Waypoint Zero is reserved for the computer to establish a track from the aircraft’s present position and will not accept operator entered waypoint coordinates.
Figure 35.21. POS (Present position).
Figure 35.22 WPT (Waypoint positions).Figure 34.22 WPT (Waypoint positions)
Waypoint 4 shown as 36°01.4’N 115°00.0’W

603
Chapter 34Inertial Navigation System
Distance and TimeThe distance to go from the aircraft’s present position direct to the next selected waypoint is shown to the nearest nautical mile in the LH window.
The lapsed time from the aircraft’s present position to the next waypoint is shown to the nearest tenth of a minute in the RH window.
The distance to go here is shown as 140nm and the time as 16.7 minutes.
Figure 34.24 DIS / TIME
Wind Speed and DirectionThe INS derived wind direction (°T) is shown to the nearest degree in the LH window.
INS derived wind speed is shown to the nearest knot in the RH window.
The W/V is shown as 155°(T)/85 kt.
Figure 34.25 WIND (Wind velocity)
Desired Track and StatusThe desired track (assuming that the aircraft is on the direct great circle track between the two selected waypoints) is shown in degrees true to the nearest tenth of a degree in the LH window.
Figure 35.26 DSR TK / STS (Desired track and status). Figure 34.26 DSR TK / STS (Desired track and status)
The RH window will normally be blank, since the status check is generally only available with the equipment in the alignment mode.
Figure 35.24 DIS / TIME (Distance andtime to the next waypoint).
Figure 35.25 WIND (Wind velocity).

604
Chapter 34 Inertial Navigation System
The desired track is 060.0°(T) which allows us to see the relationship between the aircraft’s current position and track and the direct track between the two selected waypoints. You may by now have reached the conclusion that the programme upon which the INS computer operates assumes that the INS will normally operate coupled to the flight director / autopilot, so that across track errors do not occur.
TestThe diagram at Figure 34.27 shows the function switch in the test position resulting in all of the digits on the various displays being illuminated either showing a figure or letters. This enables the operator to check that all of the functions are operating.
Figure 34.27 TEST (Light emitting diode test)
MANUAL AND AUTOMATIC SYSTEM CHECKS
At the initial setting up stage the start position must be fed into the INS computer with a high degree of accuracy. If the initial latitude is slightly in error the platform will not remain Earth horizontal once the equipment is switched into the navigation mode, since the torque motors will be tilting the platform at an inappropriate rate, due to computer calculations based on incorrect latitude. Likewise, and for the same reasons, the platform will not remain directionally aligned with respect to north.
If the initial latitude setting is grossly in error the system will detect the error and warn the operator (this is one of the principal functions of the warning annunciator on the CDU whilst the equipment is in the align mode). The equipment is able to sense a gross latitude input error since the apparent drift and topple rates sensed by the rate gyros will not correspond to the corrections being applied by the torque motors.
An incorrect operator input of longitude will not affect the stability of the platform, but obviously the track and distance from the departure point to the first waypoint will be incorrectly computed. Furthermore, all subsequent indications of longitude will be in error by the amount of the initial input error.
An incorrect input of the lat / long of any of the waypoints will have serious consequences. The INS will navigate very accurately between waypoints, but it is incapable of detecting operator malfunctions (finger trouble)! In order to check that the waypoints have been correctly inserted they should be recalled from store onto the LED display, and rechecked before flight.
A second check is to call up the initial great circle track(TK / GS) and distances(DIS / TIME) between consecutive waypoints, and to compare these values against those shown on the flight log/flight progress log/flight plan.
Figure 35.27 TEST (Light emmitting diodetest)

605
Chapter 34Inertial Navigation System
QUESTIONS
1. INS errors are classified as “Bounded errors” and “Unbounded errors”.
a. An “Unbounded error” is an error that increases with time, an example being the distance gone error due to a ground speed error.
b. An “Unbounded error” is an error that increases with time, an example being an increasing ground speed error due to the platform not being levelled correctly.
c. A “Bounded error” is an error that is subject to sudden unpredictable random changes. Most notable during pitching manoeuvres and when raising or lowering flap and U/C.
d. A “Bounded error” is an error that is “tied” to the real wander rates of the gyros on the platform.
2. Two checks that can be carried out to check that two selected sequential waypoints have been entered correctly are:
a. select DSR.TK/STS and check that the status is less than 4; select DIS/TIME and check that the time agrees with the flight plan time.
b. select DIS/TIME and check that the distance agrees with the distance on the flight plan; then check that the time agrees with the flight plan time for the leg.
c. select DIS/TIME and check that the distance agrees with the distance on the flight plan; select DSR.TK/STS and check that the track agrees with the flight plan track for the leg.
d. select DIS/TIME and check that the distance agrees with the distance on the flight plan; select HDG/DA and check that the heading agrees with the flight plan heading for the leg.
3. In an INS the E/W accelerations are converted into an E/W speed (kt) at the first stage of integration and into E/W distance gone (nm) at the second stage of integration. This gives:
a. departure which is multiplied by Cosine of the present latitude of obtain d’long (min) which is used to automatically up-date the present longitude.
b. d’long (min) which is used to automatically up-date the present longitude.c. departure which is multiplied by Secant of the present latitude to obtain d’long (min)
which is used to automatically up-date the present longitude.d. departure which is multiplied by Sine of the present latitude to obtain d’long (min)
which is used to automatically up-date the present longitude.
4. At the second stage of integration E/W speed is converted into E/W distance gone. To convert this departure into change of longitude is has to:
a. be divided by Secant of the latitude.b. be multiplied by Secant of the latitude. c. be divided by Tangent of the latitude. d. be multiplied by Cosine of the latitude.

606
Inertial Navigation SystemChapter 34
5. The amber ALERT light on an INS control and display unit:
a. illuminates steadily 2 minutes, in AUTO mode, before reaching the next waypoint.b. start flashing 2 minutes before reaching the next waypoint and goes out at 30 seconds
to run.c. illuminates if power from the aircraft bus bar has been lost and the system is operating
on standby battery.d. illuminates steadily after passing a waypoint in manual mode, until the next leg is
programmed in.
6. With reference to Inertial Navigation Systems, the functions of the integrators are:
i) at the second stage of integration to suppress unbounded errors (when in the NAV mode).
ii) at the first stage of integration to convert acceleration, with respect to time, into speed, (when in NAV mode).
iii) at the second stage of integration to convert speed, with respect to time, into distance gone, (when in the NAV mode).
iv) to align the platform (when in the level and align modes).
a. all the above statements are true.b. only (ii), (iii) and (iv) of the above statements are true. c. only (i), (ii) and (iii) of the above statements are true. d. only (ii) and (iii) of the above statements are true.
7. The computer of a north referenced Inertial Navigation System (INS) in flight, provides compensation for:
a. aircraft manoeuvres, real wander, apparent wander, transport wander. b. coriolis, real wander, apparent wander, transport wander.c. earth rotation, transport wander, coriolis.d. transport wander, apparent wander, coriolis, magnetic variation.
The diagram below shows the situation after an aircraft, equipped with INS, has passed over waypoint 2 and is tracking along the line TK (dashed).
Using the information given in the diagram and the fact that with DA/HDG selected on the control and display unit (CDU) of the INS, the display shows 6L/080, answer the following two questions:
8. When DSRTK/STS is selected on the CDU, the left window will show:
a. 074 b. 086 c. 068 d. 080

607
Chapter 34Inertial Navigation System
9. When XTK/TKE is selected on the CDU, the display will show (to the nearest whole number):
LEFT DISPLAY RIGHT DISPLAY
a. 5L 6R b. 5R 6R c. 5L 6L d. 6R 5L
10. During initialisation of an INS the aircraft must not be moved until:
a. The ramp position has been inserted and checked. b. The platform is levelled.c. The gyros and accelerometers are in the “null” position.d. The green “ready NAV” light has been illuminated and the mode selector switch has
been set to the “NAV” position
608
Inertial Navigation SystemChapter 34
ANSWERS
1 A
2 C
3 C
4 B
5 A
6 D
7 C
8 C
9 B
10 D

609
Chapter 35Inertial Reference System
CHAPTER THIRTY FIVE
INERTIAL REFERENCE SYSTEM
Contents
INERTIAL REFERENCE SYSTEM . . . . . . . . . . . . . . . . . . . . . . . . . . . . . .611
INERTIAL NAVIGATION. . . . . . . . . . . . . . . . . . . . . . . . . . . . . . . . . . .611
INERTIAL REFERENCE UNIT . . . . . . . . . . . . . . . . . . . . . . . . . . . . . . . .612
INERTIAL INFORMATION . . . . . . . . . . . . . . . . . . . . . . . . . . . . . . . . .612
THE PRIMARY SOURCES OF INFORMATION . . . . . . . . . . . . . . . . . . . . . .612
THE LASER GYRO. . . . . . . . . . . . . . . . . . . . . . . . . . . . . . . . . . . . . . .613
PRINCIPLES OF LASER GYROS AND IRS . . . . . . . . . . . . . . . . . . . . . . . . .613
CONSTRUCTION AND OPERATION . . . . . . . . . . . . . . . . . . . . . . . . . . .613
LIMITATIONS AND ACCURACY . . . . . . . . . . . . . . . . . . . . . . . . . . . . . .614
PLATFORM / STRAP DOWN PRINCIPLES . . . . . . . . . . . . . . . . . . . . . . . .615
PLATFORM ALIGNMENT . . . . . . . . . . . . . . . . . . . . . . . . . . . . . . . . . .615
ADVANTAGES . . . . . . . . . . . . . . . . . . . . . . . . . . . . . . . . . . . . . . . . .616
QUESTION . . . . . . . . . . . . . . . . . . . . . . . . . . . . . . . . . . . . . . . . . . .616

610
Chapter 35 Inertial Reference System
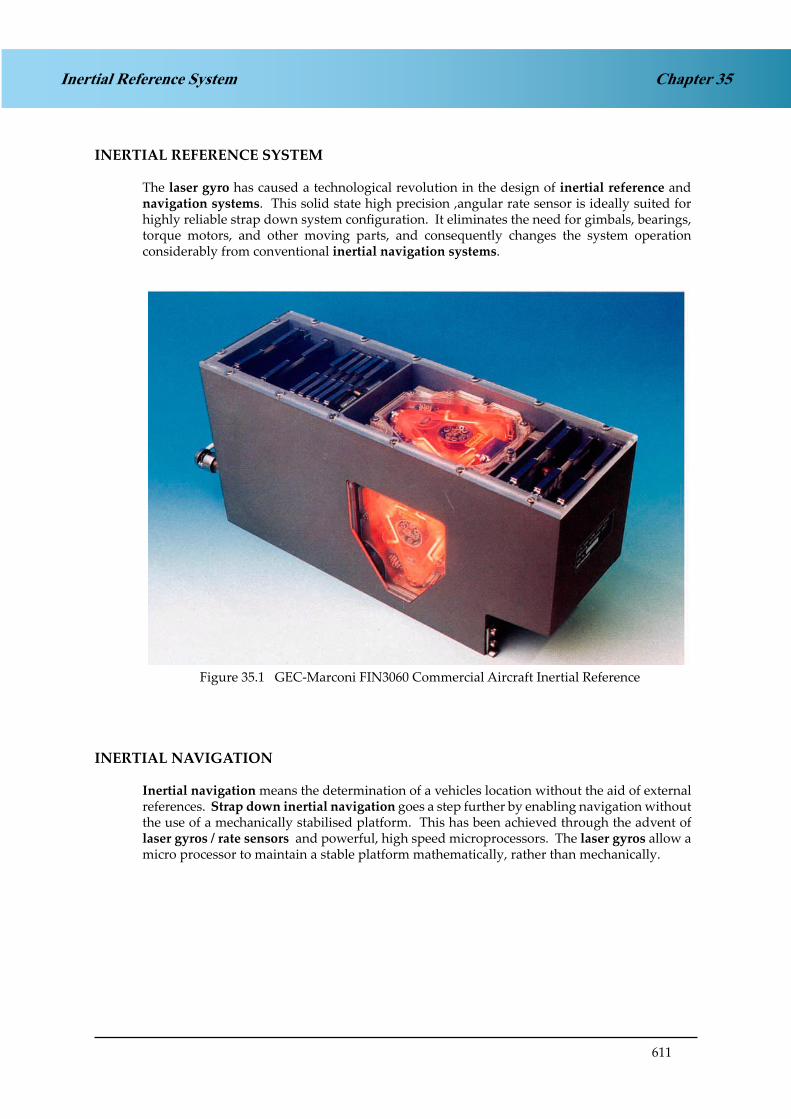
611
Chapter 35Inertial Reference System
INERTIAL REFERENCE SYSTEM
The laser gyro has caused a technological revolution in the design of inertial reference and navigation systems. This solid state high precision ,angular rate sensor is ideally suited for highly reliable strap down system configuration. It eliminates the need for gimbals, bearings, torque motors, and other moving parts, and consequently changes the system operation considerably from conventional inertial navigation systems.
Figure 35.1 GEC-Marconi FIN3060 Commercial Aircraft Inertial Reference
INERTIAL NAVIGATION
Inertial navigation means the determination of a vehicles location without the aid of external references. Strap down inertial navigation goes a step further by enabling navigation without the use of a mechanically stabilised platform. This has been achieved through the advent of laser gyros / rate sensors and powerful, high speed microprocessors. The laser gyros allow a micro processor to maintain a stable platform mathematically, rather than mechanically.

612
Chapter 35 Inertial Reference System
INERTIAL REFERENCE UNIT
The Inertial Reference Unit ( IRU ) is the heart of the Inertial Reference System (IRS). It provides all required inertial reference outputs for the aircraft’s avionics.
Outputs are:Primary attitude Pitch and rollHeading True, MagneticAccelerations Lateral, Longitude, Normal Angular rates Pitch, Roll, Yaw
Inertial velocity N/S, E/W, GS, TA, Vertical rate Position Latitude, longitude, inertial altitude Wind data Wind speed, wind angle, drift angle Calculated data Flight path angle and acceleration
Along and across track accelerationInertial pitch and roll rate Vertical acceleration Potential vertical speed.
INERTIAL INFORMATION
Inertial information is used by:
Flight management computer Flight control computer Thrust management computer Stability augmentation system Weather radar Anti skid auto brake systems Attitude direction indicator Horizontal situation indicator Vertical speed indicator Radio direction magnetic indicator Flight data recorder
THE PRIMARY SOURCES OF INFORMATION
The primary sources of information for the IRU are its own internal sensors three laser gyros, and three inertial accelerometers. The only other inputs required are initial position, barometric altitude, and True Air Speed (TAS).
Initial position is required because present position is calculated from the distance and direction travelled from the initial start position entered.
Barometric altitude stabilises the vertical navigation, and thereby stabilises the vertical velocity and inertial altitude outputs.
The TAS input allows the IRU to calculate wind speed and wind direction.

613
Chapter 35Inertial Reference System
THE LASER GYRO
The laser gyro is an example of the application that uses the characteristics of light to measure motion. This device operates based on the SAGNAC effect. One beam rotates in one direction and the other beam in the opposite direction. One of the conditions that must be satisfied to maintain lasing is that the number of wavelengths in the beams path length must equal a whole number. When the wavelengths change there is a concurrent change in the lights frequency. This means that in a rotating gyro, one laser beam will exhibit an increase in frequency, whereas the other beam will exhibit a frequency decrease. The frequency difference between the two beams is easily and accurately measured along optical paths.
PRINCIPLES OF LASER GYROS AND IRS
Laser (Light Amplification and Stimulated Emission of Radiation) gyros measure rotation by comparing two laser beams created and directed to rotate in opposite directions within a very narrow tunnel. Photons are emitted within the laser cavity in all directions but only the light that radiates backwards and forwards between the mirrors is reinforced by repeated trips through the gain medium: continued passage amplification soon reaches saturation and a steady state oscillation ensues, a laser beam.
CONSTRUCTION AND OPERATION
Construction. The laser gyro contains three mirrors to achieve a rotational path for two beams that are generated and sent around in a triangular path in opposite directions. The lasers are sent around small tunnels drilled parallel to the perimeter of a triangular block of temperature stable glass with reflecting mirrors placed in each corner.
Lasing is achieved by running high voltages through helium neon gas between the anodes and the cathode transforming many of the atoms of the gas into light in the pinkish orange part of the visible spectrum (this action is helped by the tuned cavity effect of the tunnel in the glass block).
Operation. The laser beam that is created can be described as a high energy beam of coherent light which is said to be of a pure frequency. The light will be reflected by the mirrors but light of unwanted frequencies ( i.e. not at the design frequency) will be absorbed by the mirrors and their coatings. Because the frequency of the light is known it can be measured and modified by adjustment of the path length i.e. “If the path length is decreased, the light is compressed and the frequency will increase - if the path length is expanded the frequency decreases”.

614
Chapter 35 Inertial Reference System
Figure 36.2Figure 35.2
The triangular path of the device does not rotate but the two beams of light are caused to travel in opposite directions and will of course travel at the same speed - the speed of light.If there is no movement of the device the beams cancel each other out but when movement is induced one of the beams will take longer to complete its path and the other, in opposition, a measurably shorter length of time to complete its journey. This whole process is measured by devices known as gain elements and the rate of rotation can be calculated.
The three mirrors involved are not identical - one makes micro adjustments to keep the physical light path accurately aligned and another is partially transparent to allow the laser light to be detected on the photo cell detectors.
Included with the second mirror is a prism which flips / redirects the light beam around causing it to meet and interfere with the light beam that is aimed directly at the photo cell. The beams alternately cancel and reinforce each other ( known as interference ) thus generating a fringe pattern.
The photo electric cell detects the direction and speed at which the fringe pattern moves. The change in the pattern , moving in one direction or other depends upon which way the laser gyro is being rotated. The faster the rotation the faster the fringe pattern moves across the photo electric cell - this is then converted to signals used within the aircraft systems.
LIMITATIONS AND ACCURACY
Drift. The principle source of error with this form of device , as with the conventional gyro stabilised platform INS device, is associated with random drift. In a conventional gyro this is caused by imperfections of gyro bearings and mass imbalances but with the laser system noise is the cause and this is derived almost entirely from imperfections in the mirrors and their coatings.

615
Chapter 35Inertial Reference System
Accuracy. The accuracy of the laser system is directly influenced by the length of its optical path - the longer the path available the greater the accuracy with a small percentage increase in length leading to a substantial increase in accuracy.
Lock in. The most significant potential problem is lock in, also known as laser lock, which occurs at very low rotation rates.
At very low rotation rates the output frequency can drop to zero as a result of back scattering between the two beams which causes the beams to synchronise, that is, no longer indicate the rotation correctly and indeed introduce undesirable errors. This phenomena is overcome by the introduction of a vibration device known as a piezo electric dither motor which breaks the lock in. The motor is mounted in such a way that it vibrates the laser ring about its input axis through the lock in region, thereby unlocking the beams and enabling the optical sensor to detect the smaller movement of the fringe pattern. The motions caused by the dither motor are decoupled from the output of the ring laser gyro / rate sensor.
PLATFORM / STRAP DOWN PRINCIPLES
Platform. The INS (platform set in gimbals) requires three rate integrating gyros and acccelerometers to achieve an output that we can use and this process is started by ensuring that the platform is horizontal at the correct Latitude. IRS ( strap down) attaches the three laser gyro / rate sensors and accelerometers directly to the aircraft chassis.
High speed micro processors then achieve a stable platform mathematically rather than mechanically ( as per the INS) - this results in greatly improved accuracy and reliability.Integration. Integration principles are used as per the older INS system.
Gravity. Gravity - the microprocessor subtracts the effect of local gravity from any vertical acceleration to compensate for local effects.
Earth rotation. Earth Rotation Rate - compensated for at the rate of 15.04 degrees as with a gyro (INS) system.
Transport compensation. Transport Rate - Schuler Tuning is again required to compensate for oscillation errors as the system is transported over the Earth (this in relation to pendulum theory which results in an 84.4 minute error cycle as described in the older INS.
Calibration. Automatic Calibration - completed automatically by computer to enhance the overall accuracy of the system.
PLATFORM ALIGNMENT
True North. The system, as with the INS, requires to find true north to achieve an alignment and this is achieved when the aircraft is stationary on the ground and the only rate of change is that associated with the movement of the Earth. True North is then found.
Latitude. Initial Latitude must be put into the system by the operator, the computer then, after assessing the rotational vectors that it is experiencing compares the Latitude it finds with that entered by the operator during initialization. However, it should be noted that with this system the inbuilt memory function remembers its position at landing and will indicate to the crew any errors of initial position input (lat’or long’) upon startup.

616
Inertial Reference SystemChapter 35
Alignment. The computer, after confirming the Latitude, completes a full mathematical levelling process - initial Latitude and Longitude must be entered manually as a present position to assist this align - THE AIRCRAFT MUST NOT BE MOVED DURING THIS PROCESS.
ADVANTAGES
Activation. Almost no spin up time, one second activation for the rate sensor.
Manoeuvring. Insensitive to “G” attitude, rolling, pitching manoeuvres.
Construction. Mechanically simple and highly reliable.
Range. Wide dynamic range.
Drift. Very small drift rates - greatest errors induced by the operator.
QUESTION
Dither is used in a laser gyro in order to:
a. Enhance the accuracy of the gyro at all rotational rates.b. Increase the maximum rotational rate that can be sensed by the gyro.c. Stabilise the laser frequencies at peak power output.d. Break the frequency lock which would prevent small rotational rates from being sensed
by the gyro.
Correct answer D.

617
Chapter 36Flight Management System
CHAPTER THIRTY SIX
FLIGHT MANAGEMENT SYSTEM
Contents
PRINCIPLE OF OPERATION. . . . . . . . . . . . . . . . . . . . . . . . . . . . . . . . .619
CONTROL AND DISPLAY UNIT (CDU) . . . . . . . . . . . . . . . . . . . . . . . . . .619
DATA BASE. . . . . . . . . . . . . . . . . . . . . . . . . . . . . . . . . . . . . . . . . . .620
OPERATIONAL PROCEDURES - INITIAL ACTIONS . . . . . . . . . . . . . . . . . .621
SUMMARY . . . . . . . . . . . . . . . . . . . . . . . . . . . . . . . . . . . . . . . . . . .622
OPERATIONAL PROCEDURES - CLIMB VERTICAL NAVIGATION (VNAV) . . . .622
OPERATIONAL PROCEDURES - CRUISE LATERAL NAVIGATION (LNAV) . . . .623
OPERATIONAL PROCEDURES - DESCENT . . . . . . . . . . . . . . . . . . . . . . .623
OPERATIONAL PROCEDURES - ACCURACY . . . . . . . . . . . . . . . . . . . . . .623
OPERATIONAL PROCEDURES - CONTROL AND DISPLAY UNIT . . . . . . . . . .624

618
Chapter 36 Flight Management System

619
Chapter 36Flight Management System
PRINCIPLE OF OPERATION
Flight management systems are designed to improve navigation, aid fuel efficiency and to reduce crew workload. Computers are used to fly aircraft along complex routes using Lateral Guidance (LNAV).
Vertical Guidance (VNAV) enables the system to calculate optimum cruise altitudes and to determine the best combination of auto-throttle control and speed during climb and descent.
At all times when the crew are not actually controlling the aircraft by hand, they use the FMS controls to “fly” the aircraft. The controls of a FMS are, in effect, a miniature flight deck with fingertip control.
DME 1VOR 1
CDU
FGS
ENGFUEL
FMC
DATA BASE
ADC 1
FMC
CDU
FGS
DME 2VOR 2
ENGFUEL
GPS 1 IRS 1 LORAN C 1
ADC 2
GPS 2 IRS 2
ADC 1 ADC 1ADC 2ADC 2
LORAN C 2
DATA BASE
Figure 36.1. Schematic layout of a typical system.
Legend:
CDU - Control and Display UnitFGS - Flight Guidance SystemFMC - Flight Management ComputerADC - Air Data ComputerIRS - Inertial Reference SystemGPS - Global Positioning System
CONTROL AND DISPLAY UNIT (CDU)
The primary function of the CDU is to act as the interface between the aircraft and the crew. The CDU can be used to command completely automatic control of the aircraft or semi-automatic with varying degrees of pilot involvement including full manual control.
Two CDUs are usually fitted either side of the centre console with the left CDU normally being the master(in the B747-400 they are joined by a third CDU placed upon the centre console for use primarily by engineering staff). They comprise of a monochrome or coloured cathode ray tube (CRT) display on which different “pages” of selected data can be shown, and a selector key panel. Figure 36.2. shows a typical CDU.

620
Chapter 36 Flight Management System
Figure 37.2Figure 36.2
The FMCs may be decoupled to provide fully Independant Mode operation. This is not usual in that therewill be no safety/cross check between the two FMCs.
When operating in Dual Mode (the norm for ordinary flight profiles) both FMCs independently process pilot entries on both MCDUs and compare the results to ensure that crucial information is consistent on both systems. The same output is then passed to both FMCs.
If there is a failure of an FMC the second system can be expected to operate the aircraft successfully on its own - this is known as Single Mode. The failed FMC may be selected out of the system to allow single mode operation of the “surviving” FMC if required by the crew.
DATA BASE
The information stored in the FMC is called its data base. The data base is divided into two major sections. One contains performance related information and the other contains information dealing with navigation.

621
Chapter 36Flight Management System
The purpose of the performance data base is to reduce the need for the flight crew to refer to the Cruise Control Manual during flight and to provide the FMC with information required to calculate pitch and thrust commands. All reference data normally required can be displayed on the FMS-CDU. The data stored in the data base includes aircraft drag and engine characteristics, maximum and minimum speeds. Maintenance can refine the data base for each aircraft by entering factors for drag and fuel flow.
The FMC navigation data base includes most information that would normally be determined by referring to navigation charts. This information may be displayed on the FMS-CDU / AMD and eliminates most of the cockpit chart reading in aircraft without an FMC. The geographic area covered includes all areas where the aircraft is normally flown. The stored information includes the location of navigation aids, airports, runways and other airline selected information such as SIDs, STARs, approaches and company routes.
The FMC contains two sets of navigation data, each valid for 28 days. Each set corresponds to the normal revision cycle for navigation charts. During preflight the flight crew can select which set is active. The FMC uses the active set for navigation calculations. The contents of the navigation data base are updated by maintenance every 28 days. When the navigation chart revision date arrives, the new data is already in the FMC and ready for selection.
OPERATIONAL PROCEDURES - INITIAL ACTIONS
IDENT Page: Upon application of power to the aircraft the FMS immediately executes a self- test procedure and upon its successful self completion the IDENT page of the system is displayed. The IDENT page of the FMC allows the crew to confirm aircraft details on start-up and this in turn initiates a series of prompts to direct the crew through the route procedures that need to be generated for their flight. Importantly on this page we have confirmation of the Navigation Data Base in operation and an indication of the date of changeover to the next programme - if the data base is out of date it will tell us to change to the in date programme.
POS INIT Page: When we have checked the IDENT page we will be directed to the POS INIT page where we must check the FMS clock time against the aircraft clock to ensure synchronisation between the systems: data is saved on the FDR against time and of course ETAs are generated by the FMC and need to be in line with times indicated by the aircraft clock. As we complete this task we must also ensure that the airfield datum or gate position, if available, is entered accurately to allow for IRS alignment (this position will be suitable for alignment but is often updated at the take-off point to obtain the best possible initial position for use in flight).
RTE Page: After completing our tasks upon the POS INIT page we will be directed to the RTE page where we will enter our starting and destination airport ICAO Designators. We may then expect to enter our flight number details and identify a “standard” company route to take us to our destination: if a standard route is not available other actions will have to be taken to input the information into the system.
PERF INIT Page: We may now move on to the PERF INIT page to update the aircraft to its current performance / weight configuration for the route to be flown. On this page we may input details of fuel weight, fuel reserves required, cruise altitude and even, in the case of the B747, if we are carrying a fifth engine to our destination upon its suspension point on the wing. At this stage we may also enter Cost Index requirements related to our flight as discussed later in the chapter.

622
Chapter 36 Flight Management System
SUMMARY
The following is a summary of the initial pages that you may expect to see on the Boeing series of aircraft currently in use but of course this information may vary from company to company as they modify the system for their own use:
IDENT page -
Aeroplane Model / Configuration Operational Programme Identifier Drag / Fuel Flow Factors Navigation Data Base identifier / cycle
POS INIT page -
IRS Position Reference IRS Heading Reference GMT / UTC / Time Zone Display
RTE page -
Origin Airport Destination Airport Flight Number Route Activation
PERF INIT page -
Gross Weight Fuel Quantity Zero Fuel Weight Fuel reserves Cost Index Cruise altitude Spare (fifth) engine carriage (B747 specific) Altitude Step Size
OPERATIONAL PROCEDURES - CLIMB VERTICAL NAVIGATION (VNAV)
Entering a cost index of “ZERO” provides economy speeds representing a maximum range cruise. The VNAV profile that the FMC commands is a climb with climb thrust to remain within all airspeed and altitude constraints that are part of the SID entered into the active route, then climb at economy speed to the entered cruise altitude.If when flying the climb speed profile it would cause a violation of an altitude constraint the UNABLE NEXT ALT message is displayed. The pilot must then select a different speed on the FMS-CDU that provides a steeper climb angle. Reaching cruise altitude, the FMC commands cruise at economy speed until the top of descent point.
A number of Cost index modifications are allowed until passing Top of Descent point (TOD)for example Long Range Cruise (LRC) and “selected speed” cruise may also be entered.

623
Chapter 36Flight Management System
Notes: Time Related Cost is a function of speed selected, the higher the speed in climb, cruise or descent the higher the “trip fuel cost” but the lower the “trip time cost”.Economy Cruise Mode will yield the lowest operating cost based on the cost index.
Cost Index is determined by dividing aeroplane operating cost ($ / £ per hour) by fuel cost ($ / £ per pound or litre). A cost index of Zero results in “minimum trip fuel operation” and so will include cruise at “maximum range” cruise and a low speed descent.
OPERATIONAL PROCEDURES - CRUISE LATERAL NAVIGATION (LNAV)
LNAV guidance outputs from the FMC are normally great circle tracks between the waypoints making up the active route. However, when a procedure stored in the FMS data base is entered into the active route the FMC can supply commands to fly a constant heading, track or follow a DME arc, as required to comply with the procedure.
FMC determines present position by using inputs from the IRS / INS, DME, VOR and other navigation systems fitted. It uses its calculated present position to generate lateral steering commands along the active leg to the active waypoint. To function, the FMC requires position information from at least one IRS / INS. While the aircraft is on the ground, the FMC calculates present position based only on information received from the IRS / INSs.
The FMC present position is normally the combination of all IRS / INS positions and since inertial systems accumulate position errors as a function of time, the position information being used by the FMC is slowly accumulating errors. These position errors can be detected by observing the various positions of the individual IRS / INS s on the CDU. If an extended ground delay occurs and a significant map error is noticed, the IRS / INS should be realigned and present position re-entered.
OPERATIONAL PROCEDURES - DESCENT
When a programmed “arrival” is entered, the FMC calculates a descent path based on the procedure’s airspeed and altitude constraints and the End of Descent (E/D). The E/D is a waypoint with an altitude and airspeed constraint that coincides with a final approach fix or runway threshold.
For VFR and non-precision approaches, the FMC computed path is built to a point that is 50 feet over the approach end of the runway. It is the flight crews’ responsibility to not descend below “DH” until adequate visual contact has been achieved. During a missed approach, LNAV guidance is available to the missed approach point and altitude.
OPERATIONAL PROCEDURES - ACCURACY
Radial error rates of less than 0.05 nm/hour are not uncommon. Introduction of Ground Positioning by Satellite(GPS) as a navigation input will improve overall performance. It must be stressed however that the skill of the operator and the need for constant and careful monitoring will always be a deciding factor.
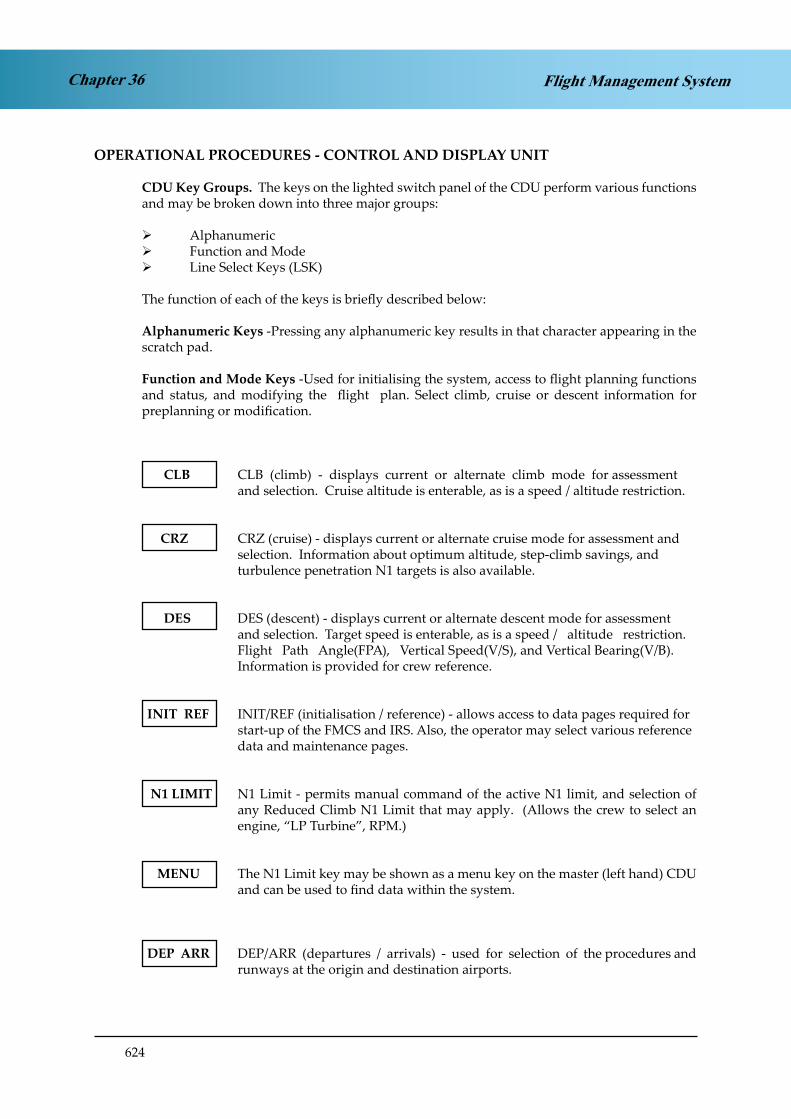
624
Chapter 36 Flight Management System
OPERATIONAL PROCEDURES - CONTROL AND DISPLAY UNIT
CDU Key Groups. The keys on the lighted switch panel of the CDU perform various functions and may be broken down into three major groups:
Alphanumeric Function and Mode Line Select Keys (LSK)
The function of each of the keys is briefly described below:
Alphanumeric Keys -Pressing any alphanumeric key results in that character appearing in the scratch pad.
Function and Mode Keys -Used for initialising the system, access to flight planning functions and status, and modifying the flight plan. Select climb, cruise or descent information for preplanning or modification.
CLB CLB (climb) - displays current or alternate climb mode for assessment and selection. Cruise altitude is enterable, as is a speed / altitude restriction.
CRZ CRZ (cruise) - displays current or alternate cruise mode for assessment and selection. Information about optimum altitude, step-climb savings, and turbulence penetration N1 targets is also available.
DES DES (descent) - displays current or alternate descent mode for assessment and selection. Target speed is enterable, as is a speed / altitude restriction. Flight Path Angle(FPA), Vertical Speed(V/S), and Vertical Bearing(V/B). Information is provided for crew reference.
INIT REF INIT/REF (initialisation / reference) - allows access to data pages required for start-up of the FMCS and IRS. Also, the operator may select various reference data and maintenance pages.
N1 LIMIT N1 Limit - permits manual command of the active N1 limit, and selection of any Reduced Climb N1 Limit that may apply. (Allows the crew to select an engine, “LP Turbine”, RPM.)
MENU The N1 Limit key may be shown as a menu key on the master (left hand) CDU and can be used to find data within the system.
DEP ARR DEP/ARR (departures / arrivals) - used for selection of the procedures and runways at the origin and destination airports.

625
Chapter 36Flight Management System
RTE RTE (route) - permits flight plan data entries. A primary means for lateral flight plan alteration.
LEGS LEGS (route legs) - displays and accepts entries of detailed data concerning each leg of the flight plan, for both the lateral and vertical paths.
HOLD HOLD - permits planning or initiation of holding at a designated waypoint.
DIR INTC DIR/INTC (direct / intercept) - provides data capability to proceed direct to any point desired, or to intercept any leg presently in the flight plan.
FIX FIX (fix information) - displays range and bearing data from the present position to an entered fix. Facilitates creation of fixes for use in flight planning.
PROG PROG (flight progress) - displays current flight status information such as ETA, fuel remaining at waypoint, navigation radio tuning status, wind, and path errors.
Line Select Keys (LSK) - entry of data from the scratch pad into the selected line and field is accomplished by using the LSKs. There are twelve LSKs on the CDU panel, six each to the left and right of the CRT display. Data entries are permitted only on lines adjacent to the LSKs. Data can also be duplicated into the blank scratch pad by pressing the LSK adjacent to the desired data line.
EXEC EXEC (execute) - used to incorporate data displayed on the CDU as part of the active flight plan. The EXEC key is operable when its annunciator bar is illuminated. The key is used for activating the flight plan, changing the active flight plan, changing the active guidance mode, or inserting data which will affect the active flight plan, guidance mode, or data base. Illumination of the white annunciator bar indicates that a valid set of data is on display and may be made active for guidance of the aircraft.
+ / - Change Sign Key - changes data in the scratch pad from positive to negative and back again. May also be used to insert a hyphen for specialised data entries.
PREV PAGE Page Select Keys - when multiple-page displays are shown, pressing the NEXT PAGE key advances the display to the next higher page number.
NEXT PAGE Pressing PREV PAGE backs up the display to the next lower page number. Page access wraps around.
CLR Clear Key - the scratch pad’s contents can be edited or cleared by pressing the CLR key. When an entry is present in the scratch pad, a brief depression of the CLR key will clear the last character in the entry. If the CLR key is held down for more than one second, the entire entry in the scratch pad will be cleared. The CLR key is also used to clear advisory and alerting messages from the scratch pad.

626
Chapter 36 Flight Management System
DEL Delete Key - the delete (DEL) key is used to remove data from a display (and thus a flight plan) after it has been line selected and accepted into a data field. If the scratch pad is empty, depression of the DEL key writes (“DELETE”) into the scratch pad. The delete process is then completed by line-selecting (LSK) the data item to be removed. If the deletion is a valid one, the data field reverts to its default value (box prompts, dashes, or a system-generated value). The system prevents invalid use of the DEL key.
Illuminated Annunciators. There are four annunciators on the front of the CDU as shown in the illustration:
MSG Illuminates white in colour; indicates an alerting or advisory message or pending messages.
FAIL Illuminates amber in colour; lit if FMC failure is detected.
DISPLAY Illuminates white in colour if the page displayed is not related to the active flight plan leg or to the current operational performance mode.
OFFSET Illuminates white in colour when a parallel offset is in use (ie. the aeroplane is flying parallel to, but a fixed distance from, the FMS preprogrammed track).

627
Chapter 37General Navigation Problems
CHAPTER THIRTY SEVEN
GENERAL NAVIGATION PROBLEMS
Contents
INTRODUCTION . . . . . . . . . . . . . . . . . . . . . . . . . . . . . . . . . . . . . . .629
TRIANGULAR PROBLEMS . . . . . . . . . . . . . . . . . . . . . . . . . . . . . . . . .629
IMPLICATIONS OF GEOMETRY ON THE TRIANGLE OF VELOCITIES . . . . . . .632
CALCULATION OF RHUMB LINE TRACK ANGLES . . . . . . . . . . . . . . . . . .633
TIMING TO A BEACON . . . . . . . . . . . . . . . . . . . . . . . . . . . . . . . . . . .634

628
Chapter 37 General Navigation Problems

629
Chapter 37General Navigation Problems
INTRODUCTION
The General Navigation exam includes many questions on general principles. They fall into the following broad categories:
Triangular problemsImplications of geometry on the Triangle of VelocitiesCalculation of Rhumb Line track anglesCross-track displacement between Rhumb Line and Great Circle tracksTiming to a beacon
TRIANGULAR PROBLEMS
Question. The relative bearing to a beacon is 270°R. Three minutes later, at a groundspeed of 180 knots, it has changed to 225°R. What was the distance of the closest point of approach of the aircraft to the beacon?
a. 45 nmb. 18 nmc. 9 nmd. 3 nm
Answer: The question doesn’t specify any heading or track, so draw the situation assuming that the aircraft is travelling due north. That way, the relative bearing and the true bearing are the same.
225°R
270°RA
B
C
The angle A within the triangle when the 270°R bearing is taken is 90°. Three minutes later, the relative bearing is 225°R, so the angle B within the triangle at that corner is 45°. The two of them add up to 135°, leaving 45° remaining (angle C) of the 180° which must make up the internal angles of a triangle.
Therefore angles B and C are equal and we have another isosceles triangle. So length AB = length AC.
We know that from A to B is 3 minutes at 180 knots, which is 9 nautical miles. Therefore AC, which is the closest point of approach to the beacon, is also 9 nautical miles. Answer c is the right one here.

630
Chapter 37 General Navigation Problems
Question. At 1000 hours an aircraft is on the 310° radial from a VOR/DME, at 10 nautical miles range. At 1010 the radial and range are 040/10nm. What is the aircraft’s track and groundspeed?
a. 080°(M)/ 85 knotsb. 085°(M)/ 85 knotsc. 080°(M)/ 80 knotsd. 085°(M)/ 90 knots
Answer. Start by drawing a diagram. This is just a sketch – not a scale drawing. It would be possible to solve this question by drawing it out accurately but this is not the ideal method.
Draw a Magnetic North reference arrow, and draw in the two fixes.
40°
50°
C
1010
040/10
B
1000
310/10
x
y
A
If radial B is 310°(M), then the angle between Magnetic North and AB is 50°. Similarly the angle up to AC is 40° - right-angled triangle. AB and AC are both 10 nautical miles so, again, we have the triangle ABC. The internal angles must add up to 180° and 90 of them are at corner A, so the remaining 90° are equally split between corners B and C. Therefore both B and C are 45°.
There are now several ways of establishing the track angle. The easiest is to consider the left-hand of the two smaller triangles above. The bottom angle is 50° and angle B is 45°. These add up to 95°, so angle x must be 85°. If angle x is 85°, then so is angle y. Angle y is the track angle.
Another way is to say that if direction AB is 310°(M), then direction BA must be 130°(M). We know that angle B is 45°, so the track direction is (130 – 45) = 085°(M).

631
Chapter 37General Navigation Problems
Alternatively: we know that angle C is 45°. We also know that direction AC is 040°(M). Draw construction lines to extend the track angle AC and to extend the radial AC, like this:-
A q
p C
Line direction AC is 040M. Angle p is 45°. Therefore the extension of line AC is also 040°(M), and angle q is also 45° (opposite angles). 040°(M) + 45° = 085°(M)).
Therefore the Track angle is 085°(M). Now for the groundspeed.
You can do it by sin or cosine of 45°, using your 10 nautical mile sides for AB or AC, but it’s easier to find the distance AC using Pythagoras.
BC2 = AB2 + AC2
so BC = 200 = 14.14 nautical miles.
Use your navigation computer to calculate a groundspeed if 14.14 nm are covered in 10 minutes. It works out at 85 knots.
Thus answer b is correct.

632
Chapter 37 General Navigation Problems
IMPLICATIONS OF GEOMETRY ON THE TRIANGLE OF VELOCITIES
It is often assumed, wrongly, that if the wind is at right angles to heading or track, there is no head or tail wind component. For many problems, especially in Flight Planning, you are expected to assume zero wind component.
However, strictly speaking, this is not true. Consider the following question:
Question. An aircraft is tracking 090°(T) at a TAS of 180 knots. The wind is from due North and the wind component is 5 knots head. What will the wind component be if the aircraft flies a track of 270°(T)?
a. 5 knots tailb. zeroc. 5 knots headd. not possible to tell
Answer. You could solve this one on your navigation computer, though not easily, and not by one of the conventional methods. Put the wind direction (360°) at the 12 o’clock position and draw a straight line vertically downwards from the blue circle (about 3 – 4 cm long). Put 180 knots under the blue circle. Bring the track (090°) up to the heading index to start. Your initial drift will be to starboard. Rotate the wind face to the right, select a heading off to the left until the amount of difference between heading and track is the same as the drift-line which crosses the wind direction at 175 knots ground speed. It’s a little difficult to explain without a diagram, but try it practically and you will see that it occurs at a heading of 077°, using 13° S drift. This gives a wind of 360° / 42. Now apply 360° / 42 to a track of 270°(T) and you will find you need to fly a heading of 283°(T). This gives you a groundspeed of 175 knots.
We get a headwind of 5 knots whether we track 090°(T) or 270°(T). Why is this? Draw a diagram.
A B
C
This makes it clear that on a track of 090°(T) with a TAS of 180 knots, the ground speed is less than the TAS. The hypotenuse will be longer than the opposite or adjacent, to use trigonometrical terms.
If we now reverse the track, we get a mirror image of the situation.
A B
C
180 knots TAS still gives us 175 knots groundspeed - (5 knots headwind..
Answer c is correct.

633
Chapter 37General Navigation Problems
This shows that a zero head / tail wind component does not occur, strictly speaking, with the wind at right angles to track. You can also show, by a similar drawing exercise, that it does not occur at right angles to heading. It is rather an academic point for practical purposes, but in fact, zero wind component is present when the wind is at right angles to the bisector between heading and track.
CALCULATION OF RHUMB LINE TRACK ANGLES
You know how to calculate the distance in nautical miles of change of latitude. Also how to calculate distance involved in of change of longitude using the departure formula. You will also need to calculate Rhumb Line track angle using the tangent relationship. This is a typical example:-
Question. What is the Rhumb Line track from A (4500N 01000W) to B (4830N 01500W)?
a. 315°(T)b. 330°(T)c. 215°(T)d. 150°(T)
Answer. You have to draw these diagrams as though they were a Mercator chart - a rectangular graticule. A straight line will be a Rhumb Line.
The change of latitude from 4500N to 4830N is 3°30’, or 210 nautical miles. To solve the E-W distance we use the departure. Strictly speaking, it should be the departure at mid-latitude, at 4645N in this example. However, in the examples noted so far the changes of latitude are small and it does not make a great deal of difference to the departure. In fact, on this example, you get an answer slightly nearer to the right answer if you use the departure at 45N.
Departure = change of longitude (in minutes) x cos latitude
= 5 x 60 x .7071
= 212.13 nautical miles
The tangent of angle x = opposite = 210 adjacent 212
= 0.99
Therefore angle x = 44.7°
The Rhumb Line track from A westwards along the parallel of latitude is 270°(T), add x to that to get 314.7°(T) - answer a.

634
Chapter 37 General Navigation Problems
TIMING TO A BEACON
Most timing problems require the wind component to be taken into consideration. Groundspeed is a combination of TAS and head / tail wind component. To get the timing right requires the right groundspeed. However, what the pilot actually adjusts is the Mach No or CAS, which is directly proportional to TAS, not G/S.
Question. You are flying at a True Mach no of .77 in a SAT of -55°C. At 1000 hours you are 150 nm from a DME with an ETA of 1017. ATC ask you to slow down to arrive at 1021. What is your new TMN if you reduce speed at 150 distance to go?
a. M.72b. M.62c. M.67d. M.59
Answer. Start by calculating the current groundspeed. 150 nm to go in 17 minutes gives 530 knots G/S. We need to alter the G/S to cover the 150 nm in 21 minutes, which is a new required groundspeed of 429 knots.
Avoid the temptation to say that the required new Mach No must be:
New Mach No = M.77 x 429 = M.62 530
You have to take the wind into consideration:-
Old groundspeed = 150 nm in 17 min = 530 knotsTAS: M.77 @ -55°C = 442 knots Wind component = +88 knots
New required G/S = 150 nm in 21 min = 429 knotsWind component = +88 knots (reverse sign)New required TAS = 341 knots
New Mach No = M.77 x 341 = M.59 442
Answer d is correct.

635
Chapter 38Revision Questions
CHAPTER THIRTY EIGHT
REVISION QUESTIONS
Contents
QUESTIONS . . . . . . . . . . . . . . . . . . . . . . . . . . . . . . . . . . . . . . . . . .637
Appendix B to Revision Questions . . . . . . . . . . . . . . . . . . . . . . . . . . . . . .677
Appendix C to Revision Questions. . . . . . . . . . . . . . . . . . . . . . . . . . . . . .678
ANSWERS . . . . . . . . . . . . . . . . . . . . . . . . . . . . . . . . . . . . . . . . . . .679
FINAL EXAM. . . . . . . . . . . . . . . . . . . . . . . . . . . . . . . . . . . . . . . . . .698
Appendix A to Final Exam . . . . . . . . . . . . . . . . . . . . . . . . . . . . . . . . . .707
Appendix B to Final Exam . . . . . . . . . . . . . . . . . . . . . . . . . . . . . . . . . .708
ANSWERS to FINAL EXAM . . . . . . . . . . . . . . . . . . . . . . . . . . . . . . . . .709
ANSWERS to FINAL EXAM EXPLAINED . . . . . . . . . . . . . . . . . . . . . . . . .710

636
Revision QuestionsChapter 38
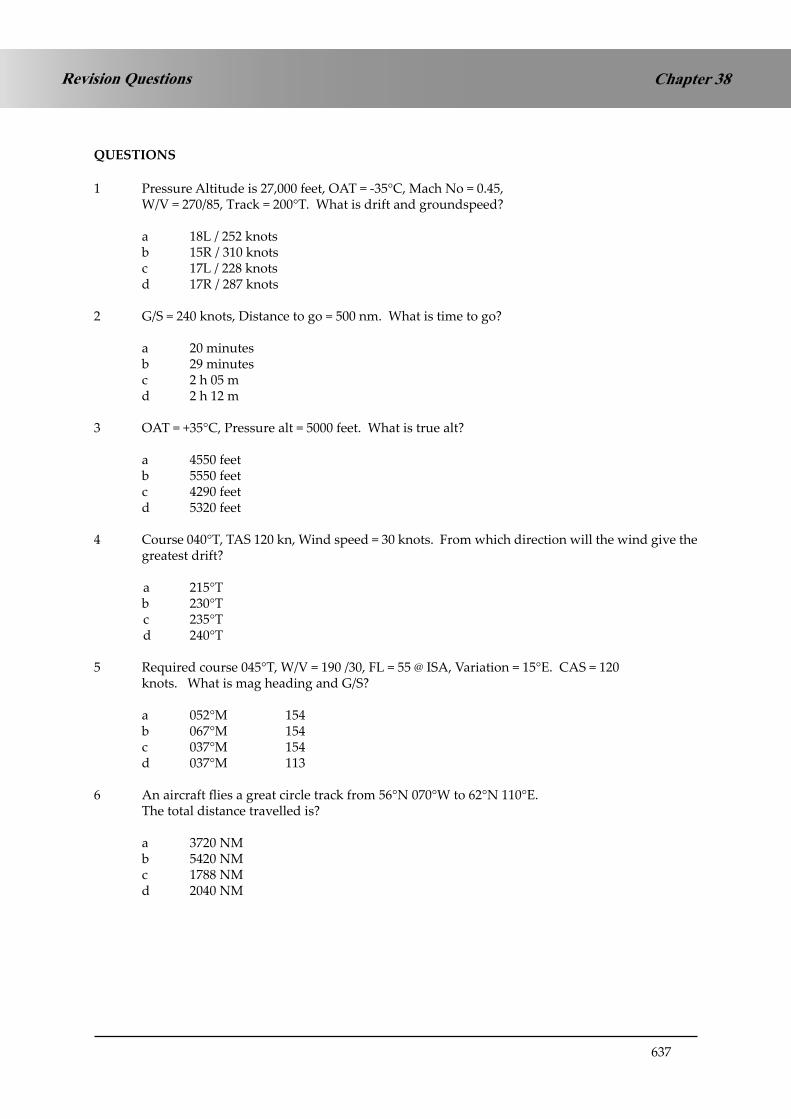
637
Chapter 38Revision Questions
QUESTIONS
1 Pressure Altitude is 27,000 feet, OAT = -35°C, Mach No = 0.45, W/V = 270/85, Track = 200°T. What is drift and groundspeed?
a 18L / 252 knots b 15R / 310 knots c 17L / 228 knots d 17R / 287 knots
2 G/S = 240 knots, Distance to go = 500 nm. What is time to go?
a 20 minutes b 29 minutes c 2 h 05 m d 2 h 12 m
3 OAT = +35°C, Pressure alt = 5000 feet. What is true alt?
a 4550 feet b 5550 feet c 4290 feet d 5320 feet
4 Course 040°T, TAS 120 kn, Wind speed = 30 knots. From which direction will the wind give the greatest drift?
a 215°T b 230°T c 235°T d 240°T
5 Required course 045°T, W/V = 190 /30, FL = 55 @ ISA, Variation = 15°E. CAS = 120 knots. What is mag heading and G/S?
a 052°M 154 b 067°M 154 c 037°M 154 d 037°M 113
6 An aircraft flies a great circle track from 56°N 070°W to 62°N 110°E. The total distance travelled is?
a 3720 NM b 5420 NM c 1788 NM d 2040 NM
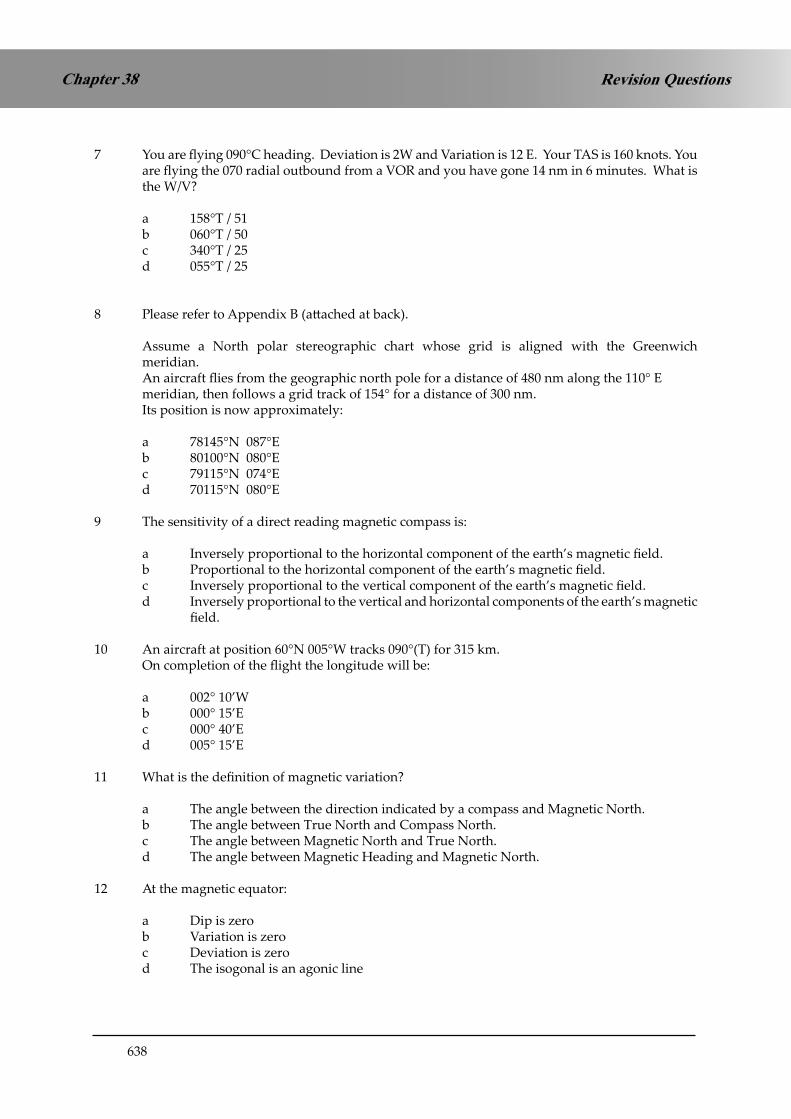
638
Revision QuestionsChapter 38
7 You are flying 090°C heading. Deviation is 2W and Variation is 12 E. Your TAS is 160 knots. You are flying the 070 radial outbound from a VOR and you have gone 14 nm in 6 minutes. What is the W/V?
a 158°T / 51 b 060°T / 50 c 340°T / 25 d 055°T / 25
8 Please refer to Appendix B (attached at back).
Assume a North polar stereographic chart whose grid is aligned with the Greenwich meridian.
An aircraft flies from the geographic north pole for a distance of 480 nm along the 110° E meridian, then follows a grid track of 154° for a distance of 300 nm.
Its position is now approximately:
a 78145°N 087°E b 80100°N 080°E c 79115°N 074°E d 70115°N 080°E
9 The sensitivity of a direct reading magnetic compass is:
a Inversely proportional to the horizontal component of the earth’s magnetic field. b Proportional to the horizontal component of the earth’s magnetic field. c Inversely proportional to the vertical component of the earth’s magnetic field. d Inversely proportional to the vertical and horizontal components of the earth’s magnetic
field.
10 An aircraft at position 60°N 005°W tracks 090°(T) for 315 km. On completion of the flight the longitude will be:
a 002° 10’W b 000° 15’E c 000° 40’E d 005° 15’E
11 What is the definition of magnetic variation?
a The angle between the direction indicated by a compass and Magnetic North. b The angle between True North and Compass North. c The angle between Magnetic North and True North. d The angle between Magnetic Heading and Magnetic North.
12 At the magnetic equator:
a Dip is zero b Variation is zero c Deviation is zero d The isogonal is an agonic line

639
Chapter 38Revision Questions
13 Which of these is a correct statement about the Earth’s magnetic field:
a It acts as though there is a large blue magnetic pole in Northern Canada b The angle of dip is the angle between the vertical and the total magnetic force. c It may be temporary, transient, or permanent. d It has no effect on aircraft deviation.
14 Where is a compass most effective?
a About midway between the earth’s magnetic poles b In the region of the magnetic South pole c In the region of the magnetic North pole d On the geographic equator
15 The value of variation:
a is zero at the magnetic equator b has a maximum value of 180° c has a maximum value of 45° E or 45° W d cannot exceed 90°
16 You are in the northern hemisphere, heading West, and the aircraft is accelerating. Will a direct reading magnetic compass over-read or under-read? Is the compass indicating a turn to the north or to the south?
Compass Indicating turn to
a over-reads north b over-reads south c under-read north d under-reads south
17 What is the advantage of the remote indicating compass (slaved gyro compass) over the direct reading magnetic compass?
a It is lighter b It is connected to a source of electrical power and so is more accurate c It senses the earth’s magnetic field rather than seeks it, so is more sensitive d It is not affected by aircraft deviation
18 You are in the Northern hemisphere, heading 135° C on a Direct Reading Magnetic Compass. You turn right in a Rate 1 turn for 30 seconds. Do you roll out on an indicated heading of:
a Greater than 225 b Less than 225 c Equal to 225 d Not possible to determine
19 IRS differs from INS in that it:
a Has a longer spin-up time and is not affected by vertical accelerations due to gravity. b Has a shorter spin-up time and suffers from laser lock. c Does not need to correct for coriolis and central acceleration. d Does not experience Schuler errors as accelerometers are strapped down and are not rotated by a V/R feedback loop.

640
Revision QuestionsChapter 38
20 The period of validity of an FMS database is:
a 56 days b One week c 28 days d Varies depending on the area of operational cover.
21 In an IRS:
a The accelerometers are strapped down but the platform is gyro stabilised. b The platform is strapped down but the accelerometers are gyro-stabilised. c Accelerometers and platform are both gyro-stabilised. d Accelerometers and platform are both strapped down.
22 When initial position is put into an FMS, the system:
a Rejects initial latitude error, but it will accept longitude error. b Rejects initial longitude error, but it will accept latitude error. c Rejects initial latitude or longitude error. d Cannot detect input errors, and accepts whatever is put in.
23 In a ring laser gyro, the purpose of the dither motor is to:
a Enhance the accuracy of the gyro at all rotational rates. b Overcome laser lock. c Compensate for transport wander. d Stabilise the laser frequencies.
24 The FMC position is:
a The average of the IRS positions b The average of the IRS and radio navigation positions c Computer generated from the IRS and radio navigation positions d Computer generated from the radio navigation positions
25 Which of the following can all be stored as five letter waypoint identifiers through the CDU of a B737- 400 Electronic Flight Instrument System?
a Airway names; navaid identifiers; airport names; waypoint code numbers b Waypoint names; navaid identifiers; runway numbers; airport ICAO identifiers c Waypoint names; navaid frequencies; runway codes; airport ICAO identifiers d Waypoint names; navaid positions; airport ICAO identifiers; airport names

641
Chapter 38Revision Questions
26 The following waypoints are entered into an inertial navigation system (INS) WPT 1: 60N 30W WPT 2: 60N 20W WPT 3: 60N 10W
The inertial navigation is connected to the automatic pilot on the route WP1 → WP2 → WP3. The track change on passing WPT 2 will be approximately:
a a 9 ° increase b a 4 ° decrease c zero d a 9 ° decrease
27 What is the source of magnetic variation information in a Flight Management system (FMS)?
a The main directional gyro which is coupled to the magnetic sensor (flux valve) positioned in the wing tip.
b Magnetic variation information is stored in each IRS memory; it is applied to the true heading calculated by the respective IRS
c Magnetic variation is calculated by each IRS based on the respective IRS position and the aircraft’s magnetic heading
d The FMS calculates MH and MT from the FMC position
28 In the Boeing 737-400 FMS, the CDU is used to:
a manually initialise the IRS and FMC with dispatch information b automatically initialise the IRS and FMC with dispatch information c manually initialise the Flight Director System and FMC with dispatch information d manually initialise the Flight Director System, FMC and Autothrottle with dispatch
information
29 What are the levels of message on the Boeing 737-400 FMC?
a Urgent and Routine b Priority and Alerting c Alert and Advisory d Urgent and Advisory
30 An INS platform is kept at right angles to local gravity by applying corrections for the effects of:
i Aircraft manoeuvres ii earth rotation iii transport wander iv coriolis v gyroscopic inertia
a i, iii and v b ii, iii and v c ii, iv and v d i, ii,iii and iv

642
Revision QuestionsChapter 38
31 When and where are IRS positions updated?
a during all phases of flight b only on the ground during the alignment procedure c when the FMS is in IRS ONLY NAV operation d when the VHF Nav Radios are selected to AUTO
32 An aircraft equipped with an Inertial Navigation system (INS) flies with INS 1 coupled with autopilot 1. Both inertial navigation systems are navigating from waypoint A to B. The inertial systems’ CDU s show:
XTK on INS 1 = 0 XTK on INS 2 = 8L
From this information it can be deduced that:
a only inertial navigation No 1 is drifting b only inertial navigation No 2 is drifting c at least one of the inertial navigation systems is drifting d the autopilot is unserviceable in NAV mode
33 Aircraft position determined by radio navigation in the Boeing 737-400 FMC is derived from:
a VOR / DME b DME ranges and / or VOR / ADF bearings c VOR / ADF d VOR / DME and DME / DME
34 On a triple-fit IRS system, present positions on the CDU:
a will only differ if one IRS has been decoupled due to a detected malfunction b will only differ if an initial input error of aircraft position has been made c are likely to differ as the information comes from different sources d will not differ as the information is averaged
35 Gyro-compassing in an INS:
a is possible in flight as the accelerometers can differentiate between acceleration due to aircraft movement and initial alignment errors
b is not possible in flight as the accelerometers can differentiate between acceleration due to aircraft movement and initial alignment errors
c is not possible in flight as the accelerometers cannot differentiate between acceleration due to aircraft movement and initial alignment errors
d is possible in flight as the accelerometers cannot differentiate between acceleration due to aircraft movement and initial alignment errors
36 What are the positions (in the order left to right) on the Boeing 737-400 IRS MSU mode selector?
a OFF STBY ALIGN NAV b OFF ON ALIGN NAV c OFF STBY ATT NAV d OFF ALIGN NAV ATT

643
Chapter 38Revision Questions
37 An aircraft leaves at 0900UTC on a 250 nm journey with a planned groundspeed of 115 knots. After 74 nm the aircraft is 1.5 minutes behind the planned schedule.
What is the revised ETA at the destination?
a 1100 b 1110 c 1115 d 1054
38 The drift of the azimuth gyro on an inertial unit induces an error in position given by this unit., t being the elapsed time since selecting the MSU from ALIGN to NAVigate. The total error is:
a Proportional to t b Proportional to the square of time, t2 c Proportional to t/2 d sinusoidal
39 From the departure point, the distance to the point of equal time is:
a proportional to the sum of ground speed out and ground speed back b inversely proportional to the total distance to go c inversely proportional to ground speed back d inversely proportional to the sum of ground speed out and ground speed back 40 Laser lock is overcome in an IRS system by using a piezo-electric motor which utilises the
principle of:
a shake b SAGNAC c dither d vibration
41 A B C | 30 nm | 20 nm | _________________________________________
ATA A is 1010. ETA B is 1030. ETA C is 1043. ATA B is 1027. What is revised ETA C?
a 1040 b 1043 c 1038 d 1036
42 Isogrivs are lines that connect positions that have
a the same grivation b the same variation c 0° magnetic dip d the same horizontal magnetic field strength

644
Revision QuestionsChapter 38
43 An aircraft at position 6000N 00522W flies 165 km due East. What is the new position?
a 6000N 00820E b 6000N 00224W c 6000N 00108E d 6000N 00108W 44 An aircraft at latitude 0220N tracks 180°T for 685 kilometres. What is its latitude at the end of
the flight?
a 0350S b 0250S c 0210S d 0855S
45 In an Inertial Navigation System (INS), Ground Speed (GS) is calculated:
a by integrating gyro precession in N/S and E/W directions respectively b by integrating measured acceleration c from TAS and W/V from RNAV data d from TAS and W/V from Air Data Computer (ADC)
46 What is the average true track and distance between WTD NDB (5211.3N 00705.0W) and FOY NDB (5234.0N 00911.7W) - use your Jeppesen E(LO)1
Track Dist
a 294 76 b 286 76 c 294 81 d 286 81
47 An aircraft is flying TAS 180 knots and tracking 090°T. The W/V is 045/50. How far can the aircraft fly out from its base and return within 1 hour?
a 74 nm b 85 nm c 102 nm d 111 nm
48 A useful method of a pilot resolving, on a visual flight, any uncertainty in the aircraft’s position is to maintain visual contact with the ground and:
a set heading towards a line feature such as a coastline, river, or motorway b fly the reverse of the heading being flown prior to becoming uncertain until a pinpoint
is obtained c fly expanding circles until a pinpoint is obtained d fly reverse headings and associated timings until the point of departure is reached

645
Chapter 38Revision Questions
49 An aircraft is at FL140 with an IAS of 210 and a true OAT of -5 °C. The wind component is -35 knots. When the aircraft is at 150 nm from a reporting point, ATC request the crew to lose 5 minutes by the time they get to the beacon. How much do they need to reduce IAS?
a 15 knots b 25 knots c 30 knots d 20 knots
50 An aircraft has a TAS of 300 knots and a safe endurance of 10 hours. If the wind component on the outbound leg is 50 knots head, what is the distance to the point of safe endurance?
a 1500 nm b 1458 nm c 1544 nm d 1622 nm 51 An aircraft has a TAS of 300 knots and is over a stretch of water between 2 airfields 500 nm
apart. If the wind component is 60 knots head, what is the distance from the first airfield to the critical point?
a 250 nm b 200 nm c 300 nm d 280 nm
52 X Y Z | 30 nm | 20 nm | ________________________________________
ATA X is 1420. ETA Y is 1447. ATA Y is 1450. What is new ETA Z?
a 1506 b 1512 c 1510 d. 1515
53 Given: Airport elevation is 1000 feet. QNH is 988 hPa What is the approximate airport pressure altitude?
a 320 b 1680 c -320 d 680
54 An aircraft starts at position 0410S 17822W and heads true north for 2950 nm,then turns 90 degrees left, and maintains a rhumb line track for 314 kilometers. What is its final position?
a 5500N 17422W b 4500N 17422W c 5500N 17738E d 4500N 17738E

646
Revision QuestionsChapter 38
55 You are heading 080°T when you get a range and bearing fix from your AWR on a headland at 185 nm 30° left of the nose. What true bearing do you plot on the chart?
a 050 from the headland, using the headland’s meridian b 050 from the headland, using the aircraft’s meridian c 230 from the headland, using the headland’s meridian d 230 from the headland, using the aircraft’s meridian
56 By what amount must you change your rate of descent given a 10 knot increase in headwind on a 3° glideslope?
a 50 feet per minute increase b 30 feet per minute increase c 50 feet per minute decrease d 30 feet per minute decrease
57 You are on a heading of 105°C, deviation 3 E. WTD NDB (5211.3N 00705.0W) bears 013 R, CRK VOR (5150.4N 00829.7W) QDM is 211. What is your position? (Use Jeppesen E(LO)1)
a 5245N 00757W b 5228N 00802W c 5412N 00639W d 5217N 00745W
58 The airport at 5211N 00932W is: (use Jeppesen E (LO) 1)
a Kerry b Cork c Shannon d Waterford
59 In which months is the difference between apparent noon and mean noon the greatest?
a November and February b January and July c March and September d June and December
60 5 hours 20 minutes and 20 seconds hours time difference is equivalent to which change of longitude?
a 81° 30’ b 78° 15’ c 79° 10’ d 80° 05’
61 The main reason that day and night, throughout the year, have different durations is due to the:
a earth’s rotation b relative speed of the sun along the ecliptic c inclination of the ecliptic to the equator d gravitational effect of the Sun and the Moon on the speed of rotation of the Earth
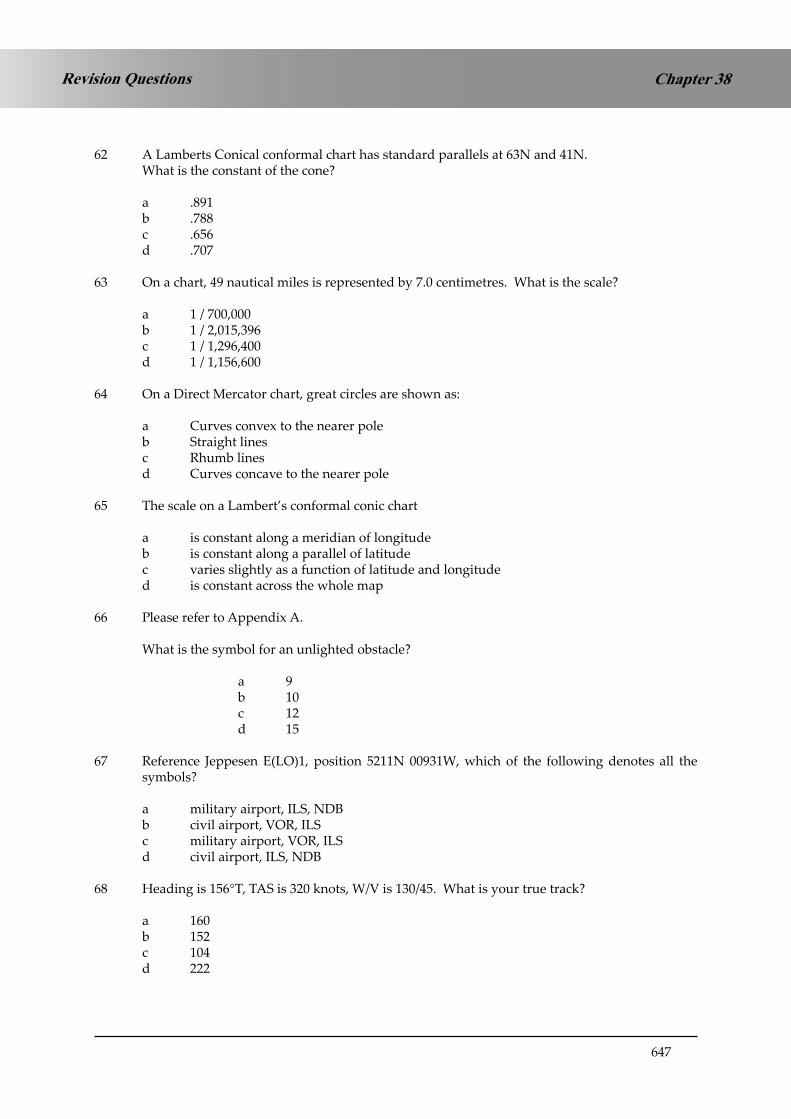
647
Chapter 38Revision Questions
62 A Lamberts Conical conformal chart has standard parallels at 63N and 41N. What is the constant of the cone?
a .891 b .788 c .656 d .707
63 On a chart, 49 nautical miles is represented by 7.0 centimetres. What is the scale?
a 1 / 700,000 b 1 / 2,015,396 c 1 / 1,296,400 d 1 / 1,156,600
64 On a Direct Mercator chart, great circles are shown as:
a Curves convex to the nearer pole b Straight lines c Rhumb lines d Curves concave to the nearer pole
65 The scale on a Lambert’s conformal conic chart
a is constant along a meridian of longitude b is constant along a parallel of latitude c varies slightly as a function of latitude and longitude d is constant across the whole map
66 Please refer to Appendix A.
What is the symbol for an unlighted obstacle?
a 9 b 10 c 12 d 15
67 Reference Jeppesen E(LO)1, position 5211N 00931W, which of the following denotes all the symbols?
a military airport, ILS, NDB b civil airport, VOR, ILS c military airport, VOR, ILS d civil airport, ILS, NDB
68 Heading is 156°T, TAS is 320 knots, W/V is 130/45. What is your true track?
a 160 b 152 c 104 d 222

648
Revision QuestionsChapter 38
69 You are heading 345°M, the variation is 20°E, and you take a radar bearing of 30° left of the nose from an island. What bearing do you plot?
a 160°T b 155°T c 140°T d 180°T
70 Your pressure altitude is FL55, the QNH is 998, and the SAT is +30°C. What is Density Altitude?
a 6980 feet b 7750 feet c 8620 feet d 10020 feet
71 Convergency on a Transverse Mercator chart is correct at:
a the datum meridian only b the datum meridian and the Equator c the Equator and the Poles d the Parallel of Origin
72 When is the last point at which an INS or IRS may be selected to NAV mode?
a After passengers and freight are aboard b Immediately prior to push back or taxy from the gate c At the holding point d On operation of the TOGA switch when opening the throttles for the take-off
73 On a particular take-off, you can accept up to 10 knots tailwind. The runway QDM is 047, the variation is 17°E and the ATIS gives the wind direction as 210. What is the maximum wind strength you can accept?
a 18 knots b 11knots c 8 knots d 4 knots
74 The agonic line:
a is midway between the magnetic North and South poles b follows the geographic equator c is the shorter distance between the respective True and Magnetic North and South
poles d Follows separate paths out of the North polar regions, one currently running through
Western Europe and the other through the USA
75 On a 12% glide slope, your groundspeed is 540 knots. What is your rate of descent?
a 6550 feet/min b 4820 feet/min c 8740 feet/min d 3120 feet/min

649
Chapter 38Revision Questions
76 What does the sensor of an INS/IRS measure ?
a velocity b displacement c pressure d acceleration
77 At 65 nm from a VOR you commence a descent from FL330 in order to arrive over the VOR at FL 100. Your mean groundspeed in the descent is 240 knots. What rate of descent is required?
a 1420 feet/min b 1630 feet/min c 1270 feet/min d 1830 feet/min
78 In an Inertial Navigation System, what is the output of the first stage North/South integrator?
a groundspeed b latitude c velocity along the local meridian d change of latitude
79 On the Jeppesen E(LO)1 chart, what are the symbols at Galway Carnmore (5318.1N 00856.5W)?
a VOR, NDB, DME, compulsory reporting point b civil airport, NDB, DME, non-compulsory reporting point c civil airport, VOR, DME, non-compulsory reporting point d VOR, NDB, DME, non-compulsory reporting point 80 In which month does aphelion occur?
a January b March c July d November
81 The term drift refers to the wander of the axis of a gyro in?
a any plane b the horizontal plane c the vertical plane d the vertical and horizontal plane
82 What is the highest latitude listed below at which the sun will rise above the horizon and set every day?
a 68° N b 66° N c 62° N d 72° N

650
Revision QuestionsChapter 38
83 The pressure alt is 29000 feet and the SAT is -55°C. What is density altitude?
a 27500 feet b 26000 feet c 30000 feet d 31000 feet
84 The distance from A to B is 2368 nautical miles. If outbound groundspeed in 365 knots and homebound groundspeed is 480 knots and safe endurance is 8 hours 30 minutes, what is the time to the PNR?
a 290 minutes b 209 minutes c 219 minutes d 190 minutes
85 What is the UTC time of sunrise in Vancouver, British Columbia, Canada (49N 123 30W) on the 6th December? (In the exam, tables were supplied. The answers given below are based on the tables in your Gen Nav notes).
a 2324 UTC b 0724 UTC c 1552 UTC d 0738 UTC
86 How does scale change on a normal Mercator chart?
a Expands as the secant 2 (½ co-latitude) b Expands directly with the secant of the latitude c Correct on the standard parallels, expands outside them, contracts within them d Expands as the secant of the E/W great circle distance
87 You are on ILS 3-degree glideslope which passes over the runway threshold at 50 feet. Your DME range is 25 nm from the threshold. What is your height above the runway threshold elevation? (Use the 1 in 60 rule and 6000feet = 1 nautical mile)
a 8010 feet b 7450 feet c 6450 feet d 7550 feet
88 When it is 0600 Standard Time in Queensland, Australia, what is the Standard Time in Hawaii, USA? (Disregard Summer Time)
a 0200 ST b 0600 ST c 1000 ST d 1200 ST

651
Chapter 38Revision Questions
89 Please refer to Appendix A.
Which of the following is the symbol for an exceptionally high (over 1000 feet AGL) lighted obstruction?
a 6 b 9 c 10 d 15
90 You are flying at a True Mach No of .82 in a SAT of -45°C. At 1000 hours you are 100 nm from the POL DME and your ETA at POL is 1012. ATC ask you to slow down to be at POL at 1016. What should your new TMN be if you reduce speed at 100 nm distance to go?
a M .76 b M .72 c M .68 d M .61
91 The relative bearing to a beacon is 270°R. Three minutes later, at a groundspeed of 180 knots, it has changed to 225°R. What was the distance of the closest point of approach of the aircraft to the beacon?
a 45 nm b 18 nm c 9nm d 3 nm
92 Groundspeed is 540 knots. 72 nm to go. What is time to go?
a 8 mins b 9 mins c 18 mins d 12 mins
93 An aircraft at position 2700N 17000W travels 3000 km on a track of 180°T, then 3000 km on a track of 090°T, then 3000 km on a track of 000°T, then 3000 km on a track of 270°T. What is its final position?
a 2700N 17000W b 0000N/S 17000W c 2700N 17318W d 2700N 14300W
94 On the Jeppesen E(LO)1, Kerry (5210.9N 00932.0W) is 41 nm DME, Galway (5318.1N 00856.5W) is 50 nm DME. What is your position?
a 5242N 00827W b 5230N 00834W c 5255N 00819W d 5219N 00809W

652
Revision QuestionsChapter 38
95 An aircraft at FL370 is required to commence descent at 120 NM from a VOR and to cross the facility at FL130. If the mean GS for the descent is 288 kt, the minimum rate of descent required is:
a 920 ft/min b 890 ft/min c 860 ft/min d 960 ft/min
96 On the Boeing 737-400 EFIS EHSI, on which modes is a Weather Radar Display available?
a MAP, PLAN, FULL VOR/ILS b MAP, PLAN, EXP VOR/ILS c MAP, EXP VOR/ILS, EXP NAV d MAP, FULL VOR/ILS, FULL NAV
97 You are homing to overhead a VORTAC and will descend from 7500 QNH to be 1000 AMSL by 6 nm DME. Your groundspeed is 156 knots and the ROD will be 800 feet/min. At what range from the VORTAC do you commence the descent?
a 27.1 nm b 15.8 nm c 11.7 nm d 30.2 nm
98 ATT mode of the Inertial Reference System (IRS) is a back-up mode providing:
a altitude, heading and position information b navigation information c only attitude information d only attitude and heading information
99 The data that needs to be inserted into an Inertial Reference System in order to enable the system to make a successful alignment for navigation is:
a airport ICAO identifier b the position of an in-range DME c aircraft heading d aircraft position in latitude and longitude
100 A Rhumb line is:
a the vertex of a conformal polyformic projection b a straight line on a Lambert=s conformal chart c a line on the Earth which cuts all meridians at the same angle d the shortest distance between two points on the Earth’s surface
101 You fly from 49N to 58N along the 180 E/W meridian. What is the distance in kilometres?
a 540 km b 804 km c 1222 km d 1000 km

653
Chapter 38Revision Questions
102 How long does alignment of an IRS (Ring Laser Gyros) normally take at mid-latitudes?
a 17 minutes b 5 minutes c 10 minutes d 2 minutes
103 On a particular Direct Mercator wall chart, the 180°W to 180°E parallel of latitude at 53N is 133 cm long. What is the scale of the chart at 30S?
a 1: 30,000,000 b 1: 18,000,000 c 1: 21,000,000 d 1: 25,000,000
104 What method of entering waypoints can be used on all INS equipments?
a Distance and bearing b Waypoint name c Navaid identifier d Latitude and longitude
105 What is the highest latitude on the Earth at which the Sun can be vertically overhead?
a 23½ o b 66½ o c 45 o d 90 o
106 Track = 090 (T), TAS = 460 knots, W/V = 360 (T) / 100, Variation = 10 E, Deviation = -2. What is compass heading and groundspeed?
a 079 o 470 knots b 069 o 450 knots c 068 o 460 knots d 070 o 455 knots
107 Please refer to Appendix A.
What symbol is used to show a VORTAC on a map/chart?
a 5 b 7 c 13 d 14
108 The purpose of the TAS input, from the air data computer, to the Inertial Navigation System is for
a position update in Attitude mode b the calculation of wind velocity c the calculation of drift d position update in Navigation mode

654
Revision QuestionsChapter 38
109 The angle between True North and Magnetic north is known as:
a deviation b variation c alignment error d dip
110 An aircraft is at 10° N and is flying South at 444 km/hour. After 3 hours the latitude is:
a 10° S b 02° N c 02° S d 00° N/S
111 Given that:
A is N55° E/W 000° B is N54° E 010°,
If the average true course of the great circle is 100° T, the true course of the Rhumb Line at point A is?
a 096° b 107° c 104° d 100°
112 The circumference of the Earth is approximately:
a 43200 nm b 10800 nm c 21600 nm d 5400 nm
113 The angle between the plane of the Equator and the plane of the Ecliptic is:
a 66.5° b 23.5° c 25.3° d 65.6° 114 Position A is at 70S 030W, position B is 70S 060E. What is the Great Circle track of B from A,
measured at A?
a 132° T b 048° T c 090° T d 228° T
115 Alignment of INS and IRS equipments can take place in which of the following modes?
a ATT and ALIGN b NAV and ALIGN c ALIGN only d ALIGN and ATT

655
Chapter 38Revision Questions
116 The value of magnetic variation on a chart changes with time. This is due to:
a Movement of the magnetic poles, causing an increase b Increase in the magnetic field, causing an increase c Reduction in the magnetic field, causing a decrease d Movement of the magnetic poles, which can cause either an increase or a decrease
117 Isogonal lines converge as follows:
a At the North Magnetic Pole b At the North and South Magnetic and Geographical Poles c At the North and South Magnetic Poles d At the Magnetic equator.
118 Position A is 55N 30W. Position B is 54N 20W. The Great Circle track from A to B, measured at A, is 100°T. What is the Rhumb line bearing from A to B?
a 104°T b 090°T c 100°T d 284°T
119 An aircraft departs a point 0400N 17000W and flies 600 nm South, followed by 600 nm East, then 600 nm North, then 600 nm West. What is its final position?
a 0400N 17000W b 0600S 17000W c 0400N 169° 58.1’W d 0400N 170° 01.8’W
120 Why are the detector units of slaved gyro compasses usually located in the aircraft wingtips?
a With one detector unit in each wingtip, compass deviations are cancelled out. b To isolate the detector unit from the aircraft deviation sources. c To isolate the detector unit from the Earth’s magnetic field. d To reduce turning and acceleration errors.
121 What measurement is used to carry out alignment of an Inertial Navigation System?
a acceleration sensed by the east gyro horizontal accelerometer b acceleration sensed by the north gyro horizontal accelerometer c acceleration sensed by the north gyro vertical accelerometer b difference in magnitude of the value of gravity compared with the gravity at the last
known position
122 At 1000 hours an aircraft is on the 310 radial from a VOR/DME, at 10 nautical miles range. At 1010 the radial and range are 040/10 nm. What is the aircraft’s track and groundspeed?
a 080° / 85 knots b 085° / 85 knots c 080° / 80 knots d 085° / 90 knots

656
Revision QuestionsChapter 38
123 A straight line is drawn on a North Polar Stereographic chart joining Point A (7000N 06000W) to Point B (7000N 06000E).
What is the initial track direction (going eastwards) of the line at A ?
a 090° T b 030° T c 120° T d 330° T
124 What is the maximum possible value of Dip Angle?
a 66° b 180° c 90° d 45°
125 Given: Magnetic heading 311° Drift is 10° left Relative bearing of NDB 270 What is the magnetic bearing of the NDB measured from the aircraft?
a 221° b 208° c 211° d 180°
126 The initial straight track from A(75N 60E) to B (75N 60W) on a Polar Stereographic chart is:
a 030° b 360° d 060° d 330°
127 Given: Runway direction 083°(M), Surface W/V 035/35 kt. Calculate the effective headwind component.
a 24 kt b 27 kt c 31 kt d 34 kt
128 Which of the following lists the first three pages of the FMC/CDU normally used to enter data on initial start-up of the Boeing 737-400 Electronic Flight Instrument System?
a POS INIT - RTE - IDENT b IDENT - POS INIT - RTE c POS INIT - RTE - DEPARTURE d IDENT - RTE - DEPARTURE

657
Chapter 38Revision Questions
129 Which of the following equipments does not use information from external sources in flight?
a INS / IRS b pressure altimeter c slaved gyro compass d VOR
130 Given: For take-off an aircraft requires a headwind component of at least 10 kt and has a cross-wind limit of 35 kt. The angle between the wind direction and the runway is 60°. Calculate the maximum and minimum allowable wind speeds.
a 20 kt and 40 kt b 15 kt and 43 kt c 12 kt and 38 kt d 18 kt and 50 kt
131 Which mode on the CDU of an INS must be selected in order to display initial Great Circle track between 2 waypoints?
a HDG \ DA b TK \ GS c DSRTK \ STS d XTK \ TKE
132 What is the weight in kilogrammes of 380 US Gallons at a Specific Gravity of 0.78?
a 1123 b 2470 c 5434 d 543
133 You leave A to fly to B, 475 nm away, at 1000 hours. Your ETA at B is 1130. At 1040, you are 190 nm from A. What groundspeed is required to arrive on time at B?
a 317 knots b 330 knots c 342 knots d 360 knots
134 What is the aircraft position in lat and long given the following (use Jeppesen chart E(LO)1):
CRN (5318N 00857W) 18 DME SHA (5243N 00853W) 20 DME Heading 270 M Both ranges DME decreasing
a 5201N 00908W b 5301N 00908W c 5302N 00843W d 5203N 00843W

658
Revision QuestionsChapter 38
135 What is at 5211N 00932W ? - (use E(LO)1)
a Kerry VOR b Cork Airport c Waterford NDB d Kerry Airport
136 What is the mean true track and distance from the BAL VOR (5318N 00627W) to CFN NDB (5502N 00820W)? - (use E(LO)1)
a 328° 125 b 148° 125 a 328° 134 a 148° 134
137 You are at position 5340N 00800W. What is the QDR from the SHA VOR (5243N 00853W)?
a 217 b 037 c 209 d 029
138 Your radial from the SHA VOR (5243N 00853W) is 120° M. From the CRK VOR (5151N 00830W), the radial is 033° M. What is your position? - (use E(LO)1)
a 5320N 00800W b 5240N 00821W c 5220N 00821W d 5230N 00800W
139 In what formats can created waypoints be entered into the scratch pad of the B737 - 400 FMS?
a Place Bearing/Distance, Place Distance/Place Distance, Along-Track Displacement, Latitude and Longitude
b Place Bearing/Distance, Place Bearing/Place Bearing, Across-Track Displacement, Latitude and Longitude
c Place Bearing/Distance, Place Bearing/Place Bearing, Along-Track Displacement, Latitude and Longitude
d Place, Place Bearing/Distance, Along-Track Displacement, Latitude and Longitude
140 Which of the following differences in latitude will give the biggest difference in the initial Great Circle track and the mean Great Circle track between two points separated by 10° change of longitude?
a 60N and 60S b 60N and 55N c 30S and 30N d 30S and 25S

659
Chapter 38Revision Questions
141 An aircraft is at 5530N 03613W, where the variation is 15W. It is tuned to a VOR located at 5330N 03613W, where the variation is 12W. What VOR radial is the aircraft on?
a 348 b 012 c 165 d 015
142 The wind velocity is 359/25. An aircraft is heading 180 at a TAS of 198 knots. (All directions are True). What is its track and groundspeed?
a 180 223 b 179 220 c 180 220 d 179 223
143 An aircraft’s compass must be swung:
a If the aircraft has been in the hangar for a long time and has been moved several times.
b If the aircraft has been subjected to hammering. c Every maintenance inspection d After a change of theatre of operations at the same magnetic latitude. 144 Civil Twilight occurs between:
a Sunset and 6° below the horizon b 6° and 12° below the horizon c 12° and 18° below the horizon d Sunrise and sunset 145 What is the dip angle at the South Magnetic Pole?
a 0° b 90° c 180° d 64°
146 What is a line of equal magnetic variation?
a An isocline b An isogonal c An isogriv d An isovar
147 What is the reason for seasonal changes in climate?
a Because the Earth’s spin axis is inclined to the plane of its orbit round the Sun b Because the distance between the Earth and the Sun varies over a year c Because the Earth’s orbital speed round the Sun varies according to the time of the
year d Because of the difference between the Tropical Year and the Calendar Year

660
Revision QuestionsChapter 38
148 The aircraft position is at 5330N 00800W. The VORs are tuned to Shannon (SHA, 5243N 00853W) and Connaught (CON, 5355N 00849W). Which radials will be indicated?
SHA CON a 033 130 b 221 318 c 042 138 d 213 310
149 You are on the 205 radial from the Shannon VOR (SHA, 5243N 00853W) and on the 317 radial from Cork VOR (CRK, 5150N 00830W). What is the aircraft position?
a 5205N 00915W b 5215N 00917W c 5118N 00913W d 5210N 00909W
150 What is the radial and DME distance from Connaught VOR/DME (CON, 5355N 00849W) to overhead Abbey Shrule aerodrome( 5336N 00739W)?
a 304 47 nm b 124 47 nm c 296 46 nm d 116 46 nm
151 What is the average magnetic track and distance between Kerry NDB ( KER, 5211N 00932W) and Carnmore NDB (CRN, 5318N 00856W)?
a 025 70 nm b 197 71 nm c 017 70 nm d 205 71 nm
152 What is the approximate course (T) and distance between Waterford NDB (WTD, 5212N 00705W) and Sligo NDB (SLG, 5417N 00836W)?
a 344 139 nm b 164 138 nm c 156 136 nm d 336 137 nm
153 What is the Rhumb Line track from A (4500N 01000W) to B (4830N 01500W)?
a 315° T b 330° T c 215° T a 150° T
154 A pilot accidently turns OFF the INS in flight, and then turns it back ON a few moments later. Following this incident
a everything returns to normal and is usable b the INS is usable in NAV MODE after a position update c it can only be used for attitude reference. d no useful information can be obtained from the INS

661
Chapter 38Revision Questions
155 Some inertial reference systems are known as ‘strapdown’. This means:-
a The system is mounted on a stabilised platform. b The system is mounted and fixed to the aircraft structure c The accelerometers are fixed but the gyros are stabilised. d The gyros are fixed but the accelerometers are stabilised. 156 What is the effect on the Mach number and TAS in an aircraft that is climbing with constant
CAS?
a Mach number decreases; TAS decreases b Mach number increases; TAS remains constant c Mach number increases; TAS increases d Mach number remains constant; TAS increases
157 Please refer to Appendix A.
What is the chart symbol for a lightship?
a 6 b 8 c 9 d 12
158 In an Inertial Navigation System (INS), Ground Speed (GS) is calculated:
a by integrating gyro precession in N/S and E/W directions respectively b by integrating measured acceleration c from TAS and W/V from RNAV data d from TAS and W/V from Air Data Computer (ADC)
159 The direct reading magnetic compass is made aperiodic (dead beat) by:
a using long magnets b keeping the magnetic assembly mass close to the compass point and using damping
wires c pendulous suspension of the magnetic assembly d using the lowest acceptable viscosity compass liquid
160 An aircraft is on the 025 radial from Shannon VOR (SHA, 5243N 00853W) at 49 DME. What is its position?
a 5329N 00930W b 5239N 00830W c 5229N 00930W d 5329N 00830W 161 An island is observed to be 15° to the left. The aircraft heading is 120° (M), variation 17° (W). The bearing (° T) from the aircraft to the island is:
a) 268 b) 302 c) 088 d) 122

662
Revision QuestionsChapter 38
162 An aircraft is flying around the Earth eastwards along the 60N parallel of latitude at a groundspeed of 240 knots. At what groundspeed would another aircraft have to fly eastwards along the Equator to fly once round the Earth in the same journey time?
a 600 knots b 240 knots c 480 knots d 120 knots
163 If it is 0700 hours Standard Time in Kuwait, what is the Standard Time in Algeria?
a 0500 hours b 0900 hours c 1200 hours d 0300 hours
164 If variation is West; then:
a True North is West of Magnetic North b Compass North is West of Magnetic North c True North is East of Magnetic North d Magnetic North is West of Compass North
165 Which of the following statements concerning the position indicated on the Inertial Reference System (IRS) display is correct?
a The positions from the two IRSs are compared to obtain a ‘best position’ which is displayed on the IRS.
b It is updated when ‘go-around’ is selected on take-off c It is constantly updated by information obtained by the FMC d It is not updated once the IRS mode is set to NAV
166 At what latitude does the maximum difference between geodetic and geocentric latitude occur?
a 0° b 45° c 60° d 90°
167 At what times of the year does the length of the hours of daylight change most rapidly?
a Spring Equinox and Autumn Equinox b Summer Solstice and Winter Solstice c Spring Equinox and Summer Solstice d Autumn Equinox and Winter Solstice
168 Given: Aircraft height = 2500 feet, ILS GP angle = 3°, at what approximate distance from the threshold can you expect to intercept the glide-path?
a 8.0 nm b 14.5 nm c 13.1 nm d 7.0 nm

663
Chapter 38Revision Questions
169 Convert 70 metres/sec into knots.
a 136 knots b 36 knots c 146 knots d 54 knots
170 In an INS, what is the output of the E/W second-stage integrator?
a Velocity N/S b Distance N/S c Distance E/W d Velocity E/W
171 The chart that is generally used for navigation in polar areas is based on a:
a Direct Mercator Projection b Gnonomic projection c Lambert conformal projection d Stereographic projection
172 Which of the following conversions from True to Compass is the correct one?
T V M D C a 130 2W 132 -1 131 b 130 2E 132 -1 133 c 130 2W 132 -1 133 d 130 2E 132 -1 133
173 Your position is 5833N 17400W. You fly exactly 6 nm eastwards. What is your new position?
a 5833N 17411.5W b 5833N 17355W c 5833N 17340W d 5833N 17348.5W
174 TAS = 240 knots. Track is 180°T. The relative bearing from an NDB is 315R at 1410. At 1420 the bearing has changed to 270R. What is your distance from the NDB at 1420?
a 40 nm b 50 nm c 60 nm d 70 nm
175 Given: True Track = 352 Variation = 11W Deviation = - 5 Drift = 10 R What is Heading (C)?
a 078 C b 346 C c 358 C d 025 C

664
Revision QuestionsChapter 38
176 What is the definition of EAT?
a Estimated on-blocks arrival time b Estimated time overhead the destination airfield c Estimated initial approach fix time d Estimated final approach fix time
177 What is the radial and DME distance from CRK VOR (5151N 00830W) to position 5220N 00910W?
a 322M 39nm b 330M 41nm c 330M 39nm d 322M 41nm
178 What is the radial and DME distance from SHA VOR (5243N 00853W) to Birr airport (5304N 00755W)?
a 068M 42nm b 060M 40nm c 068M 40nm d 060M 42nm
179 What is the lat and long of the SHA VOR (5243N 00853W) 239M / 36nm radial/range?
a 5215N 00930W b 5220N 00937W c 5212N 00930W d 5212N 00915W
180 A Lambert conformal conic chart has a constant of the cone of 0.80. A straight line course drawn on this chart from A (53°N 004°W) to B is 080° at A; course at B is
092°. What is the longitude of B? a 019°E b 008°E c 009°36’E d 011°E
181 An aircraft at position 0000 N/S 16327W flies a track of 225°T for 70 nm. What is its new position?
a 0049N 16238W b 0049S 16238W c 0049N 16416W d 0049S 16416W
182 On a Polar Stereographic map, a straight line is drawn from position A (70N 102W) to position B (80N 006E). The point of highest latitude along this line occurs at longitude 035 W. What is the initial straight-line track angle from A to B, measured at A?
a 049°T b 077°T c 229°T d 023°T
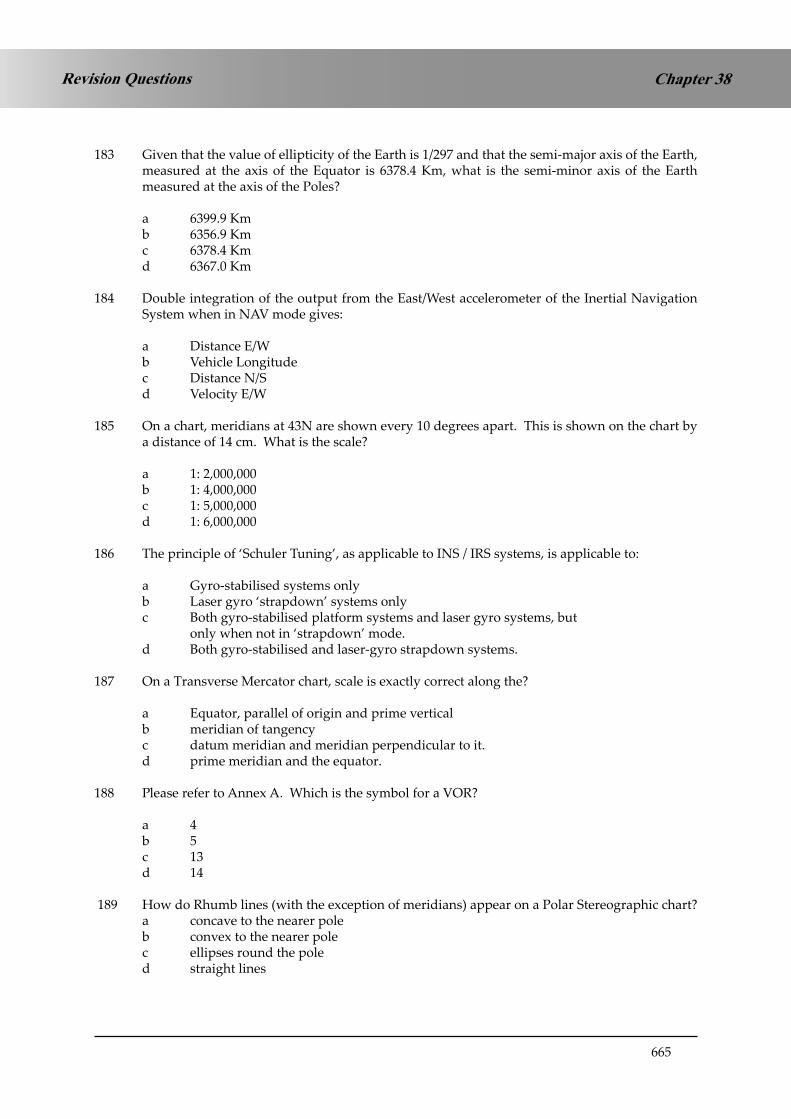
665
Chapter 38Revision Questions
183 Given that the value of ellipticity of the Earth is 1/297 and that the semi-major axis of the Earth, measured at the axis of the Equator is 6378.4 Km, what is the semi-minor axis of the Earth measured at the axis of the Poles?
a 6399.9 Km b 6356.9 Km c 6378.4 Km d 6367.0 Km
184 Double integration of the output from the East/West accelerometer of the Inertial Navigation System when in NAV mode gives:
a Distance E/W b Vehicle Longitude c Distance N/S d Velocity E/W
185 On a chart, meridians at 43N are shown every 10 degrees apart. This is shown on the chart by a distance of 14 cm. What is the scale?
a 1: 2,000,000 b 1: 4,000,000 c 1: 5,000,000 d 1: 6,000,000 186 The principle of ‘Schuler Tuning’, as applicable to INS / IRS systems, is applicable to: a Gyro-stabilised systems only b Laser gyro ‘strapdown’ systems only c Both gyro-stabilised platform systems and laser gyro systems, but only when not in ‘strapdown’ mode. d Both gyro-stabilised and laser-gyro strapdown systems.
187 On a Transverse Mercator chart, scale is exactly correct along the?
a Equator, parallel of origin and prime vertical b meridian of tangency c datum meridian and meridian perpendicular to it. d prime meridian and the equator.
188 Please refer to Annex A. Which is the symbol for a VOR?
a 4 b 5 c 13 d 14
189 How do Rhumb lines (with the exception of meridians) appear on a Polar Stereographic chart? a concave to the nearer pole b convex to the nearer pole c ellipses round the pole d straight lines

666
Revision QuestionsChapter 38
190 In which IRS mode does gyro-compassing take place? a ON b STANDBY c ATT / REF d ALIGN 191 Please refer to Annex A. What does symbol 3 represent? a lit obstacle b lighthouse c VRP d aeronautical ground light 192 The purpose of the FMS is to: a provide continuous automatic navigation, guidance, and performance management. b provide continuous manual navigation, guidance, and performance management c provide continuous manual navigation, guidance and automatic performance
management d provide continuous automatic navigation, guidance and manual performance
management 193 What is the chart convergence factor on a polar stereographic chart?
a 0 b 1.0 c 0.866 d 0.5 194 At 0422 you are 185 nm from a VOR at FL 370. You need to descend at a mean descent rate of
1800’/min to be at FL 80 overhead the VOR. Your groundspeed in the level cruise is currently 320 knots. In the descent your mean G/S will be 232 knots. What is the latest time to commence descent?
a) 0437 b) 0441 c) 0444 d) 0451
195 Given: Heading 165(M), Variation 25W, Drift 10° R, G/S 360 knots. At ‘A’ your relative bearing to an NDB is 325R. Five minutes later, at ‘B’, the relative bearing is 280R. What is the True Bearing and Distance from ‘B’ to the NDB?
a) 060°T 40nm b) 105°T 30nm c) 060°T 30nm d) 105°T 40nm 196 What is the diameter of the Earth? a) 40000 km b) 12732 km c) 21600 km d) 6366 km

667
Chapter 38Revision Questions
197 An aircraft on the Equator accelerates whilst traveling westwards. What will be the effect on a direct reading compass?
a) Indicates an increase in heading b) No change c) Indicates a decrease in heading d) Indicates an apparent turn to the North 198 An aircraft flies 100 st mile in 20 minutes. How long does it take to fly 215 nm? a) 50 mins b) 37 mins c) 57 mins d) 42 mins
199 What is the duration of civil twilight?
a) From the moment when the centre of the sun is on the sensible horizon until the centre reaches a depression angle of 6° from the sensible horizon.
b) From the moment when the tip of the sun disappears below the sensible horizon until the centre reaches a depression angle of 6° from the sensible horizon.
c) From the moment when the centre of the sun is on the visual horizon until the centre reaches a depression angle of 6° from the sensible horizon.
d) From the moment when the tip of the sun disappears below the visual horizon until the centre reaches a depression angle of 6° from the sensible horizon.
200 Please refer to Annex B (or your Jeppesen E(LO)1). From the Connaught (CON, 5355N 00849W) VOR / DME, you plot a radial of 048 oM and a
range of 22 nm. What is the aircraft position? a) 5410N 00844W b) 5350N 00821W c) 5407N 00837W d) 5411N 00824W 201 What is the shortest distance between Point ‘A’ (3543N 00841E) and Point ‘B’ (5417N 17119W)? a) 5400 nm b) 6318 nm c) 6557 nm d) 6000 nm 202 On a conformal chart, the standard parallels are 41° 20°N and 11° 40°N. What is the constant
of the cone? a) .660 b) .202 c) .446 d) .895

668
Revision QuestionsChapter 38
203 Given: Runway direction 083°(M), Surface W/V 035/35kt. Calculate the effective headwind component.
a 24 kt b 27 kt c 31 kt d 34 kt 204 Given: TAS=375 Trk=335 °T W/V=340 °T/50 What is heading and Groundspeed? a) 335 °T 322 b) 335 °T 318 c) 336 °T 326 d) 333 °T 326 205 Lines of latitude on a chart are always: a) Great Circles b) Small Circles except for the Equator c) Vertices d) Meridians 206 You enter the start position of an INS from a ramp at 7019.2N 13946.3W but you incorrectly
enter 13946.3E instead of W. You fly to 7019.2N 180E/W without updating the INS in flight. What longitude is indicated on your INS present position display?
a) 08027E b) 09933E c) 08027W d) 09933W 207 On a Lambert chart, the constant of the cone is .78585. What is the parallel of tangency? a) 51°02’ b) 51°36’ c) 51°15’ d) 51°48’ 208 On a Lambert’s chart the constant of the cone is 0.80. A is at 53N 04W. You plan to fly to B. The
initial Lambert’s chart straight-line track is 070T and the Rhumb Line track from A to B is 082T. What is the longitude of B?
a) 26E b) 34W c) 11E d 15E
209 On which chart projection is it not possible to show the North Pole? a) Direct Mercator b) Lamberts c) Transverse Mercator d) Polar Stereographic

669
Chapter 38Revision Questions
210 You are at FL 150 and the SAT is -5°C. You are over an airport with an elevation of 720 feet. The QNH is 1003. Assume 27 feet = 1HPa.
What is your true height? a) 14300 feet b) 15300 feet c) 14700 feet d) 15600 feet 211 What is the formula for Conversion Angle? a) Change of longitude × Sine latitude b) Change of longitude / 2 × Sine mean longitude c) Change of longitude / 2 × Sine mean latitude d) Change of longitude × Cosine latitude 212 On the Polar Stereographic projection, a Great Circle appears as: a) a straight line b) a curve which becomes more near to a straight line as the latitude increases c) a curve convex to the nearer pole d) a curve which can be concave or convex to the nearer pole, depending on the latitude 213 What is the input to an INS which allows it to compute W/V? a) Altitude and OAT b) IAS c) Mach No d) TAS
214 An aircraft departs Guam ( 13N 145E) at 2300 Standard Time on 30th April local date. Flight Time to Los Angeles, California, USA (34N 118W) is 11 hours 15 minutes. What is the California Standard Time and local date of arrival? Assume Summer Time is being kept.
a) 1715 ST 30 Apr b) 1215 ST 01 May c) 1315 ST 01 May d) 1615 ST 30 Apr
(NB The Standard time Difference for Guam is 10 hours – not given in our version of the Air Almanac, but the right page will be available in the exam).
215 The FMC can calculate:
1) Fuel necessary to divert round bad weather.2) Fuel required for a missed approach, climb to altitude and fuel required to alternate.
The correct combination is:
a) (1) only b) (2) only c) Neither d) (1) and (2)
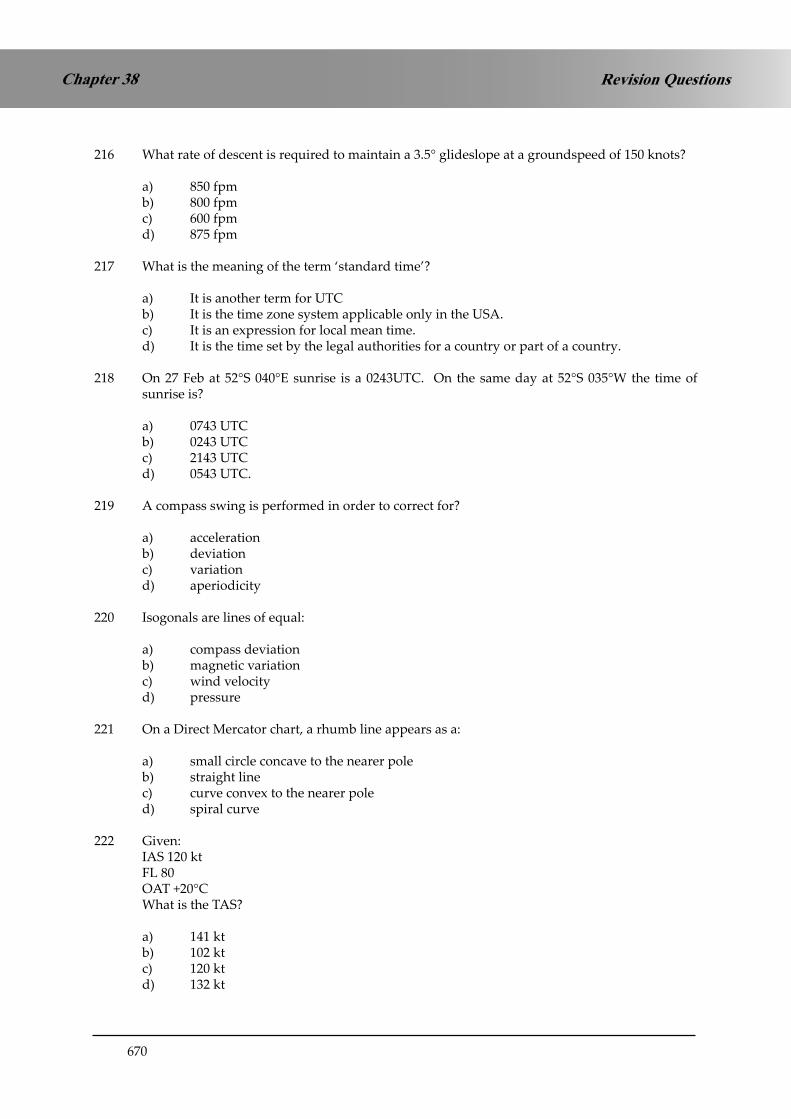
670
Revision QuestionsChapter 38
216 What rate of descent is required to maintain a 3.5° glideslope at a groundspeed of 150 knots?
a) 850 fpm b) 800 fpm c) 600 fpm d) 875 fpm
217 What is the meaning of the term ‘standard time’?
a) It is another term for UTC b) It is the time zone system applicable only in the USA. c) It is an expression for local mean time. d) It is the time set by the legal authorities for a country or part of a country. 218 On 27 Feb at 52°S 040°E sunrise is a 0243UTC. On the same day at 52°S 035°W the time of
sunrise is?
a) 0743 UTC b) 0243 UTC c) 2143 UTC d) 0543 UTC.
219 A compass swing is performed in order to correct for?
a) acceleration b) deviation c) variation d) aperiodicity
220 Isogonals are lines of equal:
a) compass deviation b) magnetic variation c) wind velocity d) pressure
221 On a Direct Mercator chart, a rhumb line appears as a:
a) small circle concave to the nearer pole b) straight line c) curve convex to the nearer pole d) spiral curve
222 Given: IAS 120 kt FL 80 OAT +20°C What is the TAS?
a) 141 kt b) 102 kt c) 120 kt d) 132 kt

671
Chapter 38Revision Questions
223 The distance between two waypoints is 200 NM. To calculate compass heading the pilot used 2°E magnetic variation instead of 2°W. Assuming
that the forecast W/V applied, what will the off track distance be at the second waypoint?
a) 14 NM b) 7 NM c) 0 NM d) 21 NM
224 Given: True Course 300° Drift 8°R Variation 10°W Deviation -4° Calculate the compass heading.
a 322° b 306° c 278° d 294°
225 Given: True track 180° Drift 8°R Compass Heading 195° Deviation -2° Calculate the variation.
a 21°W b 25°W c 5°W d 9°W
226 Given the following: Magnetic heading: 060° Magnetic variation: 8°W Drift angle: 4° right What is the true track?
a 064° b 056° c 072° d 048°

672
Revision QuestionsChapter 38
227 An aircraft was over ‘Q’ at 1320 hours flying direct to ‘R’. Given: Distance ‘Q’ to ‘R’ 3016 NM True air speed 480 knots Mean wind component ‘out’ -90 kt Mean wind component ‘back’ +75 kt Safe endurance 10:00 HR
The distance from ‘Q’ to the Point of Safe Return (PSR) is:
a 2370 NM b 2290 NM c 1510 NM d 1310 NM
228 Given: Half way between two reporting points the navigation log gives the following information: TAS 360 kt W/V 330°/80 kt Compass heading 237° Deviation on this heading -5° Variation 19°W What is the average ground speed for this leg?
a 403 kt b 354 kt c 373 kt d 360 kt
229 (For this question use Annex C) Complete line 5 of the ‘FLIGHT NAVIGATION LOG’, position ‘J’ to ‘K’. What is the HDG°(M) and ETA?
a HDG 337° - ETA 1422 UTC b HDG 320° - ETA 1412 UTC c HDG 337° - ETA 1322 UTC d HDG 320° - ETA 1432 UTC
230 A laser reference system (IRS), as compared to a gyro reference system (INS):
a is not strapped down and is adversely affected by g-forces b is strapped down and is not adversely affected by g-forces c the platform is strapped down but the accelerometers are not d the accelerometers are strapped down but the platform is not
231 On a Transverse Mercator projection, a parallel of latitude other than the equator is:
a an ellipse b parabolic c hyperbolic d a straight line

673
Chapter 38Revision Questions
232 During a low level flight 2 parallel roads are crossed at right angles by an aircraft. The time between these roads can be used to check the aircraft:
a track b drift c groundspeed d heading
233 The angle between the true great-circle track and the true rhumb-line track joining the following points: A (60S 165W) and B (60S 177E) at the place of departure A, is?
a 9° b 15.6° c 5.2° d 7.8°
234 Which of the following indicates an advisory airspace (ADA) boundary?
a b c d
235 Given the following: True track: 192° Magnetic variation: 7° E Drift angle: 5° left What is the magnetic heading required to maintain the given track?
a 180° b 190° c 194° d 204°
236 Given: A polar stereographic chart whose grid is aligned with the zero meridian. Grid track 344° ,
Longitude 115° 00’W, calculate the true course? (Assume N Hemisphere).
a 099° b 279° c 049° d 229°
237 The rhumb-line distance between points A (60° 00’N 002° 30’E) and B (60° 00’N 007° 30’W) is:
a 300 nm b 450 nm c 600 nm d 150 nm

674
Revision QuestionsChapter 38
238 Given: TAS = 485 kt, OAT = ISA +10° C, FL 410. Calculate the Mach Number.
a 0.87 b 0.825 c 0.90 d 0.85
239 Fuel flow per HR is 22 US-GAL, total fuel on board is 83 IMP GAL. What is the endurance?
a 2 hr 15 min b 4 hr 32 min c 3 hr 12 min d 3 hr 53 min
240 Given: Position A is 60N 020W, Position B is 60N 021W, and Position C is 59N 020W, what are, respectively, the distances from A to B and from A to C?
a) 60nm and 30nm b) 30nm and 60 nm c) 52 nm and 60nm d) 60nm and 52 nm
241 Given: FL 350, Mach 0.80, OAT -55°C, calculate values for TAS and local speed of sound?
a) 461 kt, LSS 296 kt b) 461 kt, LSS 576 kt c) 237 kt, LSS 296 kt d) 490 kt, LSS 461 kt
242 How many nautical miles are travelled in 1 minute 45 seconds at a groundspeed of 135 knots?
a) 2.36 b) 3.25 c) 39.0 d) 3.94
243 The distance A to B is 90 nm in a straight line. You are 60 nm from A when you fix your position 4 nm to the left of track. What correction do you need to make to arrive at B?
a) 4° b) 8° c) 12° d) 10°
244 A Great Circle crosses the Equator at longitude 030°W. The direction of the GC at Equator is 035°T. An aircraft following this Great Circle will reach its highest latitude (N or S) at position:
a) 35S 120W b) 55S 060E c) 35N 120W d) 55N 060E

675
Chapter 38Revision Questions
245 The heading is 299°G. Magnetic variation is 90°W and chart convergence is 55°W. What is magnetic heading?
a) 154°M b) 084°M c) 264°M d) 334°M
246 The orbit of the Earth round the Sun is elliptical. An ellipse has 2 foci. Which of the following is a correct statement?
a) The Earth is positioned at one of the foci. b) The Sun is positioned at the mid-point of the 2 foci. c) The Sun is positioned at one of the foci. d) The Earth is positioned at the mid-point of the 2 foci.
247 If acceleration is zero:
a) Velocity decreases b) Velocity increases c) Velocity is constant d) Velocity is zero
248 An aircraft homing to a VOR/DME loses 2500 feet in 11.1 nm change of DME range. What is the gradient of the slope?
a) 4.1% b) 3.5% c) 3.9% d) 3.7%
249 An aircraft at position 8500N 02000E flies a Rhumb Line track of 075°T. What will be its path over the Earth?
a) The shortest route to a destination b) A spiral path leading towards the North Pole c) A Great Circle route continuing over the pole and then southwards over the other side d) An increasing track angle
250 Given: For take-off an aircraft requires a headwind component of at least 10 kt and has a cross-wind limit of 35 kt. The angle between the wind direction and the runway is 60°. Calculate the maximum and minimum allowable windspeeds.
a) 20 kt and 40 kt b) 15 kt and 43 kt c) 12 kt and 38 kt d) 18 kt and 50 kt
251 From the departure point, the distance to the point of equal time is:
a) proportional to the sum of groundspeed out and groundspeed back b) inversely proportional to the total distance to go c) inversely proportional to ground speed back d) inversely proportional to the sum of ground speed out and ground speed back

676
Revision QuestionsChapter 38
Appendix A to Revision QuestionsAppendix A to Consolidation Questions

677
Chapter 38Revision Questions
Appendix B to Revision Questions
GENERAL NAVIGATION SPECIMEN QUESTIONS
39 - 40 © Oxford Aviation Services Limited
Appendix B
Grid North
85N
80N
75N
90 E
0º E/W
100 nm 200 300 400 500 nm
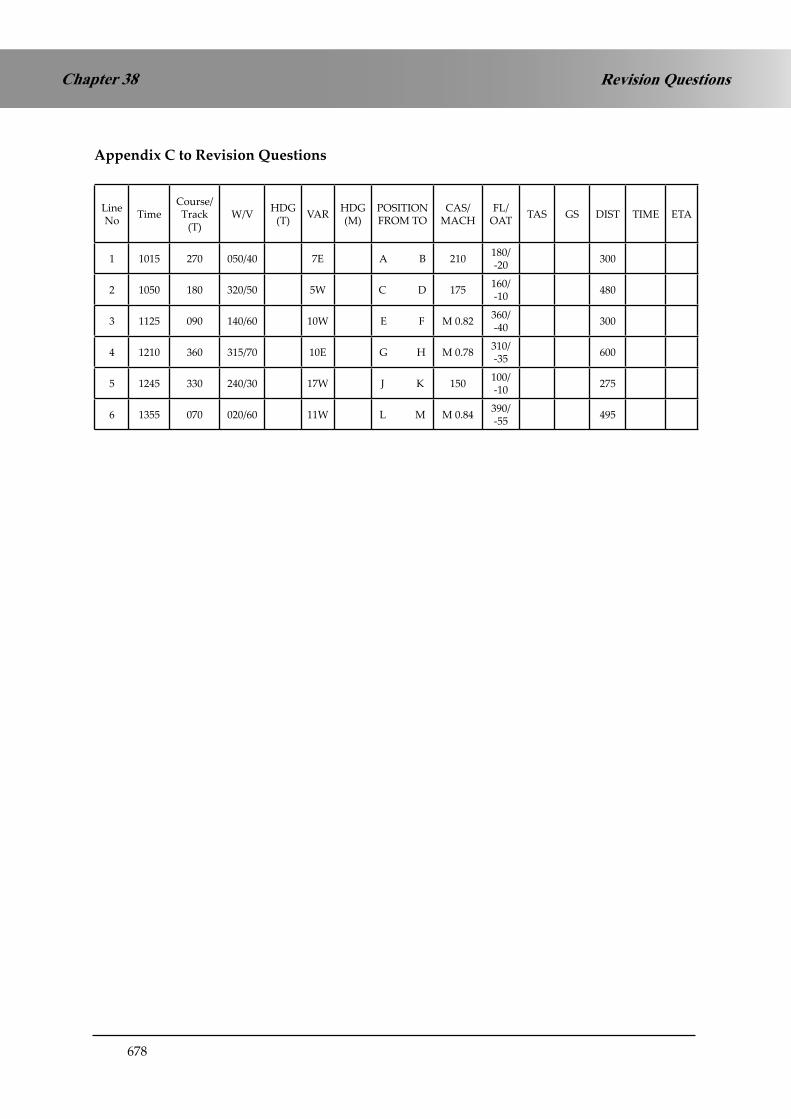
678
Revision QuestionsChapter 38
Appendix C to Revision Questions
Line No Time
Course/ Track
(T)W/V HDG
(T) VAR HDG(M)
POSITION FROM TO
CAS/ MACH
FL/ OAT TAS GS DIST TIME ETA
1 1015 270 050/40 7E A B 210 180/-20 300
2 1050 180 320/50 5W C D 175 160/-10 480
3 1125 090 140/60 10W E F M 0.82 360/-40 300
4 1210 360 315/70 10E G H M 0.78 310/-35 600
5 1245 330 240/30 17W J K 150 100/-10 275
6 1355 070 020/60 11W L M M 0.84 390/-55 495

679
Chapter 38Revision Questions
ANSWERS
1 c A common mistake here is to set the W/V, then put 200 up at the 12 o’clock index and just read the drift and groundspeed off. But that is the answer for a HEADING of 200. The question asks for a TRACK of 200. You now have to lay off for drift, which will give you a heading of 217 at the top, balanced by 17 degrees of port drift, giving a track of 200.
2 c
3 b We recommend that you use the CRP-5 for true altitude problems, especially if the question gives you the actual SAT instead of ISA deviation. But if you want to use the formula, the ISA deviation is +30 degrees:
True Alt = 5000 + (+30 x 4/1000 x 5000) = 5600 feet
which is pretty close to answer (b).
4 d You would expect the greatest drift when the wind direction makes the greatest angle with from the track or reciprocal direction (the JAA use the word ‘course’ to mean ‘desired track’). The reciprocal track of 040° is 220° and answer (d) is the furthest from 220°.
5 c
6 a You should note that these longitudes are meridian and anti-meridian. This is the over-the-pole case.
7 a If your compass heading is 090 C, you can fill in the following table:
T V M D C 100 12E 088 2W 090
So your true heading is 100. VOR radials are always magnetic, so you are flying a true track of 082. Your TAS is 160. If you have gone 14 nm in 6 mins, your G/S is 140. Now use your CRP-5 as in Chapter 6.
8 b This question is solved by scale drawing. Use the scale to draw a line 480 nm along the 110°E meridian from the North Pole, then plot a line 300 nm in a direction of 154°Grid.
9 b
10 c This is a departure question. A very similar example is given on in Chapter 15
11 c
12 a
13 a
14 a
15 b

680
Revision QuestionsChapter 38
16 a
17 c With a Direct Reading Compass, the compass needle or magnetic assembly (for instance, the magnets in the centre of the vertical card) have to physically take up the alignment of north, which involves overcoming friction. With a Slaved Gyro Compass, the 3 legs of the flux valve pick up different amounts of magnetic flux on different headings. No friction needs to be overcome when the aircraft alters heading and so the system is more sensitive.
18 a
19 b
20 c
21 d
22 c This question is intended to check understanding of the difference between INS and IRS (as fitted to FMS). In old-fashioned INS it was possible to put in an incorrect initial latitude and longitude and the system would accept the information without checks. If the longitude was in error, the system would never know and, apart from the fact that it was showing the incorrect position, it would align and operate normally. However, if latitude was in error it would adversely affect the alignment, because the gyrocompassing process uses sine and cosine latitude as part of the alignment calculation. If the latitude was more than about, say, ten degrees out, the system would probably not align at all. Therefore you can say that the INS accepts incorrect longitude but rejects latitude error.
IRS/FMS is more modern technology and has greater computing power and a non-volatile memory, It therefore remembers where it was shut down after the last flight. When you input your present position on at start-up on the next flight, if it is more than a certain distance (about 5 km, to allow for moving the aircraft to another part of the airport), the software rejects the new position. We therefore say that IRS/FMS rejects incorrect latitude or longitude.
23 b
24 c A process known as Kalman filtering compares the positions generated by each IRS with a series of DME/DME cross-cut fixes. The history of the pattern of IRS errors is built up over time and this data is used to build a mathematical model of IRS errors, which is then used to calculate the statistically most probable position This is not the same thing as the average of the DME/DME and IRS positions.
.25 b Answers: Waypoint names – eg, BLUFA navaid identifiers – eg, CPT runway
numbers – eg, 27L airport ICAO identifiers – eg, EGTK.
Many systems do not use waypoint numbers. Navaid frequencies are not unique and navaid positions would use more than 5 alpha-numerics. ¬
26 d A very similar question is in Chapter 14

681
Chapter 38Revision Questions
27 b FMS is invariably associated with IRS rather than INS. One of the changes which has taken place over the last 20-30 years of technological development is a vast increase in computer memory store. Unlike the older INS, IRS has a data base which can look up a value of variation for a given latitude and longitude position. The IRS is aligned to True North, then calculates Magnetic North from the data base variation.
28 a The given answer is a direct quote from a recommended CAA publication, so we are certain that it is the required option. However, it is a questionable statement. Manual input from the pilots is required during initialisation and we would describe the procedure as semi-automatic. Nevertheless, (a) is the ‘correct’ answer.
29 c FMS Chapter. See under Illuminated Annunciators – MSG
30 d
31 b After initial alignment and insertion of initial position, the IRS position is not further updated. It gets passed to the Kalman filter in the FMC where it is error modelled against the DME/DME fixes. The FMC position is updated in flight but the IRS position is not.
32 c Answer (d) is just noise. Of the other options, if you’ve got only 2 systems, not externally monitored against DME/DME or GPS, how can you tell which one is correct? Each is as likely to be correct as the other. Indeed, they might both be a bit wrong.
33 d The B737-400 uses DME/DME as the primary source to be Kalman-filtered against the IRS. However, if the DME/DME angle of cut is poor, it can revert to VOR/DME if the DME range is less than 30 nm. If the options given are ‘DME/DME’ or ‘VOR/DME’, choose ‘DME/DME’ because ‘VOR/DME’ on its own is wrong. But if ‘VOR/DME and DME/DME’ is an option, that is the one to go for.
34 c If you have 3 different IRSs, each will have slightly different errors (for instance, slightly different initial alignments, slightly different laser gyro wander rates, etc) which will result in slightly different computations of IRS position.
35 c Gyro-compassing is the final stage of alignment, after caging and levelling. During alignment, it is essential that the aircraft is not moved. The principle of both levelling and gyro-compassing depends on the accelerometers detecting the direction of gravity (ie, vertically downwards) very accurately. If there is any horizontal acceleration it will be detected along with the acceleration due to gravity and the direction sensed will be the resultant of the 2 accelerations, which will not be vertical.
36 d With IRS, the initial present position is usually entered via the FMS, so there is no need for the STBY position used in the INS.
37 c 74 nm @ the planned G/S of 115 knots = 38.6 mins 250 nm @ the planned G/S of 115 knots = 130.4 mins After 74 nm, the actual elapsed time = 40.1 mins Therefore the flight time for 250 nm at the revised G/S = 130.4 x 40.1 / 38/6 This comes to 135 mins. 0900UTC + 135 mins = 1115UTC

682
Revision QuestionsChapter 38
38 b There are 2 separate effects here, both dependent on time. Firstly, the heading error will increase with time, ie, if the azimuth gyro drift rate is 0.1 degrees/hour, then the heading will be in error by 0.1 degrees after the first hour, 0.2 degrees in error after the second hour, etc. That is the heading error.
However, in addition, the cross-track position error increases with time. If there is a steady heading error of, say, one degree, then using the one in sixty rule, after 60 nm along track, the aircraft will be one nm across track, but after 120 nm along track, the aircraft will be 2 nm across track, and so on.
So the cross-track error increases with time for a fixed heading error AND, with an azimuth drift rate, the heading error increases with time. These 2 effects multiply together, so the cross-track position error increases proportionally to t².
39 d The formula is X = DH / (O + H).
40 c
41 c ETA B and ETA C are not relevant. You fly 30 nm in 17 mins. How long will it take you to fly the remaining 20 nm at the same groundspeed?
42 a
43 b This is a departure problem. Convert 165 km to nm, then use the departure formula to convert the nm to change of longitude.
44 a Convert 685 km to nm, which comes to 370 nm. If you track 180°T you are flying southwards along a meridian of longitude, ie, a great circle, so one nm equals one minute of latitude. 370 nm is therefore a change of latitude of 6° 10’ S.
45 b
46 d Plotting question. Solve by measurement on the chart.
47 b This is a PNR problem. T = EH/(O+H).
48 a
49 d Find the present TAS, apply the wind and get the present G/S (230 knots) 150 nm @ 230 k G/S is 39 mins. You need to arrive 5 minutes later, so your new time to
go is 44 mins. The new required G/S will be 150 nm in 44 mins, which is 205 k G/S The wind should not change, so the new required TAS will be 240 Then either use FL140/-5°C in the airspeed window to convert the TAS to 190 k CAS, or
put the old TAS (264) against the old IAS (210), then against 240 TAS, you will see 190. 210 to 190 is a 20 knot reduction in IAS (strictly CAS, but the PEC should not change
much in 20 knots).
Answer (d).
50 b This is a PNR problem. T = EH/(O+H).
51 c This is a CP problem. X = DH/(O+H).
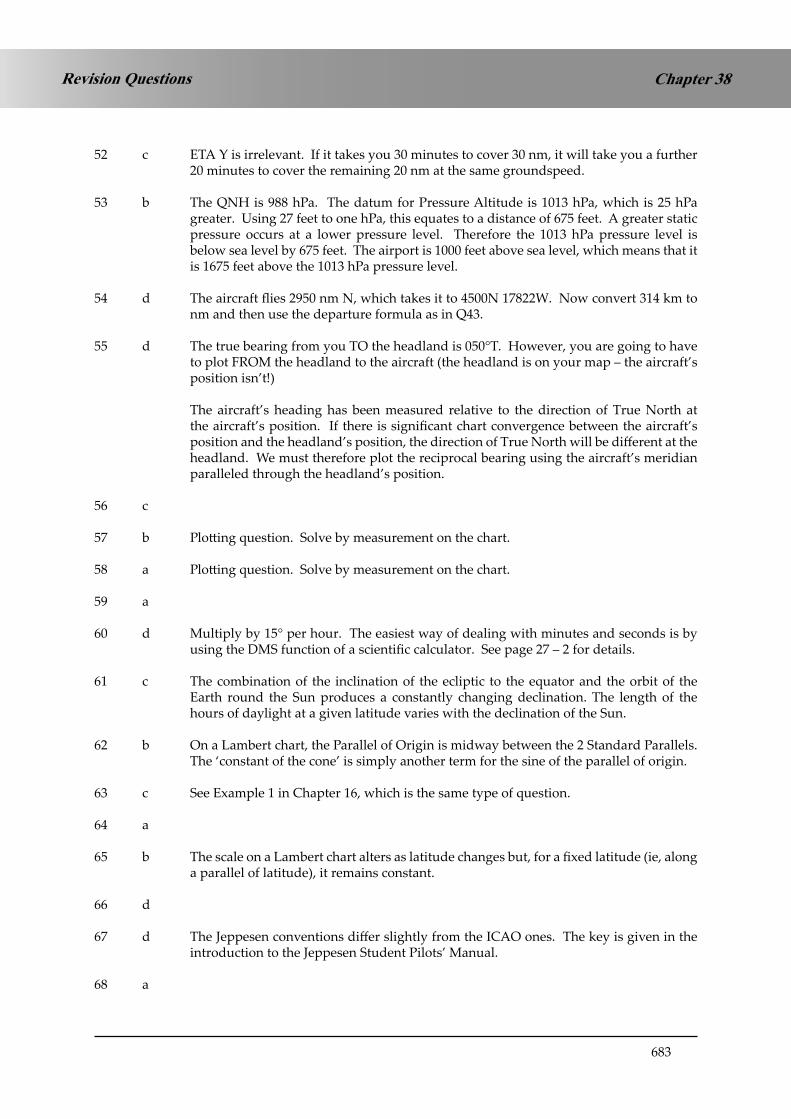
683
Chapter 38Revision Questions
52 c ETA Y is irrelevant. If it takes you 30 minutes to cover 30 nm, it will take you a further 20 minutes to cover the remaining 20 nm at the same groundspeed.
53 b The QNH is 988 hPa. The datum for Pressure Altitude is 1013 hPa, which is 25 hPa greater. Using 27 feet to one hPa, this equates to a distance of 675 feet. A greater static pressure occurs at a lower pressure level. Therefore the 1013 hPa pressure level is below sea level by 675 feet. The airport is 1000 feet above sea level, which means that it is 1675 feet above the 1013 hPa pressure level.
54 d The aircraft flies 2950 nm N, which takes it to 4500N 17822W. Now convert 314 km to nm and then use the departure formula as in Q43.
55 d The true bearing from you TO the headland is 050°T. However, you are going to have to plot FROM the headland to the aircraft (the headland is on your map – the aircraft’s position isn’t!)
The aircraft’s heading has been measured relative to the direction of True North at the aircraft’s position. If there is significant chart convergence between the aircraft’s position and the headland’s position, the direction of True North will be different at the headland. We must therefore plot the reciprocal bearing using the aircraft’s meridian paralleled through the headland’s position.
56 c
57 b Plotting question. Solve by measurement on the chart.
58 a Plotting question. Solve by measurement on the chart.
59 a
60 d Multiply by 15° per hour. The easiest way of dealing with minutes and seconds is by using the DMS function of a scientific calculator. See page 27 – 2 for details.
61 c The combination of the inclination of the ecliptic to the equator and the orbit of the Earth round the Sun produces a constantly changing declination. The length of the hours of daylight at a given latitude varies with the declination of the Sun.
62 b On a Lambert chart, the Parallel of Origin is midway between the 2 Standard Parallels. The ‘constant of the cone’ is simply another term for the sine of the parallel of origin.
63 c See Example 1 in Chapter 16, which is the same type of question.
64 a
65 b The scale on a Lambert chart alters as latitude changes but, for a fixed latitude (ie, along a parallel of latitude), it remains constant.
66 d
67 d The Jeppesen conventions differ slightly from the ICAO ones. The key is given in the introduction to the Jeppesen Student Pilots’ Manual.
68 a

684
Revision QuestionsChapter 38
69 b Apply 20°E variation to 345°M to get 005°T. 30° left of this is a True bearing of 335°T from you TO the headland. However, you are going to have to plot FROM the headland to the aircraft (the headland is on your map – the aircraft’s position isn’t!) You therefore plot the reciprocal of 155°T.
70 c As per the reply to Q3.
71 c
72 b Prior to going to NAV mode, the INS/IRS will be in ALIGN mode. Gyro-compassing is the final stage of alignment, after caging and levelling. During alignment, it is essential that the aircraft is not moved. The principle of both levelling and gyro-compassing depends on the accelerometers detecting the direction of gravity (ie, vertically downwards) very accurately. If there is any horizontal acceleration it will be detected along with the acceleration due to gravity and the direction sensed will be the resultant of the 2 accelerations, which will not be vertical. Therefore the INS/IRS must be selected to NAV mode before the aircraft is moved or the alignment will be destroyed.
73 b
74 d
75 a A 12% glideslope means that for every 100 knots you go forward horizontally, you go down 12 knots vertically. 12% of your forward speed of 540 is 64.8 knots vertically. Convert this to feet per min and you will see that option (a) is the nearest
76 d
77 a 65 nm @ 240 knots will take 16.25 minutes. I need to lose 23000 feet, also in 16.25 minutes. The required ROD is 23000/16.25 = 1415 feet per minute.
78 c The output of the first-stage N/S integrator is velocity N/S. N/S is the direction of the local meridian.
79 b The Jeppesen conventions differ slightly from the ICAO ones. The key is given in the introduction to the Jeppesen Student Pilots’ Manual.
80 c
81 b
82 b The lowest latitude at which there is at least one day a year without a sunset (MidSummer Day) and one day a year without a sunrise (MidWinter Day) is the Artic Circle (which is 66½°N). Therefore the sun will rise and set every day at 62N and 66N. The higher of these two is 66N.
83 a (Pressure alt + (ISA dev x 120) gives 27560; CRP5 gives 27000)
84 a This is a PNR problem. T = EH/(O+H).

685
Chapter 38Revision Questions
85 c Look up the LMT of sunrise at 49N on the 6th December. There is 3 minutes change between the 4th Dec and the 7th Dec. So, interpolating, the times at 50N and 45N are 0742 and 0723 respectively. That is a difference of 19 minutes. One-fifth of that is about 4 minutes, so the LMT of sunrise at 49N on the 6th December is 0738. Now set it out in a table:
Day Hour Minute Time LMT sunrise at Vancouver 6 Dec 07 38 LMT Arc/time 123° 30`W (long west, UTC best) - +08 14 - UTC 6 Dec 15 52 UTC
To calculate arc/time, enter the degrees and minutes in DMS format into your calculator and divide by 15.
86 b
87 d This is just the 1 in 60 rule. A 3-degree glide path gives you 300 feet per nautical mile. 25 nm @ 300 feet per nm is 7500 feet. That would be for a touch-down at zero feet at the runway threshold. However, height over the threshold is 50 feet, which has to be added.
88 c As always, use a table:
Day Hour Minute Time Standard Time at Queensland Today 06 00 ST STD (long east, UTC least) - -10 00 - UTC Yesterday 20 00 UTC STD (long west, UTC best) - -10 00 - Standard Time at Hawaii Yesterday 1000 00 ST
89 c
90 d
91 c
92 a
93 c The first leg takes it down to the Equator at 170 W, the second leg takes it to the Equator at 143W, the third leg takes it to 27N 143W and you then work out the change of longitude of 1620 nm due west departure at 27N, which is 30°18’ W, ie 17318W.
However, you don’t need to do the full calculation. You should realise that a departure of 3000 km will give a greater change of longitude at 27N than it will at the Equator. Therefore, the answer must be at 27N, but WEST of the 170W meridian. There is only one option which fits.
94 b Plotting question. Solve by measurement on the chart.
95 d You have 120 nm horizontal distance to travel at 288 knots. This will take 25 minutes. You need to lose 24000 feet in 25 minutes, which is 960 feet per minute.
96 c

686
Revision QuestionsChapter 38
97 a You need to lose 6500 feet at a rate of descent of 800 feet per minute. This will take 8.125 minutes. Flying for this time at a groundspeed of 156 knots gives a distance of 21.1 nm. However, this is 6 nm before the DME, so the total distance to start the descent is 27.1 nm.
98 d ATT mode on the IRS is the same as ATT REF on the INS. If you select ATT REF (on a typical IN) or ATT on the B737-400 IRS, either after switching OFF, or directly from NAV (following a computing, but not gyro, failure), the gyros now work as a combination of a superior form of DGI and ADI. If you have a period of steady unaccelerated flight, the gyros will erect to the vertical by sensing gravity from the accelerometers and the heading can then be set by the pilot to be the same as the heading from some other source (such as a slaved gyro compass).
Attitude information will stay good for the rest of flight, but the azimuth information is not corrected for Earth rate or Transport Wander, so whilst it will have the very low real drift rate associated with IN-quality gyros (in the order or 1/100 degree per hour), it still needs to be corrected every 20 minutes or so from another source because of the ER and TW drifts.
However, all nav computing facilities (readouts of latitude and longitude, drift, track, waypoint steering, distance to go, etc) are no longer available.
99 d See the reply to Q22.
100 c
101 d This is a 9-degree change of latitude. You could work this out as 540 nm and then convert it to km, but there is a quicker way. 90 degrees of change of latitude is 10,000 km (see page 2 – 11), so a 9 degree change of latitude will be 1000 km.
102 c Alignment time is faster than the 17 minutes or so for an INS. There is no requirement to spin up the gyro (which takes about 3 minutes) because the laser will fire up immediately. Of the remaining 14 mins for the older technology of the INS, this time has been reduced to about 10 minutes for the IRS.
103 d The thing to realise is that on a Mercator chart, meridians are drawn as parallel lines. Therefore if the 180E and 180W meridian are 133 cm apart at 53N, they will also be 133
cm apart at 30S. So now find the departure from 180E to 180W at 30S.
Dep = ch long x cos 30
= 360 x 60 x cos 30 = 18706 nm
You now have a simple scale problem. The Chart length is 133 cm, the Earth Distance is 18706. This gives you a scale of approximately 1:26 million. The nearest answer is (d). This seems a long way off, but we believe that these are the actual figures used in a JAA question.
104 d The others can be used with some equipments, but not all.
105 a

687
Chapter 38Revision Questions
106 b Find the True heading in the normal way, then apply variation and deviation. First, check that you have balanced the drift. When deviation is given as East or West then you use the DEVIATION EAST COMPASS LEAST RULE. However, deviation (not variation, only deviation) is sometimes quoted as plus or minus-. In this case the rule is that deviation is what you apply to the compass to get magnetic (not the other way round). So EAST deviation is plus and WEST deviation is minus.
107 d
108 b The INS calculates heading, track and groundspeed itself, but not TAS. It needs an input of TAS from an ADC in order to calculate wind.
(It does not calculate drift from the W/V or TAS, so answer c is wrong. Drift is calculated by comparing INS heading and INS track).
109 b
110 c 3 x 444 is 1332 km. Divide by 1.852 to get 719.2 nm. This has obviously been approximated to 720 to give 12° change of latitude, which takes us to latitude 02°S.
111 d The average Great Circle track is the Rhumb Line track.
112 c You should remember that the distance from the Equator to a Pole is 5400 nm (90° change of latitude x 60 nm per degree). So the Earth’s circumference is 4 x 5400, which is 21,600 nm. Alternatively, multiply 360° (a meridian plus the associated anti-meridian) by 60.
113 b
114 a The Rhumb Line track from 70S to 70S is along a parallel of latitude, so it will be 090T. However, the Great Circle track will ‘cut the corner’ and take the shortest route. This will be to the South of 090T. Draw it out on a Lambert’s style projection, or try it on a globe.
The conversion angle will be 42 degrees, so this makes the initial Great Circle track 132T.

688
Revision QuestionsChapter 38
115 b You can align with NAV selected on the MSU. If you go straight from STANDBY to NAV, it won’t go into NAV mode until it has finished aligning. B is correct.
“What is ATT mode?” - If an INS or IRS is switched OFF in flight, either inadvertently or in response to a checklist action, then the alignment is lost. If it subsequently becomes safe to switch it back on, you cannot get a full gyro-compassing in flight because the lateral accelerometer of the East gyro will not be able to distinguish between Earth rate and accelerations caused by movement of the aircraft. This is why the aircraft has to be stationary during ground alignment.
However, if you select ATT REF (on a typical IN) or ATT on the B737-400 IRS, either after switching OFF, or directly from NAV (following a computing, but not gyro, failure), the gyros now work as a combination of a superior form of DGI and ADI. If you have a period of steady unaccelerated flight, the gyros will erect to the vertical by sensing gravity from the accelerometers and the heading can then be set by the pilot to be the same as the heading from some other source (such as a slaved gyro compass).
Attitude information will stay good for the rest of flight, but the azimuth information is not corrected for Earth rate or Transport Wander, so whilst it will have the very low real drift rate associated with IN-quality gyros (in the order or 1/100 degree per hour), it still needs to be corrected every 20 minutes or so from another source because of the ER and TW drifts.
However, all nav computing facilities (readouts of latitude and longitude, drift, track, waypoint steering, distance to go, etc) are no longer available.
116 d
117 b
118 a
119 c 6°S is a greater value of latitude than 4°N. Therefore, for a given departure, you get a greater change of longitude eastwards. When you come back to 4°N again, 600 nm does not take you so far westwards. So you will finish up east of where you started.
120 b
121 a The gyro used for gyrocompassing is called the East gyro. The north and the east accelerometers are horizontal. All IRS and some INS have a vertical accelerometer as well, but this is not used in gyrocompassing.
122 b
123 b
124 c
125 a See my comments on Q57.
126 d
127 a CRP-5
128 b

689
Chapter 38Revision Questions
129 a The primary source of information in INS/IRS is acceleration, which is measured by entirely self-contained equipment. Accelerometers do not even use gravity – they are used in space navigation.
130 a
131 c Desired track is the computed track between 2 waypoints. It is not necessarily the track being flown by the aircraft at the time, which is shown when you select TK/GS on the CDU.
132 a Either use the CRP-5 or remember that there are 5 Imperial gallons to 6 US galls and the Imp Gall to litres conversion is 4.55. Then multiply by .78 to get the weight in kg, ie:
380 x 5/6 x 4.55 x .78 = 1123.85
It’s probably easier with the CRP-5.
133 c Distance still remaining = 475 – 190 = 285 nm. Time to go = 1130 - 1040 = 50 mins
134 c Plotting question. Solve by measurement on the chart. An explanation of the point about ‘both DME distances decreasing’ is given in the Plotting chapter.
135 d The Jeppesen conventions differ slightly from the ICAO ones. The key is given in the introduction to the Jeppesen Student Pilots’ Manual.
136 a Plotting question. Solve by measurement on the chart.
137 b Plotting question. Solve by measurement on the chart.
138 d Plotting question. Solve by measurement on the chart.
139 c This is not really covered in the notes. The navigation data base of the FMS contains established waypoints (ATC reporting points, VORs, DMEs, etc). However, you may be asked to steer to some place which is not a published waypoint. In that case, the pilot has to ‘create’ a waypoint, ie, input a position into the FMS. There are various formats in which this can be done:
a) Latitude and longitude
b) Place bearing/Distance (ie, SAM 180035 means 35 nm on the 180 radial from Southampton VOR/DME)
c) Place bearing/Place bearing (ie, SAM 135 / DVR 242 means where the 135 radial from Southampton meets the 242 radial from Dover)
d) Along track distance (ie, 15 nm along the centreline of the track between SAM and DVR).
However, you can’t create a “Place” - because it’s already in the data base. And you can’t input with 2 place distances because it gives 2 intersections, so the FMS doesn’t know which one to take.
690
Revision QuestionsChapter 38
140 b The mean great circle is the same as the rhumb line track. The question is asking which pairs of latitudes will give the greatest difference between great circle and rhumb line track, ie, which will give the greatest conversion angle?
The ca formula is 1/2 ch long sin mean lat.
If you keep the 1/2 ch long constant for all cases, then you are asking which pairs of latitudes will give you the greatest sine mean lat.
141 b The longitudes are the same so, from the given lats and longs, the True bearing of the aircraft from the VOR is 000/360. For VOR, you take the variation at the VOR, because the bearing is measured at the beacon. (For an ADF bearing, it would be the variation at the aircraft, because that is where the variation is measured).
142 a The Air Vector is 5 times as long as the Wind Vector, so the direction will be nearer 180 than 179. Try drawing the Triangle of Velocities out as a diagram.
143 b
144 a
145 b
146 b
147 a The combination of the inclination of the ecliptic to the equator and the orbit of the Earth round the Sun produces a constantly changing declination. The predominant cause of the Seasons is the inclination (tilt) of the Earth.
148 c Radials radiate. That’s what the word means. In other words they are, by definition, the magnetic bearing FROM the VOR. On the VOR in the aircraft you have a needle with 2 ends. The sharp end points to the VOR and is the QDM, or mag track to the VOR and the other end points to the QDR, or radial, which is the mag bearing from the VOR.
149 d Plotting question. Solve by measurement on the chart.
150 b Plotting question. Solve by measurement on the chart.
151 a Plotting question. Solve by measurement on the chart.
152 d Plotting question. Solve by measurement on the chart.
153 a
154 c See the answer to Q98. Option (c) is the best of the available answers, although, in fact, heading is also available, albeit in a limited form.
155 b

691
Chapter 38Revision Questions
156 c As the air becomes less dense, the aircraft has to fly faster through it (TAS) to experience the same dynamic pressure (CAS). So the TAS is increasing, which means that the Mach No would also increase even if there were no temperature change.
However, in addition, temperature normally decreases with increasing altitude. This means that the speed of sound will decrease so, for a given TAS, the Mach No will increase, giving an additional effect.
157 b
158 b
159 b
160 d Plotting question. Solve by measurement on the chart.
161 c Apply 17°W variation to 120°M to get 103°T heading. The island is 15° to the left, which makes the True bearing TO the island 088°T.
162 c This is a departure problem. In one hour, the aircraft covers 240 nm. The departure formula is:
Departure = change of longitude (minutes) x cosine latitude
240 nm = change of longitude (minutes) x cosine 60 (which is 0.5)
Change of longitude = 480 minutes.
At the Equator, 480 minutes = 480 nm, which also has to be covered in one hour.
163 a As always, use a table:
Day Hour Minute Time Standard Time at Kuwait Today 07 00 ST STD (long east, UTC least) -3 00 - UTC Today 04 00 UTC STD (long east, UTC least) +1 00 - Standard Time at Algeria Today 0500 00 ST
164 c
165 d The IRS is 30 years later technology and usually feeds into an associated FMS. The IRS itself cannot be updated after initialisation, but the FMS position can be – by the automatic systems, not by the pilots.
166 b
167 a
168 a This is just the 1 in 60 rule. A 3-degree glide path gives you 300 feet per nautical mile. Divide 2500 feet by 300 feet and the answer is just over 8 nautical miles.
169 a To convert metres into nm, divide by 1852. This gives you nm per second. Now multiply by 60 x 60 to convert to nm per hour, ie, knots.
70 x 3600/1852 = 136 knots

692
Revision QuestionsChapter 38
170 c
171 d Polar navigation can be ( and often is) carried out on a Polar Stereographic, a Transverse Mercator or an Oblique Mercator, in fact, but the JAA consider Polar Stereographic to be the preferred answer.
172 c
173 d This is a departure problem. The departure formula is:
Departure = change of longitude (minutes) x cosine latitude
6 nm = change of longitude (minutes) x cosine 58°33’
Change of longitude = 6/.5218 = 11.5 minutes (eastwards) from 174°00’W
174 a This is covered in detail in the ‘General Navigation Problems’ Chapter. The numbers are different but the principle is the same. If the question doesn’t give you any wind information, you can only assume that TAS = G/S.
175 c Don’t forget that a deviation of -5° is equivalent to 5°W.
176 c This topic is actually covered in our Flight Planning Notes (Book 7) but this question came up in a Gen Nav paper.
177 c Plotting question. Solve by measurement on the chart.
178 a Plotting question. Solve by measurement on the chart.
179 b Plotting question. Solve by measurement on the chart.
180 d ‘Constant of the cone’ is just another term for ‘sine of the parallel of origin’.
Chart convergence = change of longitude x sin parallel of origin
12° = change of longitude x 0.80 Change of longitude = 15°
15° eastwards from 004°W is 011°E.
181 d Resolve 70 nm along a track of 225 into their change of northings and change of eastings,ie, 70 sin45 and 70 cos 45. This gives 49nm south and 49 nm west. As you are at the equator, you can take the 49 nm west as 49 mins change of longitude - you don’t need the departure formula. So the final position is 49 mins south and 48 mins west of the original position.
182 d

693
Chapter 38Revision Questions
183 b The only problem with this question is the language, not the concept. The question is telling us that the polar diameter and the equatorial diameter of the Earth are in the ratio 296:297. The ‘semi-major axis of the Earth, measured at the axis of the Equator’ is simply half the Equatorial diameter and the ‘semi-minor axis of the Earth measured at the axis of the Poles’ is half the Polar diameter. We need to find half the Polar diameter, or the Polar radius.
Polar radius / 6378.4 = 296 / 297
So Polar radius = 6356.9 Km
Alternatively, you could remember from page 1 - 1 that the Polar diameter is 43 Km shorter than the Equatorial diameter. So the radius or semi-diameter will be 21.5 Km shorter.
6378.4 – 21.5 = 6356.9 Km. Either method gives you the right answer.
184 a
185 d This is a combination of a departure and a representative fraction (scale) problem.
Departure = change of longitude x cos latitude
10° (x 60, to get minutes) x .7314
= 438.8 nm
Scale = Chart Length / Earth Distance = 14 cm / (438.8 x 1852 x 100)
= 1 / 5.8 Million (approx), which is closest to (d).
186 d ‘Schuler tuning’ is another term for a V/R feedback loop to keep the measurement of acceleration level to the vertical as the aircraft travels over the Earth. It is necessary both for INS and IRS. In INS it is achieved by physically torqueing the platform. In IRS it is achieved by axis transformation in the computer.
187 b The ‘meridian of tangency’ is the Datum Meridian.
188 c
189 a
190 d Gyro-compassing is part of the alignment process.
191 d
192 a The given answer is a direct quote from a recommended CAA publication, so we are certain that it is the required option. However, it is a questionable statement. The pilots can amend or update the process in flight and change the profile and we would describe the procedure as semi-automatic. Nevertheless, (a) is the ‘correct’ answer.
193 b

694
Revision QuestionsChapter 38
194 c There are 2 parts to this profile. You are going to continue to fly at FL370 until the top of descent, and then descend to FL80. The question is asking for the ETA for top of descent.
From FL370 to FL80 is 29000 feet. At 1800 feet per minute, that is 16.1 minutes. Your mean groundspeed in the descent is 232 knots so, for 16.1 mins, that is 62 nm in the descent.
Your total distance to run is 185 nm. If there are 62 nm is the descent, the high level distance to top of descent is 123 nm. 123 nm @ your level groundspeed of 320 is 23 mins. Add 23 to 0422 to get 0445. (c) is the nearest answer.
195 c True heading is 140, true track is 150. Relative bearing at A is 35° left of the nose, ie a True bearing of 105 to the NDB. At B, the NDB is 80 left of the nose, True bearing to the NDB is 060.
So you now have 3 lines. A track line of 150, and a bearing from A of 105 and a bearing from B of 060. This gives a right angles isosceles triangle, with the 2 short sides being 30 nm long (5 minutes at 360 knots G/S). Draw it out and it become obvious.
196 b You are not supposed to remember the diameter of the Earth. But you should know that the circumference of the Earth is 40,000 km. Circumference = 2 π r (or π d). So divide 40000 km by π.
197 b At the Equator there is little or no dip angle. There is therefore no acceleration error.
198 a Use the CRP-5.
199 d
200 d Plotting question. Solve by measurement on the chart.
201 a Plotting question. Solve by measurement on the chart.
202 c On a Lambert chart, the parallel of origin is midway between the 2 Standard Parallels, which in this case is 26°30`. Sine 26°30` is 0.446.
203 a CRP-5 problem.
204 c
205 b
206 b You have started from an incorrect position about 80° of longitude too far East (work out the exact number yourself). So the final position will also be about 80° too far East of the correct position, at the same latitude.
207 d The ‘constant of the cone’ is the sine of the parallel of origin (or tangency). Simply use your calculator to find the arc sine of 0.78585. Use the DMS button if you need to convert the answer from degrees and decimal degrees to degrees and minutes.

695
Chapter 38Revision Questions
208 a The ‘constant of the cone’ is another term for the sine of the parallel of origin. The initial straight-line track is 070 and the mean is 082. Therefore half chart convergence is 12 degrees, so the chart convergence between A and B is 24 degrees.
Chart convergence = change of longitude x sine parallel of origin
Therefore change of longitude = chart convergence/sin parallel of origin
Change of longitude = 24/.8 = 30 degrees.
30 degrees east of 04W is 026E. 209 a The North Pole is in the hole at the end of the cylinder.
210 c (The correct answer is 14610, but 14700 was the nearest option).
211 c
212 b
213 d The INS calculates heading, track and groundspeed itself, but not TAS. It needs an input of TAS from an ADC in order to calculate wind.
214 a As always, use a table:
Day Hour Minute Time Standard Time at Guam 30 Apr 23 00 ST STD (long east, UTC least) -10 00 UTC 30 Apr 13 00 UTC Flight Time +11 15 UTC arrival at Los Angeles 01 May 00 15 UTC STD (long west, UTC best) -8 00 Standard Time at LA 30 Apr 16* 15 ST * But California Summer Time rules apply. Add an hour to get 1715.
215 b The fuel required to divert round bad weather will vary according to many extra track miles are required and the FMC has no way of calculating this. However, standard figures are available for missed approaches and normal diversion track to alternates.
216 d
217 d
218 a The change in longitude between 040°E and 035°W is 75°. The Earth rotates at 15° per hour, so this is equivalent to 5 hours of time. The Earth rotates eastwards, so a westerly longitude will have a later UTC sunrise time.
219 b
220 b
221 b

696
Revision QuestionsChapter 38
222 a
223 a This is just the one in sixty rule. The variation is 4° in error. For each 60 nm between waypoints, the aircraft will be 4 nm off track.
Dist off = 4 x 200 / 60 = 13⅓ nm
224 b The JAA use the term ‘course’ to mean ‘desired track’. If the drift is 8° starboard, the True heading is 292°T. With 10°W variation, this is 302°M. Negative deviation must be applied to the compass to give magnetic heading, so the compass heading is 306°M. In other words, -4° deviation is the same as 4°W.
225 a If the compass heading is 195C, apply -2 degrees deviation to get 193 Mag heading. If you have a True Track of 180 and 8 degrees starboard drift, the True heading must be
172 T. With a heading of 172T and 195M, you have 21 degrees West variation.
226 b Apply 8°W variation to 060°M to get 052°T. With 4° starboard drift, the true track is 056°T.
227 b This is a PNR problem. T = EH/(O+H).
228 a
229 a
230 b
231 a
232 c Groundspeed is the only of these options which depends on time difference.
233 d This is a Conversion Angle problem:
Conversion Angle = ½ change of longitude x sine latitude
= ½ x 18 x 0.866
= 7.8°
234 c
235 b 192°T + 7E Var = 185° Mag Track. With 5° of left drift, you need to aim off 5° to the right, onto a Mag heading of 190°M.
236 d The Datum Meridian is Greenwich, so the aircraft is 115° West of the Datum in the Northern Hemisphere. Therefore convergence is 115°E. Convergence East – True Least. So True track will be 115 degrees less than Grid Track. 344°G – 115°Convergence = 229°T.

697
Chapter 38Revision Questions
237 a Rhumb Line distance between 2 points at the same latitude is the Departure.
Departure = change of longitude (in minutes) x cos latitude
= 10° x 60 (to get minutes) x cos 60°
= 600 x 0.5 = 300 nm
238 b Don’t forget that ISA at FL410 is still -56.5°C, even though you are higher than 36,090 feet pressure alt. So the SAT is -46.5°C. Use the CRP-5.
239 b Convert 22 UGS galls per hour to imperial gallons on the CRP-5. The answer is about 18.3 Imp gall/hour. Then use either the CRP-5 or your calculator to get the total endurance.
240 b A and B are at the same latitude but different longitudes. So it’s a departure problem.
Departure = change of longitude (in minutes) x cosine latitude
Departure = 1 x 60 x cos 60 = 30 nm
A and C are at different latitudes but the same longitude. So it’s a simple change of latitude problem. One degree is 60 nm.
241 b Use the CRP-5.
242 d 135 x 1.75/60 = 3.94
243 c You need 4° right to correct for track error angle and parallel track. Then, with 60 nm gone, there are 30 nm to go. Four nm off in 30 gives a closing angle of 8°. Total change = 12° right.
244 d
245 b
246 c
247 c
248 d
249 b
250 a
251 d

698
Revision QuestionsChapter 38
FINAL EXAM 54 Questions 2 Hours 77 Marks
Equipment required: Protractor, dividers, ruler, CRP5, scientific (but non-programmable) calculator, Jeppesen E (LO) 1 - (optional) Full Jeppesen Manual not allowed.
1. Assuming mid-latitudes (40° to 50° N/S), at which time of the year is the relationship between the length of day and night, as well as the rate of change of declination of the sun, changing at the greatest rate?
a. Summer solstice and winter solsticeb. Spring equinox and autumn equinoxc. Summer solstice and spring equinoxd. Winter solstice and autumn equinox (1 mark)
2. In which two months of the year is the difference between the transit of the Apparent Sun and Mean Sun across the Greenwich Meridian the greatest?
a. March and Septemberb. February and Novemberc. June and Decemberd. April and August (1 mark)
3. Position ‘B’ is 240°(T) and 200 nm from ‘A’. If the position of ‘A’ is N00° E100°, what is the position of ‘B’?
a. S01°40’ E101°40’b. S01°40’ E097°07’c. N01°40’ E097°07’d. N01°40’ E101°40’ (2 marks)
4. An aeroplane flies from A (59°S 142°W) to B (61°S 148°W) with a TAS of 480 kt. The autopilot is engaged and coupled with an Inertial navigation system in which AB track is active. On route AB, the true track:
a. varies by 4°b. decreases by 6°c. varies by 10°d. increases by 5° (2 marks)
5. Given: Waypoint 1 is 60°S 030°W, waypoint 2 is 60°S 020°W. What will be the approximate latitude on the display unit of an inertial navigation system at longitude 025°W?
a. 60°06’Sb. 59°49’Sc. 60°00’Sd. 60°11’S (2 marks)
6. The maximum difference between the geocentric and geodetic latitude occurs at about:
a. 45° North and Southb. 90° North and Southc. 60° North and Southd. 0° North and South (equator) (1 mark)

699
Chapter 38Revision Questions
7. What is the time required to travel along the parallel of latitude 60° N between meridians 010°E and 030°W at a groundspeed of 480 kt?
a. 1 hr 15 minb. 2 hr 30 minc. 1 hr 45 mind. 5 hr 00 min (1 mark)
8. What is the meaning of the term ‘standard time’?
a. It is another term for UTCb. It is the time zone system applicable only in the USA.c. It is an expression for local mean time.d. It is the time set by the legal authorities for a country or part of a country. (1 mark)
9. Deviation applied to magnetic heading gives:
a. magnetic trackb. magnetic coursec. true headingd. compass heading (1 mark)
10. Given: Position A is 60N 020W, Position B is 60N 021W, and Position C is 59N 020W, what are, respectively, the distances from A to B and from A to C?
a. 60nm and 30nmb. 30nm and 60 nmc. 52 nm and 60nmd. 60nm and 52 nm (2 marks)
11. At a specific location, the value of magnetic variation:
a. depends on the magnetic headingb. depends on the value of true headingc. varies slowly over timed. depends on the type of compass installed (1 mark)
12. The value of magnetic variation:
a. has a maximum of 180°b. varies between a maximum of 45°E and 45Wc. must be 0° at the magnetic equatord. cannot exceed 90° (1 mark)
13. In the northern hemisphere, during an acceleration in a easterly direction, the magnetic compass will indicate:
a. a heading of Eastb. an increase in headingc. an apparent turn to the Southd. a decrease in heading (1 mark)

700
Revision QuestionsChapter 38
14. The direct reading magnetic compass is made aperiodic (dead beat) by:
a. using long magnetsb. keeping the magnetic assembly mass close to the compass point and using damping
wiresc. pendulous suspension of the magnetic assemblyd. using the lowest acceptable viscosity compass liquid (1 mark)
15. In a remote indicating magnetic compass system, the amount of deviation caused by aircraft magnetism and electrical circuits may be minimised by:
a. the use of repeater cardsb. positioning the master unit in the centre of the aircraftc. mounting the detector unit in the wingtipd. using a vertically mounted gyroscope (1 mark)
16. Which of the following is an advantage of a remote reading compass as compared to a standby compass?
a. It eliminates the effect of turning and acceleration errors by by pendulously suspending the detector unit.
b. It senses the magnetic meridian instead of seeking it, increasing compass sensitivity.c. It is more reliable because it is operated electrically and power is always available from
sources within the aircraft.d. It is lighter than a direct reading compass because it employs, apart from the detector
unit, existing aircraft equipment. (1 mark)
17. At 47°N the chart distance between meridians 10° apart on a chart is 5 inches. The scale of the chart at that latitude is approximately:
a. 1: 2 500 000b. 1: 3 000 000c. 1: 8 000 000d. 1: 6 000 000 (2 marks)
18. On a Lambert Conformal Conic chart, earth convergency is most accurately represented at the:
a. north and south limits of the chartb. standard parallelsc. Equatord. parallel of origin (1 mark)
19. An Oblique Mercator projection is used specifically to produce:
a. radio navigation charts in equatorial regionsb. topographical maps of large east/west extentc. plotting charts in equatorial regionsd. charts of the great circle route between two points (1 mark)
20. On the Transverse Mercator chart, scale is correct along the:
a. equator, parallel of origin and prime verticalb. prime meridian and equatorc. datum meridian and the meridian perpendicular to itd. meridian of tangency (1 mark)

701
Chapter 38Revision Questions
21. Which of the following describes the appearance of Rhumb lines, except meridians, on a Polar Stereographic chart?
a. Ellipses around the Poleb. Straight linesc. Curves concave to the Poled. Curves convex to the Pole (1 mark)
22. Please refer to Appendix AWhat is the meaning of aeronautical chart symbol No 3?
a. Hazard to aerial navigationb. Visual reference pointc. Lighthouse d. Aeronautical ground light (1 mark)
23. Please refer to your Jeppesen E (LO) 1. What is the average track (°M) and distance from WTD NDB (N52°11.3’ W007°05.0’) to KER
NDB (N52°10.9’ W009°31.5’)?
a. 280° - 89 nmb. 278° - 90 nmc. 090° - 91 nmd. 098° - 90 nm (2 marks)
24. Please refer to Appendix A Which aeronautical chart symbol indicates an exceptionally high unlighted obstacle?
a. 12b. 6c. 10d. 15 (1 mark)
25. Please refer to your Jeppesen E (LO).Given:CRN DME (N5318.1 W00856.5) DME 18 nmSHA VOR (N5243.3 W00853.1) DME 30 nmAircraft heading 270°(M)Both DME distances decreasing.What is the aircraft position?
a. N5310 W00830b. N5252 W00923c. N5307 W00923d. N5355 W00825 (2 marks)
26. Please refer to your Jeppesen E (LO) 1.What feature is shown on the chart at position N5212 W00612?
a. Tuskar Rock Lighthouse NDBb. KERRY/Farrafore aerodromec. Clonbullogue aerodromed. WTD NDB (1 mark)

702
Revision QuestionsChapter 38
27. Please refer to Appendix AWhich of the aeronautical chart symbols indicates a VOR?
a. 4b. 2c. 13d. 14 (1 mark)
28. An aircraft travels 2.4 statute miles in 47 seconds. What is its groundspeed?
a. 183 ktb. 13 ktc. 209 ktd. 160 kt (1 mark)
29. Given: IAS 120 knots, FL 80, OAT +20°C, what is the TAS?
a. 132 ktb. 141 ktc. 102 ktd. 120 kt (1 mark)
30. Given: TAS 200 kt, Track 110°(T), W/V 015/40 kt, calculate heading°(T) and groundspeed.
a. 097° - 201 ktb. 099° - 199 ktc. 121° - 207 ktd. 121° - 199 kt (2 marks)
31. Given: True HDG 145°, TAS 240 kt, True Track 150°, G/S 210 kt, calculate the W/V.
a. 360/35 b. 295/35c. 180/35d. 115/35 (2 marks)
32. Given: TAS 140 kt, HDG 005°(T), W/V 265/25, calculate the drift and groundspeed.
a. 11R - 140 ktb. 10R - 146 ktc. 9R - 140 ktd. 11R - 142 kt (2 marks)
33. Given: FL 120, OAT is ISA, CAS = 200 knots, Track = 222°(M), Heading = 215°(M), Variation = 15°W.
If the time to fly 105 nm is 21 minutes, what is the W/V?
a. 040T / 105 ktd. 055T / 105 ktc. 050T / 70 ktd. 065T / 70 kt (2 marks)

703
Chapter 38Revision Questions
34. Given: Airport elevation = 1000 feet, QNH = 988 hPa, what is the approximate airport pressure altitude?(Assume 1 hPa = 27 feet)
a. -320 feetb. 1680 feetc. 320 feetd. 680 feet (2 marks)
35. Given: TAS = 487, FL 330, Temp = ISA+15, calculate the Mach No?
a. 0.81b. 0.78c. 0.84d. 0.76 (2 marks)
36. Please refer to Appendix B Assume a North polar stereographic chart whose grid is aligned with the Greenwich meridian.
An aircraft flies from the geographic north pole for a distance of 480 nm along the 110°E meridian, then follows a grid track of 154° for a distance of 300 nm.
Its position is now approximately:
a. 78°45’N 087°Eb. 80°00’N 080°Ec. 79°15’N 074°Ed. 70°15’N 080°E (2 marks)
37. Given:AD = Air distanceGD = Ground distanceTAS = True AirspeedGS = GroundspeedWhich of the following is the correct formula to calculate ground distance (GD) gone?
a. GD = TAS/(GS x AD)b. GD = (AD x GS)/TASc. GD = AD x (GS-TAS)/GSd. GD = (AD-TAS)/TAS (1 mark)
38. An island appears 30° to the left of the centre line of an airborne weather display. What is the true bearing of the aircraft from the island if at the time of the observation the aircraft was on a magnetic heading of 020° with the magnetic variation of 25°W.
a. 145°b. 195°c. 205°d. 325° (2 marks)
39. Given: Aircraft height = 2500 feet, ILS GP angle = 3°, at what approximate distance from the threshold can you expect to intercept the glidepath?
a. 8.0 nmb. 14.5 nmc. 13.1 nmd. 7.0 nm (2 marks)

704
Revision QuestionsChapter 38
40. An aircraft is planned to fly from position A to position B, distance 480 nm, at an average groundspeed of 240 knots. It departs A at 1000 UTC. After flying 150 nm along track from A, the aircraft is 2 minutes behind the planned time.Using the actual groundspeed experienced, what is the revised ETA at B?
a. 1153b. 1203c. 1206d. 1157 (2 marks)
41. The distance between two waypoints is 200 nm. To calculate compass heading, the pilot used 2°E magnetic variation instead of 2°W. Assuming that the forecast W/V applied, what will the off track distance be at the end of the second waypoint?
a. 7 nmb. 14 nmc. 0 nmd. 21 nm (2 marks)
42. An aircraft at FL 140, IAS 210 knots, OAT -5°C and wind component – 35 knots, is required to reduce speed in order to cross a reporting point 5 minutes later than planned. Assuming that flight conditions do not change, when the aircraft is 150 nm from the reporting point, the IAS should be reduced by:
a. 15 ktb. 20 ktc. 30 ktd. 25 kt (2 marks)
43. Complete the following line of the Flight Navigation Log
Time Trk(T)
W/V(T) Hdg Var Hdg
(M) Observation M/RAS
PA /OAT TAS G S Dist Time ETA
1109 205 315 / 45 17E O/H C
S/H D M.84 330 /-45 758
O/H C S/H D
What is HDG (M) and ETA?
a. 193 1249b. 193 1239c. 183 1159d. 188 1229 (3 marks)
44. Which of the following can all be stored as five letter waypoint identifiers through the CDU of a B737- 400 Electronic Flight Instrument System?
a. Airway names; navaid identifiers; airport names; waypoint code numbersb. Waypoint names; navaid identifiers; runway numbers; airport ICAO identifiersc. Waypoint names; navaid frequencies; runway codes; airport ICAO identifiersd. Waypoint names; navaid positions; airport ICAO identifiers; airport names
(1 mark)
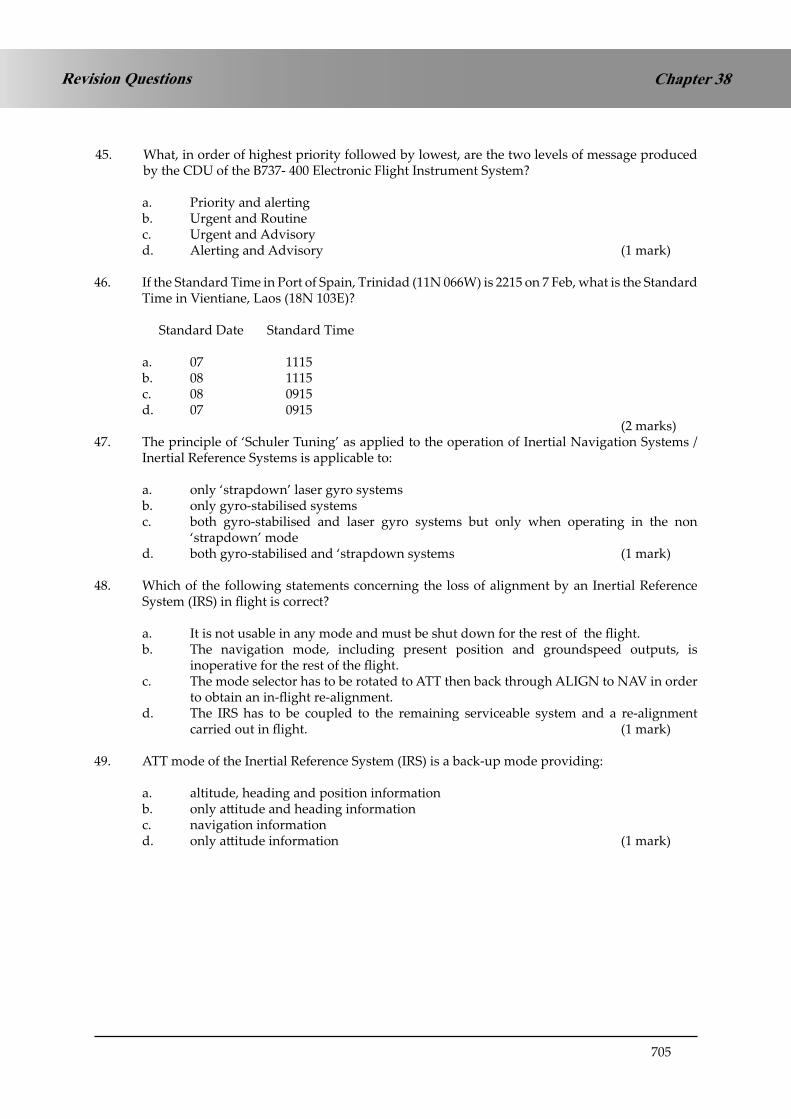
705
Chapter 38Revision Questions
45. What, in order of highest priority followed by lowest, are the two levels of message produced by the CDU of the B737- 400 Electronic Flight Instrument System?
a. Priority and alertingb. Urgent and Routinec. Urgent and Advisoryd. Alerting and Advisory (1 mark)
46. If the Standard Time in Port of Spain, Trinidad (11N 066W) is 2215 on 7 Feb, what is the Standard Time in Vientiane, Laos (18N 103E)?
Standard Date Standard Time
a. 07 1115b. 08 1115c. 08 0915d. 07 0915 (2 marks)
47. The principle of ‘Schuler Tuning’ as applied to the operation of Inertial Navigation Systems / Inertial Reference Systems is applicable to:
a. only ‘strapdown’ laser gyro systemsb. only gyro-stabilised systemsc. both gyro-stabilised and laser gyro systems but only when operating in the non
‘strapdown’ moded. both gyro-stabilised and ‘strapdown systems (1 mark)
48. Which of the following statements concerning the loss of alignment by an Inertial Reference System (IRS) in flight is correct?
a. It is not usable in any mode and must be shut down for the rest of the flight.b. The navigation mode, including present position and groundspeed outputs, is
inoperative for the rest of the flight.c. The mode selector has to be rotated to ATT then back through ALIGN to NAV in order
to obtain an in-flight re-alignment.d. The IRS has to be coupled to the remaining serviceable system and a re-alignment
carried out in flight. (1 mark)
49. ATT mode of the Inertial Reference System (IRS) is a back-up mode providing:
a. altitude, heading and position informationb. only attitude and heading informationc. navigation informationd. only attitude information (1 mark)

706
Revision QuestionsChapter 38
50. An aircraft equipped with an Inertial Navigation system (INS) flies with INS 1 coupled with autopilot 1. Both inertial navigation systems are navigating from waypoint A to B. The inertial systems’ CDUs show:
XTK on INS 1 = 0XTK on INS 2 = 8L
From this information it can be deduced that:
a. only inertial navigation No 1 is driftingb. only inertial navigation No 2 is driftingc. at least one of the inertial navigation systems is driftingd. the autopilot is unserviceable in NAV mode (1 mark)
51. Gyrocompassing of an inertial reference system (IRS) is accomplished with the mode selector switched to:
a. ONb. STBYc. ATT/REFd. ALIGN (1 mark)
52. With reference to the inertial navigation system (INS), the initial great circle track between computer inserted waypoints will be displayed when the CDU is selected to:
a. XTK/TKEb. TK/GSc. DSRTK/STSd. HDG/DA (1 mark)
53. Waypoints can be entered in an INS memory in different formats. In which of the following formats can waypoints be entered into all INSs?
a. geographical co-ordinatesb. hexadecimalc. by waypoint’s named. bearing and distance (1 mark)
54. The following waypoints are entered into an inertial navigation system (INS) WPT 1: 60N 30WWPT 2: 60N 20WWPT 3: 60N 10W
The inertial navigation is connected to the automatic pilot on the route WP1 – WP2 – WP3. The track change on passing WPT 2 will be approximately:
a. a 9° increaseb. a 4° decreasec. zerod. a 9° decrease (2 marks)

707
Chapter 38Revision Questions
Appendix A to Final ExamAppendix A to Consolidation Questions
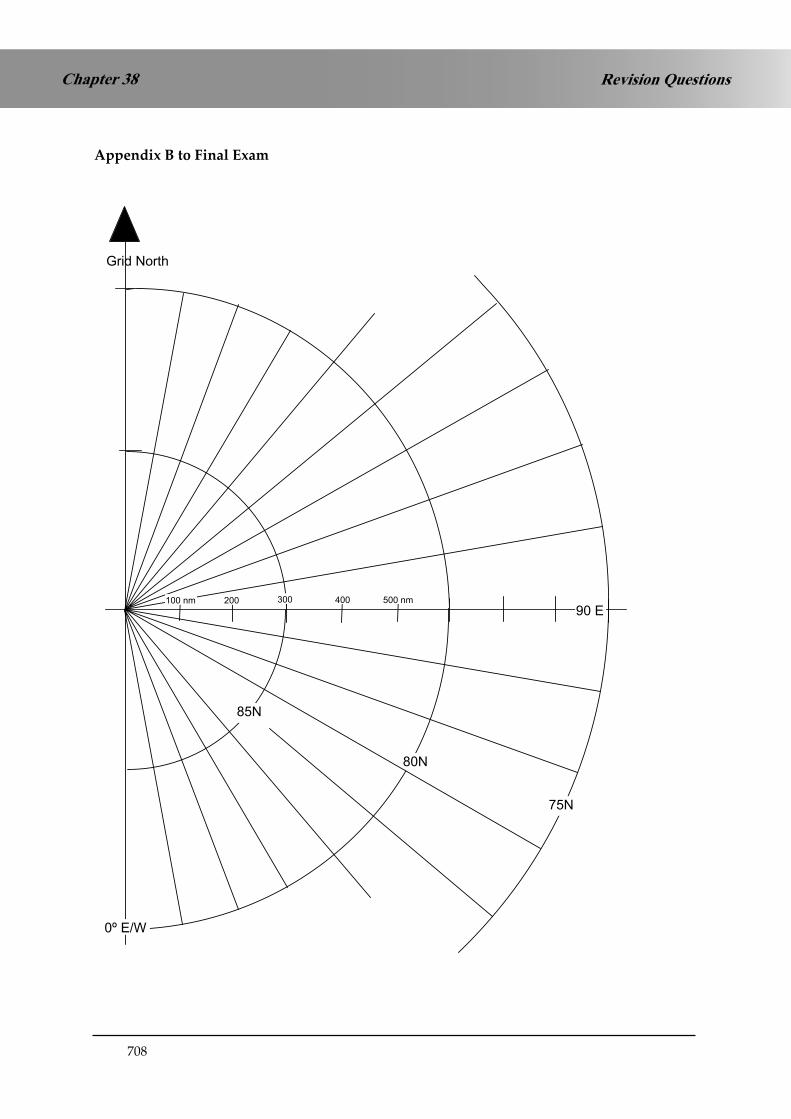
708
Revision QuestionsChapter 38
Appendix B to Final Exam
GENERAL NAVIGATION SPECIMEN QUESTIONS
39 - 40 © Oxford Aviation Services Limited
Appendix B
Grid North
85N
80N
75N
90 E
0º E/W
100 nm 200 300 400 500 nm

709
Chapter 38Revision Questions
ANSWERS to FINAL EXAM
1 B 21 C 41 B
2 B 22 D 42 B
3 B 23 B 43 B
4 D 24 B 44 B
5 A 25 A 45 D
6 A 26 A 46 C
7 B 27 C 47 D
8 D 28 D 48 B
9 D 29 B 49 B
10 B 30 B 50 C
11 C 31 D 51 D
12 A 32 B 52 D
13 D 33 C 53 A
14 B 34 B 54 D
15 C 35 A
16 B 36 B
17 D 37 B
18 D 38 A
19 D 39 A
20 D 40 C

710
Revision QuestionsChapter 38
ANSWERS to FINAL EXAM EXPLAINED
1. b See page 407.
2. b See page 409.
3. b Calculate the N/S and the E/W distance of ‘B’ from ‘A’ using sine and cosine.
200 nm x cos 240°T = -100 nm (ie, 100 nm S)
200 nm x sin 240°T = -173 nm (ie, 173 nm W)
Change of latitude = 100 nm = 1° 40’ S
Lat ‘A’ is Equator, so lat ‘B’ is S 01°40’
As we are at the Equator, we do not need the cosine of latitude in order to calculate departure. One nautical mile is one minute of longitude.
Change of longitude = 173 nm = 2° 53’ W Long ‘A’ is E100°, so lat ‘B’ is E097°07’
In fact, you do not need to do the calculation. A bearing of 240° is S and W from ‘A’. Option ‘B’ is the only one where ‘B’ is SW from ‘A’. You can solve this question by simple inspection of the answers, thereby saving some time.
4. d This is a convergency problem. The INS will fly a Great Circle track, which will change direction by the amount of convergency as the route progresses.
Convergency = change of longitude x sine mean latitude
Convergency = 6° x sin 60 = 5.2°
The aircraft is flying westwards in the southern hemisphere so, using the D – I – I – D rule on page 28, the track direction will increase.
5. a This is a very difficult question, in fact, in my opinion, an unreasonably difficult question. So much so that I have devoted a large part of one chapter to answering just this question.
3 full solutions are given in Book 10, pages 628 to 630.
6 a See page 10.
7. b This is a departure problem. The change of longitude is 40°.
Departure = change of longitude (in minutes) x cosine latitude
Departure = 40 x 60 x cos 60 = 1200 nm
1200 nm @ 480 knots G/S = 2 hr 30 min
8. d See page 425.

711
Chapter 38Revision Questions
9 d See page 57.
10. b A and B are at the same latitude but different longitudes. So it’s a departure problem.
Departure = change of longitude (in minutes) x cosine latitude
Departure = 1 x 60 x cos 60 = 30 nm
A and C are at different latitudes but the same longitude. So it’s a simple change of latitude problem. One degree is 60 nm.
11. c See pages 49-50.
12. a See page 47.
13. d An acceleration always gives an apparent turn towards the nearer pole. In the northern hemisphere, this is north. So the indicated heading will change from 090°C to some value nearer 000°C, ie, a decrease in indicated heading.
14. b See page 532.
15. c See page 562.
16. b With a Direct Reading Compass, the compass needle or magnetic assembly (for instance, the magnets in the centre of the vertical card) has to physically take up the alignment of north, which involves overcoming friction. With a Slaved Gyro Compass, the 3 legs of the flux valve pick up different amounts of magnetic flux on different headings. No friction needs to be overcome when the aircraft alters heading and so the system is more sensitive.
17. d First, find the departure of 10° change of longitude at 47°N:
Departure = change of longitude (in minutes) x cosine latitude
Departure = 10 x 60 x cos 47 = 409.2 nm
Now treat it as a simple scale (Representative Fraction) problem:
Scale = Chart Length/Earth Distance
Scale = 5 / (409.2 x 6080 x 12) = 1/5,971,032
which is approximately 1/6,000,000
18. d Chart convergence is constant all over the chart but is correct (ie, the same as Earth Convergence) only at the parallel of origin.
19. d See page 396.
20. d See page 393.
21. c See page 372.
22. d See page 235.

712
Revision QuestionsChapter 38
23. b Plotting question. Solve by measurement on the chart.
24. d See page 235.
25. a Plotting question. Solve by measurement on the chart. An explanation of the point about ‘both DME distances decreasing’ is given at the top of page 519.
26. a The Jeppesen conventions differ slightly from the ICAO ones. The key is given in the introduction to the Jeppesen Student Pilots’ Manual.
27. c See page 235.
28. d Convert 2.4 statute mile to nautical miles on your Navigation Computer. It comes to 2.09 nm.
G/S = 2.09 x 3600/47 = 160 knots
29. b See pages 108-109 and the worksheet on page 119.
30. b See pages 148-159 and the worksheet on page 163.
31. d See pages 139-143 and the worksheet on page 144.
32. b See pages 148-159 and the worksheet on page 163.
33. c Get everything into True first.
True heading is 200°T, True track is 207°T.
Now work out the TAS, which comes to 240 knots. The G/S is 5 nm a minute, which is 300 knots – or put 105 on the outer scale of your CRP-5 against 21 minutes on the inner scale.
To find the W/V, see pages 169-143 and the worksheet on page 144.
34. b The QNH is 988 hPa. The datum for Pressure Altitude is 1013 hPa, which is 25 hPa greater. Using 27 feet to one hPa, this equates to a distance of 675 feet. A greater static pressure occurs at a lower pressure level. Therefore the 1013 hPa pressure level is below sea level by 675 feet. The airport is 1000 feet above sea level, which means that it is 1675 feet above the 1013 hPa pressure level.
35. a See page 113 and the worksheet on page 119.
36. b This question is solved by scale drawing. Use the scale to draw a line 480 nm along the 110°E meridian from the North Pole, then plot a line 300 nm in a direction of 154°Grid.
37. b Although we teach this in the Flight Planning syllabus, this question has appeared in ATPL Gen Nav exams. See Book 7, page 64.
38. a Mag hdg 020°M – 25W variation = True hdg 355°T
30° to the left of the nose gives a True bearing from the aircraft TO the island of 325°T. However, you are going to have to plot FROM the headland to the aircraft (the island is on your map – the aircraft’s position isn’t!) So you plot the reciprocal of 145°T.

713
Chapter 38Revision Questions
39. a This is just the 1 in 60 rule. A 3-degree glide path gives you 300 feet per nautical mile. Divide 2500 feet by 300 feet and the answer is just over 8 nautical miles.
40. c 480 nm @ the planned G/S of 240 knots = 120 mins
150 nm @ the planned G/S of 240 knots = 37.5 mins
But at this point, we are 2 mins late, so our actual time is 39.5 mins
So total time will be 120 x 39.5/37.5 = 126.4 mins
With take-off at 1000UTC, revised ETA will be 1206.
41. b Mis-applying the variation will give 4° heading error. After that, it is just the one in sixty rule. For every 60 nm of along-track distance, there will be 4 nm of cross-track distance.
42. b Find the present TAS, apply the wind and get the present G/S (230 knots) 150 nm @ 230 k G/S is 39 mins. You need to arrive 5 minutes later, so your new time to
go is 44 mins. The new required G/S will be 150 nm in 44 mins, which is 205 k G/S The wind should not change, so the new required TAS will be 240 Then either use FL140/-5°C in the airspeed window to convert the TAS to 190 k CAS, or
put the old TAS (264) against the old IAS (210), then against 240 TAS, you will see 190. 210 to 190 is a 20 knot reduction in IAS (strictly CAS, but the PEC should not change
much in 20 knots).
43. b Chapters 5 to 8 refer.
44. b Answers: Waypoint names – eg, BLUFA navaid identifiers – eg, CPT runway numbers – eg, 27L airport ICAO identifiers – eg, EGTK.
Many systems do not use waypoint numbers. Navaid frequencies are not unique and navaid positions would use more than 5 alpha-numerics.
45. d Page 620. See under Illuminated Annunciators – MSG
46. c Day Hour Minute Time
Standard Time Trinidad 7 Feb 22 15 STSTD (long west, UTC best) +04 UTC 8 Feb 02 15 UTCSTD (long east, UTC least) +7 Standard Time Laos 8 Feb 09 15 ST
47. d See pages 589 and 609.

714
Revision QuestionsChapter 38
48. b If an INS or IRS is switched OFF in flight, either inadvertently or in response to a checklist action, then the alignment is lost. If it subsequently becomes safe to switch it back on, you cannot get a full gyro-compassing in flight because the lateral accelerometer of the East gyro will not be able to distinguish between Earth rate and accelerations caused by movement of the aircraft. This is why the aircraft has to be stationary during ground alignment.
However, if you select ATT REF (on a typical IN) or ATT on the B737-400 IRS, either after switching OFF, or directly from NAV (following a computing, but not gyro, failure), the gyros now work as a combination of a superior form of DGI and ADI. If you have a period of steady unaccelerated flight, the gyros will erect to the vertical by sensing gravity from the accelerometers and the heading can then be set by the pilot to be the same as the heading from some other source (such as a slaved gyro compass).
Attitude information will stay good for the rest of flight, but the azimuth information is not corrected for Earth rate or Transport Wander, so whilst it will have the very low real drift rate associated with IN-quality gyros (in the order or 1/100 degree per hour), it still needs to be corrected every 20 minutes or so from another source because of the ER and TW drifts.
However, all nav computing facilities (readouts of latitude and longitude, drift, track, waypoint steering, distance to go, etc) are no longer available
49. b See the answer to 48 above.
50. c Answer (d) is just noise. Of the other options, if you’ve got only 2 systems, not externally monitored against DME/DME or GPS, how can you tell which one is correct? Each is as likely to be correct as the other. Indeed, they might both be a bit wrong.
51. d It is normal to select ALIGN for gyro-compassing, although it can also be done in NAV.
52. c See Figure 34.26 on page 597.
53. a You can enter lat and long into all INSs. Some systems allow various combinations of the others, but only lat/long can be used for all systems.
54. d See Q5 on page 257 and the worked solution on page 258, which is the same problem with slightly different numbers.

715
Chapter 38Revision Questions
INTENTIONALLY LEFT BLANK

716
Revision QuestionsChapter 38
INTENTIONALLY LEFT BLANK

717
Chapter 38Revision Questions
INTENTIONALLY LEFT BLANK

718
Revision QuestionsChapter 38
INTENTIONALLY LEFT BLANK

719
Chapter 38Revision Questions
INTENTIONALLY LEFT BLANK

720
Revision QuestionsChapter 38
INTENTIONALLY LEFT BLANK


