58
2045 Tri-County Transportation Plan MetroQuest Survey Results November 2018 Prepared for Prepared by

2045 Tri-County Transportation Plan
MetroQuest Survey Results
November 2018
Prepared for
Prepared by

2045 Tri-County Transportation Plan – MetroQuest Survey Results
i
Table of Contents
Section 1. Introduction
Section 2. Survey Overview
Section 3. Survey
Participation
Section 4. Priorities
Section 5. Scenarios
Section 6. Elements
Section 7. Conclusion
……………………… Page 1
……………………… Page 3
……………………… Page 6
……………………… Page 11
……………………… Page 15
……………………… Page 22
……………………… Page 52
The preparation of this report has been financed in part through grants from the Federal Highway
Administration and Federal Transit Administration, U.S. Department of Transportation, under the
Metropolitan Planning Program, Section 104(f) of Title 23, U.S. Code. The contents of this report do not
necessarily reflect the official views or policy of the U.S. Department of Transportation.
The MPOs do not discriminate in any of their programs or services. Public participation is solicited by
the MPOs without regard to race, color, national origin, sex, age, disability, family or religious status.
Learn more about our commitment to nondiscrimination and diversity by contacting:
Hillsborough County MPO
Johnny Wong, Title VI/Nondiscrimination Coordinator
(813) 273-3774 ext. 370, or [email protected]
Pinellas County MPO
Alicia Parinello, Title VI Program Planner (727) 464-8250
Pasco County MPO
Tania Gorman, Title VI Planner, (727) 847-8140

2045 Tri-County Transportation Plan – MetroQuest Survey Results
1
Chapter 1 – Introduction
It’s TIME Tampa Bay is a collaboration of the Metropolitan Planning Organizations (MPOs)
of Hillsborough, Pasco, and Pinellas Counties. Federal law requires MPOs to evaluate trends, project
future growth, and identify fiscally constrained multimodal transportation investments for the next
20 plus years as part of their Long Range Transportation Plan (LRTP) update. It’s TIME Tampa Bay
represents the first tri-county planning initiative the three counties have undertaken as part of the
2045 LRTP planning process. Together, the MPOs are addressing regional mobility needs in an effort
to ensure that connections to jobs, universities, healthcare, airports, state parks and the beaches are
accessible to everyone. Each MPO will utilize the results of the tri-county public outreach effort to
help identify county-specific, and cross-county, projects that support and enhance regional mobility.
Public Outreach
The Hillsborough, Pasco and Pinellas MPOs embrace public outreach as it is a critical step to inform
the LRTP development process and helps to ensure the LRTP reflects community values, and overall
vision. As such, the MPOs together selected an online survey platform – MetroQuest – as the
primary public outreach tool for the It’s TIME Tampa Bay initiative.
The MetroQuest survey provided the public the
opportunity to weigh in on:
• transportation and growth priorities,
• three exaggerated future year growth scenarios
• and a variety of potential roadway and transit
projects, community development and funding
options.
No single scenario will solve the transportation and
mobility needs of the tri-county area—it will take a
combination of investments to move people and goods around the region, both today and even
more so in the future when the three-county area will add over one million in population. The
Designed to optimize engagement,
MetroQuest surveys are quick to
complete on any device – laptops,
tablets, and smart phones.

2045 Tri-County Transportation Plan – MetroQuest Survey Results
2
purpose of this survey was to help the MPOs identify the best ideas, projects, and policies to evaluate
further as part of the 2045 LRTP development that will be completed in 2019.
Toward this end, each MPO will continue to conduct transportation planning for their communities
and neighborhoods, in coordination with local city and county land-use planning. Some
current/recent examples include the Brandon Corridors & Mixed-Use Centers study in Hillsborough,
the Master Plan for Gateway/Mid-County in Pinellas, and the Wesley Chapel Roadway
Connection study in Pasco. The It’s TIME Tampa Bay survey builds off these local planning and
regional planning initiatives in an effort to address these basic questions:
Why it’s TIME!
Already among the top 20 most populated regions in the country, the Tampa Bay area is also one of
the fastest growing in the country. Visit any part of the tri-county area and you will experience the
growth firsthand: construction in Downtown Tampa, St. Petersburg, Wesley Chapel, and numerous
other locations. Residents and visitors to our area feel the impacts of this growth on a daily basis as
traffic levels continue to increase and daily commutes become longer. Add an additional one
million in population to the tri-county area over the next 20 plus years and it is easy to see
that now is the time to act to address our regional mobility and travel needs!

2045 Tri-County Transportation Plan – MetroQuest Survey Results
3
Chapter 2 – Survey Overview
The MetroQuest survey consisted of five screens: Welcome, Priorities, Scenarios, Elements, and Wrap-
up. Each screen setup/design, and the corresponding survey results, is discussed in the following
chapters.
The Welcome Screen, displayed below, set the context for the project and encouraged people to
participate. The visually appealing screen included a brief project background (see text below) and a
call to action. The introduction pop-up box was the first information that visitors received when
clicking on the survey located to the It’s TIME Tampa Bay website. In an effort to maximize
participation, survey participants were eligible to win tickets to a Tampa Bay Buccaneers game, a
Tampa Bay Lightning game, or to the performing arts as long as they provided a valid email address
on the Wrap-up screen.
Welcome Screen
Introduction Pop-up Box
Welcome Screen – Project Background
Transportation, Innovation, Mobility for Everyone!
Transportation, land use, and funding are important challenges in our region. By 2045, our
region will have over a million more people living and working here. Hillsborough, Pasco
and Pinellas counties would like your input on three growth scenarios. Individual elements
of each scenario may be combined into a final regional plan.
It will take a combination of investments to move people around our region, both today
and in the future. Please take a few minutes to tell us your views on the region’s future
transportation system.

2045 Tri-County Transportation Plan – MetroQuest Survey Results
4
Survey Development/Collection
Development of the MetroQuest survey began in late January 2018. The three MPOs formed a
working group comprising staff from the Hillsborough, Pinellas and Pasco MPOs, along with other
stakeholders and project consultants. The working group met five times between January and June,
with the survey going live at the end of July and ending early October.
The working group reviewed various MetroQuest screens, survey text and images, draft surveys and
discussed potential outreach opportunities and marketing strategies. In May 2018, AECOM staff
presented an overview of the survey to the Tampa Bay Transportation Management Area Leadership
Group (TMA). In May and June, the MPOs conducted testing of the draft survey to check for
understanding, ease of use, and to determine the approximate time to complete the survey. Based
on feedback, the working group made edits to simplify and shorten the survey. The MPOs approved
a final survey in mid-July and MetroQuest completed their final testing the last week of July.
The MetroQuest survey went live on July 31, 2018 and
closed October 1, 2018. Over this two-month timeframe,
there were 17,762 visitors that clicked on the survey link
and 9,666 people answered at least some survey
questions. This 54.4% participation rate generally falls in
the range for most MetroQuest surveys.
Following a standard review and survey
clean-up, the final dataset included 9,575
participants. This set a new record for
MetroQuest survey participation in the
United States. In total, there were 234,884
data points collected, 10,471 comments
provided and over 5,600 participants
provided their email address and were
eligible to win football, hockey or
performing arts tickets. The graph on the
right displays strong participation from start
to finish due to a strong and steady outreach effort. The survey ended up with 33 straight days
with over 100 responses per day (August 13th to September 14th) and the most responses for a
single day (500 participants) were recorded on August 28th.
Working Group
Kickoff (#1)
January 26, 2018
Working Group #3
April 19, 2018
Working Group #2
March 16, 2018
Working Group #4
May 24, 2018
Working Group #5
June 20, 2018
Begin Survey
July 31, 2018
End Survey
October 1, 2018
Survey Live

2045 Tri-County Transportation Plan – MetroQuest Survey Results
5
Public Outreach
The MetroQuest survey was available through the It’s TIME Tampa Bay website
(itstimetampabay.org) created specifically for the survey. The website was hosted by the
Hillsborough MPO and promoted on the Pinellas and Pasco MPOs websites. The MPOs also worked
closely with local media outlets to promote the survey and wish to thank the following marketing
partners for a successful campaign.
Marketing Partners
The working group also developed and reviewed alternative public outreach tools and activities to
spread the word and to generate interest in the planning process. Staff from the three MPOs
developed a wide range of outreach activities in an attempt to maximize participation representative
of the communities within the tri-county area. The following highlights these activities.
• A matching paper survey, and corresponding PowerPoint slideshow, to provide an alternative
method to complete the survey
• A Spanish translation of the paper survey and PowerPoint slideshow
• Facebook (265,000 impressions), Twitter (46,000 impressions) and Instagram (54,000
impressions) campaigns throughout the majority of the survey to encourage residents to visit
the It’s TIME Tampa Bay website to complete the survey (34% of the visits to the website
came from social media)
• Promotional It’s TIME Tampa Bay video to encourage individuals to take the survey
• It’s TIME Tampa Bay ad in the Tampa Bay Times newspaper
• MPO-staffed booth at Florida’s Largest Home show over Labor Day weekend (resulting in
nearly 700 surveys being completed over the holiday weekend)
• Participation of Beth Alden (Hillsborough MPO Executive Director) and Whit Blanton (Forward
Pinellas Executive Director) on a radio talk show (The Current with Roxanne Wilder on Q105)
to discuss regional transportation and mobility issues, and to promote the survey
• Hillsborough MPO-printed rack cards included with the Property Appraiser’s True in Millage
(TRIM) notice, mailed countywide to approximately half million property and business owners
• Pinellas utilized the Nextdoor app to reach communities throughout Pinellas County and also
delivered utility mailers to account holders throughout the county.
• Pasco MPO-developed video to highlight the importance of taking the survey to discuss
regional travel issues between the three counties
• Numerous Pinellas MPO-posted Facebook advertisements encouraging residents to have
their voice heard by completing the survey

2045 Tri-County Transportation Plan – MetroQuest Survey Results
6
• MPO attendance at various small group/community meetings to inform them about the
survey, and in some cases to take the survey (Hillsborough MPO attended over 80 meetings)
Chapter 3 – Survey Participation
The two-month survey run resulted in a large dataset that yielded useful information to help inform
the LRTP development process. In total, 9,575 surveys were analyzed. Of this total, 6,544 (68%)
provided a home zip code that was located within the tri-county area. Home zip codes were assigned
to one of the three counties based on United States Postal Service (USPS) classifications. For
example, some zip code boundaries cross county lines, in particular along the Hillsborough-Pasco
County line, and as such the survey results were assigned to one county based on the USPS
classification.
Figure 1 and Table 1 summarize the overall survey results, by county, as compared to the population
of the tri-county area. Hillsborough County respondents represented 61% of all survey responses,
which is approximately 13 percentage points higher when comparing the share of survey responses
to share of tri-county population.
It is also worth noting that over 3,000 surveys were completed that either did not include a home zip
code or included a home zip code outside the tri-county area (these surveys could represent
individuals who work in the tri-county area, or travel to or through the area on a regular basis, or
some respondents simply may not have wanted to provide their zip code information).
Figure 2 displays the distribution of survey responses by home and work zip code.
Figure 1. Survey Response vs. 3-County Area Population
Table 1. Survey Response Overview

2045 Tri-County Transportation Plan – MetroQuest Survey Results
7
Figure 2. Survey Response (by Home and Work Zip Code Provided)
County Population1
Percentage Participants2
Percentage Difference
Hillsborough 1,379,302 48.4% 4,012 61.3% 12.9%
Pinellas 962,003 33.8% 1,731 26.5% -7.3%
Pasco 505,709 17.8% 801 12.2% -5.5%
Total 2,847,014 6,544
1
2
3-County Area Survey
SOURCE: BEBR, Bulletin 181, Population Projections by Age, Sex, Race & Hispanic
Origin for Florida & Its Counties, 2020 - 2045 with Estimates for 2017 (June 2018).
Survey participants who provided their home zip code.

2045 Tri-County Transportation Plan – MetroQuest Survey Results
8

2045 Tri-County Transportation Plan – MetroQuest Survey Results
9
Representative Coverage
It was very important to the MPOs to conduct a survey that—from a demographic and geographic
coverage standpoint—reflected the tri-county planning area to the best degree possible. The Wrap-
up screen collected general demographic data that was useful in better understanding the survey
responses for the priorities, scenarios and elements. Providing demographic data was optional and if
someone did not answer these questions their already completed survey responses and comments
were still recorded and analyzed as part of the final dataset.
Wrap-up Screen
“What to Do” Pop-up Box
• Home Zip Code
• Work Zip Code
• Employment Status
– Employed Full-time
– Employed Part-time
– Currently Unemployed
– Retired (full-time FL resident)
– Retired (part-time FL resident)
– Student
• Race/Ethnicity
– White
– Black, or African American
– Hispanic, Latino or Spanish
origin
– Asian
– American Indian or
Alaskan Native
– Native Hawaiian or Other
Pacific Islander
– Other
• Annual Household Income
– $39,999 or less
– $40,000 to $54,999
– $55,000 to $99,999
– $1000,000 to $199,999
– $200,000 or more
– If a valid email address was
provided, the participant
was eligible to win tickets to
a Tampa Bay Buccaneers
game, a Tampa Bay
Lightning game, or a
performing arts event.
Privacy Statement
The following privacy statement was included on the Wrap-up screen:
Under Florida law, email addresses are public records. If you do not want your email address
released in response to a potential public records request, please do not submit your email
address. In accordance with Title VI of the Civil Rights Act of 1964 and other nondiscrimination
laws, public participation is solicited without regard to race color, national origin, age, sex,
religion, disability, or family status. Read more about the MPO's commitment to non-
discrimination and other requirements.

2045 Tri-County Transportation Plan – MetroQuest Survey Results
10
Survey Responses by Demographics
The following sections provide a breakdown of survey responses by employment status, annual
household income, and race/ethnicity.
Employment Status
Figure 3 shows that full-time employed residents represented the majority of survey respondents
(approximately 70%). A portion of the respondents who did not provide their home zip code could
have been students participants. Survey respondents who identified as currently unemployed
represent approximately 3% of all respondents. This is consistent with the unemployment rates in
the region which range between 3% and 5%. Full-time retired respondents represented about 11%
of the survey responses, while less than 1% identified themselves as a part-time retired Florida
resident. Given this small response rate, the part-time retired Florida residents were combined with
the full-time retired Florida residents for the purpose of further survey analysis.
Figure 3. Participants by Employment Status
Annual Household Income
Figure 4 shows that 70% of survey respondents have an annual household income over $55,000, and
40% have an income over $100,000. In general, the survey responses represent a more affluent
population as compared to the region's average, or median income level. For those survey
respondents who did not provide a home zip code, 21% indicated that they had an annual
household income under $39,999.
70
.4%
7.1
%
2.9
% 7.0
% 12
.0%
0.5
%
73
.2%
7.6
%
2.7
%
2.8
%
12
.6%
1.2
%
71
.4%
7.7
%
5.4
%
2.8
%
12
.0%
0.8
%
56
.1%
8.0
%
1.0
%
25
.1%
9.4
%
0.3
%0.0%
10.0%
20.0%
30.0%
40.0%
50.0%
60.0%
70.0%
80.0%
EmployedFulltime
EmployedParttime
CurrentlyUnemployed
Student Retired fulltimeFlorida resident
Retired parttimeFlorida resident
Hillsborough Pinellas Pasco Not Provided All Participants

2045 Tri-County Transportation Plan – MetroQuest Survey Results
11
Figure 4. Participants by Annual Household Income
Race/Ethnicity
Figure 5 shows that approximately 77% of all survey respondents identified as white. Pinellas County
tended to have a slightly higher white response rate at 86%, while Hillsborough County reported in
at 72%. Hillsborough County had the highest response rate by minority populations including 11%
who identified as Hispanic, Latino or Spanish origin, and 7% who identified as African American.
While these percentages are lower compared to the County totals, they do reflect an extensive
outreach effort to try to maximize the survey participation rate among minority groups.
Figure 5. Participants by Race/Ethnicity
Emails
Over 5,600 emails were provided and were eligible for the drawing. A drawing to select the winners
was held at a meeting of the Hillsborough MPO Board on Tuesday, October 2, 2018.

2045 Tri-County Transportation Plan – MetroQuest Survey Results
12
Chapter 4 – Priorities
The second screen of the It’s TIME Tampa Bay survey (What is Important to You?) included seven
priorities. Survey respondents were asked to identify their top five priorities; however, respondents
could identify less and still continue on the next screen. The respondents’ priorities were then used
on the Scenarios screen to show the impact that each scenario has on each selected priority
(additional information provided in Chapter 5). The following images display the Priorities screen,
along with the “What to Do” pop-up box.
Priorities Screen
“What to Do” Pop-up Box
In total, priorities were ranked 39,645 times by all survey participants, which equates to an average of
4.1 priorities identified per survey respondent. The It’s TIME Tampa Bay priorities and descriptions,
as presented in the survey, are listed on the following page. A summary of the top priorities follows
the descriptions.
Comment from Hillsborough Resident (commenting on Traffic Jams)
“More than anything else I would like to not have to drive, with a shorter non-car dependent commute.”
Comment from Pinellas Resident (commenting on Alternatives to Driving)
“Give us a city to city (St. Pete to Tampa) solution, where we can park in one city and go to the other.”
Comment from Pasco Resident (commenting on Shorter Commutes)
“Expanding mass transit and other personal vehicle alternatives, especially to poorer and more underserved areas, would be a massive boon to our region and citizenry.”

2045 Tri-County Transportation Plan – MetroQuest Survey Results
13
It’s TIME Tampa Bay Priorities
Traffic Jams
Reduce amount of time spent sitting in traffic on
a typical weekday, which affects productivity,
family time, air quality, noise, and other factors.
Alternatives to Driving
Expand opportunities for walking, biking, buses
and rail, carpooling and water ferries.
Shorter Commutes
Keep the economy moving by shortening
commutes so people have access to jobs, and
businesses have access to workers.
Open Space
Protect undeveloped lands, including wetlands
and wildlife areas.
Public Service Costs
Efficiently manage growth to reduce the costs of
building and maintaining new water supply lines,
sewers, and local roads.
Equal Opportunity
Improve access to jobs and life-sustaining
services for underserved communities.
Storm Vulnerability
Minimize the number of people and jobs located
in hurricane evacuation zones.

2045 Tri-County Transportation Plan – MetroQuest Survey Results
14
Top Priorities
Figure 6 summarizes the percentage of times that each priority was identified on screen 2 of the
MetroQuest survey. The figure highlights the responses by county, as compared to the overall
survey response by all participants. Traffic jams and alternatives to driving were identified as the top
tier priorities. Of the 9,575 surveys, 7,184 (75%) respondents identified traffic jams and 7,059 (74%)
respondents identified alternatives to driving as a top priority. Second tier priorities included open /
green space which was identified 6,123 (64%) times by respondents, and shorter commutes,
identified 5,956 times (62%).
Figure 6. Priority Ratings (by County)
Hillsborough and Pasco County respondents ranked traffic jams as the top priority while a slightly
higher number of Pinellas County respondents identified alternatives to driving as their top choice.
Pasco County respondents slightly favored shorter commutes as their third priority (over open
/green space).
One additional item of note: 57% Pinellas County respondents identified storm vulnerability as a top
priority – eight percentage points higher than Hillsborough County respondents and four percentage
points higher than Pasco County respondents.
Table 2 on the following page provides a detailed breakdown of the priority ratings.
76.0
%
75.4
%
64.6
%
62.8
%
48.9
%
49.5
%
40.1
%
73.1
%
76.2
%
69.0
%
59.9
%
56.7
%
50.1
%
40.4
%
78.3
%
72.4
%
60.8
%
68.0
%
52.6
%
53.8
%
34.7
%
0.0%
10.0%
20.0%
30.0%
40.0%
50.0%
60.0%
70.0%
80.0%
90.0%
Traffic Jams Alternatives toDriving
Open / GreenSpace
ShorterCommutes
StormVulnerability
Public ServiceCosts
EqualOpportunity
Hillsborough Pinellas Pasco All Participants
Ranked highest to lowest based on All Participants

2045 Tri-County Transportation Plan – MetroQuest Survey Results
15
Table 2. Priority Ratings (Detailed Breakdown)
Number of Times Identified as a Top 5 Priority
NOTE: Darker to lighter green shading (or no shading) indicates the highest to lowest totals.
Percentage of Times Identified as a Top 5 Priority
Distribution of Responses by Category
All Participants Hillsborough Pinellas Pasco
Traffic Jams 7,184 3,049 1,265 627
Alternatives to Driving 7,059 3,024 1,319 580
Open / Green Space 6,123 2,593 1,195 487
Shorter Commutes 5,956 2,520 1,037 545
Storm Vulnerability 4,883 1,963 982 421
Public Service Costs 4,768 1,985 868 431
Equal Opportunity 3,672 1,607 700 278
39,645 16,741 7,366 3,369
4.14 4.17 4.26 4.21
All Participants Hillsborough Pinellas Pasco
Traffic Jams 75.0% 76.0% 73.1% 78.3%
Alternatives to Driving 73.7% 75.4% 76.2% 72.4%
Open / Green Space 63.9% 64.6% 69.0% 60.8%
Shorter Commutes 62.2% 62.8% 59.9% 68.0%
Storm Vulnerability 51.0% 48.9% 56.7% 52.6%
Public Service Costs 49.8% 49.5% 50.1% 53.8%
Equal Opportunity 38.3% 40.1% 40.4% 34.7%
9,575 4,012 1,731 801
Row Labels All Participants Hillsborough Pinellas Pasco
Traffic Jams 18.1% 18.2% 17.2% 18.6%
Alternatives to Driving 17.8% 18.1% 17.9% 17.2%
Open / Green Space 15.4% 15.5% 16.2% 14.5%
Shorter Commutes 15.0% 15.1% 14.1% 16.2%
Storm Vulnerability 12.3% 11.7% 13.3% 12.5%
Public Service Costs 12.0% 11.9% 11.8% 12.8%
Equal Opportunity 9.3% 9.6% 9.5% 8.3%
Surveys by All Participants/County:
Average Number of Priorities Rated:

2045 Tri-County Transportation Plan – MetroQuest Survey Results
16
Chapter 5 – Scenarios
The Scenarios in screen 3 were created to facilitate discussion of three potentially different growth
and transportation futures. The intent was to present exaggerated scenarios that would make
participants consider the choices/consequences associated with future growth and development, and
to ultimately view how each scenario could potentially impact their priorities, and future
transportation and mobility options. In some cases, the project elements identified in the scenarios
were inspired by other agencies’ studies, such as:
• Tampa Bay Next
• Regional Transit Feasibility Plan
Other scenario projects may include options that are not currently being explored by the sponsoring
agency, but were listed nonetheless because they could provide useful insight into what is important
to the public. While each scenario is rated from 1 to 5 stars, participants are not rating individual
projects; instead they are rating overall themes associated with each scenario to help inform the
LRTP development process. Ultimately, one scenario will not solve the region’s transportation and
mobility issues. It will require a wide range of strategies and policies, addressing both growth and
infrastructure, to shape the future transportation system.
The Scenarios screen started by asking the general question “How should we grow?” Based on the
priorities a respondent selected on screen 2, the impacts of the transportation and growth on that
scenario were communicated by arrows. A red arrow pointing left indicated that particular priority
would perform worse than today, by the year 2045. A green arrow pointing right indicated that
particular priority would perform better than today, by the year 2045. In both situations, the longer
the arrow, the greater negative or positive the impact. Furthermore, participants were encouraged to
provide comments that could be used to better understand the survey responses. The scenarios are
summarized on the following pages.
Scenarios Screen
“What to Do” Pop-up Box

2045 Tri-County Transportation Plan – MetroQuest Survey Results
17
It’s TIME Tampa Bay Scenarios
Scenario A Imagine a future where we primarily
invest in NEW TECHNOLOGIES and a few
roadway projects to manage traffic flow.
Scenario A Impact on Priorities

2045 Tri-County Transportation Plan – MetroQuest Survey Results
18
It’s TIME Tampa Bay Scenarios
Scenario B Imagine a future where we primarily
invest in EXPRESSWAY LANES forming
an outer loop so traffic does not have to
go through the congested center of the
region.
Scenario B Impact on Priorities

2045 Tri-County Transportation Plan – MetroQuest Survey Results
19
It’s TIME Tampa Bay Scenarios
Scenario C Imagine a future where we primarily
invest in BUS AND RAIL SERVICES
connecting, revitalizing and in-filling the
communities that exist today.
Scenario C Impact on Priorities

2045 Tri-County Transportation Plan – MetroQuest Survey Results
20
Scenario Results
The following sections summarize the survey results for the three scenarios. Respondents ranked the
scenarios using a 1 to 5 scale, with 1 representing the least appealing score and 5 the most
appealing. For the purpose of the presenting the results, the graphs combine the 1 and 2 ratings (low
approval, or less favorable) and the 4 and 5 ratings (high approval, or more favorable).
Scenario A – New Technologies
Scenario A involved imagining a future that invested mostly in new technologies and a few select
roadway projects to manage traffic flow. In total, 7,832 participants (3,702 from Hillsborough, 1,615
from Pinellas, and 727 from Pasco as defined by home zip code) rated this scenario. Figure 7 shows
that overall survey respondents in general had a relatively neutral opinion of the new technologies
scenario. Of all participants, 40% rated this scenario low with 1 or 2 stars. By comparison, 31% rated
this scenario high at 4 or 5 stars. Figure 8 shows the average rating for Scenario A was 2.86. Pasco
County respondents had a slightly higher favorable opinion of this scenario with a rating of 2.97.
Figure 7. Scenario A Rating (1 to 5 Stars) Figure 8. Scenario A Average Rating
Comment from Hillsborough Resident
(works outside the tri-county area)
“Want to see less vehicles and roads, not more. Would be further convinced of driverless transport if there was a positive
impact on noise, smog, and congestion in highways.”
Comment from Pinellas Resident
(works in Hillsborough County)
“While these solutions are nice on the surface and could certainly be utilized to relieve some of the transportation issues,
I don’t think they address the root of the problems. They feel like band aids. I do like the idea of driverless cars, but I think
we’re a ways away from people being comfortable with them and money could be better spent elsewhere (at least for now).”
Comment from Pasco Resident
(works in Pasco County)
“More emphasis on convenient, fast, efficient, mass transit, less on a ton of driverless vehicles on already jammed roads.”
35.2%
31.1%
33.7%
38.3%
31.3%
30.5%
42.4%
27.7%
29.9%
40.4%
28.3%
31.3%
0.0% 10.0% 20.0% 30.0% 40.0% 50.0% 60.0% 70.0% 80.0% 90.0%
1 & 2
3
4 & 5
All Participants Hillsborough Pinellas Pasco

2045 Tri-County Transportation Plan – MetroQuest Survey Results
21
Scenario B – Expressway Lanes
Scenario B involved reimagining expressways by adding tolled express lanes and creating an outer
loop to facilitate more efficient travel movement through the region. In total, 6,460 participants
(3,246 from Hillsborough, 1,352 from Pinellas, and 563 from Pasco as defined by home zip code)
rated this scenario. Figure 9 shows that overall the majority of survey respondents had a relatively
less than favorable opinion of this scenario. Of all participants, 52% rated this scenario low with 1 or
2 stars. By comparison, only 25% rated this scenario high at 4 or 5 stars.
Figure 10 shows the average rating for Scenario B was 2.53. Pasco County respondents had a slightly
higher favorable opinion of this scenario with a rating of 2.77 while Pinellas County respondents
rated this scenario lower at 2.35.
Figure 9. Scenario B Rating (1 to 5 Stars) Figure 10. Scenario B Average Rating
Comment from Hillsborough Resident
(works outside the tri-county area)
“Expressway lanes have not worked that well in South Florida. Stick with new technologies and alternate forms of
transportation (rail, bus, ferry, etc.).”
Comment from Pinellas Resident
(works in Pinellas County)
“Express lanes help for major commutes but do nothing for local traffic. You still have to get to the express lanes somehow
and this must be accounted for.”
Comment from Pasco Resident
(works in Hillsborough County)
“I like the idea of an express lane, but I'm not sure how that minimizes the traffic and shortens the commute.”
45.5%
21.0%
33.6%
58.4%
21.0%
20.6%
51.3%
23.1%
25.6%
52.3%
22.1%
25.6%
0.0% 10.0% 20.0% 30.0% 40.0% 50.0% 60.0% 70.0% 80.0% 90.0%
1 & 2
3
4 & 5
All Participants Hillsborough Pinellas Pasco

2045 Tri-County Transportation Plan – MetroQuest Survey Results
22
Scenario C – Transit Focus (Bus and Rail)
Scenario C focuses on regional and statewide transit, mostly bus and rail, improvements. In total,
6,302 participants (3,210 from Hillsborough, 1,320 from Pinellas, and 547 from Pasco as defined by
home zip code) rated this scenario. Figure 11 shows overwhelmingly support by survey respondents
for this scenario. Of all participants, 75% rated this scenario high with 4 or 5 stars. Pinellas County
respondents rated this scenario slightly higher at 78%. By comparison, only 12% of all respondents
rated this scenario low at 1 or 2 stars.
Figure 12 shows the average rating for Scenario B was 4.08. Pasco County respondents had a slightly
lower rating at 3.96 while Pinellas County respondents rated this scenario slightly higher at 4.16.
Figure 11. Scenario C Rating (1 to 5 Stars) Figure 12. Scenario C Average Rating
Comment from Hillsborough Resident
(works in Hillsborough County)
“Multimodal! This is our future. The only thing I would add is an expanded and modernized streetcar system connecting the urban
districts within Tampa. I love the inclusion of the water ferry system as well - we are surrounded by water and need to use it!”
Comment from Pinellas Resident
(works in Hillsborough County)
“This region needs to invest in transit. I live in Pinellas County and there are very few roadway corridors that can be expanded to
accommodate the future levels of traffic. The region also needs to invest in walking and biking.”
Comment from Pasco Resident
(works in Pasco County)
“I think this (Scenario C) is great because it gives other options to driving everywhere, which can open up job markets that were
previously out of reach based on commute.”
13.3%
13.7%
72.9%
10.6%
11.4%
78.0%
11.0%
11.8%
77.2%
12.2%
12.1%
75.8%
0.0% 10.0% 20.0% 30.0% 40.0% 50.0% 60.0% 70.0% 80.0% 90.0%
1 & 2
3
4 & 5
All Participants Hillsborough Pinellas Pasco

2045 Tri-County Transportation Plan – MetroQuest Survey Results
23
Chapter 6 – Elements
The fourth screen polled respondents about Elements, or components of the three scenarios to
facilitate further discussion regarding potential roadway projects, transit projects, community
development, and funding options. The Elements screen started with the question, “What Should
Be in the Plan?” The intent of the question was to drill down into the ingredients that make up each
of the scenarios to help determine what elements should ultimately be included in a hybrid
transportation and growth scenario. In total, there were 20 elements – allowing respondents who
liked certain aspects of a scenario, but not the entire scenario, to provide more detailed input that
could be used to identify key themes.
Elements Screen
“What to Do” Pop-up Box
It’s TIME Tampa Bay Elements
Roadways
• Advanced Technology
• New/Expanded Ramps
• Elevated Toll Roads
• Complete the Loop
• I-275 Boulevard
Community
• Expanded Growth Area
• Preserve Neighborhoods
• More/Better Downtowns
• Efficient Use of Land
• Walk & Bike Focus
Transit
• Expanded Ridesharing
• Express Bus Rapid Transit
• Rail (Local/Regional)
• Water Ferry
• Statewide Rail
Funding
• New Lanes with Tolls
• Taxes/Fees for Roads
• Taxes/Fees for Buses
• Taxes/Fees for Rail
• Special District Fees

2045 Tri-County Transportation Plan – MetroQuest Survey Results
24
Overall Responses
Figure 13 shows all the elements as sorted by average rating (highly supported elements begin on
the left side of the graph, and less favored elements on the far right side). The figure includes color-
coded symbols to distinguish which of the four elements each response is assigned to (see legend
below the graph).
Figure 13. All Elements Ratings
LEGEND
Roadway Element Transit Element Community Element Funding Element
The highest overall support was for rail-related projects—both statewide rail connecting to the
Tampa Bay area and for local/regional service, such as Light Rail Transit (LRT). The next four highest
rated elements focus on community development and growth. Each of these four elements
generally focused on more efficient land use—and expanded walking and biking—that would
support an expanded regional transit system. By comparison, the fifth community element was an
expanded growth area that received the lowest rating of all 20 elements.
Taxes/fees to fund rail rated the highest among the funding elements, with special district fees being
the second highest rated funding element. The remaining funding options were less favorable, with
over 40% of survey respondents providing low (1 and 2 star) ratings. Of all five funding elements,
taxes/fees for roadways was rated the least favorable.
The majority of roadway elements had support and high (4 and 5 star) ratings. The Complete the
Loop element had almost a nearly equal level of low and high support, while the I-275 Boulevard
Conversion was rated low, with over 50% of survey respondents rating it 1 or 2 stars. Each element is
discussed further in the following sections.
0.0%
10.0%
20.0%
30.0%
40.0%
50.0%
60.0%
70.0%
80.0%
90.0%
1 & 2 3 4 & 5
0.0%
10.0%
20.0%
30.0%
40.0%
50.0%
60.0%
70.0%
80.0%
90.0%
1 & 2 3 4 & 5

2045 Tri-County Transportation Plan – MetroQuest Survey Results
25
Roadway Elements
Overall, survey participants support New/Expanded Ramps, have a generally positive opinion for
Advanced Technology and Elevated Toll Roads, a somewhat neutral opinion on Complete the Loop,
and less than positive opinion on the conversion of I-275 to a boulevard. Of the five roadway
elements, 55% rated Expanded/New Ramps highly (4 or 5 stars) while 54% rated the I-275 boulevard
conversion poorly (1 or 2 stars). Figure 14 summarizes the roadway element ratings.
Figure 14. Roadway Elements (Ratings 1 to 5 Stars)
Table 3 shows expanded/new ramps received the highest roadway element average rating at 3.56.
Pasco County respondents rate this slightly higher at 3.79 (0.23 points higher) compared to all
participants. Overall, Pasco respondents rated roadway improvements 0.20 to 0.30 points higher
compared to the overall average, while having a less favorable opinion of advanced technology and
I-275 conversion. Pinellas County respondents had a less favorable rating of the Complete the Loop
at 2.79 (0.24 points lower than the overall average 3.03). Pinellas respondents also rated the I-275
conversion 0.14 points lower than the average. Figures 15 to 17 display 1 to 5 ratings by county.
Table 3. Roadway Elements (Average Ratings)
21.5%
32.1% 31.9%
37.2%
54.1%
22.9% 21.8% 22.4% 23.0%19.5%
55.5%
46.1% 45.7%
39.8%
26.4%
0.0%
10.0%
20.0%
30.0%
40.0%
50.0%
60.0%
70.0%
80.0%
90.0%
Expanded/NewRamps
AdvancedTechnology
Elevated Toll Roads Complete the Loop I-275 Boulevard
1 & 2 3 4 & 5

2045 Tri-County Transportation Plan – MetroQuest Survey Results
26
Figure 15. Roadway Elements – Hillsborough County Respondents
Figure 16. Roadway Elements – Pinellas County Respondents
Figure 17. Roadway Elements – Pasco County Respondents
22.1%30.3% 33.0% 36.3%
52.6%
22.2% 22.5% 22.0% 24.2%18.5%
55.7%47.3% 45.0%
39.5%
28.9%
0.0%
10.0%
20.0%
30.0%
40.0%
50.0%
60.0%
70.0%
80.0%
90.0%
Expanded/NewRamps
AdvancedTechnology
Elevated Toll Roads Complete the Loop I-275 Boulevard
1 & 2 3 4 & 5
Average of All Participants
22.3%
31.1% 32.4%
44.7%
57.6%
25.9%21.0% 23.7% 21.5% 20.9%
51.8%47.9%
43.8%
33.8%
21.5%
0.0%
10.0%
20.0%
30.0%
40.0%
50.0%
60.0%
70.0%
80.0%
90.0%
Expanded/NewRamps
AdvancedTechnology
Elevated Toll Roads Complete the Loop I-275 Boulevard
1 & 2 3 4 & 5
Average of All Participants
14.5%
36.3%
24.8%29.3%
58.6%
22.4% 22.4% 22.9% 20.3% 22.6%
63.1%
41.3%
52.3% 50.3%
18.8%
0.0%
10.0%
20.0%
30.0%
40.0%
50.0%
60.0%
70.0%
80.0%
90.0%
Expanded/NewRamps
AdvancedTechnology
Elevated Toll Roads Complete the Loop I-275 Boulevard
1 & 2 3 4 & 5
Average of All Participants

2045 Tri-County Transportation Plan – MetroQuest Survey Results
27
Individual Roadway Elements
New / Expanded Ramps
This element includes targeted roadway investment to improve connections and traffic flow between
Interstates/regional expressways and the local roadway network. Generally speaking, these
improvements are intended to enhance traffic operations and more effectively move traffic to reduce
congestion, reduce travel delay and improve travel safety. Figure 18 displays the 1 to 5 star rating
this element received among participants from different counties.
Improve expressway
ramps and new road
connections to make it
easier and safer to
enter and exit.
Figure 18. New/Expanded Ramps (Ratings)
The majority of all survey participants favor this type of improvement. In total, among the 6,968
participants who rated this element, approximately 55% rated it highly (four or five stars). Pasco
County residents tend to have a more favorable rating of this scenario, coming in approximately 8
percentage points higher compared to all survey participants (63% high rating). By comparison,
Pinellas County residents have a slightly less favorable opinion of this element at approximately 3%
points lower than the survey average (52% high rating). Figure 19 shows the average rating for this
element was 3.56, with Pasco County participants having a higher rating at 3.79.
Figure 19. New/Expanded Ramps (Average Rating)
14.5%
22.4%
63.1%
22.3%
25.9%
51.8%
22.1%
22.2%
55.7%
21.5%
22.9%
55.5%
0.0% 10.0% 20.0% 30.0% 40.0% 50.0% 60.0% 70.0% 80.0% 90.0%
1 & 2
3
4 & 5
All Participants Hillsborough Pinellas Pasco

2045 Tri-County Transportation Plan – MetroQuest Survey Results
28
Elevated Toll Roads
Elevated toll roads would provide greater capacity on area expressways by limiting the number of
entry/exit points, helping reduce travel delay and enhance regional travel connections. The elevated
toll roads have a secondary benefit as the raised structure has the potential to avoid flooding during
hurricanes or other storm events. Figure 20 displays the 1 to 5 star rating for this element among
participants from different counties.
Elevated Toll Roads
Expressways with
limited entry points
provide reliable travel
times and less delay
Figure 20. Elevated Toll Roads (Ratings)
The majority of all survey participants slightly favored this type of improvement. Among the 6,880
participants who rated this element, approximately 46% gave it a rating of four or five stars. Pasco
County residents have a more favorable rating of elevated toll roads—approximately 8-9 percentage
points higher compared to all survey participants (52% four or five star rating). By comparison,
Pinellas County residents have a slightly less favorable opinion of this element reporting in at
approximately 3 percentage points lower than the survey average (44% four or five star rating).
Figure 21 shows the average rating was 3.20, with Pasco County respondents coming in at 3.41.
Figure 21. Elevated Toll Roads (Average Rating)
24.8%
22.9%
52.3%
32.4%
23.7%
43.8%
33.0%
22.0%
45.0%
31.9%
22.4%
45.7%
0.0% 10.0% 20.0% 30.0% 40.0% 50.0% 60.0% 70.0% 80.0% 90.0%
1 & 2
3
4 & 5
All Participants Hillsborough Pinellas Pasco
2045 Tri-County Transportation Plan – MetroQuest Survey Results
29
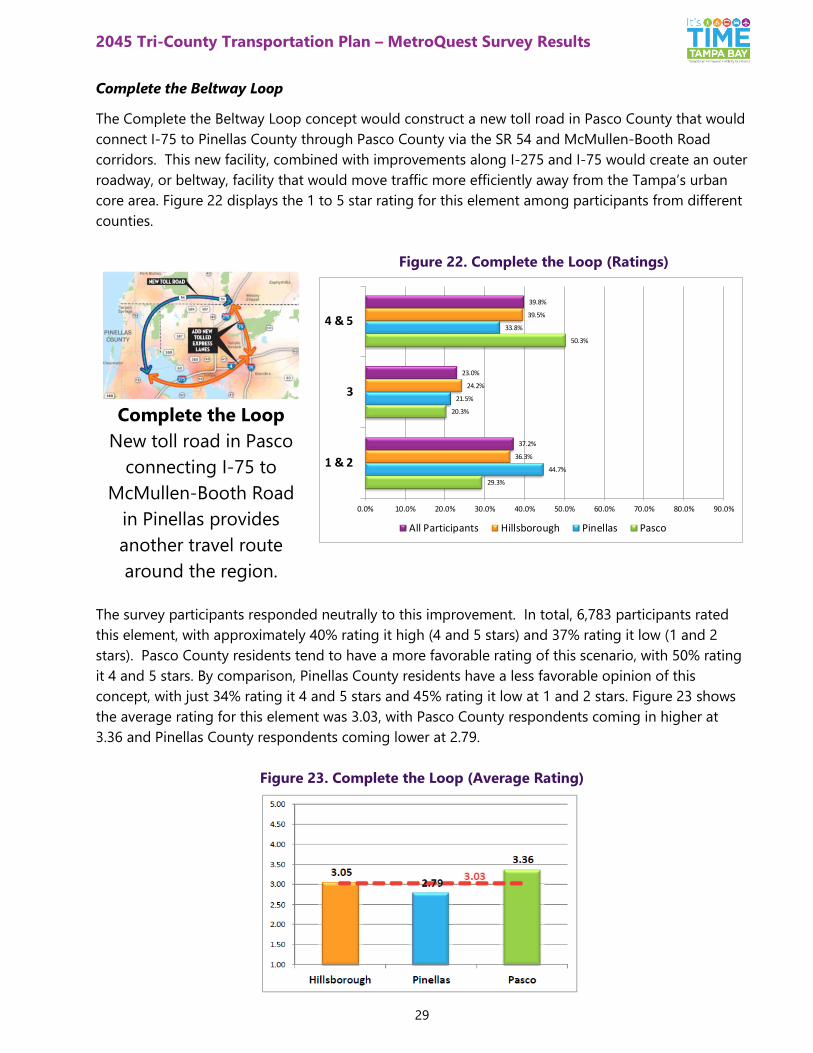
Complete the Beltway Loop
The Complete the Beltway Loop concept would construct a new toll road in Pasco County that would
connect I-75 to Pinellas County through Pasco County via the SR 54 and McMullen-Booth Road
corridors. This new facility, combined with improvements along I-275 and I-75 would create an outer
roadway, or beltway, facility that would move traffic more efficiently away from the Tampa’s urban
core area. Figure 22 displays the 1 to 5 star rating for this element among participants from different
counties.
Complete the Loop
New toll road in Pasco
connecting I-75 to
McMullen-Booth Road
in Pinellas provides
another travel route
around the region.
Figure 22. Complete the Loop (Ratings)
The survey participants responded neutrally to this improvement. In total, 6,783 participants rated
this element, with approximately 40% rating it high (4 and 5 stars) and 37% rating it low (1 and 2
stars). Pasco County residents tend to have a more favorable rating of this scenario, with 50% rating
it 4 and 5 stars. By comparison, Pinellas County residents have a less favorable opinion of this
concept, with just 34% rating it 4 and 5 stars and 45% rating it low at 1 and 2 stars. Figure 23 shows
the average rating for this element was 3.03, with Pasco County respondents coming in higher at
3.36 and Pinellas County respondents coming lower at 2.79.
Figure 23. Complete the Loop (Average Rating)
29.3%
20.3%
50.3%
44.7%
21.5%
33.8%
36.3%
24.2%
39.5%
37.2%
23.0%
39.8%
0.0% 10.0% 20.0% 30.0% 40.0% 50.0% 60.0% 70.0% 80.0% 90.0%
1 & 2
3
4 & 5
All Participants Hillsborough Pinellas Pasco

2045 Tri-County Transportation Plan – MetroQuest Survey Results
30
Advanced Technology
Ever changing technology advancements are quickly turning what used to be visionary
transportation concepts into viable future mobility solutions. Autonomous vehicles (AV) and
connected networks (CN) show promising signs of being able to address increasing traffic gridlock
brought on by urban growth. Vehicle automation also extends into shared mobility services and
freight transportation, making the potential benefits of a driverless future staggering. Figure 24
displays the 1 to 5 star rating for this element among respondents from different counties.
Invest in smart
infrastructure to
support driverless
vehicles and better
manage traffic flow.
Figure 24. Advanced Technology (Ratings)
Generally speaking, survey participants favor investment in advanced technology to better manage
traffic flow. In total, 46% of the total 7,793 participants rated this element highly (4 or 5 stars). Pasco
County residents have a slightly less favorable opinion of advanced technology at 5 percentage
points lower than the survey average. Figure 25 shows the overall average rating for all survey
respondents was 3.23, with Pasco County respondents coming in slightly lower at a 3.09 average.
Figure 25. Advanced Technology (Average Rating)
36.3%
22.4%
41.3%
31.1%
21.0%
47.9%
30.3%
22.5%
47.3%
32.1%
21.8%
46.1%
0.0% 10.0% 20.0% 30.0% 40.0% 50.0% 60.0% 70.0% 80.0% 90.0%
1 & 2
3
4 & 5
All Participants Hillsborough Pinellas Pasco
Advanced Technology

2045 Tri-County Transportation Plan – MetroQuest Survey Results
31
I-275 Boulevard Conversion
The I-275 boulevard conversion is a conceptual improvement that would convert an approximately
ten-mile segment of I-275 north of downtown Tampa from an interstate facility to an at-grade
boulevard. This improvement would be implemented to help reconnect neighborhoods and
promote the use of alternative transportation modes. This conceptual project would be coordinated
with improvements to the existing interstate and regional roadway network located on the outer
fringe to facilitate the movement of people and goods around the area. Figure 26 summarizes survey
respondents’ reaction to an I-275 boulevard conversion.
I-275 Boulevard
Convert I-275 north of downtown Tampa to
a street-level boulevard to reconnect Tampa’s core neighborhoods.
Figure 26. I-275 Boulevard Conversion (Ratings)
Overall, survey participants rated this the second lowest of all elements. In total, 6,657 participants
rated this element, with approximately 54% rating it low (one or two stars), compared to 26% that
rated it high (four or five stars). Pinellas and Pasco County residents tended to give this concept a
slightly lower rating at 57% to 59%. Figure 27 displays the average rating for the I-275 conversion
was 2.49. Hillsborough County respondents were slightly higher at a rating of 2.56.
Figure 27. I-275 Boulevard Conversion (Average Rating)
58.6%
22.6%
18.8%
57.6%
20.9%
21.5%
52.6%
18.5%
28.9%
54.1%
19.5%
26.4%
0.0% 10.0% 20.0% 30.0% 40.0% 50.0% 60.0% 70.0% 80.0% 90.0%
1 & 2
3
4 & 5
All Participants Hillsborough Pinellas Pasco

2045 Tri-County Transportation Plan – MetroQuest Survey Results
32
Transit Elements
Overall, there was widespread support for expanding transit options, which is consistent with the
Alternative to Driving receiving a high rating for the Priorities. Survey participants overwhelmingly
supported Statewide Rail and Local/Regional Rail Service, generally supported Express BRT Service
and Water Ferry and tended to have a less favorable opinion regarding Expanded Ridesharing, where
there were more neutral and low ratings than high. Each of the transit elements is discussed in more
detail in the following section. Figure 28 summarizes the transit element ratings.
Figure 28. Transit Elements (Ratings 1 to 5 Stars)
Table 4 summarizes the transit element average ratings, which show relatively little variation between
counties. The two exceptions are Expanded Ridesharing and Water Ferry were Pasco County
respondents were 0.13 to 0.18 points less likely to support these modes. Statewide Rail received the
highest average rating (4.35) within the transit category, followed closely by Local/Regional Rail
(4.28). Of the five transit elements, the Expanded Ridesharing was the only element to receive an
average rating below three (2.93 rating). Figures 29 to 31 display the responses by county.
Table 4. Transit Elements (Average Ratings)
9.1% 9.3%
20.7%24.9%
38.6%
8.5% 9.9%
24.2%22.1%
27.1%
82.4% 80.8%
55.1%53.0%
34.3%
0.0%
10.0%
20.0%
30.0%
40.0%
50.0%
60.0%
70.0%
80.0%
90.0%
Statewide Rail Rail (Local/Regional) Express BRT Water Ferry ExpandedRidesharing
1 & 2 3 4 & 5

2045 Tri-County Transportation Plan – MetroQuest Survey Results
33
Figure 29. Transit Elements – Hillsborough County Respondents
Figure 30. Transit Elements – Pinellas County Respondents
Figure 31. Transit Elements – Pasco County Respondents
8.6% 8.5%
21.1%24.7%
38.0%
8.8% 9.7%
25.1% 22.2%27.6%
82.6% 81.8%
53.7% 53.1%
34.4%
0.0%
10.0%
20.0%
30.0%
40.0%
50.0%
60.0%
70.0%
80.0%
90.0%
Statewide Rail Rail (Local/Regional) Express BRT Water Ferry ExpandedRidesharing
1 & 2 3 4 & 5
Average of All Participants
7.3% 8.3%
20.0% 21.4%
37.2%
8.0% 9.6%
23.8% 23.1%28.1%
84.7% 82.1%
56.2% 55.5%
34.7%
0.0%
10.0%
20.0%
30.0%
40.0%
50.0%
60.0%
70.0%
80.0%
90.0%
Statewide Rail Rail (Local/Regional) Express BRT Water Ferry ExpandedRidesharing
1 & 2 3 4 & 5
Average of All Participants
8.3% 9.0%
19.1%
28.2%
43.2%
7.9% 9.5%
22.5% 21.2%27.9%
83.8% 81.4%
58.5%50.6%
28.9%
0.0%
10.0%
20.0%
30.0%
40.0%
50.0%
60.0%
70.0%
80.0%
90.0%
Statewide Rail Rail (Local/Regional) Express BRT Water Ferry ExpandedRidesharing
1 & 2 3 4 & 5
Average of All Participants

2045 Tri-County Transportation Plan – MetroQuest Survey Results
34
Statewide Rail
A statewide rail system would provide a commuter passenger rail service connecting the Tampa Bay
region to Orlando and other regions throughout Florida. This concept would provide Tampa Bay
residents and out of state visitors an alternative to having to drive the I-4 corridor. Figure 32
summarizes survey respondents’ reaction to a statewide rail connection to Tampa Bay.
Statewide Rail
Connect the Tampa Bay region to Orlando and other regions around
Florida.
Figure 32. Statewide Rail (Ratings)
As noted above, survey participants responded positively to this type of improvement. In total,
among the 6,614 participants who rated this element, approximately 82% rated it four or five stars.
All three counties had an equal favorability rating (83%-85%). Figure 33 shows the overall average
rating for all survey respondents was 4.35. As the overall average falls below the three county
averages, this would indicate that survey respondents who did not provide a home zip coded rated
this element slightly lower compared to those who provided their home zip code.
Figure 33. Statewide Rail (Average Ratings by County)
8.3%
7.9%
83.8%
7.3%
8.0%
84.7%
8.6%
8.8%
82.6%
9.1%
8.5%
82.4%
0.0% 10.0% 20.0% 30.0% 40.0% 50.0% 60.0% 70.0% 80.0% 90.0%
1 & 2
3
4 & 5
All Participants Hillsborough Pinellas Pasco
2045 Tri-County Transportation Plan – MetroQuest Survey Results
35
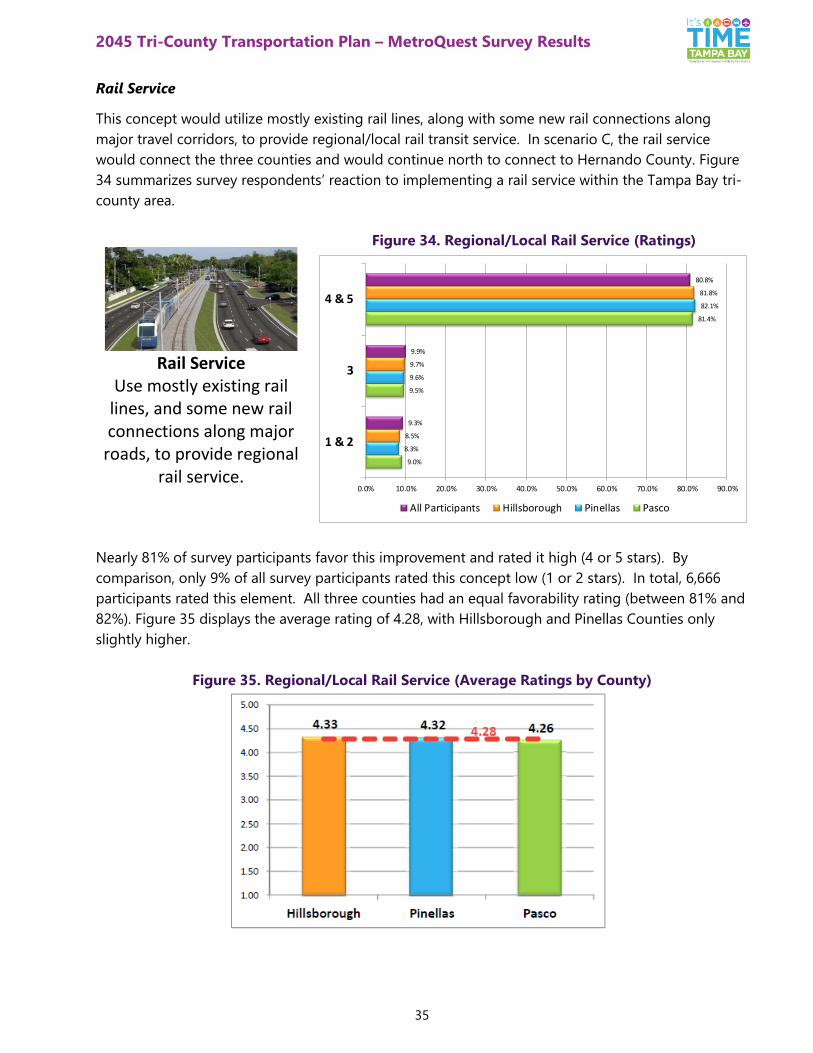
Rail Service
This concept would utilize mostly existing rail lines, along with some new rail connections along
major travel corridors, to provide regional/local rail transit service. In scenario C, the rail service
would connect the three counties and would continue north to connect to Hernando County. Figure
34 summarizes survey respondents’ reaction to implementing a rail service within the Tampa Bay tri-
county area.
Rail Service
Use mostly existing rail lines, and some new rail connections along major
roads, to provide regional rail service.
Figure 34. Regional/Local Rail Service (Ratings)
Nearly 81% of survey participants favor this improvement and rated it high (4 or 5 stars). By
comparison, only 9% of all survey participants rated this concept low (1 or 2 stars). In total, 6,666
participants rated this element. All three counties had an equal favorability rating (between 81% and
82%). Figure 35 displays the average rating of 4.28, with Hillsborough and Pinellas Counties only
slightly higher.
Figure 35. Regional/Local Rail Service (Average Ratings by County)
9.0%
9.5%
81.4%
8.3%
9.6%
82.1%
8.5%
9.7%
81.8%
9.3%
9.9%
80.8%
0.0% 10.0% 20.0% 30.0% 40.0% 50.0% 60.0% 70.0% 80.0% 90.0%
1 & 2
3
4 & 5
All Participants Hillsborough Pinellas Pasco

2045 Tri-County Transportation Plan – MetroQuest Survey Results
36
Express Bus & BRT Service
This concept builds off the exaggerated Scenario C which included additional BRT projects
throughout the tri-county area, including a BRT route along Central Avenue in Pinellas County. Figure
36 displays survey respondents’ ratings for this element.
Express Bus & BRT
Service Make express bus service
more frequent and run some buses in their own lanes (Bus Rapid Transit).
Figure 36. Express Bus and Bus Rapid Transit (Ratings)
The survey participants responded positively to this improvement. Fifty-five percent of the total
6,626 participants gave this element a rating of four or five stars. All three counties had a nearly
equal favorability rating (54% to 59%), with Pasco County slightly more favorable than Hillsborough
and Pinellas Counties. Figure 37 shows the average rating was 3.54, which was fairly consistent across
all three counties.
Figure 37. Express Bus and Bus Rapid Transit (Average Ratings by County)
19.1%
22.5%
58.5%
20.0%
23.8%
56.2%
21.1%
25.1%
53.7%
20.7%
24.2%
55.1%
0.0% 10.0% 20.0% 30.0% 40.0% 50.0% 60.0% 70.0% 80.0% 90.0%
1 & 2
3
4 & 5
All Participants Hillsborough Pinellas Pasco

2045 Tri-County Transportation Plan – MetroQuest Survey Results
37
Water Ferry
This concept builds off a 2016/2017 trial run of a downtown St. Petersburg to downtown Tampa
water ferry service. This service, which returns in November 2018, would be expanded to connect to
MacDill Air Force base and South Hillsborough. Figure 37 shows the participant ratings for this
element.
Water Ferry
Connect the downtowns of Tampa and St.
Petersburg, and MacDill AFB and South Hillsborough.
Figure 38. Water Ferry (Ratings)
The survey participants responded positively to this type of improvement. In total, 6,575 participants
rated this element, with approximately 53% rating it four or five stars. Pinellas County responded
most favorably (56%, average score 3.56) and Pasco County responded somewhat less favorably
(51%, average score 3.36). Figure 38 shows the average rating was 3.49.
Figure 39. Water Ferry (Average Ratings by County)
28.2%
21.2%
50.6%
21.4%
23.1%
55.5%
24.7%
22.2%
53.1%
24.9%
22.1%
53.0%
0.0% 10.0% 20.0% 30.0% 40.0% 50.0% 60.0% 70.0% 80.0% 90.0%
1 & 2
3
4 & 5
All Participants Hillsborough Pinellas Pasco

2045 Tri-County Transportation Plan – MetroQuest Survey Results
38
Expanded Ridesharing
Over the past decade, ridesharing has emerged as important travel mode in urban environments—
drawing both praise and criticism. Depending on the context and local policies, it can enable people
to avoid single-occupancy vehicle travel for some trips, such as making first- and last-mile
connections to transit; however, it can also add to urban congestion and attract riders away from
transit. This element focuses on using ridesharing to provide alternatives that would boost access to
transit and decrease the need for car ownership. Figure 40 displays the ratings for this element.
Expanded Ridesharing
Encourage more rideshare options (e.g.
Uber/Lyft) to travel without having to own a
car while improving connections to transit.
Figure 40. Expanded Ridesharing (Ratings)
The survey participants responded somewhat negatively to this type of improvement. In total, 7,350
participants rated this element, of whom fewer rated it favorably (34%) than negatively (39%). Pasco
County responded most negatively to expanded ridesharing (43%) and Pinellas County responded
least negatively to this (37%). Figure 40 shows the average rating was 2.93, with Pasco County
reporting a slightly lower average at 2.75.
Figure 41. Expanded Ridesharing (Average Ratings by County)
43.2%
27.9%
28.9%
37.2%
28.1%
34.7%
38.0%
27.6%
34.4%
38.6%
27.1%
34.3%
0.0% 10.0% 20.0% 30.0% 40.0% 50.0% 60.0% 70.0% 80.0% 90.0%
1 & 2
3
4 & 5
All Participants Hillsborough Pinellas Pasco

2045 Tri-County Transportation Plan – MetroQuest Survey Results
39
Community Elements
Overall, survey participants rated most community elements very favorably. Preserving
Neighborhoods, Walk & Bike Focus, and More/Better Downtowns all received over 72% high
approval (4 or 5 stars). The exception is the Expanded Growth Area, which received only 22% high
approval. Figure 42 provides a summary of the community elements.
Figure 42. Community Elements (Ratings 1 to 5 Stars)
Table 5 provides the average ratings for the five community elements, including the variance of
individual counties from the total average. The highest rated were Preserve Neighborhoods, followed
closely by Walk & Bike Focus and More/Better Downtowns—all around 4.10. The Expanded Growth
Area was the only element to receive an average rating below 3 (2.40 rating), even in the county
where it garnered the most support, Pasco County (2.71). Each of the community elements is
discussed in more detail in the following section. Figures 43 to 45 display the responses by county.
Table 5. Community Elements (Average Ratings)
8.9%11.7% 10.4%
15.6%
55.8%
15.7% 15.0%16.8%
19.9%21.9%
75.3%73.3% 72.8%
64.5%
22.2%
0.0%
10.0%
20.0%
30.0%
40.0%
50.0%
60.0%
70.0%
80.0%
90.0%
PreserveNeighborhoods
Walk & Bike Focus More/BetterDowntowns
Efficient Land Use Expanded GrowthArea
1 & 2 3 4 & 5

2045 Tri-County Transportation Plan – MetroQuest Survey Results
40
Figure 43. Community Elements – Hillsborough County Respondents
Figure 44. Community Elements – Pinellas County Respondents
Figure 45. Community Elements – Pasco County Respondents
9.0% 11.1% 9.1%13.8%
56.1%
15.8% 14.8% 17.1% 19.2% 22.0%
75.2% 74.1% 73.8%67.0%
21.9%
0.0%
10.0%
20.0%
30.0%
40.0%
50.0%
60.0%
70.0%
80.0%
90.0%
PreserveNeighborhoods
Walk & Bike Focus More/BetterDowntowns
Efficient Land Use Expanded GrowthArea
1 & 2 3 4 & 5
Average of All Participants
7.0% 9.9% 10.5%17.8%
60.1%
13.4% 13.4% 15.5%21.1% 21.9%
79.7% 76.7% 74.0%
61.1%
18.0%
0.0%
10.0%
20.0%
30.0%
40.0%
50.0%
60.0%
70.0%
80.0%
90.0%
PreserveNeighborhoods
Walk & Bike Focus More/BetterDowntowns
Efficient Land Use Expanded GrowthArea
1 & 2 3 4 & 5
Average of All Participants
9.0%16.6%
12.5%16.8%
45.7%
18.1% 16.4% 17.5% 20.1%24.4%
72.9%67.0% 70.0%
63.1%
29.9%
0.0%
10.0%
20.0%
30.0%
40.0%
50.0%
60.0%
70.0%
80.0%
90.0%
PreserveNeighborhoods
Walk & Bike Focus More/BetterDowntowns
Efficient Land Use Expanded GrowthArea
1 & 2 3 4 & 5
Average of All Participants

2045 Tri-County Transportation Plan – MetroQuest Survey Results
41
Preserve Neighborhoods
As our communities grow older and more established, time can take its toll on the buildings,
landscape, and infrastructure that make them unique and full of character. This element would
dedicate investment to ensuring that neighborhoods that are older and may be in decline receive
targeted attention to improve conditions, hopefully serving as a catalyst to encourage further
reinvestment by residents and businesses. Figure 46 displays the ratings for this element, overall and
by county.
Preserve Neighborhoods
Revitalize older neighborhoods in cities
and suburbs, and promote reinvestment.
Figure 46. Preserve Neighborhoods (Ratings)
The survey participants responded positively to this type of improvement. In total, 6,571 participants
rated this element, and approximately 75% rated it four or five stars. Pasco County responded
slightly less positively (73% rating 4 or 5 stars), as might be expected given the County is
experiencing primarily new development, and Pinellas County responded most favorably (80% rating
4 or 5 stars). Figure 47 shows the average rating was 4.13, with relatively little difference by county.
Figure 47. Preserve Neighborhoods (Average Ratings by County)
9.0%
18.1%
72.9%
7.0%
13.4%
79.7%
9.0%
15.8%
75.2%
8.9%
15.7%
75.3%
0.0% 10.0% 20.0% 30.0% 40.0% 50.0% 60.0% 70.0% 80.0% 90.0%
1 & 2
3
4 & 5
All Participants Hillsborough Pinellas Pasco
2045 Tri-County Transportation Plan – MetroQuest Survey Results
42
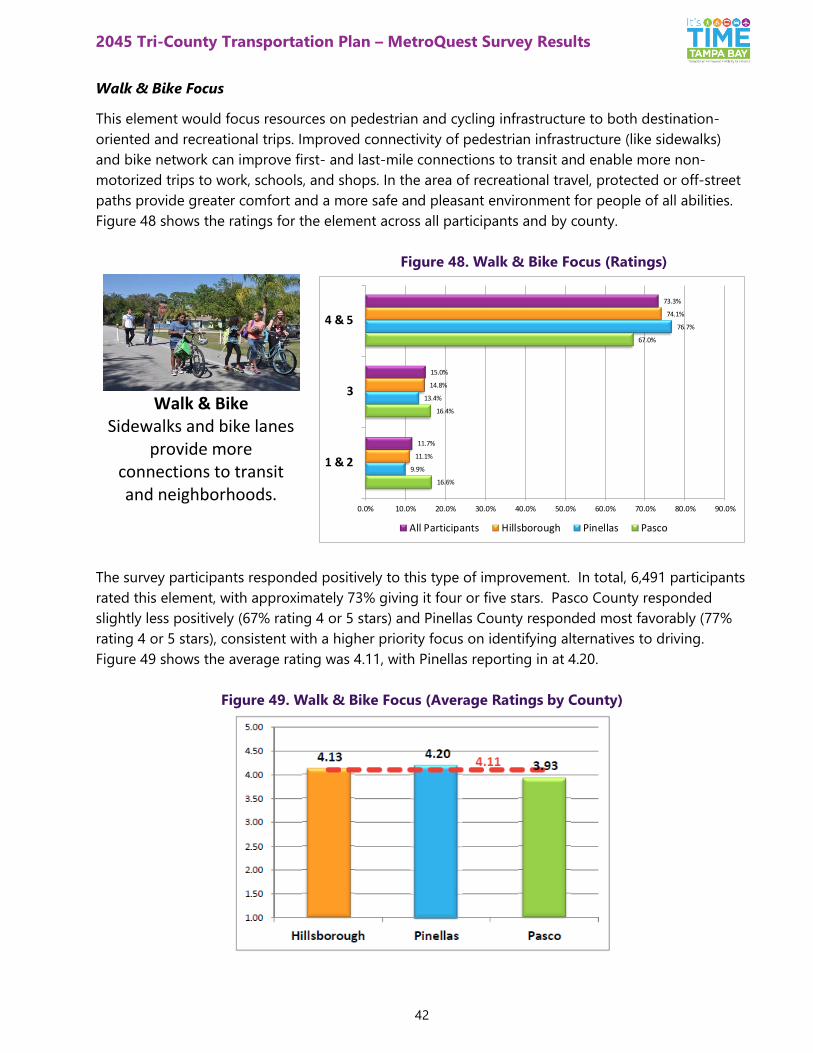
Walk & Bike Focus
This element would focus resources on pedestrian and cycling infrastructure to both destination-
oriented and recreational trips. Improved connectivity of pedestrian infrastructure (like sidewalks)
and bike network can improve first- and last-mile connections to transit and enable more non-
motorized trips to work, schools, and shops. In the area of recreational travel, protected or off-street
paths provide greater comfort and a more safe and pleasant environment for people of all abilities.
Figure 48 shows the ratings for the element across all participants and by county.
Walk & Bike
Sidewalks and bike lanes provide more
connections to transit and neighborhoods.
Figure 48. Walk & Bike Focus (Ratings)
The survey participants responded positively to this type of improvement. In total, 6,491 participants
rated this element, with approximately 73% giving it four or five stars. Pasco County responded
slightly less positively (67% rating 4 or 5 stars) and Pinellas County responded most favorably (77%
rating 4 or 5 stars), consistent with a higher priority focus on identifying alternatives to driving.
Figure 49 shows the average rating was 4.11, with Pinellas reporting in at 4.20.
Figure 49. Walk & Bike Focus (Average Ratings by County)
16.6%
16.4%
67.0%
9.9%
13.4%
76.7%
11.1%
14.8%
74.1%
11.7%
15.0%
73.3%
0.0% 10.0% 20.0% 30.0% 40.0% 50.0% 60.0% 70.0% 80.0% 90.0%
1 & 2
3
4 & 5
All Participants Hillsborough Pinellas Pasco

2045 Tri-County Transportation Plan – MetroQuest Survey Results
43
More/Better Downtowns
This element emphasizes the importance of creating more or better downtowns by directing
resources and tailoring land use policies to encourage such commercial districts. These downtowns
would typically have a mix of shops, offices, and housing options located in mid- and high-rise
buildings near transit stations to revitalize the area with larger day-time and night-time populations.
Figure 50 shows the ratings for this element.
More/Better Downtowns
Revitalize commercial districts with a mix of mid-rise and high-rise
office and housing options near transit
stations.
Figure 50. More/Better Downtowns (Ratings)
The survey participants responded positively to this type of improvement. In total, 6,499 participants
rated this element, with 73% giving it four or five stars. Pasco County responded slightly less
positively (70% rating 4 or 5 stars) and Pinellas County responded most favorably (74% rating 4 or 5
stars). Figure 51 shows the average rating was 4.07, with relatively little difference between counties
Figure 51. More/Better Downtowns (Average Ratings by County)
12.5%
17.5%
70.0%
10.5%
15.5%
74.0%
9.1%
17.1%
73.8%
10.4%
16.8%
72.8%
0.0% 10.0% 20.0% 30.0% 40.0% 50.0% 60.0% 70.0% 80.0% 90.0%
1 & 2
3
4 & 5
All Participants Hillsborough Pinellas Pasco
2045 Tri-County Transportation Plan – MetroQuest Survey Results
44
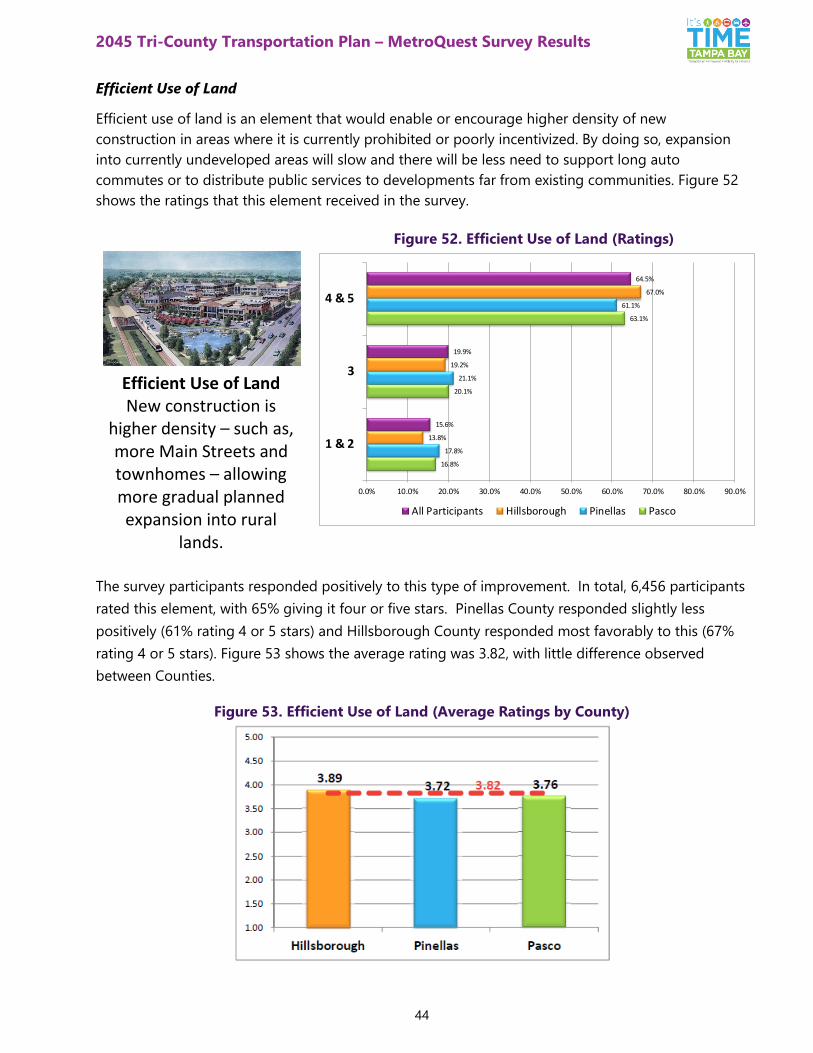
Efficient Use of Land
Efficient use of land is an element that would enable or encourage higher density of new
construction in areas where it is currently prohibited or poorly incentivized. By doing so, expansion
into currently undeveloped areas will slow and there will be less need to support long auto
commutes or to distribute public services to developments far from existing communities. Figure 52
shows the ratings that this element received in the survey.
Efficient Use of Land New construction is
higher density – such as, more Main Streets and townhomes – allowing more gradual planned expansion into rural
lands.
Figure 52. Efficient Use of Land (Ratings)
The survey participants responded positively to this type of improvement. In total, 6,456 participants
rated this element, with 65% giving it four or five stars. Pinellas County responded slightly less
positively (61% rating 4 or 5 stars) and Hillsborough County responded most favorably to this (67%
rating 4 or 5 stars). Figure 53 shows the average rating was 3.82, with little difference observed
between Counties.
Figure 53. Efficient Use of Land (Average Ratings by County)
16.8%
20.1%
63.1%
17.8%
21.1%
61.1%
13.8%
19.2%
67.0%
15.6%
19.9%
64.5%
0.0% 10.0% 20.0% 30.0% 40.0% 50.0% 60.0% 70.0% 80.0% 90.0%
1 & 2
3
4 & 5
All Participants Hillsborough Pinellas Pasco

2045 Tri-County Transportation Plan – MetroQuest Survey Results
45
Expanded Growth Area
In contrast to the previous element, Expanded Growth Area would support continued outward
expansion, with new development occurring in currently rural areas. This low-density approach to
development has been the traditional mode of expansion for much of the second half of the 20th
century, corresponding with a boom in road construction and public desire for large-lot single-family
homes. Expanded growth also generally increases the cost of providing public services. Figure 54
shows the support that this element received from survey participants.
Expanded Growth Area Development expands
outward, including growing into rural areas.
Figure 54. Expanded Growth Area (Ratings)
The survey participants responded negatively to this type of improvement. In total, 7,154
participants rated this element, with approximately 56% giving it 1 or 2 stars. Pinellas County
responded most negatively to this (61% rating 1 or 2 stars) and Pasco County responded less
negatively to this (46% rating 1 or 2 stars). The average rating was 2.40, as shown in Figure 55.
Figure 55. Expanded Growth Area (Average Ratings by County)
45.7%
24.4%
29.9%
60.1%
21.9%
18.0%
56.1%
22.0%
21.9%
55.8%
21.9%
22.2%
0.0% 10.0% 20.0% 30.0% 40.0% 50.0% 60.0% 70.0% 80.0% 90.0%
1 & 2
3
4 & 5
All Participants Hillsborough Pinellas Pasco

2045 Tri-County Transportation Plan – MetroQuest Survey Results
46
Funding Elements
Overall, survey participants have a generally positive view of Taxes/Fees for Rail and Special District
Fees, and a somewhat negative opinion of Taxes/Fees for Buses, New Lanes with Tolls, and
Taxes/Fees for Roads. Of the five funding elements, at least half of respondents gave a high rating (4
or 5 stars) to Taxes/Fees for Rail (59%) and Special District Fees (53%). Among the other elements,
only about a third of survey respondents rated them highly; the most negative ratings went to New
Lanes with Tolls (45%), followed by Taxes/Fees for Roads (44%) and Taxes/Fees for Buses (42%).
Figure 56 summarizes the roadway element ratings for all survey participants, and Figures 57 to 59
provide the ratings summary by county.
Figure 56. Funding Elements (Ratings 1 to 5 Stars)
Taxes/Fees for Rail received the highest average rating within the funding element category at 3.61;
Pasco County rated it slightly lower compared at 3.49, while Pinellas County rated it a little higher
(3.70). Overall, Pasco County respondents rated funding elements related to driving/roadways
higher and transit and special district funding elements lower than the tri-county average. The
funding elements tied for the lowest ratings were New Lanes with Tolls and Taxes/Fees for Roads
(2.76). Table 6 summarizes the funding element average ratings based on a 1 to 5 star rating. Each of
the elements is discussed in more detail in the following section.
Table 6. Funding Elements (Average Ratings)
24.1% 24.1%
42.3%44.7% 43.7%
16.5%
23.2% 23.9%22.1%
26.0%
59.4%
52.7%
33.8% 33.2%30.2%
0.0%
10.0%
20.0%
30.0%
40.0%
50.0%
60.0%
70.0%
80.0%
90.0%
Taxes/Fees for Rail Special District Fees Taxes/Fees for Buses New Lanes with Tolls Taxes/Fees for Roads
1 & 2 3 4 & 5

2045 Tri-County Transportation Plan – MetroQuest Survey Results
47
Figure 57. Funding Elements – Hillsborough County Respondents
Figure 58. Funding Elements – Pinellas County Respondents
Figure 59. Funding Elements – Pasco County Respondents
22.2% 22.4%
41.2%45.9%
42.5%
16.5%22.5% 24.2% 21.3%
26.2%
61.3%55.1%
34.7% 32.8% 31.3%
0.0%
10.0%
20.0%
30.0%
40.0%
50.0%
60.0%
70.0%
80.0%
90.0%
Taxes/Fees for Rail Special District Fees Taxes/Fees for Buses New Lanes with Tolls Taxes/Fees for Roads
1 & 2 3 4 & 5
Average of All Participants
21.1% 22.7%
40.0%45.1% 42.8%
16.9%23.2% 25.3% 22.8%
28.5%
62.0%
54.0%
34.7% 32.1%28.7%
0.0%
10.0%
20.0%
30.0%
40.0%
50.0%
60.0%
70.0%
80.0%
90.0%
Taxes/Fees for Rail Special District Fees Taxes/Fees for Buses New Lanes with Tolls Taxes/Fees for Roads
1 & 2 3 4 & 5
Average of All Participants
26.0% 25.2%
44.0%38.4% 40.0%
18.3%24.6% 23.5% 23.3% 25.5%
55.7%50.2%
32.5%38.3%
34.5%
0.0%
10.0%
20.0%
30.0%
40.0%
50.0%
60.0%
70.0%
80.0%
90.0%
Taxes/Fees for Rail Special District Fees Taxes/Fees for Buses New Lanes with Tolls Taxes/Fees for Roads
1 & 2 3 4 & 5
Average of All Participants

2045 Tri-County Transportation Plan – MetroQuest Survey Results
48
Taxes/Fees to Fund Rail
The Taxes/Fees to Fund Rail element would seek to raise local taxes and/or fees to build a regional
rail system. At this juncture no specific fiscal mechanism is identified (e.g., retail sales tax, property
tax increment, development impact fees), so support of this funding element can be interpreted as
support for rail infrastructure improvements and willingness to raise new funding to this end (rather
than relying on existing funds or revenue streams). Figure 60 shows ratings that this funding element
received in the survey.
Taxes/Fees to Fund Rail Raise local taxes and/or fees to build a regional
rail system.
Figure 60. Taxes/Fees to Fund Rail (Ratings)
The majority of survey respondents responded positively to this funding strategy. In total, of the
6,518 participants who rated this element, 59% rated it 4 or 5 stars. Pinellas County responded most
positively (62% rating 4 or 5 stars) and Pasco County responded least positively (56% rating 4 or 5
stars). Figure 61 shows the average rating was 3.61, with Pasco County having a slight less favorable
view of this element at 3.49.
Figure 61. Taxes/Fees to Fund Rail (Average Ratings by County)
26.0%
18.3%
55.7%
21.1%
16.9%
62.0%
22.2%
16.5%
61.3%
24.1%
16.5%
59.4%
0.0% 10.0% 20.0% 30.0% 40.0% 50.0% 60.0% 70.0% 80.0% 90.0%
1 & 2
3
4 & 5
All Participants Hillsborough Pinellas Pasco

2045 Tri-County Transportation Plan – MetroQuest Survey Results
49
Special District Fees
The Special District Fees element would implement local fees or taxes to fund community
improvements in designated areas. At this juncture no specific fiscal mechanism is identified (e.g., tax
increment financing, benefit assessment district, development impact fees), so support of this
funding element can be interpreted as support for revitalizing priority communities (perhaps due to
a history of disinvestment or catalytic importance) and willingness to raise new funding to this end.
Figure 62 shows ratings that this funding element received in the survey.
Special District Fees
Developers and/or local property owners pay
fees/taxes for community improvements in designated areas.
Figure 62. Special District Fees (Ratings)
The survey participants responded positively to this to this funding strategy. In total, 6,451
participants rated this element, with 53% rating it 4 or 5 stars. Hillsborough County responded most
favorably (55% rating 4 or 5 stars) and Pasco County responded slightly less positively (50% rating 4
or 5 stars). Figure 63 shows the average rating was 3.47, with little variation between counties.
Figure 63. Special District Fees (Average Ratings by County)
25.2%
24.6%
50.2%
22.7%
23.2%
54.0%
22.4%
22.5%
55.1%
24.1%
23.2%
52.7%
0.0% 10.0% 20.0% 30.0% 40.0% 50.0% 60.0% 70.0% 80.0% 90.0%
1 & 2
3
4 & 5
All Participants Hillsborough Pinellas Pasco

2045 Tri-County Transportation Plan – MetroQuest Survey Results
50
Taxes/Fees to Fund Buses
The Taxes/Fees to Fund Buses element would seek to raise local taxes and/or fees to improve
regional and local bus service. At this juncture no specific fiscal mechanism is identified (e.g., retail
sales tax, property tax increment, development impact fees), so support of this funding element can
be interpreted as support for bus service improvements and willingness to raise new funding to this
end (rather than relying on existing funds or revenue streams). Figure 64 shows the ratings that this
funding element received in the survey.
Taxes/Fees to Fund
Buses Raise local taxes and/or
fees to improve local and regional bus service.
Figure 64. Taxes/Fees to Fund Buses (Ratings)
The survey participants responded slightly negatively to this to this funding strategy. In total, 6,471
participants rated this element, with approximately 42% rating it 1 or 2 stars. Pasco County
responded most negatively to this (44% rating 1 or 2 stars) and Hillsborough County responded least
negatively (41% rating 1 or 2 stars). Figure 65 shows the average rating was 2.84, with little variation
between counties.
Figure 65. Taxes/Fees to Fund Buses (Average Ratings by County)
44.0%
23.5%
32.5%
40.0%
25.3%
34.7%
41.2%
24.2%
34.7%
42.3%
23.9%
33.8%
0.0% 10.0% 20.0% 30.0% 40.0% 50.0% 60.0% 70.0% 80.0% 90.0%
1 & 2
3
4 & 5
All Participants Hillsborough Pinellas Pasco

2045 Tri-County Transportation Plan – MetroQuest Survey Results
51
New Lanes with Tolls
New Lanes with Tolls would build new express lanes with variable tolls to manage traffic flow. While
there has been discussion of new lanes with tolls on some area roadways, the overall concept for this
funding element can be interpreted as support for expanded roadway capacity funded at least in
part by toll revenues. Variable (or dynamically priced) tolls allow for more control over roadway
demand, and thus can result in more reliable express lane travel times and higher toll revenues to
fund these improvements. Figure 66 shows the ratings that this funding element received in the
survey.
New Lanes with Tolls
Build new express lanes with variable tolls to manage traffic flow.
Figure 66. New Lanes with Tolls (Ratings)
The survey participants responded negatively to this to this funding strategy. In total, 7,134
participants rated this element, with approximately 45% rating it 1 or 2 stars. Hillsborough County
responded most negatively (46% rating 1 or 2 stars) and Pasco County was evenly divided on this
issue (38% 4 or 5 stars and 38% 1 or 2 stars). Figure 67 shows the average rating was 2.76, with Pasco
County coming in slightly higher in support of this element at 2.95.
Figure 67. New Lanes with Tolls (Average Ratings by County)
38.4%
23.3%
38.3%
45.1%
22.8%
32.1%
45.9%
21.3%
32.8%
44.7%
22.1%
33.2%
0.0% 10.0% 20.0% 30.0% 40.0% 50.0% 60.0% 70.0% 80.0% 90.0%
1 & 2
3
4 & 5
All Participants Hillsborough Pinellas Pasco

2045 Tri-County Transportation Plan – MetroQuest Survey Results
52
Taxes/Fees to Fund Roads
The Taxes/Fees to Fund Roads element would seek to raise local taxes and/or fees to build more
roads. At this juncture, no specific fiscal mechanism is identified (e.g., retail sales tax, property tax
increment, development impact fees), so support of this funding element can be interpreted as
support for more roadway capacity and willingness to raise new funding to this end (rather than
relying on existing funds or revenue streams). Figure 68 shows the ratings that this funding element
received in the survey.
Taxes/Fees to Fund
Roads Raise local taxes and/or
fees to build more roadway projects.
Figure 68. Taxes/Fees to Fund Roads (Ratings)
The largest share of survey respondents responded negatively to this funding strategy. In total, 6,517
participants rated this element, with approximately 44% rating it negatively. Pinellas County
responded most negatively to this (43% 1 or 2 stars) and Pasco County responded least negatively
(40% rating 1 or 2 stars). Figure 69 shows the average rating was 2.76, for all survey participants.
Pasco County respondents had a slightly higher approval of this element at 2.86.
Figure 69. Taxes/Fees to Fund Roads (Average Ratings by County)
40.0%
25.5%
34.5%
42.8%
28.5%
28.7%
42.5%
26.2%
31.3%
43.7%
26.0%
30.2%
0.0% 10.0% 20.0% 30.0% 40.0% 50.0% 60.0% 70.0% 80.0% 90.0%
1 & 2
3
4 & 5
All Participants Hillsborough Pinellas Pasco

2045 Tri-County Transportation Plan – MetroQuest Survey Results
53
Chapter 7 – Conclusion
It’s TIME Tampa Bay involved extensive coordination and outreach between the Hillsborough,
Pinellas and Pasco County MPOs. The survey reached over 18,000 visitors and included 9,575
survey participants – a new MetroQuest record for the United States! This large dataset contains
a wealth of information that will be used to inform the development of a hybrid scenario that will
guide the remaining LRTP development efforts.
Survey Highlights
Beginning with the priorities, it was clear that the primary focus of the survey responses were on
addressing traffic congestion, and supporting alternatives to driving. Both of these priorities were
identified by 74% to 75% of all survey respondents – the highest of all priorities. A second tier of
priorities, protecting open/green space and shorter commutes, were identified by 62% to 63% of
survey respondents. The remaining priorities were identified 50% or lower.
The response to exaggerated scenarios questions highlighted a clear desire among survey
participants for new mobility options that would provide an alternative to driving. The preference for
a statewide rail and regional rail system dominated the survey responses, and appeared also in the
high ratings for rail transit and rail funding in the Elements section. Projects or funding mechanisms
to expand the roadway network tended to receive comparatively lower levels of support, even when
they included advanced technology to improve efficiency.
From a growth and development standpoint, generally speaking, respondents did not want to
continue to expand outward, as shown in support for efficient use of land and more/better
downtowns, as well as negativity towards an expanded growth area. Investments that focus on
improving existing communities such as preserving neighborhoods and a walk & bike focus) also
performed well, highlighting a common desire to improve the communities that already exist rather
than expanding into open/rural areas on the fringe of Hillsborough and Pasco Counties.
Guidance for 2045 Plan “Hybrid Scenario”
The It’s TIME Tampa Bay exaggerated scenarios were intended to help create a hybrid 2045
scenario, based on the best and most well-supported pieces of the scenarios and elements. The
primary purpose of the Scenario planning process was to help:
• Visualize long-term implications of today’s decisions
• Explore “what-ifs” about things we control, and things we don’t
• Build consensus with quantitative feedback to determine what long-range outcomes are the
most widely accepted
Figure 70 conceptually shows how the scenarios and elements were pulled together to help identify
which components would ultimately become part of a hybrid scenario. This hybrid scenario will help
inform future year LRTP multimodal projects and supportive growth policies and funding strategies.

2045 Tri-County Transportation Plan – MetroQuest Survey Results
54
Figure 70. Building a Hybrid Scenario
Key themes from this outreach effort—comprising issues related to land use and different
transportation modes—are summarized below.
Land Use
In the Hybrid Scenario, the MPOs and other transportation agencies will coordinate with local
governments to support the creation of comprehensive plans that are compatible with the priorities
identified within the Tri-County Transportation Plan. These priorities include:
Reinvesting in neighborhoods
In recent years there has been a resurgence of many of our urban core areas as evidenced by
redevelopment and denser development in some neighborhoods. This reinvestment means we can
make more efficient use of existing infrastructure, encourage newer affordable housing and stimulate
more neighborhoods to improve. On-going upgrades to infrastructure and improving services in
these areas can help sustain these revitalization efforts which will lead to more connected and
inviting communities. Reinvestment can take many forms: improved sidewalks and cycle tracks, green
infrastructure implementation for both stormwater and aesthetic benefits, grant funding to finance
renovation of buildings in disrepair, installation of comfortable bus shelters, etc.
Strengthening downtowns and creating more downtown-like places
Downtowns are key areas for investment, thanks to the efficiencies that come with higher activity
levels and shorter distances between people and businesses. Such development patterns are also key
for an effective and efficient transit network, which has been identified as one of the key priorities in
this outreach effort. Implementing policies conducive to higher density development at key nodes, as
well as supporting the construction of mixed-use buildings (including market rate and affordable
housing) via incentives, partnerships, or policies, will support this goal.
Minimizing outward growth
The complement of strengthening downtowns is reducing the amount of outward growth that
occurs. The area is expected to grow significantly—both in population and economic activity—in

2045 Tri-County Transportation Plan – MetroQuest Survey Results
55
coming years, and keeping that growth manageable and sustainable will be a key component of
ensuring that our communities are right-sized for our needs. Minimizing outward growth also helps
reduce the cost of providing necessary public services that come with outward expansion. This
outreach effort clearly demonstrates that of all transportation, growth and funding elements
considered that an expanded growth area was the lowest rated, and least desirable, of all possible
options.
Transportation
Within the sphere of transportation, identifying specific types of projects and investments—if not
individual projects—is an area where each MPO can provide clear guidance, building off of their own
analysis and expertise as well as public outreach efforts like this survey. The following highlights
transportation priorities that can help guide future planning efforts:
Rail
Based on the results of this survey, rail projects should be considered as part of on-going LRTP
efforts. This could include regional rail projects, like expanding the connection of Brightline from
Southeast Florida through Orlando to Tampa, or developing a rail network through inter-county
coordination and partnership. Streetcar service should also be considered in support of strengthened
downtowns or reinvestment in historic communities. No matter the form, it is important to integrate
such projects with planned connections to other complimentary transportation resources, such as
Bus Rapid Transit or express bus stations.
Funding is always a critical topic for rail projects due to their higher upfront capital costs compared
to bus projects. Nevertheless, tax funding for rail improvements gained significant support from
responses in this survey. Evaluating potential local funding mechanisms such as tax increment
financing, benefit assessment districts, rideshare fees, ad valorem vehicle taxes, sales tax, etc., to
support a potential rail or other fixed guideway transit project, should be considered as part of on-
going LRTP planning efforts.
Walking and Biking
Walking and biking improvements play an important role as part of an overall comprehensive
transportation system. Being able to provide an attractive and low-cost alternative to a solo car trip
can reduce congestion at the local level, which can translate to fewer traffic jams, shorter commutes,
and increased alternatives to driving—all priorities identified in this study. Most transit trips begin
and end with a walk or bike trip, so improved non-motorized connections can boost the potential
market for transit agencies to draw their riders from, as well as provide increased opportunities for
recreational travel and public health. In addition, better alternatives to driving is a progressive benefit
for our communities’ low-income or otherwise disadvantaged residents.
Road
Safety and reliability of the area roadways has been, and will continue to be, one of the top priorities
of the MPOs and other transportation agencies. Based on this survey, one of the most widely
supported targeted roadway improvements was the construction of new and expanded interchange
ramps. Being able to move between the expressways and local roadways smoothly and safely,

2045 Tri-County Transportation Plan – MetroQuest Survey Results
56
without the unpredictability of chokepoints at ramps limited in either capacity or quantity, should be
explored in on-going LRTP planning efforts.
The use of elevated toll roads is another roadway concept that received general support and should
also be considered in further planning efforts to potentially help reduce travel delay, reduce the need
for more right-of-way, enhance regional travel connections, and function as primary evacuation
routes during hurricanes or major storm events. The potential congestion management benefits of
this type of improvement could also potentially benefit traffic operations in the Downtown Tampa
interchange area, as well as along SR 54, with potential connections between these facilities via I-75
and I-4. However, it is worth noting there was clearly a negative feeling towards the concept of
“closing the loop” in Pinellas County, which included the use of an elevated toll road in the
McMullen/East Lake corridor.
Technology
While it did not garner the same level of enthusiasm as the future multimodal scenario, a scenario
illustrating a roadway network improved by the implementation of technological advances did elicit
the support of many survey respondents. These technology advances can be simple and
straightforward, such as smart technology that is used to coordinate traffic signal timings to move
traffic more effectively, enhance safety and reduce travel delay. Another example is the use of
dynamically priced toll lanes to enhance traffic flow and increase the predictability of travel times in
tolled lanes, while keeping some lanes free for less time-sensitive travelers.
Other technology advances might include the implementation of transit signal priority systems,
enabling buses operating in congestion to improve their on-time rates and thus become more
attractive to potential riders. Or perhaps the use of automated shuttles—a.k.a. microtransit—to ferry
people to and from transit stations; such shuttles are already being rolled out in small-scale pilot
projects as of 2018—something that was nearly unimaginable just a handful of years ago. The
implementation of automated buses is a technological advancement that would dramatically reduce
the operating costs of many transit agencies, though its initial roll-out seems more likely in BRT-style
routes with dedicated guideways rather than mixed traffic.
Regardless of the project, technology will continue to advance at a rapid pace and future
transportation and mobility applications will benefit from these advancements. Based on the
responses from this survey, the use of technology should be considered in on-going LRTP planning
efforts. At a minimum, it is important to continue the discussion of advanced technology as part of
an on-going process to educate the public about the potential transportation and mobility
benefits—ultimately with the goal of helping the public become more comfortable with technology
over time.


