2050 Japan and the Global Economy “Looking into the Future :the World Economy of the 21 st Century” Ⅷ Astana Economic Forum in 2015 Kazumasa IWATA Japan Center for Economic Research 22 May 2015
Transcript
2050 Japan and the Global Economy“Looking into the Future
:the World Economy of the 21st Century”
Ⅷ Astana Economic Forum in 2015Kazumasa IWATA
Japan Center for Economic Research22 May 2015
Outline
Ⅰ. 2050 Japan and the Global EconomyⅡ. World New LeadersⅢ. Global Trends in 2050 Ⅳ. Energy and Environment in 2050Ⅴ. Demographic Boom in 2050?
2
Ⅰ. 2050 Japan and the Global Economy
1. Japan Center for Economic Research(JCER) published the book on “the Engine of Japan’s Revival“ (2050 Japan and the Global Economy) in August 2014.
2. Under the circumstance of rapid demographic change after mid-1990s, Japan stagnated in the past two decades. To overcome the secular stagnation we proposed to stop the population decline. At the same time, we focused on the importance of economic, social and political institutions which may affect the total factor productivity among different countries.
3. We employed the institutions evaluation function to assess the impact of different degree of quality of various institutions among 64 countries.
3
4. As a base case, we assumed that every country will continue the same speed of institutional reform over the forecast period as was the case in the past ten years.5. In the case of Japan we provided threescenarios, namely “base case scenario” (close to zero average growth rate) , “Japan is back scenario”(1.4% average growth rate) and “fiscal bankruptcy scenario” (negative growth rate).
Ⅰ. 2050 Japan and the Global Economy
4
6. In “Japan is back scenario”, Japan will implement “best practice” of the world economy in institutional reforms. Per capita GNI will increase from 42 thousand dollars to 90 thousand dollars and will rank third in global economy.7. The difference between the “base case scenario” and “Japan is back scenario” arises from the open-up of economy, labor market flexibility, gender gap and easiness of start-up business.
Ⅰ. 2050 Japan and the Global Economy
5
Table1 Per Capita Gross National Income in 2050
(Note) Numbers in parentheses for Korea, China and India stand for rank.(Source) World Bank Statistics For the complete text, see http://www.jcer.or.jp/eng/research/policy.html, JCER “Long-term Forecast and Policy Proposal:Vision 2050 Maintain Position As a First-tier Nation”
Fig.1 Difference between “base case scenario” and “Japan is back (growth/reform) scenario”
(Source) JCER estimates. Actual results are calculated by including demand factors in productivity. Real values based on 2005 prices.For the complete text, see http://www.jcer.or.jp/eng/research/policy.html, JCER “Long-term Forecast and Policy Proposal:Vision 2050 Maintain Position As a First-tier Nation”
7
4
5
6
7
8
9
2000 2010 2020 2030 2040 2050
Composite Effects [6]
e) Flexible Labor [6]
d) Elderly's Labor Participation [4]
c) Female's Labor Participation [3]
b) Gender [11]
a) Open Markets [68]
Growth/Reform Scenario (100)
Base Scenario/Stagnation Scenario(0)
(Tr. US$, 2005 prices)
(year)
Effects on Real GNIBase --> Growth/Reform Scenario
1. In 2050 the United States will continue to achieve top institutional quality and maintain the largest economic size coupled with increasing population.2. China will fall in the “middle income trap”, if the institutional quality improvement will not allow China to catch up with those of advanced economies.3. In terms of real GDP(2005 dollar price), the economic size of Japan in the “base case scenario” will rank fifth after the US, EU,China and India in 2050.
8
Fig.2 Changes in the Global Economy 2010-2050
(Note) Real GNI, base year 2005 (converted at market rates). Circle sizes indicate size of relevant economy. (Source) For the complete text, see http://www.jcer.or.jp/eng/research/policy.html, JCER “Long-term Forecast and Policy Proposal:Vision 2050 Maintain Position As a First-tier Nation” 9
(Source) JCER estimates. Actual results are calculated by including demand factors in productivity. Real values based on 2005 prices.For the complete text, see http://www.jcer.or.jp/eng/research/policy.html, JCER “Long-term Forecast and Policy Proposal:Vision 2050 Maintain Position As a First-tier Nation”
Fig.4 Five Institutional Indicators to Determine Productivity Growth
(Note) Note: The mean for sixty-four countries covered in the forecast as of 2010 is set 50, and one standard deviation as 10. Outward expansion of the pentagon indicates better quality of institutions. (Source) For the complete text, see http://www.jcer.or.jp/eng/research/policy.html, JCER “Long-term Forecast and Policy Proposal:Vision 2050 Maintain Position As a First-tier Nation”
1. We are living in a “second machine age” where the human brain work is replaced by machine.2. The artificial intelligence is likely to exceed the capacity of human brain in the mid-2040s (“singularity point”), due to the development of neuroscience and the “deep learning” by machine. 3. Today, new developments of the ICT began to transform the business strategy towards the vertical and horizontal integration of industry through the construction of network arising from new combination of “internet of things”, “Big Data”, “open innovation(=“mobilize global brain”)” and “3D printers”. This facilitates the large scale customization of goods and services.
12
Ⅲ. Global Trends in 2050
4. Firms are enhanced to construct “global value chains” to maximize the value creation under the circumstance of mega-FTA formation.- The World Economic Forum once provided the estimate of
effects arising from removing all the barriers against construction of global value chains. The world benefit will amount to 2.6trillion dollars, as compared with that of removal of all the tariff barriers (0.4trillion dollars).
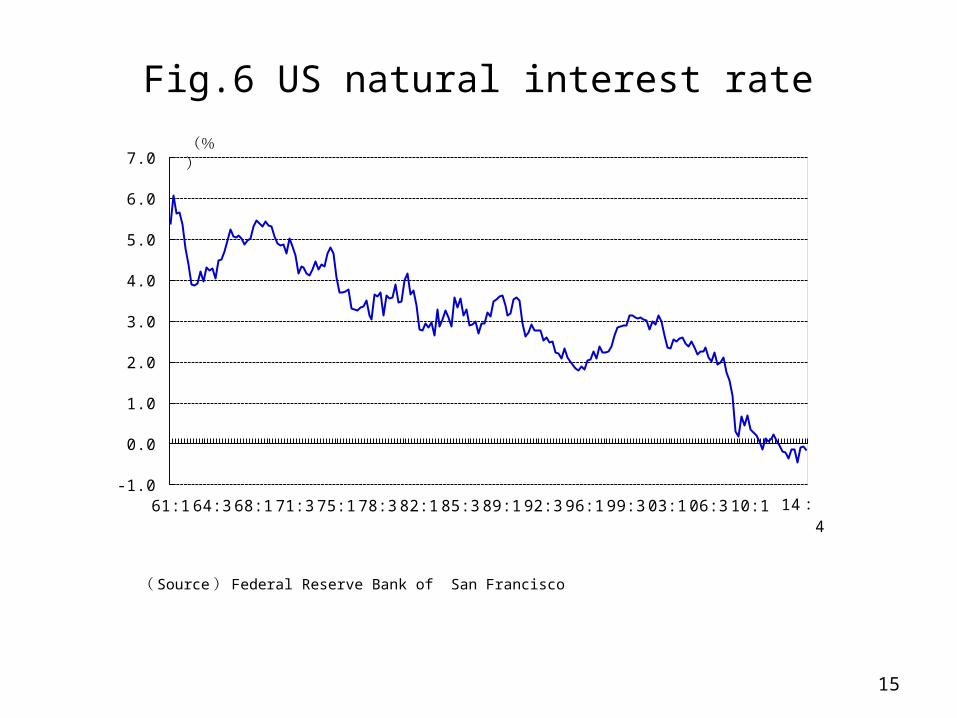
5. Main risk is the secular stagnation among advanced economies after the global financial crisis.- Not only Japan, but also the US faces low real long-term interest rates and the negative equilibrium interest rate.
1. After Fukushima nuclear accident, Japan has been forced to rely heavily on imported LNG and Coal as a source of energy. Given the increasing risk of global warming, it is a challenging task for Japan to achieve economic growth, while cutting the greenhouse gas emission by 80% in 2050.
2. In April 2015 the Japanese Government announced the new energy path and the target of the greenhouse gas emission reduction in 2030.- Energy saving will be 17% in 2030,compared with the “business as usual” case.- Nuclear power will account for 20-22% in electricity supply, while the renewable
energy will provide 22-24%. The remaining part (54-58%) will be provided by fossil fuels.
- The new target to cut the greenhouse gas emission is set at 26% in 2030(base year 2013).
16
Ⅳ. Energy and Environment in 2050
3. In September 2014 the sustainable development projects by the United Nations predict that from the technological viewpoint, it is feasible for Japan to achieve 80% cut of emission in 2050, given the 15% electricity supply by nuclear power and the active use of CCS(Carbon Capture and Storage).4. In February 2015 JCER published the new energy path and the target of the green house gas emission reduction.- Energy saving will amount to 20% in 2030 and 40% in 2050, due to
the higher energy prices and industrial structure changes from manufacturing-based economy to the economy centering on information related services.
- Renewable energy will take on 60% of electricity supply in 2050.
17
Ⅳ. Energy and Environment in 2050
- Nuclear power will provide 15% of electricity supply in 2030. Yet, the costs of electricity generation by nuclear power will be almost equivalent to those of renewable energy, if we include the insurance fees of severe accidents and increasing subsidy to local communities within 30km circle of the nuclear power plant.
- The remaining electricity supply of 25% will come from fossil fuels including coal. Yet, under the assumption of the availability of the CCS after 2025 will make possible zero emission of power generation after 2040.
18
Ⅳ. Energy and Environment in 2050
5. It is possible to attain 30% cut of CO2 emission in 2030 (base year 2005) and more than 60% cut in 2050.- It is needed to reinforce the effort to attain
the target 80% cut of emission in 2050 by introducing the trade in emission rights and raising the environment tax rate significantly.
19
Fig.7 Even under Economic Growth, a 63% CO2 Reduction Relative to FY 2005 is Achievable
(58% Reduction Relative to FY 1990)
0
20
40
60
80
100
120
140
160
180
1990 2000 10 20 30 40 50
(FY 2005=100)
(Fiscal Year)
Abandoning nuclear energy by 2050
Retaining nuclear energy of 15% in power supplies
CCS
Real GDP
Estimation
(Note) In the case of utilization of CCS with a 63% reduction, the emission reduction is the same whether nuclear power is phased out or maintained because the CO2 from thermal power stations generated due to the difference between the two will all be absorbed through CCS. In the case of the phase-out of nuclear power, nuclear power stations are gradually decommissioned from fiscal 2030, reaching zero in fiscal 2050. In the case of maintenance of nuclear power, nuclear power’s contribution to total electricity is maintained at 15% from fiscal 2030. (Sources) Database of the Institute of Energy Economics, Japan, and the system of national accounts (SNA). Real GDP figures are growth scenario forecasts in JCER Long-Term World Forecast-Three Scenarios.For the complete text, see http://www.jcer.or.jp/eng/research/policy.html , JCER “Vision 2050: The Future of Energy and Environmental Choice - Fiscal 2014 Report -”
(Source) IEA “World Energy Outlook 2014” For the complete text, see http://www.jcer.or.jp/eng/research/policy.html , JCER “Vision 2050: The Future of Energy and Environmental Choice - Fiscal 2014 Report -”
Fig.9 Ratios of Renewable Energy Sources (Including Existing Hydroelectric Power) to
Total Electricity Generation
(Source) Survey of Electric Power Statistics For the complete text, see http://www.jcer.or.jp/eng/research/policy.html , JCER “Vision 2050: The Future of Energy and Environmental Choice - Fiscal 2014 Report -”
0
20
40
60
80
2012 20 30 40 50
(%)
(FY)
Photo Voltaic Wind Geothermal Biomass Small and medium-scale hydropower Hydropower Total
Fig.10 Trends in Premiums and Grants for the Location of Electric Power Plants according to
Electricity Generation
(Source) For the complete text, see http://www.jcer.or.jp/eng/research/policy.html , JCER “Vision 2050: The Future of Energy and Environmental Choice - Fiscal 2014 Report -”
Fig.11 Breakdown of CO2 Reduction by Energy Conservation, Nuclear Power and CCS
(Source) For the complete text, see http://www.jcer.or.jp/eng/research/policy.html , JCER “Vision 2050: The Future of Energy and Environmental Choice - Fiscal 2014 Report -”(Note) The reason renewable energy sources appear to increase CO2 in fiscal 2020 and fiscal 2030 is because we included the increase in CO2 resulting from the use of thermal power to make up for the suspension of operations of nuclear power plants. We included this increase in renewable energy sources for the sake of convenience to verify when the increase associated with the use of thermal power in place of nuclear power can be covered by renewable energy sources.
-80
-60
-40
-20
0
20
FY 2020 30 40 50
(%) CCS Nuclear power Renewable Energy saving Total
(Source) For the complete text, see http://www.jcer.or.jp/eng/research/policy.html , JCER “Vision 2050: The Future of Energy and Environmental Choice - Fiscal 2014 Report -”
Reduction rate of CO2(%)Abandoning nuclearenergy by 2050
Retaining nuclear energy of15% of total power supplies
Fig.12 CO2 Prices and User Cost Accompanying Emissions
(Source) For the complete text, see http://www.jcer.or.jp/eng/research/policy.html , JCER “Vision 2050: The Future of Energy and Environmental Choice - Fiscal 2014 Report -”
1. The World Population Projects by the United Nations predicts that world population growth rate will decelerate from 1% in 2001-2010 to 0.2% in 2041-2050.- The rising living standards in developing economies tend to diminish the fertility rate with rising opportunity costs of childbearing and the increase in education costs for households, while the OECD economies will register close to zero population growth rate in 2014-2050. 2. However, the relative size of population among different countries will drastically change in 2050.
27
Ⅴ. Demographic Boom in 2050?
- Not only advanced economies such as Japan, Germany, Portugal and Italy, but also China and the Asian NIEs will face the problem of population decline and ageing after 2020. - India will become the largest population country,
exceeding the size of Chinese population after 2020. - African area will maintain relatively high population
growth rate in 2041-2050(1.4%). Notably, Kenya, Uganda and Tanzania will continue to enjoy population bonus.