305
CENTER FOR DRUG EVALUATION AND RESEARCH APPLICATION NUMBER: 206829Orig1s000 CLINICAL PHARMACOLOGY AND BIOPHARMACEUTICS REVIEW(S)
| Date post: | 02-Mar-2019 |
| Category: |
Documents |
| Upload: | dinhnguyet |
| View: | 219 times |
| Download: | 0 times |

CENTER FOR DRUG EVALUATION AND RESEARCH
APPLICATION NUMBER:
206829Orig1s000
CLINICAL PHARMACOLOGY AND BIOPHARMACEUTICS REVIEW(S)

1
OFFICE OF CLINICAL PHARMACOLOGY REVIEW
NDA: 206-829 Submission Date(s): 04/21/14
Drug Ceftolozane/Tazobactam
Trade Name ZERBAXA
OCP Reviewer Ryan P. Owen, Ph.D.
OCP Team Leader Kimberly Bergman, Pharm.D.
PM Team Leader Jeffry Florian, Ph.D.
OCP Division DCP4
OND division DAIP
Sponsor Cubist Pharmaceuticals, Inc.
Relevant IND(s) IND 104,490;
Submission Type; Code Original New Drug Application (Type 1 New Molecular Entity and Type 4 New Combination)
Formulation; Strength(s) Powder for reconstitution in single dose vials containing 1.147 g ceftolozane sulfate (equivalent to 1 g ceftolozane) and 0.537 g tazobactam sodium (equivalent to 0.5 g of tazobactam).
Indication For the treatment of complicated intra-abdominal infections (cIAI) and complicated urinary tract infections (cUTI) including pyelonephritiscaused by susceptible organisms
Dosage and Administration 1.5 g every 8 hours by IV infusion administered over 1 hour for patients ≥ 18 years of age with creatinine clearance (CrCL) > 50 mL/min
For patients with moderate renal impairment: 750 mg IV every 8 hours infused over 1 hour.
For patients with severe renal impairment: 375 mg IV every 8 hours infused over 1 hour.
For patients with End Stage Renal Disease (ESRD) on hemodialysis (HD): A single loading dose of 750 mg followed by a 150 mg maintenance dose administered IV every 8 hours for the remainder of the treatment period.
Table of Contents1 Executive Summary.................................................................................................................................... 2
1.1 Recommendations .............................................................................................................................. 21.2 Phase 4 Commitments ........................................................................................................................ 31.3 Summary of Important Clinical Pharmacology and Biopharmaceutics Findings ................................ 3
2 Question-Based Review ............................................................................................................................. 82.1 General Attributes of the Drug ........................................................................................................... 8
Reference ID: 3648317
(b) (4)

2
2.2 General Clinical Pharmacology ........................................................................................................... 92.3 Intrinsic Factors.................................................................................................................................412.4 Extrinsic Factors ................................................................................................................................ 492.5 General Biopharmaceutics................................................................................................................ 582.6 Analytical Section.............................................................................................................................. 58
3 Detailed Labeling Recommendations ......................................................................................................644 Appendices............................................................................................................................................... 87
4.1 In vitro study reports ........................................................................................................................ 874.2 Individual Clinical Pharmacology Study Reviews ............................................................................1844.3 Pharmacometric Review ................................................................................................................. 250
1 ExecutiveSummary
Ceftolozane (also referred to as CXA-101) is a cephalosporin-class antibacterial drug with activity against several Gram-negative organisms, including Enterobacteriaceae and Pseudomonas aeruginosa. Tazobactam is a beta-lactamase inhibitor that is a component of the currently-marketed product piperacillin-tazobactam (Zosyn). Ceftolozane was tazobactam was added to the combination to improve coverage against extended-spectrum beta-lactamase (ESBL)-producing organisms.
The Sponsor’s original development plan was to conduct 2 Phase 3 non-inferiority trials for complicated urinary tract infections (cUTI) and 2 Phase 3 trials for complicated intra-abdominal infections (cIAI). However, following regulatory feedback, the Sponsor decided to pool their existing Phase 3 trials for each indication, and submit one Phase 3 trial for each indication. The intent of this strategy was for the efficacy in the cUTI trial to act as supportive evidence for the efficacy of the cIAI trial and vice versa. Both Phase 3 trials were non-inferiority trials and met their primary endpoints; however, the efficacy of ceftolozane/tazobactam appeared more robust in the cUTI indication.
The current NDA submission contains the following clinical studies:
9 Phase 1 studies [single ascending dose (SAD)/multiple ascending dose (MAD), Thorough QT (TQT), Renal Impairment, epithelial lining fluid (ELF) penetration, drug interaction]
2 Phase 2 studies (1 each in cIAI and cUTI)
3 Phase 3 studies (1 in cIAI, 1 in cUTI, 1 in nosocomial pneumonia [discontinued after one patient])
1.1 Recommendations
The Office of Clinical Pharmacology, Division of Clinical Pharmacology 4 has reviewed NDA 206-829, and found it to be acceptable from a clinical pharmacology perspective.
The reviewer concurs with the proposed dosing regimen for cUTI and cIAI (1000 mg ceftolozane and 500 mg tazobactam given q8h). However, the borderline efficacy data from cIAI suggests that patients may benefit from a higher dose of ceftolozane/tazobactam; this observation will influence the choice of
Reference ID: 3648317
(b) (4)

3
susceptibility breakpoints. The Reviewer concurs with the Sponsor’s proposed dose adjustments for moderate and severe renal impairment and for ESRD patients on HD. No dose adjustment is required for any other intrinsic or extrinsic factor.
The Reviewer does not agree with the Sponsor’s proposed susceptibility breakpoints for Enterobacteriaceae and P. aeruginosa The Reviewer’s analysis supports breakpoints of 2 µg/mL for Enterobacteriaceae and 4 µg/mL for P. aeruginosa.
1.2Phase4Commitments
No Phase 4 commitments are recommended.
1.3SummaryofImportantClinicalPharmacologyandBiopharmaceuticsFindings
General PK Characteristics:The pharmacokinetics of ceftolozane are linear and dose-proportional over the range of doses studied (250 mg to 3 g). Table 1.3-1 shows the ceftolozane plasma and urine pharmacokinetics following single ascending doses (with or without tazobactam).
Table 1.3-1: Ceftolozane (TOL) Plasma and Urine Pharmacokinetic Parameters after a Single Intravenous 1-hour Infusion of Ceftolozane Alone and with Tazobactam (TAZ)
Reference ID: 3648317
(b) (4) (b) (4)

4
Following multiple dosing (q8h), very little accumulation of ceftolozane and tazobactam was observed. Tazobactam M-1 (an inactive metabolite) had a slightly longer half-life than ceftolozane (~3.5-4.5 hours) and showed some accumulation.
There were no clinically meaningful differences in ceftolozane or tazobactam Cmax or AUC on Day 1 as compared to Day 10, indicating that steady-state is achieved early. The calculated CL and Vss of ceftolozane and tazobactam did not change significantly across dosing groups.
DistributionThe calculated Vss of ceftolozane across studies ranged from 12.0 L to 17.1 L, and the calculated Vss of tazobactam ranged from 14.3 L to 18.6 L across studies. The volume of distribution values are larger than blood volumes and suggest that both ceftolozane and tazobactam distribute into the extracellular space.
The protein binding of ceftolozane is approximately 21%. The protein binding of tazobactam was previously known (~30% in humans).
MetabolismCeftolozane is not metabolized. Less than 20% of tazobactam is metabolized to the inactive metabolite tazobactam M-1.
ExcretionCeftolozane is entirely excreted unchanged in the urine. Tazobactam is primarily (~80%) excreted unchanged in the urine. Tazobactam M-1 is also renally excreted.
Intrinsic Factors:Dose adjustments are required for moderate renal impairment (500 mg ceftolozane/250 mg tazobactam), severe renal impairment (250 mg ceftolozane/125 mg tazobactam), and ESRD patients on HD (500 mg ceftolozane/250 mg tazobactam loading dose followed by maintenance doses of 100 mg ceftolozane/50 mg tazobactam). Dose adjustments for geriatric patients should be based on renal function. All dosing regimens are given q8h and infused over 1 hour.
No dose adjustment is required for any other intrinsic factor, although a trend for decreased exposure with increasing body weight was observed (see Table 1.3-2).
Table 1.3-2: Predicted AUCss and Ctrough based on post-hoc parameter estimates from the Sponsor’s population PK analysis for ceftolozane based on the Sponsor’s proposed dosing for a subset ofcovariates
Ceftolozane
Covariate Category
AUCss (µg.h/mL) Ctrough (µg/mL)
n Median [IQR] Median [IQR]
Body weight (kg)
≥43 - <66 92 193 [165; 218] 3.4 [1.8; 5.4]
≥66 - <74 96 170 [153; 203] 3.4 [1.8; 4.9]
≥74 - <85 93 161 [148; 193] 3.6 [2.1; 6.9]
Reference ID: 3648317

5
≥85 95 150 [114; 194] 3.6 [2.2; 7.4]
Age (years)
≥18 - <27 84 168 [154; 200] 2.9 [1.3; 3.7]
≥27 - <39 96 160 [136; 175] 2.3 [1.2; 3.6]
≥39 - <60 96 170 [144; 215] 3.6 [2.5; 5.4]
≥60 - 89 100 190 [149; 234] 8.1 [4.6; 11.2]
BMI (kg/m2)
≥17.2 - <23.6 94 179 [152; 217] 3.7 [2.0; 5.5]
≥23.6 - <25.7 94 168 [151; 206] 3.2 [1.7; 4.7]
≥25.7 - < 28.4 94 163 [146; 193] 3.2 [2.2; 5.7]
≥28.4 94 167 [132; 216] 4.1 [2.0; 8.3]
Infection Status
HVs 226 172 [156; 213] 3.2 [1.6; 4.7]
cUTI 73 174 [148; 217] 5.8 [3.6; 10.3]
cIAI 77 119 [98; 177] 2.9 [1.9; 6.0]
Creatinine Clearance (mL/min)
Normal (≥90 mL/min)
255 162 [143; 188] 2.9 [1.5; 4.0]
Mild (≥60 and <90 mL/min)
79 214 [171; 256] 6.2 [4.3; 10.2]
Moderate (≥30 and <60
mL/min)36 152 [105; 195] 6.4 [3.5; 11.6]
Severe (≥15 and <30 mL/min)
6 256 [225; 270] 23.6 [19.8; 25.8]
Extrinsic Factors:In human liver microsomes treated with ceftolozane at 1000 µg/mL for 3 days, a decrease in mRNA levels of CYP1A2 and CYP3A4 was noted in some donors. Tazobactam also showed a potential to directly inhibit CYP3A4 activity at high concentrations (IC50 >500 µg/mL). Separate in vitro studies have shown that tazobactam has a potential to act as a substrate and an inhibitor for OAT1 and OAT3. In order to further investigate these potential interactions, a clinical cocktail drug-drug interaction study was conducted (CXA-DDI-12-10) involving probe substrates for OAT1/3 (furosemide), CYP1A2 (caffeine), and CYP3A4 (midazolam). No clinically relevant changes in the pharmacokinetics of the probe drugs were observed.
Population PK Analysis:The Sponsor’s population pharmacokinetic model was found to be acceptable. The final population PK model for ceftolozane is shown in Table 1.3-3 and the final population PK model for tazobactam is shown in Table 1.3-4. Covariates for the ceftolozane model include CLCR on CL, body weight on Vc, and infection on CL and Vc. Covariates for the tazobactam model include CLCR on CL and infection on Vc.
Reference ID: 3648317

6
Table 1.3-3: Population PK Parameters of Ceftolozane: Refined Final Model
Population PharmacokineticParameters Population Estimate RSE%
CL (L/h)
No Infection 5.11 (2.15) * (CLCR / 109) 0.715 (6.14)
33.0 (3.94)With Infection
x exp(0.190
(24.6) * UTI +
0.195 (22.5) * IAI)
Vc (L)
No Infection 11.4 (2.70) * (WT/74)(1-IAI)
39.8 (4.50)With Infection
x exp(0.191 (30.1) * UTI +
0.464 (12.3) * IAI)
CL2 (L/h) 1.19 (2.24) Fixed at 0
Vp (L) 2.88 (fixed) Fixed at 0
Error Model
Proportional Error (%) 16.8 (11.8) -
Additive Error (µg/mL) 0.0524 (8.07) -Adapted from sponsor’s population PK results table for ceftolozane: BSV: Between-subject variability; cIAI: Complicated intrabdominal infection; CL: Clearance; CL2: Peripheral clearance; CLCR: Creatinine clearance (mL/min); cUTI: Completed urinary tract infection; RSE: Relative standard error; Vc: Central volume of distribution; Vp: Peripheral volume of distribution; WT: Body weight. UTI=1 for cUTI patients; IAI for cIAI patients
Table 1.3-4: Population PK Parameters of Tazobactam: Final Model
Breakpoint AnalysesThe Sponsor proposed breakpoints of for Enterobacteriaceae and P. aeruginosa. The proposed PK/PD targets of T>MIC (stasis) and T>MIC (1-log10 kill) for ceftolozane were derived from the murine neutropenic thigh infection model. However, the traditional PK/PD target for cephalosporins is 50% T>MIC, corresponding with an approximate 1 log kill. The Reviewer selected a target of 40% T>MIC for breakpoint analyses which would correspond to a nearly 2-log10 kill based on the Sponsor’s analysis. The Sponsor also conducted a co-modeling PK/PD analysis which incorporated both tazobactam (utilizing a critical threshold concentration) and ceftolozane targets.
Reference ID: 3648317
(b) (4)
(b) (4) (b) (4)

7
Enterobacteriaceae and P. aeruginosa MIC distributions and clinical outcome by MIC were also considered in setting breakpoints. Table 1.3-4 summarizes the evidence supporting the Enterobacteriaceae breakpoint and Table 1.3-5 summarizes the evidence supporting the P. aeruginosabreakpoint.Table 1.3-4: Ceftolozane (TOL)/tazobactam breakpoint summary for Enterobacteriaceae
Evidence Cutoff or Breakpoint Supported
Epidemiological Cutoff 2 µg/mL
Nonclinical PK/PD – TOL only 40% T>MIC target 4 µg/mL
Nonclinical PK/PD – co-model 40%T>MIC target 1 µg/mL
Clinical Cutoff 4 µg/mL
Overall Proposed Breakpoint 2 µg/mL
A final breakpoint of 2 µg/mL for Enterobacteriaceae was selected for ceftolozane/tazobactam based on the available evidence. An overall breakpoint of 4 µg/mL was also considered. However, given the borderline efficacy observed in the Phase 3 cIAI trial and the lower breakpoint supported by the co-modeling PK/PD analysis with ceftolozane and tazobactam 1 µg/mL, a breakpoint of 2 µg/mL was considered more appropriate.
Table 1.3-5: Ceftolozane (TOL)/tazobactam breakpoint summary for P. aeruginosa
Evidence Cutoff or Breakpoint Supported
Epidemiological Cutoff 4 µg/mL
Nonclinical PK/PD – TOL only 40% T>MIC target 4 µg/mL
Clinical Cutoff 1 µg/mL – very low data at higher MIC
Overall Proposed Breakpoint 4 µg/mL
A final breakpoint of 4 µg/mL for P. aeruginosa was selected for ceftolozane/tazobactam based on the evidence presented above. The epidemiological cutoff value (ECV) and the nonclinical PK/PD analysis with the 40% T>MIC target both suggested 4 µg/mL. The clinical data was very limited at MICs of higher than 1 µg/mL; however, the Review Team was willing to extrapolate based on evidence from other sources.
Cardiovascular effectsA thorough QT study was conducted in healthy adults with a therapeutic dose (1000/500 mg) and a supra-therapeutic dose (3000/1500 mg) ceftolozane/tazobactam. No significant QTc prolongation effects of ceftolozane/tazobactam were detected. For a complete assessment of the thorough QT study findings, refer to the Interdisciplinary Review Team’s review.
Reference ID: 3648317
8
2Question-BasedReview
2.1GeneralAttributesoftheDrug
2.1.1.Whatarethehighlightsofthechemistryandphysical-chemicalpropertiesofthedrugsubstanceandtheformulationofthedrugproductastheyrelatetoclinicalpharmacologyandbiopharmaceuticsreview?
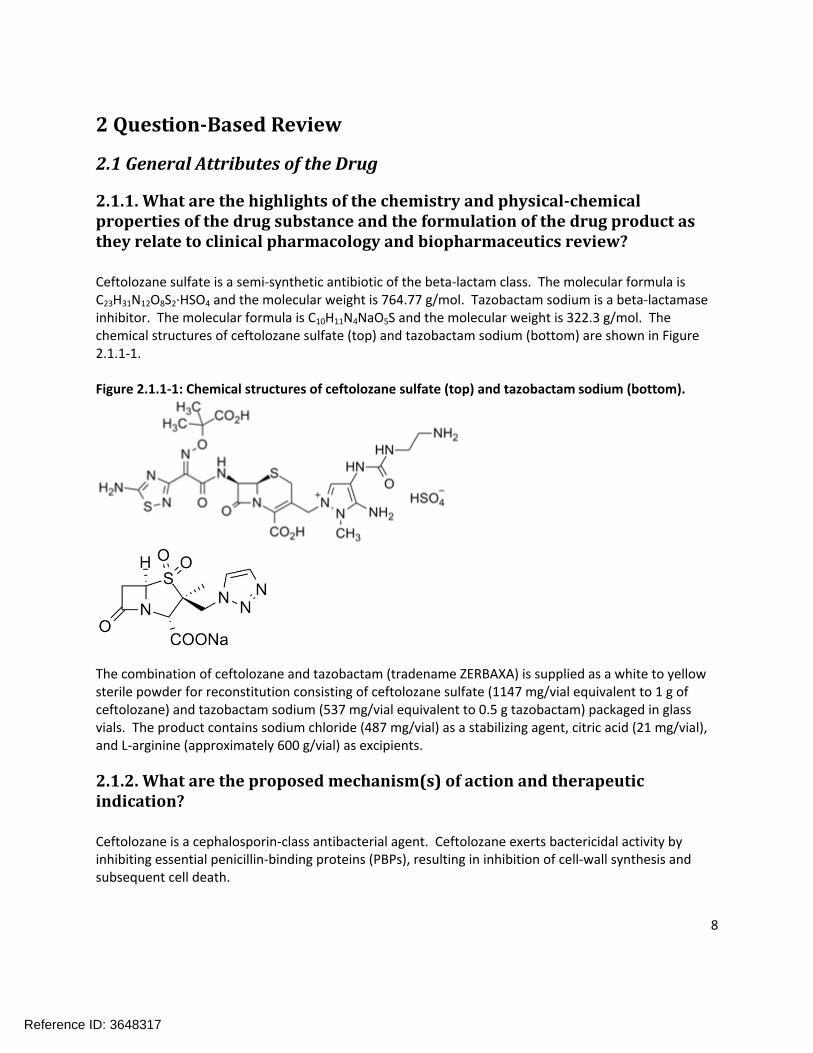
Ceftolozane sulfate is a semi-synthetic antibiotic of the beta-lactam class. The molecular formula is C23H31N12O8S2·HSO4 and the molecular weight is 764.77 g/mol. Tazobactam sodium is a beta-lactamase inhibitor. The molecular formula is C10H11N4NaO5S and the molecular weight is 322.3 g/mol. The chemical structures of ceftolozane sulfate (top) and tazobactam sodium (bottom) are shown in Figure 2.1.1-1.
Figure 2.1.1-1: Chemical structures of ceftolozane sulfate (top) and tazobactam sodium (bottom).
The combination of ceftolozane and tazobactam (tradename ZERBAXA) is supplied as a white to yellow sterile powder for reconstitution consisting of ceftolozane sulfate (1147 mg/vial equivalent to 1 g of ceftolozane) and tazobactam sodium (537 mg/vial equivalent to 0.5 g tazobactam) packaged in glass vials. The product contains sodium chloride (487 mg/vial) as a stabilizing agent, citric acid (21 mg/vial), and L-arginine (approximately 600 g/vial) as excipients.
2.1.2.Whataretheproposedmechanism(s)ofactionandtherapeuticindication?
Ceftolozane is a cephalosporin-class antibacterial agent. Ceftolozane exerts bactericidal activity by inhibiting essential penicillin-binding proteins (PBPs), resulting in inhibition of cell-wall synthesis and subsequent cell death.
Reference ID: 3648317

9
Tazobactam is an irreversible inhibitor of β-lactamases and can bind covalently to chromosomal and plasmid-mediated bacterial β-lactamases.
The proposed indications are complicated intra-abdominal infections (cIAI) and complicated urinary tract infections (cUTI), including pyelonephritis caused by susceptible organisms.
2.1.3.Whataretheproposeddosage(s)androute(s)ofadministration?
For adult subjects with normal renal function or mild renal impairment, the proposed dosing regimen for both cIAI and cUTI is 1500 mg ZERBAXA (1000 mg of ceftolozane and 500 mg tazobactam) administered over a 1 hour intravenous infusion and given every 8 hours. For adult patients with moderate or severe renal impairment, or end stage renal disease (ESRD), dose adjustment of ZERBAXA is recommended as illustrated in Table 2.1.3-1.
Table 2.1.3-1: Dosage of ZERBAXA in patients with renal impairment
Estimated CrCL (mL/min) from Cockcroft-Gault Recommended Dosage Regimen for ZERBAXA (to be administered via a 1 hour IV infusion)
30 to 50 750 mg intravenously every 8 hours
15 to 29 375 mg intravenously every 8 hours
ESRD on hemodialysis (HD) A single loading dose of 750 mg followed by a 150 mg maintenance dose administered every 8 hours
for the remainder of the treatment period
The safe and effective use of ZERBAXA has not yet been established in pediatric patients; therefore, dosing recommendations in pediatric patients are not yet available.
The recommended duration of therapy is 7 days for cUTI and 4-14 days for cIAI.
2.2GeneralClinicalPharmacology
2.2.1.Whatarethedesignfeaturesoftheclinicalpharmacologyandclinicalstudiesusedtosupportdosingorclaims?
Ceftolozane was . Tazobactam was later added to improve coverage against extended-spectrum beta lactamase (ESBL) producing organisms. Table 2.2.1-1 summarizes all of the clinical studies that have been conducted in support of NDA 206-829, including studies conducted with ceftolozane alone.
Table 2.2.1-1: Clinical studies submitted in support of NDA 206-829
Study Title Phase Study Type Comments
CXA-101-01 1 SAD/MAD Ceftolozane alone
CXA-201-01 1 SAD/MADSource of PK data in
12.3
Reference ID: 3648317
(b) (4)

10
CXA-ELF-10-03 1ELF tissue
penetration
CXA-MD-11-07 1 MAD
CXA-101-02 1 Renal ImpairmentNormal or Mild Renal
Impairment –Ceftolozane alone
CXA-201-02 1 Renal ImpairmentMild or Moderate Renal
Impairment
CXA-REN-11-01 1 Renal ImpairmentSevere renal
impairment and ESRD
CXA-DDI-12-10 1Cocktail Drug
Interaction
CYP1A2, CYP3A4, OAT1/OAT3 probe
substrates
CXA-QT-10-02 1 Thorough QT4500 mg dose used as
supra-therapeutic dose
CXA-101-03 2Phase 2 proof of
concept
Ceftazidime as comparator. Conducted
without tazobactam.
CXA-IAI-10-01 2Phase 2 proof of concept in cIAI
Meropenem as comparator
CXA-cUTI-10-04 3Pivotal Safety and
Efficacy - cUTILevofloxacin as
comparator
CXA-cIAI-10-08 3Pivotal Safety and
Efficacy - cIAIMeropenem as
comparator
CXA-NP-11-08 3 Safety and Efficacy
Discontinued after enrolling one patient.
Program will be redesigned.
Individual study reviews can be found in Appendix 4.2 for studies in bold above.
The Sponsor conducted 2 Phase 2 trials, 1 each in cUTI (CXA-101-03) and cIAI (CXA-IAI-10-01). Only 1dosing regimen was used in each indication. The dosing regimen for CXA-101-03 was 1000 mg ceftolozane q8h (this trial was conducted prior to the addition of tazobactam). The dosing regimen for CXA-IAI-10-01 was 1500 mg ZERBAXA q8h. The efficacy results from these trials are shown in Table 2.2.1-2 (for CXA-101-03) and Table 2.2.1-3 (for CXA-IAI-10-01), respectively. The decision to proceed to Phase 3 trials with the 1500 mg ZERBAXA q8h dosing regimen was supported by efficacy results from the Phase 2 trials, in vitro susceptibility data, animal models of efficacy, and probability of target attainment simulations.
Reference ID: 3648317
(b) (4)

11
Table 2.2.1-2: Microbiological Response at the Test of Cure Visit [modified microbiological intent-to-treat (mMITT) and microbiologically evaluable (ME) Populations] for CXA-101-03
Table 2.2.1-3: Clinical Response at the Test of Cure Visit (mMITT and ME Populations) for CXA-IAI-10-01
2.2.2.Whatisthebasisforselectingtheresponseendpoints(i.e.clinicalorsurrogateendpoints)orbiomarkers(collectivelycalledpharmacodynamics(PD))andhowaretheymeasuredinclinicalpharmacologyandclinicalstudies?
The Sponsor’s original development plan was to conduct 2 Phase 3 trials in cUTI and 2 Phase 3 trials in cIAI. However, upon receiving feedback from the Agency that efficacy in one indication could serve as supporting evidence for efficacy in the second indication, the Sponsor opted to pool their ongoing Phase 3 studies in the same indication. The net result of this was 1 Phase 3 trial in cUTI and 1 Phase 3 trial in cIAI. The primary efficacy endpoints for cIAI and cUTI are shown in Table 2.2.2-1 and Table 2.2.2-2, respectively.
For cIAI, the primary efficacy endpoint was to demonstrate non-inferiority in the clinical response (cure, indeterminate or failure) in the microbiological intent-to-treat (MITT) population at the test of cure (TOC) visit 26 to 30 days after initiation of study drug. The key secondary efficacy objective was to demonstrate non-inferiority of ceftolozane/tazobactam versus meropenem based on the difference in clinical “Cure” (defined as complete resolution or significant improvement in signs and symptoms of the index infection, such that no additional antibacterial therapy or surgical drainage procedure was required for the index infection) rates at the TOC visit in the microbiologically evaluable (ME) population. Patients were classified as “indeterminate” if one of the following criteria were met: study data were not available for evaluation of efficacy for any reason, including death during the study period unrelated to the index infection, or extenuating circumstances that preclude classification as cure or
Reference ID: 3648317
12
failure (e.g., subject lost to follow-up). Patients were classified as “failure” if any of the following criteria were met:
Death related to IAI at any time point prior to TOC
Persisting or recurrent infection within the abdomen requiring additional intervention to cure the infection
Need for treatment with additional antibiotics for ongoing symptoms of IAI prior to the TOC
Postsurgical wound infection, defined as an open wound with signs of local infection, such as purulent exudate, erythema, or warmth that required additional antimicrobial therapy and/or non-routine wound care (such as incision and drainage or re-opening of the wound).
For cUTI, the primary efficacy endpoint was the composite microbiological and clinical cure rates at the TOC visit (cure, indeterminate or failure). “Cure” was defined as complete resolution of, marked improvement in (where clinical improvement was defined as a reduction in severity of all baseline signs and symptoms with worsening of none and with no requirement for additional antibiotic therapy after EOT), or return to pre-infection signs and symptoms and no use of additional or non-study antimicrobial therapy for the treatment of the current cUTI; “indeterminate” was defined as study data were not available for the evaluation of clinical outcome for any reason or the outcome assessment was confounded; “failure” was defined as persistence of 1 or more sign or symptom of infection or reappearance of or new signs and symptoms that requires additional or alternative antimicrobial therapy for the current cUTI or adverse event leading to study drug discontinuation and the subject required non-study antimicrobial therapy for the current cUTI. The primary analysis was based on the microbiological modified intent-to-treat (mMITT) and the key secondary analysis was based on the ME population. The statistical criteria required that the 95% CI exclude the pre-specified non-inferiority margin of 10%.
Reference ID: 3648317

13
Table 2.2.2-1: Summary and analysis for non-inferiority of clinical response at the test-of-cure visit (MITT and ME Populations) for the cIAI indication
Table 2.2.2-2: Primary and key secondary analyses: composite microbiological and clinical response rate at the TOC visit by analysis population for the cUTI indication
Ceftolozane/tazobactam met the pre-specified non-inferiority margin in both Phase 3 trials, although the combination appeared to perform better relative to the comparator in the cUTI indication, possibly
Reference ID: 3648317

14
due to the presence of quinolone resistant organisms, or to higher concentrations of ceftolozane in urine. There were no response endpoints evaluated in the clinical pharmacology studies.
2.2.3.Arethemoietiesintheplasma(orotherbiologicalfluid)appropriatelyidentifiedandmeasuredtoassesspharmacokineticparametersandexposure-responserelationships?
The pharmacokinetics of the following moieties were measured during the clinical pharmacology trials: ceftolozane, tazobactam, and tazobactam M-1 (the primary metabolite of tazobactam). All of these entities were appropriately measured in plasma, urine, or dialysate (or some combination thereof). Refer to section 2.6 for further bioanalytical information.
2.2.4.Exposure-response
2.2.4.1. What are the characteristics of the exposure-response relationship (dose-response, concentration-response) for efficacy?
No pharmacokinetic samples were collected in Phase 3 studies, so formal exposure-response analyses for the registrational trials could not be conducted. However, a dose-response for efficacy from the Phase 2 cIAI study was conducted and is shown below. Additionally, there are outstanding questions related to exposure-response: specifically how the dose selection and ratio for ceftolozane tazobactam was conducted and whether the Sponsor’s proposed susceptibility test interpretive criteria (breakpoints) are acceptable. These questions are also addressed below.
Exposure Response for EfficacyStudy CXA-IAI-10-01 is the only study submitted in support of NDA 206-829 to have all of the following elements: patient outcome data, pharmacokinetic sampling, and the presence of both ceftolozane and tazobactam. Therefore, the exposure-response for efficacy analysis is restricted to this trial. Study CXA-101-03 also had patient outcomes and pharmacokinetic data, but it was conducted with only ceftolozane and the ceftolozane efficacy in cUTI appears more robust than the efficacy against cIAI. A quartile analysis was conducted by the Sponsor (see Table 2.2.4.1-1) based on the exposure data and outcomes from cIAI patients receiving 1500 mg ZERBAXA q8h in Study CXA-IAI-10-01. The exposure-response relationship for efficacy is relatively flat across all quartiles based on either AUC or Cmax. The n in each quartile is small and therefore the results should be interpreted in that context. It should be noted that for both AUC and Cmax, the percentage of patients with Cure as the outcome in the 4th
quartile was numerically higher than the other quartiles. This is an absolute difference of one more patient being classified as Cure vs. the 3rd quartile in each case. However, these results do not rule out the possibility that a higher dose of ceftolozane/tazobactam could be beneficial for cIAI patients.
Reference ID: 3648317

15
Table 2.2.4.1-1: Quartile Exposure-Response Analysis with Pharmacokinetic Exposure Parameters versus Clinical Response in Study CXA-IAI-10-01
PK Parameter/Outcome
1st
Quartile(n=13)
2nd
Quartile(n=13)
3rd
Quartile(n=13)
4th
Quartile(n=12)
Missing PK
Mean (SD) AUC0-tau(µg*h/mL)
76.2 (18.9) 103.8 (7.6) 138.3 (12.5)
253.3 (47.8)
Cure n (%) 11 (84.6) 11 (84.6) 11 (84.6) 11 (91.7) 7 (100)
Failure/Indeterminate n (%)
2 (15.4) 2 (15.4) 2 (15.4) 1 (8.3) 0 (0)
1st
Quartile(n=16)
2nd
Quartile(n=13)
3rd
Quartile(n=15)
4th
Quartile(n=14)
Mean (SD)Cmax
(µg/mL)
31 (19.5) 39.6 (3.5) 48.6 (8.3) 118.1 (119.2)
Cure n (%) 14 (87.5) 11 (84.6) 13 (86.7) 13 (92.9)
Failure/Indeterminate n (%)
2 (12.5) 2 (15.4) 2 (13.3) 1 (7.1)
Dose Selection
. Ceftolozane alone demonstrated activity against many Gram-negative pathogens (e.g. Enterobacteriaceae and P. aeruginosa) and had a favorable safety profile in CXA-101-01 (the first in human SAD/MAD PK study). Consistent with other cephalosporins, the %T>MIC was found to be the PK/PD parameter most closely associated with efficacy (refer to the Breakpoints discussion below for more information and a discussion of PK/PD targets).
After tazobactam was added to the combination to improve coverage against ESBL-producing organisms, the Sponsor evaluated multiple ratios of ceftolozane:tazobactam to determine the final ratio. Table 2.2.4.1-2 shows the activity of ceftolozane alone and three different ceftolozane:tazobactam ratios in ESBL producing strains in the mouse neutropenic thigh model.
Table 2.2.4.1-2: Activity of the CXA-101/Tazobactam Combination versus ESBL-Producing Strains in a Neutropenic Thigh Infection Model
ESBL strainMIC (μg/mL)
CXA-101CXA-101:Tazobactam Ratios
2:1 4:1 8:1E. coli 6042 16-32 2 4 8
E. cloacae 81-1291A 8-16 2 2 4K. pneumoniae 81-
1269A32-64 2 4 8
The 2:1 ratio of ceftolozane:tazobactam resulted in the lowest MICs across the three ESBL-expressing strains tested. Additionally, the 2:1 ratio resulted in comparable or better log CFU reductions compared to ceftolozane alone and the 4:1 and 8:1 ratios for all three ESBL-expressing strains. Based on these
Reference ID: 3648317
(b) (4)
16
data, the 2:1 ratio of ceftolozane to tazobactam was selected for further development. Note that ratios lower than 2:1 (e.g. 1:1 were not explored).
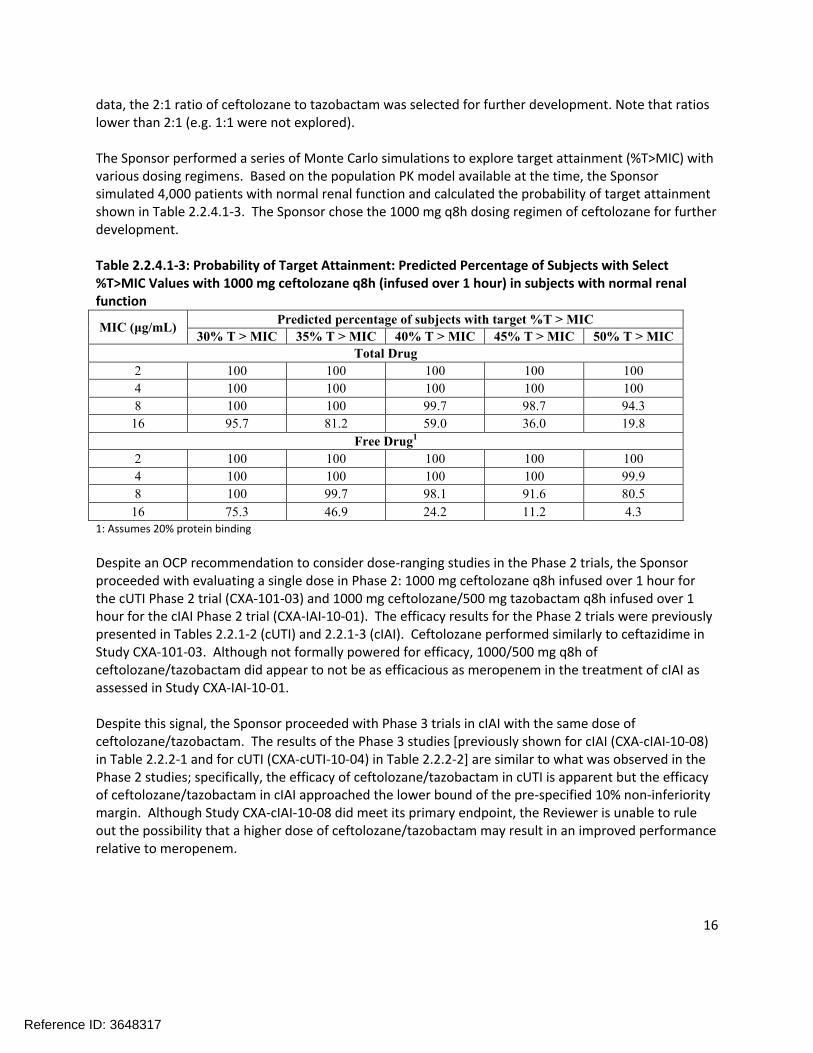
The Sponsor performed a series of Monte Carlo simulations to explore target attainment (%T>MIC) with various dosing regimens. Based on the population PK model available at the time, the Sponsor simulated 4,000 patients with normal renal function and calculated the probability of target attainment shown in Table 2.2.4.1-3. The Sponsor chose the 1000 mg q8h dosing regimen of ceftolozane for further development.
Table 2.2.4.1-3: Probability of Target Attainment: Predicted Percentage of Subjects with Select %T>MIC Values with 1000 mg ceftolozane q8h (infused over 1 hour) in subjects with normal renal function
MIC (μg/mL)Predicted percentage of subjects with target %T > MIC
30% T > MIC 35% T > MIC 40% T > MIC 45% T > MIC 50% T > MIC
Total Drug
2 100 100 100 100 100
4 100 100 100 100 100
8 100 100 99.7 98.7 94.3
16 95.7 81.2 59.0 36.0 19.8
Free Drug1
2 100 100 100 100 100
4 100 100 100 100 99.9
8 100 99.7 98.1 91.6 80.5
16 75.3 46.9 24.2 11.2 4.31: Assumes 20% protein binding
Despite an OCP recommendation to consider dose-ranging studies in the Phase 2 trials, the Sponsor proceeded with evaluating a single dose in Phase 2: 1000 mg ceftolozane q8h infused over 1 hour for the cUTI Phase 2 trial (CXA-101-03) and 1000 mg ceftolozane/500 mg tazobactam q8h infused over 1 hour for the cIAI Phase 2 trial (CXA-IAI-10-01). The efficacy results for the Phase 2 trials were previouslypresented in Tables 2.2.1-2 (cUTI) and 2.2.1-3 (cIAI). Ceftolozane performed similarly to ceftazidime in Study CXA-101-03. Although not formally powered for efficacy, 1000/500 mg q8h of ceftolozane/tazobactam did appear to not be as efficacious as meropenem in the treatment of cIAI as assessed in Study CXA-IAI-10-01.
Despite this signal, the Sponsor proceeded with Phase 3 trials in cIAI with the same dose of ceftolozane/tazobactam. The results of the Phase 3 studies [previously shown for cIAI (CXA-cIAI-10-08) in Table 2.2.2-1 and for cUTI (CXA-cUTI-10-04) in Table 2.2.2-2] are similar to what was observed in the Phase 2 studies; specifically, the efficacy of ceftolozane/tazobactam in cUTI is apparent but the efficacy of ceftolozane/tazobactam in cIAI approached the lower bound of the pre-specified 10% non-inferiority margin. Although Study CXA-cIAI-10-08 did meet its primary endpoint, the Reviewer is unable to rule out the possibility that a higher dose of ceftolozane/tazobactam may result in an improved performance relative to meropenem.
Reference ID: 3648317

17
Breakpoint DeterminationIntroductionThe proposed breakpoints are informed from data from three sources: the MIC distribution of various pathogens from surveillance data, non-clinical PK/PD information, and an assessment of clinical outcome versus pathogen MIC. Each of these sources is discussed in more detail below. The Reviewer is unable to supplement this information with patient exposure-response analyses as no pharmacokinetic information was collected in the Phase 3 trials. The Sponsor has submitted a full PK/PD analysis for both Enterobacteriaceae and P. aeruginosa which are reviewed more extensively in Appendix 4.3. From a clinical pharmacology standpoint, sufficient evidence has been submitted to propose susceptibility breakpoints for Enterobacteriaceae and P. aeruginosa. The Sponsor’s proposed breakpoints are shown in Table 2.2.4.1-4.
Table 2.2.4.1-4: Sponsor-proposed Susceptibility Test Interpretive Criteria for Enterobacteriaceae and P. aeruginosa
Pathogen Broth Dilution MIC (µg/mL)
S I R
Enterobacteriaceae
P. aeruginosa
MIC DistributionsFigure 2.2.4.1-1 shows the MIC distribution for Enterobacteriaceae and Figure 2.2.4.1-2 shows the MIC distribution for P. aeruginosa (both clinical and surveillance isolates are shown).
Figure 2.2.4.1-1: Percentage of Isolates at Each MIC of Ceftolozane/Tazobactam against Enterobacteriaceae
Reference ID: 3648317
(b) (4)

18
The Sponsor reports 2702 Enterobacteriaceae isolates from the clinical trial program, which is significantly greater than the number of patients that received ceftolozane/tazobactam. However, a breakdown of which trials and patients those 2702 Enterobacteriaceae isolates originated from is not available in the NDA. It is likely that the 2702 total isolates of Enterobacteriaceae include ceftolozane/tazobactam MICs derived from pathogens isolated from patients who were receiving the control antibacterials (levofloxacin or meropenem). Additionally, some patients had polymicrobial infections where more than one Enterobacteriaceae organism could be isolated. Together, these factors likely explain the apparent discrepancy between number of Enterobacteriaceae isolates with a ceftolozane/tazobactam MIC and number of patients treated with ceftolozane/tazobactam.
Figure 2.2.4.1-2: Percentage of Isolates at Each MIC of Ceftolozane/Tazobactam against P. aeruginosa
Based on the MIC distributions and conversations with the Microbiology Reviewer (Dr. Kerian Grande), the epidemiological cutoff values (ECV) for Enterobacteriaceae and P. aeruginosa are 2 µg/mL and 4 µg/mL, respectively.
Nonclinical PK/PD cutoffDetermination of the PK/PD parameter most closely associated with efficacyDose fractionation experiments were carried out in the mouse neutropenic thigh model using strains of E. coli, K. pneumoniae, and P. aeruginosa. The relationship between Cmax/MIC, AUC/MIC, and %T>MIC and the number of bacteria in the thigh at the end of 24 hours was evaluated (see Figure 2.2.4.1-3 for the results with E. coli). The %T>MIC was identified as the PK/PD parameter that most closely correlates with efficacy for ceftolozane because it exhibited the highest R2 value in Figure 2.2.4.1-3 and based on previous knowledge for cephalosporin-class antibacterial drugs.
Reference ID: 3648317

19
Figure 2.2.4.1-3: Relationship of Different PK/PD Indices on the Antimicrobial Activity of Ceftolozane Against E. coli ATCC 25922 in the Thighs of Neutropenic Mice
Determination of the Magnitude of the %T>MIC Necessary for EfficacyThe magnitude of the %T>MIC associated with stasis and 1- and 2-log10 kills was evaluated using total drug concentration (since protein binding of ceftolozane was low in mice). Beta-lactamase negative Enterobacteriaceae and P. aeruginosa strains were evaluated (see Table 2.2.4.1-5). The median %T>MIC associated with stasis, 1-log10 kill, and 2-log10 kill were and 42.8% T>MIC, respectively.
Reference ID: 3648317
(b) (4) (b) (4)

20
Table 2.2.4.1-4: Percent T>MIC Required for Bacteriostasis and Bactericidal Activity against Enterobacteriaceae and Pseudomonas aeruginosa
It should be noted that the Sponsor uses the T>MIC (stasis) and T>MIC (1-log10 kill) targets in the probability of target attainment analyses. Given the severity of the indications under consideration for approval (particularly cIAI), a cidal target is considered desirable. However, the Sponsor’s 1-log10 target of T>MIC is also substantially lower than the traditional cidal cephalosporin target of 50% time above MIC.
Due to this difference, the Reviewer considered a PK/PD target of 40% T>MIC for the purposes of setting breakpoints. This target corresponds to a nearly 2-log10 kill target based on the data shown in Table 2.2.4.1-4. Due to the borderline efficacy observed in the Phase 3 cIAI trial, a more conservative breakpoint is desirable to prevent the treatment of patients who would not respond well to ceftolozane/tazobactam. The selection of the 40% T>MIC target strikes a balance, allowing for the possibility that ceftolozane is more potent than other cephalosporins while at the same time being more conservative than the initial analysis.
Two recent studies were conducted to determine the PK/PD parameter and magnitude that were necessary for the efficacy of tazobactam. The first study identified %T>threshold concentration as the PK/PD parameter of interest for tazobactam. The objectives of the second study were to 1) use different strains of Enterobacteriaceae to characterize the %T>threshold of tazobactam needed for efficacy in conjunction with ceftolozane (see Figure 2.2.4.1-4 left panel) and 2) to develop a translational relationship for the purpose of co-modeling ceftolozane and tazobactam (see Figure 2.2.4.1-4 right panel). The proposed translational relationship was to determine the %T>threshold concentration by taking one-half of the ceftolozane/tazobactam MIC for a particular strain. Based on these results, a
Reference ID: 3648317
(b) (4) (b) (4)
(b) (4)

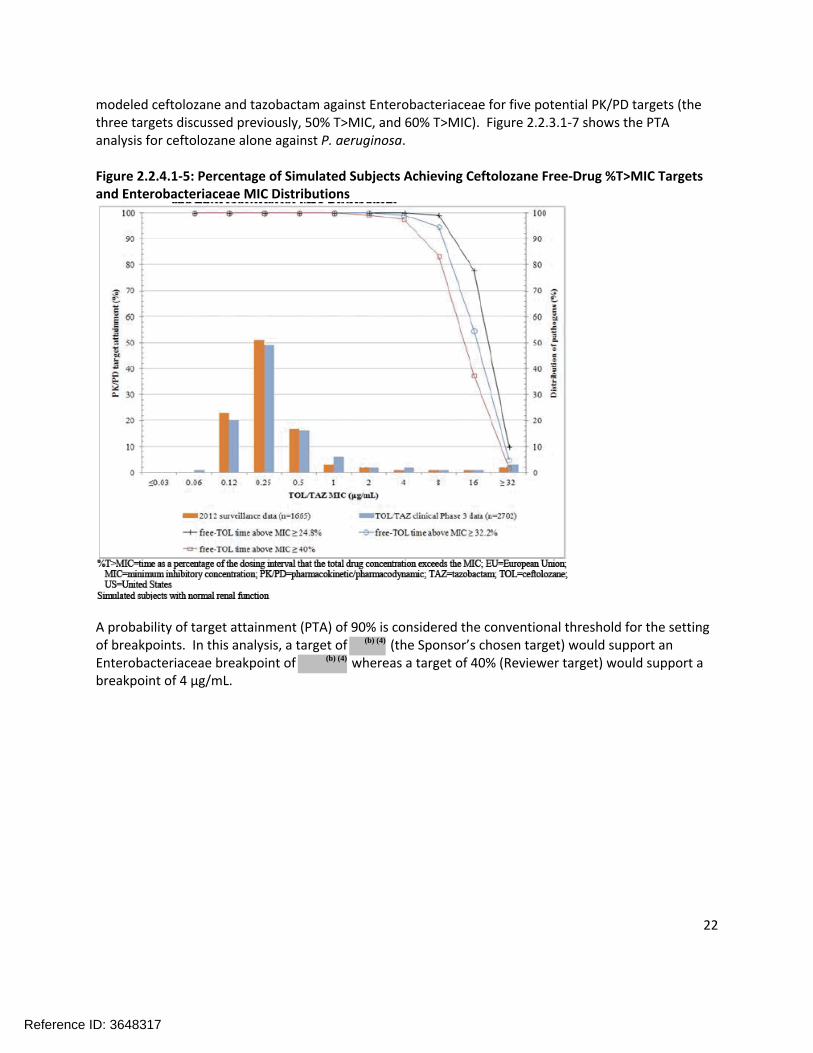
22
modeled ceftolozane and tazobactam against Enterobacteriaceae for five potential PK/PD targets (the three targets discussed previously, 50% T>MIC, and 60% T>MIC). Figure 2.2.3.1-7 shows the PTA analysis for ceftolozane alone against P. aeruginosa.
Figure 2.2.4.1-5: Percentage of Simulated Subjects Achieving Ceftolozane Free-Drug %T>MIC Targets and Enterobacteriaceae MIC Distributions
A probability of target attainment (PTA) of 90% is considered the conventional threshold for the setting of breakpoints. In this analysis, a target of (the Sponsor’s chosen target) would support an Enterobacteriaceae breakpoint of whereas a target of 40% (Reviewer target) would support a breakpoint of 4 µg/mL.
Reference ID: 3648317
(b) (4)
(b) (4)

23
Figure 2.2.4.1-6: Percentage of Simulated Subjects Achieving Free-Drug %T>MIC Targets for Ceftolozane and Tazobactam Overlaid on Enterobacteriaceae (ESBL+ and ESBL-) Histograms from the Phase 3 Clinical Trials
Figure 2.2.4.1-6 is an attempt to co-model ceftolozane and tazobactam (refer to Appendix 4.3 for more detail). In brief, a gated approach is used in which simulated patients are tested for achieving 1) the tazobactam target and (if not achieved) 2) the ceftolozane target. Applying the conventional PTA threshold of 90% to this analysis would support a breakpoint of up to 1 µg/mL; this analysis is therefore more conservative than the ceftolozane alone analysis.
Reference ID: 3648317

24
Figure 2.2.4.1-7: Percentage of Simulated Subjects Achieving Free-Drug %T>MIC Targets and P. aeruginosa MIC Distributions
In the analysis shown in Figure 2.2.4.1-7, a target of (the Sponsor’s chosen target) would support a P. aeruginosa breakpoint of whereas a target of 40% (Reviewer target) would support a breakpoint of 4 µg/mL.
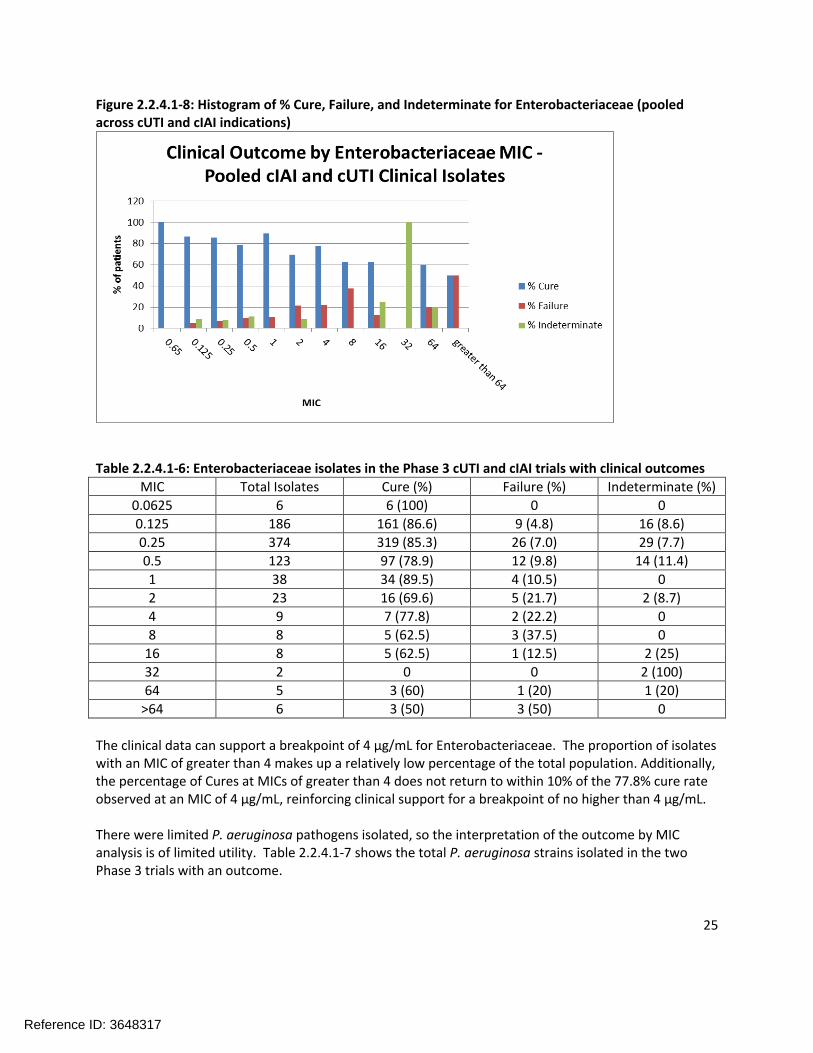
Clinical Outcome by MICFigure 2.2.4.1-8 is a histogram of the percentage of Cures, Failures, and Indeterminates for the Enterobacteriaceae (pooled results across the cIAI and cUTI trials). Table 2.2.4.1-6 shows the same data in tabular form with the number of isolates in each category specified.
Reference ID: 3648317
(b) (4)
(b) (4)
25
Figure 2.2.4.1-8: Histogram of % Cure, Failure, and Indeterminate for Enterobacteriaceae (pooled across cUTI and cIAI indications)
Table 2.2.4.1-6: Enterobacteriaceae isolates in the Phase 3 cUTI and cIAI trials with clinical outcomes
MIC Total Isolates Cure (%) Failure (%) Indeterminate (%)
0.0625 6 6 (100) 0 0
0.125 186 161 (86.6) 9 (4.8) 16 (8.6)
0.25 374 319 (85.3) 26 (7.0) 29 (7.7)
0.5 123 97 (78.9) 12 (9.8) 14 (11.4)
1 38 34 (89.5) 4 (10.5) 0
2 23 16 (69.6) 5 (21.7) 2 (8.7)
4 9 7 (77.8) 2 (22.2) 0
8 8 5 (62.5) 3 (37.5) 0
16 8 5 (62.5) 1 (12.5) 2 (25)
32 2 0 0 2 (100)
64 5 3 (60) 1 (20) 1 (20)
>64 6 3 (50) 3 (50) 0
The clinical data can support a breakpoint of 4 µg/mL for Enterobacteriaceae. The proportion of isolates with an MIC of greater than 4 makes up a relatively low percentage of the total population. Additionally, the percentage of Cures at MICs of greater than 4 does not return to within 10% of the 77.8% cure rate observed at an MIC of 4 µg/mL, reinforcing clinical support for a breakpoint of no higher than 4 µg/mL.
There were limited P. aeruginosa pathogens isolated, so the interpretation of the outcome by MIC analysis is of limited utility. Table 2.2.4.1-7 shows the total P. aeruginosa strains isolated in the two Phase 3 trials with an outcome.
Reference ID: 3648317

26
Table 2.2.4.1-7: P. aeruginosa isolates in the Phase 3 cUTI and cIAI trials with clinical outcome
MIC Total Isolates Cure (%) Failure (%) Indeterminate (%)
0.03125 1 1 (100) 0 0
0.0625 0 0 0 0
0.125 0 0 0 0
0.25 1 0 0 1 (100)
0.5 23 16 (69.6) 2 (8.7) 5 (21.7)
1 23 17 (73.9) 2 (8.7) 4 (17.4)
2 1 1 (100) 0 0
4 3 1 (33.3) 2 (66.7) 0
8 1 0 1 (100) 0
16 1 1 (100) 0 0
32 0 0 0 0
64 0 0 0 0
>64 2 2 (100) 0 0
Activity in ESBL-producing organismsIn the Phase 3 cIAI trial, 58 patients had ESBL-positive pathogens in the MITT population. Clinical cure rates were 25/29 (86.2%) for ceftolozane/tazobactam and 24/29 (82.8%) for meropenem. For the Phase 3 cUTI trial, 104 patients had ESBL-positive pathogens in the mMITT population. Clinical cure rates were 47/53 (88.7%) for ceftolozane/tazobactam and 37/51 (72.5%) for levofloxacin.
Summary of Breakpoint Data and Reviewer ConclusionsTable 2.2.4.1-8 summarizes the sources of evidence for determining the susceptibility breakpoint of ceftolozane tazobactam for Enterobacteriaceae and Table 2.2.4.1-9 summarizes the same data for P. aeruginosa.
Table 2.2.4.1-8: Ceftolozane/tazobactam breakpoint summary for Enterobacteriaceae
Evidence Cutoff or Breakpoint Supported
Epidemiological Cutoff 2 µg/mL
Nonclinical PK/PD – cef only 40% T>MIC target 4 µg/mL
Nonclinical PK/PD – co-model 40%T>MIC target 1 µg/mL
Clinical Cutoff 4 µg/mL
Overall Proposed Breakpoint 2 µg/mL
A final breakpoint of 2 µg/mL for Enterobacteriaceae was selected for ceftolozane/tazobactam based on the evidence presented above. An overall breakpoint of 4 µg/mL was also considered. However, given the borderline efficacy observed in the Phase 3 cIAI trial and the lower breakpoint supported by the co-modeling PK/PD analysis with ceftolozane and tazobactam 1 µg/mL, a breakpoint of 2 µg/mL was considered more appropriate.
Reference ID: 3648317

27
Table 2.2.4.1-9: Ceftolozane/tazobactam breakpoint summary for P. aeruginosa
Evidence Cutoff or Breakpoint Supported
Epidemiological Cutoff 4 µg/mL
Nonclinical PK/PD – cef only 40% T>MIC target 4 µg/mL
Clinical Cutoff 1 µg/mL – very low data at higher MIC
Overall Proposed Breakpoint 4 µg/mL
A final breakpoint of 4 µg/mL for P. aeruginosa was selected for ceftolozane/tazobactam based on the evidence presented above. The ECV and the Nonclinical PK/PD analysis with the 40% T>MIC target both suggested 4 µg/mL. The clinical data was very limited at MICs of higher than 1 µg/mL; however, the Review Team was willing to extrapolate based on evidence from other sources.
2.2.4.2. What are the characteristics of the exposure-response relationships (dose-response, concentration-response) for safety?
No pharmacokinetic sampling was conducted in the Phase 3 trials, so the available exposure data werelimited to Phase 1 and 2 trials. No specific safety events of concern were identified in the Phase 2 trials or the Phase 1 thorough QTc trial with a supra-therapeutic dose of ZERBAXA (4.5 g). The Sponsor conducted an exposure-safety analysis to assess the possible relationship between exposure and elevations in aspartate aminotransferase, alanine aminotransferase, and alkaline phosphatase. However, no trend was observed and no further exposure safety analyses were conducted.
The AE profile of ceftolozane was consistent with other cephalosporins. The safety profile of tazobactam was largely known due to previous experience with the marketed product Zosyn (piperacillin/tazobactam).
2.2.4.3. Does this drug prolong the QT or QTc interval?
The response to this question was taken from the “Overall Summary of Findings” from the review of Dr. Huifang Chen of the QT interdisciplinary review team. Dr. Chen’s full review was submitted to DARRTS under NDA 206-829 on 10/1/14.
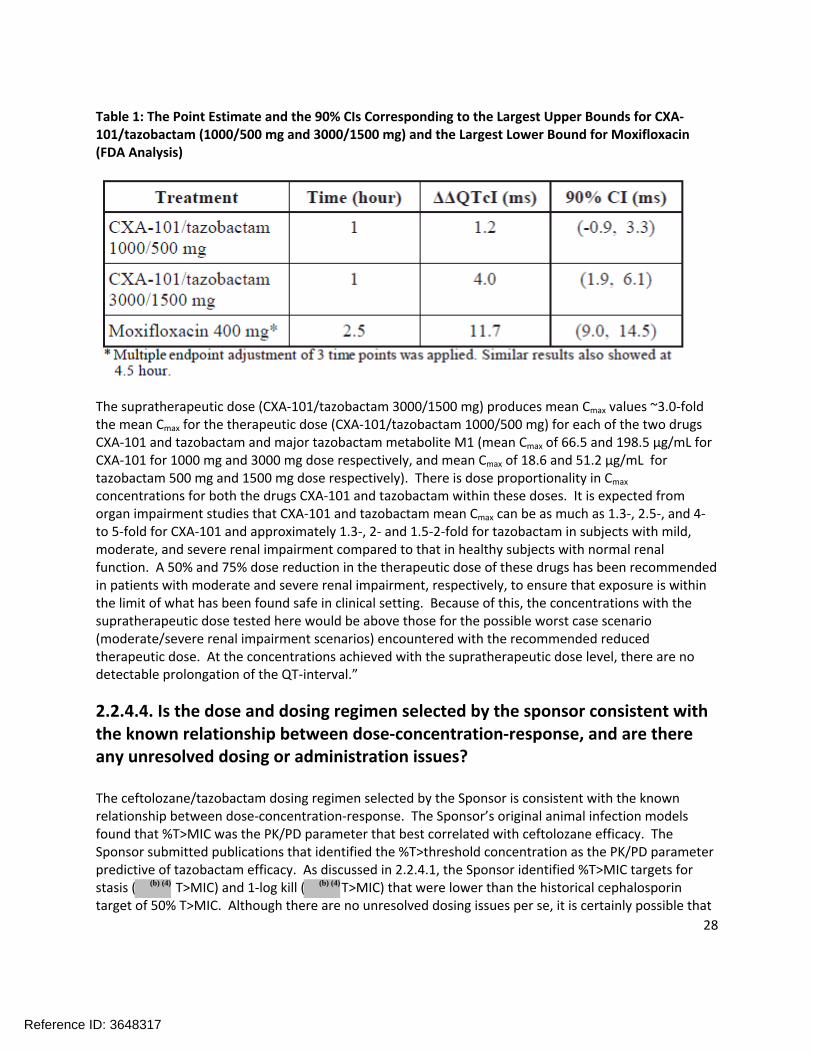
“No significant QTc prolongation effects of CXA-101/tazobactam (1000/500 mg and 3000/1500 mg) was detected in this TQT study. The largest upper bounds of the 2-sided 90% CI for the mean difference between CXA-101/tazobactam (1000/500 mg and 3000/1500 mg) and placebo were below 10 ms, the threshold for regulatory concern as described in the ICH E 14 guidelines. The largest lower bound of the two-sided 90% CI for the ΔΔQTcI for moxifloxacin was greater than 5 ms, and the moxifloxacin profile over time is adequately demonstrated in Figure 4, indicating that assay sensitivity was established.
In this randomized, double-blind, double-dummy, four-period crossover study, 52 healthy subjects received CXA-101/tazobactam 1000/500 mg CXA-101/tazobactam 3000/1500 mg, placebo, and a single oral dose of moxifloxacin 400 mg. Overall summary of findings is presented in Table 1.
Reference ID: 3648317
28
Table 1: The Point Estimate and the 90% CIs Corresponding to the Largest Upper Bounds for CXA-101/tazobactam (1000/500 mg and 3000/1500 mg) and the Largest Lower Bound for Moxifloxacin (FDA Analysis)
The supratherapeutic dose (CXA-101/tazobactam 3000/1500 mg) produces mean Cmax values ~3.0-fold the mean Cmax for the therapeutic dose (CXA-101/tazobactam 1000/500 mg) for each of the two drugs CXA-101 and tazobactam and major tazobactam metabolite M1 (mean Cmax of 66.5 and 198.5 µg/mL for CXA-101 for 1000 mg and 3000 mg dose respectively, and mean Cmax of 18.6 and 51.2 µg/mL for tazobactam 500 mg and 1500 mg dose respectively). There is dose proportionality in Cmax
concentrations for both the drugs CXA-101 and tazobactam within these doses. It is expected from organ impairment studies that CXA-101 and tazobactam mean Cmax can be as much as 1.3-, 2.5-, and 4-to 5-fold for CXA-101 and approximately 1.3-, 2- and 1.5-2-fold for tazobactam in subjects with mild, moderate, and severe renal impairment compared to that in healthy subjects with normal renal function. A 50% and 75% dose reduction in the therapeutic dose of these drugs has been recommended in patients with moderate and severe renal impairment, respectively, to ensure that exposure is within the limit of what has been found safe in clinical setting. Because of this, the concentrations with the supratherapeutic dose tested here would be above those for the possible worst case scenario (moderate/severe renal impairment scenarios) encountered with the recommended reduced therapeutic dose. At the concentrations achieved with the supratherapeutic dose level, there are no detectable prolongation of the QT-interval.”
2.2.4.4. Is the dose and dosing regimen selected by the sponsor consistent with the known relationship between dose-concentration-response, and are there any unresolved dosing or administration issues?
The ceftolozane/tazobactam dosing regimen selected by the Sponsor is consistent with the known relationship between dose-concentration-response. The Sponsor’s original animal infection models found that %T>MIC was the PK/PD parameter that best correlated with ceftolozane efficacy. The Sponsor submitted publications that identified the %T>threshold concentration as the PK/PD parameter predictive of tazobactam efficacy. As discussed in 2.2.4.1, the Sponsor identified %T>MIC targets for stasis ( T>MIC) and 1-log kill ( T>MIC) that were lower than the historical cephalosporin target of 50% T>MIC. Although there are no unresolved dosing issues per se, it is certainly possible that
Reference ID: 3648317
(b) (4) (b) (4)

29
the efficacy of ceftolozane (particularly in cIAI) could be improved if a larger dose was given. It should be noted that the Sponsor is exploring a 3000 mg dose of ZERBAXA for the treatment of nosocomial pneumonia.
2.2.5.WhatarethePKcharacteristicsofthedruganditsmajormetabolite?
2.2.5.1. What are the single dose and multiple dose PK parameters?
Study CXA-201-01 was the first study conducted after the addition of tazobactam to the combination. Part 1 of the study evaluated single ascending doses of ceftolozane and tazobactam given as a 1-hour infusion. Subjects in each of the 3 dosing cohorts in Part 1 were randomized to 1 of 6 dosing sequences and received, in a within-cohort crossover design, each of ceftolozane (500, 1000, and 2000 mg), tazobactam (250, 500, or 1000 mg), and ceftolozane/tazobactam (500/250 mg, 1000/500 mg, or 2000/1000 mg) with a washout period between doses. Part 2 of the study evaluated multiple ascending doses of ceftolozane, tazobactam, and ceftolozane/tazobactam given as a 1 hour IV infusion, either every 8 hours or every 12 hours for 10 days.
Figure 2.2.5.1-1 shows the single dose concentration-time profile of ceftolozane from Part 1 of study CXA-201-01; Figure 2.2.5.1-2 shows the single dose concentration-time profile of tazobactam; and Figure 2.2.5.1-3 shows the single dose concentration-time profile of tazobactam M-1. Table 2.2.5.1-1 shows the ceftolozane plasma and urine pharmacokinetics from the various dosing groups. It is apparent that the pharmacokinetics of ceftolozane are not altered by co-administration with tazobactam.
Reference ID: 3648317

30
Figure 2.2.5.1-1: Ceftolozane Plasma Concentration-Time Profiles After a Single Intravenous 1-hour Infusion of Ceftolozane Alone and with Tazobactam
Figure 2.2.5.1-2: Tazobactam Plasma Concentration-Time Profiles after a Single Intravenous 1-hour Infusion of Tazobactam Alone and with Ceftolozane
Reference ID: 3648317

31
Figure 2.2.5.1-3: Tazobactam M-1 Metabolite Plasma Concentration-Time Profiles after a Single Intravenous 1-hour Infusion of Tazobactam Alone and with Ceftolozane
Table 2.2.5.1-1: Ceftolozane Plasma and Urine Pharmacokinetic Parameters after a Single Intravenous 1-hour Infusion of Ceftolozane Alone and with Tazobactam
Reference ID: 3648317

32
Note that the fraction excreted values for ceftolozane of greater than 100% in Table 2.2.5.2-1 is likely due to measurement error. Similarly, the CLR appears greater than the total CL in Table 2.2.5.2-1, but they are not effectively different. Essentially ceftolozane is entirely renally cleared and excreted into the urine as unchanged drug.
In Part 2 of Study CXA-201-01, the pharmacokinetics of ceftolozane, tazobactam, and tazobactam M-1 were obtained following multiple doses of the following regimens:
Ceftolozane alone 1000 mg q8h for 10 days
Ceftolozane 1000 mg and Tazobactam 500 mg q8h for 10 days
Ceftolozane 1000 mg and Tazobactam 500 mg q12h for 10 days
Ceftolozane 1500 mg and Tazobactam 750 mg q12h for 10 days
The plasma concentration-time profile of ceftolozane following multiple doses of the above regimens is shown in Figure 2.2.5.1-4. The pharmacokinetics of ceftolozane following multiple doses of the above regimens is shown in Table 2.2.5.1-2, and the pharmacokinetics of tazobactam and tazobactam M-1 are shown in Table 2.2.5.1-3.
Figure 2.2.5.1-4: Ceftolozane Plasma Concentration-Time Profiles after Single and Multiple Intravenous 1-hour Infusions of Ceftolozane Alone or with Tazobactam
Note that in Figure 2.2.5.1-4, a single dose and final dose of ceftolozane were single doses, and the q8h or q12h doses were administered from days 2-9. Trough samples were collected on days 3, 6, 7, and 8. The data in Figure 2.2.5.1-4 does not allow for a visual distinction between q8h and q12h hour dosing.
Reference ID: 3648317

33
Figure 2.2.5.1-5 shows a plot of ceftolozane (1000 mg shown in blue) and tazobactam (500 mg shown in red) following a single dose administered via a 1 hour infusion.
Figure 2.2.5.1-5: Mean Ceftolozane (blue) and Tazobactam Plasma Concentration-Time Profiles after a Single 1-hour Infusion of Ceftolozane (1000 mg) and Tazobactam (500 mg)
Time (h)
0 5 10 15 20
Co
nce
ntr
atio
n (
mcg/m
L)
0
20
40
60
80
100
Time (h) vs Ceftolozane (mcg/mL) Time (h) vs Tazobactam (mcg/mL)
Table 2.2.5.1-2: Ceftolozane Plasma and Urine Pharmacokinetic Parameters after Single (Day 1) and Multiple (Day 10) Intravenous 1-hour Infusions of Ceftolozane Alone and with Tazobactam
Reference ID: 3648317

34
Table 2.2.5.1-3: Plasma and Urine Pharmacokinetic Parameters for Tazobactam and its Major Metabolite M-1 after Single (Day 1) and Multiple (Day 10) Intravenous 1-hour Infusions of Tazobactam Alone and with Ceftolozane
Very little accumulation of ceftolozane was observed following multiple doses, consistent with its half-life (generally 2-3 hours across dosing groups). Similarly, very little accumulation of tazobactam was observed following multiple doses due to its ~1 hour half-life. Tazobactam M-1 had a slightly longer half-life than ceftolozane (~3.5-4.5 hours) and showed some accumulation.
Reference ID: 3648317

35
There were no clinically meaningful differences in ceftolozane or tazobactam Cmax or AUC on Day 1 as compared to Day 10, indicating that steady-state is achieved relatively quickly. The calculated CL and Vss of ceftolozane and tazobactam also did not change significantly across dosing groups.
2.2.5.2. How does the PK of the drug and its major active metabolites in healthy volunteers compare to that in patients?
As part of population PK report CUBI-PCS-100 (see also Appendix 4.3), the Sponsor constructed a table of the dose-normalized ceftolozane and tazobactam PK parameters in healthy volunteers and in cUTI and cIAI patients (see Table 2.2.5.2-1 for ceftolozane PK in healthy volunteers and patients by indication). Comparable data for tazobactam is not provided, although data are available with the cUTI and cIAI patients pooled (refer to Appendix 4.3). The covariates identified in the final population PK model for ceftolozane included the CLCR on CL, body weight on VC and the impact of infection status on CL and Vc. The covariates identified in the final population PK model for tazobactam included CLCR on CL and the impact of infection status on Vc. In general, patients had a larger dose normalized volume of distribution and CL, and a reduced dose normalized Cmax. However, the dose normalized AUC was fairly consistent.
Table 2.2.5.2-1: Summary of Dose-Normalized Ceftolozane Pharmacokinetic Exposure Parameters at Steady-State by Infection Status in Subjects with Creatinine Clearance ≥ 90 mL/min
2.2.5.3. What are the characteristics of drug absorption?
Not applicable. Both products are administered intravenously so absorption is complete.
2.2.5.4. What are the characteristics of drug distribution?
The Vss of ceftolozane and tazobactam was independent of dose. The calculated Vss of ceftolozane across studies ranged from 12.0 L to 17.1 L, and the calculated Vss of tazobactam ranged from 14.3 L to 18.6 L across studies. These volume of distribution values are larger than blood volumes and suggest that both ceftolozane and tazobactam distribute into the extracellular space.
Reference ID: 3648317

36
The protein binding of ceftolozane in human serum ranged from 16.3% to 20.8%. A ceftolozane protein binding of 21% was assumed when calculating the free ceftolozane. The protein binding of tazobactam was previously known (~30% in humans).
2.2.5.5. Does the mass balance study suggest renal or hepatic as the major route of elimination?
There was no formal mass balance study. However, the vast majority of the ceftolozane (mean of approximately 99% across studies) and tazobactam (previously known to be primarily renally excreted) doses were recovered in the urine. Therefore, renal elimination is the major pathway.
2.2.5.6. What are the characteristics of metabolism?
There is no evidence that ceftolozane is metabolized. Ceftolozane was ~99% recovered unchanged from the urine. Tazobactam undergoes some metabolism to tazobactam M-1 (<20% of the administered dose). Tazobactam M-1 is formed by both the hydrolysis of the β-lactam ring and as an alkaline degradative product. The tazobactam M-1 metabolite lacks pharmacological activity.
2.2.5.7. What are the characteristics of drug excretion?
Ceftolozane is excreted unchanged in the urine. The majority of a dose of tazobactam is also excreted unchanged in the urine. Less than 20% of a tazobactam dose is metabolized to tazobactam M-1, which is then also renally excreted.
2.2.5.8. Based on PK parameters, what is the degree of linearity or nonlinearity in the dose-concentration relationship?
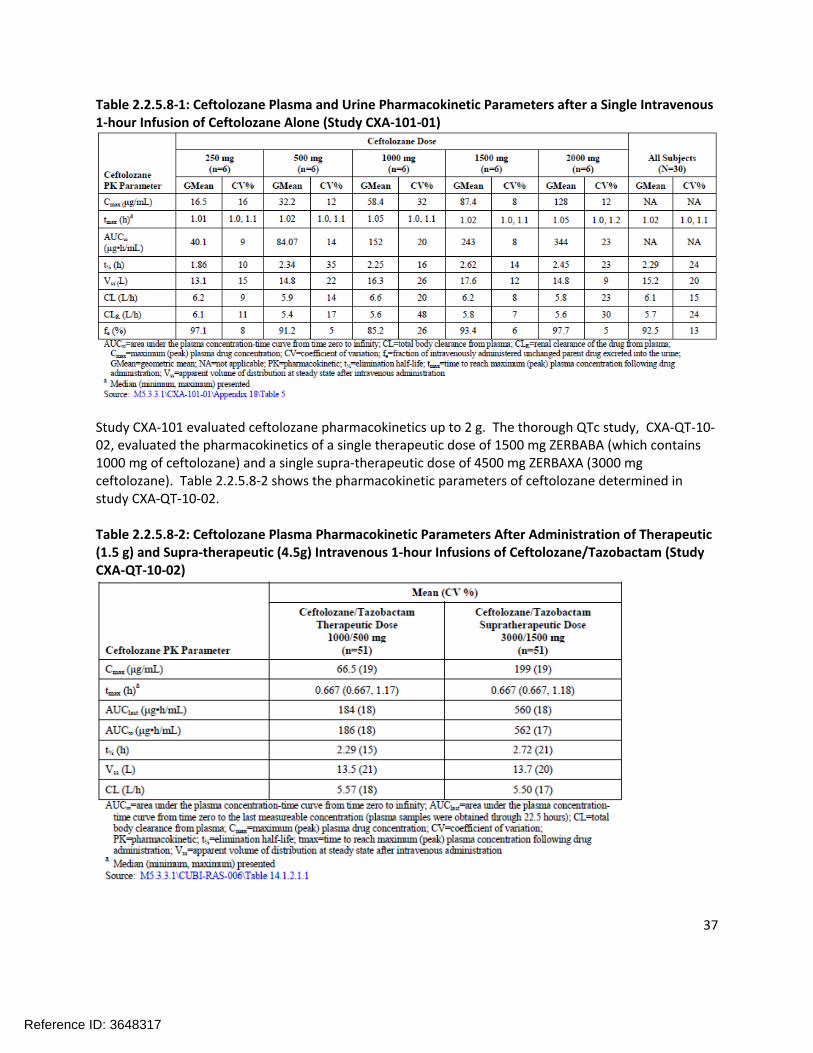
The pharmacokinetics of ceftolozane are linear and dose-proportional over the range of doses studied (250 mg to 3 g). The plasma and urine pharmacokinetic parameters from the initial single ascending dose study (CXA-101) are shown in Table 2.2.5.8-1.
Reference ID: 3648317
37
Table 2.2.5.8-1: Ceftolozane Plasma and Urine Pharmacokinetic Parameters after a Single Intravenous 1-hour Infusion of Ceftolozane Alone (Study CXA-101-01)
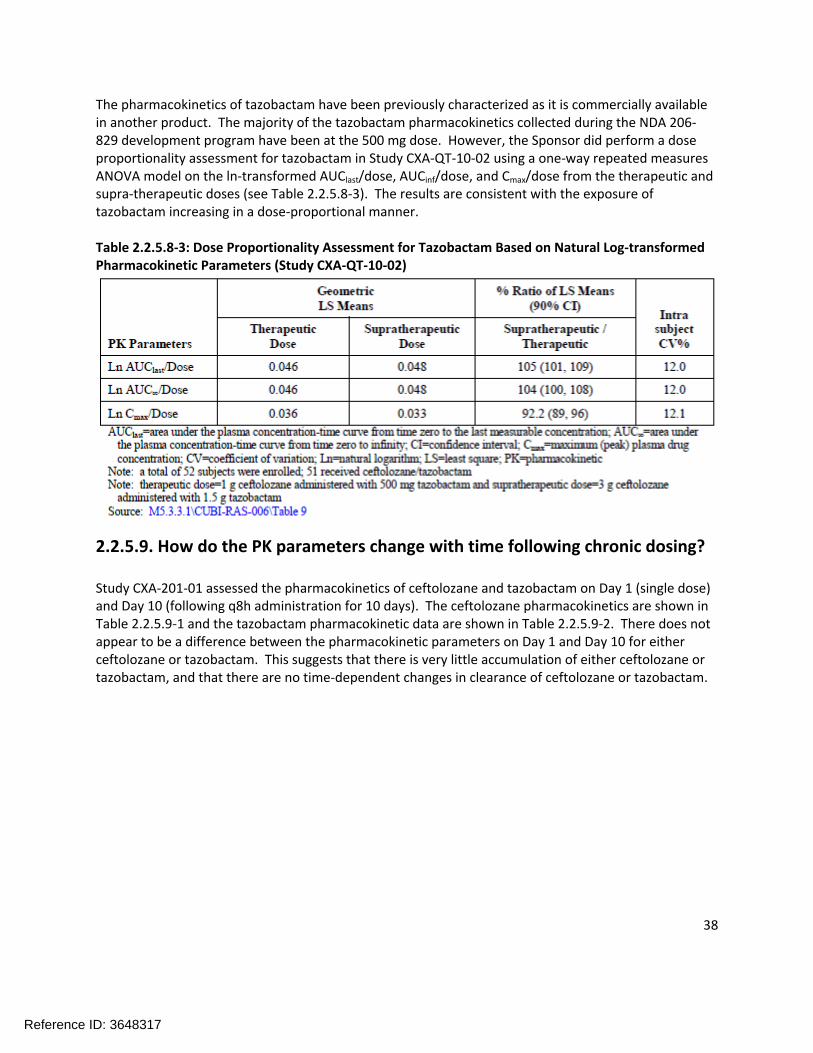
Study CXA-101 evaluated ceftolozane pharmacokinetics up to 2 g. The thorough QTc study, CXA-QT-10-02, evaluated the pharmacokinetics of a single therapeutic dose of 1500 mg ZERBABA (which contains 1000 mg of ceftolozane) and a single supra-therapeutic dose of 4500 mg ZERBAXA (3000 mg ceftolozane). Table 2.2.5.8-2 shows the pharmacokinetic parameters of ceftolozane determined in study CXA-QT-10-02.
Table 2.2.5.8-2: Ceftolozane Plasma Pharmacokinetic Parameters After Administration of Therapeutic (1.5 g) and Supra-therapeutic (4.5g) Intravenous 1-hour Infusions of Ceftolozane/Tazobactam (Study CXA-QT-10-02)
Reference ID: 3648317
38
The pharmacokinetics of tazobactam have been previously characterized as it is commercially available in another product. The majority of the tazobactam pharmacokinetics collected during the NDA 206-829 development program have been at the 500 mg dose. However, the Sponsor did perform a dose proportionality assessment for tazobactam in Study CXA-QT-10-02 using a one-way repeated measures ANOVA model on the ln-transformed AUClast/dose, AUCinf/dose, and Cmax/dose from the therapeutic and supra-therapeutic doses (see Table 2.2.5.8-3). The results are consistent with the exposure of tazobactam increasing in a dose-proportional manner.
Table 2.2.5.8-3: Dose Proportionality Assessment for Tazobactam Based on Natural Log-transformed Pharmacokinetic Parameters (Study CXA-QT-10-02)
2.2.5.9. How do the PK parameters change with time following chronic dosing?
Study CXA-201-01 assessed the pharmacokinetics of ceftolozane and tazobactam on Day 1 (single dose) and Day 10 (following q8h administration for 10 days). The ceftolozane pharmacokinetics are shown in Table 2.2.5.9-1 and the tazobactam pharmacokinetic data are shown in Table 2.2.5.9-2. There does not appear to be a difference between the pharmacokinetic parameters on Day 1 and Day 10 for either ceftolozane or tazobactam. This suggests that there is very little accumulation of either ceftolozane or tazobactam, and that there are no time-dependent changes in clearance of ceftolozane or tazobactam.
Reference ID: 3648317
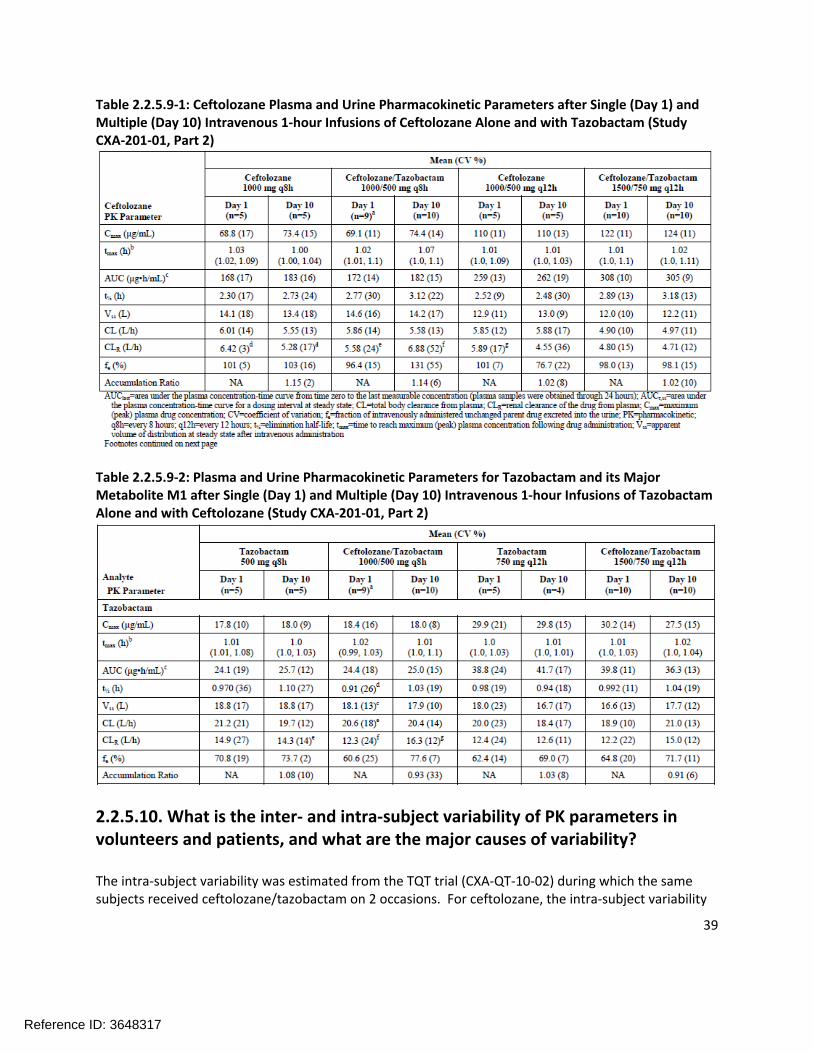
39
Table 2.2.5.9-1: Ceftolozane Plasma and Urine Pharmacokinetic Parameters after Single (Day 1) and Multiple (Day 10) Intravenous 1-hour Infusions of Ceftolozane Alone and with Tazobactam (Study CXA-201-01, Part 2)
Table 2.2.5.9-2: Plasma and Urine Pharmacokinetic Parameters for Tazobactam and its Major Metabolite M1 after Single (Day 1) and Multiple (Day 10) Intravenous 1-hour Infusions of Tazobactam Alone and with Ceftolozane (Study CXA-201-01, Part 2)
2.2.5.10. What is the inter- and intra-subject variability of PK parameters in volunteers and patients, and what are the major causes of variability?
The intra-subject variability was estimated from the TQT trial (CXA-QT-10-02) during which the same subjects received ceftolozane/tazobactam on 2 occasions. For ceftolozane, the intra-subject variability
Reference ID: 3648317

40
was estimated to be <10% and for tazobactam the intra-subject variability was estimated to be approximately 12%.
The inter-subject variability in healthy volunteers was evaluated in two of the larger Phase 1 studies, CXA-QT-10-02 and CXA-DDI-12-10 (see Table 2.2.5.10-1). The %CV for the ceftolozane/tazobactam PK parameters ranged from 13-24%. Table 2.2.5.10-2 shows the inter-subject variability of ceftolozane and tazobactam pharmacokinetics in patients. Inter-subject variability in subjects with cUTI was similar to that observed in healthy subjects (%CV ranging from 18-26%). Inter-subject variability in cIAI was higher (%CV ranging from 46 – 117 for ceftolozane). The major sources of variability in the cIAI ceftolozane and tazobactam data are likely the severity of the cIAI infection (e.g. resulting in different amounts of extracellular fluid accumulation in the abdomen) and differences in CLCR.
Table 2.2.5.10-1: Mean (%CV) Plasma Pharmacokinetic Parameters in Healthy Subjects after an Intravenous 1-hour Infusion 1.5 g Ceftolozane/Tazobactam
Table 2.2.5.10-2: Ceftolozane and Tazobactam Plasma Pharmacokinetic Parameters in Patients with Normal Renal Function Receiving Intravenous 1-hour Infusions of 1.5 g Ceftolozane/Tazobactam Every8 hours
Reference ID: 3648317

41
2.3IntrinsicFactors
2.3.1Whatintrinsicfactors(age,gender,race,weight,height,disease,geneticpolymorphism,pregnancy,andorgandysfunction)influenceexposure(PKusually)and/orresponse,andwhatistheimpactofanydifferencesinexposureonefficacyorsafetyresponses?
Since ceftolozane and tazobactam are primarily renally excreted, the Sponsor conducted dedicated studies in subjects with varying degrees of renal impairment. The changes in the pharmacokinetics of ceftolozane and tazobactam in subjects with moderate and severe renal impairment were of sufficient magnitude as to merit a dose adjustment. Similarly, the pharmacokinetics of ceftolozane and tazobactam in subjects with end stage renal disease (ESRD) on hemodialysis (HD) also required a dosage adjustment. The increase in ceftolozane/tazobactam exposure observed in subjects with mild renal impairment was not deemed to be clinically significant. The impact of other intrinsic factors on ceftolozane pharmacokinetics was evaluated via population pharmacokinetic analyses.
The Sponsor initially developed a population PK model for ceftolozane based on pharmacokinetic data from healthy volunteers. The population PK model was updated as new trials were conducted, including the addition of subjects with varying degrees of renal impairment and patients infected with cUTI or cIAI.
A meta-analysis (Report CUBI-PCS-100, see Appendix 4.3 Pharmacometric Review) of all of the previous population PK reports was conducted to determine the final population pharmacokinetic models for ceftolozane and tazobactam. Consistent with the previous analyses, the final structural model for ceftolozane was a 2-compartment disposition model with linear elimination including the effect of baseline CLCR on CL and body weight on Vc, and the effect of cUTI and cIAI infection on both CL and Vc. The final structural model for tazobactam was a 2-compartment disposition model with linear elimination including the effect of baseline CLCR on CL and cIAI infection on Vc.
2.3.2.Baseduponwhatisknownaboutexposure-responserelationshipsandtheirvariabilityandthegroupsstudied,healthyvolunteersvs.patientsvs.specificpopulations,whatdosageregimenadjustments,ifany,arerecommendedforeachofthesegroups?Ifdosageregimenadjustmentsarenotbaseduponexposure-responserelationships,describethealternativebasisfortherecommendation.
Table 2.3.2-1 shows the quartiles of AUC and Ctrough for several intrinsic factors. Consistent with the population PK modeling, there was a trend towards decrease exposure with increased weight (body weight and BMI). Exposure in cIAI was also lower than cUTI and healthy volunteers, possibly due to an increased volume of distribution due to the disease state.
Reference ID: 3648317

42
Table 2.3.2-1: Predicted AUCss and Ctrough based on post-hoc parameter estimates from the Sponsor’s population PK analysis for ceftolozane based on the Sponsor’s proposed dosing for a subset ofcovariates
Ceftolozane
Covariate Category
AUCss (µg.h/mL) Ctrough (µg/mL)
n Median [IQR] Median [IQR]
Body weight (kg)
≥43 - <66 92 193 [165; 218] 3.4 [1.8; 5.4]
≥66 - <74 96 170 [153; 203] 3.4 [1.8; 4.9]
≥74 - <85 93 161 [148; 193] 3.6 [2.1; 6.9]
≥85 95 150 [114; 194] 3.6 [2.2; 7.4]
Age (years)
≥18 - <27 84 168 [154; 200] 2.9 [1.3; 3.7]
≥27 - <39 96 160 [136; 175] 2.3 [1.2; 3.6]
≥39 - <60 96 170 [144; 215] 3.6 [2.5; 5.4]
≥60 - 89 100 190 [149; 234] 8.1 [4.6; 11.2]
BMI (kg/m2)
≥17.2 - <23.6 94 179 [152; 217] 3.7 [2.0; 5.5]
≥23.6 - <25.7 94 168 [151; 206] 3.2 [1.7; 4.7]
≥25.7 - < 28.4 94 163 [146; 193] 3.2 [2.2; 5.7]
≥28.4 94 167 [132; 216] 4.1 [2.0; 8.3]
Infection Status
HVs 226 172 [156; 213] 3.2 [1.6; 4.7]
cUTI 73 174 [148; 217] 5.8 [3.6; 10.3]
cIAI 77 119 [98; 177] 2.9 [1.9; 6.0]
Creatinine Clearance (mL/min)
Normal (≥90 mL/min)
255 162 [143; 188] 2.9 [1.5; 4.0]
Mild (≥60 and <90 mL/min)
79 214 [171; 256] 6.2 [4.3; 10.2]
Moderate (≥30 and <60
mL/min)36 152 [105; 195] 6.4 [3.5; 11.6]
Severe (≥15 and <30 mL/min)
6 256 [225; 270] 23.6 [19.8; 25.8]
2.3.2.1. Elderly.
No dosing adjustment of ZERBAXA is recommended on the basis of age.
2.3.2.2. Pediatric patients.
Reference ID: 3648317
43
The pharmacokinetics of ceftolozane have not yet been evaluated in pediatric patients. Therefore, no recommendations can be made at this time.
2.3.2.3. Gender.
No clinically relevant differences in AUC were observed for ceftolozane or tazobactam with respect to gender (median AUC of 181 for females and 161 for males). Therefore, no dose adjustment to ZERBAXA is recommended on the basis of gender.
2.3.2.4. Race.
The population pharmacokinetic analysis contained 186 total subjects, the majority of which (n=156) were Caucasian. Although the data from races other than Caucasians were limited, the population pharmacokinetic analysis suggested that no clinically relevant difference in ZERBAXA AUC was observed. Therefore, no dose adjustment of ZERBAXA is recommended on the basis of race.
2.3.2.5. Renal Impairment.
The Sponsor conducted three renal impairment studies in support of this NDA: CXA-101-02, CXA-201-02, and CXA-REN-11-01. Study CXA-101-02 was not reviewed because it was conducted with ceftolozane alone in subjects with normal or mild renal impairment. Reviews of the individual study reports for CXA-201-02 and CXA-REN-11-01 can be found in Appendix 4.2 and an analysis of the Sponsor’s proposed dose adjustment can be found in the Pharmacometric Review (Appendix 4.3).
CXA-201-02CXA-201-02 evaluated the pharmacokinetics of a single dose of ceftolozane/tazobactam (1000 mg/500 mg) in subjects with normal renal function, mild renal impairment, and moderate renal impairment. A total of 24 subjects were enrolled, with six subjects in each of the following groups: normal renal function demographically matched to mild renal impairment, mild renal impairment, normal renal function demographically matched to moderate renal impairment, and moderate renal impairment.
The subjects in Study CXA-201-02 were originally enrolled and categorized based on the 1998 FDA Renal Impairment Guidance for Industry. A new draft Guidance for Renal Impairment was published in 2010 which included some revisions to how renal impairment groups were defined. As it pertains to CXA-201-02, two subjects were affected by the revised recommendations and were reclassified in the Sponsor’s analysis. Subject 002-012 (CLCR of 88.9 mL/min) was reclassified from the normal renal function group into the mild renal impairment group and Subject 002-003 (CLCR of 50.2 mL/min) was reclassified from the mild renal impairment group into the moderate renal impairment group.
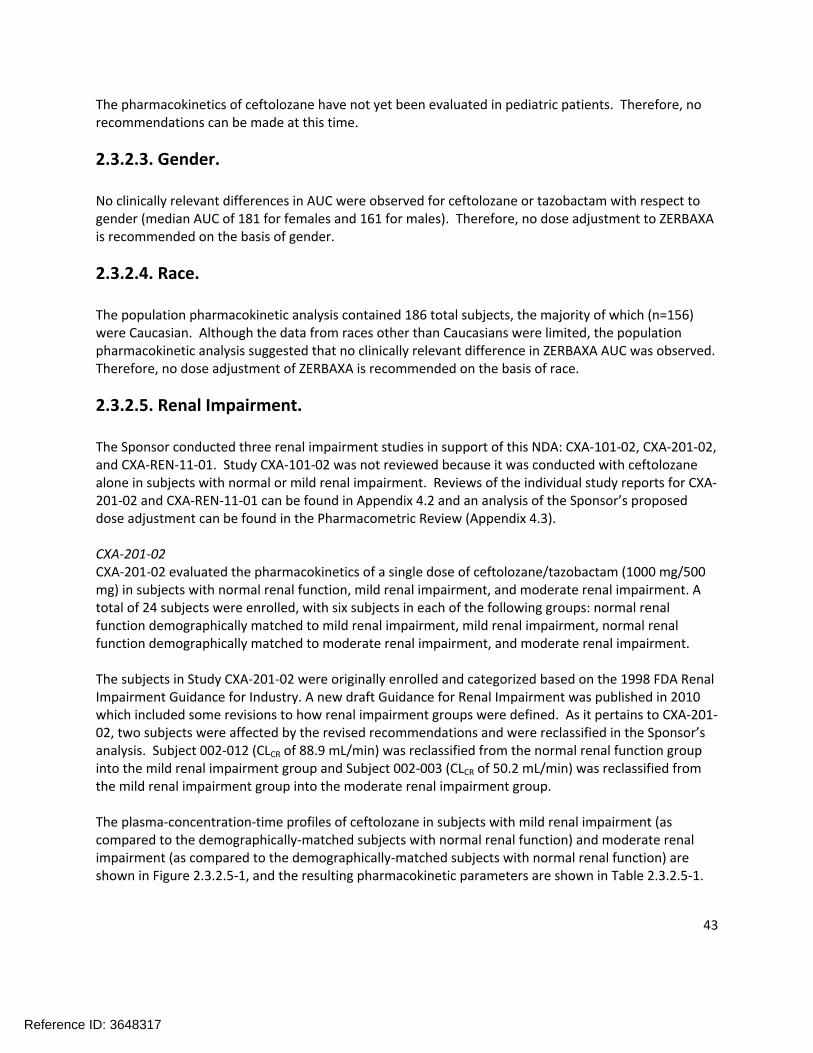
The plasma-concentration-time profiles of ceftolozane in subjects with mild renal impairment (as compared to the demographically-matched subjects with normal renal function) and moderate renal impairment (as compared to the demographically-matched subjects with normal renal function) are shown in Figure 2.3.2.5-1, and the resulting pharmacokinetic parameters are shown in Table 2.3.2.5-1.
Reference ID: 3648317

44
Figure 2.3.2.5-1: Mean (SD) Concentration-Time Profiles of CXA-101 in Plasma
Table 2.3.2.5-1: Mean (%CV) PK Parameters of CXA-101 in Plasma Following a Single IV Dose of CXA-101/Tazobactam 1000/500 mg
The mean ceftolozane AUC0-last and AUC0-inf in mild renal impairment subjects were increased by roughly 25% compared to the demographically-matched subjects with normal renal function. This difference is not considered clinically meaningful and no dose adjustment of ceftolozane is recommended for subjects with mild renal impairment. Conversely, the mean AUC0-last and AUC0-inf in subjects with moderate renal impairment was increased by approximately 2.5 fold relative to the demographically-matched subjects with normal renal function, indicating a dose adjustment would be necessary to achieve comparable exposure.
The plasma-concentration-time profiles of tazobactam in subjects with mild renal impairment (as compared to the demographically-matched subjects with normal renal function) and moderate renal
Reference ID: 3648317

45
impairment (as compared to the demographically-matched subjects with normal renal function) are shown in Figure 2.3.2.5-2, and the resulting pharmacokinetic parameters are shown in Table 2.3.2.5-2.
Figure 2.3.2.5-2: Mean (SD) Concentration-Time Profiles of Tazobactam in Plasma
Table 2.3.2.5-2: Mean (%CV) PK Parameters of Tazobactam in Plasma Following a Single IV Dose ofCXA-101/Tazobactam 1000/500 mg
The mean tazobactam AUC0-last and AUC0-inf in mild renal impairment subjects were increased by roughly 30% compared to the demographically-matched subjects with normal renal function. This difference is not considered clinically meaningful and no dose adjustment of tazobactam is recommended for subjects with mild renal impairment. Conversely, the mean tazobactam AUC0-last and AUC0-inf in subjects with moderate renal impairment was increased by approximately 2-fold relative to the demographically-matched subjects with normal renal function, indicating a dose adjustment would be necessary to achieve comparable exposure.
CXA-REN-11-01CXA-REN-11-01 evaluated the pharmacokinetics of a single dose of ceftolozane/tazobactam (500/250 mg) in subjects with severe renal function, and two doses of ceftolozane/tazobactam (before and after
Reference ID: 3648317

46
dialysis) in subjects with end-stage renal disease on hemodialysis (ESRD on HD). A total of 12 subjects were enrolled, six subjects with severe renal impairment and six subjects with ESRD.
Since there was no within-trial comparison of ceftolozane/tazobactam pharmacokinetics, the concentration-time profiles are not shown here for either subjects with severe renal impairment or ESRD (refer to Appendix 4.2). The pharmacokinetic parameters for ceftolozane and tazobactam in patients with severe renal impairment are shown in Table 2.3.2.5-3, and the pharmacokinetics of ceftolozane/tazobactam in subjects with ESRD are shown in Table 2.3.2.5-4 (before dialysis) and Table 2.3.2.5-5 (after dialysis).
Table 2.3.2.5-3: Median (Range) Pharmacokinetic Parameters for CXA-101, Tazobactam, and the M-1 Metabolite of Tazobactam for Subjects with Severe Renal Impairment Following Administration of a Single Dose of CXA-201 in Plasma
Note that despite being given a reduced dose of ceftolozane/tazobactam, the AUC0-t and AUC0-inf values of ceftolozane and tazobactam are still increased by roughly 2-fold over what was observed in subjects with normal renal function (refer to Tables 2.3.2.5-1 for ceftolozane and 2.3.2.5-2 for tazobactam) indicating a further downward dose adjustment is necessary for subjects with severe renal impairment to achieve ceftolozane and tazobactam exposures comparable to subjects with normal renal function.
Table 2.3.2.5-4: Median (Range) Pharmacokinetic Parameters for CXA-101, Tazobactam, and the M-1 Metabolite of Tazobactam Following Administration of the First Dose of CXA-201 (before dialysis)
As expected, the exposures of ceftolozane and tazobactam in ESRD patients who have not yet received their dialysis treatment are significantly higher than what was observed in healthy volunteers. Additionally, the ceftolozane AUC0-inf in the ESRD subjects was more than 3-fold larger than in subjects with severe renal impairment and the tazobactam AUC0-inf was nearly two fold larger.
Reference ID: 3648317

47
Table 2.3.2.5-5: Median (Range) Pharmacokinetic Parameters for CXA-101, Tazobactam, and the M-1 Metabolite of Tazobactam Following Administration of the Second Dose of CXA-201 on Study Day 4 in Subjects with ESRD During HD
These results indicate that the dialysis procedure significantly removes both ceftolozane and tazobactam. The resulting AUC0-inf for ceftolozane and tazobactam was still elevated compared to subjects with normal renal function receiving the 1500 mg dose of CXA-201, but the resulting exposures were similar to patients with mild renal impairment who received the 1500 mg dose.
Proposed Dose AdjustmentsThe Sponsor has proposed dose adjustments for ceftolozane/tazobactam in patients with moderate and severe renal impairment (in the population PK meta-analysis report CUBI-PCS-100) and in patients with ESRD on HD (in the population PK report CXA-POPPK-002). Both reports are reviewed extensively in the Pharmacometric Review (Appendix 4.3). Summary plots showing the relationship between creatinine clearance and population pharmacokinetic model-predicted ceftolozane (left, Figure 2.3.2.5-3) and tazobactam (right, Figure 2.3.2.5-3) clearance support the dedicated study findings of decreased drug elimination as creatinine clearance decreases.
Figure 2.3.2.5-3: Relationship Between Creatinine Clearance (CrCL) and Population Pharmacokinetic Model-predicted Ceftolozane (left) and Tazobactam (right) Clearance
The Reviewer is in agreement with the proposed dose adjustments which are summarized in Table 2.3.2.5-6 as the exposures resulting from the implementation of the recommended dose adjustments
Reference ID: 3648317

48
would be predicted to be comparable to the exposures resulting from the administration of 1.5 g ZERBAXA q8h infused over 1 hour in patients with normal renal function.
Table 2.3.2.5-6: Recommended Doses of Ceftolozane and Tazobactam by Renal Impairment Group
Renal Impairment Category Proposed Dose of Ceftolozane/Tazobactam
Frequency
Normal 1000/500 mg q8h
Mild 1000/500 mg q8h
Moderate 500/250 mg q8h
Severe 250/125 mg q8h
ESRD on HD Loading dose: 500/250Maintenance dose: 100/50
q8h, with the maintenance dose administered at the earliest
possible time following completion of dialysis on HD
days
Dose adjustments are recommended on the basis of matching plasma concentrations. A dose adjusted patient would be expected to receive comparable ceftolozane and tazobactam plasma concentrations as a patient with normal renal function that did not receive a dose adjustment. However, since the absolute dose administered may differ, the concentrations of ceftolozane and tazobactam in the urine for dose adjusted patients may differ than what was observed for patients with normal renal function. However, the urinary concentrations of ceftolozane and tazobactam should remain sufficiently high with the adjusted dose such that efficacy would not be compromised in cUTI infections.
2.3.2.6. Hepatic Impairment.
A hepatic impairment study was not conducted, and does not appear to be necessary given the extensive renal elimination of both ceftolozane and tazobactam. Hepatic impairment would not be expected to affect the pharmacokinetics of ceftolozane or tazobactam. No dose adjustment of ceftolozane/tazobactam is recommended on the basis of hepatic impairment.
2.3.2.7. What pregnancy and lactation use information is there in the application?
The impact of pregnancy and lactation was not evaluated in this NDA. The proposed product labeling states that it is unknown whether ceftolozane or tazobactam is excreted in human milk and that caution should be exercised when ZERBAXA is administered to a nursing woman.
No pregnancies have occurred in any subject treated with ceftolozane/tazobactam or ceftolozane alone during the clinical development program.
Reference ID: 3648317

49
2.4ExtrinsicFactors
2.4.1.Whatextrinsicfactors(drugs,herbalproducts,diet,smoking,andalcoholuse)influencedose-exposureand/orresponseandwhatistheimpactofanydifferencesinexposureonresponse?
The impact of herbal products, diet, smoking, and alcohol use were not evaluated. The Sponsor conducted an extensive in vitro program to evaluate the potential for ceftolozane, tazobactam, and tazobactam M-1 to interact with select CYP450 enzymes and membrane transporters (refer to Appendix 4.1).
In general, the in vitro studies suggested a low potential for drug interactions. However, it was observed that tazobactam was a substrate and inhibitor of OAT1 and OAT3. Additionally, treatment of ceftolozane at 1000 µg/mL for 3 days in human liver microsomes caused a moderate reduction in mRNA levels of CYP1A2 and CYP3A4 in some of the donor samples. To further investigate these potential drug-drug interactions, the Sponsor conducted a cocktail drug-drug interaction study (CXA-DDI-12-10) which is further discussed in 2.4.2.8.
2.4.2.Drug-druginteractions.
2.4.2.1. Is there an in vitro basis to suspect in vivo drug-drug interactions?
The Sponsor conducted several in vitro studies to assess the potential for ceftolozane, tazobactam, and tazobactam M-1 to induce or inhibit CYP450 enzymes. Additionally, ceftolozane and tazobactam were evaluated for the potential to be substrates of or to inhibit select membrane transporters.
In general, the results of these in vitro trials did not suggest a potential for drug interactions. Tazobactam was shown to inhibit OAT1 and OAT3 at estimated IC50 values of 117.7 and 146.7 µg/mL, respectively. Ceftolozane, tazobactam, and tazobactam M-1 all showed potential to reduce mRNA levels of CYP1A2 or CYP3A4. An in vivo cocktail drug interaction study (CXA-DDI-12-10) was conducted to further investigate these findings (see section 2.4.2.8).
Tazobactam showed some inhibition of CYP3A4 at concentrations well above the expected clinical concentration of 22 µg/mL (see Table 2.4.2.1-1). Ceftolozane showed some potential to inhibit MATE1 and MATE2-K (by approximately 30-40%), although an IC50 could not be identified despite ceftolozane concentrations of 2500 µg/mL.
Reference ID: 3648317

50
Table 2.4.2.1-1: Inhibition of CYP3A4 (Midazolam 1’-hydorxylase)
2.4.2.2. Is the drug a substrate of CYP enzymes? Is metabolism influenced by genetics?
No. Ceftolozane is nearly completely recovered unchanged in the urine. Tazobactam is metabolized to tazobactam M-1 by non-CYP450-mediated processes.
2.4.2.3. Is the drug an inhibitor and/or an inducer of CYP enzymes?
All of the information in this section is derived from in vitro studies. No clinically significant interactions are expected (refer to 2.4.2.8).
Ceftolozane showed no potential to induce CYP450 enzymes. Ceftolozane did not directly inhibit the activity of any of the following CYP450 isozymes: CYP1A2, CYP2B6, CYP2C8, CYP2C9, CYP2C19, CYP2D6, or CYP3A4. However, ceftolozane has shown a potential to reduce mRNA levels of CYP1A2 and CYP3A4 which may indirectly act as an inhibitor.
Tazobactam showed no inhibition of CYP1A2, CYP2B6, CYP2C8, CYP2C9, CYP2C19, or CYP2D6. Tazobactam showed some inhibition of CYP3A4 (see Table 2.4.2.1-1), although the inhibition at clinically relevant concentrations is not substantial. Tazobactam also showed a potential to reduce mRNA levels of CYP1A2 and CYP3A4.
Tazobactam M-1 showed no potential to inhibit CYP1A2, CYP2B6, CYP2C8, CYP2C9, CYP2C19, CYP2D6, or CYP3A4. Tazobactam M-1 showed a potential to reduce mRNA levels of CYP1A2, CYP2B6, and CYP3A4.
2.4.2.4. Is the drug a substrate and/or an inhibitor of P-glycoprotein transport processes?
No. Ceftolozane and tazobactam were shown to be neither a substrate nor an inhibitor of P-gp.
Reference ID: 3648317

51
2.4.2.5. Are there other metabolic/transporter pathways that may be important?
Ceftolozane was evaluated for its potential to inhibit the following transporters: OAT1, OAT3, OCT1, OCT2, OATP1B1, OATP1B3, P-gp, BCRP, BSEP, MRP2, MATE1, and MATE2-K. For most of the transporters, no inhibition was observed. For OAT1, OAT1B3, MATE1, and MATE2-K, a weak inhibition was observed, but an IC50 was not able to be determined with ceftolozane concentrations up to 2500 µg/mL [>50-fold the Cmax of ceftolozane observed in Phase 2 studies (47 µg/mL)]. Therefore, the inhibition of transporters by ceftolozane is unlikely to be clinically relevant.
Tazobactam was evaluated for its potential to inhibit the following transporters: OAT1, OAT3, OATP1B1, OATP1B3, OCT1, OCT2, P-gp, BCRP, and BSEP. No inhibition was observed for OATP1B1, OCT2, P-gp, BCRP, or BSEP. Weak inhibition of OCT1 (19.6% at 500 µg/mL) and OATP1B3 (32.3% at 500 µg/mL) was observed. Tazobactam IC50 values of 117.8 µg/mL and 146.7 µg/mL were determined for OAT1 and OAT3 inhibition, respectively. This interaction was further investigated in the in vivo drug-drug interaction study CXA-DDI-12-10.
Tazobactam M-1 was evaluated for its potential to inhibit the following transporters: OATP1B1, OATP1B3, OAT1, OAT3, BSEP, BCRP, and P-gp. Tazobactam M-1 inhibited OAT1 by 43.8% at 75 µg/mL, but otherwise showed no inhibition. The mean tazobactam M-1 concentration in the Phase 2 cIAI trial was 1.5 µg/mL, so this interaction is unlikely to be clinically significant.
2.4.2.6. Does the label specify co-administration of another drug (e.g. combination therapy in oncology) and if so, has the interaction potential between these drugs been evaluated?
Yes. Ceftolozane is given with tazobactam as a combination product. The Sponsor conducted a Phase 1 trial to assess whether tazobactam interfered with ceftolozane pharmacokinetics (CXA-201-01). Table 2.4.2.6-1 shows the pharmacokinetics of ceftolozane following single doses of ceftolozane alone (TOL) and the same single dose when given with tazobactam (TOL/TAZ). This study also contained a multiple dose arm that was consistent with the single dose data. Tazobactam does not interfere with the pharmacokinetics of ceftolozane.
Reference ID: 3648317
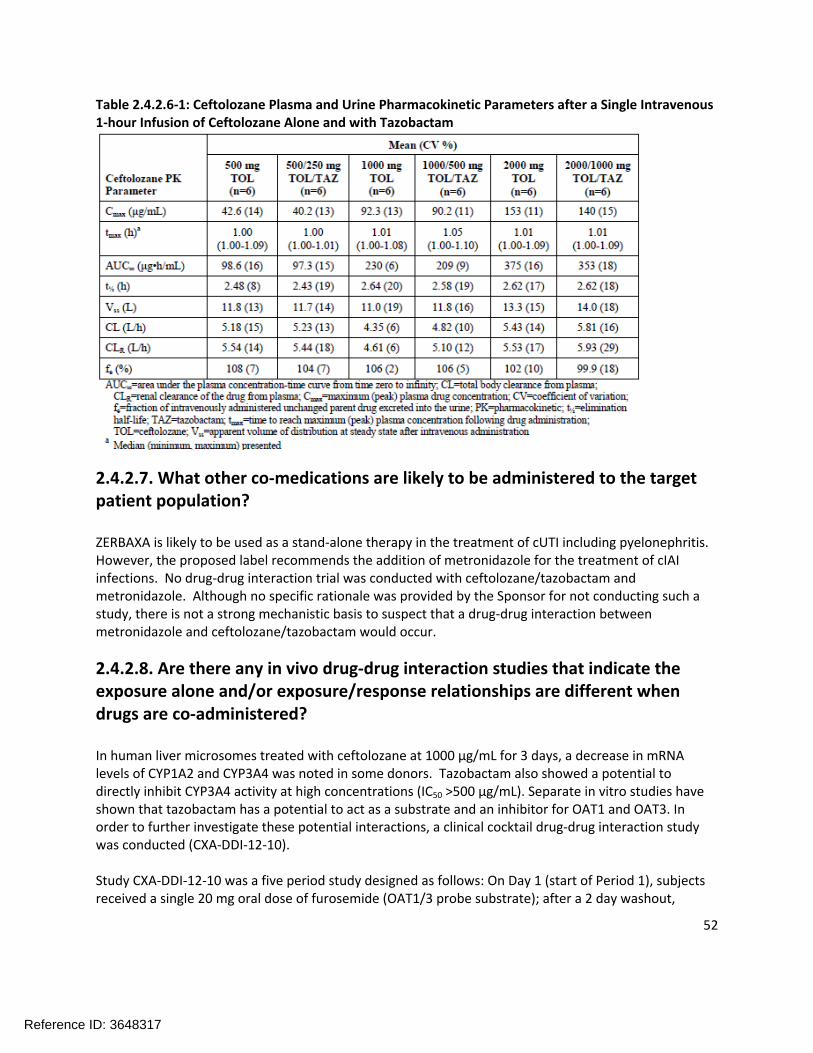
52
Table 2.4.2.6-1: Ceftolozane Plasma and Urine Pharmacokinetic Parameters after a Single Intravenous 1-hour Infusion of Ceftolozane Alone and with Tazobactam
2.4.2.7. What other co-medications are likely to be administered to the target patient population?
ZERBAXA is likely to be used as a stand-alone therapy in the treatment of cUTI including pyelonephritis. However, the proposed label recommends the addition of metronidazole for the treatment of cIAI infections. No drug-drug interaction trial was conducted with ceftolozane/tazobactam and metronidazole. Although no specific rationale was provided by the Sponsor for not conducting such a study, there is not a strong mechanistic basis to suspect that a drug-drug interaction between metronidazole and ceftolozane/tazobactam would occur.
2.4.2.8. Are there any in vivo drug-drug interaction studies that indicate the exposure alone and/or exposure/response relationships are different when drugs are co-administered?
In human liver microsomes treated with ceftolozane at 1000 µg/mL for 3 days, a decrease in mRNA levels of CYP1A2 and CYP3A4 was noted in some donors. Tazobactam also showed a potential to directly inhibit CYP3A4 activity at high concentrations (IC50 >500 µg/mL). Separate in vitro studies have shown that tazobactam has a potential to act as a substrate and an inhibitor for OAT1 and OAT3. In order to further investigate these potential interactions, a clinical cocktail drug-drug interaction study was conducted (CXA-DDI-12-10).
Study CXA-DDI-12-10 was a five period study designed as follows: On Day 1 (start of Period 1), subjects received a single 20 mg oral dose of furosemide (OAT1/3 probe substrate); after a 2 day washout,
Reference ID: 3648317
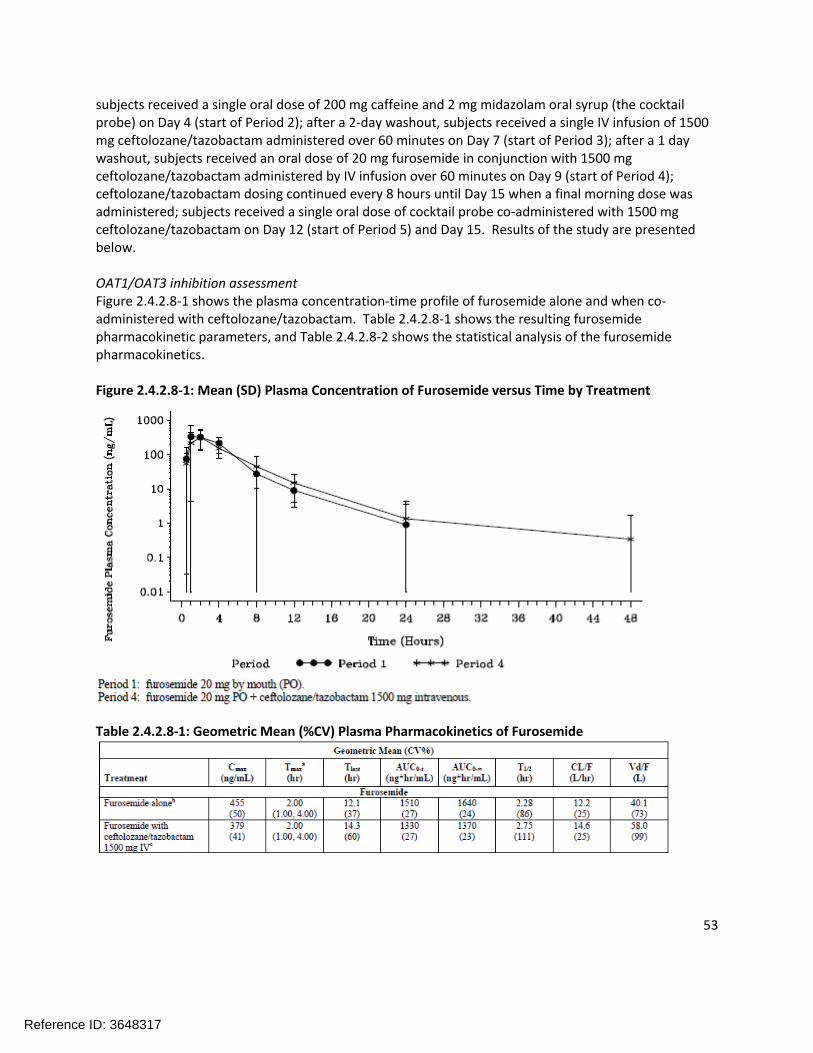
53
subjects received a single oral dose of 200 mg caffeine and 2 mg midazolam oral syrup (the cocktail probe) on Day 4 (start of Period 2); after a 2-day washout, subjects received a single IV infusion of 1500 mg ceftolozane/tazobactam administered over 60 minutes on Day 7 (start of Period 3); after a 1 day washout, subjects received an oral dose of 20 mg furosemide in conjunction with 1500 mg ceftolozane/tazobactam administered by IV infusion over 60 minutes on Day 9 (start of Period 4); ceftolozane/tazobactam dosing continued every 8 hours until Day 15 when a final morning dose was administered; subjects received a single oral dose of cocktail probe co-administered with 1500 mg ceftolozane/tazobactam on Day 12 (start of Period 5) and Day 15. Results of the study are presented below.
OAT1/OAT3 inhibition assessmentFigure 2.4.2.8-1 shows the plasma concentration-time profile of furosemide alone and when co-administered with ceftolozane/tazobactam. Table 2.4.2.8-1 shows the resulting furosemide pharmacokinetic parameters, and Table 2.4.2.8-2 shows the statistical analysis of the furosemide pharmacokinetics.
Figure 2.4.2.8-1: Mean (SD) Plasma Concentration of Furosemide versus Time by Treatment
Table 2.4.2.8-1: Geometric Mean (%CV) Plasma Pharmacokinetics of Furosemide
Reference ID: 3648317

54
Table 2.4.2.8-2: Statistical Analysis of Plasma Pharmacokinetic Parameters of Furosemide
The lower bound of the 90% confidence intervals for furosemide AUC0-t, AUC0-inf, and Cmax all fell below the pre-specified no-effect boundary of 0.8, indicating that the pharmacokinetics of furosemide were altered by co-administration of ceftolozane/tazobactam. However, the interaction was not in the expected direction as an inhibition of OAT1/3 would manifest in increased concentrations/exposures of furosemide. The reduction of the point estimates were in the range of 10-20%, suggesting that the reductions in furosemide concentrations/exposures are not clinically relevant.
CYP1A2 inhibition (caffeine and 1,7-dimethylxanthine)Study CXA-DDI-12-10 assessed both the pharmacokinetics of CYP1A2 probe substrate caffeine as well as its metabolite 1,7-dimethylxanthine. The pharmacokinetics of caffeine were not altered by the co-administration of ceftolozane/tazobactam. The pharmacokinetics of 1,7-dimethylxanthine are shown in Table 2.4.2.8-3 and the statistical analysis of the parameters is shown in Table 2.4.2.8-4.
Table 2.4.2.8-3: Geometric Mean (%CV) Plasma Pharmacokinetics of 1,7-Dimethylxanthine
Reference ID: 3648317

55
Table 2.4.2.8-4: Statistical Analysis of Plasma Pharmacokinetic Parameters of 1.7-Dimethylxanthine
The AUC0-t of the caffeine metabolite 1,7-dimethylxanthine increased when co-administered with ceftolozane/tazobactam, although not substantially. This increase in exposure is not consistent with inhibition of CYP1A2, which would be predicted to result in a decrease in 1,7-dimethxanthine concentrations and an increase in caffeine concentrations, neither of which was observed.
CYP3A4 inhibition (midazolam and 1-hydroxymidazolam)Study CXA-DDI-12-10 assessed both the pharmacokinetics of CYP3A4 probe substrate midazolam as well as its metabolite 1-hydroxymidazolam. The pharmacokinetic parameters of midazolam are shown in Table 2.4.2.8-5 and the pharmacokinetics of 1-hydroxymidazolam are shown in Table 2.4.2.8-6. The statistical analysis of the pharmacokinetic parameters is shown in Table 2.4.2.8-7 for midazolam and Table 2.4.2.8-8 for 1-hydroxymidazolam.
Table 2.4.2.8-5: Geometric Mean (%CV) Plasma Pharmacokinetics of Midazolam
Reference ID: 3648317
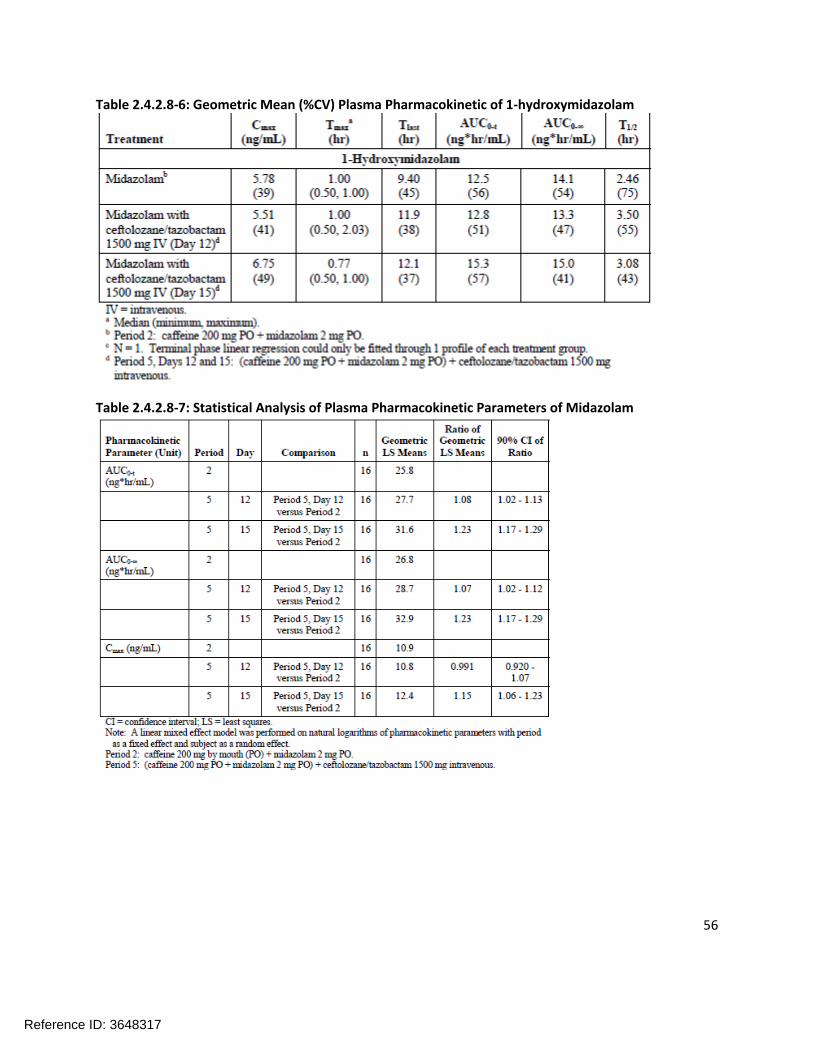
56
Table 2.4.2.8-6: Geometric Mean (%CV) Plasma Pharmacokinetic of 1-hydroxymidazolam
Table 2.4.2.8-7: Statistical Analysis of Plasma Pharmacokinetic Parameters of Midazolam
Reference ID: 3648317

57
Table 2.4.2.8-8: Statistical Analysis of Plasma Pharmacokinetics of 1-hydroxymidazolam
The 90% confidence intervals of the point estimates for the AUC0-t, AUC0-inf, and Cmax for midazolam (as calculated on Day 12) all fell within the pre-specified 0.8-1.25 no effect boundary, indicating that the pharmacokinetics of midazolam were not altered. However, by Day 15, the upper bound of the confidence intervals had exceeded 1.25 for all of the parameters. The point estimates for midazolam on the Day 15 assessment indicated an increase in Cmax of approximately 15% and increase in AUC of ~23% (both AUC0-t and AUC0-inf). One possible conclusion is that several days of ceftolozane/tazobactam administration led to a suppression of CYP3A4 mRNA levels and therefore CYP3A4 activity as observed in the in vitro study; however, the increase in midazolam concentrations/exposures was not accompanied by a comparable decrease in 1-hydroxymidazolam concentrations; in fact, the concentrations and exposures of 1-hydroxymidazolam also increased between Day 12 and Day 15.
SummaryThe pharmacokinetics of furosemide, 1,7-dimethylxanthine, midazolam, and 1-hydroxymidazolam were altered when co-administered with ceftolozane/tazobactam. However, the magnitudes of the changes observed are not clinically significant and do not require dose adjustment. Some of the findings in the study are puzzling (e.g. the decrease in furosemide exposure following the administration of ceftolozane/tazobactam), and the observed pharmacokinetic changes do not coincide with the possible mechanistic explanations. One possibility for this could be that subtle changes are not apparent when looking at mean data. The Reviewer examined the individual concentration-time profiles for furosemide, caffeine, 1,7-dimethylxanthine, midazolam, and 1-hydroxymidazolam. Although there was some inter-individual variability, the mean results were generally consistent with the individual results. The Reviewer concludes that the changes in pharmacokinetics observed in Study CXA-DDI-12-10 are likely not clinically relevant.
Reference ID: 3648317

58
2.4.2.9. Is there a known mechanistic basis for pharmacodynamic drug-drug interactions, if any?
The possible reduction of CYP1A2 and CYP3A4 mRNA levels may be due to a pharmacodynamic drug interaction (e.g. inhibition of transcription factors). However, there is no known mechanistic basis to support that.
2.4.2.10. Are there any unresolved questions related to metabolism, active metabolites, metabolic drug interactions, or protein binding?
There are no unresolved questions related to metabolism, active metabolites, or metabolic drug interactions.
2.4.3.Whatissuesrelatedtodose,dosingregimens,oradministrationareunresolvedandrepresentsignificantomissions?
There are no significant unresolved issues related to the dose, dosing regimen, or administration of ceftolozane/tazobactam.
2.5GeneralBiopharmaceuticsNot applicable, as ceftolozane/tazobactam is intended for intravenous infusion.
2.6AnalyticalSection
2.6.1.Howareactivemoietiesidentifiedandmeasuredintheplasmaintheclinicalpharmacologyandbiopharmaceuticsstudies?
Ceftolozane, tazobactam, and tazobactam M-1 were measured in human plasma, urine, and dialysate. Caffeine, furosemide, and midazolam concentrations (and relevant metabolites) in human plasma were also measured in conjunction with CXA-DDI-12-10 (refer to Appendix 4.2).
2.6.2.Whichmetaboliteshavebeenselectedforanalysisandwhy?
Ceftolozane is not metabolized to any appreciable extent (if at all). Tazobactam M-1 was selected for analysis as it is the primary metabolite of tazobactam.
2.6.3.Forallmoietiesmeasured,isfree,bound,ortotalmeasured?Whatisthebasisforthatdecision,ifany,andisitappropriate?
Total concentrations were measured. No specific justification for measuring total concentrations was provided. Total concentrations were corrected for protein binding for the appropriate analysis (e.g. probability of target attainment analyses for breakpoint determination).
Reference ID: 3648317

59
2.6.4.Whatbioanalyticalmethodsareusedtoassessconcentrations?
Ceftolozane in human plasma was originally measured via LC/MS/MS (method MN08035) and then via another method (MN10131) that used derivatization and solid phase extraction (SPE). A cross validation method (MC10B-0277) was carried out to ensure the compatibility between the two previous methods. Ceftolozane in human urine was measured via LC/MS/MS (method MN08036).
Tazobactam and tazobactam M-1 in human plasma were measured via LC/MS/MS (method MN09054). Tazobactam and tazobactam M-1 in human urine were measured via LC/MS/MS (method MN09055).
Ceftolozane, tazobactam, and tazobactam M-1 in human dialysate were measured via an LC/MS/MS method (MN11038).
2.6.4.1. What is the range of the standard curve? How does it relate to the requirements for clinical studies? What curve fitting techniques are used?
Please see Table 2.6.4.1-1. The concentration ranges studied were appropriate for the observed concentrations in clinical trials. Curve fitting was performed using non-linear regression techniques.
Table 2.6.4.1-1: Range of Standard Curve and Curve Fitting for Ceftolozane, Tazobactam, and Tazobactam M-1 by Biological Matrix and Bioanalytical Method.
Method Analyte/Matrix Range of Standard Curve
MN08035 Ceftolozane/plasma 0.1 – 50.0 µg/mL
MN10131 Ceftolozane/plasma 0.25 to 150 µg/mL
MN08036 Ceftolozane/urine 5.0 to 5000 µg/mL
MN09054 Tazobactam and Tazobactam M-1/plasma
Tazo: 0.1 – 50.0 µg/mL
Tazo M1: 0.05 – 25.0 µg/mL
MN09055 Tazobactam and Tazobactam M-1/urine
Tazo: 10 – 5000 µg/mL
Tazo M-1: 5 – 2500 µg/mL
MN11038 Ceftolozane, tazobactam, and tazobactam M-1/dialysate
Cef: 1.0 – 500 ng/mL
Tazo: 1.0 – 500 ng/mL
Tazo M-1: 1.0 – 500 ng/mL
Reference ID: 3648317

60
2.6.4.2. What are the lower and upper limits of quantification (LLOQ/ULOQ)?
See Table 2.6.4.2-1.
Table 2.6.4.2-1: LLOQ and ULOQ for Ceftolozane, Tazobactam, and Tazobactam M-1 by Biological Matrix and Bioanalytical Method
Method Analyte/Matrix LLOQ ULOQ
MN08035 Ceftolozane/plasma 0.1 µg/mL 50 µg/mL
MN10131 Ceftolozane/plasma 0.25 µg/mL 150 µg/mL
MN08036 Ceftolozane/urine 5.0 µg/mL 5000 µg/mL
MN09054 Tazobactam and Tazobactam M-
1/plasma
Tazobactam: 0.1 µg/mL
Tazo M-1: 0.05 µg/mL
Tazobactam: 50 µg/mL
Tazo M-1: 25 µg/mL
MN09055 Tazobactam and Tazobactam M-1/urine
Tazo: 10 µg/mL
Tazo M-1: 5 µg/mL
Tazo: 5000 µg/mL
Tazo M-1: 2500 µg/mL
MN11038 Ceftolozane, tazobactam, and tazobactam M-
1/dialysate
Cef: 1.0 ng/mL
Tazo: 1.0 ng/mL
Tazo M-1: 1.0 ng/mL
Cef: 500 ng/mL
Tazo: 500 ng/mL
Tazo M-1: 500 ng/mL
2.6.4.3. What are the accuracy, precision, and selectivity at these limits?See Table 2.6.4.3-1. Non-interference validation (selectivity) was evaluated separately in the context of CXA-DDI-12-10 in which ZERBAXA was administered with a cocktail containing caffeine, furosemide, and midazolam. Based on the results of the analysis, the coexistence of tazobactam, tazobactam M-1, midazolam, hydroxymidazolam, caffeine, and furosemide do not interfere with the determination of CXA-101 in human plasma.
Reference ID: 3648317

61
Table 2.6.4.3-1: Accuracy and Precision for Ceftolozane, Tazobactam, and Tazobactam M-1 by Biological Matrix and Bioanalytical Method
Method Analyte/Matrix Accuracy (% bias) Precision (%CV)
MN08035 Ceftolozane/plasma 94.5 – 102.0% 1.74 – 7.42%
MN10131 Ceftolozane/plasma 89.6 – 105.0% 3.52 – 3.70%
MN08036 Ceftolozane/urine 94.8 – 108.0% 0.86 – 5.59%
MN09054 Tazobactam and Tazobactam M-
1/plasma
Tazo: 95.0 –108.8%
Tazo M-1: 90.7 –102.4%
Tazo: 0.78 –8.45%
Tazo M-1: 1.72 –7.95%
MN09055 Tazobactam and Tazobactam M-
1/urine
Tazo: 95.2 –102.0%
Tazo M-1: 96.0 –102.6%
Tazo: 0.86 –6.69%
Tazo M-1: 1.28 –5.99%
MN11038 Ceftolozane, tazobactam, and tazobactam M-
1/dialysate
Cef: 96.0 – 102.2%
Tazo: 97.5 –105.6%
Tazo M-1: 97.4 –103.0
Cef: 1.60 – 6.82%
Tazo: 2.06 –6.57%
Tazo M-1: 1.48 –6.1%
2.6.4.4. What is the sample stability under the conditions used in the study (long-term, freeze-thaw, sample-handling, sample transport, autosampler)?
The freeze-thaw stability and the long-term stability for each method are provided below. Stability information was not provided for sample transport or autosampler.
Method MN08035
Freeze-thaw Stability: 4-cycles.
Long-term Stability: 7 days at -20°C; 395 days at -70°C.
Method MN10131Freeze-thaw stability: 5 cycles.
Long-term stability: 22 days at -20°C; 352 days at -70°C.
Bench top stability: 4 hours at room temperature.
Reference ID: 3648317

62
MN08036Freeze-thaw stability: 6 cycles.
Long-term stability: 24 hours on ice, 14 days at -20°C and -70°C when blended with tazobactam and tazobactam M-1.
MN09054Freeze-thaw stability: 5 cycles.
Long-term stability: 14 days at -20°C and 542 days -70°C for both tazobactam and tazobactam M-1.
MN09055Freeze-thaw stability: 5 cycles.
Long-term stability: 14 days at -20°C and -70°C when blended with ceftolozane.
MN11038Freeze-thaw stability: 5 cycles.
Long-term stability: 79 days at -70°C for ceftolozane, tazobactam, and tazobactam M-1.
2.6.4.5. What is the QC sample plan?
The QC sample plans for the various methods are presented below. A general QC sample strategy is not provided in the summary of biopharmaceutics and associated analytical methods. However, the QC sample plan appears consistent with the guidance (at least three QCs per method run in duplicate, etc.).
Method MN08035 Three QC samples were analyzed: low (0.3 µg/mL), mid (3.0 µg/mL), and high (40.0 µg/mL).
Method MN10131Four QC samples were analyzed: low (0.25 µg/mL), mid (0.750 µg/mL and 10.0 µg/mL), and high (120 µg/mL).
MN08036Three QC samples were analyzed: low (15 µg/mL), mid (500 µg/mL), and high (4000 µg/mL).
MN09054For tazobactam, three QC samples were analyzed: low (0.3 µg/mL), mid (3.0 µg/mL), and high (40 µg/mL).
For tazobactam M-1, three QC samples were analyzed: low (0.15 µg/mL), mid (1.50 µg/mL), and high (20 µg/mL).
MN09055
Reference ID: 3648317

63
For tazobactam, three QC samples were analyzed: low (30 µg/mL), mid (300 µg/mL), and high (4000 µg/mL).
For tazobactam M-1, three QC samples were analyzed: low (15 µg/mL), mid (150 µg/mL), and high (2000 µg/mL).
MN11038For ceftolozane, tazobactam, and tazobactam M-1, four QC samples were analyzed: low (1.0 ng/mL), mid (3.0 ng/mL and 30 ng/mL), and high (400 ng/mL).
Reference ID: 3648317
23 Page(s) of Draft Labeling have been Withheld in Full as b4 (CCI/TS) immediately following this page

87
4Appendices
4.1InvitrostudyreportsStudy No: 301036648 (CX.101.DM.001)Study Title: CXA-101: A Non-GLP Evaluation of Induction Potential of Cytochrome P450 Isoforms by CXA-101 in Cultured Cryopreserved Human Hepatocytes
Date: 10/18/10 – 1/31/11
Laboratory Site:
OBJECTIVE: The purpose of this non-GLP study was to determine the induction potential of CXA-101in plated primary cryopreserved human hepatocytes. Induction was determined by measuring the catalytic activity of cytochrome P450 (CYP) isoforms CYP1A2, CYP2B6, and CYP3A4.
METHODS:Primary cryopreserved hepatocytes from three donors were tested. Hepatocytes were exposed to CXA-101 for a total of 3 days under serum free conditions at concentrations of 100, 300, or 1000 mcg/mL, and a single concentration of positive control inducer, with media changes every 24 hours. CYP induction was assessed by measuring the catalytic activity of CYP isoforms using probe substrates specific for CYP1A2, CYP2B6, and CYP3A4 catalytic activity. The probe substrates used in this study are shown in Table 1 and the positive control inducers are shown in Table 2.
Table 1: Incubation conditions of P450 substrates
Table 2: Positive Control Inducers
RESULTSStabilityPrior to initiation of the study, the Sponsor assessed the stability of the CXA-101 test article at concentrations of 50 mcg/mL and 3000 mcg/mL in hepatocyte media incubated at 37° C for 6 and 24 hours. Following 6 hours of incubation, 90% and 87% of CXA-101 remained when 50 mcg/mL and 3000 mcg/mL concentrations were incubated, respectively. Following 24 hours of incubation, 52% and 32% of
Reference ID: 3648317
(b) (4)

88
parent CXA-101 remained, respectively. Therefore, over the 24 hour incubation period, the actual average concentration for parent CXA-101 was likely to be lower than the nominal concentration, and likely within a factor of 2.
CYP1A2 activityThe potential for CXA-101 to induce CYP1A2 was tested at concentrations of 100, 300, and 1000 mcg/mL with primary cultured hepatocytes from three donors (see Table 3). Based upon the results of this study, CXA-101 is not considered to be an inducer of CYP1A2 activity. The treatment of hepatocytes with the positive control inducer BNF (20 µM) for 3 days caused a 35, 74, and 30-fold increase in CYP1A2 activity in donors HF382, HMC399, and HMC426, respectively.
Table 3: The Effect of CXA-101 on CYP1A2 Activity in Human Hepatocytes
CYP2B6 activityTable 4 shows the effect of different concentrations of ceftolozane on CYP2B6 activity. Based upon the results of this study, CXA-101 is not considered to be an inducer of CYP2B6 activity. Treatment of hepatocytes with the positive control inducer PB (2 mM) showed an increase in CYP2B6 activity.
Reference ID: 3648317

89
Table 4: The Effect of CXA-101 on CYP2B6 Activity in Human Hepatocytes
CYP3A4 activityTable 5 shows the effect of different concentrations of ceftolozane on CYP3A4 activity. Based upon the results of this study, CXA-101 is not considered to be an inducer of CYP3A4 activity. Treatment of hepatocytes with the positive control inducer rifampin (20 µM) showed an increase in CYP2B6 activity.
Reference ID: 3648317
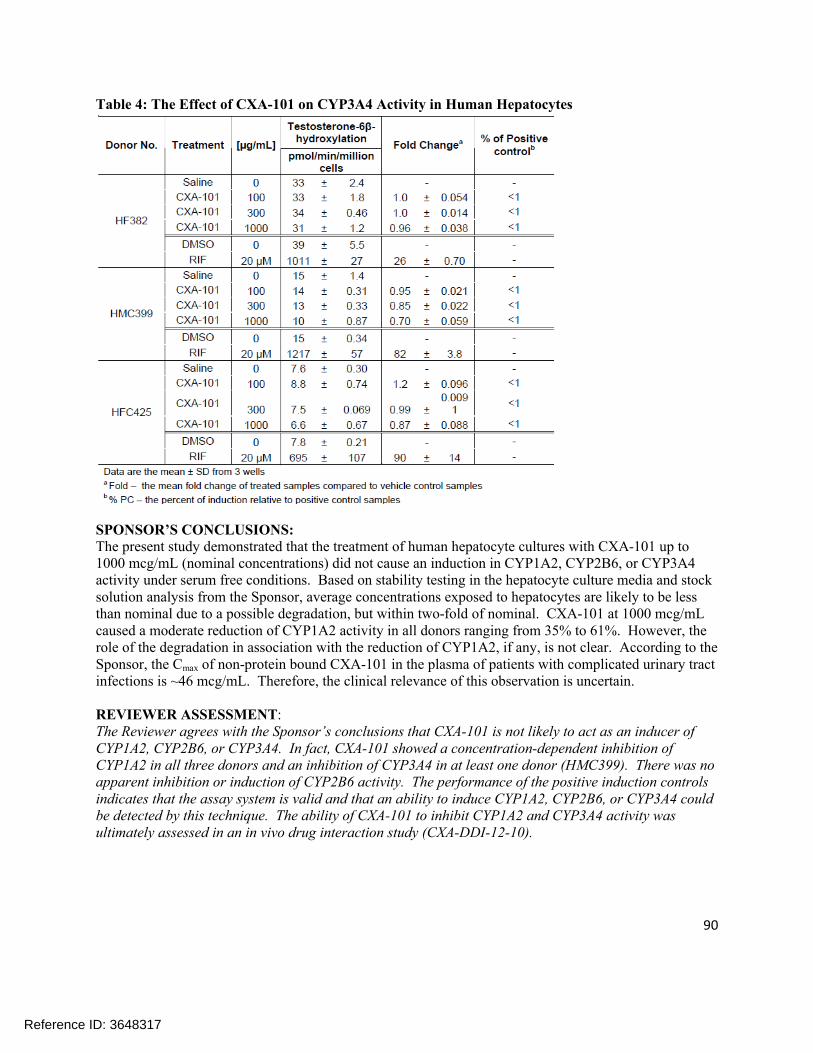
90
Table 4: The Effect of CXA-101 on CYP3A4 Activity in Human Hepatocytes
SPONSOR’S CONCLUSIONS:The present study demonstrated that the treatment of human hepatocyte cultures with CXA-101 up to 1000 mcg/mL (nominal concentrations) did not cause an induction in CYP1A2, CYP2B6, or CYP3A4 activity under serum free conditions. Based on stability testing in the hepatocyte culture media and stock solution analysis from the Sponsor, average concentrations exposed to hepatocytes are likely to be less than nominal due to a possible degradation, but within two-fold of nominal. CXA-101 at 1000 mcg/mL caused a moderate reduction of CYP1A2 activity in all donors ranging from 35% to 61%. However, the role of the degradation in association with the reduction of CYP1A2, if any, is not clear. According to the Sponsor, the Cmax of non-protein bound CXA-101 in the plasma of patients with complicated urinary tract infections is ~46 mcg/mL. Therefore, the clinical relevance of this observation is uncertain.
REVIEWER ASSESSMENT:The Reviewer agrees with the Sponsor’s conclusions that CXA-101 is not likely to act as an inducer of CYP1A2, CYP2B6, or CYP3A4. In fact, CXA-101 showed a concentration-dependent inhibition of CYP1A2 in all three donors and an inhibition of CYP3A4 in at least one donor (HMC399). There was no apparent inhibition or induction of CYP2B6 activity. The performance of the positive induction controls indicates that the assay system is valid and that an ability to induce CYP1A2, CYP2B6, or CYP3A4 could be detected by this technique. The ability of CXA-101 to inhibit CYP1A2 and CYP3A4 activity was ultimately assessed in an in vivo drug interaction study (CXA-DDI-12-10).
Reference ID: 3648317

91
Study Number: 301107791 (CX.101.DM.002)
Study Title: CXA-101: A Non-GLP Evaluation of Induction Potential of Cytochrome P450 Isoforms 1A2 and 3A4 by CXA-101 in Cultured Cryopreserved Human Hepatocytes
Date: 10/10/11 to 2/2/12
Lab Site:
OBJECTIVE: The purpose of this non-GLP study was to determine the potential for CXA-101 to induce or reduce cytochrome P450 isoforms CYP1A2 and CYP3A4 in plated primary cryopreserved human hepatocytes. Induction was measured by catalytic activity and mRNA expression assays selective for cytochrome P450 isoforms CYP1A2 and CYP3A4.
METHODS:Primary cryopreserved hepatocytes from three donors were used. The effect of CXA-101 at concentrations of 100, 300, and 1000 mcg/mL upon CYP1A2 and 3A was assessed using the 24 hour medium change regimen. Hepatocytes were exposed to CXA-101 for a total of 3 days. CYP induction was assessed by measuring the catalytic activity of CYP isoforms using probe substrates specific for CYP1A2 and CYP3A4, and mRNA expression levels were determined by RT-PCR. In addition, replicate plates of cells were cultured and treated for collection of protein for potential Western blot analysis.
The probe substrates used are shown in Table 1 and the positive control inducers are shown in Table 2.
Table 1: Enzyme Methods for CYP-Mediated Metabolite Formation
Table 2: Positive Control Inducers
Reference ID: 3648317
(b) (4)

92
RESULTS:StabilityThe Sponsor assessed the stability of CXA-101 in hepatocyte media incubated at 37° C for 6 and 24 hours. Following 6 hours of incubation, 88.1% and 87.1% of CXA-101 remained when 100 mcg/mL and 1000 mcg/mL concentrations were incubated, respectively. Following 8 hours of incubation, 79.6% and 78.8% of CXA-101 remained when 100 mcg/mL and 1000 mcg/mL concentrations were incubated, respectively. Following 24 hours of incubation, 43.5% and 48.9% of parent CXA-101 remained when 100 mcg/mL and 1000 mcg/mL concentrations were incubated, respectively.
Effect of CXA-101 on CYP1A2 Activity and mRNA ExpressionThe potential for CXA-101 to induce CYP1A2 was tested in serum free medium at nominal concentrations of 100, 300, and 1000 mcg/mL with primary cultured human hepatocytes from three donors. The activity and mRNA results are summarized in Tables 3 and 4, respectively. Based upon the results of this study, CXA-101 is not considered to be an inducer of CYP1A2 activity and mRNA.
Incubation of the hepatocytes with CXA-101 for three days demonstrated that CXA-101 exhibited no potential to induce CYP1A2 activity. The fold induction values ranged from 0.60 to 1.5 at concentrations up to 1000 mcg/mL, representing <1 to 1% of the positive control inducer response, from all three donors. The results suggest that CXA-101 is not an inducer of CYP1A2 enzyme activity. Treatment with 100 mcg/mL CXA-101 for three days caused a moderate reduction of CYP1A2 activity by 31 to 40% in hepatocyte lots 264 and 285, respectively. No apparent reduction of CYP1A2 activity was observed in hepatocyte lot 295.
The RT-PCR results demonstrated that CXA-101 exhibited no induction of CYP1A2 mRNA expression at concentrations up to 1000 mcg/mL. Additionally, the results demonstrated concentration-dependent decreased levels of CYP1A2 mRNA for all three donors. In general, the PCR data support the enzyme activity results for the donors, with the exception for hepatocyte lot 295, where the decrease in mRNA was not consistent with the CYP1A2 activity result.
Effect of CXA-101 on CYP3A4 Activity and mRNA ExpressionThe potential for CXA-101 to induce CYP3A4 was tested in serum free medium at nominal concentrations of 100, 300, and 1000 mcg/mL with primary cultured human hepatocytes from three donors. The activity and mRNA results are summarized in Tables 5 and 6, respectively. Based upon the results of this study, CXA-101 is not considered to be an inducer of CYP3A4 activity and mRNA.
Incubation of hepatocytes with CXA-101 for three days resulted in no increases or decreases in CYP3A4 activity at all CXA-101 concentrations tested. The fold induction values ranged from 0.92 to 1.3 at concentrations up to 1000 mcg/mL, representing < 1% of the positive control inducer response, from all three donors. The PCR results showed a 74% reduction in CYP3A4 mRNA expression at 1000 mcg/mL CXA-101 for hepatocyte lot 264, as compared to saline control. No induction or reduction of mRNA levels was observed in hepatocyte lots 285 and 295. With the exception of the lot 264 results, the PCR data support the enzyme activity results for the donors.
Reference ID: 3648317

93
Table 3: The Effect of CXA-101 on CYP1A2 Activity in Human Hepatocytes
Reference ID: 3648317

94
Table 4: The Effect of CXA-101 on CYP1A2 mRNA in Human Hepatocytes
Table 5: The Effect of CXA-101 on CYP3A4 Activity in Human Hepatocytes
Reference ID: 3648317

95
Table 6: The Effect of CXA-101 on CYP3A4 mRNA in Human Hepatocytes
SPONSOR’S CONCLUSIONS:The present study demonstrated that the treatment of human hepatocyte cultures with CXA-101 up to 1000 mcg/mL (nominal concentrations) did not cause in induction in CYP1A2 or CYP3A4 activity and mRNA expression under serum free conditions. At a concentration of 1000 mcg/mL, CXA-101 produced a moderate reduction of CYP1A2 activity and mRNA levels, and a reduction of CYP3A4 mRNA levels (but not enzymatic activity) in one of three donors. According to the Sponsor, the unbound (free) plasma Cmax of CXA-101 in patients with complicated urinary tract infections is ~46 mcg/mL. Therefore, 1000 mcg/mL is approximately 22-fold greater than the unbound Cmax in patients with urinary tract infections, making the clinical relevance of this find negligible.
REVIEWER ASSESSMENT:The Reviewer agrees with the Sponsor’s conclusions regarding the changes in enzymatic activity and mRNA levels of CYP1A2 and CYP3A4. The ability of CXA-101 to inhibit CYP1A2 and CYP3A4 activity was ultimately assessed in an in vivo drug interaction study (CXA-DDI-12-10).
Reference ID: 3648317
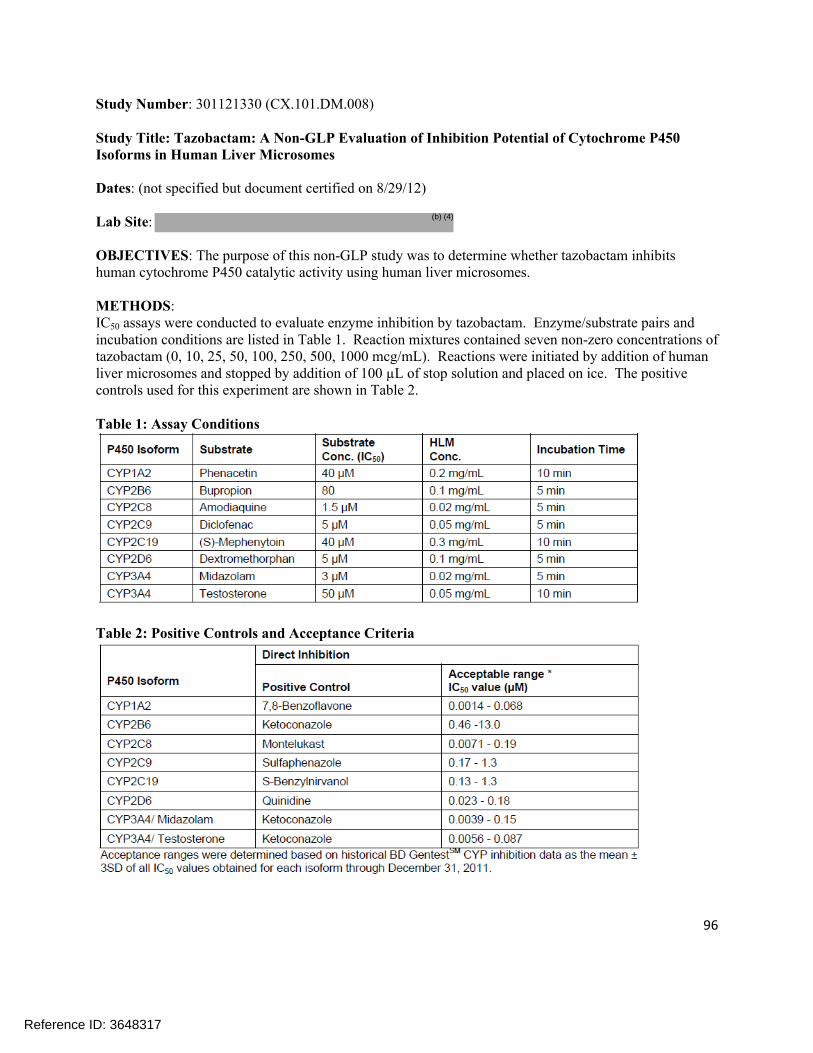
96
Study Number: 301121330 (CX.101.DM.008)
Study Title: Tazobactam: A Non-GLP Evaluation of Inhibition Potential of Cytochrome P450 Isoforms in Human Liver Microsomes
Dates: (not specified but document certified on 8/29/12)
Lab Site:
OBJECTIVES: The purpose of this non-GLP study was to determine whether tazobactam inhibits human cytochrome P450 catalytic activity using human liver microsomes.
METHODS: IC50 assays were conducted to evaluate enzyme inhibition by tazobactam. Enzyme/substrate pairs and incubation conditions are listed in Table 1. Reaction mixtures contained seven non-zero concentrations of tazobactam (0, 10, 25, 50, 100, 250, 500, 1000 mcg/mL). Reactions were initiated by addition of human liver microsomes and stopped by addition of 100 µL of stop solution and placed on ice. The positive controls used for this experiment are shown in Table 2.
Table 1: Assay Conditions
Table 2: Positive Controls and Acceptance Criteria
Reference ID: 3648317
(b) (4)
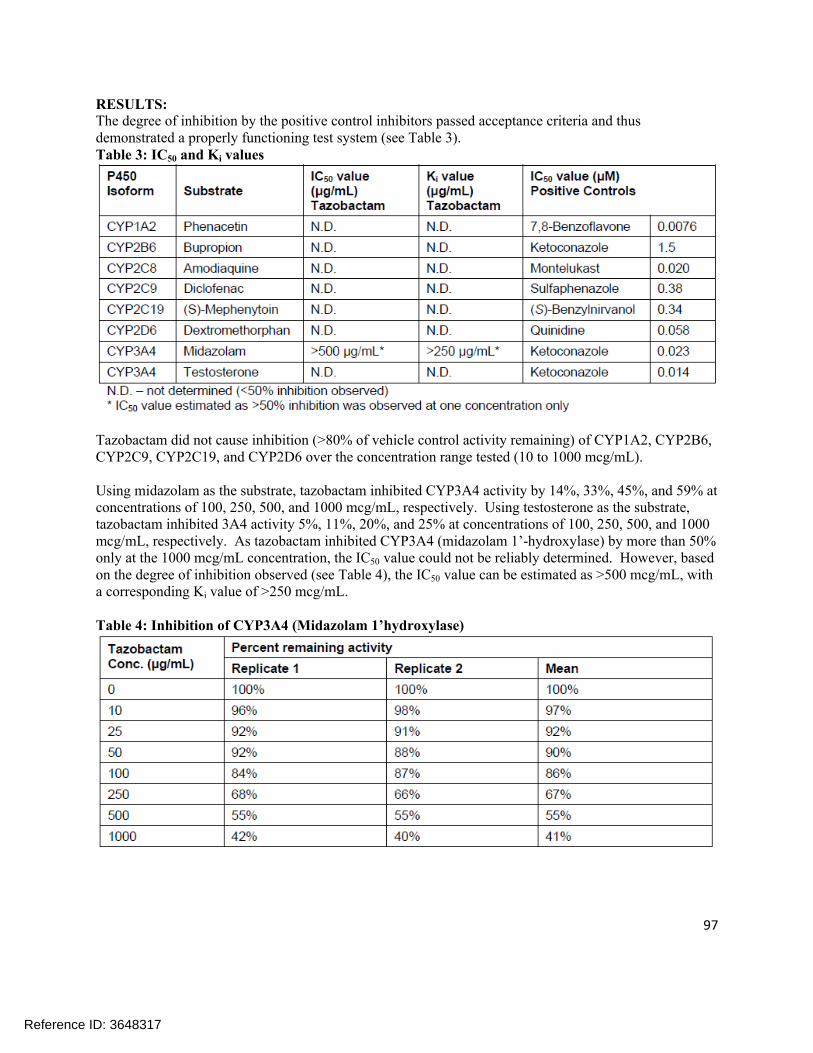
97
RESULTS: The degree of inhibition by the positive control inhibitors passed acceptance criteria and thus demonstrated a properly functioning test system (see Table 3).Table 3: IC50 and Ki values
Tazobactam did not cause inhibition (>80% of vehicle control activity remaining) of CYP1A2, CYP2B6, CYP2C9, CYP2C19, and CYP2D6 over the concentration range tested (10 to 1000 mcg/mL).
Using midazolam as the substrate, tazobactam inhibited CYP3A4 activity by 14%, 33%, 45%, and 59% at concentrations of 100, 250, 500, and 1000 mcg/mL, respectively. Using testosterone as the substrate, tazobactam inhibited 3A4 activity 5%, 11%, 20%, and 25% at concentrations of 100, 250, 500, and 1000 mcg/mL, respectively. As tazobactam inhibited CYP3A4 (midazolam 1’-hydroxylase) by more than 50% only at the 1000 mcg/mL concentration, the IC50 value could not be reliably determined. However, based on the degree of inhibition observed (see Table 4), the IC50 value can be estimated as >500 mcg/mL, with a corresponding Ki value of >250 mcg/mL.
Table 4: Inhibition of CYP3A4 (Midazolam 1’hydroxylase)
Reference ID: 3648317

98
SPONSOR’S CONCLUSIONS:Tazobactam did not cause inhibition (>80% of vehicle control activity remaining) of CYP1A2, CYP2B6, CYP2C8, CYP2C9, CYP2C19, and CYP2D6 over the concentration range tested (10 – 1000 mcg/mL).
Using midazolam as the substrate, tazobactam inhibited CYP3A4 activity by 14%, 33%, 45%, and 59% at concentrations of 100, 250, 500, and 1000 mcg/mL, respectively. Using testosterone as the substrate, tazobactam inhibited 3A4 activity 5%, 11%, 20%, and 25% at concentrations of 100, 250, 500, and 1000 mcg/mL, respectively. The IC50 value for the inhibition of CYP3A4 (midazolam 1’-hydroxylase) by tazobactam was estimated as > 500 mcg/mL, with a corresponding Ki value of > 250 mcg/mL.
According to the Sponsor, the mean total plasma Cmax of tazobactam in patients with intra-abdominal infections is ~ 22 mcg/mL. Together with the estimated Ki value of > 250 mcg/mL, this yields an R value of < 1.088 for inhibition of CYP3A4 by tazobactam and thus indicates that tazobactam is unlikely to cause clinically relevant CYP3A4 inhibition.
REVIEWER ASSESSMENT:The Reviewer agrees that tazobactam does not appear to show any inhibitory potential towards CYP1A2, CYP2B6, CYP2C8, CYP2C9, CYP2C19, or CYP2D6 at any of the concentration range tested. Tazobactam does show some inhibition of CYP3A4 at high concentrations; however, the concentration of tazobactam is unlikely to reach levels associated with significant inhibition of CYP3A4 (e.g. Cmax of tazobactam as reported in the proposed labeling is 18.0 mcg/mL). Therefore, the Reviewer agrees with the Sponsor’s assertion that the inhibition of CYP3A4 by tazobactam is not likely to be clinically relevant.
Reference ID: 3648317

99
Study Number: 301137476 (CX.101.DM.009)
Study Title: CXA-101: A Non-GLP Evaluation of Inhibition Potential of Cytochrome P450 Isoforms in Human Liver Microsomes
Date: (not specified but document certified on 3/25/13)
Lab Site:
OBJECTIVES: To evaluate the potential of CXA-101 at three concentrations (1000, 3000, and 6000mcg/mL) to inhibit human cytochrome P450 catalytic activity of 7 isoforms in vitro using human liver microsomes.
METHODS:IC50 assays were conducted to evaluate enzyme inhibition by CXA-101. Enzyme/substrate pairs and incubation conditions are listed in Table 1. Reaction mixtures contained CXA-101 (0 and 1000 mcg/mL in the initial assay, 0 and 3000 mcg/mL in the follow-up assay specified in Amendment #1, and 0 and 6000 mcg/mL in the follow-up assay specified in Amendment #2. Reactions were initiated by addition of human liver microsomes and stopped by addition of 100 µL stop solution and placement on ice. The positive control inhibitors used in this study are shown in Table 2.
Table 1: Assay Conditions
Reference ID: 3648317
(b) (4)
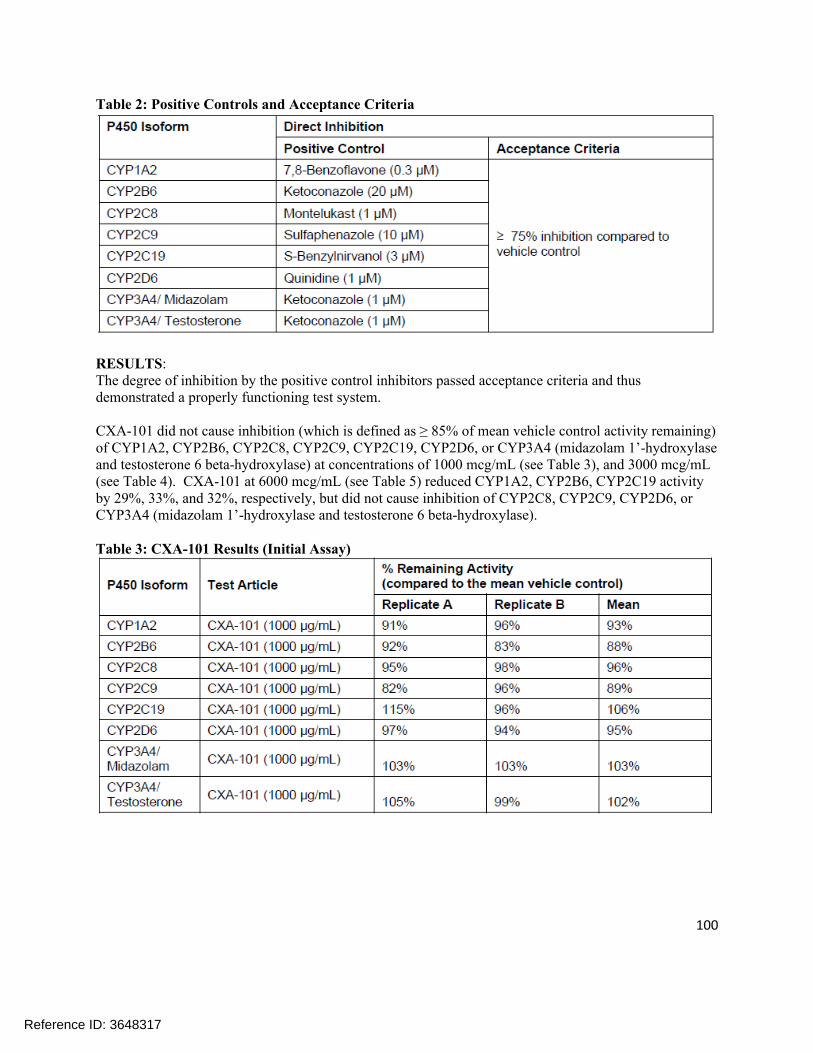
100
Table 2: Positive Controls and Acceptance Criteria
RESULTS:The degree of inhibition by the positive control inhibitors passed acceptance criteria and thus demonstrated a properly functioning test system.
CXA-101 did not cause inhibition (which is defined as ≥ 85% of mean vehicle control activity remaining) of CYP1A2, CYP2B6, CYP2C8, CYP2C9, CYP2C19, CYP2D6, or CYP3A4 (midazolam 1’-hydroxylase and testosterone 6 beta-hydroxylase) at concentrations of 1000 mcg/mL (see Table 3), and 3000 mcg/mL (see Table 4). CXA-101 at 6000 mcg/mL (see Table 5) reduced CYP1A2, CYP2B6, CYP2C19 activity by 29%, 33%, and 32%, respectively, but did not cause inhibition of CYP2C8, CYP2C9, CYP2D6, or CYP3A4 (midazolam 1’-hydroxylase and testosterone 6 beta-hydroxylase).
Table 3: CXA-101 Results (Initial Assay)
Reference ID: 3648317

101
Table 4: CXA-101 Results (Follow-up Assay per Study Protocol Amendment #1)
Table 5: CXA-101 Results (Follow-up Assay per Study Protocol Amendment #2)
SPONSOR’S CONCLUSIONSCXA-101 did not cause inhibition (≥ 85% of mean vehicle activity remaining) of CYP1A2, CYP2B6, CYP2C8, CYP2C9, CYP2C19, CYP2D6, or CYP3A4 (midazolam 1’-hydroxylase and testosterone 6 beta-hydroxylase) at concentrations of 1000 mcg/mL and 3000 mcg/mL. CXA-101 at 6000 mcg/mL reduced CYP1A2, CYP2B6, CYP2C19 activity by 29%, 33%, and 32%, respectively, but did not cause inhibition of CYP2C8, CYP2C9, CYP2D6, or CYP3A4 (midazolam 1’- hydroxylase and testosterone 6 beta-hydroxylase). The highest tested concentration of 6000 mcg/mL is ~105 fold above the mean total plasma Cmax of approximately 57 mcg/mL of CXA-101 in patients with cUTI and cIAI (unbound plasma Cmax of approximately 47 mcg/mL). Therefore, the current study results suggest that CXA-101 has low potential to cause clinically relevant inhibition of these enzymes in vivo.
The IC50 value for the inhibition of CYP1A2, CYP2B6, CYP2C8, CYP2C9, CYP2C19, CYP2D6, and CYP3A4 (midazolam 1’-hydroxylase and testosterone 6 beta-hydroxylase) by CXA-101 is estimated to
Reference ID: 3648317
102
be > 6000 mcg/mL, with a corresponding Ki value of >3000 mcg/mL. In vitro microsomal binding of CXA-101 at 1000 mcg/mL was 21% resulting in an unbound Ki of >2370 mcg/mL.
According to the Sponsor, the mean total plasma Cmax of CXA-101 in patients with cUTI and cIAI is ~57 mcg/mL, with plasma protein binding of approximately 20% resulting in mean unbound plasma Cmax of approximately 47 mcg/mL. The estimated Ki, unbound of >2370 mcg/mL (>50 fold the unbound Cmax of CXA-101), results in an R value of < 1.0244 (< threshold value of 1.1) indicating that CXA-101 has low potential to cause clinically relevant inhibition of these CYP isoforms in vivo.
REVIEWER ASSESSMENT:The Reviewer agrees with the Sponsor’s assessment that CXA-101 is not an inhibitor of CYP1A2, CYP2B6, CYP2C8, CYP2C9, CYP2C19, CYP2D6, or CYP3A4 at clinically relevant concentrations.
Reference ID: 3648317

103
Study Number: 301139470 (CX.101.DM.010)
Study Title: Tazobactam M-1: A Non-GLP Evaluation of Induction Potential of Cytochrome P450 Isoforms 1A2, 2B6, and 3A4 by Tazobactam M-1 in Cultured Cryopreserved Primary Human Hepatocytes.
Dates: 10/12/12 – 3/28/13
Lab Site:
OBJECTIVES: To evaluate the potential for the test article tazobactam M-1, the major metabolite of tazobactam, to induce cytochrome P450 (CYP) isoforms 1A2, 2B6, and 3A4 when cultured with cryopreserved, primary human hepatocytes for 72 hours. Induction was measured by catalytic activity and mRNA expression assays selective for CYP1A2, CYP2B6, and CYP3A4.
METHODS:Primary cultures of cryopreserved human hepatocytes (Lots 228, 307, and 321) were used for this study. Cryopreserved hepatocytes were incubated in serum-free medium containing tazobactam M-1 at nominal concentrations of 10, 30, 75, or 150 mcg/mL, a vehicle control for tazobactam M-1 (sodium phosphate), the positive control tamoxifen (at 50 µM), and a solvent control for tamoxifen (DMSO) in triplicate.
After treatment, the cell cultures were washed with serum free medium lacking the test materials and then incubated with P450 substrates in hepatocyte culture medium. The probe substrates, final substrate concentration, CYP450 enzyme tested, reaction catalyzed, and incubation times are shown in Table 1.
The mRNA expression for each CYP isoform was determined by Taqman Real Time RT-PCR methods. All CYP isoforms were performed under one-step assay. The positive control inducers for hepatocyte P450 enzymes are shown in Table 2.
Table 1: Enzyme Methods for CYP-Mediated Metabolite Formation
Reference ID: 3648317
(b) (4)
(b) (4)

104
Table 2: Positive Control Inducers
RESULTS:Effect of tazobactam M-1 on CYP1A2 activity and mRNA expressionThe potential for tazobactam M-1 to induce CYP1A2 was tested in serum free medium at nominal concentrations of 5, 30, and 75 mcg/mL by incubation with primary cultured human hepatocytes from three donors. The activity and the mRNA results are summarized in Table 3 and 4, respectively. Based upon the results of this study, tazobactam M-1 is not considered to be an inducer of CYP1A2 activity or mRNA expression at the concentrations tested.
Table 3: The Effect of Tazobactam M-1 on CYP1A2 Activity in Human Hepatocytes
Reference ID: 3648317

105
Table 4: The Effect of Tazobactam M-1 on CYP1A2 mRNA in Human Hepatocytes
Effect of tazobactam M-1 on CYP2B6 activity and mRNA expressionThe potential for tazobactam M-1 to induce CYP2B6 was tested in serum free medium at nominal concentrations of 5, 30, and 75 mcg/mL by incubation with primary cultured human hepatocytes from three donors. The activity and the mRNA results are summarized in Table 5 and 6, respectively. Based upon the results of this study, tazobactam M-1 is not considered to be an inducer of CYP2B6 activity or mRNA expression at the concentrations tested.
Reference ID: 3648317

106
Table 5: The Effect of Tazobactam M-1 on CYP2B6 Activity in Human Hepatocytes
Table 6: The Effect of Tazobactam M-1 on CYP2B6 mRNA in Human Hepatocytes
Effect of tazobactam M-1 on CYP3A4 activity and mRNA expressionThe potential for tazobactam M-1 to induce CYP3A4 was tested in serum free medium at nominal concentrations of 5, 30, and 75 mcg/mL by incubation with primary cultured human hepatocytes from
Reference ID: 3648317

107
three donors. The activity and the mRNA results are summarized in Table 7 and 8, respectively. Based upon the results of this study, tazobactam M-1 is not considered to be an inducer of CYP3A4 activity or mRNA expression at the concentrations tested.
Table 7: The Effect of Tazobactam M-1 on CYP3A4 Activity in Human Hepatocytes
Table 8: The Effect of Tazobactam M-1 on CYP3A4 mRNA in Human Hepatocytes
SPONSOR’S CONCLUSIONS:Tazobactam M-1, the major metabolite of tazobactam, demonstrated no potential to induce cytochrome P450 (CYP) isoforms CYP1A2, CYP2B6, or CYP3A4 as assessed by in situ catalytic activity and mRNA
Reference ID: 3648317

108
expression assays in cultured human hepatocytes from three donors up to a maximum concentration of 75mcg/mL. The concentration of 75 mcg/mL is approximately 50-fold greater than the mean unbound clinical Cmax of approximately 1.5 mcg/mL tazobactam M-1 observed in patients with cIAI. Tazobactam M-1 produced a concentration-dependent decrease in mRNA levels and enzyme activity across all doors for all three isoforms tested, suggesting a potential for down regulation. The clinical significance of the decrease in mRNA and corresponding decrease in the catalytic activity for these three CYP isoforms is unclear.
REVIEWER ASSESSMENT:The Reviewer agrees with the Sponsor’s conclusion that tazobactam M-1 does not demonstrate any potential to induce CYP1A2, CYP2B6, or CYP3A4 at either the mRNA level or the enzymatic activity level. On the contrary, with few exceptions, tazobactam M-1 shows a dose-dependent inhibition of CYP1A2, CYP2B6, and CYP3A4 at both the mRNA and enzymatic activity level. The inhibition was likely not significant at the most clinically relevant concentration studied (5 mcg/mL). The impact of tazobactam M-1 on CYP1A2 and CYP3A3 activity was indirectly evaluated in an in vivo drug interaction study (CXA-DDI-12-10).
Reference ID: 3648317

109
Study Number: 301139471 (CX.101.DM.011)
Study Title: Tazobactam M-1: A Non-GLP In Vitro Evaluation of Inhibition Potential of Seven Major Cytochrome P450 Isoforms in Human Liver Microsomes
Dates: (not specified but document certified on 3/13/13)
Lab Site:
OBJECTIVES: To evaluate the potential of the tazobactam M-1 metabolite, the major human metabolite of tazobactam, to inhibit seven major human cytochrome P450 (CYP) isoforms (CYP1A2, CYP2B6, CYP2C8, CYP2C9, CYP2C19, CYP2D6, and CYP3A) catalytic activity using 8 probe substrates in human liver microsomes.
METHODS:This study employed the use of pooled human liver microsomes. The IC50
assays were conducted to evaluate enzyme inhibition potential by the tazobactam M-1 metabolite. Enzyme/substrate pairs are listed in Table 1.
Reaction mixtures contained seven non-zero concentrations of the tazobactam M-1 metabolite (0, 2, 5, 10, 20, 35, 75, and 150 mcg/mL). Reactions were initiated by the addition of human liver microsomes and stopped by addition of 100 µL stop solution and placement on ice. The positive control inhibitors are shown in Table 2.
Table 1: Assay Conditions
Reference ID: 3648317
(b) (4)
(b) (4)

110
Table 2: Positive Controls, Acceptance Criteria and Results
RESULTS:All positive control inhibitors met the acceptance criteria, thus demonstrating a properly functioning testsystem. The IC50 values for Tazobactam M-1 were found to be greater than 150 mcg/mL for all enzymes examined (see Table 3).
Table 3: Summary of Results for Tazobactam M-1
SPONSOR’S CONCLUSION:Tazobactam M-1 did not inhibit CYP1A2, CYP2B6, CYP2C8, CYP2C9, CYP2C19, CYP2D6, and CYP3A4 (midazolam 1’-hydroxylase and testosterone 6-beta-hydroxylase) at unbound concentrations up to and including 150 mcg/mL (nominal; actual concentration 92% of nominal). Across enzymes, ≥ 76% of enzyme activity remained in the presence of tazobactam M-1 at concentrations up to and including 150 mcg/mL as compared to vehicle control. Based on these data, concentrations of tazobactam M-1 greater than 150 mcg/mL with corresponding Ki values of > 75 mcg/mL (assuming competitive inhibition) would be required to produce 50% inhibition of the CYP isoforms assessed.
According to the Sponsor, the mean total plasma Cmax of tazobactam M-1 in patients with cIAI is approximately 1.5 mcg/mL with minimal protein binding. Based on equations provided in the draft FDA guidance pertaining to drug-drug interaction, the calculated R value is 1.02 which is below the 1.1 threshold value that would signal investigation in vivo. These data indicate that tazobactam M-1 has low potential to cause clinically relevant inhibition of these CYP isoforms. These data indicate that tazobactam M-1 is unlikely to cause clinically relevant inhibition of these CYP isoforms and that clinical
Reference ID: 3648317
111
drug-drug interaction (DDI) studies with tazobactam M-1 are not required for the CYP isoforms investigated.
REVIEWER ASSESSMENT:The Reviewer agrees with the Sponsor’s conclusion that tazobactam M-1 is not likely to act as an inhibitor of any of the CYP isoforms tested.
Reference ID: 3648317

112
Study Number: 440000082 (CX.101.DM.013)
Study Title: CXA-101: A Non-GLP In Vitro Evaluation of Induction Potential of Cytochrome P450 Isoform 2B6 by CXA-101 in Cultured Cryopreserved Human Hepatocytes
Dates: 5/11/12 – 11/28/12
Lab Site:
OBJECTIVES: To determine the potential for CXA-101 to induce cytochrome P450 isoform CYP2B6 in plated primary cryopreserved human hepatocytes. Induction was measured by catalytic activity and mRNA expression assays selective for cytochrome P450 (CYP) isoform CYP2B6.
METHODS:The effect of CXA-101 upon CYP2B6 was assessed at concentrations of 100, 300, and 1000 mcg/mL using primary cryopreserved hepatocytes from three donors. CYP2B6 induction was assessed by measuring the catalytic activity of CYP2B6 using the probe substrate bupropion, and mRNA expression levels were determined with RT-PCR. Phenobarbital was used as a positive control inducer.
RESULTS:StabilityThe Sponsor assessed the stability of CXA-101 in hepatocyte media incubated at 37 °C for 6, 8, and 24 hours. Following 6 hours of incubation, 88.1% and 87.1% of CXA-101 remained when 100 mcg/mL and 1000 mcg/mL concentrations were incubated, respectively. Following 8 hours of incubation, 79.6% and 78.8% of CXA-101 remained when 100 mcg/mL and 1000 mcg/mL concentrations were incubated, respectively. Following 24 hours of incubation, 43.5% and 48.9% of parent CXA-101 remained when 100 mcg/mL and 1000 mcg/mL concentrations were incubated, respectively.
Effect of CXA-101 on CYP2B6 Activity and mRNA ExpressionThe potential for CXA-101 to induce CYP2B6 was tested in serum free medium at nominal concentrations of 100, 300, and 1000 mcg/mL with primary cultured human hepatocytes from three donors. The activity and mRNA results are summarized in Tables 1 and 2, respectively. Based upon the results of this study, CXA-101 is not considered to be an inducer of CYP2B6 activity and mRNA.
Reference ID: 3648317
(b) (4)
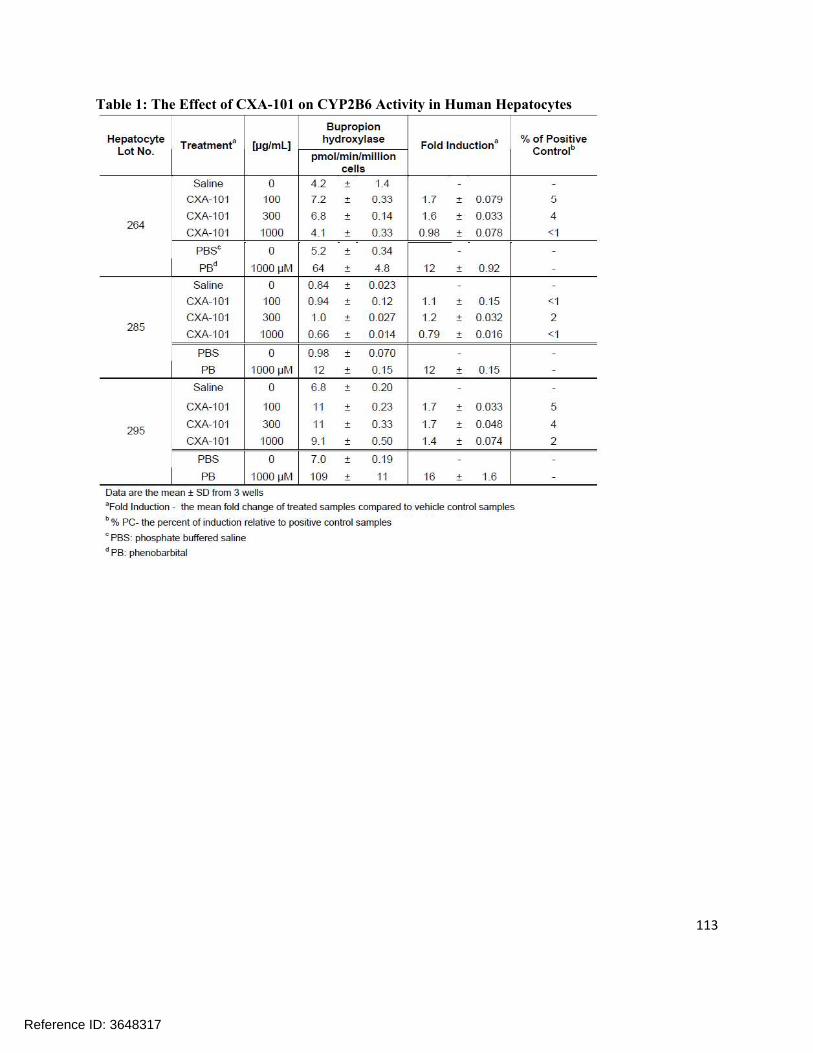
113
Table 1: The Effect of CXA-101 on CYP2B6 Activity in Human Hepatocytes
Reference ID: 3648317
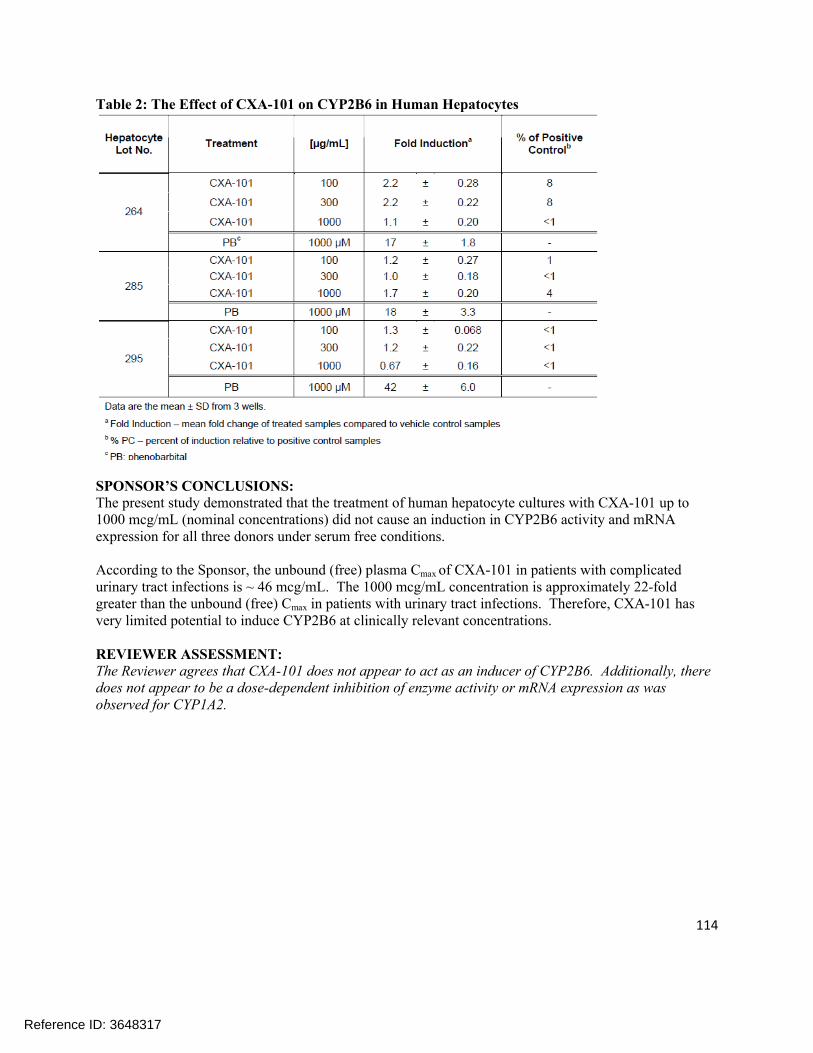
114
Table 2: The Effect of CXA-101 on CYP2B6 in Human Hepatocytes
SPONSOR’S CONCLUSIONS:The present study demonstrated that the treatment of human hepatocyte cultures with CXA-101 up to 1000 mcg/mL (nominal concentrations) did not cause an induction in CYP2B6 activity and mRNA expression for all three donors under serum free conditions.
According to the Sponsor, the unbound (free) plasma Cmax of CXA-101 in patients with complicated urinary tract infections is ~ 46 mcg/mL. The 1000 mcg/mL concentration is approximately 22-fold greater than the unbound (free) Cmax in patients with urinary tract infections. Therefore, CXA-101 has very limited potential to induce CYP2B6 at clinically relevant concentrations.
REVIEWER ASSESSMENT:The Reviewer agrees that CXA-101 does not appear to act as an inducer of CYP2B6. Additionally, there does not appear to be a dose-dependent inhibition of enzyme activity or mRNA expression as was observed for CYP1A2.
Reference ID: 3648317

115
Study Number: 440001850 (CX.101.DM.017)
Study Title: CXA-101: A Non-GLP In Vitro Evaluation of Time-Dependent Inhibition Potential of Cytochrome P450 Isoforms in Human Liver Microsomes
Dates: (not specified but document certified on 3/25/13)
Lab Site:
OBJECTIVES: To determine whether CXA-101 exhibits time-dependent inhibition of human cytochrome P450 (CYP) catalytic activity with seven CYP isoforms using human liver microsomes.
METHODS:This study was carried out using pooled human liver microsomes. IC50 shift assays were conducted to evaluate time-dependent enzyme inhibition by the test article. Enzyme-substrate pairs tested and incubation conditions are listed in Table 1.
Table 1: Assay Conditions (IC50 shift)
Pre-incubation reaction mixtures contained seven non-zero concentrations of test article (10, 50, 100, 500, 1000, 3000, and 6000 mcg/mL) and microsomal protein either with or without an NADPH-regenerating system (1.3 mM NADP+, 3.3 mM glucose-6-phosphate, 0.4 U/mL glucose-6-phosphate dehydrogenase, and 3.3 mM magnesium chloride) in 100 nM potassium phosphate (pH 7.4). Reactions were initiated by addition of human liver microsomes and incubated at 37 °C. After a 30 min pre-incubation time, a 40 µL (80 µL for CYP2C19) aliquot was transferred into a pre-warmed secondary reaction mixture containing the NADPH-regenerating system and the probe substrate in 100 mM potassium phosphate (pH 7.4). Reactions were incubated at 37 °C and stopped by addition of 100 µL stop solution and placement on ice.
The positive control inhibitors for time-dependent inhibition are shown in Table 2.
Reference ID: 3648317
(b) (4)
(b) (4)

116
Table 2: Positive Control Inhibitors, Acceptance Criteria and Results from this Study
RESULTS:JustificationInhibition and inactivation of cytochrome P450 enzyme catalytic activity are major mechanisms of metabolism-based drug interactions. Determination of IC50 shift or Ki/kinact values (for time- and NADPH-dependent inhibition), aids in the prediction of metabolism-based drug-drug interactions.
Time-dependent inhibitionThe inhibition of the positive control inhibitors met the acceptance criteria and thus demonstrated a properly functioning test system (see Table 2).
CXA-101 did not cause time-dependent inhibition of CYP1A2, CYP2B6, CYP2C8, CYP2C9, CYP2C19, CYP2D6, or CYP3A4 (midazolam 1’- hydroxylase and testosterone 6-beta-hydroxylase) at concentrations up to and including 6000 mcg/mL in the pre-incubation (see Table 3). No enhancement in enzyme inhibition was observed when CXA-101 was pre-incubated with NADPH as compared to the same incubations devoid of NADPH. Compared to solvent vehicle control, ≥46% of enzyme activity remained after pre-incubation of CXA-101 at concentrations up to 6000 mcg/mL, followed by a 5 to 10-fold dilution into the secondary incubation with the enzymes tested. Only one enzyme, CYP2C8, was inhibited by more than 50%; however, this occurred only in the absence of NADPH. Less extensive inhibition (up to 22%) was observed in the presence of NADPH. The reason for this is unknown.
Collectively, these data suggest that there is a low risk of drug interactions in patients that is attributable to time-dependent inhibition of the seven enzymes tested in this study.
Reference ID: 3648317

117
Table 3: Time-dependent inhibition IC50 values
SPONSOR’S CONCLUSIONS:CXA-101 demonstrated no potential to cause time-dependent inhibition of cytochrome P450 (CYP) isoforms CYP1A2, CYP2B6, CYP2C8, CYP2C9, CYP2C19, CYP2D6, or CYP3A4 (midazolam 1’-hydroxylase and testosterone 6-beta-hydroxylase) at concentrations up to and including 6000 mcg/mL in this in vitro non-GLP study. The highest tested concentration of 6000 mcg/mL is ~105-fold above the mean total plasma Cmax of approximately 57 mcg/mL of CXA-101 in patients with complicated urinary tract infections (cUTI) and complicated intra-abdominal infections (cIAI) (unbound Cmax of approximately 47 mcg/mL). Therefore, the current study results suggest that CXA-101 has low potential to cause clinically relevant time-dependent inhibition of these enzymes in vivo.
No enhancement in apparent enzyme inhibition was observed when CXA-101 was pre-incubated with NADPH as compared to incubations devoid of NADPH. Compared to solvent vehicle control, the percent of CYP1A2, CYP2B6, CYP2C8, CYP2C9, CYP2C19, CYP2D6, and CYP3A4 enzyme activity remaining after pre-incubation of CXA-101 ranged from 77 to 100% at concentrations up to 6000 mcg/mL. CYP2C8 was inhibited by more than 50% at the highest tested concentration of 6000 mcg/mL; however, this effect only occurred in the absence of NADPH. In the presence of NADPH, 78% activity remained and hence it was concluded that CXA-101 did not cause time-dependent inhibition of CYP2C8.
According to the Sponsor, the mean total plasma Cmax of CXA-101 in patients with cUTI and cIAI is approximately 57 mcg/mL with a plasma protein binding value of approximately 20% resulting in unbound Cmax of approximately 47 mcg/mL. The Sponsor also reported that microsomal binding of CXA-101 is low [21% at 1000 mcg/mL and hence not included to calculate CXA-101 unbound incubation concentrations]. Therefore, the highest tested concentration of 6000 mcg/mL was approximately 105-fold higher than the total plasma Cmax of CXA-101 in patients. Collectively, these data suggest that CXA-101 has low potential to cause clinically relevant time-dependent inhibition of these seven enzymes in vivo.
Reference ID: 3648317

118
REVIEWER ASSESSMENT:The Reviewer concurs with the Sponsor’s assessment that there is a low potential for time-dependent inhibition of the CYP450 isoforms tested due to CXA-101.
Reference ID: 3648317
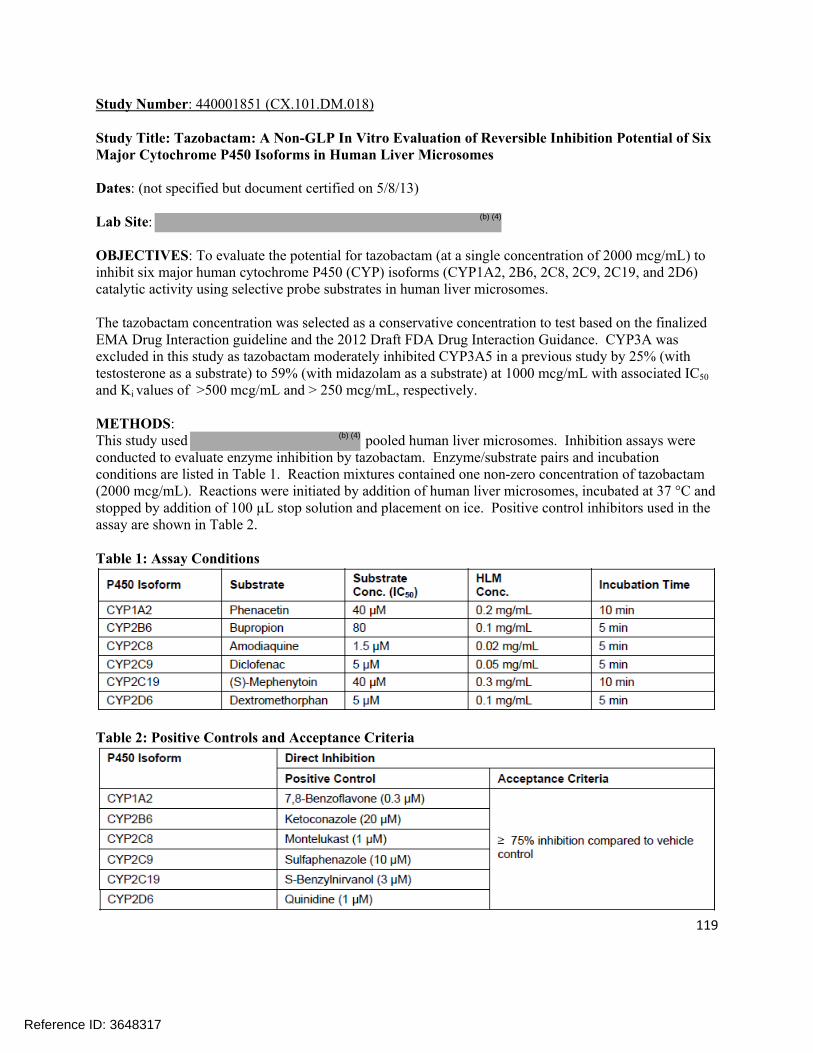
119
Study Number: 440001851 (CX.101.DM.018)
Study Title: Tazobactam: A Non-GLP In Vitro Evaluation of Reversible Inhibition Potential of Six Major Cytochrome P450 Isoforms in Human Liver Microsomes
Dates: (not specified but document certified on 5/8/13)
Lab Site:
OBJECTIVES: To evaluate the potential for tazobactam (at a single concentration of 2000 mcg/mL) to inhibit six major human cytochrome P450 (CYP) isoforms (CYP1A2, 2B6, 2C8, 2C9, 2C19, and 2D6) catalytic activity using selective probe substrates in human liver microsomes.
The tazobactam concentration was selected as a conservative concentration to test based on the finalized EMA Drug Interaction guideline and the 2012 Draft FDA Drug Interaction Guidance. CYP3A was excluded in this study as tazobactam moderately inhibited CYP3A5 in a previous study by 25% (with testosterone as a substrate) to 59% (with midazolam as a substrate) at 1000 mcg/mL with associated IC50
and Ki values of >500 mcg/mL and > 250 mcg/mL, respectively.
METHODS:This study used pooled human liver microsomes. Inhibition assays were conducted to evaluate enzyme inhibition by tazobactam. Enzyme/substrate pairs and incubation conditions are listed in Table 1. Reaction mixtures contained one non-zero concentration of tazobactam (2000 mcg/mL). Reactions were initiated by addition of human liver microsomes, incubated at 37 °C and stopped by addition of 100 µL stop solution and placement on ice. Positive control inhibitors used in the assay are shown in Table 2.
Table 1: Assay Conditions
Table 2: Positive Controls and Acceptance Criteria
Reference ID: 3648317
(b) (4)
(b) (4)

120
RESULTS:The results for the evaluation of reversible inhibition by tazobactam are shown in Table 3. The percent remaining activity for all enzymes was 62% or greater, relative to vehicle control. All positive control inhibitors met the acceptance criteria of >75% inhibition.
Table 3: Reversible Inhibition by Tazobactam Results
SPONSOR’S CONCLUSIONS:Tazobactam demonstrated no potential to inhibit CYP450 isoforms 1A2, 2B6, 2C8, 2C9, 2C19, or 2D6 at a single concentration of 2000 mcg/mL in this study. The tested concentration of 2000 mcg/mL is approximately 90-fold above the mean total plasma Cmax of ~22 mcg/mL of tazobactam in patients with cIAI (unbound plasma Cmax of approximately 15.4 mcg/mL) suggesting low potential to cause clinically relevant inhibition of these enzymes in vivo.
The IC50 value for the inhibition of CYP 1A2, 2B6, 2C8, 2C9, 2C19, or 2D6 by tazobactam were all estimated as >2000 mcg/mL, with a corresponding Ki value of >1000 mcg/mL. In a previous study (CX.101.DM.008), tazobactam did not cause inhibition (>80% of vehicle control activity remaining) of these isoforms over the concentration range tested (10 to 1000 mcg/mL). In this previous study, tazobactam inhibited CYP3A4 by 25% (testosterone as substrate) to 59% (midazolam as substrate) at 1000 mcg/mL with associated IC50 and Ki values of >500 mcg/mL and >250 mcg/mL, respectively. In vitro microsomal binding of tazobactam at 500 mcg/mL was practically negligible (7.8% binding – see CX.101.DM.014).
According to the Sponsor, the mean total plasma Cmax of tazobactam in patients with cIAI is approximately 22 mcg/mL with a protein binding value of approximately 30% resulting in mean unbound plasma Cmax of approximately 15.4 mcg/mL. Together with the estimated Ki, unbound value of > 1000 mcg/mL (>50-fold the unbound Cmax of tazobactam), this yields an R value of <1.02 (below the FDA-recommended threshold value of 1.1) for inhibition of CYP1A2, CYP2B6, CYP2C8, CYP2C9, CYP2C19, and CYP2D6 by tazobactam and thus indicates that tazobactam is unlikely to cause clinically relevant inhibition of these enzymes in vivo.
Reference ID: 3648317
121
REVIEWER ASSESSMENT:The Reviewer agrees with the Sponsor’s conclusion that tazobactam is not likely to inhibit any of the tested CYP450 isoforms.
Reference ID: 3648317
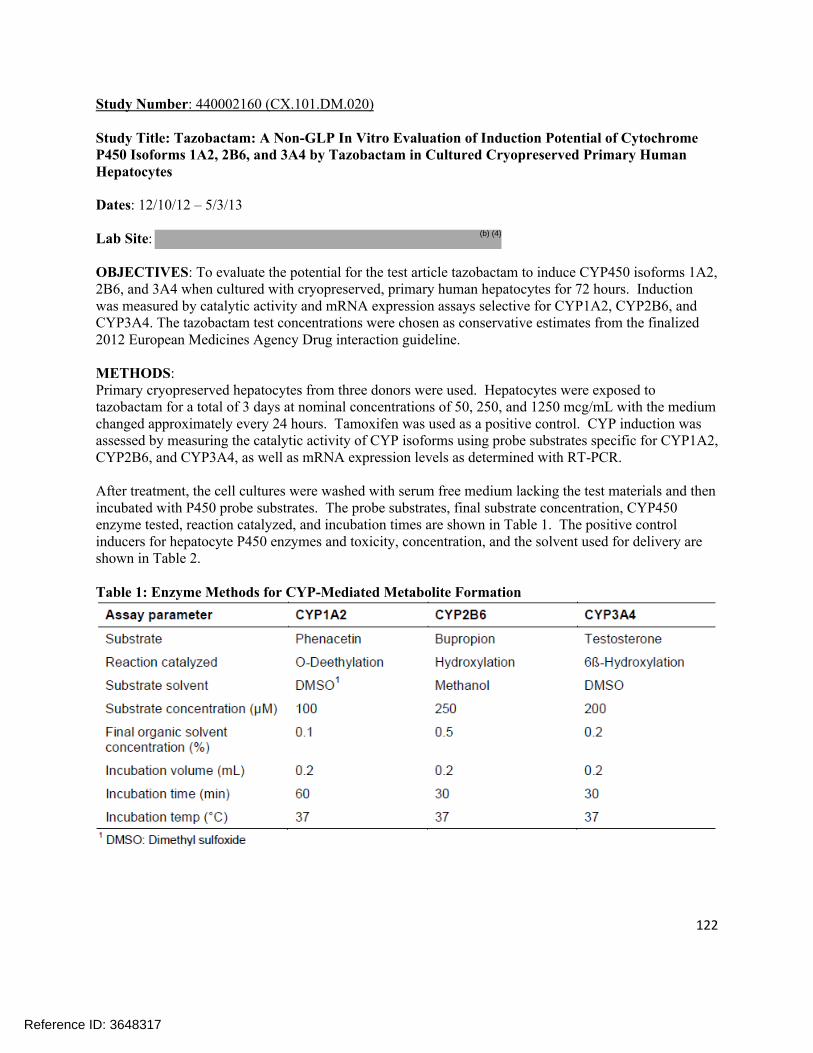
122
Study Number: 440002160 (CX.101.DM.020)
Study Title: Tazobactam: A Non-GLP In Vitro Evaluation of Induction Potential of Cytochrome P450 Isoforms 1A2, 2B6, and 3A4 by Tazobactam in Cultured Cryopreserved Primary Human Hepatocytes
Dates: 12/10/12 – 5/3/13
Lab Site:
OBJECTIVES: To evaluate the potential for the test article tazobactam to induce CYP450 isoforms 1A2, 2B6, and 3A4 when cultured with cryopreserved, primary human hepatocytes for 72 hours. Induction was measured by catalytic activity and mRNA expression assays selective for CYP1A2, CYP2B6, and CYP3A4. The tazobactam test concentrations were chosen as conservative estimates from the finalized 2012 European Medicines Agency Drug interaction guideline.
METHODS:Primary cryopreserved hepatocytes from three donors were used. Hepatocytes were exposed to tazobactam for a total of 3 days at nominal concentrations of 50, 250, and 1250 mcg/mL with the medium changed approximately every 24 hours. Tamoxifen was used as a positive control. CYP induction was assessed by measuring the catalytic activity of CYP isoforms using probe substrates specific for CYP1A2, CYP2B6, and CYP3A4, as well as mRNA expression levels as determined with RT-PCR.
After treatment, the cell cultures were washed with serum free medium lacking the test materials and then incubated with P450 probe substrates. The probe substrates, final substrate concentration, CYP450enzyme tested, reaction catalyzed, and incubation times are shown in Table 1. The positive control inducers for hepatocyte P450 enzymes and toxicity, concentration, and the solvent used for delivery are shown in Table 2.
Table 1: Enzyme Methods for CYP-Mediated Metabolite Formation
Reference ID: 3648317
(b) (4)

123
Table 2: Positive Control Inducers
RESULTS:Effect of tazobactam on CYP1A2 activity and mRNA expressionThe potential for tazobactam to induce CYP1A2 was tested in serum free medium at nominal concentrations of 50, 250, and 1250 mcg/mL, with primary cultured human hepatocytes from three donors. The activity and mRNA results are summarized in Tables 3 and 4, respectively. Based upon the results of this study, tazobactam is not considered to be an inducer of CYP1A2 activity or mRNA expression at the concentrations tested.
Table 3: The Effect of Tazobactam on CYP1A2 Activity in Human Hepatocytes
Reference ID: 3648317
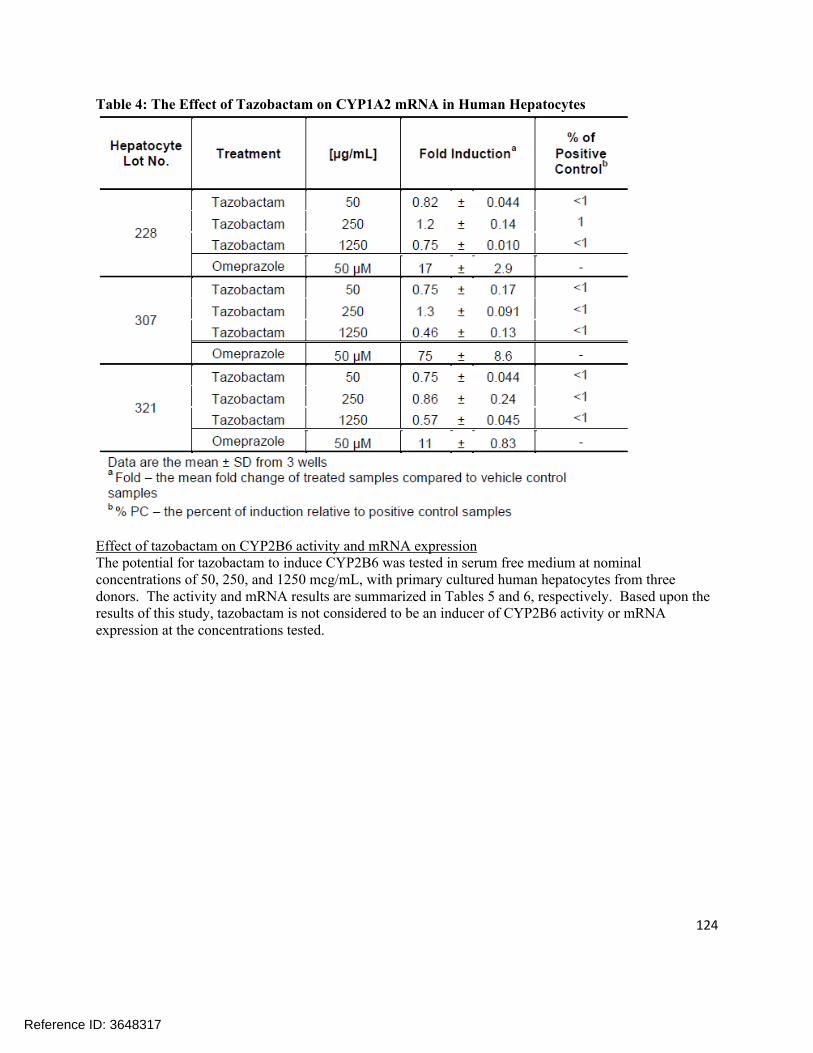
124
Table 4: The Effect of Tazobactam on CYP1A2 mRNA in Human Hepatocytes
Effect of tazobactam on CYP2B6 activity and mRNA expressionThe potential for tazobactam to induce CYP2B6 was tested in serum free medium at nominal concentrations of 50, 250, and 1250 mcg/mL, with primary cultured human hepatocytes from three donors. The activity and mRNA results are summarized in Tables 5 and 6, respectively. Based upon the results of this study, tazobactam is not considered to be an inducer of CYP2B6 activity or mRNA expression at the concentrations tested.
Reference ID: 3648317

125
Table 5: The Effect of Tazobactam on CYP2B6 Activity in Human Hepatocytes
Reference ID: 3648317
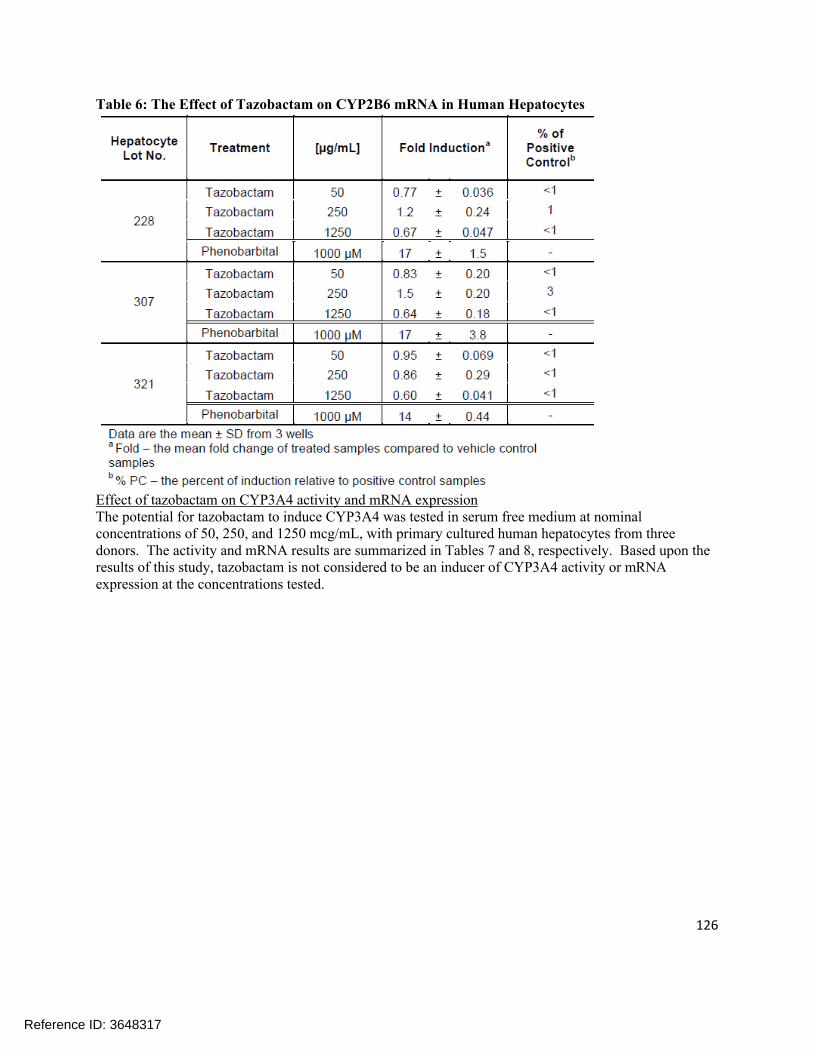
126
Table 6: The Effect of Tazobactam on CYP2B6 mRNA in Human Hepatocytes
Effect of tazobactam on CYP3A4 activity and mRNA expressionThe potential for tazobactam to induce CYP3A4 was tested in serum free medium at nominal concentrations of 50, 250, and 1250 mcg/mL, with primary cultured human hepatocytes from three donors. The activity and mRNA results are summarized in Tables 7 and 8, respectively. Based upon the results of this study, tazobactam is not considered to be an inducer of CYP3A4 activity or mRNA expression at the concentrations tested.
Reference ID: 3648317

127
Table 7: The Effect of Tazobactam on CYP3A4 Activity in Human Hepatocytes
Reference ID: 3648317

128
Table 8: The Effect of Tazobactam on CYP3A4 mRNA in Human Hepatocytes
SPONSOR’S CONCLUSIONS:Tazobactam demonstrated no potential to induce cytochrome P450 isoforms CYP1A2, CYP2B6, or CYP3A4 as assessed by in situ catalytic activity and mRNA expression assays in cultured human hepatocytes in this study. Tazobactam was tested at concentrations up to and including 1250 mcg/mL in hepatocytes obtained from three separate donors. The top concentration of 1250 mcg/mL of tazobactam is approximately 81-fold greater than the mean unbound Cmax of approximately 15.4 mcg/mL observed in patients with cIAI. Tazobactam at the highest tested concentration of 1250 mcg/mL decreased CYP1A2 and CYP2B6 mRNA levels as well as enzyme activity as compared to vehicle control. mRNA levels were 0.46- to 0.75-fold that of vehicle control for CYP1A2 and 0.60- to 0.67-fold that of vehicle control for CYP2B6 across the three donors assessed. Enzyme activity was 0.63 to 0.75-fold that of vehicle control for CYP1A2 and 0.65- to 0.74 fold that of vehicle control for CYP2B6 across the three donors assessed. Tazobactam at a concentration of 1250 mcg/mL decreased CYP3A4 mRNA levels as compared to vehicle control without producing a decrease in CYP3A4 activity; mRNA levels were 0.44- to 0.71-fold that of vehicle control. In a previous study, tazobactam caused no induction of CYP1A2, CYP2B6, or CYP3A4 activity or mRNA expression when tested at concentrations up to a nominal concentration of 500 mcg/mL for all three donors. The clinical significance of the decreases in mRNA for these three CYP isoforms and decreases in catalytic activity for CYP1A2 and CYP2B6 in the current study is unclear as these effects were only observed at supra-therapeutic concentrations.
REVIEWER ASSESSMENT:The Reviewer agrees with the Sponsor’s conclusion that tazobactam is not a significant inducer of enzyme activity or mRNA expression. There is some evidence of inhibition of inhibition of enzyme activity and mRNA levels at the highest concentration tested for tazobactam. The ability of tazobactam to inhibit CYP1A2 and CYP3A4 activity was ultimately assessed in an in vivo drug interaction study (CXA-DDI-12-10).
Reference ID: 3648317

129
Study Number: 440002161 (CX.101.DM.021)
Study Title: CXA-101: A Non-GLP In Vitro Evaluation of Induction Potential of Cytochrome P450 Isoform 2B6 by CXA-101 in Cultured Cryopreserved Primary Human Hepatocytes
Dates: 12/10/12 – 5/3/13
Lab Site:
OBJECTIVES: To evaluate the potential for the test article, CXA-101, to induce cytochrome P450 isoform CYP2B6 when cultured with cryopreserved primary human hepatocytes for 72 hours. Induction was measured by a catalytic activity assay selective for CYP2B6 as well as mRNA using RT-PCR. The CXA-101 test concentrations were chosen as conservative estimates from the finalized 2012 EMA Drug Interaction guideline and the 2012 Draft FDA Drug Interaction Guidance.
METHODS:Primary cultures of cryopreserved human hepatocytes were used for this study. Cryopreserved hepatocytes were incubated in hepatocyte culture medium containing CXA-101 at nominal concentrations of 100, 500, or 1000 mcg/mL, a vehicle control for CXA-101 (saline), a single concentration of positive control inducer (phenobarbital), and vehicle control for the inducer (DMSO). The mRNA expression for CYP2B6 was determined by Taqman Real Time RT-PCR methods.
RESULTS:Effect of CXA-101 on CYP2B6 Activity and mRNA ExpressionThe potential for CXA-101 to induce CYP2B6 was tested in serum free medium at nominal concentrations of 100, 500, and 1000 mcg/mL, with primary cultured human hepatocytes from three donors. The activity and mRNA results are summarized in Tables 1 and 2, respectively. Based upon the results of this study, CXA-101 is not considered to be an inducer of CYP2B6 activity or mRNA expression at the concentrations tested.
Reference ID: 3648317
(b) (4)

130
Table 1: The Effect of CXA-101 on CYP2B6 Activity in Human Hepatocytes
Table 2: The Effect of CXA-101 on CYP2B6 mRNA in Human Hepatocytes
Reference ID: 3648317

131
SPONSOR’S CONCLUSIONS:CXA-101 demonstrated no potential to induce the cytochrome P450 isoform CYP2B6 as assessed by in situ catalytic activity and mRNA expression assays using cultured human hepatocytes from three donors, up to a maximum concentration of 1000 mcg/mL in this study. According to the Sponsor, the highest tested concentration of 1000 mcg/mL is approximately 21-fold above the mean unbound plasma Cmax of approximately 47 mcg/mL of CXA-101 in patients with cUTI and cIAI (total plasma Cmax of approximately 57 mcg/mL). CXA-101 treatment, at supratherapeutic concentrations, was associated with a decrease in CYP2B6 mRNA levels in two donors and a decrease in enzyme activity in three donors. In a previous study (CX.101.DM.013), CXA-101 did not cause induction of CYP2B6 across three donors at nominal concentrations up to and including 1000 mcg/mL. The clinical significance of the decrease in mRNA levels and catalytic activity for CYP2B6 in the current study is unclear.
REVIEWER ASSESSMENT:The Reviewer agrees that CXA-101 did not show any potential for induction of CYP2B6 in this study and that there is some evidence for inhibition of both enzymatic activity and mRNA expression at a concentration of 1000 mcg/mL.
Reference ID: 3648317

132
Study Number: CXA101-P-001
Study Title: In Vitro Evaluation of CXA-101 as a Direct Inhibitor of Human Cytochrome P450 Enzymes
Dates: 4/9/08 (report date)
Lab Site:
OBJECTIVES: To evaluate the ability of CXA-101 to directly inhibit the major CYP enzymes in human liver microsomes, with the aim of ascertaining the potential for CXA-101 to inhibit the metabolism of other drugs.
METHODS:Human liver microsomes from donated livers were prepared and characterized by the Testing Facility. A pool of sixteen individual mixed gender, human liver microsomal samples was used for this study. CXA-101 was evaluated for its ability to directly inhibit the following human CYP enzymes (see Table 1): CYP1A2, CYP2B6, CYP2C8, CYP2C9, CYP2C19, CYP2D6, and CYP3A4/5. The positive controls that were used in this study are shown in Table 2.
Table 1: Summary of experimental conditions for enzyme assays: direct inhibition of CYP enzymes by CXA-101 (IC50 determinations)
Table 2: Positive Controls
Reference ID: 3648317
(b) (4)

133
RESULTS:Under the experimental conditions examined, there was little or no evidence of direct inhibition by CXA-101 for any of the CYP enzymes investigated (see Table 3). The IC50 values for these enzymes were determined to be greater than the highest concentration tested (i.e. 300 µM).
Table 3: Summary of results: In vitro evaluation of CXA-101 as an inhibitor of human CYP enzymes
SPONSOR’S CONCLUSIONS: Under the experimental conditions examined, there was little or no evidence of direct inhibition
of CYP1A2, CYP2B6, CYP2C8, CYP2C9, CYP2C19, CYP2D6, and CYP3A4 (as measured by testosterone 6-beta-hydroxylation and midazolam 1’-hydroxylation) by CXA-101.
The IC50 values for these enzymes were determined to be greater than 300 µM (the highest concentration tested).
REVIEWER ASSESSMENT:The Reviewer concurs that CXA-101 did not show any potential for direct inhibition of CYP isoforms within the concentration range tested in this study.
Reference ID: 3648317

134
Study Number: -05Aug2011 (CX.101.DM.004)
Study Title: CXA-101: A Non-GLP In Vitro Assessment of Inhibitor Potential on Human OAT1, OAT3, OCT1, OCT2, OATP1B1, and OATP1B3 Uptake Transporters
Dates: 3/30/12 (date issued)
Lab Site:
OBJECTIVES: To evaluate the in vitro inhibitory potential of CXA-101 upon the human OAT1, OAT3, OCT1, OCT2, OATP1B1, and OATP1B3 transporters in the uptake transporter inhibition assay.
METHODS:Uptake experiments were performed on CHO cells or HEK293 cells stably expressing the respective uptake/SLC transporters. For human OATP1B1, OATP1B3, OCT, OCT2, OAT1, and OAT3 parental cell lines were used as a negative control. The treatment groups for the transporter assays are shown in Table 1.
Table 1: Treatment groups in uptake transporter assays
RESULTS:In the present study, the in vitro interaction potential of CXA-101 with the human OATP1B1, OATP1B3, OAT1, OAT3, OCT1, and OCT2 uptake transporters was investigated at 7 concentrations (see Table 1) in uptake transporter inhibition assays.
CXA-101 showed no potential inhibitory interaction against the human OAT1, OAT3, OCT1, OCT2, OATP1B1, or OATP1B3 transporters when tested in vitro at concentrations up to 500 mcg/mL. A slight inhibition (15% to 36) was observed at 1000 mcg/mL for OATP1B3, OAT1, OCT2, and OCT1 while no inhibition was observed with OATP1B1 and OAT3. Consequently, IC50 values could not be determined.
The OATP1B1 and OATP1B3 transporter activities were slightly stimulated by CXA-101 with maximum stimulations of 18% and 15% at 125 mcg/mL for OATP1B1 and OATP1B3, respectively. In the case of
Reference ID: 3648317
(b) (4)
(b) (4)
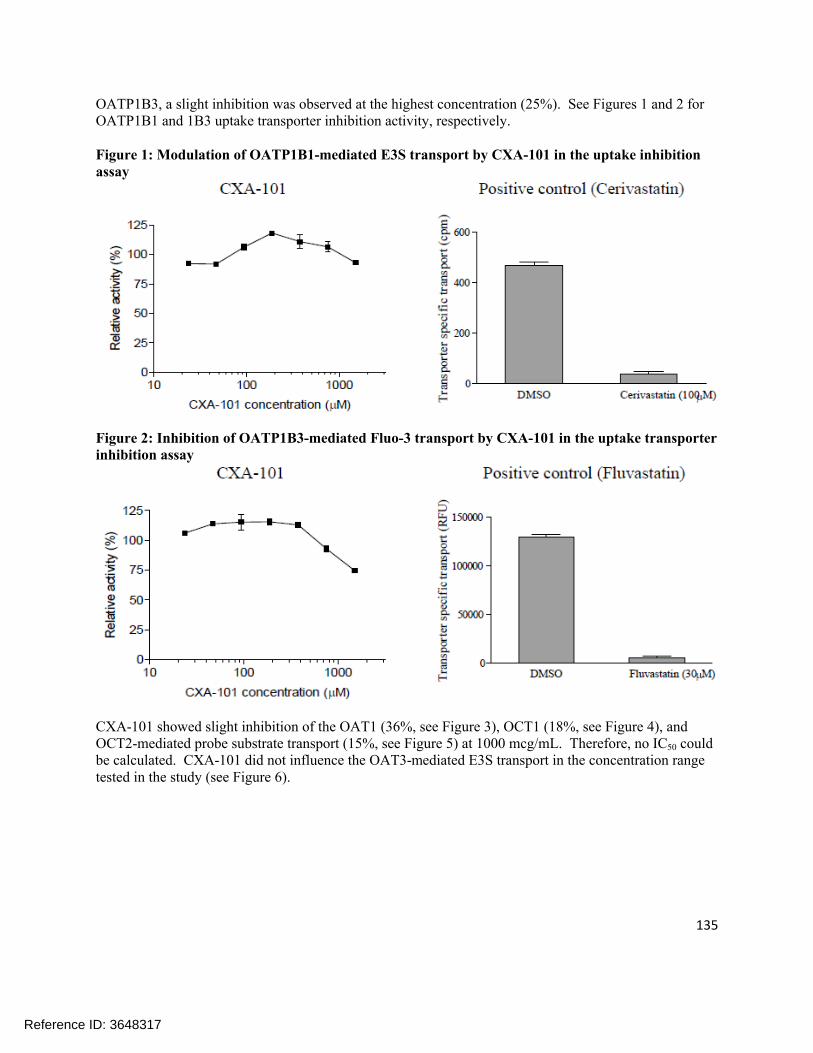
135
OATP1B3, a slight inhibition was observed at the highest concentration (25%). See Figures 1 and 2 for OATP1B1 and 1B3 uptake transporter inhibition activity, respectively.
Figure 1: Modulation of OATP1B1-mediated E3S transport by CXA-101 in the uptake inhibition assay
Figure 2: Inhibition of OATP1B3-mediated Fluo-3 transport by CXA-101 in the uptake transporter inhibition assay
CXA-101 showed slight inhibition of the OAT1 (36%, see Figure 3), OCT1 (18%, see Figure 4), and OCT2-mediated probe substrate transport (15%, see Figure 5) at 1000 mcg/mL. Therefore, no IC50 could be calculated. CXA-101 did not influence the OAT3-mediated E3S transport in the concentration range tested in the study (see Figure 6).
Reference ID: 3648317

136
Figure 3: Inhibition of OAT1-mediated PAH transport by CXA-101 in the uptake transporter inhibition assay
Figure 4: Inhibition of OCT1-mediated TEA transport by CXA-101 in the uptake transporter inhibition assay
Reference ID: 3648317

137
Figure 5: Inhibition of OCT2-mediated metformin transport by CXA-101 in the uptake transporter inhibition assay
Figure 6: Effect of OAT3-mediated E3S transport by CXA-101 in the uptake transporter inhibition assay
SPONSOR’S CONCLUSION:In this non-GLP study, CXA-101 showed no potential inhibitory interaction against the human OAT1, OAT3, OCT1, OCT2, OATP1B1, or OATP1B3 transporters when tested in vitro at concentrations up to 500 mcg/mL. A 15% to 36% inhibition was observed for OATP1B3, OAT1, OCT2, and OCT1, and no inhibition was observed for OATP1B1 or OAT2 was observed at 1000 mcg/mL. Thus, IC50 values could not be determined. Based on the recommendation of the International Transporter Consortium, in vivo DDI studies should be considered if the IC50 value is less than 10-fold the unbound Cmax value. Because the highest anticipated unbound clinical concentrations of CXA-101 is between 50 and 100 mcg/mL and IC50 values could not be determined up to 1000 mcg/mL (or can be estimated to be above 1000 mcg/mL), the results of this study indicate that clinical DDI studies with CXA-101 are not recommended for the uptake transporters investigated.
Reference ID: 3648317

138
REVIEWER ASSESSMENT:The Reviewer agrees that CXA-101 is unlikely to significantly inhibit any of the transporters tested in this assay.
Reference ID: 3648317

139
Study Number: CX.101.DM.006
Study Title: Tazobactam: A Non-GLP In Vitro Assessment of Inhibitor Potential on Human OAT1, OAT3, OCT1, OCT2, OATP1B1, and OATP1B3 and of Substrate Potential on Human OAT1, OAT3, and OCT2 Uptake Transporters
Dates: 5/24/13 (amended date)
Lab Sites:
OBJECTIVES: To evaluate the inhibitory effect of tazobactam on the human OAT1, OAT3, OCT1, OCT2,
OATP1B1, and OATP1B3 transporters in the uptake transporter inhibition assays and To evaluate the substrate potential of tazobactam for OAT1, OAT3, and OCT2 transporters in the
uptake transporter substrate assays
METHODS:Uptake experiments were performed on CHO cells or HEK293 with FlpIn technology cells stably expressing the respective uptake transporters. Cells were plated on standard 96- or 24-well tissue culture plates. For human OATP1B1, OATP1B3, OCT1, OCT2, OAT1, and OAT3 parental cell lines were used as negative controls. The probe substrates and inhibitors for each transporter are shown in Table 1. The concentrations of tazobactam used in the inhibition assays are shown in Table 2.
The uptake of tazobactam was determined using cells overexpressing the respective uptake transporter and using control cells at two incubation time points (2 and 20 min) and at two concentrations (5 and 50 mcg/mL or 25 and 100 mcg/mL) of the test drug. In order to confirm the interaction, the transporter specific uptake of tazobactam was determined in the presence of a known inhibitor.
Table 1: Parameters of Uptake Transporter Assays Tested in a Concentration Range
Reference ID: 3648317
(b) (4)
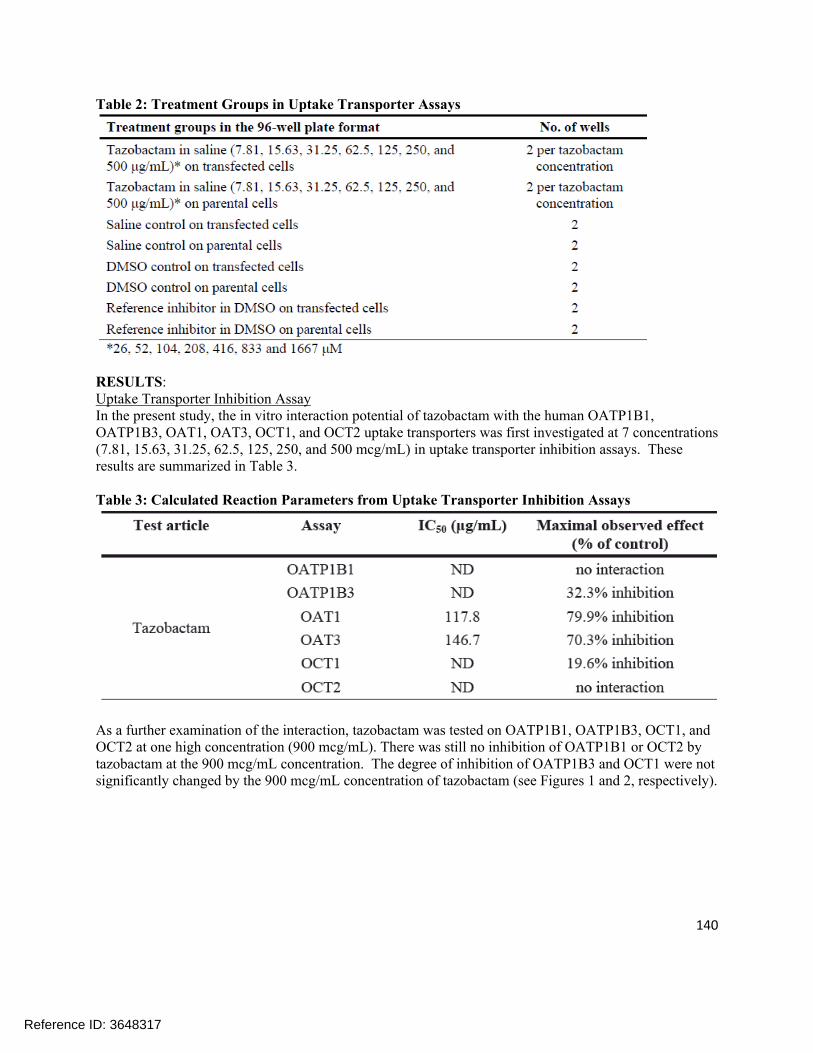
140
Table 2: Treatment Groups in Uptake Transporter Assays
RESULTS:Uptake Transporter Inhibition AssayIn the present study, the in vitro interaction potential of tazobactam with the human OATP1B1, OATP1B3, OAT1, OAT3, OCT1, and OCT2 uptake transporters was first investigated at 7 concentrations (7.81, 15.63, 31.25, 62.5, 125, 250, and 500 mcg/mL) in uptake transporter inhibition assays. These results are summarized in Table 3.
Table 3: Calculated Reaction Parameters from Uptake Transporter Inhibition Assays
As a further examination of the interaction, tazobactam was tested on OATP1B1, OATP1B3, OCT1, and OCT2 at one high concentration (900 mcg/mL). There was still no inhibition of OATP1B1 or OCT2 by tazobactam at the 900 mcg/mL concentration. The degree of inhibition of OATP1B3 and OCT1 were not significantly changed by the 900 mcg/mL concentration of tazobactam (see Figures 1 and 2, respectively).
Reference ID: 3648317

141
Figure 1: Inhibition of OATP1B3-Mediated Fluo-3 Transport by Tazobactam in the Uptake Transporter Inhibition Assay
Figure 2: Inhibition of OCT1-Mediated TEA Transport by Tazobactam in the Uptake Transporter Inhibition Assay
Uptake Transporter Substrate AssaysThe substrate potential of tazobactam for OAT1, OAT3, and OCT2 was investigated in the uptake transporter substrate assays: in the case of OAT1 and OAT3 at two concentrations (5 and 50 mcg/mL) and two time points (2 and 20 minutes) and in the case of OCT2 at four concentrations (5, 25, 50, and 100 mcg/mL) and two time points (2 and 20 minutes).
A compound is considered to be a substrate if the accumulation into transfected cells is 2-fold greater compared to the accumulation into parental cells (fold accumulation > 2) and this accumulation can be inhibited by a reference inhibitor. Up to a 3.54-fold accumulation of tazobactam was observed in OAT1 expressing cells as compared to controls (5 mcg/mL for 20 min) while up to 3.07-fold accumulation was observed for OAT3 (5 mcg/mL for 2 min). For OCT2, no remarkable transporter specific accumulation was observed under the conditions investigated (see Table 4 for a summary of these data).
Reference ID: 3648317
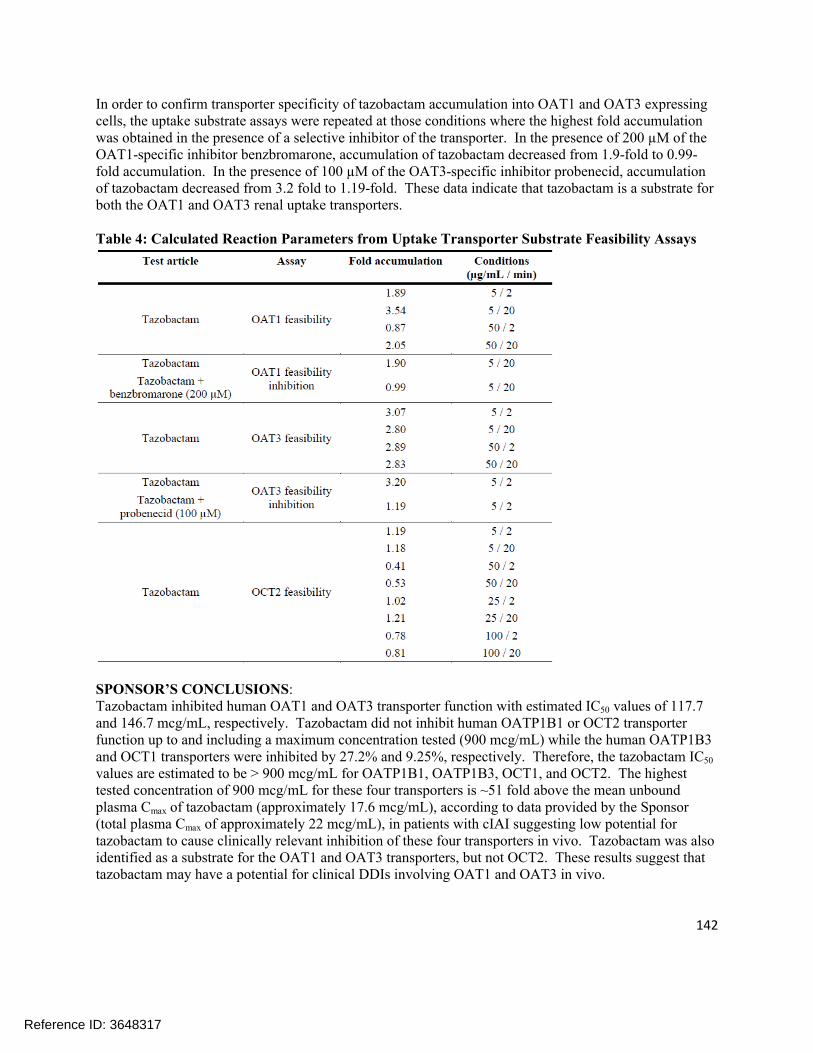
142
In order to confirm transporter specificity of tazobactam accumulation into OAT1 and OAT3 expressing cells, the uptake substrate assays were repeated at those conditions where the highest fold accumulation was obtained in the presence of a selective inhibitor of the transporter. In the presence of 200 µM of the OAT1-specific inhibitor benzbromarone, accumulation of tazobactam decreased from 1.9-fold to 0.99-fold accumulation. In the presence of 100 µM of the OAT3-specific inhibitor probenecid, accumulation of tazobactam decreased from 3.2 fold to 1.19-fold. These data indicate that tazobactam is a substrate for both the OAT1 and OAT3 renal uptake transporters.
Table 4: Calculated Reaction Parameters from Uptake Transporter Substrate Feasibility Assays
SPONSOR’S CONCLUSIONS:Tazobactam inhibited human OAT1 and OAT3 transporter function with estimated IC50 values of 117.7 and 146.7 mcg/mL, respectively. Tazobactam did not inhibit human OATP1B1 or OCT2 transporter function up to and including a maximum concentration tested (900 mcg/mL) while the human OATP1B3 and OCT1 transporters were inhibited by 27.2% and 9.25%, respectively. Therefore, the tazobactam IC50
values are estimated to be > 900 mcg/mL for OATP1B1, OATP1B3, OCT1, and OCT2. The highest tested concentration of 900 mcg/mL for these four transporters is ~51 fold above the mean unbound plasma Cmax of tazobactam (approximately 17.6 mcg/mL), according to data provided by the Sponsor (total plasma Cmax of approximately 22 mcg/mL), in patients with cIAI suggesting low potential for tazobactam to cause clinically relevant inhibition of these four transporters in vivo. Tazobactam was also identified as a substrate for the OAT1 and OAT3 transporters, but not OCT2. These results suggest that tazobactam may have a potential for clinical DDIs involving OAT1 and OAT3 in vivo.
Reference ID: 3648317

143
The inhibitory potential of tazobactam was initially tested up to a concentration of 500 mcg/mL> Tazobactam inhibited human OAT1, OAT3, OCT1, and OATP1B3 transporter function by 79.9%, 70.3%, 19.6%, and 32.3%, respectively, when tested over a concentration range up to 500 mcg/mL. The inhibitory potential of tazobactam on OATP1B1, OATP1B3, OCT1, and OCT2 was subsequently tested at a single higher concentration of 900 mcg/mL. Tazobactam inhibited OATP1B3 and OCT1 transporter function by 27.2% and 9.25%, respectively, at this higher concentration but did not inhibit OATP1B1 or OCT2. The potential IC50 values for these four transporters are estimated to be >900 mcg/mL.
Tazobactam was identified as a substrate for the OAT1 and OAT3 transporters. Up to 3.54-fold accumulation of tazobactam was detected in OAT1 expressing cells as compared to controls (5 mcg/mL for 2 min). The accumulation of tazobactam into OAT1 and OAT3 expressing cells could be inhibited (from 1.9 to 0.99 fold for OAT1 and from 3.20 to 1.19 fold for OAT3) using specific inhibitors of these transporters demonstrating that tazobactam is a substrate for both OAT1 and OAT3 in vitro. Tazobactam was not identified as a substrate for the OCT2 transporter over a concentration range of 5 to 100 mcg/mL.
According to the Sponsor, the mean total plasma Cmax of tazobactam in patients with cIAI is approximately 22 mcg/mL, with a plasma protein binding value of approximately 30% resulting in a mean unbound plasma Cmax of approximately 17.6 mcg/mL. In all inhibition experiments in current study, the transporter specific probe substrate concentration was below the respective Km so the resulting IC50 values are a reasonable estimation of the Ki. The inhibition assessment concentration of 900 mcg/mL is sufficient for determining a Ki less than or equal to 50-fold the unbound Cmax per EMA guidance and less than or equal to 10-fold the total Cmax per FDA guidance for OATP1B1, OATP1B3, OCT1, and OCT2 transporters. Based on the study results (IC50 >900 mcg/mL for OATP1B1, OATP1B3, OCT1, and OCT2 transporters) and tazobactam Cmax, tazobactam has a low potential to cause clinically relevant inhibition of these transporters in vivo. Additionally, tazobactam was not a substrate for human OCT2 transporter suggesting low potential for a clinically relevant interaction in vivo.
Tazobactam inhibited human OAT1 and OAT3 transporter function with estimated IC50 values 117.7 and 146.7 mcg/mL, respectively and was a substrate for these transporters. These results suggest that tazobactam may have potential for clinical DDIs involving OAT1 and OAT3 in vivo.
REVIEWER ASSESSMENT:The Reviewer concurs that tazobactam is a substrate and an inhibitor of OAT1 and OAT3; this interaction was further investigated in an in vivo drug interaction study. Tazobactam also showed weak inhibition of OATP1B3 and OCT1 at high concentrations; this is not likely to be clinically significant since the inhibition is weak and the concentrations of tazobactam required for inhibition are significantly higher than the observed tazobactam concentrations following administration of the 1500 mg dose of ceftolozane/tazobactam. Tazobactam did not appear to be a substrate or inhibitor of OCT2. Tazobactam did not inhibit OATP1B1 at the highest concentration tested.
Reference ID: 3648317

144
Study Number: CX.101.DM.012
Study Title: Tazobactam M-1: A Non-GLP In Vitro Assessment of Inhibitor Potential on Human MDR1, BCRP, BSEP, OATP1B1, OATP1B3, OAT1, OAT3, OCT1, and OCT2 Transporters
Dates: 2/20/13 (Issued Date)
Lab Site:
OBJECTIVES:The objectives of this study are to evaluate inhibitory potential of tazobactam M-1 with:
The human BSEP transporter in the vesicular transport inhibition assay The human OATP1B1, OATP1B3, OAT1, OAT3, OCT1, and OCT2 transporters in the uptake
transporter inhibition assay The human MDR1 and BCRP transporters in the monolayer efflux inhibition assay
The test concentrations are chosen based on guidance from the 2012 draft FDA drug interaction guidance and the final EMA drug interaction guidance.
METHODS:Vesicular transportVesicular transport assays were performed with membrane vesicles in the inside out orientation prepared from cells overexpressing human ABC transporters. Low permeability probe substrates are transported into vesicles by the expressed ABC transporter. Treatment groups applied in the vesicular transport assay are listed in Table 1.
Table 1: Treatment Groups in Vesicular Transport Assays
Uptake transporter inhibition assaysUptake experiments were performed on CHO cells or HEK293 (with FlpIn technology – FlpIn293) cells stably expressing the respective uptake transporters. Cells were plated on standard 96-well tissue culture plates. Parental cell lines were used as negative control. The treatment groups used in the uptake transporter assays are shown in Table 2.
Reference ID: 3648317
(b) (4)
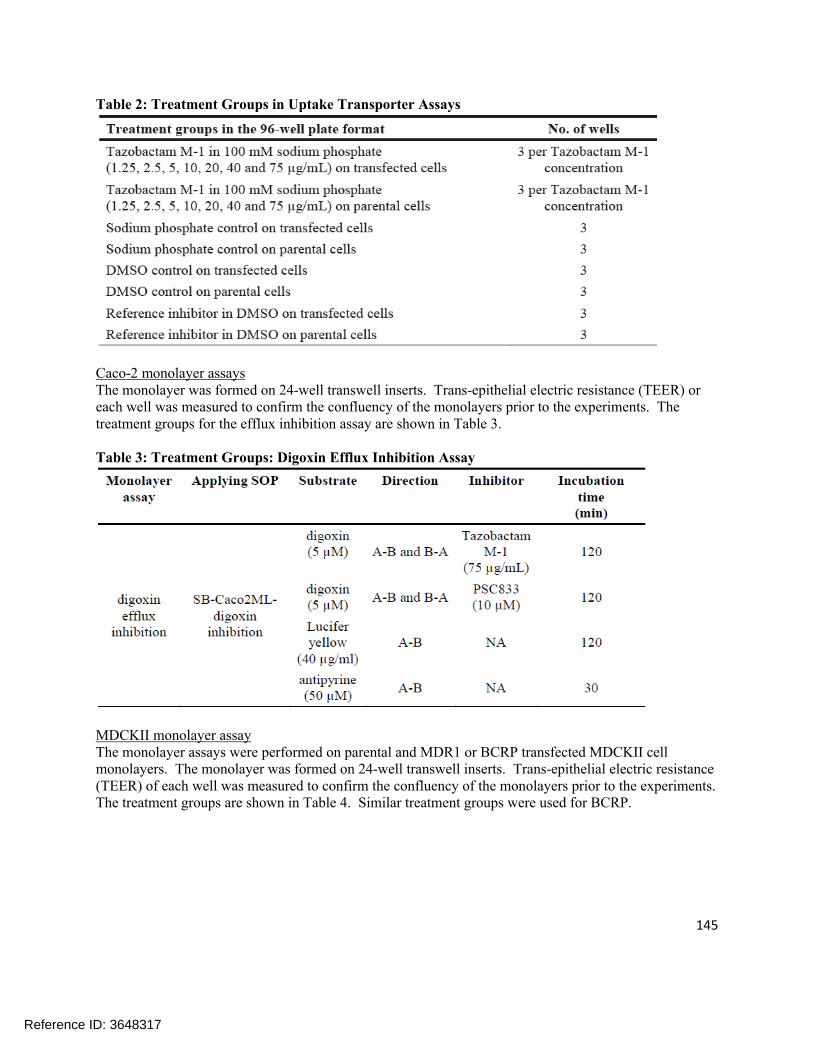
145
Table 2: Treatment Groups in Uptake Transporter Assays
Caco-2 monolayer assaysThe monolayer was formed on 24-well transwell inserts. Trans-epithelial electric resistance (TEER) or each well was measured to confirm the confluency of the monolayers prior to the experiments. The treatment groups for the efflux inhibition assay are shown in Table 3.
Table 3: Treatment Groups: Digoxin Efflux Inhibition Assay
MDCKII monolayer assayThe monolayer assays were performed on parental and MDR1 or BCRP transfected MDCKII cell monolayers. The monolayer was formed on 24-well transwell inserts. Trans-epithelial electric resistance (TEER) of each well was measured to confirm the confluency of the monolayers prior to the experiments. The treatment groups are shown in Table 4. Similar treatment groups were used for BCRP.
Reference ID: 3648317

146
Table 4: Treatment Groups; MDCKII-MDR1 and Parental Permeability Measurements
RESULTS:Vesicular TransportTazobactam M-1 did not influence the BSEP-mediated probe substrate transport when test from 1 through 75 mcg/mL nominal concentration in the vesicular transporter inhibition assay. The IC50 is > 75 mcg/mL (see Figure 1).
Figure 1: Modulation of BSEP-Mediated Probe Substrate Transport by Tazobactam M-1 in the Vesicular Transport Inhibition Assay
Uptake Transporter Inhibition AssayThe in vitro interaction potential of tazobactam M-1 with the human OATP1B1, OATP1B3, OAT1,OAT3, OCT1, and OCT2 uptake transporters was investigated at 7 concentrations (1, 2.5, 5, 10, 20, 40, and 75 mcg/mL) in the uptake transporter inhibition assays. Table 5 summarizes the results of these experiments.
Reference ID: 3648317

147
Table 5: Calculated Reaction Parameters from Uptake Transporter Inhibition Assays
Caco-2 monolayer assaysThe inhibitory effect of tazobactam M-1 on digoxin transport was determined at one concentration. Inhibition of digoxin transport by tazobactam M-1 (75 mcg/mL nominal, 66.3 mcg/mL experimental) and PSC833 (10 µM) is presented in Figure 2. Tazobactam M-1 did not influence the digoxin transport on Caco-2 cells. The ER was practically unchanged from 10.1 to 13.72 in the presence of tazobactam M-1. The ER of digoxin was reduced close to unity in the presence of PSC833 (the ER value was 1.28), indicating probe substrate transport could be inhibited.
Figure 2: Inhibitory Effect of Tazobactam M-1 and Control Inhibitor (PSC833) on the MDR1-Mediated Transport of Digoxin across Caco-2 Monolayers.
Reference ID: 3648317
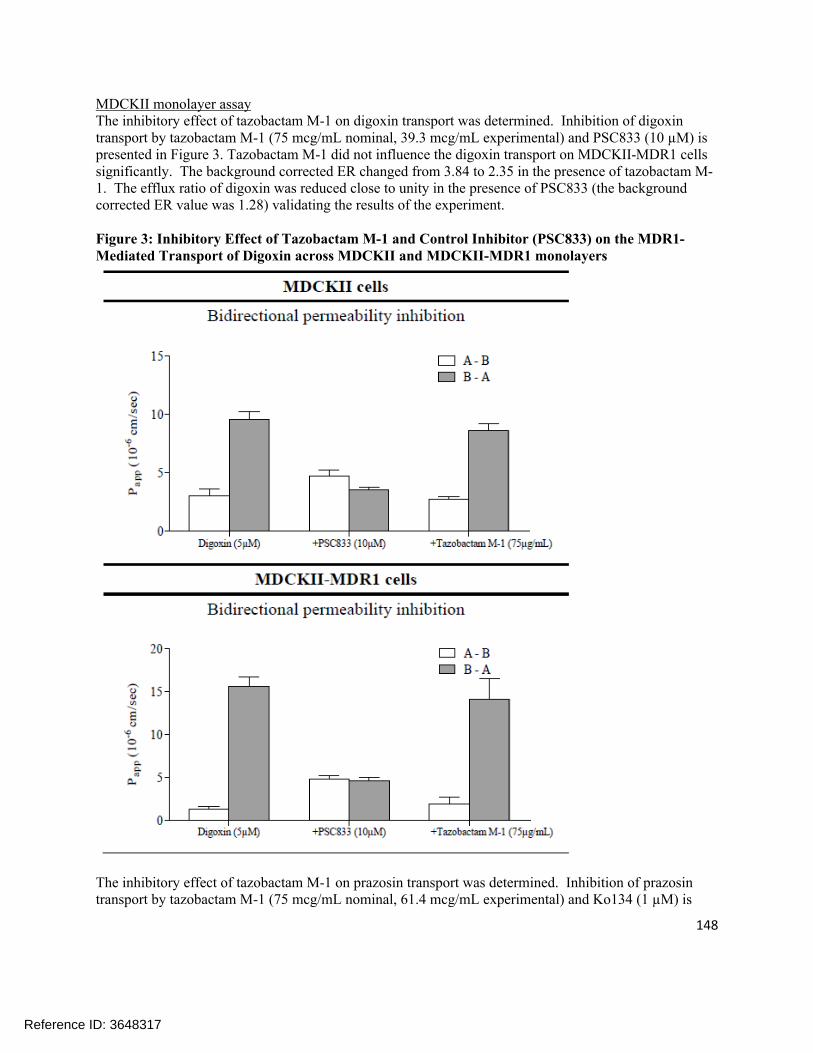
148
MDCKII monolayer assayThe inhibitory effect of tazobactam M-1 on digoxin transport was determined. Inhibition of digoxin transport by tazobactam M-1 (75 mcg/mL nominal, 39.3 mcg/mL experimental) and PSC833 (10 µM) is presented in Figure 3. Tazobactam M-1 did not influence the digoxin transport on MDCKII-MDR1 cells significantly. The background corrected ER changed from 3.84 to 2.35 in the presence of tazobactam M-1. The efflux ratio of digoxin was reduced close to unity in the presence of PSC833 (the background corrected ER value was 1.28) validating the results of the experiment.
Figure 3: Inhibitory Effect of Tazobactam M-1 and Control Inhibitor (PSC833) on the MDR1-Mediated Transport of Digoxin across MDCKII and MDCKII-MDR1 monolayers
The inhibitory effect of tazobactam M-1 on prazosin transport was determined. Inhibition of prazosin transport by tazobactam M-1 (75 mcg/mL nominal, 61.4 mcg/mL experimental) and Ko134 (1 µM) is
Reference ID: 3648317

149
presented in Figure 4. Tazobactam M-1 did not influence the prazosin transport on MDCKII-BCRP cells significantly. The background corrected ER was almost unchanged from 12 to 11.65 in the presence of tazobactam M-1. The ER of prazosin was reduced close to unity in the presence of Ko134 (the background corrected ER values was 0.72) indicating the test system was functioning properly.
Figure 4: Inhibitory Effect of Tazobactam M-1 and Control Inhibitor (Ko134) on the BCRP-Mediated Transport of Prazosin across MDCKII and MDCKII-BCRP Monolayers
SPONSOR’S CONCLUSIONS:Tazobactam M-1 did not inhibit the human OATP1B1, OATP1B3, OAT3, OCT1, BSEP, BCRP, or MDR1 transporter function at nominal concentrations up to, and including 75 mcg/mL in this study. Tazobactam M-1 did inhibit the human OAT1 transporter function by approximately 43.8% at 75 mcg/mL. The IC50 values may be estimated to be > 75 mcg/mL for all the transporters tested in this study. The highest tested concentration of 75 mcg/mL is about 50-fold higher than the mean total plasma
Reference ID: 3648317

150
Cmax of tazobactam M-1 in patients with complicated intra-abdominal infections (~1.5 mcg/mL, as provided by the Sponsor).
In all experiments, the applied probe substrate concentration was below the respective Km so the resulting IC50 values are a reasonable estimate of the Ki. The tazobactam M-1 concentration of 75 mcg/mL is sufficient for determining a Ki less than or equal to 50-fold the unbound Cmax per EMA guidance and less than 10-fold the total Cmax per FDA guidance for the transporters tested in this study thus suggesting a low potential for clinically relevant inhibition of these transporters in vivo by tazobactam M-1.
REVIEWER ASSESSMENT:The Reviewer agrees with the Sponsor’s conclusions that tazobactam M-1 is not likely to cause any clinically significant inhibition of OATP1B1, OATP1B3, OCT1, BSEP, BCRP, or MDR1.
Reference ID: 3648317
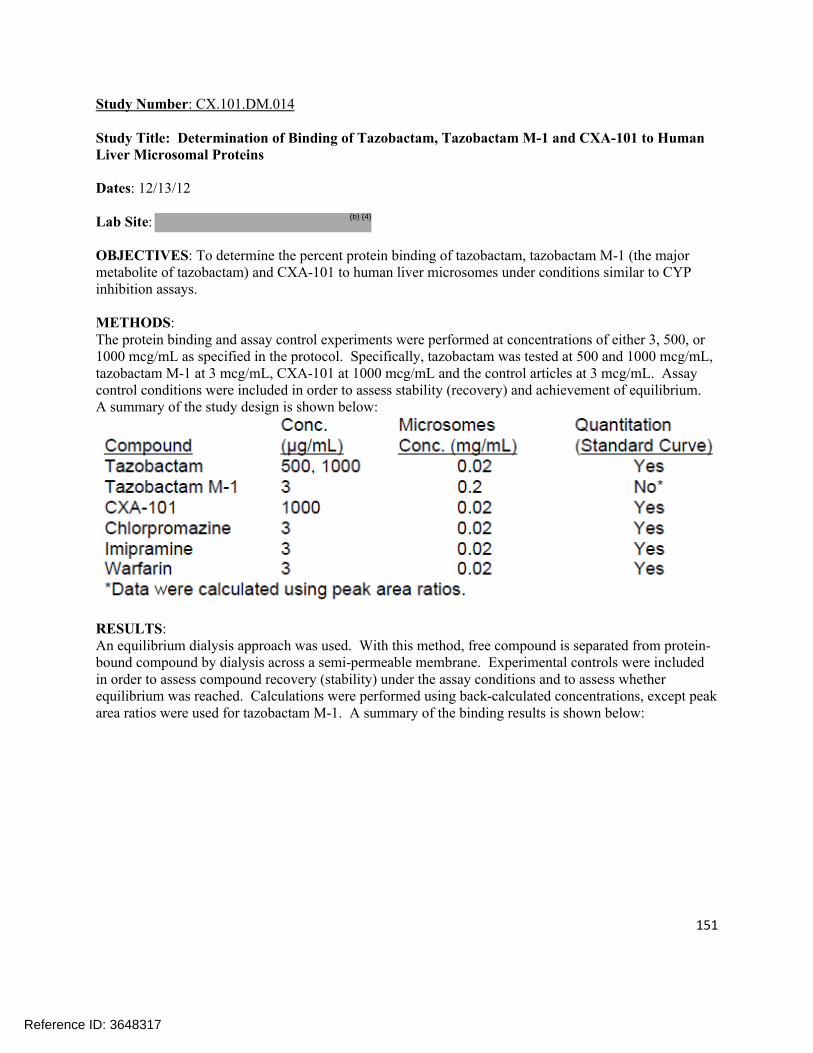
151
Study Number: CX.101.DM.014
Study Title: Determination of Binding of Tazobactam, Tazobactam M-1 and CXA-101 to Human Liver Microsomal Proteins
Dates: 12/13/12
Lab Site:
OBJECTIVES: To determine the percent protein binding of tazobactam, tazobactam M-1 (the major metabolite of tazobactam) and CXA-101 to human liver microsomes under conditions similar to CYP inhibition assays.
METHODS:The protein binding and assay control experiments were performed at concentrations of either 3, 500, or 1000 mcg/mL as specified in the protocol. Specifically, tazobactam was tested at 500 and 1000 mcg/mL, tazobactam M-1 at 3 mcg/mL, CXA-101 at 1000 mcg/mL and the control articles at 3 mcg/mL. Assay control conditions were included in order to assess stability (recovery) and achievement of equilibrium. A summary of the study design is shown below:
RESULTS:An equilibrium dialysis approach was used. With this method, free compound is separated from protein-bound compound by dialysis across a semi-permeable membrane. Experimental controls were included in order to assess compound recovery (stability) under the assay conditions and to assess whether equilibrium was reached. Calculations were performed using back-calculated concentrations, except peak area ratios were used for tazobactam M-1. A summary of the binding results is shown below:
Reference ID: 3648317
(b) (4)

152
TazobactamAt concentrations of 500 mcg/mL and 1000 mcg/mL, tazobactam demonstrated 7.8% and no binding (-0.4% calculated), respectively, to HLM proteins. These % bound values are within experimental variability for little to no binding (as the extent of binding decreases, the variability in the % bound value increases, and it is possible for slightly negative values to be calculated). It is not known how the extent of binding might be affected by the stoichiometric ratio of compound to protein binding sites (i.e. 1000 mcg/mL compound vs. 20 mcg/mL HLM protein).
The recovery values of tazobactam (compared to the T0 control reference values) in the presence of HLM following dialysis for 6 hours at 37 °C against buffer or blank matrix ranged from 118.8% to 220.2%. It is not known why these recoveries were >100%, e.g., if they were affected by the significant dilution required to bring the samples within the range of the standard curve. The recovery values would not impact the binding results since the percent binding calculation is dependent upon the relative (not absolute) levels on the donor and receiver compartments.
The equilibrium ratio values for tazobactam were 1.0 and 1.1, showing that equilibrium was achieved during the dialysis period and that the % bound values were reliable.
Tazobactam M-1Tazobactam M-1 demonstrated no binding (-9.8% calculated) to 0.2 mg/mL microsomal proteins at a concentration of 3 mcg/mL. It should be noted that the variability in calculated % bound values increases as the extent of binding decreases; further, this value (-9.8% binding) was within the experimental error for no binding. The recovery values for this test article under assay conditions (dialyzed against either buffer or blank matrix) were 99.2% and 96.3%, respectively, indicating stability in this microsomal matrix. The equilibrium ratio was 1.0, demonstrating that equilibrium was achieved during the dialysis period.
CXA-101The test article, CXA-101, demonstrated 21.0% binding to HLM proteins at an assay concentration of 1000 mcg/mL (comparable to chlorpromazine control article discussed below). The % recovery under assay conditions (after 6 hours and 37 °C) was low and estimated to be 46.9% to 48.9%. The recovery for CXA-101 was higher than for the chlorpromazine control, which performed acceptably but has been reported to show lower recovery. The cause of this low recovery is unknown, but could indicate instability in the matrix and/or non-specific binding to the assay apparatus. It is possible, however, that the low recovery may be due to variability resulting from the high dilution factors needed to bring the samples within the range of the standard curve. However, the equilibrium ratio was 1.3, indicating that
Reference ID: 3648317

153
equilibrium was achieved, as would be expected for compounds showing low levels of protein binding, and any contributing effects due to recovery would likely be minimal.
ChlorpromazineThe control drug, chlorpromazine, demonstrated 27.8% binding to 0.02 mg/mL human liver microsomal proteins at an assay concentration of 3 mcg/mL.
The recovery of chlorpromazine under the assay conditions was only 27.5%-29.5%, indicating some potential instability and/or non-specific binding. The equilibrium ratio value was 1.2, showing that equilibrium was attained, as would be expected for a compound with a low extent of protein binding.
ImipramineImipramine showed 3.0% binding to HLM protein at a concentration of 3 mcg/mL. The % recovery ranged from 70.8% to 75.4%, and the equilibrium ratio was 1.1, showing that equilibrium was attained.
WarfarinWarfarin demonstrated -1.4% binding to human liver microsomal proteins at an assay concentration of 3 mcg/mL. The assay recoveries were 98.1% - 114.3% (indicating stability under assay conditions), and the equilibrium ratio value was 1.0 (indicating equilibrium was achieved during the assay).
Summary for control articlesLiterature values for control drugs binding to HLM under these assay conditions were not available, but literature data under relevant assay conditions suggested that the rank order of binding to microsomal proteins would be chlorpromazine (higher) > imipramine (intermediate) > warfarin (lower). The above results for the control articles were as expected and demonstrate acceptable performance of the assay.
SPONSOR’S CONCLUSIONS:Tazobactam, tazobactam M-1, and CXA-101 were tested for binding to pooled human liver microsomal proteins. Equilibrium was achieved for all compounds under the experimental conditions (6 hours dialysis at 37 °C).
Tazobactam and tazobactam M-1 both demonstrated little to no binding to microsomal proteins [7.8% andno binding (-0.4%) for tazobactam at 500 mcg/mL and 1000 mcg/mL, respectively, and no binding (-9.8%) at 3 mcg/mL tazobactam M-1], and exhibited >96% recovery in the assay matrix.
CXA-101 showed low protein binding (21.0% bound at 1000 mcg/mL) with assay recoveries ranging from 46.9% to 48.9% after 6 hours at 37 °C. The recoveries for tazobactam and CXA-101 may be variable due to the high dilution factors used for the samples. The low recovery of CXA-101 may possibly be due to matrix instability and/or non-specific binding; however, its recovery was higher than for the chlorpromazine control, which performed acceptability but has been reported to show lower recovery. The recoveries are unlikely to impact the protein binding results.
The control articles, chlorpromazine, imipramine, and warfarin, demonstrated 27.8%, 3.0% and no binding (-1.4%), respectively, and the recoveries ranged from 27.5% to 29.5% (chlorpromazine) up to 98.1 to 114.3% (warfarin). The rank order of binding was as expected, indicating that the assay method performed acceptably.
Reference ID: 3648317

154
REVIEWER ASSESSMENT:It should be noted that since tazobactam M-1 is not pharmacologically active, the only compounds of relevance in this study were ceftolozane and tazobactam (the other compounds were controls). The protein binding of ceftolozane was assessed at a single concentration of 1000 mcg/mL, and was determined to be ~21%. This is similar value to previous studies. However, in this study, the protein binding of tazobactam was determined to be essentially zero. That stands in contrast to the labeling information where a protein binding of 30% is listed for tazobactam. This discrepancy is not addressed. However, in the proposed label, the more “conservative” values for the protein binding of tazobactam are listed. This study appeared to have some limitations since the protein binding for ceftolozane was only assessed at a single concentration and there appeared to be some issues related to compound recovery.
Reference ID: 3648317

155
Study Number: CX.101.DM.015
Study Title: CXA-101: A Non-GLP In Vitro Assessment of Inhibitor And/or Substrate Potential on Human P-gp, BCRP, BSEP, and MRP2 Transporters
Dates: 10/11/12 – 3/28/13
Lab Site:
OBJECTIVES: To evaluate the inhibitory potential of CXA-101 against human P-gp, BCRP, MRP2, and BSEP efflux transporters, and to investigate the potential for CXA-101 to act as a substrate for the P-gp and BCRP transporters.
METHODS:The purpose of this study was to determine the potential for the test article, CXA-101, to interact with human P-gp and BCRP efflux transporters as an inhibitor and/or substrate, when cultured in vitro with Caco-2 or MDR1-LLC-PK1 cells for 90 minutes. Additionally, the potential for CXA-101 to inhibit human BSEP and MRP2 efflux transporters when incubated in vesicles was determined.
Bi-Directional Transport AssaysAll CXA-101 incubations were performed in the A to B and B to A directions in triplicate monolayers. The donor and receiver solutions were added to the apical or basolateral chambers of the monolayers. The monolayers were incubated on an orbital shaker at 37 °C, with ambient humidity and CO2 for the duration of the transport assay.
To assess the potential of CXA-101 to inhibit the P-gp and BCRP transporters, the transport of the known P-gp substrate digoxin (5 µM) was determined in the presence of increasing concentrations of CXA-101 (0, 3, 9, 30, 100, 300, 900, and 2500 mcg/mL). Samples from donor and receiver chambers were taken at one time point (90 min). Positive controls are listed in Table 1.
Based on the results from the Caco-2 inhibition assays (less than 3% inhibition through 2500 mcg/mL), an assessment of the potential of CXA-101 to inhibit the P-gp transporter in MDR1-LLC-PK1 cell monolayers was performed. For that purpose, the transport of the known P-gp substrate digoxin (5 µM) was determined in the presence of increasing concentrations of CXA-101 (0, 3, 9, 30, 100, 300, 900, and 2500 mcg/mL). Samples from donor and receiver chambers were taken at one time point (90 min). Positive controls are listed in Table 1. Bidirectional transport of digoxin was not determined in control (vector carrying) LLC-PK1 cells.
[14C] CXA-101 was tested for its potential to act as a substrate for the P-gp and BCRP transporters at four concentrations (3, 10, 100, 1000 mcg/mL). Samples were taken from the receiver chamber at three time points (45, 90, and 120 min) and sampling volumes were replaced by receiver solution. Samples were taken from the donor chamber at two time points (0, 120 min).
Reference ID: 3648317
(b) (4)

156
Table 1: P-gp and BCRP Comparators and Positive Controls
BSEP and MRP2 Inhibition in Membrane VesiclesTo assess the potential for CXA-101 to inhibit the BSEP and MRP2 transporters, the positive control BSEP and MRP2 substrates (see Table 2) were assayed at one concentration in the absence and presence of increasing concentrations of CXA-101 (0, 3, 9, 30, 100, 300, 900, and 2500 mcg/mL for BSEP and 0, 15.6, 31.3, 62.5, 125, 250, 500, and 1000 mcg/mL for MRP2), in the presence of ATP and in the presence of AMP (control for +ATP condition).
Table 2: BSEP and MRP2 Positive Controls
RESULTS:P-gp Inhibition Activity of CXA-101 in MDR1-LLC-PK1 Cell MonolayersIncubation of probe substrate [3H] digoxin, in the presence of CXA-101 at concentrations of 3, 9, 30, 100, 300, 900, and 2500 mcg/mL resulted with concentration-independent inhibition of digoxin efflux ratios (range of 8 to 48%) with 8% inhibition at 2500 mcg/mL. The results suggest that CXA-101 is not an inhibitor of P-gp mediated digoxin efflux under the conditions examined (see Table 3).
Reference ID: 3648317
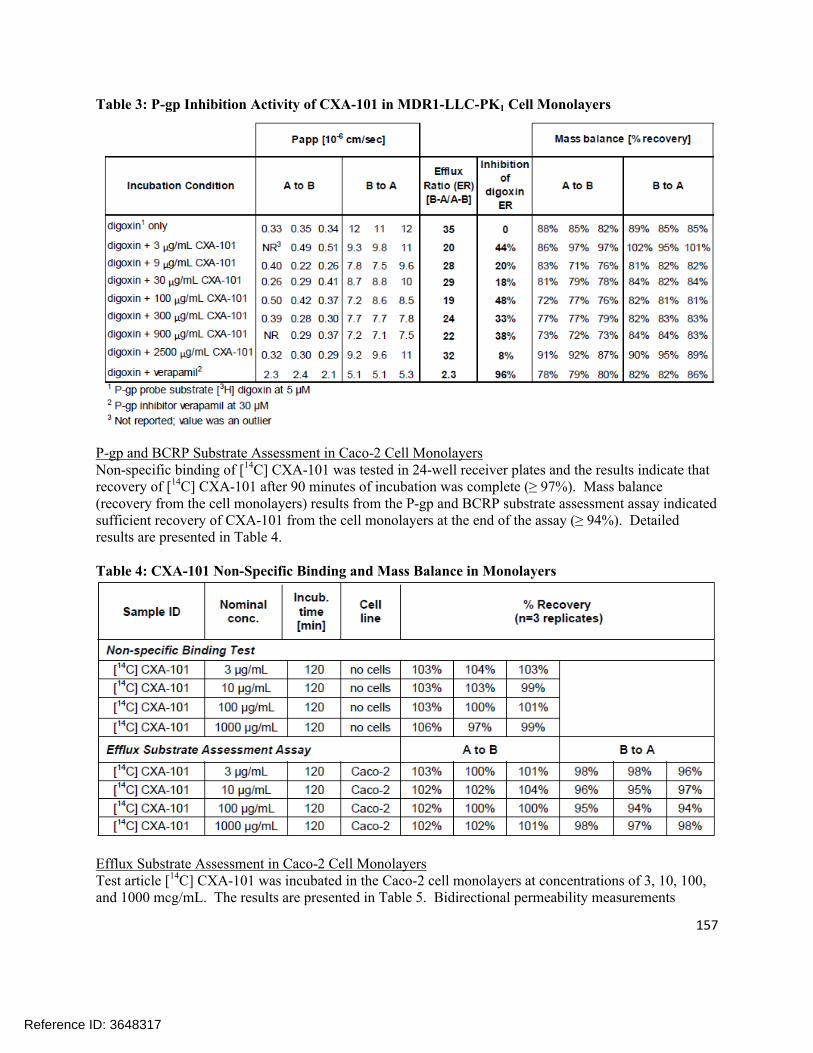
157
Table 3: P-gp Inhibition Activity of CXA-101 in MDR1-LLC-PK1 Cell Monolayers
P-gp and BCRP Substrate Assessment in Caco-2 Cell MonolayersNon-specific binding of [14C] CXA-101 was tested in 24-well receiver plates and the results indicate that recovery of [14C] CXA-101 after 90 minutes of incubation was complete (≥ 97%). Mass balance (recovery from the cell monolayers) results from the P-gp and BCRP substrate assessment assay indicated sufficient recovery of CXA-101 from the cell monolayers at the end of the assay (≥ 94%). Detailed results are presented in Table 4.
Table 4: CXA-101 Non-Specific Binding and Mass Balance in Monolayers
Efflux Substrate Assessment in Caco-2 Cell MonolayersTest article [14C] CXA-101 was incubated in the Caco-2 cell monolayers at concentrations of 3, 10, 100, and 1000 mcg/mL. The results are presented in Table 5. Bidirectional permeability measurements
Reference ID: 3648317
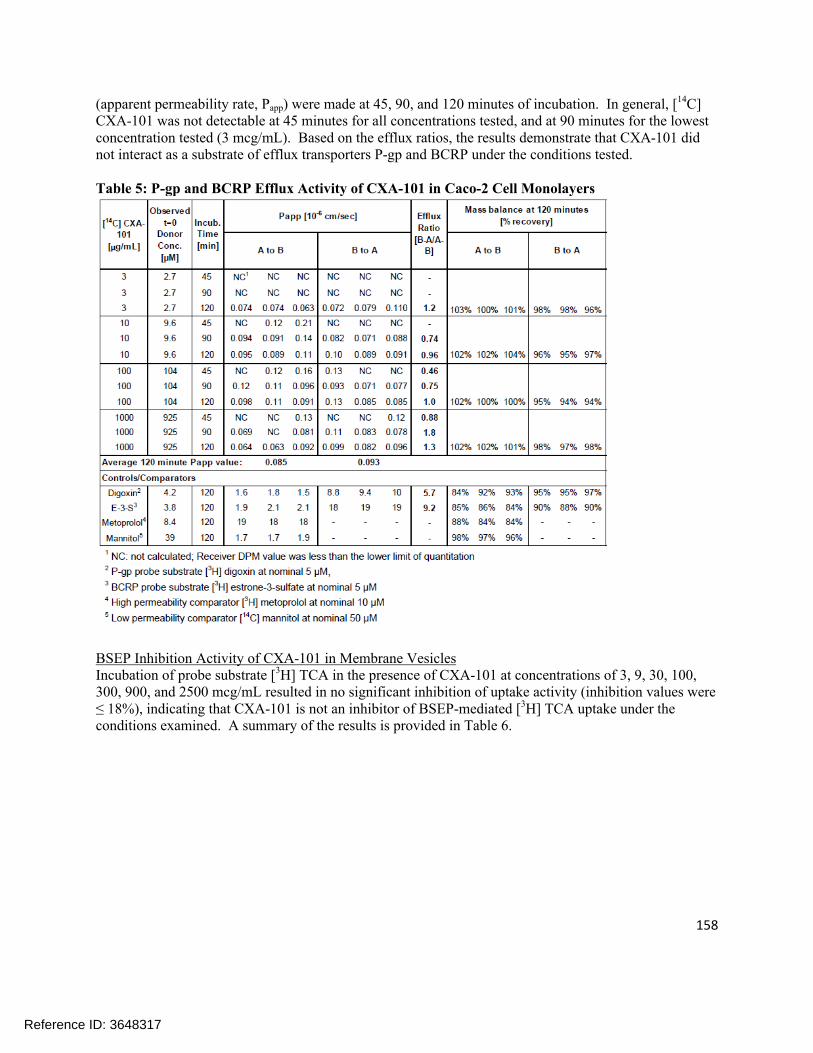
158
(apparent permeability rate, Papp) were made at 45, 90, and 120 minutes of incubation. In general, [14C] CXA-101 was not detectable at 45 minutes for all concentrations tested, and at 90 minutes for the lowest concentration tested (3 mcg/mL). Based on the efflux ratios, the results demonstrate that CXA-101 did not interact as a substrate of efflux transporters P-gp and BCRP under the conditions tested.
Table 5: P-gp and BCRP Efflux Activity of CXA-101 in Caco-2 Cell Monolayers
BSEP Inhibition Activity of CXA-101 in Membrane VesiclesIncubation of probe substrate [3H] TCA in the presence of CXA-101 at concentrations of 3, 9, 30, 100, 300, 900, and 2500 mcg/mL resulted in no significant inhibition of uptake activity (inhibition values were ≤ 18%), indicating that CXA-101 is not an inhibitor of BSEP-mediated [3H] TCA uptake under the conditions examined. A summary of the results is provided in Table 6.
Reference ID: 3648317

159
Table 6: BSEP Inhibition Activity of CXA-101 in Membrane Vesicles
MRP2 Inhibition Activity of CXA-101 in Membrane VesiclesIncubation of probe substrate, [3H] estradiol-17β-D-glucuronide in the presence of CXA-101 at concentrations of 15.6, 31.3, 62.5, 125, 250, 500, and 1000 mcg/mL resulted in no significant inhibition of uptake activity (inhibition values were ≤25% and concentration-independent), indicating that CXA-101 is not an inhibitor of MRP2-mediated [3H] estradiol-17β-D-glucuronide uptake. A summary of the results is presented in Table 7.
Reference ID: 3648317

160
Table 7: MRP2 Inhibition Activity of CXA-101 in Membrane Vesicles
SPONSOR’S CONCLUSIONS: CXA-101, when tested at nominal concentrations up to 2500 mcg/mL, caused no inhibition of P-
gp or BCRP activity in Caco-2 cells. In the follow-up P-gp inhibition assay in MDR1-LLC-PK1 cells, the inhibition values ranged
from 8% to 48% in a concentration-independent manner, with 8% inhibition at the highest concentration of CXA-101 tested.
When tested as a substrate for efflux in Caco-2 cells, [14C] CXA-101 at nominal concentrations up to 1000 mcg/mL demonstrated low bidirectional permeability (Papp values were less than that of low permeability comparator mannitol) and no evidence of efflux by P-gp or BCRP.
Tested as an inhibitor of human BSEP, CXA-101 at nominal concentrations up to 2500 mcg/mL in membrane vesicles caused no biologically relevant inhibition of BSEP activity.
CXA-101, when tested as an inhibitor of human MRP2 at nominal concentrations up to 1000 mcg/mL in membrane vesicles, caused no biologically relevant or concentration-dependent inhibition of MRP2.
The results of this study indicate that CXA-101 does not have potential to interact with human efflux transporters P-gp, BCRP, BSEP, or MRP2 as an inhibitor, or as a substrate for P-gp or BCRP.
Reference ID: 3648317

161
REVIEWER ASSESSMENT:The Reviewer agrees with the Sponsor’s assessment that CXA-101 does not appear to be a substrate or inhibitor of P-gp or BCRP. Further CXA-101 does not appear to be an inhibitor of MRP2 or BSEP.
Reference ID: 3648317

162
Study Number: CX.101.DM.016
Study Title: Tazobactam: A Non-GLP In Vitro Assessment of Inhibitor Potential on Human P-gp, BCRP, and BSEP Transporters
Dates: 10/11/12 – 3/28/13
Lab Site:
OBJECTIVES: To evaluate the inhibitory potential of tazobactam against human P-gp, BCRP, and BSEP efflux transporters. The test concentrations were chosen based on guidance from the 2012 draft FDA drug interaction guidance and final EMA drug interaction guideline.
METHODS:All tazobactam incubations were performed in the A to B and B to A directions in triplicate monolayers. The donor and receiver solutions were added to the apical or basolateral chambers of the monolayers. The monolayers were incubated on an orbital shaker at 37 °C, with ambient humidity and CO2 for the duration of the transport assay.
To assess the potential of tazobactam to inhibit the P-gp and BCRP transporters, the transport of the known P-gp substrate digoxin (5 µM) and the known BCRP substrate estrone-3 sulfate (5 µM) were determined in the presence of increasing concentrations of tazobactam (0, 3, 10, 30, 100, 300, 900, and 2500 mcg/mL). Samples from the donor and receiver chambers were taken at one time point (90 min). Positive controls are listed in Table 1.
Based on the results from the Caco-2 inhibition assays, an assessment of the potential of tazobactam to inhibit the P-gp transporter in MDR1-LLC-PK1 cell monolayers was performed. For that purpose, the transport of the known P-gp substrate digoxin (5 µM) was determined in the presence of increasing concentrations of tazobactam (0, 1, 3, 10, 30, 100, 300, 900, and 2500 mcg/mL). Positive controls are listed in Table 1. Bidirectional transport of digoxin was not determined in control (vector carrying) LLC-PK1 cells.
Table 1: P-gp and BCRP Comparators and Positive Controls
To assess the potential for tazobactam to inhibit the BSEP transporter, the positive control BSEP substrate (see Table 2) was assayed at one concentration in the absence and presence of increasing concentrations
Reference ID: 3648317
(b) (4)
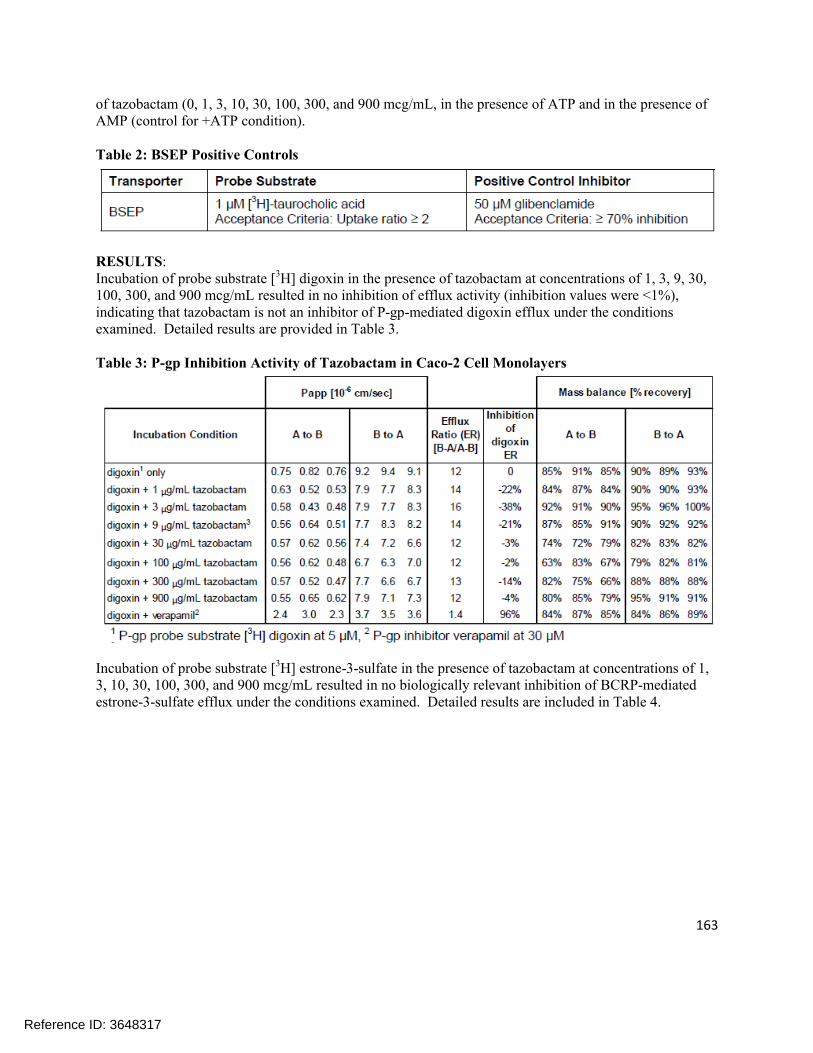
163
of tazobactam (0, 1, 3, 10, 30, 100, 300, and 900 mcg/mL, in the presence of ATP and in the presence of AMP (control for +ATP condition).
Table 2: BSEP Positive Controls
RESULTS:Incubation of probe substrate [3H] digoxin in the presence of tazobactam at concentrations of 1, 3, 9, 30, 100, 300, and 900 mcg/mL resulted in no inhibition of efflux activity (inhibition values were <1%), indicating that tazobactam is not an inhibitor of P-gp-mediated digoxin efflux under the conditions examined. Detailed results are provided in Table 3.
Table 3: P-gp Inhibition Activity of Tazobactam in Caco-2 Cell Monolayers
Incubation of probe substrate [3H] estrone-3-sulfate in the presence of tazobactam at concentrations of 1, 3, 10, 30, 100, 300, and 900 mcg/mL resulted in no biologically relevant inhibition of BCRP-mediated estrone-3-sulfate efflux under the conditions examined. Detailed results are included in Table 4.
Reference ID: 3648317

164
Table 4: BCRP Inhibition Activity of Tazobactam in Caco-2 Cell Monolayers
Incubation of the probe substrate [3H] digoxin, in the presence of tazobactam at concentrations of 1, 3, 10, 30, 100, 300, and 900 mcg/mL resulted in no biologically relevant inhibition of efflux activity (inhibition values were ≤ 12%), indicating that tazobactam is not an inhibitor of P-gp-mediated digoxin efflux under the conditions examined. Detailed results are included in Table 5.
Table 5: P-gp Inhibition Activity of Tazobactam in MDR1-LLC-PK1 Cell Monolayers
Incubation of probe substrate [3H] TCA in the presence of tazobactam at concentrations of 1, 3, 10, 30, 100, 300, and 900 mcg/mL resulted in no inhibition of uptake activity (inhibition values were ≤5%), indicating that tazobactam is not an inhibitor of BSEP-mediated [3H] TCA uptake under the conditions examined. A summary of the results is provided in Table 6.
Reference ID: 3648317

165
Table 6: BSEP Inhibition Activity of Tazobactam in Membrane Vesicles
SPONSOR’S CONCLUSIONS: Tazobactam, when tested at nominal concentrations up to 900 mcg/mL, caused no inhibition of P-
gp or BCRP activity in Caco-2 cells. Tazobactam, when tested at nominal concentrations up to 900 mcg/mL, caused no inhibition of P-
gp in MDR1-LLC-PK1 cells. Tazobactam, when tested at nominal concentrations up to 900 mcg/mL, caused no inhibition of
BSEP activity Tazobactam demonstrated no potential to inhibit human efflux transporters P-gp, BCRP, or BSEP
at nominal concentrations up to and including 900 mcg/mL (the highest concentration tested).
The 900 mcg/mL concentration of tazobactam is approximately 58-fold above the mean unbound plasma Cmax of approximately 15 mcg/mL of tazobactam in patients with complicated intra-abdominal infections (cIAI). The inhibition assessment concentrations are sufficient for determining a Ki less than or equal to 50-fold the unbound Cmax per EMA guideline, and less than or equal to 10-fold the total Cmax per FDA guidance. The current study results, together with the clinical Cmax, suggest that tazobactam has low potential to cause clinically relevant inhibition of P-gp, BCRP, or BSEP transporters.
Reference ID: 3648317

166
REVIEWER ASSESSMENT:The Reviewer agrees with the Sponsor’s conclusions. Tazobactam does not appear to be an inhibitor of P-go, BCRP, or BSEP under the conditions tested.
Reference ID: 3648317

167
Study Number: CX.101.DM.019
Study Title: CXA-101: A Non-GLP In Vitro Assessment of Inhibitor Potential on Human OATP1B1, OATP1B3, OAT1, OAT3, OCT1, and OCT2 Transporters at a Single High Concentration
Dates: 3/26/13
Lab Site:
OBJECTIVES: To evaluate the inhibitory potential of CXA-101 on the human OATP1B1, OATP1B3, OAT1, OAT3, OCT1, and OCT2 transporters in the uptake transporter inhibition assay at a single concentration of 2500 mcg/mL.
In a previous study, (CX.101.DM.004), at the highest tested CXA-101 concentration of 1000 mcg/mL, 15% to 36% inhibition was observed for OATP1B3, OAT1, OCT2, and OCT1, and no inhibition of OATP1B1 and OAT3 transporters. The inhibition assessment concentration of 2500 mcg/mL of CXA-101 is sufficient for determining a Ki less than or equal to 50-fold the unbound plasma Cmax per EMA guidance, and less than or equal to 10-fold the total Cmax per FDA guidance.
METHDOS:Uptake experiments were performed on CHO cells or Flp-In-293 cells stably expressing the respective uptake/SLC transporters. Cells were plated on standard 96-well tissue culture plates. Parental cell lines were used as a negative control. Parameters of the uptake transport assays and treatment groups are presented in Tables 1 and 2, respectively.
Table 1: Parameters of Uptake Transporter Assays
Reference ID: 3648317
(b) (4)
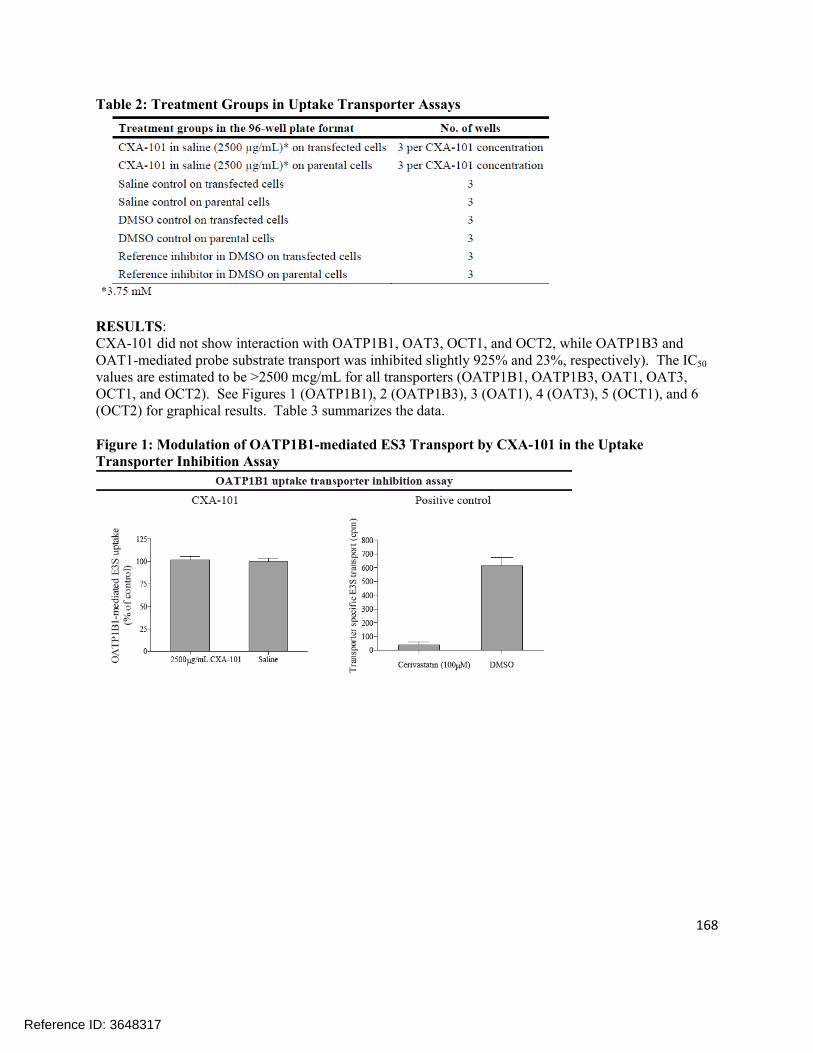
168
Table 2: Treatment Groups in Uptake Transporter Assays
RESULTS:CXA-101 did not show interaction with OATP1B1, OAT3, OCT1, and OCT2, while OATP1B3 and OAT1-mediated probe substrate transport was inhibited slightly 925% and 23%, respectively). The IC50
values are estimated to be >2500 mcg/mL for all transporters (OATP1B1, OATP1B3, OAT1, OAT3, OCT1, and OCT2). See Figures 1 (OATP1B1), 2 (OATP1B3), 3 (OAT1), 4 (OAT3), 5 (OCT1), and 6 (OCT2) for graphical results. Table 3 summarizes the data.
Figure 1: Modulation of OATP1B1-mediated ES3 Transport by CXA-101 in the Uptake Transporter Inhibition Assay
Reference ID: 3648317

169
Figure 2: Reduction of OATP1B3-Mediated Fluo-3 Transport by CXA-101 in the Uptake Transporter Inhibition Assay
Figure 3: Reduction of OAT1-Mediated PAH Transport by CXA-101 in the Uptake Transporter Inhibition Assay
Figure 4: Modulation of OAT3-Mediated ES3 Transport by CXA-101 in the Uptake Transporter Inhibition Assay
Reference ID: 3648317

170
Figure 5: Modulation of OCT1-Mediated Metformin Transport by CXA-101 in the Uptake Transporter Inhibition Assay
Figure 6: Modulation of OCT2-Mediated Metformin Transport by CXA-101 in the Uptake Transporter Inhibition Assay
Table 3: Calculated Reaction parameters from Uptake Transporter Inhibition Assays
Reference ID: 3648317
171
SPONSOR’S CONCLUSIONS:CXA-101 demonstrated no potential to inhibit OATP1B1, OAT3, OCT1, or OCT2 at a concentration of 1500 mcg/mL. A slight inhibition (25% and 23%, respectively) of OATP1B3 and OAT1, respectively, was detected following treatment with CXA-101 at 2500 mcg/mL. Therefore, the IC50 values are estimated to be >2500 mcg/mL for all the transporters tested in this study. The highest tested concentration of 2500 mcg/mL is ~53 fold above the mean unbound plasma Cmax of approximately 47 mcg/mL of CXA-101 in patients with cUTI and cIAI (total plasma Cmax of approximately 57 mcg/mL), according to the Sponsor. Therefore, the current study results suggest that CXA-101 has low potential to cause clinically relevant inhibition of these transporters in vivo.
In a previous study (CX.101.DM.004) at the highest tested CXA-101 concentration of 1000 mcg/mL, 15% to 36% inhibition was observed for OATP1B3, OAT1, OCT2, and OCT1, and no inhibition of OATP1B1 and OAT3 transporters.
REVIEWER ASSESSMENT:The Reviewer agrees with the Sponsor’s assessment. This study indicated that CXA-101 has a low potential to act as an inhibitor of OATP1B1, OATP1B3, OAT1, OAT3, OCT1, or OCT2 at clinically-relevant concentrations.
Reference ID: 3648317
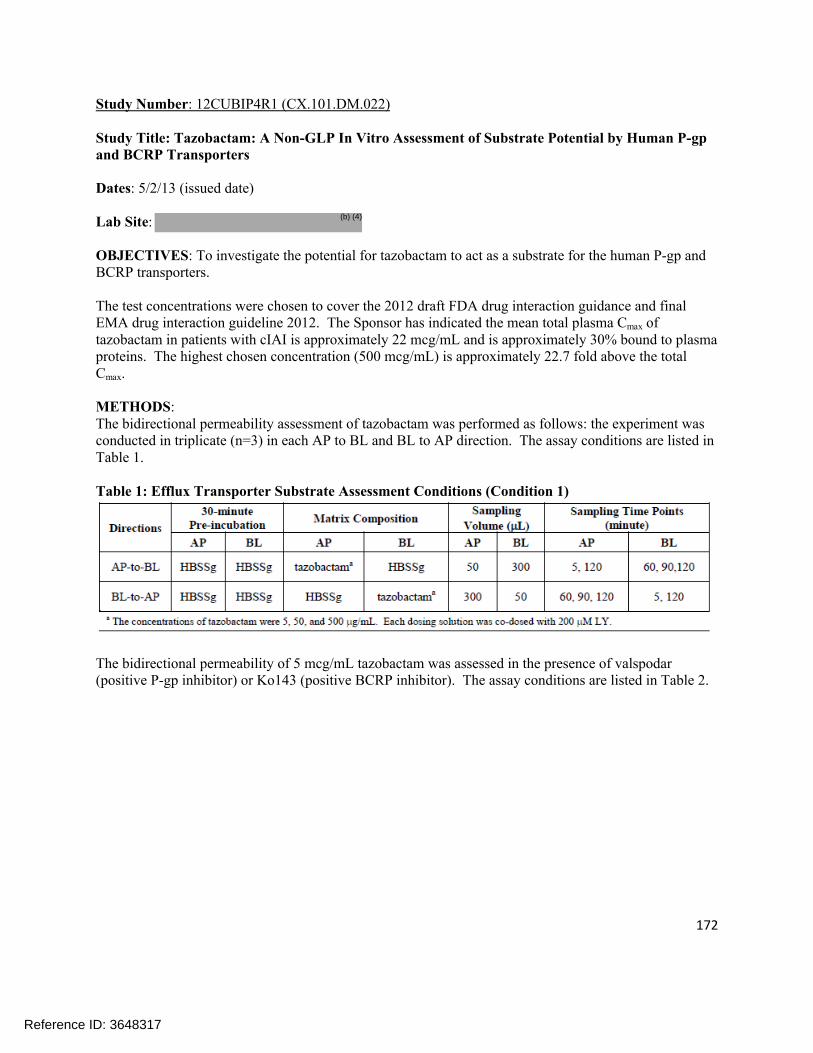
172
Study Number: 12CUBIP4R1 (CX.101.DM.022)
Study Title: Tazobactam: A Non-GLP In Vitro Assessment of Substrate Potential by Human P-gp and BCRP Transporters
Dates: 5/2/13 (issued date)
Lab Site:
OBJECTIVES: To investigate the potential for tazobactam to act as a substrate for the human P-gp and BCRP transporters.
The test concentrations were chosen to cover the 2012 draft FDA drug interaction guidance and final EMA drug interaction guideline 2012. The Sponsor has indicated the mean total plasma Cmax of tazobactam in patients with cIAI is approximately 22 mcg/mL and is approximately 30% bound to plasma proteins. The highest chosen concentration (500 mcg/mL) is approximately 22.7 fold above the total Cmax.
METHODS:The bidirectional permeability assessment of tazobactam was performed as follows: the experiment was conducted in triplicate (n=3) in each AP to BL and BL to AP direction. The assay conditions are listed in Table 1.
Table 1: Efflux Transporter Substrate Assessment Conditions (Condition 1)
The bidirectional permeability of 5 mcg/mL tazobactam was assessed in the presence of valspodar (positive P-gp inhibitor) or Ko143 (positive BCRP inhibitor). The assay conditions are listed in Table 2.
Reference ID: 3648317
(b) (4)

173
Table 2: P-gp and BCRP Substrate Assessment (Condition 2)
For positive controls, the bidirectional permeability of 10 µM digoxin was assessed in the absence and in the presence of valspodar and the bidirectional permeability of 5 µM E3S was assessed in the absence and in the presence of Ko143. The assay conditions are listed in Table 3.
Table 3: P-gp and BCRP Substrate Assessment (Condition 3)
RESULTS:At 5, 50, and 500 mcg/mL, the efflux ratios of tazobactam were less than 2.0 in Caco-2 cells. In the presence of valspodar or Ko143, the efflux ratios of tazobactam were less than 2.0 to 5 mcg/mL (see Table 4). The results suggested that tazobactam is neither a substrate of P-gp nor a substrate of BCRP.
Reference ID: 3648317
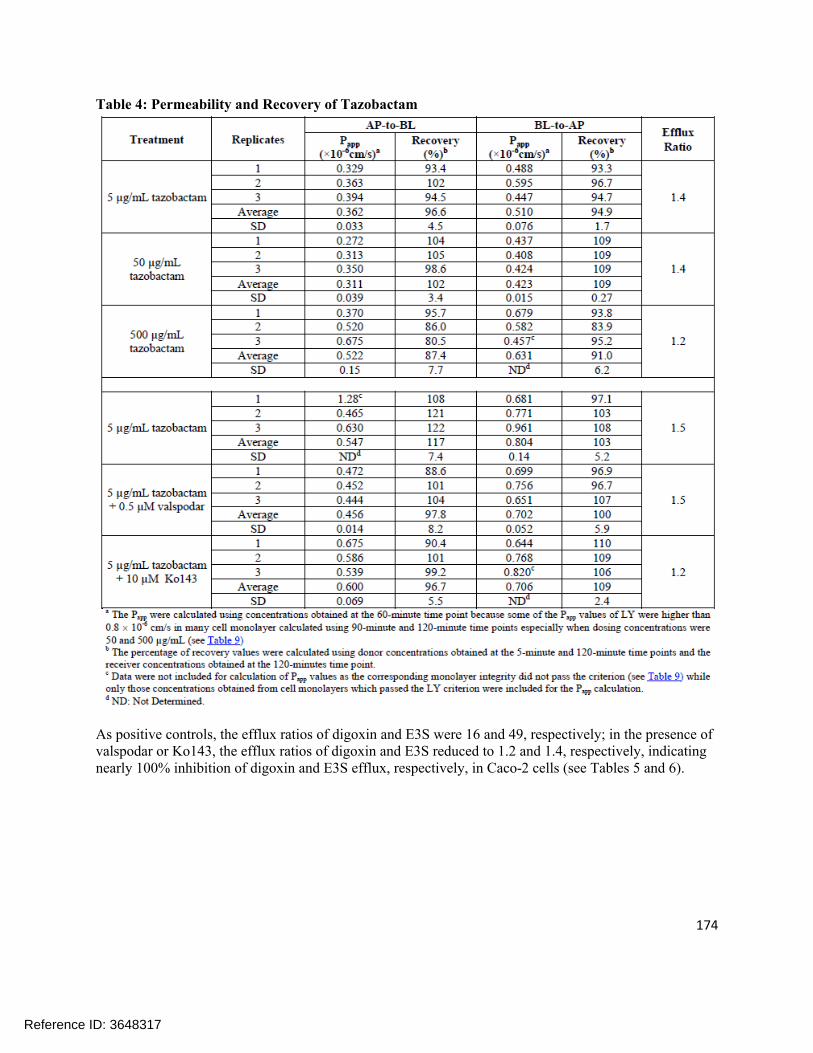
174
Table 4: Permeability and Recovery of Tazobactam
As positive controls, the efflux ratios of digoxin and E3S were 16 and 49, respectively; in the presence of valspodar or Ko143, the efflux ratios of digoxin and E3S reduced to 1.2 and 1.4, respectively, indicating nearly 100% inhibition of digoxin and E3S efflux, respectively, in Caco-2 cells (see Tables 5 and 6).
Reference ID: 3648317

175
Table 5: Permeability and Recovery of Digoxin and E3S in the Presence and Absence of Inhibitors
Table 6: Corrected Efflux Ratio of Digoxin and Percentage Inhibition by Valspodar and Corrected Efflux Ratio of E3S and Percentage Inhibition by Ko143
SPONSOR’S CONCLUSIONS:Tazobactam was not a substrate of the human P-gp or BCRP transporter in this study. The efflux ratios for tazobactam were less than 2.0 for all treatment groups ranging from 5 to 500 mcg/mL of tazobactam. The concentrations tested spanned a 100-fold range (5 to 500 mcg/mL) bracketing the mean unbound plasma Cmax of approximately 15.4 mcg/mL of tazobactam in patients with cIAI (mean total plasma Cmax
of approximately 22 mcg/mL) according to the Sponsor. These results collectively suggest that tazobactam has low potential for clinically relevant DDIs involving P-gp or BCRP in vivo.
REVIEWER ASSESSMENT:The Reviewer agrees with the Sponsor’s conclusions that tazobactam is not a substrate of P-gp or BCRP.
Reference ID: 3648317
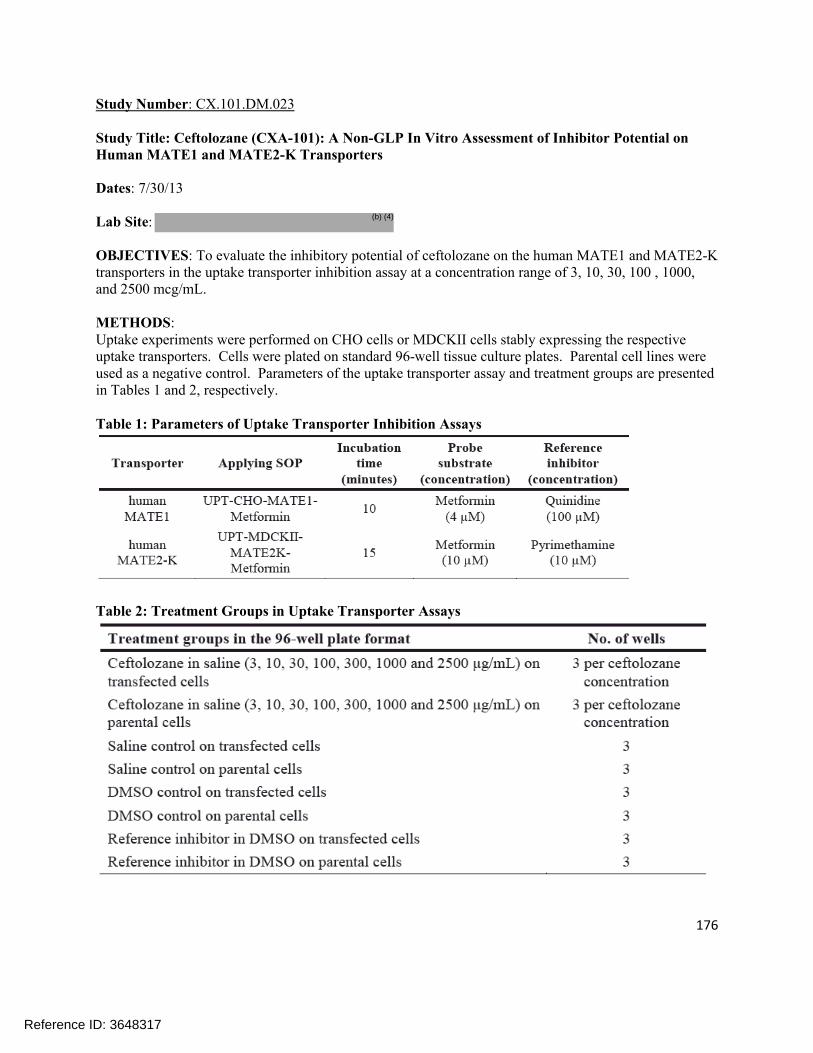
176
Study Number: CX.101.DM.023
Study Title: Ceftolozane (CXA-101): A Non-GLP In Vitro Assessment of Inhibitor Potential on Human MATE1 and MATE2-K Transporters
Dates: 7/30/13
Lab Site:
OBJECTIVES: To evaluate the inhibitory potential of ceftolozane on the human MATE1 and MATE2-K transporters in the uptake transporter inhibition assay at a concentration range of 3, 10, 30, 100 , 1000, and 2500 mcg/mL.
METHODS:Uptake experiments were performed on CHO cells or MDCKII cells stably expressing the respective uptake transporters. Cells were plated on standard 96-well tissue culture plates. Parental cell lines were used as a negative control. Parameters of the uptake transporter assay and treatment groups are presented in Tables 1 and 2, respectively.
Table 1: Parameters of Uptake Transporter Inhibition Assays
Table 2: Treatment Groups in Uptake Transporter Assays
Reference ID: 3648317
(b) (4)

177
RESULTS:Ceftolozane showed a concentration-dependent interaction in the case of both MATE1 and MATE2-K up to 2500 mcg/mL (see Figure 1 and 2, respectively). The highest observed inhibitions were 32.5% and 39.8% observed at the 2500 mcg/mL ceftolozane concentration for MATE1 and MATE2-K, respectively. Based on the current results, IC50 values could not be determined and are estimated to be >2500 mcg/mL for both MATE1 and MATE2-K (see Table 3).
Figure 1: Effect of Ceftolozane on MATE1-Mediated Metformin Transport in the Uptake Transporter Inhibition Assay
Figure 2: Effect of Ceftolozane on MATE2-K-Mediated Metformin Transport in the Uptake Transporter Inhibition Assay
Reference ID: 3648317

178
Table 3: Calculated Reaction Parameters for the Uptake Transporter Inhibition Assays
SPONSOR’S CONCLUSIONS:Ceftolozane demonstrated a dose-dependent inhibition of both MATE1 and MATE2-K transporters up to a concentration of 2500 mcg/mL in this study. The highest observed inhibitions were 32.5% and 39.8% for MATE1 and MATE2-K, respectively. The IC50 values are estimated to be >2500 mcg/mL for both transporters. The highest tested concentration of 1500 mcg/mL is approximately 53 fold above the mean unbound plasma Cmax of ceftolozane in patients with cUTI and cIAI (approximately 47 mcg/mL). Therefore, the current study results suggest that ceftolozane has low potential to cause clinically relevant inhibition of these transporters in vivo.
In all experiments in the current study, the transporter specific probe substrate concentration was below the respective Km so the resulting IC50 values are a reasonable estimation of the Ki. The ceftolozane concentration of 2500 mcg/mL is sufficient for determining a Ki less than or equal to 50-fold the unbound Cmax per EMA guidance and less than or equal to 10-fold the total Cmax per FDA guidance. Based on the study results (IC50 >2500 mcg/mL for all tested transporters) and the current regulatory guidance, the results indicate that ceftolozane has low potential to cause clinically relevant inhibition of these transporters in vivo.
REVIEWER ASSESSMENT:The Reviewer agrees with the Sponsor that ceftolozane exhibits a dose-dependent inhibition of MATE1 and MATE2-K. However, the Sponsor was unable to derive an IC50 as less than 50% inhibition was observed at the highest concentration of ceftolozane tested, which was substantially larger than the therapeutic concentrations of ceftolozane. Therefore, it is unlikely that any significant drug interactions would occur due to the inhibition of MATE1 or MATE2-K by ceftolozane.
Reference ID: 3648317

179
Study Number: PCDM0300304 (CRD050181)
Study Title: Non-Clinical Pharmacokinetics: In Vitro Protein binding of FR264205 in Mouse, Rat, Dog, and Human Serum in Human Plasma
Dates: 1/17/13
Lab Site: Drug Metabolism Research Laboratories Drug Discovery Research, Astellas Pharma Inc. Tokyo, Japan
OBJECTIVES: As part of the non-clinical evaluation of the study drug, the in vitro protein binding rate of FR264205 in mice, rats, dogs, and human was measured using 14C-labeled FR24205 (ceftolozane).
METHODS:Fresh serum was collected from at least 3 individuals of each species on the day of the experiment and pooled until used. In addition, fresh plasma was also collected from at least the 3 human subjects on the day of the experiment and pooled until used. A 4 mL aliquot of pooled serum/plasma was placed into each of 3 stock tubes and incubated at 37 °C for approximately 5 min. A 40 µL aliquot of each 14C-FR264205 standard solution was added to prepare samples at the final concentrations of 0.5, 5, and 50 mcg/mL. Radioactivity was measured for 5 min using a liquid scintillation analyzer.
RESULTS:The in vitro protein binding rate of FR264205 in mouse, rat, dog, and human serum as well as in human plasma is presented in Table 1. In the FR264205 concentration range of 0.5-50 mcg/mL, the protein binding rate was low in all of the species examined: 7.35%-9.64% for mouse serum (the mean value of 3 samples, the same hereafter), 8.10%-11.10% for rat serum, 15.96-17.48% for dog serum, and 14.57%-16.76% for human serum. The protein binding in human plasma was 16.27%-20.84% which was slightly higher than in serum. The individual data is shown in Table 2.
Table 1: In Vitro Serum and Plasma Protein Binding of 14C-FR264205
Reference ID: 3648317

180
Table 2: In Vitro Serum and Plasma Protein Binding of 14C-FR264205
Reference ID: 3648317
181
SPONSOR’S CONCLUSIONS:The in vitro protein binding rate of FR264205 in mouse, rat, dog, and human serum as well as in human plasma was measured using an ultrafiltration method with 14C-labeled FR264205. In the FR264205 concentration range of 0.5 – 50 mcg/mL, the protein binding rate was low in all of the species examined: 7.35% - 9.64% for mouse serum, 8.10% - 11.0% for rat serum, 15.96% - 7.48% for dog serum, and 14.57% - 16.76% for human serum. The protein binding in human plasma was 16.27% - 20.84%, which was slightly higher than that in serum.
REVIEWER ASSESSMENT:The protein binding of FR264205 (ceftolozane) is below 25% in all of the species studied. The protein binding ranged from 16-21% in human plasma, which was the highest level of protein binding observed in any of the species studied. The protein binding of ceftolozane was not dependent on the concentration.
Reference ID: 3648317

182
Study Number: PCDM0300305 (CRD040179)
Study Title: Non-Clinical Pharmacokinetics: In Vitro Transfer of FR264205 into Blood Cells in Mice, Rats, Dogs, and Humans
Dates: 1/17/13
Lab Site: Drug Metabolism Research Laboratories Drug Discovery Research, Astellas Pharma Inc. Tokyo, Japan
OBJECTIVES: To determine the in vitro blood to plasma concentration ratio of FR264205 in mice, dogs, and humans by measuring 14C-labeled FR264205.
METHODS:Samples were collected from at least 3 individuals of each species on the day of the experiment and stored at room temperature until used. An equal volume of each of the blood samples collected from the individuals was pooled to yield a volume of approximately 10 mL. A 2 mL aliquot of each of the 10 mL samples was then placed into stock tubes in triplicate. After incubation at 37 °C for approximately 5 min, a 20 µL aliquot of the 0.05, 0.5, or 5 mg/mL standard solution was added to prepare blood samples at the final concentrations of 0.05, 0.5, or 5 mg/mL. A 0.5 mL aliquot of the prepared samples was placed into each of 3 micro test tubes. After incubation at 37 °C for 10 min, the samples were centrifuged at 10,000 rpm for approximately 2 min to separate the plasma for radioactivity measurement. The remaining blood was used for measuring hematocrit values and blood radioactivity.
RESULTS:The in vitro blood to plasma concentration ratio of FR264205 in mice, rats, dogs, and humans are shown in Table 1. The ratio remained almost constant in all of the species in the FR264205 concentration range of 0.5-50 mcg/mL. The values for the ratio obtained were 0.61-0.63 for mice (the mean value of 3 samples, the same hereafter), 0.62-0.69 for rats, 0.55-0.58 for dogs, and 0.60-0.61 for humans.
The percent transfer into blood cells calculated using the hematocrit values are shown in Table 2. In the FR264205 concentration range of 0.5-50 mcg/mL, the values for the percent transfer into blood cells were 9.2%-13.7% (the mean value of 3 samples, the same hereafter), 6.6%-16.0% for rats, 4.3%-9.1% for dogs, and 8.3%-9.8% for humans. The percent transfer into blood cells for all of the species examined was low.
Table 1: In Vitro Blood to Plasma Concentration Ratio of 14C-FR264205
Reference ID: 3648317

183
Table 2: Percent Transfer of 14C-FR264205 into Blood Cells In Vitro
SPONSOR’S CONCLUSIONS:The in vitro blood to plasma concentration ratio of FR264205 in mice, rats, dogs, and humans remained almost constant in the FR264205 concentration range of 0.5 – 50 mcg/mL. The values for the ratio obtained were 0.61-0.63 for mice, 0.62-0.69 for rats, 0.55-0.58 for dogs, and 0.60-0.61 for humans.
The values for the percent transfer into blood cells were 9.2%-13.7% for mice, 6.6%-16.0% for rats, 4.3%-9.1% for dogs, and 8.3%-9.8% for humans. The percent transfer into blood cells for all of the species examined was low.
REVIEWER ASSESSMENT:The Reviewer agrees with the Sponsor’s conclusions.
Reference ID: 3648317

184
4.2IndividualClinicalPharmacologyStudyReviews
Study Title: A Phase 1, Randomized, Double-blind, Dose Escalation Study to Evaluate the Safety, Tolerability, and Pharmacokinetics of Intravenous CXA-101, Tazobactam, and CXA-101/tazobactam Administered to Healthy Adult Subjects (Protocol CXA-201-01)
Dates: Initiated 8/7/09 Completed 10/8/09Investigator: Mark J. Allison, M.D., Tempe, AZAnalysis:
OBJECTIVE:Primary: To evaluate the safety and tolerability of CXA-101/tazobactam in a fixed 2:1 ratio in healthy male and female subjects.Secondary: To characterize the PK profile of CXA-101 and tazobactam (including metabolite M-1) when given individually or in combination in healthy subjects.
BACKGROUND:CXA-101/tazobactam (collectively referred to as CXA-201) is a combination of the investigational cephalosporin CXA-101 and the β-lactamase inhibitor (BLI) tazobactam. Tazobactam was added to the development of CXA-101 to improve its potency against ESBL-producing organisms. Although CXA-101 and tazobactam have been previously administered to humans independently, this represents the first study in which they are co-administered. The components of the combination did not result in increased toxicity in animal studies, and the pharmacokinetics of the components were not altered by co-administration in dogs. Reviewer comment: The purpose of the current study is to confirm that co-administration of CXA-101 (ceftolozane) and tazobactam does not alter the pharmacokinetics of either component compared to when the components are administered separately in humans.
STUDY DESIGN:This Phase 1, randomized, double-blind, dose-escalation study comprised two parts. Part 1 assessed single ascending IV doses of CXA-101, tazobactam, and CXA-101/tazobactam, and Part 2 assessed two different IV dosing regimens of CXA-101, tazobactam, and CXA-101/tazobactam in healthy male and female adult subjects.Part 1 Study DesignIn Part 1, 18 healthy adult subjects (10 male, 8 female) were enrolled in three cohorts of six subjects each. Subjects in each cohort were randomized to one of six dosing sequences and received, in a within-cohort crossover design, each of CXA-101, tazobactam, and CXA-101/tazobactam with a washout period between doses. The study design for Part 1, including doses and dosing sequences is shown schematically in Figure 1.Each dose of study drug in Part 1 was administered as a single 60-minute IV infusion. Subjects were required to fast for at least 10 hours before receiving study drug, and were to refrain from drinking fluids during, and for one hour after infusion of each study drug. For each subject, the
Reference ID: 3648317
(b) (4)
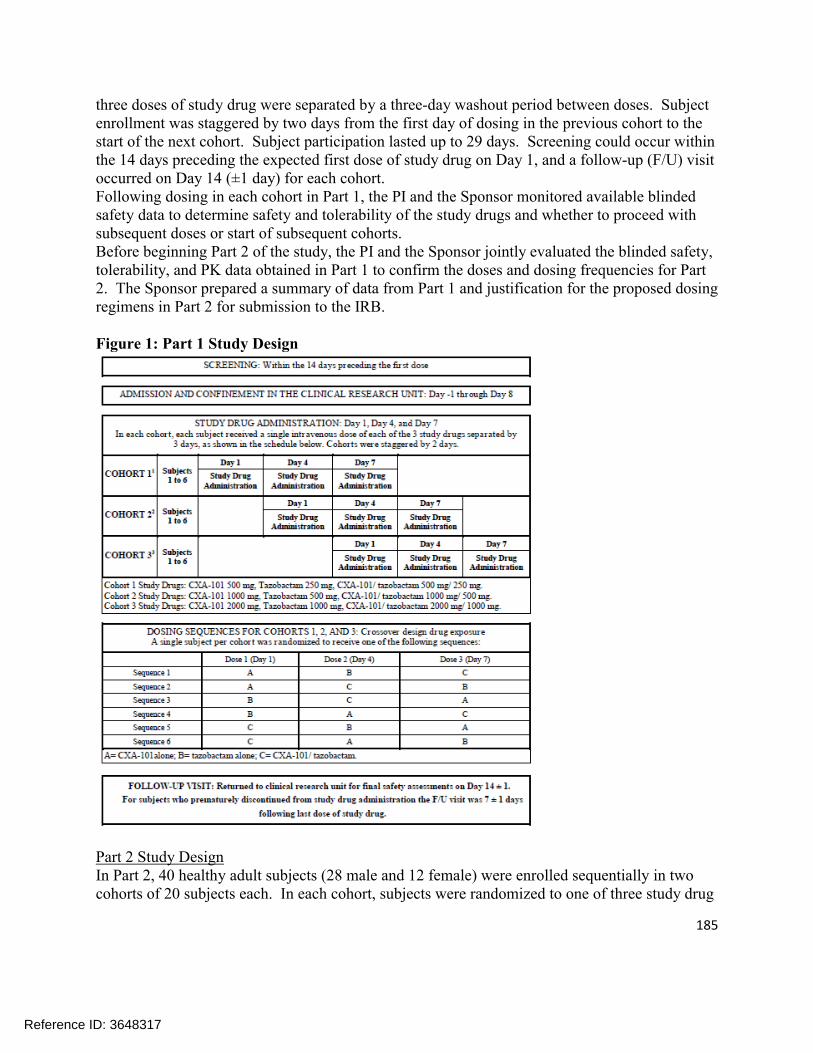
185
three doses of study drug were separated by a three-day washout period between doses. Subject enrollment was staggered by two days from the first day of dosing in the previous cohort to the start of the next cohort. Subject participation lasted up to 29 days. Screening could occur within the 14 days preceding the expected first dose of study drug on Day 1, and a follow-up (F/U) visit occurred on Day 14 (±1 day) for each cohort.Following dosing in each cohort in Part 1, the PI and the Sponsor monitored available blinded safety data to determine safety and tolerability of the study drugs and whether to proceed with subsequent doses or start of subsequent cohorts. Before beginning Part 2 of the study, the PI and the Sponsor jointly evaluated the blinded safety, tolerability, and PK data obtained in Part 1 to confirm the doses and dosing frequencies for Part 2. The Sponsor prepared a summary of data from Part 1 and justification for the proposed dosing regimens in Part 2 for submission to the IRB.
Figure 1: Part 1 Study Design
Part 2 Study DesignIn Part 2, 40 healthy adult subjects (28 male and 12 female) were enrolled sequentially in two cohorts of 20 subjects each. In each cohort, subjects were randomized to one of three study drug
Reference ID: 3648317

186
regimens and received multiple doses of either CXA-101 (N=5), tazobactam (N=5), or CXA-101/tazobactam (N=10). The study design for Part 2, including doses and dosing sequences is shown schematically in Figure 2. The study allowed for one of two different dosing regimens for Cohort 5. The lower dosage regimens of 1500 mg CXA-101, 750 mg tazobactam, and 1500 mg/750 mg CXA-101/tazobactam q12h were chosen because preliminary PK results indicated absence of interaction between CXA-101 and tazobactam. Therefore, the higher dosing regimen was unlikely to be clinically warranted.Each dose of study drug in Part 2 was administered as a 60-minute IV infusion, either q8h or q12h for 10 days. A single dose of study drug was administered on Day 1; two or three daily doses of study drug, as appropriate, on Days 2 through 9; and a single dose on Day 10. Subjects were required to fast for at least 10 hours before receiving the first dose of study drug and were to refrain from drinking fluids during, and for one hour after each infusion of study drug. Cohort 5 was initiated three days after completion of dosing in Cohort 4, after review of blinded safety data from Cohort 1. Subject participation lasted up to 32 days. Screening could occur within the 14 days preceding the expected first dose of study drug on Day 1, and a F/U visit occurred on Day 17 (± 1 day) for each cohort.
Figure 2: Part 2 Study Design
MEHODS AND ASSAY METHODOLOGY:MethodsPharmacokinetic parameters of CXA-101, tazobactam (including metabolite M-1), or both CXA-101 and tazobactam (including metabolite M-1) in plasma were calculated using a validated version of WinNonlin Enterprise (Version 5.2). Statistical analyses to assess drug-drug interaction were performed using SASv9 (PROC MIXED) or WinNonlin version 5.2 (Average Bioequivalence Module). Summary table and figures were generated using WinNonlin AutoPilot (Version 1.1.1.), a configurable software application that works with WinNonlin and third-party reporting tools, including SigmaPlot 2004 for Windows version 9.-1 and Microsoft Office Word and Excel 2007.
Reference ID: 3648317

187
For Parts 1 and 2, plasma and urine samples were assayed for CXA-101, TAZ (tazobactam) and metabolite M-1. The following PK parameters were determined using non-compartmental methods based on the individual plasma concentration-time data for CXA-101, TAZ, and metabolite M-1 for Part 1:
The Accumulation Index was also calculated for Part 2 and was defined as AUC0-tau (Day 10)/AUC0-8 or AUC0-12 (Day1).All PK calculations were performed using actual time points calculated relative to dose. The PK parameters half-life, AUC0-inf, CL, and Vss in plasma were not calculated for patients with concentration-time profiles that did not exhibit a terminal log-linear phase. The following PK parameters were determined using non-compartmental methods based on the individual urine concentration-time data for CXA-101, TAZ, and metabolite M-1
Reference ID: 3648317
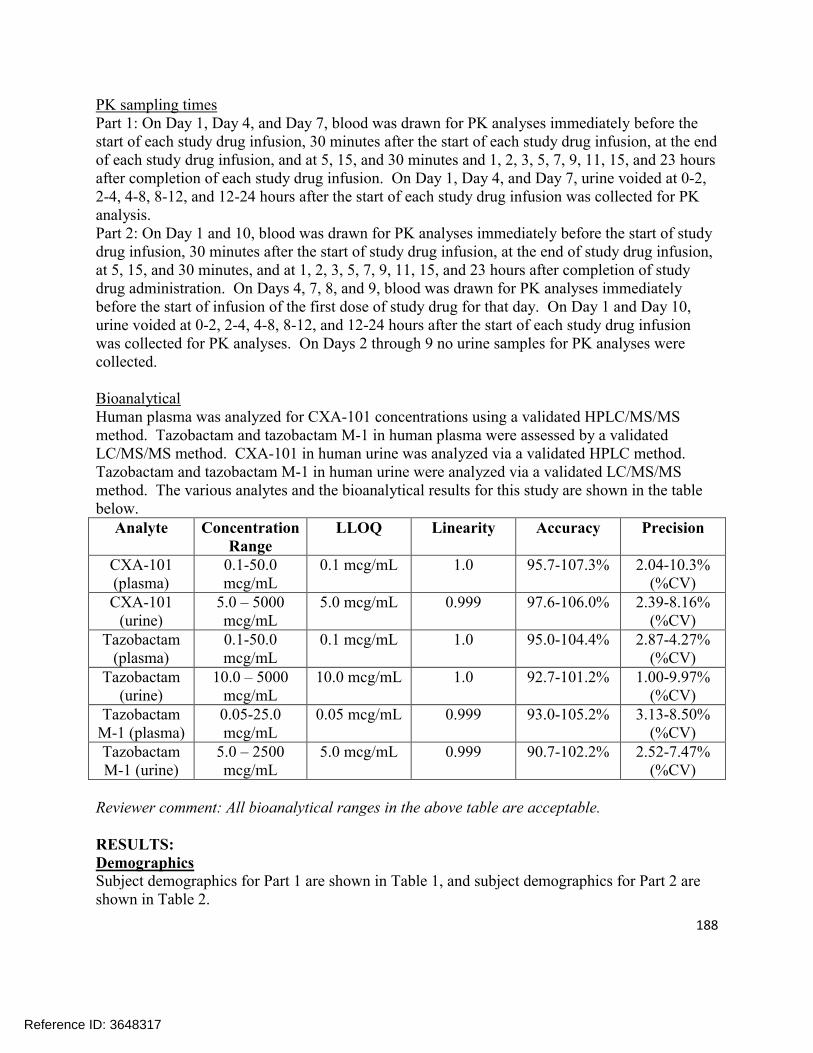
188
PK sampling timesPart 1: On Day 1, Day 4, and Day 7, blood was drawn for PK analyses immediately before the start of each study drug infusion, 30 minutes after the start of each study drug infusion, at the end of each study drug infusion, and at 5, 15, and 30 minutes and 1, 2, 3, 5, 7, 9, 11, 15, and 23 hours after completion of each study drug infusion. On Day 1, Day 4, and Day 7, urine voided at 0-2, 2-4, 4-8, 8-12, and 12-24 hours after the start of each study drug infusion was collected for PK analysis.Part 2: On Day 1 and 10, blood was drawn for PK analyses immediately before the start of study drug infusion, 30 minutes after the start of study drug infusion, at the end of study drug infusion, at 5, 15, and 30 minutes, and at 1, 2, 3, 5, 7, 9, 11, 15, and 23 hours after completion of study drug administration. On Days 4, 7, 8, and 9, blood was drawn for PK analyses immediately before the start of infusion of the first dose of study drug for that day. On Day 1 and Day 10, urine voided at 0-2, 2-4, 4-8, 8-12, and 12-24 hours after the start of each study drug infusion was collected for PK analyses. On Days 2 through 9 no urine samples for PK analyses were collected.
BioanalyticalHuman plasma was analyzed for CXA-101 concentrations using a validated HPLC/MS/MS method. Tazobactam and tazobactam M-1 in human plasma were assessed by a validated LC/MS/MS method. CXA-101 in human urine was analyzed via a validated HPLC method. Tazobactam and tazobactam M-1 in human urine were analyzed via a validated LC/MS/MS method. The various analytes and the bioanalytical results for this study are shown in the table below.
Analyte Concentration Range
LLOQ Linearity Accuracy Precision
CXA-101 (plasma)
0.1-50.0 mcg/mL
0.1 mcg/mL 1.0 95.7-107.3% 2.04-10.3% (%CV)
CXA-101 (urine)
5.0 – 5000 mcg/mL
5.0 mcg/mL 0.999 97.6-106.0% 2.39-8.16% (%CV)
Tazobactam (plasma)
0.1-50.0 mcg/mL
0.1 mcg/mL 1.0 95.0-104.4% 2.87-4.27% (%CV)
Tazobactam (urine)
10.0 – 5000 mcg/mL
10.0 mcg/mL 1.0 92.7-101.2% 1.00-9.97% (%CV)
Tazobactam M-1 (plasma)
0.05-25.0 mcg/mL
0.05 mcg/mL 0.999 93.0-105.2% 3.13-8.50% (%CV)
Tazobactam M-1 (urine)
5.0 – 2500 mcg/mL
5.0 mcg/mL 0.999 90.7-102.2% 2.52-7.47% (%CV)
Reviewer comment: All bioanalytical ranges in the above table are acceptable.
RESULTS:DemographicsSubject demographics for Part 1 are shown in Table 1, and subject demographics for Part 2 are shown in Table 2.
Reference ID: 3648317

189
Table 1: Demographic and Baseline Characteristic of Subjects in Part 1
Table 2: Demographic and Baseline Characteristics of Subjects in Part 2
Reference ID: 3648317

190
PharmacokineticsOverall, 58 subjects (18 in Part 1 and 40 in Part 2) were enrolled in the study and received study treatment. Fifty-seven of the 58 subjects completed the study (one subject enrolled in Part 2 withdrew consent on Study Day 6 due to a family emergency).
Part 1Ceftolozane plasma concentrations following the end of infusion declined in a biphasic manner (see Figure 3). Ceftolozane co-administered with tazobactam demonstrated linear PK in the 500 to 2000 mg dose range when administered as a single dose. Cmax and AUC of ceftolozane were comparable with and without tazobactam, indicating that co-administration of ceftolozane with tazobactam did not influence the pharmacokinetics of ceftolozane. The mean CLR of ceftolozane across all doses alone or with tazobactam was similar to CL (see Table 3). Almost all (>99%) of the administered dose of ceftolozane was recovered in the urine as unchanged drug when ceftolozane was given alone or with tazobactam.
Reference ID: 3648317
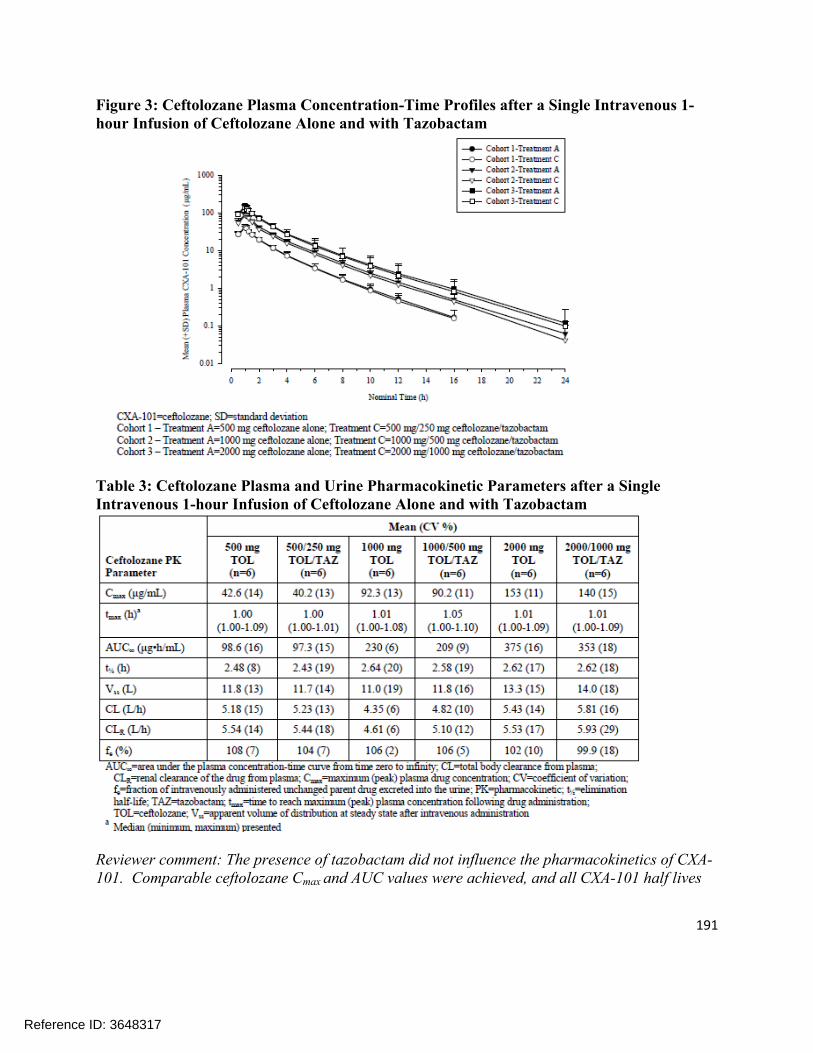
191
Figure 3: Ceftolozane Plasma Concentration-Time Profiles after a Single Intravenous 1-hour Infusion of Ceftolozane Alone and with Tazobactam
Table 3: Ceftolozane Plasma and Urine Pharmacokinetic Parameters after a Single Intravenous 1-hour Infusion of Ceftolozane Alone and with Tazobactam
Reviewer comment: The presence of tazobactam did not influence the pharmacokinetics of CXA-101. Comparable ceftolozane Cmax and AUC values were achieved, and all CXA-101 half lives
Reference ID: 3648317

192
were in the 2-3 hour range observed in other studies. CL and CLR were also virtually the same for all groups, suggesting that CXA-101 is entirely cleared renally.
Plasma concentration-time profiles of tazobactam and the M1 metabolite of tazobactam following a single IV 1-hour infusion are shown in Figure 4 and Figure 5, respectively. The single dose PK parameters for tazobactam and tazobactam-M1 metabolite are provided in Table 5. Co-administration of ceftolozane and tazobactam did not change the PK of tazobactam or the M1 metabolite of tazobactam.
Figure 4: Tazobactam Concentration-Time Profiles after a Single Intravenous 1-hour Infusion of Tazobactam Alone and with Ceftolozane
Reference ID: 3648317

193
Figure 5: Tazobactam M1 Metabolite Plasma Concentration-Time Profiles after a Single Intravenous 1-hour Infusion of Tazobactam Alone and with Ceftolozane
Part 2Overall, both ceftolozane and tazobactam (including its metabolite M1) PK parameters were unaffected by co-administration. Steady-state appeared to be achieved by the end of Day 3, the first sampled time point after Day 1 (see Figure 6). For the same total daily dose, ceftolozane steady-state plasma concentrations were higher for the every 8 hour dosing regimens compared to the every 12 hour regimen. This supported the every 8 hour dosing regimen due to anticipated greater time as a percentage of the dosing interval that the total drug concentration exceeds the MIC (%T>MIC) for this regimen.
The mean half-life of ceftolozane alone or with tazobactam remained unchanged (approximately 2 to 3 hours). As well, mean CL and Vss of ceftolozane alone or with tazobactam remained unchanged across all doses following 10 days of dosing. The CLR of ceftolozane was similar to the CL. As anticipated with a 3-hour half-life, there was no clinically relevant accumulation upon multiple dosing.
The mean half-life of tazobactam alone or with ceftolozane remained unchanged (approximately 1 hour). The urinary excretion of ceftolozane and tazobactam was unaffected by the co-administration of the 2 drugs. As expected, tazobactam did not accumulate but the M1 metabolite, which lacks pharmacological and antibacterial activity exhibited slight accumulation after multiple dosing. The Cmax for the M1 metabolite occurred between 2 and 3 hours after the end of infusion.
Reference ID: 3648317

194
For the 1.5 mg dose of ceftolozane/tazobactam, the single dose exposure (Cmax and AUC) was higher in Part 1 of the study compared to that on Day 1 of Part 2. Consistent with this observation, CL was higher in Part 2 on Day 1 compared to that in Part 1. The CLCR for subjects in Part 2 (median 142 mL/min) was also higher than that in subjects from Part 1 (median 114 mL/min). Due to renal elimination, the plasma CL and CLR for ceftolozane increases with increasing CLCR, therefore, the higher CL and consequently lower observed ceftolozane exposure in Part 2, Day 1 was consistent with the higher observed CLCR in Part 2.
Figure 6: Ceftolozane Plasma Concentration-Time Profiles after Single and Multiple Intravenous 1-hour Infusions of Ceftolozane Alone or with Tazobactam
Reference ID: 3648317

195
Table 4: Ceftolozane Plasma and Urine Pharmacokinetic Parameters after Single (Day 1) and Multiple (Day 10) Intravenous 1-hour Infusions of Ceftolozane Alone and with Tazobactam
Reviewer comment: Similar to the single dose results from Part 1, CXA-101 Cmax and AUC were not affected by the co-administration of tazobactam over the course of multiple doses.
Reference ID: 3648317

196
Table 5: Plasma and Urine Pharmacokinetic Parameters for Tazobactam and its Major Metabolite M1 after Single (Day 1) and Multiple (Day 10) Intravenous 1-hour Infusions of Tazobactam Alone and with Ceftolozane
Reviewer comment: Tazobactam and tazobactam M-1 Cmax and AUC were not affected by the presence of ceftolozane. Tazobactam showed no evidence of accumulation following multiple dosing, consistent with its ~1 hour half-life; tazobactam M-1 metabolite showed a slight accumulation with multiple dosing, consistent with its 3.5-4 hour half-life.
Reference ID: 3648317

197
SafetyNo SAEs and no deaths were reported during the study. No subjects discontinued the trial due to an adverse event (one subject withdrew consent for personal reasons during Part 2).In Part 1, 10 (56%) of the 18 subjects experienced at least one AE, with a total of 16 AEs reported. Of these AEs, 15 (94%) were judged by the PI to be mild in severity and one was moderate (generalized body aches); three (19%) were judged related to study drug administration, and 13 (82%) were unrelated.
In Part 2, 29 (73%) of the 40 subjects experienced at least one AE, with a total of 95 AEs reported. Of these, 94 (99%) were judged by the PI to be mild in severity and one was moderate (menstrual cramps); 47 (50%) were judged unrelated to study drug administration and 48 (50%) were related. Of the 48 related AEs, 33 (69%) involved the site of IV infusion. Adverse events reported in Part 2 showed no particular pattern of occurrence with respect to cohort or study drug regimen. Mild IV infusion-related events were the most common AEs observed in subjects receiving multiple doses and occurred in all study drug treatment groups.
APPLICANT’S CONCLUSION:The data presented in this report show that single doses of CXA-101 from 500 mg to 2000 mg, single doses of tazobactam from 250 mg to 1000 mg, and single doses of CXA-101/tazobactam from 500 mg/250mg to 2000mg/1000mg were generally safe and well tolerated by healthy adult male and female subjects. The data also show that multiple doses of CXA-101, 1000 mg q8h and 1500 mg q12h administered over ten days; multiple doses of tazobactam, 500 mg q8h and 750 mg q12h administered over ten days; and multiple doses of CXA-101/tazobactam, 1000mg/500 mg q8h and 1500mg/750 mg q12h administered over ten days were generally safe and well-tolerated by healthy adult male and female subjects.
Systemic drug-related AEs were uncommon and mild in all dosing groups. Mild IV infusion-related events were the most common AEs observed in subjects receiving multiple doses and occurred in all study drug treatment groups. The nature and incidence of AEs did not appear to be dose-related. No dose-limiting toxicity was identified in healthy adult subjects with the doses evaluated.
REVIWER ASSESSMENT:The Reviewer concurs with the Sponsor’s assessment that there is no drug interaction between ceftolozane and tazobactam. The Cmax and AUC of the respective compounds are very similar when administered together as when they are administered alone. The pharmacokinetic parameters showed dose proportional increases in Cmax and AUC suggesting linear pharmacokinetics. CXA-101 and tazobactam did not show accumulation following multiple doses. Tazobactam M-1 showed some accumulation following multiple dosing consistent with its slightly longer half-life. Ceftolozane and tazobactam appeared to be well tolerated with no subjects discontinuing due to an adverse event, and the majority of the adverse events deemed to be mild.
Reference ID: 3648317

198
A Phase 1, Open-label, Pharmacokinetic, Safety, and Tolerability Study of a Single Intravenous Dose of CXA-101/Tazobactam in Subjects with Normal Renal Function or Mild or Moderate Renal Impairment (CXA-201-02)
Dates: October 26, 2009 to June 28, 2010Investigator: Multi-center (Sponsor Signatory Ian Friedland, MD, Lexington, MA)Analysis:
OBJECTIVES:The objectives of this study were to:
Evaluate the safety and tolerability of a single IV administration of CXA-101/tazobactam in subjects with normal renal function or mild or moderate renal impairment
Evaluate the PK of a single IV administration of CXA-101/tazobactam in subjects with normal renal function or mild or moderate renal impairment
BACKGROUND:CXA-101 (also referred to as ceftolozane) and tazobactam are both primarily renally excreted. CXA-101 is not thought to be metabolized, and is entirely excreted unchanged. Tazobactam is primarily excreted unchanged, but is also partially metabolized to tazobactam M-1 (20% or less), which is then also excreted in the urine. This Phase 1 study was performed to determine whether dose adjustment would be required for subjects with mild or moderate renal impairment receiving the CXA-101/tazobactam combination.
STUDY DESIGN:Study CXA-201-02 was a Phase 1, multicenter, open-label safety, tolerability, and PK study of a 60-minute IV infusion of CXA-101/tazobactam (1000 mg/500 mg) in subjects with normal renal function or mild or moderate renal impairment. The planned sample size was 24 subjects. Using the Cockcroft-Gault formula to estimate creatinine clearance (CrCl), 4 groups of 6 subjects each were enrolled in the following cohorts:
Creatinine clearance was measured directly once during Day -1 to Day 3.
At least 2 men and 2 women were enrolled in each cohort. Subjects with normal renal function were individually matched to the subjects with mild or moderate renal impairment for age (target: ± 10 years), gender, and body mass index (BMI) (target: ± 20%).
All cohorts were enrolled concurrently. Subjects with normal renal function were enrolled after their matched subject in the mild or moderate renal impairment cohort completed Day 3 assessments.All subjects received a single IV infusion of CXA-101/tazobactam on Day 1 and remained in the CRU until Day 3 (at least 48 hours after study drug infusion). Urine specimens were collected for direct measurement of CrCl after admission and before their discharge from the clinic on Day 3.
Reference ID: 3648317
(b) (4)
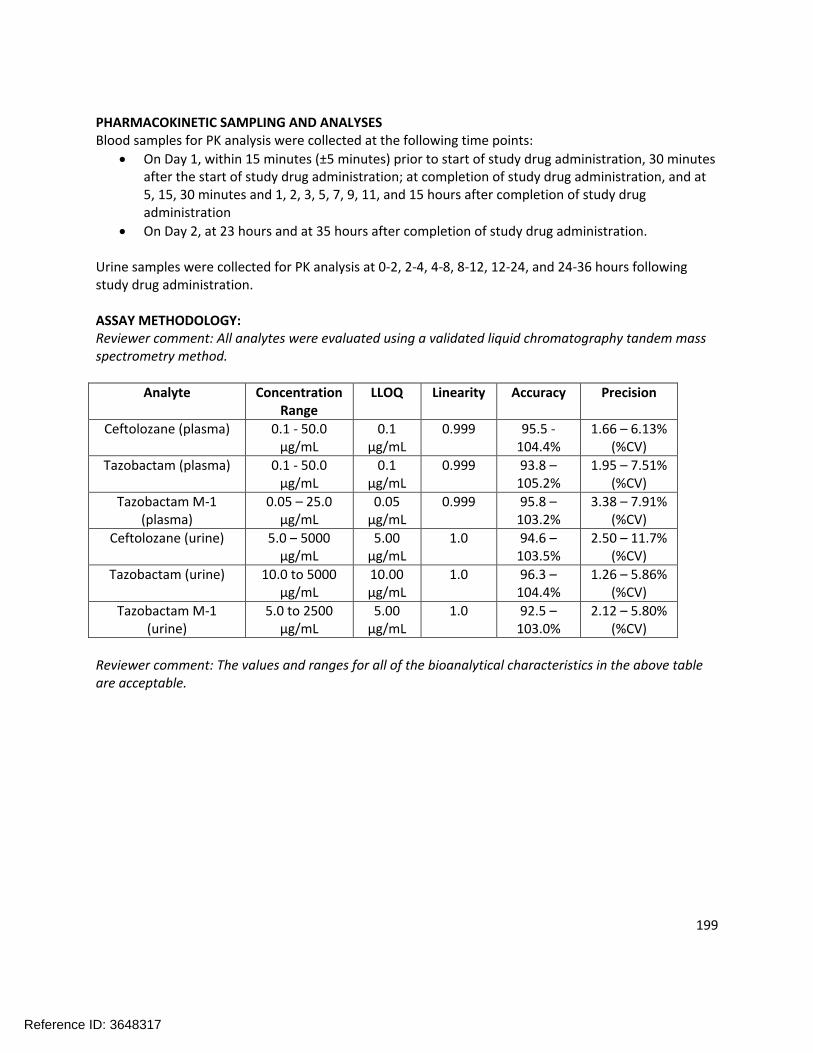
199
PHARMACOKINETIC SAMPLING AND ANALYSESBlood samples for PK analysis were collected at the following time points:
On Day 1, within 15 minutes (±5 minutes) prior to start of study drug administration, 30 minutes after the start of study drug administration; at completion of study drug administration, and at 5, 15, 30 minutes and 1, 2, 3, 5, 7, 9, 11, and 15 hours after completion of study drug administration
On Day 2, at 23 hours and at 35 hours after completion of study drug administration.
Urine samples were collected for PK analysis at 0-2, 2-4, 4-8, 8-12, 12-24, and 24-36 hours following study drug administration.
ASSAY METHODOLOGY:Reviewer comment: All analytes were evaluated using a validated liquid chromatography tandem mass spectrometry method.
Analyte Concentration Range
LLOQ Linearity Accuracy Precision
Ceftolozane (plasma) 0.1 - 50.0 µg/mL
0.1 µg/mL
0.999 95.5 -104.4%
1.66 – 6.13% (%CV)
Tazobactam (plasma) 0.1 - 50.0 µg/mL
0.1 µg/mL
0.999 93.8 –105.2%
1.95 – 7.51% (%CV)
Tazobactam M-1 (plasma)
0.05 – 25.0 µg/mL
0.05 µg/mL
0.999 95.8 –103.2%
3.38 – 7.91% (%CV)
Ceftolozane (urine) 5.0 – 5000 µg/mL
5.00 µg/mL
1.0 94.6 –103.5%
2.50 – 11.7% (%CV)
Tazobactam (urine) 10.0 to 5000 µg/mL
10.00 µg/mL
1.0 96.3 –104.4%
1.26 – 5.86% (%CV)
Tazobactam M-1 (urine)
5.0 to 2500 µg/mL
5.00 µg/mL
1.0 92.5 –103.0%
2.12 – 5.80% (%CV)
Reviewer comment: The values and ranges for all of the bioanalytical characteristics in the above table are acceptable.
Reference ID: 3648317

200
RESULTS:DemographicsThe demographic characteristics of the study population are presented in Table 1 across the 4 study cohorts.
Table 1: Demographic Characteristics
Reviewer comment: Subjects were enrolled into CrCl groups based on the 1998 FDA guidance for conducting pharmacokinetic studies in patients with impaired renal function. Following issuance of a new draft guidance in March 2010, subjects were reclassified for analysis based on calculated CrCl using the new FDA guidelines. Two subjects required reclassification: Subject 002-012 (CrCL of 88.9 mL/min) was reclassified from the normal renal function group into the mild renal impairment group and Subject 002-003 (CrCL of 50.2 mL/min) was reclassified from the mild renal impairment group into the moderate renal impairment group.
Pharmacokinetic ResultsMean concentration-time profiles for CXA-101 in subjects with mild renal impairment versus matched controls and subjects with moderate renal impairment and matched controls following a single dose of CXA-101/tazobactam (1000/500) are provided in Figure 1. The resulting pharmacokinetic parameters are shown in Table 2.
Reference ID: 3648317

201
Figure 1: Mean (SD) Concentration-Time Profiles of CXA-101 in Plasma
Table 2: Mean (CV%) PK Parameters of CXA-101 in Plasma Following a Single IV Dose of CXA-101/Tazobactam 1000/500 mg
Reviewer comment: Subjects with mild renal impairment showed some separation from their demographically-matched normal renal function group. Mean AUC0-inf of ceftolozane was increased by approximately 25% and the mean ceftolozane Cmax was increased by approximately 30% in subjects with mild renal impairment as compared to the subjects with normal renal function. It should be noted that the highest individual Cmax value for the normal renal function matched to the mild renal impairment group was 95.8 mcg/mL whereas all of the other groups included at least one subject above a Cmax of 130 mcg/mL. Given the low number of subjects in this study, that may make the observed difference in Cmax
appear larger than it is between these groups. From a safety standpoint, an exposure increase of 25% does not represent an area of concern since we know that ceftolozane is tolerated at higher doses. The efficacy of ceftolozane should not be adversely affected by an exposure increase of 25%; if anything, the efficacy may improve since the T>MIC should increase. The Reviewer concurs with the Sponsor that a dose adjustment in patients with mild renal impairment is not necessary.
Reference ID: 3648317
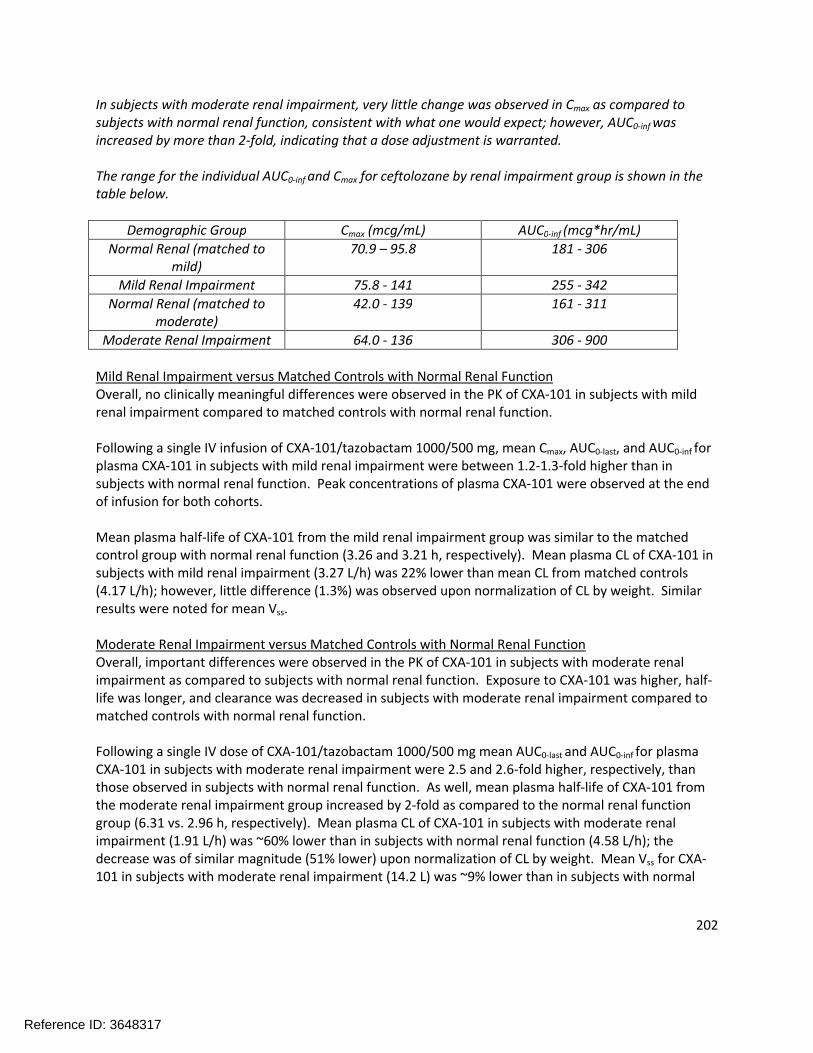
202
In subjects with moderate renal impairment, very little change was observed in Cmax as compared to subjects with normal renal function, consistent with what one would expect; however, AUC0-inf was increased by more than 2-fold, indicating that a dose adjustment is warranted.
The range for the individual AUC0-inf and Cmax for ceftolozane by renal impairment group is shown in the table below.
Demographic Group Cmax (mcg/mL) AUC0-inf (mcg*hr/mL)
Normal Renal (matched to mild)
70.9 – 95.8 181 - 306
Mild Renal Impairment 75.8 - 141 255 - 342
Normal Renal (matched to moderate)
42.0 - 139 161 - 311
Moderate Renal Impairment 64.0 - 136 306 - 900
Mild Renal Impairment versus Matched Controls with Normal Renal FunctionOverall, no clinically meaningful differences were observed in the PK of CXA-101 in subjects with mild renal impairment compared to matched controls with normal renal function.
Following a single IV infusion of CXA-101/tazobactam 1000/500 mg, mean Cmax, AUC0-last, and AUC0-inf for plasma CXA-101 in subjects with mild renal impairment were between 1.2-1.3-fold higher than in subjects with normal renal function. Peak concentrations of plasma CXA-101 were observed at the end of infusion for both cohorts.
Mean plasma half-life of CXA-101 from the mild renal impairment group was similar to the matched control group with normal renal function (3.26 and 3.21 h, respectively). Mean plasma CL of CXA-101 in subjects with mild renal impairment (3.27 L/h) was 22% lower than mean CL from matched controls (4.17 L/h); however, little difference (1.3%) was observed upon normalization of CL by weight. Similar results were noted for mean Vss.
Moderate Renal Impairment versus Matched Controls with Normal Renal FunctionOverall, important differences were observed in the PK of CXA-101 in subjects with moderate renal impairment as compared to subjects with normal renal function. Exposure to CXA-101 was higher, half-life was longer, and clearance was decreased in subjects with moderate renal impairment compared to matched controls with normal renal function.
Following a single IV dose of CXA-101/tazobactam 1000/500 mg mean AUC0-last and AUC0-inf for plasmaCXA-101 in subjects with moderate renal impairment were 2.5 and 2.6-fold higher, respectively, than those observed in subjects with normal renal function. As well, mean plasma half-life of CXA-101 from the moderate renal impairment group increased by 2-fold as compared to the normal renal function group (6.31 vs. 2.96 h, respectively). Mean plasma CL of CXA-101 in subjects with moderate renal impairment (1.91 L/h) was ~60% lower than in subjects with normal renal function (4.58 L/h); the decrease was of similar magnitude (51% lower) upon normalization of CL by weight. Mean Vss for CXA-101 in subjects with moderate renal impairment (14.2 L) was ~9% lower than in subjects with normal
Reference ID: 3648317

203
renal function (15.6 L); little difference (1%) was observed for the same comparison after normalization of Vss by weight.
Urine Pharmacokinetics for CeftolozaneMean CLr of CXA-101 in subjects with mild renal impairment (3.26 L/h) was 14% lower than for the matched control group (3.77 L/h). In subjects with moderate renal impairment (1.60 L/h), the decrease in mean CLr of CXA-101 was 54% as compared to the matched control group (3.48 L/h).
The mean percent CXA-101 recovered in urine over 36 hours was similar in the mild renal impairment group and the matched control group with normal renal function, with over 90% recovery. Although the mean percent CXA-101 recovered in urine over 36 hours also was similar in the moderate renal impairment group and the matched control group, results should be interpreted with caution. Three subjects in this matched control group displayed urine recoveries over 36 hours post-dose of <61%. Mean urine recovery of CXA-101 over 36 hours post-dose was slightly reduced (78%) in subjects with moderate renal impairment relative to the greater than 90% urine recover found in historical data from subjects with normal renal function. Three subjects with moderate renal impairment (Subjects 002-009, 004-002, and 004-003) were excluded from the analyses due to incomplete urine collection over 36 hours post dose. In general, subjects with moderate renal impairment showed urinary recovery in the range of 85-95% within 36 hours, except for one subject (Subject 004-001) who exhibited only 42% urinary recovery.
Reviewer comment: There are sufficient data from this trial and other trials conducted in support of this NDA to say with confidence that the vast majority of ceftolozane is excreted unchanged in the urine. While the incomplete urine collection of some subjects is unfortunate, this overall conclusion remains valid.
Reference ID: 3648317

204
Relationship Between Creatinine Clearance and Pharmacokinetics of CXA-101The relationship between CrCl and CXA-101 primary PK parameters (Cmax, AUC0-last, AUC0-inf and plasma and renal clearance) are presented in Figure 2.
Figure 2: Relationship Between Creatinine Clearance and Primary PK Parameters
Reviewer comment: These plots indicate the expected relationships for an intravenously administered and renally excreted drug - a relatively flat Cmax across renal function groups and decreasing exposure with increasing renal function.
Tazobactam plasma pharmacokineticsMean concentration-time profiles for tazobactam in subjects with mild renal impairment versus matched controls and subjects with moderate renal impairment and matched controls following a single dose of CXA-101/tazobactam 1000/500 mg are provided in Figure 3.
Mean tazobactam concentrations declined in a multi-exponential fashion after the end of the infusion and remained above the LLOQ of the assay (0.100 µg/mL, dashed line) up to 8 hours after the start of infusion for all cohorts with the exception of the moderate renal impairment group where mean concentrations remained above the LLOQ for up to 16 hours.
Reference ID: 3648317
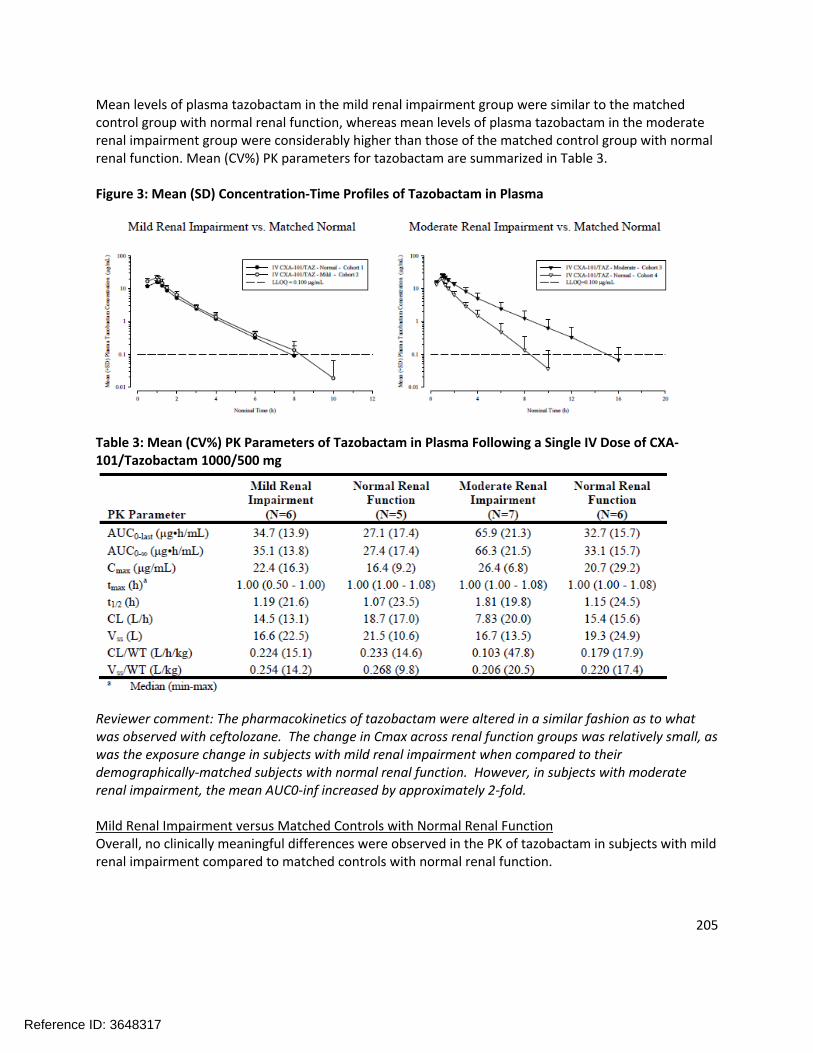
205
Mean levels of plasma tazobactam in the mild renal impairment group were similar to the matched control group with normal renal function, whereas mean levels of plasma tazobactam in the moderate renal impairment group were considerably higher than those of the matched control group with normal renal function. Mean (CV%) PK parameters for tazobactam are summarized in Table 3.
Figure 3: Mean (SD) Concentration-Time Profiles of Tazobactam in Plasma
Table 3: Mean (CV%) PK Parameters of Tazobactam in Plasma Following a Single IV Dose of CXA-101/Tazobactam 1000/500 mg
Reviewer comment: The pharmacokinetics of tazobactam were altered in a similar fashion as to what was observed with ceftolozane. The change in Cmax across renal function groups was relatively small, as was the exposure change in subjects with mild renal impairment when compared to their demographically-matched subjects with normal renal function. However, in subjects with moderate renal impairment, the mean AUC0-inf increased by approximately 2-fold.
Mild Renal Impairment versus Matched Controls with Normal Renal FunctionOverall, no clinically meaningful differences were observed in the PK of tazobactam in subjects with mild renal impairment compared to matched controls with normal renal function.
Reference ID: 3648317

206
Following a single IV dose of CXA-101/tazobactam 1000/500 mg, mean rate and extent of exposure (Cmax, AUC0-last, and AUC0-inf) to tazobactam in subjects with mild renal impairment were up to 37% higher than those observed in subjects with normal renal function. Peak concentrations of plasma tazobactam were observed at the end of infusion in both cohorts.
Mean plasma half-life of tazobactam in the mild renal impairment group was similar to the matched control group (1.19 and 1.07 h, respectively). Mean plasma CL and Vss of tazobactam in subjects with mild renal impairment were 22% to 23% lower than the matched controls; however, little difference (3.9% to 5%) was observed after normalization of these parameters by weight.
Moderate Renal Impairment versus Matched Controls with Normal Renal FunctionOverall, important differences were observed in the PK of tazobactam in subjects with moderate renal impairment as compared to subjects with normal renal function. Exposure to tazobactam was higher, half-life was longer, and clearance was decreased in subjects with moderate renal impairment compared to matched controls with normal renal function.
Following a single IV dose of CXA-101/tazobactam 1000/500 mg, mean AUC0-last and AUC0-inf for tazobactam in subjects with moderate renal impairment were 2-fold higher than in matched controls with normal renal function. Mean plasma half-life of tazobactam in the moderate renal impairment group was 1.6-fold longer than the matched control group (1.81 vs. 1.15 h, respectively). Mean plasma CL of tazobactam in subjects with moderate renal impairment (7.83 L/h) decreased 2-fold as compared to the matched control group (15.4 L/h); the decrease was of similar magnitude (1.7-fold lower) after normalization of CL by weight. Mean Vss for tazobactam in subjects with moderate renal impairment (16.7 L) was ~13% lower than in the matched controls (19.3 L); however, little difference (6%) was observed after normalization of Vss by weight.
Urine Pharmacokinetics of TazobactamMean CLr of tazobactam in subjects with mild renal impairment (11.4 L/h) was 12% lower than for the matched control group (13.0 L/h). In subjects with moderate renal impairment (5.37 L/h), the decrease in mean CLr of tazobactam was approximately 2-fold compared to the matched control group (11.6 L/h).
The mean percent of tazobactam recovered in urine over 36 hours was similar between the mild renal impairment group and the matched control group, with mean urine recoveries ranging from 70% to 79%. However, mean urine recovery of tazobactam over the same time period was slightly reduced in subjects with moderate renal impairment (64%) relative to the 75% urine recovery in matched subjects with normal renal function.
Relationship Between Creatinine Clearance and Pharmacokinetics of CXA-101The relationship between CrCL and tazobactam primary PK parameters (Cmax, AUC0-last, AUC0-inf and plasma and renal clearance) are presented in Figure 4
Reference ID: 3648317

207
Figure 4: Primary PK Parameters of Tazobactam vs. Baseline CrCL
Pharmacokinetics of Metabolite M-1Maximum mean plasma metabolite M-1 concentrations were observed 3 hours after the end of the infusion followed by a multi-exponential decline in subjects with mild renal impairment. In subjects with moderate renal impairment, peak plasma concentration of metabolite M-1 was delayed and occurred 5.5 hours after the end of the infusion followed by a multi-exponential decline.
Overall, little difference was observed in the PK of metabolite M-1 in subjects with mild renal impairment compared to subjects with normal renal function.
Subjects with moderate renal impairment displayed increased exposure to metabolite M-1 compared to subjects with normal renal function due to a decrease in CL of tazobactam. Mean AUCmetabolite/AUCparent
ratio for the moderate renal impairment group was 2.6-fold higher than the average for the normal renal function group.
Mean CLr of metabolite M-1 in subjects with mild renal impairment was 24% lower and the mean clearance in subjects with moderate renal impairment was 56% lower than the mean CLr observed for the matched control groups.
The mean percentage of metabolite M-1 recovered in urine over 36 hours was similar between the mild renal impairment group and the matched control group, with mean urine recoveries of approximately
Reference ID: 3648317

208
14%. The mean percentage of metabolite M-1 recovered in urine over 36 hours was 44% greater than for the moderate renal impairment group (Fe(0-36) = 22%) compared to the matched control group (Fe(0-36)
= 15%).
Safety ResultsA total of 24 subjects received a single dose of CXA-101/tazobactam as planned. All 24 subjects completed the study.
Overall, 4 of the 24 subjects experienced at least 1 TEAE during the study including 2 (33.3%) of 6 subjects with mild renal impairment, 1 (20.0%) of 5 subjects with normal renal function in the matched control for moderate renal impairment, and 1 (16.7%) of 6 subjects with normal renal function in the matched control for moderate renal impairment. None of the 7 subjects with moderate renal impairment experienced a TEAE. The display of adverse events is shown in Table 4.
The most common TEAE was headache, reported in 3 subjects overall: 1 each in the mild impairment cohort and the matched control group for this cohort, and 1 in the matched control for the moderate renal impairment group. All other TEAEs were reported in 1 subject each and included diarrhea, injection site hemorrhage and infusion site hemorrhage in the mild renal impairment group and skin laceration in the matched control group for moderate renal impairment.
All TEAEs reported during the study were mild in intensity with the exception of 1 report of moderate headache in subjects with normal renal function in the matched control for moderate renal impairment. No events of severe intensity were reported. No serious adverse events were reported and none of the subjects discontinued due to adverse events.
Table 4: Treatment-emergent Adverse Events by MedDRA SOC and Preferred Term (MITT Population)
Reference ID: 3648317

209
APPLICANT’S CONCLUSION:A single IV dose of CXA-101/tazobactam at a dose of 1000/500 was safe and well tolerated when administered to subjects with mild to moderate renal impairment and matched-control subjects with normal renal function. All reported adverse events were mild to moderate in intensity. The most commonly reported event was headache, which occurred in 3 or the 24 subjects.
All subjects completed the study as planned; no subject discontinued prematurely or was withdrawn from the study for any reason. No treatment-related trends or changes from baseline were observed in clinical laboratory parameters, vital signs, or physical examinations. The incidence of TEAEs was low and no unexpected safety findings were observed.
Overall, no clinically meaningful differences were observed in the plasma pharmacokinetics of CXA-101, tazobactam, or metabolite M-1 in subjects with mild renal impairment (CrCl 60 to 89 mL/min) compared with matched controls with normal renal function following a single dose of CXA-101/tazobactam 1000 mg/500 mg. This indicates that dosage adjustment may not be required in subjects with mild renal impairment. Based on an increase in systemic exposure (Cmax, AUC0-last, and AUC0-inf) of CXA-101, tazobactam, and metabolite M-1 in plasma for subjects with moderate renal impairment (CrCl 30 to 59 mL/min), dose reduction of 50% may be required to achieve plasma concentrations that are comparable to those observed in subjects with normal renal function.
REVIEWER ASSESSMENT:The Reviewer concurs with the Sponsor’s conclusions. The impact of mild renal impairment on the pharmacokinetics of ceftolozane and tazobactam was not of sufficient magnitude to warrant a dose adjustment. However, the AUC0-inf of both ceftolozane and tazobactam was increased by at least 2-fold in subjects with moderate hepatic impairment, suggesting a dose adjustment is necessary.
Reference ID: 3648317
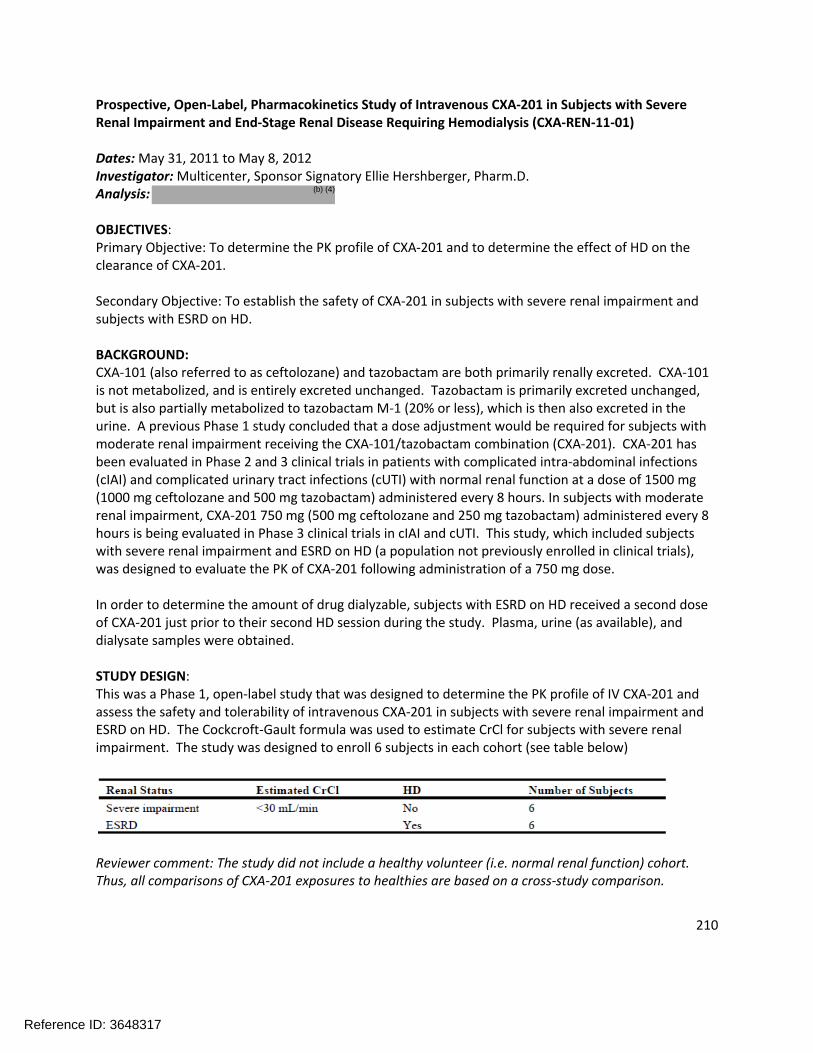
210
Prospective, Open-Label, Pharmacokinetics Study of Intravenous CXA-201 in Subjects with Severe Renal Impairment and End-Stage Renal Disease Requiring Hemodialysis (CXA-REN-11-01)
Dates: May 31, 2011 to May 8, 2012Investigator: Multicenter, Sponsor Signatory Ellie Hershberger, Pharm.D.Analysis:
OBJECTIVES:Primary Objective: To determine the PK profile of CXA-201 and to determine the effect of HD on the clearance of CXA-201.
Secondary Objective: To establish the safety of CXA-201 in subjects with severe renal impairment and subjects with ESRD on HD.
BACKGROUND:CXA-101 (also referred to as ceftolozane) and tazobactam are both primarily renally excreted. CXA-101 is not metabolized, and is entirely excreted unchanged. Tazobactam is primarily excreted unchanged, but is also partially metabolized to tazobactam M-1 (20% or less), which is then also excreted in the urine. A previous Phase 1 study concluded that a dose adjustment would be required for subjects with moderate renal impairment receiving the CXA-101/tazobactam combination (CXA-201). CXA-201 has been evaluated in Phase 2 and 3 clinical trials in patients with complicated intra-abdominal infections (cIAI) and complicated urinary tract infections (cUTI) with normal renal function at a dose of 1500 mg (1000 mg ceftolozane and 500 mg tazobactam) administered every 8 hours. In subjects with moderate renal impairment, CXA-201 750 mg (500 mg ceftolozane and 250 mg tazobactam) administered every 8 hours is being evaluated in Phase 3 clinical trials in cIAI and cUTI. This study, which included subjects with severe renal impairment and ESRD on HD (a population not previously enrolled in clinical trials), was designed to evaluate the PK of CXA-201 following administration of a 750 mg dose.
In order to determine the amount of drug dialyzable, subjects with ESRD on HD received a second dose of CXA-201 just prior to their second HD session during the study. Plasma, urine (as available), and dialysate samples were obtained.
STUDY DESIGN:This was a Phase 1, open-label study that was designed to determine the PK profile of IV CXA-201 and assess the safety and tolerability of intravenous CXA-201 in subjects with severe renal impairment andESRD on HD. The Cockcroft-Gault formula was used to estimate CrCl for subjects with severe renal impairment. The study was designed to enroll 6 subjects in each cohort (see table below)
Reviewer comment: The study did not include a healthy volunteer (i.e. normal renal function) cohort. Thus, all comparisons of CXA-201 exposures to healthies are based on a cross-study comparison.
Reference ID: 3648317
(b) (4)

211
Screening assessments for study qualification were performed within 21 days prior to Baseline. Baseline assessments occurred within 24 hours prior to the start of study drug administration.
Subjects with severe renal impairment received a single IV dose of 750 mg CXA-201 as a 1-hour infusion on Day 1 and remained in the Clinical Research Unit (CRU) until Day 3 (at least 48 hours after drug infusion). Subjects had a follow-up visit 7 (±1) days after discharge.
Subjects with chronic ESRD on HD should have had a minimum of 3 months of HD prior to enrollment. Subjects should have been on 4-hour sessions of intermittent (3 times per week [approximately 48 hours, 48 hours, and 72 hours between sessions]) high-flux HD and received an IV dose of 750 mg CXA-201 as a 1-hour infusion immediately after their first HD session on Day 1 (approximately 72 hours prior to the next HD session). Subjects with ESRD received a second dose of 750 mg CXA-201 approximately 2 hours before their second HD session on Day 4 of the study. Infusion of CXA-201 was completed approximately 1 hour before the start of HD. Subjects with ESRD remained in the CRU until Day 6, with a follow-up visit 7 (±1) days after discharge.
Safety was assessed by monitoring for AEs/serious AEs (SAEs) from the first dose of drug through the last study evaluation, review of vital signs, physical examination findings, 12-lead electrocardiogram (ECG) results, and clinical laboratory results. Plasma, urine, and dialysate fluid samples were obtained, if applicable, for PK analysis prior to and following administration of CXA-201 at protocol specified time points. Figure 1 indicates the relative timing of events (HD, study drug administration, and PK sampling) for ESRD on HD.
Figure 1: Timing of HD, Study Drug Administration, and PK Sampling for Subjects with ESRD on HD
Reference ID: 3648317
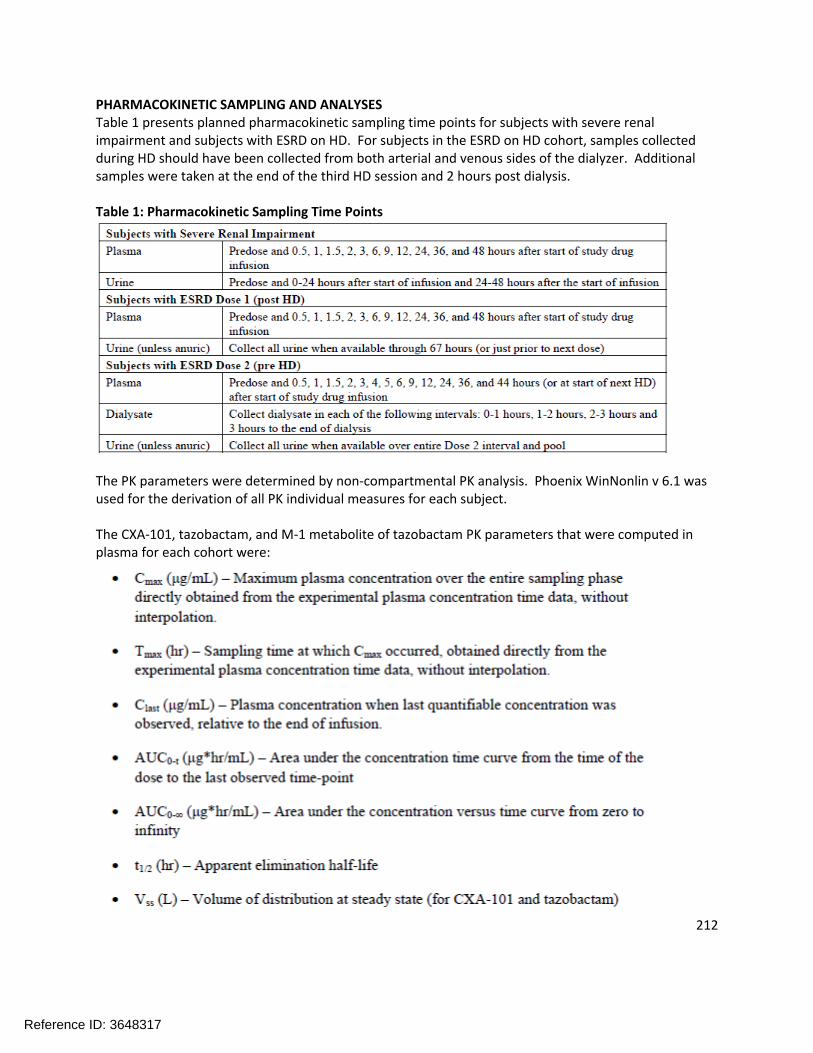
212
PHARMACOKINETIC SAMPLING AND ANALYSESTable 1 presents planned pharmacokinetic sampling time points for subjects with severe renal impairment and subjects with ESRD on HD. For subjects in the ESRD on HD cohort, samples collected during HD should have been collected from both arterial and venous sides of the dialyzer. Additional samples were taken at the end of the third HD session and 2 hours post dialysis.
Table 1: Pharmacokinetic Sampling Time Points
The PK parameters were determined by non-compartmental PK analysis. Phoenix WinNonlin v 6.1 was used for the derivation of all PK individual measures for each subject.
The CXA-101, tazobactam, and M-1 metabolite of tazobactam PK parameters that were computed in plasma for each cohort were:
Reference ID: 3648317
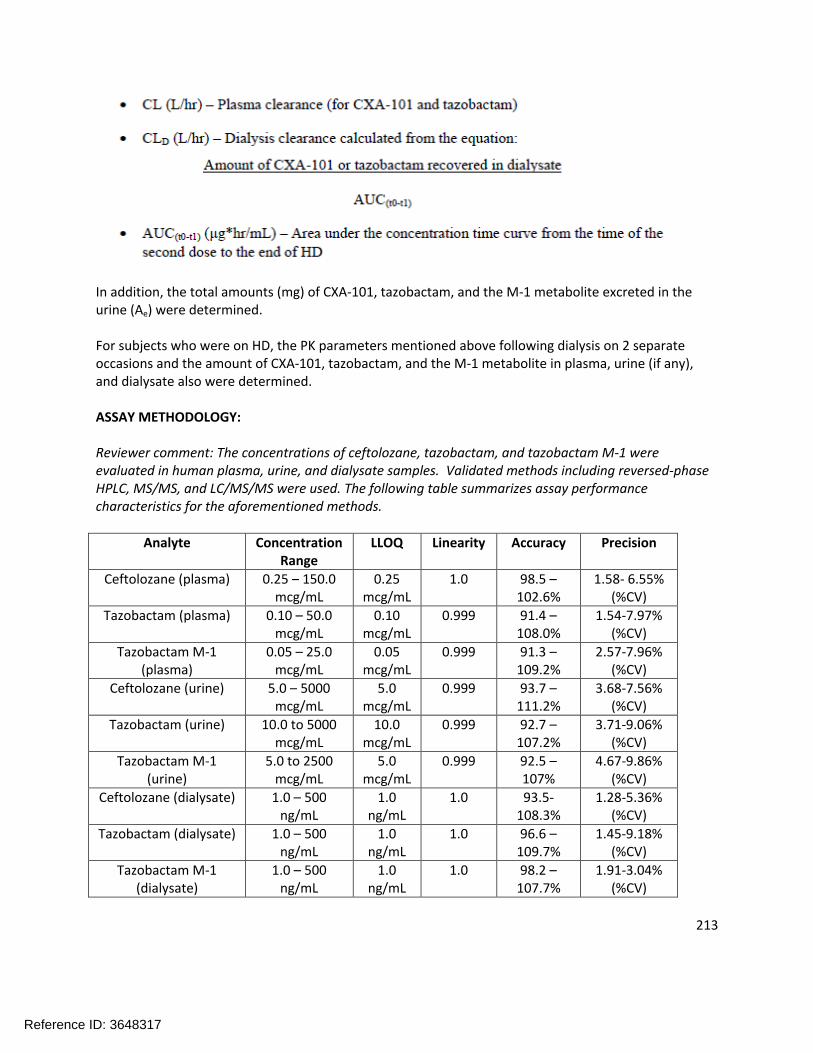
213
In addition, the total amounts (mg) of CXA-101, tazobactam, and the M-1 metabolite excreted in the urine (Ae) were determined.
For subjects who were on HD, the PK parameters mentioned above following dialysis on 2 separate occasions and the amount of CXA-101, tazobactam, and the M-1 metabolite in plasma, urine (if any), and dialysate also were determined.
ASSAY METHODOLOGY:
Reviewer comment: The concentrations of ceftolozane, tazobactam, and tazobactam M-1 were evaluated in human plasma, urine, and dialysate samples. Validated methods including reversed-phase HPLC, MS/MS, and LC/MS/MS were used. The following table summarizes assay performance characteristics for the aforementioned methods.
Analyte Concentration Range
LLOQ Linearity Accuracy Precision
Ceftolozane (plasma) 0.25 – 150.0 mcg/mL
0.25 mcg/mL
1.0 98.5 –102.6%
1.58- 6.55% (%CV)
Tazobactam (plasma) 0.10 – 50.0 mcg/mL
0.10 mcg/mL
0.999 91.4 –108.0%
1.54-7.97% (%CV)
Tazobactam M-1 (plasma)
0.05 – 25.0 mcg/mL
0.05 mcg/mL
0.999 91.3 –109.2%
2.57-7.96% (%CV)
Ceftolozane (urine) 5.0 – 5000 mcg/mL
5.0 mcg/mL
0.999 93.7 –111.2%
3.68-7.56% (%CV)
Tazobactam (urine) 10.0 to 5000 mcg/mL
10.0 mcg/mL
0.999 92.7 –107.2%
3.71-9.06% (%CV)
Tazobactam M-1 (urine)
5.0 to 2500 mcg/mL
5.0 mcg/mL
0.999 92.5 –107%
4.67-9.86% (%CV)
Ceftolozane (dialysate) 1.0 – 500ng/mL
1.0 ng/mL
1.0 93.5-108.3%
1.28-5.36% (%CV)
Tazobactam (dialysate) 1.0 – 500 ng/mL
1.0 ng/mL
1.0 96.6 –109.7%
1.45-9.18% (%CV)
Tazobactam M-1 (dialysate)
1.0 – 500 ng/mL
1.0 ng/mL
1.0 98.2 –107.7%
1.91-3.04% (%CV)
Reference ID: 3648317

214
Reviewer comment: All of the ranges and values in the above table are acceptable.
RESULTS:DemographicsTable 2 describes the study demographics.
Table 2: Demographic and Baseline Characteristics
Pharmacokinetic ResultsSubjects with Severe Renal ImpairmentThe plasma concentration-time profiles for CXA-101 (top panel), tazobactam (middle panel), and tazobactam M-1 metabolite (bottom panel) in subjects with severe renal impairment are shown in Figure 2. The PK parameters for CXA-101, tazobactam, and tazobactam M-1 metabolite for subjects with severe renal impairment are summarized in Table 3. Table 4 summarizes the cumulative amounts of CXA-101, tazobactam, and the M-1 metabolite excreted in urine and the percent of the dose excreted in the urine for CXA-101 and tazobactam from subjects with severe renal impairment.
Reference ID: 3648317


216
Table 3: Median (Range) of Pharmacokinetic Parameters for CXA-101, Tazobactam, and the M-1 Metabolite of Tazobactam for Subjects with Severe Renal Impairment Following Administration of a Single Dose of 750 mg CXA-201 (500 mg ceftolozane and 250 mg tazobactam) in Plasma
Reviewer comment: The labeled dose of ceftolozane/tazobactam is 1500 mg (1000 mg of ceftolozane and 500 mg of tazobactam). The pharmacokinetic parameters resulting from a single dose of ceftolozane/tazobactam (as they appear in Section 12.3 of the proposed label) are presented below.
PK Parameter Ceftolozane Tazobactam
Cmax (mcg/mL) 69.1 18.4
AUC (mcg*h/mL) 172 24.4
Half-life 2.77 0.91
The subjects with severe renal impairment in this study received a dose that was half that of the therapeutic dose (500 mg ceftolozane and 250 mg of tazobactam). Despite the reduced dose, the exposures achieved in this trial were significantly higher than the exposures achieved in subjects with normal renal function given the therapeutic dose (nearly 3x higher for ceftolozane and greater than 2x higher for tazobactam; based on a cross-study comparison). This finding is not surprising given that ceftolozane and tazobactam are entirely excreted renally, but it does suggest that a further dose reduction will be needed in order to match the therapeutic exposures achieved in subjects with normal renal function.
Table 4: Summary Statistics of the Cumulative Amount of CXA-101, Tazobactam, and the M-1 Metabolite of Tazobactam and Percent of Administered Dose Excreted in Urine for Subjects with Severe Renal Impairment Following Administration of a Single Dose of 750 mg CXA-201 (500 mg ceftolozane and 250 mg tazobactam)
Reviewer comment: The urine collection intervals were 0-24 hours and 24-48 hours. In all cases, the recovery of tazobactam occurred only in the 0-24 hour collection interval, suggesting that the recovery of
Reference ID: 3648317

217
tazobactam was complete. However, there were still detectable concentrations of the M-1 metabolite at 48 hours indicating that recovery of the metabolite had not yet been completed.
Subjects with ESRD (prior to dialysis)The plasma concentration-time profiles for CXA-101 (top), tazobactam (middle), and tazobactam M-1 (bottom) during the non-HD on Study Day 1 for subjects with ESRD is shown in Figure 3. The PK parameters for CXA-101, tazobactam, and the M-1 metabolite during non-HD for subjects with ESRD is presented in Table 5. Since the sampling of CXA-101 was conducted over a period of 48 hours, which is approximately 1 half-life, the estimates of half-life, CL, and Vss parameters for CXA-101 should be interpreted with caution. Also note that the plasma concentrations of the M-1 metabolite were not declining by the end of the sampling interval. Therefore, no PK parameters were calculated for the M-1 metabolite.
Reference ID: 3648317


219
Table 5: Median (Range) Pharmacokinetic Parameters for CXA-101, Tazobactam, and the M-1 Metabolite of Tazobactam During Non-Hemodialysis Following Administration of a Single Dose of 750 mg CXA-201 (500 mg ceftolozane and 250 mg tazobactam) on Study Day 1 in Subjects with ESRD
Since insufficient urine samples were collected following the administration of the first dose of study drug on Study Day 1 and over a limited time period, no analysis to determine the amount of CXA-101, tazobactam, and the M-1 metabolite excreted in the urine was conducted. Consequently, the CLR of CXA-101 and tazobactam in these subjects could not be determined.
Reviewer comment: As expected, the exposures of ceftolozane and tazobactam in ESRD patients who have not yet received their dialysis treatment are significantly higher than what was observed in healthy volunteers, based on a cross-study comparison. Additionally, the ceftolozane AUC0-inf in the ESRD subjects was more than 3x larger than in subjects with severe renal impairment, and the tazobactam AUC0-inf was nearly 2x.
Subjects with ESRD during HDThe plasma concentration-time profile for CXA (top), tazobactam (middle), and tazobactam M-1 (bottom) are shown in subjects with ESRD during HD following the second dose of study drug in Figure 4. Dialysis started 2 hours post-start of the infusion of study drug and lasted for 3 or 4 hours, depending on the subject. The plasma PK parameters for CXA-101, tazobactam, and the M-1 metabolite for subjects with ESRD during HD are summarized in Table 6. Sampling continued beyond a second HD session, but only plasma concentrations of samples collected between one dialysis period (0-44 hours) were used in the determination of PK parameters.
Reference ID: 3648317


221
Table 6: Median (Range) Pharmacokinetic Parameters for CXA-101, Tazobactam, and the M-1 Metabolite of Tazobactam Following Administration of the Second Dose [750 mg CXA-201 (500 mg ceftolozane and 250 mg tazobactam)]on Study Day 4 in Subjects with ESRD During HD
Reviewer comment: These results indicate that the dialysis procedure significantly removes both ceftolozane and tazobactam. The resulting AUC0-inf for ceftolozane and tazobactam was still elevated compared to subjects with normal renal function receiving the 1500 mg dose of CXA-201 (based on a cross-study comparison), but the changes were less than 2x.
A separate analysis was conducted to determine the PK parameters of CXA-101, tazobactam, and the M-1 metabolite from the start of the second study drug infusion to the end of dialysis. This was conducted in order to determine the contribution of HD on the removal of the 3 analytes. The plasma concentration-time profile of CXA-101 (top), tazobactam (middle), and tazobactam M-1 (bottom) are shown in Figure 5.
Reference ID: 3648317


223
The PK parameters for CXA-101, tazobactam, and the M-1 metabolite following administration of the second dose of CXA-201 on Study Day 4 for subjects with ESRD during HD are presented in Table 7.
Table 7: Median (Range) of Pharmacokinetic Parameters for CXA-101, Tazobactam, and the M-1 Metabolite of Tazobactam Following Administration of the second dose [750 mg CXA-201 (500 mg ceftolozane and 250 mg tazobactam)]on Study Day 4 in Subjects with ESRD During HD (Start of Infusion-End of Dialysis)
Reviewer comment: These results further indicate that the dialysis procedure significantly removes ceftolozane, tazobactam and the M-1 metabolite.
Safety ResultsNone of the 6 subjects in the severe renal impairment cohort experienced a TEAE during the study. In the ESRD cohort, 3 (50%) of the 6 subjects experienced TEAEs. All reported TEAEs occurred in only 1 subject each and included thrombosis of an arteriovenous fistula, flatulence, glossodynia, myalgia, and vulvovaginal pain. All TEAEs reported during the study were mild or moderate in severity. Three of the events, flatulence, glossodynia, and myalgia, were reported as treatment-related. Thrombosis of the arteriovenous fistula was considered an SAE; no other SAEs were reported. A summary of TEAEs is provided in Table 8.
Reference ID: 3648317

224
Table 8: Summary of Treatment-Emergent Adverse Events
APPLICANT’S CONCLUSIONS:
Pharmacokinetic Conclusions
The pharmacokinetic parameters of CXA-101, tazobactam, and the M-1 metabolite were different in subjects with severe renal impairment when compared to healthy subjects or subjects with mild and moderate renal impairment.
The median terminal elimination half-lives of CXA-101 and tazobactam were 11.1 and 2.5 hours, respectively, in subjects with severe renal impairment.
The median clearance for CXA-101 and tazobactam was 1.0 and 4.4 L/hr, respectively, in subjects with severe renal impairment.
The median percent of the dose of CXA-101 excreted in the urine was 84% in subjects with severe renal impairment. The less than complete recovery of CXA-101 in this population may have been due to the collection of urine over only a 48 hour interval, resulting in the incomplete elimination of the administered dose.
A reduction in dose or frequency of administration will be required in patients with severe renal impairment to achieve concentrations similar to those seen in healthy subjects.
The pharmacokinetic parameters for CXA-101 and tazobactam were substantially different in subjects with ESRD undergoing HD than subjects with severe renal impairment.
The concentrations of CXA-101, tazobactam, and the M-1 metabolite were reduced by more than 90% immediately following HD indicating that HD had a significant contribution on their removal.
Safety Conclusions
Safety findings were consistent with this patient population and similar to previous findings forthis drug.
Reference ID: 3648317
225
The incidence of TEAEs was low and all events were mild or moderate in severity; all subjects who experienced TEAEs were in the ESRD on HD cohort.
No TEAEs were reported in more than 1 subject.
1 SAE, thrombosis of an arteriovenous fistula, was reported during the study, and was assessed as unrelated to study drug.
There were no deaths or treatment discontinuations reported during the study.
There were no clinically meaningful changes in safety laboratory test results or vital signs.
REVIEWER ASSESSMENT:The pharmacokinetics of ceftolozane and tazobactam were significantly altered in subjects with severe renal impairment and in subjects with ESRD as compared to patients with normal renal function. Despite being given a reduced dose of 750 mg CXA-201, subjects in this trial demonstrated increased exposures when compared to subjects with normal renal function that received the full 1500 mg dose. A previous renal impairment study in subjects with mild and moderate renal impairment demonstrated that a dose adjustment was needed for subjects with moderate renal impairment. This study suggests that a further dose adjustment would be required in subjects with severe renal impairment and subjects with ESRD. Refer to the Pharmacometrics review for further discussion of recommended dosing in patients with severe renal impairment and in subjects with ESRD.
Reference ID: 3648317

226
A Phase 1 Drug-Drug Interaction Study to Evaluate the Potential of Ceftolozane/Tazobactam to Influence the Pharmacokinetics of CYP1A2, CYP3A4, and OAT1/OAT3 Probe Substrate Drugs in Healthy Subjects
Dates: Feb 22 – March 28, 2013Investigator: Matthew Medlock, MD Austin, TXAnalysis:
(for analysis of ceftolozane, tazobactam, and tazobactam metabolite M-1)
(for analysis of furosemide, caffeine, and midazolam)
OBJECTIVES:Primary Objective: To evaluate the potential of ceftolozane/tazobactam to influence the pharmacokinetics of probe substrate drugs metabolized by CYP1A2 and CYP3A4 and transported by OAT1/OAT3 in healthy volunteers. The primary endpoints were area under the concentration versus time curve (AUC) and maximum plasma concentration (Cmax) for caffeine, midazolam, and furosemide assessed alone versus co-administered with ceftolozane/tazobactam.
Secondary Objective: To evaluate the safety and tolerability of ceftolozane/tazobactam in healthy volunteers and to evaluate urinary excretion of ceftolozane/tazobactam in healthy volunteers when given alone.
BACKGROUND:When tested in a short-term, human liver microsome in vitro incubation study, ceftolozane did not directly inhibit the major P450 enzymes CYP1A2, CYP2B6, CYP2C8, CYP2C9, CYP2C19, CYP2D6, or CYP3A4/5. However, treatment with ceftolozane at 1000 mcg/mL for 3 days caused a moderate reduction of CYP1A2 activity by 35% to 61% and a 24% to 73% decrease in mRNA levels. The mechanism of the decrease appeared unlikely to be associated with its direct enzyme inhibition. Treatment with ceftolozane at 1000 mg/mL for 72 hours also caused a 74% reduction in CYP3A4 mRNA levels in 1 of 3 donors. This reduction in enzyme activity or mRNA may lead to increased exposure of drugs metabolized by CYP1A2 and CYP3A4 when given with repeated doses of ceftolozane. Separate, in vitro studies have indicated that tazobactam has a potential to act as an inhibitor (IC50 values < 150 mcg/mL) and a substrate of the organic anion transporter 1 (OAT1) and the organic anion transporter 3 (OAT3), possibly causing an increase in exposure or interaction with drugs that are substrates of OAT1/OAT3. Tazobactam also demonstrated a potential to directly inhibit CYP3A4 in vitro (IC50 <1000 mcg/mL), which may contribute to an increase in exposure of drugs that are metabolized by CYP3A4. The clinical implication of tazobactam as a substrate of OAT1 and OAT3 is well characterized as probenecid, an inhibitor of OAT1 and OAT3, has been shown to reduce renal clearance (CLR) of tazobactam. However, the clinical implication of inhibition of OAT1 and OAT3 by tazobactam is not well understood. This study is designed to assess the impact of repeated doses of ceftolozane/tazobactam on the pharmacokinetics of substrates of the CYP1A2 and CYP3A4 enzymes as well as the impact of single dose ceftolozane/tazobactam on the pharmacokinetics of substrates of OAT1 and OAT3.
Reference ID: 3648317
(b) (4)
(b) (4)

227
STUDY DESIGN:This was a Phase 1, single center, open-label, fixed sequence, crossover study in 16 healthy subjects. This 5-period study evaluated the ceftolozane/tazobactam drug interaction potential with CYP1A2, CYP3A4, and OAT1/OAT3 probe substrate drugs caffeine, midazolam, and furosemide, respectively.
Subjects received a single oral dose of 20 mg furosemide on Day 1 (start of Period 1). After a 2-day washout, subjects received a single oral dose of 200 mg caffeine and 2 mg midazolam oral syrup (cocktail probe) administered together on Day 4 (start of Period 2). After a 2-day washout, subjects received a single IV infusion of 1500 mg ceftolozane/tazobactam administered over 60 minutes on Day 7 (start of Period 3). After a 1-day washout, subjects received a single oral dose of 20 mg furosemide in conjunction with 1500 mg ceftolozane/tazobactam administered by IV infusion over 60 minutes on Day 9 (start of Period 4). Ceftolozane/tazobactam dosing continued every 8 hours to Day 15 when a final morning dose was administered. Subjects received a single oral dose of cocktail probe co-administered with 1500 mg ceftolozane/tazobactam on Day 12 (start of Period 5) and Day 15.
The Study design is presented in Figure 1. The pharmacokinetic sampling times by day for each drug are shown below.
Figure 1: Study Design
PHARMACOKINETIC SAMPLING AND ANALYSESThe PK parameters were determined by non-compartmental PK analysis. Phoenix WinNonlin Version 6.1 was used for the derivation of all PK individual measures for each subject. For plasma concentrations versus time, descriptive statistics were tabulated at each time point by treatment on linear and semi-logarithmic scales. All pre-dose below the limit of quantification (BLQ) values in Period 1 were set to 0. Missing or BLQ values obtained after the first quantifiable concentration were replaced by a period. Actual blood draw times were used to calculate PK parameters.
Reference ID: 3648317

228
Reference ID: 3648317

229
ASSAY METHODOLOGY:Plasma samples were analyzed for ceftolozane, tazobactam, tazobactam M-1, furosemide, caffeine, 1,7-dimethylxanthine, midazolam, and 1-hydroxymidazolam Urine samples were analyzed for determination of ceftolozane, tazobactam, and tazobactam M-1. Assay characteristics are summarized as follows:
Analyte Concentration Range
LLOQ Linearity Accuracy Precision
Ceftolozane (plasma) 0.25-150 mcg/mL
0.25 mcg/mL
1.0 97.0-103.0%
1.42-3.98%(%CV)
Tazobactam (plasma) 0.1-50 mcg/mL 0.1 mcg/mL
0.999 96.4-104.5%
2.74-9.09%(%CV)
Tazobactam M-1 (plasma)
0.05-25 mcg/mL
0.05 mcg/mL
0.999 90.7-105.2%
1.79-7.39%(%CV)
Ceftolozane (urine) 5.0-5000 mcg/mL
5.0 mcg/mL
1.0 92.7-104.8%
1.66-6.70% (%CV)
Tazobactam (urine) 10.0-5000 mcg/mL
10.0 mcg/mL
0.999 94.3-106.8%
2.21-11.2% (%CV)
Tazobactam M-1 (urine)
5.0-2500 mcg/mL
5.0 mcg/mL
0.999 94.7-106.8%
2.29-8.64% (%CV)
Furosemide (plasma) 5-5000 ng/mL 5.0 ng/mL
0.998 92.4-102.6%
1.03-7.87%(%CV)
Caffeine (plasma) 0.02-20.0 mcg/mL
0.02 mcg/mL
0.998 94.3-103.7%
4.14-8.28% (%CV)
1,7-dimethylxanthine (plasma)
0.02-20.0 mcg/mL
0.02 mcg/mL
0.998 95.9-102.5%
3.96-9.66%(%CV)
Midazolam (plasma) 0.1-100 ng/mL 0.1 ng/mL
0.999 97.6-103.2%
1.84-3.14% (%CV)
1-hydroxymidazolam 0.1-50 ng/mL 0.1 0.999 94.4- 1.62-8.32%
Reference ID: 3648317


231
Pharmacokinetic Results – Interacting DrugsFurosemideThe semi-log concentration-time profile of furosemide in Period 1 and Period 4 is shown in Figure 2 and the resulting pharmacokinetic parameters are shown in Table 2 and the statistical analysis of the furosemide pharmacokinetic parameters between periods is shown in Table 3.
Figure 2: Mean (SD) Plasma Concentration of Furosemide Versus Time by Treatment – Semi logarithmic Scale
Table 2: Geometric Mean (CV%) Plasma Pharmacokinetics of Furosemide
Reference ID: 3648317

232
Table 3: Statistical Analysis of Plasma Pharmacokinetic Parameters of Furosemide
Reviewer Comment: The lower bound of the 90% confidence intervals for furosemide AUC0-t, AUC0-inf, and Cmax all fell below the pre-specified no-effect boundary of 0.8, indicating that the pharmacokinetics of furosemide were altered by co-administration with ceftolozane/tazobactam. However, the interaction was not in the expected direction as an inhibition of OAT1/3 would manifest in increased concentrations/exposures of furosemide. The reductions in the point estimates were in the range of 10-20%, suggesting that there may not be clinically significant reductions in furosemide concentrations/exposures. Tazobactam is a known substrate of OAT1/3, and also has the potential to act as an inhibitor of OAT1/3. Ceftolozane is not thought to be an inhibitor of OAT 1 or OAT 3 based on an in vitro inhibition study.
Caffeine/1,7-DimethylxanthineThe semi-log concentration-time profile of caffeine in is shown in Figure 3 and the semi-log concentration-time profile of 1,7-dimethylxanthine is shown in Figure 4. The resulting pharmacokinetic parameters are shown in Tables 4 and 5, respectively. The statistical analysis of the caffeine pharmacokinetic parameters are shown in Table 6 and the statistical analysis of the 1,7-dimethylxanthine pharmacokinetic parameters are shown in Table 7.
Reference ID: 3648317

233
Figure 3: Mean (SD) Plasma Concentration of Caffeine versus Time by Treatment – Semi-logarithmic Scale
Figure 4: Mean (SD) Plasma Concentration of 1,7-Dimethylxanthine versus Time by Treatment – Semi-logarithmic Scale
Reference ID: 3648317

234
Table 4: Geometric Mean (CV%) Plasma Pharmacokinetics of Caffeine
Table 5: Geometric Mean (CV%) Plasma Pharmacokinetics of 1,7-Dimethylxanthine
Reference ID: 3648317

235
Table 6: Statistical Analysis of Plasma Pharmacokinetic Parameters of Caffeine
Table 7: Statistical Analysis of Plasma Pharmacokinetic Parameters of 1,7-Dimethylxanthine
Reference ID: 3648317

236
Reviewer comment: The 90% confidence interval around the point estimate for the AUC0-t, AUC0-inf, and Cmax of caffeine fall within the pre-specified 0.8-1.25 no effect boundary. Therefore, the pharmacokinetics of caffeine were not altered by ceftolozane/tazobactam co-administration. The AUC0-t
of the caffeine metabolite 1,7-dimethylxanthine increased when co-administered with ceftolozane/tazobactam, although not substantially (20-30%). This increase in exposure is not consistent with the inhibition of CYP1A2, which would be predicted to result in a decrease in 1,7-dimethylxanthine concentrations and an increase in caffeine concentrations, neither of which was observed. Interestingly, the half-life of 1,7-dimethylxanthine was relatively unchanged when caffeine was administered alone versus when caffeine was co-administered with ceftolozane/tazobactam, suggesting that the clearance of 1,7-dimethylxanthine may not have been affected.
Midazolam/1-HydroxymidazolamThe semi-log concentration-time profile of midazolam in is shown in Figure 5 and the semi-log concentration-time profile of 1-hydroxymidazolam is shown in Figure 6. The resulting pharmacokinetic parameters are shown in Tables 8 and 9, respectively. The statistical analysis of the midazolam pharmacokinetic parameters are shown in Table 10 and the statistical analysis of the 1-hydroxymidazolam pharmacokinetic parameters are shown in Table 11.
Reference ID: 3648317

237
Figure 5: Mean (SD) Plasma Concentration of Midazolam versus Time by Treatment – Semi-logarithmic Scale
Figure 6: Mean (SD) Plasma Concentration of 1-hydroxymidazolam versus Time by Treatment – Semi-logarithmic Scale
Reference ID: 3648317

238
Table 8: Geometric Mean (CV%) Plasma Pharmacokinetics of Midazolam
Table 9: Table 5: Geometric Mean (CV%) Plasma Pharmacokinetics of 1-hydroxymidazolam
Reference ID: 3648317

239
Table 10: Statistical Analysis of Plasma Pharmacokinetic Parameters of Midazolam
Reference ID: 3648317
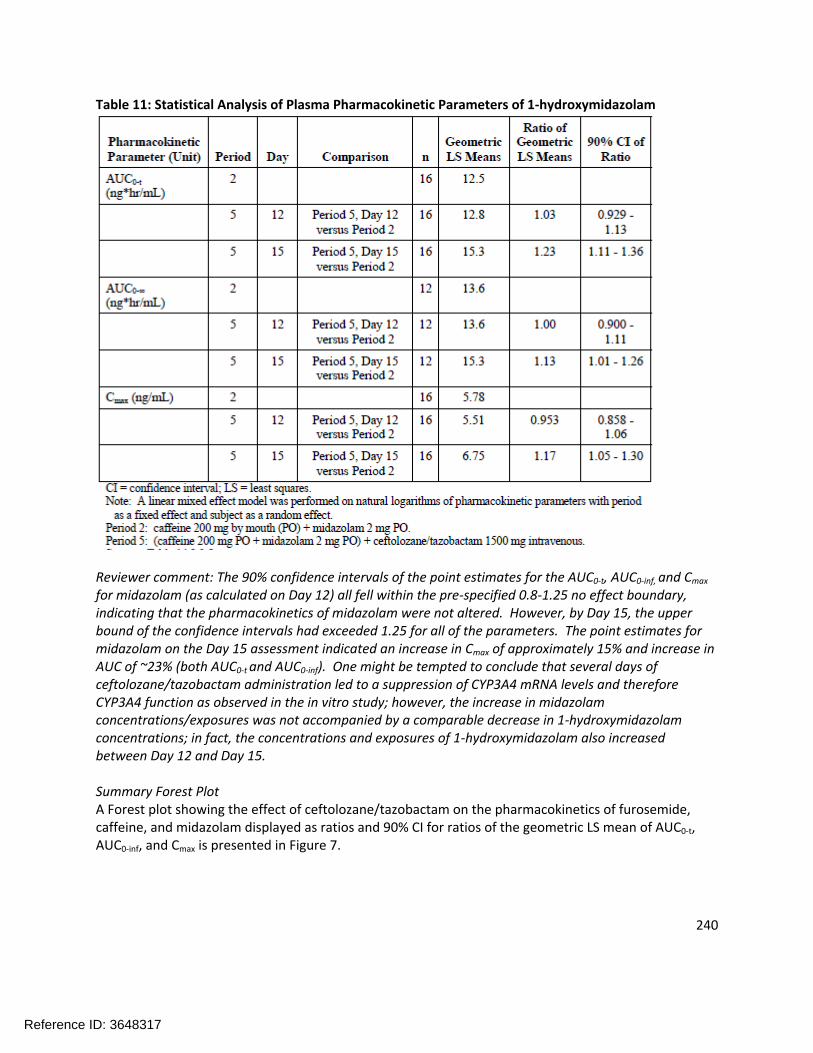
240
Table 11: Statistical Analysis of Plasma Pharmacokinetic Parameters of 1-hydroxymidazolam
Reviewer comment: The 90% confidence intervals of the point estimates for the AUC0-t, AUC0-inf, and Cmax
for midazolam (as calculated on Day 12) all fell within the pre-specified 0.8-1.25 no effect boundary, indicating that the pharmacokinetics of midazolam were not altered. However, by Day 15, the upper bound of the confidence intervals had exceeded 1.25 for all of the parameters. The point estimates for midazolam on the Day 15 assessment indicated an increase in Cmax of approximately 15% and increase in AUC of ~23% (both AUC0-t and AUC0-inf). One might be tempted to conclude that several days of ceftolozane/tazobactam administration led to a suppression of CYP3A4 mRNA levels and therefore CYP3A4 function as observed in the in vitro study; however, the increase in midazolam concentrations/exposures was not accompanied by a comparable decrease in 1-hydroxymidazolam concentrations; in fact, the concentrations and exposures of 1-hydroxymidazolam also increased between Day 12 and Day 15.
Summary Forest PlotA Forest plot showing the effect of ceftolozane/tazobactam on the pharmacokinetics of furosemide, caffeine, and midazolam displayed as ratios and 90% CI for ratios of the geometric LS mean of AUC0-t, AUC0-inf, and Cmax is presented in Figure 7.
Reference ID: 3648317
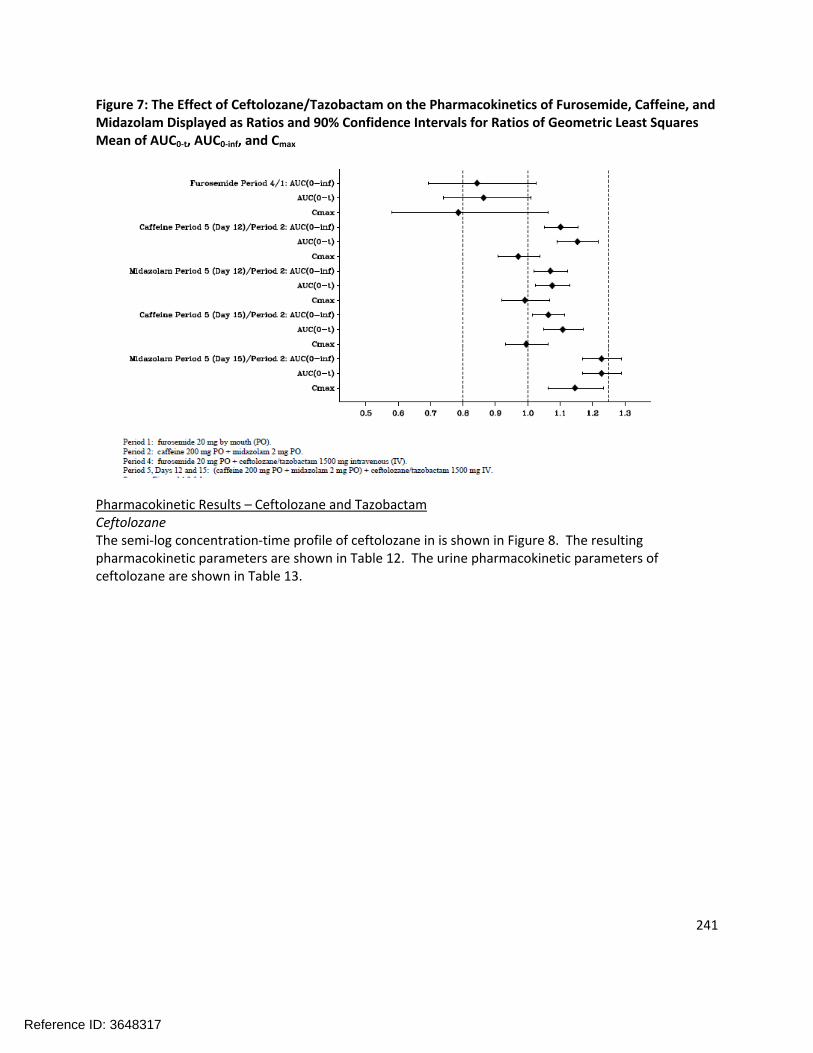
241
Figure 7: The Effect of Ceftolozane/Tazobactam on the Pharmacokinetics of Furosemide, Caffeine, and Midazolam Displayed as Ratios and 90% Confidence Intervals for Ratios of Geometric Least Squares Mean of AUC0-t, AUC0-inf, and Cmax
Pharmacokinetic Results – Ceftolozane and TazobactamCeftolozaneThe semi-log concentration-time profile of ceftolozane in is shown in Figure 8. The resulting pharmacokinetic parameters are shown in Table 12. The urine pharmacokinetic parameters of ceftolozane are shown in Table 13.
Reference ID: 3648317

242
Figure 8: Mean (SD) Plasma Concentrations of Ceftolozane versus Time by Treatment
Table 12: Geometric Mean (CV%) Plasma Pharmacokinetic Parameters for Ceftolozane after Intravenous Administration of Ceftolozane/Tazobactam 1500 mg in Healthy Subjects
Reference ID: 3648317

243
Table 13: Geometric Mean (CV%) Urine Pharmacokinetic Parameters for Ceftolozane after Intravenous Administration of Ceftolozane/Tazobactam 1500 mg in Healthy Subjects
Tazobactam/Tazobactam-M1The semi-log concentration-time profile of tazobactam in is shown in Figure 9 and the semi-log concentration-time profile of tazobactam-M1 is shown in Figure 10. The resulting pharmacokinetic parameters are shown in Tables 14 and 15, respectively. The urine pharmacokinetic parameters for tazobactam are shown in Table 16 and the urine pharmacokinetic parameters for tazobactam-M1 are shown in Table 17.
Figure 9: Mean (SD) Plasma Concentrations of Tazobactam versus Time by Treatment
Reference ID: 3648317

244
Figure 10: Mean (SD) Plasma Concentrations of Tazobactam-M1 versus Time by Treatment
Table 14: Geometric Mean (CV%) Plasma Pharmacokinetic Parameters for Tazobactam after Intravenous Administration of Ceftolozane/Tazobactam 1500 mg in Healthy Subjects
Reference ID: 3648317
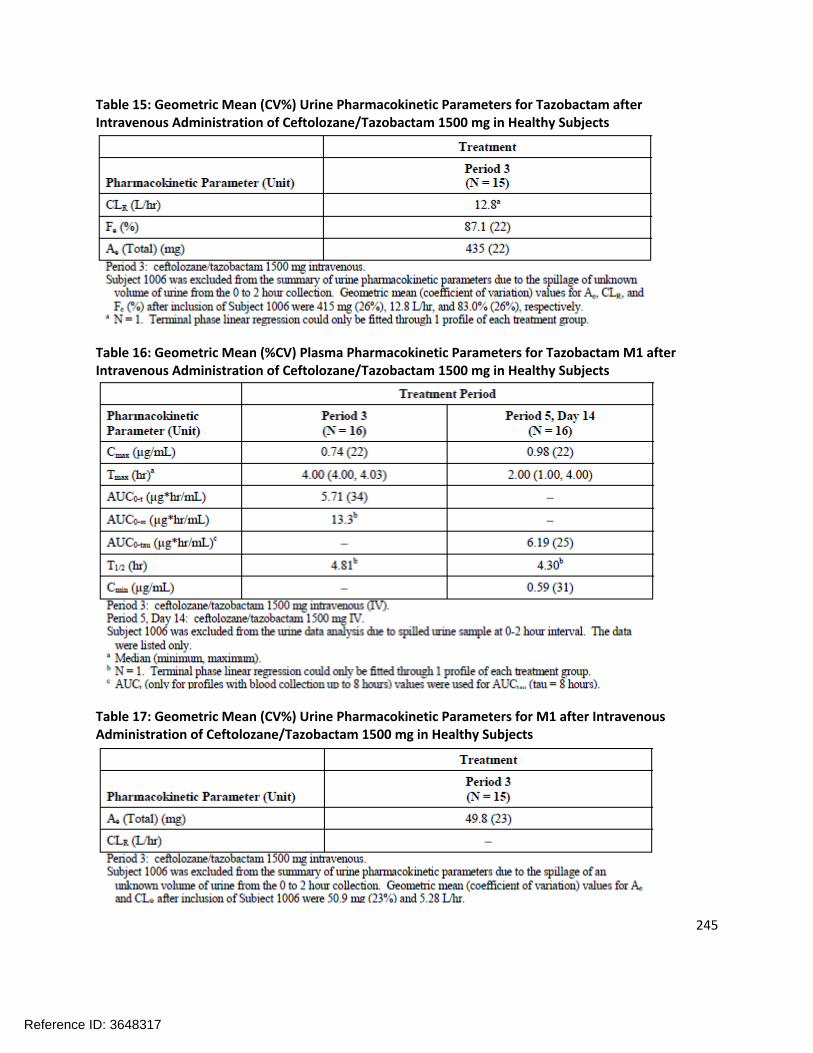
245
Table 15: Geometric Mean (CV%) Urine Pharmacokinetic Parameters for Tazobactam after Intravenous Administration of Ceftolozane/Tazobactam 1500 mg in Healthy Subjects
Table 16: Geometric Mean (%CV) Plasma Pharmacokinetic Parameters for Tazobactam M1 after Intravenous Administration of Ceftolozane/Tazobactam 1500 mg in Healthy Subjects
Table 17: Geometric Mean (CV%) Urine Pharmacokinetic Parameters for M1 after Intravenous Administration of Ceftolozane/Tazobactam 1500 mg in Healthy Subjects
Reference ID: 3648317
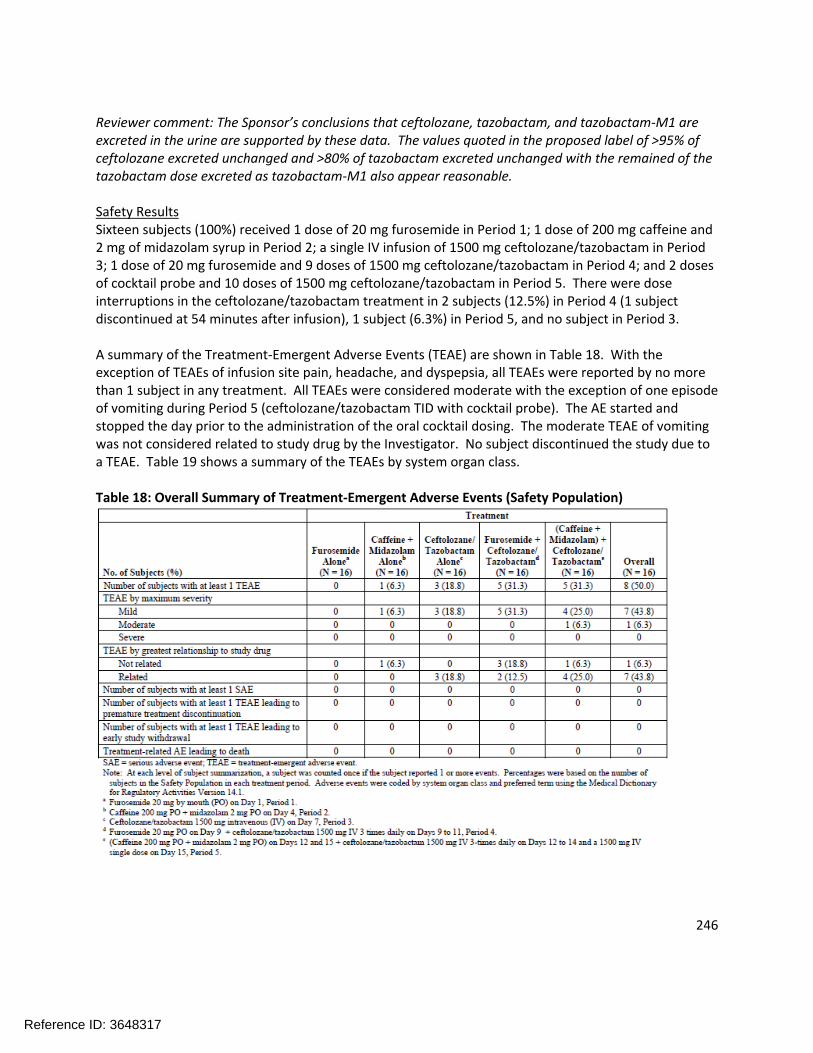
246
Reviewer comment: The Sponsor’s conclusions that ceftolozane, tazobactam, and tazobactam-M1 are excreted in the urine are supported by these data. The values quoted in the proposed label of >95% of ceftolozane excreted unchanged and >80% of tazobactam excreted unchanged with the remained of the tazobactam dose excreted as tazobactam-M1 also appear reasonable.
Safety ResultsSixteen subjects (100%) received 1 dose of 20 mg furosemide in Period 1; 1 dose of 200 mg caffeine and 2 mg of midazolam syrup in Period 2; a single IV infusion of 1500 mg ceftolozane/tazobactam in Period 3; 1 dose of 20 mg furosemide and 9 doses of 1500 mg ceftolozane/tazobactam in Period 4; and 2 doses of cocktail probe and 10 doses of 1500 mg ceftolozane/tazobactam in Period 5. There were dose interruptions in the ceftolozane/tazobactam treatment in 2 subjects (12.5%) in Period 4 (1 subject discontinued at 54 minutes after infusion), 1 subject (6.3%) in Period 5, and no subject in Period 3.
A summary of the Treatment-Emergent Adverse Events (TEAE) are shown in Table 18. With the exception of TEAEs of infusion site pain, headache, and dyspepsia, all TEAEs were reported by no more than 1 subject in any treatment. All TEAEs were considered moderate with the exception of one episode of vomiting during Period 5 (ceftolozane/tazobactam TID with cocktail probe). The AE started and stopped the day prior to the administration of the oral cocktail dosing. The moderate TEAE of vomiting was not considered related to study drug by the Investigator. No subject discontinued the study due to a TEAE. Table 19 shows a summary of the TEAEs by system organ class.
Table 18: Overall Summary of Treatment-Emergent Adverse Events (Safety Population)
Reference ID: 3648317

247
Table 19: Summary of Treatment-Emergent Adverse Events (Safety Population)
APPLICANT’S CONCLUSION:Pharmacokinetic Conclusions
There was minimal potential for a clinically relevant drug interaction effect of ceftolozane/tazobactam on OAT1/OAT3 probe substrate furosemide (decrease of AUC0-t of approximately 12%)
There was minimal potential for a clinically relevant drug interaction effect of multiple doses of ceftolozane/tazobactam on CYP1A2 probe substrate caffeine or its metabolite (caffeine and 1,7-dimethylxanthine AUC0-t increased approximately 11% and 29%, respectively, on Day 15)
Reference ID: 3648317
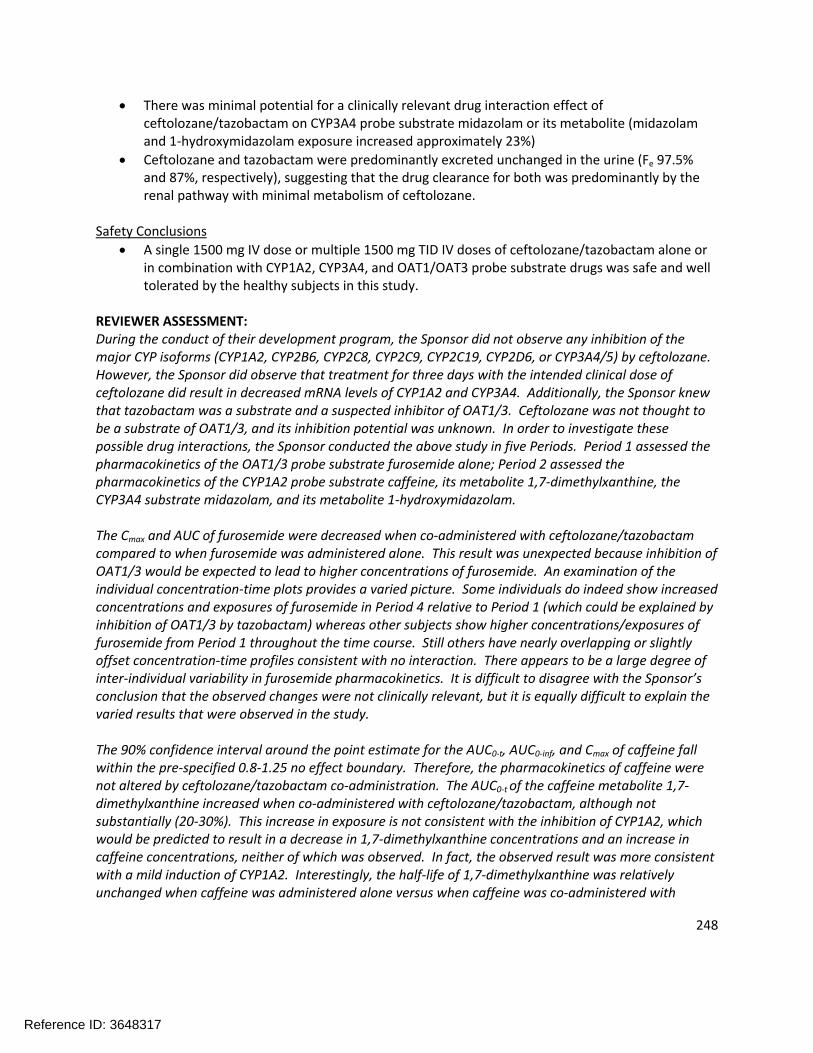
248
There was minimal potential for a clinically relevant drug interaction effect of ceftolozane/tazobactam on CYP3A4 probe substrate midazolam or its metabolite (midazolam and 1-hydroxymidazolam exposure increased approximately 23%)
Ceftolozane and tazobactam were predominantly excreted unchanged in the urine (Fe 97.5% and 87%, respectively), suggesting that the drug clearance for both was predominantly by the renal pathway with minimal metabolism of ceftolozane.
Safety Conclusions
A single 1500 mg IV dose or multiple 1500 mg TID IV doses of ceftolozane/tazobactam alone or in combination with CYP1A2, CYP3A4, and OAT1/OAT3 probe substrate drugs was safe and well tolerated by the healthy subjects in this study.
REVIEWER ASSESSMENT:During the conduct of their development program, the Sponsor did not observe any inhibition of the major CYP isoforms (CYP1A2, CYP2B6, CYP2C8, CYP2C9, CYP2C19, CYP2D6, or CYP3A4/5) by ceftolozane. However, the Sponsor did observe that treatment for three days with the intended clinical dose of ceftolozane did result in decreased mRNA levels of CYP1A2 and CYP3A4. Additionally, the Sponsor knew that tazobactam was a substrate and a suspected inhibitor of OAT1/3. Ceftolozane was not thought to be a substrate of OAT1/3, and its inhibition potential was unknown. In order to investigate these possible drug interactions, the Sponsor conducted the above study in five Periods. Period 1 assessed the pharmacokinetics of the OAT1/3 probe substrate furosemide alone; Period 2 assessed the pharmacokinetics of the CYP1A2 probe substrate caffeine, its metabolite 1,7-dimethylxanthine, the CYP3A4 substrate midazolam, and its metabolite 1-hydroxymidazolam.
The Cmax and AUC of furosemide were decreased when co-administered with ceftolozane/tazobactam compared to when furosemide was administered alone. This result was unexpected because inhibition of OAT1/3 would be expected to lead to higher concentrations of furosemide. An examination of the individual concentration-time plots provides a varied picture. Some individuals do indeed show increased concentrations and exposures of furosemide in Period 4 relative to Period 1 (which could be explained by inhibition of OAT1/3 by tazobactam) whereas other subjects show higher concentrations/exposures of furosemide from Period 1 throughout the time course. Still others have nearly overlapping or slightly offset concentration-time profiles consistent with no interaction. There appears to be a large degree of inter-individual variability in furosemide pharmacokinetics. It is difficult to disagree with the Sponsor’s conclusion that the observed changes were not clinically relevant, but it is equally difficult to explain the varied results that were observed in the study.
The 90% confidence interval around the point estimate for the AUC0-t, AUC0-inf, and Cmax of caffeine fall within the pre-specified 0.8-1.25 no effect boundary. Therefore, the pharmacokinetics of caffeine were not altered by ceftolozane/tazobactam co-administration. The AUC0-t of the caffeine metabolite 1,7-dimethylxanthine increased when co-administered with ceftolozane/tazobactam, although not substantially (20-30%). This increase in exposure is not consistent with the inhibition of CYP1A2, which would be predicted to result in a decrease in 1,7-dimethylxanthine concentrations and an increase in caffeine concentrations, neither of which was observed. In fact, the observed result was more consistent with a mild induction of CYP1A2. Interestingly, the half-life of 1,7-dimethylxanthine was relatively unchanged when caffeine was administered alone versus when caffeine was co-administered with
Reference ID: 3648317

249
ceftolozane/tazobactam, suggesting that the clearance of 1,7-dimethylxanthine may not have been affected. The Sponsor concludes that there is minimal potential for a clinically significant CYP1A2-mediated drug interaction. The Reviewer agrees with this conclusion.
The 90% confidence intervals of the point estimates for the AUC0-t, AUC0-inf, and Cmax for midazolam (as calculated on Day 12) all fell within the pre-specified 0.8-1.25 no effect boundary, indicating that the pharmacokinetics of midazolam were not altered. However, by Day 15, the upper bound of the confidence intervals had exceeded 1.25 for all of the parameters. The point estimates for midazolam on the Day 15 assessment indicated an increase in Cmax of approximately 15% and increase in AUC of ~23% (both AUC0-t and AUC0-inf). One might be tempted to conclude that several days of ceftolozane/tazobactam administration led to a suppression of CYP3A4 mRNA levels and therefore CYP3A4 function as observed in the in vitro study; however, the increase in midazolamconcentrations/exposures was not accompanied by a comparable decrease in 1-hydroxymidazolam concentrations; in fact, the concentrations and exposures of 1-hydroxymidazolam also increased between Day 12 and Day 15. The Reviewer agrees with the Sponsor’s conclusion that no clinically significant CYP3A4-mediated drug interactions are likely to occur with ceftolozane/tazobactam.
Reference ID: 3648317

250
4.3PharmacometricReview4.2 Pharmacometric Review
OFFICE OF CLINICAL PHARMACOLOGY:
PHARMACOMETRIC REVIEW
NDA: 206-829
Drug Ceftolozane/Tazobactam
Trade Name ZERBAXA
PM Reviewer Ryan Owen, Ph.D.
PM Team Leader Jeffry A. Florian, Ph.D.
Clinical Pharmacology Reviewer
Ryan Owen, Ph.D.
Clinical Pharmacology Team Leader
Kimberly Bergman, Pharm.D.
Sponsor Cubist Pharmaceuticals, Inc., Lexington, MA
Submission Type; Code Original New Drug Application (New Molecular Entity), Priority
Indication For the treatment of complicated intra-abdominal infections (cIAI) and complicated urinary tract infections (cUTI) caused by susceptible organisms.
Dosage and Administration 1500 mg Zerbaxa (1000 mg ceftolozane and 500 mg tazobactam) administered via a 1 hour intravenous infusion every 8 hours for 4-14 days in patients with normal renal function.
1 SummaryofFindings
1.1 KeyReviewQuestionsThe purpose of this review is to address the following key questions:
1. Does the population pharmacokinetic analysis support the sponsor’s proposed labeling claims regarding effects of sex, age, race, and hepatic impairment on the dosing of ceftolozane/tazobactam?
2. Are the proposed dose adjustments for moderate renal function (750 mg ZERBAXA q8h), severe renal function (375 mg ZERBAXA q8h), and ESRD (loading dose of 750 mg ZERBAXA followed by a 150 mg maintenance dose administered every 8 hours for the remainder of the treatment period – on hemodialysis days, the dose should be administered at the earliest possible time following completion of dialysis) appropriate?
Reference ID: 3648317

251
3. Are the proposed Enterobacteriaceae and P. aeruginosa in vitro susceptibility test interpretive criteria for ceftolozane/tazobactam supported based on the available clinical and nonclinical data?
1.1.1 Does the population pharmacokinetic analysis support the sponsor’sproposed labeling claims regarding effects of sex, age, race, and hepaticimpairmentonthedosing ofceftolozane/tazobactam?
Yes, the Applicant’s population pharmacokinetic models support that dose adjustments of both ceftolozane and tazobactam are needed based on patient creatinine clearance. The provided modeling also identified that body weight and infection were significant covariates on volume of distribution for ceftolozane and that infection was a significant covariate for volume of distribution for tazobactam. The clinical impact of changes in ceftolozane and tazobactam exposure for these covariates was not considered significant, and no dose adjustments are recommended based on these factors, though it should be noted that the exposures in subjects with complicated intra-abdominal infection (cIAI) were lower than that observed in other subjects. Many patients with cIAI also had normal renal function and body weight in the upper quartile, which may have contributed to the observed lower exposures. Other covariates included in the model included sex and age. The population PK dataset for ceftolozane included 24 subjects >75 years of age and 53 subjects >65 years of age with an infection in the analysis (17 subjects and 8 subjects > 75 and 65 years of age, respectively for tazobactam). Neither of these covariates were identified as significant in the analysis after accounting for renal function. There were insufficient subjects with race listed as non-Caucasian in the analysis to evaluate the impact of race on ceftolozane and tazobactam exposure, though no differences were identified between subjects with race listed as Caucasian compared to non-Caucasian. A summary of ceftolozane and tazobactam steady state AUC and Ctrough are provided below in Table 1.1 and Table 1.2 based on population PK estimates from the developed models. PK parameters are shown normalized to the Applicant’s proposed dosing regimen (1000/500 mg q8h ceftolozane/tazobactam in patients with normal renal function and mild renal impairment; 500/250 mg q8h for patients with moderate renal impairment).
Table 1.1: Predicted AUCss and Ctrough based on post-hoc parameter estimates from the Applicant’s population PK analysis for ceftolozane based on the Applicant’s proposed dosing for a subset ofcovariates
Ceftolozane
Covariate Category
AUCss (ng.h/mL) Ctrough (ng/mL)
n Median [IQR] Median [IQR]
Body weight (kg)
≥43 - <66 92 193 [165; 218] 3.4 [1.8; 5.4]
≥66 - <74 96 170 [153; 203] 3.4 [1.8; 4.9]
≥74 - <85 93 161 [148; 193] 3.6 [2.1; 6.9]
≥85 95 150 [114; 194] 3.6 [2.2; 7.4]
Age (years)
≥18 - <27 84 168 [154; 200] 2.9 [1.3; 3.7]
≥27 - <39 96 160 [136; 175] 2.3 [1.2; 3.6]
≥39 - <60 96 170 [144; 215] 3.6 [2.5; 5.4]
≥60 - 89 100 190 [149; 234] 8.1 [4.6; 11.2]
BMI (kg/m2) ≥17.2 - <23.6 94 179 [152; 217] 3.7 [2.0; 5.5]
Reference ID: 3648317

252
≥23.6 - <25.7 94 168 [151; 206] 3.2 [1.7; 4.7]
≥25.7 - < 28.4 94 163 [146; 193] 3.2 [2.2; 5.7]
≥28.4 94 167 [132; 216] 4.1 [2.0; 8.3]
Infection Status
HVs 226 172 [156; 213] 3.2 [1.6; 4.7]
cUTI 73 174 [148; 217] 5.8 [3.6; 10.3]
cIAI 77 119 [98; 177] 2.9 [1.9; 6.0]
Creatinine Clearance (mL/min)
Normal (≥90 mL/min) 255
162 [143; 188]2.9 [1.5; 4.0]
Mild (≥60 and <90 mL/min) 79
214 [171; 256]6.2 [4.3; 10.2]
Moderate (≥30 and <60
mL/min) 36152 [105; 195]
6.4 [3.5; 11.6]
Severe (≥15 and <30 mL/min) 6
256 [225; 270]
23.6 [19.8; 25.8]HVs, healthy volunteers
Table 1.2: Predicted AUCss and Ctrough based on post-hoc parameter estimates from the Applicant’s population PK analysis for tazobactam based on the Applicant’s proposed dosing for a subset ofcovariates
Tazobactam
Covariate Category
AUCss (µg.h/mL) Ctrough (µg/mL)
n Median [IQR] Median [IQR]
Body weight (kg)
≥49 - <6761
25.0 [22.1; 28.2]
0.051 [0.011; 0.091]
≥67 - <7460
25.4 [22.3; 31.2]
0.061 [0.022; 0.135]
≥74 - <8558
24.6 [21.3; 27.2]
0.060 [0.038; 0.181]
≥8564
22.6 [19.6; 28.9]
0.093 [0.045; 0.311]
Age (years)
≥18 - <2759
22.4 [20.1; 25.8]
0.040 [0.009; 0.060]
≥27 - <3762
22.8 [20.2; 26.7]
0.044 [0.007; 0.069]
≥37 - <5561
24.1 [21.6; 29.2]
0.063 [0.037; 0.124]
≥55 - 8661
30.5 [26.0; 38.9]
0.323 [0.135; 0.852]
BMI (kg/m2) ≥18.4 - <23.661
24.6 [22.6; 28.4]
0.065 [0.034; 0.148]
Reference ID: 3648317

253
≥23.6 - <25.757
24.5 [20.6; 28.3]
0.053 [0.016; 0.108]
≥25.7 - < 28.864
22.7 [20.8; 27.4]
0.055 [0.034; 0.116]
≥28.861
26.5 [21.9; 31.3]
0.110 [0.048; 0.395]
Infection Status
HVs166
24.4 [21.6; 27.5]
0.047 [0.011; 0.082]
cIAI77
26.3 [19.9; 38.9]
0.181 [0.089; 0.770]
Creatinine Clearance (mL/min)
Normal (≥90 mL/min) 185
23.6 [21.1; 27.0]
0.049 [0.020; 0.089]
Mild (≥60 and <90 mL/min) 32
31.0 [28.1; 39.4]
0.177 [0.084; 0.459[
Moderate (≥30 and <60
mL/min) 20
27.7 [20.1; 36.1]
0.465 [0.171; 1.00]
Severe (≥15 and <30 mL/min) 6
26.8 [19.9; 27.1]
0.864 [0.650; 1.148]
HVs, healthy volunteers
1.1.2 Are the proposed dose adjustments for moderate renal function (750 mgZERBAXA q8h), severe renal function (375 mg ZERBAXA q8h), and ESRD(loading dose of 750 mg ZERBAXA followed by a 150 mg maintenance doseadministered every 8 hours for the remainder of the treatment period – onhemodialysis days, the dose should be administered at the earliest possibletimefollowingcompletionofdialysis)appropriate?
The Applicant’s proposed dose adjustments in subjects with moderate renal function (500/250 mg ceftolozane/tazobactam q8h), severe renal function (250/125 mg ceftolozane/tazobactam q8h), and end-stage renal disease (ESRD) (500/250 mg ceftolozane/tazobactam loading dose with 100/50 mg q8h and language to administer the maintenance dose on dialysis days immediately following dialysis) are all reasonable.
In addition to results from dedicated renal studies a population PK analyses for ceftolozane and tazobactam identified creatinine clearance as a significant covariate impacting clearance. Based on this covariate relationship a typical patient with creatinine clearance of 30 or 50 mL/min would have a clearance 33-60% lower than a typical patient with creatinine clearance of 110 mL/min. This would translate to an AUC 1.8-2.5 fold higher between populations, in agreement with results from the dedicated study and supporting the Applicant’s proposed dose adjustment in patients with moderate renal function (dose reduction of 50%). A similar analysis indicates a typical patient with creatinine clearance of 15 to 30 mL/min would have an AUC 2.5- to 4-fold higher than a patient with normal renal function and supports a 4-fold reduction in dose in such patients. By nature of the decreased
Reference ID: 3648317

254
elimination rate in subjects with moderate or severe renal impairment, a dose reduction to match exposures (AUC) with that in subjects with normal renal function will result in lower Cmax value, but consistently higher Ctrough values. This is further displayed in both the summary of PK parameters shown above in Table 1.1 and Table 1.2, as well as below in Figure 1.1. This figure shows ceftolozane (left) and tazobactam (right) PK profiles over 14 days for a typical patient with normal (CrCL: 120 mL/min), mild (CrCL: 75 mL/min), moderate (CrCL: 40 mL/min), and severe (CrCL: 22 mL/min) renal function administered the Applicant’s proposed doses. With the proposed dose adjustments, patients with moderate and severe renal impairment have time course profiles that are bounded by or lower than the exposure profiles observed for a typical patient with normal or mild renal function while maintaining adequate %T>MIC.
Figure 1.1: Typical Ceftolozane (left) and Tazobactam (right) Concentration-Time Plots by Renal Function Category for the Applicant’s Proposed Dosing at Steady State
The sponsor’s proposed dosing in patients with ESRD on hemodialysis appears reasonable based on limited data available from a dedicated ESRD study, though it should be noted that the data collected by the sponsor was highly variable, and the resulting model development had large uncertainties with respect to pharmacokinetic parameters and the impact of hemodialysis on drug elimination. However, the available data are sufficient to provide dosing recommendations based on a principle of maintaining ceftolozane and tazobactam AUC within the range of that observed for the proposed regimen while maintaining Ctrough at or higher than levels in those subjects.
The Applicant, as well as the reviewer, selected a dosing scenario of dialysis every three days for a four hour duration to represent a typical use case. A loading dose of 500/250 mg ceftolozane/tazobactam was administered immediately after dialysis on a Monday, followed by a four-hour dialysis duration. Maintenance doses of 100/50 mg ceftolozane/tazobactam were repeated every 8 hours, or immediately following dialysis. For the purposes of the simulations, it was assumed that dialysis treatments occurred again on Wednesday and Friday, with dialysis treatments repeated on those same days the following week. Such a course was predicted to result in total daily ceftolozane and tazobactam AUC24 exposures ranging between 322-610 ug•hr/mL and 44-103 ug•hr/mL, respectively. In comparison, the mean AUCss,8h observed for ceftolozane and tazobactam was 182 and 25 ug•hr/mL, respectively, or a mean
Reference ID: 3648317

255
AUC24 of 546 and 75 ug•hr/mL, respectively. In general the ceftolozane and tazobactam exposures with such a dosing regimen and planned dialysis treatments are not expected to exceed those already observed for 1000/500 mg ceftolozane/tazobactam q8h in patients with normal and mild renal function. Maximum concentrations of both compounds are not expected to exceed the range of exposures in other patient groups, and Ctrough will be maintained at higher levels than expected for patients with normal and mild renal impairment except during hemodialysis treatments. This observation emphasizes the importance of initiating the maintenance dose soon after the completion of hemodialysis. The Applicant also notes that the tazobactam and ceftolozane half-lives in the ESRD study could support less frequent dosing (q12h and q24h, respectively). Given these observations, the Applicant still proposes to administer both compounds on a q8h schedule. The Reviewer agrees with this approach an overall q12h schedule may have limited additional convenience over a q8h schedule.
Figure 1.2: Typical Ceftolozane (left) and Tazobactam (right) Concentration-Time Plots for a Patient with ESRD (red) over 14 Days Assuming Initiation of the Applicant’s Proposed Regimen on Monday with Dialysis Treatments for 4-hours Every Monday, Wednesday, and Friday. A Typical Profile for a Patient with Normal and Mild Renal Impairment is Included for Comparison.
1.1.3 AretheproposedEnterobacteriaceae andP.aeruginosa invitrosusceptibilitycriteriaforceftolozane/tazobactamsupportedbasedontheavailableclinicalandnonclinicaldata?
The elements of the sponsor’s analysis that are included in the pharmacometric review (e.g. the population PK model, the co-modeling approach for ceftolozane and tazobactam, and the simulations for different renal function groups) are acceptable. However, the Sponsor’s overall proposed breakpoints of for Enterobacteriaceae and P. aeruginosa are not acceptable (see QBR question 2.2.4.1 for a full overview of the available information to inform breakpoints). The Reviewer selected breakpoints for Enterobacteriaceae and P. aeruginosa are 2 µg/mL and 4 µg/mL, respectively. They are lower than the sponsor selected breakpoints because the Reviewer chose a more conservative target
Reference ID: 3648317
(b) (4)

256
corresponding with nearly 2-log10 kill, a lack of clinical data at higher MICs, and the borderline efficacy of ceftolozane/tazobactam in cIAI patients.
2 PertinentregulatorybackgroundCeftolozane, a cephalosporin antibiotic, . Tazobactam, a beta-lactamase inhibitor, was added to the product to improve performance against extended-spectrum beta-lactamase (ESBL) producing organisms. The dosing ratio of 2:1 (ceftolozane:tazobactam on a mg/mg basis) was determined early in development using nonclinical models. The combination rule was satisfied using animal models since it would be unethical to provide tazobactam as a monotherapy to patients with infections. The dosing of the combination of ceftolozane and tazobactam (trade name ZERBAXA) is expressed as a cumulative dose in mg (e.g. 1000 mg of ceftolozane and 500 mg of tazobactam is expressed as 1500 mg of ZERBAXA).
Despite OCP advice to the contrary, three separate renal impairment trials were conducted. This was partially due to a change in sponsors during the IND process and the addition of tazobactam to the combination later in development.
The original development program included two Phase 3 trials for each indication (cUTI and cIAI), but upon receiving feedback from the Agency that one trial for each indication would provide sufficient confirmatory evidence, the sponsor opted to pool their two existing trials for each indication into a single Phase 3 trial for each indication. Pharmacokinetic sampling was not conducted during the Phase 3 trials, so patient PK data is available only from the Phase 2 trials. In addition, the Phase 2 trials (one each in cUTI and cIAI) evaluated a single dose level of ceftolozane, equivalent to the dose used in Phase 3 trials (1500 mg ZERBAXA q8h for cIAI, and 1000 mg of ceftolozane q8h for cUTI), so dose-response analyses based on the Phase 2/3 data for ceftolozane could not be conducted.
The sponsor has an ongoing clinical development program for hospital-acquired bacterial pneumonia and ventilator-associated bacterial pneumonia (HABP/VABP) at a higher proposed dose (3000 mg q8h –2000 mg ceftolozane and 1000 mg tazobactam).
3 ResultsofSponsor’sAnalysisReviewer comment: Unless otherwise noted, the figures and tables displayed in section 3 reflect the sponsor’s analyses. This section covers the sponsor’s population PK analysis, the proposed dose adjustments for renal impairment, and their proposed susceptibility test interpretive criteria.
3.1 PopulationPKAnalysisReviewer comment: Report CUBI-PCS-100 is covered in Section 3.1. This report covers the development of the population PK model, addresses the sources of variability, comments on the need for dose adjustment (or lack thereof) on the basis of intrinsic factors, and provides the support for the proposed dose adjustments in moderate and severe renal impairment. The proposed dose adjustment for patients with ESRD on dialysis is handled in a separate report (CXA-POPPK-002) and will be covered in Section 3.2.
Reference ID: 3648317
(b) (4)
257
OBJECTIVES:
To enrich the previously developed population PK models for ceftolozane/tazobactam by including additional PK data from seven Phase 1 and Phase 2 studies.
To determine the source of variability in PK parameters of ceftolozane/tazobactam, and to identify intrinsic and extrinsic clinically relevant covariates.
To compute model-based individual exposure measures of ceftolozane/tazobactam in special populations (renal impairment, patients with bacterial infection).
METHODS:SoftwareThe population PK analysis was performed using Phoenix Non Linear Mixed Effects (NLME) version 1.2 with the extended least squares first order conditional estimation (FOCE-ELS). FOCE involves optimization of marginal log likelihood(s) using a series of iterations. The iterations are repeated until convergence, which is defined by reduction of the gap (difference between starting and final optimal log likelihood values) to less than a specified tolerance.
Dataset preparation, exploration, and visualization of the data were performed using R (2.15.0), S-Plus v8.2, and Microsoft Office Excel 2003. Phoenix NLME v1.2 was used to evaluate/validate the model with a bootstrap resampling approach and predictive checks. R was used to generate tables of posthoc PK parameters and descriptive statistics.
Population PK ModelingNote: Plasma concentrations of ceftolozane and tazobactam reported as below the limit of quantitation (BLQ) of the assay, all in Phase 1 healthy subjects, were set to missing for the population PK analysis.
The population PK analyses for ceftolozane and tazobactam were performed using the methodology presented in Figure 3.1.1.
Reference ID: 3648317

258
Figure 3.1.1: Overview of Population PK Model Development of Ceftolozane and Tazobactam
Studies included in the Population PK Analysis:This population PK analysis was performed on plasma concentration-time data of ceftolozane/tazobactam obtained from 10 clinical studies. Briefly, PK data were obtained from eight Phase 1 studies, and from two Phase 2 studies. Of the eight Phase 1 studies, five were performed in healthy subjects and three in subjects with various degrees of renal impairment (normal, mild, moderate, severe, and ESRD).
Ceftolozane and tazobactam were administered alone or ceftolozane was administered in combination with tazobactam at a 2:1 ratio of ceftolozane relative to tazobactam. These different treatments were administered at various dosage levels (250, 500, 1000, 1500, 2000, and 3000 mg for ceftolozane, and 250, 500, 750, 1000, and 1500 mg for tazobactam) and dosing intervals (single dose or multiple dose
Reference ID: 3648317
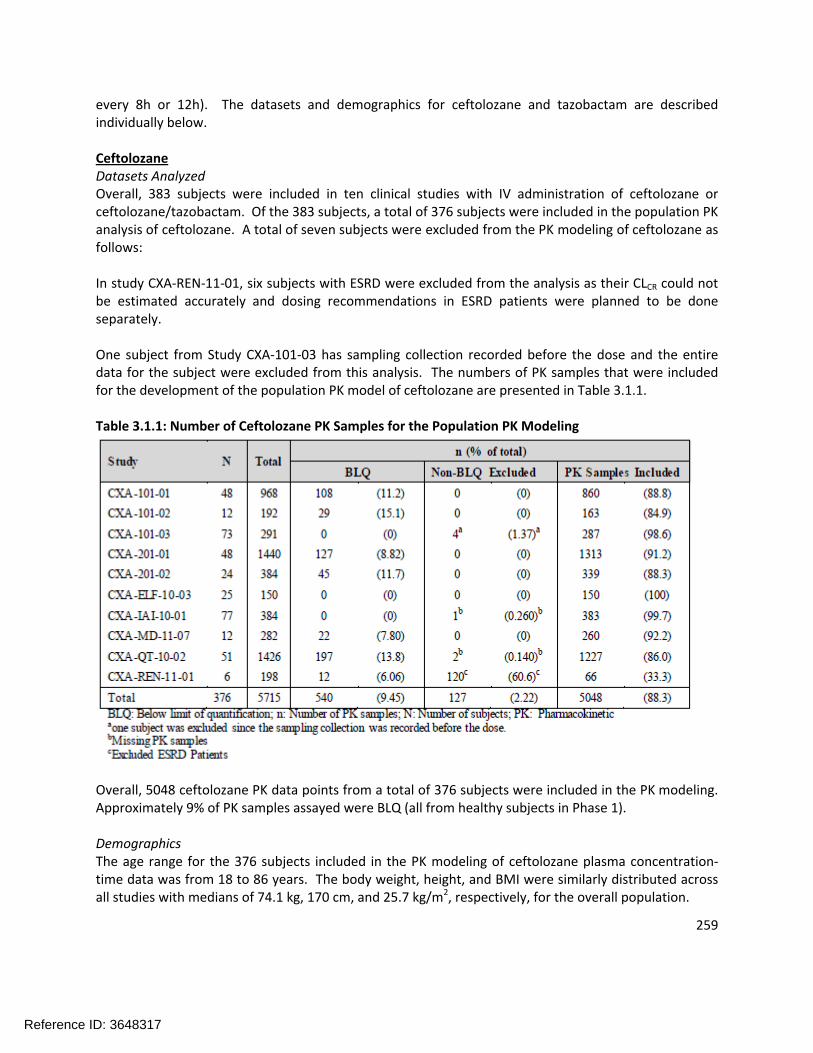
259
every 8h or 12h). The datasets and demographics for ceftolozane and tazobactam are described individually below.
CeftolozaneDatasets AnalyzedOverall, 383 subjects were included in ten clinical studies with IV administration of ceftolozane or ceftolozane/tazobactam. Of the 383 subjects, a total of 376 subjects were included in the population PK analysis of ceftolozane. A total of seven subjects were excluded from the PK modeling of ceftolozane as follows:
In study CXA-REN-11-01, six subjects with ESRD were excluded from the analysis as their CLCR could not be estimated accurately and dosing recommendations in ESRD patients were planned to be done separately.
One subject from Study CXA-101-03 has sampling collection recorded before the dose and the entire data for the subject were excluded from this analysis. The numbers of PK samples that were included for the development of the population PK model of ceftolozane are presented in Table 3.1.1.
Table 3.1.1: Number of Ceftolozane PK Samples for the Population PK Modeling
Overall, 5048 ceftolozane PK data points from a total of 376 subjects were included in the PK modeling. Approximately 9% of PK samples assayed were BLQ (all from healthy subjects in Phase 1).
DemographicsThe age range for the 376 subjects included in the PK modeling of ceftolozane plasma concentration-time data was from 18 to 86 years. The body weight, height, and BMI were similarly distributed across all studies with medians of 74.1 kg, 170 cm, and 25.7 kg/m2, respectively, for the overall population.
Reference ID: 3648317

260
The numbers of males were slightly greater than that of females (56 and 44% were male and female, respectively). About 40% of subjects included in the PK modeling had an infection (e.g. pyelonephritis, appendicitis, and/or other bacterial infections). The percentages of subjects with pyelonephritis andappendicitis were 5.6% and 8.5%, respectively. The majority of subjects were Caucasians (88%). Approximately 68% of subjects had normal renal function and 32% had varying degrees of renal impairment. The maximum CLCR value observed in this study was 309 mL/min using the Cockcroft-Gault equation.
TazobactamDatasets AnalyzedOverall, 249 subjects were included in seven clinical studies with IV administration of tazobactam or ceftolozane/tazobactam. Of the 249 subjects, a total of 243 subjects were included in the population PK analysis of tazobactam. A total of six subjects with ESRD from study CXA-REN-11-01 were excluded from the analysis as their CLCR could not be estimated accurately and dosing recommendations in ESRD patients were planned to be done separately. The numbers of PK samples available for the development of the population PK modeling of tazobactam are presented in Table 3.1.2.
Table 3.1.2: Number of Tazobactam PK Samples for the Population PK Modeling
Overall, 4249 tazobactam data points from a total of 243 subjects were included in the PK modeling. Approximately 35% of PK samples assayed were BLQ and 63% of PK samples assayed were non-BLQ.
DemographicsThe age range of 243 subjects included in the PK modeling of tazobactam was from 18 to 86 years. The body weight, height, and BMI were similarly distributed across all studies with medians of 74.2 kg, 170 cm, and 25.7 kg/m2, respectively, for the overall population.
The numbers of males were slightly greater than that of females (57 and 43% were male and female, respectively). Of the 32% of subjects included in the PK modeling who had an infection, 13% had appendicitis and no subjects had pyelonephritis. The majority of subjects were Caucasians (87%). A
Reference ID: 3648317


262
proportional error model. Diagonal variance (omega) for CL and Vc was estimated. The variability of peripheral PK parameters was fixed to a value of 0 due to shrinkage and to avoid instability. Population PK parameters derived with the structural PK model of ceftolozane are presented in Table 3.1.3.
Table 3.1.3: Population PK Parameters of Ceftolozane – Structural Model
The population estimates of CL (5.33 L/h) and Vc (13.3 L) for ceftolozane were comparable to those obtained in a previous study for the structural model for ceftolozane (4.68-4.97 L/h and 11.47-13.5 L, respectively). The unexplained error was 19% and BSV for CL and Vc were relatively high (45% for both).
TazobactamTazobactam plasma concentration-time plots by dose level and renal impairment category following single and multiple doses of tazobactam or ceftolozane/tazobactam are presented in Figure 3.1.3.
Reference ID: 3648317

263
Figure 3.1.3: Tazobactam Plasma Concentration-Time Plots by Dose Level and Renal Impairment Category (Semi-Log Plot)
As illustrated, following single or multiple infusions, the post-infusion tazobactam concentration declined with time roughly in a bi-exponential manner, with the slower terminal elimination phase with the increasing severity of renal impairment.
The structural model for tazobactam was previously developed with the PK data from Phase 1 (including specific populations) and Phase 2 studies. The structural model consisted of a 2-compartment model parameterized with systemic and peripheral clearance (CL and CL2) as well as central and peripheral volumes of distribution (Vc and Vp). The residual unexplained variability was modeled using a proportional model. The previously selected diagonal omega for CL and Vc was used in this analysis. Initial attempts for more complex omega had convergence issues. The variability of peripheral PK parameters was not reliably estimable and was therefore fixed at 0 values. Population PK parameters derived with the structural PK model of tazobactam are presented in Table 3.1.4.
Reference ID: 3648317

264
Table 3.1.4: Population PK Parameters of Tazobactam – Structural Model
The population estimates of CL (17.1 L/h) and Vc (15.3 L) for tazobactam were comparable to those obtained from the previous study for tazobactam (17.3 L/h and 12.1 L, respectively). The unexplained error was 26.1% and BSV for CL and Vc were moderate to high (54 to 59%).
Covariate AnalysisCeftolozaneIntrinsic covariates (body weight, age, BMI, CLCR, race, renal impairment category, and sex) as well as extrinsic covariates (presence/absence of infection [pyelonephritis, appendicitis and other bacterial infections], dose levels and treatment) were evaluated as potential sources of variability in PK parameters of ceftolozane.
The covariates that were judged to be clinically relevant for the formal covariate analysis in Phoenix NLME were age, body weight, CLCR, sex, race (for exploratory purposes), and infection status on CL and Vc and they were all included for further evaluation in this analysis.
The covariate evaluation was performed using Phoenix NMLE with a stepwise approach of forward selection (p value < 0.01) followed by backward elimination steps (p value < 0.001). For continuous covariates, a power model centered at the median was used to increase numerical stability. For the categorical covariates, an exponentiated factor relative to the reference category was used. The models retained from the covariate analysis are presented in Table 3.1.5.
Reference ID: 3648317

265
Table 3.1.5: Covariate Analysis on PK Parameters of Ceftolozane (Statistically Significant Models Only)
Overall, the tentative final model for ceftolozane was a 2-compartment model with linear elimination including the effect of baseline CLCR on CL and body weight on Vc, and the effect of cUTI/cIAI infection on CL and Vc.
TazobactamIntrinsic covariates (body weight, age, BMI, CLCR, race, renal impairment category and sex) as well as extrinsic covariates (presence/absence of infection [pyelonephritis, appendicitis and other bacterial infections], dose levels and treatment) were evaluated as potential sources of variability in PK parameters of tazobactam.
The potentially clinically relevant covariates for this analysis included age, body weight, CLCR, sex, race (for exploratory purposes), and infection status on CL and Vc. A stepwise covariate evaluation with forward selection (p value < 0.01) followed by backward elimination (p value < 0.001) was performed in this analysis. For continuous covariates, a power model standardized by the median was used, while for the covariates an exponentiated factor relative to the reference category was used. The retained models from the covariate analysis are presented in Table 3.1.6.
Reference ID: 3648317

266
Table 3.1.6: Covariate Analysis on PK Parameters of Tazobactam (Relevant Models Only)
Overall, the tentative final model for tazobactam was a 2-compartment model with linear elimination including the effect of baseline CLCR on CL and the effect of infection on Vc.
FINAL MODEL PERFORMANCE, QUALIFICATION, AND VALIDATION
CeftolozaneThe performance, qualification, and validation of the final population PK model of ceftolozane were evaluated with several methods including goodness-of-fit plots (GOF), visual predictive check (VPC), and a non-parametric bootstrap with replacement. The overall GOF plots with observed, individual predicted, and population predicted ceftolozane concentrations are presented in Figure 3.1.4.
Reference ID: 3648317

267
Figure 3.1.4: Goodness-of-Fit – Final Population PK Model of Ceftolozane
Reviewer comment: The IPRED plot appears to show two sources of bias based on the providedgoodness-of-fit plots. First, there is a tendency to under predict low concentration values, which could be due to handling of BLQ data in the analyses or the presence of additional compartment kinetics at low concentrations. The second source of bias is at concentration values 1 to 100 where all the outliers are below the line of unity. A majority of the samples came from study CXA-IAI-10-01 and a single subject from CXA-201-02 (subject ID 1202, day 10 sampling). The deviation from CXA-IAI-10-01 appears to come from approximately 20 subjects where post-infusion samples (2 hours onward) were higher than measurements immediately following the infusion. For the second case (subject ID 1202 from CXA-201-02), the multiple dose exposure at day 10 was lower than the single dose values at day 1. Overall, these outliers reflect a small percentage of the data (1%) and given the above explanations, are not expected to impact overall model quality.
The appropriateness of using the current model to perform simulations was also evaluated using VPC on ceftolozane plasma concentration-time profiles. A total of 1000 replicates of the original observed 376 subjects with the original dosing regimens were simulated with the final population PK model. The observed ceftolozane concentrations were generally distributed within the 90% PIs of the predicted median across all dose levels suggesting that the final model is expected to accurately predict plasma concentration-time of ceftolozane at a wide range of doses.
Reference ID: 3648317

268
The final population PK model of ceftolozane was evaluated using a bootstrap resampling strategy. A total of 1000 bootstrap runs were performed by using the tentative final population PK model (with the significant covariates). Non-parametric bootstrap values (median) for each parameter were compared with the original parameter estimates to examine bias and predictive error. Non-parametric 95% CIs were also constructed around the population PK median estimates from the Phoenix NLME runs with a successful minimization. All 1000 bootstrap runs were successfully minimized in the bootstrap resampling analysis. See Table 3.1.7 for the distribution of PK parameters of ceftolozane from the bootstrap analysis.
Table 3.1.7: Population PK Analysis of Ceftolozane – Bootstrap Resampling Analysis
The difference between the PK parameters (CL, Vc, CL2, Vp) and the covariate effects on population PK parameters derived from the tentative final model and those derived with the bootstrap resampling analysis were less than 5%. This suggests that point estimates of PK parameters of ceftolozane derived from the tentative final model were very stable. Overall, the final model for ceftolozane was confirmed to be a 2-compartment model with linear elimination including the effect of baseline CLCR on CL and body weight on Vc, and the effect of infection on CL and Vc.
Population PK parameters of ceftolozane derived with the final model are presented in Table 3.1.8.
Reference ID: 3648317

269
Table 3.1.8: Population PK Parameters of Ceftolozane: Final Model
Tornado plots were used to evaluate effect of CLCR and infection on PK parameters of ceftolozane according to the range of CLCR values observed in the current population and based on the different stages of renal impairment (See Figure 3.1.5).
Figure 3.1.5: Relationships of Clearance of Ceftolozane and the Effects of Infection, CLCR, and Renal Impairment
The tornado plot visually compares the unexplained between subject variability in the population to the variability induced by CLCR and the effect of infection and its distribution in the modeled population. The unexplained variability of 34.3% has more impact on relative clearance variations than the effect of infection.
Reference ID: 3648317
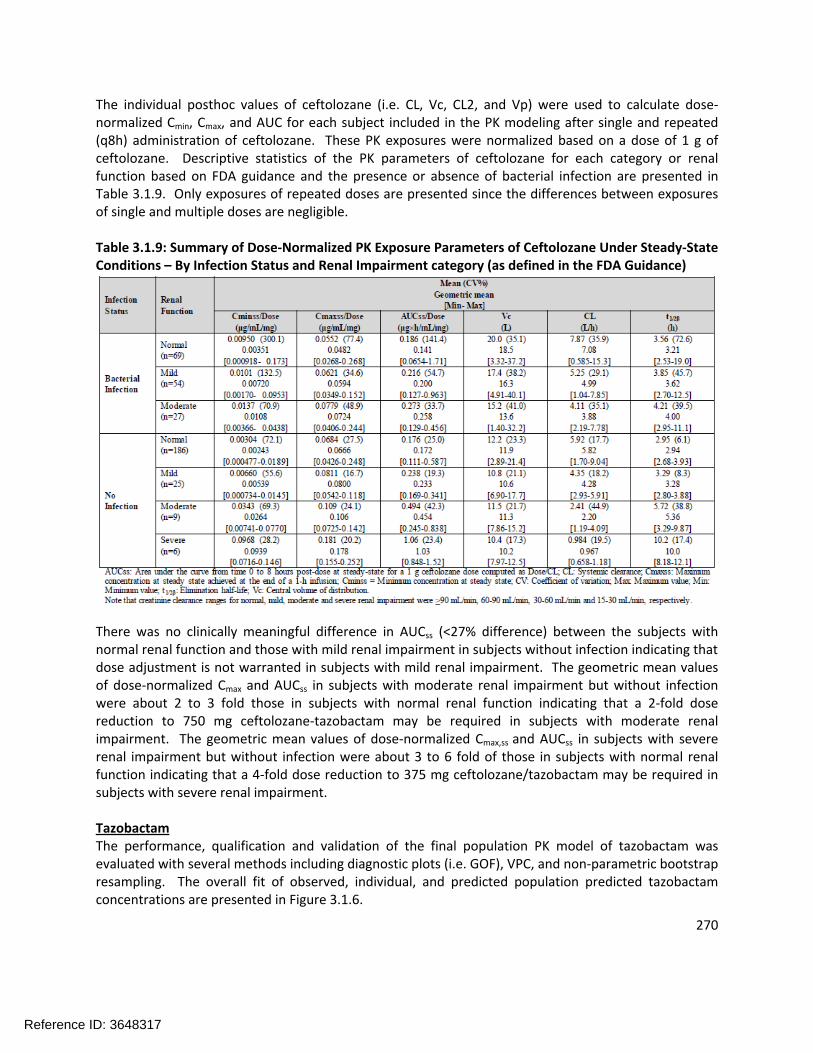
270
The individual posthoc values of ceftolozane (i.e. CL, Vc, CL2, and Vp) were used to calculate dose-normalized Cmin, Cmax, and AUC for each subject included in the PK modeling after single and repeated (q8h) administration of ceftolozane. These PK exposures were normalized based on a dose of 1 g of ceftolozane. Descriptive statistics of the PK parameters of ceftolozane for each category or renal function based on FDA guidance and the presence or absence of bacterial infection are presented in Table 3.1.9. Only exposures of repeated doses are presented since the differences between exposures of single and multiple doses are negligible.
Table 3.1.9: Summary of Dose-Normalized PK Exposure Parameters of Ceftolozane Under Steady-State Conditions – By Infection Status and Renal Impairment category (as defined in the FDA Guidance)
There was no clinically meaningful difference in AUCss (<27% difference) between the subjects with normal renal function and those with mild renal impairment in subjects without infection indicating that dose adjustment is not warranted in subjects with mild renal impairment. The geometric mean values of dose-normalized Cmax and AUCss in subjects with moderate renal impairment but without infection were about 2 to 3 fold those in subjects with normal renal function indicating that a 2-fold dose reduction to 750 mg ceftolozane-tazobactam may be required in subjects with moderate renal impairment. The geometric mean values of dose-normalized Cmax,ss and AUCss in subjects with severe renal impairment but without infection were about 3 to 6 fold of those in subjects with normal renal function indicating that a 4-fold dose reduction to 375 mg ceftolozane/tazobactam may be required in subjects with severe renal impairment.
TazobactamThe performance, qualification and validation of the final population PK model of tazobactam was evaluated with several methods including diagnostic plots (i.e. GOF), VPC, and non-parametric bootstrap resampling. The overall fit of observed, individual, and predicted population predicted tazobactam concentrations are presented in Figure 3.1.6.
Reference ID: 3648317
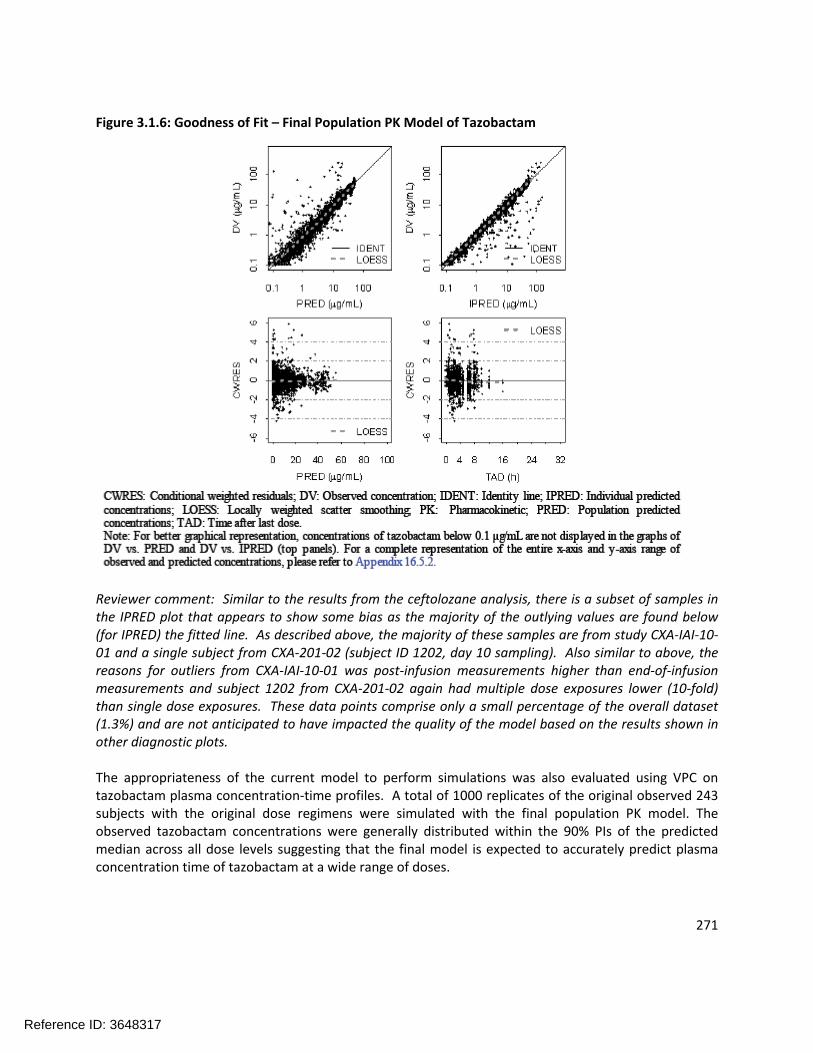
271
Figure 3.1.6: Goodness of Fit – Final Population PK Model of Tazobactam
Reviewer comment: Similar to the results from the ceftolozane analysis, there is a subset of samples in the IPRED plot that appears to show some bias as the majority of the outlying values are found below (for IPRED) the fitted line. As described above, the majority of these samples are from study CXA-IAI-10-01 and a single subject from CXA-201-02 (subject ID 1202, day 10 sampling). Also similar to above, the reasons for outliers from CXA-IAI-10-01 was post-infusion measurements higher than end-of-infusion measurements and subject 1202 from CXA-201-02 again had multiple dose exposures lower (10-fold) than single dose exposures. These data points comprise only a small percentage of the overall dataset (1.3%) and are not anticipated to have impacted the quality of the model based on the results shown in other diagnostic plots.
The appropriateness of the current model to perform simulations was also evaluated using VPC on tazobactam plasma concentration-time profiles. A total of 1000 replicates of the original observed 243 subjects with the original dose regimens were simulated with the final population PK model. The observed tazobactam concentrations were generally distributed within the 90% PIs of the predicted median across all dose levels suggesting that the final model is expected to accurately predict plasma concentration time of tazobactam at a wide range of doses.
Reference ID: 3648317
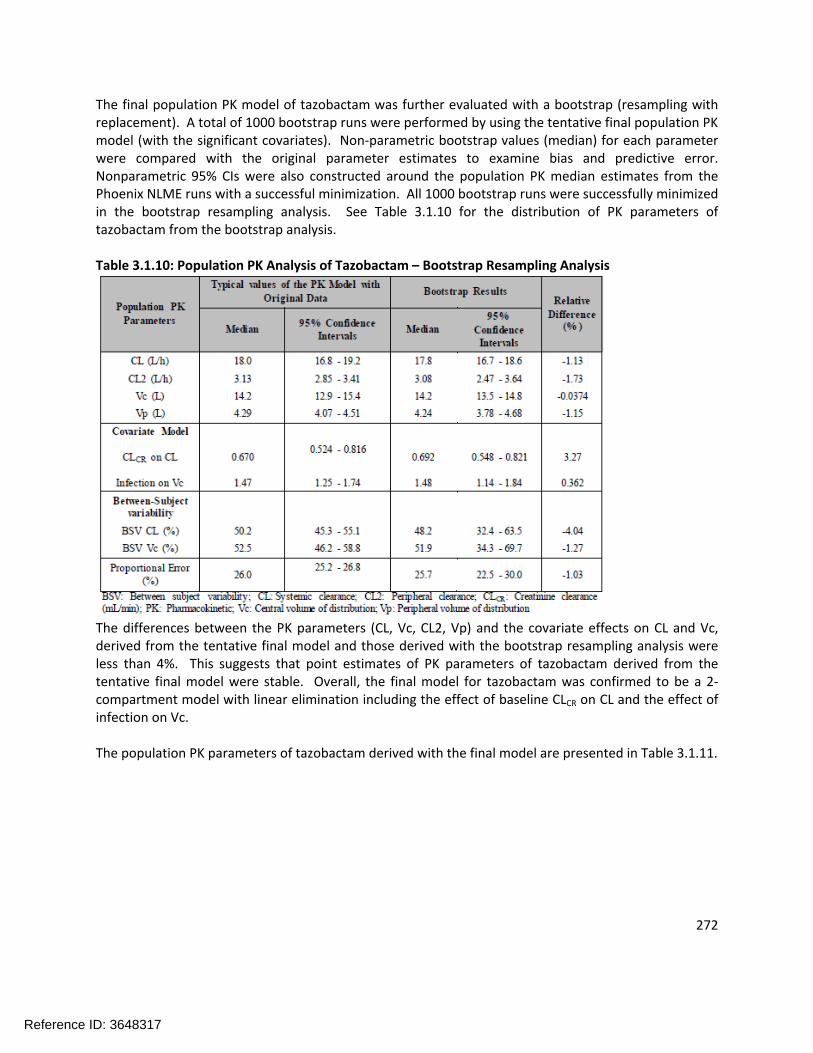
272
The final population PK model of tazobactam was further evaluated with a bootstrap (resampling with replacement). A total of 1000 bootstrap runs were performed by using the tentative final population PK model (with the significant covariates). Non-parametric bootstrap values (median) for each parameter were compared with the original parameter estimates to examine bias and predictive error. Nonparametric 95% CIs were also constructed around the population PK median estimates from the Phoenix NLME runs with a successful minimization. All 1000 bootstrap runs were successfully minimized in the bootstrap resampling analysis. See Table 3.1.10 for the distribution of PK parameters of tazobactam from the bootstrap analysis.
Table 3.1.10: Population PK Analysis of Tazobactam – Bootstrap Resampling Analysis
The differences between the PK parameters (CL, Vc, CL2, Vp) and the covariate effects on CL and Vc, derived from the tentative final model and those derived with the bootstrap resampling analysis were less than 4%. This suggests that point estimates of PK parameters of tazobactam derived from the tentative final model were stable. Overall, the final model for tazobactam was confirmed to be a 2-compartment model with linear elimination including the effect of baseline CLCR on CL and the effect of infection on Vc.
The population PK parameters of tazobactam derived with the final model are presented in Table 3.1.11.
Reference ID: 3648317

273
Table 3.1.11: Population PK Parameters of Tazobactam: Final Model
Tornado plots were used to evaluate effect of CLCR on PK parameters of tazobactam according to the range of CLCR values observed in the current population and based on the different stages of renal impairment (See Figure 3.1.7).
Figure 3.1.7: Relationship of Tazobactam Clearance and CLCR, and Renal Impairment (as defined in the FDA Guidance)
The tornado plot visually compares the unexplained between subject variability in the population to the variability explained by CLCR. The incorporation of CLCR effect on CL reduced the BSV from 59% to 50%. The high unexplained variability of 50.2% has important impact on relative clearance variations. Similar to ceftolozane, the low levels of CLCR (i.e. severe and moderate categories) decreases clearance and supports the need for dose adjustments at patients with moderate or severe renal impairment.
The individual posthoc values of tazobactam CL, Vc, CL2, and Vp were used to calculate dose-normalized Cmin, Cmax, and AUC for each subject included in the PK modeling after single and repeated (q8h and q12h) administration of tazobactam. Descriptive statistics of the PK parameters of tazobactam for each
Reference ID: 3648317

274
category or renal function based on FDA guidance and with the presence of absence of bacterial infection are presented in Table 3.1.12. Only exposures of repeated doses are presented since the differences between exposures of single and multiple doses were negligible.
Table 3.1.12: Summary of Dose-Normalized PK Parameters of Tazobactam Under Steady-State Conditions – By Infection Status and Renal Impairment Category (as defined in the FDA Guidance)
As shown in Table 3.1.12, overall infection status does not significantly change Cmax,ss/Dose (within 10% variation). However, infection status increases AUCss/Dose roughly by 100% with very high variability (CV% of 153-226%) in subjects with normal renal function or mild renal impairment. This increase of exposure was unlikely associated with the infection since the infection status does not significantly change AUCss/Dose in subjects with moderate renal impairment.
REFINED FINAL PK MODEL
The above tentative final model was further refined with infection status being split into cUTI and cIAI since intra-abdominal disease has been shown to significantly increase volume of distribution of beta-lactam antibiotics and may also cause faster drug clearance. Both the between subject and residual variability models were re-tested and the interactions of the identified significant covariates were further evaluated following the same standard procedures for model buildup and validation. The refined final population PK model for ceftolozane became:
Reference ID: 3648317

275
Where UTI and IAI are defined as 1 for cUTI and cIAI patients, respectively, and 0 otherwise; N(0,s2) stands for a normal distribution of the between-subject variability or residual variability centering at 0 with a standard error of s (variance of s2); Cp_obs and Cp_ipred stand for the measured and predicted individual ceftolozane plasma concentrations, respectively. The parameter estimates and their standard confidence variations of the refined model are listed in Table 3.1.13.
Table 3.1.13: Population PK Parameters of Ceftolozane: Refined Final Model
Population PharmacokineticParameters Population Estimate RSE%
CL (L/h)
No Infection 5.11 (2.15) * (CLCR / 109) 0.715 (6.14)
33.0 (3.94)With Infection
x exp(0.190
(24.6) * UTI +
0.195 (22.5) * IAI)
Vc (L)
No Infection 11.4 (2.70) * (WT/74)(1-IAI)
39.8 (4.50)With Infection
x exp(0.191 (30.1) * UTI +
0.464 (12.3) * IAI)
CL2 (L/h) 1.19 (2.24) Fixed at 0
Vp (L) 2.88 (fixed) Fixed at 0
Error Model
Proportional Error (%) 16.8 (11.8) -
Additive Error (µg/mL) 0.0524 (8.07) -Adapted from sponsor’s population PK results table for ceftolozane: BSV: Between-subject variability; cIAI: Complicated intrabdominal infection; CL: Clearance; CL2: Peripheral clearance; CLCR: Creatinine clearance (mL/min); cUTI: Completed urinary tract infection; RSE: Relative standard error; Vc: Central volume of distribution; Vp: Peripheral volume of distribution; WT: Body weight. UTI=1 for cUTI patients; IAI for cIAI patients
Figure 3.1.8 illustrates the covariate effects in ceftolozane clearance, suggesting a dose reduction for patients with moderate (2-fold to 750 mg ceftolozane/tazobactam every 8 hours) or severe renal impairment (4-fold to 375 mg ceftolozane/tazobactam every 8 hours) compared to that in subjects with normal renal function (1.5 g ceftolozane/tazobactam every 8 hours).
Reference ID: 3648317

276
Figure 3.1.8: Relationships of Clearance of Ceftolozane and the Effects of Infection, CLCR, and Renal Impairment (as defined in the FDA Guidance)
Similar to the previous tentative final model, the statistical summary of the individual post hoc values of ceftolozane parameters from the refined final model is listed in Table 3.1.14 by disease status and renal function. As shown in this table, for normal renal function or mild impairment, there is no significant difference in AUC values across healthy subjects, cUTI patients, and cIAI patients. There is no significant difference in AUC between cUTI and cIAI patients either. The apparent observed slight difference in AUC between cUTI patients and cIAI patients was primarily due to differences in creatinine clearance, as demonstrated in the table where more than 50% of cUTI patients had mild renal impairment while more than 60% of cIAI patients had normal renal function. Thus a lower creatinine clearance in cUTI versus cIAI patients contributed to higher AUC in cUTI patients.
Reference ID: 3648317

277
Table 3.1.14: Summary of Dose-Normalized PK Exposure Parameters of Ceftolozane Under Steady State Conditions – by Infection Type Status and Renal Impairment Category (as defined in the FDA Guidance)
Sponsor’s Conclusions
Consistent with results from a previously developed population PK model, a two-compartment disposition model with linear elimination, plus a moderate random between-subject variability in both clearance and volume of distribution best described the PK of ceftolozane/tazobactam in a population comprised of healthy subjects, subjects with varying degrees of renal impairment, and patients with cUTI and cIAI.
Ceftolozane/tazobactam population PK models were robust, allowing for further PK/PD analyses to evaluate the probability of target attainment or any potential exposure-response analyses.
As anticipated for primarily renally eliminated drugs, creatinine clearance was the most significant covariate to interpret the between-subject variability in clearance for ceftolozane/tazobactam, suggesting a 2-fold dose reduction to 750 mg ceftolozane/tazobactam every 8 hours for patients with moderate renal impairment and a 4-fold dose reduction to 375 mg ceftolozane/tazobactam every 8 hours for those with severe renal impairment compared to the subjects with normal renal function and mild renal impairment (1.5 g ceftolozane/tazobactam every 8 hours).
While infection was an important covariate explaining the variability in CL and Vc for ceftolozane and Vc for tazobactam its effect on PK was not considered clinically meaningful as any exposure changes were limited to less than 20%.
Reference ID: 3648317

278
Body weight was a statistically significant covariate for ceftolozane volume of distribution but did not influence exposure alone in a clinically meaningful manner.
None of the other examined covariates, e.g., age, sex, and race, significantly influence the PK of ceftolozane/tazobactam.
Reviewer’s Comments: Overall, the reviewer agrees with the population PK model development conducted by the sponsor for ceftolozane and tazobactam. Creatinine clearance is the primary covariate impacting exposure for these two compounds, as would be expected given what is known regarding their clinical pharmacology and primary route of elimination (no hepatic metabolism; renal elimination). Visual inspection of the observed data supports the identified compartment structures for ceftolozane and tazobactam, though the distribution of ceftolozane concentrations at low concentrations suggests that ceftolozane PK may exhibit additional compartment kinetics at low concentrations. These observations regarding the model, however, do not suggest the model is inappropriate for simulating PK profiles for use in the subsequent determination of breakpoints based on probability of target attainment.
3.2 DoseAdjustmentRecommendationsforESRDINTRODUCTION/OBJECTIVES
This analysis was performed to characterize a) the PK parameters for ceftolozane and tazobactam in subjects with end stage renal disease (ESRD) on hemodialysis and b) assess probability of target attainment (PTA) based on Monte Carlo simulations and recommend optimal dosing regimens for clinical use.
METHODS
DataAltogether per protocol, 156 plasma samples were collected from 6 subjects with ESRD/hemodialysis in Study CXA-REN-11-01. Out of the 156 plasma samples, there were 141 valid ceftolozane (TOL) plasma concentrations and 115 valid tazobactam (TAZ) plasma concentrations included for analysis. The key demographics of the 6 subjects are summarized in Table 3.2.1. Below the lower limit of quantification (BLLOQ) and missing samples, if any, were not included for analysis, except the first pre-dose samples. One ceftolozane concentration and 2 tazobactam concentrations were excluded from analysis due to their abnormal values.
Reference ID: 3648317

279
Table 3.2.1: Demographics of the Subjects with ESRD/Hemodialysis
SoftwarePhoenix Non-Linear Mixed Effects (NLME) version 1.2 with the extended least squares first order conditional estimation (FOCE-ELS) was used for population PK modeling and SAS 9.3 with finite element method (FEM) was used for Monte Carlo simulation. R (2.15.0) and SAS 9.3 were used for data management, statistical summaries and table/figure generation.
Population PK ModelingThe previously developed two-compartment disposition model, as illustrated in Figure 3.2.1, was used to fit the ceftolozane or tazobactam plasma concentration-time data without hemodialysis and to test the between subject variability (BSV) and the residual variability. No other structural model was further tested unless necessary. Ceftolozane or tazobactam plasma concentration-time data with hemodialysis were then included and hemodialysis was tested as a covariate effect on both clearance and volume of distribution for the central compartment. The final model was selected based on the stability of the model, reliability and interpretability of the parameter estimates and the goodness-of-fit plots.
Reference ID: 3648317
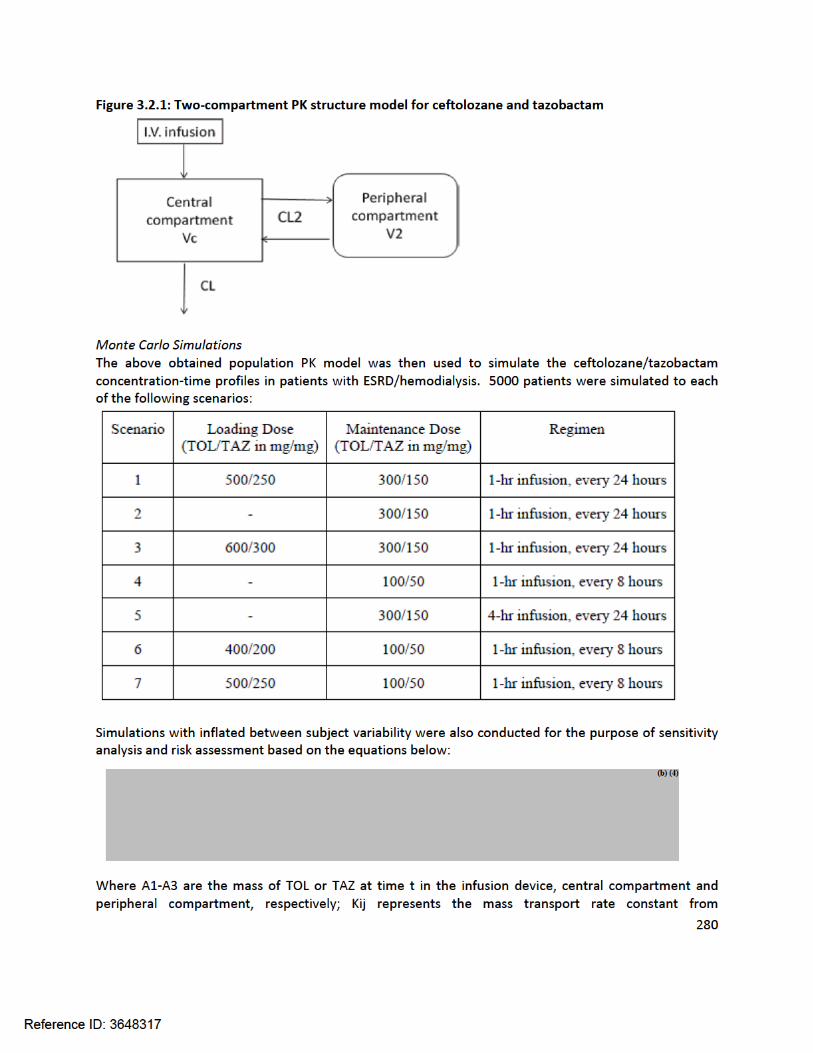

281
compartment i to compartment j, noting that K12=Dose/infdur represents the infusion rate during infusion and 0 post the end of infusion with infdur standing for infusion duration;
For ceftolozane, T>MIC and PTA were based on an MIC range from 0.03 to 128 µg/mL. For tazobactam, there is no MIC value since tazobactam itself does not kill bacteria. However, it is believed that there is tazobactam threshold concentration needed to inhibit beta-lactamase from hydrolyzing antibiotics. Therefore, similar to the minimum inhibitory concentration (MIC) concept used for ceftolozane, a term of minimum efficacious concentration (MEC) is used for tazobactam, representing the minimum concentration that is needed to effectively inhibit resistance development of bacteria. Fu of 0.79 and 0.70 was used for the unbound fraction of ceftolozane and tazobactam, respectively.
RESULTS
CeftolozaneThe population PK model for ceftolozane was developed via a 2-step process. First, the ceftolozane plasma concentrations without hemodialysis (first dose) were modeled and best described with a 2-compartment disposition model plus a proportional residual error model. The between-subject variability was reliably estimated on all four PK parameters (CL, Vc, CL2, and V2). When the ceftolozane plasma concentrations following the second dose with hemodialysis were included, the above model, with the addition of a dichotomous covariate and a between subject variability for the effect of hemodialysis, was the best to fit the combined data. The detailed parameter estimates and their standard errors are listed in Table 3.2.2.
Table 3.2.2: Parameter Estimates of the Population PK Model for Ceftolozane
When the ceftolozane concentrations with and without hemodialysis were all combined together, the volume of distribution for the central compartment was not reliably estimable and was therefore fixed at the value of 6, which was the estimate of the model when only the concentrations following the first dose (without hemodialysis) were included. Otherwise, the model was stable, all converged to the sameset of the final estimates with different sets of initial estimates, and the parameter estimates were all reliable and interpretable. The overall fitting was reasonably good as illustrated by the goodness of fit plots in Figure 3.2.2 and the visual predictive check shown in Figure 3.2.3.
Reference ID: 3648317

282
Figure 3.2.2: Goodness of fit of the Population PK Model for Ceftolozane
Reference ID: 3648317

283
Figure 3.2.3: Visual Predictive Check of the Population PK Model for Ceftolozane
As described by the model, the terminal clearance is about 0.34 L/h, with an apparent terminal half-life of about 40 hours in subjects with ESRD as compared to about 2 hours in subjects with normal renal function. Hemodialysis removes ceftolozane at a clearance of about 20 L/h. In addition, hemodialysis also increased the apparent volume of distribution for the central compartment from about 6 L to about 28 L. The relatively large inter-compartment clearance of about 19 L/h suggests an almost instant equilibrium of ceftolozane concentration between the peripheral compartment and the central compartment.
Reviewer’s comment: Based on the ceftolozane population PK model, a clearance rate of 0.51 L/h would be predicted for a subject with baseline CrCL of 5 mL/min. The observations of this analysis are in relative agreement with that observed from the previous population PK analysis, noting that the population evaluated here have creatinine clearance values outside the range of subjects included in that analysis. However, the consistency between the models provides a measure of confidence in the results from the current analysis given the limited number of subjects.
The reviewer agrees that the impact of hemodialysis would have to be included as a separate covariate in the analysis as was conducted by the sponsor.
TazobactamSimilar to ceftolozane, tazobactam plasma concentrations without hemodialysis (first dose) were first modeled and well described with a 2-compartment disposition model plus a proportional residual error model. The between-subject variability was reliably estimated on all four PK parameters CL, Vc, CL2, and V2. When the tazobactam plasma concentrations following the second dose were included, the model with hemodialysis evaluated as a dichotomous covariate with between-subject variability was the best to fit all the combined data. The detailed parameter estimates are listed in Table 3.2.3. The
Reference ID: 3648317

284
parameters were reliably estimated, with SEM values less than 50%. The overall quality of fitting was good as illustrated by the goodness of fit plots in Figure 3.2.4 and the visual predictive check plot in Figure 3.2.5.
As described by the model, the terminal clearance was about 3 L/h for tazobactam in subjects with ESRD, much larger than ceftolozane due to its metabolic elimination path. The apparent half-life was about 4 hours in subjects with ESRD as compared to about 1 hour in subjects with normal renal function. Hemodialysis increased the terminal clearance of tazobactam from about 3 L/h to about 20 L/h and the apparent volume of distribution for the central compartment from about 11 L to about 16 L. The estimated BSV was very large in both clearance and volume of distribution, partially reflecting the observed variability in this type of subjects with ESRD and the small number of subjects.
Table 3.2.3: Parameter Estimates of the Population PK Model for Tazobactam
Reference ID: 3648317


286
Figure 3.2.5: Visual Predictive Check of the Population PK Model for Tazobactam
Reviewer’s comments: Based on the tazobactam population PK model, a clearance rate of 2.2 L/h would be predicted for a subject with baseline CrCL of 5 mL/min. The observations in the current analysis, which identified an elimination rate of 3 L/h are in relative agreement with that observed from the previous population PK analysis, noting that the population evaluated here have creatinine clearance values outside the range of subjects included in that analysis. .
The reviewer agrees that the impact of hemodialysis would have to be included as a separate covariate in the analysis as was conducted by the sponsor. The analysis predicts that hemodialysis increases clearance approximately 6-fold, resulting in an overall clearance similar to patients with normal renal function.
Monte Carlo SimulationsSimulated scenarios were performed as described in the Methods section. The simulated treatment duration was set for 14 days. A pre-dose 4-hour hemodialysis session was assumed on Monday, Wednesday, and Friday (or the last 4 hours of the previous dosing day). Considering that only 6 subjects were used to estimate BSV values, which might not be representative, a typical 50% BSV (i.e. a variance of 0.25) in log-scale was used in simulations for all PK parameters except hemodialysis. For sensitivity analysis and risk assessment, three additional simulations were also simulated for each of the above scenarios:
a) The BSV values as the model estimated;b) The BSV was inflated to 63% (or 0.40 for variance) in log scale for the parameters with lower
model-estimated BSV, except for hemodialysis which was considered to be machine related;c) The BSV was inflated to 63% (or 0.40 for variance) in log-scale if the model estimate was lower
and deflated to 63% if the model-estimate was higher, except for hemodialysis which was considered to be machine related.
The simulated results indicated that hemodialysis reduced the accumulation from the previous dosing regimens to a minimal level. In addition, for ceftolozane alone, of which the terminal half-life was
Reference ID: 3648317
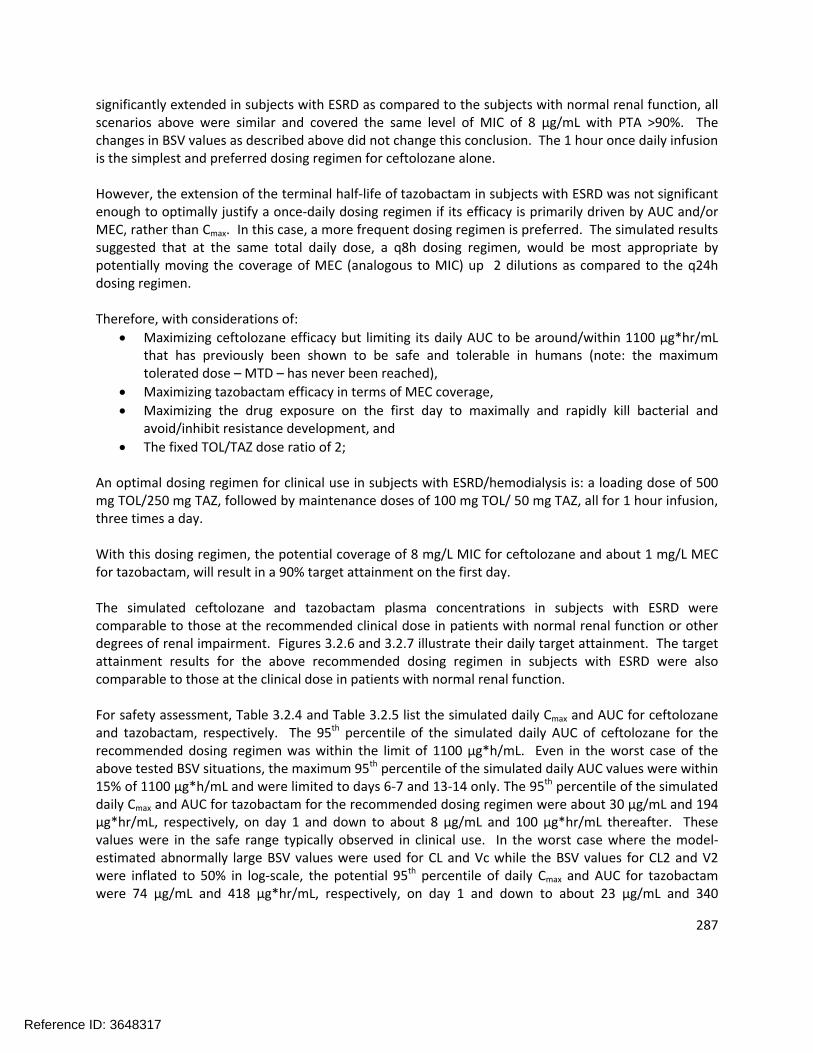
287
significantly extended in subjects with ESRD as compared to the subjects with normal renal function, all scenarios above were similar and covered the same level of MIC of 8 µg/mL with PTA >90%. The changes in BSV values as described above did not change this conclusion. The 1 hour once daily infusion is the simplest and preferred dosing regimen for ceftolozane alone.
However, the extension of the terminal half-life of tazobactam in subjects with ESRD was not significant enough to optimally justify a once-daily dosing regimen if its efficacy is primarily driven by AUC and/or MEC, rather than Cmax. In this case, a more frequent dosing regimen is preferred. The simulated results suggested that at the same total daily dose, a q8h dosing regimen, would be most appropriate by potentially moving the coverage of MEC (analogous to MIC) up 2 dilutions as compared to the q24h dosing regimen.
Therefore, with considerations of:
Maximizing ceftolozane efficacy but limiting its daily AUC to be around/within 1100 µg*hr/mL that has previously been shown to be safe and tolerable in humans (note: the maximum tolerated dose – MTD – has never been reached),
Maximizing tazobactam efficacy in terms of MEC coverage,
Maximizing the drug exposure on the first day to maximally and rapidly kill bacterial and avoid/inhibit resistance development, and
The fixed TOL/TAZ dose ratio of 2;
An optimal dosing regimen for clinical use in subjects with ESRD/hemodialysis is: a loading dose of 500 mg TOL/250 mg TAZ, followed by maintenance doses of 100 mg TOL/ 50 mg TAZ, all for 1 hour infusion, three times a day.
With this dosing regimen, the potential coverage of 8 mg/L MIC for ceftolozane and about 1 mg/L MEC for tazobactam, will result in a 90% target attainment on the first day.
The simulated ceftolozane and tazobactam plasma concentrations in subjects with ESRD were comparable to those at the recommended clinical dose in patients with normal renal function or other degrees of renal impairment. Figures 3.2.6 and 3.2.7 illustrate their daily target attainment. The target attainment results for the above recommended dosing regimen in subjects with ESRD were also comparable to those at the clinical dose in patients with normal renal function.
For safety assessment, Table 3.2.4 and Table 3.2.5 list the simulated daily Cmax and AUC for ceftolozane and tazobactam, respectively. The 95th percentile of the simulated daily AUC of ceftolozane for the recommended dosing regimen was within the limit of 1100 µg*h/mL. Even in the worst case of the above tested BSV situations, the maximum 95th percentile of the simulated daily AUC values were within 15% of 1100 µg*h/mL and were limited to days 6-7 and 13-14 only. The 95th percentile of the simulated daily Cmax and AUC for tazobactam for the recommended dosing regimen were about 30 µg/mL and 194 µg*hr/mL, respectively, on day 1 and down to about 8 µg/mL and 100 µg*hr/mL thereafter. These values were in the safe range typically observed in clinical use. In the worst case where the model-estimated abnormally large BSV values were used for CL and Vc while the BSV values for CL2 and V2 were inflated to 50% in log-scale, the potential 95th percentile of daily Cmax and AUC for tazobactam were 74 µg/mL and 418 µg*hr/mL, respectively, on day 1 and down to about 23 µg/mL and 340
Reference ID: 3648317

288
µg*hr/mL thereafter. These values were in the range that other recommended clinical dosing regimens have reached for tazobactam e.g. Zosyn.
In summary, the dosing regimens of 500/250 (TOL/TAZ in mg/mg) loading dose, followed by a 100/50 maintenance dose infused over 1 hour q8h is recommended for clinical use.
Figure 3.2.6: Simulated Daily Free Ceftolozane %T>MIC Targets by MIC Values in Patients with ESRD for the Dosing Regimen: a Loading Dose of 500 mg Tol/250 mg TAZ + Maintenance Doses of 100 mg TOL/50 mg TAZ, All Infused Over 1 hour and Given Every 8 Hours (BSV = 50% in log scale and N=5000)
Reference ID: 3648317
Best Available Copy


292
Table 3.2.4: Simulated Median (5th, 95th percentile) Daily Cmax and AUC of Total Ceftolozane for the Dosing Regimen: a Loading Dose of 500 mg TOL/250 mg TAZ + Maintenance Doses of 100 mg TOL/50 mg TAZ, All Infused Over 1 hour and Given Every 8 Hours (BSV = 50% in log scale and N=5000)
Reference ID: 3648317

293
Table 3.2.5: Simulated (5th, 95th percentile) Daily Cmax and AUC of Total Tazobactam for the Dosing Regimen: a Loading Dose of 500 mg TOL/250 mg TAZ + Maintenance Doses of 100 mg TOL/50 mg TAZ, All Infused Over 1 hour and Given Every 8 Hours (BSV = 50% in log scale and N=5000)
Sponsor’s Conclusions
Ceftolozane/tazobactam plasma concentrations following TOL/TAZ infusion in subjects with ESRD and on intermittent hemodialysis can be best described with a 2-compartment disposition model plus a covariate effect of hemodialysis on both clearance and volume of distribution of the central compartment
o The residual accumulation, if any, from previous doses prior to each hemodialysis is manageable with appropriate dose adjustments.
o Ceftolozane terminal half-life is significantly extended such that a daily or q8h dosing regimen in subjects with ESRD are equally adequate in achieving PTA of >90% for an MIC of up to 8 µg/mL.
o Tazobactam terminal half-life is modestly extended but not long enough to justify changing the q8h dosing regimen to a daily dosing regimen.
With consideration of maximizing tazobactam efficacy and limiting ceftolozane daily AUC around or within 1100 µg/mL, the proposed dosing regimen for clinical use in subjects with ESRD is: a single loading dose of 500 mg ceftolozane/250 mg tazobactam via 1 hour infusion, followed in 8 hours by a maintenance dose of 100 mg ceftolozane/50 mg tazobactam via 1 hour infusion every 8 hours. A maintenance dose is suggested to be given at the earliest possible time post the end of each hemodialysis session.
3.3 Susceptibility TestInterpretiveCriteria– EnterobacteriaceaeINTRODUCTION/OBJECTIVES
Reference ID: 3648317

294
Using a population PK model for ceftolozane, the population PK model for tazobactam, non-clinical PK/PD targets, and Monte Carlo simulation, the objective of these analyses was to conduct PK/PD target attainment analyses to provide support for the following:
Recommendation for in vitro susceptibility test interpretive criteria for ceftolozane/tazobactam against Enterobacteriaceae (beta-lactamase producers and non-producers); and
Selected ceftolozane/tazobactam dosing regimens by renal function category.
METHODS
Monte Carlo SimulationUsing the previously developed population PK models for ceftolozane and tazobactam and various ceftolozane/tazobactam dosing regimens, plasma concentration-time profiles for ceftolozane/tazobactam were generated for simulated patients. These simulations were conducted for five renal function categories (see below) with a total of 5000 patients simulated (1000 per category)
High normal renal function (> 150 to ≤ 200 mL/min);
Normal renal function (> 90 to ≤ 150 mL/min);
Mild renal impairment (>50 to ≤ 90 mL/min);
Moderate renal impairment (≥29 to ≤ 50 mL/min); and
Severe renal impairment (≥15 to <29 mL/min).In each renal function category, patients were assigned a CLCR value based upon a uniform distribution.
In addition to CLCR, total body weight (WTKG), an additional covariate identified during population PK modeling, was assigned to each simulated patient. This was carried out by randomly sampling from a log-normal distribution for total body weight with a mean (standard deviation, SD) of 75.6 (15.5) kg which was based upon the actual values obtained for the ceftolozane/tazobactam-treated Phase 2 patients with cUTI (including pyelonephritis) and patients with cIAI.
Reviewer comment: The Sponsor used the final population PK model for ceftolozane as described in Section 3.1 and specifically the parameters listed in Table 3.1.8. It appears they did not use the “refined final model” that was described in Section 3.1. However, the differences between the so-called final model and the refined final model do not appear to be significant, so the conclusions in this report are unlikely to change significantly if the refined final model were used instead.
The Sponsor used the final population PK model for tazobactam as described in Table 3.1.11.
The sponsor-evaluated two different ceftolozane/tazobactam dosing regimens (2000/1000 mg or 1000/500 mg) administered over 1 hour every 8 hours (q8h) with additional dosing adjustments within regimens by renal function category. A short summary of the regimens and dosing adjustments are provided below:
Reference ID: 3648317

295
Reviewer comment: the 2000 mg ceftolozane dosing regimens are not under consideration for this NDA as the proposed dosing regimen is 1000 mg ceftolozane and 500 mg tazobactam.
Using the population PK model for ceftolozane, total-drug steady-state ceftolozane plasma concentration-time profiles were generated for each simulated patient in each renal function category for each of the ceftolozane dosing regimens listed above. For each simulated patient, total-drug steady-state ceftolozane plasma concentrations were simulated every 5 minutes during the dosing interval. A plasma protein binding estimate of 21% was used for ceftolozane to derive free-drug plasma concentrations. Since free-drug ceftolozane plasma concentrations are likely to be the pharmacologically-active entity, total-drug ceftolozane plasma concentrations were subsequently multiplied by 0.79 to calculate the free-drug ceftolozane plasma concentrations for use for the PK/PD target attainment analyses described below.
A similar process was used to simulate tazobactam concentration-time profiles. Using the population PK model for tazobactam, free drug steady-state tazobactam plasma concentration-time profiles were generated for each simulated patient in each renal function category for each of the dosing regimens.
Pharmacokinetic/Pharmacodynamic Target Attainment AnalysesUsing the targets described below, PK/PD target attainment by MIC was assessed for simulated patients in each renal function category. In the primary analyses, data were assessed in the context of the clinical trial program MIC distribution for ceftolozane/tazobactam against Enterobacteriaceae. In sensitivity analyses, PK/PD target attainment by MIC value was also conducted based on surveillance data from the Unites States (US) and European Union (EU).
CeftolozaneStudies in the mouse neutropenic thigh model determined that the PK/PD parameter most closely associated with efficacy for ceftolozane was the %T>MIC. Four P. aeruginosa isolates and 4 Enterobacteriaceae isolates were studied in this model. Since the total drug %T>MIC targets for
Reference ID: 3648317
(b) (4)

296
ceftolozane against P. aeruginosa and Enterobacteriaceae for each bacterial reduction endpoint overlapped, the individual isolate targets were pooled and the median values for each bacterial reduction endpoint were determined.
Based on data for all eight isolates, the median total drug %T>MIC values of and were associated with net bacterial stasis and a 1-log10 CFU reduction from baseline, respectively.
Using ultrafiltration at ceftolozane concentrations of 10 and 100 mg/L, protein binding was assessed. Given that the authors reported minimal plasma protein binding (<5%), free drug and total drug ceftolozane %T>MIC targets were considered equivalent. Thus, total drug %T>MIC targets based on these data are referred to as free drug %T>MIC targets herein.
For the PK/PD target attainment analyses, free-drug %T>MIC targets of and associated with net bacterial stasis and a 1-log10 CFU reduction from baseline, respectively, were assessed. Free drug %T>MIC targets of 40, 50, and 60 were also assessed.
TazobactamIn two studies, VanScoy and colleagues utilized a PK/PD in vitro infection model to identify the PK/PD determinates of tazobactam efficacy when administered with ceftolozane. In the first study, a dose-fractionation study was designed to determine the exposure measure most predictive of tazobactam efficacy in combination with ceftolozane. The challenge organism panel was comprised of an isogenic CTX-M-15-producing E. coli triplet set, genetically engineered to transcribe different levels of blaCTX-M-15. These recombinant strains exhibited ceftolozane MIC values of 4, 16, and 64 mg/L representing low, moderate, and high levels of CTX-M-15, respectively. Different blaCTX-M-15 transcription levels were confirmed by relative quantitative real time polymerase chain reaction and beta-lactamase hydrolytic assays. The exposure measure associated with efficacy was the percentage of the dosing interval that tazobactam concentrations remained above a threshold (%T>threshold), regardless of enzyme expression (r2=0.938, see Figure 3.3.1). The threshold concentrations identified was dependent upon enzyme expression level.
Reference ID: 3648317
(b) (4)
(b) (4)
(b) (4)
(b) (4)

297
Figure 3.3.1: Relationships between three tazobactam exposure measures, AUC, Cmax, and %T>threshold, and the change in log10 CFU of isogenic CTX-M-15-producing E. coli after 24 hours of therapy in a PK/PD in vitro infection model. The color of the symbols represents the different dose-fractionation schedules, while the shape of the symbol represents the level of beta-lactamase production. Cmax is shown in micrograms per milliliter.
In the second study, a tazobactam dose-range study was designed to determine the %T>threshold necessary for efficacy in combination with ceftolozane in a PK/PD in vitro infection model. The initial challenge panel included four well-characterized beta-lactamase-producing E. coli strains with variable enzyme expression and other resistance determinants. A range of tazobactam doses were administered using a fixed dose of ceftolozane, both of which simulated that observed in humans. The ceftolozane dose administered for isolates with MIC values of 0.5 and 1 mg/L was 1000 mg while a 2000 mg dose was administered for isolates with MIC values of 2 and 4 mg/L. The tazobactam dose ranged from 135 to 4000 mg. Each dosing interval was 8 hours since this is the dosing schedule that was used in clinical trials. Both drugs were administered over 1 hour, and free-drug concentration-time profiles assuming 20% and 30% protein binding for ceftolozane and tazobactam, respectively, were simulated.
Data from the dose-ranging studies were evaluated using a PK/PD Hill-type model and nonlinear least-squares regression. The data were weighted using the inverse of the estimated measurement variance. Relationships between free-drug tazobactam %T>MIC threshold and changes in log10 CFU from baseline at 24 hours were evaluated. For each individual isolate, the free-drug tazobactam %T>threshold was identified through an iterative process in which candidate threshold concentrations of 0.05, 0.1, 0.25, 0.5, 1, 2, and 4 mg/L were evaluated.
As evidenced by r2 values ranging from 0.90 to 0.99 for each clinical isolate, the observed data were well described by fitted functions describing the relationship between the tazobactam %T>threshold and change in log10 CFU from baseline; however, the data from the four isolates did not co-model well. Thethreshold concentration identified for each isolate ranged from 0.5 to 4 mg/L. Subsequently, an enabling translational relationship was identified for the tazobactam threshold that allowed co-modeling of all four clinical isolates, which was the product of the individual isolate’s ceftolozane/tazobactam MIC value and 0.5. As evidenced by an r2 value of 0.90, the transformed data
Reference ID: 3648317

298
were well described by a fitted function describing the relationship between tazobactam %T>threshold and change in log10 CFU from baseline. Due to these findings, the challenge panel was expanded to include three well-characterized beta-lactamase-producing K. pneumoniae strains with variable enzyme expression and other resistance determinants. As shown in Figure 3.3.2, the translational relationship for the tazobactam threshold that allowed for the co-modeling of the four E. coli isolates performed well for the expanded data set (seven isolates in total; four E. coli and three K. pneumoniae), as evidenced by an r2 value of 0.84.
Based on pooled and transformed data for the four E. coli and three K. pneumoniae clinical isolates, the parameter estimates (standard errors) for the relationship between free drug tazobactam %T>threshold and change in log10 CFU from baseline were as follows: change in log10 CFU from baseline at 24 hours in the absence of drug (E0), 2.89 (0.212); maximum effect (Emax), 8.09 (2.54); Hill’s coefficient, 3.21 (0.88); and 50% effective concentration (EC50), 79.2 (15.9). The free drug tazobactam %T>threshold associated with net bacterial stasis and 1- and 2-log10 CFU reductions in bacteria at 24 hours were 65.9, 77.3, and 90.2% of the dosing interval, respectively, regardless of the MIC, number and type of beta-lactamases, or other resistance determinants.
For the PK/PD target attainment analyses described, a free drug tazobactam %T>threshold target of 65.9 associated with net bacterial stasis was assessed.
Figure 3.3.2: Relationship between tazobactam %T>threshold and change in log10 CFU from baseline at 24 hours for the four E. coli and three K. pneumoniae clinical isolates in a PK/PD in vitro infection model. Isolates are represented by different colors. The black line represents the fitted function for the pooled data across isolates. The threshold for each isolate represented the product of the ceftolozane/tazobactam MIC value for the individual isolate and 0.5.
Pathogen Susceptibility DataPK/PD target attainment results were interpreted in the context of MIC distributions for ceftolozane/tazobactam against Enterobacteriaceae collected during the course of the clinical trial
Reference ID: 3648317

299
program, which was comprised of data from four studies involving patients with either complicated urinary tract infections or complicated intra-abdominal infections shows the MIC distributions for ceftolozane/tazobactam against Enterobacteriaceae isolates which were collected from these patients, grouped by ESBL producer status. Details regarding the process to identify ESBL-producing isolates and to elucidate the ESBL are provided below.
Isolates classified as Enterobacteriaceae are presented in Table 3.3.1. Enterobacteriaceae isolates were tested for susceptibility to ceftolozane and ceftolozane/tazobactam. Additionally, Enterobacteriaceae were evaluated using the algorithm below and those meeting the criteria were further characterized to elucidate ESBLs:
Isolates that qualified for testing were subjected to a commercial MicroArray System Check- MDR CT101 kit. The assays were performed according to the manufacturer’s instructions for the screening of genes encoding the CTX-M Groups , 2, 8+25 and 9, TEM wild type and extended-spectrum beta-lactamase, SHV wild type and ESBL and the carbapenemases KPC and NDM. In addition, Enterobacteriaceae isolates were screened for oxacillinase – (blaOXA-2-, blaOXA-10-, and blaOXA-13-group, blaOXA-18 and blaOXA-45) and carbapenemase-encoding genes (blaIMP, blaVIM, and blaOXA-28) using custom and validated multiplex assays.
A sensitivity analysis, PK/PD target attainment by MIC value was also evaluated in the context of surveillance data from the US and the EU, which are provided below.
Reference ID: 3648317
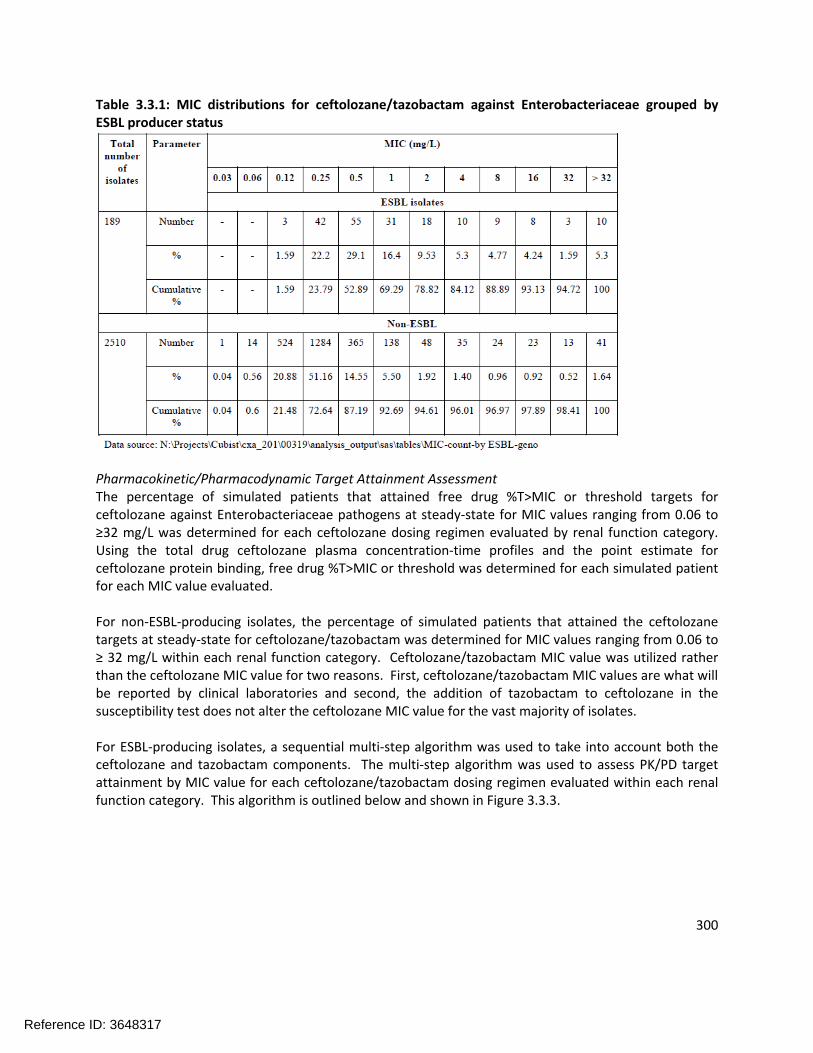
300
Table 3.3.1: MIC distributions for ceftolozane/tazobactam against Enterobacteriaceae grouped by ESBL producer status
Pharmacokinetic/Pharmacodynamic Target Attainment AssessmentThe percentage of simulated patients that attained free drug %T>MIC or threshold targets for ceftolozane against Enterobacteriaceae pathogens at steady-state for MIC values ranging from 0.06 to ≥32 mg/L was determined for each ceftolozane dosing regimen evaluated by renal function category. Using the total drug ceftolozane plasma concentration-time profiles and the point estimate for ceftolozane protein binding, free drug %T>MIC or threshold was determined for each simulated patient for each MIC value evaluated.
For non-ESBL-producing isolates, the percentage of simulated patients that attained the ceftolozane targets at steady-state for ceftolozane/tazobactam was determined for MIC values ranging from 0.06 to ≥ 32 mg/L within each renal function category. Ceftolozane/tazobactam MIC value was utilized rather than the ceftolozane MIC value for two reasons. First, ceftolozane/tazobactam MIC values are what will be reported by clinical laboratories and second, the addition of tazobactam to ceftolozane in the susceptibility test does not alter the ceftolozane MIC value for the vast majority of isolates.
For ESBL-producing isolates, a sequential multi-step algorithm was used to take into account both the ceftolozane and tazobactam components. The multi-step algorithm was used to assess PK/PD target attainment by MIC value for each ceftolozane/tazobactam dosing regimen evaluated within each renal function category. This algorithm is outlined below and shown in Figure 3.3.3.
Reference ID: 3648317

301
Reference ID: 3648317
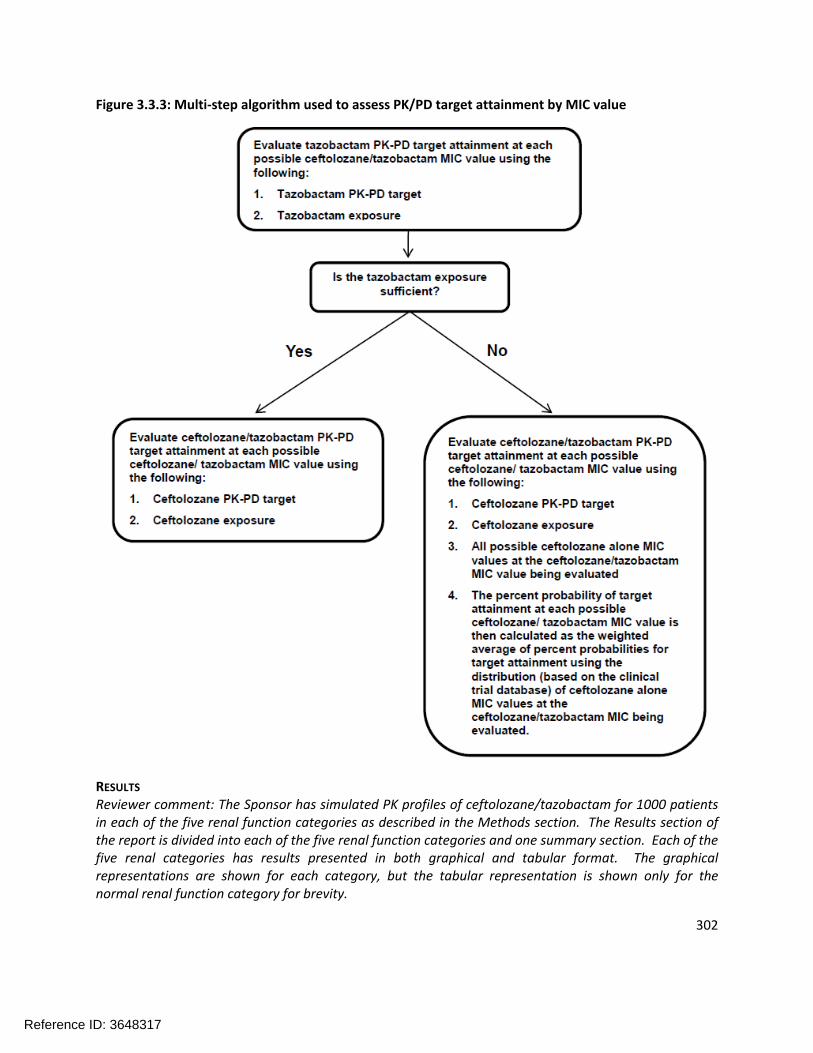
302
Figure 3.3.3: Multi-step algorithm used to assess PK/PD target attainment by MIC value
RESULTS
Reviewer comment: The Sponsor has simulated PK profiles of ceftolozane/tazobactam for 1000 patients in each of the five renal function categories as described in the Methods section. The Results section of the report is divided into each of the five renal function categories and one summary section. Each of the five renal categories has results presented in both graphical and tabular format. The graphical representations are shown for each category, but the tabular representation is shown only for the normal renal function category for brevity.
Reference ID: 3648317

303
PK/PD Target Attainment in Simulated Patients with High Normal Renal FunctionFigure 3.3.4 shows the percentage of the 1000 simulated patients with high normal renal function achieving free drug PK/PD targets for ceftolozane (%T>MIC) and tazobactam (%T>threshold) for the clinical trial program MIC distribution at steady state following administration of ceftolozane/tazobactam 1000/500 mg q8h.
Figure 3.3.4: Percentage of the 1000 simulated patients with high normal renal function (>150 mL/min to ≤ 200 mL/min by Cockcroft-Gault) achieving free-drug %T>MIC targets for Enterobacteriaceae by MIC value at steady-state following administration of ceftolozane/tazobactam 1000/500 mg q8h overlaid on histograms showing MIC distributions for ceftolozane/tazobactam against Enterobacteriaceae
PK/PD Target Attainment in Simulated Patients with Normal Renal FunctionThe percentage of the 1000 simulated patients with normal renal function achieving free-drug PK/PD targets for ceftolozane (%T>MIC) and tazobactam (%T>threshold) for the clinical trial program MIC distribution at steady-state following administration of ceftolozane/tazobactam 1000/500 mg q8h is shown in Table 3.3.2. The shaded area in the table separates the MIC values at which the percentage of simulated patients achieving a given free drug %T>MIC target is approximately 80%. As expected, the percentage of simulated patients achieving free-drug PK/PD targets increased as the MIC value or the magnitude of the target decreased. A ceftolozane/tazobactam dosing regimen of 1000/500 mg q8h allowed for 80% or greater of simulated patients with normal renal function to achieve free drug %T>MIC targets ≥ and respectively, up to an MIC value of 4 mg/L. Figure 3.3.5 shows the
Reference ID: 3648317
(b) (4) (b) (4)


305
Figure 3.3.5: Percentage of the 1000 simulated patients with normal renal function (> 90 to ≤ 150 mL/min by Cockcroft-Gault equation) achieving free drug %T>MIC targets for Enterobacteriaceae by MIC value at steady-state following administration of ceftolozane/tazobactam 1000/500 mg q8h overlaid on histograms showing MIC distributions for ceftolozane/tazobactam against Enterobacteriaceae
PK/PD Target Attainment in Simulated Patients with Mild Renal ImpairmentFigure 3.3.6 shows the percentage of the 1000 simulated patients with mild renal impairment achieving free drug PK/PD targets for ceftolozane (%T>MIC) and tazobactam (%T>threshold) for the clinical trial program MIC distribution at steady state following administration of ceftolozane/tazobactam 1000/500 mg q8h.
Reference ID: 3648317
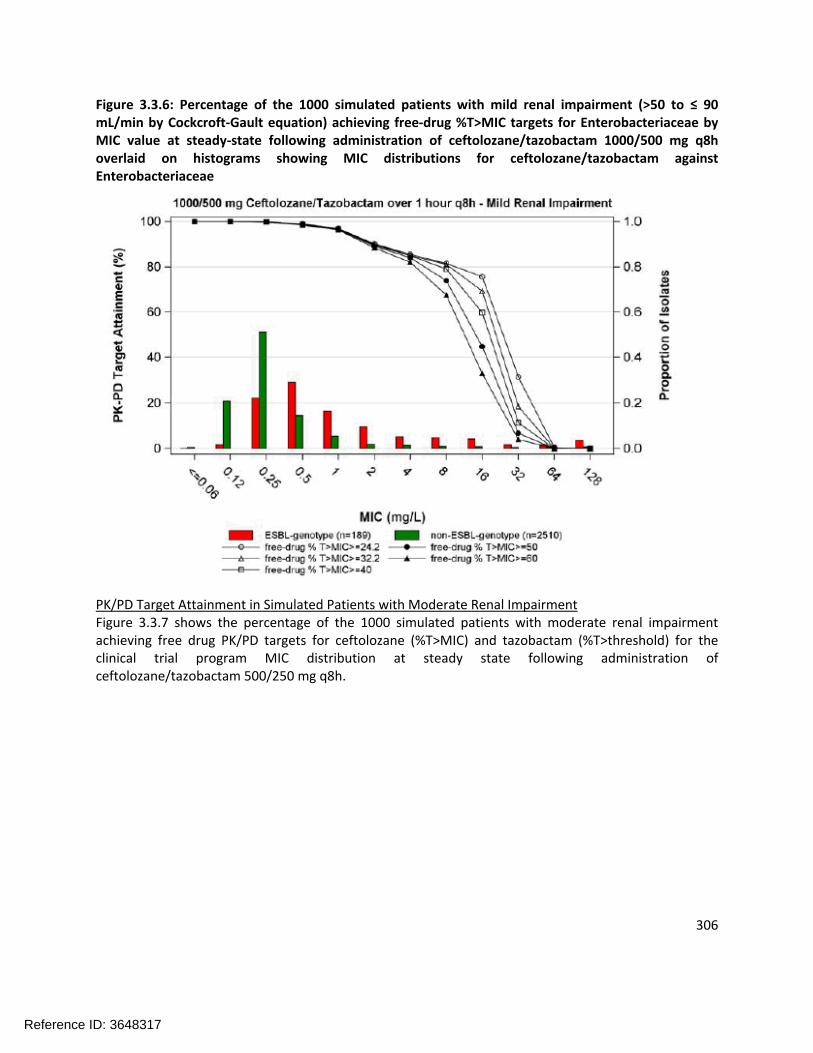
306
Figure 3.3.6: Percentage of the 1000 simulated patients with mild renal impairment (>50 to ≤ 90 mL/min by Cockcroft-Gault equation) achieving free-drug %T>MIC targets for Enterobacteriaceae by MIC value at steady-state following administration of ceftolozane/tazobactam 1000/500 mg q8h overlaid on histograms showing MIC distributions for ceftolozane/tazobactam against Enterobacteriaceae
PK/PD Target Attainment in Simulated Patients with Moderate Renal ImpairmentFigure 3.3.7 shows the percentage of the 1000 simulated patients with moderate renal impairment achieving free drug PK/PD targets for ceftolozane (%T>MIC) and tazobactam (%T>threshold) for the clinical trial program MIC distribution at steady state following administration of ceftolozane/tazobactam 500/250 mg q8h.
Reference ID: 3648317

307
Figure 3.3.7: Percentage of the 1000 simulated patients with moderate renal impairment (≥29 to ≤ 50 mL/min by Cockcroft-Gault equation) achieving free-drug %T>MIC targets for Enterobacteriaceae by MIC value at steady-state following administration of ceftolozane/tazobactam 500/250 mg q8h overlaid on histograms showing MIC distributions for ceftolozane/tazobactam against Enterobacteriaceae
PK/PD Target Attainment in Simulated Patients with Severe Renal ImpairmentFigure 3.3.8 shows the percentage of the 1000 simulated patients with severe renal impairment achieving free drug PK/PD targets for ceftolozane (%T>MIC) and tazobactam (%T>threshold) for the clinical trial program MIC distribution at steady state following administration of ceftolozane/tazobactam 250/125 mg q8h.
Reference ID: 3648317
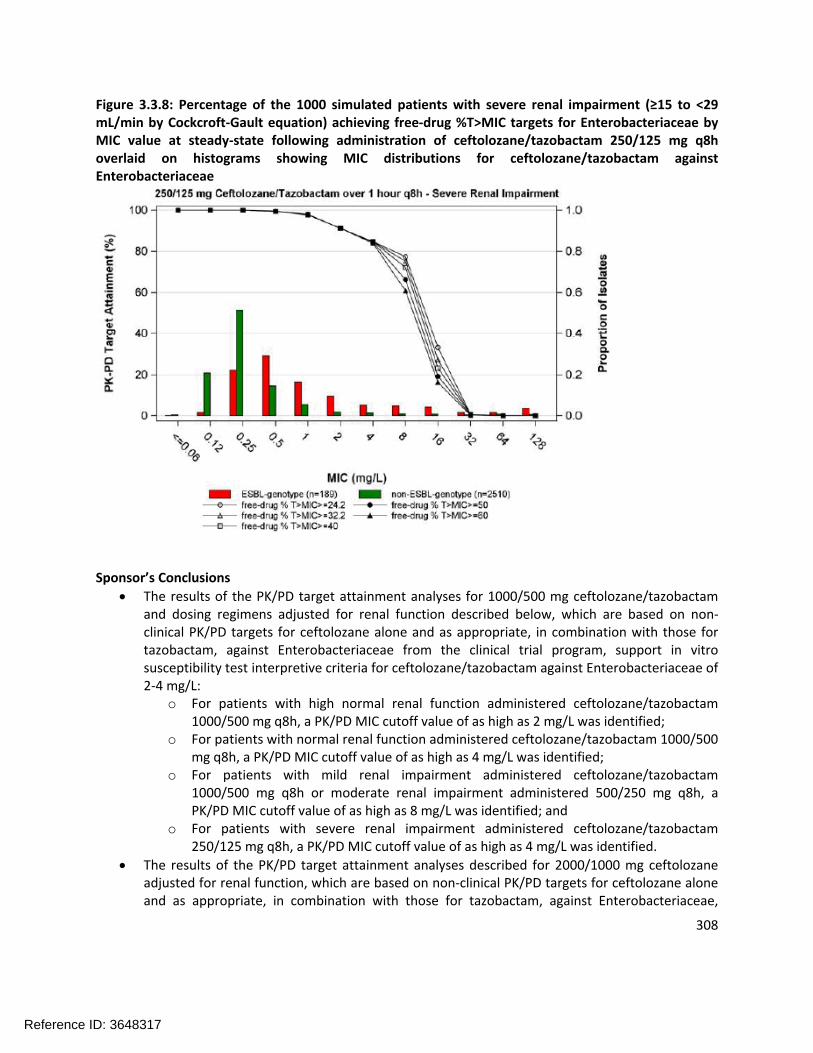
308
Figure 3.3.8: Percentage of the 1000 simulated patients with severe renal impairment (≥15 to <29 mL/min by Cockcroft-Gault equation) achieving free-drug %T>MIC targets for Enterobacteriaceae by MIC value at steady-state following administration of ceftolozane/tazobactam 250/125 mg q8h overlaid on histograms showing MIC distributions for ceftolozane/tazobactam against Enterobacteriaceae
Sponsor’s Conclusions
The results of the PK/PD target attainment analyses for 1000/500 mg ceftolozane/tazobactam and dosing regimens adjusted for renal function described below, which are based on non-clinical PK/PD targets for ceftolozane alone and as appropriate, in combination with those for tazobactam, against Enterobacteriaceae from the clinical trial program, support in vitro susceptibility test interpretive criteria for ceftolozane/tazobactam against Enterobacteriaceae of 2-4 mg/L:
o For patients with high normal renal function administered ceftolozane/tazobactam 1000/500 mg q8h, a PK/PD MIC cutoff value of as high as 2 mg/L was identified;
o For patients with normal renal function administered ceftolozane/tazobactam 1000/500 mg q8h, a PK/PD MIC cutoff value of as high as 4 mg/L was identified;
o For patients with mild renal impairment administered ceftolozane/tazobactam 1000/500 mg q8h or moderate renal impairment administered 500/250 mg q8h, a PK/PD MIC cutoff value of as high as 8 mg/L was identified; and
o For patients with severe renal impairment administered ceftolozane/tazobactam 250/125 mg q8h, a PK/PD MIC cutoff value of as high as 4 mg/L was identified.
The results of the PK/PD target attainment analyses described for 2000/1000 mg ceftolozane adjusted for renal function, which are based on non-clinical PK/PD targets for ceftolozane alone and as appropriate, in combination with those for tazobactam, against Enterobacteriaceae,
Reference ID: 3648317

309
support in vitro susceptibility test interpretive criteria for ceftolozane/tazobactam against Enterobacteriaceae of
3.4 SusceptibilityTestInterpretiveCriteria– P.aeruginosaINTRODUCTION/OBJECTIVES
Using a population PK model for ceftolozane, non-clinical PK/PD targets, and Monte Carlo simulation, the objectives of these analyses was to conduct PK/PD target attainment analyses to provide support for the following:
Recommendations for in vitro susceptibility test interpretive criteria for ceftolozane/tazobactam against Pseudomonas aeruginosa; and
Selected ceftolozane/tazobactam dosing regimens by renal function category.
METHODS
Monte Carlo SimulationUsing the previously developed population PK models for ceftolozane and various ceftolozane/tazobactam dosing regimens, plasma concentration-time profiles for ceftolozane/tazobactam were generated for simulated patients. These simulations were conducted for five renal function categories (see below) with a total of 5000 patients simulated (1000 per category)
High normal renal function (> 150 to ≤ 200 mL/min);
Normal renal function (> 90 to ≤ 150 mL/min);
Mild renal impairment (>50 to ≤ 90 mL/min);
Moderate renal impairment (≥29 to ≤ 50 mL/min); and
Severe renal impairment (≥15 to <29 mL/min).In each renal function category, patients were assigned a CLCR value based upon a uniform distribution.
In addition to CLCR, total body weight (WTKG), an additional covariate identified during population PK modeling, was assigned to each simulated patient. This was carried out by randomly sampling from a log-normal distribution for total body weight with a mean (standard deviation, SD) of 75.6 (15.5) kg which was based upon the actual values obtained for the ceftolozane/tazobactam-treated Phase 2 patients with cUTI (including pyelonephritis) and patients with cIAI. This modeling approach is similar to that applied for Enterobacteriaceae.
Reviewer comment: The Sponsor used the final population PK model for ceftolozane as described in Section 3.1 and specifically the parameters listed in Table 3.1.8. It appears they did not use the “refined final model” that was described in Section 3.1. However, the differences between the models do not appear to be significant, so the conclusions in this report are unlikely to be altered if the refined final model were used instead.
The sponsor-evaluated two different ceftolozane/tazobactam dosing regimens (2000/1000 mg or 1000/500 mg) administered over 1 hour every 8 hours (q8h) with additional dosing adjustments by renal function category (see below).
Reference ID: 3648317
(b) (4)

310
As the activity of ceftolozane is not enhanced significantly by tazobactam due to lack of inhibition of AmpC beta-lactamase, only ceftolozane exposures were considered in these analyses. Thus, PK/PD target attainment results by renal function category for the above-described dosing regimens were expressed in terms of ceftolozane doses.
Reviewer comment: the 2000 mg ceftolozane dosing regimens are not under consideration for this NDA as the proposed dosing regimen is 1000 mg ceftolozane and 500 mg tazobactam.
Using the population PK model for ceftolozane, total-drug steady-state ceftolozane plasma concentration-time profiles were generated for each simulated patient in each renal function category for each of the ceftolozane dosing regimens listed above.
For each simulated patient, total-drug steady-state ceftolozane plasma concentrations were output at 5 minute intervals during the dosing interval. A plasma protein binding estimate of 21% was used for ceftolozane to derive free-drug plasma concentrations. Since free-drug ceftolozane plasma concentrations are likely to be the pharmacologically-active entity, total-drug ceftolozane plasma concentrations were subsequently multiplied by 0.79 to calculate the free-drug ceftolozane plasma concentrations for use for the PK/PD target attainment analyses described below.
Pharmacokinetic/Pharmacodynamic Target Attainment AnalysesUsing the targets described below, PK/PD target attainment by MIC was assessed for simulated patients in each renal function category.
Studies in the mouse neutropenic thigh model determined that the PK/PD parameter most closely associated with efficacy for ceftolozane was the %T>MIC. Four P. aeruginosa isolates and 4 Enterobacteriaceae isolates were studied in this model. Since the total drug %T>MIC targets for ceftolozane against P. aeruginosa and Enterobacteriaceae for each bacterial reduction endpoint
Reference ID: 3648317
(b) (4)

311
overlapped, the individual isolate targets were pooled and the median values for each bacterial reduction endpoint were determined.
Based on data for all eight isolates, the median total drug %T>MIC values of and were associated with net bacterial stasis and a 1-log10 CFU reduction from baseline, respectively.
Using ultrafiltration at ceftolozane concentrations of 10 and 100 mg/L, protein binding was assessed. Given that the authors reported minimal plasma protein binding (<5%), free drug and total drug ceftolozane %T>MIC targets were considered equivalent. Thus, total drug %T>MIC targets based on these data are referred to as free drug %T>MIC targets herein.
For the PK/PD target attainment analyses, free-drug %T>MIC targets of and associated with net bacterial stasis and a 1-log10 CFU reduction from baseline, respectively, were assessed. Free drug %T>MIC targets of 40, 50, and 60 were also assessed.
The percentage of simulated patients that attained free drug %T>MIC targets for ceftolozane against P. aeruginosa at steady-state for MIC values ranging from 0.03 to ≥32 mg/L was determined for each ceftolozane dosing regimen evaluated by renal function category. Using the total drug ceftolozane plasma concentration-time profiles and the point estimate for ceftolozane protein binding, free drug %T>MIC was then calculated for each simulated patient and MIC combination.
For context MIC distributions for ceftolozane/tazobactam against P. aeruginosa based on contemporary surveillance collected from the US and EU are included. A summary of the MIC distributions for ceftolozane/tazobactam against P. aeruginosa by US and EU regions is provided in Table 3.4.1.
Table 3.4.1: MIC distributions for ceftolozane/tazobactam against P. aeruginosa by US and EU regions
RESULTS
Reviewer comment: The Sponsor has simulated PK profiles for 1000 patients in each of the five renal function categories as described in the Methods section. The Results section of the report is divided into
Reference ID: 3648317
(b) (4)
(b) (4)
(b) (4)
(b) (4)

312
each of the five renal function categories and one summary section. Each of the five renal categories has results presented in both graphical and tabular format. The graphical representations are shown for each category, but the tabular representation is shown only for the normal renal function category for brevity.
PK/PD Target Attainment in Simulated Patients with High Normal Renal FunctionFigure 3.4.1 shows the percentage of the 1000 simulated patients with high normal renal function achieving free drug %T>MIC targets for P. aeruginosa by MIC at steady-state following administration of ceftolozane 1000 mg q8h.
Figure 3.4.1: Percentage of the 1000 simulated patients with high normal renal function (>150 to ≤ 200 mL/min by Cockcroft-Gault equation) achieving free-drug %T>MIC targets for P. aeruginosa by MIC value at steady-state following administration of ceftolozane 1000 mg q8h overlaid on histograms showing the US and EU MIC distributions for ceftolozane/tazobactam against P. aeruginosa
PK/PD Target Attainment in Simulated Patients with Normal Renal FunctionThe percentage of the 1000 simulated patients with normal renal function achieving free drug %T>MIC targets for P. aeruginosa by MIC value at steady-state following administration of ceftolozane 1000 mg q8h is shown in Table 3.4.2. The line in the table separates the MIC values at which the percentage of simulated patients achieving a given free drug %T>MIC target is < or ≥ 90%. As expected, the percentage of simulated patients achieving free drug %T>MIC targets increased as the MIC value of the magnitude of the target decreased. A ceftolozane dosing regimen of 1000 mg q8h allowed for 99.1 and 94.7% of simulated patients with normal renal function to achieve free drug %T>MIC targets ≥ and
respectively, at an MIC value of 8 mg/L. Figure 3.4.2 shows the same data as presented in Table
Reference ID: 3648317
(b) (4)
(b) (4)
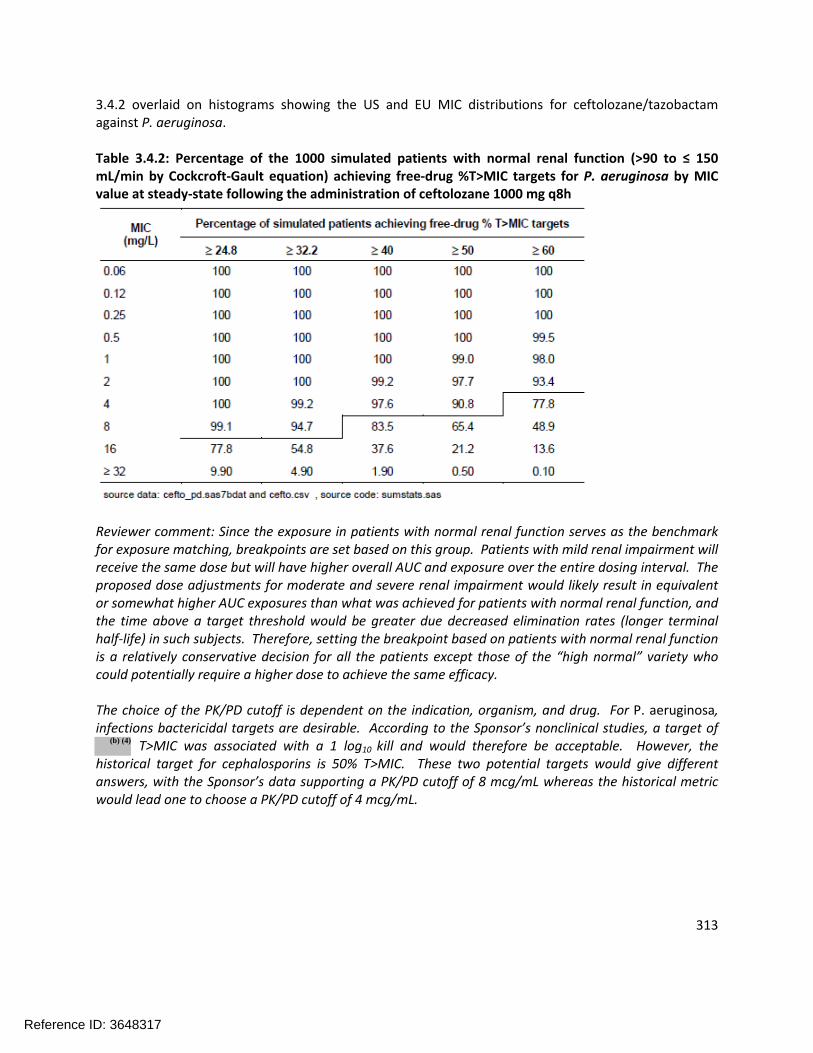
313
3.4.2 overlaid on histograms showing the US and EU MIC distributions for ceftolozane/tazobactam against P. aeruginosa.
Table 3.4.2: Percentage of the 1000 simulated patients with normal renal function (>90 to ≤ 150 mL/min by Cockcroft-Gault equation) achieving free-drug %T>MIC targets for P. aeruginosa by MIC value at steady-state following the administration of ceftolozane 1000 mg q8h
Reviewer comment: Since the exposure in patients with normal renal function serves as the benchmark for exposure matching, breakpoints are set based on this group. Patients with mild renal impairment will receive the same dose but will have higher overall AUC and exposure over the entire dosing interval. The proposed dose adjustments for moderate and severe renal impairment would likely result in equivalent or somewhat higher AUC exposures than what was achieved for patients with normal renal function, and the time above a target threshold would be greater due decreased elimination rates (longer terminal half-life) in such subjects. Therefore, setting the breakpoint based on patients with normal renal function is a relatively conservative decision for all the patients except those of the “high normal” variety who could potentially require a higher dose to achieve the same efficacy.
The choice of the PK/PD cutoff is dependent on the indication, organism, and drug. For P. aeruginosa, infections bactericidal targets are desirable. According to the Sponsor’s nonclinical studies, a target of
T>MIC was associated with a 1 log10 kill and would therefore be acceptable. However, the historical target for cephalosporins is 50% T>MIC. These two potential targets would give different answers, with the Sponsor’s data supporting a PK/PD cutoff of 8 mcg/mL whereas the historical metric would lead one to choose a PK/PD cutoff of 4 mcg/mL.
Reference ID: 3648317
(b) (4)
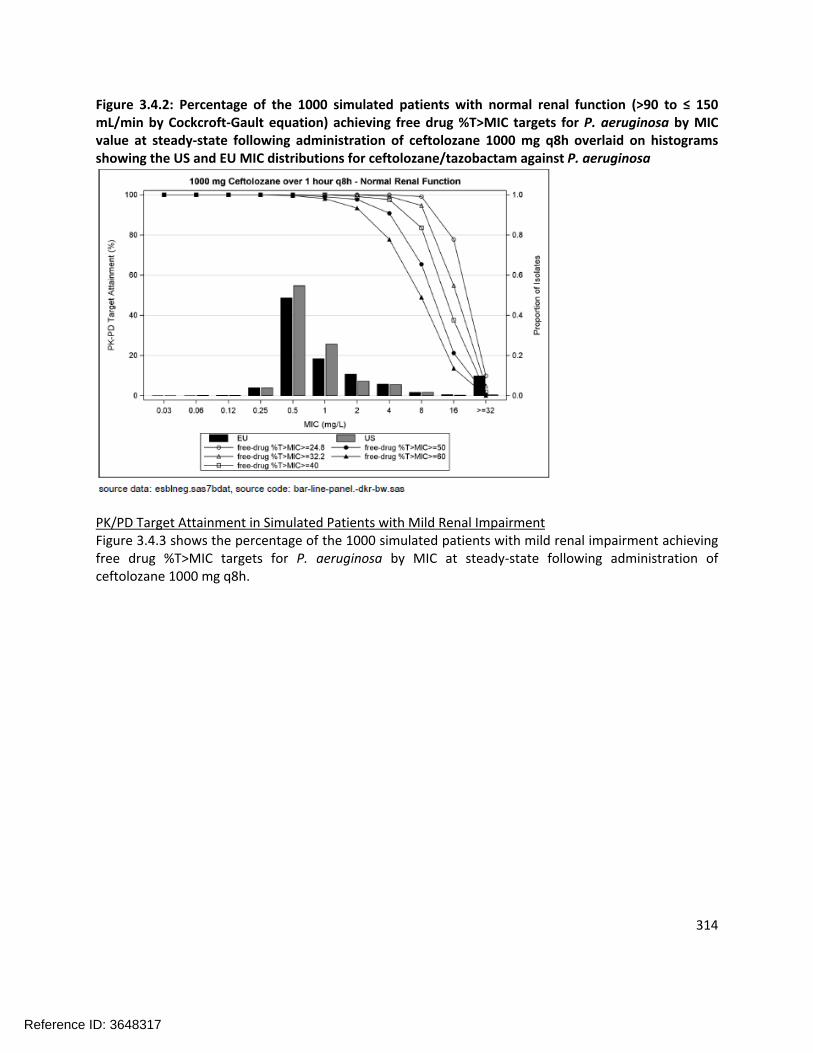
314
Figure 3.4.2: Percentage of the 1000 simulated patients with normal renal function (>90 to ≤ 150 mL/min by Cockcroft-Gault equation) achieving free drug %T>MIC targets for P. aeruginosa by MIC value at steady-state following administration of ceftolozane 1000 mg q8h overlaid on histograms showing the US and EU MIC distributions for ceftolozane/tazobactam against P. aeruginosa
PK/PD Target Attainment in Simulated Patients with Mild Renal ImpairmentFigure 3.4.3 shows the percentage of the 1000 simulated patients with mild renal impairment achieving free drug %T>MIC targets for P. aeruginosa by MIC at steady-state following administration of ceftolozane 1000 mg q8h.
Reference ID: 3648317

315
Figure 3.4.3: Percentage of the 1000 simulated patients with mild renal impairment (>50 to ≤ 90 mL/min by Cockcroft-Gault equation) achieving free drug %T>MIC targets for P. aeruginosa by MIC value at steady-state following administration of ceftolozane 1000 mg q8h overlaid on histograms showing the US and EU MIC distributions for ceftolozane/tazobactam against P. aeruginosa
PK/PD Target Attainment in Simulated Patients with Moderate Renal ImpairmentFigure 3.4.4 shows the percentage of the 1000 simulated patients with moderate renal impairment achieving free drug %T>MIC targets for P. aeruginosa by MIC at steady-state following administration of ceftolozane 500 mg q8h.
Reference ID: 3648317

316
Figure 3.4.4: Percentage of the 1000 simulated patients with moderate renal impairment (≤29 to ≤ 50 mL/min by Cockcroft-Gault equation) achieving free drug %T>MIC targets for P. aeruginosa by MIC value at steady-state following administration of ceftolozane 500 mg q8h overlaid on histograms showing the US and EU MIC distributions for ceftolozane/tazobactam against P. aeruginosa
PK/PD Target Attainment in Simulated Patients with Severe Renal ImpairmentFigure 3.4.5 shows the percentage of the 1000 simulated patients with severe renal impairment achieving free drug %T>MIC targets for P. aeruginosa by MIC at steady-state following administration of ceftolozane 250 mg q8h.
Reference ID: 3648317
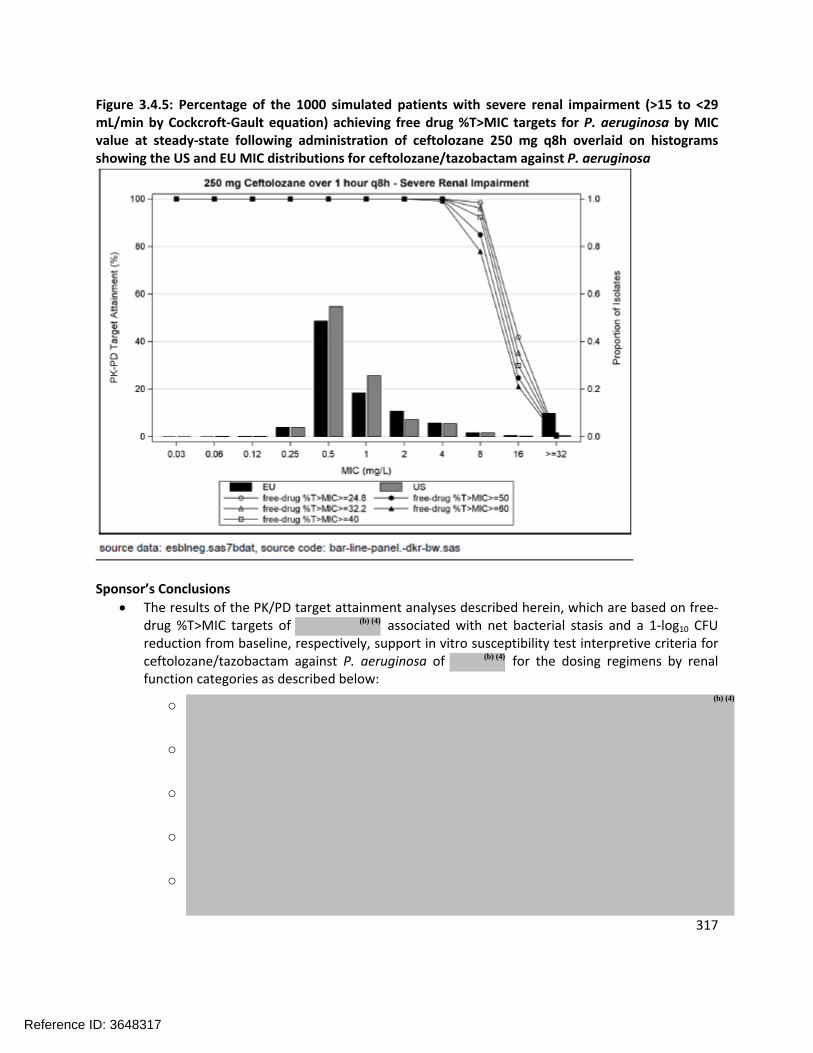
317
Figure 3.4.5: Percentage of the 1000 simulated patients with severe renal impairment (>15 to <29 mL/min by Cockcroft-Gault equation) achieving free drug %T>MIC targets for P. aeruginosa by MIC value at steady-state following administration of ceftolozane 250 mg q8h overlaid on histograms showing the US and EU MIC distributions for ceftolozane/tazobactam against P. aeruginosa
Sponsor’s Conclusions
The results of the PK/PD target attainment analyses described herein, which are based on free-drug %T>MIC targets of associated with net bacterial stasis and a 1-log10 CFU reduction from baseline, respectively, support in vitro susceptibility test interpretive criteria for ceftolozane/tazobactam against P. aeruginosa of for the dosing regimens by renal function categories as described below:
o
o
o
o
o
Reference ID: 3648317
(b) (4)
(b) (4)
(b) (4)

318
The results of the PK/PD target attainment analyses described for 2000 mg ceftolozane adjusted for renal function group, which are based on free-drug %T>MIC targets of associated with net bacterial stasis and a 1-log10 CFU reduction from baseline, respectively, support in vitro susceptibility test interpretive criteria for ceftolozane/tazobactam against P. aeruginosa of
Reference ID: 3648317
(b) (4)
(b) (4)

---------------------------------------------------------------------------------------------------------This is a representation of an electronic record that was signedelectronically and this page is the manifestation of the electronicsignature.---------------------------------------------------------------------------------------------------------/s/----------------------------------------------------
RYAN P OWEN10/24/2014
JEFFRY FLORIAN10/24/2014
KIMBERLY L BERGMAN10/24/2014
Reference ID: 3648317
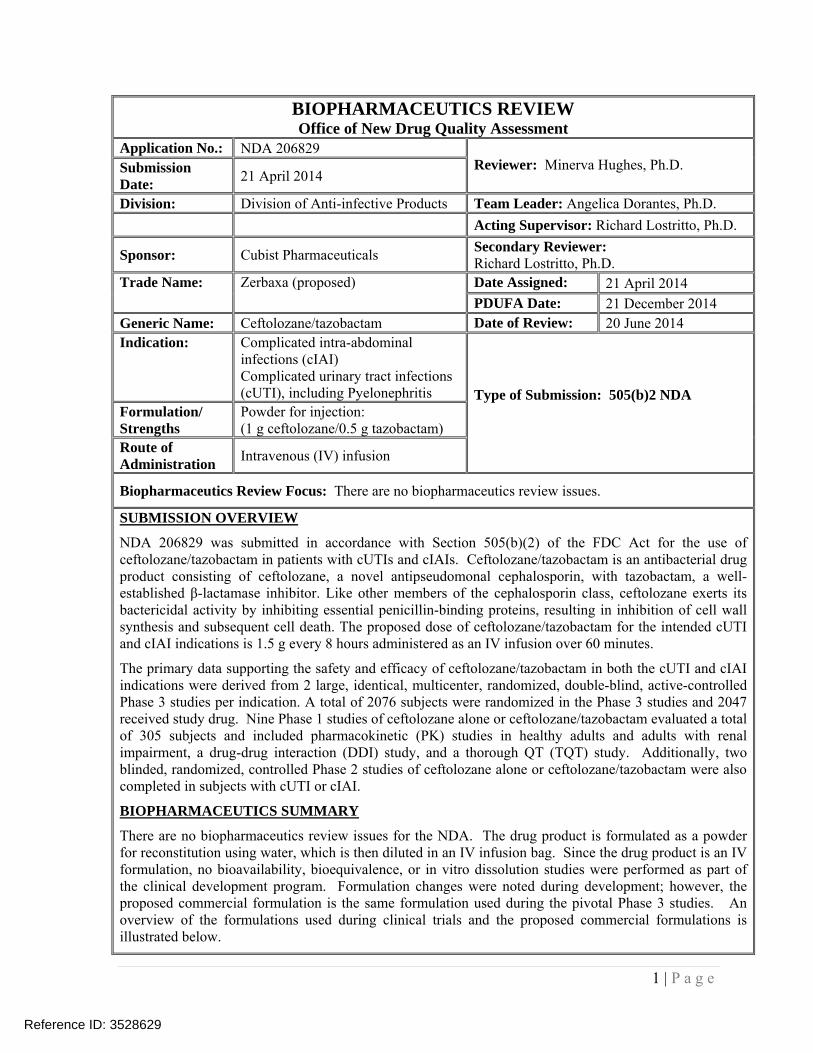
1 | P a g e
BIOPHARMACEUTICS REVIEW Office of New Drug Quality Assessment
Application No.: NDA 206829 Reviewer: Minerva Hughes, Ph.D. Submission
Date: 21 April 2014
Division: Division of Anti-infective Products Team Leader: Angelica Dorantes, Ph.D.
Acting Supervisor: Richard Lostritto, Ph.D.
Sponsor: Cubist Pharmaceuticals Secondary Reviewer: Richard Lostritto, Ph.D.
Trade Name: Zerbaxa (proposed) Date Assigned: 21 April 2014 PDUFA Date: 21 December 2014
Generic Name: Ceftolozane/tazobactam Date of Review: 20 June 2014 Indication: Complicated intra-abdominal
infections (cIAI) Complicated urinary tract infections (cUTI), including Pyelonephritis Type of Submission: 505(b)2 NDA
Formulation/ Strengths
Powder for injection: (1 g ceftolozane/0.5 g tazobactam)
Route of Administration
Intravenous (IV) infusion
Biopharmaceutics Review Focus: There are no biopharmaceutics review issues.
SUBMISSION OVERVIEW
NDA 206829 was submitted in accordance with Section 505(b)(2) of the FDC Act for the use of ceftolozane/tazobactam in patients with cUTIs and cIAIs. Ceftolozane/tazobactam is an antibacterial drug product consisting of ceftolozane, a novel antipseudomonal cephalosporin, with tazobactam, a well-established β-lactamase inhibitor. Like other members of the cephalosporin class, ceftolozane exerts its bactericidal activity by inhibiting essential penicillin-binding proteins, resulting in inhibition of cell wall synthesis and subsequent cell death. The proposed dose of ceftolozane/tazobactam for the intended cUTI and cIAI indications is 1.5 g every 8 hours administered as an IV infusion over 60 minutes.
The primary data supporting the safety and efficacy of ceftolozane/tazobactam in both the cUTI and cIAI indications were derived from 2 large, identical, multicenter, randomized, double-blind, active-controlled Phase 3 studies per indication. A total of 2076 subjects were randomized in the Phase 3 studies and 2047 received study drug. Nine Phase 1 studies of ceftolozane alone or ceftolozane/tazobactam evaluated a total of 305 subjects and included pharmacokinetic (PK) studies in healthy adults and adults with renal impairment, a drug-drug interaction (DDI) study, and a thorough QT (TQT) study. Additionally, two blinded, randomized, controlled Phase 2 studies of ceftolozane alone or ceftolozane/tazobactam were also completed in subjects with cUTI or cIAI.
BIOPHARMACEUTICS SUMMARY
There are no biopharmaceutics review issues for the NDA. The drug product is formulated as a powder for reconstitution using water, which is then diluted in an IV infusion bag. Since the drug product is an IV formulation, no bioavailability, bioequivalence, or in vitro dissolution studies were performed as part of the clinical development program. Formulation changes were noted during development; however, the proposed commercial formulation is the same formulation used during the pivotal Phase 3 studies. An overview of the formulations used during clinical trials and the proposed commercial formulations is illustrated below.
Reference ID: 3528629


---------------------------------------------------------------------------------------------------------This is a representation of an electronic record that was signedelectronically and this page is the manifestation of the electronicsignature.---------------------------------------------------------------------------------------------------------/s/----------------------------------------------------
MINERVA HUGHES06/20/2014
RICHARD T LOSTRITTO06/20/2014
Reference ID: 3528629
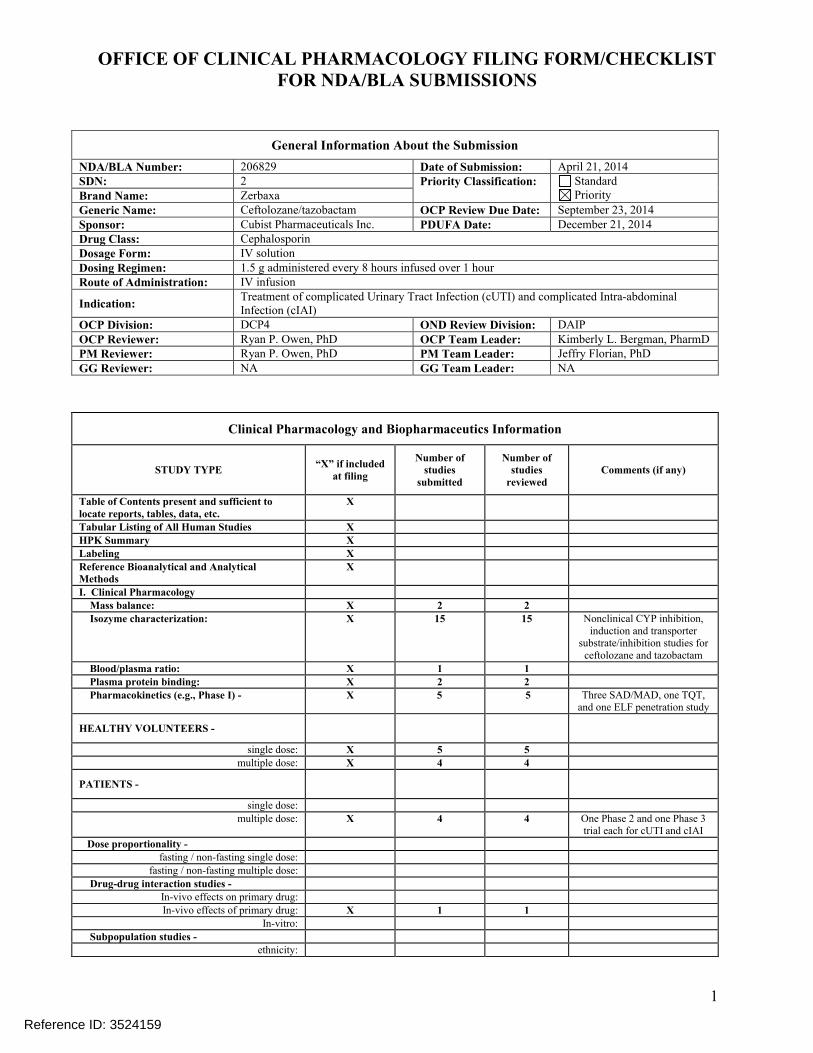
OFFICE OF CLINICAL PHARMACOLOGY FILING FORM/CHECKLISTFOR NDA/BLA SUBMISSIONS
1
General Information About the Submission
NDA/BLA Number: 206829 Date of Submission: April 21, 2014SDN: 2 Priority Classification: Standard
PriorityBrand Name: ZerbaxaGeneric Name: Ceftolozane/tazobactam OCP Review Due Date: September 23, 2014Sponsor: Cubist Pharmaceuticals Inc. PDUFA Date: December 21, 2014Drug Class: CephalosporinDosage Form: IV solutionDosing Regimen: 1.5 g administered every 8 hours infused over 1 hourRoute of Administration: IV infusion
Indication:Treatment of complicated Urinary Tract Infection (cUTI) and complicated Intra-abdominal Infection (cIAI)
OCP Division: DCP4 OND Review Division: DAIPOCP Reviewer: Ryan P. Owen, PhD OCP Team Leader: Kimberly L. Bergman, PharmDPM Reviewer: Ryan P. Owen, PhD PM Team Leader: Jeffry Florian, PhDGG Reviewer: NA GG Team Leader: NA
Clinical Pharmacology and Biopharmaceutics Information
STUDY TYPE“X” if included
at filing
Number of studies
submitted
Number of studies
reviewedComments (if any)
Table of Contents present and sufficient to locate reports, tables, data, etc.
X
Tabular Listing of All Human Studies X HPK Summary X Labeling X Reference Bioanalytical and Analytical Methods
X
I. Clinical Pharmacology Mass balance: X 2 2 Isozyme characterization: X 15 15 Nonclinical CYP inhibition,
induction and transporter substrate/inhibition studies for
ceftolozane and tazobactam
Blood/plasma ratio: X 1 1 Plasma protein binding: X 2 2 Pharmacokinetics (e.g., Phase I) - X 5 5 Three SAD/MAD, one TQT,
and one ELF penetration study
HEALTHY VOLUNTEERS -
single dose: X 5 5multiple dose: X 4 4
PATIENTS -
single dose:multiple dose: X 4 4 One Phase 2 and one Phase 3
trial each for cUTI and cIAI
Dose proportionality - fasting / non-fasting single dose:
fasting / non-fasting multiple dose:
Drug-drug interaction studies - In-vivo effects on primary drug:In-vivo effects of primary drug: X 1 1
In-vitro:
Subpopulation studies - ethnicity:
Reference ID: 3524159
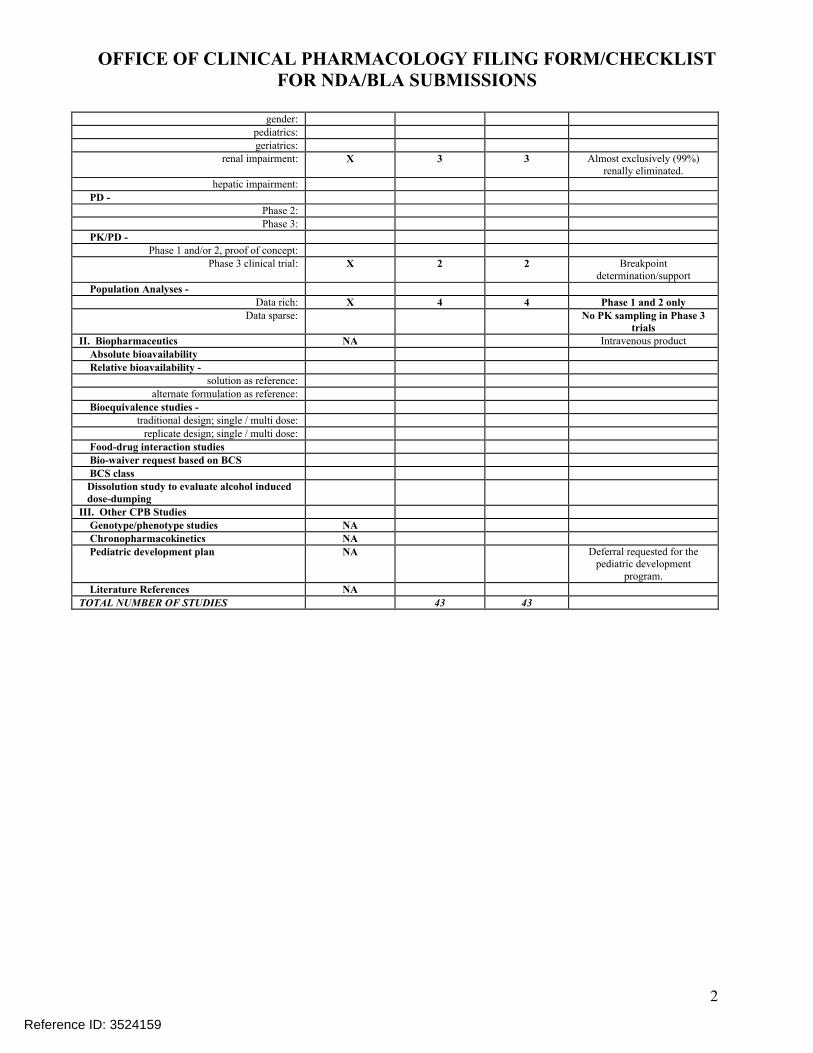
OFFICE OF CLINICAL PHARMACOLOGY FILING FORM/CHECKLISTFOR NDA/BLA SUBMISSIONS
2
gender:pediatrics:geriatrics:
renal impairment: X 3 3 Almost exclusively (99%) renally eliminated.
hepatic impairment:
PD - Phase 2:Phase 3:
PK/PD - Phase 1 and/or 2, proof of concept:
Phase 3 clinical trial: X 2 2 Breakpoint determination/support
Population Analyses -Data rich: X 4 4 Phase 1 and 2 only
Data sparse: No PK sampling in Phase 3 trials
II. Biopharmaceutics NA Intravenous product
Absolute bioavailability Relative bioavailability -
solution as reference:alternate formulation as reference:
Bioequivalence studies - traditional design; single / multi dose:
replicate design; single / multi dose:
Food-drug interaction studies Bio-waiver request based on BCS BCS class Dissolution study to evaluate alcohol induced dose-dumpingIII. Other CPB Studies Genotype/phenotype studies NA Chronopharmacokinetics NA Pediatric development plan NA Deferral requested for the
pediatric development program.
Literature References NA
TOTAL NUMBER OF STUDIES 43 43
Reference ID: 3524159

OFFICE OF CLINICAL PHARMACOLOGY FILING FORM/CHECKLISTFOR NDA/BLA SUBMISSIONS
3
Criteria for Refusal to File (RTF)(This OCP checklist applies to NDA, BLA submissions and their supplements.)
No Content Parameter Yes No N/A Comment
1 Did the applicant submit bioequivalence data comparing to-be-marketed product(s) and those used in the pivotal clinical trials?
X To-be-marketed product was used in the Phase 3 studies.
2 Did the applicant provide metabolism and drug-drug interaction information? (Note: RTF only if there is complete lack of information)
X
3 Did the applicant submit pharmacokinetic studies to characterize the drug product, or submit a waiver request?
X Several PK studies included.
4 Did the applicant submit comparative bioavailability data between proposed drug product and reference product for a 505(b)(2) application?
X Only considered a 505(b)(2) due to referencing the nonclinical program for tazobactam.
5 Did the applicant submit data to allow the evaluation of the validity of the analytical assay for the moieties of interest?
X
6 Did the applicant submit study reports/rationale to support dose/dosing interval and dose adjustment?
X Dose adjustment recommended for moderate and severe renal impairment.
7 Does the submission contain PK and PD analysis datasets and PK and PD parameter datasets for each primary study that supports items 1 to 6 above (in .xpt format if data are submitted electronically)?
X
8 Did the applicant submit the module 2 summaries (e.g. summary-clin-pharm, summary-biopharm, pharmkin-written-summary)?
X
9 Is the clinical pharmacology and biopharmaceutics section of the submission legible, organized, indexed and paginated in a manner to allow substantive review to begin?If provided as an electronic submission, is the electronic submission searchable, does it have appropriate hyperlinks and do the hyperlinks work leading to appropriate sections, reports, and appendices?
X
Complete Application10 Did the applicant submit studies including study reports, analysis
datasets, source code, input files and key analysis output, or justification for not conducting studies, as agreed to at the pre-NDA or pre-BLA meeting? If the answer is ‘No’, has the sponsor submitted a justification that was previously agreed to before theNDA submission?
X
Criteria for Assessing Quality of an NDA (Preliminary Assessment of Quality)Data Yes No N/A1 Are the data sets, as requested during pre-submission discussions,
submitted in the appropriate format (e.g., CDISC)? X
Reference ID: 3524159

OFFICE OF CLINICAL PHARMACOLOGY FILING FORM/CHECKLISTFOR NDA/BLA SUBMISSIONS
4
2 If applicable, are the pharmacogenomic data sets submitted in the appropriate format?
X
Studies and Analyses1 Is the appropriate pharmacokinetic information submitted? X2 Has the applicant made an appropriate attempt to determine
reasonable dose individualization strategies for this product (i.e., appropriately designed and analyzed dose-ranging or pivotal studies)?
X
3 Are the appropriate exposure-response (for desired and undesired effects) analyses conducted and submitted as described in the Exposure-Response guidance?
X
4 Is there an adequate attempt by the applicant to use exposure-response relationships in order to assess the need for dose adjustments for intrinsic/extrinsic factors that might affect the pharmacokinetic or pharmacodynamics?
X
5 Are the pediatric exclusivity studies adequately designed to demonstrate effectiveness, if the drug is indeed effective?
X Request for deferral of pediatric studies.
6 Did the applicant submit all the pediatric exclusivity data, as described in the WR?
X Request for deferral of pediatric studies.
7 Is there adequate information on the pharmacokinetics and exposure-response in the clinical pharmacology section of the label?
X
General8 Are the clinical pharmacology and biopharmaceutics studies of
appropriate design and breadth of investigation to meet basic requirements for approvability of this product?
X
9 Was the translation (of study reports or other study information) from another language needed and provided in this submission?
X
IS THE CLINICAL PHARMACOLOGY SECTION OF THE APPLICATION FILEABLE?
Yes No
If the NDA/BLA is not fileable from the clinical pharmacology perspective, state the reasons and provide comments to be sent to the Applicant.
Please identify and list any potential review issues to be forwarded to the Applicant for the 74-day letter.No issues at this time.
Ryan Owen, PhD
Primary Reviewer Date
Kimberly Bergman, PharmD
Secondary Reviewer/Team Leader Date
Reference ID: 3524159

---------------------------------------------------------------------------------------------------------This is a representation of an electronic record that was signedelectronically and this page is the manifestation of the electronicsignature.---------------------------------------------------------------------------------------------------------/s/----------------------------------------------------
RYAN P OWEN06/13/2014
KIMBERLY L BERGMAN06/13/2014
Reference ID: 3524159


