30 th June 2016 1 20mph Research – Analysis of speed outcomes in 20mph limit areas using GPS data for 12 case study areas 2 nd March 2017 – RSGB Analysts Conference Jane Robinson and Richard Fernandes (Atkins) Atkins, AECOM, Professor Mike Maher
Transcript
30th June 2016 1
20mph Research – Analysis of speed outcomes in 20mph limit areas using GPS data for 12 case study areas
2nd March 2017 – RSGB Analysts Conference
Jane Robinson and Richard Fernandes (Atkins)
Atkins, AECOM, Professor Mike Maher
Structure of Presentation
• Study purpose and objectives, and overall methodology
• Existing evidence and wider trends in vehicle speeds
• Analysis of area-wide speed outcomes using GPS data
• Questions and discussion
2
Study purpose
• Atkins, Aecom and Professor Mike Maher were commissioned by
the DfT in 2014 to undertake research into 20mph signed only
speed limits.
• Purpose - To address an evidence gap regarding the effectiveness
of 20mph speed limit only schemes.
3
Study objectives
• To evaluate the effectiveness of 20mph speed limits, in a range of
settings.
• To examine drivers’ and residents’ perceptions of 20mph limits.
• To assess the relative costs/benefits to vulnerable groups e.g.
children, cyclists, the elderly.
• To evaluate the processes and factors which contribute to the level of
effectiveness of 20mph speed limit schemes.
Case studies
• 12 case study schemes; generally implemented 2012-2015
• 8 large residential area-wide schemes
• 2 small-scale schemes in self-contained residential areas
• 2 focused on city centre areas
4
5
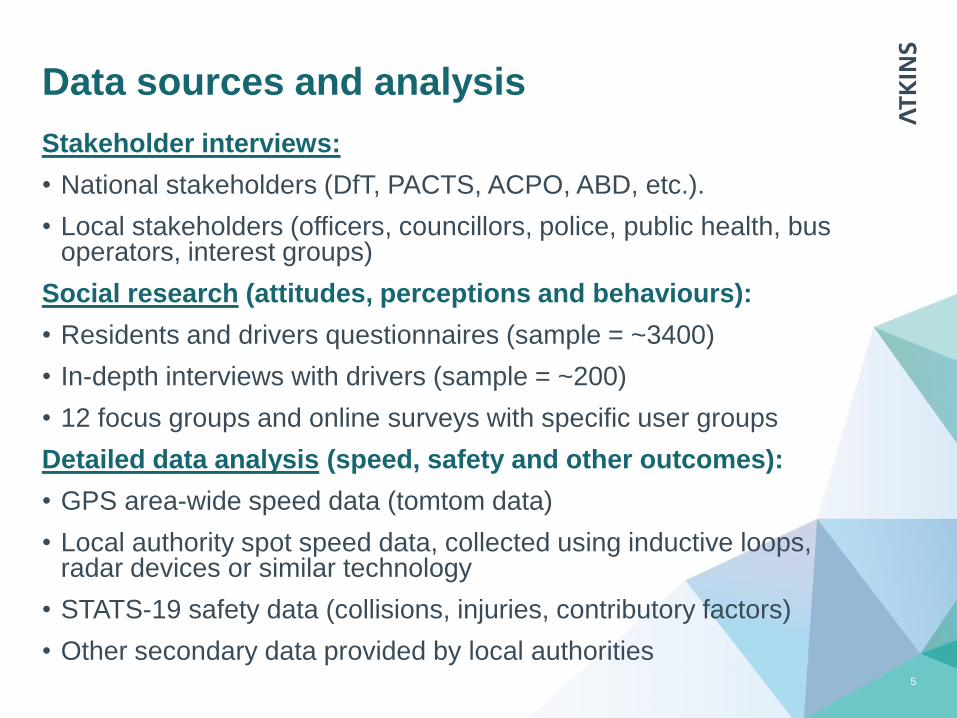
Data sources and analysis
Stakeholder interviews:
• National stakeholders (DfT, PACTS, ACPO, ABD, etc.).
• Local stakeholders (officers, councillors, police, public health, bus operators, interest groups)
Social research (attitudes, perceptions and behaviours):
• Residents and drivers questionnaires (sample = ~3400)
• In-depth interviews with drivers (sample = ~200)
• 12 focus groups and online surveys with specific user groups
Detailed data analysis (speed, safety and other outcomes):
• GPS area-wide speed data (tomtom data)
• Local authority spot speed data, collected using inductive loops, radar devices or similar technology
• STATS-19 safety data (collisions, injuries, contributory factors)
• Other secondary data provided by local authorities
6
Analysis of speed outcomes
30th June 2016
7
Small 20mph zones
• Two extensive studies undertaken by the Transport Research
Laboratory (e.g. Webster & Mackie, 1996; Webster and Layfield, 2003)
• 20mph zones can achieve substantial reductions in average speed, of
around 9-10 mph
• Small schemes (typically covering a few kms of road length), before
speed well above 20mph (typically around 25mph), implemented to
address location-specific safety issues
20mph limits
• Less evidence available (Portsmouth, Bristol, Edinburgh, national trial
programme of advisory 20mph speed limits across Scotland)
• 20mph limits deliver much smaller reductions in average speed, typically
around 1-2mph
• Large scale, lower before speeds (closer to 20mph)
Existing evidence on speed impacts
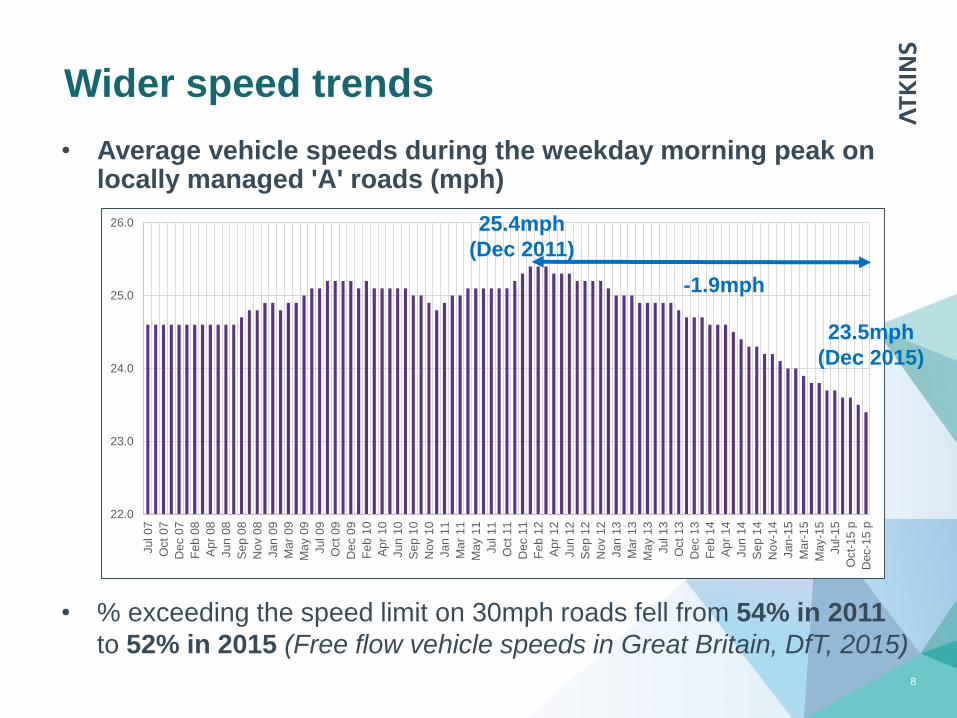
Wider speed trends
• Average vehicle speeds during the weekday morning peak on locally managed 'A' roads (mph)
8
22.0
23.0
24.0
25.0
26.0
Jul 07
Oct
07
De
c 0
7
Fe
b 0
8
Ap
r 08
Jun
08
Se
p 0
8
No
v 0
8
Jan
09
Ma
r 0
9
Ma
y 0
9
Jul 09
Oct
09
De
c 0
9
Fe
b 1
0
Ap
r 10
Jun
10
Se
p 1
0
No
v 1
0
Jan
11
Ma
r 1
1
Ma
y 1
1
Jul 11
Oct
11
De
c 1
1
Fe
b 1
2
Ap
r 12
Jun
12
Se
p 1
2
No
v 1
2
Jan
13
Ma
r 1
3
Ma
y 1
3
Jul 13
Oct
13
De
c 1
3
Fe
b 1
4
Ap
r 14
Jun
14
Se
p 1
4
Nov-1
4
Jan
-15
Ma
r-1
5
Ma
y-1
5
Jul-
15
Oct-
15
p
Dec-1
5 p
• % exceeding the speed limit on 30mph roads fell from 54% in 2011
to 52% in 2015 (Free flow vehicle speeds in Great Britain, DfT, 2015)
25.4mph
(Dec 2011)
23.5mph
(Dec 2015)
-1.9mph
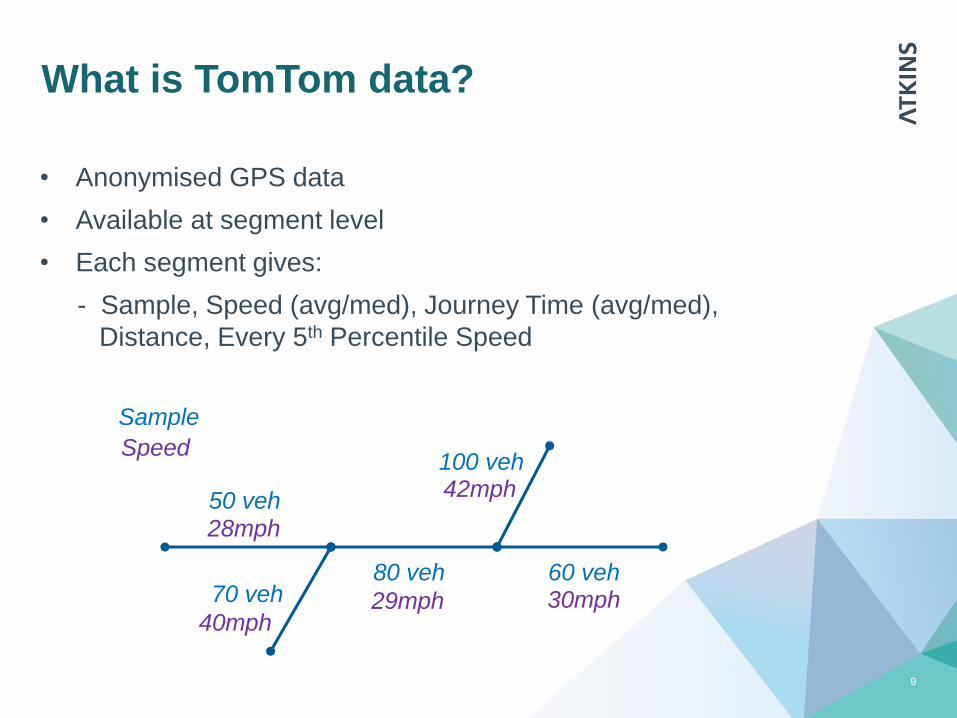
What is TomTom data?
• Anonymised GPS data
• Available at segment level
• Each segment gives:
- Sample, Speed (avg/med), Journey Time (avg/med),
Distance, Every 5th Percentile Speed
9
Sample
50 veh
80 veh70 veh
60 veh
100 vehSpeed
28mph
29mph40mph
30mph
42mph
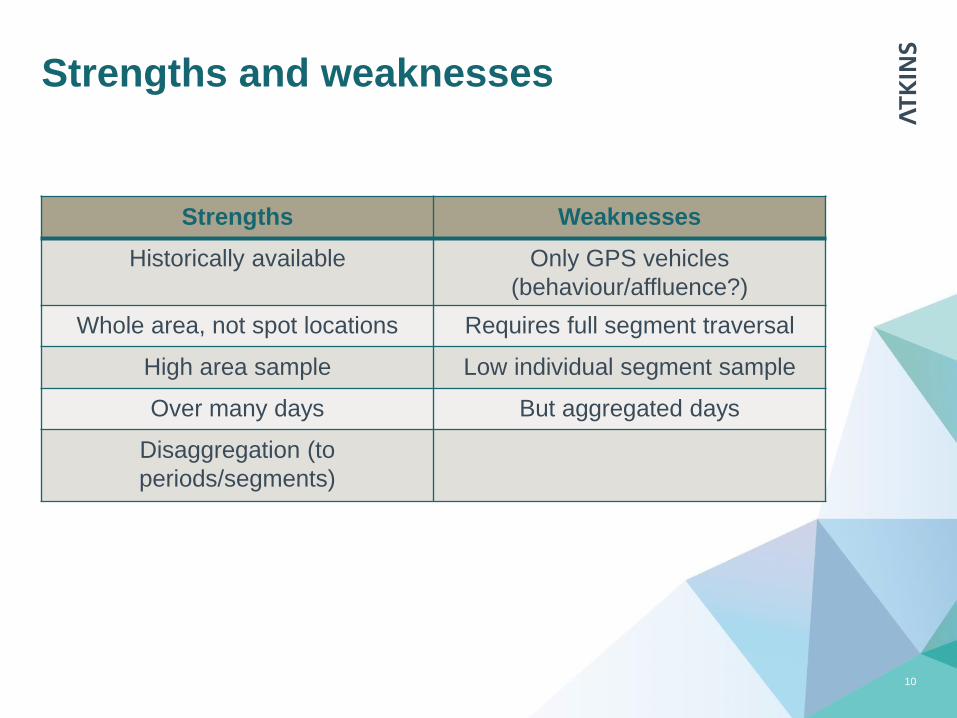
Strengths and weaknesses
Strengths Weaknesses
Historically available Only GPS vehicles
(behaviour/affluence?)
Whole area, not spot locations Requires full segment traversal
High area sample Low individual segment sample
Over many days But aggregated days
Disaggregation (to
periods/segments)
10
Methodological challenges
• What is the average speed in an area?
(issues of aggregation, samples, distance)
• What is the right metric for measuring change in
speed?
(issues of slow moving vehicles)
11
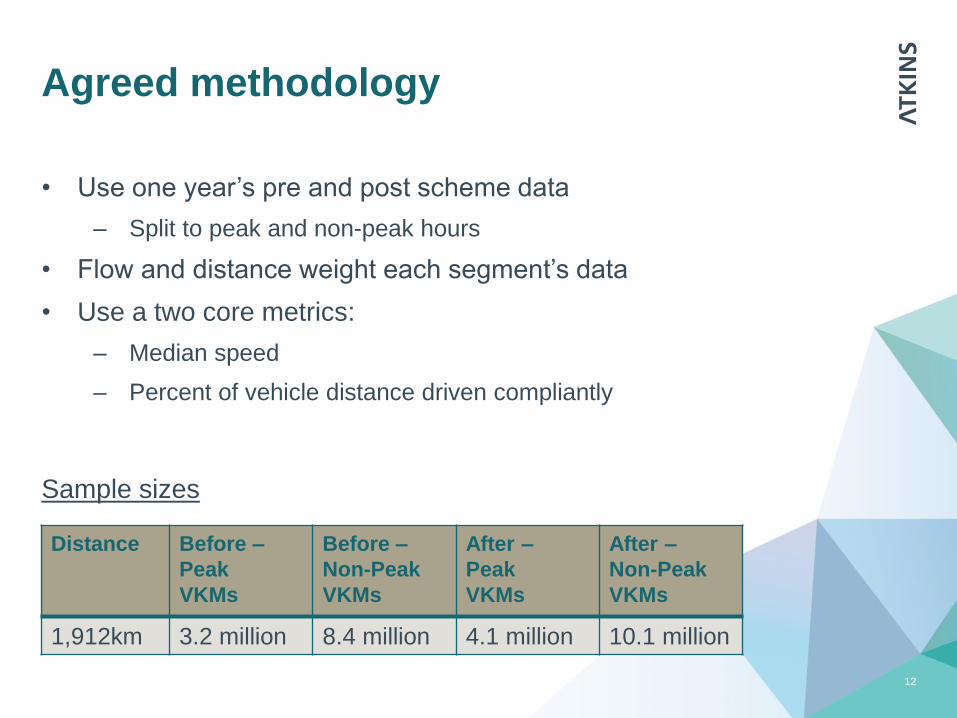
Agreed methodology
• Use one year’s pre and post scheme data
– Split to peak and non-peak hours
• Flow and distance weight each segment’s data
• Use a two core metrics:
– Median speed
– Percent of vehicle distance driven compliantly
12
Distance Before –
Peak
VKMs
Before –
Non-Peak
VKMs
After –
Peak
VKMs
After –
Non-Peak
VKMs
1,912km 3.2 million 8.4 million 4.1 million 10.1 million