2.1 Air Quality October 2017 9993 The Villages – Escondido Country Club Final EIR 2.1-1 CHAPTER 2 SIGNIFICANT ENVIRONMENTAL EFFECTS OF THE PROPOSED PROJECT This chapter of the Environmental Impact Report (EIR) provides discussion and analysis of the environmental impacts associated with The Villages – Escondido Country Club (Project) that were identified as significant environmental impacts. For each environmental topic, this EIR describes the existing conditions for that topic, details the existing regulatory setting for that topic, provides an analysis of the Project’s environmental impact, and makes a determination as to whether the impact is significant. For each environmental topic, the EIR also analyzes the Project’s cumulative impact, makes a determination of the significance of the Project’s impact prior to mitigation, proposes mitigation measures that will avoid or reduce the Project’s impact, and makes a final conclusion. The environmental issue areas addressed in Chapter 2 are as follows: 2.1 Air Quality 2.2 Biological Resources 2.3 Cultural Resources 2.4 Greenhouse Gas Emissions 2.5 Hazards and Hazardous Materials 2.6 Noise 2.7 Transportation and Traffic 2.1 Air Quality This section addresses the potential air quality impacts associated with implementation of the Project. The analysis is based on the review of existing resources, technical data, and applicable laws, regulations, and guidelines, as well as the Air Quality Analysis Technical Report prepared by Dudek, included as Appendix 2.1-1 to this EIR. 2.1.1 Existing Conditions The Project site is located in the northwest portion of the City of Escondido (City), along both sides of West Country Club Lane west of Nutmeg Street. The Project site itself currently has an address of 1800 West Country Club Lane and consists of approximately 109 acres. Figures 1-8 and 1-9, Regional Map and Vicinity Map, show the Project location within the County of San Diego (County) and the City. The Project is located in the northwest part of Escondido. Regionally, the City is situated in northern San Diego County, about 30 miles north of downtown San Diego via Interstate 15 (I-15). The Project is approximately 0.5 miles to the west of I-15, and about 2 miles north of State Route 78. The City of San Marcos boundary is approximately 0.2 miles to the southwest.
Transcript
2.1 Air Quality
October 2017 9993
The Villages – Escondido Country Club Final EIR 2.1-1
CHAPTER 2 SIGNIFICANT ENVIRONMENTAL EFFECTS OF THE
PROPOSED PROJECT
This chapter of the Environmental Impact Report (EIR) provides discussion and analysis of the
environmental impacts associated with The Villages – Escondido Country Club (Project) that were
identified as significant environmental impacts. For each environmental topic, this EIR describes
the existing conditions for that topic, details the existing regulatory setting for that topic, provides
an analysis of the Project’s environmental impact, and makes a determination as to whether the
impact is significant. For each environmental topic, the EIR also analyzes the Project’s cumulative
impact, makes a determination of the significance of the Project’s impact prior to mitigation,
proposes mitigation measures that will avoid or reduce the Project’s impact, and makes a final
conclusion. The environmental issue areas addressed in Chapter 2 are as follows:
2.1 Air Quality
2.2 Biological Resources
2.3 Cultural Resources
2.4 Greenhouse Gas Emissions
2.5 Hazards and Hazardous Materials
2.6 Noise
2.7 Transportation and Traffic
2.1 Air Quality
This section addresses the potential air quality impacts associated with implementation of the
Project. The analysis is based on the review of existing resources, technical data, and applicable
laws, regulations, and guidelines, as well as the Air Quality Analysis Technical Report prepared by
Dudek, included as Appendix 2.1-1 to this EIR.
2.1.1 Existing Conditions
The Project site is located in the northwest portion of the City of Escondido (City), along both sides
of West Country Club Lane west of Nutmeg Street. The Project site itself currently has an address of
1800 West Country Club Lane and consists of approximately 109 acres. Figures 1-8 and 1-9,
Regional Map and Vicinity Map, show the Project location within the County of San Diego (County)
and the City. The Project is located in the northwest part of Escondido. Regionally, the City is
situated in northern San Diego County, about 30 miles north of downtown San Diego via Interstate
15 (I-15). The Project is approximately 0.5 miles to the west of I-15, and about 2 miles north of State
Route 78. The City of San Marcos boundary is approximately 0.2 miles to the southwest.
2.1 Air Quality
October 2017 9993
The Villages – Escondido Country Club Final EIR 2.1-2
The Project is located within the San Diego Air Basin (SDAB) and is within the jurisdictional
boundaries of the San Diego Air Pollution Control District (SDAPCD). The SDAB and
SDAPCD are discussed further in Section 2.1.1.1, Environmental Setting (under “Ambient Air
Quality Monitoring Data”), and Section 2.1.1.2, Regulatory Setting, respectively.
2.1.1.1 Environmental Setting
Climate and Topography
The weather of the San Diego region, as in most of Southern California, is influenced by the
Pacific Ocean and its semi-permanent high-pressure systems that result in dry, warm summers
and mild, occasionally wet winters. The average temperature ranges (in degrees Fahrenheit (°F))
from the mid-40s to the mid-70s. Most of the region’s precipitation falls from November to
April, with infrequent (approximately 10%) precipitation during the summer. The average
seasonal precipitation along the coast is approximately 10 inches; the amount increases with
elevation as moist air is lifted over the mountains (WRCC 2016).
The topography in the San Diego region varies greatly, from beaches on the west to mountains
and desert on the east; along with local meteorology, the topography influences the dispersal and
movement of pollutants in the SDAB. The mountains to the east prohibit dispersal of pollutants
in that direction and help trap them in inversion layers.
The interaction of ocean, land, and the Pacific High Pressure Zone maintains clear skies for
much of the year and influences the direction of prevailing winds (westerly to northwesterly).
Local terrain is often the dominant factor inland, and winds in inland mountainous areas tend to
blow through the valleys during the day and down the hills and valleys at night.
Pollutants and Effects
Criteria Air Pollutants
Criteria air pollutants are defined as pollutants for which the federal and state governments have
established ambient air quality standards, or criteria, for outdoor concentrations to protect public
health. The federal and state standards have been set, with an adequate margin of safety, at levels
above which concentrations could be harmful to human health and welfare. These standards are
designed to protect the most sensitive persons from illness or discomfort. Pollutants of concern
centers, convalescent centers, and retirement homes. The closest off-site sensitive receptors to
the Project are residential land uses located adjacent to the Project site boundary.
Health Impacts of Toxic Air Contaminants
In addition to impacts from criteria pollutants, project impacts may include emissions of
pollutants identified by the state and federal government as TACs or HAPs. State law has
established the framework for California’s TAC identification and control project, which is
generally more stringent than the federal project, and is aimed at TACs that are a problem in
California. The state has formally identified more than 200 substances as TACs, including the
federal HAPs, and is adopting appropriate control measures for sources of these TACs.
The greatest potential for TAC emissions during construction would be diesel particulate
emissions from heavy equipment operations and heavy-duty trucks, and the associated health
impacts to sensitive receptors. The closest sensitive receptors would be the residents adjacent to
the golf course. Accordingly, a health risk assessment (HRA) was performed to evaluate the risk
to sensitive receptors from Project-generated TAC emissions. The following paragraphs describe
the findings of the HRA, and the detailed assessment is provided in Appendix 2.1-1.
Health effects from carcinogenic air toxics are usually described in terms of cancer risk. The
SDAPCD recommends an incremental cancer risk threshold of 10 in a million.5 “Incremental
cancer risk” is the likelihood that a person continuously exposed to concentrations of TACs
resulting from a project over a 70-year lifetime will contract cancer based on the use of standard
risk-assessment methodology. The cancer burden is determined for the population located within
5 The City does not specify HRA guidance or thresholds within its Environmental Quality Regulations (City of
Escondido, Section 33.47.1.33-924).
2.1 Air Quality
October 2017 9993
The Villages – Escondido Country Club Final EIR 2.1-29
the zone of impact, defined as the area within the one in one million cancer risk isopleth for a 70-
year exposure. The Hotspots Analysis and Reporting Program Version 2 (HARP2) was used to
generate an isopleth, which is a line of a constant value, showing the area exposed to a cancer risk
above one in one million. Cancer burden was conservatively estimated by using the distance of the
furthest receptor within the one in a million isopleth as the radius of a zone of impact.
Some TACs increase non-cancer health risk due to long-term (chronic) exposures. The Chronic
Hazard Index (HIC) is the sum of the individual substance chronic hazard indices for all TACs
affecting the same target organ system. The HIC estimates for all receptor types used EPA’s
“OEHHA Derived”6 calculation method, which uses high-end exposure parameters for the
inhalation and next top two exposure pathways and uses mean exposure parameters for the
remaining pathways for non-cancer risk estimates. The HIC is the sum of the individual substance
chronic hazard indices for all TACs affecting the same target organ system.7 A hazard index less
than one (1.0) means that adverse health effects are not expected. Within this analysis,
noncarcinogenic exposures of less than 1.0 are considered less than significant. The SDAPCD
recommends a HIC significance threshold of 1.0 (Project increment).
The air dispersion modeling methodology was based on generally accepted modeling practices of
SDAPCD (SDAPCD 2015b). Air dispersion modeling was performed using EPA’s AERMOD,
Version 16216r, modeling system (computer software) with the Lakes Environmental Software
implementation/user interface, AERMOD View, Version 9.3.0. The HRA followed the Office of
Environmental Health Hazard Assessment (OEHHA) 2015 guidelines (OEHHA 2015) and
SDAPCD Tier-1 techniques to calculate the health risk impacts at all receptors including the
nearby residential receptors, the nearest school, and off-site worker receptors, as further
discussed below. The dispersion modeling included the use of standard regulatory default
options. AERMOD parameters were selected consistent with the SDAPCD and EPA guidance
and identified as representative of the Project site and Project activities. Principal parameters of
this modeling are presented in Table 2.1-12.
This HRA evaluated impacts nesting a grid of receptors with initial rectangular 50-meter (165-
foot) spacing to focus on the nearby residences and occupational exposures. This receptor analysis
utilized 100-meter (330-foot), 250-meter (820-foot), and then 500-meter (1,650-foot) resolution
nested grids covering a total 5.95-kilometer by 3.60-kilometer (3.70-mile by 2.24-mile) rectangular
area. This nested grid network of receptors established an impact analysis area where locations of
maximum cancer risk and short- and long-term hazard indices would occur. This analysis also
6 “OEHHA” refers to EPA’s Office of Environmental Health Hazard Assessment. 7 The Chronic Hazard Index estimates for all receptor types used the OEHHA Derived calculation method
(OEHHA 2015).
2.1 Air Quality
October 2017 9993
The Villages – Escondido Country Club Final EIR 2.1-30
placed discretely located Cartesian receptors to evaluate the maximum exposure for schools.
Residences are located immediately adjacent to the construction Project site’s property boundaries.
Health risk calculations were performed using CARB’s HARP2 Air Dispersion Modeling and
Risk Tool (Version 17052). AERMOD was run with all construction area sources emitting 1 gram
per second for each individual source area meter to obtain necessary “unity concentration,” input
values for HARP2. These dispersion factor values that were determined for each source using
AERMOD were imported into HARP2, then multiplied by annual emissions to determine
ground-level concentrations for each pollutant. These ground-level concentrations were then
used to estimate the long-term cancer health risk to an individual, and the non-cancer chronic and
acute health indices.
Construction of Project components would require use of heavy-duty construction equipment,
which is subject to a CARB Airborne Toxics Control Measure for in-use diesel construction
equipment to reduce diesel particulate emissions, and would involve use of diesel trucks, which
are also subject to an Airborne Toxics Control Measure. Construction of Project components
would occur in four phases lasting a total of 5.5 years and would be periodic and short term
within each phase. Following completion of construction activities, Project-related TAC
emissions would cease. The results of the HRA for health risks incurred during construction are
provided in Table 2.1-13, Summary of Maximum Cancer and Chronic Health Risks .
As shown in Table 2.1-13, the health risks resulting from Project-generated TAC emissions would be
below the levels of significance for construction. The TAC emissions from construction would be
short term in nature and would cease after the construction period. As such, impacts from exposure
of sensitive receptors to Project-related TAC emissions would be less than significant.
No residual TAC emissions and corresponding cancer risk are anticipated after construction,
and no long-term sources of TAC emissions are anticipated during operation of the Project.
Thus, the Project would not result in a long-term (i.e., 9-year, 30-year, or 70-year) source of
TAC emissions. Therefore, impacts from long-term exposure of sensitive receptors to
Project-related TAC emissions during operation would be less than significant.
Health Impacts of Carbon Monoxide
As described previously, exposure to high concentrations CO can result in dizziness, fatigue,
chest pain, headaches, and impairment of central nervous system functions. Mobile-source
impacts, including those related to CO, occur essentially on two scales of motion. Regionally,
Project-related construction travel would add to regional trip generation and increase the vehicle
miles traveled (VMT) within the local airshed and the SDAB. Locally, construction traffic would
be added to the roadway system in the vicinity of the Project site. Although the SDAB is currently
2.1 Air Quality
October 2017 9993
The Villages – Escondido Country Club Final EIR 2.1-31
an attainment area for CO, there is a potential for the formation of microscale CO “hotspots” to
occur immediately around points of congested traffic. Hotspots can form if such traffic occurs
during periods of poor atmospheric ventilation, is composed of a large number of vehicles cold-
started and operating at pollution-inefficient speeds, and/or is operating on roadways already
crowded with non-Project traffic. Because of continued improvement in vehicular emissions at a
rate faster than the rate of vehicle growth and/or congestion, the potential for CO hotspots in the
SDAB is steadily decreasing.
CO transport is extremely limited and disperses rapidly with distance from the source. Under
certain extreme meteorological conditions, however, CO concentrations near a congested roadway
or intersection may reach unhealthy levels, affecting sensitive receptors such as residents, school
children, hospital patients, and the elderly. Typically, high CO concentrations are associated with
urban roadways or intersections operating at an unacceptable level of service (LOS). Projects
contributing to adverse traffic impacts may result in the formation of CO hotspots.
To verify that the Project would not cause or contribute to a violation of the CO standards, a
screening evaluation of the potential for CO hotspots was conducted. The California Department
of Transportation (Caltrans) and the University of California, Davis, Institute of Transportation
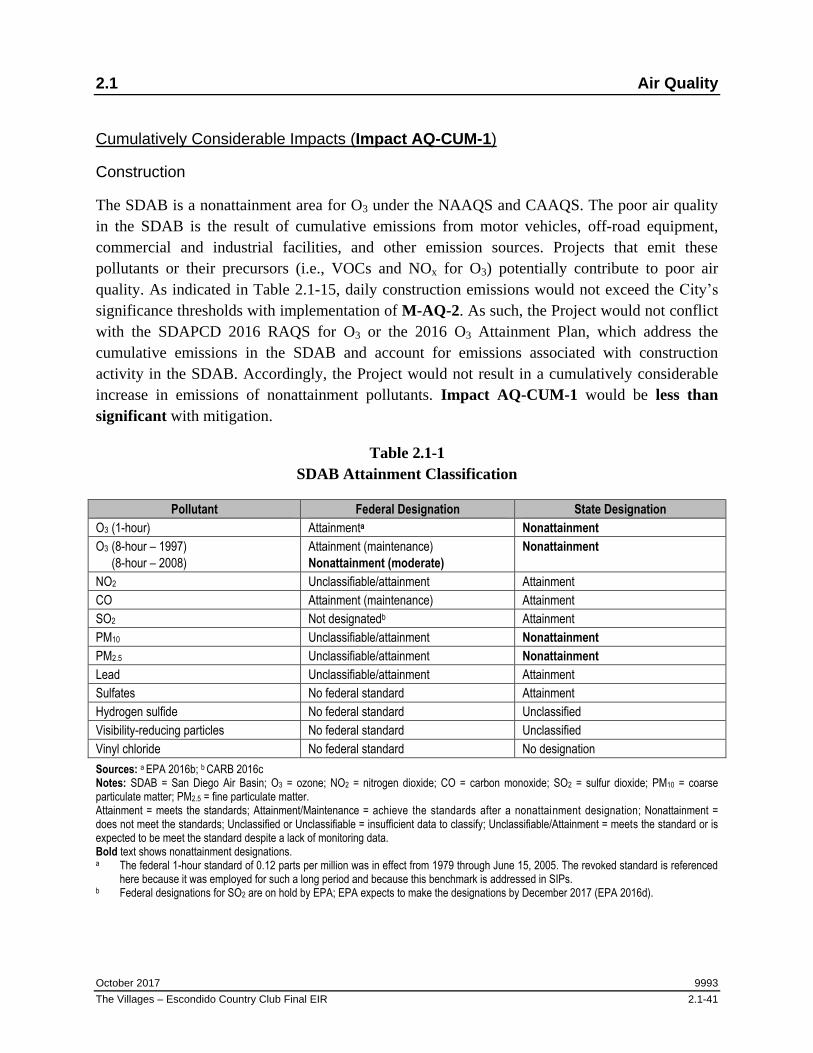
The SDAB is a nonattainment area for O3 under the NAAQS and CAAQS. The poor air quality
in the SDAB is the result of cumulative emissions from motor vehicles, off-road equipment,
commercial and industrial facilities, and other emission sources. Projects that emit these
pollutants or their precursors (i.e., VOCs and NOx for O3) potentially contribute to poor air
quality. As indicated in Table 2.1-15, daily construction emissions would not exceed the City’s
significance thresholds with implementation of M-AQ-2. As such, the Project would not conflict
with the SDAPCD 2016 RAQS for O3 or the 2016 O3 Attainment Plan, which address the
cumulative emissions in the SDAB and account for emissions associated with construction
activity in the SDAB. Accordingly, the Project would not result in a cumulatively considerable
increase in emissions of nonattainment pollutants. Impact AQ-CUM-1 would be less than
significant with mitigation.
Table 2.1-1
SDAB Attainment Classification
Pollutant Federal Designation State Designation O3 (1-hour) Attainmenta Nonattainment O3 (8-hour – 1997)
(8-hour – 2008)
Attainment (maintenance)
Nonattainment (moderate) Nonattainment
NO2 Unclassifiable/attainment Attainment
CO Attainment (maintenance) Attainment
SO2 Not designatedb Attainment
PM10 Unclassifiable/attainment Nonattainment PM2.5 Unclassifiable/attainment Nonattainment Lead Unclassifiable/attainment Attainment
Sulfates No federal standard Attainment
Hydrogen sulfide No federal standard Unclassified
Visibility-reducing particles No federal standard Unclassified
Vinyl chloride No federal standard No designation
Sources: a EPA 2016b; b CARB 2016c Notes: SDAB = San Diego Air Basin; O3 = ozone; NO2 = nitrogen dioxide; CO = carbon monoxide; SO2 = sulfur dioxide; PM10 = coarse particulate matter; PM2.5 = fine particulate matter. Attainment = meets the standards; Attainment/Maintenance = achieve the standards after a nonattainment designation; Nonattainment = does not meet the standards; Unclassified or Unclassifiable = insufficient data to classify; Unclassifiable/Attainment = meets the standard or is expected to be meet the standard despite a lack of monitoring data. Bold text shows nonattainment designations. a The federal 1-hour standard of 0.12 parts per million was in effect from 1979 through June 15, 2005. The revoked standard is referenced
here because it was employed for such a long period and because this benchmark is addressed in SIPs. b Federal designations for SO2 are on hold by EPA; EPA expects to make the designations by December 2017 (EPA 2016d).
2.1 Air Quality
October 2017 9993
The Villages – Escondido Country Club Final EIR 2.1-42
Table 2.1-2
Local Ambient Air Quality Data
Averaging Time Unit Agency/ Method
Ambient Air Quality
Standard
Measured Concentration by Year Exceedances by Year
Notes: ppm = parts per million by volume; ND = insufficient data available to determine the value; — = not available; g/m3 = micrograms per cubic meter. Data taken from CARB iADAM (http://www.CARB.ca.gov/adam) and EPA AirData (http://www.epa.gov/airdata/) represent the highest concentrations experienced over a given year. Daily exceedances for particulate matter are estimated days because PM10 and PM2.5 are not monitored daily. All other criteria pollutants did not exceed federal or state standards during the years shown. There is no federal standard for 1-hour ozone, annual PM10, or 24-hour SO2, nor is there a state 24-hour standard for PM2.5. The Escondido monitoring station is located at 600 East Valley Parkway, Escondido, California. The El Cajon monitoring station is located at 10537 Floyd Smith Drive, El Cajon, California. a Measurements of PM10 and PM2.5 are usually collected every 6 days and every 1 to 3 days, respectively. Number of days exceeding the
standards is a mathematical estimate of the number of days concentrations would have been greater than the level of the standard had each day been monitored. The numbers in parentheses are the measured number of samples that exceeded the standard.
2.1 Air Quality
October 2017 9993
The Villages – Escondido Country Club Final EIR 2.1-43
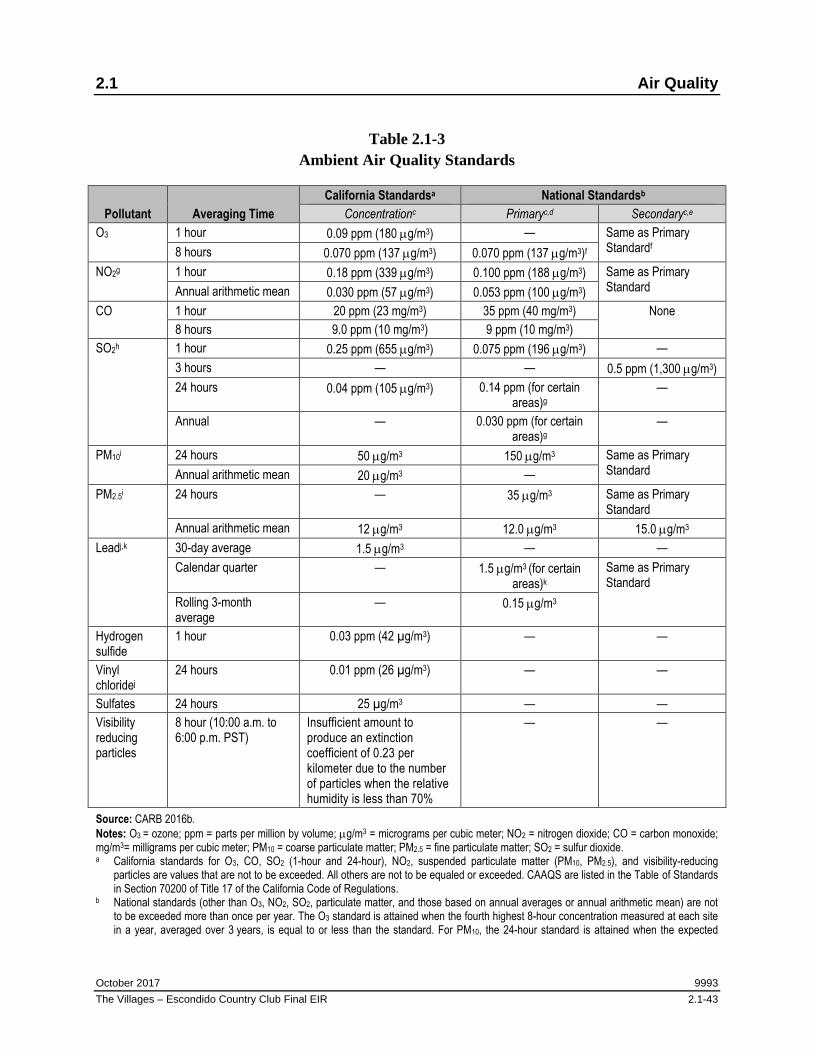
Table 2.1-3
Ambient Air Quality Standards
Pollutant Averaging Time California Standardsa National Standardsb
PM10i 24 hours 50 g/m3 150 g/m3 Same as Primary Standard Annual arithmetic mean 20 g/m3 —
PM2.5i 24 hours — 35 g/m3 Same as Primary Standard
Annual arithmetic mean 12 g/m3 12.0 g/m3 15.0 g/m3
Leadj,k 30-day average 1.5 g/m3 — —
Calendar quarter — 1.5 g/m3 (for certain areas)k
Same as Primary Standard
Rolling 3-month average
— 0.15 g/m3
Hydrogen sulfide
1 hour 0.03 ppm (42 µg/m3) — —
Vinyl chloridej
24 hours 0.01 ppm (26 µg/m3) — —
Sulfates 24 hours 25 µg/m3 — —
Visibility reducing particles
8 hour (10:00 a.m. to 6:00 p.m. PST)
Insufficient amount to produce an extinction coefficient of 0.23 per kilometer due to the number of particles when the relative humidity is less than 70%
— —
Source: CARB 2016b.
Notes: O3 = ozone; ppm = parts per million by volume; g/m3 = micrograms per cubic meter; NO2 = nitrogen dioxide; CO = carbon monoxide; mg/m3= milligrams per cubic meter; PM10 = coarse particulate matter; PM2.5 = fine particulate matter; SO2 = sulfur dioxide. a California standards for O3, CO, SO2 (1-hour and 24-hour), NO2, suspended particulate matter (PM10, PM2.5), and visibility-reducing
particles are values that are not to be exceeded. All others are not to be equaled or exceeded. CAAQS are listed in the Table of Standards in Section 70200 of Title 17 of the California Code of Regulations.
b National standards (other than O3, NO2, SO2, particulate matter, and those based on annual averages or annual arithmetic mean) are not to be exceeded more than once per year. The O3 standard is attained when the fourth highest 8-hour concentration measured at each site in a year, averaged over 3 years, is equal to or less than the standard. For PM10, the 24-hour standard is attained when the expected
2.1 Air Quality
October 2017 9993
The Villages – Escondido Country Club Final EIR 2.1-44
number of days per calendar year with a 24-hour average concentration above 150 µg/m3 is equal to or less than 1. For PM2.5, the 24-hour standard is attained when 98% of the daily concentrations, averaged over 3 years, are equal to or less than the standard.
c Concentration expressed first in units in which it was promulgated. Equivalent units given in parentheses are based on a reference temperature of 25°C and a reference pressure of 760 torr. Most measurements of air quality are to be corrected to a reference temperature of 25°C and a reference pressure of 760 torr; ppm in this table refers to ppm by volume, or micromoles of pollutant per mole of gas.
d National Primary Standards: The levels of air quality necessary, with an adequate margin of safety, to protect the public health. e National Secondary Standards: The levels of air quality necessary to protect the public welfare from any known or anticipated adverse
effects of a pollutant. f On October 1, 2015, the EPA Administrator signed the notice for the final rule to revise the primary and secondary NAAQS for O3. The EPA
is revising the levels of both standards from 0.075 ppm to 0.070 ppm and retaining their indicators (O3), forms (fourth-highest daily maximum, averaged across 3 consecutive years) and averaging times (8 hours). The EPA is in the process of submitting the rule for publication in the Federal Register. The final rule will be effective 60 days after the date of publication in the Federal Register. The lowered national 8-hour standards are reflected in the table.
g To attain the national 1-hour standard, the 3-year average of the annual 98th percentile of the 1-hour daily maximum concentrations at each site must not exceed 100 parts per billion (ppb). Note that the national 1-hour standard is in units of ppb. California standards are in units of ppm. To directly compare the national 1-hour standard to the California standards, the units can be converted from ppb to ppm. In this case, the national standard of 100 ppb is identical to 0.100 ppm.
h On June 2, 2010, a new 1-hour SO2 standard was established, and the existing 24-hour and annual primary standards were revoked. To attain the national 1-hour standard, the 3-year average of the annual 99th percentile of the 1-hour daily maximum concentrations at each site must not exceed 75 ppb. The 1971 SO2 national standards (24-hour and annual) remain in effect until 1 year after an area is designated for the 2010 standard, except that in areas designated nonattainment of the 1971 standards, the 1971 standards remain in effect until implementation plans to attain or maintain the 2010 standards are approved.
i On December 14, 2012, the national annual PM2.5 primary standard was lowered from 15 g/m3 to 12.0 g/m3. The existing national 24-hour
PM2.5 standards (primary and secondary) were retained at 35 g/m3, as was the annual secondary standard of 15 μg/m3. The existing 24-hour
PM10 standards (primary and secondary) of 150 g/m3 were also retained. The form of the annual primary and secondary standards is the annual mean averaged over 3 years.
j CARB has identified lead and vinyl chloride as TACs with no threshold level of exposure for adverse health effects determined. These actions allow for the implementation of control measures at levels below the ambient concentrations specified for these pollutants.
k The national standard for lead was revised on October 15, 2008, to a rolling 3-month average. The 1978 lead standard (1.5 μg/m3 as a quarterly average) remains in effect until 1 year after an area is designated for the 2008 standard, except that in areas designated nonattainment for the 1978 standard, the 1978 standard remains in effect until implementation plans to attain or maintain the 2008 standard are approved.
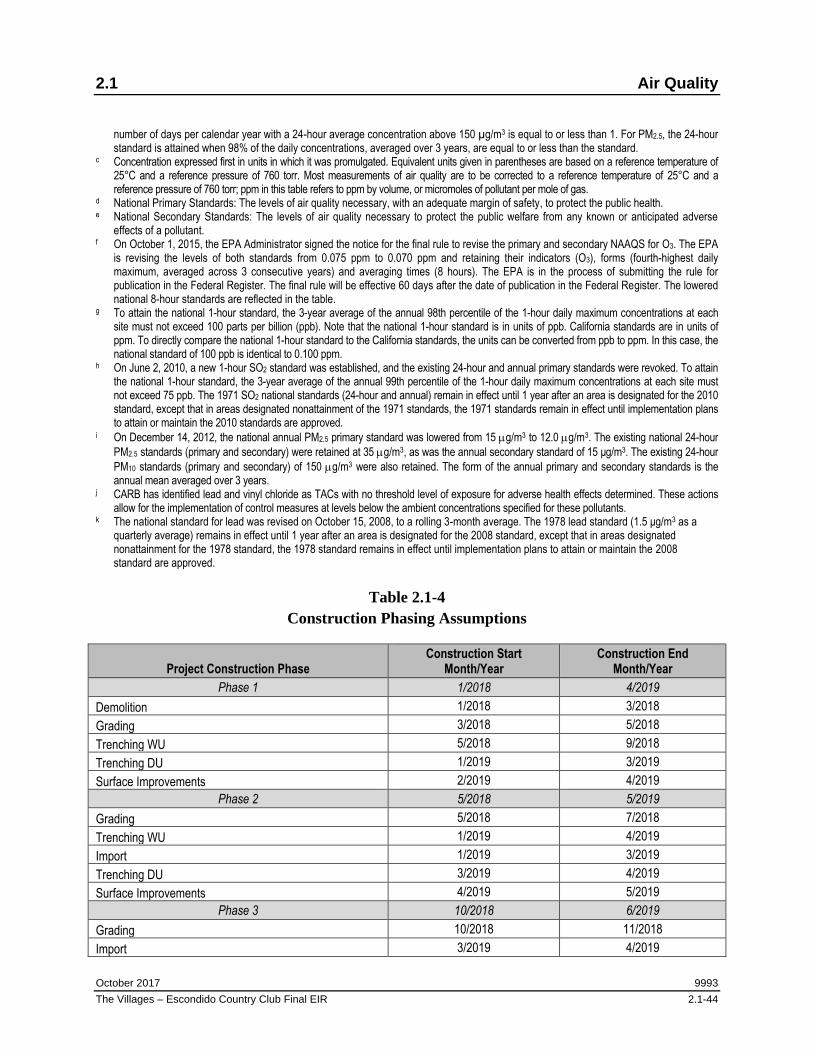
Table 2.1-4
Construction Phasing Assumptions
Project Construction Phase Construction Start
Month/Year Construction End
Month/Year Phase 1 1/2018 4/2019
Demolition 1/2018 3/2018
Grading 3/2018 5/2018
Trenching WU 5/2018 9/2018
Trenching DU 1/2019 3/2019
Surface Improvements 2/2019 4/2019
Phase 2 5/2018 5/2019
Grading 5/2018 7/2018
Trenching WU 1/2019 4/2019
Import 1/2019 3/2019
Trenching DU 3/2019 4/2019
Surface Improvements 4/2019 5/2019
Phase 3 10/2018 6/2019
Grading 10/2018 11/2018
Import 3/2019 4/2019
2.1 Air Quality
October 2017 9993
The Villages – Escondido Country Club Final EIR 2.1-45
Table 2.1-4
Construction Phasing Assumptions
Project Construction Phase Construction Start
Month/Year Construction End
Month/Year Trenching WU 4/2019 5/2019
Trenching DU 5/2019 6/2019
Surface Improvements 5/2019 6/2019
Phase 4 11/2018 7/2019
Grading 11/2018 12/2018
Import 4/2019 6/2019
Trenching WU 5/2019 7/2019
Trenching DU 6/2019 7/2019
Surface Improvements 7/2019 7/2019
Other Project Construction Phases
Paving – Country Club & El Norte 5/2018 7/2018
Paving – Country Club & Nutmeg 2/2019 4/2019
Building Construction 3/2019 6/2023
Paving – El Norte & Nutmeg 4/2019 6/2019
Architectural Coating 1/2023 6/2023
Notes: DU = dry utilities; WU = wet utilities.
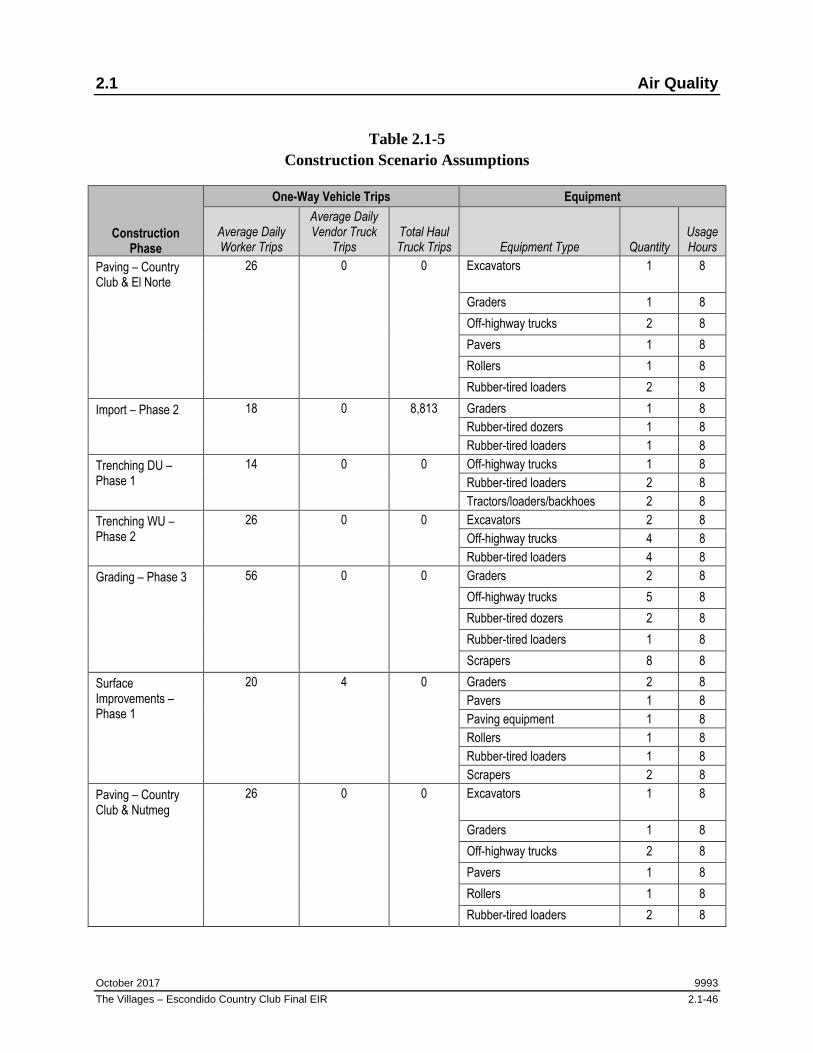
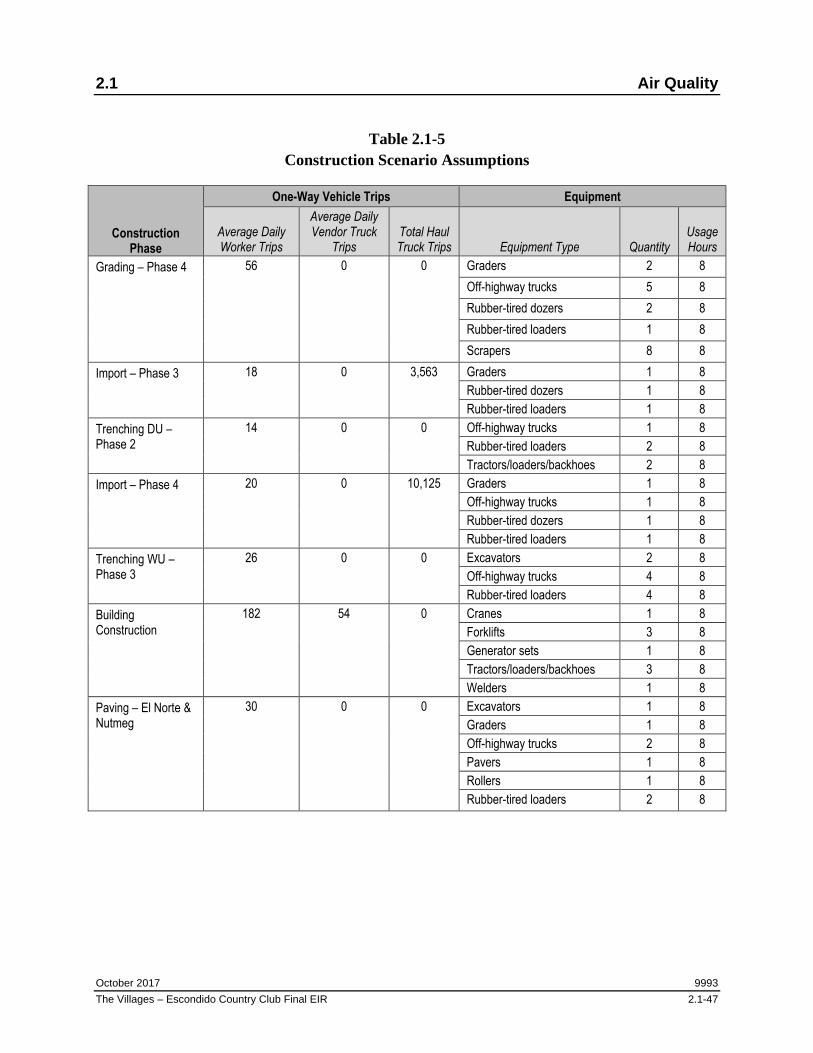
Table 2.1-5
Construction Scenario Assumptions
Construction Phase
One-Way Vehicle Trips Equipment
Average Daily Worker Trips
Average Daily Vendor Truck
Trips Total Haul Truck Trips Equipment Type Quantity
Usage Hours
Demolition – Phase 1
34 0 252 Crawler tractors 1 8 Off-highway trucks 1 8 Other construction equipment 5 8
Blasted rock (cubic yards/day) 1,287 5,627 11 1,286
Explosive used (tons/day) 0.6 2.5 0.01 0.6
Area blasted (square feet) 31,908 129,393 1,322 65,132
Area blasted (square feet/day) 10,636 16,174 441 10,855
Source: Kruer, pers. comm. 2017. Notes: Phase 1 would include Village 1 and the Village Center. Phase 2 would include Village 2. Phase 3 would include the northeast parcel of Village 3, bordered by Country Club Lane, La Brea Street, La Mirada Avenue, and Nutmeg Lane. Phase 4 would include the southwest portion of Village 3, bordered by La Brea Street, Country Club Lane, and Firestone Drive.
Table 2.1-7
Construction Emission Reduction Strategies
Regulatory Compliance Measures SDAPCD Rule 55: Fugitive Dust – The applicant would perform dust suppression during the grading and surface improvement phases using application of water three times per day.a
SDAPCD Rule 67.0.1: Architectural Coatings – The applicant would use architectural coatings in accordance with this rule during construction, assumed to be 100 g/L for exterior applications and 50 g/L for interior applications.b
Project Design Feature PDF-AQ-1: The Project would include an on-site speed limit of 15 miles per hour to reduce fugitive dust emissions.
Sources: a SDAPCD 2009b. b SDAPCD 2015a.
Table 2.1-8
Operational Emission Reduction Strategies
Regulatory Compliance Measure SDAPCD Rule 67.0.1: Architectural Coatings – The applicant would use architectural coatings in accordance with this rule during construction, assumed to be 100 g/L for exterior applications and 50 g/L for interior applications.a
Project Design Features PDF-AQ-2: Exceed 2016 Title 24 building energy efficiency standards by 15%. Additionally, the Project will include electricity-saving features, such as an increase in energy efficiency above the 2016 Title 24 standards and solar photovoltaic systems that satisfy 70% of the electricity demand for residential buildings and 50% of the electricity demand for the Village Center.
PDF-AQ-3: Traffic-calming measures for all new streets and existing affected streets and intersections.b
PDF-AQ-4: Improve the pedestrian network of the community by constructing an integrated walking and bicycling trail that would connect the villages with the Village Center and adjacent community.c
Sources: a SDAPCD 2015a. b New Urban West Inc. 2017, p. 4. c New Urban West Inc. 2017, p. 1.
2.1 Air Quality
October 2017 9993
The Villages – Escondido Country Club Final EIR 2.1-50
Table 2.1-9
City of Escondido Daily Emission Screening Level Criteria
Construction Emissions Pollutant Total Emissions (Pounds per Day)
Volatile organic compounds (VOCs) 75
Oxides of nitrogen (NOx) 250
Carbon monoxide (CO) 550
Oxides of sulfur (SOx) 250
Coarse particulate matter (PM10) 100
Fine particulate matter (PM2.5) 55
Operational Emissions Pollutant Total Emissions (Pounds per Day)
Volatile organic compounds (VOCs) 55
Oxides of nitrogen (NOx) 250
Carbon monoxide (CO) 550
Oxides of sulfur (SOx) 250
Coarse particulate matter (PM10) 100
Fine particulate matter (PM2.5) 55
Source: City of Escondido 2015.
Table 2.1-10
Estimated Maximum Daily Unmitigated Construction Criteria Air Pollutant Emissions
Year VOCs NOx CO SOx PM10 PM2.5
Pounds per Day
2018 35.00 430.16 354.41 5.39 51.82 21.85
2019 36.60 354.22 190.31 0.62 34.24 19.79
2020 3.22 27.24 24.55 0.06 3.10 1.66
2021 2.91 24.69 23.77 0.06 2.91 1.49
2022 2.65 22.36 23.13 0.06 2.75 1.33
2023 67.70 21.71 25.73 0.06 3.02 1.39
Maximum Daily Emissions 67.70 430.16 354.41 5.39 51.82 21.85 City Threshold 75 250 550 250 100 55
Threshold Exceeded? No Yes No No No No
Notes: VOC = volatile organic compound; NOx = oxides of nitrogen; CO = carbon monoxide; SOx = sulfur oxides; PM10 = coarse particulate matter; PM2.5 = fine particulate matter. See Appendix 2.1-1 for complete results.
Table 2.1-11
Estimated Maximum Daily Operational Criteria Air Pollutant Emissions
Emission Source VOCs NOx CO SOx PM10 PM2.5
Pounds per Day
Area 23.29 6.88 35.15 0.04 0.71 0.71
2.1 Air Quality
October 2017 9993
The Villages – Escondido Country Club Final EIR 2.1-51
Table 2.1-11
Estimated Maximum Daily Operational Criteria Air Pollutant Emissions
Emission Source VOCs NOx CO SOx PM10 PM2.5
Energy 0.24 2.02 0.94 0.01 0.16 0.16
Mobile 6.34 24.46 73.58 0.26 24.51 6.69
Total 29.87 33.36 109.67 0.31 25.38 7.55 City Threshold 55 250 550 250 100 55
Threshold Exceeded? No No No No No No Notes: VOC = volatile organic compound; NOx = oxides of nitrogen; CO = carbon monoxide; SOx = sulfur oxides; PM10 = coarse particulate matter; PM2.5 = fine particulate matter. See Appendix 2.1-1 for complete results. The values shown are the maximum summer or winter daily emissions results from CalEEMod. These emissions reflect CalEEMod “mitigated” output, which accounts for compliance with SDAPCD Rule 55 (Fugitive Dust) and Rule 67.0.1 (Architectural Coatings).
Table 2.1-12
AERMOD Principal Parameters
Parameter Details
Meteorological Data AERMOD-specific meteorological data from SDAPCD’s Escondido monitoring station for a 3-year (2010 through 2012) was obtained from the SDAPCD in a preprocessed format suitable for use in AERMOD.
Urban versus Rural Option
Urban dispersion option was utilized due to the residentially developed nature of the project area.
On-site Buildings No buildings were included for this construction scenario as area sources were conservatively assessed.
Terrain Characteristics
The terrain in the immediate vicinity of the project site is generally variable (flat and elevated) with hills to the north. The elevation of the site ranges from 220 to 275 meters above sea level.
Construction area sources were modeled at ground level.
Elevation Data Digital elevation data were imported into AERMOD and elevations were assigned to the emission sources and receptors. Digital elevation data were obtained through AERMOD View in the United States Geological Survey’s National Elevation Dataset format with a 7.5 minute resolution.
Emission Sources and Release Characterizations
The construction area was divided into segmentations best representing location of maximum exposure. An initial vertical dimension of 1.2 meters and release height of 5 meters was used in accordance with EPA’s guidance. This initial vertical dimension is appropriate for an elevated source not on or adjacent to a building or structure.
Note: See Appendix B of Appendix 2.1-1.
Table 2.1-13
Construction Activity Health Risk Assessment Results
Impact Parameter Units Project Impact
CEQA Threshold
Level of Significance
Maximum Individual Cancer Risk—Residential Per Million 8.43 10 Less than Significant
Maximum Individual Cancer Risk—Worker Per Million 0.80 10 Less than Significant
Maximum Individual Cancer Risk—Sensitive Receptor (Schools)
Per Million 0.33 10 Less than Significant
Maximum Chronic Hazard Index Not Applicable 0.003 1.0 Less than Significant
Source: SDAPCD 2015b. Notes: CEQA = California Environmental Quality Act; HRA = Health Risk Assessment
2.1 Air Quality
October 2017 9993
The Villages – Escondido Country Club Final EIR 2.1-52
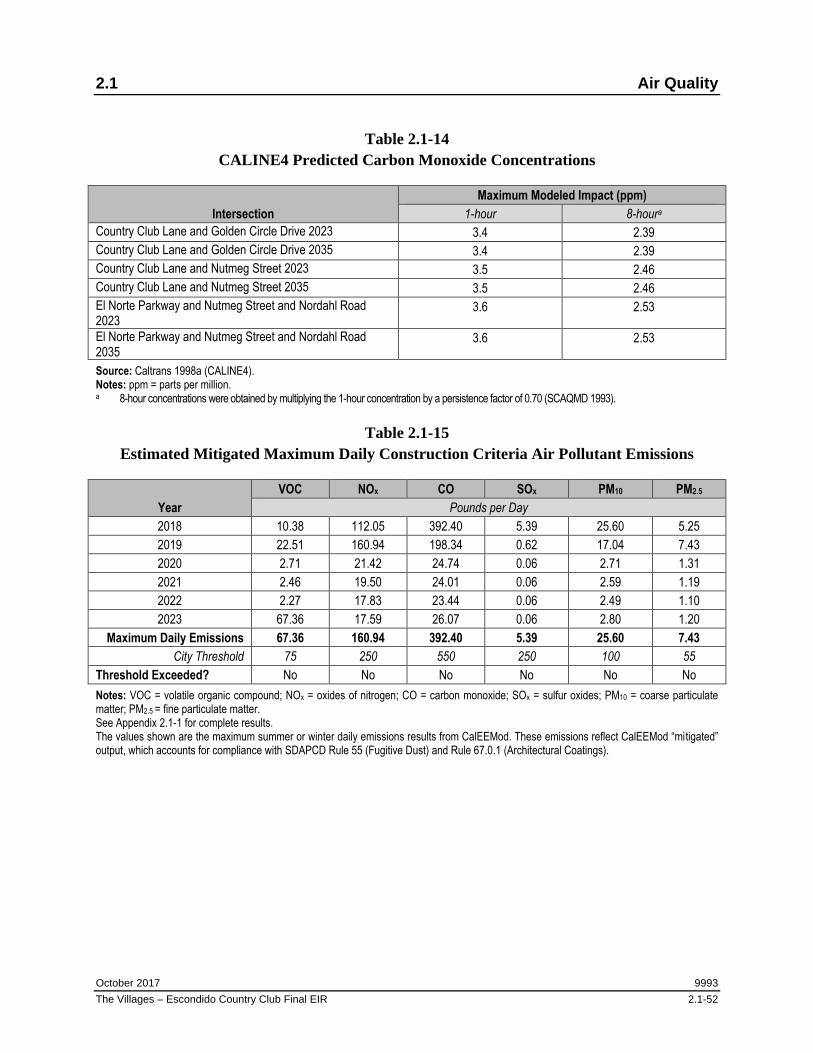
Table 2.1-14
CALINE4 Predicted Carbon Monoxide Concentrations
Intersection Maximum Modeled Impact (ppm)
1-hour 8-houra
Country Club Lane and Golden Circle Drive 2023 3.4 2.39
Country Club Lane and Golden Circle Drive 2035 3.4 2.39
Country Club Lane and Nutmeg Street 2023 3.5 2.46
Country Club Lane and Nutmeg Street 2035 3.5 2.46
El Norte Parkway and Nutmeg Street and Nordahl Road 2023
3.6 2.53
El Norte Parkway and Nutmeg Street and Nordahl Road 2035
3.6 2.53
Source: Caltrans 1998a (CALINE4). Notes: ppm = parts per million. a 8-hour concentrations were obtained by multiplying the 1-hour concentration by a persistence factor of 0.70 (SCAQMD 1993).
Table 2.1-15
Estimated Mitigated Maximum Daily Construction Criteria Air Pollutant Emissions
Year VOC NOx CO SOx PM10 PM2.5
Pounds per Day
2018 10.38 112.05 392.40 5.39 25.60 5.25
2019 22.51 160.94 198.34 0.62 17.04 7.43
2020 2.71 21.42 24.74 0.06 2.71 1.31
2021 2.46 19.50 24.01 0.06 2.59 1.19
2022 2.27 17.83 23.44 0.06 2.49 1.10
2023 67.36 17.59 26.07 0.06 2.80 1.20
Maximum Daily Emissions 67.36 160.94 392.40 5.39 25.60 7.43 City Threshold 75 250 550 250 100 55
Threshold Exceeded? No No No No No No Notes: VOC = volatile organic compound; NOx = oxides of nitrogen; CO = carbon monoxide; SOx = sulfur oxides; PM10 = coarse particulate matter; PM2.5 = fine particulate matter. See Appendix 2.1-1 for complete results. The values shown are the maximum summer or winter daily emissions results from CalEEMod. These emissions reflect CalEEMod “mitigated” output, which accounts for compliance with SDAPCD Rule 55 (Fugitive Dust) and Rule 67.0.1 (Architectural Coatings).