28
November 2017

November 2017

Spend or save?How long-term charity investors approach spending on their charitable aims
Tom Montagu-Pollock, Portfolio Director
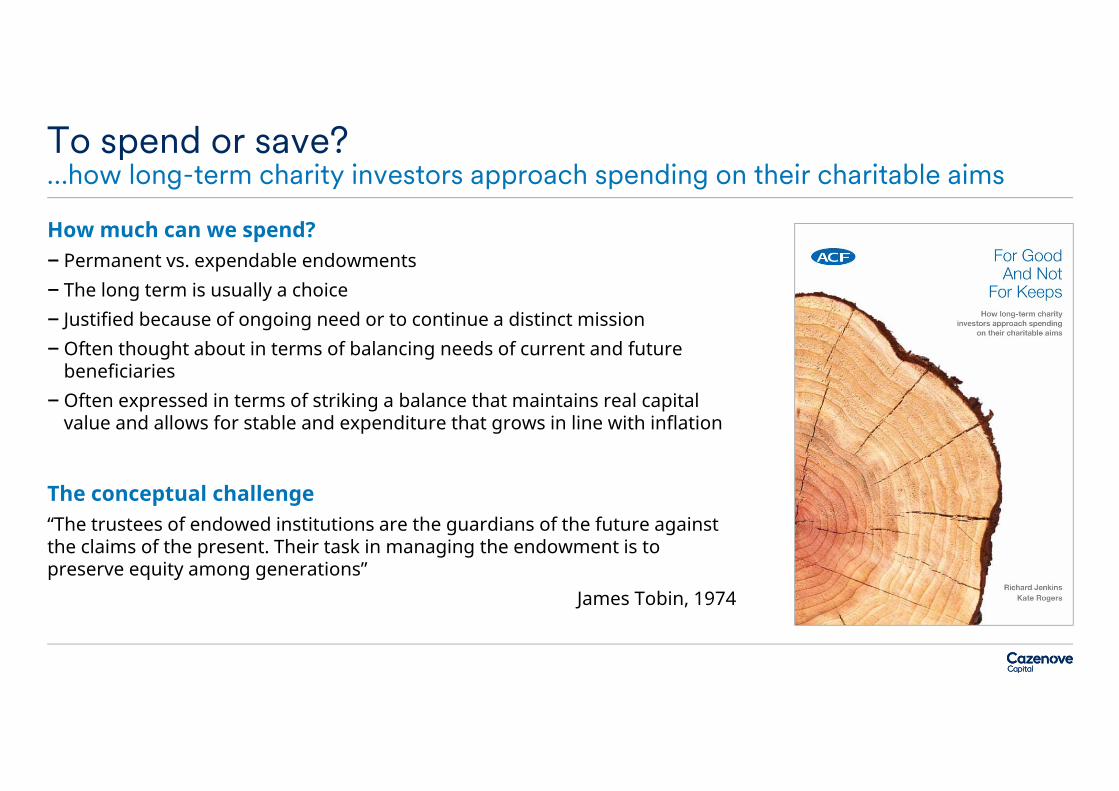
How much can we spend?– Permanent vs. expendable endowments– The long term is usually a choice– Justified because of ongoing need or to continue a distinct mission– Often thought about in terms of balancing needs of current and future
beneficiaries– Often expressed in terms of striking a balance that maintains real capital
value and allows for stable and expenditure that grows in line with inflation
The conceptual challenge“The trustees of endowed institutions are the guardians of the future against the claims of the present. Their task in managing the endowment is to preserve equity among generations”
James Tobin, 1974
To spend or save?…how long-term charity investors approach spending on their charitable aims

The challenge for trusteesConflicting pulls and pressures
Trustees
Volatile returns
Maximising distributions
for today
Stable spending
Preserving capital for future
generations
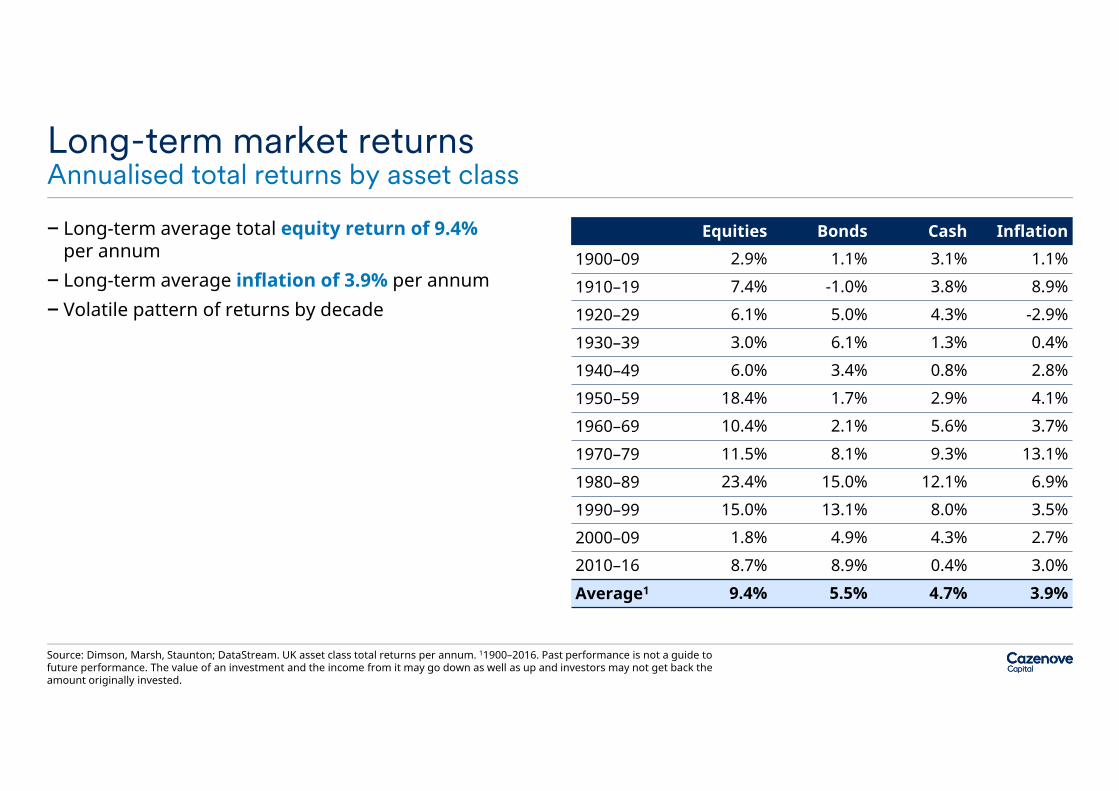
– Long-term average total equity return of 9.4% per annum
– Long-term average inflation of 3.9% per annum– Volatile pattern of returns by decade
Long-term market returnsAnnualised total returns by asset class
Source: Dimson, Marsh, Staunton; DataStream. UK asset class total returns per annum. 11900–2016. Past performance is not a guide to future performance. The value of an investment and the income from it may go down as well as up and investors may not get back the amount originally invested.
Equities Bonds Cash Inflation1900–09 2.9% 1.1% 3.1% 1.1%
1910–19 7.4% -1.0% 3.8% 8.9%
1920–29 6.1% 5.0% 4.3% -2.9%
1930–39 3.0% 6.1% 1.3% 0.4%
1940–49 6.0% 3.4% 0.8% 2.8%
1950–59 18.4% 1.7% 2.9% 4.1%
1960–69 10.4% 2.1% 5.6% 3.7%
1970–79 11.5% 8.1% 9.3% 13.1%
1980–89 23.4% 15.0% 12.1% 6.9%
1990–99 15.0% 13.1% 8.0% 3.5%
2000–09 1.8% 4.9% 4.3% 2.7%
2010–16 8.7% 8.9% 0.4% 3.0%
Average1 9.4% 5.5% 4.7% 3.9%

Real value of charity £1m initial assets, spending 4.2% per annumMillions
£0.0
£0.5
£1.0
£1.5
£2.0
£2.5
£3.0
£3.5
£4.0
£4.5
1899 1909 1919 1929 1939 1949 1959 1969 1979 1989 1999 2009
Spending rate = portfolio return – inflation
Market analysis– Long-term history puts the sustainable spending rate
at 4–5% per annum ……….but it is all in the timing
How much can we spend?…market analysis
Source: Dimson, Marsh, Staunton; Datastream. Example portfolio: 80% UK Equities, 15% UK Bonds, 5% Cash. Past performance is not a guide to future performance. The value of an investment and the income from it may go down as well as up and investors may not get back the amount originally invested.
Victorian Philanthropist Post-War Philanthropist

Long-term charity investors … – 79% felt maintaining real capital value of investment portfolio over the long term is very important– 57% felt maintaining real value of expenditure over the long term is very important– Majority aim to preserve or grow the real capital value over the long term– Only 7 charities planning to spend out, and 16 knowingly planning to spend at a rate that could erode the capital value over the
long term
What approximate percentage of your investment portfolio do you spend each year? (Funded from your investment portfolio rather than other incoming resources)
2017 Charity Investment Survey: Median expenditure rate of 3–4%
39
18 21
74
44
713
0
20
40
60
80
Less than 1% 1–2% 2–3% 3–4% 4–5% 5–6% More than 6%
How much can we spend?Our survey says …
Source: Schroders, ACF. Charity investment expenditure survey 2012, 19 questions, 226 respondents.

Our survey says…Factors associated with different spending levels
Low spend
Highspend
Shorter time horizonSmaller charitiesIncome opportunities
Longer time horizonLarger, older charitiesTotal return approaches
40
60
80
100
120
140
160
180
200
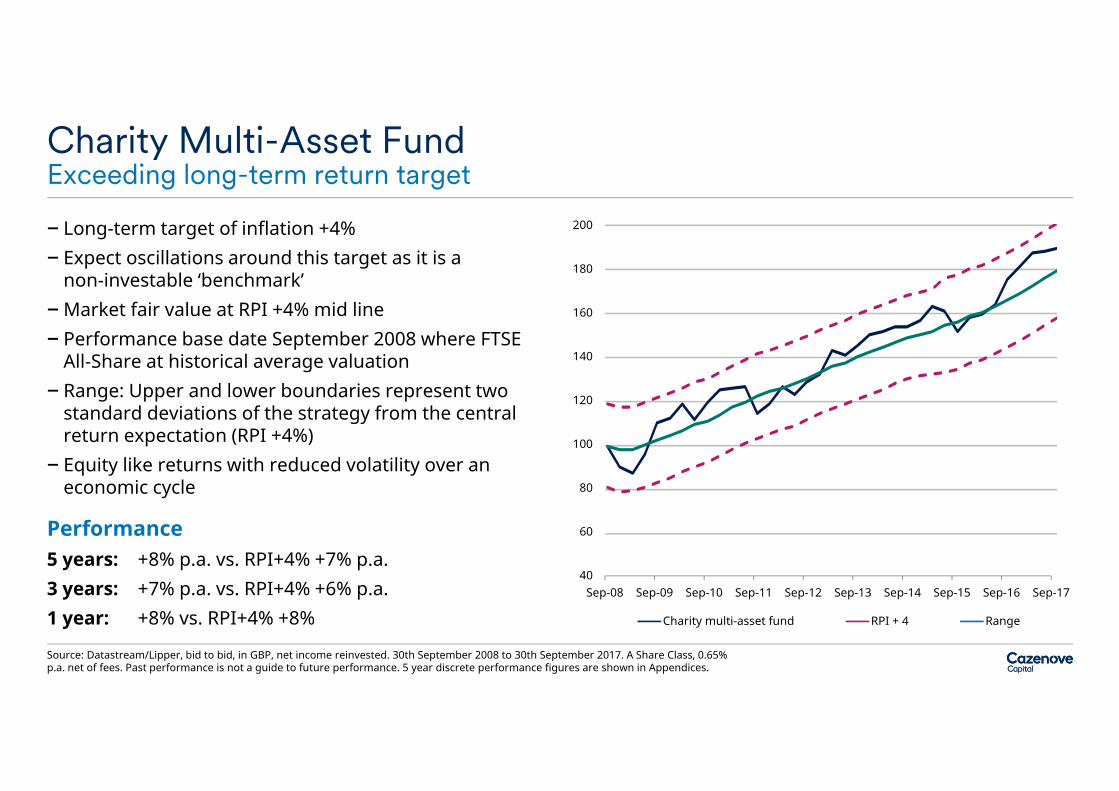
Sep-08 Sep-09 Sep-10 Sep-11 Sep-12 Sep-13 Sep-14 Sep-15 Sep-16 Sep-17
Charity multi-asset fund RPI + 4 Range
– Long-term target of inflation +4%– Expect oscillations around this target as it is a
non-investable ‘benchmark’ – Market fair value at RPI +4% mid line – Performance base date September 2008 where FTSE
All-Share at historical average valuation– Range: Upper and lower boundaries represent two
standard deviations of the strategy from the central return expectation (RPI +4%)
– Equity like returns with reduced volatility over an economic cycle
Performance5 years: +8% p.a. vs. RPI+4% +7% p.a.3 years: +7% p.a. vs. RPI+4% +6% p.a.1 year: +8% vs. RPI+4% +8%
Charity Multi-Asset Fund Exceeding long-term return target
Source: Datastream/Lipper, bid to bid, in GBP, net income reinvested. 30th September 2008 to 30th September 2017. A Share Class, 0.65% p.a. net of fees. Past performance is not a guide to future performance. 5 year discrete performance figures are shown in Appendices.

Bonds
Cash UK equities
Absolute Return
Property
Overseas equities
Looking to the futureForecasting long term vs. short term
Source: Cazenove Capital. Estimated risk and return data is based on our own analysis. Risk, return or yield characteristics of the above portfolios or constituent asset classes are not guaranteed to be achieved in the future. We define risk as standard deviation of annual returns. Our forecasts assume an average rate of inflation of 2.5% per annum. This analysis is based on broad market forecasts. Risk, return and correlation assumptions are shown in Appendices.
Multi-AssetStrategy
30 year forecasts 7 year forecasts
Expected Return 6.9% per annum 5.9% per annum
Expected Volatility 10.7% per annum 10.7% per annum
Sustainable Spend Rate 3.9% per annum 2.9% per annum
Difficult to forecast Current economic and political outlook is uncertain Forecasting a lower return environment than the previous
few years Long-term ‘Safe spend’ rate of 3.9% per annum? Medium-term forecasts reduce the ‘Safe spend’ rate to
2.9% per annum
38%
25%
10%
10%
15%2%

A better question to ask…….
'When determining our spend and investment policies,
what risk are we prepared to take with longevity?'
How much can we spend?…sustainability is only ever a probability
Source: Dimson, Marsh, Staunton; Datastream. Example portfolio: 80% UK Equities, 15% UK Bonds, 5% Cash. Past performance is not a guide to future performance.
Probability of maintaining real value No spending 3% p.a. 4% p.a.
Cazenove Capital 30 Year Forecasts 95% 61% 32%
Long-term Historical Analysis – Rolling 30 years 100% 93% 78%
Long-term Historical Analysis – Rolling 10 years 89% 59% 54%

Three distinct approaches to the long term…– Legally permanent
Restricted to spending income only. Exist as long as capital does– Intentional preservation
Low risk tolerance for mortality. Keep spending low to maximise chances of survival– Open-ended
Higher risk tolerance to mortality. But open for survival if strong markets make it possible or trustees change approach
Total return guidance means legally permanent may choose to approach question in same manner as intentional preservation
– Shorter term focusActively choose to “spend out”
How much can we spend?Balancing current need and longevity

Case studiesRepresenting four different spending approaches
Cripplegate Foundation
Permanently endowed and spending income only
Barrow Cadbury
Trust
Fully expendable and spending a fixed amount
that could conceivably erode the real value of the portfolio over time
Paul Hamlyn Foundation
Fully expendable and calculating expenditure
at a rate intended to preserve the real-value of investment portfolio
Exeter College Oxford
A mixture of permanent and expendable
endowments invested for total return to support the mission indefinitely
Look at long term market analysis – historical and forecast
Do as much good with all your assets as you can
Do good for as long as you can
Don’t put all your eggs in one basket if the long term is very important to you
Practical advice Multiple strategies for the long term
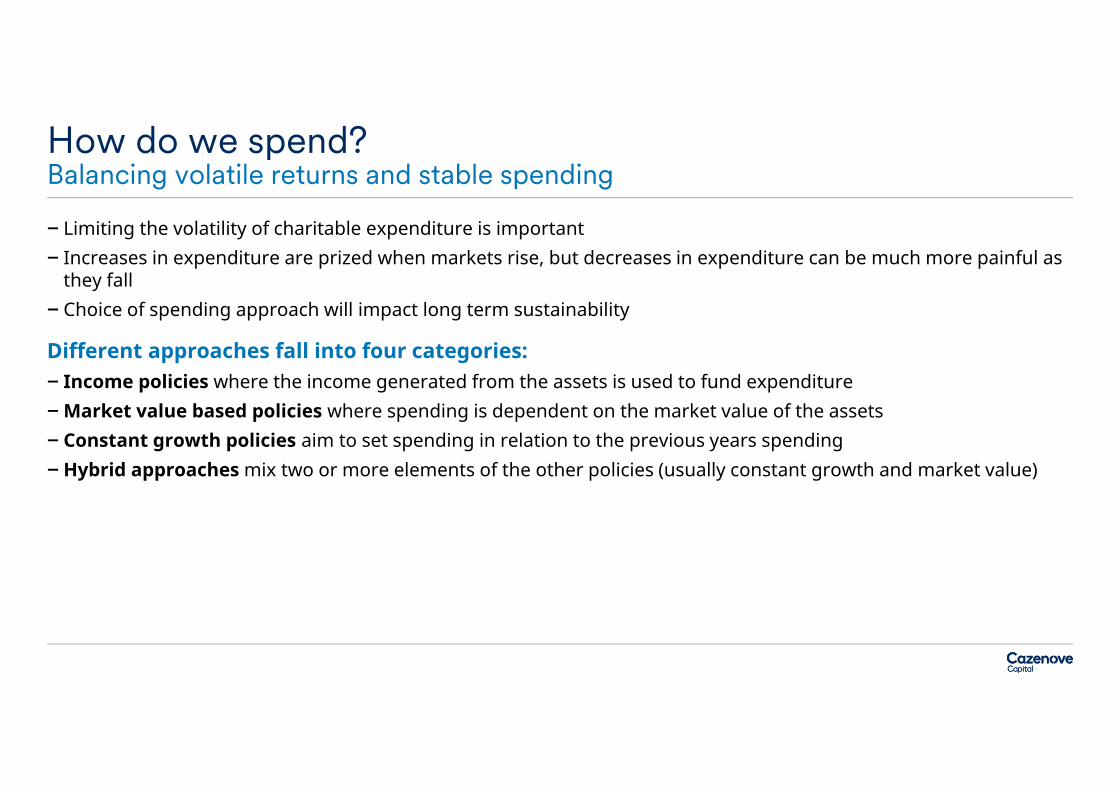
– Limiting the volatility of charitable expenditure is important– Increases in expenditure are prized when markets rise, but decreases in expenditure can be much more painful as
they fall– Choice of spending approach will impact long term sustainability
Different approaches fall into four categories:– Income policies where the income generated from the assets is used to fund expenditure– Market value based policies where spending is dependent on the market value of the assets– Constant growth policies aim to set spending in relation to the previous years spending – Hybrid approaches mix two or more elements of the other policies (usually constant growth and market value)
How do we spend?Balancing volatile returns and stable spending
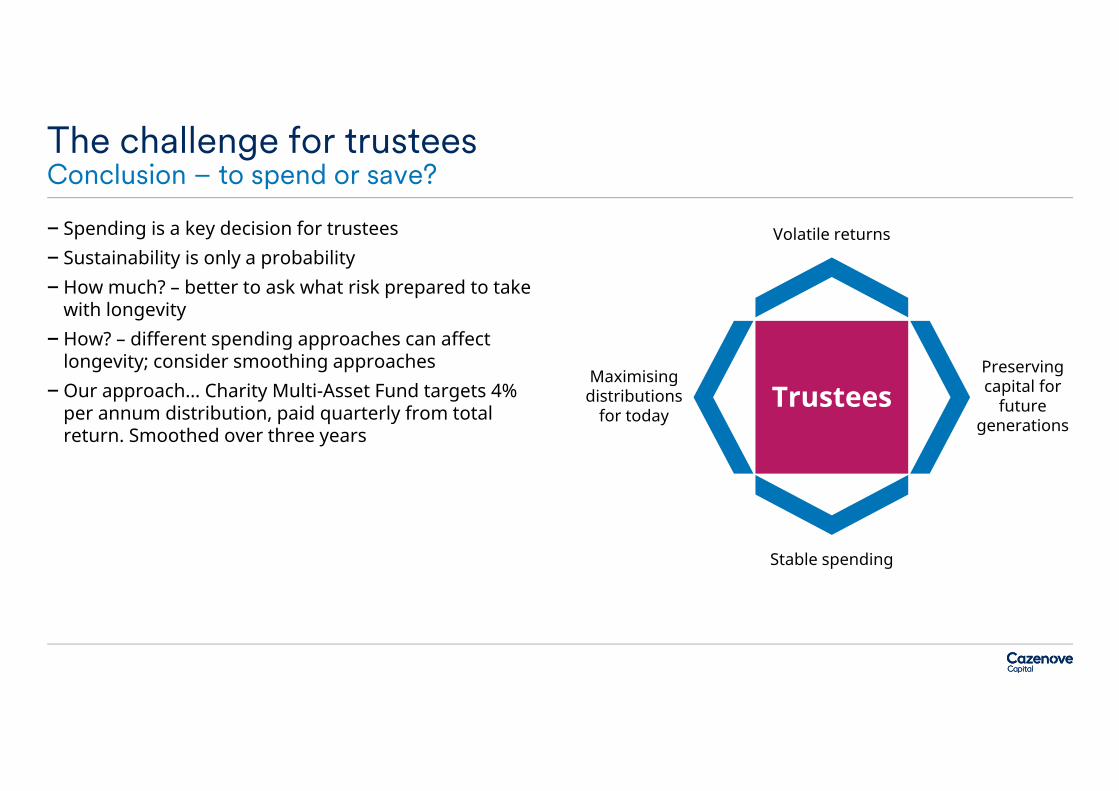
– Spending is a key decision for trustees– Sustainability is only a probability– How much? – better to ask what risk prepared to take
with longevity– How? – different spending approaches can affect
longevity; consider smoothing approaches– Our approach… Charity Multi-Asset Fund targets 4%
per annum distribution, paid quarterly from total return. Smoothed over three years
The challenge for trusteesConclusion – to spend or save?
Trustees
Volatile returns
Maximising distributions
for today
Stable spending
Preserving capital for
future generations

Appendices

Charity Multi-Asset FundPerformance summary – 30 September 2017
Source: 30 September 2017. DataStream/Lipper, bid to bid, in GBP, net income reinvested. A Share Class, 0.65% p.a. net of fees. Past performance is not a guide to future performance. The value of an investment and the income from it may go down as well as up and investors may not get back the amount originally invested.
Total returns5 Years to 30
Sept 2017 (p.a.)
3 Years to30 Sept 2017
(p.a.)
1 Oct 2016 to 30 Sept
2017
1 Oct 2015 to 30 Sept
2016
1 Oct 2014 to 30 Sept
2015
1 Oct 2013 to 30 Sept
2014
1 Oct 2012 to 30 Sept
2013
Charity Multi-Asset Fund +7.9% +7.2% +8.3% +15.2% -1.3% +5.7% +12.7%
RPI +4% +6.5% +6.3% +8.0% +6.1% +4.8% +6.3% +7.3%
Excess return over RPI +4% +1.4% +0.9% +0.3% +9.1% -6.1% -0.6% +5.4%
RPI +2.4% +2.2% +3.9% +2.0% +0.8% +2.3% +3.2%
Excess return over RPI +5.5% +5.0% +4.4% +13.2% -2.1% +3.4% +9.5%
Cash +0.5% +0.5% +0.3% +0.5% +0.6% +0.5% +0.5%
Excess return over Cash +7.4% +6.7% +8.0% +14.7% -0.7% +5.2% +12.2%
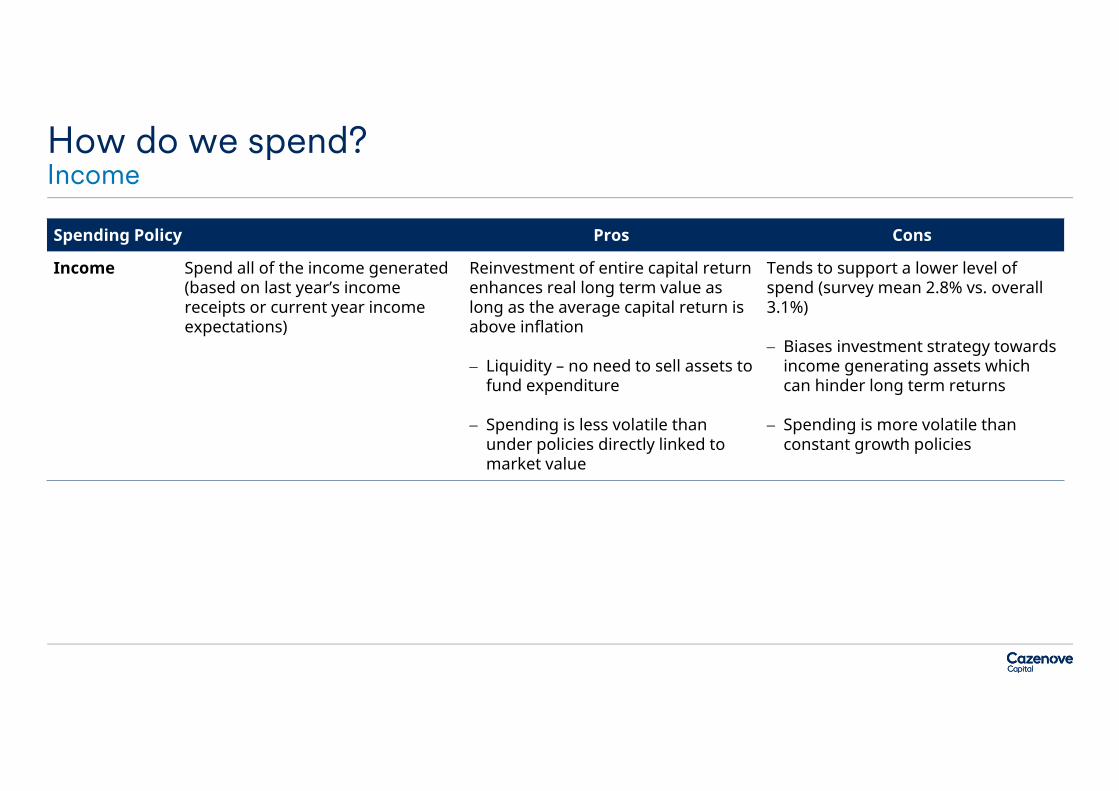
How do we spend?Income
Spending Policy Pros Cons
Income Spend all of the income generated(based on last year’s income receipts or current year income expectations)
Reinvestment of entire capital return enhances real long term value as long as the average capital return is above inflation
Liquidity – no need to sell assets to fund expenditure
Spending is less volatile than under policies directly linked to market value
Tends to support a lower level of spend (survey mean 2.8% vs. overall 3.1%)
Biases investment strategy towards income generating assets which can hinder long term returns
Spending is more volatile than constant growth policies
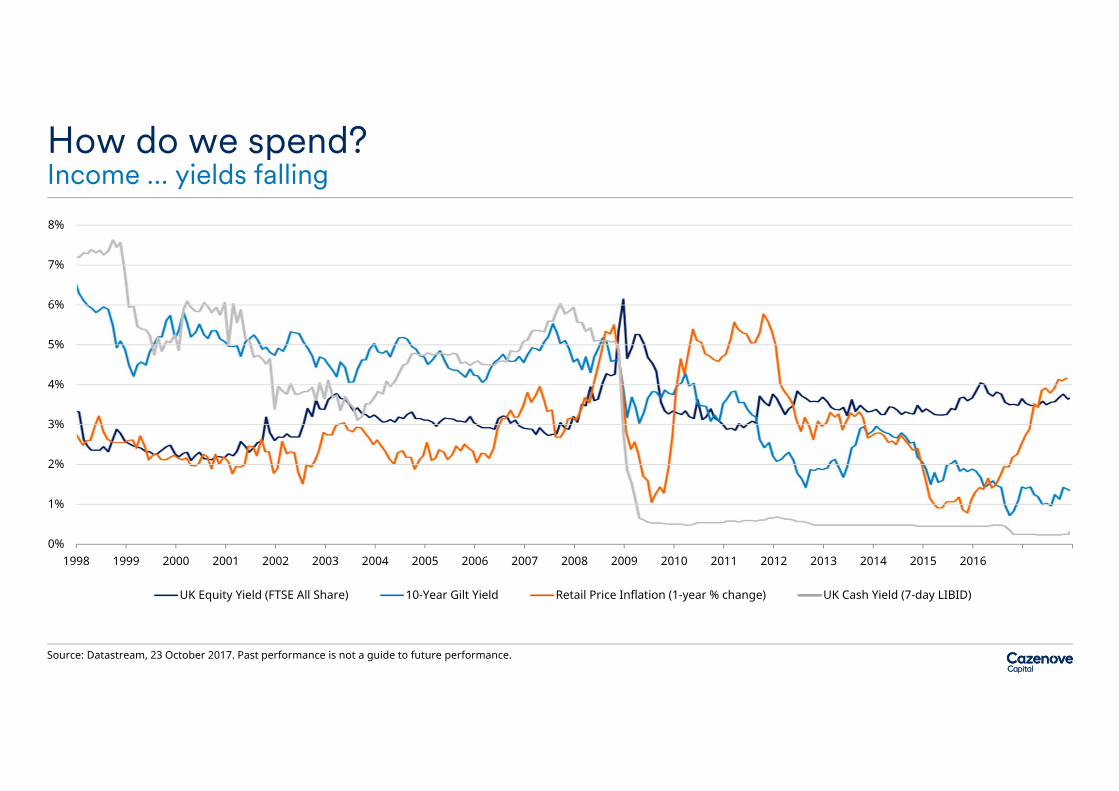
How do we spend?Income … yields falling
Source: Datastream, 23 October 2017. Past performance is not a guide to future performance.
0%
1%
2%
3%
4%
5%
6%
7%
8%
1998 1999 2000 2001 2002 2003 2004 2005 2006 2007 2008 2009 2010 2011 2012 2013 2014 2015 2016
UK Equity Yield (FTSE All Share) 10-Year Gilt Yield Retail Price Inflation (1-year % change) UK Cash Yield (7-day LIBID)

How do we spend?Market Value
Spending Policy Pros Cons
Spending rate Spend a pre-agreed percentage (spending rate) of the portfolio market value
Spending is directly related to market value of assets which enhances longevity of the assets
Allows a total return approach to be adopted, which, when used effectively, can enhance real long term value and spending through inclusion of lower yielding assets for return enhancement or risk reduction (diversification)
Spending is much more volatile than other policies
Linkage to market value enhances cyclical spend pattern, does not promote equality through time, or align with likely need
Funding expenditure from capital and income may lead to liquidity problems, although this is less of a risk than in constant growth policies
Movingaveragespending rate
Spend a pre-agreed percentage (spending rate) of the moving average market value
Smoothing reduces volatility of spending as compared to simple spending rate method

How do we spend?Constant Growth
Spending Policy Pros Cons
Fixed amount Spend a pre-agreed amount each year (usually based on a historic spending amount, perhaps increased by a fixed percentage)
Supports a stable and predictable spending amount
Benefits long term real value in strong market conditions
Lack of market value linkage can expose assets to risk of overspend and permanent impairment in weak market conditions
Significant liquidity risk in downturns, selling assets to fund expenditure
Real expenditure
Grow the expenditure with inflation each year
Directly linked to inflation so preserving real expenditure prioritised
Lack of market value linkage risks long term real value in times of market weakness or high inflation
Banded real expenditure
Grow the expenditure with inflation each year within agreed inflation bands
Spending stable and growing, directly linked to inflation
Reduces risk of overspend in high inflation conditions

How do we spend?Hybrid
Spending Policy Pros Cons
Weighted average spending
Weighted average of ‘Real Expenditure’ (last year’s spending adjusted for inflation) and ‘Spending Rate’ (market value multiplied by the spending rate) methodologies.Weightings determined by individual policiese.g. Yale: 80% real expenditure and 20% spending rate
Spending more stable than market value approaches and directly linked to inflation
Linkage to market value should offer some protection against overspend in downturns
Some exposure to overspend risk in market downturns or period of high inflation
Liquidity risk of selling assets in weak markets
Market value linkage means spending is more volatile than constant growth policies

Spending Policy Low spending volatility
Countercyclical spending
Maximise long term real value in
strong market
Maximise long term real value in
downturn
Minimise liquidity risk
Income 3 3 3 2 1
Market Value 4 4 4 1 2
Constant Growth 1 1 1 4 4
Hybrid 2 2 2 3 3
How do we spend?…summary
Source: Schroders.
Characteristic (1 = best, 4 = worst)

Forward looking return assumptions for high level asset classes (GBP)
Long-term returns and risk assumptionsCazenove Capital sterling portfolios
Source: Cazenove Capital. The expected returns are forecasts and not a reliable indicator of future performance. Illustrative ten year performance for a normal business cycle. Income reinvested with no capital withdrawals. Underlying assumptions and calculations available on request. All forecast performance figures are exclusive of commissions, fees and other charges which will have an effect on final performance figures.
Expectedlong-term return p.a.
Expected volatility p.a. Comments
UK equity 7.5% 15% Assumption of 3.5% equity risk premium over expected returns from government bonds (4%)
Developed market ex-UK equity 7.75% 17% Assumption of 3.75% equity risk premium over expected returns from government bonds (4%)
Emerging market equity 10% 23% Emerging market premium over developed equities expected to reward investors for higher risk and higher anticipated nominal growth rates
Government bonds (UK or £ hedged) 4% 6% Returns on government bonds close to expected, long run nominal GDP growth (real growth 2.25%,
inflation 2%)
Investment grade corporate bonds (UK or £ hedged) 5% 7% Returns derived by adding expected credit spread, net of anticipated losses due to defaults, to
government bond yields (credit spread 1.1%, default losses 0.1%)
High yield bonds (UK or £ hedged) 6% 11% Returns derived by adding expected credit spread, net of anticipated losses due to defaults, to
government bond yields (credit spread 5%, default losses 3%)
Property 6% 7.5% Returns expected to lie between the returns realizable from government bonds and equities
Target absolute return 6% 7.5% Returns expected to lie between the returns realizable from government bonds and equities
Commodities 6.5% 19% Commodity returns a function of global growth and commodity specific supply demand balances
Cash (£) 3.75% 0.5% Derived from deduction of anticipated term premium (25 bps) from benchmark government bond yield

DisclaimersWe undertake to comply with our obligations under the Financial Services and Markets Act 2000 and the disclaimers set out in this section do not exclude or restrict liability for any duty to clients under this Act or any other applicable regulatory authority.
Nothing in this document should be deemed to constitute the provision of financial, investment or other professional advice in any way. The material in this document is for information purposes only and the services, securities, investments and funds described may not be available to or suitable for you. Not all strategies are appropriate at all times.
We have taken all reasonable care to ensure that the information contained within this document is accurate, up to date, and complies with all prevailing UK legislation. However, no liability can be accepted for any errors or omissions, or for any loss resulting from its use. Any data and material provided ahead of an investment decision are for information purposes only. Unit and share prices are for information purposes only, they are not intended for trading purposes. We shall not be liable for any errors or delays in these prices or in the provision of this information, or for any actions taken in reliance thereon.
We reserve the right to amend, alter, or withdraw any of the information contained in this document at any time and without notice. No liability is accepted for such changes.
This document may include forward-looking statements that are based upon our current opinions, expectations and projections. We undertake no obligation to update or revise any forward-looking statements. Actual results could differ materially from those anticipated in the forward-looking statements.
Risk warnings You should consider the following risks:
Investment risk: Past performance is not a guide to future performance. The value of an investment and the income from it may go down as well as up and investors may not get back the amount originally invested.
Taxation: Statements concerning taxation are based on our understanding of the taxation law in force at the time of publication. The levels and bases of taxation may change. You should obtain professional advice on taxation where appropriate before proceeding with any investment.
Exchange rates: Investments in overseas securities are exposed to movements in exchange rates. These may cause the sterling value of units to go up or down.
Debt securities: Investments in higher yielding bonds issued by borrowers with lower credit ratings may result in a greater risk of default and have a negative impact on income and capital value. Income payments may constitute a return of capital in whole or in part. Income may be achieved by foregoing future capital growth.
Emerging markets: You should be aware of the additional risks associated with investment in emerging and developing markets. These include: higher volatility of markets; systems and standards affecting trading, settlement, registration and custody of securities all possibly lower than in developed markets; lack of liquidity in markets and exchanges leading to lower marketability of securities and greater price fluctuation; significant currency volatility, possibly resulting in adoption of exchange controls; lower shareholder protection or information to investors provided from the legal infrastructure and accounting, auditing and reporting standards.
Disclaimers, risk warnings and regulatory status

Risk warnings (continued)Unregulated collective investment schemes: Unregulated collective investment schemes and other non-mainstream pooled investments (NMPIs) are unlikely to offer a level of investor protection equivalent to that available for UK regulated investments. Such schemes may deal infrequently and may limit redemption.
Structured products: Structured products are usually issued by financial institutions and in the event of these institutions going into liquidation or failing to comply with the terms of the securities you may not receive the anticipated returns and you may lose all or part of the money you originally invested. If you sell your investment before its maturity date the investment may achieve a price less than the original investment. The performance of these investments may depend on indices and defined calculations which may differ from direct investments.
Gearing: Some of the investments we may make on your behalf could be in investment companies which use gearing as a strategy or invest in other investment companies which use gearing, such as investment trusts. The strategy which the issuer of such securities uses or proposes to use may result in movements in the price of the securities being more volatile than the movements in the price of underlying investments. Such investments may be subject to sudden and large falls in value and you may get back nothing at all if there is a sufficiently large fall.
Regulated Mortgages: Schroder & Co. Limited is authorised by the Prudential Regulation Authority to administer, advise on, arrange (bring about) and enter into a regulated mortgage contract. Your home may be repossessed if you do not keep up repayments on your mortgage.
All data contained within this document is sourced from Cazenove Capital unless otherwise stated. Where FTSE International Limited (“FTSE”) data is used, “FTSE” is a trade mark of the London Stock Exchange Group of companies and is used by FTSE International Limited under licence. All rights in the FTSE indices vest in FTSE and/or its licensors. Neither FTSE nor its licensors accept any liability for any errors or omissions in the FTSE indices or underlying data. No further distribution of FTSE data is permitted without FTSE’s express written consent.
Company particulars and regulatory statusThis document is issued by Cazenove Capital which is part of the Schroder Group and is a trading name of Schroder & Co. Limited, who together with connected companies provide the services described.
Schroder & Co Limited is authorised by the Prudential Regulation Authority and regulated by the Financial Conduct Authority and the Prudential Regulation Authority. Registered office is at 31 Gresham Street, London EC2V 7QA. Registered Number 2280926 England.
Services supplied by Schroder & Co. Limited and connected companies may be subject to value added tax (VAT). Schroder & Co. Limited is registered for VAT in the United Kingdom (GB 243868730).
For the purposes of the Data Protection Act 1998, the data controller in respect of any personal data you supply is Schroder & Co. Limited. Personal information you supply may be processed for the purposes of investment administration by the Schroder Group, which may include the transfer of data outside of the European Economic Area. Schroder & Co. Limited may also use such information for marketing activities unless you notify it otherwise in writing.
For your security, communications may be recorded or monitored.
Disclaimers, risk warnings and regulatory status

Thank you


