Macro Commodities Forex Rates Equity Credit Derivatives 22 October 2010 Equity – SG Europe Research Multi-Utilities & Unregulated Power Initiation of coverage www.sgresearch.com Italy ACTELIOS A winning combination Investment case The merger of Actelios’ biomass-based electricity production activities with those of the wind energy specialist Falck Renewables (both controlled by Gruppo Falck) will lead to the creation of one of the principal independent producers of renewable electricity in Europe. This transaction enables the combination of a company with substantial cash but a limited growth outlook (Actelios) with a highly dynamic wind energy developer that operates in countries with high profitability (UK, Italy) but has substantial financing needs (Falck Renewables). The balance sheet structure of the new group appears solid for the period 2010-2014 despite significant investments. The combination of these two entities should also serve to limit the inherent risks of each by diversifying their technological and geographical bases. The new group should show earnings growth of over 15% per year. We believe that the share offers strong upside potential based on our target price of €3.0 per share. Catalysts for the share price The completion of the transactions concerning the shareholder structure of Actelios and Falck Renewables should give the share new visibility. After a H1 in which trading was penalised by poor wind energy conditions in the UK and the shutdown of one of Actelios’ sites for complete renovation, the outlook should improve significantly. Finally, discussions have resumed concerning the cancelled projects in Sicily. This could lead to the reimbursement of the €128m in investments made. 12m target price and methodology We have a target price of €3.0 per share. As with all electricity producers, our benchmark method is a sum of the parts valuation. Installed assets are valued using a DCF valuation based on assumed asset profitability, which varies as a function of geographical location and technology. Actelios’ sum of the parts valuation (before market discount) equals €4.1. Stock market comparisons are also useful and lead to a valuation of €3. In contrast, a DCF valuation is not very relevant in the case of developers. Alternative scenarios and risk to our scenario The regulatory situation concerning green certificates in Italy remains uncertain and their value could be revised downward. This would have an impact on the profitability of wind and biomass assets. Electricity price trends also remain an important factor in terms of Actelios’ performance. Buy (12m) Price 19/10/10 12m target €2.21 €3.0 Sector Weighting Underweight Preferred stock EDF Energies Nouvelles Least preferred stock Theolia 1 year Price MA 100 2.2 2.9 3.6 4.3 2009 2010 0 0.55 1.1 1.65 (m) 2009 2010 Source: SG Cross Asset Research Risk Stock vs sector na Sector vs market na Actelios on www.sgresearch.com Share data Financial data 12/09 12/10e 12/11e 12/12e Ratios 12/09 12/10e 12/11e 12/12e RIC AA4.MI, Bloom ACT IM Revenues (€m) 94.9 202.3 243.7 276.6 P/E (x) 35.8 18.7 16.2 15.0 52-week range 4.24-2.21 EBIT margin (%) 19.8 29.2 28.4 28.9 FCF yield (/EV) (%) 5.5 -2.4 -11.8 -8.0 EV 10 (€m) 931 Rep. net inc. (€m) 4.2 19.1 22.0 23.8 Dividend yield (%) 3.9 1.6 1.8 2.0 Market cap. (€m) 357 EPS (adj.) (€) 0.062 0.118 0.136 0.147 Price/book value (x) 0.4 0.9 0.9 0.9 Free float (%) 31.3 Dividend/share (€) 0.085 0.035 0.041 0.044 EV/revenues (x) 2.76 4.60 4.51 4.50 Performance (%) 1m 3m 12m Payout (%) 269.5 58.0 26.2 24.0 EV/EBIT (x) 13.9 15.7 15.9 15.6 Ordinary shares -14.4 -22.0 -46.0 Interest cover (x) 3.6 2.2 2.1 2.0 EV/IC (x) 1.0 1.0 1.0 1.0 Rel. Eurofirst 300 -15.2 -27.5 -48.8 Net debt/equity (%) nm 148.1 190.0 225.9 ROIC/WACC (x) 0.5 0.7 0.5 0.5 CAGR 09-12e: +33.6% Didier Laurens (33) 1 42 13 50 78 [email protected]Notice to US investors: Written by a non-US research analyst not registered/qualified under FINRA Rules. THIS RESEARCH REPORT IS THE PRODUCT OF SOCIETE GENERALE (AUTHORIZED IN FRANCE BY THE AMF). PLEASE SEE IMPORTANT DISCLOSURES AND ANALYST CERTIFICATION IN THE APPENDIX FAT
Notice to US investors: Written by a non-US research analyst not registered/qualified under FINRA Rules. THIS RESEARCH REPORT IS THE PRODUCT OF SOCIETE GENERALE (AUTHORIZED IN FRANCE BY THE AMF). PLEASE SEE IMPORTANT DISCLOSURES AND ANALYST CERTIFICATION IN THE APPENDIX
Actelios, an Italian company specialising in the production of electricity from biomass and
waste, is in the process of merging its operations with those of Falck Renewables, a wind
energy specialist. These two companies are controlled by Gruppo Falck, an Italian holding
company.
Sales/division 2009 EBIT/division 2009 pf
Others9.0%
Waste treatment27.4%
Electricity63.6%
The group’s principal activity is electricity production. The merger with Falck Renewables will further increase the dominance of this segment.
Falck Renewable
s64%
Actelios36%
On a pro forma 2009 basis, Falck Renewables is the major contributor to group EBITDA. It should also be the main growth driver.
Source: Company data Source: Company data
End-market exposure 2009 Sales/region 2009
Others36.0%
Electric utilities64.0%
The Italian network operator is the principal customer for the electricity produced by Actelios. The service and waste treatment activities are linked to sector industrials.
Italy100.0%
Actelios operates exclusively in Italy. The merger with Falck Renewables will increase the geographical diversification and reduce regulatory risks.
Since its IPO in 2006, the share has been hit by a series of bad news, with the most important being the cancellation of waste treatment projects in Sicily in 2008.
Cancelled Sicilian
projects
Lehman’s collapse
Merger with Falck
Renewables announced
FAT
Actelios
22 October 2010 4
Contents
2 Group anatomy – business overview
3 Group anatomy – performance and valuation
5 Investment summary
5 A new, less risky ensemble
6 A new, more dynamic ensemble
6 Over 30% upside potential
7 Inherent risks, above all on the Italian market
8 Electricity production: Actelios’ core business
8 The consolidation of Falck Renewables
10 A change in dimension
12 Actelios: centred on Italy
12 Active in biomass and waste
14 Photovoltaic solar energy
15 Falck Renewables: an important player in wind energy
15 408 MW of wind energy capacity in Europe
18 UK: favourable rate environment
20 Italian markets offers strong potential
23 Revenues: growth driven by wind energy
23 Around 1.1 GW of capacities in 2014
23 Revenues to double by 2014
25 Investment programme
26 Results driven by new assets
26 EBITDA: growth driven by wind energy
27 Attributable net income: growth of 14% per year
28 A solid financial structure
29 Financing of growth: a useful but not obligatory capital increase
30 Target price of €3.0
30 Calculation of the target price and fundamental valuation
30 Sum of the parts: €4.1 per share
31 Normalised Free Cash Flow: €2.6
32 Stock market comparisons: €3.0
33 DCF: valuation of €3.2
34 Sum of the parts valuation sensitivity analysis
FAT
Actelios
22 October 2010 5
Investment summary
A new, less risky ensemble The transfer of Falck Renewables’ assets to Actelios will lead to the creation of one of the
most important independent European renewable electricity producers after the sector majors.
Installed capacities as of 31 December 2009
10 752
6230
5469
2257
454 322 202 160 149 138 75
Iber
drol
a R
enov
able
s
Acci
ona
EDP
Ren
ovav
eis
EDF
EN
Acte
lios
Theo
lia
ERG
Ren
ew
Aler
ion
Tern
a En
ergy
Fers
a
Gre
ente
ch E
S
Source: SG Cross Asset Research
While Actelios had previously operated exclusively in Italy in the biomass and waste areas, the
new group’s revenue sources will be more diversified. Additionally, geographical
diversification should reduce risk, particularly regulatory risks that penalise the renewable
energy sector players.
Production asset breakdown by technology Geographical breakdown of production assets
Wind90%
Biomass3%
Waste7%
PV Solar0%
UK51%
Italy31%
Spain11%
France7%
Source: SG Cross Asset Research, company Source: SG Cross Asset Research, company
FAT
Actelios
22 October 2010 6
A new, more dynamic ensemble The growth outlook for Actelios alone was limited by the difficulty in obtaining new
authorisations for waste incinerators and in assuring the availability of producible biomass.
Additionally, there appeared to be only limited opportunities for development in the PV solar
segment over time. Actelios could not use its net cash (€95m) in an optimal manner. In
contrast, Falck Renewables is benefiting from the dynamism of wind energy in the UK and
Italy and has a strong growth outlook. However, seizing these opportunities requires major
investments and Falck Renewables appears to lack the resources.
A winning combination
Actelios
Weak growth
Low geographical div ersif ication
Technological div ersif ication
Solid balance sheet
Falck Renewables
High growth
High geographical div ersif ication
Single technology
Unbalanced balance sheet
Actelios + FR
High growth
Div ersif ication = reduction in risks
Solid balance sheet
Source: SG Cross Asset Research
The combination of the two entities will create a group with a solid balance sheet and a strong
growth outlook. Average earnings growth over 2009-2014e should be close to 15%. Finally,
the new group’s return on equity should improve compared to Actelios alone.
Over 30% upside potential We have a target price of €3.0 per share based a sum of the parts valuation, our benchmark
method. While the theoretical valuation equals €4.1, the market applies an average discount of
nearly 25% to the sum of the parts valuation of the renewable development majors. Applying
this discount to Actelios leads to our target price of €3.0. Stock market comparisons give a
target price between €2.5 and €3.7 per share.
Summary of our valuation methods
Method Theoretical valuation (€/sh) Comments
Sum of the parts 4.1 Our benchmark method
FCF yield 2.6 Normalised valuation approach
Stock market comparisons 3.0 Based on 2011e EV/EBITDA multiples
DCF 3.2 Validation of the SOP valuation Source: SG Cross Asset Research
FAT
Actelios
22 October 2010 7
Inherent risks, above all on the Italian market Regulatory risk in Italy Looking beyond the risks inherent in the operation of wind energy units (whose impact could
be seen in Falck Renewables’ H1 2010 results), the new group will be above all exposed to
regulatory risk in terms of the future of green certificates in Italy. In a worst case scenario
under which the repurchase obligation of the GSE (Italian renewable energy development
authority) is cancelled, the value of green certificates would fall to close to zero given the
surplus. Under this scenario, EBITDA over 2012-2014 would fall by 15-20%. Applying the
average 2012 EBITDA multiples of wind energy developers would lead to a valuation of €2.0, a
level 10% below the current share price.
Impact of a fall in prices of green certificate prices on wind energy operations in Italy
Initial SGe forecasts Forecasts including the risk
Scenario 15% reduction in wind energy remuneration in Italy. Assumed price: €129/MWh over the period
End of systematic repurchases of green certificates in Italy. Assumed wind electricity price: €70/MWh
Fiscal year 2012 2013 2014 2012 2013 2014
EBITDA 141 168 209 114 137 176
EPS 0.15 0.17 0.24 0.04 0.05 0.11
Source: SG Cross Asset Research
Limited exchange rate risk As the new group will realise around 30% of its revenues in the UK, it will be exposed to £/€
exchange rate risk. We estimate that a 10% variation in the £/€ exchange rate would lead to
an around 5% variation in EBITDA.
FAT
Actelios
22 October 2010 8
Electricity production: Actelios’ core business
The consolidation of Falck Renewables Actelios, an Italian company specialising in electricity production from biomass and waste, is
in the process of merging its operations with those of Falck Renewables, a wind energy
specialist. The two companies are controlled by Gruppo Falck, an Italian holding company.
Current shareholder structure Final shareholder structure
Actelios
Falck
Management
Falck Renewables
100%
Falck Energy
Free float
81%
19%
68.7%
31.3%
Actelios
Falck
Management
Falck Renewables
Free float
c.100%
60%
Source: company data Source: company data
A three-step merger The creation of the new Actelios, which will lead to Actelios owning around 100% of Falck
Renewables, will involve three steps:
The de-merger of Falck Renewables from Falck Energy, which currently owns an 81%
stake, and its direct attachment to Gruppo Falck. Management will continue to own a 19%
stake, including 12.6% held by William Heller, the company’s managing director.
The contribution of Gruppo Falck’s 81% stake to Actelios through an asset transfer. Actelios
will issue in return around 74.7 million shares based on valuations of €340m for Actelios and
€518m for Falck Renewables.
The acquisition by Actelios of the 19% of Falck Renewables shares held by management
through the issue of 19.5 million new Actelios shares.
The valuation of Falck Renewables in this transaction appears perfectly justified. The
theoretical EV of the existing wind energy assets equals €1.1bn, or around €500m after
deducting debt. Actelios’ final percent ownership of Falck Renewables will depend on
management’s response, keeping in mind that William Heller has decided to accept the offer.
In total, Actelios will issue 94.2 million new shares in this transaction, lifting its total number of
shares to 161.9 million.
FAT
Actelios
22 October 2010 9
The creation of a significant player in the renewable energies area The transfer of Falck Renewables’ assets will lead to the creation of one of the most important
independent European companies in the production of electricity from renewable sources,
with 454MW of production capacity.
Installed capacity on 31 December 2009 (MW)
10 752
6230
5469
2257
454 322 202 160 149 138 75
Iber
drol
a R
enov
able
s
Acci
ona
EDP
Ren
ovav
eis
EDF
EN
Acte
lios
Theo
lia
ERG
Ren
ew
Aler
ion
Tern
a En
ergy
Fers
a
Gre
ente
ch E
S
Source: SG Cross Asset Research
Diversification that will reduce risks The new ensemble will be principally exposed to wind energy, which will represent 90% of
installed assets. Additionally, the group will now be geographically diversified, with half of its
assets in the UK compared to its exclusive exposure to Italy up until now. The technological
and geographical diversification will diversify the risks associated with each technology and
each market.
Production assets breakdown by technology Geographical breakdown of production assets
Wind90%
Biomass3%
Waste7%
PV Solar0%
UK51%
Italy31%
Spain11%
France7%
Source: SG Cross Asset Research, company Source: SG Cross Asset Research, company
FAT
Actelios
22 October 2010 10
A change in dimension The consolidation of Falck Renewables will lead to a change in dimension at Actelios, not only
in terms of production capacities, but also in financial terms.
Pro forma growth of 30% Based on Falck Renewables’ results (source: Gruppo Falck annual report), Actelios’ 2009
post-merger pro forma P&L statement shows a doubling in revenues and operating profit.
While pro forma net income appears stable compared to 2008, it should be noted that this is
principally linked to asset write-downs on Actelios’ accounts in 2009. Excluding these items,
2009 pro forma net income would have risen 30% compared to 2008.
Number of shares 67,680 67,680 67,680 67,680 67,680
EPS (€ per share) 0.19 0.20 0.26 0.06 0.30
Source: SG Cross Asset Research
A re-balancing of the balance sheet The individual balance sheet situations of the two companies are balanced out in the
consolidated balance sheet of the merged group. Actelios had net cash of around €95m
compared to equity funds of €350m at the end of 2009. The group had realised a capital
increase in €250m in 2006 in order to finance projects in Sicily that have since been
abandoned. In contrast, Falck Renewables has a significant need for equity capital, with net
debt of €615m (including €353m in project financing) vs equity funds of €26m at the end of
2009. Compared to EBITDA generated in 2009, the debt ratio is above 10x.
Simplified balance sheets of the separate and combined entities
(€m) Actelios Falck Renewables NewCo Pro forma
Net Lt assets 281 656 936
Working capital (26) (15) (41)
Equity funds 350 26 376
Net debt (95) 615 520
Source: SG Cross Asset Research
The debt of the combined companies totals €520m, including €383m of non-recourse debt.
The new company shows a net debt/equity ratio of 1.4x and a net debt/EBITDA ratio of 5.5x.
While the net debt/EBITDA ratio could appear high, it is in line with debt ratios of comparable
companies using project financing.
FAT
Actelios
22 October 2010 11
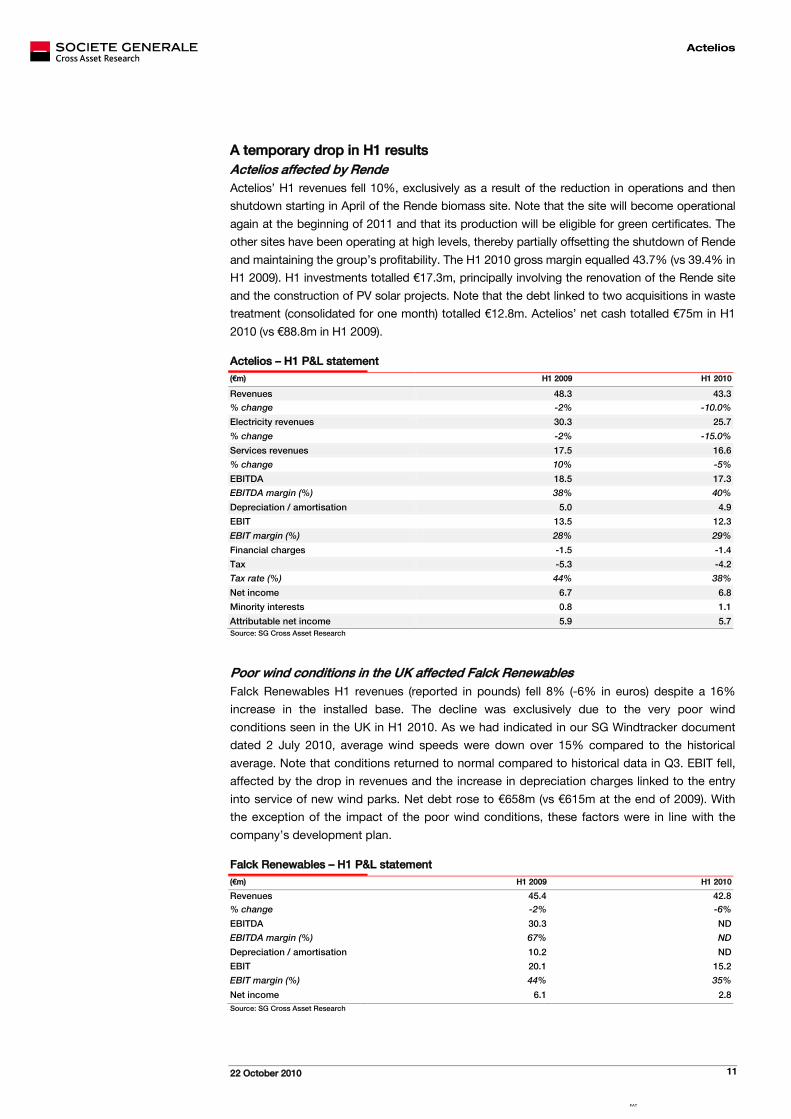
A temporary drop in H1 results Actelios affected by Rende Actelios’ H1 revenues fell 10%, exclusively as a result of the reduction in operations and then
shutdown starting in April of the Rende biomass site. Note that the site will become operational
again at the beginning of 2011 and that its production will be eligible for green certificates. The
other sites have been operating at high levels, thereby partially offsetting the shutdown of Rende
and maintaining the group’s profitability. The H1 2010 gross margin equalled 43.7% (vs 39.4% in
H1 2009). H1 investments totalled €17.3m, principally involving the renovation of the Rende site
and the construction of PV solar projects. Note that the debt linked to two acquisitions in waste
treatment (consolidated for one month) totalled €12.8m. Actelios’ net cash totalled €75m in H1
2010 (vs €88.8m in H1 2009).
Actelios – H1 P&L statement
(€m) H1 2009 H1 2010
Revenues 48.3 43.3
% change -2% -10.0%
Electricity revenues 30.3 25.7
% change -2% -15.0%
Services revenues 17.5 16.6
% change 10% -5%
EBITDA 18.5 17.3
EBITDA margin (%) 38% 40%
Depreciation / amortisation 5.0 4.9
EBIT 13.5 12.3
EBIT margin (%) 28% 29%
Financial charges -1.5 -1.4
Tax -5.3 -4.2
Tax rate (%) 44% 38%
Net income 6.7 6.8
Minority interests 0.8 1.1
Attributable net income 5.9 5.7 Source: SG Cross Asset Research
Poor wind conditions in the UK affected Falck Renewables Falck Renewables H1 revenues (reported in pounds) fell 8% (-6% in euros) despite a 16%
increase in the installed base. The decline was exclusively due to the very poor wind
conditions seen in the UK in H1 2010. As we had indicated in our SG Windtracker document
dated 2 July 2010, average wind speeds were down over 15% compared to the historical
average. Note that conditions returned to normal compared to historical data in Q3. EBIT fell,
affected by the drop in revenues and the increase in depreciation charges linked to the entry
into service of new wind parks. Net debt rose to €658m (vs €615m at the end of 2009). With
the exception of the impact of the poor wind conditions, these factors were in line with the
company’s development plan.
Falck Renewables – H1 P&L statement
(€m) H1 2009 H1 2010
Revenues 45.4 42.8 % change -2% -6%
EBITDA 30.3 ND
EBITDA margin (%) 67% ND
Depreciation / amortisation 10.2 ND
EBIT 20.1 15.2
EBIT margin (%) 44% 35%
Net income 6.1 2.8 Source: SG Cross Asset Research
FAT
Actelios
22 October 2010 12
Actelios: centred on Italy
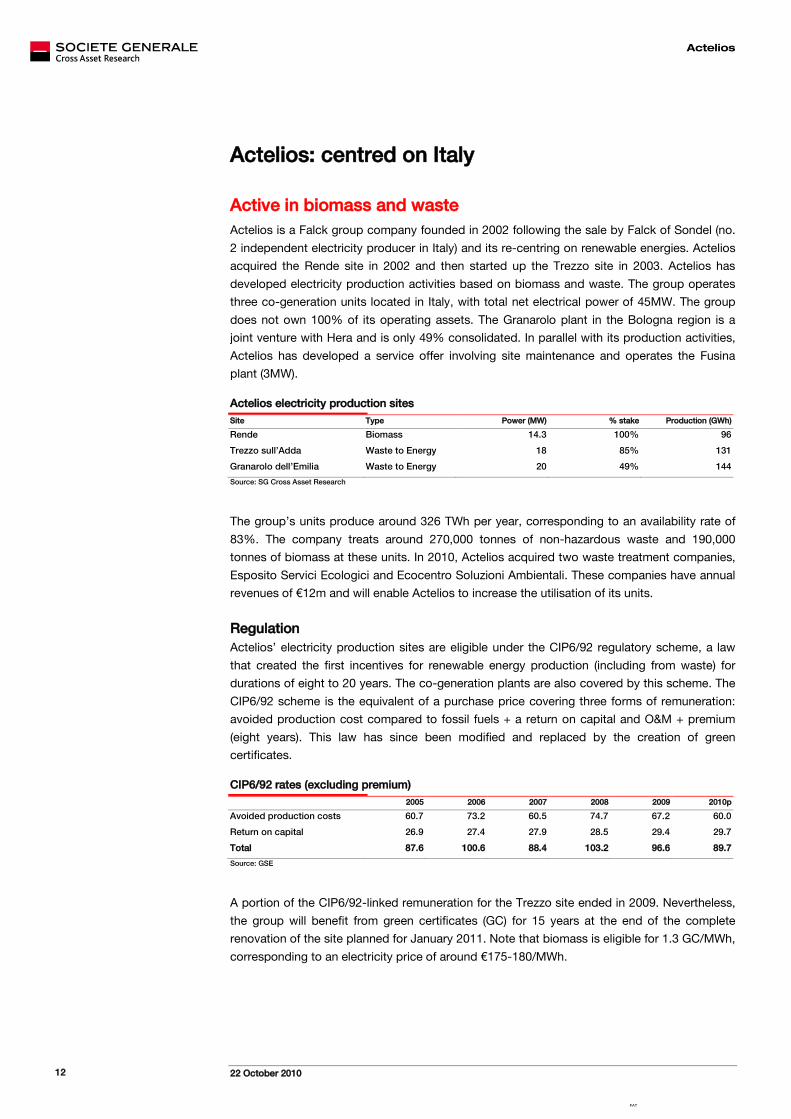
Active in biomass and waste Actelios is a Falck group company founded in 2002 following the sale by Falck of Sondel (no.
2 independent electricity producer in Italy) and its re-centring on renewable energies. Actelios
acquired the Rende site in 2002 and then started up the Trezzo site in 2003. Actelios has
developed electricity production activities based on biomass and waste. The group operates
three co-generation units located in Italy, with total net electrical power of 45MW. The group
does not own 100% of its operating assets. The Granarolo plant in the Bologna region is a
joint venture with Hera and is only 49% consolidated. In parallel with its production activities,
Actelios has developed a service offer involving site maintenance and operates the Fusina
plant (3MW).
Actelios electricity production sites
Site Type Power (MW) % stake Production (GWh)
Rende Biomass 14.3 100% 96
Trezzo sull’Adda Waste to Energy 18 85% 131
Granarolo dell’Emilia Waste to Energy 20 49% 144
Source: SG Cross Asset Research
The group’s units produce around 326 TWh per year, corresponding to an availability rate of
83%. The company treats around 270,000 tonnes of non-hazardous waste and 190,000
tonnes of biomass at these units. In 2010, Actelios acquired two waste treatment companies,
Esposito Servici Ecologici and Ecocentro Soluzioni Ambientali. These companies have annual
revenues of €12m and will enable Actelios to increase the utilisation of its units.
Regulation Actelios’ electricity production sites are eligible under the CIP6/92 regulatory scheme, a law
that created the first incentives for renewable energy production (including from waste) for
durations of eight to 20 years. The co-generation plants are also covered by this scheme. The
CIP6/92 scheme is the equivalent of a purchase price covering three forms of remuneration:
avoided production cost compared to fossil fuels + a return on capital and O&M + premium
(eight years). This law has since been modified and replaced by the creation of green
certificates.
CIP6/92 rates (excluding premium)
2005 2006 2007 2008 2009 2010p
Avoided production costs 60.7 73.2 60.5 74.7 67.2 60.0
Return on capital 26.9 27.4 27.9 28.5 29.4 29.7
Total 87.6 100.6 88.4 103.2 96.6 89.7
Source: GSE
A portion of the CIP6/92-linked remuneration for the Trezzo site ended in 2009. Nevertheless,
the group will benefit from green certificates (GC) for 15 years at the end of the complete
renovation of the site planned for January 2011. Note that biomass is eligible for 1.3 GC/MWh,
corresponding to an electricity price of around €175-180/MWh.
FAT
Actelios
22 October 2010 13
Expiration of CIP6/92 status at the Actelios sites
Site Type Regulation
Rende Biomass CIP6/92: 9MW expired in 2009; 3MW to expire in 2013
Trezzo sull’Adda Waste to Energy CIP6/92: 15MW to expire in 2014; 3MW to expire in 2017
Granarolo dell’Emilia Waste to Energy CIP6/92: 20MW to expire in 2018
Source: company
Development The Italian waste treatment market is dynamic, with an average annual growth rate of 7.1%
since 2002. Additionally, the application of the European directive 2008/98/EC should lead to
greater transformation of non-recyclable waste into electricity at incineration units. According
to Eurostat figures, Italy ranks among the EU countries with the lowest waste incineration rate
(25%), thereby creating market opportunities.
Actelios has several projects under development in the biomass, waste and PV solar areas. In
the biomass area, the group is restructuring its Rende site (14MW), which will come back on
line at the beginning of 2011. The site benefits from a 15-year PPA on the basis of market
prices + green certificate. The group is also planning the start-up of a new 15MW unit (8MW
consolidated) in H2 2013. Projects in the waste incineration area involve the existing Trezzo
and Granarolo sites, whose capacities could be doubled by 2014.
Development plans in the biomass and waste treatment areas (MW)
0
10
20
30
40
50
60
70
80
90
2009 Expansion 2014e
Biomass WTE
Source: SG Cross Asset Research
Looking beyond these projects, the company had three waste treatment-related projects
totalling 150MW in Sicily. These three projects came out of an agreement signed with the
Sicily region in 2003 that has since been cancelled (along with the authorisations). Legal
procedures are underway to attempt to recover the total of around €128m in sums invested.
FAT
Actelios
22 October 2010 14
Photovoltaic solar energy Actelios is a new entrant in the PV solar energy area with 1 MW of installed capacity. The
group has opted for an opportunistic approach in its development in solar energy, with a focus
exclusively on southern Italy. Note that the rate incentives for the development of PV solar
energy in Italy are highly favourable and that Actelios’ installations benefit from a rate of
€360/MWh plus the market price of electricity.
Actelios’ development in the PV solar energy area remains limited, with planned expansion to
27MW looking out to 2014. Develop is centred on Sicily.
Development in PV solar energy (MW)
12
13
16 27
0
5
10
15
20
25
30
Installed Under construction Authorised In dev elopment Total
Source: company data
FAT
Actelios
22 October 2010 15
Falck Renewables: an important player in wind energy
408 MW of wind energy capacity in Europe Falck Renewables was founded in 2002 by Willie Heller, the former CEO Edison Mission
Energy, with the backing of the Italian family holding company Gruppo Falck.
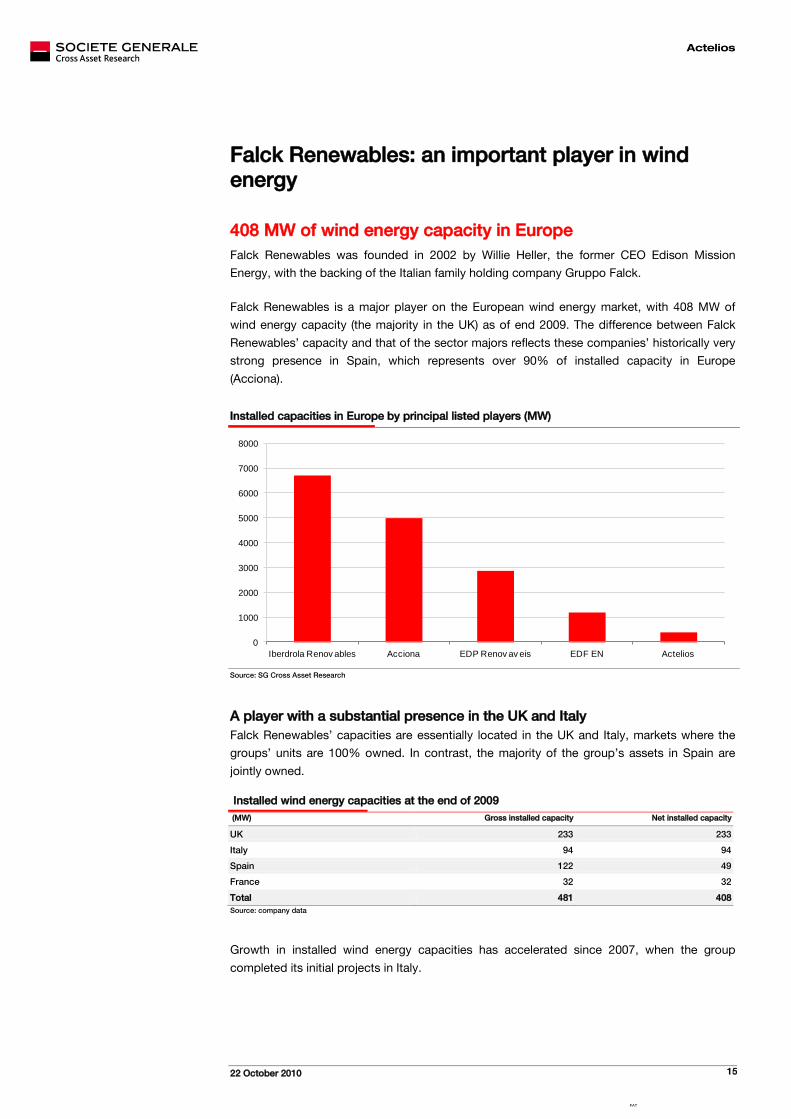
Falck Renewables is a major player on the European wind energy market, with 408 MW of
wind energy capacity (the majority in the UK) as of end 2009. The difference between Falck
Renewables’ capacity and that of the sector majors reflects these companies’ historically very
strong presence in Spain, which represents over 90% of installed capacity in Europe
(Acciona).
Installed capacities in Europe by principal listed players (MW)
0
1000
2000
3000
4000
5000
6000
7000
8000
Iberdrola Renov ables Acciona EDP Renov av eis EDF EN Actelios
Source: SG Cross Asset Research
A player with a substantial presence in the UK and Italy Falck Renewables’ capacities are essentially located in the UK and Italy, markets where the
groups’ units are 100% owned. In contrast, the majority of the group’s assets in Spain are
jointly owned.
Installed wind energy capacities at the end of 2009
(MW) Gross installed capacity Net installed capacity
UK 233 233
Italy 94 94
Spain 122 49
France 32 32
Total 481 408 Source: company data
Growth in installed wind energy capacities has accelerated since 2007, when the group
completed its initial projects in Italy.
FAT
Actelios
22 October 2010 16
Growth in installed capacities (MW)
48
106121
159
234
408
0
50
100
150
200
250
300
350
400
450
2004 2005 2006 2007 2008 2009
Source: company data
Development approach Falck Renewables bought its first wind parks, particularly in Spain with the stakes in the La
Muela and Cabezo wind parks. In the UK, the first wind park operated by the company, Cefn
Croes, was acquired in 2004. After this start-up phase, Falck Renewables has developed its
projects, in the majority of cases through co-development with partners, including RDC
Scotland (with which the company has developed its principal Scottish wind parks) and
Coriolis Energy. Falck Renewables has operated in the same manner in Italy, with for example
the development of the Budduso wind park in partnership with GeoPower. While Falck
Renewables also plans to develop projects on its own, we have not identified any such
projects at this point.
Project co-development
Phase ISite identification
+ Assesment
Phase IIIPre construction
Phase IVConstruction
Phase VOperation
Phase IIPermitting
Joint ownership with local partner Sole ownership by Falck Renewables
Local partner is lead Falck Renewables is lead
Buy-out of local partner
Source: SG Cross Asset Research
Note that in the wind energy sector, the earlier the control of the project development process,
the greater the value creation. The choice of co-development allows the trade-off between
value creation and development risks to be optimised.
FAT
Actelios
22 October 2010 17
Project portfolio Falck Renewables has a wind energy project pipeline totalling 1,540 MW at different stages of
development, including 340 MW authorised or under construction. Regarding the
development projects, the company has identified 280 MW with a high probability of success,
with the group having validated the wind energy potential and secured the location and
network access while identifying the specific risks involving the obtaining of permits.
Projects authorised and/or under construction (MW)
12020
200 340
0
50
100
150
200
250
300
350
400
UK France Italy Total
Source: company data
Development is taking place principally in those countries where the company is already
present, with the exception of Spain. However, the development focus is also turning to
Eastern Europe, where certain countries such as Poland offer both good wind conditions and
remuneration.
High probability project pipeline
80
80
50
70 280
0
50
100
150
200
250
300
UK France Italy Poland Total
Source: company data
Projects in development in France
Country Site Power (MW) Filing date
France Moulismes 16 October 2008
France Availles-Limouzine 14 November 2007
France Plonévez du Faou 23 January 2010
Source: company data
FAT
Actelios
22 October 2010 18
UK: favourable rate environment With 233 MW of installed capacity at the end of 2009, Falck Renewables is one of the
principal players in the UK, with around 7% of installed onshore MW.
Principal wind energy players in the UK (excluding offshore)
SSE26%
IBR25%
RWE9%
Falck7%
EDF EN5%
Others28%
Source: SG Cross Asset Research
Excellent wind conditions The UK wind energy market benefits from very good wind conditions. Average capacity
factors equal over 3,000 hours per year, corresponding to around 25% higher production
potential than the European average.
Capacity factors of installed wind parks in the UK
Park Power (MW) Capacity factor Hours
Ben AKetil 23 38.8% 3400
Boyndie 14 33.1% 2900
Earlsburn 37.5 36.5% 3200
Cefn Croes 58.5 32.0% 2800
Millenium 50 35.4% 3100
Kilbraur 47.5 34.2% 3000
Source: SG Cross Asset Research, company data
Favourable rate structure The UK wind energy market also benefits from an attractive rate structure. Wind energy
operators receive 1 ROC/ MWh produced, corresponding to £37.19/MWh for the 2009/2010
period + the market price of electricity (around £40-45/MWh) + the Buyout Fund
Premium corresponding to the difference between realised ROCs and those required to attain
renewable energy objectives + LEC (Levy Exempt Certificate), corresponding to a total of
around £103/MWh (€118/MWh). This is 40% higher than the average purchase price seen in
Europe. Nevertheless, the PPAs generally cover 90% of the theoretical value per MWh.
Theoretical price per wind energy MWH in the UK
Value (£/MWh) Value (€/MWh) Percentage of total
Average electricity price (1) 43.0 49.0 41.5%
Total renewable support (2) 60.54 69.0 58.5%
ROC 37.19 42.4 35.9%
Buyout Fund Premium 18.65 21.3 18.0%
LEC 4.7 5.4 4.6%
Total renewable electricity price (1) + (2) 103.54 118.0 100%
Source: SG Cross Asset Research
FAT
Actelios
22 October 2010 19
Wind conditions and rate structure: two highly favourable factors
These two factors make possible excellent profitability of close to 13% for installed assets,
above that of assets in continental Europe (with the notable exception of Italy).
Wind energy projects IRR as a function of electricity prices / capacity factors (construction cost: €1.6m/MW)
Capacity factor (hours) Electricity price (€/MWh)
2000 2400 2800 3200 3600
80 5% 7% 8% 10% 11%
90 6% 8% 10% 11% 12%
100 7% 9% 11% 12% 14%
110 8% 10% 12% 13% 15%
120 9% 11% 13% 15% 16%
130 10% 12% 14% 16% 17%
150 11% 14% 16% 18% 20%
180 14% 16% 19% 21% 23%
Source: SG Cross Asset Research
However, obtaining permits is increasingly difficult In contrast, obtaining construction permits for new wind energy projects remains a major
challenge, despite the stated ambitions of succeeding governments. For existing wind energy
parks, the average delay was around 30 months. Projects underway are already encountering
delays longer than this average. Unfortunately, the UK is not the only country where this trend
is being seen.
Delays in obtaining construction permits – existing parks
Park Application filing Authorisation date Delay
Ben AKetil October 2002 September 2005 35 months
Boyndie June 2003 July 2004 13 months
Earlsburn November 2003 June 2006 31 months
Millenium November 2003 June 2006 31 months
Kilbraur April 2004 October 2006 30 months
Source: SG Cross Asset Research, company
Delays in obtaining construction permits – projects underway
Park Application filing Authorisation date Delay
Dunbeath August 2005 2010 (appeal still possible) 60 months
Nutberry September 2006 Pending 48 months
Earlsburn North February 2008 Pending 32 months
Nigg Hill January 2008 Pending 33 months
Moor House April 2010 Pending 6 months
Source: SG Cross Asset Research, company
FAT
Actelios
22 October 2010 20
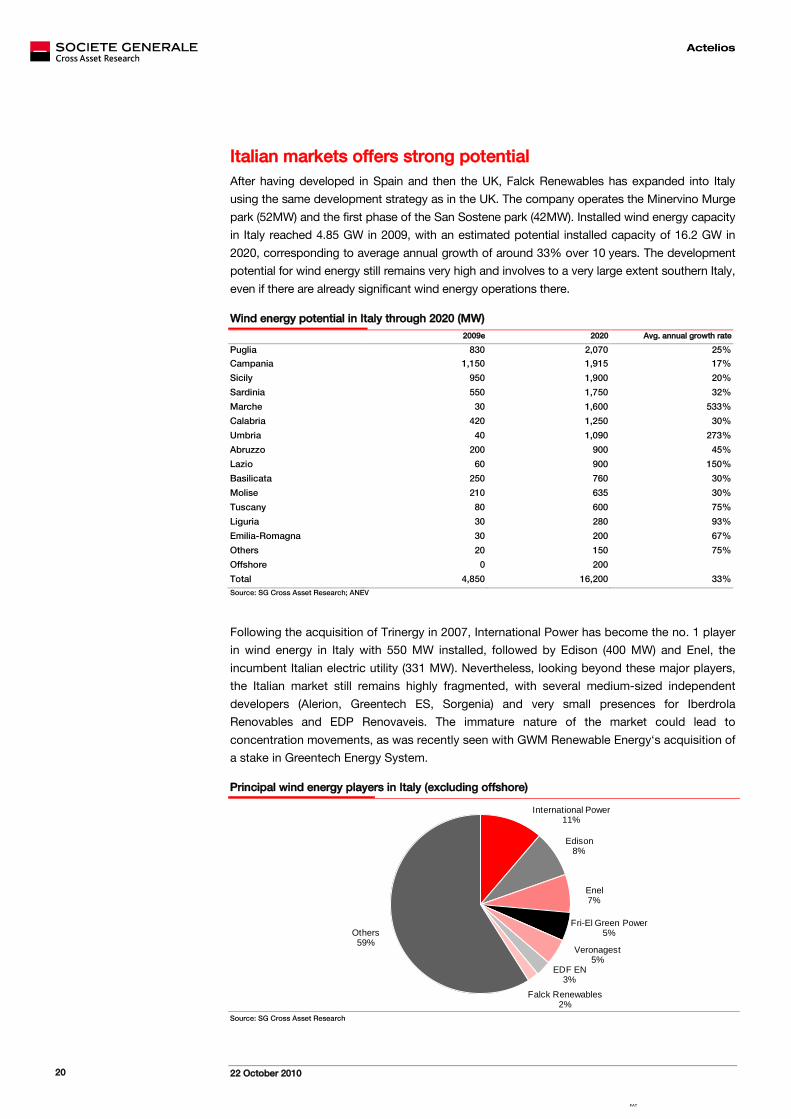
Italian markets offers strong potential After having developed in Spain and then the UK, Falck Renewables has expanded into Italy
using the same development strategy as in the UK. The company operates the Minervino Murge
park (52MW) and the first phase of the San Sostene park (42MW). Installed wind energy capacity
in Italy reached 4.85 GW in 2009, with an estimated potential installed capacity of 16.2 GW in
2020, corresponding to average annual growth of around 33% over 10 years. The development
potential for wind energy still remains very high and involves to a very large extent southern Italy,
even if there are already significant wind energy operations there.
Wind energy potential in Italy through 2020 (MW)
2009e 2020 Avg. annual growth rate
Puglia 830 2,070 25%
Campania 1,150 1,915 17%
Sicily 950 1,900 20%
Sardinia 550 1,750 32%
Marche 30 1,600 533%
Calabria 420 1,250 30%
Umbria 40 1,090 273%
Abruzzo 200 900 45%
Lazio 60 900 150%
Basilicata 250 760 30%
Molise 210 635 30%
Tuscany 80 600 75%
Liguria 30 280 93%
Emilia-Romagna 30 200 67%
Others 20 150 75%
Offshore 0 200
Total 4,850 16,200 33% Source: SG Cross Asset Research; ANEV
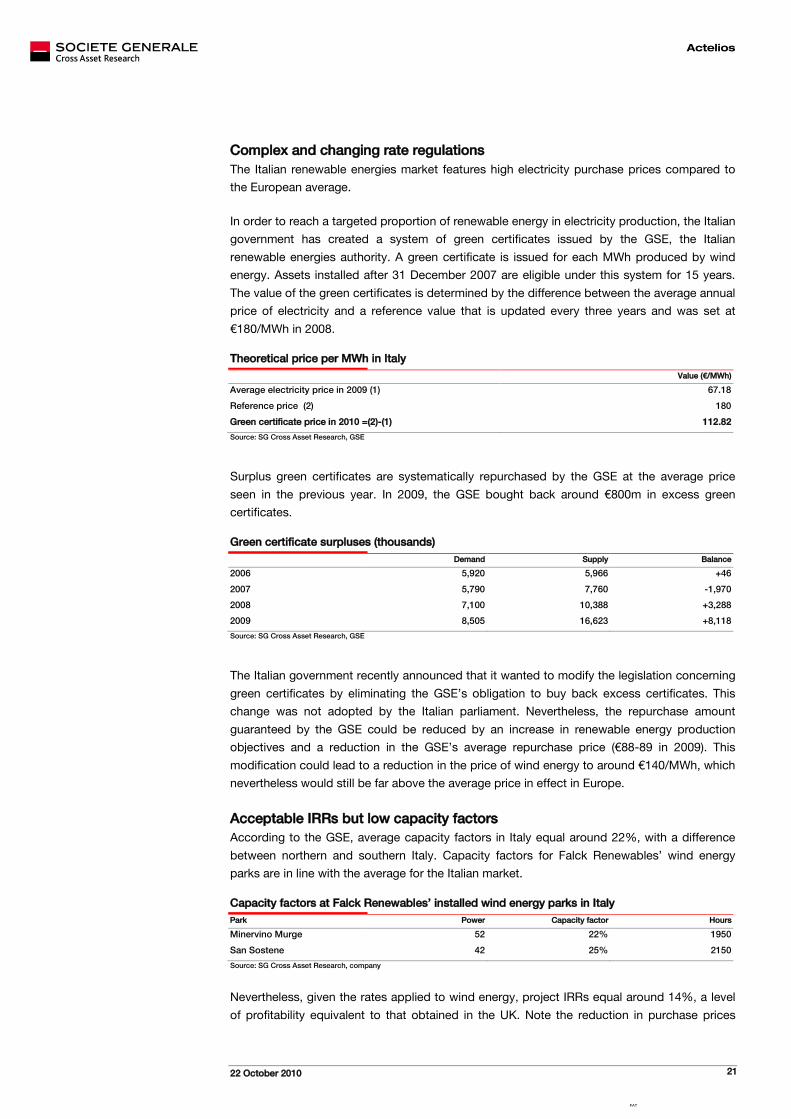
Following the acquisition of Trinergy in 2007, International Power has become the no. 1 player
in wind energy in Italy with 550 MW installed, followed by Edison (400 MW) and Enel, the
incumbent Italian electric utility (331 MW). Nevertheless, looking beyond these major players,
the Italian market still remains highly fragmented, with several medium-sized independent
developers (Alerion, Greentech ES, Sorgenia) and very small presences for Iberdrola
Renovables and EDP Renovaveis. The immature nature of the market could lead to
concentration movements, as was recently seen with GWM Renewable Energy‘s acquisition of
a stake in Greentech Energy System.
Principal wind energy players in Italy (excluding offshore)
International Power11%
Edison8%
Enel7%
Fri-El Green Power5%
Veronagest5%
EDF EN3%
Falck Renewables2%
Others59%
Source: SG Cross Asset Research
FAT
Actelios
22 October 2010 21
Complex and changing rate regulations The Italian renewable energies market features high electricity purchase prices compared to
the European average.
In order to reach a targeted proportion of renewable energy in electricity production, the Italian
government has created a system of green certificates issued by the GSE, the Italian
renewable energies authority. A green certificate is issued for each MWh produced by wind
energy. Assets installed after 31 December 2007 are eligible under this system for 15 years.
The value of the green certificates is determined by the difference between the average annual
price of electricity and a reference value that is updated every three years and was set at
€180/MWh in 2008.
Theoretical price per MWh in Italy
Value (€/MWh)
Average electricity price in 2009 (1) 67.18
Reference price (2) 180
Green certificate price in 2010 =(2)-(1) 112.82
Source: SG Cross Asset Research, GSE
Surplus green certificates are systematically repurchased by the GSE at the average price
seen in the previous year. In 2009, the GSE bought back around €800m in excess green
certificates.
Green certificate surpluses (thousands)
Demand Supply Balance
2006 5,920 5,966 +46
2007 5,790 7,760 -1,970
2008 7,100 10,388 +3,288
2009 8,505 16,623 +8,118
Source: SG Cross Asset Research, GSE
The Italian government recently announced that it wanted to modify the legislation concerning
green certificates by eliminating the GSE’s obligation to buy back excess certificates. This
change was not adopted by the Italian parliament. Nevertheless, the repurchase amount
guaranteed by the GSE could be reduced by an increase in renewable energy production
objectives and a reduction in the GSE’s average repurchase price (€88-89 in 2009). This
modification could lead to a reduction in the price of wind energy to around €140/MWh, which
nevertheless would still be far above the average price in effect in Europe.
Acceptable IRRs but low capacity factors According to the GSE, average capacity factors in Italy equal around 22%, with a difference
between northern and southern Italy. Capacity factors for Falck Renewables’ wind energy
parks are in line with the average for the Italian market.
Capacity factors at Falck Renewables’ installed wind energy parks in Italy
Park Power Capacity factor Hours
Minervino Murge 52 22% 1950
San Sostene 42 25% 2150
Source: SG Cross Asset Research, company
Nevertheless, given the rates applied to wind energy, project IRRs equal around 14%, a level
of profitability equivalent to that obtained in the UK. Note the reduction in purchase prices
FAT
Actelios
22 October 2010 22
following a regulatory change would lower the IRR to around 10-11%, a level that would still
allow continued investments under acceptable profitability conditions.
Wind energy project IRR as a function of electricity prices / capacity factors (construction cost: €1.6m/MW)
Capacity factor (hours) Price of electricity (€/MWh)
2000 2400 2800 3200 3600
80 5% 7% 8% 10% 11%
90 6% 8% 10% 11% 12%
100 7% 9% 11% 12% 14%
110 8% 10% 12% 13% 15%
120 9% 11% 13% 15% 16%
130 10% 12% 14% 16% 17%
150 11% 14% 16% 18% 20%
180 14% 16% 19% 21% 23%
Source: SG Cross Asset Research
FAT
Actelios
22 October 2010 23
Revenues: growth driven by wind energy
Around 1.1 GW of capacities in 2014 Based on development projects underway, we estimate that Actelios could reach 1,138 MW in
production capacity looking out to 2014. The majority of development will involve the
realisation of Falck Renewables’ wind energy projects, which should represent 90% of
additional capacities over 2009-2014e. As we have seen, development in PV solar energy is
opportunistic based on the rate structure in Italy. Finally, despite the expected growth on the
waste treatment market and needs in the biomass area, Actelios has adopted a prudent
approach to these expansion projects given the required investments and problems
encountered. In total, we estimate installed capacities in 2014e at 1,138 MW, including 1,022
MW in wind energy. Average annual growth in wind energy capacities is estimated at 20%
over 2009-2014 compared to 50% over 2006-2009. As wind energy development is focussed
on Italy and the UK, these two countries should represent 75% of installed assets in 2014e.
Forecast growth in installed capacities (MW) Forecast growth in wind energy capacities (MW)
0
200
400
600
800
1000
1200
2009 2010e 2011e 2012e 2013e 2014e
Wind Biomass WTE Solar
0
200
400
600
800
1000
1200
2009 2010e 2011e 2012e 2013e 2014e
Other France UK Italy Spain
408472
596732
872
1022
Source: SG Cross Asset Research Source: SG Cross Asset Research
Revenues to double by 2014 We are forecasting revenues close to €384m in 2014, corresponding to double the 2009 pro
forma revenues. Based on the 2009 pro forma accounts, average annual revenue growth
should equal nearly 16%.
Forecast Actelios revenues (€m) Forecast revenues by segment (€m)
185.2202.3
243.7276.6
318.2
383.7
0
50
100
150
200
250
300
350
400
450
2009pf 2010e 2011e 2012e 2013e 2014e
0
50
100
150
200
250
300
350
400
450
2009pf 2010e 2011e 2012e 2013e 2014e
Electricity Services
Source: Company; estimates from SG Cross Asset Research Source: SG Cross Asset Research
FAT
Actelios
22 October 2010 24
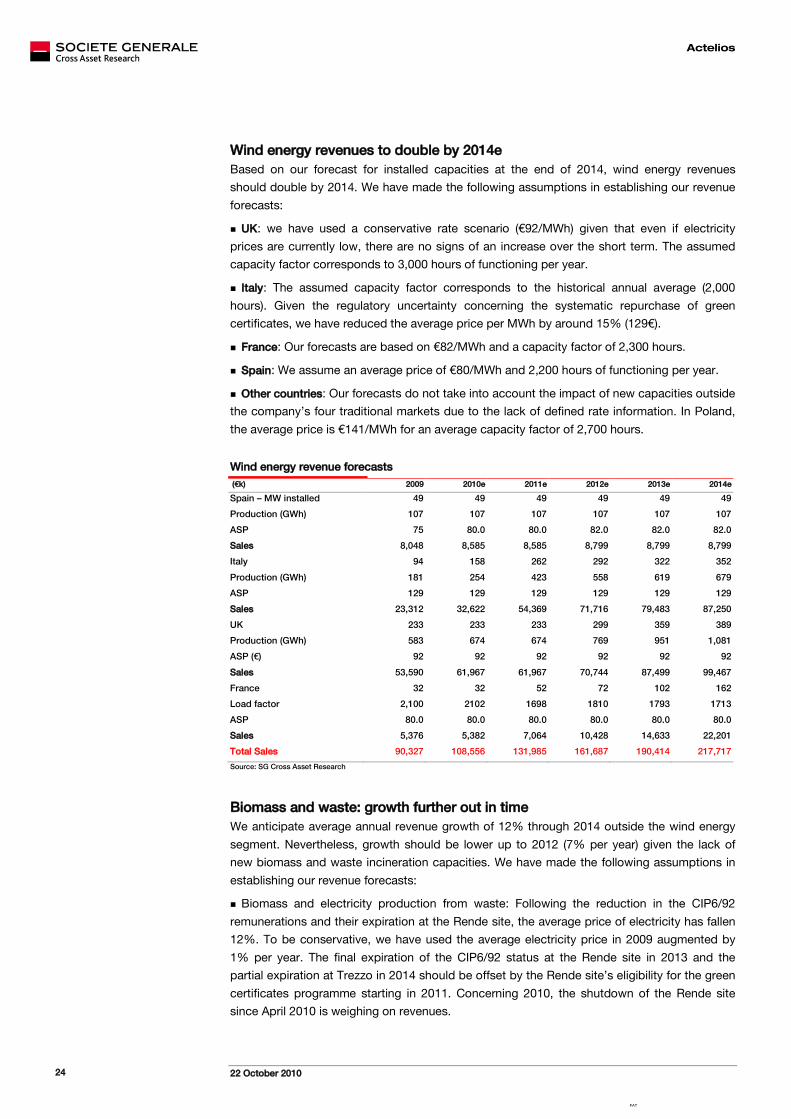
Wind energy revenues to double by 2014e Based on our forecast for installed capacities at the end of 2014, wind energy revenues
should double by 2014. We have made the following assumptions in establishing our revenue
forecasts:
UK: we have used a conservative rate scenario (€92/MWh) given that even if electricity
prices are currently low, there are no signs of an increase over the short term. The assumed
capacity factor corresponds to 3,000 hours of functioning per year.
Italy: The assumed capacity factor corresponds to the historical annual average (2,000
hours). Given the regulatory uncertainty concerning the systematic repurchase of green
certificates, we have reduced the average price per MWh by around 15% (129€).
France: Our forecasts are based on €82/MWh and a capacity factor of 2,300 hours.
Spain: We assume an average price of €80/MWh and 2,200 hours of functioning per year.
Other countries: Our forecasts do not take into account the impact of new capacities outside
the company’s four traditional markets due to the lack of defined rate information. In Poland,
the average price is €141/MWh for an average capacity factor of 2,700 hours.
Wind energy revenue forecasts
(€k) 2009 2010e 2011e 2012e 2013e 2014e
Spain – MW installed 49 49 49 49 49 49
Production (GWh) 107 107 107 107 107 107
ASP 75 80.0 80.0 82.0 82.0 82.0
Sales 8,048 8,585 8,585 8,799 8,799 8,799
Italy 94 158 262 292 322 352
Production (GWh) 181 254 423 558 619 679
ASP 129 129 129 129 129 129
Sales 23,312 32,622 54,369 71,716 79,483 87,250
UK 233 233 233 299 359 389
Production (GWh) 583 674 674 769 951 1,081
ASP (€) 92 92 92 92 92 92
Sales 53,590 61,967 61,967 70,744 87,499 99,467
France 32 32 52 72 102 162
Load factor 2,100 2102 1698 1810 1793 1713
ASP 80.0 80.0 80.0 80.0 80.0 80.0
Sales 5,376 5,382 7,064 10,428 14,633 22,201
Total Sales 90,327 108,556 131,985 161,687 190,414 217,717
Source: SG Cross Asset Research
Biomass and waste: growth further out in time We anticipate average annual revenue growth of 12% through 2014 outside the wind energy
segment. Nevertheless, growth should be lower up to 2012 (7% per year) given the lack of
new biomass and waste incineration capacities. We have made the following assumptions in
establishing our revenue forecasts:
Biomass and electricity production from waste: Following the reduction in the CIP6/92
remunerations and their expiration at the Rende site, the average price of electricity has fallen
12%. To be conservative, we have used the average electricity price in 2009 augmented by
1% per year. The final expiration of the CIP6/92 status at the Rende site in 2013 and the
partial expiration at Trezzo in 2014 should be offset by the Rende site’s eligibility for the green
certificates programme starting in 2011. Concerning 2010, the shutdown of the Rende site
since April 2010 is weighing on revenues.
FAT
Actelios
22 October 2010 25
PV solar energy: Based on the increase in installed capacities, we assume a capacity factor
of 1,400 hours per year and an average electricity price down 10% per year.
Waste treatment: The group treats around 270-275,000 metric tons per year at an average
price of €96/t. Looking beyond the acquisition of two companies in 2010, which should
increase the quantities treated to around 390-395 kt in 2011, we assume that the average
Attributable net income (€m) 20.2 19.1 22.0 23.8 27.9 39.1
% change NA -5.5% 15% 8% 17% 40%
Source: SG Cross Asset Research
FAT
Actelios
22 October 2010 28
A sound financial structure Actelios’ activities generate sufficient operating cash flow to finance investments and pay
dividends. In contrast, Falck Renewables’s growth plan will consume financial resources (as is
the case for all of its competitors). While Actelios alone had a limited growth outlook, the
combination of the two entities will enable them to benefit from Actelios’ cash in order to
finance growth. Additionally, the new group’s financial risks should be limited.
Forecast cash flow (€k)
-500
-400
-300
-200
-100
0
100
200
2009pf 2010e 2011e 2012e 2013e 2014e
Operating cash f low Inv estments Free cash f low
Source: SG Cross Asset Research
Nevertheless, the group should consume financial resources over the entire period in question
and its debt should increase substantially. We estimate that net debt will reach €1.3bn in 2014e.
While this tripling in debt is significant, the net debt / equity ratio should equal 3.3x in 2014e.
This ratio does not appear particularly strained, particularly given that financing will principally be
in the form of project financing. The net debt / EBITDA ratio is more pertinent and should equal
6.4x in 2014e, in line with ratios at the principal wind energy players. Among the project
financing covenants, the DSCR (Debt service coverage ratio) enables the measurement of the
risk concerning the debt. The DSCR corresponds to the ratio between EBITDA and the annual
cost of debt plus annual depreciation charges. In the case of project financing, the DSCR must
be 1x to avoid breaches of covenants. In the case of Actelios, based on debt with average
maturity of 12 years, the DSCR is systematically above 1x despite slight erosion at the end of the
period linked to investments in incineration and biomass capacities.
Net debt and debt ratio Debt service coverage ratio
4.5
5.0
5.5
6.0
6.5
7.0
0
200
400
600
800
1000
1200
1400
1600
2010e 2011e 2012e 2013e 2014e
Net debt (lhs)
Net debt/Ebitda (rhs)
1.0
1.1
1.2
1.3
1.4
1.5
2010e 2011e 2012e 2013e 2014e
Source: SG Cross Asset Research Source: SG Cross Asset Research
FAT
Actelios
22 October 2010 29
Financing of growth: a useful but not obligatory capital increase While the financial structure of the new consolidated ensemble appears solid, it should be
noted that project financing places restrictions on cash resources given that cash flows
generated by projects guarantee project debt. Available cash flows on the holding level are
therefore limited. This could act to limit the capacity for investment. Based on an investment
programme of €1.2bn and leverage of 80%, the group must contribute €240m in cash.
Cash movements to finance growth
Capital financing
Actelios SpA(parent company )
Stake 1 Stake 2
Project
Div idend f lows
Div idend f lows
Projectf inancing
Source: SG Cross Asset Research
Actelios had around €200m in cash at the end of 2009. The €130m capital increase planned in
2010 will lift its cash reserves to €330m, sufficient to finance the growth programme through
2014 and pay a dividend. Excluding project financing, the group’s gross debt equals around
€300m, corresponding to around 3x EBITDA. This limits the refinancing risk concerning the
bank debt.
FAT
Actelios
22 October 2010 30
Target price of €3.0
Calculation of the target price and fundamental valuation Selecting a valuation method for a fast growing company in an investment phase is always
difficult. We have selected four complementary valuation methods: 1) sum of the parts, 2) free
cash flow yield over the medium term, 3) stock market comparisons, and 4) DCF method. Our
benchmark method is the sum of parts, which leads to a valuation of €4.1 per share. However,
renewable energy developers currently trade at a discount of around 25% to their sum of the
parts valuations. We have applied this discount to Actelios to arrive at a target price of €3.0 per
share indicating upside potential of over 30%.
Summary of our valuation methods
Method Theoretical valuation (€/sh) Comments
Sum of the parts 4.1 Our benchmark method
FCF yield 2.6 Normalised valuation approach
Stock market comparisons 3.0 Based on EV/EBITDA multiples
DCF 3.2 Validation of the SOP Source: SG Cross Asset Research
Sum-of-the-parts: €4.1 per share We detail below the assumption underlying our sum-of-the-parts model, which gives a
valuation (before stock market discount) of €4.1 per share. For the wind energy segment, we
have made the following assumptions:
Valuation of installed MWs at the end of 2010e. The valuation depends on the geographical
location of assets.
We have assumed a terminal value for operating assets given that the lifespan of
installations is theoretical greater than the PPA. In total, the terminal value equals around 10-
15% of the total value of assets.
As with all Actelios’ peers, we do not value the project portfolio. Only assets under
construction are included in the valuation.
For the other assets, we have made the following assumptions:
The solar energy assets are valued on the basis of 1,400 hours per year at an average rate
of €280/MWh and an EBITDA margin of 82%. We obtain a valuation of €3.8m/MW without
terminal value.
The incineration assets are valued around €1.5m/MW, which corresponds to the residual
value of the CIP6/92 status. Beyond this, the units will sell their electricity at the market price.
The Rende biomass production site is valued at €5m/MW given its rehabilitation and
eligibility for the green certificates programme, which will assure an average remuneration of
€140-150/MWh over the next 15 years.
The minority interests are taken into account in the valuation of 85% of Trezzo.
The year-end 2010 net debt is used.
The number of shares used is 161.9 million, corresponding to the number of shares
following the merger of the two companies.
FAT
Actelios
22 October 2010 31
Sum-of-the-parts valuation
Activity Comments EV/EBITDA Value (€m) € per share
in %
Total wind energy 12.4 1,106 6.8 89%
Wind energy - UK 233 MW @ €2.5m per MW 583 3.6 47%
Wind energy - Spain 49 MW @ €1.6m per MW 78 0.5 6%
Wind energy - Italy 158 MW @ €2.2m per MW 348 2.1 28%
Wind energy - France 32 MW @ €1.5m per MW 48 0.3 4%
Assets under construction 124 MW @ €0.4m per MW 50 0.3 4%
Biomass and incineration 3.5 120 0.7 10%
Incineration 25 MW @ €1.6m per MW 40 0.2 3%
Biomass 14 MW @ €5.7m per MW 80 0.5 6%
PV solar 3 MW @ €3.8m per MW 11 0.1 1%
Other projects 20% of projects totalling 1,200 MW @ €0.0m per MW
0 0.0 0%
Enterprise value 12.5 1,237 7.6 100%
Net debt end 2010e -575 -3.6
Provisions end 2010e -3 0.0
Total net 659 4.1
Source: SG Cross Asset Research
Normalised Free Cash Flow: €2.6 In order to model the impact of planned investments, we have used a valuation method starting
in a period when investments are normalised, i.e. 2015. We assume a 10% increase in operating
cash flow compared to 2014 in order to reflect the impact of investments made in 2014 and a
Adjustments are made to take into account the value of Falck Renewables’ assets
FAT
Actelios
22 October 2010 34
Sensitivity analysis
WACC (%)
8.21% 8.71% 9.21% 9.71% 10.21%
CF perpetuity growth rate (%)
1.0% 3.60 3.07 2.62 2.22 1.88
1.5% 3.96 3.37 2.87 2.43 2.06
2.0% 4.38 3.71 3.15 2.67 2.26
2.5% 4.87 4.11 3.48 2.94 2.49
3.0% 5.45 4.58 3.86 3.26 2.75
Source: SG Cross Asset Research
Sum-of-the-parts valuation sensitivity analysis Impact of the valuation of the development pipeline We have seen that our sum-of-the-parts valuation is determined by the valuation of installed
assets. The principal factor that could influence this valuation is the valuation of wind energy
projects. In effect, our sum-of-the-parts valuation does not value the portfolio of wind energy
projects under development. While this approach is conservative, it reflects the approach
adopted by the market. The partial or total valuation of the development pipeline would
potentially boost the valuation by 10-20%.
Sensitivity of the SOP to the valuation of the development pipeline
Base valuation Partial pipeline Total pipeline
Description MW installed + under construction
MW installed + under construction + authorised
MW installed + under construction + authorised +
development Power 124 340 1,540
Valuation of the pipeline (€m) 50 115 175
SOP / share (€) 4.1 4.5 4.8
Source: SG Cross Asset Research
Impact of regulatory risk We have also seen that the reduction in the value of green certificates (GC) received in
connection with the Italian wind energy assets could have a negative impact of 15-20% on
2012-2014 EBITDA. In the sum of the parts valuation, this scenario would reduce the valuation
per wind energy MW in Italy. Based on €70/MWh (the price of electricity without subsidies),
the valuation per wind energy MW in Italy would equal €1.3m/MW, corresponding to a sum-of-
the-parts valuation of €3.2 per share. Applying a 25% discount, the target price could fall to
€2.4 per share. Note that the valuation by stock market comparisons incorporating this
scenario equals €2.0.
Impact of the value of green certificates on the valuation of Actelios
Valuation with GC Valuation without GC
Valuation of Italian wind energy assets (€m/MW) 2.2 1.3
Group EV (€m) 1,237 1,094
Valuation / share (€) 4.1 3.2
Source: SG Cross Asset Research
The DCF method is extremely sensitive to discounting parameters, largely reducing its usefulness in practice.
FAT
Actelios
22 October 2010 35
APPENDIX ANALYST CERTIFICATION Each author of this research report hereby certifies that (i) the views expressed in the research report accurately reflect his or her personal views about any and all of the subject securities or issuers and (ii) no part of his or her compensation was, is, or will be related, directly or indirectly, to the specific recommendations or views expressed in this report: Didier Laurens. IMPORTANT DISCLOSURES EDF SG acted as joint bookrunner in EDF's bond issue (4.625% 26/04/30 EUR). Enel SG makes a market in Enel warrants Enel SG was participating in a medium-term bank loan to Enel Rete Gas for the operation of disposal by Enel of its
majority stake. Enel SG acted as bookrunner in Enel's senior high grade bond issue (4% 14/09/16 EUR, 5% 14/09/22 EUR, 5.625%
14/08/24 GBP, 5.75% 14/09/40 GBP). HERA SG acted as joint bookrunner in Hera's bond issue (4.5% 03/12/19 EUR). T-Solar SG acted as joint bookrunner in Grupo T-Solar's IPO. Total SG acted as exclusive financial advisor to Total for a disposal project.
SG and its affiliates beneficially own 1% or more of any class of common equity of Iberdrola. SG or its affiliates act as market maker or liquidity provider in the equities securities of E.ON, ENDESA SA, Enel, Iberdrola, Iberdrola Renovables, Total. SG or its affiliates expect to receive or intend to seek compensation for investment banking services in the next 3 months from EDF, ENDESA SA, Enel, Iberdrola, Total. SG or its affiliates have received compensation for investment banking services in the past 12 months from EDF, Enel, HERA, T-Solar, Total. SG or its affiliates managed or co-managed in the past 12 months a public offering of securities of EDF, Enel, HERA, T-Solar.
This research report was written by a non-US research analyst who is not an associated person of a FINRA member, who is not registered/qualified as a research analyst under FINRA Rules and who may not be subject to the FINRA restrictions on communications with a subject company, public appearances and trading securities held in the research analyst(s)’ account(s).
IMPORTANT DISCLAIMER: Société Générale (“SG”) does and seeks to do business with companies covered in research reports. Investors should be aware that the firm may have a conflict of interest that could affect the objectivity of this research report. Investors should consider this research report as only a single factor in making their investment decision. The information herein is not intended to be an offer to buy or sell, or a solicitation of an offer to buy or sell, any securities and including any expression of opinion, has been obtained from, or is based upon, sources believed to be reliable but is not guaranteed as to accuracy or completeness. SG, and their affiliated companies in the SG Group, do, from time to time, deal, trade in, profit from, hold, act as market-makers or advisers, brokers or bankers in relation to the securities, or derivatives thereof, of persons, firms or entities mentioned in this document or be represented on the board of such persons, firms or entities. SG, and their affiliate companies in the SG Group, do, from time to time, act as a principal trader in debt securities that may be referred to in this report and may hold debt securities positions. Employees of SG, and their affiliated companies in the SG Group, or individuals connected to them, other than the authors of this report, may from time to time have a position in or hold any of the investments or related investments mentioned in this document. However, each author of this report is not permitted to trade in or hold any of the investments or related investments which are the subject of this document, unless such holding is specifically disclosed. SG, and their affiliated companies in the SG Group, are under no obligation to disclose or take account of this document when advising or dealing with or on behalf of customers. The views of SG reflected in this document may change without notice. To the maximum extent possible at law, SG does not accept any liability whatsoever arising from the use of the material or information contained herein. This research document is not intended for use by or targeted to retail customers. Should a retail customer obtain a copy of this report they should not base their investment decisions solely on the basis of this document and must seek independent financial advice. Important notice: The circumstances in which materials provided by SG Fixed Income (Credit) & Forex Research, SG Commodity Research, SG Convertible Research and SG Equity Derivatives Research have been produced are such (for example because of reporting or remuneration structures or the physical location of the author of the material) that it is not appropriate to characterise it as independent investment research as referred to in European MiFID directive and that it should be treated as a marketing material even if it contains a research recommendation (“recommandation d’investissement à caractère promotionnel”). However, it must be made clear that all publications issued by SG will be clear, fair, and not misleading. Notice to French Investors: This publication is issued in France by or through Société Générale ("SG") which is authorised by the CECEI and regulated by the AMF (Autorité des Marchés Financiers). Notice to UK investors: This publication is issued in the United Kingdom by or through Société Générale ("SG") London Branch which is regulated by the Financial Services Authority ("FSA") for the conduct of its UK business. Notice to US Investors: For purposes of SEC Rule 15a-6, SG Americas Securities LLC (“SGAS”) takes responsibility for this research report. This report is intended for institutional investors only. Any US person wishing to discuss this report or effect transactions in any security discussed herein should do so with or through SGAS, a broker-dealer registered with the SEC and a member of FINRA, 1221 Avenue of the Americas, New York, NY 10020. (212)-278-6000. Notice to Japanese Investors: This report is distributed in Japan by Société Générale Securities (North Pacific) Ltd., Tokyo Branch, which is regulated by the Financial Services Agency of Japan. The products mentioned in this report may not be eligible for sale in Japan and they may not be suitable for all types of investors. Notice to Australian Investors: Société Générale Australia Branch (ABN 71 092 516 286) (SG) takes responsibility for publishing this document. SG holds an AFSL no. 236651 issued under the Corporations Act 2001 (Cth) ("Act"). The information contained in this newsletter is only directed to recipients who are wholesale clients as defined under the Act. IMPORTANT DISCLOSURES: Please refer to our websites: http://www.sgresearch.com/compliance.rha http://www.sgcib.com. Copyright: The Société Générale Group 2010. All rights reserved.