+ All Categories
Home > Documents > 2/2012 - Home | C-MICRO

2/2012 - Home | C-MICRO

Date post: 16-Jan-2022
Category:
Upload: others
View: 1 times
Download: 0 times
Share this document with a friend
29
CENTER FOR APPLIED MICROECONOMICS Maria Carolina Leme Paula Louzano Vladimir Ponczek André Portela 2/2012 Working Paper The Impact of Structured Teaching Methods on the Quality of Education in Brazil March 2012
Transcript

CENTER FOR APPLIED MICROECONOMICS

Maria Carolina LemePaula LouzanoVladimir Ponczek André Portela

2/2012

WWoorrkkiinngg PPaappeerr

The Impact of Structured Teaching Methods onthe Quality of Education in Brazil

March 2012

The Impact of Structured Teaching Methods on the Quality of

Education in Brazil*

Maria Carolina da Silva Leme São Paulo School of Economics-Getúlio Vargas Foundation

Paula Louzano Department of Education – University of São Paulo

Vladimir Ponczek São Paulo School of Economics-Getúlio Vargas Foundation

André Portela Souza São Paulo School of Economics-Getúlio Vargas Foundation

March 2012

Abstract

This paper estimates the impact of the use of structured methods on the quality of

education for students in primary public school in Brazil. Structured methods encompass a

range of pedagogical and managerial instruments applied in the educational system. In

recent years, several municipalities in the state of São Paulo have contracted out private

educational providers to implement these structured methods in their schooling systems.

Their pedagogical proposal involves structuring of curriculum content, development of

teacher and student textbooks, and the training and supervision of teachers and instructors.

Using a difference-in-differences estimation strategy, we find that the fourth- and eighth-

grade students in the municipalities with structured methods performed better in Portuguese

and mathematics than did students in municipalities not exposed to these methods. We find

no differences in passing rates. However, we are unable to rule out of possibility that

unobservable characteristics are driving this results.

JEL Codes: I21, I28.

Keywords: quality of education, structured methods, Brazil.

* We thank research assistants Ana Bonomi and Márcio Kameoka , UNDIME, Municipal Education

Bureaus in the state of São Paulo, to COC, and Objetivo for the information provided. This study is part of

the 33/2007 agreement between the Educational Development Studies Network and INEP-MEC. The

opinions in this article are those of the researchers. All remained mistakes are ours.

2

I. Introduction

The quality of education in Brazil is low according to several international

comparisons. For instance, Brazil ranked 53rd in mathematics proficiency among all 57

participating countries on the 2006 PISA Exam.1 In an attempt to overcome this

disadvantage, several policies have been adopted over the last fifteen years. Among the

strategies espoused, the decentralization of educational systems was pervasive. The states

transferred control of the primary school systems to the municipalities2. In some states, the

municipalities now have the freedom to choose the pedagogical material that they teach and

part of the curriculum content based on federal regulations. This autonomy includes the

possibility of contracting educational services to private organizations. Particularly

important for our purposes are some agreements in which private institutions are contracted

to develop and provide textbooks for the students, pedagogical materials for the teachers

that systematize classes, homework materials and answer keys, etc. The private firms also

coach the teachers on the use of these materials. In the state of São Paulo during the last ten

years, around one third of the municipalities have hired private institutions that have

provided what has become known as structured teaching methods for the public system.

The purpose of this paper is to estimate the impact of structured teaching methods

on the proficiency of students in the municipal school system in the state of São Paulo. The

evaluation of this effect is relevant in itself for policy-making purposes. This is the first

attempt to gauge the impact on proficiency of this institutional innovation. Moreover, this

study is applicable to a wider field of interest in the economics of education with respect to

at least two specific topics: (i) the debate regarding private vs. public school management;

and (ii) the discussion of the relevance of inputs in the school production function.

The novelty of this Brazilian experience is the development of a private market for

structured teaching methods as demanded by the public sector. Although there is no

1 See PISA (2006).

2 For more details about the decentralization of the Educational System in Brazil, see Madeira (2008) and

Leme et al (2009).

3

competition between municipal public schools, there is competition between private

institutions to develop and provide structured methods to the municipal public school

system. The use of the private system in public schools is not new. The existence of charter

schools in the U.S., which became popular with some policymakers because they seem to

share the benefits of private competition without sacrificing government control and

supervision, may represent such a system. Charter schools include both public and private

elements. On one hand, they are allowed independent development and decision-making.

On the other hand, they are publicly financed, and the state is accountable for their

performance3. Like charter schools, the schools in municipalities that use the structured

teaching methods in Brazil are publicly funded and supervised but privately managed in

terms of pedagogical and curricular decisions. However, they are broader than charter

schools in the sense that they cover all public schools under the control of the municipality

in question. Thus, there is no competition between “public” and “charter” schools within

the municipality. However, in another sense, they are more restrictive because the

decision-making power of the private institution is limited to pedagogical and curricular

choices, including teacher coaching. Such a firm will not be able to make human resource

allocation decisions such as those regarding the hiring and firing of teachers and principals

or even the assignment of particular individuals to particular schools. These decisions are

under the public authority of the municipality.

Recently, a debate has emerged regarding the impact of charter schools on student

performance in the U.S. The results are mixed. Bettinger (2005) finds no difference in the

mathematics and reading test score gains among 4th

graders at charter and neighboring

public schools in Michigan. Booker et al. (2007) find that students experience low test

score growth in the first year in charter schools but that this period is followed by a catch-

up period in the subsequent two to three years as compared to their expected performance

in traditional public schools in Texas. Indeed, Carruthers (2010) shows that student

proficiency is greater among more experienced charter schools. Ni (2009) finds that the

introduction of charter competition negatively impacted student performance and school

efficiency in traditional public schools in Michigan. Zimmer et al. (2011) find no different

3 For a discussion of the advantages and shortcomings of charter schools see, e.g., Geske et al. (1997).

4

performance between students of charter and traditional public schools across seven states

in the U.S. However, Hoxby and Muraka (2009), taking advantage of the random selection

of charter school students in New York City, find a positive effect of charter schools on the

mathematics and reading performance of third to eighth graders. Moreover, there is some

evidence that charter schools enhance competition among public schools. Brooker et al.

(2008) find a positive and significant impact of charter school district penetration on the

achievements of traditional public school students in Texas. Dee and Fu (2004) show that

pupil-teacher ratios in traditional public schools in Arizona increased after the introduction

of charter schools. Hanushek et al. (2007) find that the relationship between the probability

of exiting school and school quality is more acute for charter schools than for traditional

public schools in Texas.

This paper also has relevance for the literature on the effectiveness of school inputs.

The international evidence on the impact of school inputs on student outcomes, and

particularly on the provision of pedagogical material, is ambiguous. Early studies, surveyed

by Lockheed and Hanushek (1987), show that textbook provision was, on average, the most

cost-effective program as compared to teacher training, interactive radio, technical schools,

peer tutoring and cooperative learning in some developing countries. The World Bank

(2002) reports similar studies; in the Philippines, the provision of multilevel material

combined with parent and teacher partnerships had a positive impact, reducing drop-out

rates and improving test scores. It also proved to be more cost-effective than the provision

of textbooks alone. In Nicaragua, a textbook provision program that included monitoring of

their use in the classroom had a positive effect on student scores but was less effective than

a radio instructional program. A more recent study in Kenya reported on by Glewwe,

Kremer, and Moulin (2007) shows that the provision of textbooks had a positive impact

only on the performance of the top students. The impact of in-service teacher training on

student performance is also ambiguous. Angrist and Lavy (2002) show that in-service

training in Jerusalem improved the test scores of elementary public schools students and

was more cost-effective than reducing class size or lengthening the school day. On the

other hand, Jacob and Lefgren (2002) find no impact of marginal increases in in-service

teacher training on the performance of students in the Chicago public school system. These

results taken together seem to indicate that combined policies are more effective than

5

isolated ones, and this is the central feature of the structured teaching methods analyzed in

this study. Curricular organization, the provision of pedagogical material and teacher

training are joint components of the structured method programs.

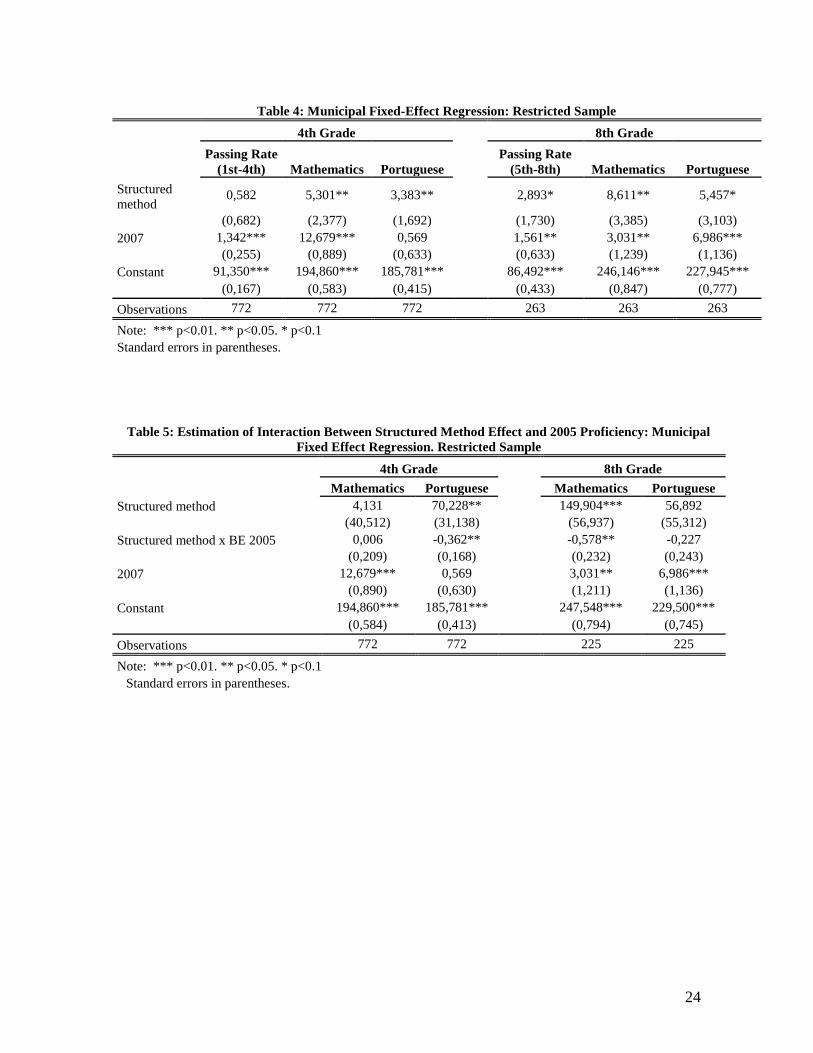
Using a longitudinal dataset of municipalities, our results show (i) that municipalities

that have adopted structured methods show higher average proficiency gains in

mathematics and Portuguese for 4th and 8th graders than those that did not adopt such

methods; and (ii) that the worst-performing municipalities in terms of proficiency exams

(for all subjects with the exception of 4th

-grade mathematics) are those with the greatest

gains from adopting structured methods. However, robustness tests suggest the possibility

that unobserved municipal characteristics associated with proficiency changes may still

affect the results over time.

This paper is organized as follows. Section two presents the data source. Section three

discusses structured teaching methods that several São Paulo State municipalities have

adopted in agreements with private teaching systems. Section four describes the dataset

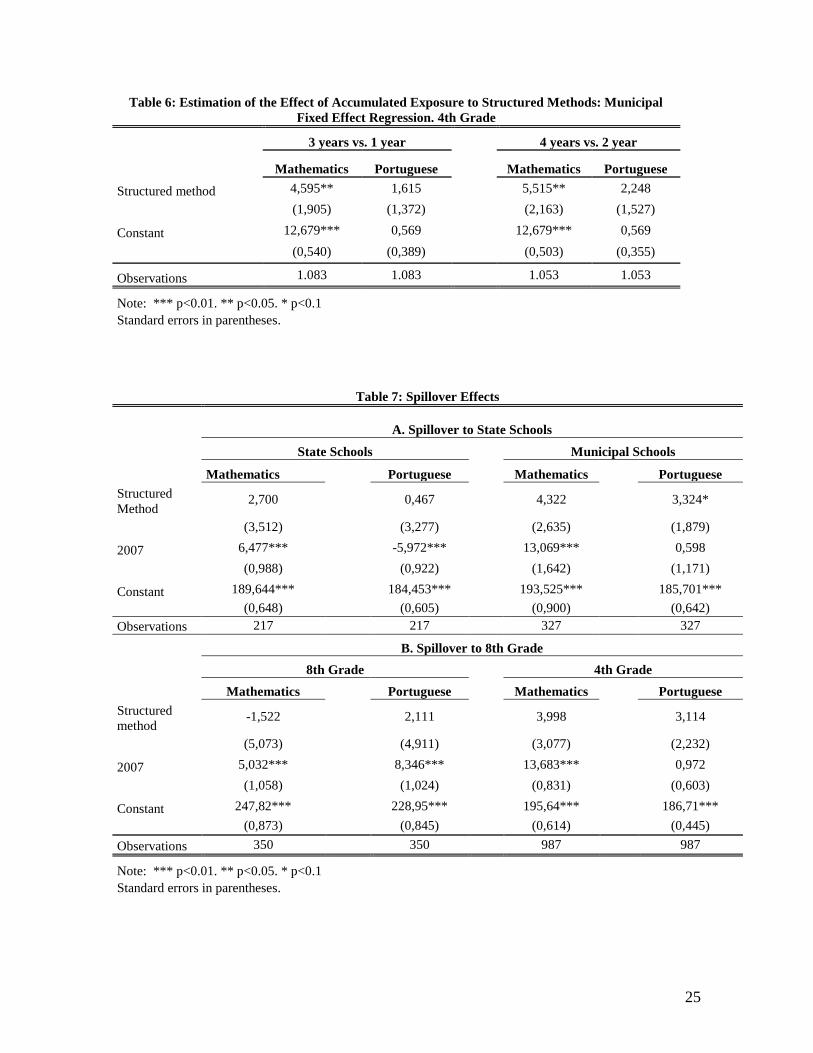
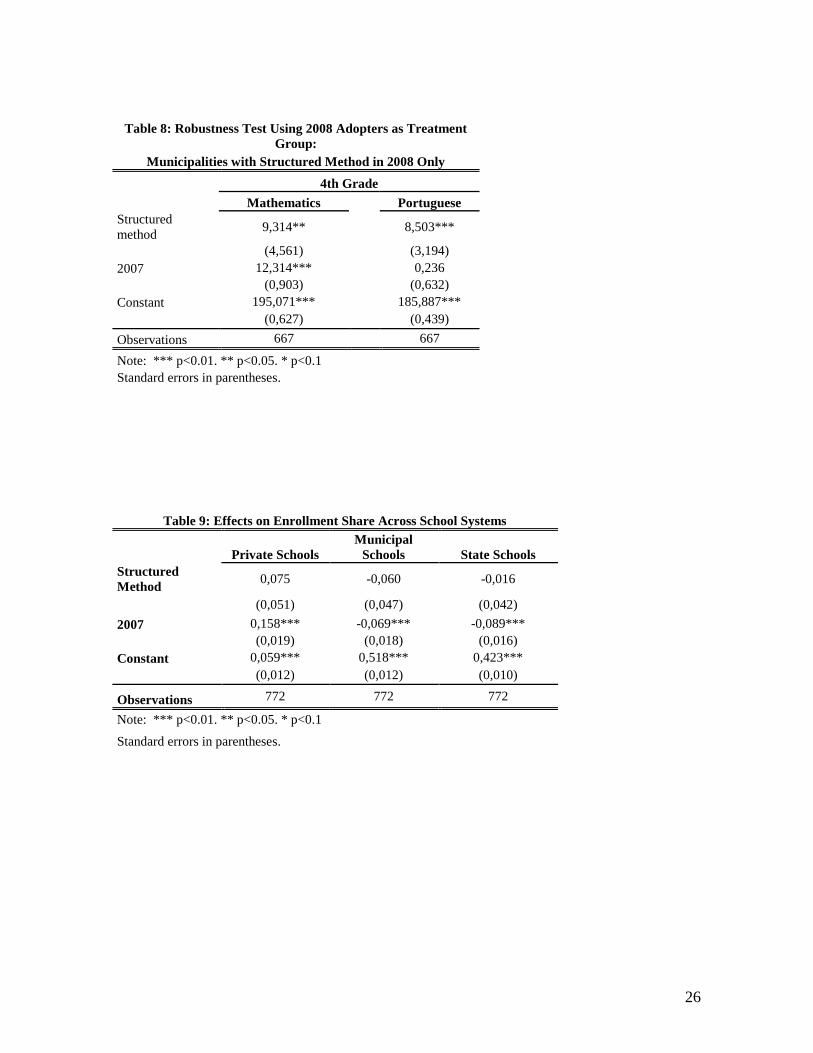
and the sample used in the analysis. Section five presents the empirical procedure and

discusses the main results, possible spillover effects and a robustness check. Finally, the

last section concludes.

II. Data Sources

In this section, we describe the data sources and the data collection process. We

need three different sets of information: i) information on which municipalities have

adopted structured methods, the years of adoption, the providers of the service and the

school levels attended; ii) information on students outcomes such as proficiency and pass

rates by municipalities; and iii) demographic and socio-economic characteristics of the

municipalities. Because there is no unique source that contains all pieces of information

needed, the data collection process involved different procedures.

In order to obtain information on municipalities that adopted structured methods and

their extent and range, primary data were collected and constructed from different sources:

a survey conducted in 2007 by the São Paulo State Audit Court (TCE) on educational

6

programs implemented in the municipalities.4 To cross validate the TCE information, the

Union of the São Paulo State Municipal Education Officials affiliates (UNDIME) sent

questionnaires to the secretaries of education of the municipalities asking whether the

municipality had contracted out the use of structured methods. Additionally to double-

check the information from TCE and UNIDIME we further contacted directly all

municipality that responded that had contracted out the teaching methods and also a 10%

random sample of all municipalities that have responded that had not contracted out such

services. Our final database has information on previous and standing agreements between

municipality and the teaching system, as well as the period and scope (kindergarten,

primary school, high school, and adult education).

In order to obtain information on student proficiency, we used the Prova Brasil

exam. Prova Brasil is the nationwide voluntary proficiency test for public school students

in the 4th

and 8th

grades conducted by the Instituto Nacional de Estudos e Pesquisas

Educacionais Anísio Teixeira of the Ministry of Education (INEP-MEC) ; we use the

average proficiency scores of the municipal schools system from the tests conducted in

2005 and 2007, for Mathematics and Portuguese. Pass rates are from the school educational

census also conducted by INEP-MEC every year.

Finally, we also use data from the Brazilian Demographic Census of 2000,

conducted by Brazilian Census Bureau – IBGE, to obtain information on the

municipalities’ demographics and economic characteristics.

III. Private Teaching Systems and Structured Methods

Primary public education in Brazil is divided in two systems: one subordinate to the

State educational authority (State schools) and the other to the Municipality educational

authority (Municipal schools). In some municipalities, there are both state and municipal

4 In 2007 TCE-SP asked the secretaries of education of the municipalities about their

education programs which include a question whether they contracted educational firms

and which were these firms. The website of TCE (www.tce.sp.gov.br) allows the

access to each of the 645 questionnaires filled out by the municipalities..

7

schools. There are also muncipalities with only municipal or state schools. In the late

1990s, due to the strong incentives for decentralization and educational autonomy to the

municipalities, agreements between private educational institutions and municipal public

school systems started to be settled in some states in Brazil (mainly in São Paulo).

The pedagogical proposition of these private teaching systems involves the design

of the curriculum and of the learning activities using learning materials (textbooks,

instructor material, test banks, etc.) intended for students and instructors. Teaching systems

also offer teachers instruction and pedagogic advice, including access to an education

website along with the materials. It is worth noting that differences between agreements

may lead to differences not only in the materials and training that the various teaching

systems provide but also between different municipalities served by the same system. The

amounts charged represent about 10% of the cost per student/year in the public sector.

Teaching systems present an integral set of learning materials with content for every

subject and grade, prepared by the private providers. The contents are divided into

textbooks covering regular periods (usually two months) and organized by grade and by

subject. Therefore, the textbooks include content by subject and provide a class plan such

that every two months one textbook will be completed covered. Furthermore, teaching

systems also offer instructors support materials. In general, these materials are intended to

clarify the class plan implied in student textbooks by offering instructors not only a

suggested teaching sequence but also pedagogical strategies for each topic and

supplemental activities to be undertaken with the students.

The private teaching systems also offer instructor training and advice services. In

general, the providers meet every two or six months with all the teachers of the school

public system. At these meetings, instructors from the teaching systems address different

methodological strategies that can be used to convey the contents of the learning materials.

Some teaching systems include bimonthly visits to classes to monitor instructors and

address doubts they may have. Others offer a permanent consultant in each city to support

instructors and track the entire teaching process.

8

They also provide interactive websites with supplemental activities, texts,

documents and education-related articles, test-question banks. The instructors can also post

questions and threads to discuss any subject related to the teaching activities. Some systems

also offer online content for students.

It is important to note that each teaching system may have particular features that

may vary across municipalities depending on the contract agreement.

Unlike schools that have adopted the privately supported systems, a regular public

school in São Paulo is free to choose its pedagogical methodology in general. The principal

and the teachers decide on the syllabus content (under federal regulation standards), the

textbooks and supplemental materials, the tests and exams, the sequence of the curriculum

content, etc. It is even possible for two different classes in the same grade and school to

have different syllabi, textbooks, etc.

The state of São Paulo is divided in 645 municipalities, 79 of them having no municipal

schools but only state schools. 396 municipalities have only municipal schools and 170

have schools in both systems. According to our dataset of all the 566 municipalities with

municipal schools 189 contracted out private structured methods between 1999 and 2008.

Over this period, 13 municipalities terminated their agreements but one resumed the

agreement after one year. Therefore, in 2008, 177 municipalities (around 30 percent) had

some kind of agreement in place, covering approximately 440,000 students, which

represent 14 percent of students enrolled in municipal schools and 8 percent of all public

school (state and municipal) enrollments.

Most of these municipalities (94%) have agreements for the 1st-4th grades; this is

the education level with most students enrolled in municipal schools. Additionally, 75

percent of these municipalities adopt structure methods for kindergarten, and 51 percent do

so for the 1st-8

th or 5

th-8

th grades.

By 2008 there were 18 firms operating structured method systems adopted by the

municipalities in São Paulo. The provider that covers the most number of municipalities

was contracted out by 41.24% of all municipalities with private providers of structured

9

methods in 2008. The second and third largest providers represent 15.82% and 11.86%,

respectively. They cover almost 69% of all municipalities with private providers. The

Herfindahl–Hirschman Index of this market of municipalities is 0.22 which indicates a

moderately concentrated market.

IV Sample Selection and Descriptive Analysis

Of all municipalities with municipal primary school, 479 participated in the 2005

and 2007 Prova Brasil exams. Since we use a difference-in-difference empirical strategy,

we restrict our sample to municipalities that never contracted out structured method until

2005. Those sum up 393 municipalities. This is our selected sample. Of those, 59

contracted out private institutions in 2006 or 2007. These will form the treatment group.

In order to investigate whether the decision to participate in Prova Brasil is

correlated with some observable characteristics of the municipalities, we computed the

probability of a municipaility participation using a probit regression5. As shown in Table 1,

the only variable significantly different from zero at 5% is the absence of state schools in

the municipality. The average schooling of the population has a significantly positive

associated at 10% level.

Table 1

After including the additional control variables municipality’s per capita revenue

and expenditures in education based on the population of school age, the sample size drops

to 360 municipalities. We find that the per capita revenue of the municipality is positively

associated with the probability of participating in the exam.

5 For this analysis, we include all municipalities.. Of those, 458 have information on the analyzed

characteristics (% pop 7-14 years old; pop. average schooling; pop per capita income; % of poor

pop.;municipalities with only school municipal system, Prova Brasil scores and passing rates).,

10

We conjecture that richer and more educated populations demand higher quality of

education and this is reflected the municipality authority choice in participating in Prova

Brasil. Moreover, since the São Paulo State school system did not participate in the 2005

exam, municipalities with both state and local school systems may have chosen to not

participate due to economies of scale of the exam logistics.

The characteristics of our selected sample are presented in Table 2. We use data

from the 2000 Brazilian Census. It shows that the treatment and comparison municipalities

are very similar in terms of average schooling, the percentage of poor in the population, the

percentage of the population that is of school age. Moreover, we observe that both groups

have similar 4th

graders Prova Brasil scores and 1st to 4

th grades average passing rates in

2005.6 The main differences are the size of the population, the education expenditure and

the presence of state-schools. The municipalities that adopted structured methods are

smaller, expend more in education and are less likely to have both school systems.

Table 2.

To further investigate the differences between treatment and comparison

municipalities, we run a probit model controlling for the same pre-treatment variables

discussed in Table 2. The results shows that the only the absence of state schools is

significantly associated with the likelihood of adopting structured methods.

We speculate that the facts of being smaller and not having a state-school system

are associated with lower municipality capacity to manage a public education system since

it requires a minimal scale to training teachers, principal and deal with the logistics of

organization and material distribution. Therefore, those small municipalities may prefer to

delegate these services to private contractors.

It is important to notice that both treatment and comparison groups have similar

characteristics previous to the introduction of structured methods, particularly they have

comparable pre-treatment educational outcome variable (proficiency and passing rates).

6 Passing rate is defined as the proportion of students that are enrolled in grade g in a given year t that are

approved to pass to grade g+1 in t+1

11

Furthermore, we observe that after the introduction, the treated municipality experience

greater test scores. For instance, in 2005 the students in the 4th

grade in the treated

(comparison) municipalities scored 192.86 (195.15) in the Mathematics exam. In 2007 they

scored 210.25 and 207.83, respectively.

Table 3

V. Results

V.1 Estimation Procedure.

The impact estimation is based on the following fixed-effect regression using 2005

and 2007 data:

itititit u+‘+ŠT+‰d+‡=y (1)

where yit is one of the variables of interest (municipal weighted average of passing rates,

municipal average of Math and Portuguese proficiencies) for municipality i in year t (2005

and 2007), dit is a dummy that assumes a value of 1 if municipality i had a structured

method in place in year t, the indicator variable Tt equals 1 if the year is 2007 and zero if it

is 2005, i is the municipality fixed effect that captures municipal-specific time-invariant

unobserved heterogeneity and uit is the error term. We are interested in the coefficient

Itcaptures the additional gain of the treatment group relatively to the comparison

municipalities (the difference-in-differences estimator).

We implement this procedure for the 4th

and 8th

graders, separately. For the former,

the treatment is composed by 54 municipalities that introduced structured methods in 2006

and 2007 including in the 4th

grade; the comparison group is formed by all municipalities

with municipal schools with 4th

graders without structured methods. They encompass 332

municipalities. For the 8th

graders, the treatment is composed by 26 municipalities that that

introduced structured methods in 2006 and 2007 including in the 8th

grade; the comparison

12

group is formed by all municipalities with municipal schools with 8th

graders without

structured methods. This group is composed by 100 municipalities.

V.2. The Average Impact of Structured Methods

Table 4 shows the regression results for the 4th

and 8th

grades, separately. The

outcomes analyzed are weighted average passing rates of students in the 1st-4th grades and

5th-8th grades and the scores on the Prova Brasil exam (Math and Portuguese). The results

indicate that the impacts on passing rates are positive but only statistically significant at

10% level for the 5th

to 8th

grades (3 percentage points)7. The results also show a positive

impact of 5.3 and 3.4 points on 4th

-grade Mathematics and Portuguese Prova Brasil exam

scores, respectively. Those figures are statistically significant different from zero at 5%

level. For 8th graders, the impact on the Prova Brasil exam mathematics and Portuguese

scores are also positive at 8.6 and 5.5 points, respectively.8

Those results are sizeable. In 2005, the nationwide student standard deviation for

Portuguese and Mathematics scores was approximately 40 points in each case for both 4th

and 8th graders. Therefore, the impact of adopting structured method agreements

corresponds to about 10 percent of the standard deviation. For example, the impact on 4th

grade math scores is 5,3/40 = 0.1325. Comparing to the variance between municipalities,

the impact of the structured method for the 4th

grader on Math is 5.3/14.13=0.375.

Table 4

Since there are different providers of structured methods, one could argue that there are

idiosyncratic characteristics of each provider that could be both correlated with the

municipality choice of the provider and the student outcomes. Unfortunately, we do not

observe municipalities change the provider between 2005 and 2007, therefore it is not

possible to include both municipality and provider fixed-effects. Besides, the effects

7 The aggregated weighted passing rates were computed using the proportion of student in each grade as

weight. In this new version we make it clear in the text. We decided to use the average across grades within

each cycle (1st to 4

th and 5

th to 8

th) since the students in these grades were all treated in the municipalities by

the structured methods. Nevertheless, we run the regressions for passing rates for the 4th

and 8th

grades alone.

The results were qualitatively the same. The point estimated are 1.13 for the 4th

grade and 2.31 for the 8th

,

both are statically insignificant at 10%. 8 These results are significant at 5 and 10% level for Math and Portuguese, respectively.

13

estimated in Table 4 are the average impact across all providers. It is possible that those

effects are heterogeneous among the providers and the average impacts maybe driven by

some of them. In order to investigate that we run the regressions with interactions between

the treatment variable and providers indicator variables, we create six provider indicator

variable. Provider 1 is the main provider; provider 2 is the second and so on until provider

5. The last one is all the other minor providers.

The results are presented in Table A1 in the appendix. Indeed, we do observe that

the effects are different across providers and provider 1 seems to present the greater

impacts. However, it is important to note that the fact that some of other providers have few

contracts may enlarge the standard errors of the coefficients associated with those providers

affecting the significance of them.

V.3. The Heterogeneous Effect of the Starting Point

This section extends the analysis of the impact of structured methods on student

proficiency to determine whether the impact varies for municipalities with different initial

levels of proficiency. The question is whether structured methods have a greater impact on

municipalities with higher or lower initial Prova Brasil exam scores. To check this, we

extend equation (1) to include the interaction of 2005 Prova Brasil scores with the treatment

group.

The estimated regression is:

ititi05ititit u+‘+ŠT+PBd+‰d+‡=y (2)

where PBi05 is the score of municipality i in the 2005 Prova Brasil exam. We

interact the score with the indicator variable dit.

Table 5 shows that the interaction is not statistically significant for 4th grade

mathematics Prova Brasil scores, but is significant for Portuguese Prova Brasil scores with

a negative impact. This means that the impact is greater for less proficient municipalities.

Similar results are found for the 8th grade scores. However in this case, the interaction is

negative and significant for the Math scores only.

14

Table 5

The Prova Brasil exam score for which the marginal effect is zero is 194 points (4th

Grade Portuguese). 86 percent of municipalities with structured methods score below this

threshold. For 8th grade mathematics the score is 254 and covers almost 90 percent of the

treated municipalities. We conjecture that the structured method may be more effective

especially for those students with weak background formation and or teachers and principal

with lower teaching and managerial capacities. Given that, it is not surprising that

municipalities with lower pre-treatment scores benefit more from the introduction of the

structured methods9.

V.4. The Effect of Accumulated Exposure to Structured Methods

This section investigates the impact of years of exposure to structured methods on

student proficiency. We attempt to determine the existence of cumulative effects of student

exposure to structured methods over time. In this exercise, the comparison group becomes

the set of all municipalities without methods in 2007 and we build two alternative treatment

groups. The first one contains municipalities whose contracts started in 2005. For these, 4th

graders had only been exposed to structured methods for one year at the time of the 2005

Prova Brasil exam. The exposure increased to 3 years for the 4th

graders in 2007 Prova

Brasil exam. We label these groups as 1 vs. 3 years. The second group is made up of

municipalities that adopted methods in 2004 and whose 4th graders therefore had two years

9 We also run a specification including interaction between the structural method indicator variable and

quartile dummies of 2005 Prova Brasil scores. We find similar results with the previous exercise: for the 4th

grade in Math there is no significantly different impacts for the quartiles; for Portuguese, we find larger

impacts for the first quartile. For the 8th grade, we find the reverse, i.e., no heterogeneous impacts for

Portuguese and larger impacts for the first quartile in Math.

15

of exposure by the 2005 Prova Brasil exam and four years of exposure for the 4th

graders by

the 2007 Prova Brasil exam. These groups are labeled 2 vs. 4 years.10

The effect was estimated with the difference-in-differences method. The treatment

group’s different results in 2007 and 2005 can be traced to two factors: duration of

exposure to the method and the time/cohort effect itself. Assuming that the time/cohort

effect is the same for the treatment and comparison groups, our estimator identifies the

exposure effect. The estimation with the first group (3 years vs. 1 year) identifies the effect

of exposure from the 2nd to the 4th grade relative to exposure in the 4th grade only. The

estimation done with the second treatment group (4 years vs. 2 years) indicates the effect of

1st-4th grade exposure relative to 3rd-4th grade exposure.

The results can be seen in Table 6. The gain in mathematics scores is 4.6 points for

the first group (3 vs. 1) and 5.5 points for the second group (4 vs. 2). The results for

Portuguese are 1.61 for group 3 vs. 1 and 2.25 for group 4 vs. 2. These results, however, are

not statistically different from zero.

Table 6

Taken together, the evidence indicates that exposure over time generates gains in

mathematics scores. Note that this exercise refers only to differences between different

exposures to the method between the 1st and 4th grades.

V. 5 Spillover Effects

The adoption of structured methods by the schools in the municipal educational

system raises the question of spillover effects. These effects could be on the schools that

belong to other educational systems, private or state-managed, due to competition between

them. The effects could be also on the other grades in the schools in the municipal system

in the case of partial adoption of the structured methods. The share of common resources

10

For this exercise, the treatment groups are composed by municipalities that had structured method

regardless of the grade. We did that for the sake of sample size. For the 3 vs 1 year, there are 29 treated

municipalities for the 4 vs 2 years, there are 19 treated municipalities.

16

such as same principal, teachers and staff may spill over the other grades in the same

school.

V.5.1 Impact for the State System

To test whether the adoption of structured methods stimulated some kind of

competition in the other educational systems, we compared the results for the schools in the

state system. We cannot test for private schools because they do not participate in Prova

Brasil. We restricted the analysis to municipalities with both local and state schools and we

compare the Prova Brasil scores achieved by schools in the state system in municipalities

adopting structured methods in 2006-2007 with the scores in the state system of

municipalities without structured methods by that time. Since state schools are not directly

exposed to the structured methods, the comparison of their results with those of the

municipal systems that are directly exposed to the methods helps interpreting the results. If

the adoption of structured methods affects student proficiency in both systems, these results

support the hypothesis of spillover effects. No effects on state schools suggest that there are

no spillover effects of structured methods. 11

The results are presented in the panel A of Table 7. It shows that proficiency gains

for state schools 4th

graders in municipalities that have adopted structured methods do not

differ from those of state schools in non-structured method municipalities. More

specifically, the estimated changes are negative but not statistically different from zero.

This result suggests that there are no spillover effects.

We also compare these results with those for municipal schools in this same sample

of municipalities. The results are not statistically significant for mathematics, and they are

significant for Portuguese only at 10% level. However, the magnitude of the points

estimated are similar to those found in Table 4. These results suggest that are no spillover

11 This test could also be interpreted as a robustness test for the impact of unobservable

characteristics, preferences, social norms, etc. of municipalities that are both associated with proficiency

changes and the adoption of structured methods. Assuming that these unobservable characteristics are mainly

responsible for proficiency changes in the treatment group, they should also affect changes in the state schools

found in the treatment group’s municipalities.

17

effects, although we cannot rule out the possibility that the lack of statistically significant

effect may be due to the smaller sample size.

Table 7

V.5.2 Impact for 8th Graders in Municipalities with Structured Methods

In this exercise, we compare the proficiency of 8th graders in municipalities that

adopted methods up to the 4th grade with the proficiency of 8th graders in municipalities

with no methods. The assumption is that no student in either group is exposed directly to

structured methods but former one is indirectly exposed. Therefore, this second test restricts

the treatment group to municipalities adopting structured methods in 2006 and 2007 with

the exclusion of those with methods for the 5th to 8th grades. The control group is made up

of municipalities with no structured methods by 2007. The difference-in-differences is

estimated for 8th grade Mathematics and Portuguese Prova Brasil exam scores. A positive

and significant result for would support the hypothesis of spillover effects of structured

methods inside the municipal system. 12

The panel B of Table 7 shows that the effects on 8th Grade Prova Brasil exam

scores are not statistically different from zero. We also compare these results those for 4th

graders for that were directly affected in this same sample of municipalities. The results are

not statistically significant different from zero either. However, the estimated scores are

similar to those seen in the general estimation. Similarly to the previous exercise, these

results suggest that are no spillover effects, although we cannot disregard the possibility

that no effect result may be due to the smaller sample size.

V.6. Robustness Tests

V.6.1 Results for Municipalities Adopting Methods in 2008

12

This test can also be interpreted as a robustness test for unobserved characteristics of municipalities and

municipal education systems associated with proficiency changes and the adoption of structured methods

18

This robustness test attempts to investigate whether a selection bias exists in the

adoption of structured methods. To perform this test, we use a control group made up of

municipalities that adopted methods from 2008 only (i.e. after the 2007 Prova Brasil exam).

The comparison group is made up of municipalities that did not have methods in place by

2008. Note that this exercise tests the identification assumption that the treatment group has

the same trend of the comparison group in the absence of treatment.

The results shown in Table 8 indicate that these municipalities showed greater

performance gains in 4th Grade mathematics and Portuguese scores than did the control

group. Also, this group’s score gain was far superior to that shown by the group made up

of municipalities that did in fact adopt methods in 2006-2007. Thus, municipalities that

decided to enter into agreements with private teaching systems in 2008 were those that

showed the greatest proficiency gains in 2005 and 2007. Therefore, we are unable to rule

out of possibility that unobservable characteristics are driving this results13

.

Table 8

V.6.2 Results for Enrollment

This exercise tests if there were any composition changes in the distribution of

students across school systems: municipal, state and private schools. It is possible that the

introduction of structured methods attracts (or repeals) the most (the less) able or more

(less) interested students. In this case, the effect found previously may be due to the

selection process of the best students. In order to investigate the existence of these

composition effects, we test the impact of the introduction of the methods on primary

education (1st to 8

th grades) enrollment shares of the three different systems (private,

municipal and state).

13

To check if our results are robust to different specifications, we combined propensity matching with the

differences-in-differences methods (Matching difference-in-differences – MDID). Using the most restrictive

matching (one-to-one), we end up with smaller sample (78 municipalities – 43 treated and 35 control group).

Since we do not have complete information for all municipalities, for the matching equation (the same as in

Table 3) we end up losing 15 treated municipalities. Nevertheless, the point estimated are very close to the

one we find with whole sample. It is important to notice that the reduced samples in the MDID turn the

coefficient insignificant. As we increase the sample by matching the treated municipalities with more nearest

neighbors, the results become even closer to the original differences-in-differences one and the coefficients

become significant, as expected.

19

The regression estimated follows equation (2) using the enrollment shares as the

dependent variables. The results are presented on Table 9. They show that there were no

statistically significant effects of the treatment of the distribution of enrollment across

school systems.

Table 9

VI. Conclusion

This study attempts to assess the impact of the adoption of structured methods on

students’ proficiency and passing rates in São Paulo State municipal schools. The evidence

suggests that compared to municipalities that did not adopt structured methods, the treated

municipalities present higher proficiency in 2007, higher proficiency gains from 2005 to

2007 and no difference in passing rates. Furthermore, we find that the worst-performing

municipalities on proficiency exams (with the exception of 4th grade mathematics) are

those with the greatest gains from adopting structured methods. However, a robustness test

suggests the possibility that unobserved municipal characteristics associated with

proficiency changes over time may affect the results.

These results are in line with most of the empirical literature related to charter schools

which finds no conclusive evidence of their impact on proficiency. We do not find evidence

of positive spillover or competition effects of these methods. Within the same

municipalities, 8th

grade students indirectly affected only by the adoption of structured

methods do not present a significant gain in proficiency compared to those not even

indirectly affected. Additionally, state schools in municipalities that adopted the methods

did not benefit either.

Our results are also in line with the main conclusions of the school production function

literature. Assuming that our results capture a causal effect of the structured method on

proficiency, they suggest that combining materials, teacher training and parents and

teachers efforts is effective in raising students’ proficiency. On the other hand, our results

contradict the part of the literature that finds positive impacts of inputs only for top

20

students. We find that, for the majority of proficiency measures analyzed, the effects are

more pervasive in bottom-ranked schools.

References

Angrist. J. and Lavy, D. (2001). V. Does Teacher Training Affect Pupil Learning?

Evidence from Matched Comparisons in Jerusalem Public Schools. Journal of Labor

Economics, 19(2): 343-369.

Baker. J. (2002). Evaluating the impact of Development Projects on Poverty: A

Handbook for Practitioners. The World Bank.

Bettinger. Eric P. (2005). The effect of charter schools on charter students and public

schools. Economics of Education Review, vol. 24(2). pages 133-147. April.

Booker, K., Gilpatric, S., Gronberg, T. and Jansen, D. (2007). The impact of charter

school attendance on student performance. Journal of Public Economics, vol. 91(5-6),

pages 849-876, June.

_______________________________________________________________. (2008).

The effect of charter schools on traditional public school students in Texas: Are children

who stay behind left behind? Journal of Urban Economics, vol 64(1), pages 123-145, July.

Carruthers, C. K. (2011). NewSchools, NewStudents, NewTeachers: Evaluating the

Effectiveness of Charter Schools, Economics of Education Review, forthcoming.

Dee, T. and Fu, H. (2004). Do charter schools skim students or drain resources?

Economics of Education Review, Volume 23, Issue 3, June, Pages 259-271.

Geske, T., Davis, and D., Hingle, P. (1997). Charter Schools: A Viable Public School

Choice Option? Economics of Education Review, Volume 16, Issue 1, February, Pages 15-

23.

Glewwe. P., Kremer, M. and Moulin, S. (2007). Many Children Left Behind?

Textbooks and Test Scores in Kenya. NBER Working Paper Series WP 13300.

Hanushek E. A (2003). The Failure of Input-Based Schooling Policies. The Economic

Journal, Vol 113, No 485, pp F64-F96.

Hanushek. E., Kain, J., Rivkin, S.and Branch, G. (2007). Charter school quality and

parental decision making with school choice. Journal of Public Economics, vol. 91(5-6).

pages 823-848, June.

21

Hoxby, C. and Murarka, S. (2009). Charter Schools in New York City: Who Enrolls

and How They Affect Their Students' Achievement. NBER Working Paper Series. Vol.

w14852.

Jacob, B. and Lefgren, L. (2004). The Impact of Teacher Training on Student

Achievement: Quasi-Experimental Evidence from School Reform Efforts in Chicago.

Journal of Human Resources, vol. 39(1).

Leme, C., Paredes, R. and Souza,A. P. (2009). A Municipalização do Ensino

Fundamental e seu Impacto sobre a Proficiência. In: Educação Básica do Brasil. org.

Fernando Veloso et. al. Elsevier. pg. 261-280

Lockheed, M. and Hanushek, E. (1987). Improving the Efficiency of Education in

Developing Countries: Review of the Evidence. Discussion Paper Education and Training

Series. The World Bank.

Madeira. R. (2007). The Effects of Decentralization on Schooling: Evidence From the

Sao Paulo State’s Education Reform (132). mimeo

Ni, Y. (2009). The impact of charter schools on the efficiency of traditional public

schools: Evidence from Michigan. Economics of Education Review, Volume 28, Issue 5,

October, Pages 571-584.

PISA (2006). PISA 2006: Science Competencies for Tomorrow's World. OCDE.

Zimmer, R., Gill, B., Booker, K., Lavertu, R., Witte, J. (2011). Examining Charter

Student Achievement Effects Across Seven States. Economics of Education Review,

forthcoming.

22

Table 1: Probit Model - Participation in Prova Brasil 2005

Variables Marginal

Effects Marginal Effects

Population (100000 hab.) 0 -0.011

0.000 -0.021

% Population 7 to 14 years old -0.521 0.002

-0.549 -0.904

Population average schooling 0.0644* 0.072*

-0.034 -0.045

Population per capita income -0.001 -0.001

0.000 0.000

% of Poor in population -0.019 -0.099

-0.216 -0.314

Only school municipal system 0.130** 0.02** (x10-3

)

-0.042 -0.030

educ. expend. (R$1000) / school age child. -0.070

-0.030

Per capita municipal revenue 0.168***

-0.062

Y predicted 85.63 85.15

Pseudo R2 0.0315 0.072

N 458 360

Note * p< 10%; **p< 5%; ***p< 1%; Standard errors in parentheses.

Table 2 : Municipality Characteristics

Without Structured

Methods in 2007

Structured Methods in

2006 and 2007

Mean SD N Mean SD N

Total population (1000 hab) 53.37 115.38 332 28.42 38.31 59

% Population poor 0.21 9.43 331 0.2 8.57 58

Years of schooling 5.37 0.92 331 5.32 0.77 58

Per capita income 278.28 85.73 331 282.25 106.38 58

% Population 7 to 14 years old 0.14 0.03 332 0.14 0.03 59

Per capita revenue 1663.28 690 263 1764.59 821.07 45

School age per capita education expenditure 2203.5 1142.22 266 2656.16 1747.14 43

School municipal system only 0.684 0.466 332 0.814 0.393 59

Prova Brasil 2005 Mathematics 4th

grade 195.15 14.13 332 192.86 10.59 59

Prova Brasil 2005 Portuguese 4th

grade 185.93 12.44 332 184.65 9.25 59

Prova Brasil 2007 Mathematics 4th

grade 207.83 19.14 332 210.25 19.2 59

Prova Brasil 2007 Portuguese 4th

grade 186.5 14.3 332 188.57 13.08 59

Average passing rate 2005 1st-4

th grades 91.43 5.35 332 90.84 5.61 59

Average passing rate 2007 1st-4

th grades 92.76 4.88 332 92.8 4.76 59

Source: population, years of schooling, per capita income: Censo Demográfico 2000-IBGE;

% poor – IPEADATA; revenue and education expenditure: Fundação SEADE; INEP/MEC

23

Table 3: Probit Model - Structured Method (2006-2007)

Marginal

Effects

Marginal

Effects

Passing rate 1st to 4

th grades -0.00262 -0.00433

(0.00317) (0.00342)

Prova Brasil 2005 mathematics -0.00416 -0.00456

(0.00271) (0.00304)

Prova Brasil 2005 Portuguese 0.001749 0.002273

(0.00313) (0.00345)

Population -0.00054 -0.00028

(0.00038) (0.00037)

% Population 7 to 14 years old -0.55271 0.727242

(0.65191) (100.714)

Average years of schooling -0.02094 -0.03769

(0.04358) (0.04814)

Average per capita income 0.000334 0.000426

(0.00041) (0.00047)

% Poor population -0.23701 -0.5033

(0.28066) (0.34432)

School municipal system only 0.06095 0.075361*

(0.0413) (0.04665)

School age per capita education expenditure 0.00003

(0.00002)

Per capita revenue -0.00005

(0.00004)

Y predicted 13.64 12.08

Pseudo R2 0.0416 0.0739

N 389 302

* p< 10%; **p< 5%; ***p< 1%.; Standard errors in parentheses.

24

Table 4: Municipal Fixed-Effect Regression: Restricted Sample

4th Grade 8th Grade

Passing Rate

(1st-4th) Mathematics Portuguese

Passing Rate

(5th-8th) Mathematics Portuguese

Structured

method 0,582 5,301** 3,383**

2,893* 8,611** 5,457*

(0,682) (2,377) (1,692) (1,730) (3,385) (3,103)

2007 1,342*** 12,679*** 0,569 1,561** 3,031** 6,986***

(0,255) (0,889) (0,633) (0,633) (1,239) (1,136)

Constant 91,350*** 194,860*** 185,781*** 86,492*** 246,146*** 227,945***

(0,167) (0,583) (0,415) (0,433) (0,847) (0,777)

Observations 772 772 772 263 263 263

Note: *** p<0.01. ** p<0.05. * p<0.1

Standard errors in parentheses.

Table 5: Estimation of Interaction Between Structured Method Effect and 2005 Proficiency: Municipal

Fixed Effect Regression. Restricted Sample

4th Grade 8th Grade

Mathematics Portuguese Mathematics Portuguese

Structured method 4,131 70,228** 149,904*** 56,892

(40,512) (31,138) (56,937) (55,312)

Structured method x BE 2005 0,006 -0,362** -0,578** -0,227

(0,209) (0,168) (0,232) (0,243)

2007 12,679*** 0,569 3,031** 6,986***

(0,890) (0,630) (1,211) (1,136)

Constant 194,860*** 185,781*** 247,548*** 229,500***

(0,584) (0,413) (0,794) (0,745)

Observations 772 772 225 225

Note: *** p<0.01. ** p<0.05. * p<0.1

Standard errors in parentheses.

25

Table 6: Estimation of the Effect of Accumulated Exposure to Structured Methods: Municipal

Fixed Effect Regression. 4th Grade

3 years vs. 1 year 4 years vs. 2 year

Mathematics Portuguese Mathematics Portuguese

Structured method 4,595** 1,615 5,515** 2,248

(1,905) (1,372) (2,163) (1,527)

Constant 12,679*** 0,569 12,679*** 0,569

(0,540) (0,389) (0,503) (0,355)

Observations 1.083 1.083 1.053 1.053

Note: *** p<0.01. ** p<0.05. * p<0.1

Standard errors in parentheses.

Table 7: Spillover Effects

A. Spillover to State Schools

State Schools Municipal Schools

Mathematics Portuguese Mathematics Portuguese

Structured

Method 2,700 0,467

4,322

3,324*

(3,512) (3,277) (2,635) (1,879)

2007 6,477*** -5,972*** 13,069*** 0,598

(0,988) (0,922) (1,642) (1,171)

Constant 189,644*** 184,453*** 193,525*** 185,701***

(0,648) (0,605) (0,900) (0,642)

Observations 217 217 327 327

B. Spillover to 8th Grade

8th Grade 4th Grade

Mathematics Portuguese Mathematics Portuguese

Structured

method -1,522

2,111

3,998

3,114

(5,073) (4,911) (3,077) (2,232)

2007 5,032*** 8,346*** 13,683*** 0,972

(1,058) (1,024) (0,831) (0,603)

Constant 247,82*** 228,95*** 195,64*** 186,71***

(0,873) (0,845) (0,614) (0,445)

Observations 350 350 987 987

Note: *** p<0.01. ** p<0.05. * p<0.1

Standard errors in parentheses.

26

Table 8: Robustness Test Using 2008 Adopters as Treatment

Group:

Municipalities with Structured Method in 2008 Only

4th Grade

Mathematics Portuguese

Structured

method 9,314**

8,503***

(4,561) (3,194)

2007 12,314*** 0,236

(0,903) (0,632)

Constant 195,071*** 185,887***

(0,627) (0,439)

Observations 667 667

Note: *** p<0.01. ** p<0.05. * p<0.1

Standard errors in parentheses.

Table 9: Effects on Enrollment Share Across School Systems

Private Schools

Municipal

Schools State Schools

Structured

Method 0,075 -0,060 -0,016

(0,051) (0,047) (0,042)

2007 0,158*** -0,069*** -0,089***

(0,019) (0,018) (0,016)

Constant 0,059*** 0,518*** 0,423***

(0,012) (0,012) (0,010)

Observations 772 772 772

Note: *** p<0.01. ** p<0.05. * p<0.1

Standard errors in parentheses.

27

APPENDIX

Table A1: Muncipal Fixed-Effect Regression: Heterogeneous Effects by Main Providers

4th Grade 8th Grade

Pass Rate

(1st-4th) Mathematics Portuguese

Pass Rate

(5th-8th) Mathematics Portuguese

Interactions of Structured Method

with

Provider 1 0,783 6,416* 5,752** 7,439** 20,814*** 13,034**

(1,071) (3,728) (2,657) (3,174) (6,086) (5,718)

Provider 2 1,103 1,292 -0,673 -2,336 3,714 0,139

(1,571) (5,470) (3,898) (3,174) (6,086) (5,718)

Provider 3 1,301 0,548 0,018 5,089 -3,311 3,854

(1,777) (6,184) (4,407) (4,443) (8,521) (8,006)

Provider 4 0,433 7,246 1,406 0,739 19,619 12,084

(2,340) (8,144) (5,804) (6,252) (11,989) (11,265)

Provider 5 5,608* 28,511** 13,686* 4,239 -3,721 -3,551

(3,299) (11,483) (8,184) (4,443) (8,521) (8,006)

Others -1,350 4,703 3,379 1,789 12,754 8,234

(1,367) (4,758) (3,391) (4,443) (8,521) (8,006)

2007 1,342*** 12,679*** 0,569 1,561** 3,031** 6,986***

(0,255) (0,889) (0,633) (0,632) (1,211) (1,138)

Constant 91,350*** 194,860*** 185,781*** 86,416*** 246,009*** 227,851***

(0,167) (0,583) (0,415) (0,434) (0,832) (0,781)

Observations 772 772 772 263 263 263

Note: *** p<0.01. ** p<0.05. * p<0.1

Standard errors in parentheses.

WORKING PAPER 2/2012 • MARCH, 2012 •

Os artigos dos Textos para Discussão da Escola de Economia de São Paulo da Fundação Getulio Vargas são de inteira responsabilidade dos autores e não refletem necessariamente a opinião da FGV-EESP. É permitida a reprodução total ou parcial dos artigos, desde que creditada a fonte.

Escola de Economia de São Paulo da Fundação Getulio Vargas FGV-EESP

www.fgvsp.br/economia


Recommended