90
22.033 Design Course Considerations in Designing a Nuclear Power Plant with a Hydrogen and Biofuels Facility 1

22.033 Design Course
Considerations in Designing a Nuclear Power Plant with a Hydrogen and Biofuels Facility
1
Why this project?
Green energy policy climate
Oil quickly depleting
Nuclear high energy/electricity output versus maintenance costs
2

System Layout
3

Reactor Core
4

Outline
1. Goals
2. Overall Design of Reactor Core
3. Radial and Axial Overview of Core
4. Fuel
5. Heat Removal
6. Core Depletion
7. Secondary System
8. Turbines and Heat Exchangers
9. Future Work 5
Reactor Core Goals
• Provide enough electricity and process heat for hydrogen and biofuels production
• Choose and design a reactor that will operate at temperatures larger than what is in use
• Produce a unique and innovative reactor
• Final design must be feasible for electrical production
6
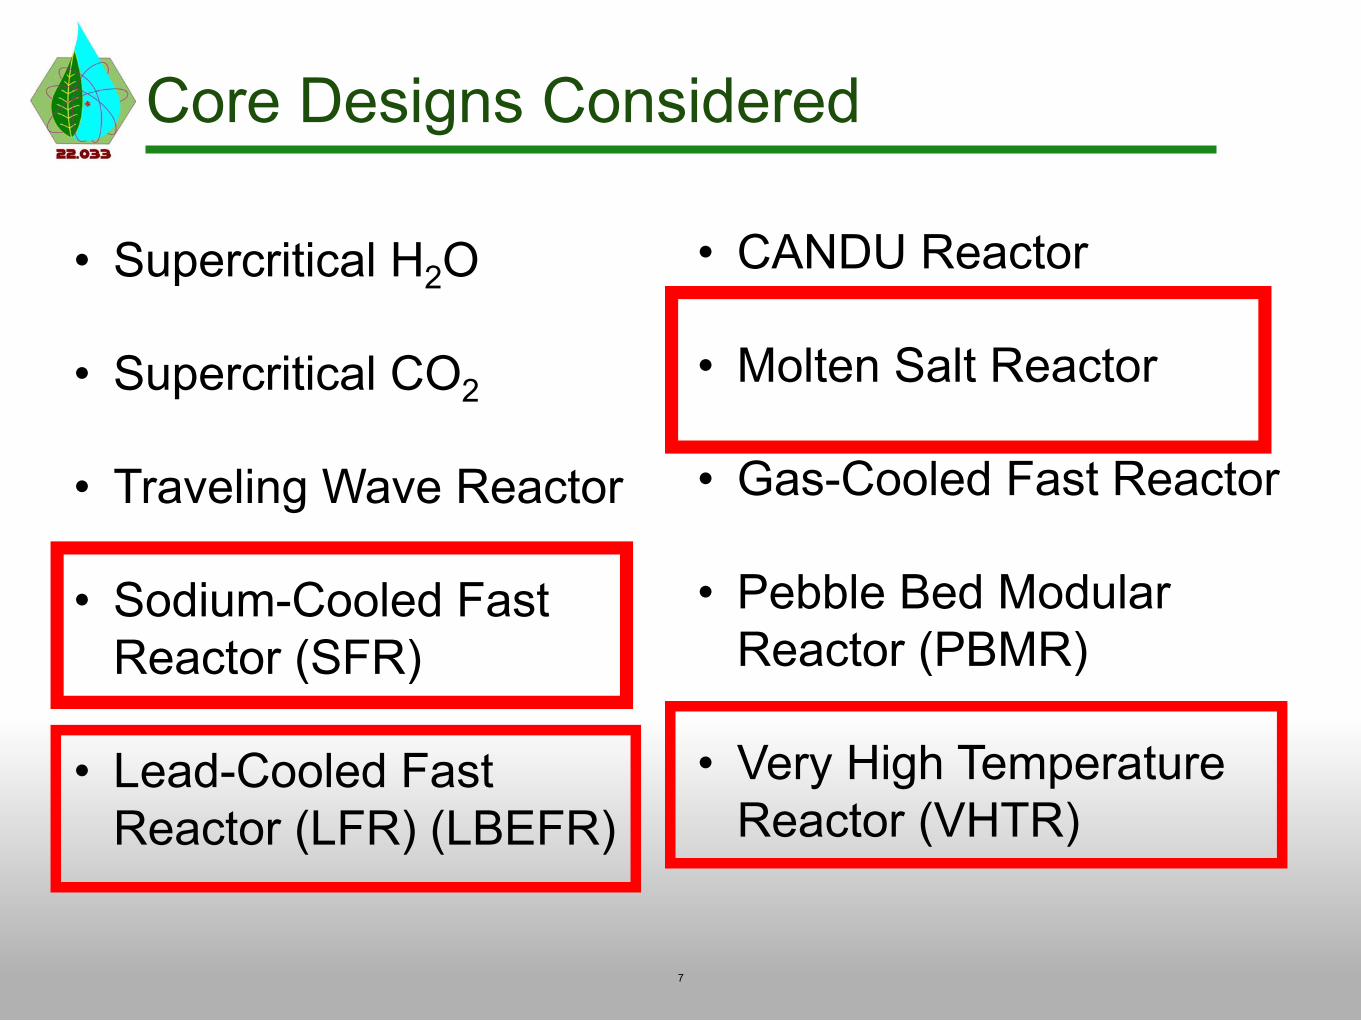
Core Designs Considered
• Supercritical H2O • CANDU Reactor
• Supercritical CO2 • Molten Salt Reactor
• Traveling Wave Reactor • Gas-Cooled Fast Reactor
• Sodium-Cooled Fast • Pebble Bed Modular Reactor (SFR) Reactor (PBMR)
• Lead-Cooled Fast • Very High Temperature Reactor (LFR) (LBEFR) Reactor (VHTR)
7
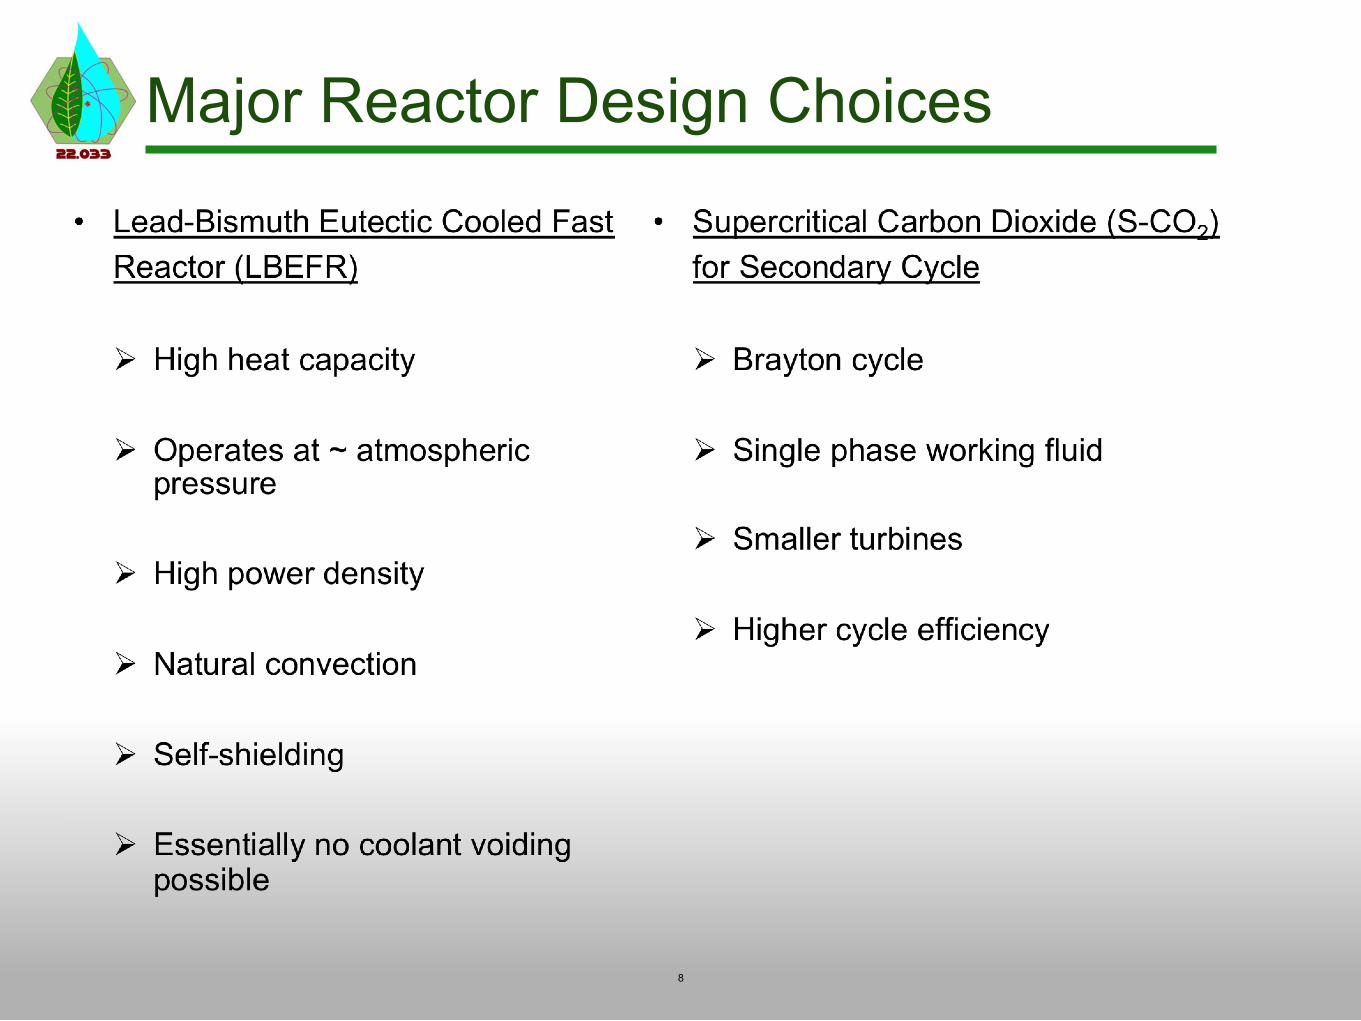
Major Reactor Design Choices
8

Reactor Core Final Design
Lead-Bismuth Eutectic (LBE) Cooled Fast Reactor with Supercritical CO2 Secondary Loop
3575 MWt (1500 MWe)
Limited by velocity of LBE (2.5 m/s) due to flow assisted corrosion
Will provide only 1000 MWe to grid, remaining energy will be used for hydrogen and biofuel production
9
•
•

LBE / CO2 Heat
Exchanger
Core
RPV
Steel
frame
Thot
Thot
Tcold
Tcold
10
Core Overview

Radial Overview of Core
11

Fuel Assembly and Zoning
Axial and Radial Zoning
Rings1-4
Rings5-10
Top 33%
10% 12.5%
Lower67%
12.5% 15%
Pitch/Pin = 1.6
12
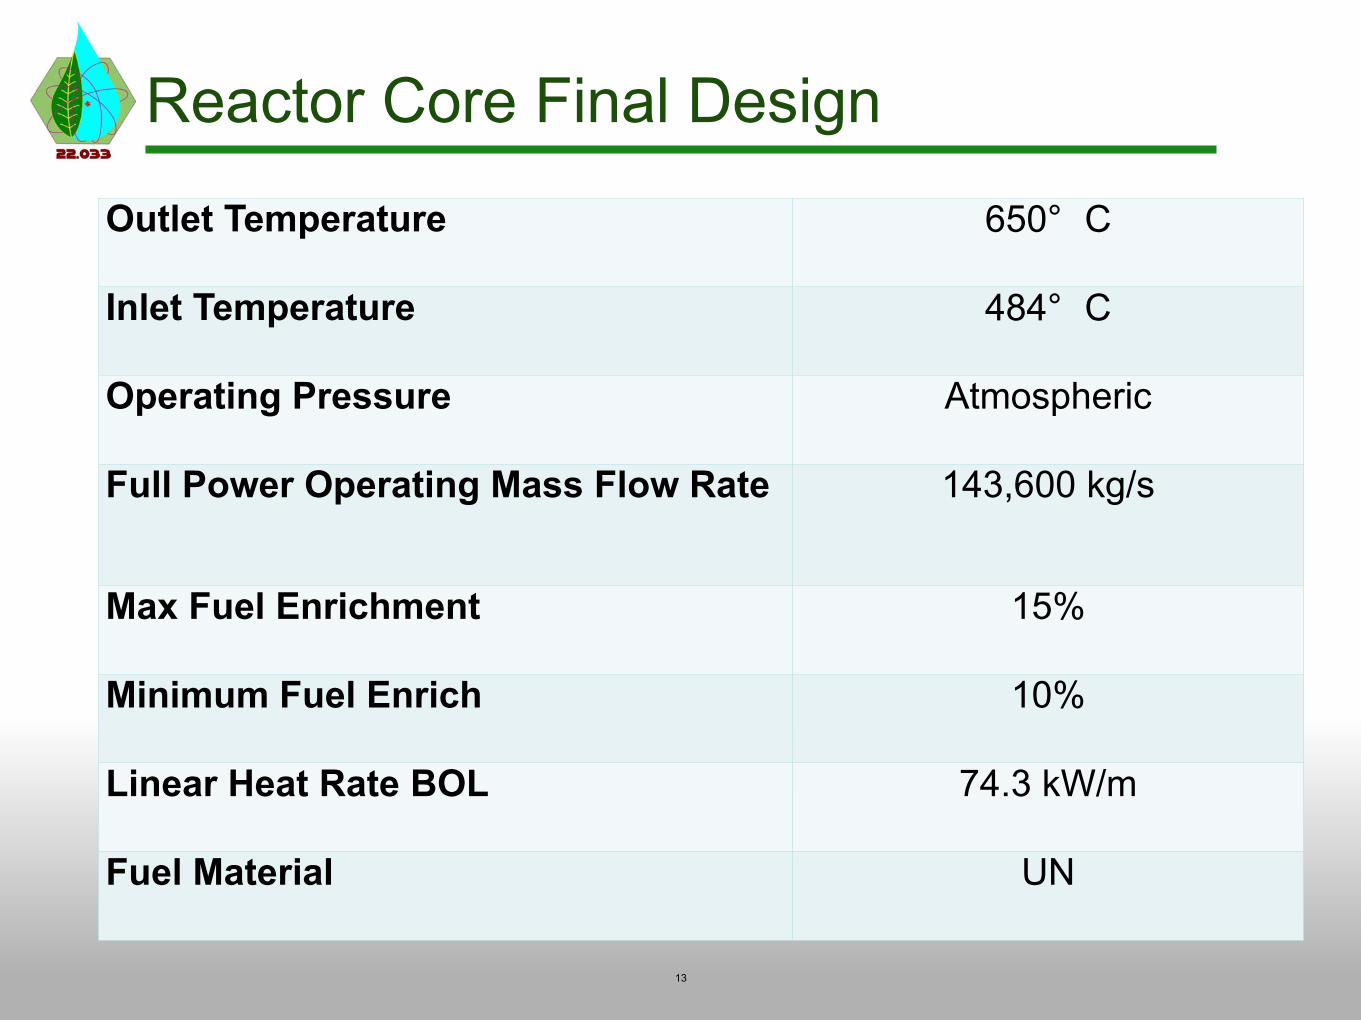
Reactor Core Final Design
Outlet Temperature 650° C
Inlet Temperature 484° C
Operating Pressure Atmospheric
Full Power Operating Mass Flow Rate 143,600 kg/s
Max Fuel Enrichment 15%
Minimum Fuel Enrich 10%
Linear Heat Rate BOL 74.3 kW/m
Fuel Material UN
13
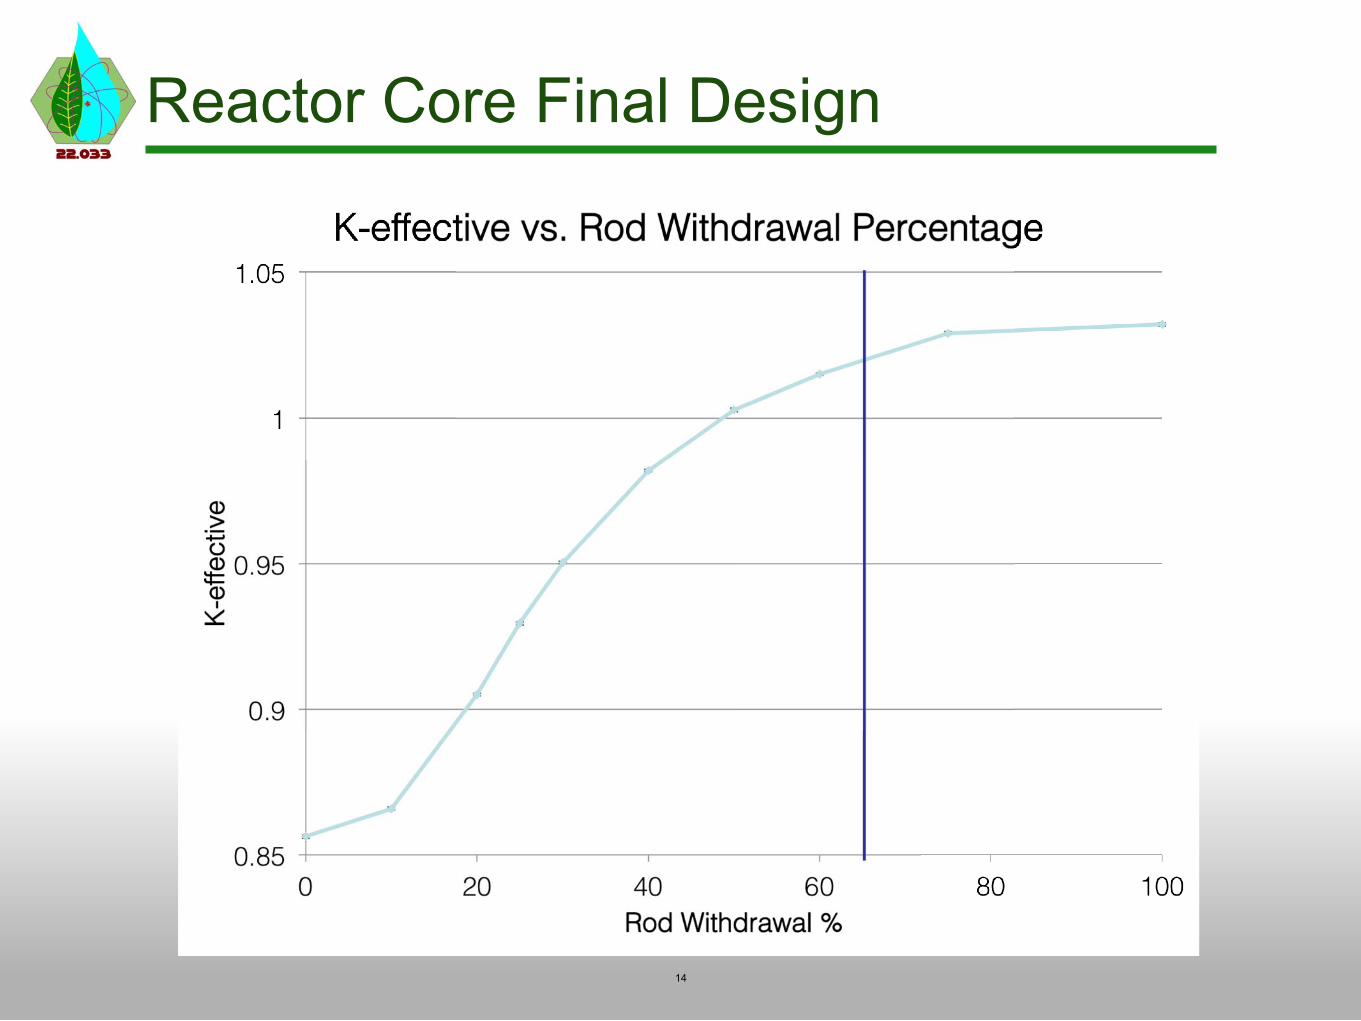
Reactor Core Final Design
14
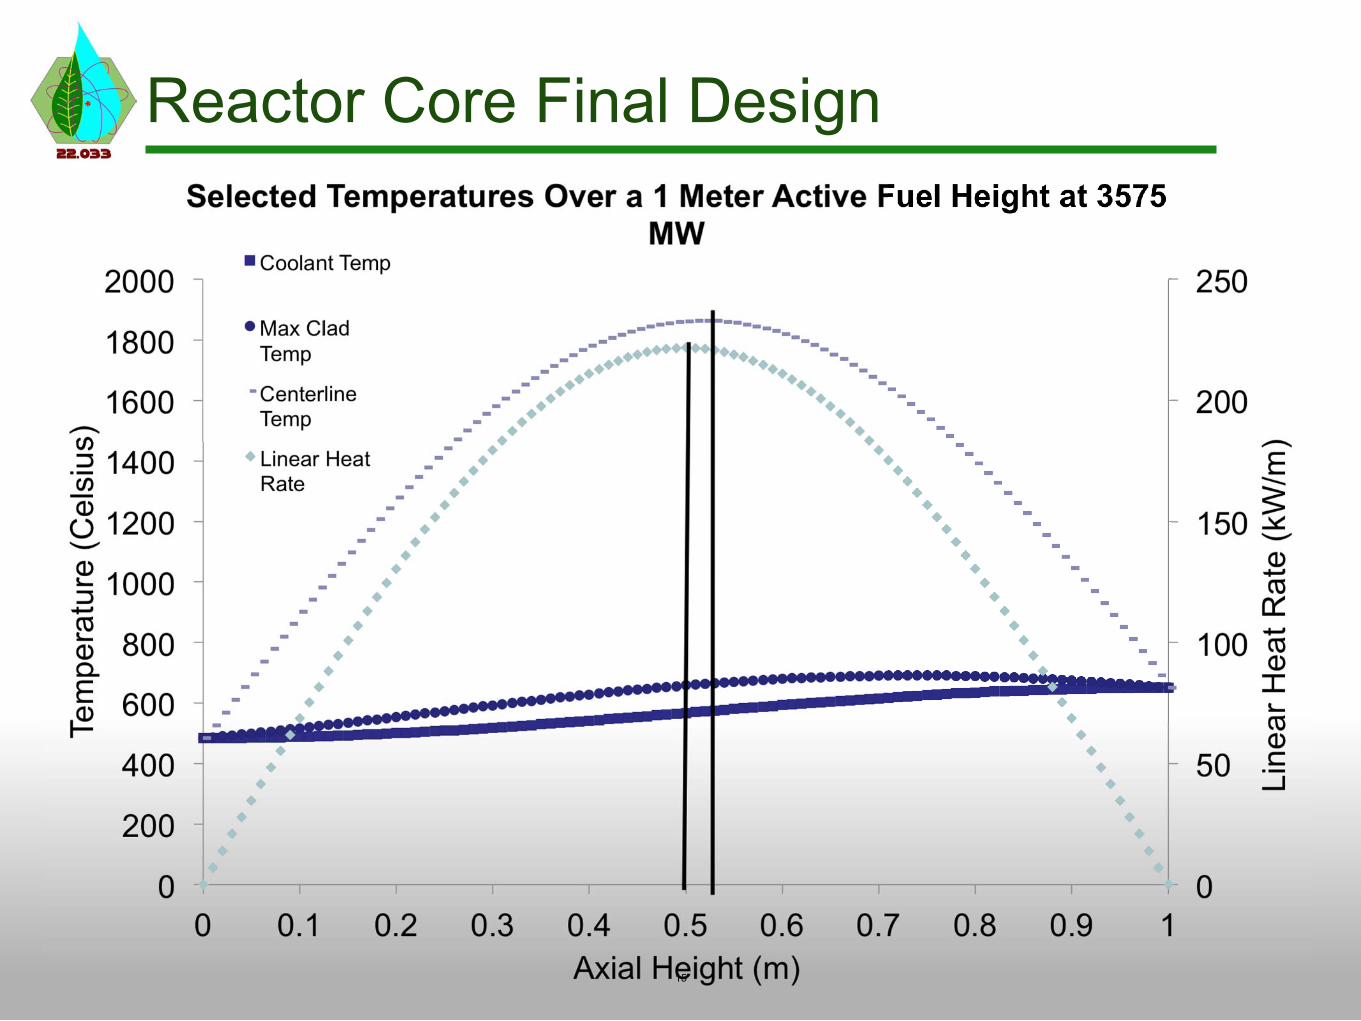
Reactor Core Final Design
15

Comparison of UN and UO2
UN UO2
Thermal Conductivity
21 W/mK 3-4 W/mK
Melting Point 2800° C 2800° C
Uranium Metal Density
13.60 g/cm3 9.67 g/cm3
Other Need to enrich the nitrogen
Long and safe operating history
16

Natural Circulation
• Natural circulation appears sufficient for heat removal at full
power.
• It is likely that pumping power/ extra heat insertion from the PCM will be needed to maintainflow during shutdown.
• Further analysis needed to determine benefits of laminar vs. turbulent regimes.
17
Plot of mass flux vs. inlet temperature given an outlet
temperature of 650° C for varying down channel diameters. R = 3m. B = 2m. G = 1m

Core Depletion
BOL Pu EOL Pu
Zone 1 (kg)
3342 3375
Zone 2 (kg)
2807 2849
Zone 3 (kg)
1982 2044
Total (kg)
8131 8268
% change
BOL U
0.99
19356
1.50
16254
3.13
11476
1.68
47086
EOL U 17935 14568 10154 42657
% change
BOL MA
-7.34
516
-10.37
433
-11.52
306
-9.41
1255
EOL MA 423 316 214 953
% change -18.02 -27.02 -30.07 -24.06
Estimated inventory changes from 2418 00MWt MIT core after 1800 days
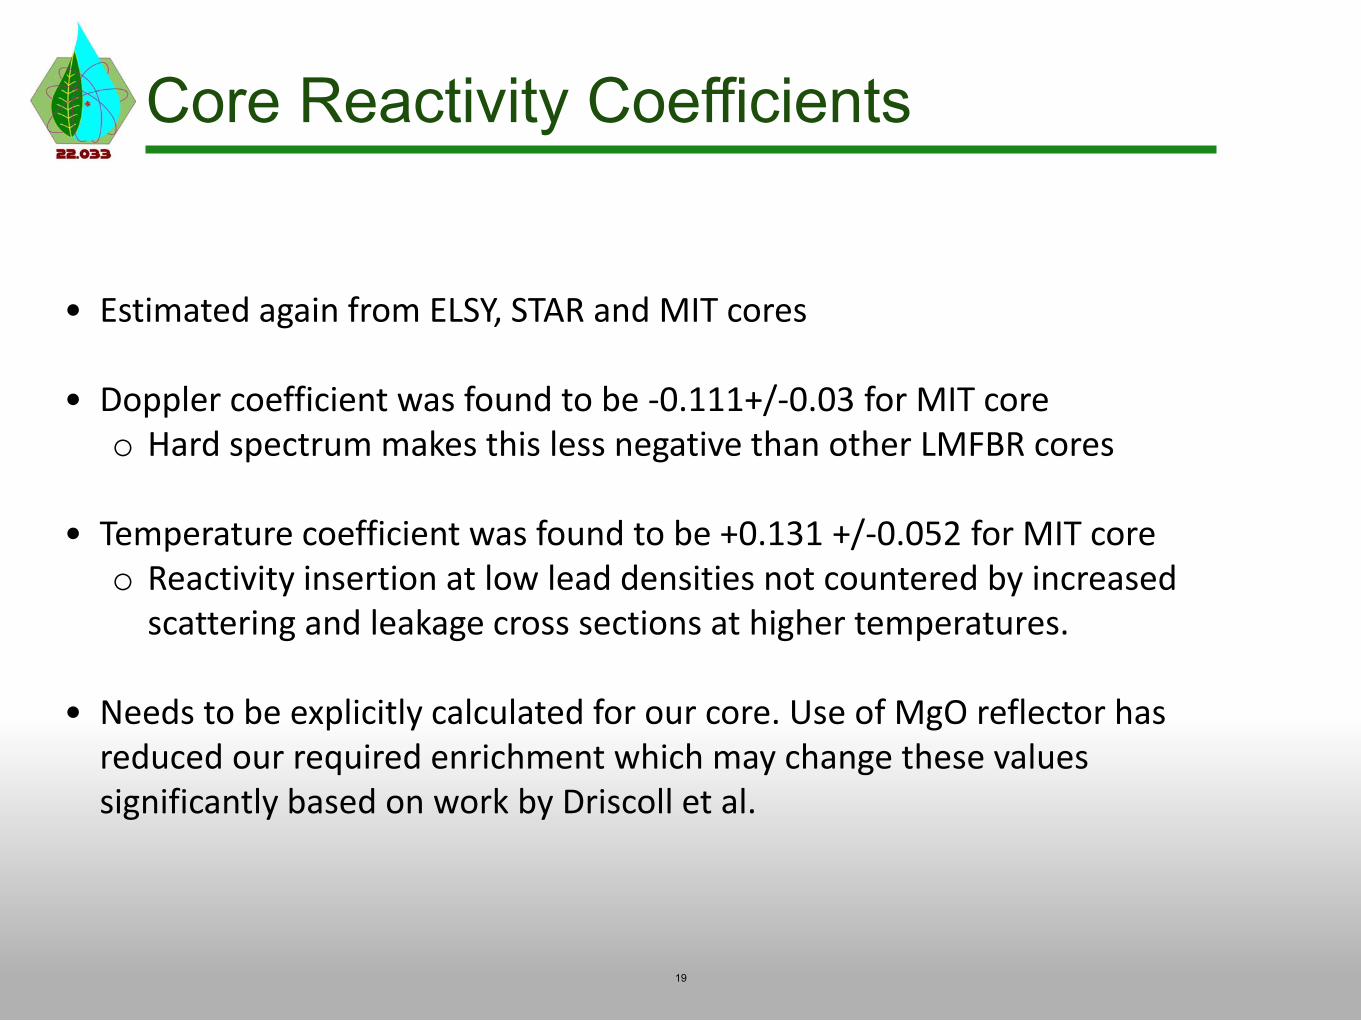
Core Reactivity Coefficients
• Estimated again from ELSY, STAR and MIT cores
• Doppler coefficient was found to be -0.111+/-0.03 for MIT core o Hard spectrum makes this less negative than other LMFBR cores
• Temperature coefficient was found to be +0.131 +/-0.052 for MIT core o Reactivity insertion at low lead densities not countered by increased
scattering and leakage cross sections at higher temperatures.
• Needs to be explicitly calculated for our core. Use of MgO reflector has reduced our required enrichment which may change these values significantly based on work by Driscoll et al.
19

Outlays of the System
• Electric Power
1000 MWe
• Plant Power
500 MWe
• Process Heat
315 MWt
20

Secondary System
21
Secondary System
• Modeled in EES
Temperature and mass flow calculations
Allows for faster optimization
Database provided enthalpy information for S-CO2
• Second turbine added to allow for greater efficiency
• Energy diverted to the Process Heat group does not significantly affect the secondary system (efficiency changes from 45.8% to 42.2%)
22
Shell and Tube Heat Exchanger
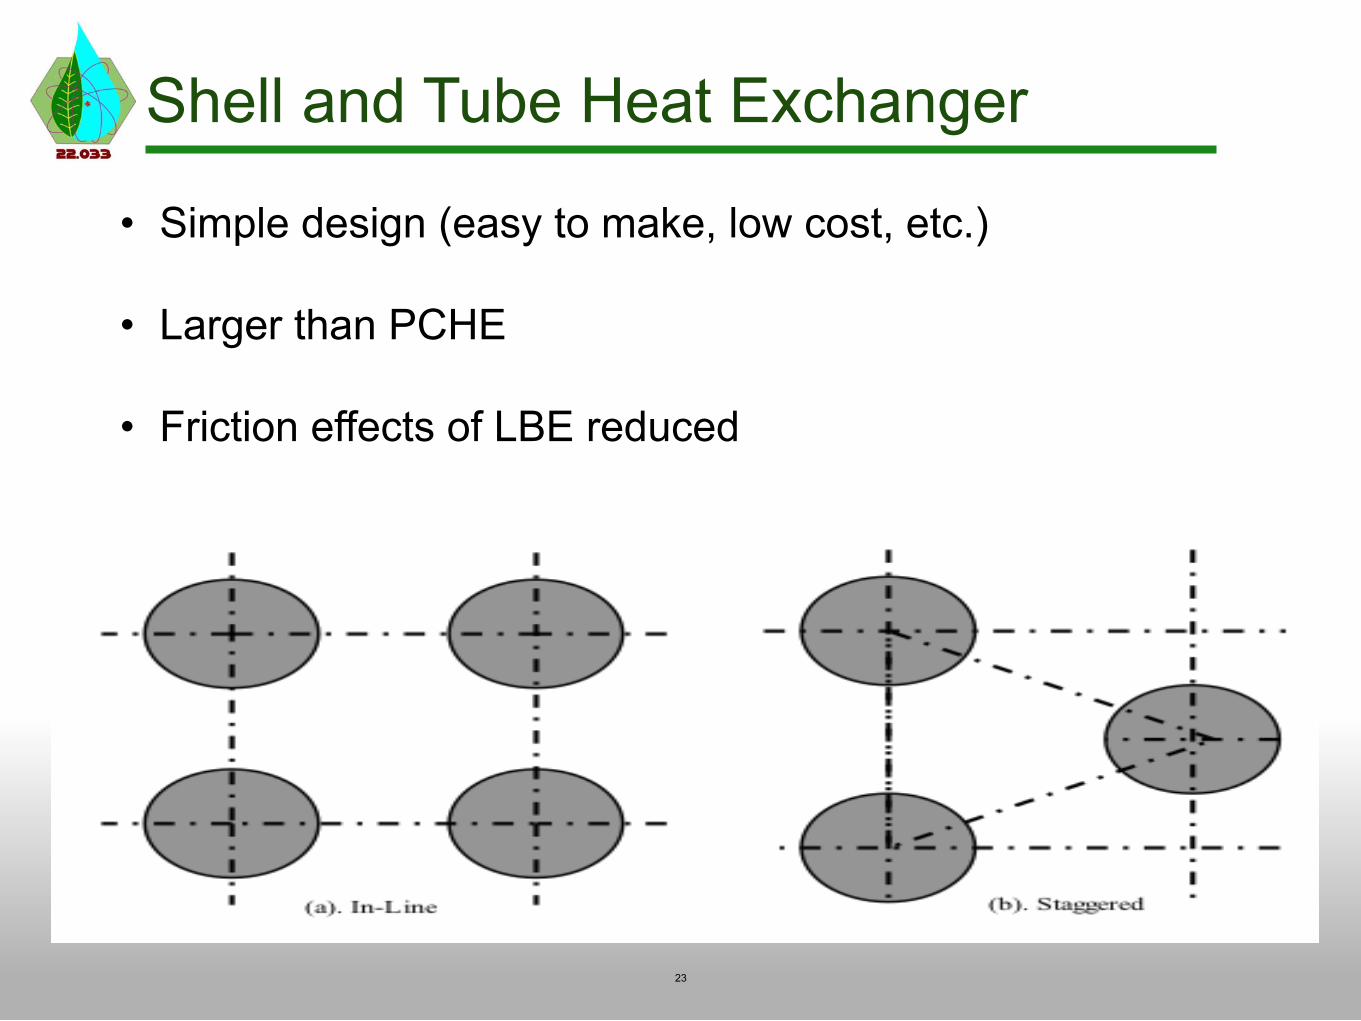
• Simple design (easy to make, low cost, etc.)
• Larger than PCHE
• Friction effects of LBE reduced
23
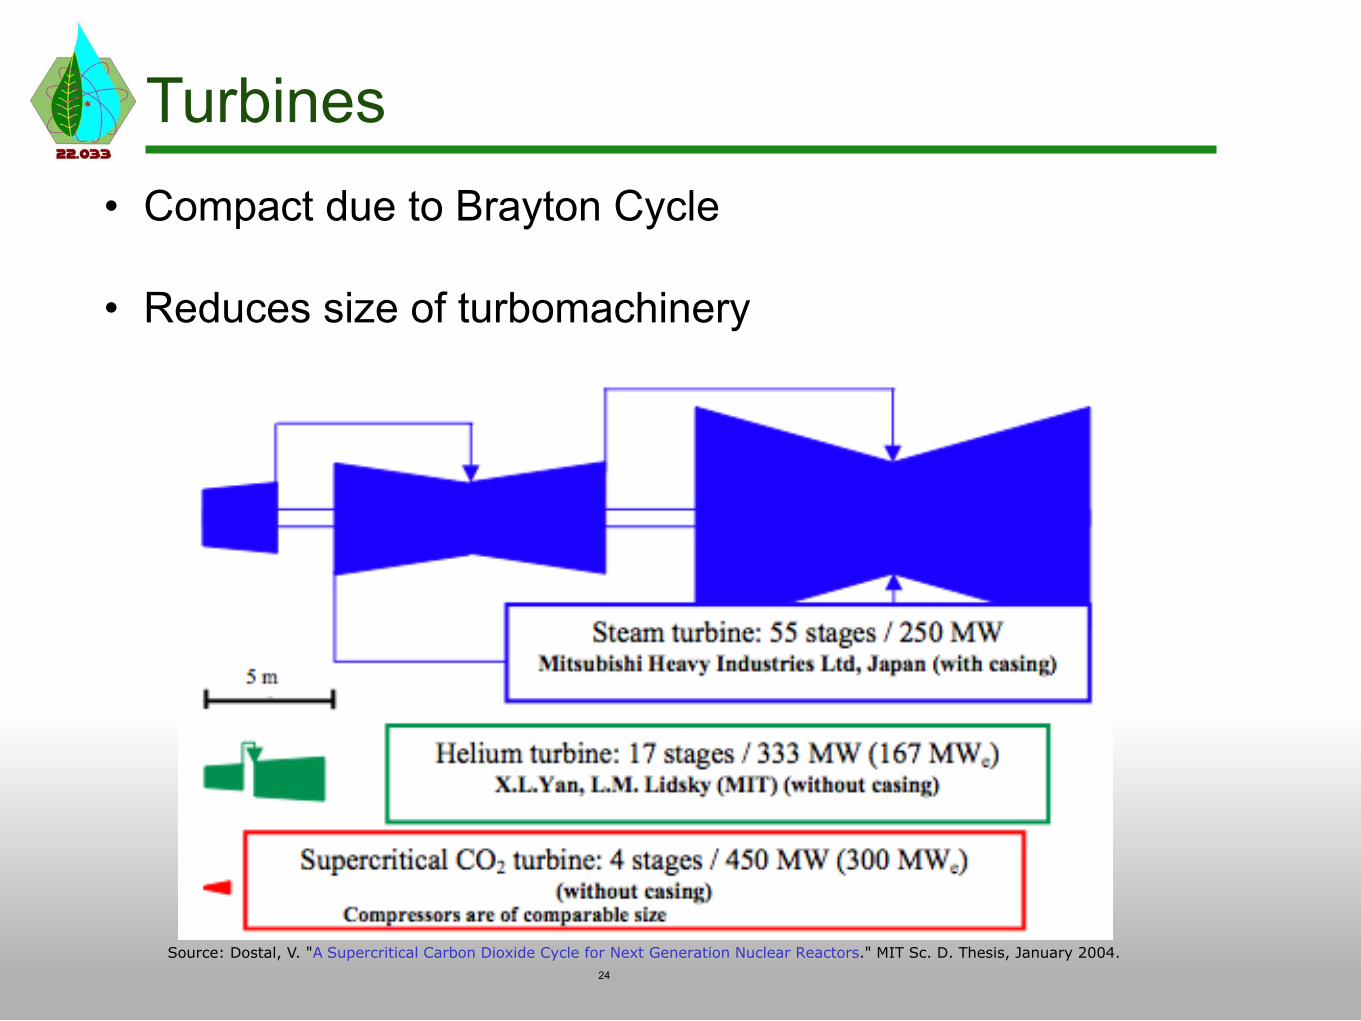
Turbines • Compact due to Brayton Cycle
• Reduces size of turbomachinery
Source: Dostal, V. "A Supercritical Carbon Dioxide Cycle for Next Generation Nuclear Reactors." MIT Sc. D. Thesis, January 2004.24
Future Work for Core
• Switch to alternate clad material or lower operating temperature OR both.
• Look at efficiency improvements in secondary system.
• Look at Uranium Carbide as alternate fuel.
• Full depletion and kinematic calculation.
• Determine if decay natural convection possible.
25
Process Heat
26
Outline
1. Goals
2. Heat Exchangers
3. Piping
4. Heat Storage
5. Future Work
27

Process Heat Goals
• Draw heat from the Core to provide steam to the Hydrogen and Biofuels plants
• Keep the LBE melted during reactor outage
• Design system for operation at high temperatures and pressures
28
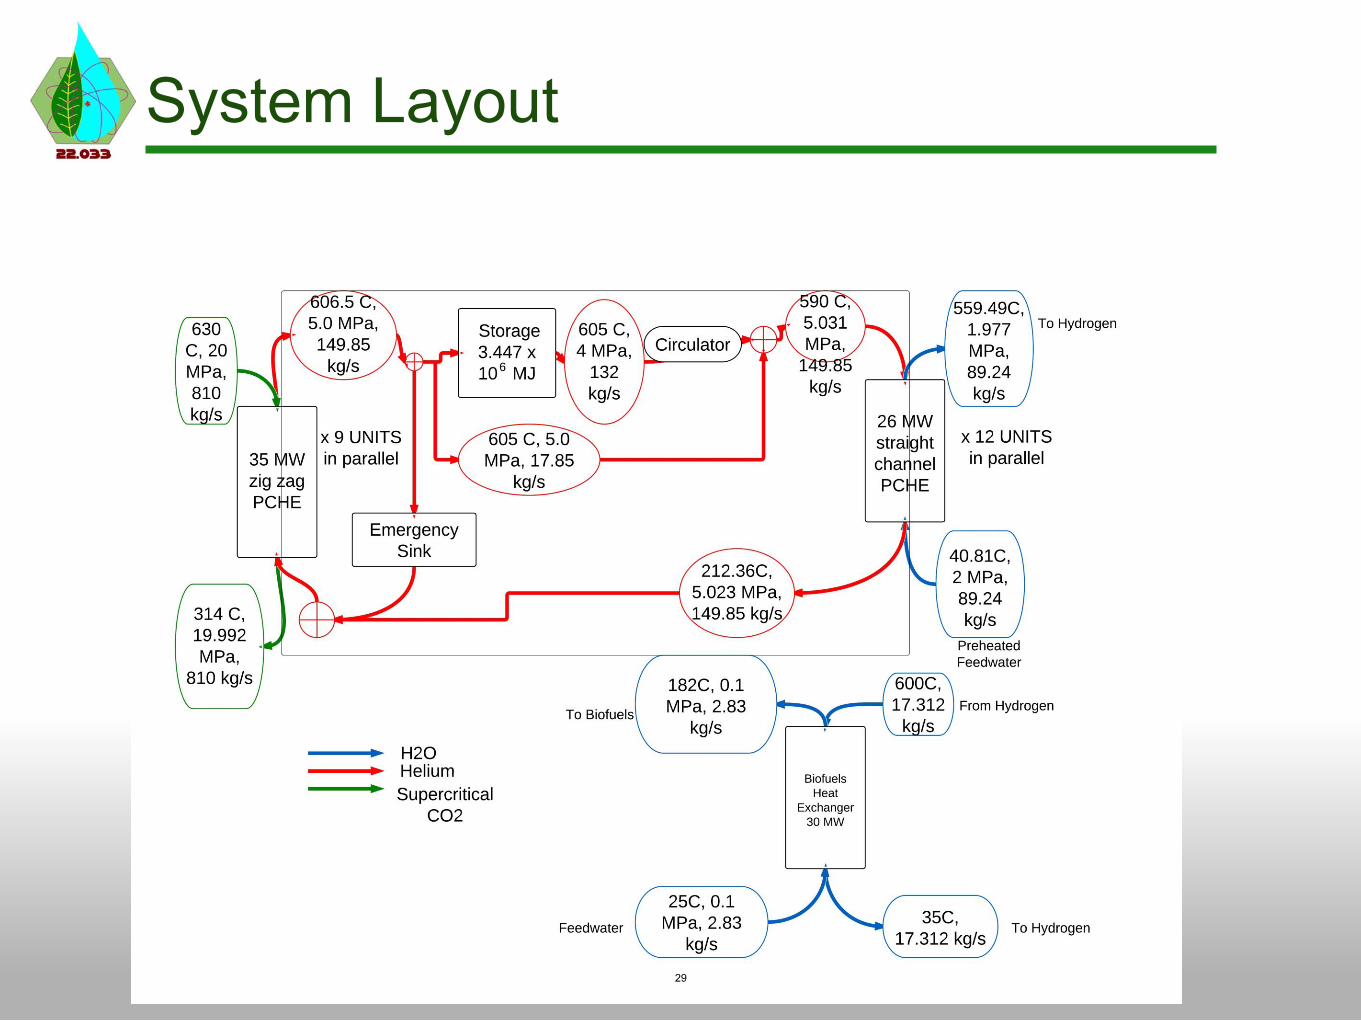
System Layout
29

System Pressure and Temperature Drops
System component Pressure drop [ kPa ] Temperature change [ C]
PCHE1 Hot side 8.043 -316
Cold side 23.749 +405.47
PCHE2 Hot side 9.812 -388
Cold side 13.874 +518.67
Heat storage
1000 -1.5
Piping (30m) 2.047 -0.041
30
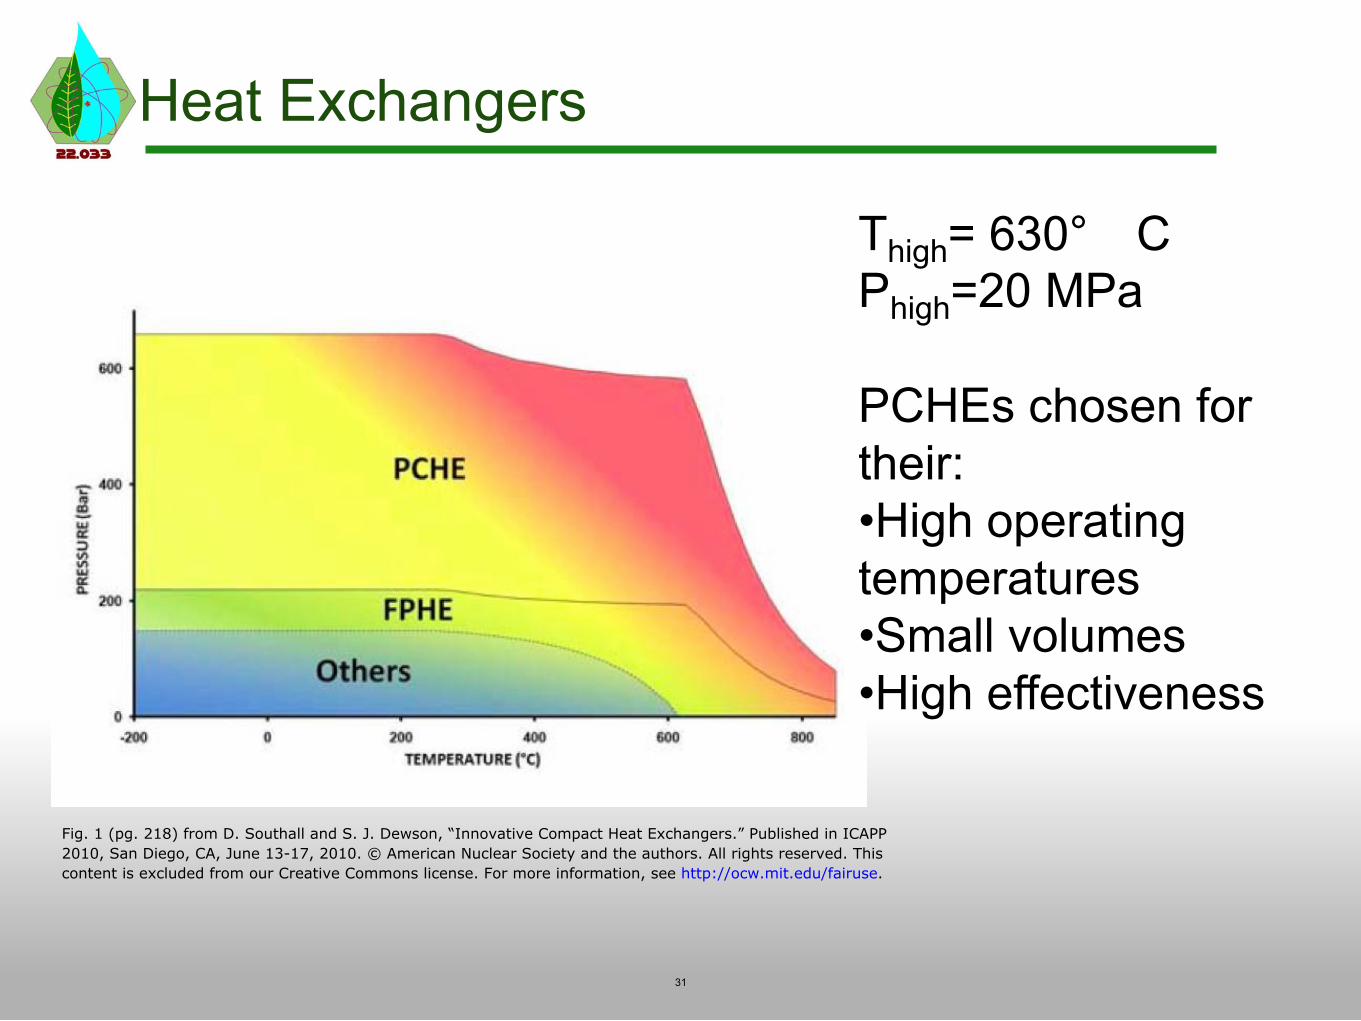
Heat Exchangers
Thigh= 630° C Phigh=20 MPa PCHEs chosen for their: •High operating temperatures •Small volumes •High effectiveness
31
Fig. 1 (pg. 218) from D. Southall and S. J. Dewson, “Innovative Compact Heat Exchangers.” Published in ICAPP2010, San Diego, CA, June 13-17, 2010. © American Nuclear Society and the authors. All rights reserved. Thiscontent is excluded from our Creative Commons license. For more information, see http://ocw.mit.edu/fairuse.

Working Fluid: Helium
Fluidat 5MPa
[200 C, 700 C]Heat Capacity
[J/kg-K]Viscosity
[Pa-s]
Carbon Dioxide (CO2)
1079.5, 1237.8 2.337 10-5, 4.064 10-5
Water/Steam (H2O) 4476.1, 2351.5 1.35 10-4, 3.678 10-
5
Helium (He) 5188.9, 5190.6 2.74 10-5, 4.533 10-
5
***data from webbook.nist.gov
32

PCHE Material: Alloy 617
Reasons for choosing Alloy 617: •Tensile strength •Thermal conductivity •Thermal expansion •Corrosion resistance •Ease of manufacturing •Design life of up to 60 years PCHEs will operate well below design stresses at all points in system
Source: Li, Xiqing., et al. “Alloy 617 for the High Temperature Diffusion-Bonded CompactHeat Exchangers.” Published in ICAPP 2008, Anaheim, CA, June 8-12, 2008. © AmericanNuclear Society and the authors. All rights reserved. This content is excluded from ourCreative Commons license. For more information, see http://ocw.mit.edu/fairuse.
33

Process Heat PCHEs
Parameter PCHE1 PCHE2
Heat rate/unit 35 MW 26 MW
Number of units 9 12
Total heat rate 315 MW 312 MW
Hot fluid S-CO2 He
Cold fluid He H2O
Channel configuration
zigzag straight
location S-CO2 loop Hydrogen plant
Total htc 1087.71 W/m2K
735 W/m2K
Volume m38.25
m315.6
*HEATRIC's quote for steel $/kg cost used
34

PCHE1: Temperature and Heat Flux Profiles
• Zigzag flow channels
• Counterflow
• Single-phase forced convection
• No swings in temperature or heat flux
• S-CO2: turbulent
• He: laminar
35

PCHE1: Temperature and Heat Flux Profiles
• Straight channels
• Counterflow
• Two-phase flow
• Unphysical behavior to the left of x=0.68m
• Exclude this region
• Both fluids laminar
• Large swings in temperature and heat flux!
• Design as three separate HXs? 36
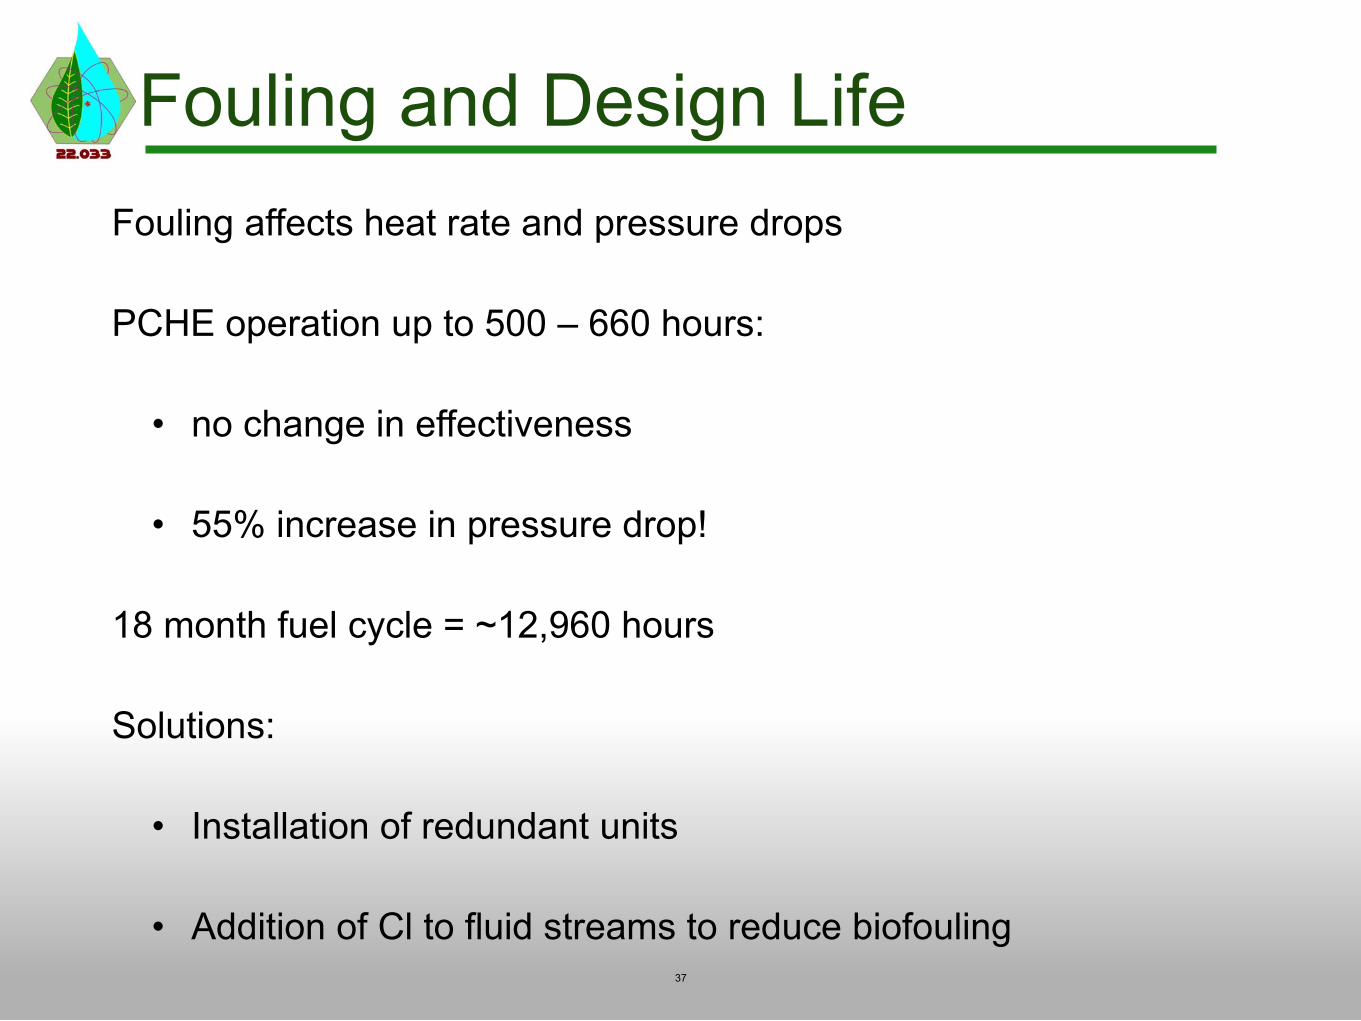
Fouling and Design Life Fouling affects heat rate and pressure drops
PCHE operation up to 500 – 660 hours:
• no change in effectiveness
• 55% increase in pressure drop!
18 month fuel cycle = ~12,960 hours
Solutions:
• Installation of redundant units
• Addition of Cl to fluid streams to reduce biofouling 37
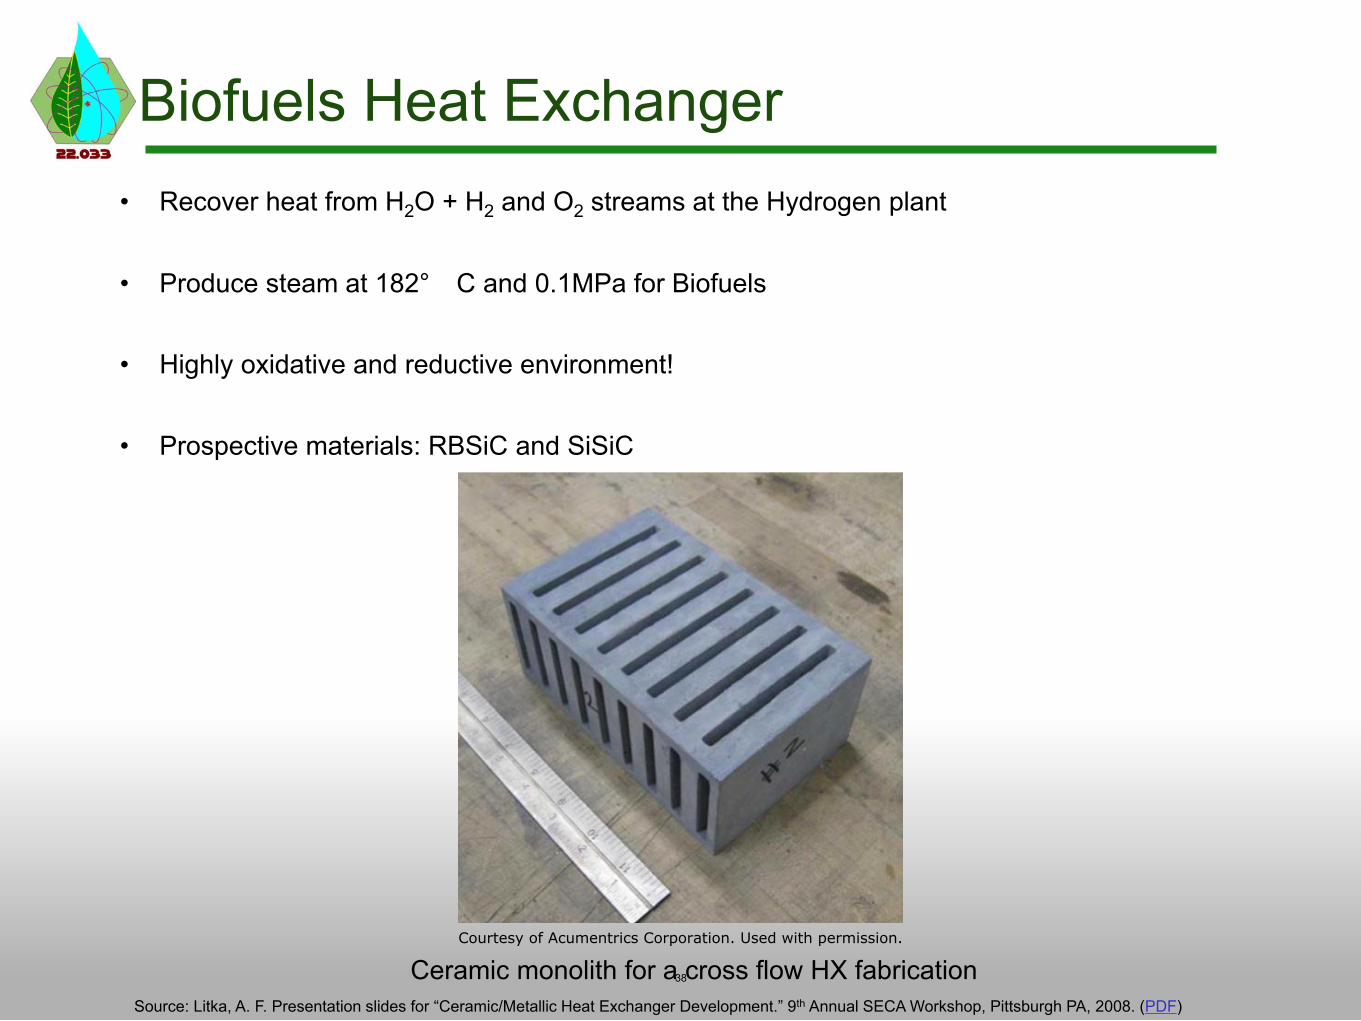
Biofuels Heat Exchanger • Recover heat from H2O + H2 and O2 streams at the Hydrogen plant
• Produce steam at 182° C and 0.1MPa for Biofuels
• Highly oxidative and reductive environment!
• Prospective materials: RBSiC and SiSiC
Courtesy of Acumentrics Corporation. Used with permission.
Ceramic monolith for a cross 38 flow HX fabrication Source: Litka, A. F. Presentation slides for “Ceramic/Metallic Heat Exchanger Development.” 9th Annual SECA Workshop, Pittsburgh PA, 2008. (PDF)
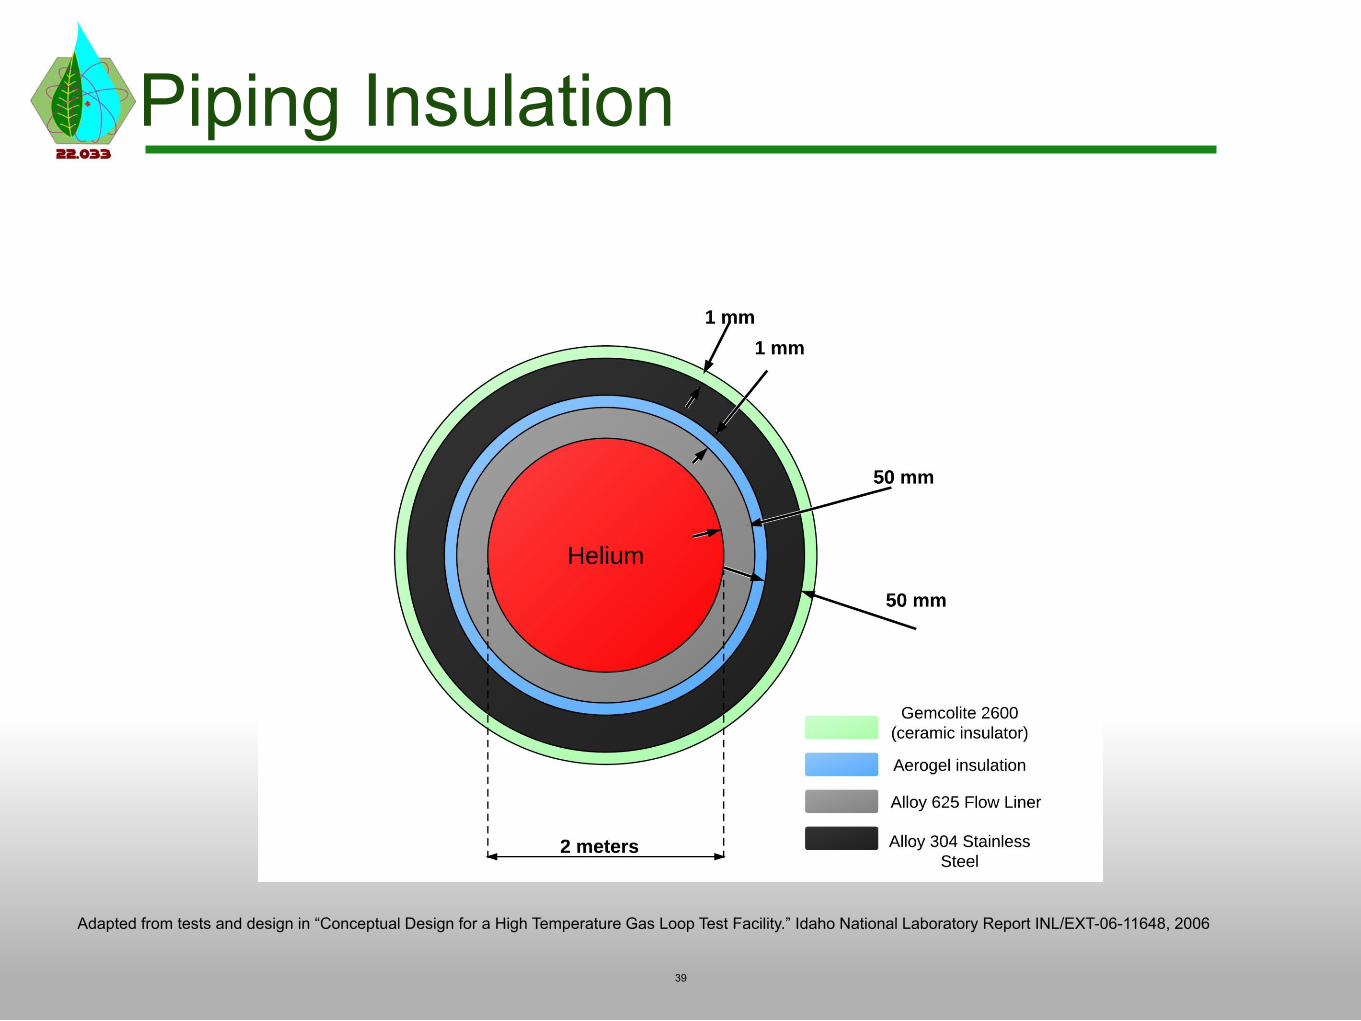
Piping Insulation
Adapted from tests and design in “Conceptual Design for a High Temperature Gas Loop Test Facility.” Idaho National Laboratory Report INL/EXT-06-11648, 2006
39

PCM: Lithium Chloride (LiCl) Property Value
Melting Point 605° C Δh° fusion 470 kJ/kg c_p (solid) 1.132 kJ/kg-K
40
Source: http://en.wikipedia.org/wiki/File:Lithium_chloride.jpg (public domain image)
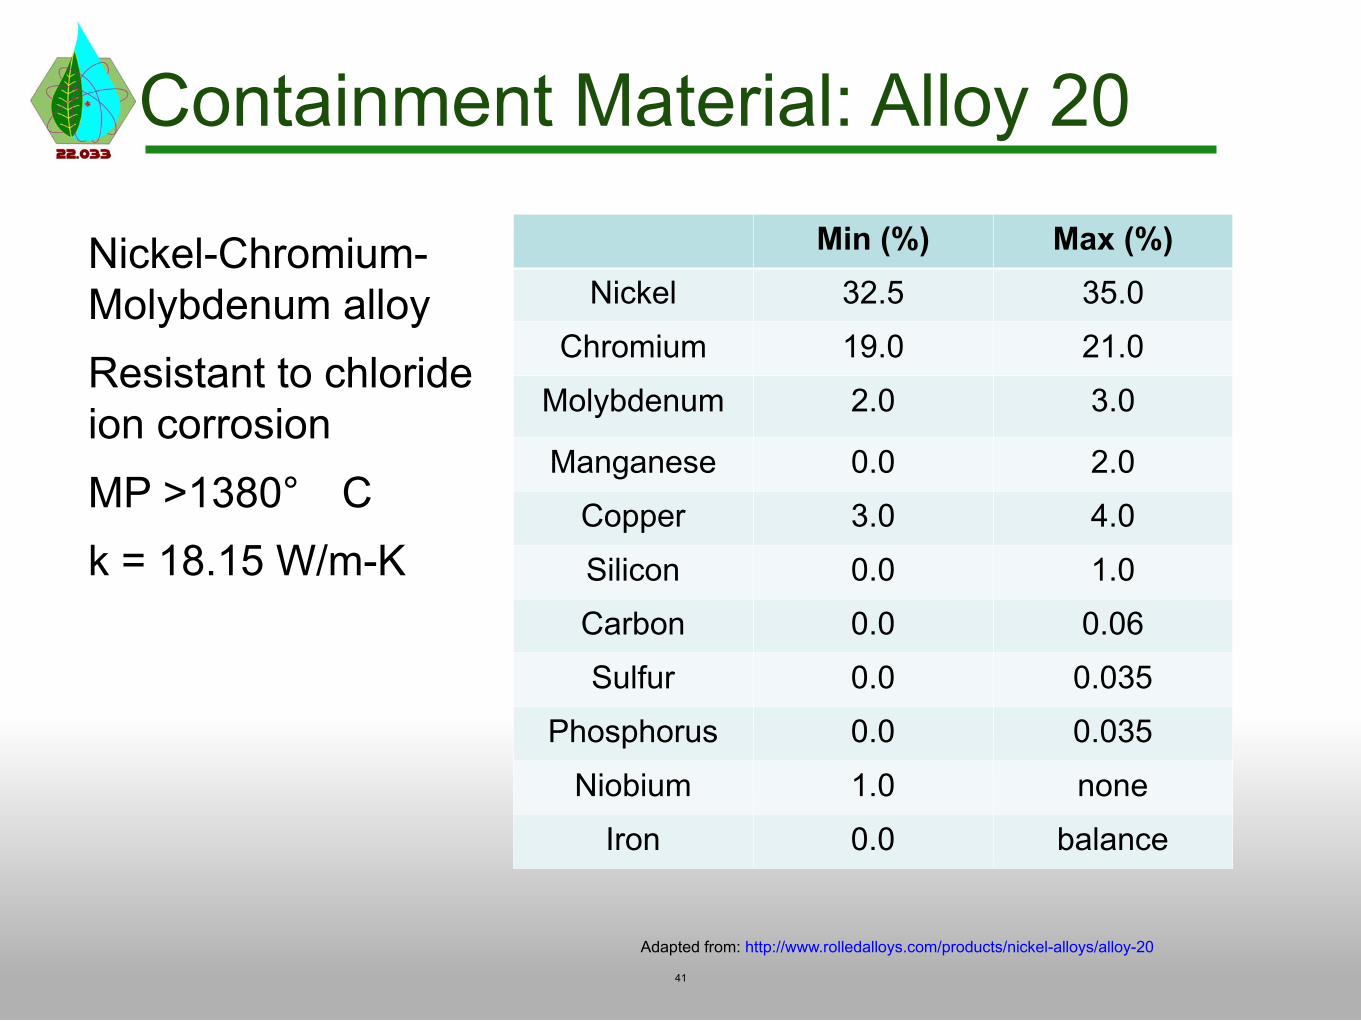
Containment Material: Alloy 20
Nickel
Min (%)32.5
Max (%)35.0
Chromium 19.0 21.0
Molybdenum 2.0 3.0
Manganese
Copper
Silicon
0.0
3.0
0.0
2.0
4.0
1.0
Carbon 0.0 0.06
Sulfur 0.0 0.035
Phosphorus
Niobium
0.0
1.0
0.035
none
Iron 0.0 balance
Adapted from: http://www.rolledalloys.com/products/nickel-alloys/alloy-20
41
Nickel-Chromium-Molybdenum alloy Resistant to chloride ion corrosion MP >1380° C k = 18.15 W/m-K

Storage – Heat Exchanger
42
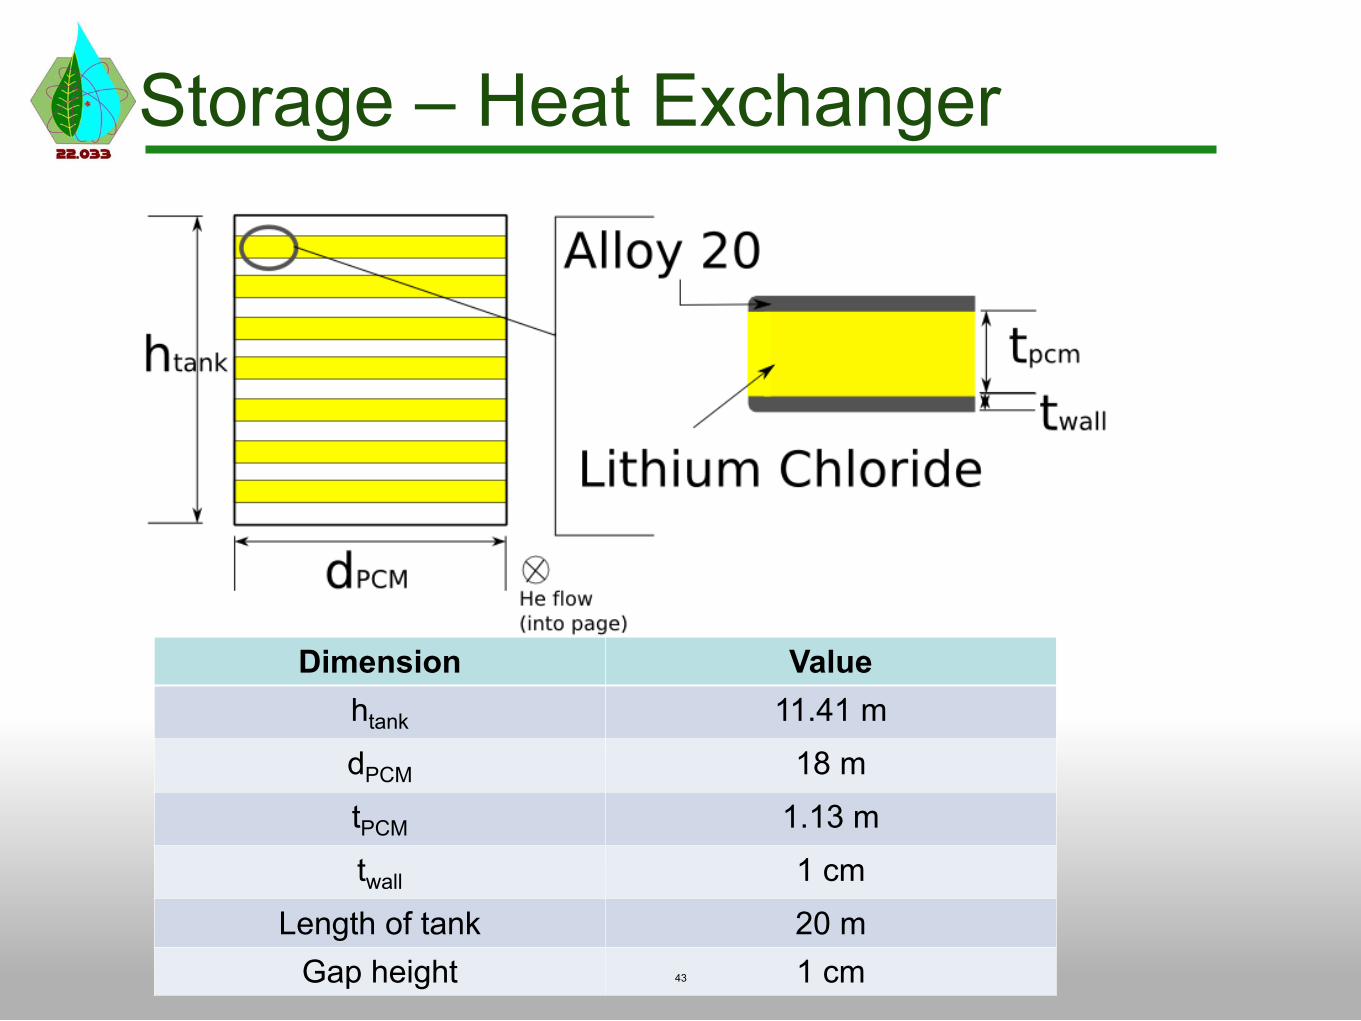
Storage – Heat Exchanger
Dimension Value htank 11.41 m
dPCM 18 m
tPCM 1.13 m
twall 1 cm
Length of tank 20 m Gap height 1 cm 43
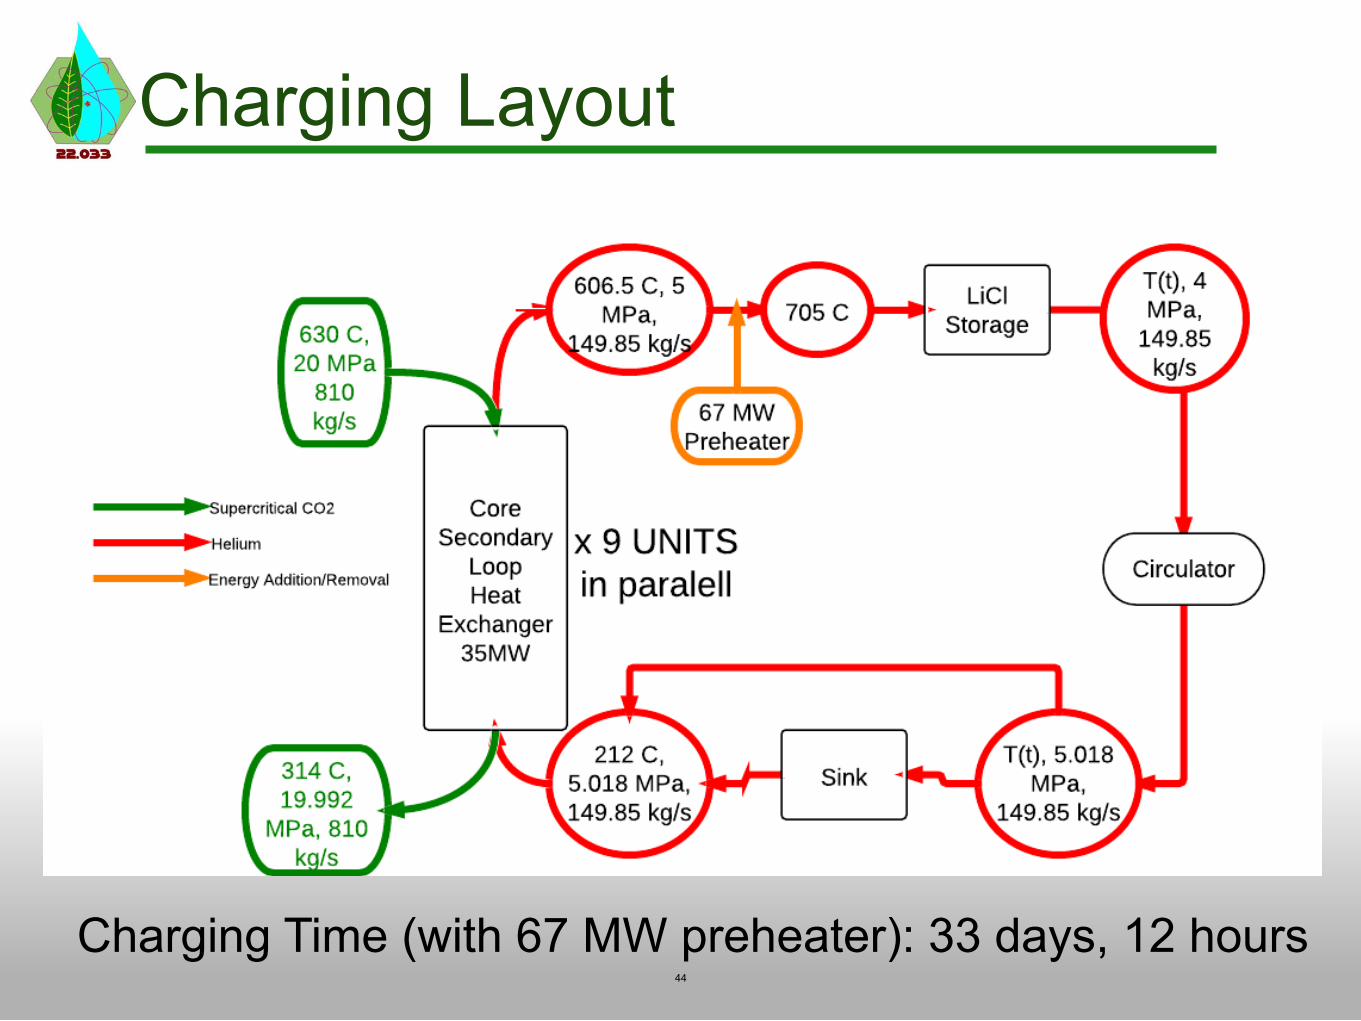
Charging Layout
Charging Time (with 67 MW preheater): 33 days, 12 hours 44
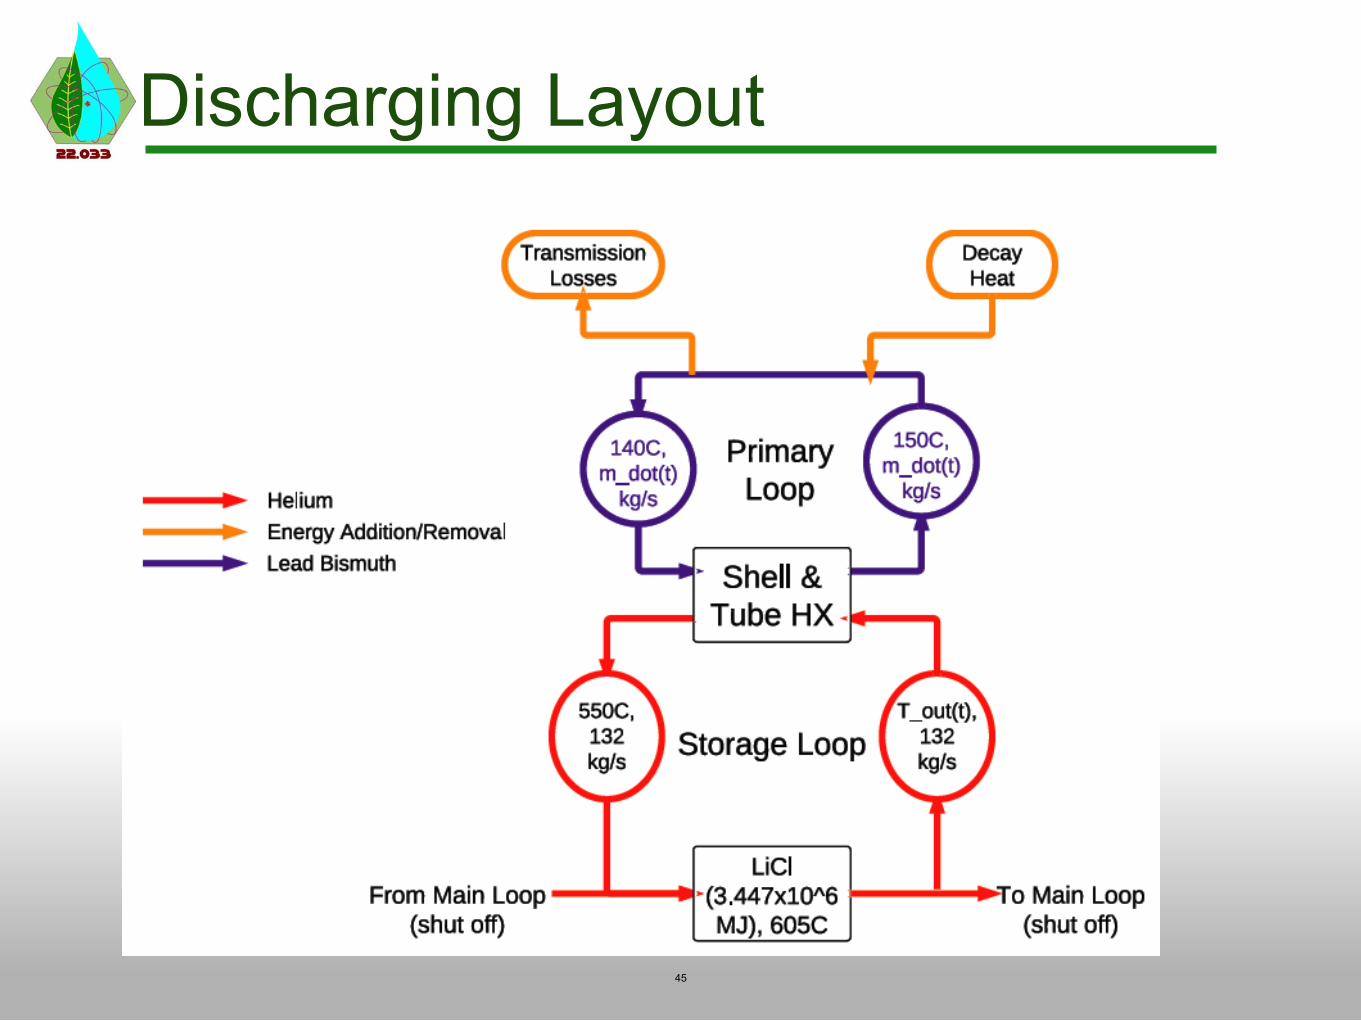
Discharging Layout
45

Emergency Scenarios Storage: LiCl leak
• Reroute He flow around storage and compressor
Heat Sink
• Average Decay Heat from core process heat 1 hr after shutdown: 5MW
• Maximum temperature change of water : 10° C
• Volumetric flow rate of seawater : 455 gallons/second
• Ti plate type HX specifically for marine applications
• Outlet diffusers to reach thermal equilibrium quicker/minimize environmental impact
46

Future Work: Process Heat
• Compare PCHEs with Shell and Tube designs
• Split PCHE2 into multiple stages
• PCHE fouling factors
• Correction factors for determining CHF values for semi-circular channels
• mdot(t) of LBE
• Ensure that ΔT of 10° C is enough to keep LBE molten even for lowest mdot
• Effects of a support system on He flow
• Insulation: steady state and during shutdown
47

Hydrogen Production Plant
48

Outline
1. Engineering Objectives
2. Options for Hydrogen Production
3. UT-3
• Plant Diagram
4. HTSE
• Plant Diagram
• Materials
5. Future Work
49

Engineering Objectives
• Meet biofuel’s hydrogen requirement • Maximize use of process heat • Minimize electricity use • Zero greenhouse emissions
50

Options for Hydrogen Production
ES: Water Electrolysis SMR:Steam Methane Reforming HTSE: High Temperature Steam Electrolysis UT-3:University of Tokyo-3 SI: Sulfur-Iodine Process (Ca-Br-Fe Thermochemical Cycle)
51

UT-3 Hydrogen Production Process1
• Bromination of calcium oxide, acidity, leads to
material concerns.
1H.Kameyama and K. Yoshida. Br-ca-fe water decomposition cycles for hydrogen production. Proc. 2nd, WHEC., pages 829–850, 1978.
52
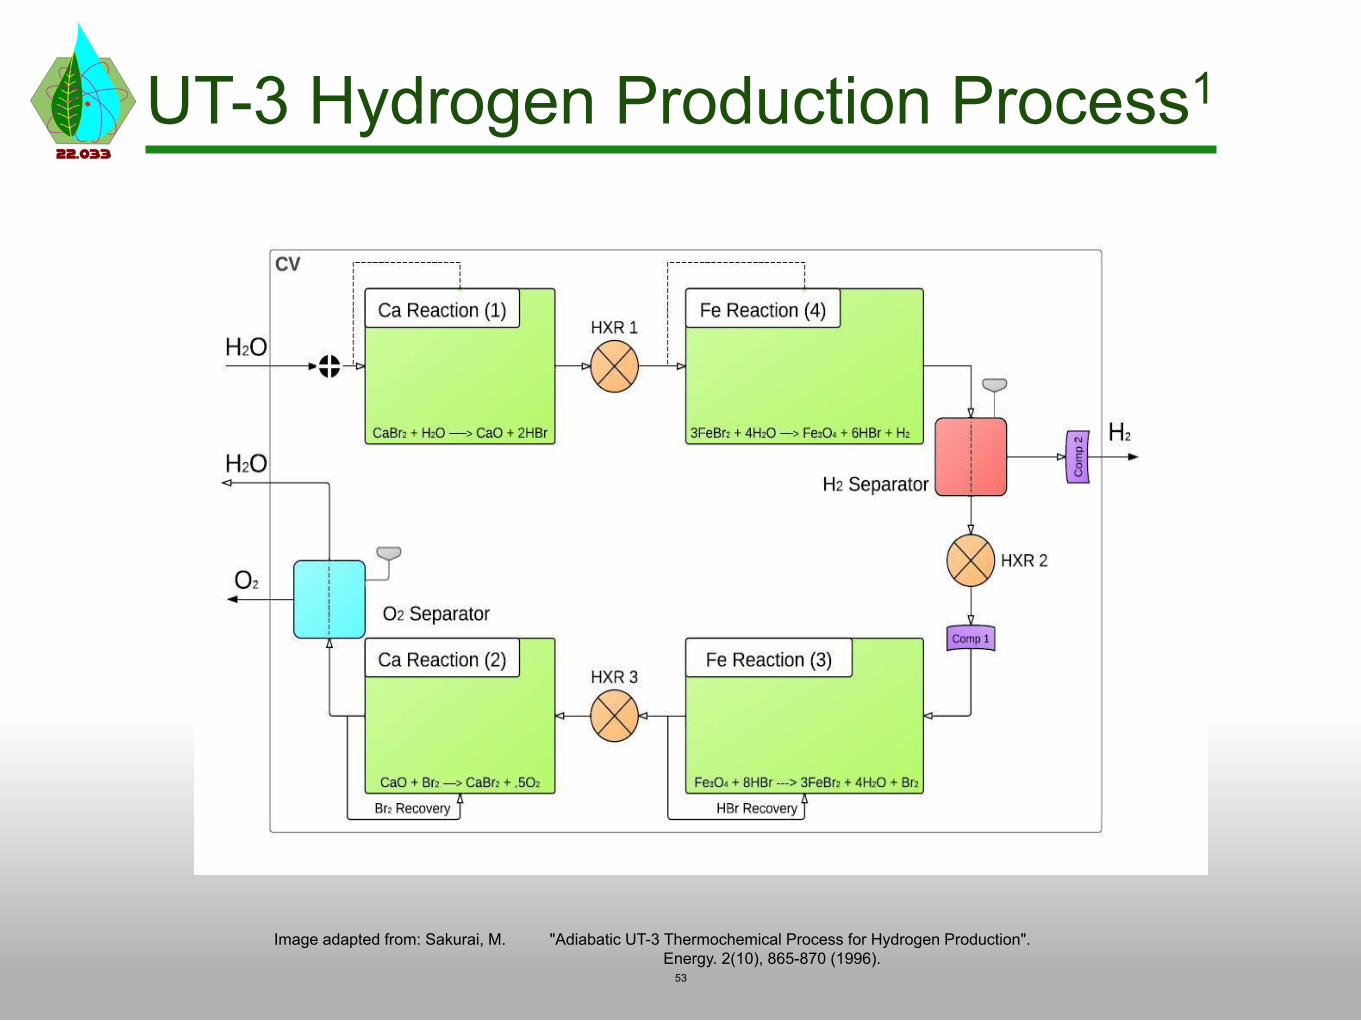
UT-3 Hydrogen Production Process1
Image adapted from: Sakurai, M. "Adiabatic UT-3 Thermochemical Process for Hydrogen Production". Energy. 2(10), 865-870 (1996).
53
Complications
• Necessary steam temperature could no longer be provided.
• Electric power required larger than reactor output.
• New hydrogen production design required
54

High Temperature Steam Electrolysis
Image from: U.S. DOE fact sheet for high-temperature electrolysis
55

Solid Oxide Electrolysis Cell (SOEC)
Material Requirements
Electrolyte: • Dense • Chemically stable • High ionic conductivity • Gas-tight (no H-O recombination) • Thin (minimize Ohmic resistance)
Electrodes:
• Porous, allows gas transportation • Similar thermal expansion
coefficient to electrolyte
Courtesy of Elsevier, Inc., http://www.sciencedirect.com. Used with permission.
56

Electrolyte Material Name Type Ionic
Conductivity (S/cm)
Optimal Temperature (K)
Comments
YSZ Stabilized zirconia 0.13 1273 Overall best choice
ScSZ
Stabilized zirconia 0.18 1273 Exorbitant cost
LSGM Doped LaGaO3 0.17 973 Requires reduced operating
temperature; problematic reaction between LSGM and
Ni
GDC Ceria-based oxides 0.10 1073 Chemically unstable
SDC Ceria-based oxide 0.08 1073 Chemically unstable
BaCeO3 Proton-conducting electrolyte
0.08 1073 Low conductivity
57
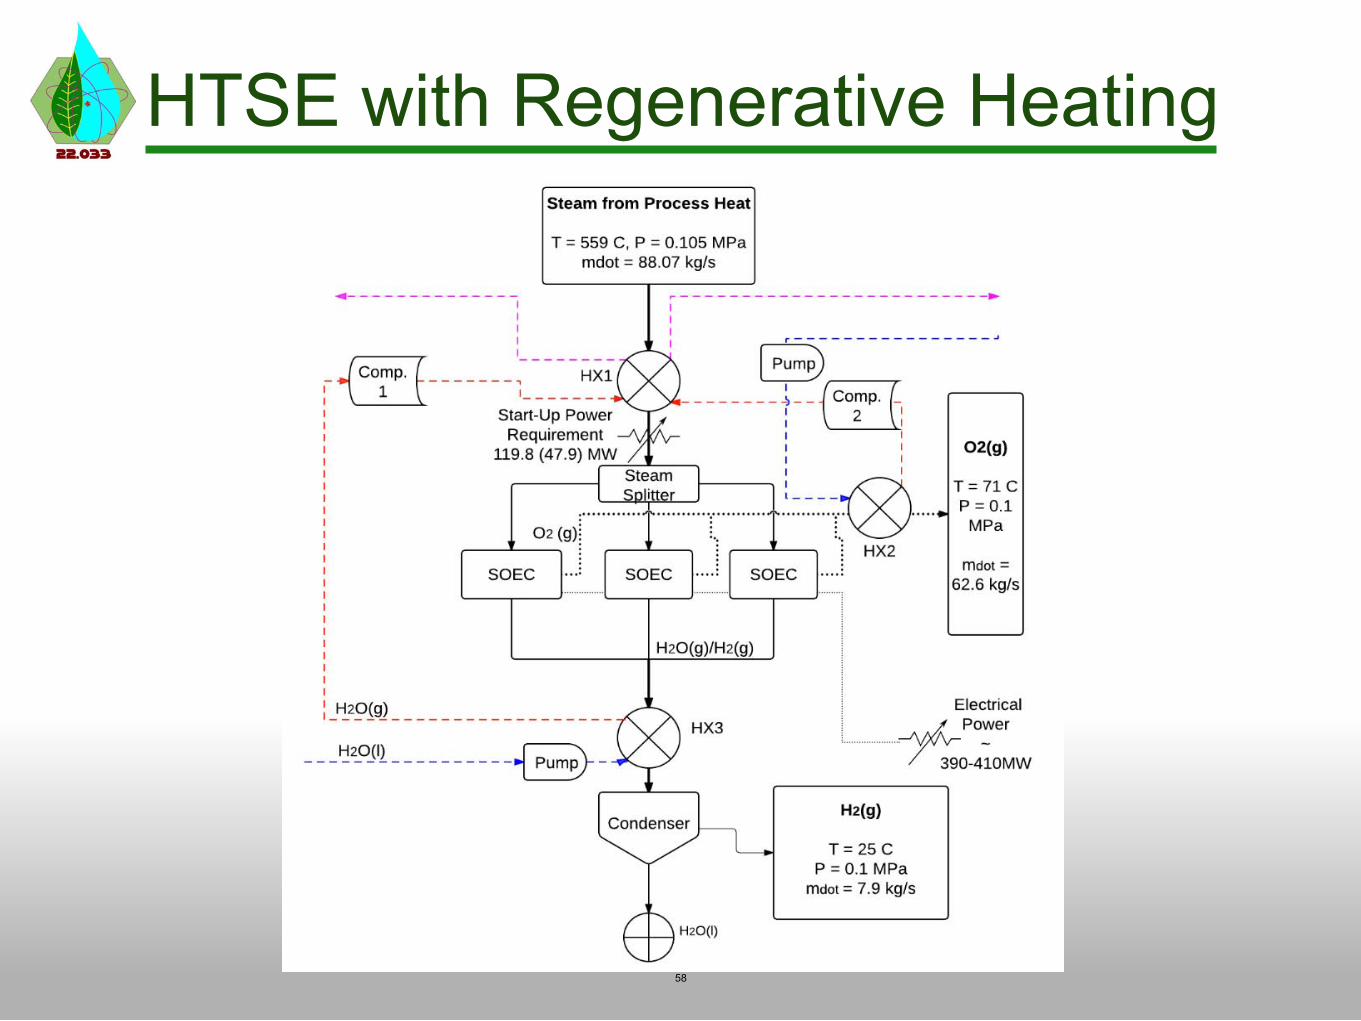
HTSE with Regenerative Heating
58

Future Work: Hydrogen Plant
• Determine electrical requirement to better accuracy.
• Possibly simulate HTSE plant to address efficiency.
59

Biofuels Production Plant
60

Outline
1. Goals
2. Overall Design of Biofuels Plant
3. Switchgrass
4. Gasification
5. Acid Gas Removal
6. Fischer-Tropsch Reactor
7. Distillation and Refining
8. Final Products and Concluding Thoughts
61

Biofuels Production Plant Goal
• Produce biofuels
• Large scale
• High quality
• Use nuclear power plant
• Process heat
• Electricity
• Hydrogen production plant
62

Acid Gas Removal
Fischer-Tropsch Reactor
Gasification
Hydrogen Heat
Distillation & Refining
63
Photo of switchgrass by Stephen Ausmus(USDA), public domain image.
Biofuels Process Overview Steam, Heated Air
Image by MIT OpenCourseWare.
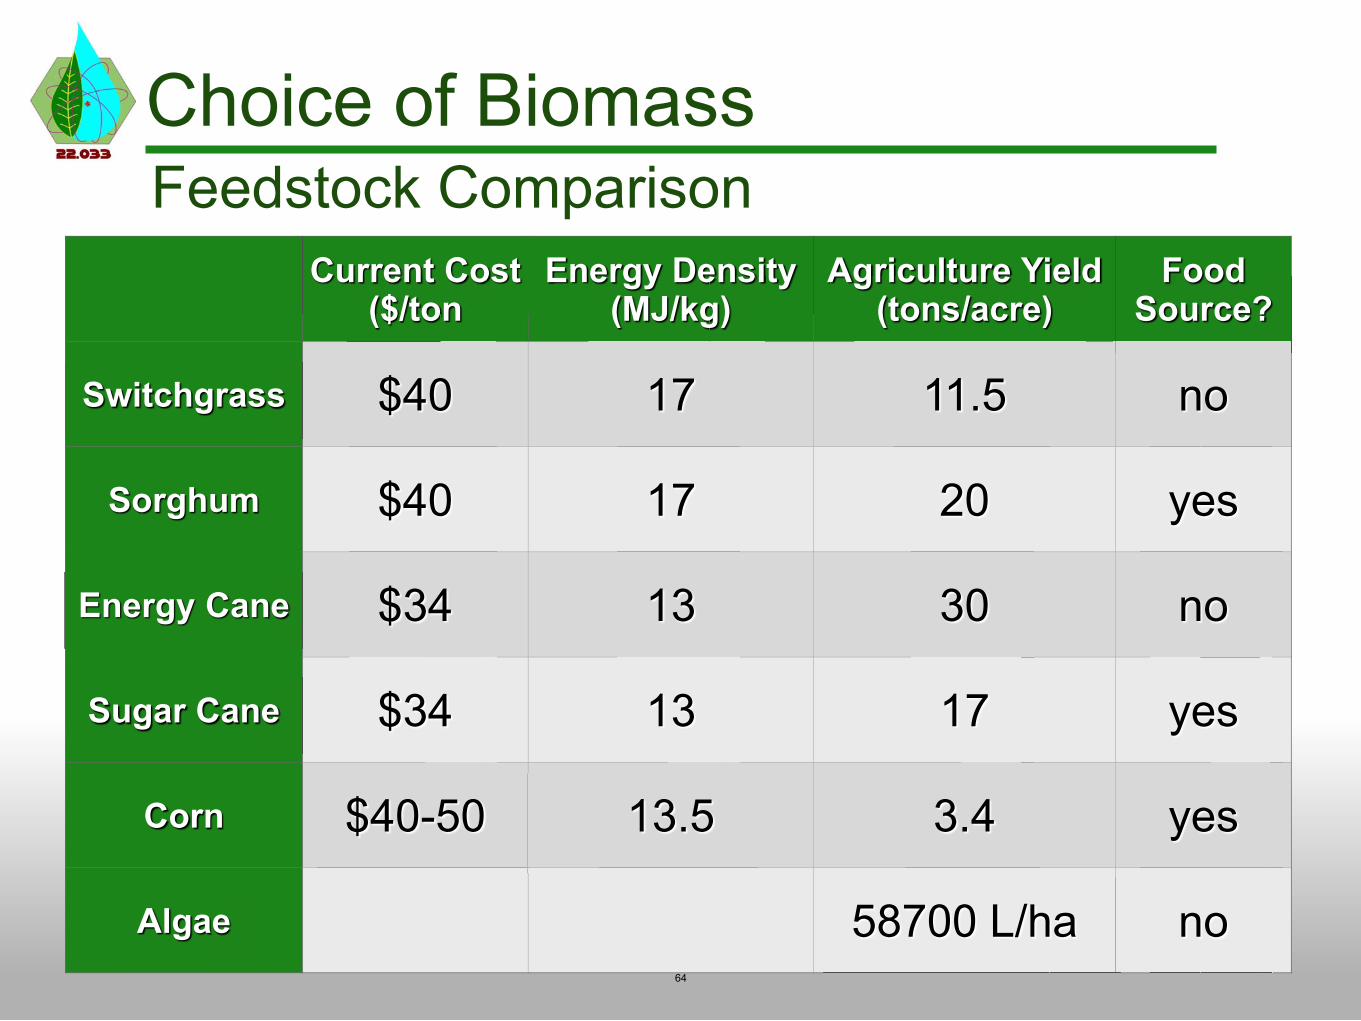
Choice of Biomass eedstock Comparison F
Current Cost ($/ton
Energy Density (MJ/kg)
Agriculture Yield (tons/acre)
FoodSource?
Switchgrass $40 17 11.5 no
Sorghum $40 17 20 yes
Energy Cane $34 13 30 no
Sugar Cane $34 13 17 yes
Corn $40-50 13.5 3.4 yes
Algae 58700 L/ha no 64

Switchgrass Growth (Mg/ha)
Map courtesy of Pacific Northwest National Laboratory, operated by Battelle for the U.S. Department of Energy.
65
Switchgrass Optimal Growing Locations in U.S.
Map produced by the National Renewable Energy Laboratory for the U.S. Department of Energy.
66
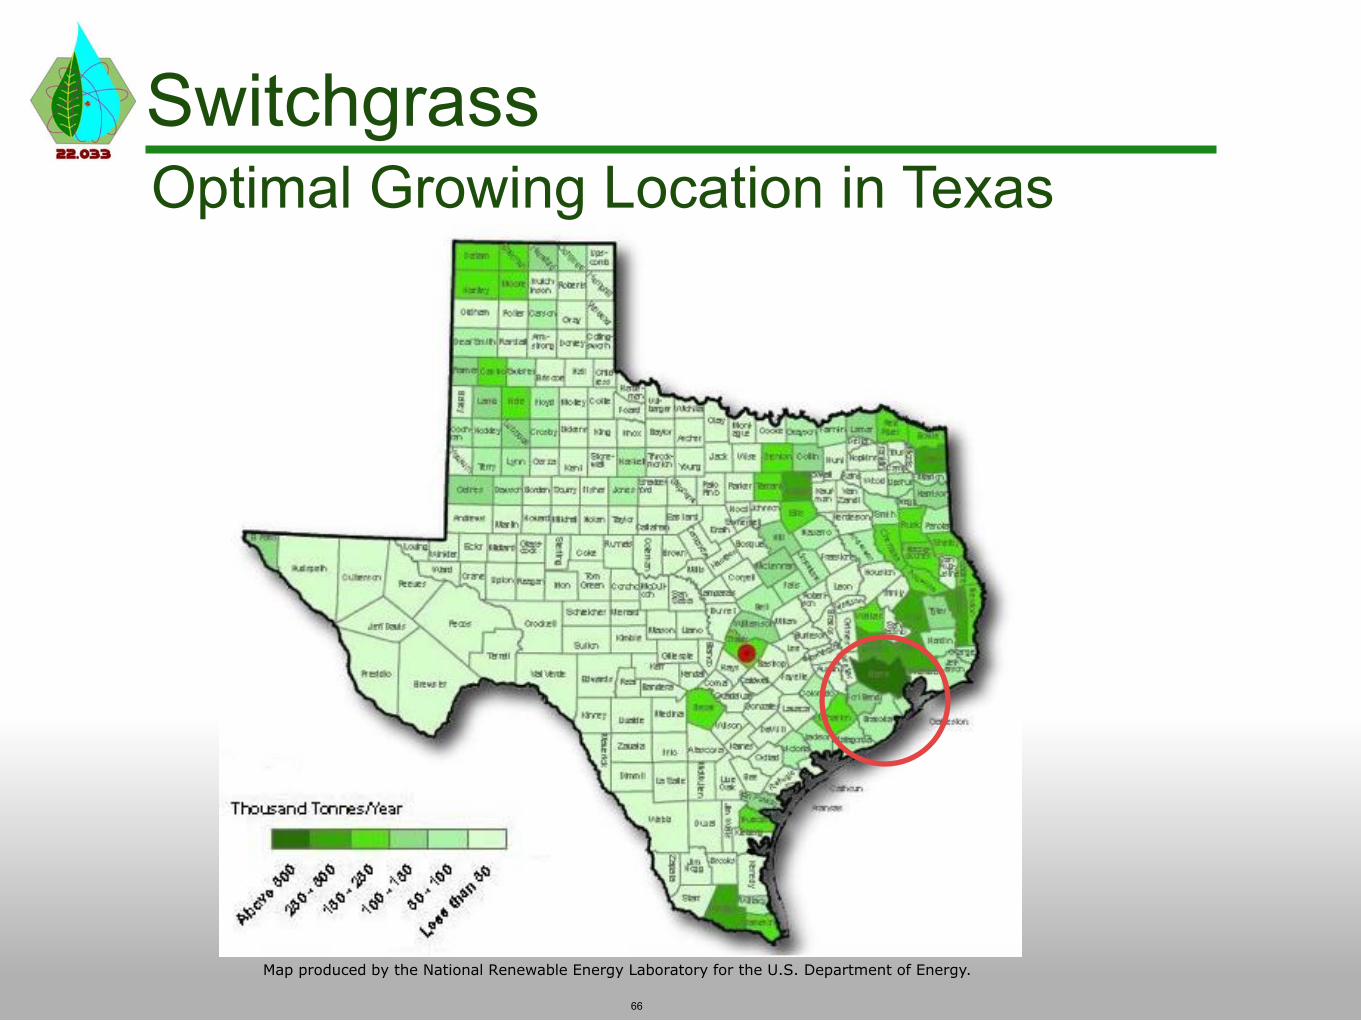
Switchgrass Optimal Growing Location in Texas

• Outsource to local farmers job creation • Quantity: 2903 tons/day
• 85 flat bed trucks/day carrying 33.3• 13 closed hopper cars at full capaci
• Pelletize to 1300 kg/m3
Switchgrass Growth and Transportation
tons each ty
67

Acid Gas Removal
Fischer-Tropsch Reactor
Gasification
Steam, Heated Air
Hydrogen Heat
Distillation & Refining
68
Biofuels Process Overview
Image by MIT OpenCourseWare.
Photo of switchgrass by Stephen Ausmus(USDA), public domain image.

© ASME. All rights reserved. This content is excluded from our Creative Commons license. For more information, see http://ocw.mit.edu/fairuse.
Gasification Rentech Silvagas Dual Fluidized Bed Cycle
69

Gasification Inputs and Outputs
Composition of Syngas (by volume):
Mass flow (kg/s)
Temperature ( C)
Biomass In 24.4 25 Steam In 2.6 182
Air In 11.9 354 Syngas Out 19.9 862
Flue Gas Out 19 916
Other
70
Estimated flow rates calculated using http://chippewa.gtsav.gatech.edu/outreach/workshop/presentations/gfarris.pdf &Twin-Bed Gasification Concepts for Bio-SNG Production (Paisely)

Acid Gas Removal
Fischer-Tropsch Reactor
Gasification
Steam, Heated Air
Hydrogen Heat
Distillation & Refining
71
Biofuels Process Overview
Image by MIT OpenCourseWare.
Photo of switchgrass by Stephen Ausmus(USDA), public domain image.
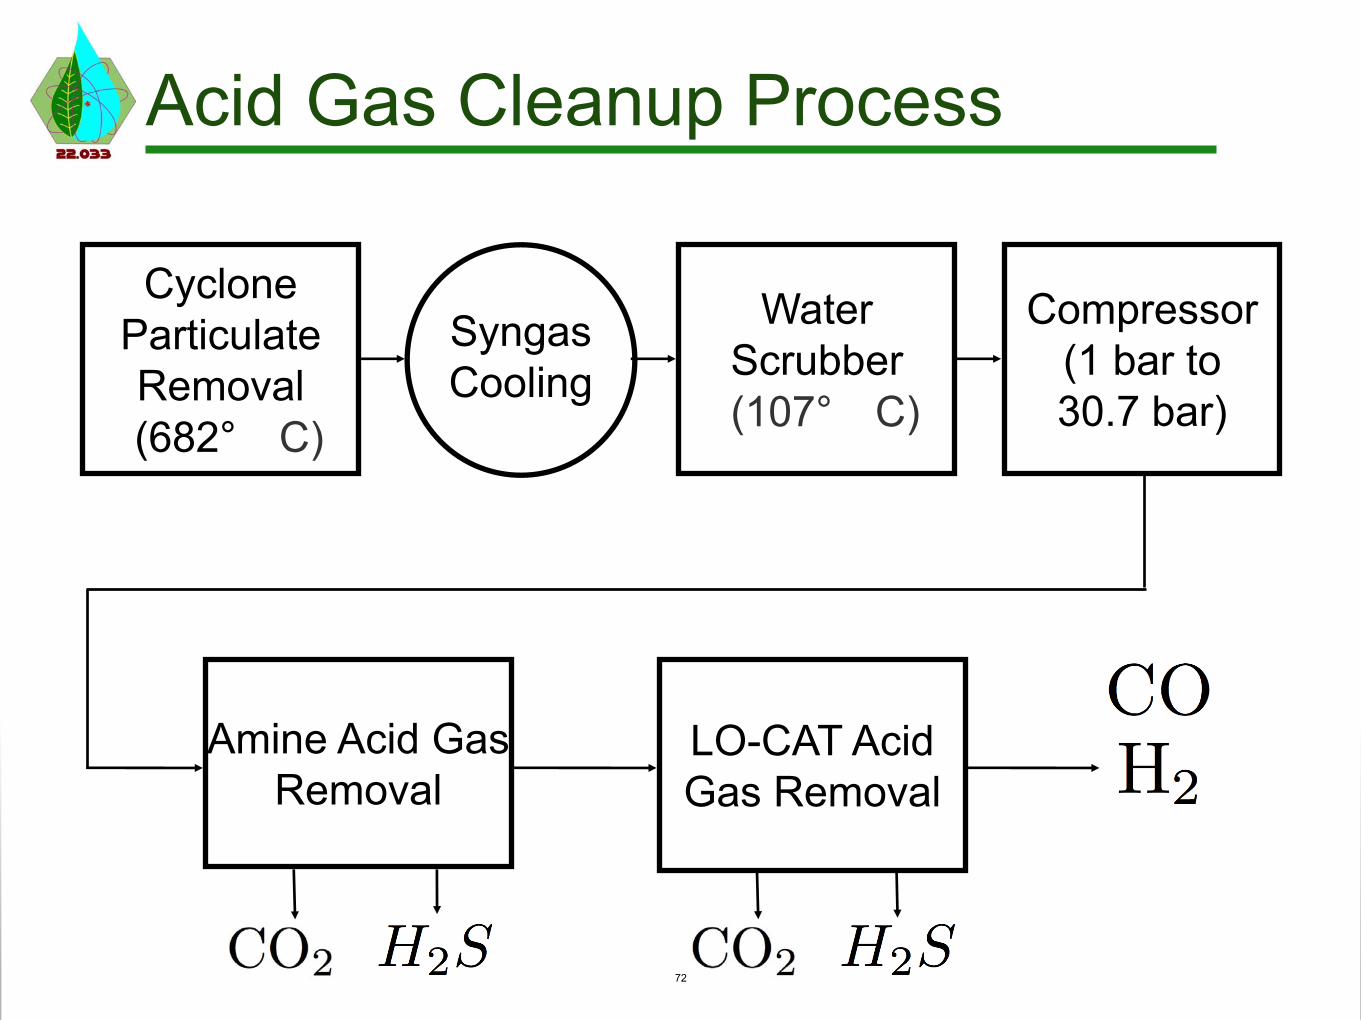
Water Scrubber (107° C)
Compressor (1 bar to 30.7 bar)
Cyclone Particulate Removal (682° C)
Syngas Cooling
Amine Acid Gas Removal
LO-CAT Acid Gas Removal
72
Acid Gas Cleanup Process

Acid Gas Removal Output Composition of Input to F-T Reactor
After gasification: After acid gas removal: 19.9 kg/s 14.6 kg/s
Other Other
73

Acid Gas Removal
Fischer-Tropsch Reactor
Gasification
Steam, Heated Air
Hydrogen Heat
Distillation & Refining
74
Biofuels Process Overview
Image by MIT OpenCourseWare.
Photo of switchgrass by Stephen Ausmus(USDA), public domain image.

Fischer-Tropsch Reactor Slurry Phase Bubble Column Design
• Fe catalyst
• Heat generated: 21.8 MW
Courtesy of Elsevier, Inc., http://www.sciencedirect.com.Used with permission.
75

gasoline biodiesel
Fischer-Tropsch Reactor Product Selectivity
© source unknown. All rights reserved. This content is excluded from our Creative Commons license. For more information, see http://ocw.mit.edu/fairuse.
76
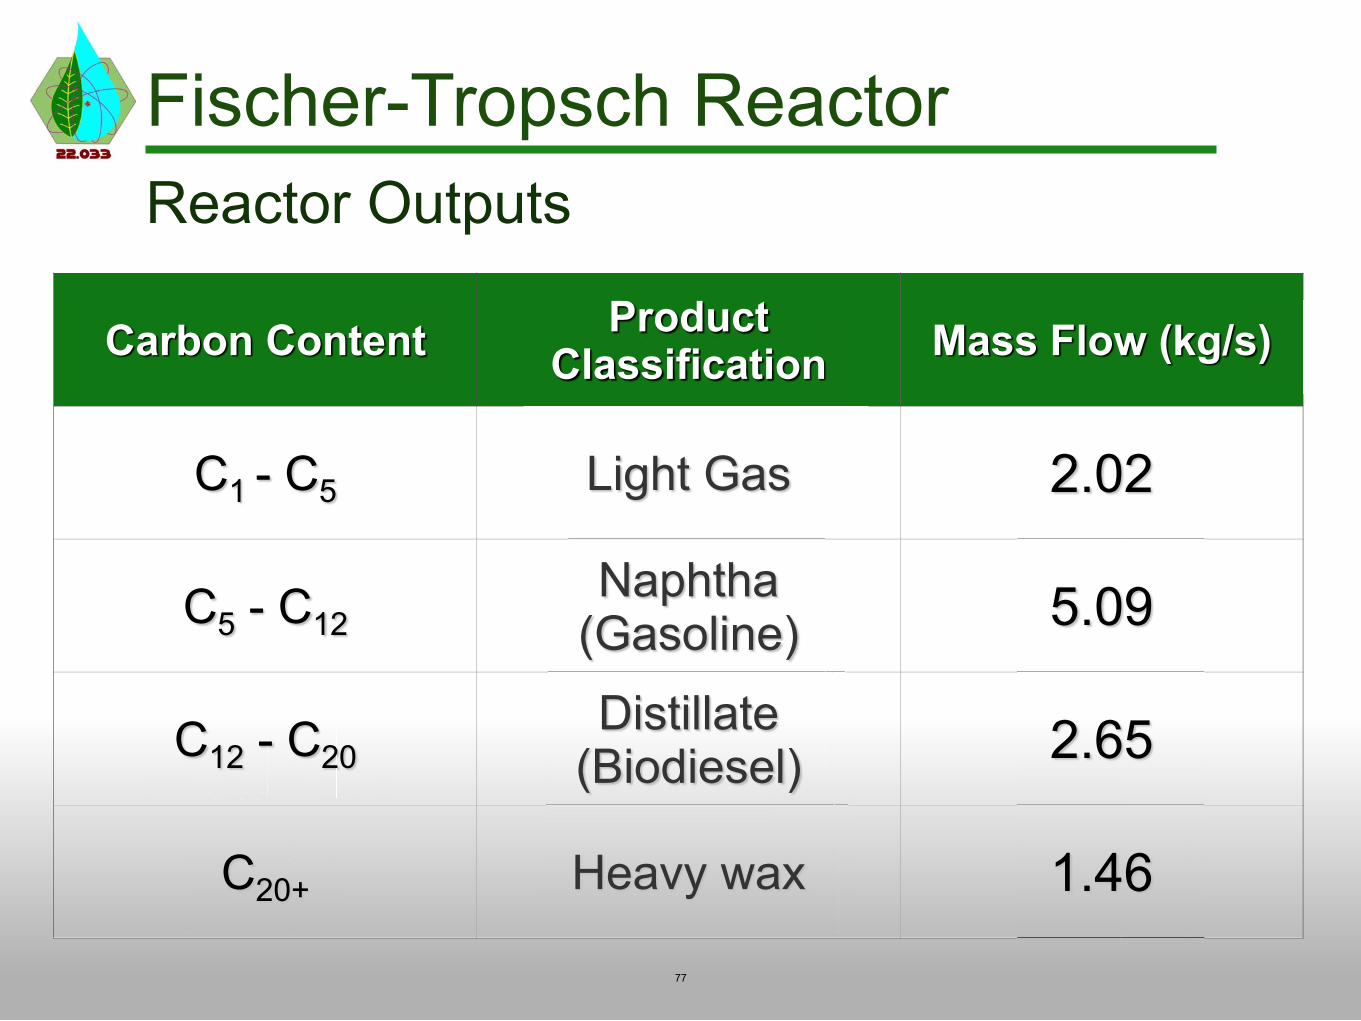
Fischer-Tropsch Reactor Reactor Outputs
ProductCarbon Content Mass Flow (kg/s)Classification
Light Gas 2.02 C1 - C5
Naphtha - C12 5.09 C5 (Gasoline) Distillate - C20 2.65C12 (Biodiesel)
Heavy wax 1.46C20+
77

Acid Gas Removal
Fischer-Tropsch Reactor
Gasification
Steam, Heated Air
Hydrogen Heat
Distillation & Refining
78
Biofuels Process Overview
Image by MIT OpenCourseWare.
Photo of switchgrass by Stephen Ausmus(USDA), public domain image.
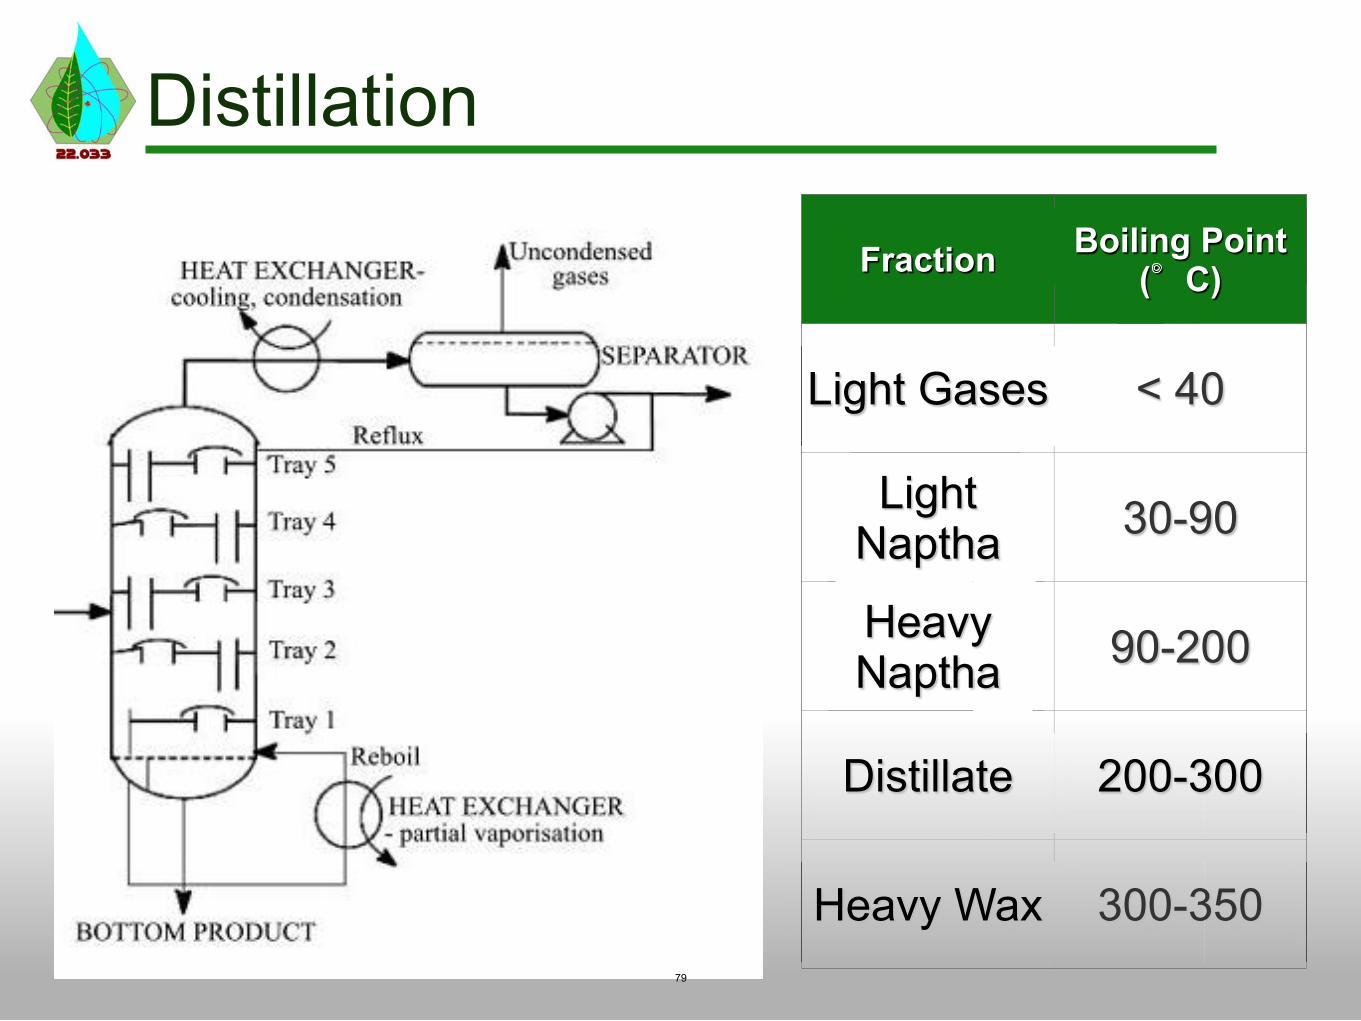
Fraction Boiling Point ( C)
Light Gases < 40
Light Naptha 30-90
Heavy Naptha 90-200
Distillate 200-300
Heavy Wax 300-350 79
Distillation
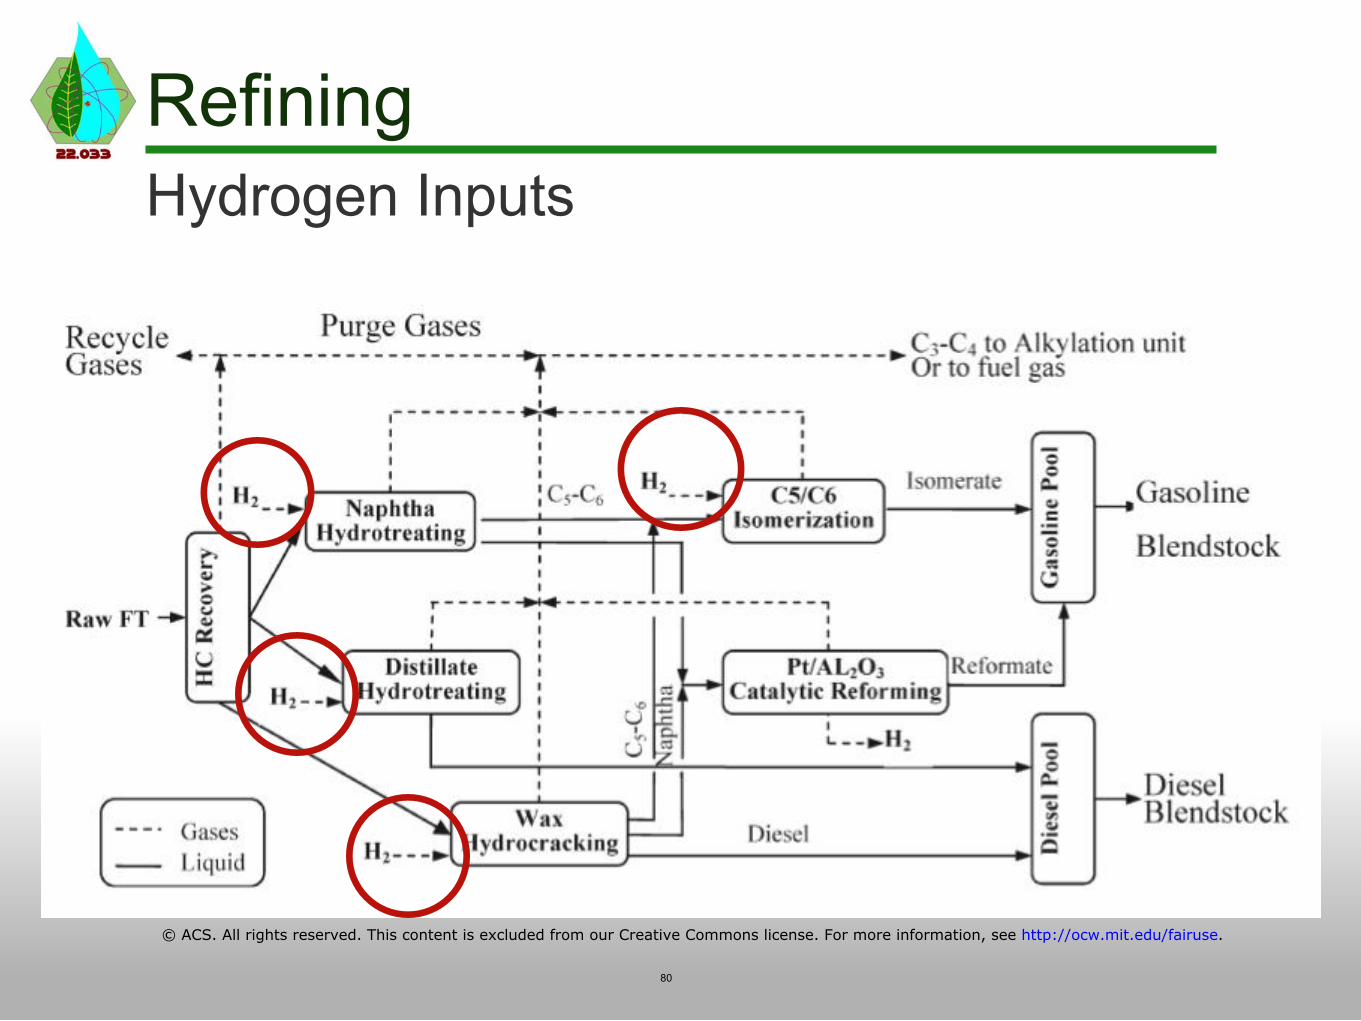
Refining Hydrogen Inputs
© ACS. All rights reserved. This content is excluded from our Creative Commons license. For more information, see http://ocw.mit.edu/fairuse.
80

Acid Gas Removal Gasification
Fischer-Tropsch Reactor
Distillation & Refining
Hydrogen Heat 81
Biofuels Process Overview Steam, Heated Air
Image by MIT OpenCourseWare.
Photo of switchgrass by Stephen Ausmus(USDA), public domain image.

Product Classification Mass Flow (kg/s) Mass Flow (barrels/day)
Light Gas 2.02 ---
Diesel 2.87 1874
Gasoline 6.33 4780
Total Diesel and Gasoline 11.22 6654
• Expected revenue from: > $1.7 million/day
• Assuming 15 gal/tank, this amount of gasoline and diesel can fill over 18,500 cars/day
• Compare to U.S. 2011 demand of 9.12 million barrels/day 82
http://pascagoula.chevron.com/Files/pascagoula/Misc/2010%20Fact%20Sheet.pdf
Final Products

• Options: • Recycle • Sell • Underground storage • Deep ocean dissolution
• CO 3
2 liquifies at 300kg/m
• Compress to 20 MPa with in-line integrally geared compressor and DDHF multistage barrel pump
3
Carbon Sequestration CO2 management
© General Electric Company. All rights reserved. This content is excluded from ourCreative Commons license. For more information, see http://ocw.mit.edu/fairuse.
8

Looking Forward
Public domain image
84

Future Work and Economics
• Potential improvements - scale up
- use oxygen from H2 plant in gasification step
-recycle flue gas, H2S, CO2 wastes
• Jobs generated: farmers, drivers, plant workers • Total daily profit: $1.4 million/day • Total profit selling only electricity: $0.83 million/day
85

Concluding Thoughts
86
Implications
• This facility design can feasibly produce green electricity, biodiesel, and biogasoline
• Minimal carbon emissions • Nuclear reactor produces 1000 MWe to grid and
powers hydrogen and biofuel plants • Biofuels produces enough alternative fuels for
18,500 cars/day
87

Acknowledgments
• Dr. Short • Tyrell Arment • Koroush Shirvan • Professor Golay • Professor Forsberg
• Professor Driscoll
• Professor Todreas 88

Questions & Discussion
89

MIT OpenCourseWarehttp://ocw.mit.edu
22.033 / 22.33 Nuclear Systems Design ProjectFall 2011
For information about citing these materials or our Terms of Use, visit: http://ocw.mit.edu/terms.


