COST-VOLUME-PROFIT RELATIONSHIPS 1. Distinguish between variable and fixed costs. Variable costs are costs that vary in total directly and proportionately with changes in the activity index. Fixed costs are costs that remain the same in total regardless of changes in the activity index. 2. Explain the significance of the relevant range. The relevant range is the range of activity in which a company expects to operate during a year. It is important in CVP analysis because the behavior of costs is linear throughout the relevant range. 3. Explain the concept of mixed costs. Mixed costs increase in total but not proportionately with changes in the activity level. For purposes of CVP analysis, mixed costs must be classified into their fixed and variable elements. One method that management may use is the high-low method. 4. List the five components of cost-volume-profit analysis. The five components of CVP analysis are (a) volume or level of activity, (b) unit selling prices, (c) variable cost per unit, (d) total fixed costs, and (e) sales mix. 5. Indicate what contribution margin is and how it can be expressed. Contribution margin is the amount of revenue remaining after deducting variable costs. It can be expressed as a per unit amount or as a ratio. 6. Identify the three ways to determine the break-even point. The break-even point can be (a) computed from a mathematical equation, (b) computed by using a contribution margin technique, and (c) derived from a CVP graph. 7. Define margin of safety and give the formulas for computing it. Margin of safety is the difference between actual or expected sales and sales at the break-even point. The formulas for margin of safety are Actual (expected) sales – Break-even sales = Margin of safety in dollars; Margin of safety in dollars ÷ Actual (expected) sales = Margin of safety ratio. 8. Give the formulas for determining sales required to earn target net income. One formula is: Required sales = Variable costs + Fixed costs + Target net income. Another formula is: Fixed costs + Target net income ÷ Contribution margin ratio = Required sales. 9. Describe the essential features of a cost-volume-profit income statement. The CVP income statement classifies costs and expenses as variable or fixed and reports contribution margin in the body of the statement. *10. Explain the difference between absorption costing and variable costing. Under absorption costing, fixed manufacturing costs are product costs; under variable costing, fixed manufacturing costs are period costs.
Transcript
COST-VOLUME-PROFIT RELATIONSHIPS
1. Distinguish between variable and fixed costs. Variable costs are costs that vary in total directly and proportionately with changes in the activity index. Fixed costs are costs that remain the same in total regardless of changes in the activity index.
2. Explain the significance of the relevant range. The relevant range is the range of activity
in which a company expects to operate during a year. It is important in CVP analysis because the behavior of costs is linear throughout the relevant range.
3. Explain the concept of mixed costs. Mixed costs increase in total but not proportionately
with changes in the activity level. For purposes of CVP analysis, mixed costs must be classified into their fixed and variable elements. One method that management may use is the high-low method.
4. List the five components of cost-volume-profit analysis. The five components of CVP
analysis are (a) volume or level of activity, (b) unit selling prices, (c) variable cost per unit, (d) total fixed costs, and (e) sales mix.
5. Indicate what contribution margin is and how it can be expressed. Contribution margin
is the amount of revenue remaining after deducting variable costs. It can be expressed as a per unit amount or as a ratio.
6. Identify the three ways to determine the break-even point. The break-even point can be
(a) computed from a mathematical equation, (b) computed by using a contribution margin technique, and (c) derived from a CVP graph.
7. Define margin of safety and give the formulas for computing it. Margin of safety is the
difference between actual or expected sales and sales at the break-even point. The formulas for margin of safety are Actual (expected) sales – Break-even sales = Margin of safety in dollars; Margin of safety in dollars ÷ Actual (expected) sales = Margin of safety ratio.
8. Give the formulas for determining sales required to earn target net income. One
formula is: Required sales = Variable costs + Fixed costs + Target net income. Another formula is: Fixed costs + Target net income ÷ Contribution margin ratio = Required sales.
9. Describe the essential features of a cost-volume-profit income statement. The CVP
income statement classifies costs and expenses as variable or fixed and reports contribution margin in the body of the statement.
*10. Explain the difference between absorption costing and variable costing. Under
absorption costing, fixed manufacturing costs are product costs; under variable costing, fixed manufacturing costs are period costs.
Test Bank for Managerial Accounting, Second Edition
5-2
TRUE-FALSE STATEMENTS
1. An activity index identifies the activity that has a causal relationship with a particular cost. 2. A variable cost remains constant per unit at various levels of activity. 3. A fixed cost remains constant in total and on a per unit basis at various levels of activity. 4. If volume increases, all costs will increase. 5. If the activity index decreases, total variable costs will decrease proportionately. 6. Changes in the level of activity will cause unit variable and unit fixed costs to change in
opposite directions. 7. For CVP analysis, both variable and fixed costs are assumed to have a linear relationship
within the relevant range of activity. 8. The relevant range of activity is the activity level where the firm will earn income. 9. Costs will not change in total within the relevant range of activity. 10. The high-low method is used in classifying a mixed cost into its variable and fixed
elements. 11. A mixed cost has both selling and administrative cost elements. 12. The fixed cost element of a mixed cost is the cost of having a service available. 13. For planning purposes, mixed costs are generally grouped with fixed costs. 14. The difference between the costs at the high and low levels of activity represents the fixed
cost element of a mixed cost. 15. When applying the high-low method, the variable cost element of a mixed cost is
calculated before the fixed cost element. 16. An assumption of CVP analysis is that all costs can be classified as either variable or
fixed. 17. In CVP analysis, the term cost includes manufacturing costs, and selling and
administrative expenses. 18. Contribution margin is the amount of revenues remaining after deducting cost of goods
sold. 19. Unit contribution margin is the amount that each unit sold contributes towards the
recovery of fixed costs and to income. 20. The contribution margin ratio is calculated by multiplying the unit contribution margin by
the unit sales price.
Cost-Volume-Profit Relationships
5-3
21. Both variable and fixed costs are included in calculating the contribution margin. 22. The break-even point is where total sales equals total variable costs. 23. The break-even point is equal to the fixed costs plus net income. 24. If the unit contribution margin is $1 and unit sales are 5,000 units above the break-even
volume, then net income will be $5,000. 25. The margin of safety is the difference between contribution margin and fixed costs. 26. A target net income is calculated by taking actual sales minus the margin of safety. 27. A CVP income statement shows contribution margin instead of gross profit. 28. A CVP income statement classifies total costs by functional areas. *29. Variable costing is not acceptable in reporting to stockholders under generally accepted
accounting principles. *30. If more units are sold than are produced in a period, variable costing income will be
greater than absorption costing income.
Answers to True-False Statements
Item Ans. Item Ans. Item Ans. Item Ans. Item Ans. Item Ans.
1. T 6. F 11. F 16. T 21. F 26. F 2. T 7. T 12. T 17. T 22. F 27. T 3. F 8. F 13. F 18. F 23. F 28. F 4. F 9. F 14. F 19. T 24. T *29. T 5. T 10. T 15. T 20. F 25. F *30. T
Test Bank for Managerial Accounting, Second Edition
5-4
MULTIPLE CHOICE QUESTIONS
31. For an activity base to be useful in cost behavior analysis, a. the activity should always be stated in dollars.
b. there should be a correlation between changes in the level of activity and changes in costs.
c. the activity should always be stated in terms of units. d. the activity level should be constant over a period of time. 32. A variable cost is a cost that a. varies per unit at every level of activity. b. occurs at various times during the year. c. varies in total in proportion to changes in the level of activity. d. may or may not be incurred, depending on management's discretion. 33. A cost which remains constant per unit at various levels of activity is a a. variable cost. b. fixed cost. c. mixed cost. d. manufacturing cost. 34. An increase in the level of activity will have the following effects on unit costs for variable
and fixed costs: Unit Variable Cost Unit Fixed Cost a. Increase Decrease b. Remains constant Remains constant c. Decrease Remains constant d. Remains constant Decrease
35. A fixed cost is a cost which a. varies in total with changes in the level of activity. b. remains constant per unit with changes in the level of activity. c. varies inversely in total with changes in the level of activity. d. remains constant in total with changes in the level of activity.
36. Fixed costs normally will not include a. property taxes. b. direct labor.
c. supervisory salaries. d. depreciation on buildings and equipment. 37. The increased use of automation and less use of the work force in companies has caused
a trend towards an increase in a. both variable and fixed costs. b. fixed costs and a decrease in variable costs.
c. variable costs and a decrease in fixed costs. d. variable costs and no change in fixed costs.
Cost-Volume-Profit Relationships
5-5
38. Cost behavior analysis is a study of how a firm's costs a. relate to competitors' costs. b. relate to general price level changes. c. respond to changes in activity levels within the company. d. respond to changes in the gross national product. 39. Cost behavior analysis applies to a. retailers. b. wholesalers. c. manufacturers. d. all entities.
40. If a firm increases its activity level, a. costs should remain the same. b. most costs will rise. c. no costs will remain the same. d. some costs will change, others will remain the same. 41. An activity index might be referred to as a cost a. driver. b. multiplier. c. element. d. correlation. 42. Cost activity indexes might help classify costs as a. temporary. b. permanent. c. variable.
d. transient. 43. Which of the following is not a cost classification? a. Mixed b. Multiple
c. Variable d. Fixed 44. If the activity level increases 10%, total variable costs will a. remain the same. b. increase by more than 10%. c. decrease by less than 10%. d. increase 10%. 45. Which of the following costs are variable?
Cost 5,000 Units 15,000 Units 1 $100,000 $300,000 2 40,000 240,000 3 90,000 90,000 4 50,000 150,000 a. 1 and 2. b. 1 and 4.
c. only 1. d. only 2.
Test Bank for Managerial Accounting, Second Edition
5-6
46. Changes in activity have a(n) _________ effect on fixed costs per unit. a. positive b. negative c. inverse d. neutral 47. Which of the following is not a fixed cost? a. Direct materials
b. Depreciation c. Lease charge d. Property taxes 48. The relevant range of activity refers to the a. geographical areas where the company plans to operate. b. activity level where all costs are curvilinear. c. levels of activity over which the company expects to operate.
d. level of activity where all costs are constant. 49. Which of the following is not a plausible explanation of why variable costs often behave in
a curvilinear fashion? a. Labor specialization b. Overtime wages c. Total variable costs are constant within the relevant range
d. Availability of quantity discounts 50. Firms operating at 100% capacity a. are common. b. are the exception rather than the rule.
c. have no fixed costs. d. have no variable costs. 51. Which of the following would be the least controllable fixed costs? a. Property taxes
b. Rent c. Research and development d. Management training programs 52. Which one of the following is a name for the range over which a company expects to
operate? a. Mixed range b. Fixed range c. Variable range d. Relevant range
53. If graphed, fixed costs that behave in a curvilinear fashion resemble a. an S-curve. b. an inverted S-curve. c. a straight line. d. a stair-step pattern.
Cost-Volume-Profit Relationships
5-7
54. The graph of variable costs that behave in a curvilinear fashion will a. approximate a straight line within the relevant range.
b. be sharply kinked on both sides of the relevant range. c. be downward sloping. d. be a stair-step pattern. 55. A mixed cost contains a. a variable cost element and a fixed cost element.
b. both selling and administrative costs. c. both retailing and manufacturing costs. d. both operating and nonoperating costs. 56. At the high level of activity in November, 7,000 machine hours were run and power costs
were $12,000. In April, a month of low activity, 2,000 machine hours were run and power costs amounted to $6,000. Using the high-low method, the estimated fixed cost element of power costs is
a. $12,000. b. $6,000. c. $3,600.
d. $8,400. 57. Wynne Company's high and low level of activity last year was 60,000 units of product
produced in May and 20,000 units produced in November. Machine maintenance costs were $39,000 in May and $15,000 in November. Using the high-low method, determine an estimate of total maintenance cost for a month in which production is expected to be 45,000 units.
a. $33,750. b. $36,000. c. $29,250. d. $30,000.
58. Which of the following is not true about the graph of a mixed cost? a. It is possible to determine the amount of the fixed cost from the graph. b. There is a total cost line on the graph. c. The fixed cost portion of the graph is the same amount at all levels of activity. d. The variable cost portion of the graph is rectangular in shape.
59. Which of the following is not a mixed cost? a. Car rental fee b. Electricity c. Depreciation d. Telephone Expense 60. In using the high-low method, the fixed cost
a. is determined by subtracting the total cost at the high level of activity from the total cost at the low activity level.
b. is determined by adding the total variable cost to the total cost at the low activity level. c. is determined before the total variable cost. d. may be determined by subtracting the total variable cost from either the total
cost at the low or high activity level.
Test Bank for Managerial Accounting, Second Edition
5-8
61. If American Airlines cuts its domestic fares by 30%, a. its fixed costs will decrease. b. profit will increase by 30%. c. a profit can only be earned by decreasing the number of flights.
d. a profit can be earned either by increasing the number of passengers or by decreasing variable costs.
Use the following information for questions 62–64. Month Miles Total Cost January 80,000 $135,000 February 50,000 100,000 March 70,000 120,000 April 90,000 160,000 62. In applying the high-low method, which months are relevant? a. January and February b. January and April c. February and April
d. February and March 63. In applying the high-low method, what is the unit variable cost? a. $1.60. b. $1.50. c. $1.80. d. cannot be determined from the information given. 64. In applying the high-low method, what is the fixed cost? a. $25,000.
b. $40,000. c. $20,000. d. $60,000. 65. For analysis purposes, the high-low method usually produces a(n) a. reasonable estimate.
b. precise estimate. c. overstated estimate. d. understated estimate. 66. The high-low method is criticized because it a. is not a graphical method. b. is a mathematical method. c. ignores much of the available data by concentrating on only the extreme points.
d. doesn't provide reasonable estimates. 67. The high-low method is often employed in analyzing a. fixed costs. b. mixed costs. c. variable costs.
d. conversion costs.
Cost-Volume-Profit Relationships
5-9
68. In CVP analysis, the term "cost" a. includes only manufacturing costs. b. means cost of goods sold. c. includes manufacturing costs plus selling and administrative expenses. d. excludes all fixed manufacturing costs. 69. Which one of the following is not an assumption of CVP analysis? a. All units produced are sold. b. All costs are variable costs.
c. Sales mix remains constant. d. The behavior of costs and revenues are linear within the relevant range. 70. CVP analysis does not consider a. level of activity. b. fixed cost per unit.
c. variable cost per unit. d. sales mix. 71. Which of the following is not an underlying assumption of CVP analysis? a. Changes in activity are the only factors that affect costs. b. Cost classifications are reasonably accurate. c. Beginning inventory is larger than ending inventory.
d. Sales mix is constant. 72. CVP analysis is not important in a. calculating depreciation expense.
b. setting selling prices. c. determining the product mix. d. utilizing production facilities. 73. To which function of management is CVP analysis most applicable? a. Planning
b. Organizing c. Directing d. Controlling 74. Contribution margin a. is always the same as gross profit margin. b. excludes variable selling costs from its calculation.
c. is calculated by subtracting total manufacturing costs per unit from sales revenue per unit.
d. equals sales revenue minus variable costs.
75. If a company had a contribution margin of $200,000 and a contribution margin ratio of
40%, total variable costs must have been a. $300,000.
b. $120,000. c. $500,000. d. $80,000.
Test Bank for Managerial Accounting, Second Edition
5-10
76. Which of the following would not be an acceptable way to express contribution margin? a. Sales minus variable costs b. Sales minus unit costs
c. Unit selling price minus unit variable costs d. Contribution margin per unit divided by unit selling price 77. A company has contribution margin per unit of $18 and a contribution margin ratio of 40%.
What is the unit selling price? a. $30.00. b. $45.00. c. $7.20. d. Cannot be determined. 78. Sales are $250,000 and variable costs are $150,000. What is the contribution margin
ratio? a. 67% b. 40% c. 60% d. cannot be determined because amounts are not expressed per unit. 79. A company has total fixed costs of $120,000 and a contribution margin ratio of 20%. The
total sales necessary to break even are a. $480,000. b. $600,000. c. $150,000. d. $144,000. 80. A company sells a product which has a unit sales price of $5, unit variable cost of $3 and
total fixed costs of $100,000. The number of units the company must sell to break even is a. 50,000 units.
b. 20,000 units. c. 200,000 units. d. 33,333 units. 81. The break-even point is where a. total sales equals total variable costs. b. contribution margin equals total fixed costs. c. total variable costs equal total fixed costs. d. total sales equals total fixed costs. 82. The break-even point cannot be determined by a. computing it from a mathematical equation. b. computing it using contribution margin. c. reading the prior year's financial statements. d. deriving it from a CVP graph. 83. Fixed costs are $600,000 and the variable costs are 75% of the unit selling price. What
is the break-even point in dollars? a. $1,400,000. b. $1,800,000. c. $2,400,000. d. $800,000.
Cost-Volume-Profit Relationships
5-11
84. Fixed costs are $900,000 and the contribution margin per unit is $150. What is the break-even point?
a. $2,250,000. b. $6,000,000. c. 2,250 units. d. 6,000 units.
85. Starr Company has the following data:
Variable costs are 70% of the unit selling price. The contribution margin ratio is 30%. The contribution margin per unit is $500. The fixed costs are $400,000.
Which of the following does not express the break-even point? a. $400,000 + .70X = X b. $400,000 + .30X = X
c. $400,000 ÷ $500 = X d. $400,000 ÷ .30 = X 86. A CVP graph does not include a a. variable cost line.
b. fixed cost line. c. sales line. d. total cost line. 87. The break-even point in units is computed by dividing fixed costs by the a. contribution margin ratio. b. contribution margin per unit.
c. total contribution margin. d. unit selling price. 88. In a CVP graph, the break-even point is at the intersection of the sales line and the a. fixed cost line. b. variable cost line. c. total cost line.
d. mixed cost line. 89. The amount by which actual or expected sales exceeds break-even sales is referred to as a. contribution margin. b. unanticipated profit. c. margin of safety.
d. target net income. 90. Barkley Company had actual sales of $500,000 and a break-even point of $400,000. Its
margin of safety ratio was a. 20%
b. 25%. c. 80%. d. 125%.
Test Bank for Managerial Accounting, Second Edition
5-12
91. In evaluating the margin of safety, the a. break-even point is not relevant. b. higher the ratio, the greater the margin of safety.
c. higher the dollar amount, the lower the margin of safety. d. higher the ratio, the lower the fixed costs. 92. The margin of safety ratio is computed using the following formula: a. actual sales – break-even sales. b. (actual sales – break-even sales) ÷ actual sales.
c. (actual sales – break-even sales) ÷ break-even sales. d. (actual sales – expected sales) ÷ break-even sales. 93. A company desires to sell a sufficient quantity of products to earn a profit of $80,000. If
the unit sales price is $20, unit variable cost is $12, and total fixed costs are $160,000, how many units must be sold to earn net income of $80,000?
a. 45,000 units b. 30,000 units c. 24,000 units d. 18,000 units 94. How much sales are required to earn a target net income of $80,000 if total fixed costs are
$100,000 and the contribution margin ratio is 40%? a. $250,000. b. $405,000. c. $450,000.
d. $200,000. 95. An income objective set by management for individual product lines is called a. break-even income. b. contribution net income. c. CVP net income. d. target net income.
96. The formula for computing required sales in units to meet target net income is the sum of target net income plus
a. fixed costs divided by contribution margin ratio. b. variable costs divided by contribution margin ratio. c. fixed costs divided by contribution margin per unit.
d. variable costs divided by contribution margin per unit.
97. A company requires $850,000 in sales to meet its target net income. Its contribution margin is 30%, and fixed costs are $150,000. What is the target net income?
a. $255,000. b. $195,000. c. $350,000. d. $105,000.
98. Grant Company has fixed costs of $600,000 and variable costs are 40% of sales. What are the required sales if Grant Company desires net income of $60,000?
a. $1,100,000.
b. $1,000,000. c. $1,650,000. d. $1,500,000.
Cost-Volume-Profit Relationships
5-13
99. Reese Company requires sales of $2,000,000 to cover its fixed costs of $900,000 and to earn net income of $400,000. What percent are variable costs of sales?
a. 20%. b. 35%. c. 45%. d. 65%. 100. An increase in the unit variable cost will generally cause an increase in all of the following
except a. the break-even point. b. contribution margin.
c. total variable costs. d. unit selling price. 101. Which is the true statement? a. In a CVP income statement, costs and expenses are classified only by function.
b. The CVP income statement is prepared for both internal and external use. c. The CVP income statement shows contribution margin instead of gross profit.
d. In a traditional income statement, costs and expenses are classified as either variable or fixed.
102. The following information is available for Louis Company:
Sales $600,000 Total fixed expenses $150,000 Cost of goods sold 390,000 Total variable expenses 360,000
A CVP income statement would report a. gross profit of $210,000. b. contribution margin of $450,000. c. gross profit of $240,000. d. contribution margin of $240,000.
103. The equation which reflects a CVP income statement is a. Sales = Cost of goods sold + Operating expenses + Net income. b. Sales + Fixed costs = Variable costs + Net income. c. Sales – Variable costs + Fixed costs = Net income. d. Sales – Variable costs – Fixed costs = Net income. 104. The CVP income statement a. is distributed internally and externally. b. classifies cost by functions. c. discloses contribution margin in the body of the statement.
d. will reflect a different net income than the traditional income statement. 105. A CVP income statement presents all of the following except a. contribution margin per unit. b. contribution margin ratio. c. total contribution margin. d. unit variable expenses.
Test Bank for Managerial Accounting, Second Edition
5-14
*106. Under absorption costing, all of the following are product costs except a. fixed overhead. b. variable overhead. c. variable manufacturing costs. d. selling and administrative expenses.
*107. Under variable costing, fixed manufacturing costs are a. charged to the product. b. not reported in the income statement. c. considered to be a period cost. d. reported on the balance sheet as a prepayment. *108. The costing approach that charges all manufacturing costs to the product is referred to as a. variable costing. b. contribution margin costing. c. direct costing. d. absorption costing. *109. If more units are produced than are sold during a period, variable costing income a. will be greater than absorption costing income. b. will be less than absorption costing income.
c. will be the same as absorption costing income. d. may be either greater or less than absorption costing income. *110. Variable costing is acceptable for a. financial statement purposes. b. income tax purposes. c. internal use by management only.
d. income tax purposes and for internal use by management. Answers to Multiple Choice Questions
Item Ans. Item Ans. Item Ans. Item Ans. Item Ans. Item Ans. Item Ans.
31. b 43. b 55. a 67. c 79. b 91. b 103. d 32. c 44. d 56. c 68. c 80. a 92. b 104. c 33. a 45. b 57. d 69. b 81. b 93. b 105. b 34. d 46. c 58. d 70. b 82. c 94. c *106. d 35. d 47. a 59. c 71. c 83. c 95. d *107. c 36. b 48. c 60. d 72. a 84. d 96. c *108. d 37. b 49. c 61. d 73. a 85. b 97. d *109. b 38. c 50. b 62. c 74. d 86. a 98. a *110. c 39. d 51. a 63. b 75. a 87. b 99. b 40. d 52. d 64. a 76. b 88. c 100. b 41. a 53. d 65. a 77. b 89. c 101. c 42. c 54. a 66. c 78. b 90. a 102. d
Cost-Volume-Profit Relationships
5-15
EXERCISES
Ex. 111
Carson Company manufactures a single product. Annual production costs incurred in the manufacturing process are shown below for the production of 2,000 units. The Utilities and Maintenance are mixed costs. The fixed portions of these costs are $200 and $300, respectively. Costs Incurred
Production in Units 2,000 3,000
Production Costs a. Direct Materials $ 4,000 ? b. Direct Labor 16,000 ? c. Utilities 1,200 ? d. Rent 3,000 ? e. Indirect Labor 4,600 ? f. Supervisory Salaries 1,500 ? g. Maintenance 900 ? h. Depreciation 2,500 ? Instructions Calculate the expected costs to be incurred when production is 3,000 units. Use your knowledge of cost behavior to determine which of the other costs are fixed or variable. Solution 111 (12–18 min.)
Costs Incurred
Production in Units 2,000 3,000
Production Costs a. Direct Materials $ 4,000 $ 6,000 b. Direct Labor 16,000 24,000 c. Utilities 1,200 1,700 d. Rent 3,000 3,000 e. Indirect Labor 4,600 6,900 f. Supervisory Salaries 1,500 1,500 g. Maintenance 900 1,200 h. Depreciation 2,500 2,500 a. Variable $4,000 ÷ 2,000 = $2.00 per unit; 3,000 × $2.00 = $6,000
b. Variable $16,000 ÷ 2,000 = $8.00 per unit; 3,000 × $8.00 = $24,000
c. Mixed $1,200 – $200 = $1,000; $1,000 ÷ 2,000 = $.50 per unit of variable costs; 3,000 × $.50 = $1,500; $1,500 + $200 (fixed) = $1,700
d. Fixed $3,000
e. Variable $4,600 ÷ 2,000 = $2.30 per unit; 3,000 × $2.30 = $6,900
Test Bank for Managerial Accounting, Second Edition
5-16
Ex. 112
Jim Vannon is considering opening a Kwik Oil Change Center. He estimates that the following costs will be incurred during his first year of operations: Rent $6,000, Depreciation on equipment $7,000, Wages $13,700, Motor oil $1.20 per quart. He estimates that each oil change will require 5 quarts of oil. Oil filters will cost $3.00 each. He must also pay The Kwik Corporation a franchise fee of $1.25 per oil change since he will operate the business as a franchise. In addition, utility costs are expected to behave in relation to the number of oil changes as follows:
Number of Oil Changes Utility Costs 4,000 $ 6,000 6,000 $ 7,300 9,000 $ 9,600 12,000 $12,600 16,000 $15,000
Mr. Vannon anticipates that he can provide the oil change service with a filter at $20.00 each. Instructions
(a) Using the high-low method, determine variable costs per unit and total fixed costs. (b) Determine the break-even point in number of oil changes and sales dollars. (c) Without regard to your answers in parts (a) and (b), determine the oil changes required to
earn net income of $20,000, assuming fixed costs are $28,000 and the contribution margin per unit is $10.
Solution 112 (19–24 min.)
(a) Separation of mixed costs: ($15,000 – $6,000) $9,000 Change in cost/Change in quantity: ————————— = ——— (16,000 – 4,000) 12,000
*Selling price per unit (a) $20.00 Variable cost per unit 11.00 Contribution margin per unit (b) $ 9.00
Contribution margin ratio (a) ÷ (b) 45% (c) Fixed costs + Net income $28,000 + $20,000 ————————————- = ————————— = 4,800 oil changes Contribution margin per unit $10 Ex. 113
Kelly Hayes operates a bed and breakfast hotel in a resort area in the Smoky Mountains. Depreciation on the hotel is $60,000 per year. Kelly employs a maintenance person at an annual salary of $30,000 per year and a cleaning person at an annual salary of $24,000 per year. Real estate taxes are $10,000 per year. The rooms rent at an average price of $50 per person per night including breakfast. Other costs are laundry service at $4.00 per person per night and the cost of food which is $6.00 per person per night. Instructions (a) Determine the number of rentals and the sales revenue Kelly needs to break even using the
contribution margin technique. (b) If the current level of rentals is 4,000, by what percentage can rentals decrease before Kelly
has to worry about having a net loss? (c) Kelly is considering upgrading the breakfast service to attract more business and increase
prices. This will cost an additional $5.00 for food costs per person per night. Kelly feels she can increase the room rate to $65 per person per night. Determine the number of rentals and the sales revenue Kelly needs to break even if the changes are made.
Solution 113 (22–27 min.)
(a) Variable costs per person per night: Fixed costs: Laundry $ 4.00 Depreciation $ 60,000 Breakfast 6.00 Maintenance 30,000 Total variable $10.00 Cleaning 24,000 Real estate taxes 10,000 Total fixed $124,000 Break-even number of persons per night rentals: Fixed costs $124,000 —————————————————— = ————— = 3,100 rentals Contribution margin per person per night $40* *Sales price per unit $50.00 Variable cost per unit 10.00 Contribution margin per unit $40.00
Test Bank for Managerial Accounting, Second Edition
5-18
Solution 113 (cont.)
Break-even sales in dollars: Fixed costs $124,000 ——————————— = ————— = $155,000 Contribution margin ratio 80%**
**Contribution margin per unit (a) $40
Sales price per unit (b) $50
Contribution margin ratio (a) ÷ (b) = 80% (b) Margin of safety: Actual rentals - Break-even rentals (4,000 – 3,100) ———————————————— = ——————— = 22.5% Actual rentals 4,000 (c) Variable costs per person per night: Fixed costs: Laundry $ 4.00 Depreciation $ 60,000 Breakfast 11.00 Maintenance 30,000 Total variable $15.00 Cleaning 24,000 Real estate tax 10,000 Total fixed $124,000 Break-even number of persons per night rentals: Fixed costs $124,000 —————————————————— = ————— = 2,480 rentals Contribution margin per person per night $50* *Sales price per unit $65 Variable cost per unit 15 Contribution margin per unit $50 Break-even point in sales dollars: 2,480 × $65 = $161,200 Ex. 114
Herbart Company gathered the following information on power costs and factory machine usage for the last six months: Month Power Cost Factory Machine Hours January $24,400 13,900 February 31,300 17,600 March 29,000 16,800 April 22,340 13,200 May 19,900 11,600 June 14,800 6,600
Cost-Volume-Profit Relationships
5-19
Ex. 114 (cont.)
Instructions
Using the high-low method of analyzing costs, answer the following questions and show computations to support your answers. (a) What is the estimated variable portion of power costs per factory machine hour? (b) What is the estimated fixed power cost each month? (c) If it is estimated that 10,000 factory machine hours will be run in July, what is the expected
total power costs for July? Solution 114 (10–15 min.)
(a) Variable power cost per factory machine hour: $31,300 – $14,800 $16,500 ————————— = ———— = $1.50 per factory machine hour 17,600 – 6,600 11,000 (b) Monthly fixed power cost: High Low (February) (June) Total costs $31,300 $14,800 Less: Variable costs 17,600 × $1.50 26,400 6,600 × $1.50 9,900 Total fixed costs $ 4,900 $ 4,900 (c) Estimated total power costs for July: Variable cost (10,000 × $1.50) $15,000 Fixed cost 4,900 Total estimated power cost $19,900 Ex. 115
The Mays Clinic has the following monthly telephone records and costs: Calls Costs 2,000 $2,400 1,500 2,100 2,200 2,600 2,500 2,800 2,300 2,700 1,700 2,200 Instructions Identify the fixed and variable cost elements using the high-low method.
Test Bank for Managerial Accounting, Second Edition
5-20
Solution 115 (10–15 min.)
High calls minus low calls: 2,500 – 1,500 = 1,000 Change in cost: $2,800 – $2,100 = $700 $700 ÷ 1,000 = $.70 variable cost per call High Low Total Cost $2,800 $2,100 Less: Variable costs 2,500 × $.70 1,750 1,500 × $.70 1,050 Total fixed costs $1,050 $1,050 Ex. 116
The Pi Kappa Omega fraternity has an annual alumni golf outing. A local caterer provides lunch and a tent. The fraternity pays a flat fee for the tent and an additional amount for each fraternity brother served. However, in the past the brothers have never been able to determine how much the caterer is going to charge. One of the brothers, who is an accounting major, is convinced that the cost is a mixed cost. In an effort to determine how much the caterer will charge this year, he has found cost and attendance data for the past five years. Attendance Caterer Cost 216 $4,470 187 3,990 258 5,430 310 6,450 289 6,050 Instructions
a. Use the high-low method to compute the variable component of the caterer’s charge. b. Compute the fixed component of the caterer’s charge. Solution 116 (6–9 min.)
a. Attendance Caterer Cost High 310 $6,450 Low 187 3,990 Difference 123 $2,460 Variable cost: $2,460 ÷ 123 = $20 b. Activity Level High Low Total Cost $6,450 $3,990 Less variable costs 310 × $20 6,200 187 × $20 3,740 Total fixed costs $ 250 $ 250
Cost-Volume-Profit Relationships
5-21
Ex. 117
Unruh Company reports the following results for the month of November:
Sales (12,000 units) $600,000 Variable costs 450,000 Contribution margin 150,000 Fixed costs 110,000 Net income $ 40,000 Management is considering the following independent courses of action to increase net income. 1. Increase selling price by 10% with no change in total variable costs. 2. Reduce variable costs to 67% of sales. 3. Reduce fixed costs by $30,000. Instructions
If maximizing net income is the objective, which is the best course of action? Solution 117 (15–20 min.)
1. Current selling price is: $600,000 ÷ 12,000 units = $50 Increase $50 by 10%: $50 × 1.10 = $55 Revised sales $660,000 Variable costs 450,000 Contribution margin 210,000 Fixed costs 110,000 Net income $100,000 2. Sales $600,000 Variable costs (reduce variable costs to 67% of sales) 402,000 Contribution margin 198,000 Fixed costs 110,000 Net income $ 88,000 3. Sales $600,000 Variable costs 450,000 Contribution margin 150,000 Fixed costs (reduce fixed costs by $30,000) 80,000 Net income $ 70,000 Increasing the price will increase net income from $40,000 to $100,000. Option (2) will only increase net income to $88,000, while option (3) will increase net income to only $70,000.
Test Bank for Managerial Accounting, Second Edition
5-22
Ex. 118
Grange Company had a net loss of $100,000 in 2001 when the selling price per unit was $20, the variable costs per unit were $12, and the fixed costs were $400,000. Management expects per unit data and total fixed costs to be the same in 2002. Management has set a goal of earning net income of $100,000 in 2002. Instructions (a) Compute the units sold in 2001. (b) Compute the number of units that would have to be sold in 2002 to reach management's
desired net income level. (c) Assume that Grange Company sells the same number of units in 2002 as they did in 2001.
What would the selling price have to be in order to reach the target net income? Solution 118 (15–20 min.)
(a) Units sold in 2001 Fixed costs – Net loss = ———————————— Contribution margin per unit $400,000 – $100,000 = —————————— $20 - $12 = $300,000 ÷ $8 = 37,500 units (b) Units needed in 2002 Fixed costs + Net income = ———————————— Contribution margin per unit $400,000 + $100,000 = —————————— $20 - $12 = $500,000 ÷ $8 = 62,500 units (c) Selling price needed in 2002 Variable costs + Fixed costs + Net income = ——————————————————— 37,500 units 37,500($12) + $400,000 + $100,000 = ———————————————— 37,500 units $950,000 = ———— = $25.33 37,500
Cost-Volume-Profit Relationships
5-23
Ex. 119
In the month of September, Nixon Company sold 500 units of product. The average sales price was $30. During the month, fixed costs were $6,000 and variable costs were 60% of sales. Instructions
(a) Determine the contribution margin in dollars, per unit, and as a ratio. (b) Using the contribution margin technique, compute the break-even point in dollars and in
units. Solution 119 (12–17 min.)
(a) Contribution margin in dollars Sales (500 × $30) $15,000 Less: Variable costs ($15,000 × 60%) 9,000 Contribution margin $ 6,000 Contribution margin per unit Unit sales price $30 Less: Variable cost per unit ($30 × 60%) 18 Contribution margin per unit $12 Contribution margin ratio $12 ÷ $30 = 40% (b) Break-even sales (in dollars) Fixed costs ÷ Contribution margin ratio $6,000 ÷ 40% = $15,000 Break-even sales (in units) Fixed costs ÷ Contribution margin per unit $6,000 ÷ $12 = 500 units Ex. 120
In 2001, Green Company had a break-even point of $800,000 based on a selling price of $10 per unit and fixed costs of $320,000. In 2002, the selling price and variable costs per unit did not change, but the break-even point increased to $950,000. Instructions
(a) Compute the variable cost per unit and the contribution margin ratio for 2001. (b) Using the contribution margin ratio, compute the increase in fixed costs for 2002.
Test Bank for Managerial Accounting, Second Edition
5-24
Solution 120 (15–20 min.)
(a) Fixed Costs Unit contribution margin = ———————————— Break-even Sales in units $320,000 = ———————— ($800,000 ÷ $10) $320,000 = ————— = $4.00 80,000 Variable cost per unit = $10 – $4 = $6 Contribution margin ratio = $4 ÷ $10 = 40% (b) Fixed costs = Break-even Sales × CM Ratio = $950,000 × 40% = $380,000 Therefore, fixed costs increased $60,000 ($380,000 – $320,000). Ex. 121
The income statement for Cornish Company for 2002 appears below.
CORNISH COMPANY Income Statement
For the Year Ended December 31, 2002 ———————————————————————————————————————————
Answer the following independent questions and show computations using the contribution margin technique to support your answers:
1. What was the company's break-even point in sales dollars in 2002?
2. How many additional units would the company have had to sell in 2003 in order to earn net income of $60,000?
3. If the company is able to reduce variable costs by $2.00 per unit in 2003 and other costs and unit revenues remain unchanged, how many units will the company have to sell in order to earn a net income of $50,000?
Cost-Volume-Profit Relationships
5-25
Solution 121 (15–20 min.)
1. $460,000 ———— = $1,150,000 40% 2. $460,000 + $60,000 ————————— = $1,300,000 Total sales needed. 40% $1,300,000 ————— = 52,000 total units to be sold $25 40,000 actual units sold 12,000 additional units to be sold Note: Required sales in units can be obtained directly by dividing fixed costs plus profit by contribution margin per unit: ($460,000 + $50,000) ÷ ($25 – $15) = 52,000 units 3. 2002 Variable cost per unit = $15 ($600,000 ÷ 40,000 units) Variable cost reduction = 2 2003 Variable cost per unit $13 Expected contribution margin $12 ($25 – $13) $460,000 + $50,000 ————————— = 42,500 units $12 Ex. 122
Rush Company developed the following information for its product:
Per Unit Sales price $90 Variable cost 63 Contribution margin $27 Total fixed costs $1,350,000 Instructions
Answer the following independent questions and show computations using the contribution margin technique to support your answers.
1. How many units must be sold to break even?
2. What is the total sales that must be generated for the company to earn a profit of $60,000?
3. If the company is presently selling 75,000 units, but plans to spend an additional $135,000 on an advertising program, how many additional units must the company sell to earn the same net income it is now making?
4. Using the original data in the problem, compute a new break-even point in units if the unit sales price is increased 20%, unit variable cost is increased by 10%, and total fixed costs are increased by $198,000.
Test Bank for Managerial Accounting, Second Edition
5-26
Solution 122 (15–20 min.)
1. $1,350,000 ————— = 50,000 units to be sold to break even. $27 2. Contribution margin ratio = 30% ($27 ÷ $90).
$1,350,000 + $60,000 —————————— = $4,700,000 total sales .30 3. $135,000 ———— = 5,000 additional units $27 4. New sales price $108.00 ($90 × 1.20) New variable cost 69.30 ($63 × 1.10) New contribution margin $ 38.70 New total fixed costs $1,548,000 ($1,350,000 + $198,000) $1,548,000 ————— = 40,000 units is the new break-even point. $38.70 Ex. 123
Keller Company estimates that variable costs will be 60% of sales and fixed costs will total $1,600,000. The selling price of the product is $10, and 500,000 units will be sold. Instructions
Using the mathematical equation, (a) Compute the break-even point in units and dollars. (b) Compute the margin of safety in dollars and as a ratio. (c) Compute net income. Solution 123 (15–20 min.)
(a) Break-even sales in units $10X = $6X + $1,600,000 $4X = $1,600,000 X = 400,000 units
Break-even point in dollars 400,000 units × $10 = $4,000,000 (b) Margin of safety in dollars $5,000,000 – $4,000,000 = $1,000,000
Margin of safety ratio $1,000,000 ÷ $5,000,000 = 20%
Cost-Volume-Profit Relationships
5-27
Solution 123 (cont.)
(c) Net Income Sales $5,000,000 Variable Costs (3,000,000) Fixed Costs (1,600,000) Net Income $ 400,000 Ex. 124
Alley Company makes student book bags that sell for $20 each. For the coming year, management expects fixed costs to be $180,000. Variable costs are $15 per unit. Instructions (a) Compute break-even sales in dollars using the mathematical equation. (b) Compute break-even sales using the contribution margin ratio. (c) Compute the margin of safety ratio assuming actual sales are $1,000,000. (d) Compute the sales required to earn net income of $90,000, using the mathematical
equation. Solution 124 (19–24 min.)
(a) Break-even Sales $20X = $15X + $180,000 $5X = $180,000 X = 36,000 units; 36,000 × $20/unit = $720,000 (b) Contribution Margin per Unit = Unit Selling Price – Unit Variable Cost CM = $20 – $15 = $5 Contribution Margin per Unit Contribution Margin Ratio = ————————————— Unit Selling Price CM Ratio = $5 ÷ $20 = 25%
Fixed Costs Break-even Sales = ———————————— Contribution Margin Ratio = $180,000 ÷ 25% = $720,000 (c) Sales $1,000,000 Less: Break-even Sales 720,000 Margin of Safety $ 280,000 Margin of Safety Margin of Safety Ratio = ——————— Actual Sales = $280,000 ÷ $1,000,000 = 28%
Test Bank for Managerial Accounting, Second Edition
Zook Company developed the following information for the product it sells: Sales price $50 per unit Variable cost of goods sold $23 per unit Fixed cost of goods sold $700,000 Variable selling expense 10% of sales price Variable administrative expense $2.00 per unit Fixed selling expense $400,000 Fixed administrative expense $300,000 For the year ended December 31, 2002, Zook Company produced and sold 80,000 units of product. Instructions
(a) Prepare a CVP income statement using the contribution margin format for Zook Company for 2002.
(b) What was the company's break-even point in units in 2002? Use the contribution margin technique.
(c) What was the company's margin of safety in dollars in 2002? Solution 125 (20–25 min.)
(a) ZOOK COMPANY Income Statement
For the Year Ended December 31, 2002 ——————————————————————————————————————————— Sales ....................................................................................... $4,000,000 Variable expenses Cost of goods sold ............................................................ $1,840,000 Administrative .................................................................... 160,000 Selling expenses ............................................................... 400,000 Total variable expenses .................................................... 2,400,000 Contribution margin ................................................................. 1,600,000 Fixed expenses Cost of goods sold ............................................................ 700,000 Selling ............................................................................... 400,000 Administrative .................................................................... 300,000 Total fixed expenses ......................................................... 1,400,000 Net income .............................................................................. $ 200,000
Cost-Volume-Profit Relationships
5-29
Solution 125 (cont.)
(b) Break-even point was 70,000 units in 2002. Variable costs per unit Contribution margin per unit Cost of goods sold $23 Sales price $50 Administrative 2 Variable cost 30 Selling 5 Contribution margin $20 $30
$1,400,000 ÷ $20 = 70,000 units to break even. (c) Margin of safety in dollars was $500,000 Actual sales $4,000,000 Break-even sales (70,000 × $50) 3,500,000 Margin of safety $ 500,000 Ex. 126
Lane Company has prepared the following cost-volume-profit graph: Instructions
For the items listed below, enter to the left of the item, the letter in the graph which best corresponds to the item.
____ 1. Activity base
____ 2. Break-even point
____ 3. Dollars
____ 4. Fixed costs
____ 5. Loss
____ 6. Profit
____ 7. Revenues
____ 8. Total costs
____ 9. Variable costs
I
BH
D
G
E
A
F
C
Test Bank for Managerial Accounting, Second Edition
5-30
Solution 126 (9–14 min.)
1. D Activity base 2. A Break-even point 3. E Dollars 4. C Fixed costs 5. G Loss 6. B Profit 7. I Revenues 8. H Total costs 9. F Variable costs Ex. 127
Mary’s Baskets, Inc. manufactures a single basket that is sold to wholesalers for $20. The contribution margin ratio is 40%. Mary’s fixed expenses total $600,000. Instructions
(a) Compute the variable cost per unit. (b) Compute how many baskets Mary will have to sell in order to break even. (c) Compute how many baskets Mary will have to sell in order to make a target net income of
$16,000. (d) Prove your answer in part (c) above by preparing a cost-volume-profit income statement at
Sayler Company earned net income of $500,000 last year. This year it wants to earn net income of $600,000. The company's fixed costs are expected to be $300,000, and variable costs are expected to be 50% of sales. Instructions
(a) Determine the required sales to meet the target net income of $600,000 using the contribution margin technique.
(b) Using a CVP income statement format, prove your answer.
Cost-Volume-Profit Relationships
5-31
Solution 128 (8–12 min.)
Fixed cost + Net income $300,000 + $600,000 (a) Required sales = ——————————— = —————————— = $1,800,000 Contribution margin ratio .50
(b) Sales $1,800,000 Variable costs 900,000 Contribution margin 900,000 Fixed costs 300,000 Target net income $ 600,000 *Ex. 129
Vicious Cycle is a small manufacturer of mountain bikes. The bikes sell for $750 each. The variable costs of each unit include the following:
Direct materials $180 Direct labor 170 Manufacturing overhead 50
In addition, $180,000 of fixed overhead is incurred annually. Selling and administrative expenses are fixed costs totaling $140,000 and $100,000, respectively. At the beginning of the year, there was no beginning finished goods inventory. During the year, 2,000 bikes were produced. At the end of the year, there were 600 bikes in ending finished goods inventory. Instructions
(a) Assuming Vicious Cycle uses absorption costing, compute the unit cost for one bike. (b) Assuming Vicious Cycle uses variable costing, compute the unit cost for one bike. (c) Compute the required sales in units necessary to achieve a target net income of $210,000. (d) Compute the margin of safety ratio for Vicious Cycle assuming actual sales of $1,125,000. *Solution 129 (12-15 min.)
(a) Direct materials $180 Direct labor 170 Variable manufacturing overhead 50 Fixed manufacturing overhead ($180,000 ÷ 2,000) 90 Unit cost $490 (b) Direct materials $180 Direct labor 170 Variable manufacturing overhead 50 Unit cost $400 ($180,000 + $140,000 + $100,000) + $210,000 $630,000 (c) Required sales in units: ————————————————————— = ———— $750 – $400 $350 = 1,800 units
Test Bank for Managerial Accounting, Second Edition
5-32
*Solution 129 (cont.)
($1,125,000 – $900,000*) (d) Margin of safety ratio: ———————————– = 20% $1,125,000 *($180,000 + $140,000 + $100,000) ———————————————— × $750 $350 *Ex. 130 Tanner Company developed the following unit information for January, 2002, its first month of operations: Per Unit Total Costs Sales price $20 Variable costs Direct materials 5 Direct labor 3 Variable manufacturing overhead 4 Selling and administrative expenses 2 Fixed selling and administrative expenses $22,000 Fixed manufacturing overhead 60,000
During January, 20,000 units were produced and 15,000 units were sold.
Instructions
(a) Prepare an income statement under the variable costing approach using the CVP format. (b) What would be the net income (loss) if the absorption cost approach had been used?
Explain any income difference between absorption and variable costing. *Solution 130 (20–25 min.)
(a) TANNER COMPANY Income Statement
For the Month Ended January 31, 2002 (Variable costing)
———————————————————————————————————————————
Sales (15,000 units × $20) ............................................................... $300,000 Variable expenses Inventory, January 1 ................................................................... $ -0- Variable manufacturing costs (20,000 units × $12) ..................... 240,000 Cost of goods available for sale ................................................. 240,000 Inventory, January 31 (5,000 units × $12) .................................. 60,000 Variable cost of goods sold ........................................................ 180,000 Variable selling and administrative expenses (15,000 × 2) ......... 30,000 Total variable expenses ....................................................... 210,000 Contribution margin ......................................................................... 90,000 Fixed expenses Manufacturing overhead ............................................................ 60,000 Selling and administrative .......................................................... 22,000 Total fixed expenses ............................................................ 82,000 Income from operations ................................................................... $ 8,000
Cost-Volume-Profit Relationships
5-33
*Solution 130 (cont.)
(b) If absorption costing had been used, Tanner would report income from operations of $23,000. Under absorption costing, fixed manufacturing overhead of $15,000* would be allocated as a product cost and would be part of the value of the finished goods inventory on the balance sheet. Therefore, income under absorption costing would be $15,000 greater than the $8,000 income under variable costing.
*$60,000 ÷ 20,000 = $3 unit fixed manufacturing overhead Ending inventory = 5,000 units × $3 = $15,000
*Ex. 131
Dolan Company developed the following information for 2002:
Selling and Administrative Expenses Variable $30,000 Fixed $50,000 Units in beginning inventory -0- Units sold 24,000 Direct materials used $75,000 Direct labor $95,000 Units produced 30,000 Manufacturing overhead Variable $100,000 Fixed $90,000 Instructions
Answer the following questions. (a) What would be the amount of the cost of goods sold under the absorption costing
approach? (b) What would be the cost of the ending inventory under the variable costing approach? (c) Which approach would show the greater income for 2002 and by how much?
*Solution 131 (16–21 min.)
Absorption Costing Variable Costing Direct materials ............................................................... $ 75,000 $ 75,000 Direct labor ..................................................................... 95,000 95,000 Variable manufacturing overhead.................................... 100,000 100,000 Fixed manufacturing overhead ........................................ 90,000 — Total manufacturing costs incurred ................................. $360,000 $270,000 Production in units .......................................................... 30,000 30,000 Production unit cost......................................................... $12 $9 (a) Cost of goods sold under the absorption costing approach would be $288,000 (24,000 units
× $12). (b) Cost of ending inventory under the variable costing approach would be $54,000 (6,000 units
× $9). (c) Absorption costing income in 2002 would be greater by $18,000 (6,000 units × $3).
Test Bank for Managerial Accounting, Second Edition
5-34
COMPLETION STATEMENTS
132. Knowledge of cost behavior is important in ______________________ analysis.
133. A _________________ cost remains constant per unit at every level of activity.
134. Unit fixed costs __________________ with the changes in the level of activity.
135. Total fixed costs are _____________ over various levels of activities, whereas total
variable cost __________________ directly and ________________ with changes in the
activity level.
136. An assumption of CVP analysis is that variable and fixed costs have a _______________
relationship with an activity base.
137. The range over which a company expects to operate is referred to as the ____________
range.
138. A cost that has both variable and fixed cost elements is referred to as a ______________
cost.
139. The amount of revenue remaining after deducting total variable costs is called the
_________________________.
140. The _______________ point is when total revenues equals total costs.
141. _______________ divided by the contribution margin ratio will give the amount of
_______________ to break even.
142. The difference between actual or expected sales and break-even sales is called the
__________________________.
143. A _______________ income statement classifies costs and expenses as variable or fixed
and reports contribution margin.
*144. Under variable costing, ____________________ manufacturing costs are considered to
be period costs.
*145. When units produced are greater than units sold, income under ________________
costing is higher than under ______________ costing.
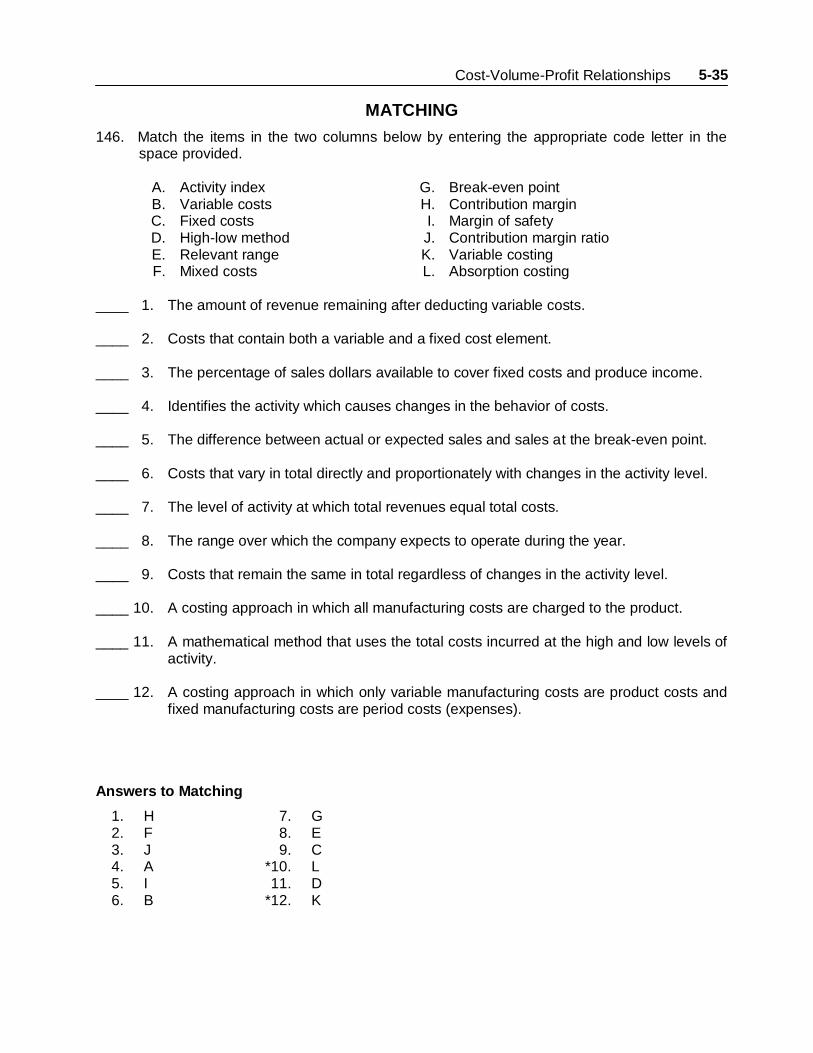
146. Match the items in the two columns below by entering the appropriate code letter in the space provided.
A. Activity index G. Break-even point B. Variable costs H. Contribution margin C. Fixed costs I. Margin of safety D. High-low method J. Contribution margin ratio E. Relevant range K. Variable costing F. Mixed costs L. Absorption costing ____ 1. The amount of revenue remaining after deducting variable costs. ____ 2. Costs that contain both a variable and a fixed cost element. ____ 3. The percentage of sales dollars available to cover fixed costs and produce income. ____ 4. Identifies the activity which causes changes in the behavior of costs. ____ 5. The difference between actual or expected sales and sales at the break-even point. ____ 6. Costs that vary in total directly and proportionately with changes in the activity level. ____ 7. The level of activity at which total revenues equal total costs. ____ 8. The range over which the company expects to operate during the year. ____ 9. Costs that remain the same in total regardless of changes in the activity level. ____ 10. A costing approach in which all manufacturing costs are charged to the product. ____ 11. A mathematical method that uses the total costs incurred at the high and low levels of
activity. ____ 12. A costing approach in which only variable manufacturing costs are product costs and
fixed manufacturing costs are period costs (expenses).
Answers to Matching
1. H 7. G 2. F 8. E 3. J 9. C 4. A *10. L 5. I 11. D 6. B *12. K
Test Bank for Managerial Accounting, Second Edition
5-36
SHORT-ANSWER ESSAY QUESTIONS
S-A E 147
A cost-volume-profit graph is frequently used in business meetings because it presents a picture of cost relationships within a company. Briefly describe the type of information and data that you would need in order to prepare a CVP graph. After a CVP graph is prepared, what are the major points that could be made from the graph that would be of interest to management? Solution 147
To begin constructing a CVP graph, information is needed concerning the maximum estimated level of sales units and the unit sales price. This is necessary to create the axes and also to plot the total revenue line from the origin. In addition, the costs must be broken down into fixed and variable components in order to plot both the fixed cost line and the total cost line. Using a CVP graph, management can readily identify the break-even point and can see how much profit or loss would result from varying levels of sales. The graph also makes it easy to portray the effects of any changes such as costs or selling prices. S-A E 148
A CVP income statement is frequently prepared for internal use by management. Describe the features of the CVP income statement that make it more useful for management decision-making than the traditional income statement that is prepared for external users. Solution 148
Several features of the CVP income statement make it more useful for internal decision-making. The CVP income statement classifies costs as either fixed or variable, rather than by function. Being able to identify the behavior of costs in this manner can aid management in controlling those costs. Also, the CVP income statement shows the contribution margin, rather than a gross profit. This helps management establish the extent to which their sales are able to cover their fixed costs, and to analyze the impact on net income of changes in sales or costs. S-A E 149 (Ethics)
Gannon Company requires its marketing managers to submit estimated cost-volume-profit data on all requests for new products, or expansions of a product line. Linda Oslo is a new manager. Her calculations show a fixed cost for a new project at $100,000 and a variable cost of $5. Since the selling price is only $15 for the proposed product, 10,000 would need to be sold to break even. That is approximately twice the volume estimate for the first year. She shares her dismay with Tina Smythe, another manager.
Cost-Volume-Profit Relationships
5-37
S-A E 149 (cont.)
Tina strongly advises her to revise her estimates. She points out that several of the costs that had been classified as fixed costs could be considered variable, since they are step costs and mixed costs. When the data has been revised classifying those costs as variable costs, the project appears viable. Required: 1. Who are the stakeholders in this decision? 2. Is it ethical for Linda to revise the costs as indicated? Briefly explain. 3. What should Linda do? Solution 149
1. The stakeholders include: Linda Oslo Gannon Company Gannon’s customers 2. It is ethical to revise the costs, certainly. The only problem that exists is the failure to
account for the fixed cost component of the step and mixed costs. At low volume levels, such as those anticipated for this project, the project is likely to be less profitable than forecast. To the extent that Linda is submitting misleading figures in order to get her project approved, she is behaving unethically.
3. Linda should try to make the forecasts as accurate as possible by making a better
determina-tion of cost behavior. If that is not possible within the time she has, she should submit both sets of figures, and let the selection committee make its determination.
S-A E 150 (Communication)
William Dexter has been the manager for two years of the production department of a company manufacturing toys made of plastic-coated cardboard. One of the toys is a paper doll, whose "clothes" are made of acetate, and stay on the doll with static electricity. The company's sales were mainly to large educational institutions until last year, when the dolls were sold for the first time to a large discount retailer. The dolls were sold out immediately, and enough orders received to keep the department at full capacity for the immediate future. The fixed costs for the department are $50,000, with $1 per unit variable costs. Each set consists of a doll and one set of clothes and sells for $3. The maximum volume is 100,000 units. With the increased volume, Mr. Dexter is considering two options to improve profitability. One would reduce variable costs to $0.75, and the other would reduce fixed costs to $35,000. Required:
Given the fact that sales are increasing, make a short (one paragraph) recommendation to Mr. Dexter about which option he should choose. Support your recommendation with a calculation showing him how profitability will change with each option.
Test Bank for Managerial Accounting, Second Edition
5-38
Solution 150
The variable costs should be reduced to $0.75 per unit in order to ensure maximum profitability of the paper doll product line. The calculations are as follows: Current Profit = ($3 × 100,000) – ($1 × 100,000) – $50,000 = $300,000 – $100,000 – $50,000 = $150,000 Plan #1: Reduce Variable Costs to $0.75